Executive summary
The number of localities with access points (PDAs) to financial services reached an all-time high in June 2021 / At the level of coverage of the territory, localities with PDAs went from 48.3% in December 2020 to 49.6% of the total in June 2021, with their inhabitants covering 92.3% of the adult population. This increase is due to the incorporation of new ATMs in localities that did not have physical infrastructure and the relocation of complementary financial services agencies (ACSF) from localities with PDAs to localities without PDA coverage.
Access to accounts remained at very high levels in relation to the adult population / In June 2021, bank account ownership reached 91.1% of the adult population, a proportion comparable to that of developed economies. The continuous increase in the number of people who jointly have bank and payment accounts was highlighted, reaching 11.5 million, representing 36% of bank account holders.
The use of retail electronic means of payment reached historic highs in the first half of 2021 / In June 2021, more than 8.5 transactions per adult were registered, the highest monthly value since records began in the series. During the first 6 months of 2021, electronic means of payment reached an average figure per adult of 7.9 operations, which is 40% higher than the average recorded in the same period of 2020.
Total wire transfer values illustrate the importance of having an interoperable payment system / As of June 2021, about 30% of transfers were initiated in a non-destination account type (CBU to CVU and CVU to CBU). Although the total transfer metrics showed the predominance of those initiated in bank accounts, it is noteworthy that the number of transfers originated in non-bank accounts (CVU) in proportion to the stock of these accounts, more than doubled the transfers initiated in CBU in relation to their number of accounts.
Card payments initiated via QR code and remote channel continued to gain traction / These payment initiation methods experienced significant rates of variation due to their comparative advantages during the social distancing stage. However, the face-to-face POS and mPOS modalities registered the highest transactionality of payments, both in amounts and in real amounts.
The proportion of individuals with financing in the expanded financial system showed a slight increase / The percentage of the adult population with financing, after a fall of 1.9 p.p. during 2020, remained stable at around 47.8% during the first half of 2021, with an improvement of 0.2 p.p. compared to November 2020, month in which it registered its minimum value. The behavior of public banks that increased their number of people financed in relation to the adult population stands out, from 11.1% in December 2019 to 11.5% in December 2020, a level that was maintained until June 2021.
Indicator Table | Financial inclusion in Argentina
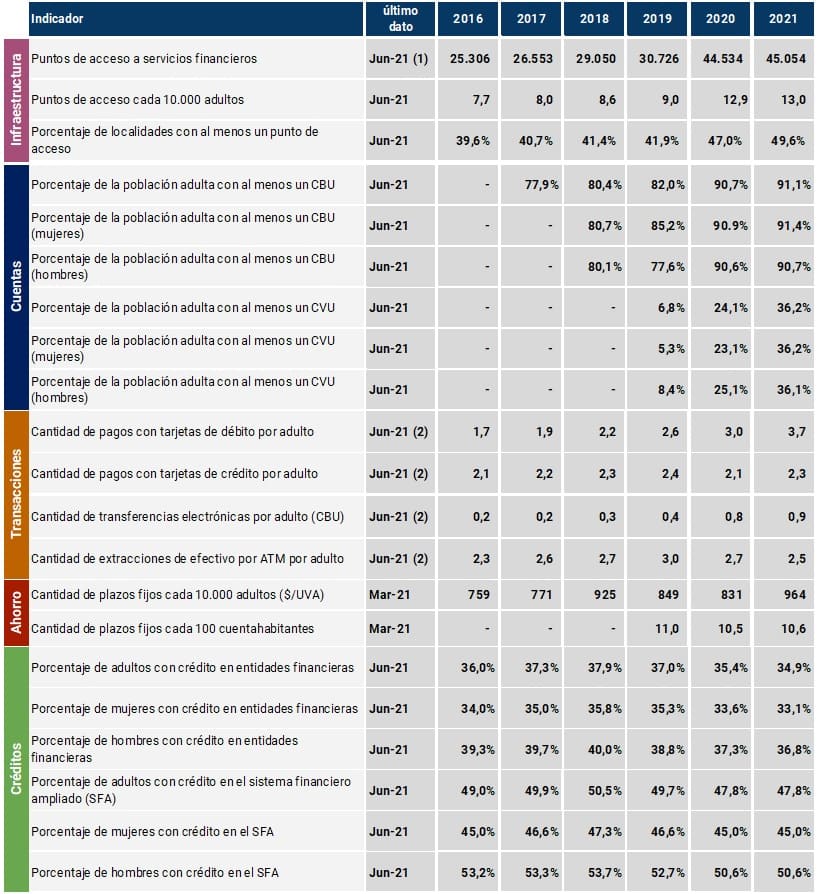
Notes:(1) This includes access points for financial institutions (branches, mobile branches, ATMs, self-service terminals, and complementary financial services agencies) and ATMs operated by non-financial institutions. (2) Monthly average for each year. 2021: monthly average for the first half of the year. To consult the historical series of the indicators, see Financial Inclusion Indicators.
Local context
During the first half of 2021, the economic context continued to be marked by the incidence of the COVID-19 pandemic. Economic activity showed a recovery after a 9.9% fall in GDP in 20201 . The Monthly Estimator of Economic Activity (EMAE) recorded positive monthly variations since May 2020, although its performance was temporarily interrupted between April and May of the current year2 due to the effect of the second wave of COVID-19. In the following months, economic activity continued to expand. Along the same lines, employment indicators showed signs of recovery from the third quarter of 2020, with a tendency to stabilize their growth in the second quarter of 20213 . For its part, private consumption began to recover from the third quarter of 2020, although in the first six months of 2021 it was slightly below the levels of March 20204 . This increase in consumption also reflected the sustained recovery in employment indicators.
To boost consumption and production, the National Government relaunched the 2021 Zero Rate Credit Program in August 2021 and extended the AHORA 12 Program. In both cases, the BCRA adjusted credit regulation by reducing minimum cash requirements, which materialize whenever financial institutions apply these funds to finance such programs5 . The first line of financing is aimed at workers adhered to the Simplified Regime for Small Taxpayers (RS), its APR is 0% and is credited to bank credit cards with the aim of accompanying the productive recovery process. The second case aims to encourage credit to families for the purchase of goods and services in installments.
In addition, for employers covered by the Productive Recovery Program II6 , the BCRA provided in May 2021 that financial institutions must incorporate unpaid installments of credit assistance in the month following the end of the life of the credit7 . The program is aimed at companies whose activities are not considered critical but suffer a significant contraction in turnover and production. Likewise, the program also contemplated companies belonging to sectors classified as critical.
The COVID-19 pandemic deepened changes in work modalities, in the channels for contracting services and purchasing goods, as well as in the use of means of payment to settle these transactions. The remote use and digitalization of financial services, as well as allowing primary care through the transfer of income to the most vulnerable sectors and the performance of operations that could not be carried out in person, became key elements to include new people in financial services.
Since the publication of the last financial inclusion report, there has continued to be an expanding trend in the number of internet accesses (fixed and mobile) in residential sectors. The number of localities in the country that report some type of internet connectivity (fixed, mobile or both) went from 80% to 82.7% and 93.5% of the adult population of Argentina lives in them 8. Likewise, the use of cell phones continues to outpace computers by a wide margin in all age ranges and genders. 9
On the flip side of the growth in the use of electronic channels, users of financial services are exposed to greater digital risks, such as fraud and identity theft, and barriers caused by a lack of digital skills and limited access to IT infrastructures. In this context, the protection of users of financial services and the incorporation of capacities through specific financial education actions on which the BCRA has been working, including security awareness campaigns, are key factors in promoting financial inclusion.
In this regard, the BCRA reinforced the security measures that financial institutions must comply with in electronic channels. The measures require the reliable identification of the people who accept pre-approved credits, as well as the notification and warning to the user about the debit orders received and their possible consequences. 10 In the case of electronic wallets, only cards, accounts or other sources of funds of the account holder may be associated. 11 This was accompanied by information and security awareness campaigns using various means of communication.
In the area of financial education, the BCRA continued to develop a series of educational programs in different parts of the country. Until September 2021, agreements were signed with the provinces of San Juan, Neuquén, Santa Fe, Chaco and Formosa 12. These agreements are already in operation and have aroused great interest. The participation of secondary schools was significant; and it is being extended among students and teachers of technical and teaching higher education institutes, and among personnel of ministries and provincial agencies that will collaborate with the implementation in their provinces of actions aimed at the most vulnerable sectors of the population.
Just as there was a growth in internet connectivity, electronic means of payment also continued to gain share in purchases of goods and services, despite an intense use of cash13 . The amount of digital payments linked to individuals14 represented 10.5% of private consumption at the beginning of the pandemic and reached a figure of 15.7% in June 2021. Supermarket sales statistics showed that in the months prior to March 2020, around 1.6% of turnover corresponded to online sales, while this indicator increased to an average value of 4.5% between April 2020 and June 2021.
To promote the use of electronic means of payment and equalize the advantages of electronic money to physical money, the BCRA took measures both to promote the use of electronic transfers as a new payment alternative, and to shorten the collection periods for businesses for sales with credit and debit cards. In the first set of measures, interoperability in QR code payments between financial institutions and electronic wallets, which will begin to be operational at the end of November, and the identification of their business customers’ accounts through a QR code stand out. In this way, businesses will be able to receive payments immediately and irrevocably. In the second set, the reduction to 8 business days of the maximum period for micro and small companies and individuals to receive the amounts for sales with credit cards or purchases issued by financial institutions made in one payment and the deadline to 1 business day for the collection of sales that businesses make with debit cards stands out. 15
In this framework of economic activity, access to and use of information technologies, and regulatory initiatives and responses, the financial inclusion indicators of this report are developed.
1. Financial infrastructure
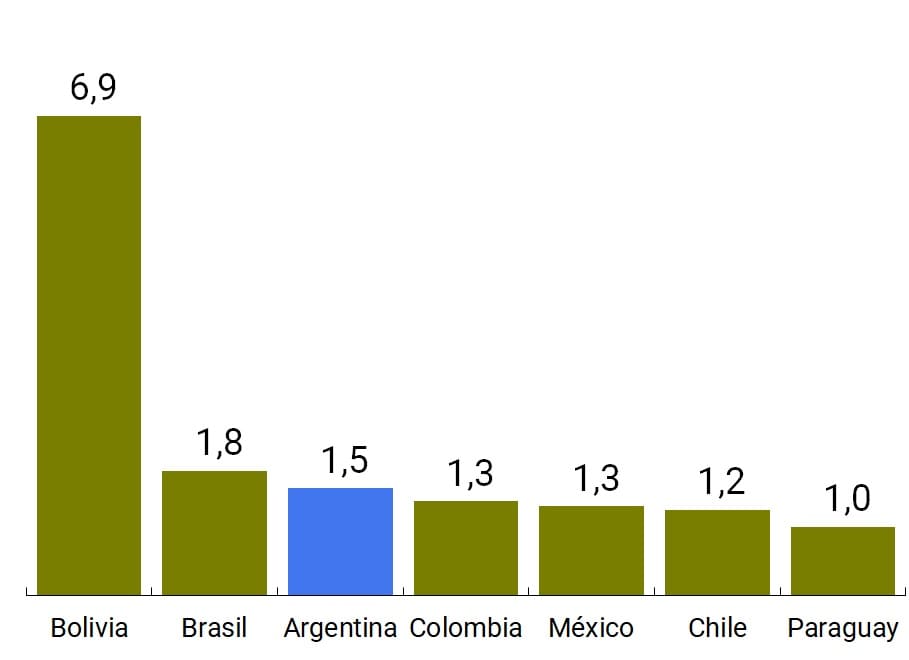
During the first half of 2021, the financial system added 600 financial service access points (PDAs), representing a 1.3% increase since December 2020. This increase almost doubles the 0.7% recorded in the first half of 2020 and shows a clear recovery compared to the first year of the COVID-19 pandemic. As of June 2021, the number of FLW per 10,000 adults reached 13 units and is above Chile and Mexico, but still behind Colombia and Brazil. 16
At the level of coverage of the territory, there is an improvement in the percentage of localities with FLW, which went from 48.3% in December 2020 to 49.6% in June 2021, reaching its historical maximum. The population that inhabits these localities represents 92.3% of adults nationwide17 . The increase in coverage is due to the incorporation of new ATMs in localities that did not have physical infrastructure and the relocation of complementary financial services agencies (ACSFs).
Graph 1 | Financial Services Access Points
Quantity of PDAs
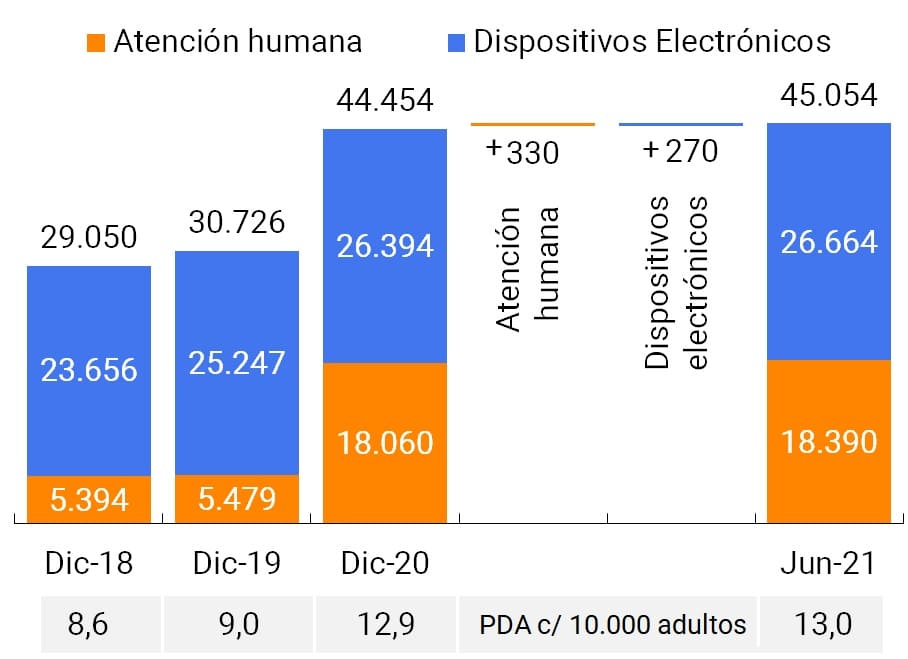
Percentage of localities with PDA
Note | Human Care: Branch and ACSF; electronic devices: ATM and TAS.
Source | BCRA, networks and INDEC.
Localities with less than 2,000 adult inhabitants continue to have a lower penetration of the financial system. This is observed in the percentage of localities covered, in the number and variety of PDAs and in the lower internet connectivity. As a result, its inhabitants are less able to access financial services on a daily basis, which represents a pending challenge for physical and digital infrastructure.
Human-attended PDAs and self-managed electronic devices had a similar increase in absolute amounts during the first half of 2021. The first group registered a strong increase in 2020 as a result of the incorporation of a large number of ACSFs into the financial system. The possibility of receiving human assistance18 is still an important aspect for financial inclusion, especially for vulnerable groups.
a. PDAs with human attention: branches continued the downward trend observed in 2020 and registered a 1% drop during the first half of 2021. Private banks account for 92% 19of the reduction, while the remaining 8% corresponds to public banks.
This phenomenon is part of a trend observed in countries of different income levels that are experiencing a progressive reduction in their branches as a result of the growth of digital financial services and a strategy by financial institutions to increase efficiency and reduce costs 20. These two factors were especially relevant in the context of the COVID-19 pandemic, in which digital financial services contributed to reducing the movement of people in order to minimize the risks of contagion, while the fall in economic activity impacted the profitability of the financial sector21 .
Graph 2 | International branch metrics
Branches per 10,000 adults
Branch Rate of Change (Dec-17 vs. Dec-20)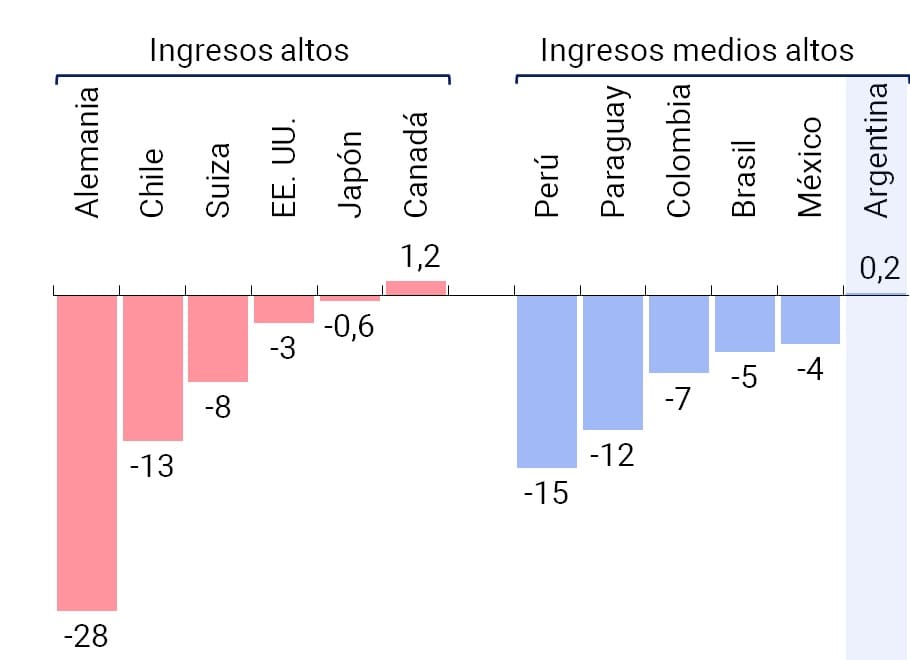
Note | The IMF data used in the international comparison are as of December 2020. BCRA data as of June 2021.
Source | BCRA, networks, INDEC and FMI (Financial Access Survey)
Despite the reduction in the number of branches per 10,000 adults, Argentina maintains a better position than other countries in the region. It also shows a superior performance in the evolution of the number of branches than other upper-middle-income countries in the region and some high-income countries globally during the period 2017-2020.
On the other hand, the coverage of localities with branches shows a slight increase. Despite the reduction in their quantity, there is a redistribution that slightly improves the capillarity of the branches. From the analysis of the presence of branches by locality according to the adult population, it is noticeable how the percentage of localities with at least one branch decreases as the number of adult inhabitants decreases. Covering the cost of setting up and operating a branch requires a certain volume of operations, so the EFFs tend to locate their branches in those localities with the largest number of inhabitants22 . However, as noted in the latest Financial Inclusion Report (Table 1), public financial institutions, in line with their functions of promoting balanced regional development and the common good, have a greater presence than private institutions in localities with fewer inhabitants.
Complementary Financial Services Agencies (ACSFs) complete the set of PDAs with human attention. Private banks have used this type of point, which offers users a limited set of transactions focused on cash withdrawals and the payment of services and loans, to expand their PDAs during 2020. The available information shows that, in relative terms, the ACSFs cover a greater number of localities with less than 10,000 inhabitants than the branches.
Table 1 | Locations with branch and ACSF coverage
Expressed as a percentage of localities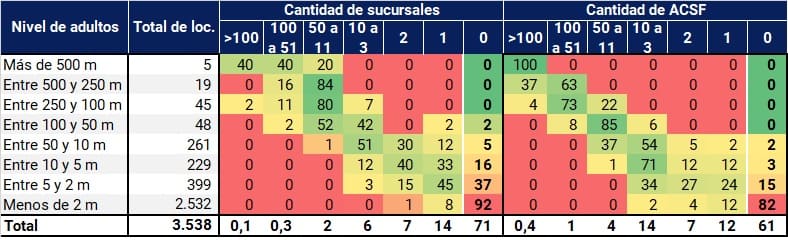
Note | Data as of June 2021. “M”: Thousands. “loc”: localities.
Source | BCRA and INDEC.
Given that the bulk of the ACSFs were located in localities that already had PDAs, in December 2020 the BCRA established the requirement of prior approval for the delegation of operations to ACSF in order to ensure that the new agencies contribute to the financial inclusion of underserved populations.
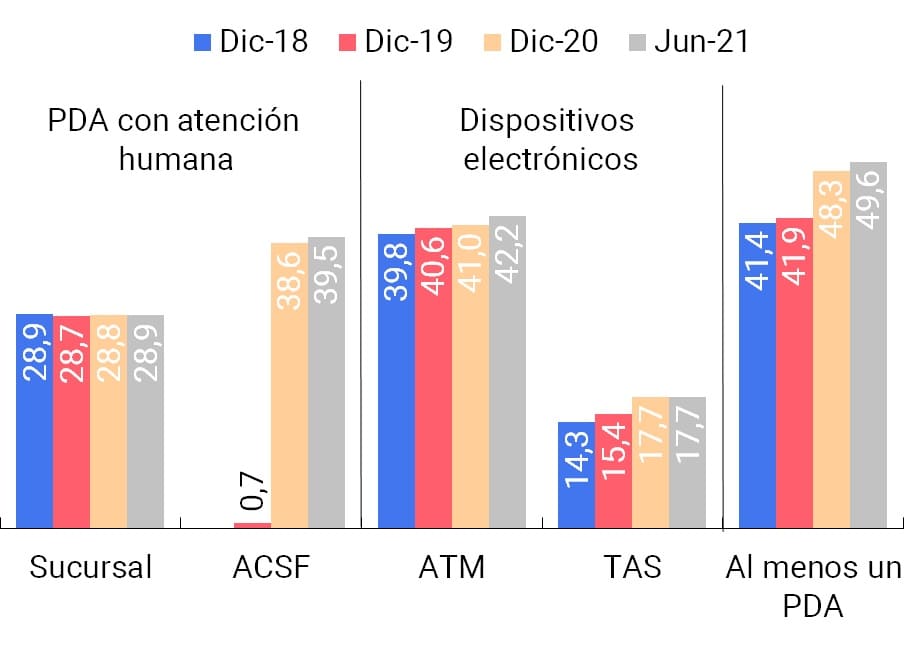
In this context, during the first half of 2021 there was a 3% increase in the number of ACSFs enabled 23 and a relocation of existing ACSFs to new sites. This change generated an improvement in the coverage of the territory with 29 new localities covered by at least one ACSF (all with less than 5 thousand adults), which thus reached 39.5% of the total localities.
b. Self-managed electronic devices: these are made up of automated teller machines (ATMs) and self-service terminals (TAS), whose main difference is related to cash handling. All ATMs allow the withdrawal of money, but only some allow deposits. On the other hand, as a general rule, TAS allows deposits, but not extractions. Both types of devices offer their customers the ability to perform other transactions, such as transfers, utility payments, balance inquiries, and more.
During the first six months of the year, 282 new ATMs were enabled, representing a 1.6% increase compared to December 2020. The incorporation of new ATMs increased compared to what was observed during the same period in 2020, in which 186 devices were enabled. Private banks, which concentrate the largest number of ATMs, lead the increase with 164 new devices. Secondly, the non-financial entities that operate non-bank ATMs continue to expand steadily since their incorporation into the financial system in 2016. These added 63 new devices, which represents a growth of 13% in the first six months of 2021.
In the case of ATMs, it is interesting to observe the additions and cancellations reported by the EEFFs, attentive to the fact that a greater number of these movements account for a replacement of devices that is key to improving the (technological) quality of the PDAs. During 2020, although there was no considerable increase in the number of ATMs, a number of registrations and deregistrations were observed concentrated in the localities with the largest population, which are the ones with the highest number of PDAs. These moves may imply an improvement in the quality of the ATM infrastructure by replacing existing devices with others with more up-to-date features and technologies. It should be remembered that the incorporation of biometric readers in ATMs, ordered by the BCRA at the beginning of 2021, simplifies their use since it does not require a debit card24 .
In the same vein, the EEFF continue to increase the percentage of their ATMs that offer facilitating tools for the use of people with visual difficulties, such as text-to-speech player software and Braille keyboard25 . As of June 2021, 44.5% of all bank ATMs had this type of tool, compared to 43.3% as of December 2020.
From the analysis of ATM coverage by locality, 42.2% of the country’s localities have at least one device of this type. In addition, it is observed that all localities with more than 50 thousand inhabitants have at least one device26 . As for PDAs with human attention, ATM coverage decreases in less populated localities. In this context, in March of this year the BCRA established incentives for the EEFF to install ATMs in less favored localities and reduce the existence of out-of-service devices27 . By reducing minimum cash requirements, the aim is for the SEEs to improve the operation and geographical distribution of ATMs and to reach smaller and more remote localities that are still underserved (or underserved)28 .
Table 2 | Locations with coverage of electronic devices
Expressed as a percentage of localities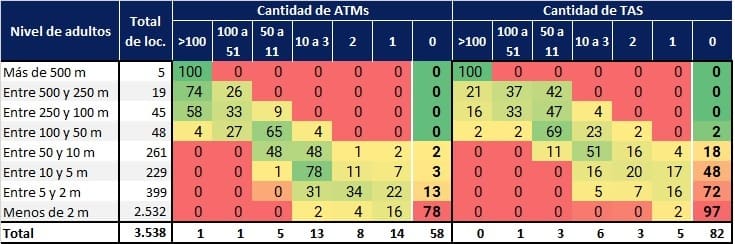
Note | Data as of June 2021. “M”: Thousands. “loc”: localities.
Source | BCRA, networks and INDEC.
With respect to self-service terminals (TAS), as of June 2021 the number of TAS registered a decrease of 0.1% compared to December 2020. The distribution of TAS by institutional group is concentrated in private banks, which represent 80% of the national total. However, it should be noted that since 2017 public banks have been gaining share in the total number of devices and account for 71% of the increase registered, with the incorporation of 1,457 TAS (vs. 596 for private banks).
The location of the devices also differentiates the ATMs from the TAS and is a key point that impacts their time availability29 and the geographical deconcentration of the PDAs. 72% of ATMs are located inside branches, while the rest are located in locations such as supermarkets, gas stations and shopping malls, among others. TAS, on the other hand, is concentrated within branches, with only 1% located in other locations. Consequently, the level of TAS location coverage depends on the location of the branches, so the percentage of localities with at least one device is lower for TAS than for ATMs (18% vs. 42%). On the other hand, in localities whose size is less than 50 thousand inhabitants, the absence of TAS begins to be observed; while in the case of ATMs this threshold occurs for localities below 5 thousand inhabitants.
c. Connectivity. The number of internet accesses (fixed and mobile) in residential sectors continues its expansive trend. Likewise, the use of the internet and cell phones by the population reports high levels in all age ranges and genders30 . Both aspects, infrastructure and use of the internet, are essential for those localities that are less populated and do not have physical infrastructure for the financial system, since they allow the population to access and make use of financial services through electronic channels31 .
Graph 3 | PDA coverage and connectivity in localities of less than 10 thousand adults
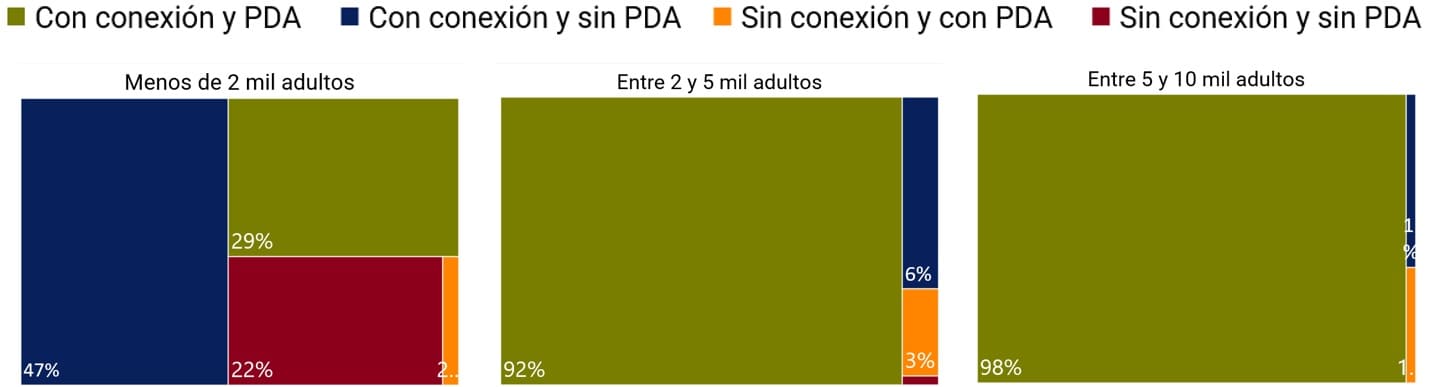
Note | Connectivity data as of March-21, PDA data as of June-21.
Source | BCRA, ENACOM and INDEC.
As of March 2021, 82.7% of the country’s localities, where 93.5% of the adult population lives, reported at least one fixed and/or mobile connection32 . From the analysis of the least populated localities, it emerges that 81% of the localities with up to 10 thousand inhabitants report at least one type of internet connection. However, when this set of localities is disaggregated according to their inhabitants, the availability of internet connection is reduced as the number of inhabitants decreases.
In the case of localities with less than 2,000 adults, 23.5% did not report an internet connection and the vast majority of the latter (21.9% of the total localities with less than 2,000 adults) do not register any PDA either. Although these localities concentrate only 0.3% of the adult population, the access infrastructure, both physical and digital, is deficient and conditions the financial inclusion of their inhabitants.
2. Account Holding
In the second quarter of 2021, the number of people who have bank accounts stood at 31.6 million, which represented 91.1% of the adult population 33 and an increase of 1% compared to December 2020. The existence of 59.7 million bank accounts of individuals in national currency translated into a ratio of 1.7 bank accounts per adult. With these values, the coverage of bank accounts was close to the entire adult population even if different attributes of the account holder such as gender, age group and geographical location are taken into account.
The continuous growth in the number of people who simultaneously have bank accounts and payment accounts34 was highlighted, which accelerated since the outbreak of the COVID-19 pandemic. Joint account holdings reached 11.5 million people, 36% of the total bank account holders. With different intensities, all regions and age groups have registered positive variations in the number of people with both accounts.
Figure 4 | Holding bank and payment accounts
In millions of people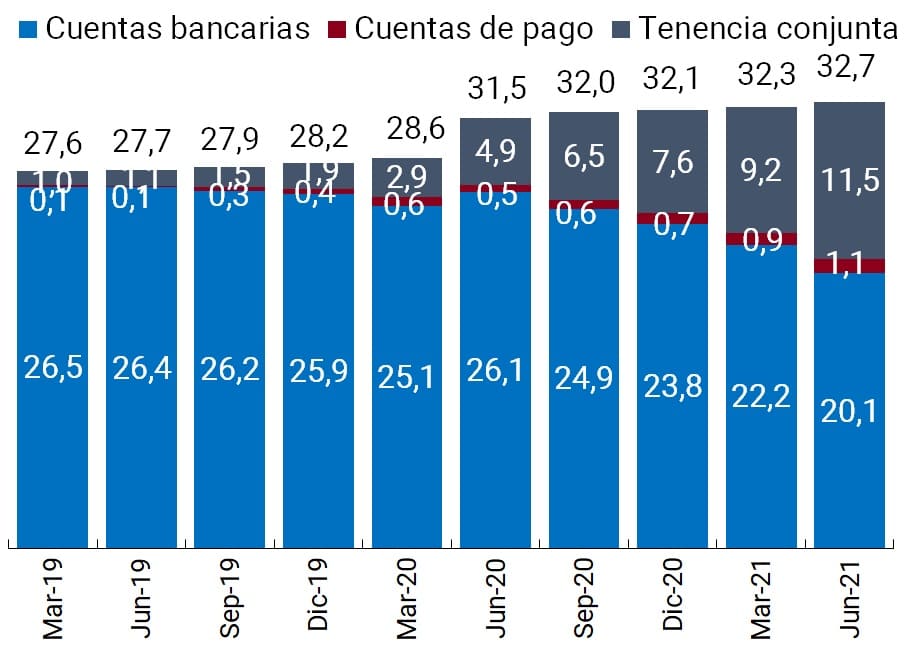
Percentage of adult population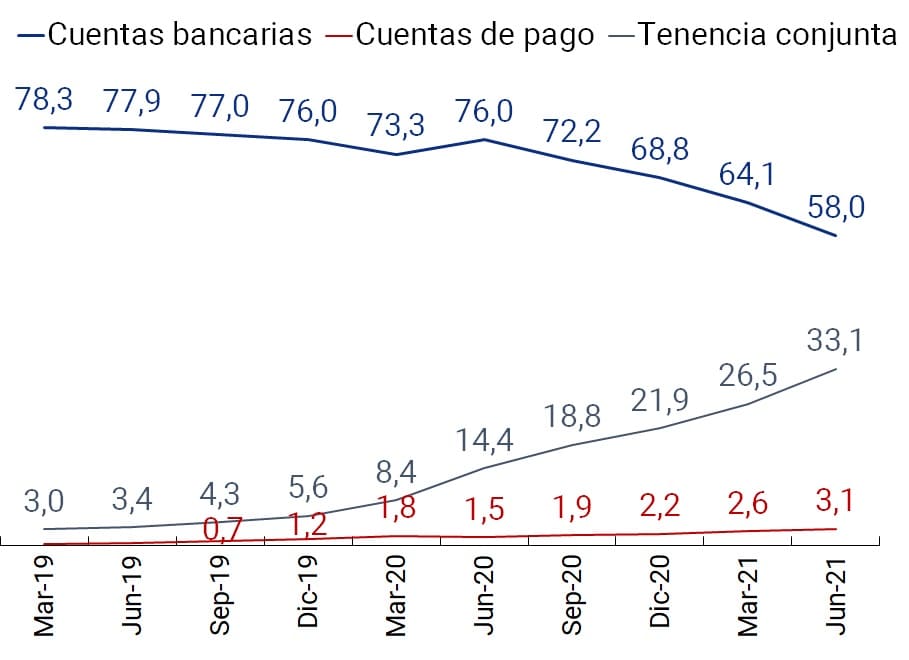
Note | (i) Bank accounts: people who only have this type of account and do not have payment accounts: (ii) Payment accounts: people who only have payment accounts; and (iii) Joint tenancy: people who have bank and payment accounts.
Source | COELSA, INDEC and BCRA.
Payment accounts took hold as a complement to bank accounts, rather than as a substitute. The number of people holding only payment accounts reached a total of 1,100,000, which represented only 8% of the total holding of payment accounts.
The evolution of account ownership in relation to the adult population shows that the process of opening payment accounts grew more in the middle-age age groups (30 to 64 years) and in the regions with a higher income level35 . When comparing the data for the first half of 2021 with the values of the previous Financial Inclusion Report (December 2020), it can be seen that the maximum variations were recorded by the Central region (13.6 p.p.) at the regional level and by the age group of 30 to 64 years old in terms of age (14 p.p.). However, young people aged 15 to 29 are still the ones who still have the highest levels of tenure (44.3%).
As of June 2021, in the Central, Patagonia and Cuyo regions, the possession of both accounts in young people was higher than the possession of only bank accounts. However, in the NEA and NOA regions, this difference remained close to 16 p.p. in favor of the exclusive possession of bank accounts. The NEA has a greater coverage with bank accounts of the population between 15 and 29 years of age (75.1%) than the Central region (71.3%). This trait would be associated with lower income levels of the population – with possible implications in terms of access to technologies and skills to use them – and the consequent greater attention of public banks and provincial financial agents to beneficiaries of social assistance programs.
Table 3 | Holding accounts in relation to the adult population of each age range and region 36
Percentage of adults; 2nd Quarter 2021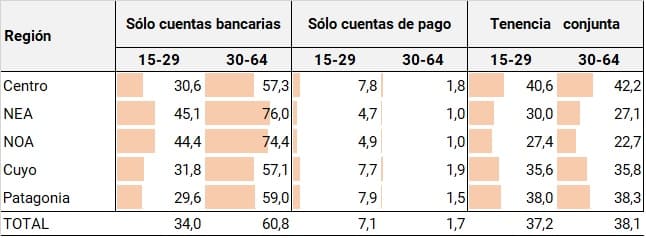
Source | COELSA, INDEC and BCRA.
At the regional level, complementarity in account keeping did not occur with the same intensity in the group of middle-aged people. The differences between holders of only bank accounts and both accounts are more than 15 p.p. in the Central, Patagonia and Cuyo regions and around 50 p.p. in NEA and NOA. The NEA and NOA regions have the lowest proportions of households with access to a computer and, therefore, the lowest rates of use of this device. However, both the levels of Internet access and cell phone use are close to the values of the other regions.
In other words, the differences in account ownership at the regional level would be influenced by factors in addition to access to and use of information and communication technologies, such as income level, the habits and customs of the already banked population, and the penetration of public and private banks that act as financial agents of provincial governments.
Younger generations tend to show a preference for accounts that are opened digitally and operated through cell phones 37. Digital financial institutions and PSPs are the group of institutions that, in relative terms, have the highest participation of young people among their customers.
Graph 5 | Participation of account holders according to age groups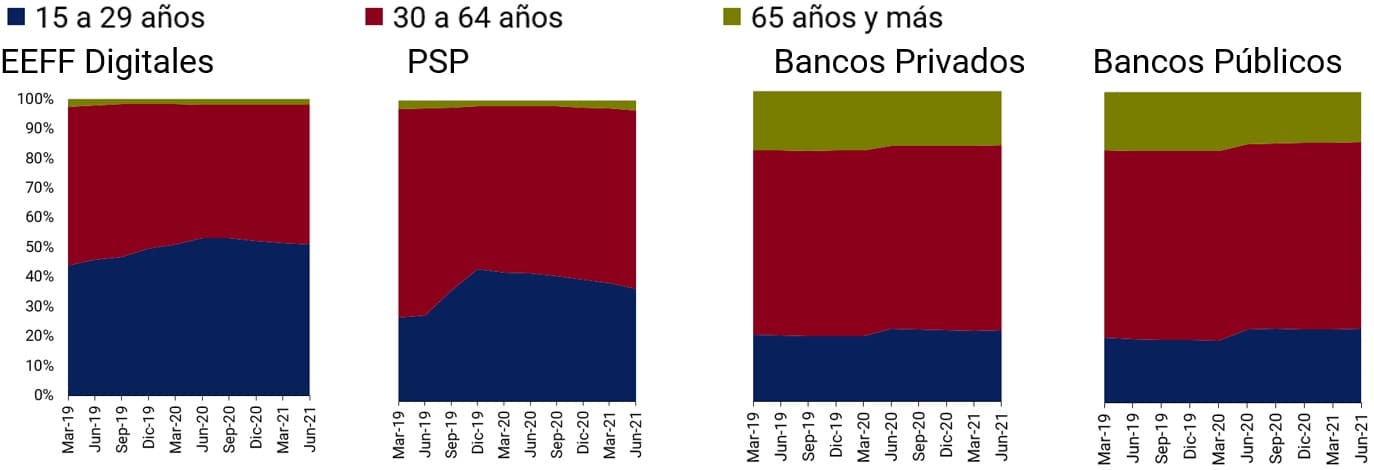
Note | The set of digital EEFF is made up of Wilobank, Brubank, Banco del Sol and Transatlántica Compañía Financiera (. Reba).
Source | COELSA, INDEC and BCRA.
The participation of young people in PSPs and digital financial institutions is higher than participation in public and private banks, which provides signals of the stakeholders of each type of provider and the choice of younger generations when interacting with financial services.
In relation to the gender gap (man-woman), the holding of payment accounts and bank accounts in digital financial institutions showed dissimilar behaviors. In the first group, the gap stood at 0.1 p.p. in June 2021, starting from a value of 4 p.p. in March 2020. However, in the case of digital financial institutions, the gender gap widened in the same period, from 1.1 p.p. in March 2020 to 2.7 p.p. in June 2021. The case of public banks is the only one that presents an inverted gap (in favor of women) influenced by the role of women in social programs.
With respect to the size of the financial system, it should be noted that digital financial institutions represent a smaller portion, since they account for 0.2% of total assets, 0.1% of private sector local currency deposits, 0.2% of local currency credit to the private sector, and 5.2% of all peso accounts38 .
3. Electronic means of payment and savings methods
3.1. Electronic means of payment
As mentioned in the previous IIF, the population accelerated the adoption of electronic means of payment (EPM) from the unexpected event of the COVID-19 pandemic. This behavior is consolidated as a gradual normalization of daily life and economic conditions advances.
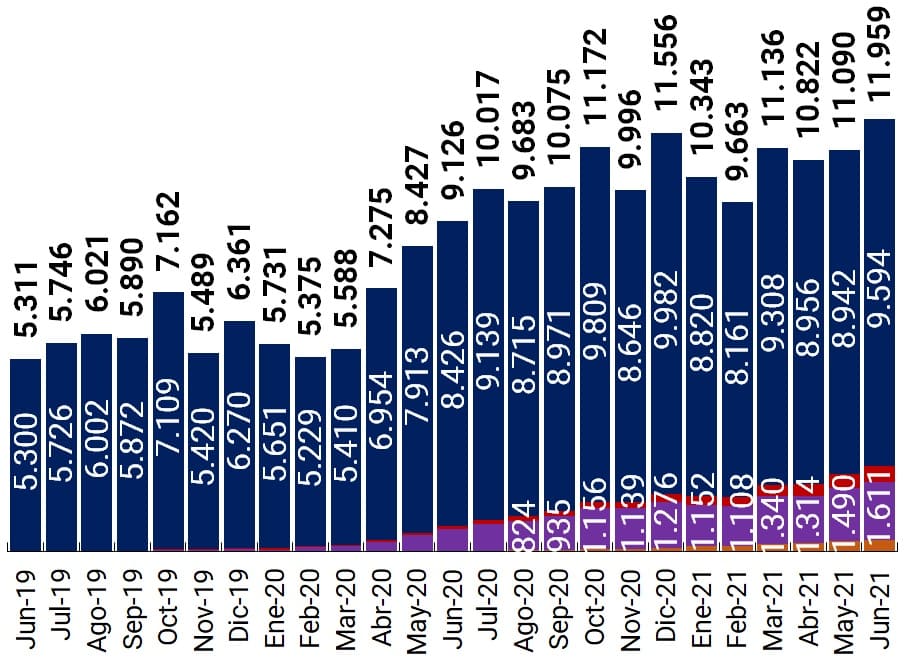
Graph 6 | Transactions by electronic means of payment
Quantity per adult
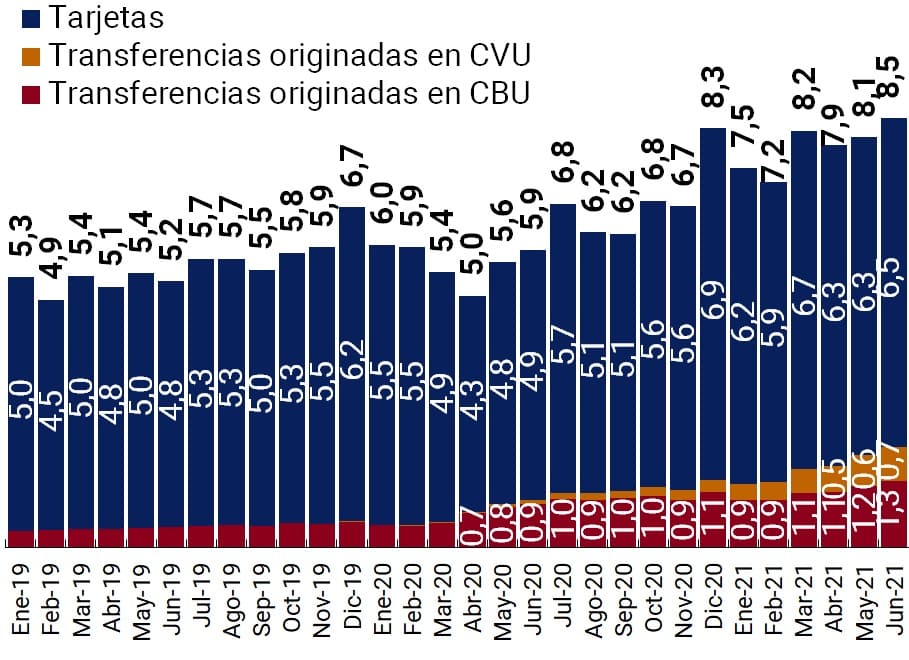
Amount per adult -moving average 12 m.-
Note | “Cards” includes debit, credit and prepaid cards.
Source | BCRA and INDEC.
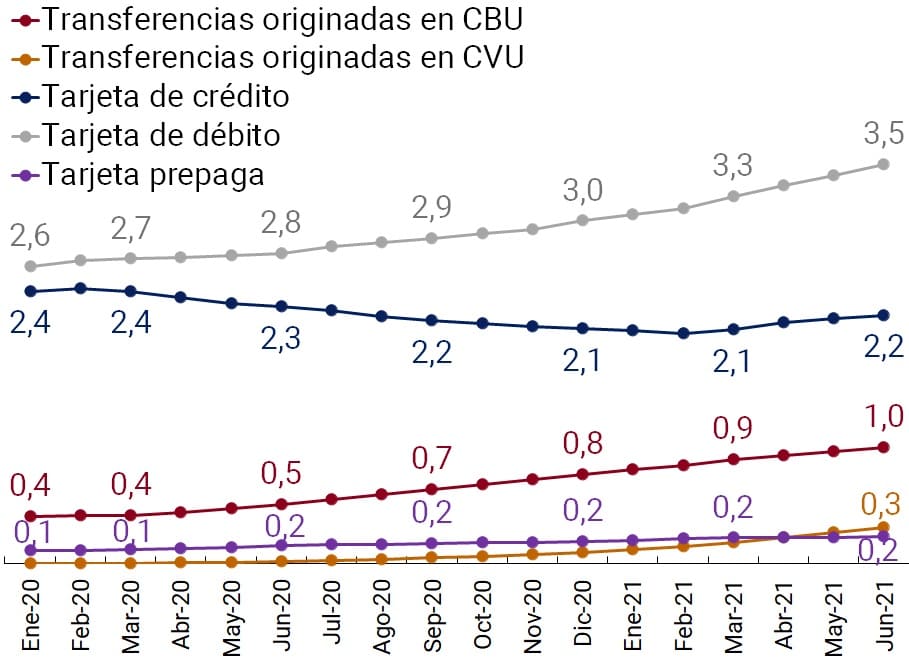
In June 2021, more than 8.5 operations were registered for MPE 39 per adult, the highest monthly value since January 2016, the date from which the series is recorded. During the first 6 months of 2021, the MPEs reached an average figure per adult of 7.9 operations, which is 40% and 16% higher than the average recorded in the same period of 2020 and in the last half of that year, respectively. Although there has been a growing trend in the use of all electronic means of payment for a few years now, except for credit cards, the dynamism of electronic transfers stands out, whose participation in total operations went from 4% in January 2016 to 23% in June 2021.
This positive trend was associated with different factors: (1) the pandemic modified the population’s habits of use of electronic means of payment, promoting those that can be done remotely, at low cost and with immediate accreditation, (2) the proliferation of electronic wallets, both bank and payment service providers that offer payment accounts (PSPOCP) and (3) the regulatory initiatives taken by the BCRA. The latter aimed to: (i) promote electronic transfers as an alternative means of payment that takes advantage of their attributes of interoperability, immediate crediting of funds and lack of costs for the payer; (ii) reduce the collection terms for retail businesses for sales with credit and debit cards and (iii) reduce non-remunerated reserve requirements for those financial institutions that promote the use of MPEs associated with demand accounts in pesos whose holders are individuals 40 . All the measures seek to equate the use of electronic money with cash.
In the first half of 2021, MPEs continued their progress with respect to cash withdrawals, a metric used to approximate the population’s use of cash. In average number of operations, the ratio increased 41% compared to the same period in 2020 and 23% compared to the previous semester; while in terms of average amount, the ratio grew 37% and 19%, respectively. The expansion of electronic payment modalities for users and incentives for their acceptance by merchants could mean that MEPs continue to gain share over the use of cash.
In the period analyzed, the dynamics of the ratio between MPE and cash withdrawals was mainly explained by the growth of electronic payments, given that withdrawals remained practically unchanged. Compared to the same period in 2020, the quantities and actual amounts extracted had variations of -1% and 1%, respectively, while, compared to the previous semester, they suffered falls of 5% and 14%.
Figure 7 | Electronic means of payment in relation to cash withdrawals
Transactions per 100 withdrawals
Amount paid per $100 of withdrawals
Note | Amount expressed in constant pesos (base CPI 100 = January-19).
Source | BCRA and INDEC.
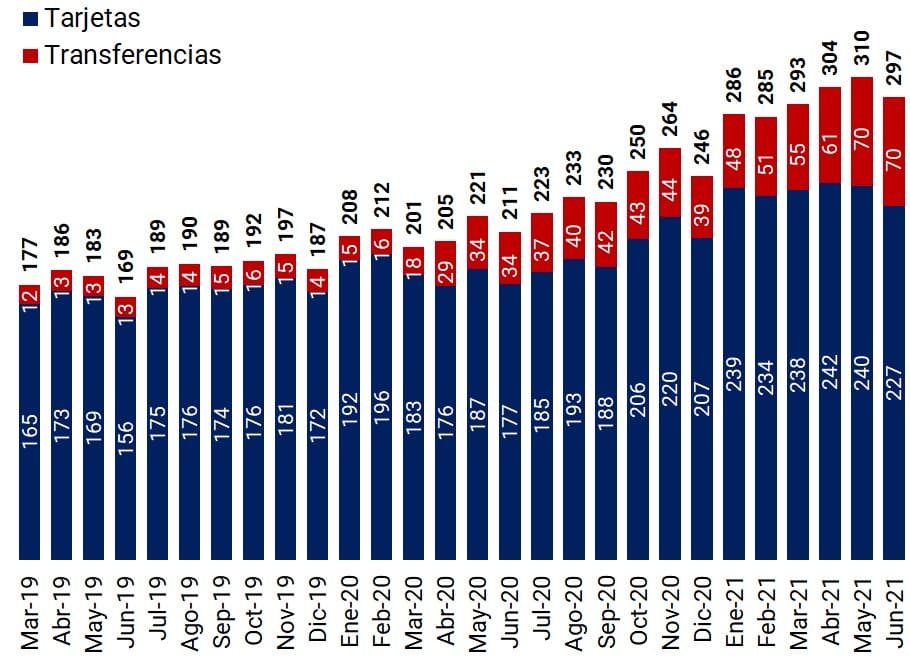
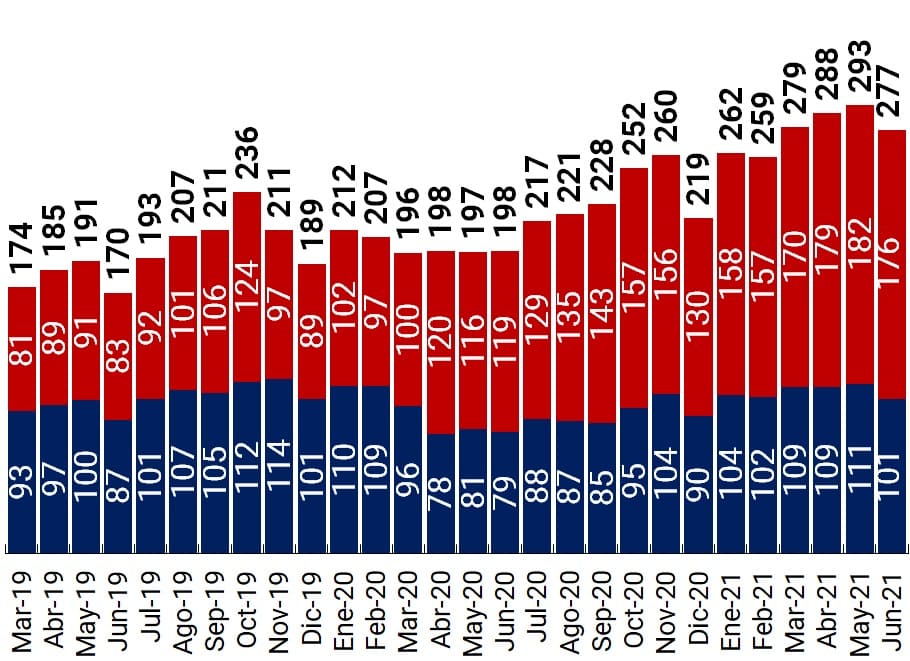
a. Wire Transfers Originating in CBU and CVU. Unlike previous editions, this report analyses wire transfers originating from bank accounts (CBUs) and payment or non-bank accounts (CVUs), regardless of the recipient account41 . The sum of both sets indicates that each adult made 1.6 monthly transfers during the first half of 2021, 38% higher than those made in the second half of 2020. The amounts transferred per adult reached an average of $10.8 thousand constant pesos in January 2019, 4% more in relation to the first half of 2020. Thus, transfers were the third most used electronic payment instrument by the adult population (20% of the total amounts) and the first in terms of amount transacted (61%).
The discrimination of transfers by type of account, bank and non-bank, shows the importance of having an interoperable payment system. As of June 2021, about 30% of transfers sent were those initiated from an account type other than the destination (CBU to CVU and CVU to CBU). On the other hand, in the first half of 2021, the growth in the number of transfers was driven, in equal parts, by both bank and non-bank accounts.
Figure 8 | Transfers initiated in CVU and CBU per adult
Quantity per adult

Amounts per adult
Note | Amount expressed in constant pesos (base CPI 100 = January-19).
Source | BCRA, INDEC and COELSA.
The values of the total transfers illustrate the predominance of those initiated in bank accounts, a result that is to be expected in view of the population’s holding of each type of account (See section on account holding). Of every 100 transfers made in June 2021, 66 were initiated in a bank account; while in the amounts transferred the ratio is even higher, since for every $100 pesos transferred, $84 originated in bank accounts. In addition to the number of bank and non-bank accounts, the short life span of transfers originating in CVU together with the greater functionalities that payment by transfer will have in the future, would imply a greater participation in the medium term.
As for the destination of transfers initiated in bank accounts, most were directed to bank accounts. During the first half of 2021, each adult carried out, on average, a monthly operation for a value of 8.9 thousand constant pesos of January 2019. These values implied an increase of 61% and 36% compared to the same period in 2020. In terms of the channels used, internet banking (home-banking) continued to dominate (almost 7 out of 10 transfers and 80% of the volume transferred). Mobile banking once again registered a notable dynamic, as its share reached a figure of 28% in amounts and 13% in amounts at constant values.
For its part, the evolution over the last two years of transfers initiated in non-bank accounts has been remarkable. The holding of these accounts multiplied by 8 between March 2019 and December 2020 (from 3% to 24% of the adult population). These transfers were mostly allocated to bank accounts. This direction was more noticeable in the amounts (84% of the volume per adult) than in the quantities per adult (57%).
The relationship between transfers and the number of accounts of human persons provides a first analysis of their intensity of use. In the first six months of the year, more than twice as many transfers from non-bank accounts were initiated in relation to the corresponding stock of accounts than from bank accounts (1.3 vs. 0.6)42 . Two of the factors that could be explaining this behavior are the age profile of the holders of both types of accounts and the type of transaction involved in the transfers. On the one hand, the activity of transfers in pension accounts, whose coverage is complete for people over 65 years of age, could be lower than in payment accounts where the youngest are the main holders. On the other hand, transfers initiated from CVU could be associated with the purchase of daily goods of lower amounts and the sending of the collections of the merchants to their bank accounts. On the other hand, the average amount at constant prices of transfers initiated in CBU, in relation to the number of accounts, exceeded those initiated in CVU ($4.8 vs. $4 thousand).
b. Card payments. In the first half of 2021, the debit card was, again, the most used means of electronic payment. This instrument registered, on average, 3.7 monthly payments per adult, equivalent to 47% of the total transacted by MPE. The amount of payments per adult reached an average value of $3,100 constant pesos in January 2019, 5% more than the average recorded in the second half of 2020. The opening of new bank accounts from the COVID-19 pandemic would have had a positive impact on debit card payments.
Debit card operations through mPOS43 , QR and remote channels continued their expansive process initiated in the wake of the COVID-19 pandemic. In the first half of 2021, these operations accounted for 28% and 30% of the total amounts and amounts of debit card payments, around 10 p.p. more than in the first six months of 2020 and 1 p.p. more than in the second half of 2020.
Figure 9 | Card payments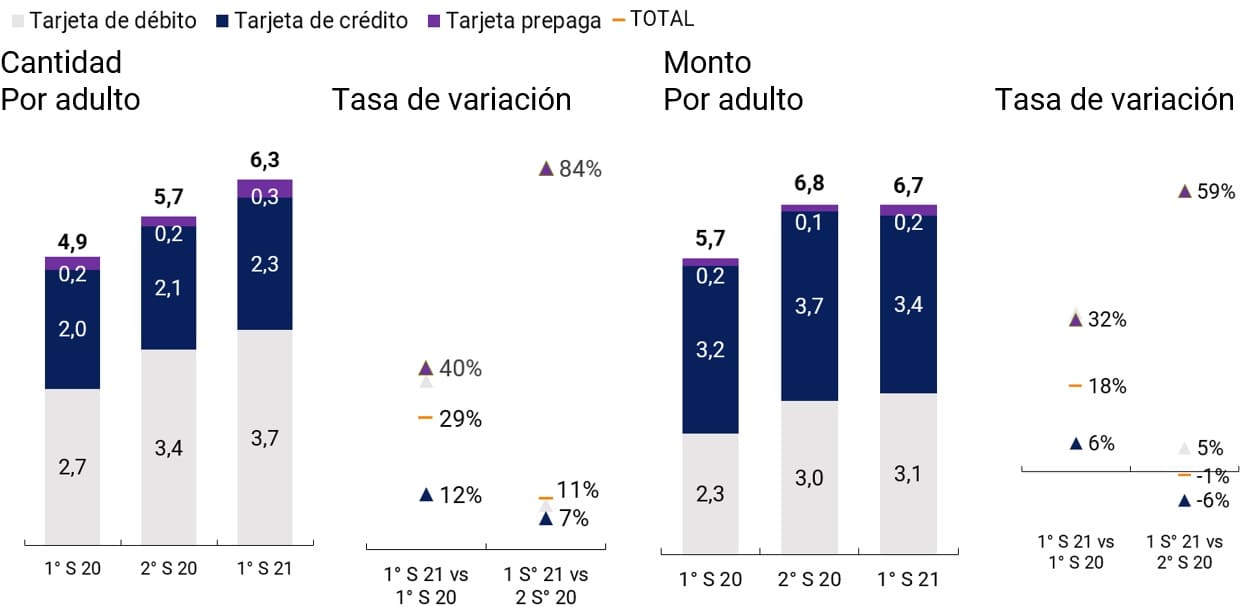
Note | The values correspond to the monthly average of each semester and the amounts are expressed in thousands of constant pesos (base CPI 100 = Jan-19).
Source | BCRA and INDEC.
For their part, credit card payments showed a recovery in the number of operations. This instrument ranked second as the most used means of electronic payment, with a 29% share in the total operations of MPE; while the proportion in the total amount reached 20%. The evolution of transactions was also reflected in the indicators of credit to individuals through credit cards. Assistance of this type, including those from non-bank credit card issuers, began to recover from mid-2020 in line with what was observed in the MPEs44 . The Crédito a Tasa Cero 2021 and AHORA 12 programs, whose operations use credit cards, had a positive impact on the operations carried out through this instrument.
Finally, during the first half of 2021, payments with prepaid cards continued to increase, although their participation in the total MPE was small (4% in amounts and 1% in amounts). The rates of change of the metrics per adult continued with positive records and of considerable magnitudes. This would be explained by the significant growth in payment accounts45 , given the association of some of the prepaid cards with these accounts46 . However, judging by the evolution of transfers initiated from CVU with respect to prepaid card operations, the performance of the former in terms of growth was more significant than that of the latter. At the same time, transactions per adult of transfers initiated from CVU exceeded, as of this year, those made with prepaid cards. This trend could reflect a greater preference of users for payments initiated from electronic wallets, as well as a superior functionality of the former compared to the latter.
Figure 10 | Card payment initiation channels
Number of trades per adult
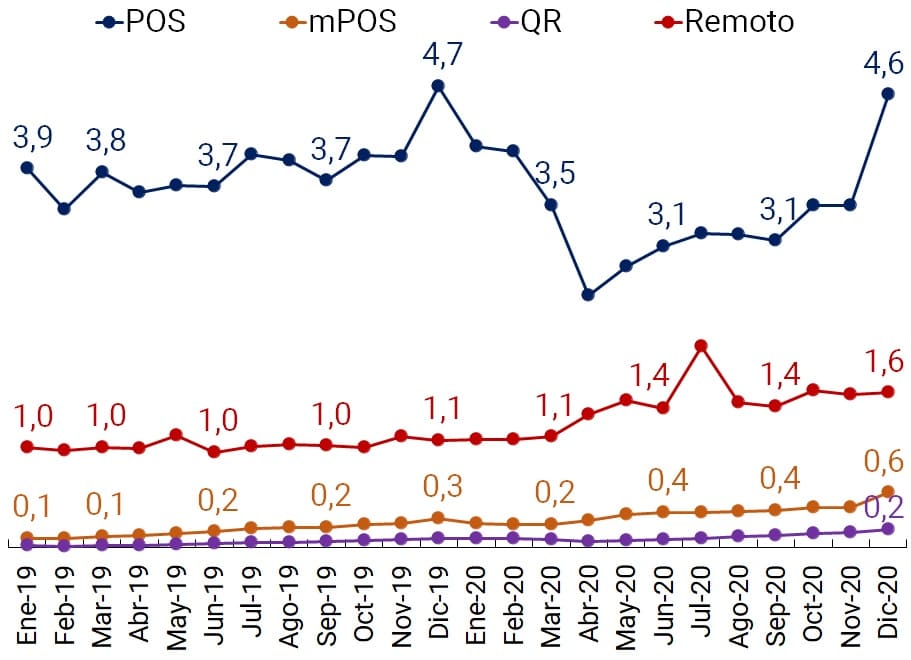
Participation by channel and card (%)
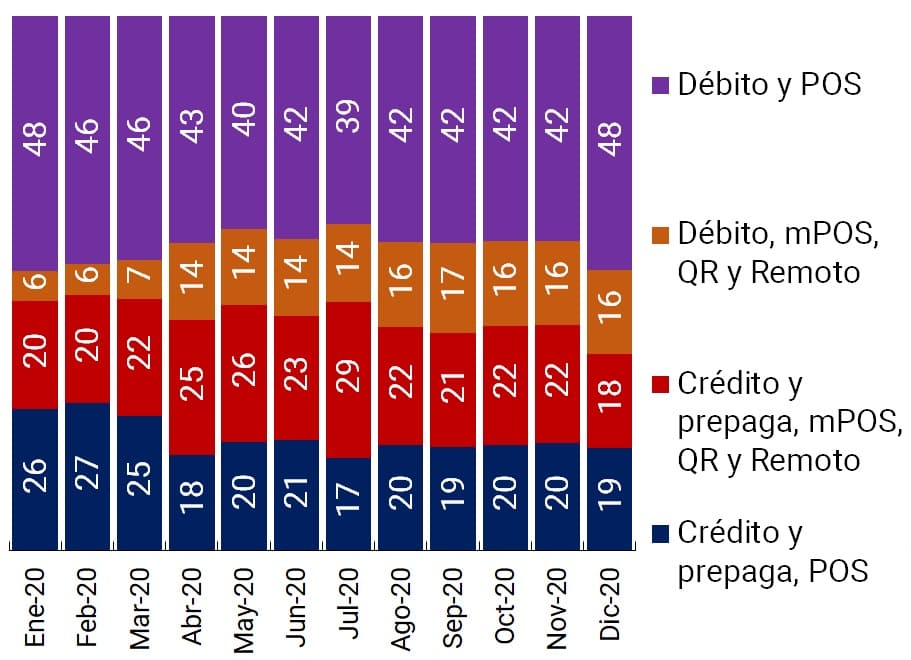
Note | “Remote” includes transactions carried out by payment button, automatic debit and telephone, among other means.
Source | Networks and INDEC.
The information on the channels for initiating card payments – credit, debit and prepaid – makes it possible to group and evaluate these operations according to their degree of presence. The face-to-face POS and mPOS 47 modalities registered the highest payment transactionality in 2019 and 2020, both in terms of amounts and real amounts. These transaction channels accounted for more than two-thirds of what was traded in both years, although the boost in remote payments from the COVID-19 pandemic caused POS and mPOS to reduce their share.
As expected, only 43% of terminals registered transactions in April 2020. The historical series of initiation channels shows a sharp drop in the number of card payments via POS in March and April 2020, a trend that is partially reversed in the following months. In December 2020, with the relaxation of social distancing measures and the seasonality of the month, operations carried out through POS returned to pre-pandemic values. In December 2020, the POS fleet had 867 thousand terminals, of which 56% registered activity in that month.
As for mPOS devices, it is noteworthy that their transactions increased in the period analyzed, in which face-to-face operations tended to suffer a generalized decline. The associated costs and infrastructure required for each type of device would explain this difference. In December 2020, the mPOS fleet amounted to more than 2.7 million devices, almost four times more than POS. However, card payments through mPOS represented a very low fraction compared to traditional devices (between 2% and 4%, in real amounts and amounts in the years 2019 and 2020).
In contrast, payments by QR code and those by remote channel gained ground in the period analyzed. The first method, which experienced 3-digit rates of variation for real quantities and amounts (136% and 140% respectively comparing the average values of 2019 and 2020), requires in most cases an operation of proximity between people, but without physical contact between the devices involved. These characteristics, which were advantageous in the context of the pandemic, together with its innovative and agile operations could explain its high growth rate.
On the other hand, remote payments, via the web and others such as telephone sales and automatic debit, marked a significant rise by allowing users to meet the needs of users to cancel their payments remotely during the stages of social distancing. In this way, remote payments manifest hysteresis in their behavior, given that the change in level observed in their operations is not reversed with the relaxation of social distancing measures, which could be interpreted as a structural change that was accelerated by the pandemic.
3.2. Savings modalities
Traditionally, individuals managed their surplus balances in the financial system between the alternatives of demand and fixed-term accounts48 . The high penetration of deposit accounts in all segments of the population allowed widespread access to these instruments, although their use would show significant differences among account holders.
The availability of savings products for individuals includes alternatives with different levels of complexity and risk-return ratio. Among the simplest to operate and manage your risks are: (i) maintaining demand balances in deposit accounts, (ii) setting up fixed terms and (iii) subscribing to mutual funds (FCIs).
The growing trend in the number of deposit accounts was accompanied by an increase in the number of fixed-term deposits, albeit of a smaller magnitude. While the number of deposit accounts more than doubled in number between June 2014 and March 2021, the number of fixed-term deposits increased 1.9-fold in the same period. Although this result in itself does not mean greater financial inclusion, given that the same person can have more than one fixed term from a single bank account or go on to have several bank accounts and make term deposits in each of them, it is still favorable evidence in this regard.
In March 2021, the BCRA allowed financial institutions to remunerate balances in deposit accounts, settling and crediting interest with the periodicity agreed between the parties (daily, weekly, etc.).49 . Thus, it equalized the conditions between financial institutions and PSPOCP in relation to the remuneration of account balances. Some PSPOCPs, through mutual funds, offer their holders a return by paying the interest on a daily basis. Although mutual funds are not within the BCRA’s direct regulatory orbit, they have gained relevance in recent years, with the number of accounts of individuals investing in FCI50 multiplied by 3.
Figure 11 | Accounts and balances of individuals (PH) in different savings products
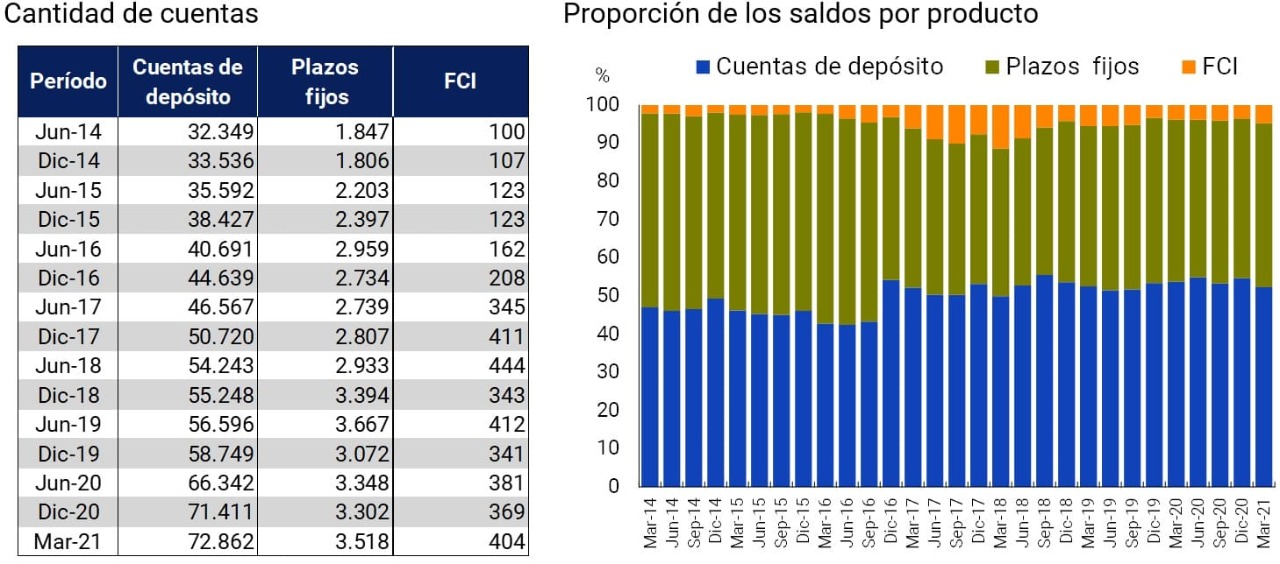
Note | Number of accounts expressed in thousands. It considers denominated placements in both domestic and foreign currency. The number of FCI accounts corresponds to the PH accounts investing in FCI. Fixed-term balance: principal balances at the end of the month; Deposit account balance: monthly average of daily balances for the last month of the quarter; FCI balance: valuation of the FCI on the last business day of the month.
Source | BCRA and the Argentine Chamber of Mutual Funds (CAFCI).
The distribution of the number of deposit accounts according to balance strata showed that the first range, up to a balance of $2,999, grouped the largest number of accounts, with an average share of 66.2% in the last 2 years. When segmenting the universe of financial institutions into small, medium and large, according to the number of human persons who account holders, it was observed that the first layer of balances concentrated the largest number of accounts regardless of the size of the financial institution, since similar levels are observed in the three categories.
76% of the deposit accounts that were located in the first range of balances were located in large financial institutions, a value that amounted to 30 million accounts as of March 2021. These accounts accounted for 52% of the total deposit accounts in pesos in the financial system and housed a very small portion of the balances (~2%).
On the contrary, fixed terms were concentrated in the highest stratum of more than $100,000, which reached an average participation of 56.9% in the last year. This range concentrated the largest number of fixed terms regardless of the size of the financial institution. Similarly to deposit accounts, 81% of the fixed-term loans that were in the last range were located in large financial institutions, a value that amounted to 1.6 million fixed-term loans as of March 2021 and represented 75% of the total balance of fixed-term loans in national currency.
Figure 12 | Number of PH accounts and fixed terms in national currency by entity size and balance stratum51
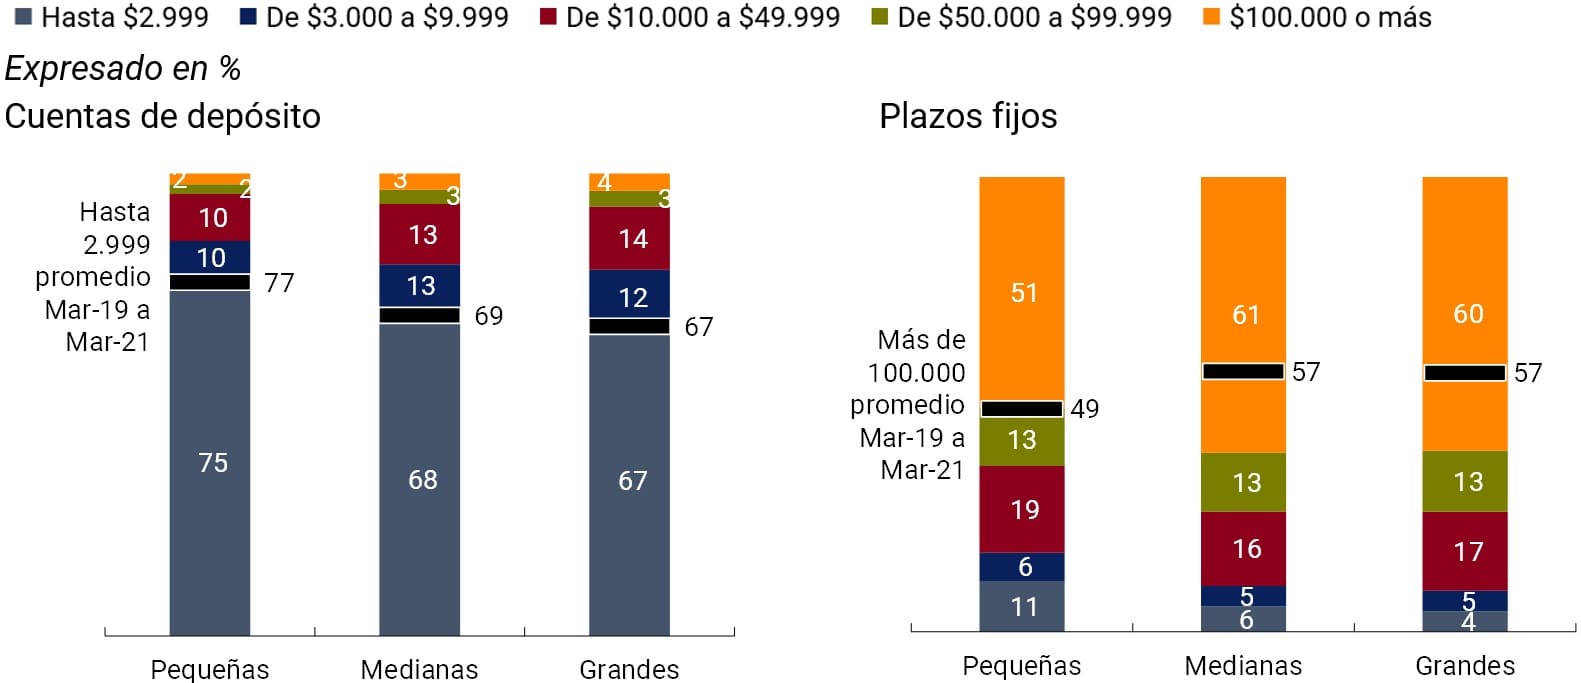
Note | Financial institutions are grouped into small, medium and large according to the number of human persons who account holders, ordered by quintiles in ascending order. Small entities include those in the first and second quintiles, medium-sized entities include those in the third and fourth quintiles, and large entities include those in the fifth quintile. The accounts are grouped into the tiers based on the monthly average of daily balances for the last month of the quarter. Fixed terms are assigned to the stratum corresponding to the amount deposited. The values correspond to March 2021.
Source | BCRA.
One of the factors that influence the relative constitution of demand and fixed-term balances is the structure of accounts of individuals in financial institutions. Large financial institutions, which accounted for 77% of the deposit accounts in pesos in the financial system, had 41% of accounts assigned to the collection of social programs, retirements, and pensions and the remaining 59% to the crediting of salaries and savings banks without specific allocation52 . In this sense, the alternative of passive savings with an account balance would be associated with accounts with low incomes. Thus, the regulations introduced could lead to an improvement in the savings conditions of the most vulnerable segments.
3. Credit to individuals
The COVID-19 pandemic had a negative impact on the credit market throughout 2020. On the one hand, the fall in economic activity and employment – with its effect on income – affected the population’s demand for credit. On the other hand, the face-to-face component of credit contracting caused restrictions on mobility to prevent the spread of the virus, together with more restrictive behavior on the part of private banks, to make it difficult to generate new financing.
In this context, the trend of reduction in the percentage of adults with financing in the extended financial system (SFA) observed since 2019, which reached its minimum of 47.6% in November 2020, accelerated. With the recovery of economic activity, the fall in the number of debtors slowed down. The percentage of adults with access to financing began to show signs of recovery and remained stable until June 2021 at a value of 47.8%. During the last year, the smaller reduction in the indicator of individuals with credit in the SFA with respect to the fall in that of financial institutions (EEFF) is then explained by the evolution of the group of people who had financing from EEFF and from non-financial credit providers (PNFC). Thus, although a group of people stopped having EEFF financing, they maintained credit lines with PNFC, an aspect that contained the fall in the SFA indicator.
Figure 13 | Percentage of individuals with financing over the adult population
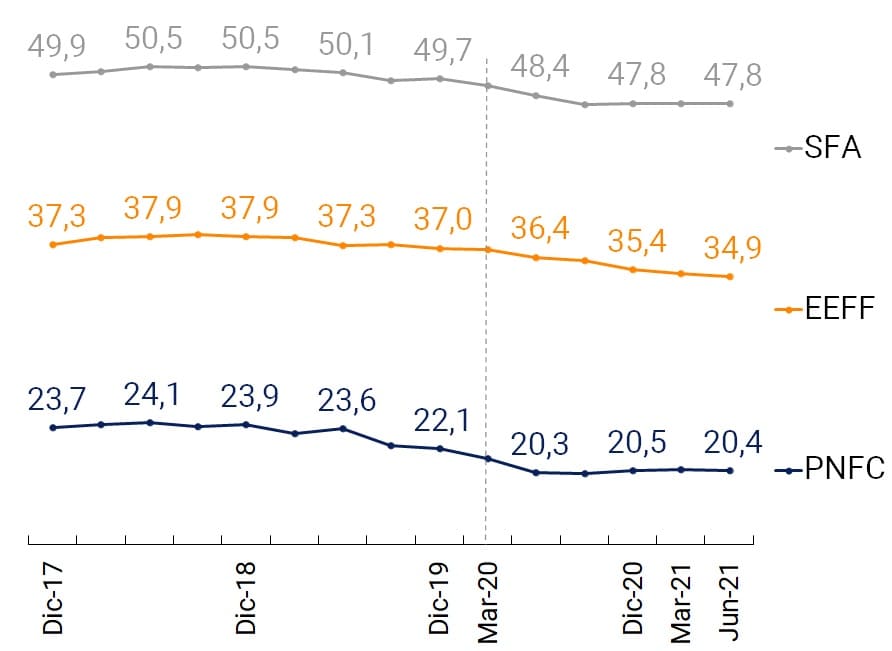

Source | BCRA and INDEC.
Regionally, Argentina ranked third after Brazil and Chile and above Mexico, Colombia, and Peru in terms of the percentage of its population with EEFF financing. Although Argentina’s relative position is not unfavorable, it is noteworthy that the rest of the countries in the comparison – except Peru – presented improvements in the indicator between 2017 and 2020, while Argentina registers a 5% drop. In particular, during the context of the COVID-19 pandemic, the percentage of the population with EEFF financing fell by 4.3%, a behavior similar to that recorded by Chile and Colombia. To soften the effects of the pandemic on access to credit and stimulate its recovery, the BCRA implemented a series of measures that included various credit assistance programs involving individuals53 , the relaxation of debtor classification criteria and current loan payment conditions, as well as the reduction of the crediting period for credit card purchases, among others.
Figure 14 | International comparison of access to finance in EEFF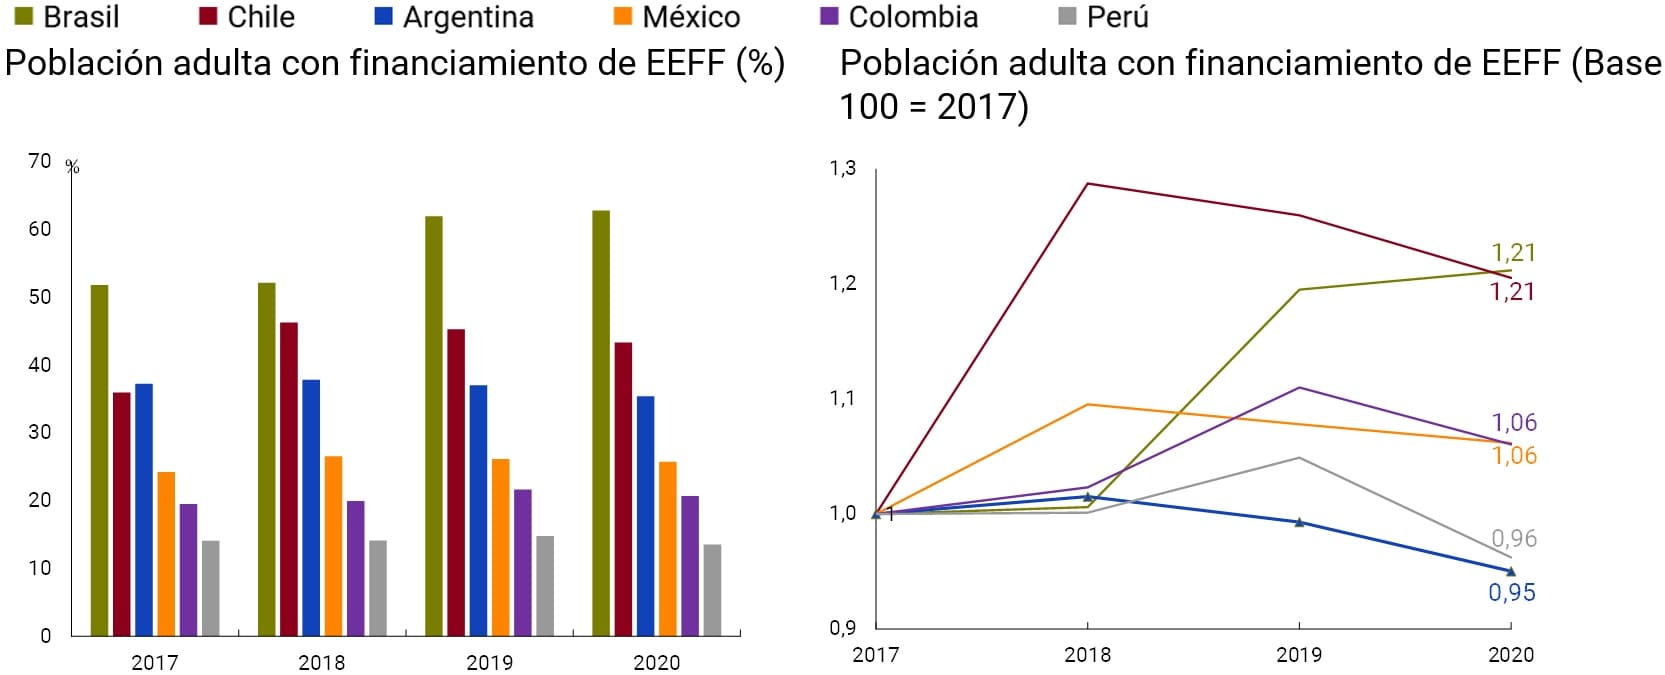
Note | Data as of December of each year.
Source | BCRA, INDEC and FMI (Financial Access Survey).
a. Credit Providers. Public banks increased their number of debtors, in relation to the adult population, from 11.1% in December 2019 to 11.5% in December 2020, a level that remained until June 2021. Although the improvement of 0.4 p.p. is not significant in absolute terms, the value achieved represents its historical maximum and consolidates a slow but sustained trend of upward growth that stands out compared to the other institutional groups. In this way, the role of public banks in mitigating the economic effects on the population of an extreme event and of a certain persistence over time is highlighted.
Non-bank credit card issuers (ETCNBs) and other non-financial credit providers (NPPOs), which recorded a sharp drop in their number of debtors during 2020, showed a different behavior in the first months of 2021. In relation to the minimums recorded in 2020 during the pandemic, the values of June 2021 increased by 0.3 p.p. for ETCNBs and 0.2 p.p. for OPNFCs.
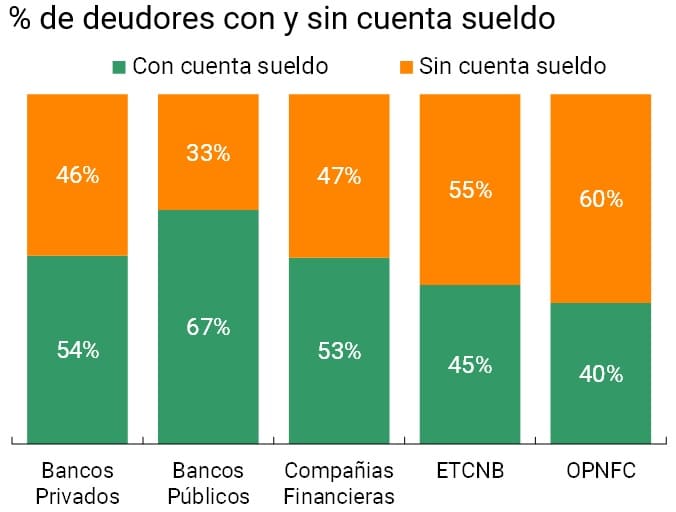
With respect to financial institutions, the ETCNB and the OPNFC have a lower proportion of debtors who have a salary account (which denotes the tenure of work in a relationship of dependency54 ), which would indicate that they serve debtors whose income is less stable over time than that of those in a relationship of dependency. This implies that its portfolio of debtors is more vulnerable to adverse conditions in economic activity and in the labor market, as happened in 2020 with the beginning of the COVID-19 pandemic.
Within the EEFFs as a whole, it can be seen that public banks registered the highest proportion of debtors who receive their remuneration in a salary account (66.9%), which shows a higher incidence of work in a relationship of dependency among the debtors of these entities. Private banks and financial companies register, in the set of financial institutions, a lower proportion of their debtors with a salary account than public banks (53.8% and 53.3% respectively), but they show higher values than ETCNBs and OPNFCs (45.5% and 40.3%).
Figure 15 | Financing and account holding
Note | Graph on the left: (i) includes debtors between 20 and 64 years of age 55 (ii) the salary account may be in the entity that granted financing or in any other; and (iii) presents the average for the second half of 2020. Graph on the right: Debtors are counted as many times as EEFF have granted financing. Data as of December 2020.
Source | BCRA, COELSA and INDEC.
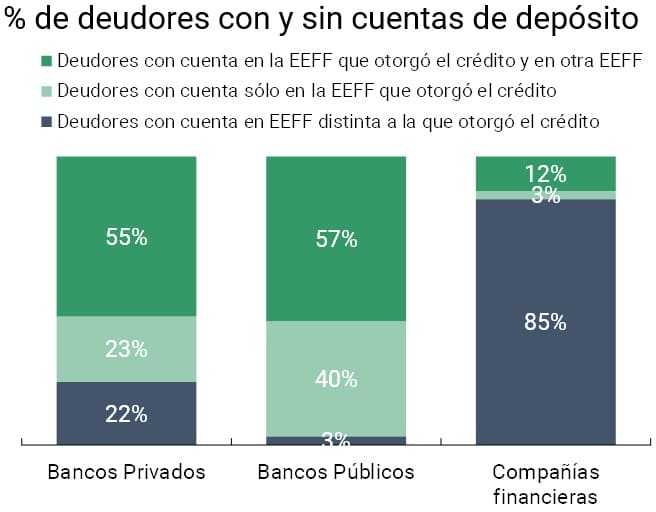
In addition, the holding of all types of bank accounts by debtors can be analyzed, both in the entity that granted the financing and in the rest of the EEFFs. Thus, public banks had the highest percentage of debtors with an account in the entity itself (97%), which would demonstrate that these entities provided financing mainly to their customers. For private LFFs, the proportion of debtors who had an account with the creditor was lower (78% for private banks and 15% for financial companies), which would indicate that these entities offered credit products not necessarily associated with the holding of a bank account with the institution.
On the other hand, the percentage of public bank debtors who had an account only with the creditor entity (40%) was higher than for private banks (23%), which would indicate that the former provide financing in a higher proportion relative to customers who have no relationship with other entities. On the other hand, debtors who have accounts in other entities are similar in both groups of entities, reaching 55% in the case of private banks and 57% in the case of public banks. This result could be associated with the participation, in each group of entities, of different customer profiles, such as people in a relationship of dependency, self-employed or monotributistas. Individuals with self-employed activities or in companies tend to use different sources of financing to carry out their activity, needing, therefore, to access and maintain lines of financing with more than one entity to select the best credit conditions.
b. Credit assistance. In terms of type of assistance, after a drop in the percentage of the adult population with credit card financing in the first half of 2020, there was a slight recovery during the second half of the year. The cards closed 2020 with the same level of debtors and remained stable during the first half of 2021, which implies a change in trend compared to 2019 in which they registered a 0.6 p.p. reduction. In this sense, it is worth noting the contribution of the Zero Rate Credits promoted by the National Government in the framework of the health crisis, which are still in force. This line of financing, aimed at self-employed workers and single-payers, was channeled through credit cards and facilitated this group’s access to financing under favorable conditions.
Figure 16 | Financing of the expanded financial system by type of assistance
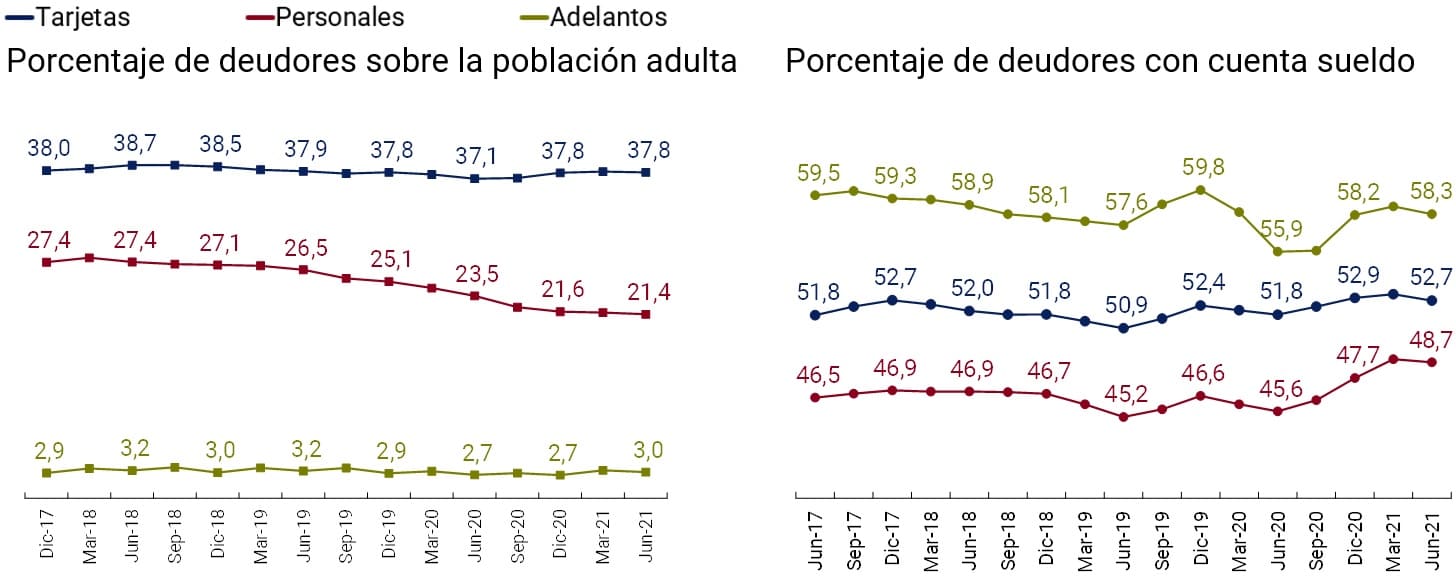
Note | Graph on the right: (i) includes debtors between 20 and 64 years of age and (ii) presents the average of the six months prior to each period.
Source | BCRA and INDEC.
Holders of personal loans registered a lower incidence of workers with a salary account than debtors of other types of assistance. This difference could indicate the high relative share of OPNFC debtors in the group of personal loan holders, which would be an explanatory factor for the downward dynamics demonstrated by this type of assistance. On the other hand, the reduction in the circulation of people due to social distancing measures may have had an impact on the generation of new financing.
c. Gender. The impact of the pandemic on access to financing was not homogeneous between men and women. Although in terms of the percentage of debtors the effect was similar between genders, the average balance per debtor in real terms showed marked differences. In particular, the average balance per female debtor of the SFA registered a reduction of 5.1% between March 2020 and June 2021, while for male debtors the drop was 2.6%.
Table 4 | Impact of the pandemic on access to finance for men and women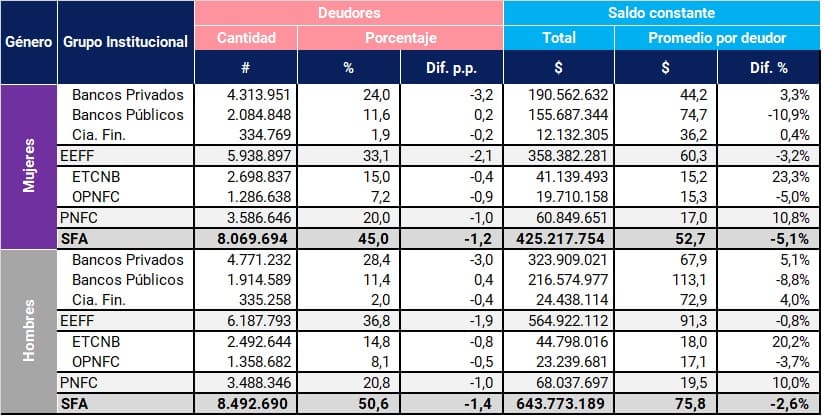
Note | Data as of June 2021. Percentage of debtors in relation to the adult population of each sex. Balances in thousands of constant pesos (base CPI 100 = Jan-19). The columns “Diff. p.p.” and “Dif. %” express the variation between March 2020 and June 2021.
Source | BCRA and INDEC.
These differences were due to the behavior of the FFS, given that the impact on the NFPPs was similar for both genders. Credit indicators by institutional group suggest that the criteria for selecting debtors may have been more restrictive for private banks than for public banks56 . Private banks, at the same time that they saw a reduction in the number of people assisted, increased the average balances of loans granted, while the indicators of public banks show the opposite behavior.
d. Situation of debtors. To mitigate the consequences of the COVID-19 pandemic on debtors in the financial system, the BCRA ordered the addition of days to the periods of arrears admitted for the classification of debtors57 . This relaxation was in force from March 2020 to May 2021 and had a clear impact on regularity indicator 58. As of June 2021, the classification of debtors was returned to the general default criteria pre-existing to March 2020.
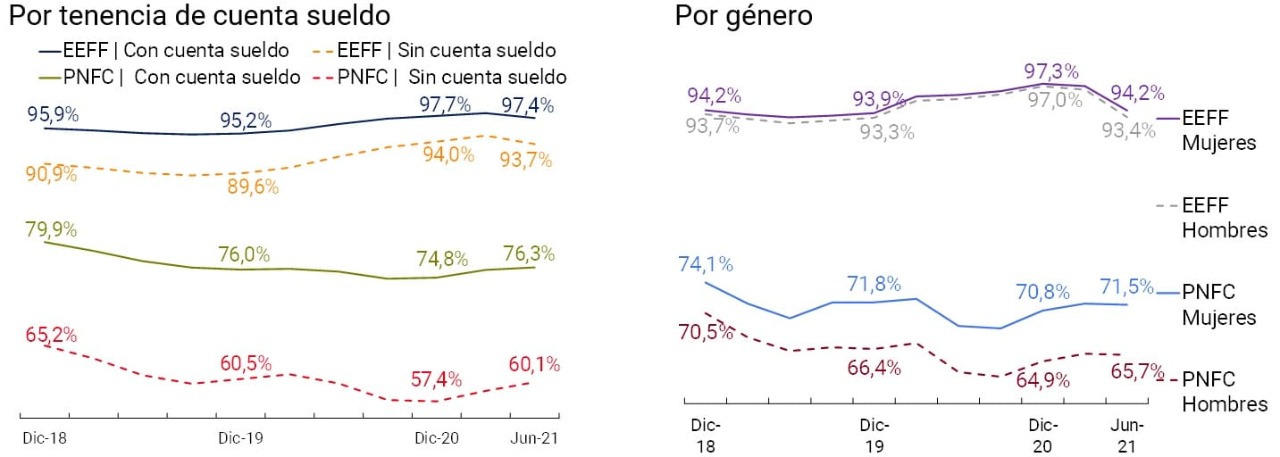
As a result of the relaxation of the classification criteria, the FBSs recorded an increase in the percentage of their debtors in good standing (debtors who adequately met their financial commitments), from 93.6% in December 2019 to 97.1% in December 2020. Once the validity of the relaxation ended in June 2021, the proportion of EEFF debtors in a regular situation returned to pre-pandemic values and reached a value of 93.8%. For the PNFCs, and probably associated with the greater impact of the pandemic on unregistered workers, the percentage of debtors in a regular situation registered a drop from 69.1% in December 2019 to 67.1% in December 2020. However, with the recovery of economic activity, this group demonstrates an improvement in its repayment capacity, registering an increase of 2 p.p. between December 2020 and June 2021 (even despite the end of the relaxation of default terms).
For both EEFF and PNFC, debtors who are holders of a salary account, and therefore have a dependent job, presented better repayment behavior than those debtors without a salary account. At this point, the difference between both groups of debtors within the PNFC stands out, where the group with a salary account registered an average difference since January 2019 of 16.1 p.p. in the percentage of its debtors in a regular situation in relation to the group without a salary account.
On the other hand, as developed in the Financial Inclusion Report for the second half of 201959 , women showed better debt payment behavior than men. The difference in the percentage of women and men who adequately met their financial commitments was clearer for PNFC debtors than for EEFF, with an average gap in favor of women of 5.1 p.p. for PNFC and 0.5 p.p. for EEFF from December 2018 to June 2021.
Figure 17 | Percentage of debtors in a regular situation
Note | Graph on the left: (i) it includes debtors between 20 and 64 years of age and (ii) each month presents the moving average of the previous six months.
Source | BCRA.
Section 1 / Regulatory incentives to improve financial inclusion in Argentina
At the end of March of this year, the BCRA approved a stimulus policy that, while freeing up minimum cash funds to grant credit, promotes financial inclusion. The regulation encourages the promotion of credit from financial institutions, the use of electronic means of payment and the better operation and geographical distribution of ATMs. The incentives are channelled through different franchises that make it possible to reduce the minimum cash requirements of financial institutions to the extent that they reach the parameters established in the new regulation60 .
The measure focuses on: (1) expanding credit to individuals and MSMEs that did not have financing from financial institutions, (2) encouraging the use of electronic means of payment associated with demand accounts in pesos whose holders are individuals, (3) promoting the use of electronic checks (ECHEQ) and Electronic Credit Invoices (FCE), (4) increase the operability of ATMs by reducing the time they are out of service and (5) extend the ATM network in areas with worse indicators of relative attention.
In cases 2, 3 and 4, the regulation set minimum thresholds beyond which minimum cash requirements are reduced. In particular in cases 2 and 4, the reduction of minimum cash increases as the growth rate of the use of electronic means of payment and the operability of ATMs exceed the established limits. Likewise, in the case of ECHEQs and FCEs, the minimum cash reduction occurs if their actual amount is higher than the average of the last 12 months. In the case of the ATM network, a new grouping of the zones that agglomerate all the localities of the country was arranged and the weights applied to the amounts withdrawn from the ATMs of zones II and IV were increased.
In general terms, the participation of financial institutions in each of the franchises is moderate to relevant. This is both in reference to the total number of entities in the financial system61 , and if only those that are active in each of the target variables of the incentives are considered (See Note to Table 1). However, from the perspective of financial inclusion, which considers account ownership as a main indicator, the impact of each franchise has included entities that have a significant number of bank accounts of individuals (Concentration of bank accounts column).
Preliminary results of each of the franchises are presented below to approximate their impact on the different dimensions of financial inclusion62 :
1. New financing. Individuals and MSMEs that did not have bank credit were able to access financing equivalent to a balance of $537 million in April and $2,315 million in May63 . This growth was largely explained by the actions of 2 private banks and 2 public banks, which had two-thirds of the total balance in May. The value of May represented 0.1% of the total financing balance of financial institutions and 0.8% of the total financing balance of Non-Financial Credit Providers (PNFC), in both cases granted to individuals.
Table A.1.1 | Use of franchises by financial institutions
Data from June 2021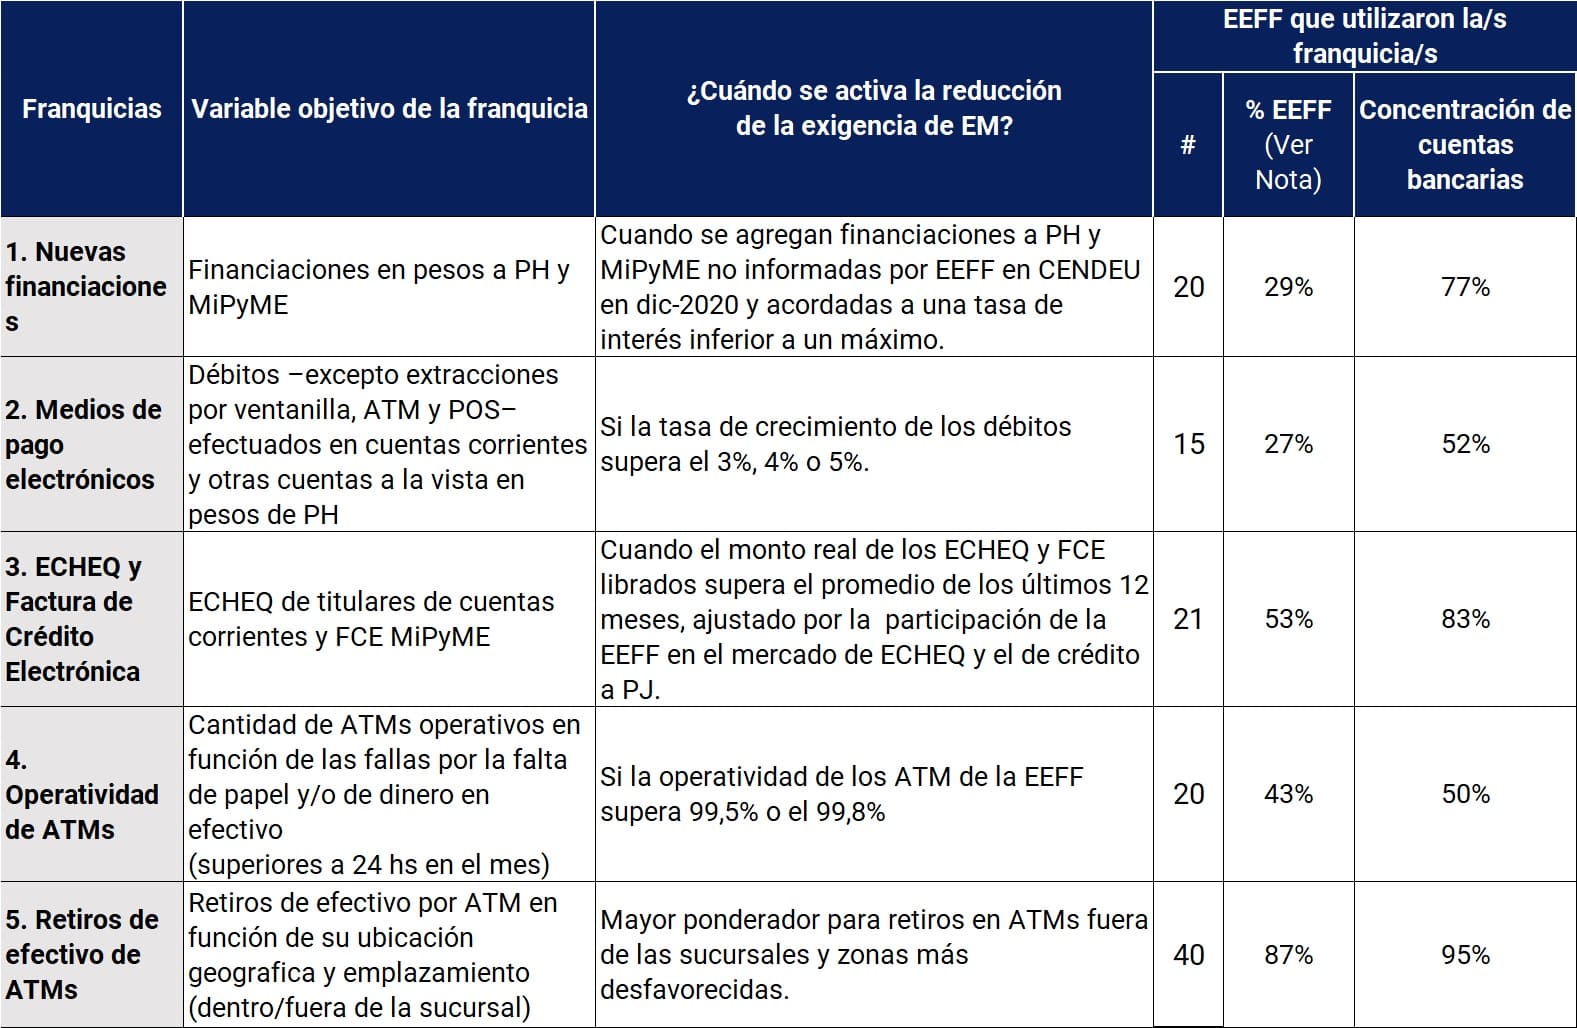
Note | Clarification on the denominators of the “% EEFF” column: F.1) EEFF that reported financing to individuals in December 2020; F.2) EEFF that have bank accounts of individuals in national currency as of June 2021; F.3) BSE that reported loans to NFPS legal entities; F. 4 and 5) EEFF that report ATMs. Column “Concentration of bank accounts”: accounts in national currency of natural persons as of June 2021 of the EEFF used by the different franchises with respect to the total amount for the financial system. EM: minimum cash. PH: human persons. PJ: legal persons.
Source | BCRA and COELSA.
Although the values granted are low, the participating entities in both months concentrated a significant amount of the accounts in national currency of the financial system, which informs the interest and potential of this franchise. As of December 2020, individuals without bank financing amounted to 22.3 million, which was equivalent to 65% of the adult population. Of these, 7 million had PNFC financing.
2. Electronic means of payment. The growth in the amounts debited from the participating financial institutions exceeded, in most cases, the threshold of 5%. These entities accounted for 60% and 22% of accounts 64 in May and June 2021, respectively. This means that, on average, the account holders of these entities made debits, such as debit card payments, fund transfers and service payments, 5% above the average of the amounts operated during the last 12 months. The remaining entities, whose growth rates were between 3% and 5%, accounted for 4% and 11% of the accounts for May and June 2021.
For the set of financial institutions participating in the franchise, the amounts debited from deposit accounts of individuals grew 12% and 9% in May and June 2021, in relation to the amounts operated during the average of the last 12 months. In this regard, growth rates in May 2021 were in a range of 4% and 20%, while in June they ranged from a minimum of 3% to a maximum of 29%.
3. ECHEQ . 65 The total amount of ECHEQ issued by current account holders of the participating entities amounted to $454 billion pesos in May 2021 and $424 billion pesos in June. These values represented 39% and 34% of the financing balance to legal entities of the NFPS in May and June 2021, respectively, which measures the high use of this instrument.
The magnitude of its use is also reflected in the number of current accounts concentrated in the participating financial institutions. In May 2021, these entities contained 89% of the current accounts of individuals and legal entities, while in June the proportion reached 90%. In this regard, it should be noted that two private financial institutions accounted for more than half of the ECHEQs issued in May and June 2021 (53% and 56%, respectively).
4. Operation of ATMs. In both months, around 51% of all ATMs of financial institutions registered an operating rate equal to or greater than 99.5%. This means that most ATMs worked without failures or were out of service due to lack of paper or lack of banknotes for less than 24 hours each month.
The ATMs with high levels of operability were located in 874 localities, where 85% of the country’s adult population lives. Of these localities, 62% registered a population of less than 10 thousand adults and concentrated 10% of the ATMs of the entities that exceeded the required rate of operation. If the participating financial institutions are considered, half of the accounts in the financial system were reached by the minimum threshold for the operation of ATMs, which translates into better conditions of access to financial services in these devices.
5. Location of ATMs. Cash withdrawals66 by ATM67 in April and May showed a clearly higher withdrawal behavior in those located within financial institutions (64%) than outside them (36%). As for the areas, which are ordered in ascending order according to their vulnerability, the values of extraction by ATM did not show significant differences between the worst and best served areas.
If we take into account the distribution of ATMs by area and location, it can be seen that 78% of the total ATMs of entities are located in the two most favored areas from the point of view of the availability of financial services (zones I and II). Likewise, the number of ATMs inside branches significantly exceeds that of ATMs outside branches (75% vs. 25%).
However, between March, the month prior to the entry into force of the regulation, and May 2021, there was a slight increase in the number of ATMs (0.2%). The most disadvantaged areas, V and VI, obtained the highest increases (2.7% and 2.2%) and those ATMs located outside the branches grew more than inside them (0.7% vs 0.1%). Both movements are in line with the aim pursued by the regulations to promote a beneficial distribution for the most vulnerable areas. However, the latest adjustment of the franchise that establishes an increase in the weights of zones II and IV, was not reflected, at least for the moment, in an outstanding variation of their ATMs.
Section 2 / Gender gaps. Management positions in financial institutions and access to credit
The existence of gender gaps is a fact observed in various areas of the financial system68 . One of the most relevant is reflected in the formal credit market and is strongly influenced by the existing gaps in the labor and income distribution levels. A new perspective for analysing this gap can also observe the link between women’s participation in the management spaces of financial institutions and the provision of financing to women.
The functioning of the financial system would seem to have a different impact on access to financing for men and women. At the global level, there are successful experiences in the women’s segment of a group of commercial banks that have implemented an approach that integrates various strategies: the provision of financial and non-financial services from a commercial perspective and not as a social responsibility, the development of market research, the implementation of internal training with a gender perspective, and the promotion of women to leadership positions69 . For its part, in the case of Argentina, two behaviors of the financial system have been observed that affect women more than men. On the one hand, women who lead companies demand training services and contact networks that are not offered mostly by banks. On the other hand, the financing of the financial system depends on the granting of guarantees by the client and the application of standard rating systems that minimize the importance of the project in the rating, which has an impact on women since they tend to be present to a greater extent than men in sectors that have few assets to use as collateral70 .
Based on institutional data from financial institutions 71 and credit information from CENDEU, this section analyzes from a descriptive perspective the participation of women in management positions and its correlation in the allocation of financing to women72 . As a first approximation, it is intended to observe whether there is an association between the presence of women in management positions (board of directors) within financial institutions and its impact on access to the credit market 73 by women. This is a preliminary approach that has not yet been investigated and there is no knowledge of other works on the subject referring to Argentina.
The BCRA incorporated gender parity in their workplaces, which includes decision-making positions, as a good practice in the corporate governance guidelines of financial institutions74 . It also established the promotion and training of staff in the field of gender and gender violence and the provision of information to the BCRA on the representation of each gender in the different hierarchical spaces and in the rest of the organization.
In December 2020, 2 out of 10 management positions in the Argentine financial system were held by women75 . This figure was similar to the values found at the international level, by studies that indicate that, despite the supply of women with relevant professions, less than 20% of the executive chairs belonged to women76 . Likewise, the role of women in areas related to the management and provision of credit was somewhat lower than that recorded in management positions: almost 2 and barely 1 in 10 commercial and branch service managements, respectively, were led by women.
However, the dynamics in recent years have been positive. Women in management positions grew by 25% between December 2016 and December 2020, equivalent to a 4 p.p. increase (See first chart A.2.1). In this period, 61% of financial institutions showed an increase in female participation. 42% obtained increases of less than 10 p.p., while 19% registered increases equal to or greater than 10 p.p. The commercial areas in charge of women advanced 9 p.p. while those related to branches remained unchanged.
Figure A.2.1 | Women’s participation in management positions and the financing gap
Financial system
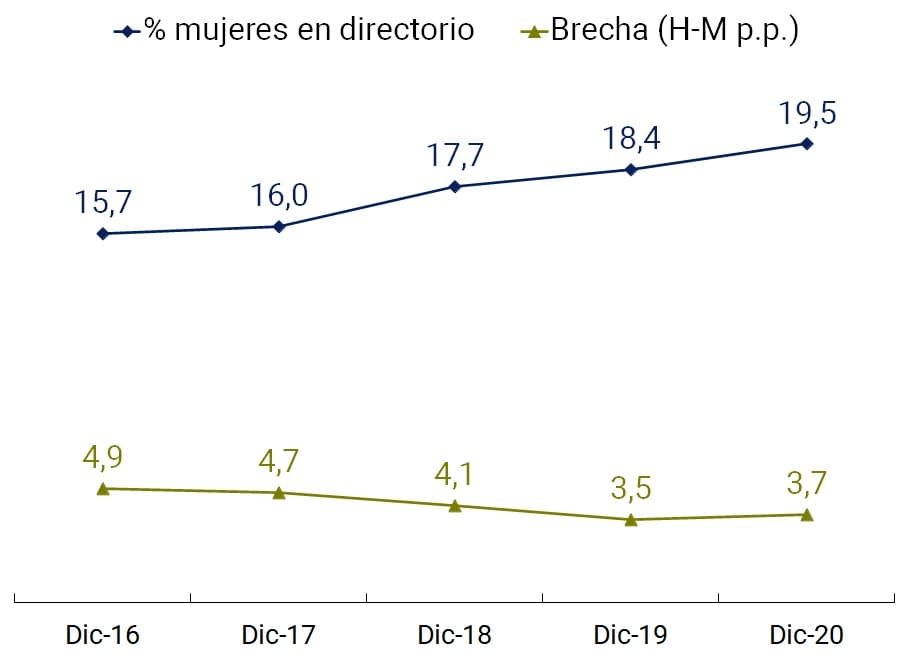
Individual financial institution

Note | In the graph on the right, the values correspond to all Decembers from 2016 to 2020.
Source | BCRA and INDEC.
In relation to the evolution of financing in the financial system, a gender gap of 3.7 p.p. in December 2020 is observed to the detriment of women, which has been reduced by 23% since December 2016. This favorable variation occurred in a period when women gained participation in management positions. However, at the individual and group level, the growth of women in management positions and the reduction of the gender gap in financing does not yet show a conclusive relationship.
Based on the heterogeneous behaviors among the institutions (see Table A.2.1), different segmentations of institutions were carried out to identify a possible relationship between the participation of women in management positions and the credit gap in the period of analysis:
(i) Entities where women’s participation in management grew the most 77: this group made up of 11 entities, where the proportion of women on the board of directors increased 17 p.p. vs. 4 p.p. for the financial system, female chairs reached between 10% and 45% of the total with an average of 27% at the end of the period. Among these 11 entities, a heterogeneous performance of credit gaps was observed. Five states experienced a favorable evolution for women (they reduced their positive gap or widened the negative gap78 ). On the other hand, 6 entities suffered a drop in female credit care (they decreased their negative gap or increased their positive gap).
Table A.2.1 | Women’s participation in management positions and the credit gap.
Period: Dec-16 vs. Dec-20 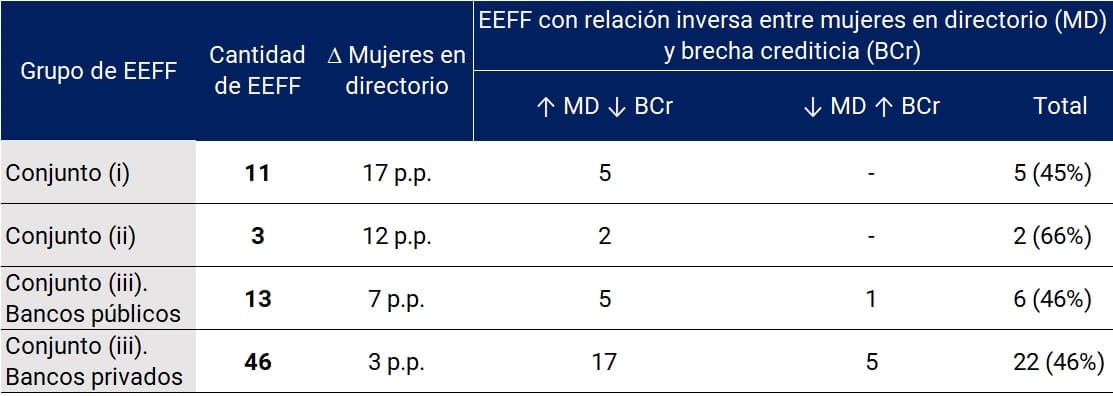
Note | The variation in management positions held by women (3rd column) was calculated as the difference between the averages of female participation in the entities for each subset between December 2016 and December 2020.
Source | BCRA and INDEC.
(ii) Podium of entities with the highest number of debtors in December 2020: it is highlighted that this group made up of 3 private entities had the highest credit gaps, both in 2016 and in 2020. The participation of women in their management positions grew more than the average for all entities (12 p.p., i.e. 8 p.p. more than the average). As in the previous group, a non-homogeneous behavior of their credit gaps is observed. Two entities decreased them (11%), while the third showed an increase (9%).
(iii) Public and private entities: a dissimilar behavior is observed, given that decision-making positions held by women grew more in public banks than in private ones (see table). Regarding credit gaps, a large number of public banks maintained negative figures while private banks maintained positive gaps to a greater extent. In both groups, credit behavior in favor of women was evidenced in most of the entities (widening of the negative gap or reduction of the positive gap).
If those that maintained a negative credit gap throughout the period (25) are excluded from the total number of entities (59), 47% of this subgroup has an inverse relationship between the participation of women on the board of directors and the credit gap.
To conclude, although women have advanced in leadership positions in the financial system in recent years, their participation is modest, as well as in the commercial and branch areas. In this way, interference in decision-making would be far from equitable. Regarding the link with the credit gap, an inverse relationship is observed in a large number of institutions in the groups analysed between December 2016 and December 2020; although not in the majority. Finally, as mentioned at the beginning, the leadership position held by women is one of the edges that is considered in successful approaches to reach a larger female audience. In order to deepen this new perspective of analysis, it is necessary to complement the study with qualitative aspects of the institutional context of each entity, as well as to introduce elements of the evolution of the prevailing economic context.
Section 3 / Indebtedness by type of entity: an analysis with a gender perspective
In Argentina, the conditions of access to credit by men and women differ between groups of entities. With respect to financing balances, and although there is a persistent bias to the detriment of women in all institutional groups, their participation in those granted by non-financial entities is greater than their participation in credit granted by banks. This greater relative access to non-bank credit suggests less favorable financing conditions for women compared to men80 .
In order to deepen the study of the factors associated with access to financing by gender and by type of institution, a set of econometric models was developed that test the probability of men and women holding credit by group of entities. To this end, information is available, on the one hand, on the loans granted by the Expanded Financial System (SFA) to individuals and, on the other hand, on their income, measured on the basis of the deposits in bank accounts that individuals receive as remunerations 81. The cross-referencing of these two sources of information allows for a novel analysis, as it makes it possible to estimate the effect of income on credit distribution and thus investigate other dimensions that could be influencing access to financing by type of entity.
“Logit” models were proposed to quantify the probability of having financing by men and women by group of entities. The dependent variable takes a value of 1 if the person has credit in the type of institution under analysis and 0 otherwise. The tables show, for the variables sex, age range, geographical regions and remuneration collection entity, the highest (lowest) probability predicted in relation to the categories selected as control for each case, namely: “men”, “people up to 24 years of age”, “CABA and Buenos Aires” and “public bank”/”private bank”, respectively. Thus, the reading of the results of the estimates must always be understood in terms of those controls. A
Thus, for example, women are 5.5% (-0.0554) less likely to have financing in private banks compared to men (Model 1), while they are 12.3% (0.123) more likely to have loans in public banks (Model 2).
The results of the estimates for private and public banks suggest that the relationship between gender and the probability of access to credit in these institutions is robust and consistent with descriptive statistics. Women’s probability of accessing credit in private banks is 5.5% lower than that of men and, conversely, it is 12.3% higher in public banks (Table 1; Models 1 and 2)82 .
The control by entry of individuals is also significant and robust. If we analyze comparatively what happens at the two extremes of the personal distribution of income, the probability of indebtedness to private banks of people who belong to the tenth decile is 20.5% higher than the probability of those in the first decile, and this difference is even more marked in the case of public banks (25.5%)83 .
Table A.3.1 | Probability of having financing by group of entities: marginal effects
Note | *, **, *** indicate significance at 0.1, 0.05 and 0.01, respectively; §: indicates a change of the discrete variable from the control category (null value).
Source | BCRA
The controls by age range and region are equally significant: the older you are, the greater the probability of borrowing in both types of institutions, while people living in CABA and Buenos Aires (control subregion) compute, in general, the higher probability of borrowing in both groups of banks.
However, it is necessary to consider the possibility that these results are influenced by the positive relationship between access to financing and the possession of salary accounts, documented in previous studies84. To avoid this potential bias, a dichotomous variable was incorporated that indicates whether or not the person receives their remuneration for the type of entity considered in the analysis. Thus, conditional on the type of collection entity, gender loses economic significance 85 in the probability of indebtedness with private banks; while, in the case of public banks, women’s greater probability of financing is reduced from 12.3% to 4.2% (Table 1; Models 3 and 4).
An aspect that is evident in the descriptive statistics and that is reinforced by the econometric analysis is the strong segmentation by income between financial and non-financial institutions. In contrast to the results obtained for banks, the probability of having financing with Credit Card Issuers and/or Non-Bank Purchases (ETCNB) and Other Non-Financial Credit Providers (OPNFC) decreases at a higher income level (Table 1). If we consider the extremes of the distribution, the probability of having financing with the ETCNCs is reduced by 16.8%, and the difference is even greater in the case of the OPNFCs, since it decreases by 19.6%. Gender does not have economic significance in the ETCNB model, while, conditional on income level, being a woman implies a lower probability of taking credit with the OPNFC (-2.4%). In turn, with age, the probability of financing through the ETCNBs increases, even those over 65 years of age, when this probability decreases. On the contrary, in general, a higher probability of using OPNFC credits is observed among people under 25 years of age (control group). Finally, the probability of financing with non-financial entities is lower in CABA and Buenos Aires compared to the rest of the country.
By incorporating income control, the study adds a new dimension to the analysis of the determinants of credit in Argentina, since it allows controlling the effect of inequalities originating in the labor market and thus delving into other aspects that could be determining access to and use of financing, including, within these dimensions, the gender perspective.
Methodological note
Population data
This IIF presents indicators that are disaggregated by different demographic and geographical variables. For the elaboration of these indicators, population data were used based on the population projection made by the National Institute of Statistics and Censuses of the Argentine Republic (INDEC). Considering that this agency does not publish a series that simultaneously contains all the disaggregations used throughout this IIF (gender, age group and geographical location at the provincial, departmental and locality levels), it was necessary to take different series according to the definition of each indicator.
For the indicators at the national and provincial levels, the series called “Population by sex and five-year age groups for the country and provinces as a whole” was used. Years 2010-2040″, while for the indicators at the departmental level, the series “Estimated population on July 1 of each calendar year by sex, by department” was taken as a basis. Finally, since INDEC does not publish a projection of the evolution over time of the number of inhabitants of each locality, it was necessary to construct the series for the indicators at that level, for which the results of the 2010 National Census were taken as a basis.
For the purposes of this IIF, an “adult” is considered to be a person 15 years of age or older, following the standard used by the World Bank for its financial inclusion indicators.
Regionalization
For the purpose of developing regional indicators, the regionalization criterion proposed by the Ministry of Economy and Public Finance (now the Ministry of Economy) was used, which establishes five regions, namely:
– NOA (Northwest Argentina): Salta, Jujuy, Tucumán, Catamarca and Santiago del Estero.
– NEA (Northeast Argentina): Formosa, Chaco, Misiones and Corrientes.
– Nuevo Cuyo: Mendoza, San Juan, San Luis and La Rioja.
– Patagonia: La Pampa, Neuquén, Río Negro, Chubut, Santa Cruz and Tierra del Fuego.
– Centro and Buenos Aires: Córdoba, Santa Fe, Entre Ríos, Buenos Aires and the Autonomous City of Buenos Aires.
In the text of this IIF, Nuevo Cuyo is mentioned as Cuyo and Center and Buenos Aires as Center.
Connectivity data
Internet connectivity information was taken disaggregated by location and type of connection published by ENACOM. Given the existence of different types of connection, in order to simplify the status of internet access in each locality, a binary indicator was developed that considers a locality with internet access if it has at least one type of connection available (“Yes/No”). This was applied both for fixed internet access (ADSL, Dial Up, fiber optic, satellite, fixed telephony) and mobile (Wireless, 3G, 4G), without considering the quality of connection.
Then, to assign the fixed and mobile connectivity status to the CN2010 localities, the localities listed in the 2010 National Census (3,538) and the indicator mentioned above were taken as a reference. There were cases where internet connectivity data is reported at a lower level of disaggregation to the locality (neighborhood or entity included), as well as others in which the locality with the largest number of inhabitants in the department does not have information available but the other localities in the department do. This information was used to characterize the localities in question, assigning the value “Yes” to the connectivity indicator to the extent that 50% or more of the neighborhoods that compose it or neighboring localities have connectivity. Finally, there is no connectivity information for a set of 595 localities.
Regularity of debtors
Financial institutions and non-financial credit providers classify their debtors according to the ability to pay their debt. BCRA regulations 86 provide for the existence of levels of grouping (“situations”) of debtors in decreasing order of quality. Situation 1 is one in which debtors are able to adequately meet all their financial commitments (even if they are late in payment), while Situations 5 and 6 are those in which the debt is considered uncollectible.
To calculate the percentage of debtors in a regular situation, the number of CUITS classified in Situations 1 and 2 is grouped, i.e., those that can meet all their financial commitments. All other debtors are considered to be under the category of irregular situation. The indicator counts each person as many times as entities in which they have active debts, both financial and non-financial institutions. According to the BCRA regulation, each debtor registers one situation per creditor.
Payment accounts at payment service providers
Among the Payment Service Providers (PSPs) that operate in COELSA, there are providers that are registered in the BCRA’s Registry of Payment Service Providers Offering Payment Accounts (PSPOCP) and other providers that are not registered87 . For the purposes of this report, only payment accounts for vendors that are registered as PSPOCPs are posted.
Section 3
For the analysis, the current balances of the Central Bank of Debtors of the Financial System (CENDEU) as of October 2020 were considered. This information was integrated with the average monthly value of the records in the remuneration base for the period August-October 2020. The objective of using the average value was to smooth out sudden changes in the values of the accreditations as a result of retroactive remuneration payments, bonuses, awards, salary increases, among others, and/or errors in the reported information. In addition to the result of the integration of both bases, a cut of +/- 2% was applied (on the variable “credit balances in relation to annualized income”) with the aim of eliminating the extremes of the distribution that could include inconsistencies in the information reported on credits and/or credits for remuneration. All in all, the study reaches approximately 36% of individuals and 40% of the balance of loans to individuals in force at the statistical cut-off date.
Glossary of abbreviations and acronyms
ACSF Complementary Financial Services Agency
AFIP Federal Administration of Public Revenues
ANSES National Social Security Administration
BCRA Central Bank of the Argentine Republic
CABA Autonomous City of Buenos Aires
CBU Uniform Bank Code
CVU Uniform Virtual Key
CENDEU Central Bank of Debtors of the Financial System
COELSA Electronic Clearing House
CUIT Unique Tax Identification Code
EEFF Financial Institutions
EMAE Monthly Estimator of Economic Activity
ENACOM National Communications Agency
ENGHO National Household Expenditure Survey
ETCNB Non-Bank Credit Card Issuers
FAS Financial Access Survey
FCE Electronic Credit Invoice
FCI Mutual Fund
IMF International Monetary Fund
A.I. Year-over-year
IIF Financial Inclusion Report
INDEC National Institute of Statistics and Censuses
CPI Consumer Price Index
LFIP Financing Line for Productive Investment
Loc Locations
M Mil
MPE Electronic Payment Methods
MPOS Mobile Device at Point of Sale
MSMEs Micro, Small and Medium Enterprises.
NOA Northwest Argentina
NEA Northeast Argentina
GDP Gross Domestic Product
PDA Access Points
PH Human person
PJ Legal Entity
POS Point of Sale Device
PNFC Non-Financial Credit Providers
P.P. Percentage points
PSP Payment Service Providers
PSPOCP Payment Service Providers Offering Payment Accounts
OPNFC Other Non-Financial Credit Providers
RS Simplified Regime for Small Taxpayers
SFA Expanded Financial System
NFPS Non-Financial Private Sector
TAS Self-service terminal
TNA Annual Nominal Rate
TO Ordered text
UVA Purchasing Value Units
VAR Variation
References
1 GDP at constant 2004 values. INDEC, “Report on the progress of the level of activity. Second quarter of 2021”.
2Seasonally adjusted series. INDEC, “Monthly Estimator of Economic Activity. July 2021”.
3INDEC “Labor Market. Rates and socioeconomic indicators (EPH)”. Second quarter of 2021
4Seasonally adjusted series. INDEC “Seasonally adjusted quarterly series of global supply and demand.”
5Decree 512-21 and Communication “A” 7349.
6Resolution No. 938/2020 of the Ministry of Labor, Employment and Social Security (“REPRO II”) and Com. “A” 7285.
7Com. “A” 7285. Point 2.1.1.2 of the TO Financial services in the framework of the health emergency provided by D. No. 260/20 (COVID-19). It does not include assistance subject to the Credit Card Law.
8ENACOM. The remaining population resides in localities that do not report connectivity or as a dispersed rural population.
9INDEC. Access to and use of information and communication technologies. EPH. Fourth quarter of 2020.
10Communication. “A” 7325 and Communication “A” 7319
12BCRA news on agreement with the province of San Juan and Formosa.
13 69.3% of the total consumption expenditure surveyed in the ENGHo 2017-2018 was made in cash.
14It arises from the sum of card payments (debit, credit and prepaid), electronic transfers of individuals originating in CBU and transfers originating in CVU.
15BCRA News. Communication “A” 7305 and BCRA News.
16According to data from the IMF’s Financial Access Survey, Chile and Mexico registered 6.2 and 12.3 FLW per 10,000 adults respectively at the end of 2020, while Brazil and Colombia reached 23.3 and 45.3 respectively.
17The remaining 7.7% live in localities without FLW or are part of the dispersed rural population.
18The regulations applicable to ACSFs expressly establish the obligation of the EEFF to provide the necessary training to the staff of the agencies for the adequate provision of the services that are delegated (Point 9.6.9).
19It should be considered that private banks have approximately two-thirds of the total number of branches.
202020 FAS Trends and Developments, IMF.
21Report on Banks, December 2020.
22World Bank, Access to Financial Services in Brazil, 2005.
23Unique trades are counted, regardless of the number of EEFF that have delegated operations to them.
24 Communication A 7208 established an implementation schedule that contemplates that the percentage of ATMs with biometric readers should reach 35% by December 2021, 60% by June 2022 and 100% by December 2022. In line with the above, foreign trade statistics show a 194% growth in the amount of CIF imports of the tariff heading corresponding to ATMs (84729010) in the first 7 months of the year compared to the same period of the previous year (INDEC Foreign Trade Consultations in Goods).
25Point 2.2.2 of the T.O. on “Protection of Users of Financial Services”. See Section 2 of the IIF for the first half of 2021 for a more in-depth analysis of access tools for blind people.
26 Size defined according to the adult population.
28 Paragraph 1 sets out the analysis of the impact of that legislation.
29 See Figure 1.6 >IIF first half of 2020 for more details on the time availability of the devices.
30 INDEC. Access to and use of information and communication technologies. EPH. Fourth quarter of 2020.
31 In addition to the ownership of electronic devices and the availability of connectivity, the population’s ability to use them is also a key factor for access to digital financial services.
32 Source: ENACOM. The remaining population resides in localities that do not report connectivity or as a dispersed rural population.
33 See Methodological note for information on the population data used.
34 Payment accounts: accounts in Payment Service Providers that offer payment accounts (PSPOCP) registered in the BCRA registry.
35 INDEC, National Household Expenditure Survey 2017-2018. Income Report. June 2020.
36 The range 30-64 in the Central and NEA regions slightly exceeds 100% because the population projections were based on the 2010 National Census.
37 The younger generations (15 to 29 years old) are the ones that mostly use the internet and cell phones (more than 90%), slightly surpassing the middle-aged population (30 to 64 years old) and the elderly population (over 65 years old). See INDEC, Access to and use of information and communication technologies. EPH. Fourth quarter of 2020.
38 Monthly accounting information regime. Data as of September 2021. Deposits include fixed term in pesos and UVA and term investments.
39 “MPE” considers the following retail means of payment: i) payments with credit, debit and prepaid cards; (ii) electronic transfers of individuals from CBU to CBU (interbank), (iii) electronic transfers from CBU to CVU; and (iv) transfers from CVU to CVU and from CVU to CBU. The last 3 series are incorporated into this report with data from January 2019.
41 BCRA based on COELSA. Clarifications: only operations from the low-value clearing house are included; (i) CBU-to-CBU transfers: considers interbank PH transfers; (ii) CBU to CVU transfers: considers all PH and PJ transfers; (iii) CVU-to-CVU and CVU-to-CBU transfers: considers all PH and PJ transfers, both those initiated from payment and non-payment accounts. For different definitions related to means of payment, see the Retail Payments Report.
42 The semi-annual average of the monthly values of the quotient of the number of transfers with respect to the stock of accounts for each month.
43 A small device that connects to a cell phone or tablet to validate card payment/collection transactions. This allows payment/collection to be made at the point of sale.
44 See section on Credit to individuals.
45 See section on Account Holding.
46 Prepaid cards are also associated with bank accounts.
47 Point of sale.
48 The remaining 5% is located in Open-Ended Mutual Funds.
50 Argentine Chamber of Mutual Funds (CAFCI).
51 The boundaries of the strata are fixed and are expressed in nominal terms. For this reason, a more extensive historical series of data was avoided.
52 Estimate made with data as of March 2021. Information on Financial Institutions, BCRA.
53 (i) “Zero-Rate Credits” is aimed at individuals adhering to the Simplified Regime for Small Taxpayers (Monotributo); (ii) Financing Line for Productive Investment (LFIP) of MSMEs; and Subsidized Rate Loans for Companies; It is aimed at both legal persons and individuals who meet the conditions stipulated in each case.
54 The holding of a salary account can be used as an indicator of formal work in a relationship of dependency, so we refer to debtors with a salary account to indicate debtors with registered work. The information on salary account holdings comes from the Information Regime for the Payment of Remunerations through Bank Account Crediting.
55 Only debtors up to 64 years of age are included as this is the age threshold of greatest employment, this being a necessary condition for the possession of a salary account. From the age of 65, the proportion of pension accounts over salary accounts increases, so these debtors are not considered for the calculation of the proportion with and without a salary account.
56 Taking as a reference the evolution, as of February 2020, of the irregularity of the portfolio of loans to the non-financial private sector, a more pronounced decline in this indicator is observed in the case of the group of private banks than in the case of public banks (see Report on Banks).
57 Communication A 7024, 7107, 7181 and 7245 .
58 See Methodological note with the characteristics of the calculation.
59 Section 3.1.iii. Financial Inclusion Report, second half of 2019.
61 As of March 2021, 80 authorized financial institutions were registered (BCRA, Payroll of entities).
62 The aggregate and entity-by-entity analysis for each franchise may differ depending on the latest available information.
63 The average monthly balance of the financing of the period prior to the integration of the requirement is considered.
64 Financial institutions with more than 100 bank account holders of individuals in national currency (56 entities) were counted. Source: COELSA, March 2021.
65In May, no entity reported data on FCE MSMEs. In June, a single (private) entity.
66 Monthly average of total daily cash withdrawals from ATMs, corresponding to the previous month.
67 The 39 financial institutions reporting for each month account for 99% of the number of ATMs in the country.
68 Difference between rates for men and women. Only the binary criterion is applied based on the data.
69 Banco Estado (Chile), Westpac (Australia), BHD-León (Dominican Republic), NatWest (United Kingdom).
70 Gender and access to business financing in Argentina. IDB. May 2020.
71 Monthly accounting RI. 20. Institutional information on financial and foreign exchange institutions.
72 Based on the available data, the financing of individuals is analyzed.
73 In this section, “credit gap” or “credit gap” refers to the difference between the following ratios: (i) number of men with financing over the adult population of men; and (ii) the number of women with financing over the adult population of women.
75 The sample considers a total of 59 financial institutions (public and private) for which data are available for the period 2016-2020. Entities with a debtor portfolio of less than 150 people for each sex were not considered.
76 Women in Finance: a case for closing gaps. IMF. September 2018.
77 Financial institutions with an increase equal to or greater than 10 p.p. between Dec-16 and Dec-20.
78 The positive gap refers to a difference to the detriment of women, while the negative one in favor.
79 This section was prepared on the basis of joint research between the BCRA and ECLAC within the framework of the Study on “Indebtedness in households, particularly of women, associated with the increase and diversification of care tasks in the context of the COVID-19 pandemic and the post-pandemic” that is being developed within the framework of the Joint Project UN COVID-19 Response and Recovery Fund “Socioeconomic recovery from the crisis caused by COVID-19 from a gender perspective: Promoting women’s economic autonomy and the care of older adults and people with disabilities in Argentina”.
80 Given that these institutions concentrate their financing on shorter-term loans (mainly credit cards and personal loans) and at interest rates higher than those of the financial system. For more details, see the Report “Other Non-Financial Credit Providers”. April 2021.
81 See Methodological note to know the aspects related to the processing of the data used.
82 For the continuous variable, annual income in natural logarithm, the difference in the probability predictions of each model is presented using the mean of this variable for different income deciles and the rest of the regressors with their fixed values in the sample mean.
83 See results in the Statistical Annex to this report.
84 An analysis of the explanatory factors of access to financing for Argentina finds a considerable improvement in such access for people with a salary account. For more details, see Financial Inclusion Report. April 2020.
85 Although the variable is statistically significant, it was chosen as a general criterion, to consider economically relevant those variables whose marginal effects exceed the critical value +/-2.
Share on


