Executive summary
– Financial intermediation activity with the private sector in pesos increased in November. The real balance of credit to the private sector in national currency increased by 0.9% in real terms between the end of the month (33.8% YoY in real terms), mainly explained by the commercial segment. For its part, the balance of financing to the private sector in foreign currency decreased 0.5% in the period (94.3% YoY).
– In November, the real balance of private sector deposits in pesos increased 2.7% (8.1% real YoY), explained by demand accounts (mainly interest-bearing accounts). Regarding the segment in foreign currency, in the month the balance of private sector deposits increased 1.8% -in source currency- (9.8% y.o.y.), reaching one of the highest levels in the last 15 years.
– In November, the irregularity ratio of credit to the private sector stood at 5.2%, which implied a monthly increase of 0.7 p.p. The default on financing to households amounted to 8.8% of the portfolio allocated to this type of debtor, while the indicator corresponding to the business segment stood at 2.3%. The total forecasts of the financial system represented 97% of the balance of credit in an irregular situation and reached 5.1% of total financing to the private sector.
– The liquidity ratios in national currency of the financial system fell between the peaks of the month. The ratio between availabilities and deposits – both in pesos – stood at 14.2% in November (-1.3 p.p. monthly and +4.7 p.p. y.o.y.). In the same vein, ample liquidity in local currency in the financial system totaled 35.9% of deposits in national currency in the month (-4.4 p.p. monthly and -8 p.p. y.o.y.), while the liquidity ratio taking items denominated in foreign currency increased to 61.9% of deposits in the same denomination (+2.3 p.p. monthly and -15.5 p.p. y.o.y.).
– The financial system exhibits a significant level of solvency, comfortably complying with the minimum required by prudential regulations. Capital integration (PRC) of the financial system as a whole stood at 28.6% of risk-weighted assets (RWA) (-0.1 p.p. monthly and -4.4 p.p. y.o.y.) and 47.2% of the balance of financing to the private sector net of forecasts. The capital position (net integration of the requirement) of the financial system as a whole totaled 253% of the requirement (-1 p.p. monthly and -61.3 p.p. y.o.y.).
– In November, the profitability of the entities as a whole was practically neutral in terms of assets (0.1% annualized), accumulating in the last 12 months an ROA of 1.1% (ROE of 4.7%), which is lower than the figure of a year ago.
I. Financial intermediation activity
Financial intermediation activity with the private sector in pesos grew in November. Taking into account the variations in the most important items of the balance sheet in national currency of all entities -in homogeneous currency-, in November the main sources of funds were the increase in the balance of deposits in both the private and public sectors and the decrease in liquid assets. These resources were mainly channeled to increase the credit balances destined to both sectors. With respect to foreign currency items, in November the balance of deposits grew and financing to the private and public sectors was reduced, with an increase in liquid assets as a counterpart.
In November, the balance of credit to the private sector in national currency increased by 0.9% in real terms between the end of the month (33.8% YoY in real terms), mainly explained by the performance of private, foreign and public banks. The increase in the period was driven by the commercial segment (1.6% real; see Graph 1) and, to a lesser extent, by lines with real and consumer collateral (0.2% real).
Graph 1: Real credit balance to the private sector in pesos*
Monthly % changes

Chart 2 : Foreign currency financial intermediation to the private sector
In currency of origin
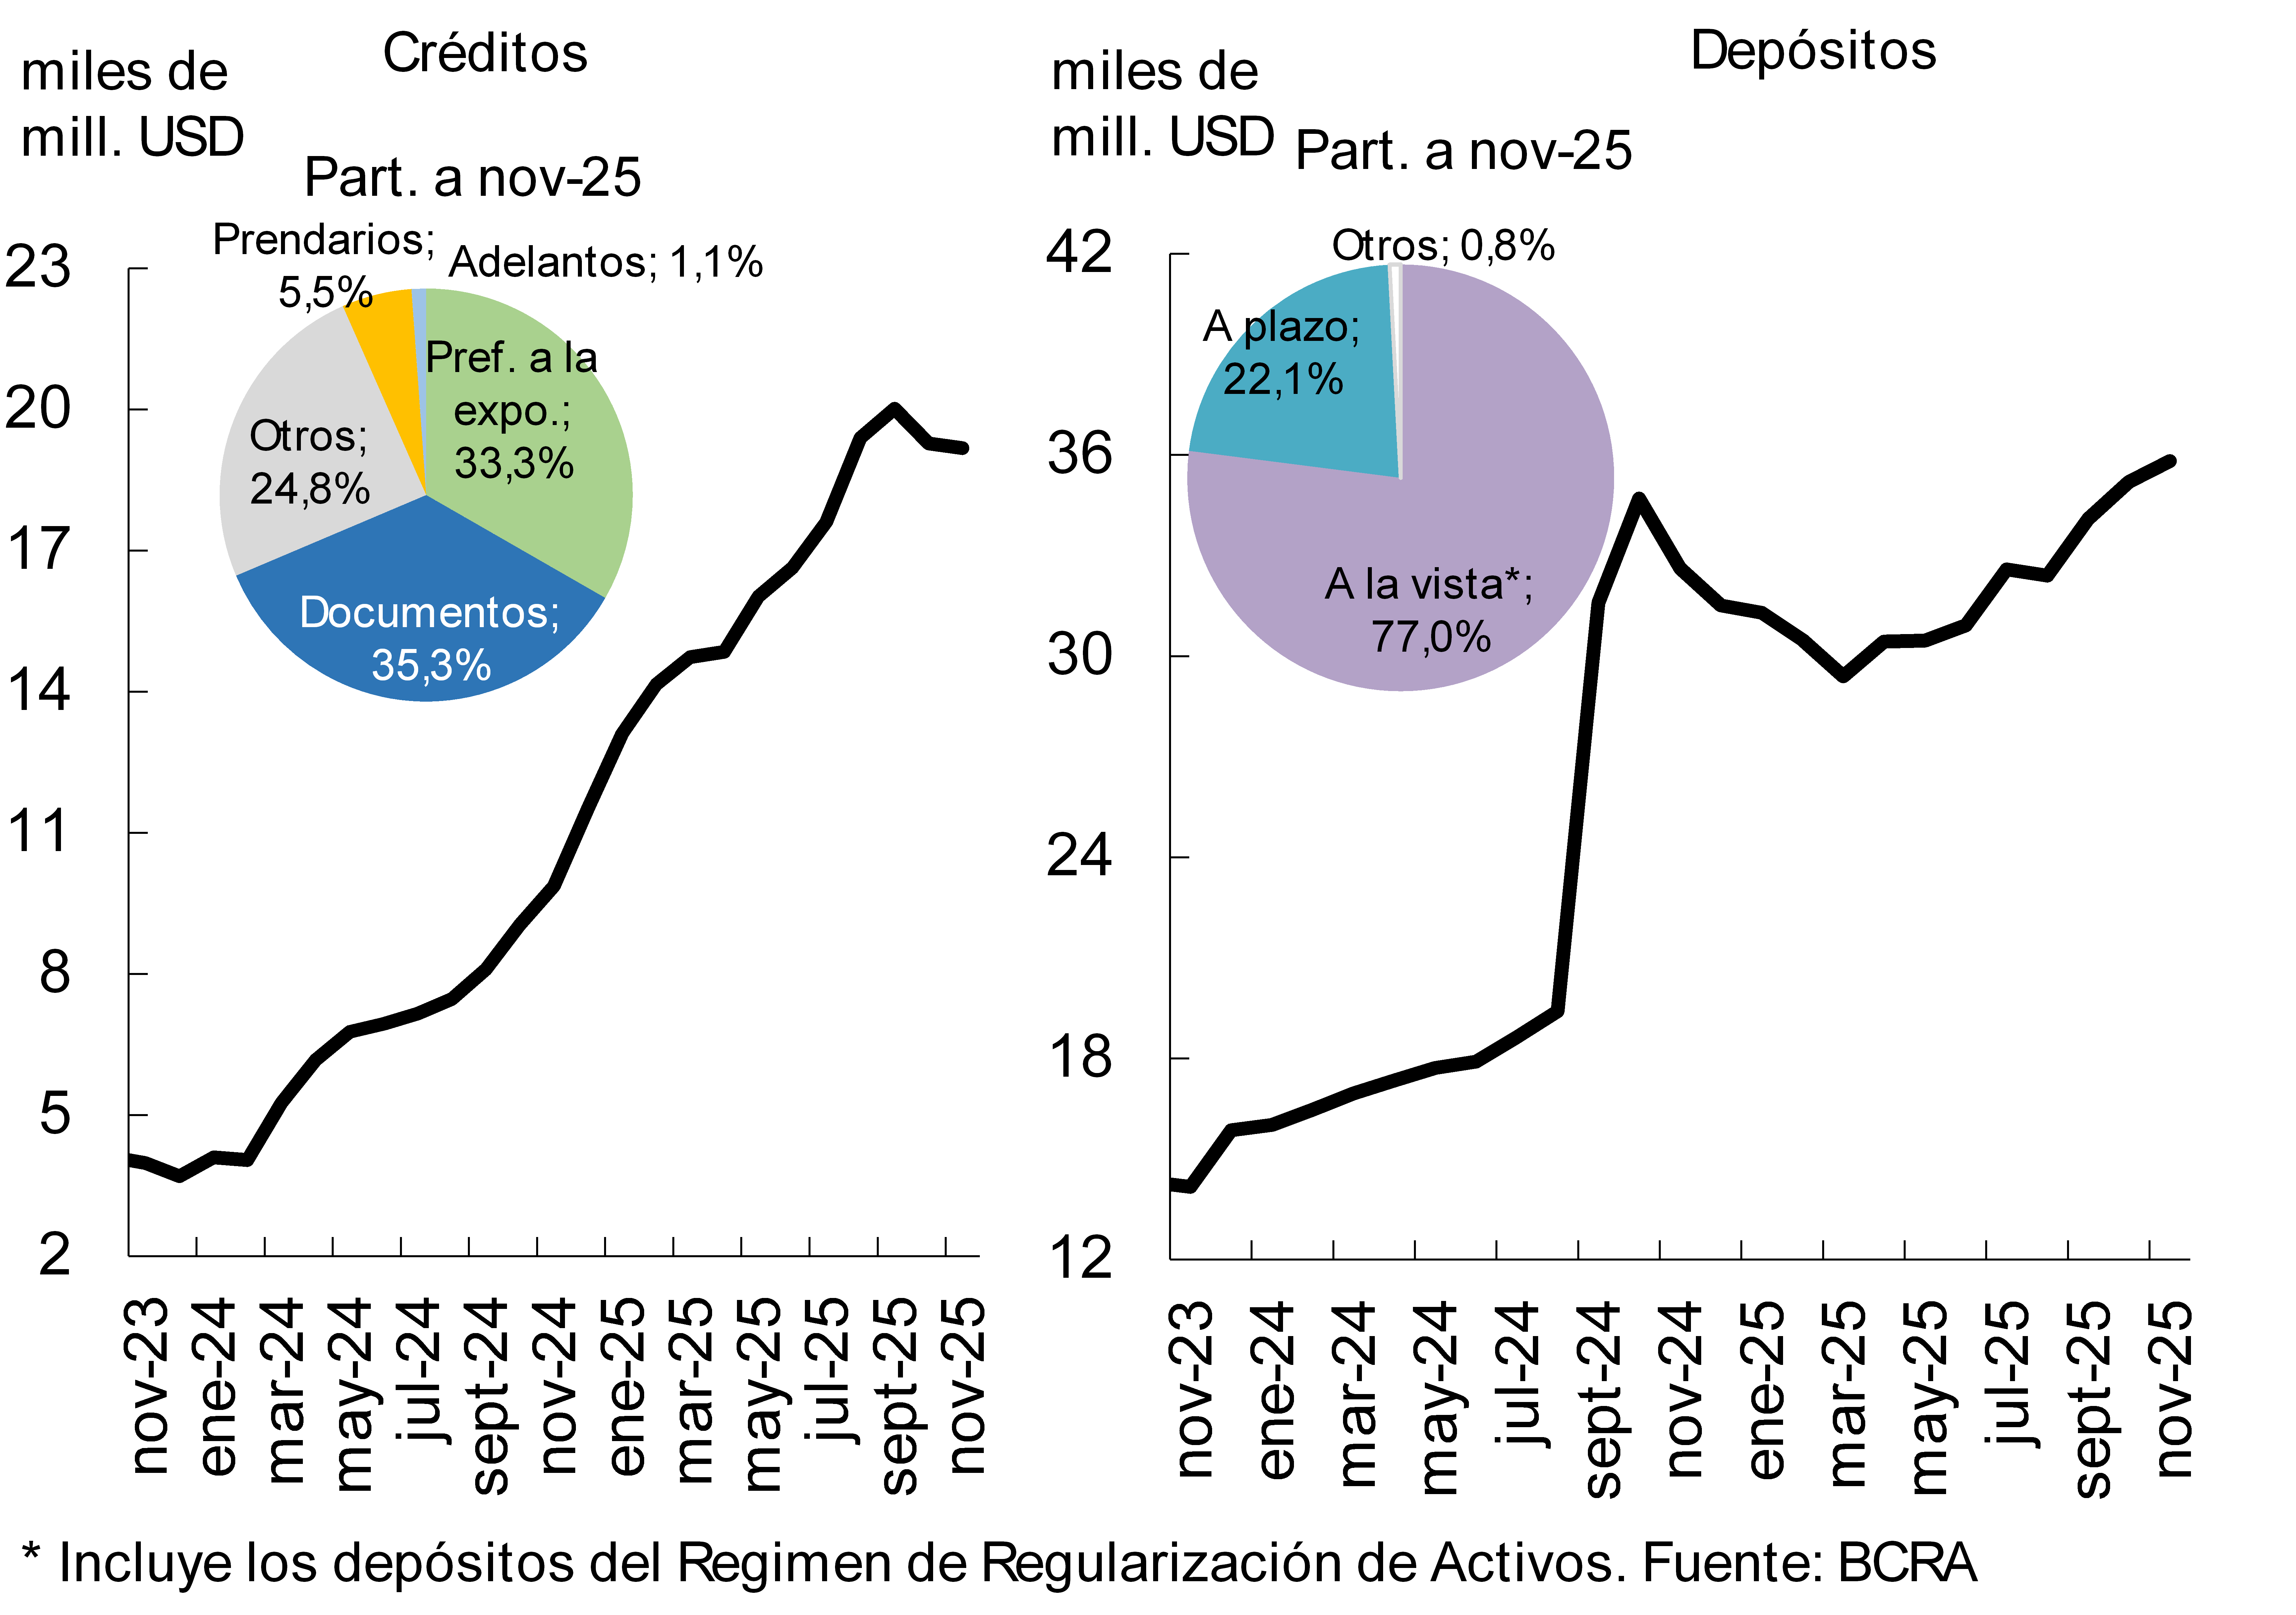
The balance of financing to the private sector in foreign currency decreased by 0.5% in November -in foreign currency-, mainly explained by the performance of pre-financing for exports (see Graph 2; 94.3% y.o.y.). The monthly dynamics were heterogeneous among the groups of financial institutions: there was an increase in foreign private banks and in the EFNBs and falls in public and national private banks.
When considering the items in domestic and foreign currency together, the real balance of credit to the private sector remained practically unchanged in magnitude in November (0.1% monthly and 45.5% real y.o.y.).
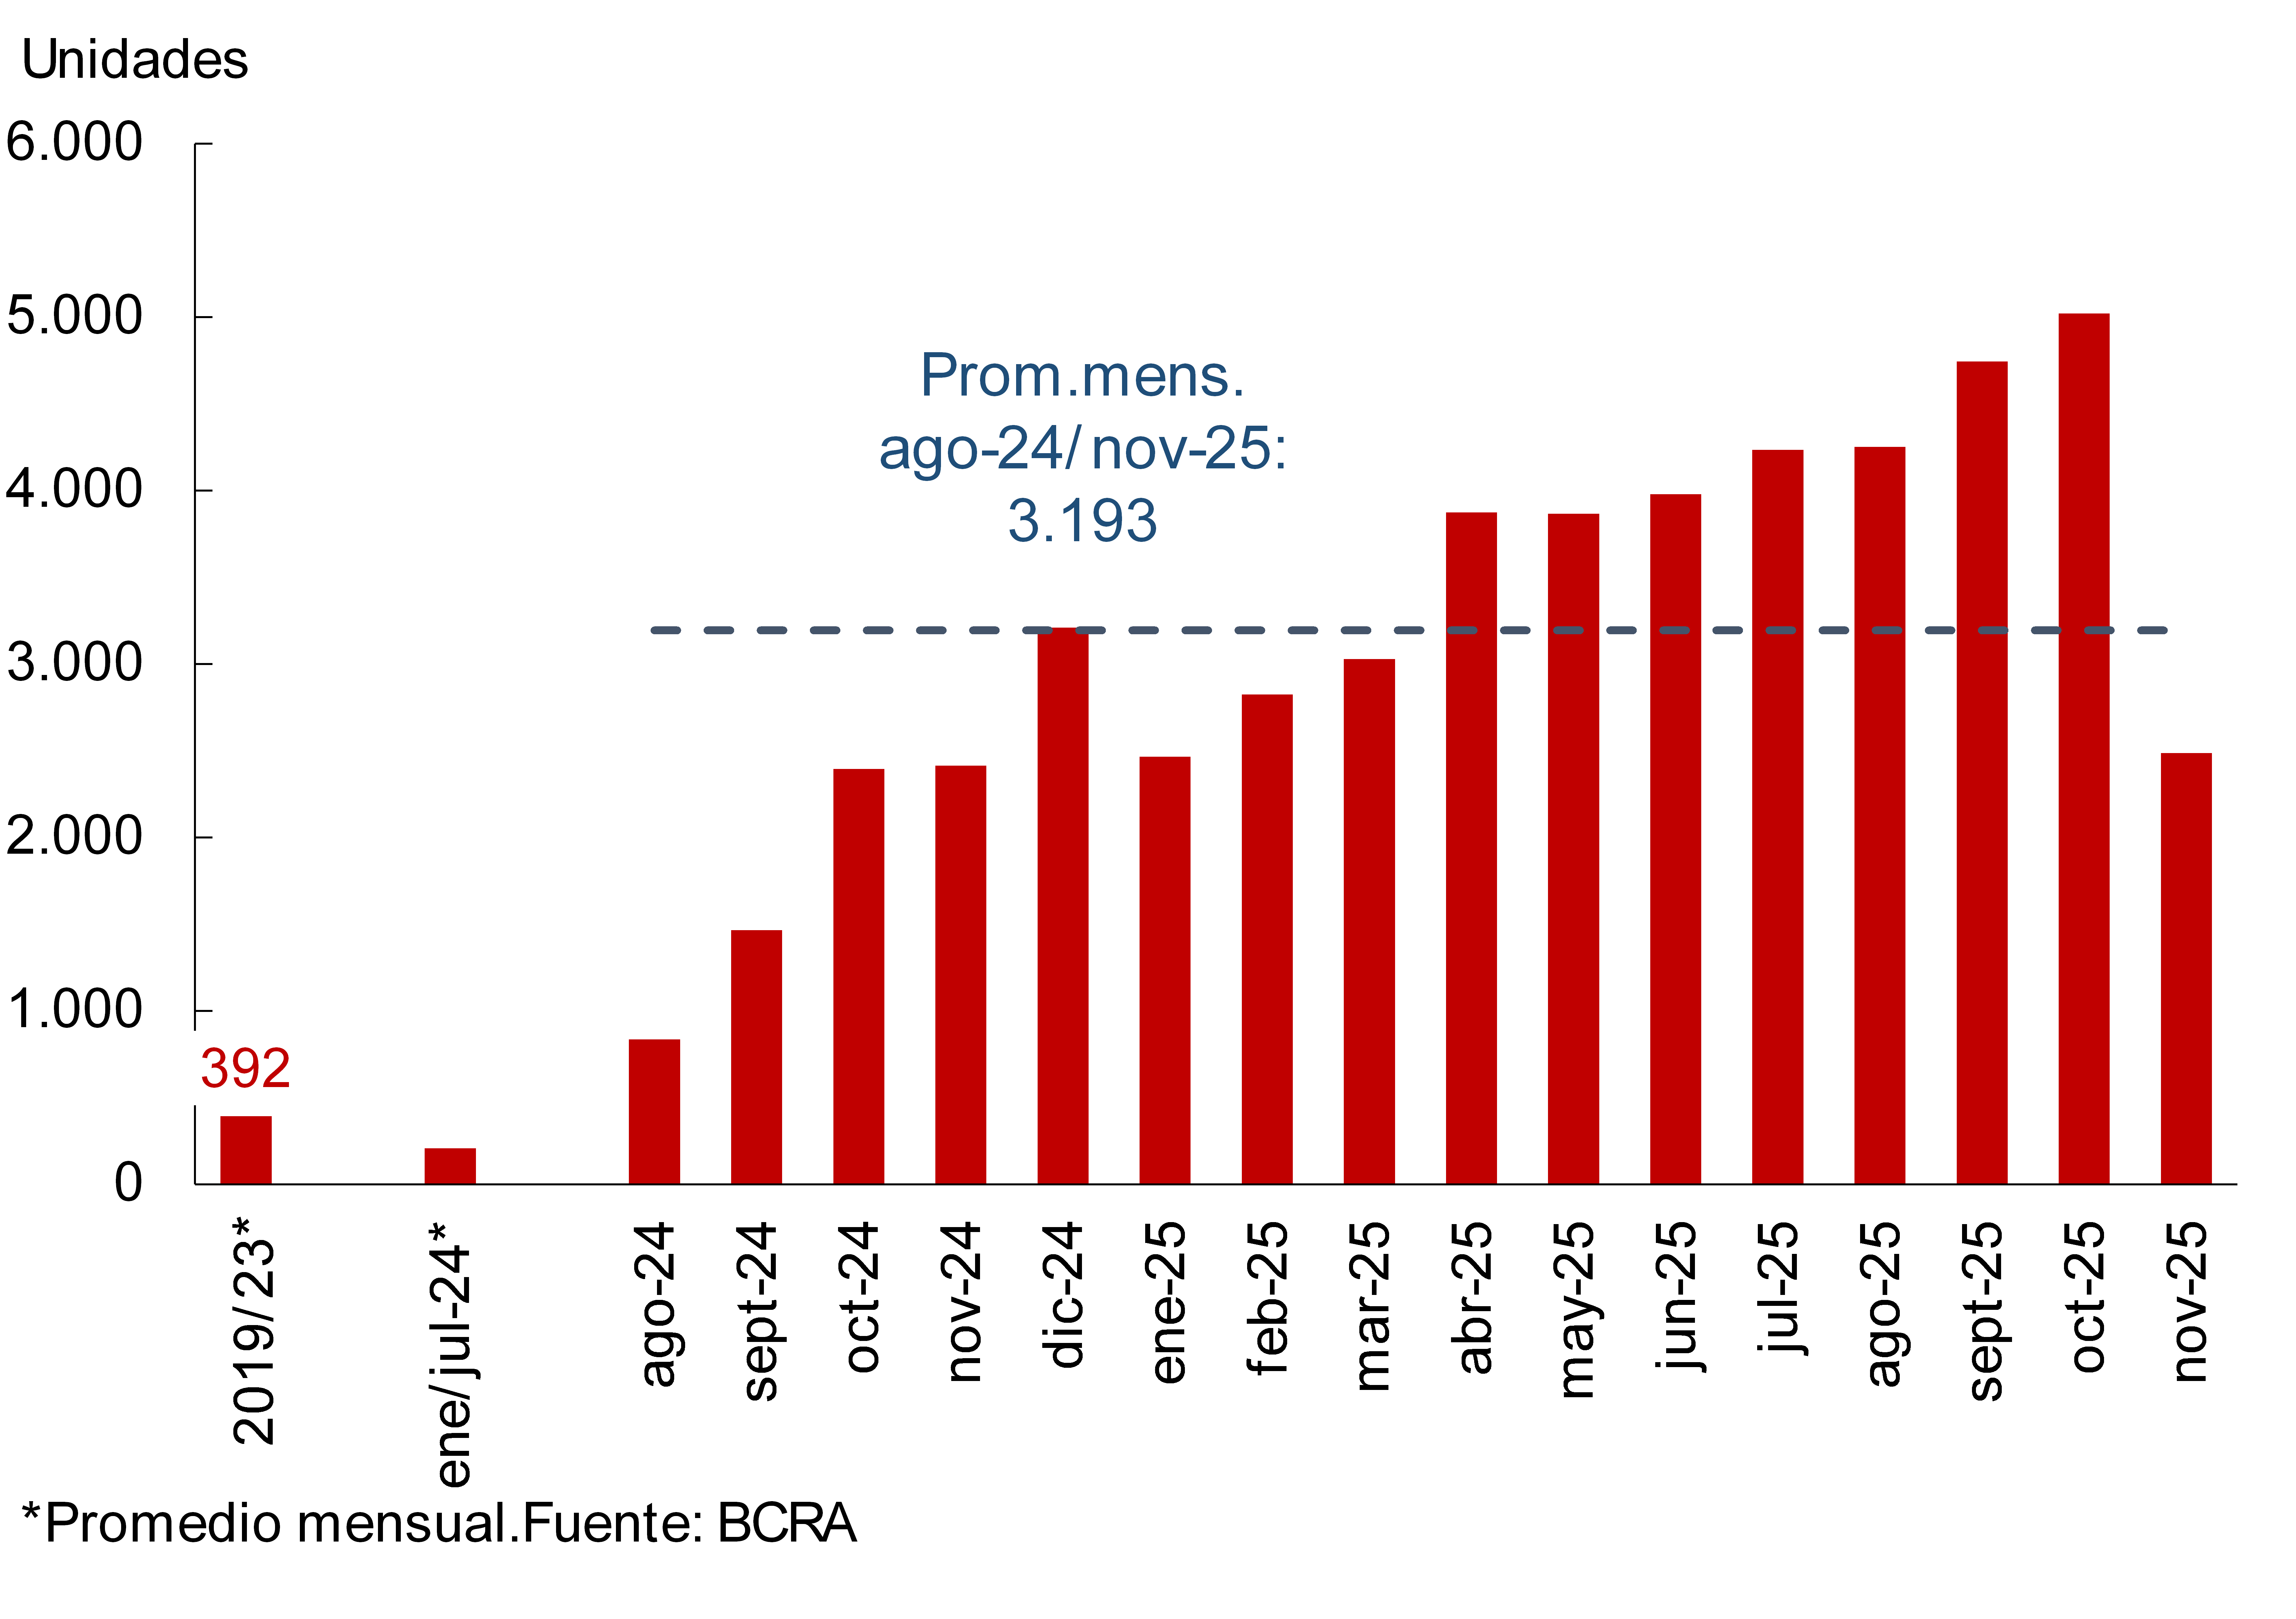
In November, the incorporation of new mortgage debtors (registrations of individuals) into the financial system was reduced. In the month, 2,486 discharges were registered, almost half of what was recorded in October (see Graph 3). In the accumulated of the last twelve months, the total number of new mortgage debtors reached 44,000. It is currently estimated that the total number of mortgage debtors in the financial system amounts to almost 177,600, increasing 20.9% in year-on-year terms.
In this context, according to the latest results of the
Credit Conditions Survey (ECC)
Corresponding to the fourth quarter of 2025, the performance of mortgage loans occurred in a scenario of slightly more restrictive conditions in the supply of credit to households, accompanied by a decrease in the demand perceived by the entities participating in this segment.
Graph 3 | Estimation of mortgage “registrations” (individuals) – Financial system
Graph 4: Real balance of private sector deposits in pesos*.
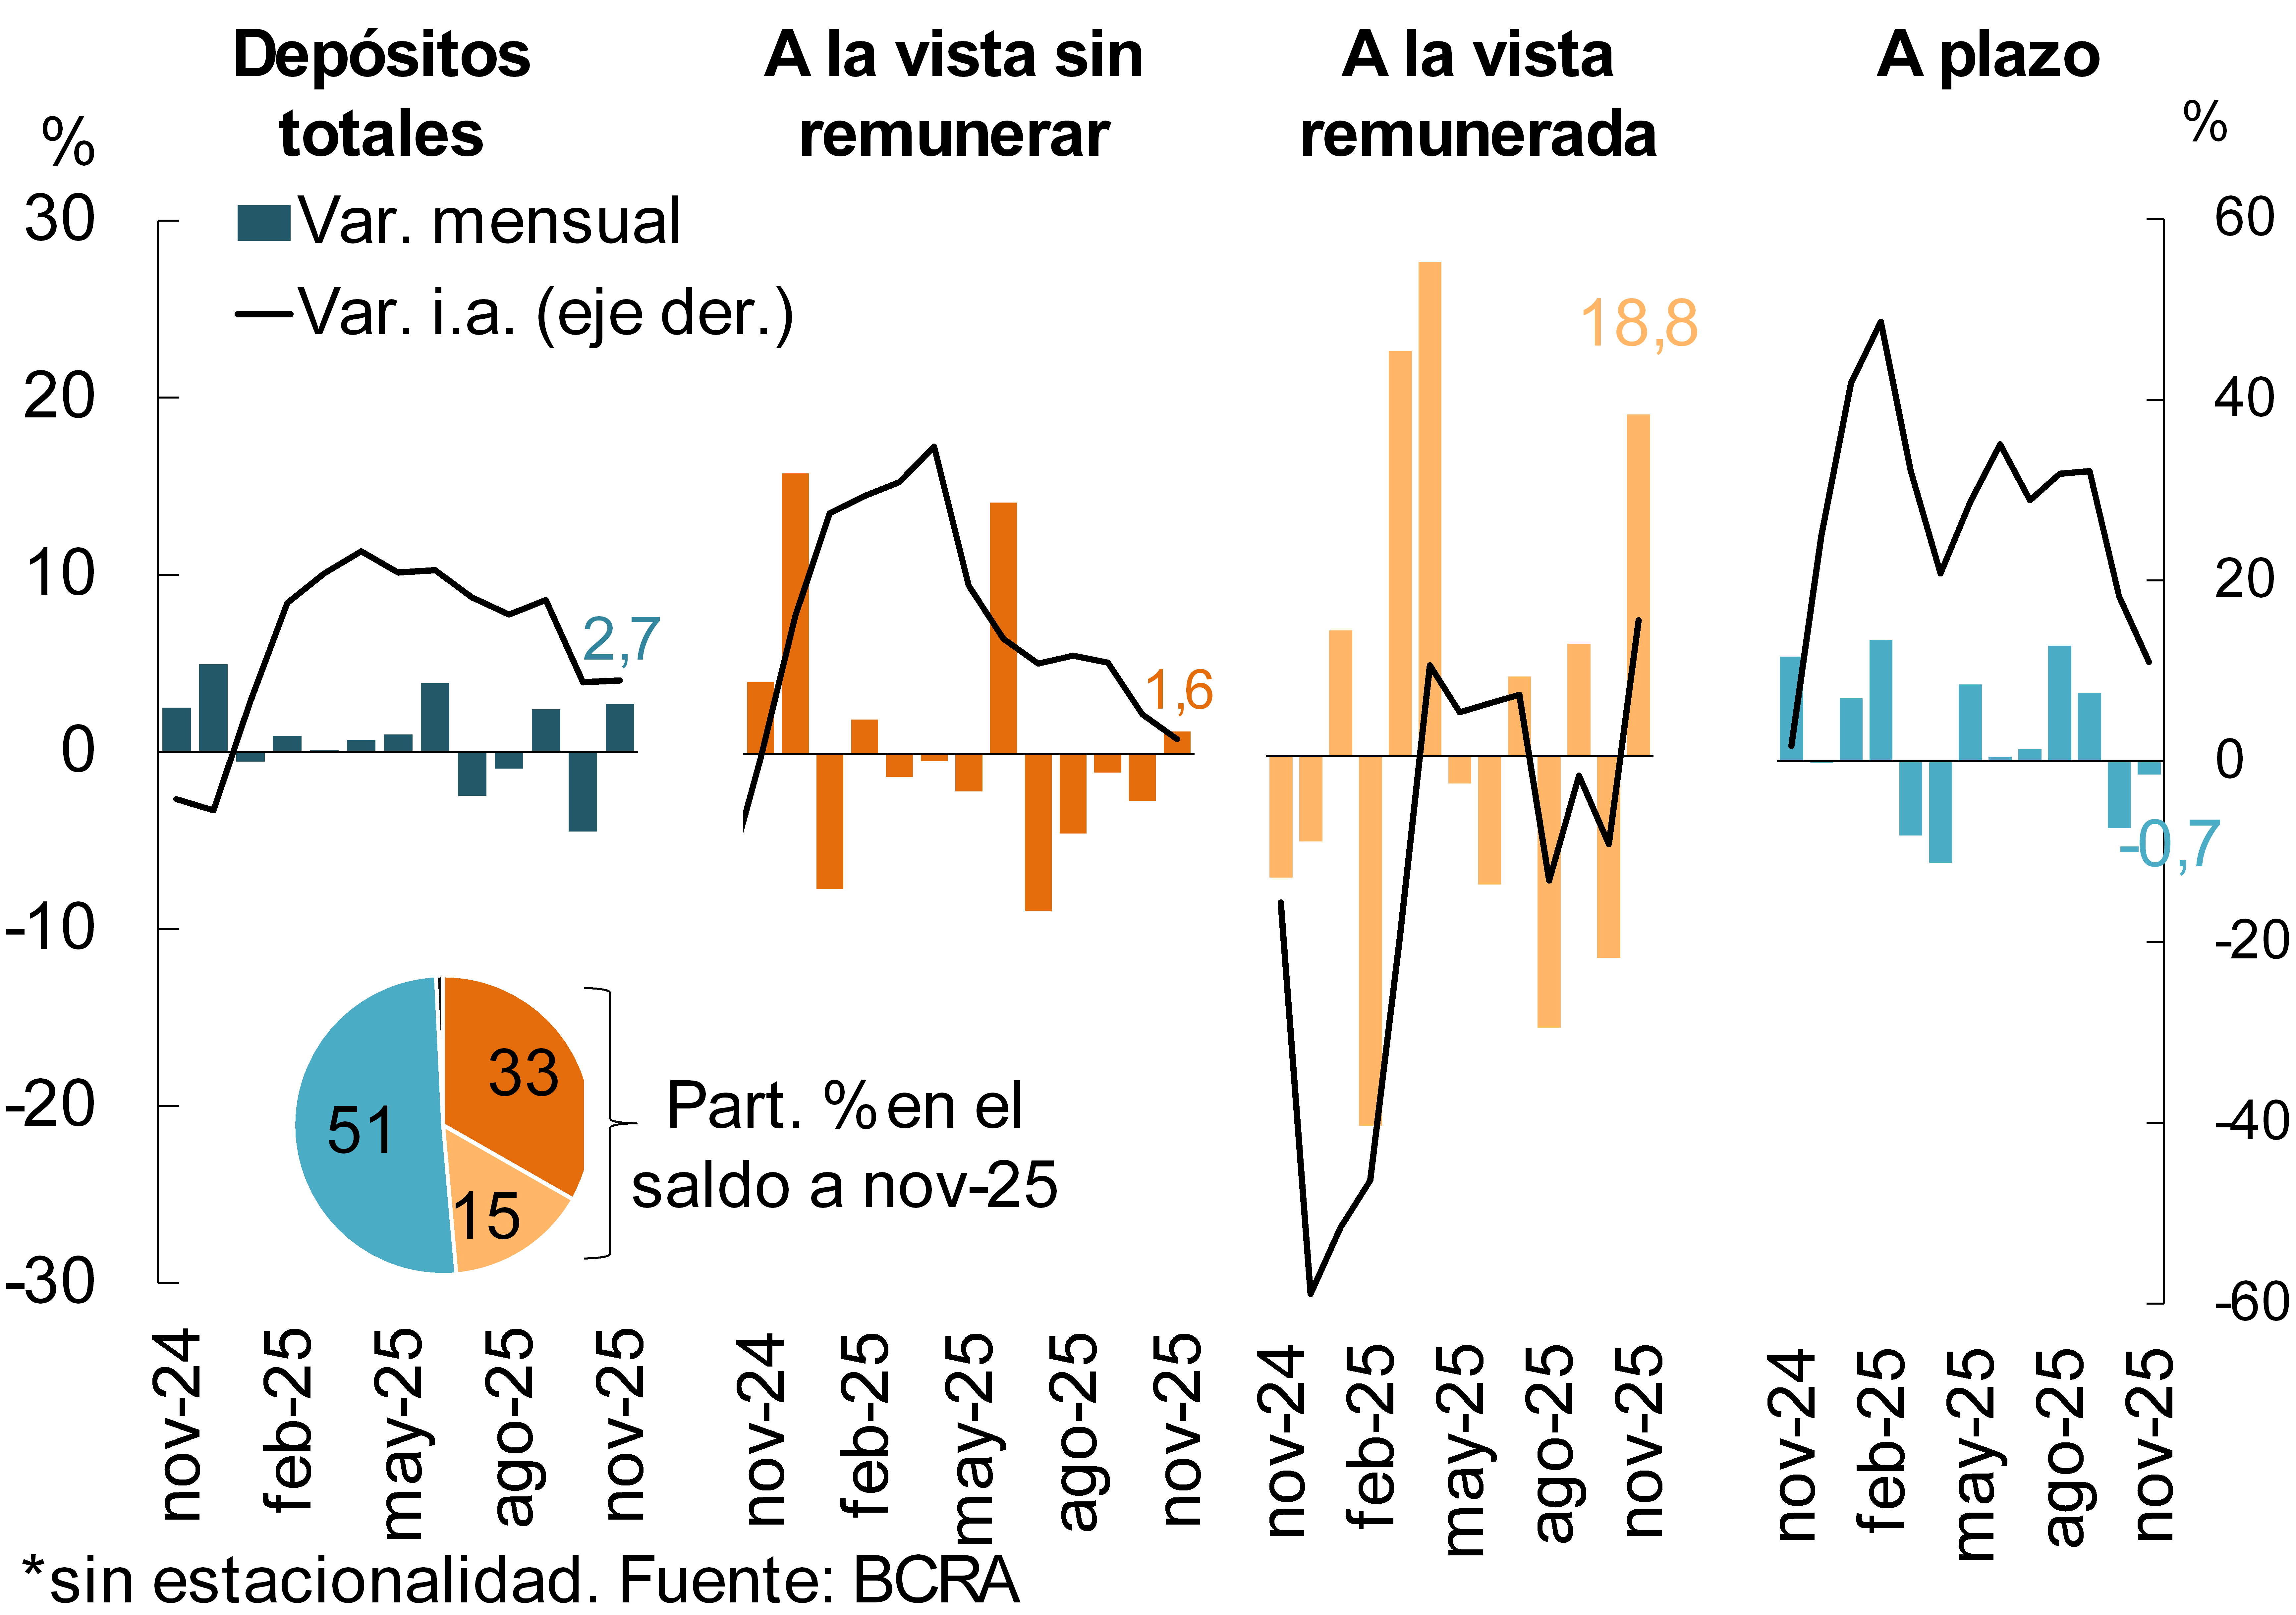
With regard to funding in the aggregate financial system, in November the real balance of private sector deposits in pesos increased by 2.7% (8.1% real YoY), explained by demand accounts (mainly interest-bearing accounts; see Chart 4)2. When distinguishing by segment, the dynamics in the period were mainly driven by legal entities providing financial services (6.9% real monthly).
In relation to the foreign currency segment, in the month the balance of private sector deposits increased by 1.8% (9.8% YoY; see Chart 2), reaching one of the highest levels in the last 15 years1. Considering all sectors and currencies, the real balance of total deposits grew 2.2% in November (10% YoY).
II. Aggregate evolution and composition of the balance sheet
The total assets of the financial system registered an increase of 1.3% in real terms in November, mainly driven by the performance of public entities. In a year-on-year comparison, the assets of financial institutions as a whole accumulated an expansion in real terms of 10.1%, a generalized dynamic among the different groups of institutions.
Chart 5 – Composition of assets and funding
Financial system – In % share
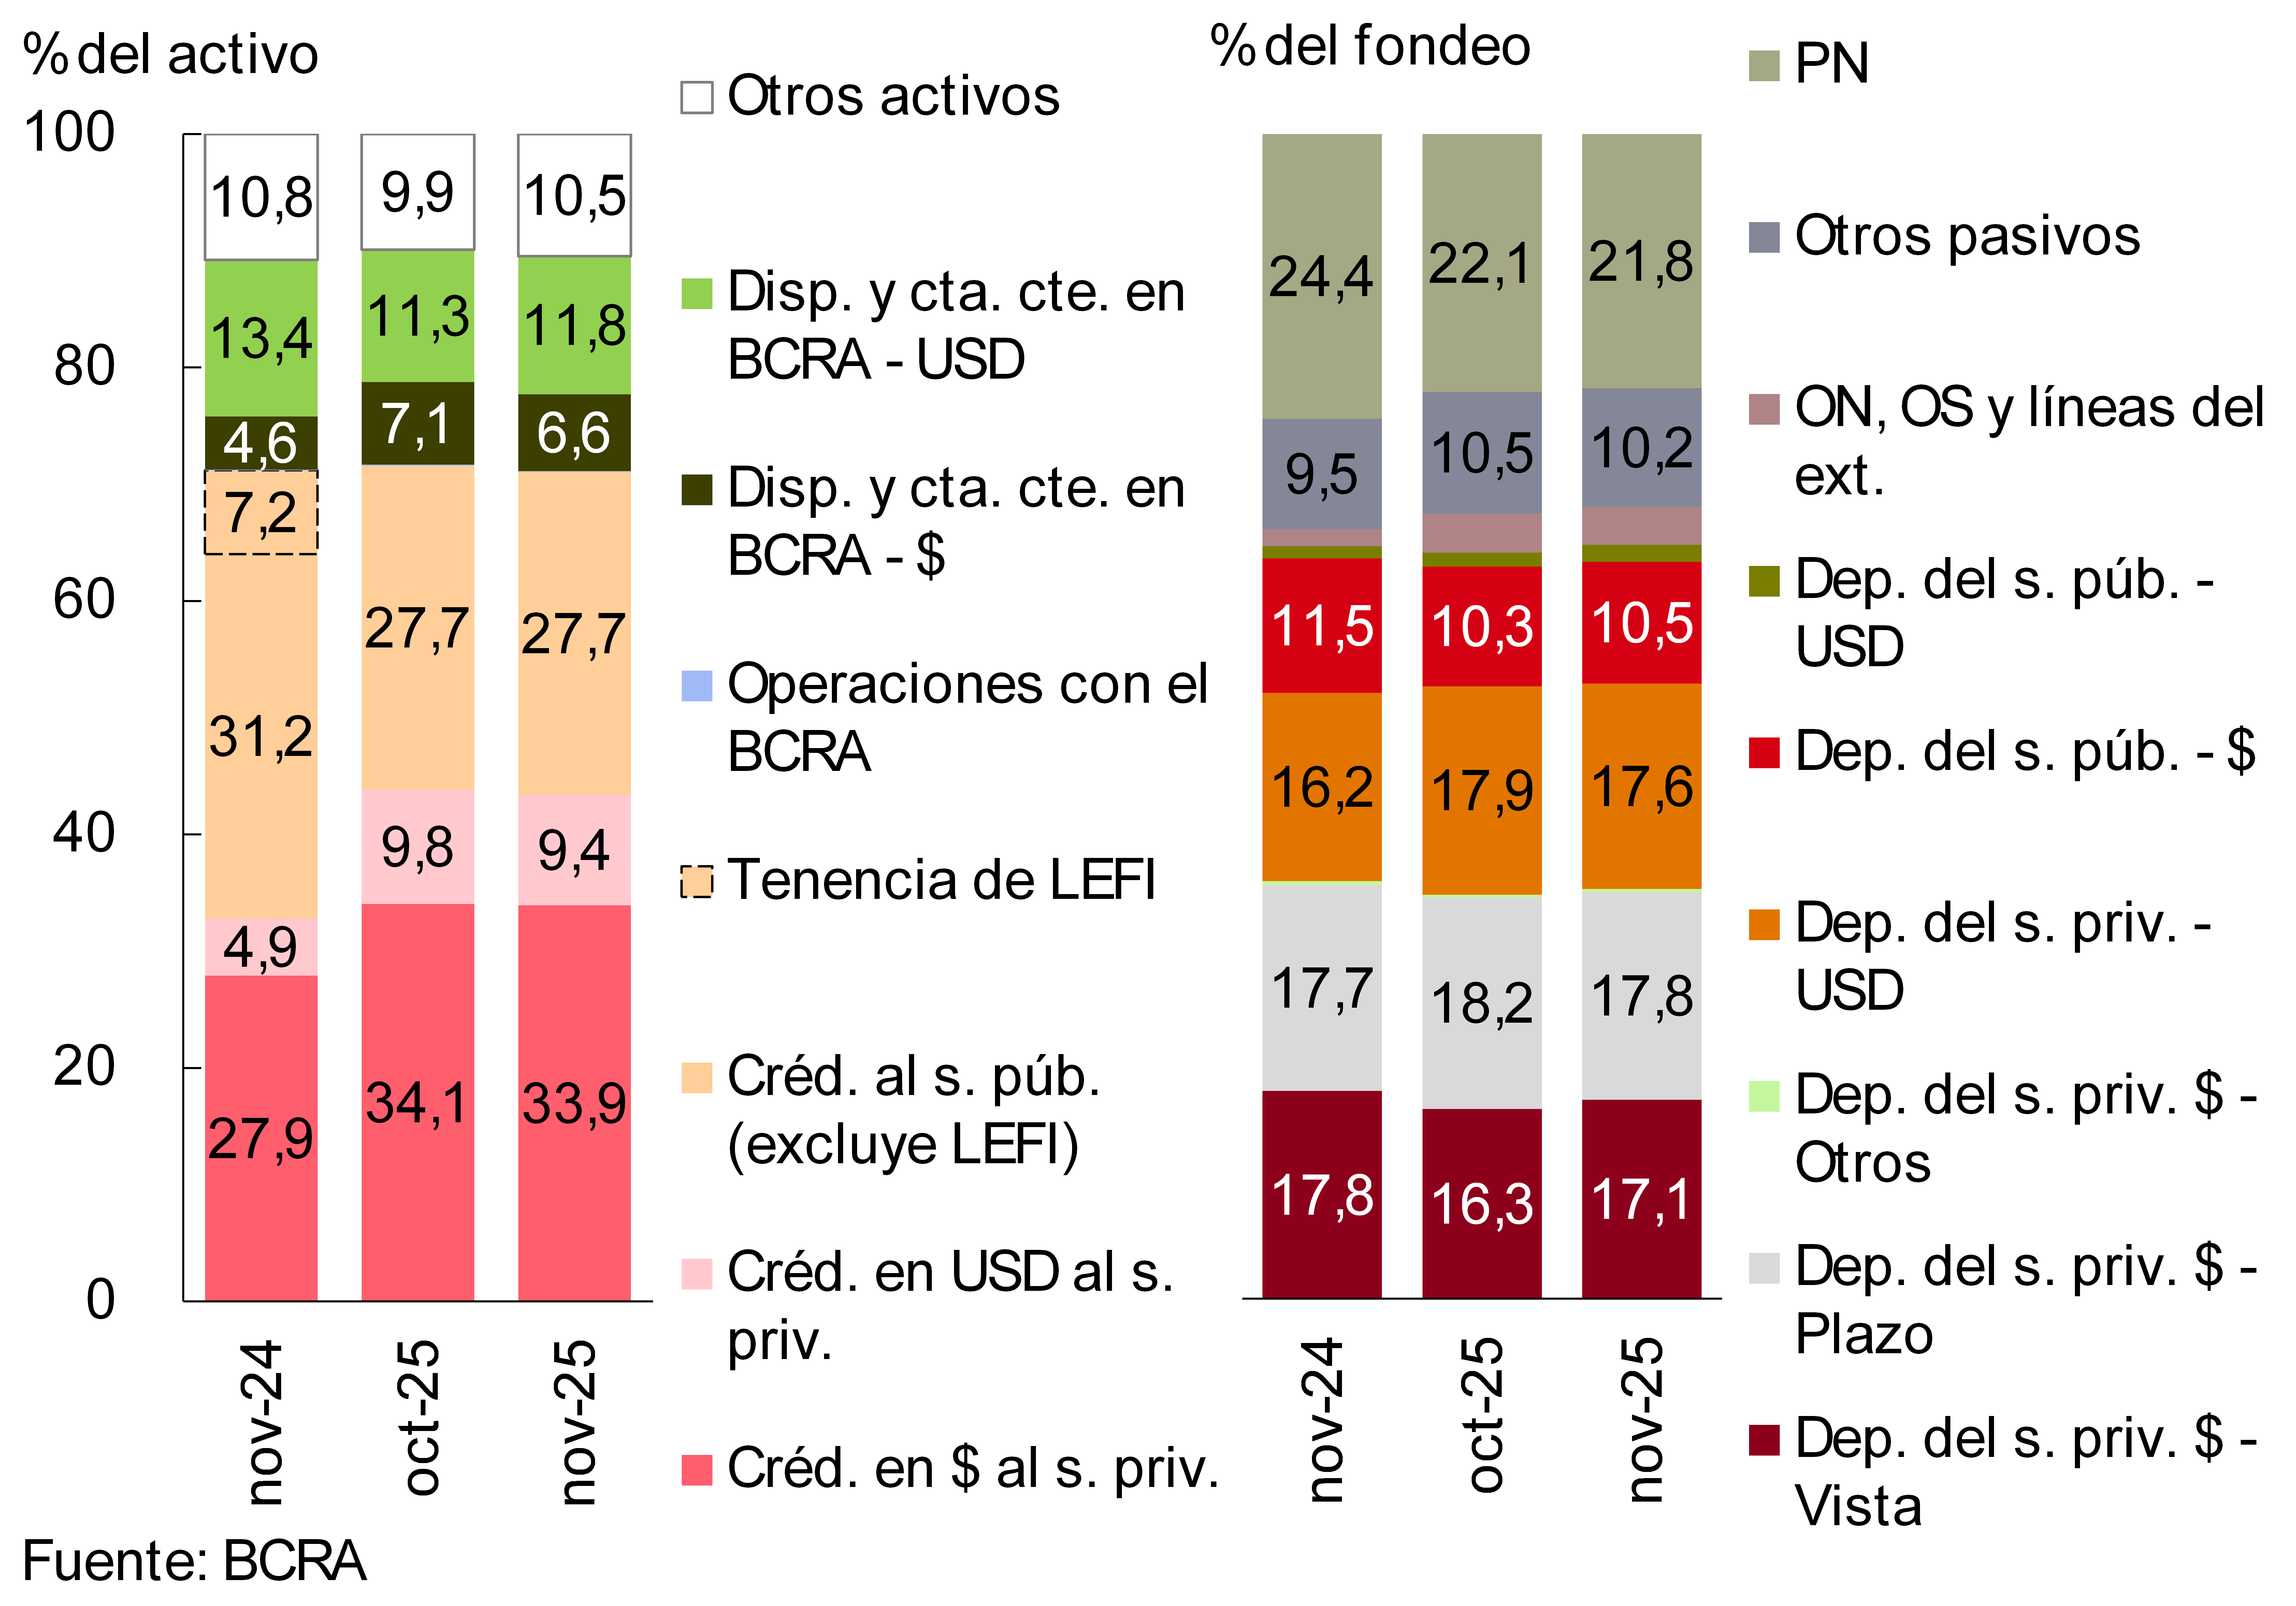
When considering the composition of the assets of the financial system, a greater weighting of the current accounts in foreign currency that the entities maintain in the BCRA was observed, while credit to the private sector – both in pesos and in foreign currency – and the current accounts in pesos of the entities in this Institution reduced their relative weight within total assets (see Graph 5). With regard to aggregate funding, between the end of the month the relevance of private sector demand accounts in pesos and public sector deposits in the same denomination increased (see Graph 5). On the other hand, the rest of the main items showed a decrease in their importance in the total in the period.
Graph 6 | Spread between assets and liabilities in foreign
currency In % of the PRC – Financial system
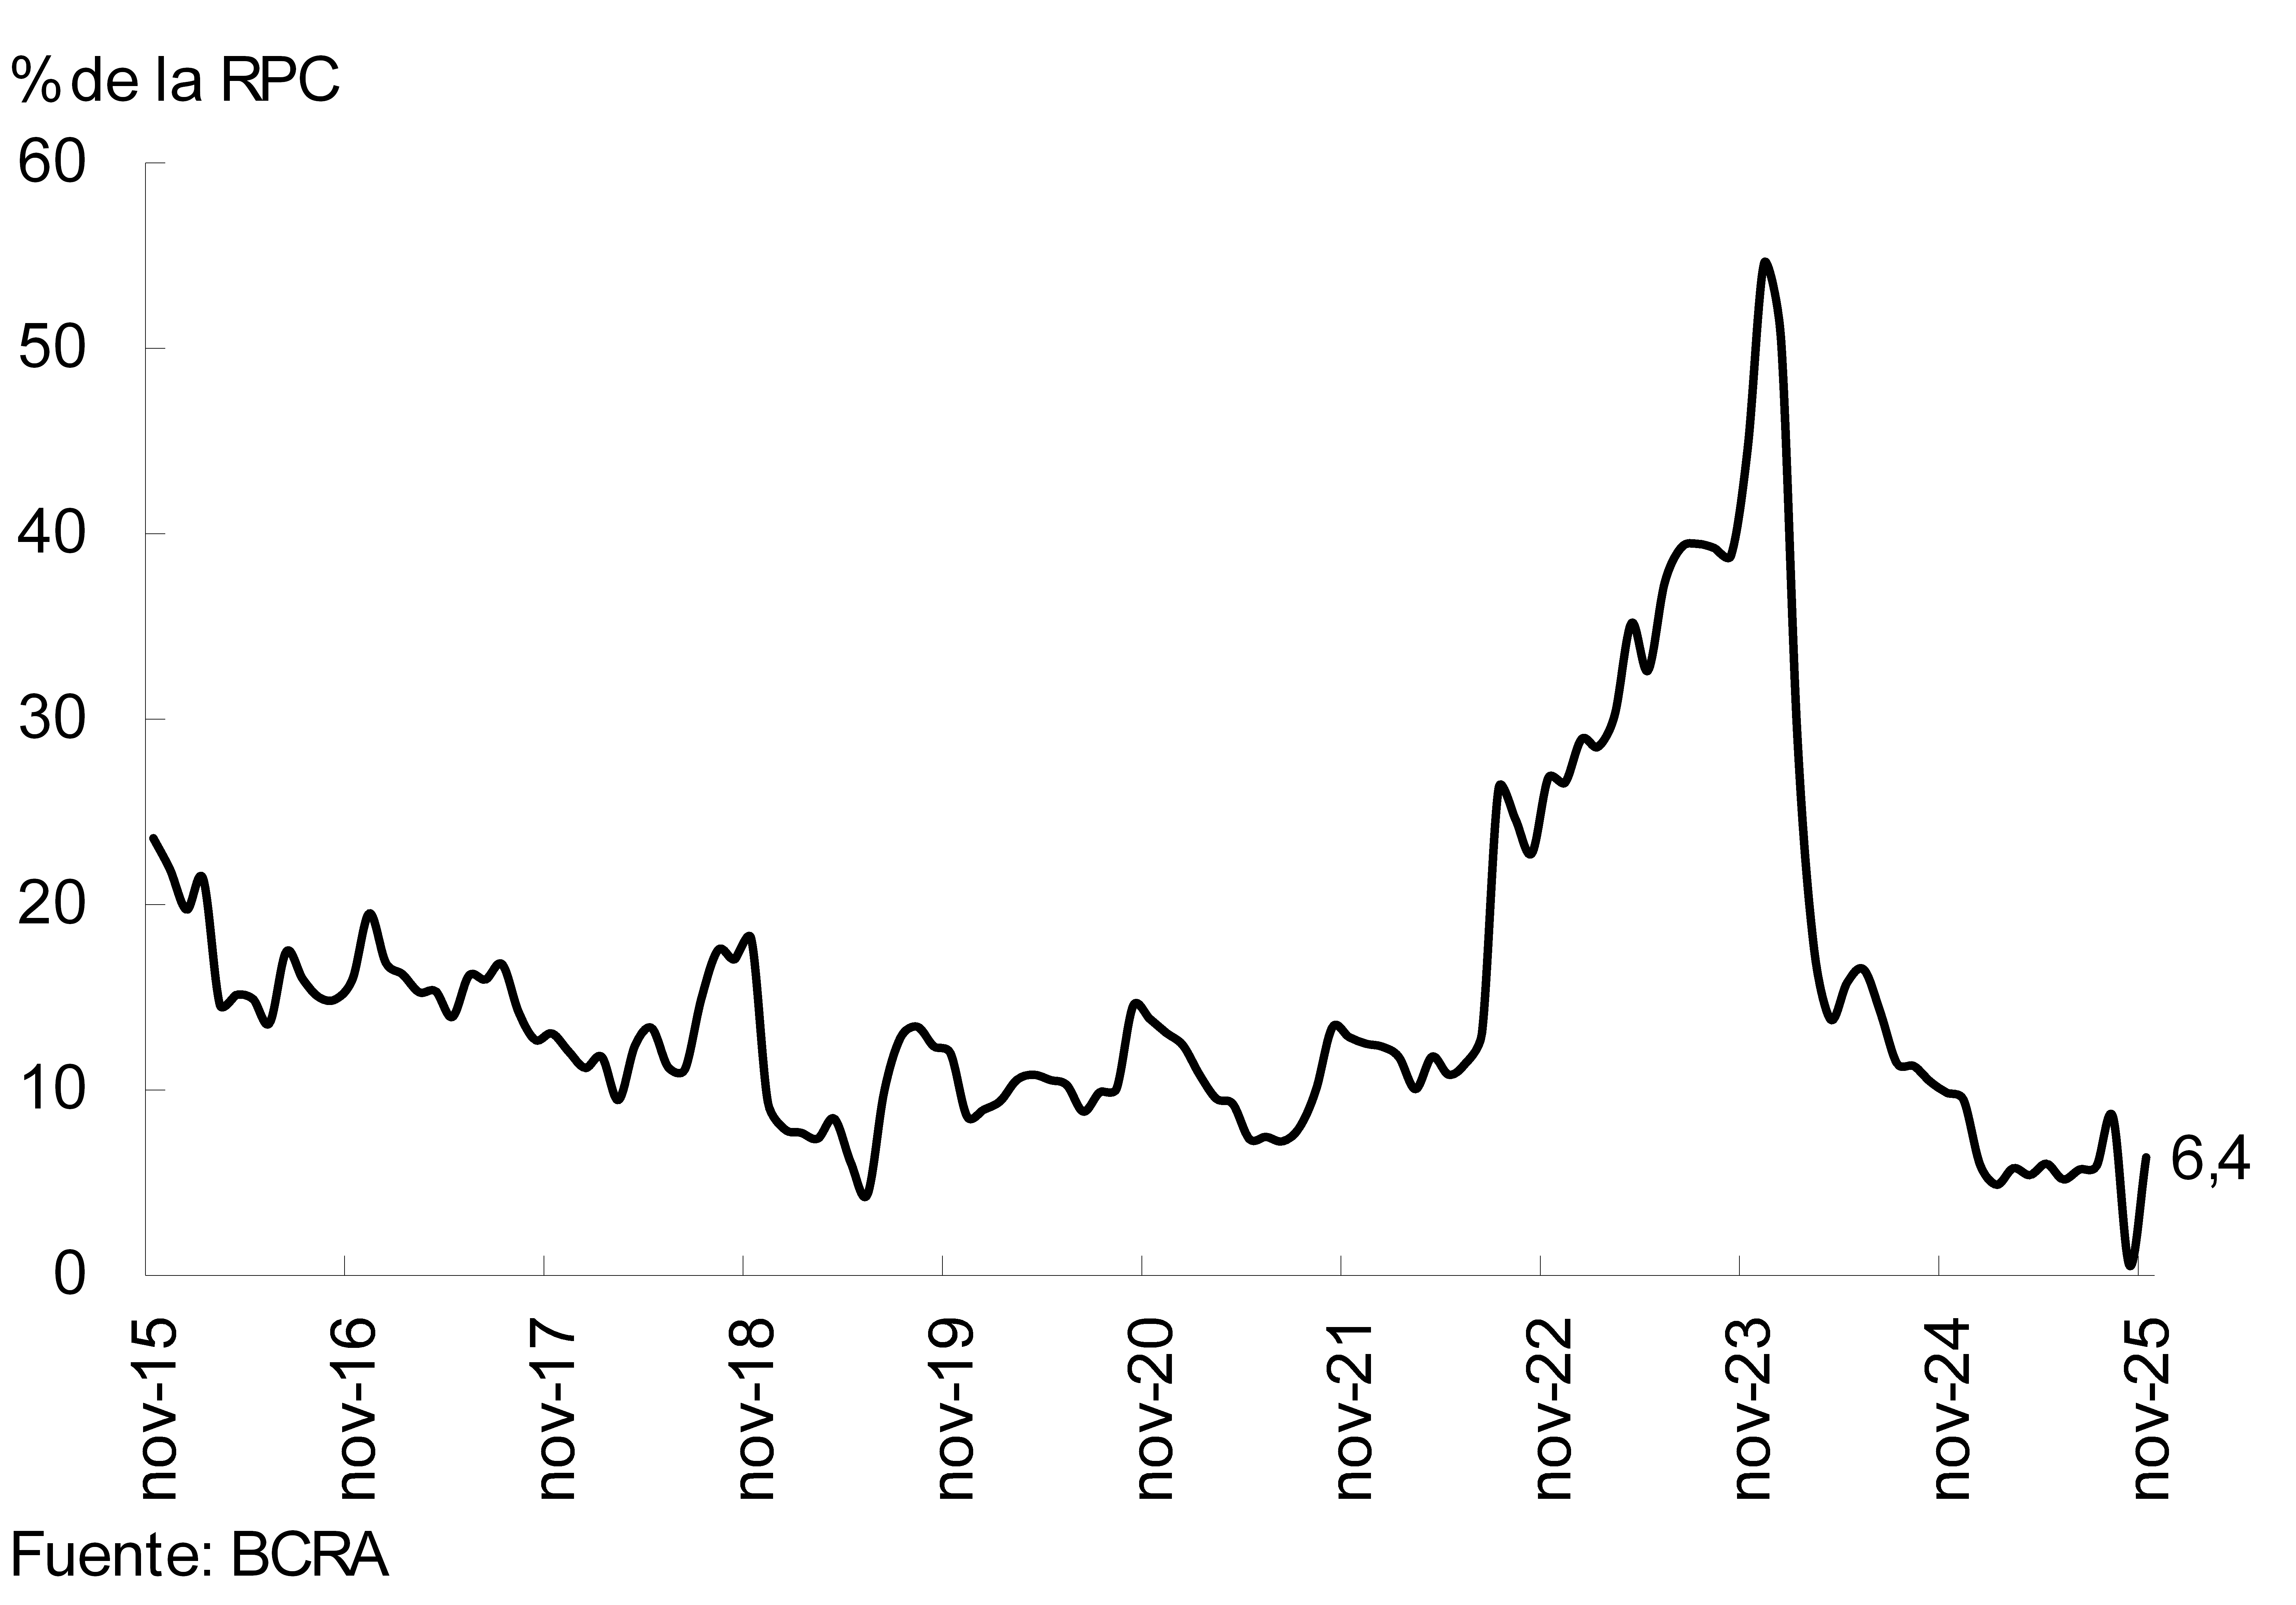
In November, the estimated spread between assets and liabilities denominated in foreign currency – including forward foreign currency purchase and sale transactions without delivery of underlying recorded off-balance sheet – increased by 5.8 p.p. of the financial system’s PRC, to 6.4%. However, this level was 3.5 p.p. lower than that observed a year ago, and 9 p.p. below the average of the last 10 years (see Graph 6). In the segment of items adjustable by CER or denominated in UVA, the aggregate spread between assets and liabilities increased 1.4 p.p. in the month, representing 91.6% of the PRC of the financial system (-11 p.p. y.o.y.).
III. Portfolio quality
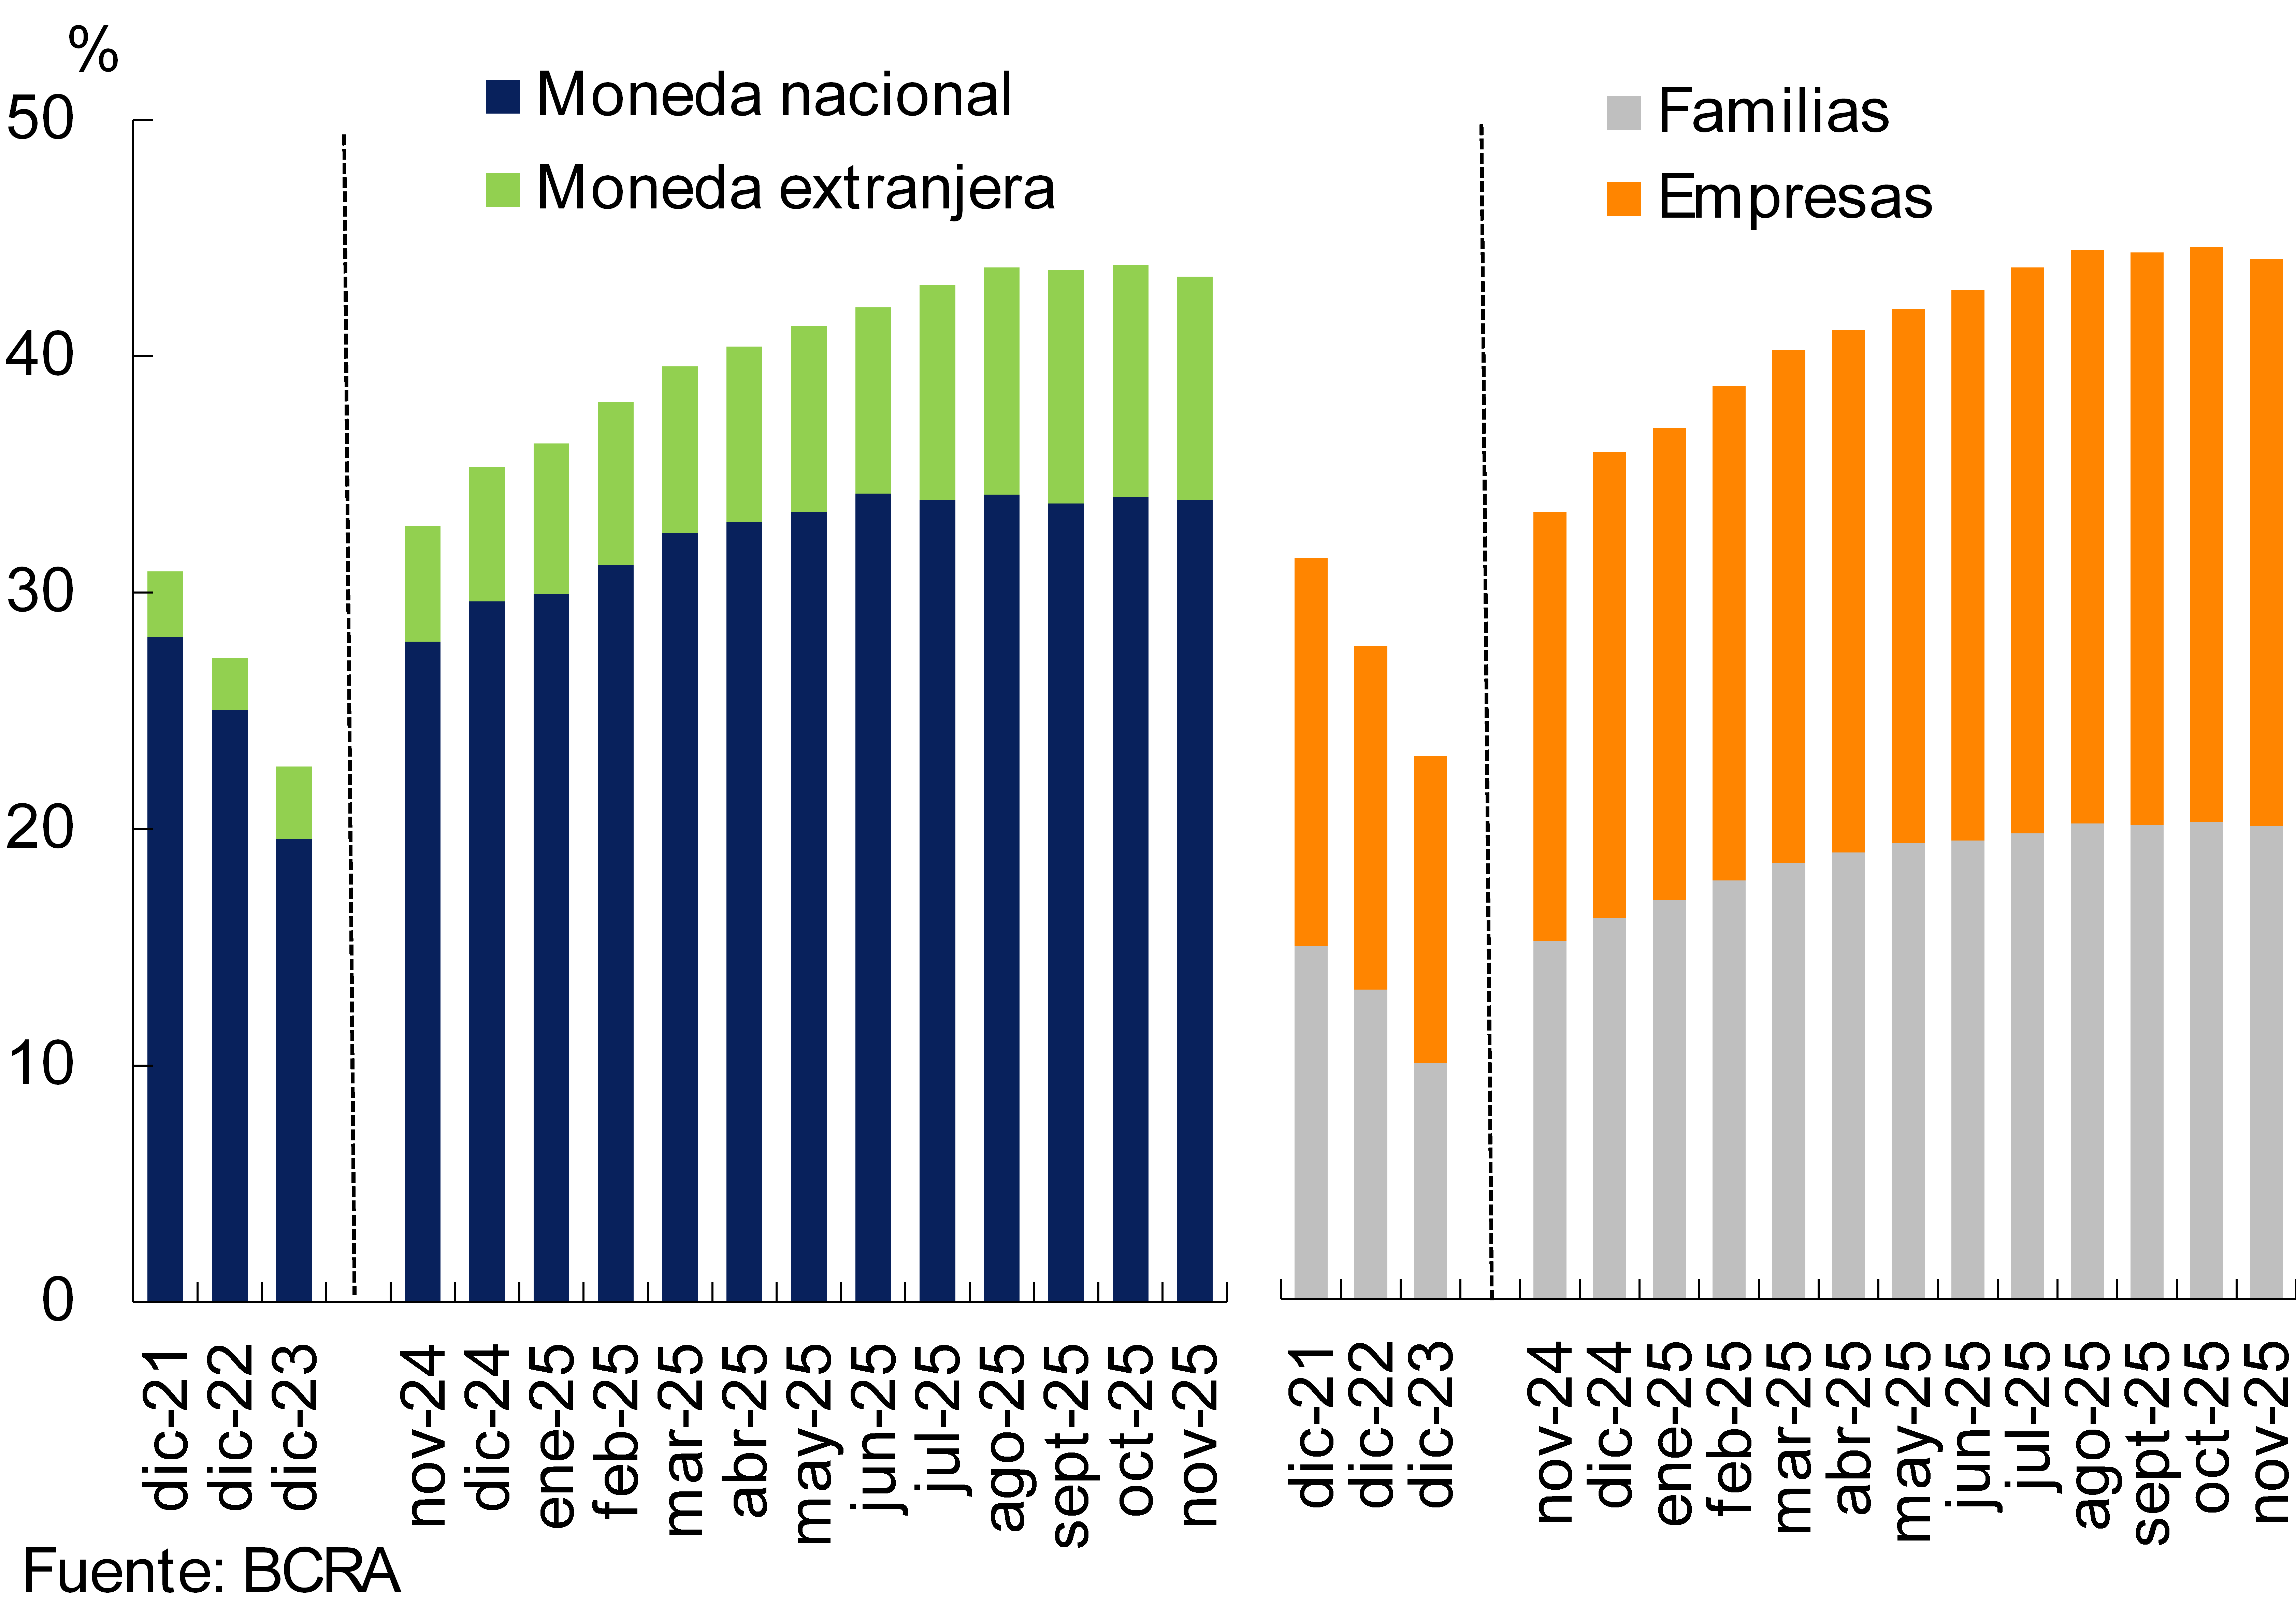
In November, the gross exposure of the financial system to the private sector, considering domestic and foreign currency, showed a slight reduction, standing at 43.4% of assets (see Chart 7). When focusing on the segment in local currency, this indicator stood at 33.9%, while the ratio between credit in foreign currency and total assets reached 9.4%. In the last year, total credit to the private sector accumulated an increase of 10.5 p.p. in assets (6 p.p. for financing in pesos and 4.5 p.p. for those denominated in foreign currency). Considering the type of debtor, in the month loans to companies represented 23.6% of the total assets of the financial system, while credit to households was equivalent to 19.7% of assets (see Graph 7).
Graph 7: Credit balance to the private sector in terms of assets
In November, the non-compliance ratio of credit to the private sector increased by 0.7 p.p., reaching 5.2% at the systemic level. When analyzed by type of debtor, in the period the default of loans to households amounted to 8.8%, an increase mainly explained by the monthly performance of assistance for consumption (see Graph 8). In the business segment, the irregularity indicator increased to 2.3%, verifying increases in all economic sectors (see Graph 8).
Chart 8: Private sector credit irregularity ratio
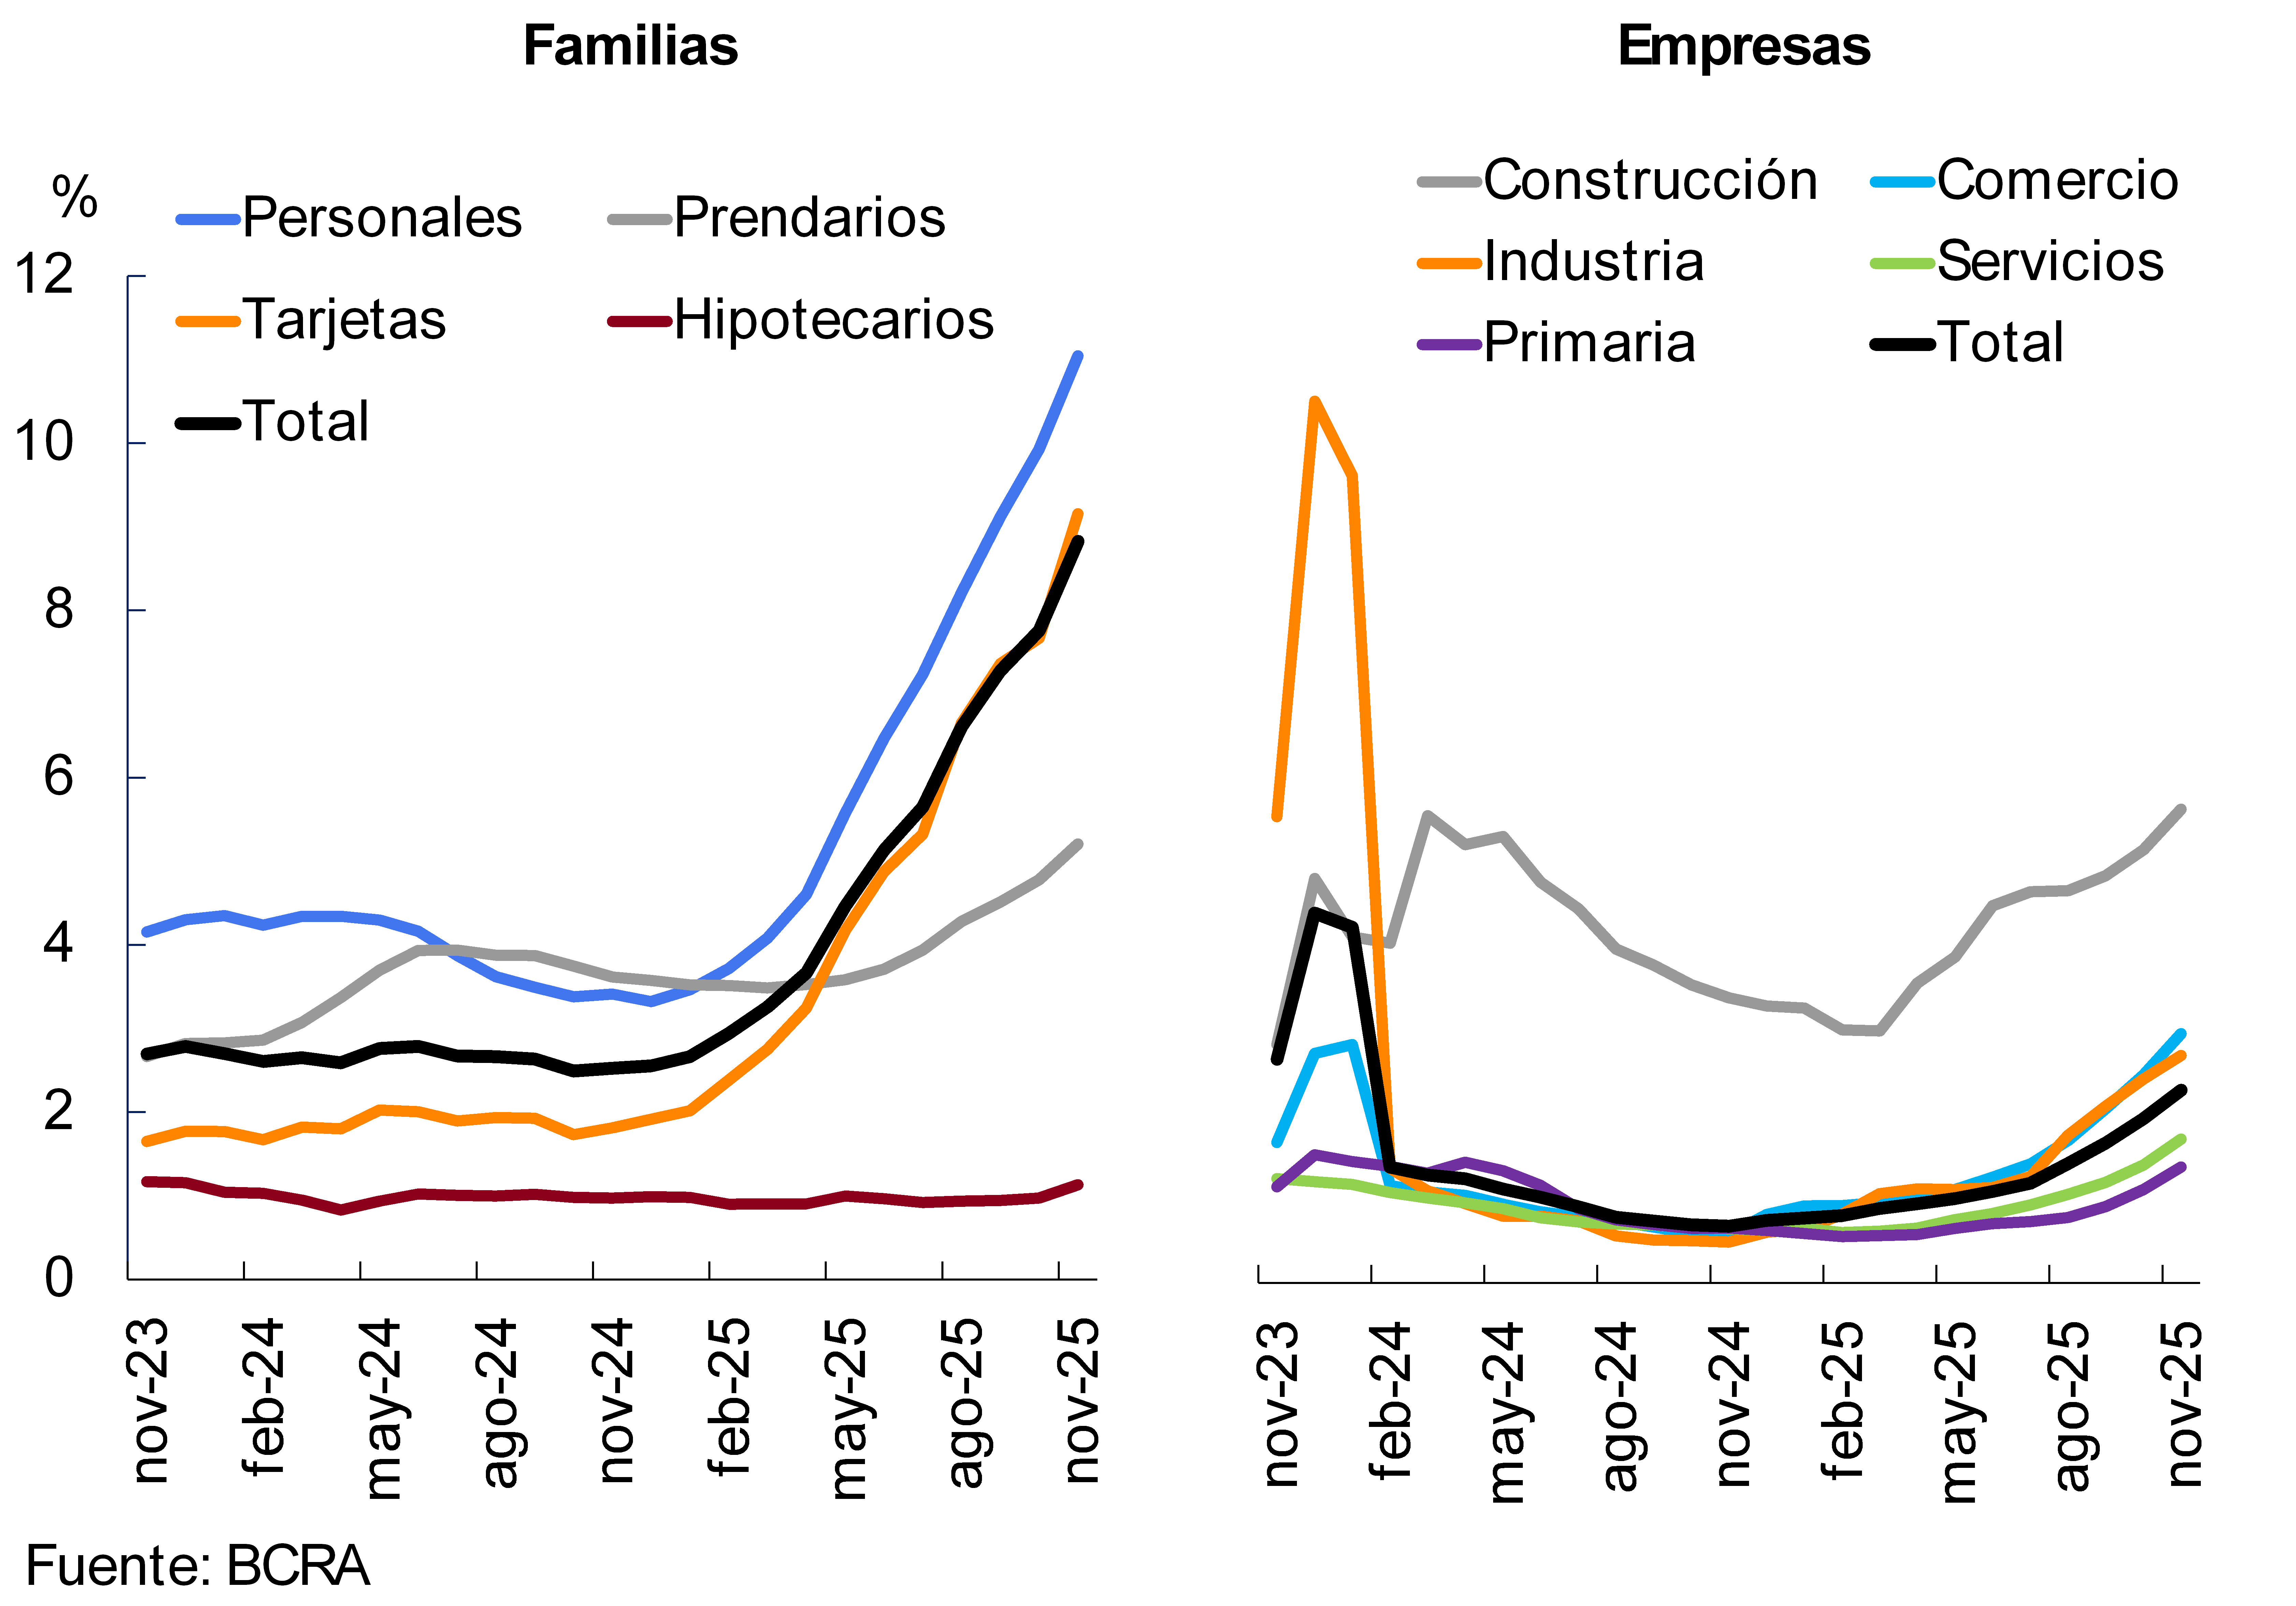
In this scenario, and according to the responses of the Credit Conditions Survey, at the aggregate level, there was a tightening of credit origination standards in the last two quarters of 2025 (mainly in the segment of households and small and medium-sized enterprises). This evolution is consistent with a prudential response by financial institutions in the context of an increase in the degree of materialization of credit risk.
The level of total forecasts constituted by the aggregate of the sector represented 97% of the portfolio in an irregular situation in November (-3.2 p.p. compared to October). In terms of the total loan portfolio to the private sector, forecasts reached 5.1% in the period (0.5 p.p. more than in the previous month).
IV. Liquidity and solvency
The liquidity ratios in national currency of the financial system fell between the peaks of the month. The ratio between availabilities and deposits – both in pesos – stood at 14.2% in November (-1.3 p.p. monthly and +4.7 p.p. y.o.y.). In the same vein, ample liquidity in national currency in the financial system totaled 35.9% of deposits in pesos in the month, with a monthly decrease of 4.4 p.p.3 (-8 p.p. y.o.y.; see Graph 9). Liquid assets in foreign currency accounted for 61.9% of deposits in the same denomination, increasing 2.3 p.p. in the month (-15.5 p.p. y.o.y.).
Graph 9 : Liquidity Indicators
Financial System – As % of deposits
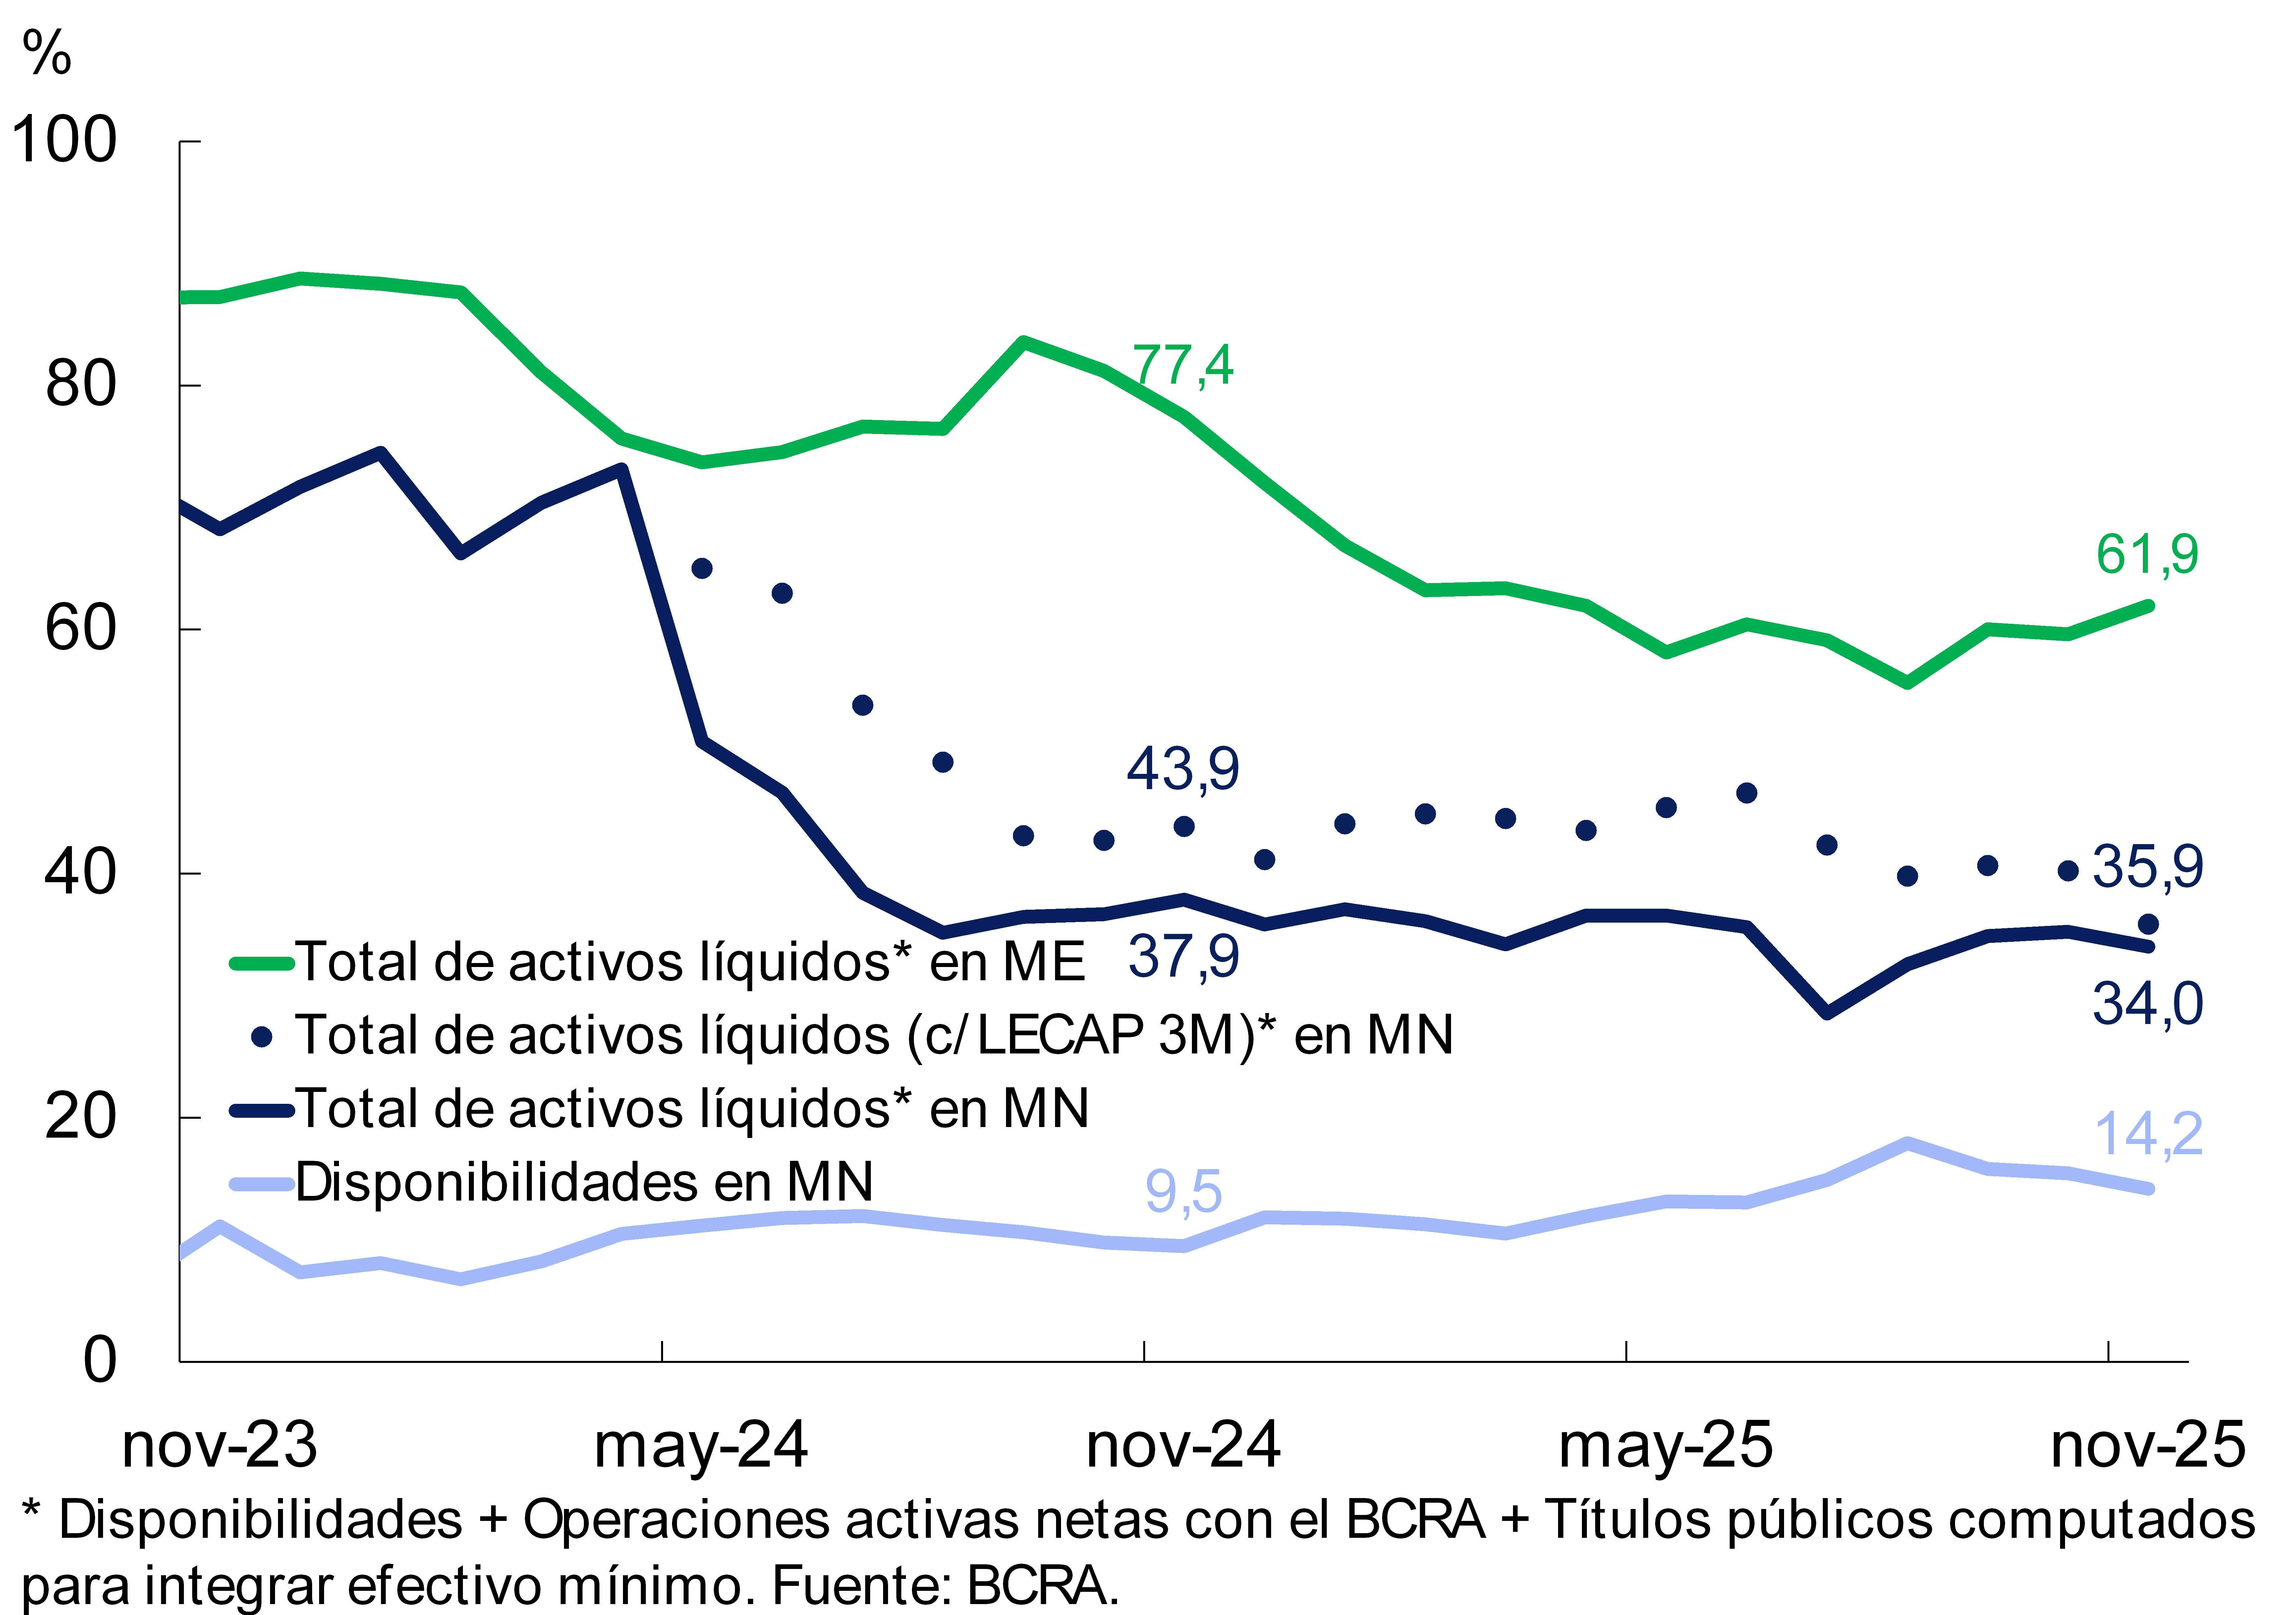
Figure 10 | Liquidity coverage ratio (LCR)
Group A financial institutions – In $
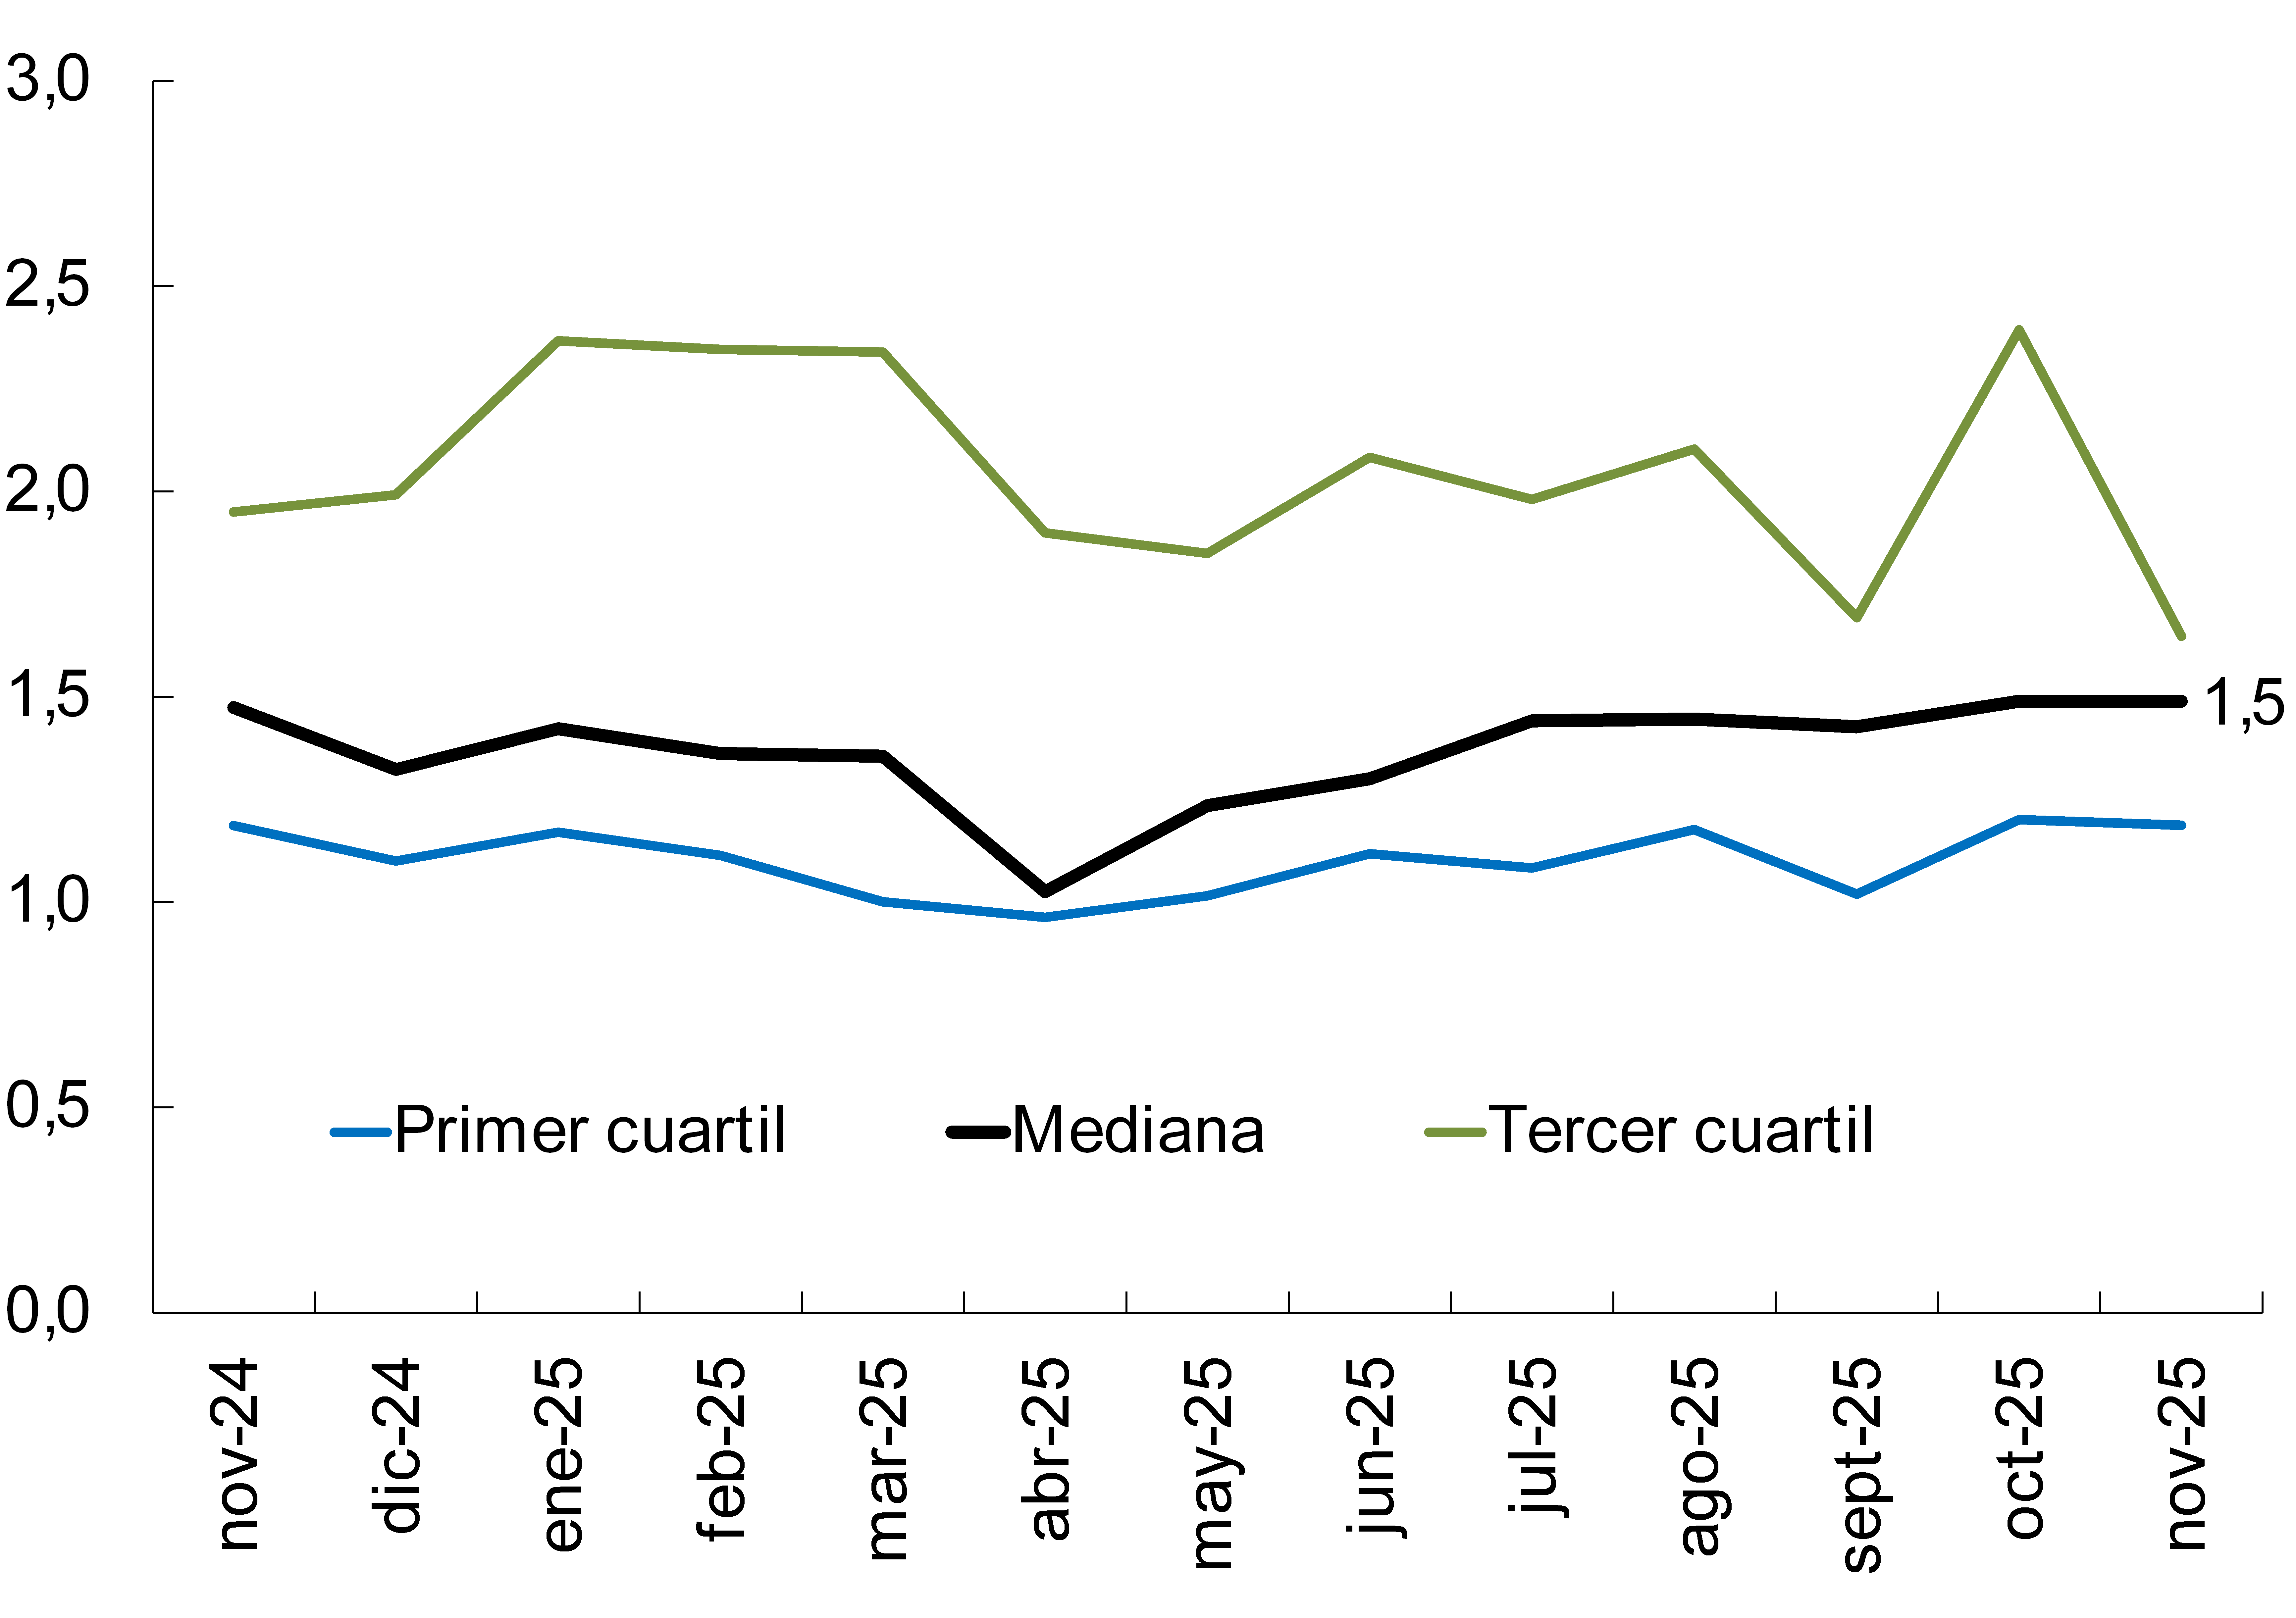
Regarding the liquidity coverage ratio (the so-called Basel III LCR) for the segment in pesos, in November it was observed that the median (Group A) remained without relevant changes compared to the previous month, standing at around 1.5 (see Chart 10).
Graph 11 : Integration of capital
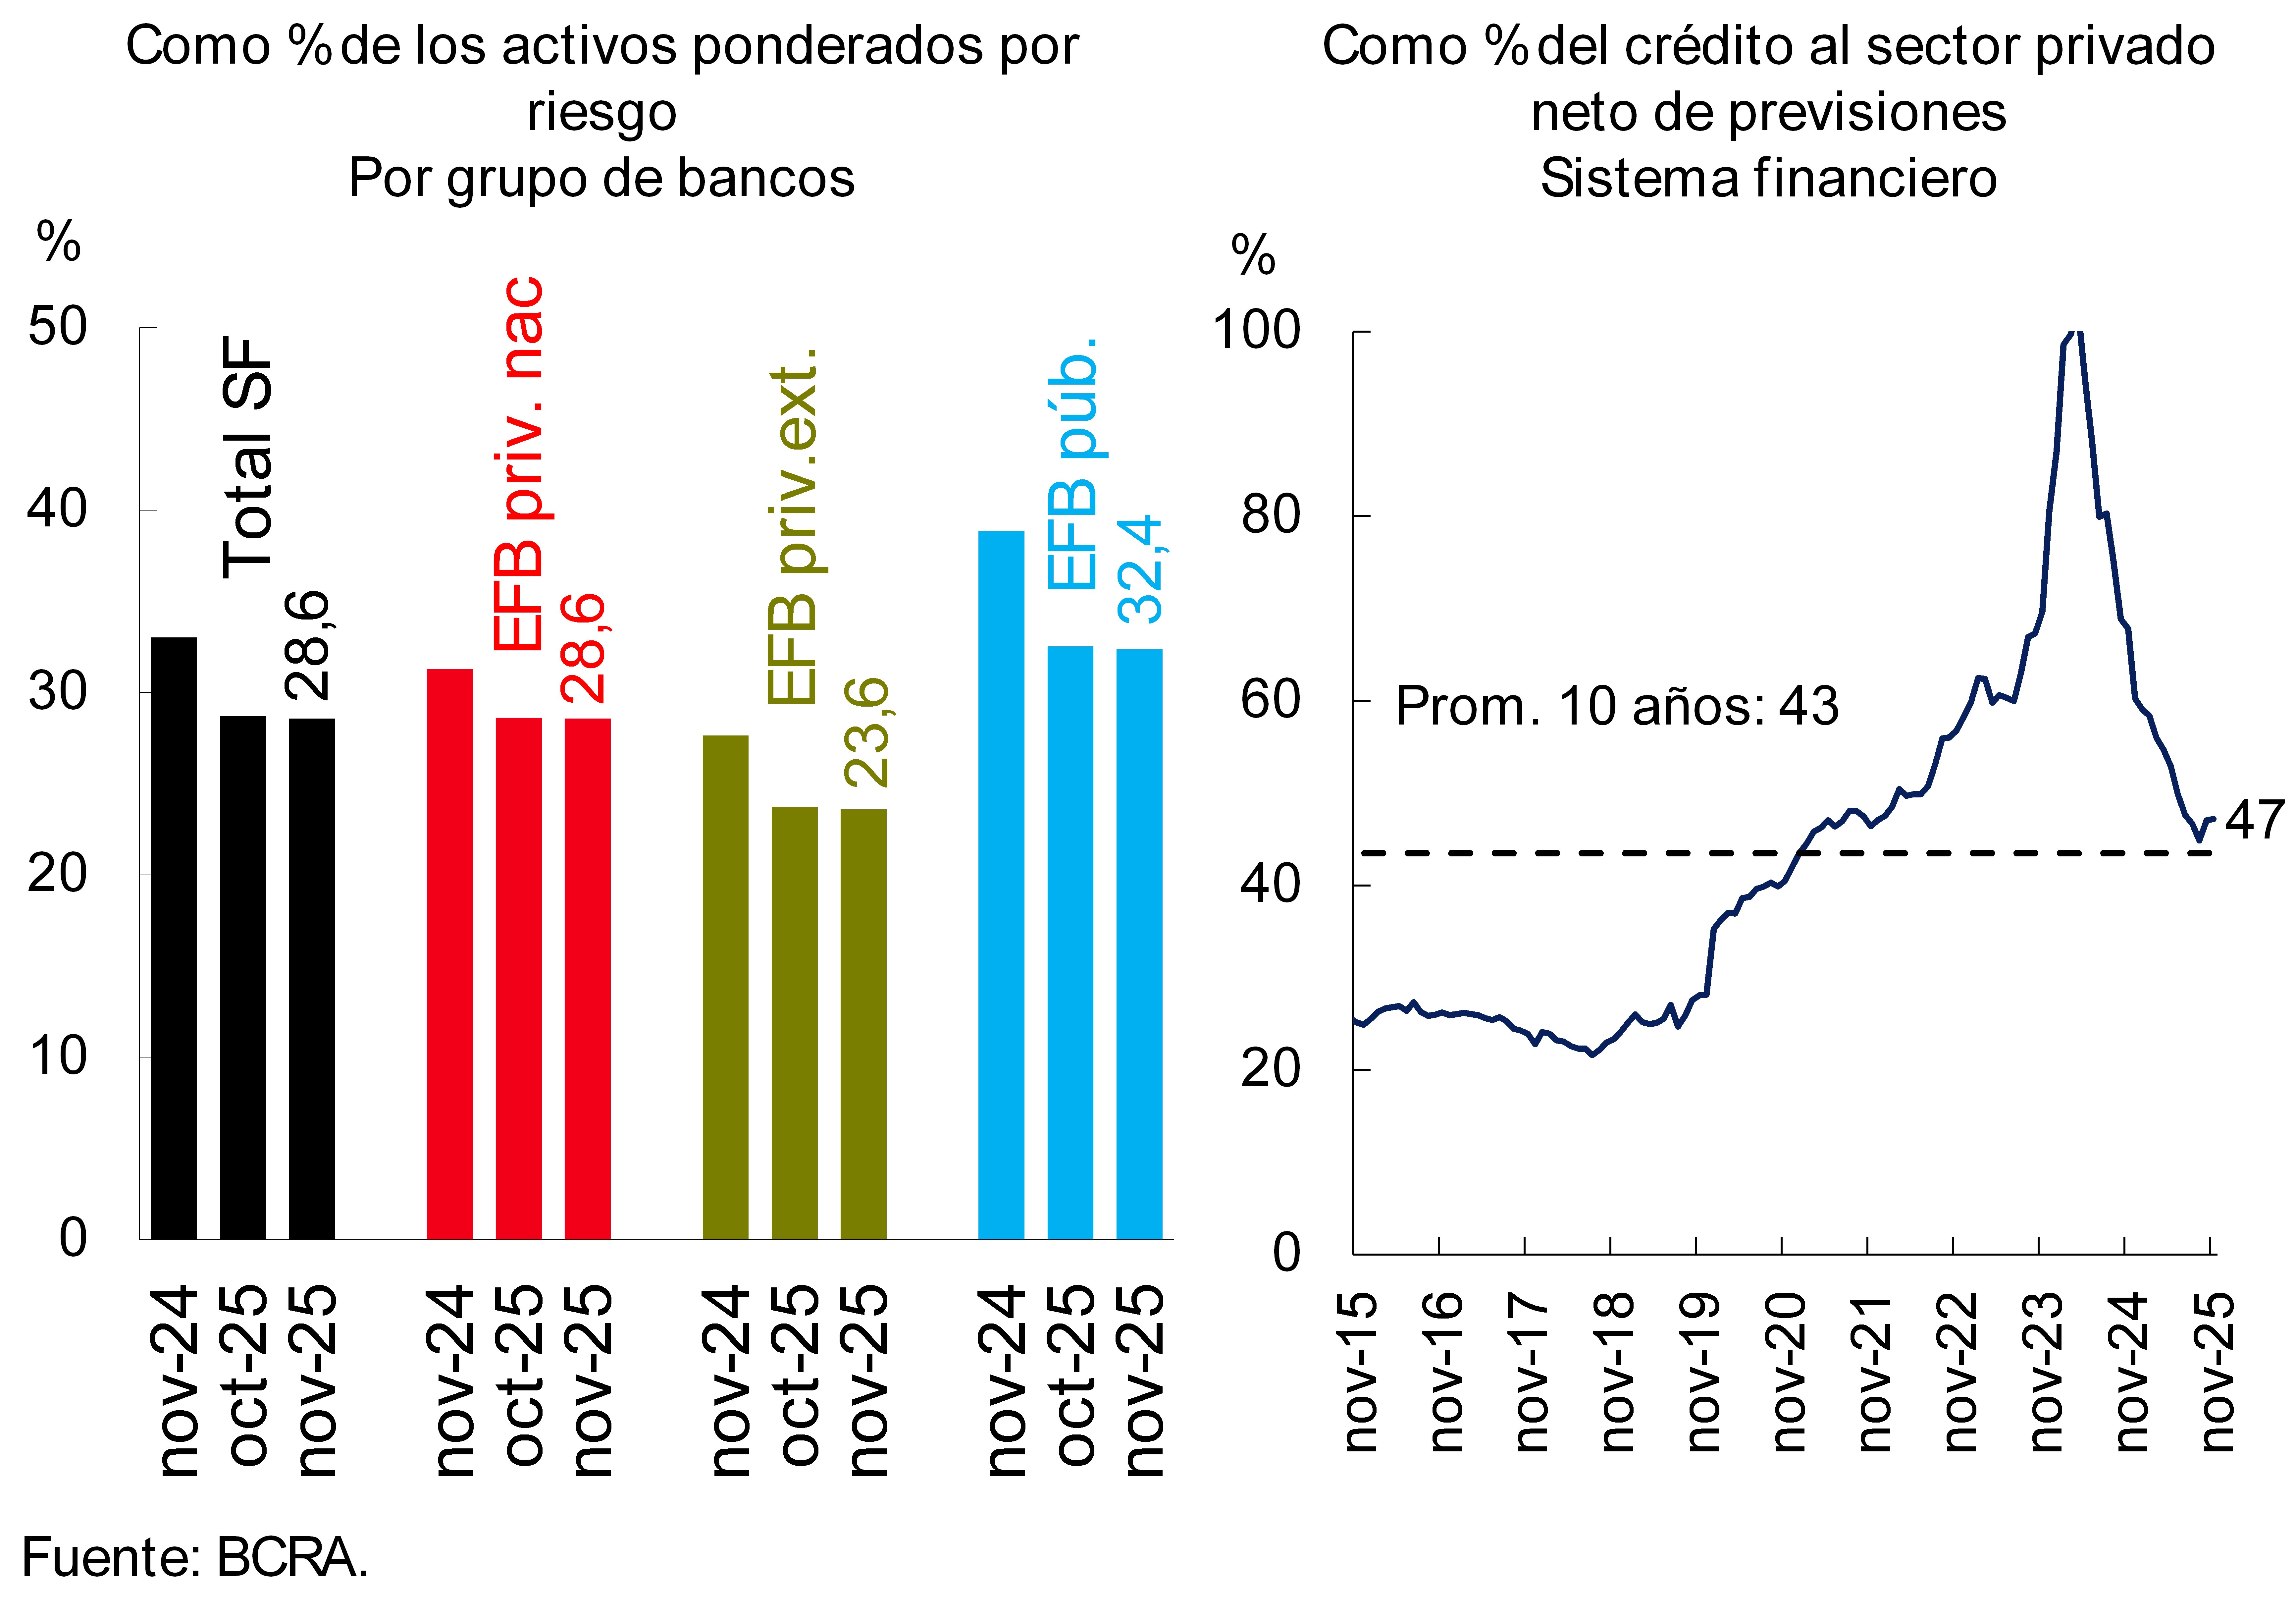
The financial system continues to have a comfortable level of solvency. Capital integration (PRC) stood at 28.6% of risk-weighted assets (RWA) of the financial system as a whole (-0.1 p.p. monthly and -4.4 p.p. y.o.y.; see Chart 11) and 47.2% of the balance of financing to the private sector net of forecasts. In the month, the capital position (net integration of the requirement) of the financial system as a whole totaled 253% of the requirement (-1 p.p. monthly and -61.3 p.p. y.o.y.).
Figure 12 | Cumulative return over 3 and 12 months
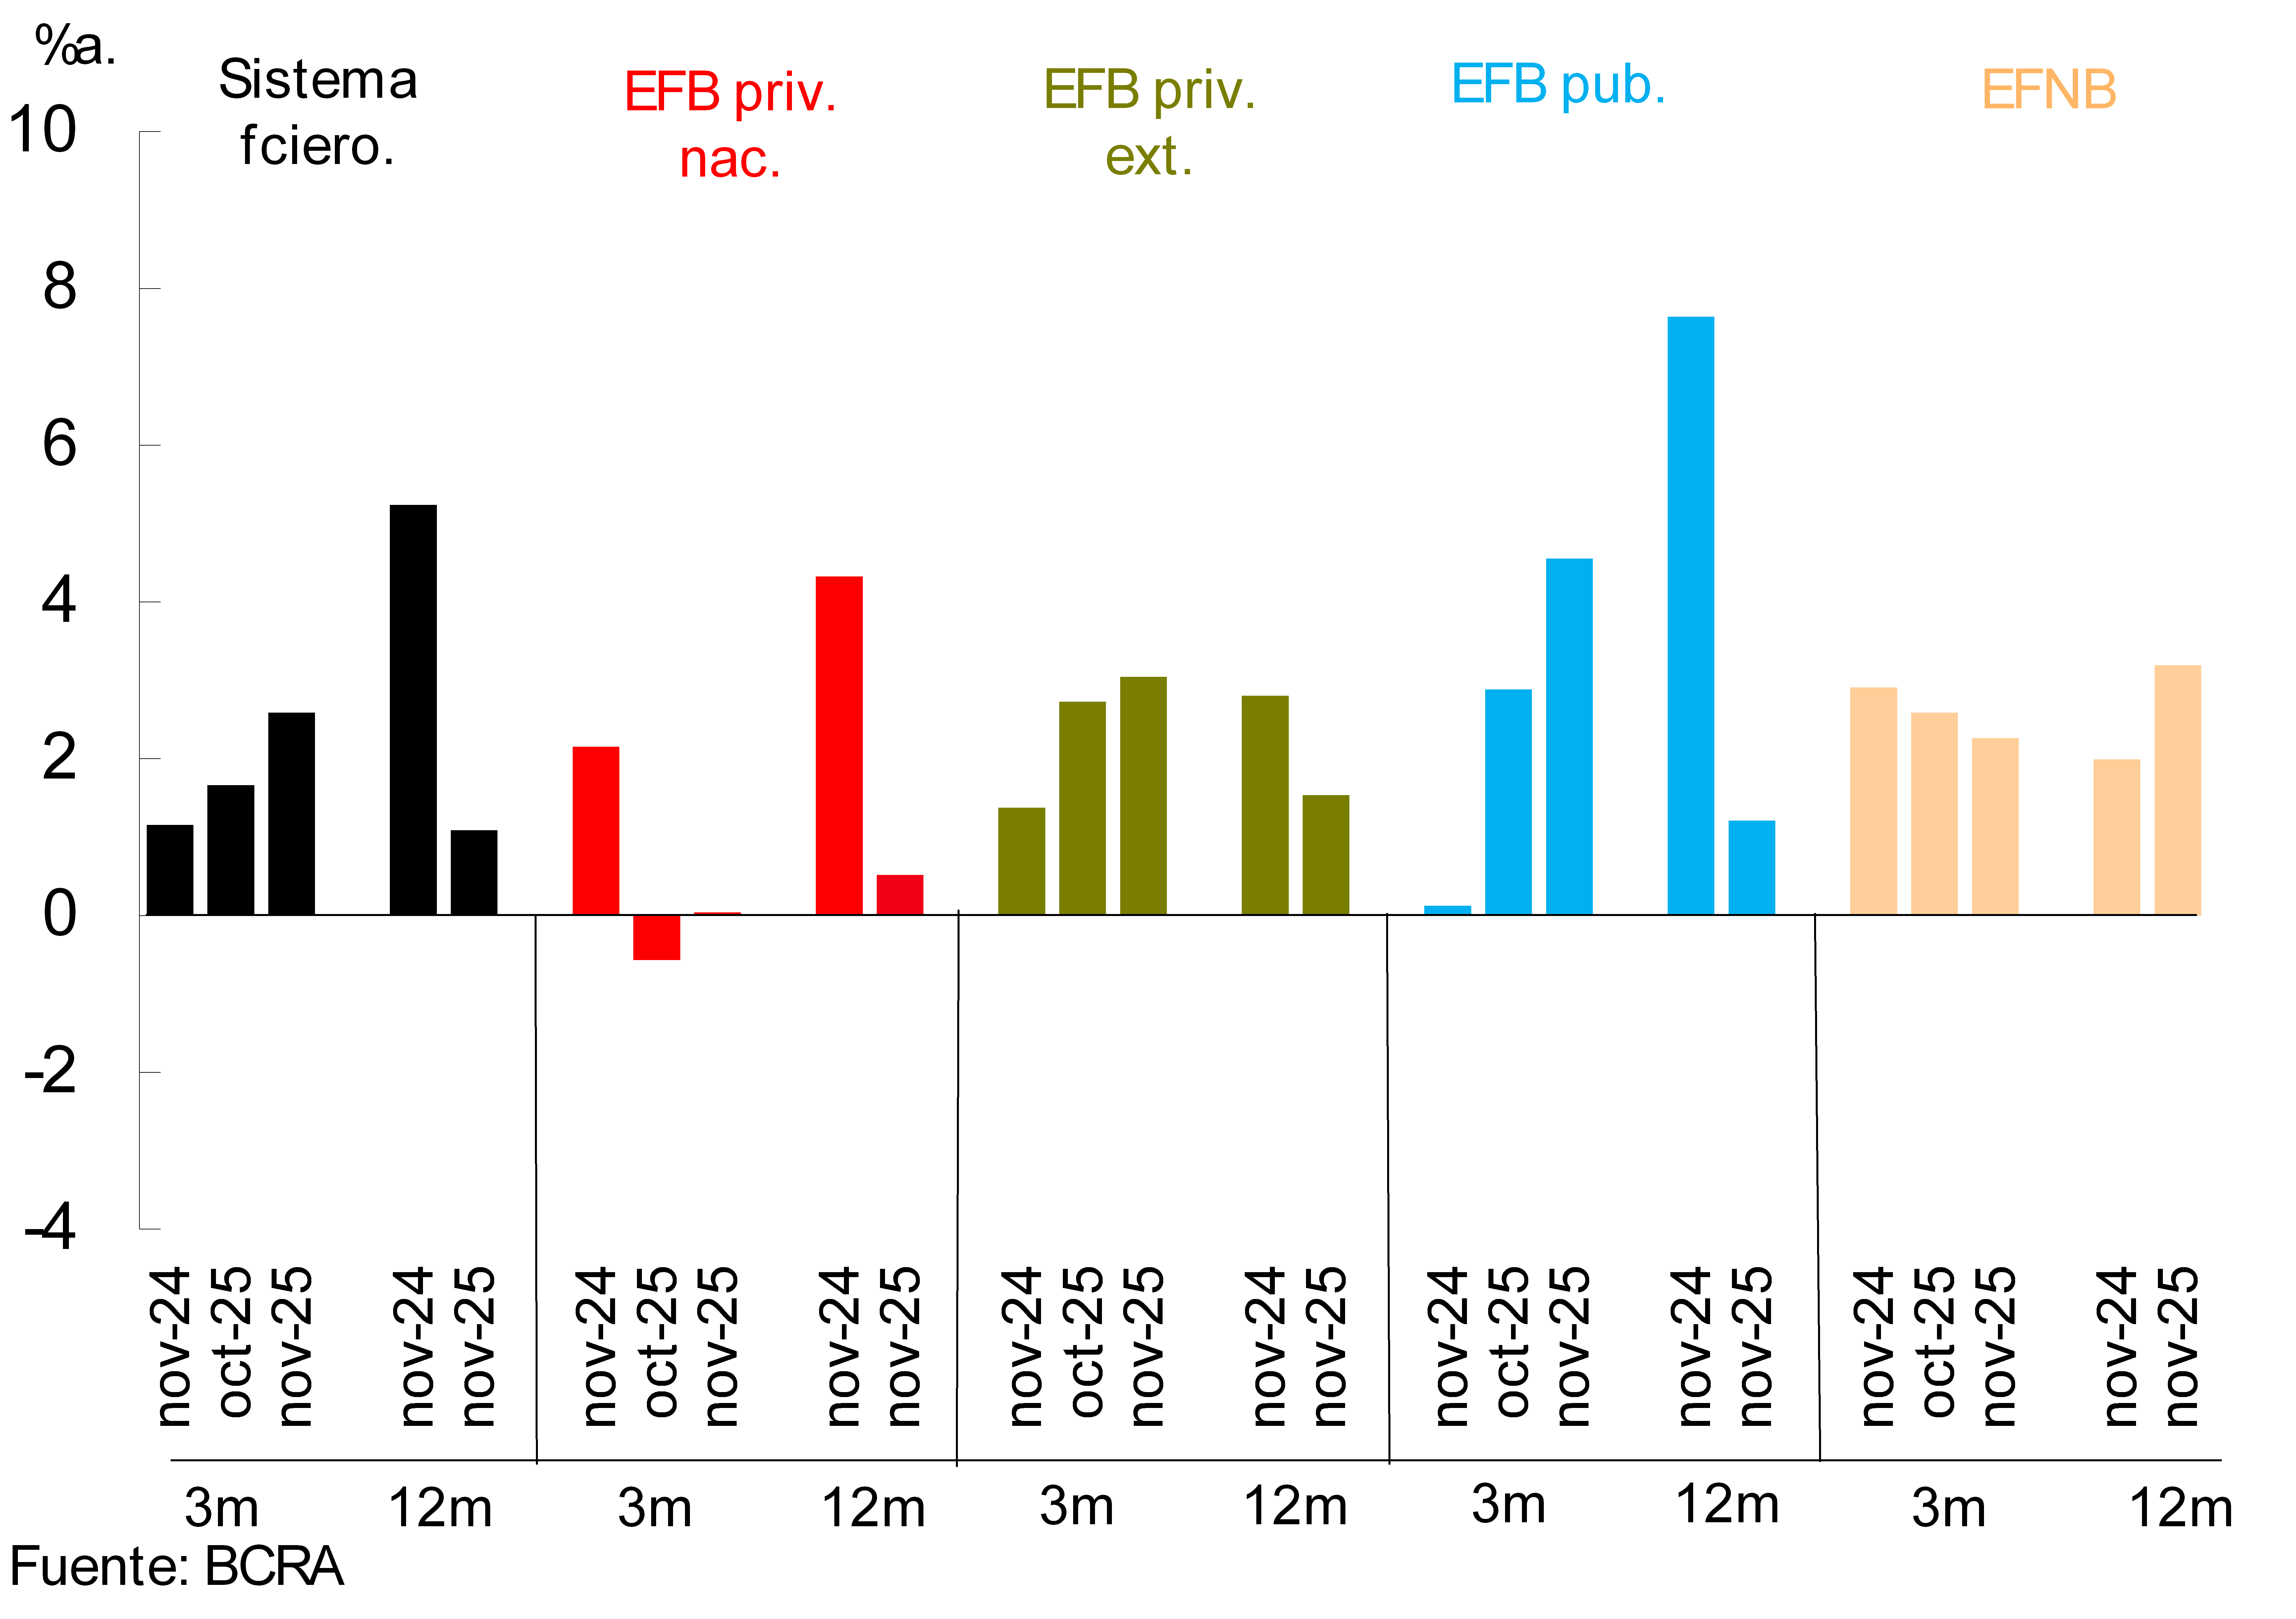
Given that in November the profitability of the institutions as a whole was practically neutral in terms of assets (0.1% annualized), in the last 12 months the ROA of the financial system stood at around 1.1% of assets (ROE of 4.7%)4, lower than the figure of a year ago (see Chart 12). The year-on-year reduction was explained by a lower real comprehensive financial margin (mainly lower premiums for passes and results for securities, mitigated by lower interest expenses on deposits) and an increase in charges for uncollectibility, partially offset by lower expenses in tax items.
V. Payment system
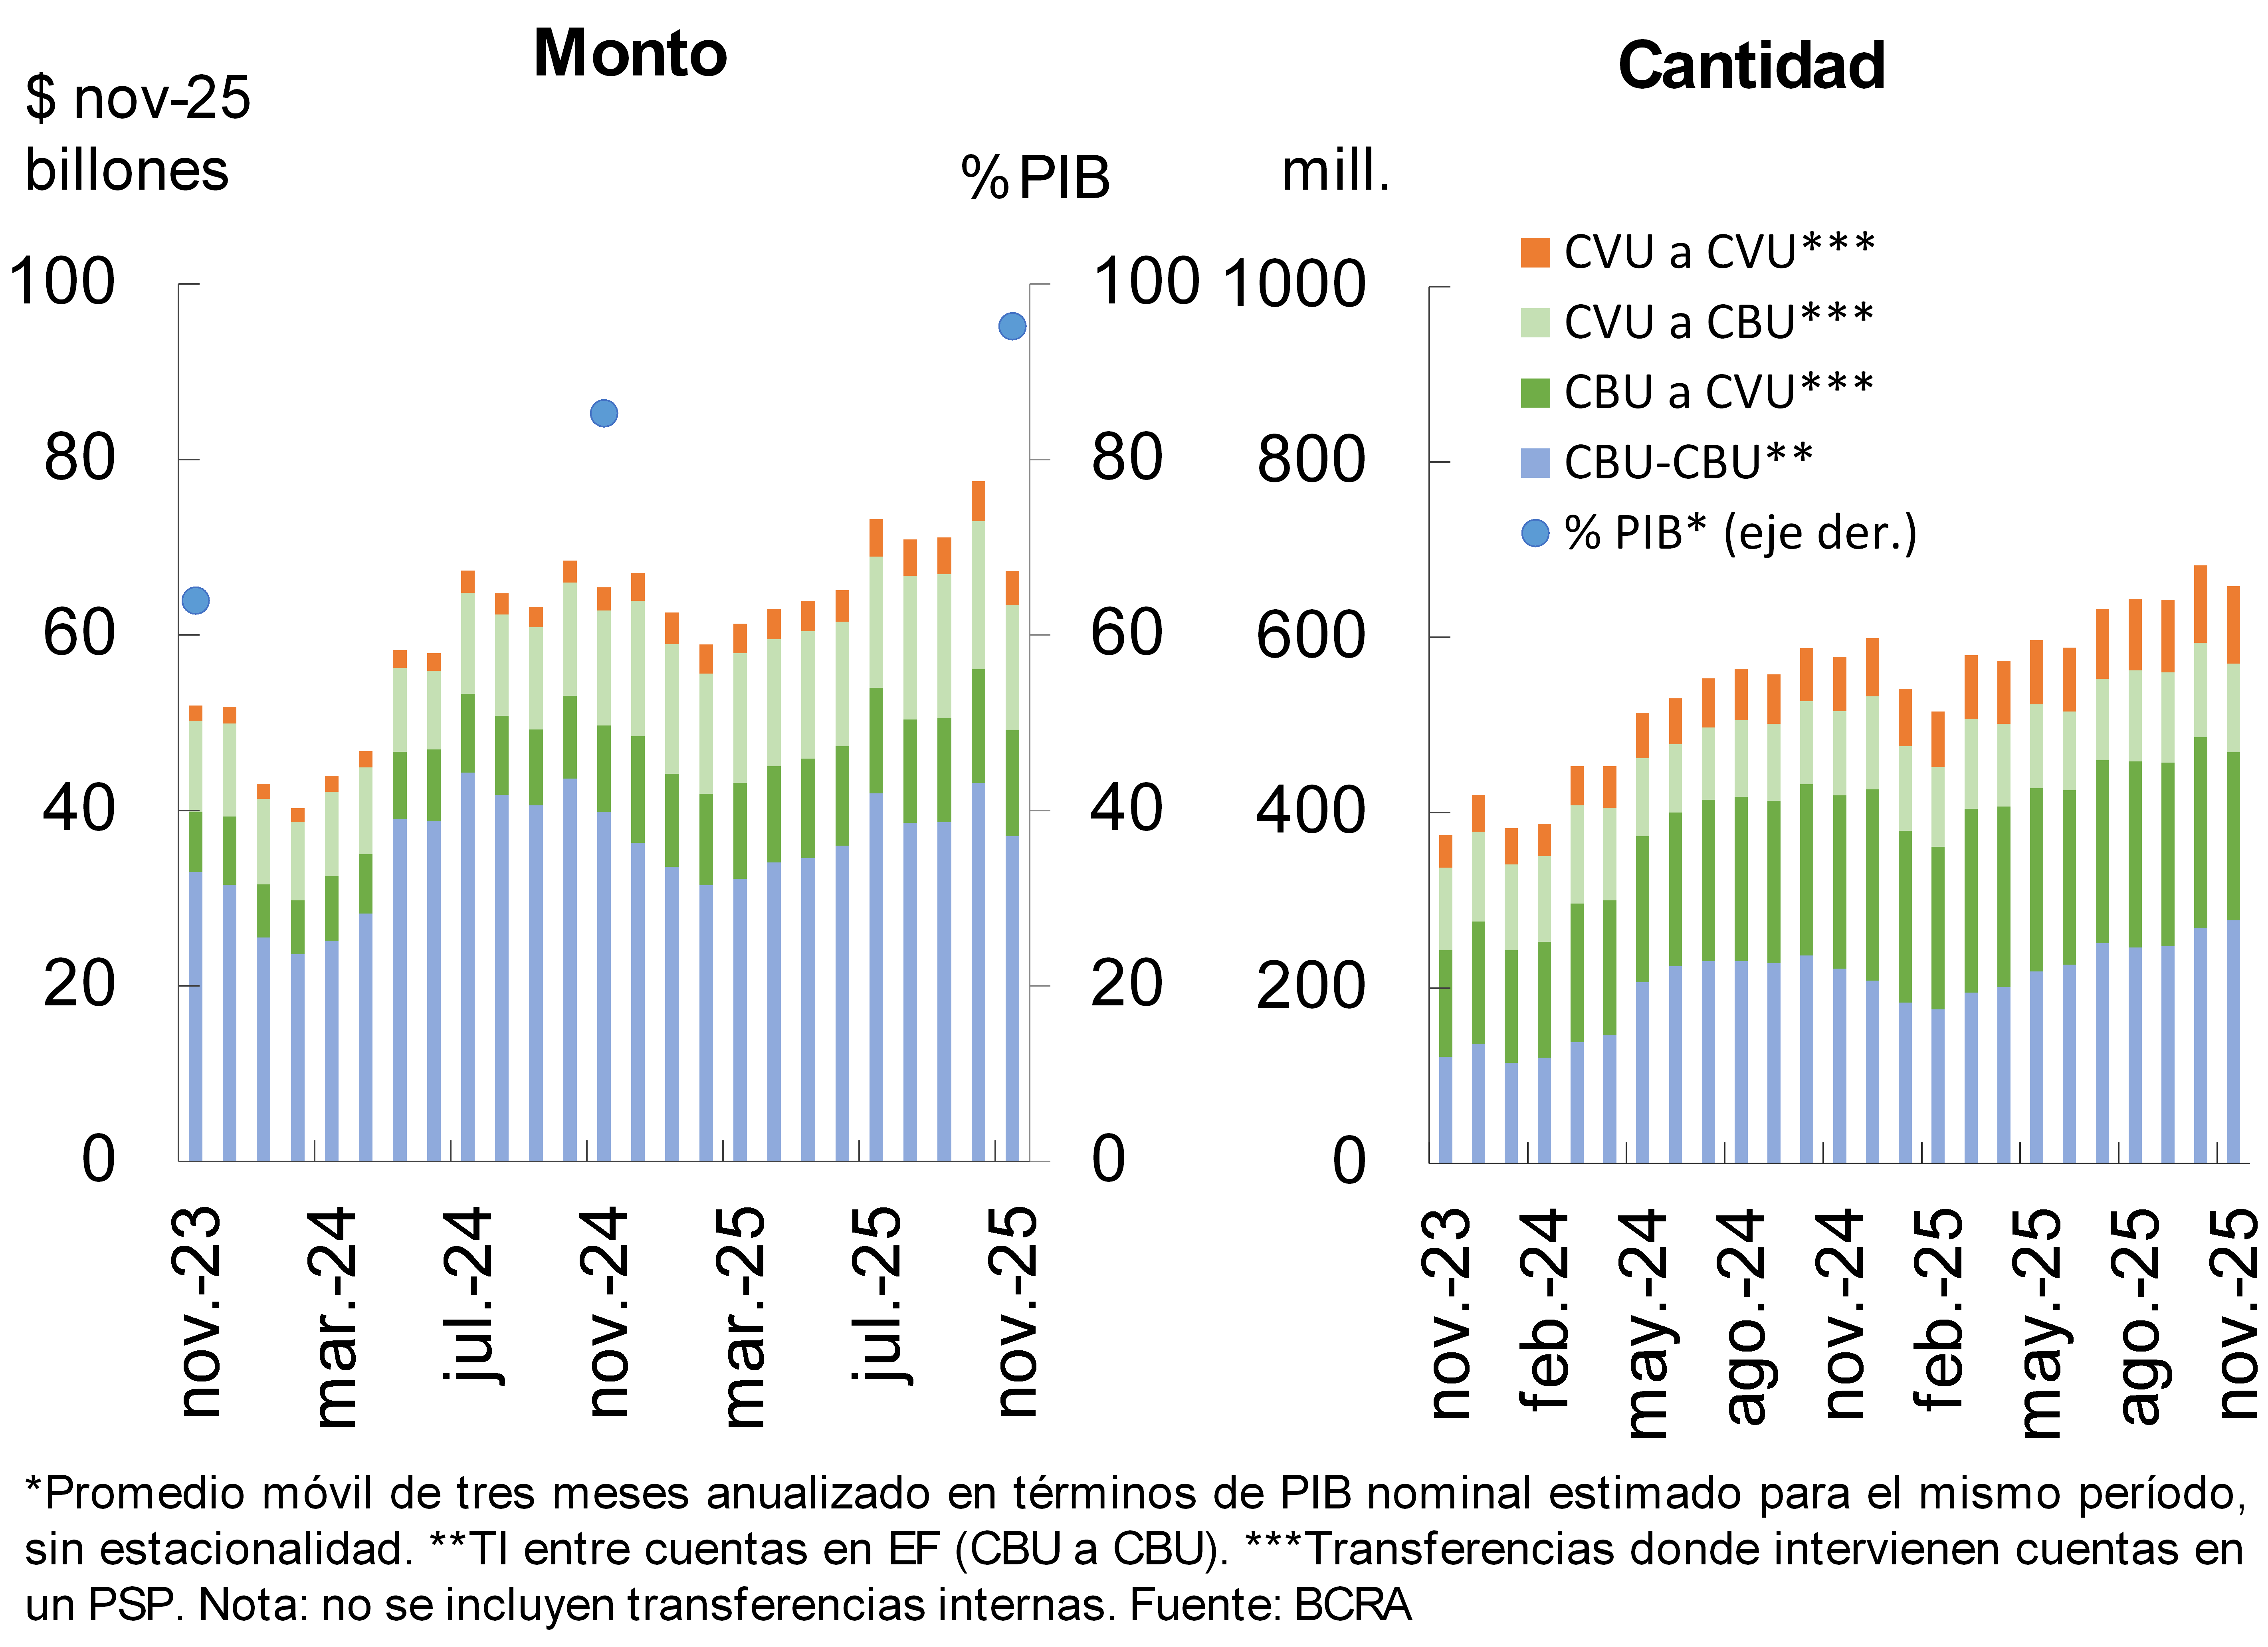
In November, immediate transfers (TI) were reduced compared to last month (-3.5% in quantities and -13.2% in real amounts), partly due to seasonal factors. However, in year-on-year terms, TIs exhibited increases of 14% in quantities and 2.9% in real amounts (see Graph 13). When considering the composition by type of account, operations involving CVUs showed the best relative performances: in terms of real amounts, transfers between CVUs grew 50.7% YoY, those from CBU to CVU 22.9% YoY and those from CVU to CBU 8.6% YoY. On the other hand, the amount of transfers made exclusively between CBU accounts – excluding intra-entity accounts – registered a year-on-year drop of around 7%in real terms 5. The total amount operated through IT – measured as the average of the last three months and annualized – represented 95.2% of GDP, that is, 9.9 p.p. more than in the same period of the previous year6.
Chart 13 – Immediate Transfers (IT)
In November, Payments with Transfers (PCT) interoperable through QR codes showed a slight monthly contraction (-2.2% in the amounts and -0.1% in the real amounts). However, in the year-on-year comparison, these operations maintained a significant growth, with rates of 35.9% in quantities and 45.8% in real amounts. Starting from a relatively limited weight within the payment system, PCTs continued to gain relevance. The amount traded in the last three months (annualized) was estimated at 2% of GDP, increasing 0.8 p.p. in relation to a year ago7.
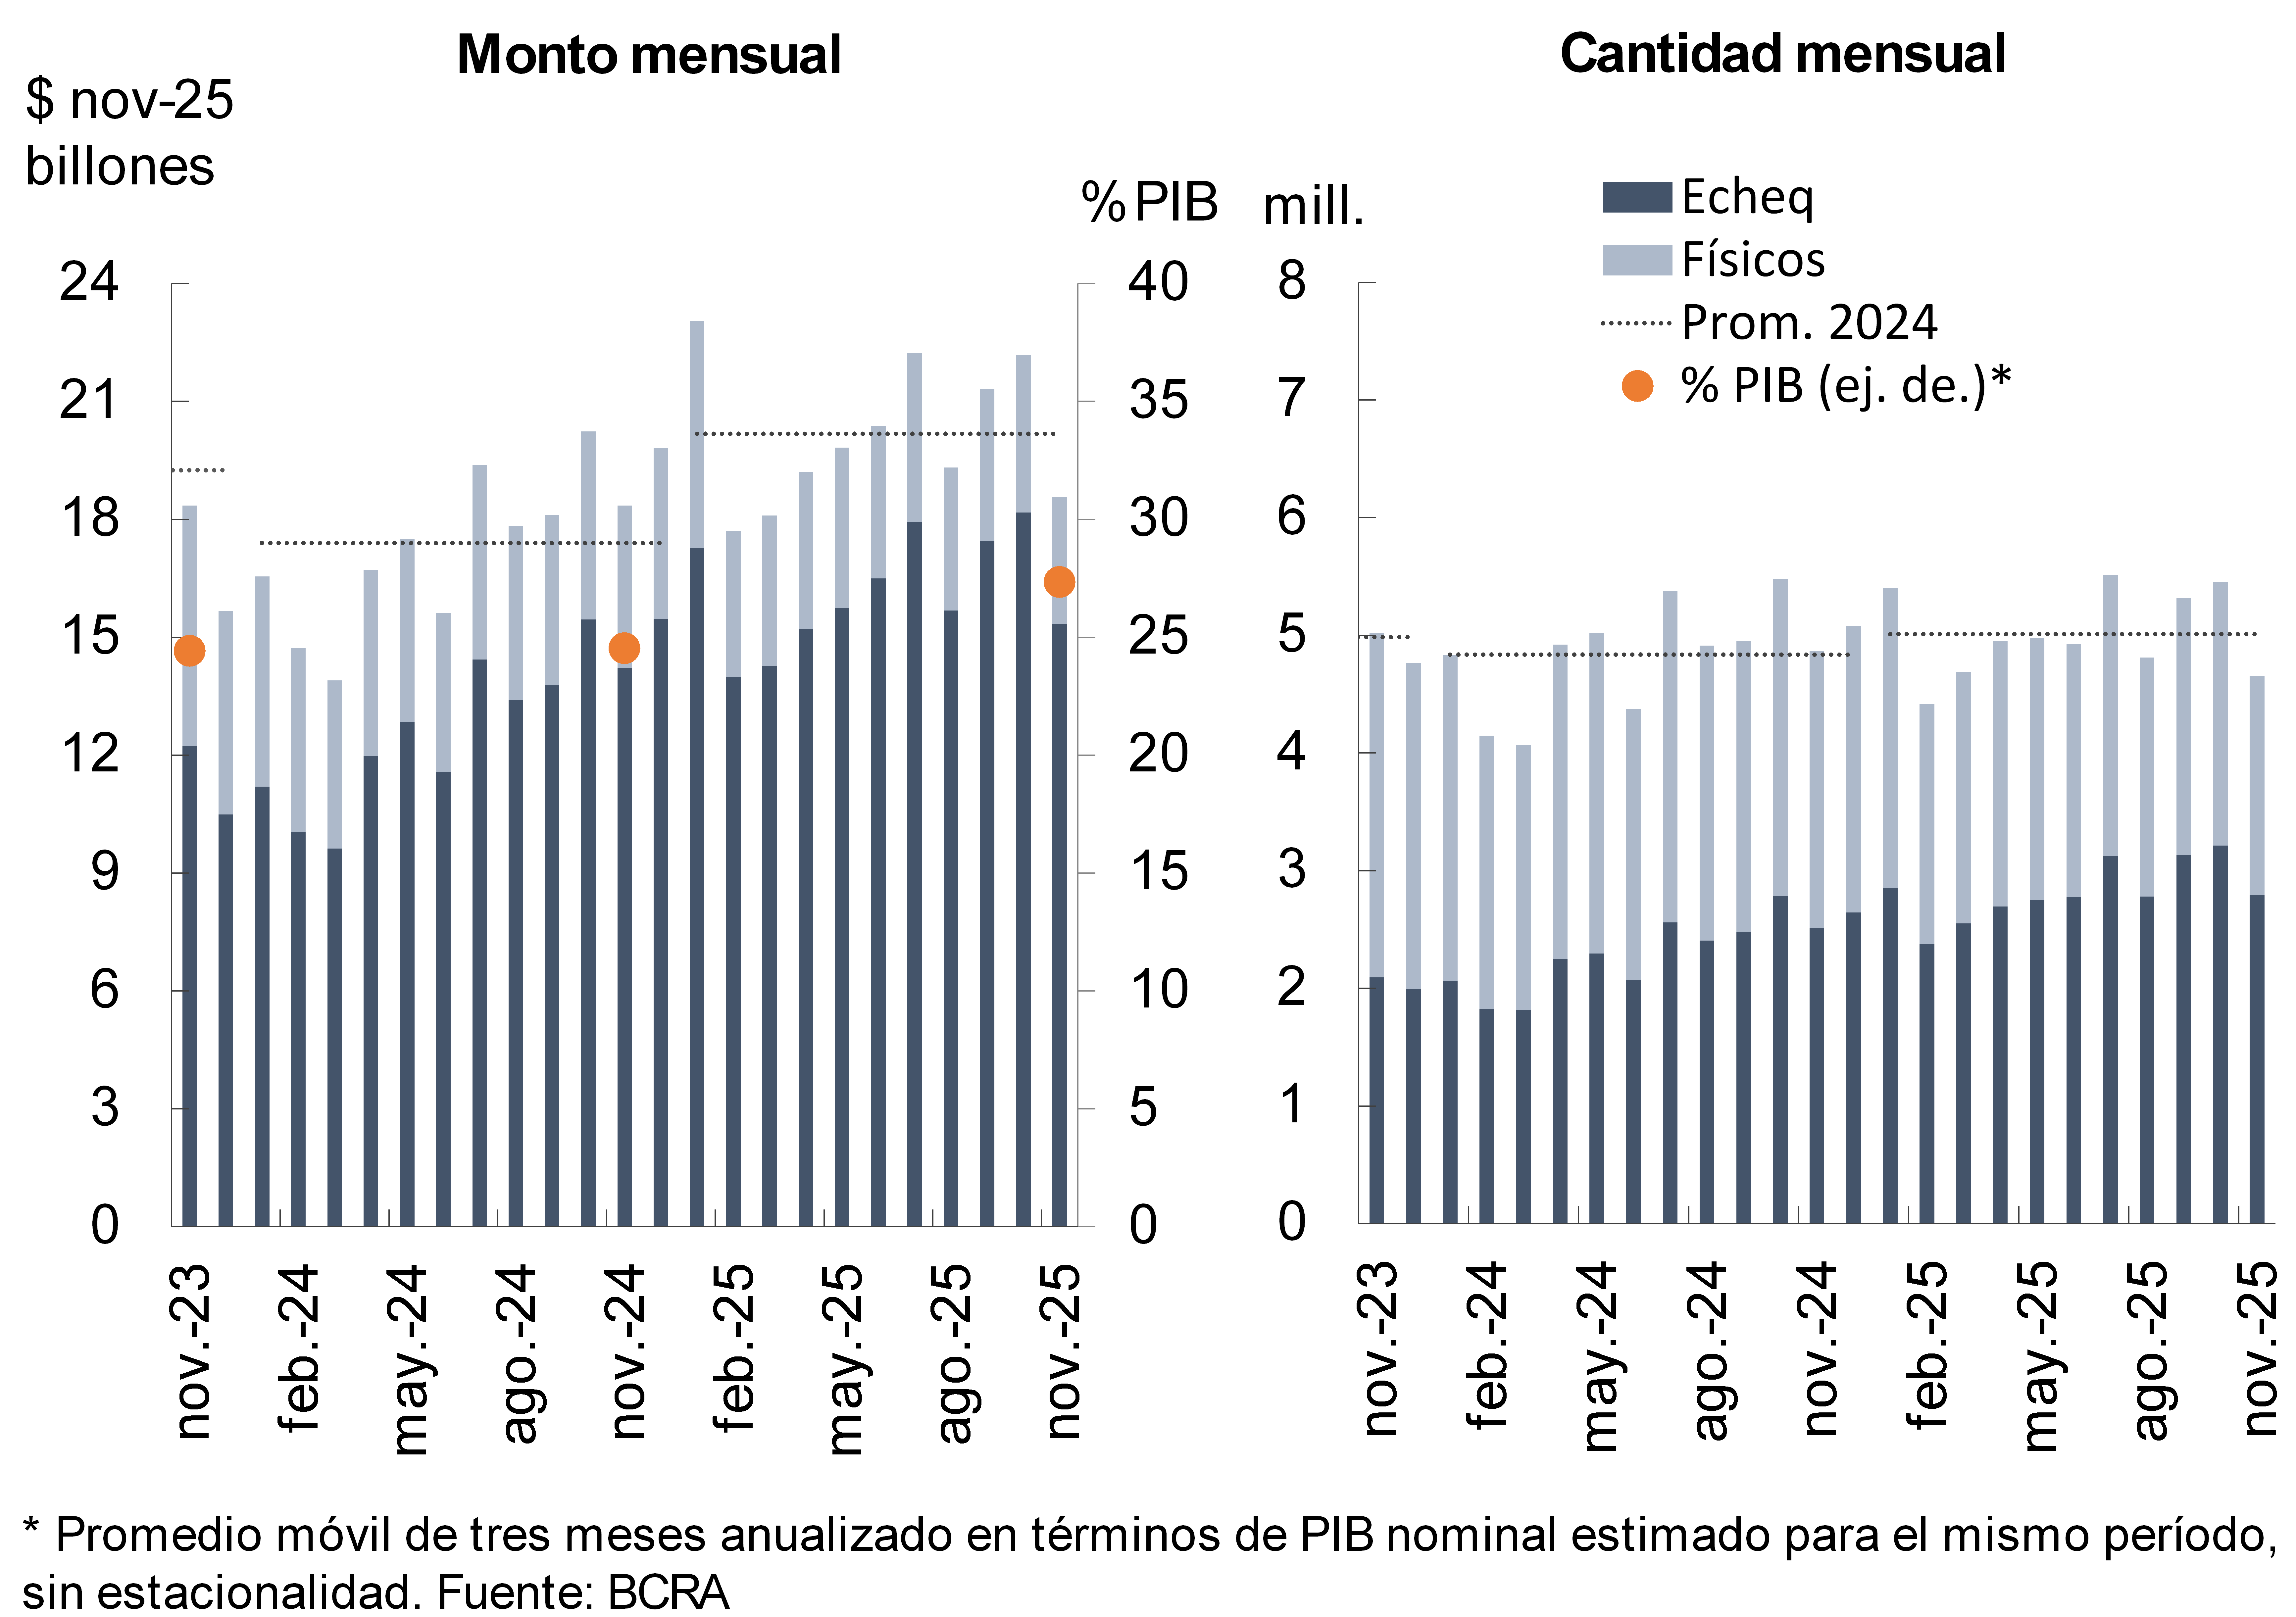
In November, the clearing of checks fell compared to the previous month, with falls of 14.7% in the amounts and 16.3% in the real amounts, partly associated with seasonal reasons (see Chart 14). In the year-on-year comparison, a disparate behavior was observed, with a 1.2% real increase in the amounts traded and a 4.4% contraction in the quantities. When disaggregated by type of instrument, operations with physical checks continued to show a downward pattern, standing 21% below the levels of a year ago (both in real amounts and in amounts). On the other hand, the ECHEQs maintained an expansive trajectory, with year-on-year increases of 11.1% in the quantities and 7.8% in the real amounts. As a result, the electronic modality reinforced its predominance within the compensation system, accounting for 60.1% of the amounts and 82.5% of the amounts traded in the month. Overall, the total value offset – considering physical and electronic checks – in the last three months (annualized) represented 27.3% of GDP, with an increase of 2.8 p.p. in year-on-year terms8.
Graph 14 : Check clearing
The ratio of bounced checks due to lack of funds to the total cleared increased in the month. In quantities, the indicator stood at 2.16% (+0.16 p.p. monthly), while in real amounts it reached 1.74% (+0.26 p.p. monthly). In the year-on-year comparison, both indicators were above the levels of the previous year: the ratio in quantities increased by 1.45 p.p., and that corresponding to real amounts advanced by 1.25 p.p.
References
1 In a context of growth in dollar deposits (see previous section).
2 In the last days of November (and the beginning of December) there was a real growth in interest-bearing demand deposits, whose main holders correspond to the “Financial Services Providers”. This dynamic was partly associated with a resolution of the CNV that established a maximum limit equivalent to 20% of the assets of the Money Market Mutual Funds for placements in sureties.
3 It considers availabilities (cash and current account at the BCRA), net active operations with the BCRA, the balance of the types of public securities that the entities compute as integration of Minimum Cash and the holdings of LECAP maturing in the next 3 months (until June 2025 it considered the fiscal liquidity bills -LEFI-).
4 Comprehensive total results in homogeneous currency.
5 In year-on-year terms through November, the amount of IT among CVUs increased 43%, while those among CBUs grew 24.7%. On the other hand, CBU to CVU operations registered a fall of 2.8% YoY, while CVU to CBU operations increased 4.9% YoY.
6 In November, the average value of IT was $102,244.
7 In November, the average value of PCTs through QR codes was $20,500.
8 In November, the average amount of cleared checks was $3.99 million (physical format: $1.74 million; ECHEQs: $5.49 million).
Share on


