About the use of inclusive language in this publication
The use of language that does not discriminate and that makes all gender identities visible is an institutional commitment of the Central Bank of the Argentine Republic. This publication recognizes the influence of language on ideas, feelings, ways of thinking and evaluation schemes.
This document has sought to avoid sexist and binary language. However, for ease of reading, resources such as “@” or “x” are not included.
Executive summary
• In a scenario marked by the effects of the second wave of the pandemic, in May the financial system continued to carry out its activities without disruptions, maintaining comfortable levels of solvency and liquidity. During the period, electronic means of payment continued to increase their relative importance in the usual operations of families and companies. In this context, the BCRA continues to direct its actions to deepen the dynamism of the payment system, especially through electronic tools, without losing sight of the security of operations.
• The amounts sent through immediate fund transfers expanded 15.1% in real terms in the last 12 months to June (latest information available). Within this segment, the dynamism of mobile banking stood out (54.6% year-on-year -y.a.- considering real amounts), driven by the greater use of electronic wallets. Debit card transactions through e-commerce increased 34.8% y.o.y. in real terms of amounts. For its part, the cleared value of electronic checks (ECHEQs) increased significantly in the last year (measured in real terms), almost tripling its value.
• The financial system continued to show high liquidity margins, both from a historical perspective and in relation to internationally recommended standards. In May, broad liquid assets accounted for 66.5% of total deposits (62.9% for items in local currency and 81.7% for the foreign currency segment), 0.4 p.p. and 0.7 p.p. more than last April and the same month of 2020, respectively.
• In May, capital integration in the financial system totaled 25.8% of risk-weighted assets (RWA), 0.5 p.p. more than last month and 2.9 p.p. higher year-on-year. The capital position (RPC minus regulatory requirements) of the aggregate of entities was around 210% of the capital requirement required in the month. The ratio between the capital position and credit to the private sector net of forecasts – an indicator associated with the sector’s capital adequacy in the event of a situation of credit risk materialization – reached 31.9% in May, well above the average of the last 10 years (13.8%).
• The balance of financing in pesos to the private sector fell by 0.8% in real terms in May (+2.4% nominal), accumulating a moderate year-on-year decrease. Within the framework of the Financing Line for Productive Investment (LFIP), the BCRA recently expanded the “Financing of investment projects” segment to all those companies – regardless of their size – that make investments aimed at increasing the production capacity of poultry and/or pork. In this way, access to credit continues to be facilitated for companies, contributing to the diversification of the meat consumption basket and the increase in net exports. Through the LFIP, more than $692,400 million have been granted until the end of June, reaching 147,809 companies.
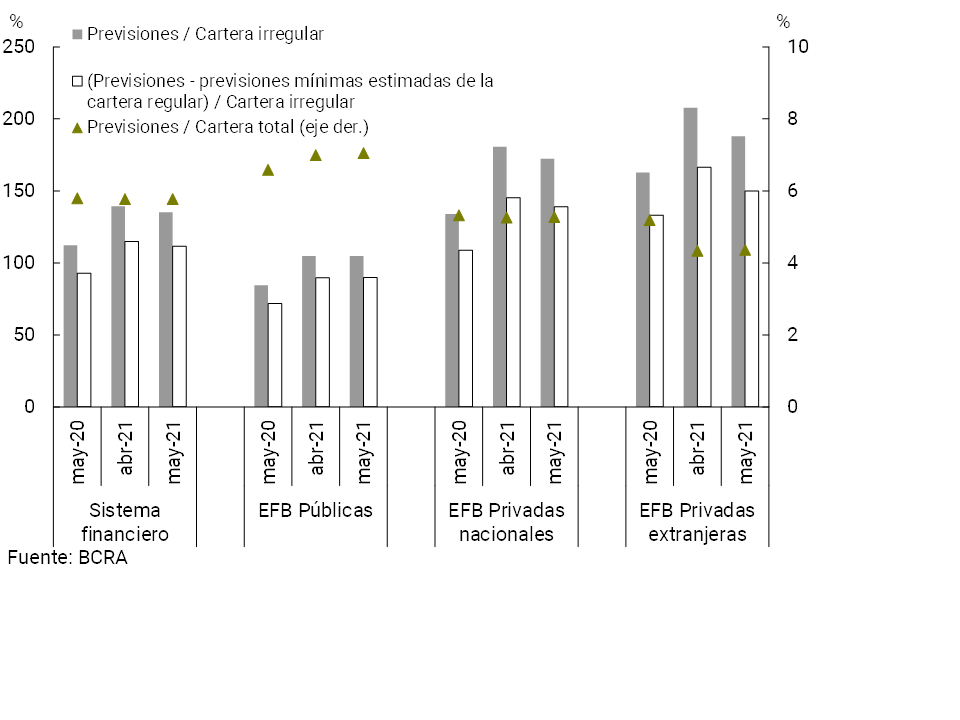
• The irregularity ratio of credit to the private sector for the aggregate financial system totaled 4.3% in the month, slightly above the April figure (-0.9 p.p. y.o.y.). This occurred in the context of the second month of the transition ordered by the BCRA for the classification of debtors carried out by financial institutions. From June they must return to using the pre-existing criteria as of 19/03/2020. At the same time, the policy of focusing financial relief measures on the sectors most affected by the pandemic was maintained, allowing financial institutions to incorporate at the end of the life of the credit the unpaid installments of assistance granted to debtors who are employers covered by REPRO II. For its part, the total forecasts of the financial system represented 5.8% of total credit to the private sector in May (in line with the record for April and the same month of the previous year).
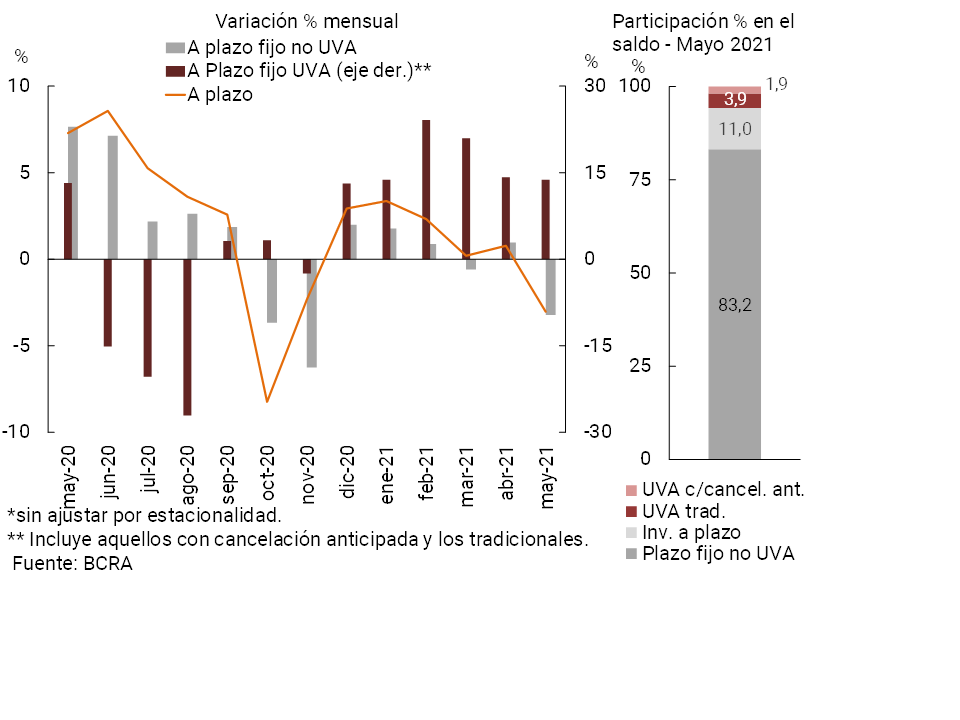
• In May, the balance of deposits in pesos in the private sector decreased by 0.5% in real terms (+2.8% nominal) compared to April, increasing by 0.8% in real terms year-on-year. In the month, demand accounts increased by 1.5% in real terms (+4.8% nominal), while term deposits fell by 3% in real terms (+0.2% nominal). UVA fixed terms continued to show a marked dynamism, with a monthly increase of 22.6% in real terms for those with early cancellation and 10% in real terms for traditional ones.
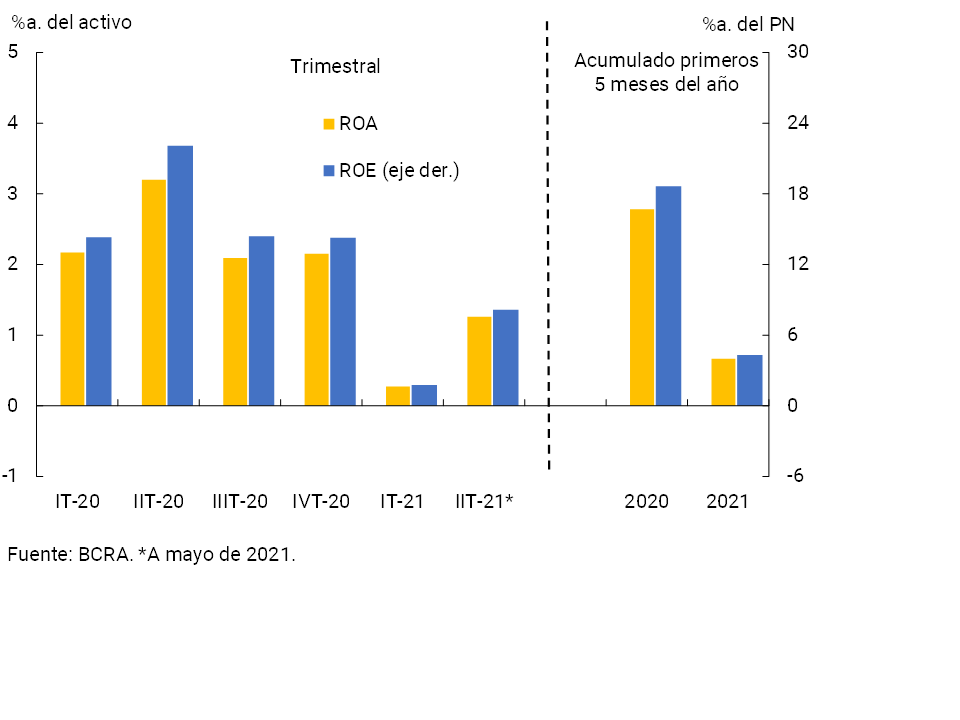
• In the first 5 months of the year, the system accumulated total comprehensive results equivalent to 0.7%y. -annualized- of assets (ROA) and 4.3%y. of net equity (ROE). These levels were lower than those recorded both in the same period last year and in the cumulative of all of 2020.
I. Financial intermediation activity
In May, financial intermediation activity with the private sector in national currency showed a weak performance. This occurred in a context in which the effects of the pandemic context are still being observed, which led to the adoption of targeted and transitory measures to avoid irreversible consequences for public health1, with effects on the mobility of citizens and on economic activity. Taking into account the main variations in the balance sheet of the financial system in homogeneous currency on the items in pesos2, during May the balance of credit to the private sector was reduced to a certain extent and public sector deposits increased. These movements took place in a scenario of increased liquidity in the broad sense of the financial system as a whole. On the other hand, considering the main variations in the aggregate balance sheet for the segment of items in foreign currency – expressed in the currency of origin – in May there was a fall in liquidity and an increase in private sector deposits, which were mainly applied to increase financing to the private sector in this denomination.
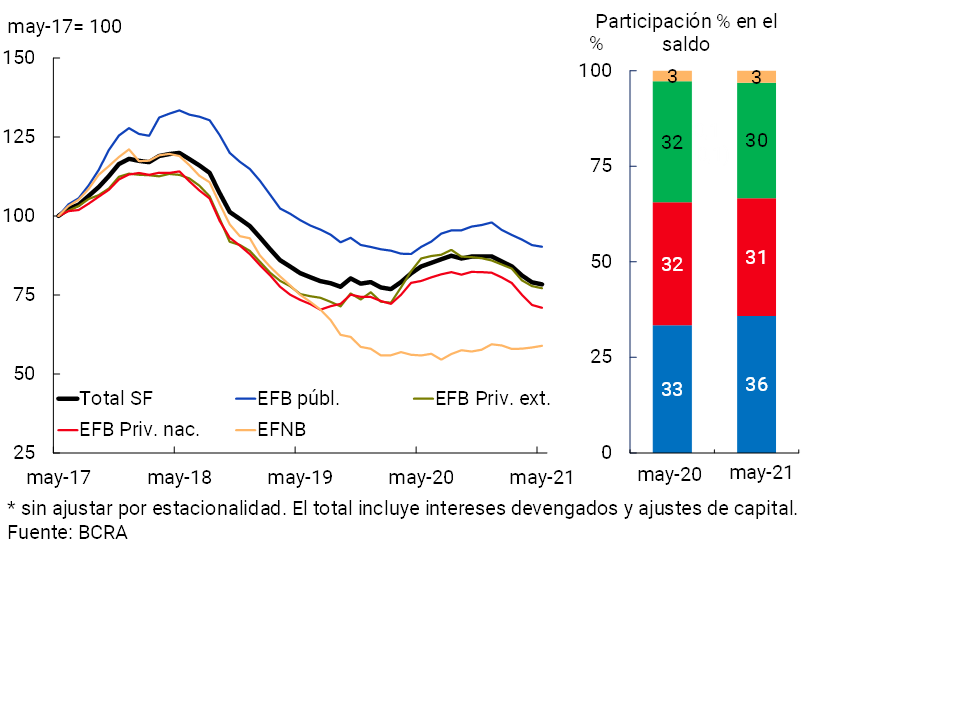
The balance of financing to the private sector in national currency fell by 0.8% in real terms in May (+2.4% nominal)3. Among credit assistance in pesos, there was a heterogeneous behavior in the month, with increases in pledges, advances and assets in financial leases and reductions in the rest of the credit lines. In year-on-year terms, the real balance of financing in pesos accumulated a fall of 6.7%, mainly explained by private financial institutions (see Chart 1)4.
Graph 1 | Credit balance to the private sector in pesos
In real terms*
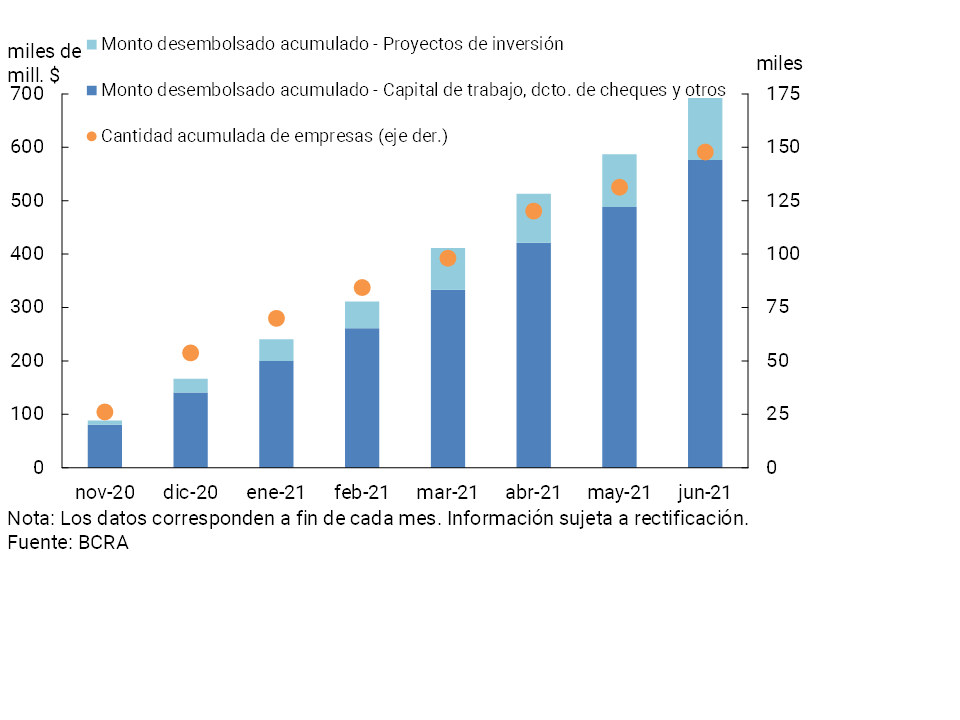
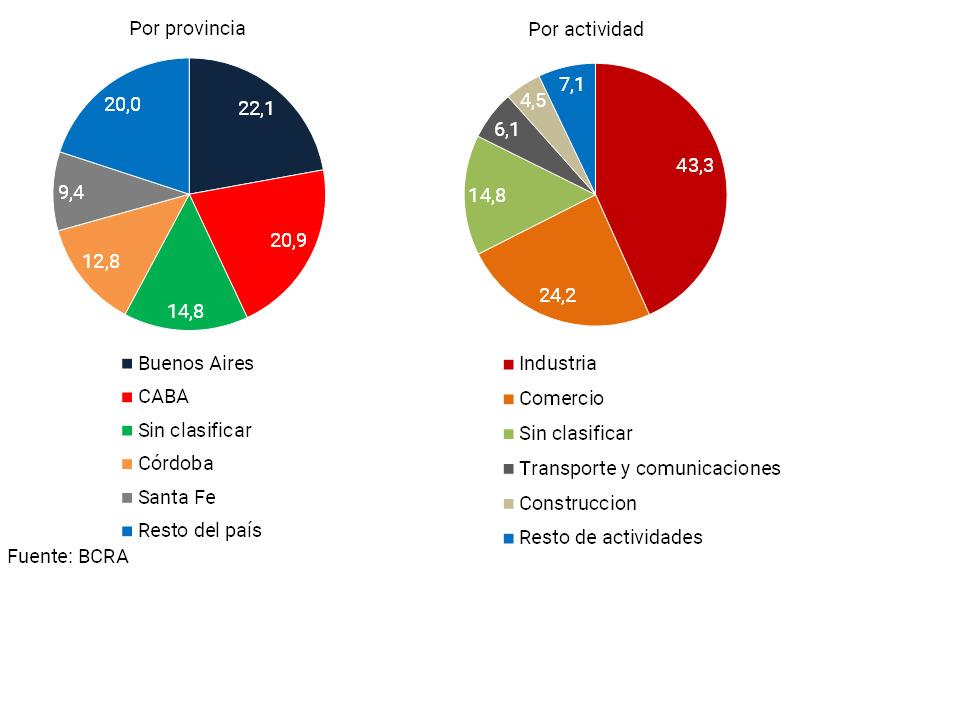
So far this year, the scope of the Financing Line for Productive Investment (LFIP) for MSMEs5 has continued to deepen. Since its implementation in mid-October 2020 and until the end of the first half of 2021, more than $692,400 million (40.5% corresponds to the 2021 quota) have been granted, reaching 147,809 companies (See Graph 2). It is estimated that 22.1% of the average daily balance in force as of May 2021 was granted to companies with tax domicile in the province of Buenos Aires, 20.9% in CABA, 12.8% in Córdoba and 9.4% in Santa Fe (see Graph 3). On the other hand, differentiating by type of activity, 43.3% of the balance was channeled to industry, followed by commerce with 24.2%.
Graph 2 | Financing Line for Productive Investment (LFIP) of MSMEs
Graph 3 | Financing Line for Productive Investment (LFIP) of MSMEs
Average daily cumulative balances as of May 2021
Within the framework of the LFIP, the BCRA recently extended the line of “Financing of investment projects” with an interest rate of 30% nominal annual to all companies (regardless of their size), which make investments aimed at increasing the productive capacity of chicken and/or porkmeat 6. In this way, access to credit continues to be facilitated for companies, contributing to the diversification of the meat consumption basket and the increase in net exports.
At the same time, through the line of financing at subsidized interest rates for companies registered in the “Emergency Assistance Program for Work and Production” (ATP)7, 20,940 loans have been granted for a total accumulated amount of $14,306 million until the end of June.
On the side of people who work as monotributistas and/or whose main sources of income are linked to self-employed activities, through the Zero Rate Credit Line8 , $66,492 million were granted until the end of June. In addition, through the Cultura9 Zero-Rate Credit line, almost $311 million have been granted.
According to the latest results of the Credit Conditions Survey corresponding to the second quarter of the year, the credit standards associated with SMEs were moderately relaxed at the aggregate level of the participating entities (remaining unchanged for large companies), as well as certain terms and conditions of the loans approved for this segment. On the side of perceived demand, in the period the group of banks surveyed observed a neutrality bias for SMEs (with a slight drop in large companies)10.
Considering the items in foreign currency, in May the credit balance in this denomination increased 6.4% compared to April – in currency of origin – mainly explained by export financing. In this scenario, the total balance of financing (including domestic and foreign currency) to the private sector remained unchanged in magnitude in the period (-0.1% real or 3.2% nominal), accumulating a fall of 11% in real terms in the last twelve months.
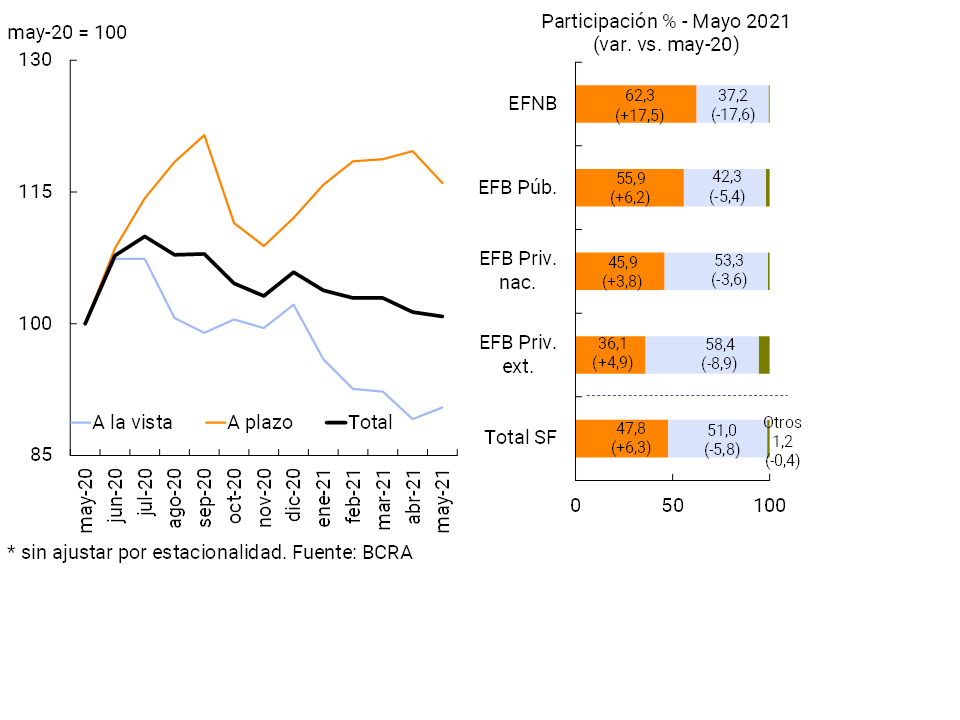
In relation to the funding of all financial institutions, in May the real balance of deposits in pesos of the private sector fell 0.5% compared to the previous month (+2.8% in nominal terms) (see Chart 4). Demand accounts increased by 1.5% in real terms (+4.8% nominal), while time deposits decreased by 3% in real terms (+0.2% nominal). Within this last segment, fixed terms in UVA showed a marked dynamism in the month – as they have been doing for six months – (see Graph 5), with an increase of 22.6% in real terms for those with early cancellation and 10% in real terms for traditional ones.
Figure 4 |Balance of private sector time deposits in pesos
In real terms*
Graph 5 | Balance of private sector time deposits in pesos – In real terms*
Monetary policy interest rates and nominal passive interest rates traded in pesos during May remained without significant variations compared to April. The ratio between the balance of time deposits and the balance of private sector demand accounts in national currency continued to be above the average recorded in recent years.
The balance of deposits in foreign currency of the private sector increased 1.3% in the month – in currency of origin – a performance reflected in all groups of financial institutions. In this context, in May total deposits (in domestic and foreign currency) of the private sector decreased 0.6% in real terms (+2.7% nominal).
In year-on-year terms, the balance of deposits in national currency of the private sector increased by 0.8% in real terms (+50% nominal YoY). In particular, time deposits in pesos in this sector increased by 16% YoY in real terms (+72.7% YoY nominal) in the period, while demand accounts fell by 9.5% YoY in real terms (+34.6% YoY nominal). For their part, public sector deposits in pesos grew 20.2% YoY (+78.9% YoY nominal). As a result, the balance of total deposits in pesos (considering both sectors) accumulated a growth of 4.8% real y.o.y. (+55.9% nominal y.o.y.). Taking into account all currencies and sectors, in May the balance of total deposits increased by 1.9% YoY in real terms (+51.6% YoY nominal).
II. Aggregate Balance Sheet Composition
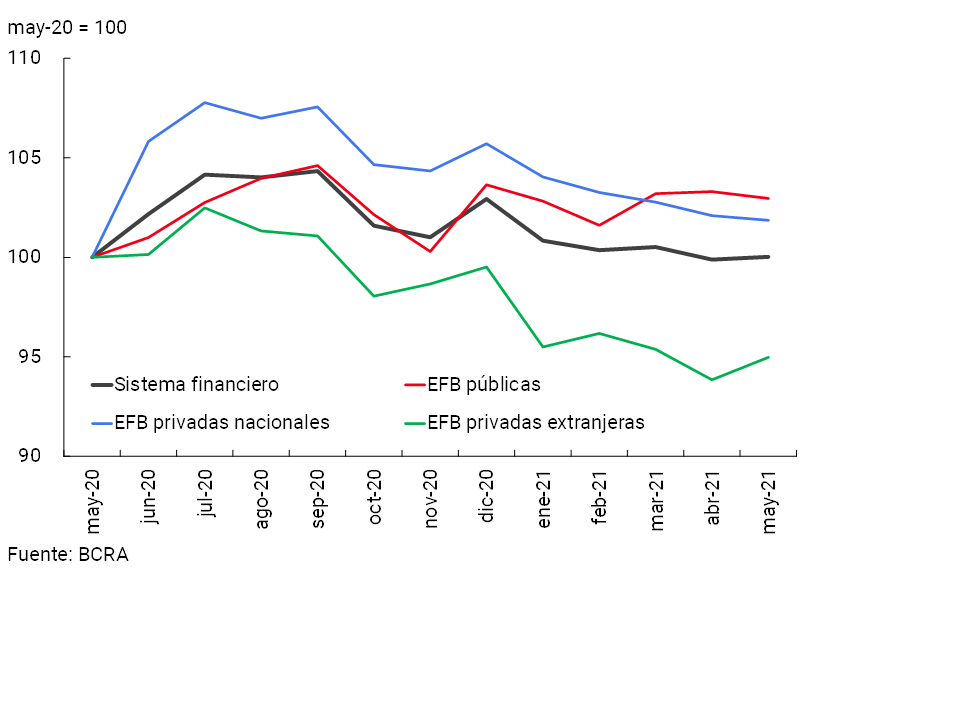
In May, the total assets of all financial institutions remained unchanged in magnitude in both monthly and year-on-year terms (see Chart 6). During the month, there were heterogeneous behaviors of assets by group of financial institutions: an increase in foreign private companies and reductions in the rest of the entities. In year-on-year terms, the assets of national public and private financial institutions showed the greatest relative dynamism.
Graph 6 | Total Asset Balance
In real terms
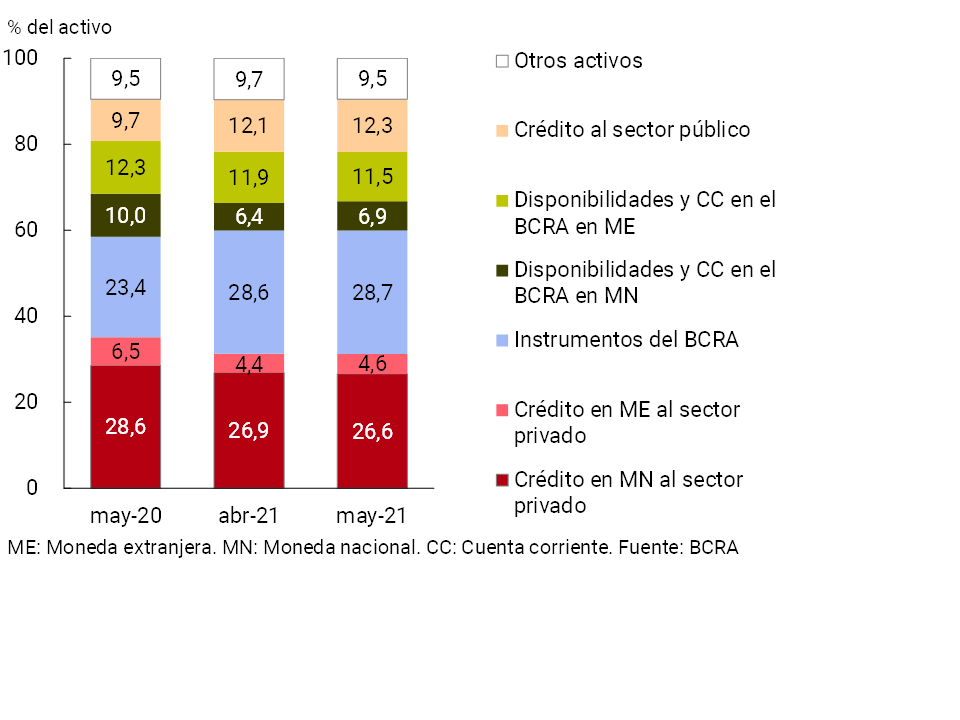
With respect to the components of the total assets of the financial system, in May the weighting of the balance of current accounts in the BCRA in national currency, financing to the public sector and credit to the private sector in foreign currency increased (see Chart 7). For its part, the relative importance of the current account balance in foreign currency that the entities have with this institution and of the financing in pesos to the private sector was reduced in the period.
Figure 7 | Composition of total assets
Financial system – Share %
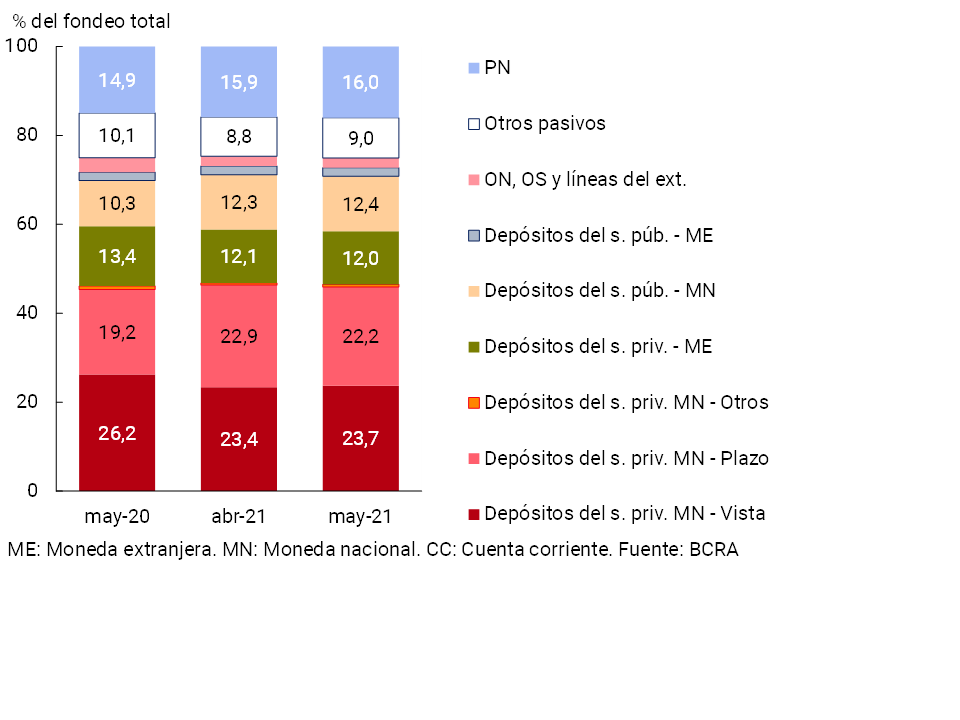
In relation to the composition of bank funding, the most relevant movements in the month were due to the greater weighting of the balance of demand accounts in pesos in the private sector and the relative decrease in time deposits in the same currency of said sector (see Chart 8).
Figure 8 |Total system funding composition
In % of total funding (liabilities + equity)
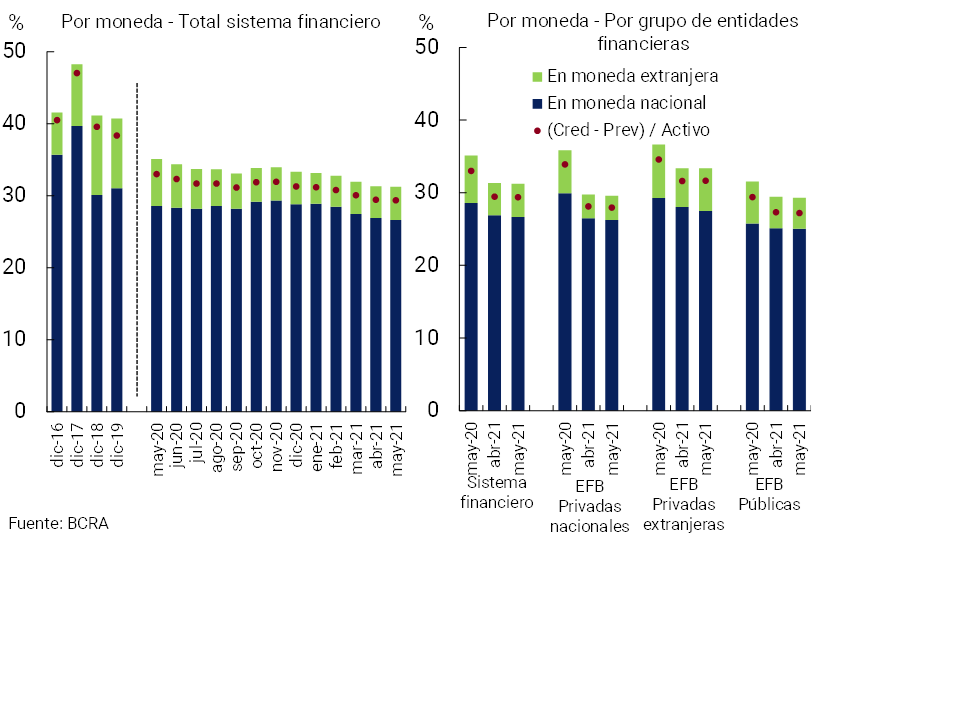
In May, the foreign currency assets of all financial institutions accounted for 18.6% of total assets, down 0.3 p.p. compared to last month and 2.5 p.p. in year-on-year terms. Liabilities in the same denomination totaled 16.9% of total funding (liabilities and equity) in the period, presenting a similar evolution, both in the monthly and year-on-year comparison. The behavior of assets and liabilities in foreign currency in total assets was mainly explained by the increase in total assets that exceeded the increase in assets and liabilities in foreign currency. Including forward purchase and sale of foreign currency (off-balance sheet) transactions, the spread between assets and liabilities in this denomination fell by 1.9 p.p. of regulatory capital at the systemic level in the month, to around 7.4% (-3.2 p.p. y.o.y.) (see Graph 9).
Figure 9 | EM Assets – EM Liabilities + EM Forward Position (financial system)
III. Portfolio quality
In May, the gross exposure of the financial system to the private sector (including domestic and foreign currency) stood at 31.2% of total assets11, slightly below the value recorded in the previous month (-3.9 p.p. y.o.y.). This ratio stood at 26.6% when considering only financing in pesos, 0.3 p.p. less than in the previous month (-1.9 p.p. y.a.) (see Graph 10). On the other hand, credit to the private sector in foreign currency increased its share of total assets by 0.2 p.p. compared to the previous month to 4.6%, remaining below the May 2020 figure (-1.9 p.p. y.o.y.).
Figure 10 | Credit balance to the Private Sector / Assets
Between April and May, the BCRA established a transition schedule for the classification of debtors by financial institutions. Until March 2021, the periods of admitted arrears for situations 1, 2 and 3 were to be increased by 60 days12, a period that was reduced to 30 days for April and May of this year, while as of June the pre-existing criteria as of 03/19/2020are used again 13. At the same time, the policy of focusing financial relief measures on the sectors most affected by the pandemic is maintained, allowing financial institutions to incorporate at the end of the life of the credit the unpaid installments of assistance granted to debtors who are employers covered by REPRO II. In this context, the irregularity ratio of credit to the private sector for the aggregate financial system rose to 4.3% in May, slightly above the April figure (-0.9 p.p. y.o.y.), a performance mainly explained by private financial institutions (see Chart 11).
Figure 11 | Irregularity of credit to the private sector
Irregular financing / Total financing (%)
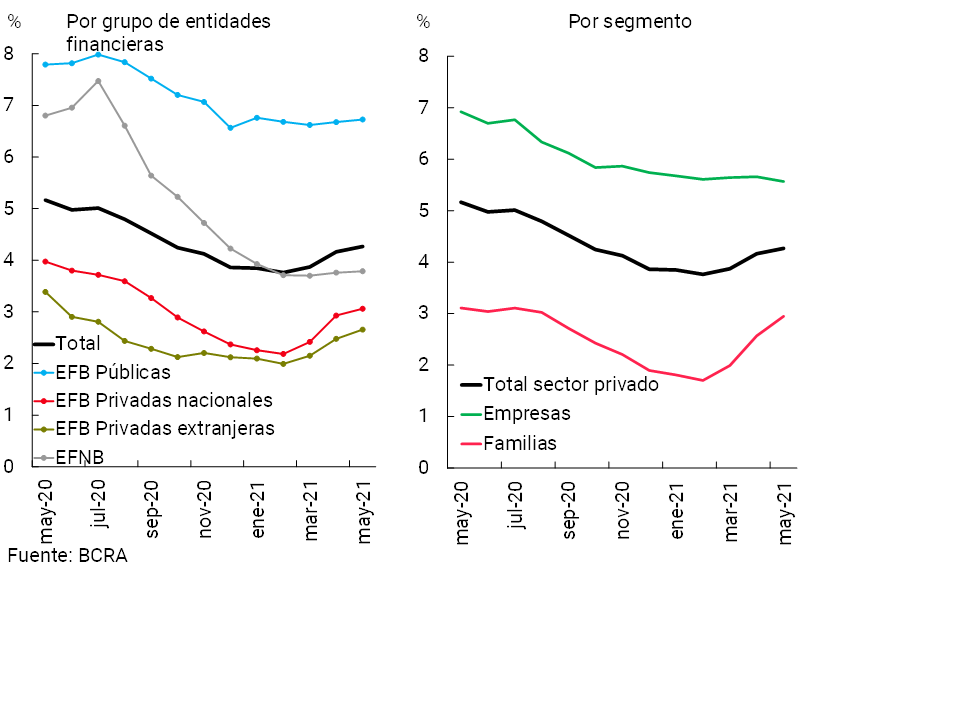
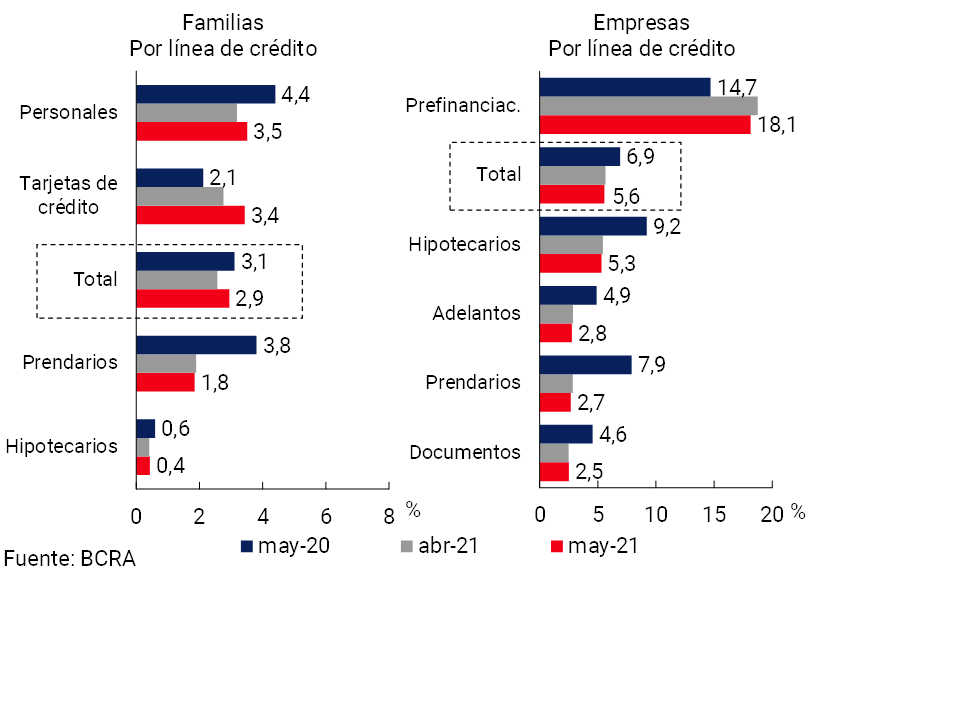
The irregularity of loans to households stood at 2.9% in the period (see Graph 12), 0.4 p.p. above the level of April (-0.2 p.p. y.o.y.). The monthly performance was mainly driven by the increase in delinquencies on consumer loans (credit cards and personal loans). For its part, the NPL indicator for loans to companies stood at 5.6% in May, slightly below last month’s figure (-1.4 p.p. y.o.y.). The monthly decrease in the delinquency of pre-financing for exports largely explained the performance of the corporate segment.
Figure 12 | Irregularity of credit to the private sector
Irregular financing / Total financing (%)
The forecasts accounted for by the aggregate financial system represented 5.8% of total credit to the private sector in May, in line with the figure for April and the same month of the previous year (see Chart 13). The total forecasts in terms of the irregular portfolio stood at 135.3% in the month (-4 p.p. monthly and +23.1 p.p. y.o.y.). In May, the balance of regulatory forecasts attributable to the non-performing loan portfolio (following the criteria of the minimum regulatory forecasts for uncollectibility risk) totalled 111.5% of the non-performing portfolio.
Figure 13 | Credit to the private sector and forecasts
By Entity Group
IV. Liquidity and solvency
The aggregate financial system maintains high liquidity and solvency margins, both from a historical perspective and in terms of internationally recommended regulatory standards.
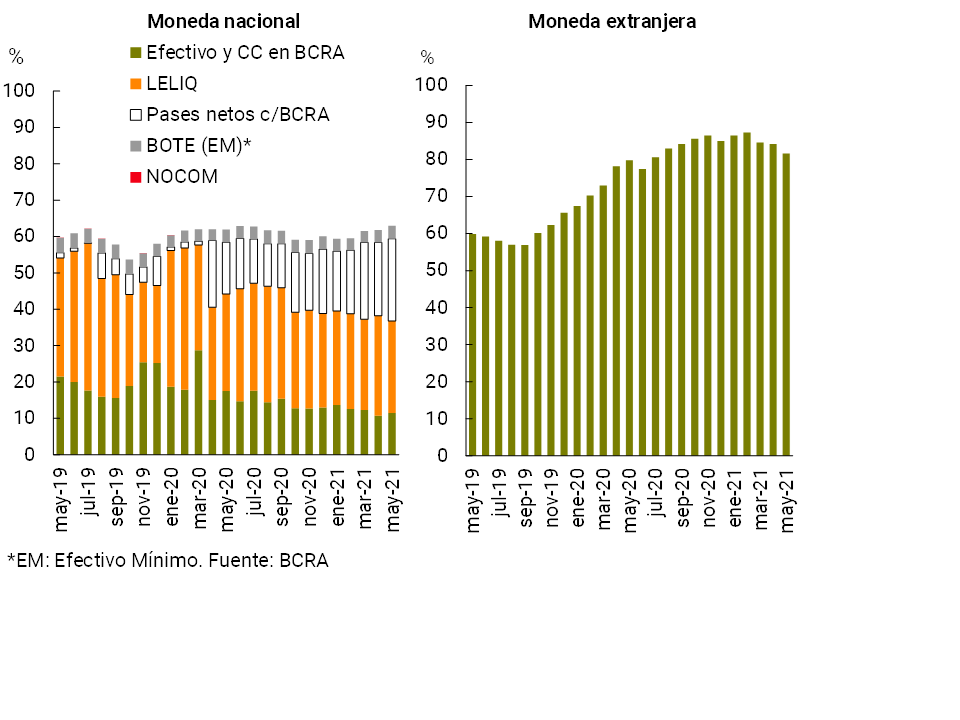
In May, broad sense liquidity14 increased by 0.4 p.p. of total deposits to represent 66.5% (+1.2 p.p. to 62.9% considering items in pesos and -2.5 p.p. to 81.7% for the foreign currency segment, see Chart 14). During the month, the weighting of net passes with the BCRA and of the current accounts that financial institutions have in this Institution increased, while the relevance of LELIQ balances decreased. In the last year, the broad liquidity indicator increased by 0.7 p.p. of total deposits.
Figure 14 | Liquidity of the financial system
In % of deposits
Considering the sector’s solvency indicators, in May the capital integration (RPC) of the aggregate of entities totaled 25.8% of risk-weighted assets (RWA), 0.5 p.p. more than last month’s figure (see Chart 15). Tier 1 capital – the one with the greatest capacity to absorb potential losses – continued to concentrate most of the total regulatory capital, representing 93% at the systemic level as of May. Likewise, the surplus capital position (RPC net of the regulatory capital requirement) in terms of the regulatory requirement stood at 210% in the month for the financial system as a whole, remaining at comfortable levels in all groups of entities.
Figure 15 | Integration of regulatory capital
By financial institution group
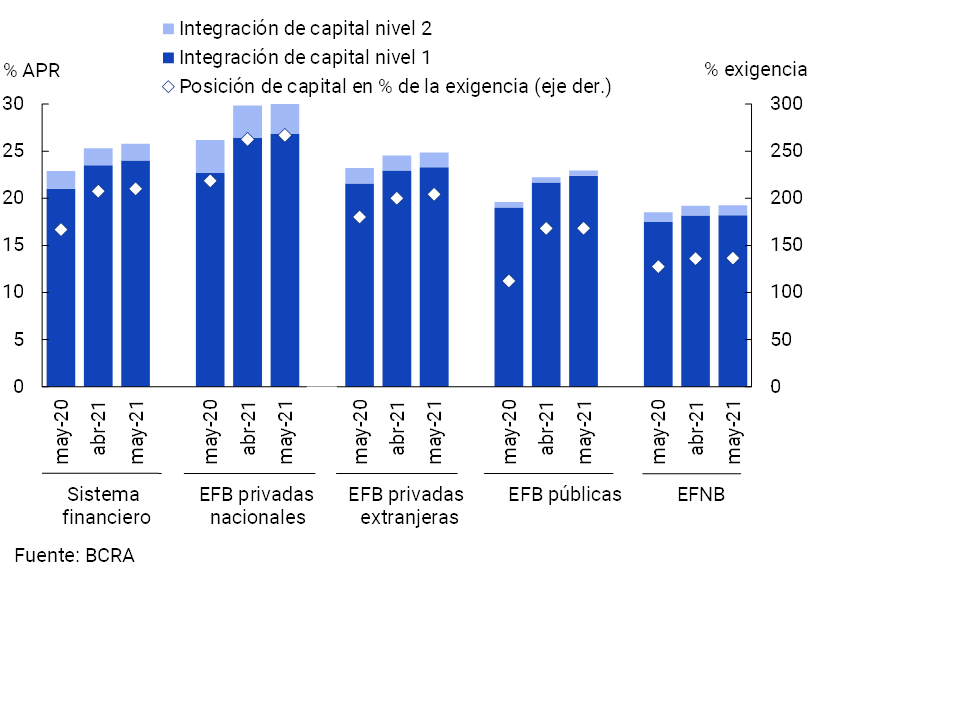
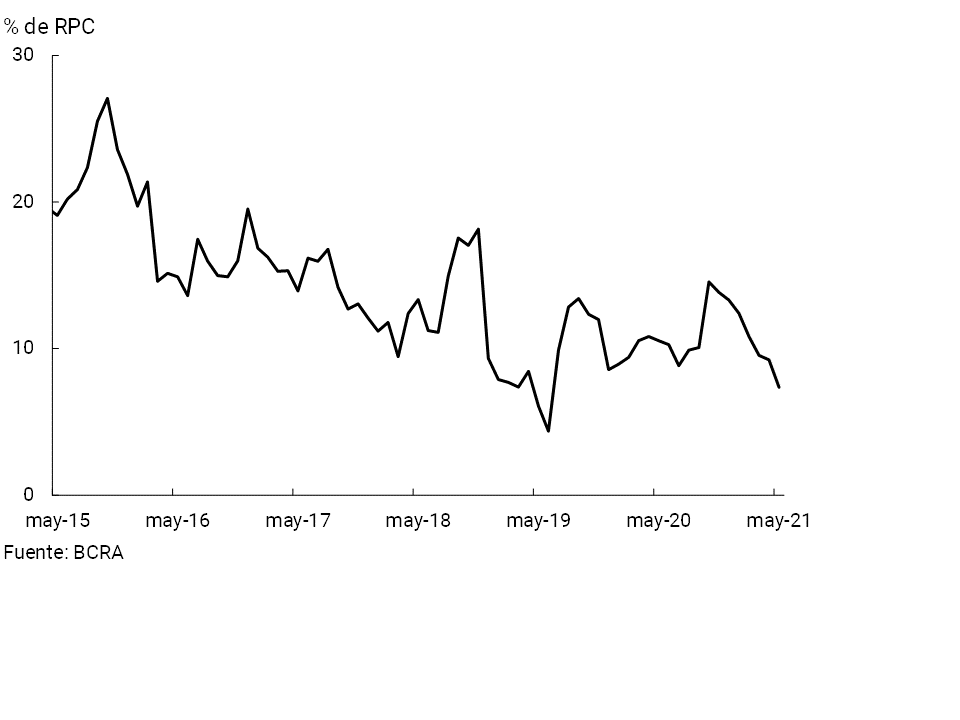
The relationship between the surplus capital position and credit to the private sector net of forecasts provides an idea of the sector’s capital adequacy in the event of a situation of extreme and low-probability credit risk materializing. In May, this ratio reached 31.9%, 0.7 p.p. and 7.8 p.p. more than in April and in a year-on-year comparison, respectively. This level was well above the average of the last 10 years (13.8%)15.
In May, the financial system accrued a positive comprehensive total result in homogeneous currency higher than in April, accumulating in the first five months of 2021 profits equivalent to 0.7% y/y of assets and 4.3% y/y of equity (see Chart 16). These levels were lower than those recorded a year ago (-2.1 p.p. and -14.3 p.p. in terms of assets and net worth, respectively), thus continuing the trend of lower profitability indicators observed since the middle of last year. The year-on-year performance included, among other factors, the effect of greater monetary losses, an increase in the cost of funding for deposits in pesos, lower interest income in pesos and a greater weight of certain tax burdens. This dynamic was partially offset by higher income from premiums for passes, lower income tax accrual and lower administrative expenses, among others.
Figure 16 | Comprehensive total profit in homogeneous currency of the financial system
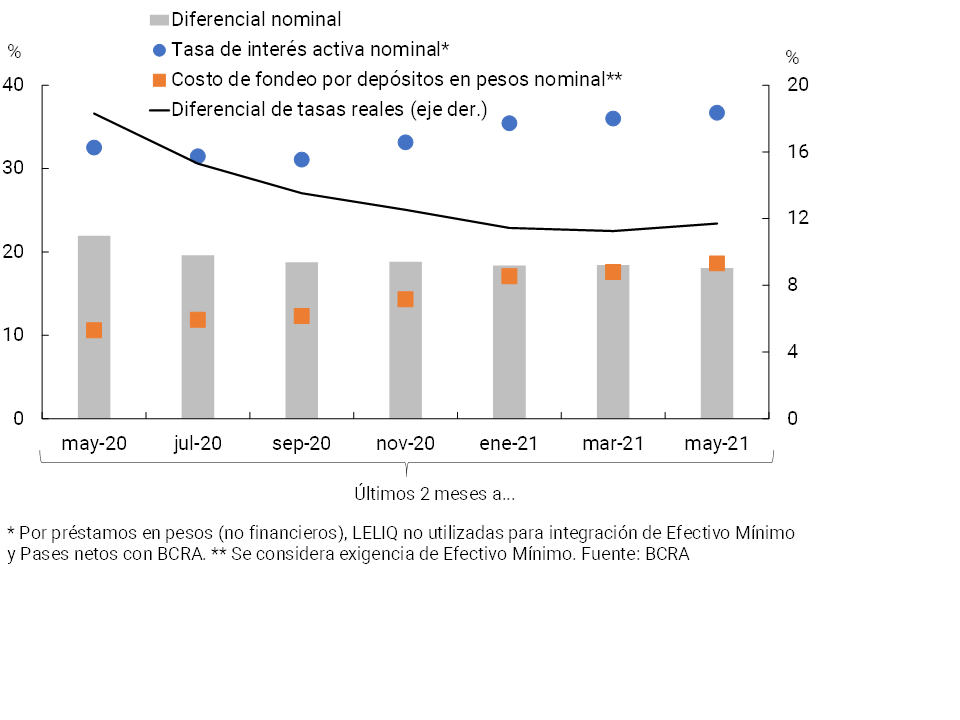
Implied interest rates and their differential are variables that contribute to giving an approximate idea of the performance of the most relevant assets and liabilities in national currency in the sector. In perspective, it can be seen that in the last two months (latest information available as of May) in general the nominal lending rate has grown by the same magnitude as the nominal deposit funding cost, thus resulting in the differential between the two concepts not presenting great variations16 (see Graph 17).
Figure 17 | Estimated Implied Interest Rates (Annualized) – Segment in Pesos – Financial System
V. Payment system
In the first months of the year, electronic means of payment continued to increase their relative importance in the usual operations of families and companies. In this context, the BCRA continues to direct its actions to deepen the dynamism of the payment system, especially through electronic tools, without losing sight of the security of operations. In this scenario, as of May, the BCRA has had a set of incentives in terms of the Minimum Cash regulations with the aim of stimulating the use of electronic payment instruments17, while establishing new measures to reinforce security in this type of transactions, especially electronic wallets18. These measures complement those recently adopted to establish a reliable acceptance of pre-agreed personal loans with automatic crediting19. All these initiatives, added to those promoted in the last20 quarters, will contribute to generating a more modern, agile and advanced payment system, with greater security in digital transactions, thus allowing them to advance in the process of gradually replacing the use of cash21.
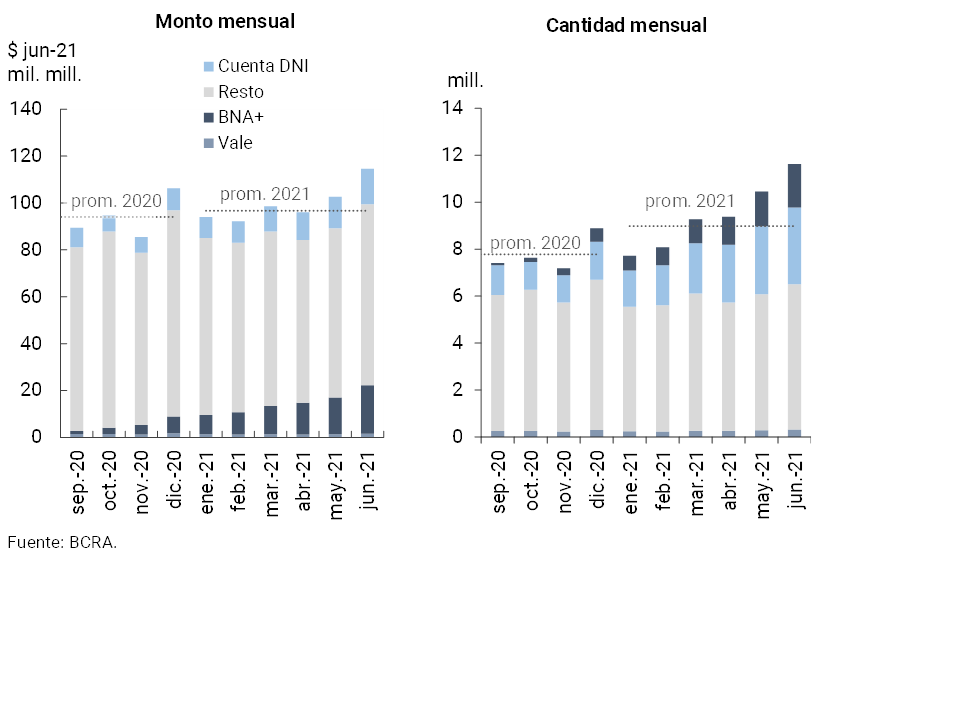
During June, total transfers in pesos increased compared to the previous month (7.2% in amounts and 12.8% in real amounts), remaining at values higher than the monthly average of 2021, a performance driven by immediate transfers (see Chart 18). Within this last segment, the dynamism of operations carried out by families through mobile banking (+11.7% in real amounts) and electronic business banking (+13% in real amounts) stood out in the month. In the case of transfers made through mobile banking, it is worth highlighting the increase in June in operations implemented via the wallets of public financial institutions: DNI Account with increases of 12.6% and 13.4% in real amounts and amounts, respectively, and BNA+ with increases of 25.7% and 31.5%, in real amounts and amounts (see Graph 19). Thus, in June the volume of transactions carried out with these wallets increased its relative participation in the total transfers channeled via mobile banking (+2.2 p.p., to represent 44% with respect to amounts and +2.9 p.p. to total 31.3% in terms of amounts operated). Compared to the same month of the previous year, total transfers in pesos increased 17.1% in amounts and 9.8% in real amounts, a dynamism explained entirely by the immediate modality.
Figure 18 | Total transfers in pesos (immediate and with accreditation in 24 hours)
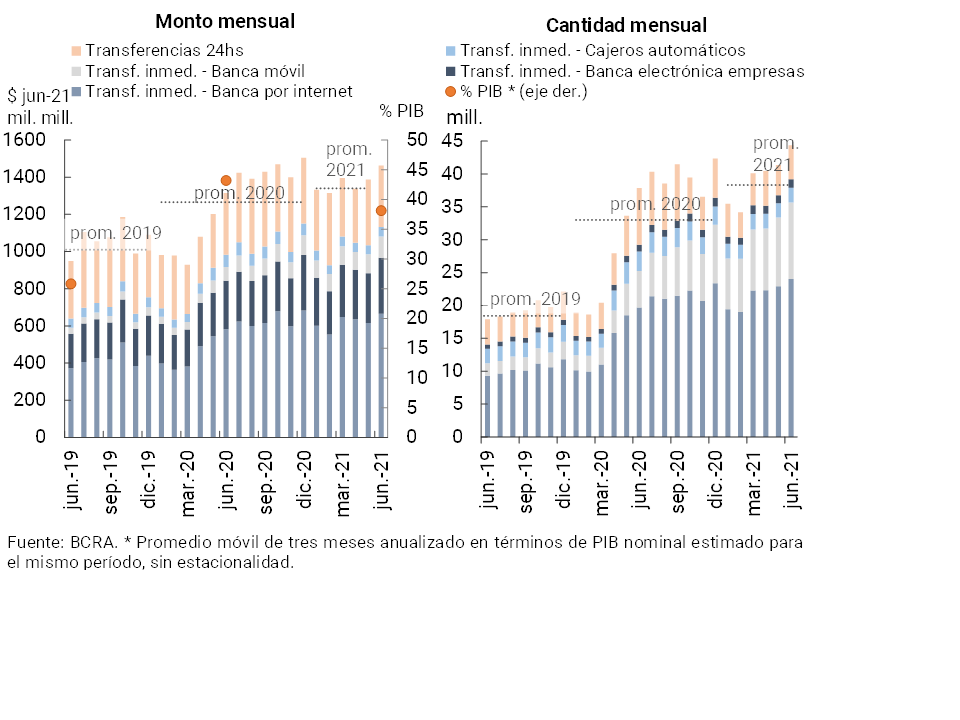
Figure 19 | Immediate transfers via Mobile Banking
Transactions through wallets of financial institutions and other
During May (latest available information), debit card operations remained at levels similar to those of the previous month (see Chart 20), higher than last year’s average. In the month, operations through e-commerce increased (3.8% in quantities and 5.3% in real amounts) while those in person decreased (-1.8% in quantities and -2.3% in real amounts). In this way, operations in electronic format continued to gain share in the total, totaling 30.4% in quantities and 32.2% in amounts in May. Compared to the same month of the previous year, debit card operations increased in amounts (43.1%) and in real amounts (22.2%), a performance mainly explained by operations in electronic format (+66.3% in amounts and +34.8% in real amounts), which more than compensated for the decrease in face-to-face transactions. The relevance that this payment instrument has in the economy is reflected in its relevance in terms of output: the annualized amount to May represented 7% of GDP, 0.5 p.p. more than in a year-on-year comparison. For its part, it should be noted that recently, in order to further streamline the payment chain, it was agreed with the banks to shorten the term for the deposit in the account of the merchants of the sales they make with debit cards to one business day, so that they can have the funds on the business day after the salewas made 22.
Figure 20 | Debit card transactions

In May (latest available information) ATM withdrawals did not show any changes in magnitude when compared to April (-0.1% in quantities and +0.8% in real amounts, see Graph 21). Thus, ATM withdrawals made during the period remained at levels similar to the average for the year, both in quantities and in real amounts. Compared to the same month of the previous year, cash withdrawals via ATMs increased in amounts (2.9%) and decreased in real amounts (-16.8%). Thus, in the average of the year, a decrease in these operations (both in quantities and in real amounts) is observed when compared to the average of 2020.
Figure 21 | Cash withdrawals
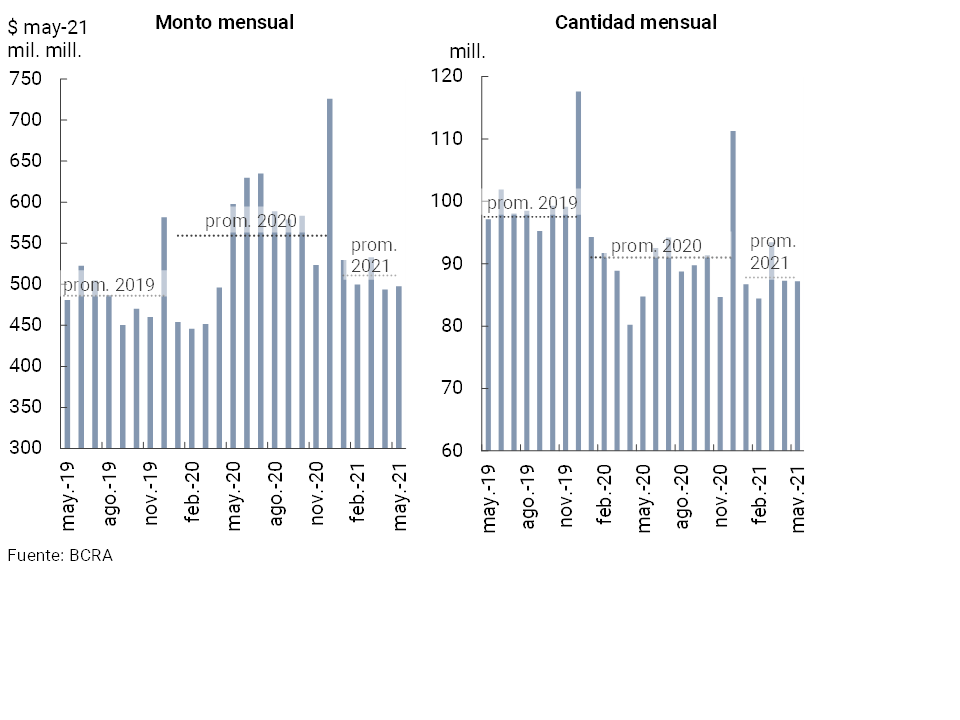
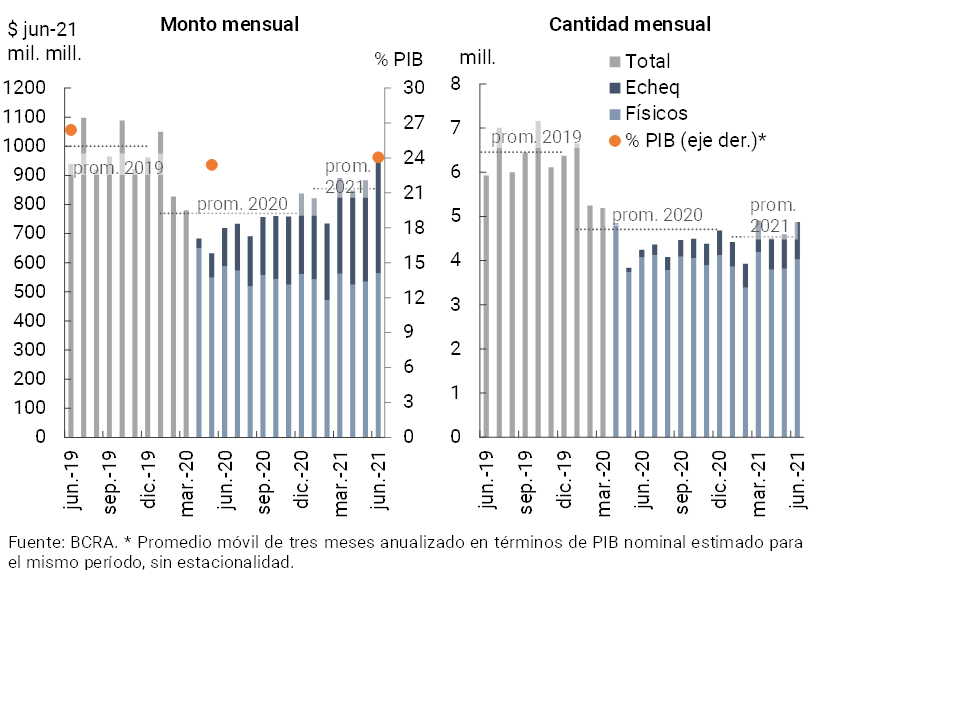
The total clearing of checks negotiated in June increased monthly, reaching levels above the monthly average of 2021 (see Chart 22). The monthly performance was due to both its physical and electronic format (ECHEQs), the latter showing a relatively greater increase, partly reflecting the regulatory incentives opportunely established by the BCRA23. In this way, operations through ECHEQs increased their weighting in the total, totaling 17.3% in quantities and 40.5% in amounts in June. Compared to the same month of the previous year, total check clearing operations increased in amounts (14.6%) and in real amounts (31.5%).
Figure 22 | Check clearing
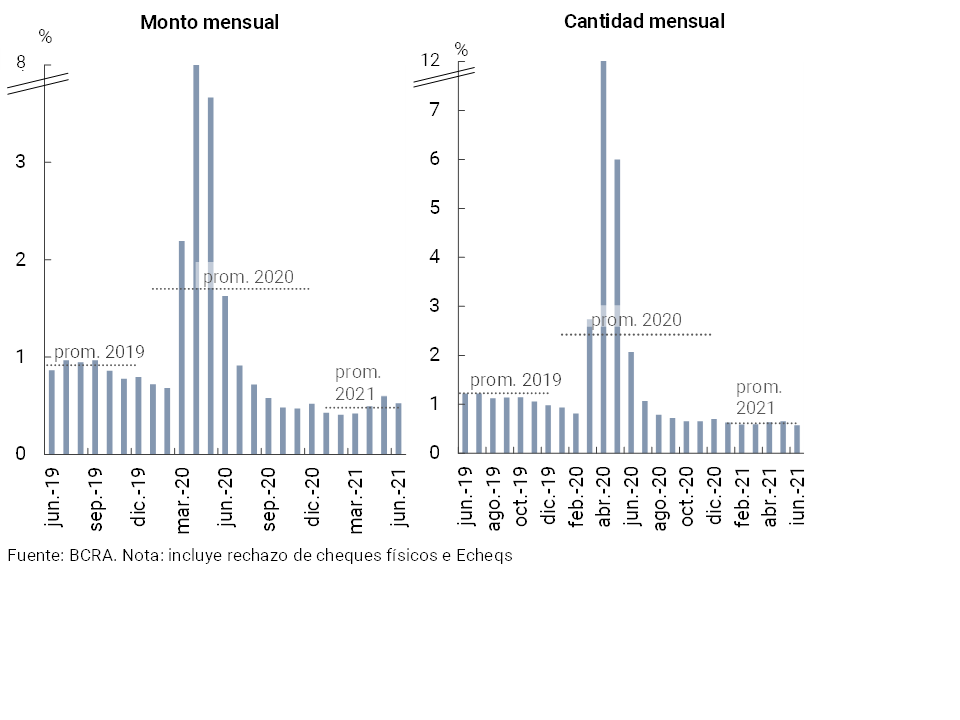
The rejection of checks due to lack of funds in terms of the total compensated fell in June (-0.08 p.p. for both amounts and amounts, to reach levels of 0.58% in the first case and 0.53% for the second), thus remaining in limited records, similar to the monthly average of 2021 (see Graph 23).
Figure 23 | Bounce checks due to insufficient funds
References
1 For more details, see Decrees “334/2021” and “287/2021”.
2 Differences in balance sheet balances expressed in homogeneous currency. Information extracted from the Monthly Accounting Information Regime (May 2021 latest information available at the time of publication of this Report).
3 Includes principal adjustments and accrued interest.
4 Throughout the Report, when reference is made to groups of private (national and/or foreign) and public financial institutions, it corresponds to banking entities. Non-bank entities will be referred to as “EFNBs”.
5 For more details, see Ordered Text “Financing Line for the Productive Investment of MSMEs”.
6 See Communication “A” “7329”.
7 See Communication “A” “7082” and Communication “A” “7102”.
8 See communication “A” “6993”.
9 See Communication “A” “7082”.
10 For more detail, see “Credit Conditions Survey” for the second quarter of 2021.
11 This ratio reached 29.4% of the balance of forecasts accounted for.
12 See Communication “A” “6938”, Communication “A” “7107”, Communication “A” “7181”, and Point 2.1.1. of the Ordered Text “Financial Services in the Framework of the Health Emergency Provided for by Decree No. 260/2020 CORONAVIRUS (COVID-19)”.
14 Considers availability, integration of minimum cash and BCRA instruments, in national and foreign currency.
15 For more detail, see “IEF I-21.”
16 The definition used for these implicit interest rates does not contemplate the effect of: administrative expenses, tax expenditures, cost of capital or other components associated with hedging for risks intrinsic to the financial intermediation operation. Implied interest rates are estimated by considering the cumulative and annualized flow for 2 months. For more details on the calculation methodology, see previous editions of the “Bank Report”.
17 The minimum cash requirement for those entities that verify in their operational infrastructure a growth in the use of electronic means through demand accounts held by individuals, in the evolution of electronic checks (ECHEQ) and electronic credit invoices (FCE MSMEs), and in the operation of their ATMs, was reduced. For more details see Communication “A” “7254”.
18 On the one hand, financial institutions must make available to their customers, by means of specific notifications and immediately (by one of the electronic means of communication that they usually use with their customers), the information of the DEBINs received (for more details see Communication “A” “7326”). On the other hand, it was decided that only cards, accounts or other sources of funds can be associated with electronic wallets only from the account holder. This is intended to prevent the use of third-party data in a wallet that may have been obtained through fraud/deception (for more details see Communication “A” “7328”).
19 See Press Release “Pre-Approved Credits: Greater Responsibility for Banks.”
20 Among which are the reduction in commissions and the shortening of the crediting period for credit card payments for MSMEs and the sequences of progress programmed in Transfers 3.0 (which will lead to the interoperability of all QR codes).
21 For more details, see “Press release of 9/07/2021”.
22 See footnote above.
Share on


