About the use of inclusive language in this publication
The use of language that does not discriminate and that makes all gender identities visible is an institutional commitment of the Central Bank of the Argentine Republic. This publication recognizes the influence of language on ideas, feelings, ways of thinking and evaluation schemes.
This document has sought to avoid sexist and binary language. However, for ease of reading, resources such as “@” or “x” are not included.
Executive summary
• In March, the financial system carried out its activity while preserving high levels of liquidity and solvency, in a context marked by the worsening of the health situation with an impact on the recovery of economic activity in which financial intermediation with the sector was tempered.
• In the month, the balance of financing to the private sector in pesos fell by 3.4% in real terms (+1.2% nominal), maintaining a growth of 2.7% real year-on-year (y.o.y.), above the falls recorded in the same month of previous years (-27.7% y.o.y. for March 2019 and -8.1% y.o.y. for March 2020) and after sustained growth in credit to the private sector until the beginning of 2021 favored by the stimulus policies of the government and the BCRA. As part of the measures adopted to facilitate access to credit for companies, in March the BCRA renewed the quota of the Financing Line for Productive Investment (LFIP) for MSMEs. Through this program, accumulated disbursements of more than $513,300 million have been made until the end of April, reaching 120,181 companies. For its part, credit to the private sector in foreign currency increased 7.2% in the month – in the currency of origin.
• In March, the irregularity ratio of credit to the private sector increased slightly to 3.9% (-1.4 p.p. y.o.y.). It should be considered that until the aforementioned month, the measures to alleviate the financial burden of debtors in the face of the pandemic scenario were in force: temporary modification of the parameters to classify them and the possibility of transferring unpaid installments at the end of the life of the credit – accruing only compensatory interest. From the beginning of April 2021 until the end of May 2021, the BCRA established a gradual transition in the guidelines for the classification of debtors of financial institutions, returning to the criteria existing prior to the start of the pandemic as of June 2021. More recently, with the aim of favoring financial relief focused on the most critical economic sectors affected by the pandemic, it was ordered that entities incorporate at the end of the life of the credit the unpaid installments of assistance granted only to debtors who are employers covered by the Productive Recovery Program II (REPRO II), considering only the accrual of compensatory interest.
• The real balance of private sector deposits in pesos remained without significant changes in the month (+4.8% nominal), with an increase in time deposits – after minimum rates remained unchanged – and a decrease in demand accounts. In line with the various savings instruments launched by the BCRA with inflation coverage, in March the growth of UVA time deposits continued to stand out, reaching a monthly increase of 34.8% in real terms for those with early cancellation and 16.3% in real terms for traditional UVA deposits. In year-on-year terms, the balance of deposits in pesos of the private sector accumulated an increase of 12.6% in real terms. For its part, in March the balance of private sector deposits in foreign currency increased by 1.6% – in source currency.
• From high levels compared to the last 15 years, in March the liquidity indicators of the financial system increased. Ample liquidity stood at 66% of total deposits in the month (61.5% when considering items in pesos), 1 p.p. more than in February and 1.4 p.p. above the record of a year ago.
• The financial system’s regulatory capital integration (RPC) stood at 25.3% of risk-weighted assets (RWA), up 0.5 p.p. compared to February and 3.3 p.p. y.o.y. For its part, the ratio between the PRC and credit to the private sector net of forecasts – an indicator of the level of resilience against the eventual materialization of credit risk – reached a value of 45.8% at the aggregate level in March, 1.3 p.p. more than in the previous month (+8.8 p.p. y.o.y.), a high figure compared to the average of the last 10 years (26.2%).
• In the first quarter of 2021, the comprehensive results accrued by the aggregate financial system in homogeneous currency were equivalent to 0.2% annualized (y.) of assets (ROA) and 1.3% y. of net worth (ROE), below the records for all of 2020. Considering the cumulative twelve months to March, the sector registered an ROA of 1.9% (ROE of 12.7%).
• Electronic means of payment have been performing outstandingly in the context of the measures implemented by the BCRA, which include the launch of the Transfer Payment System and regulatory incentives (Minimum Cash). In particular, total transfers in pesos operated in April 2021 (latest information) increased 41% YoY in amounts and 17.3% YoY in real amounts. The greater relative dynamism of transfers with immediate crediting through mobile banking and internet banking stands out. On the other hand, operations through ECHEQs increased their participation in the total clearing of checks both in amounts (up to 14.5%) and in amounts (up to 36.9%).
I. Financial intermediation activity
In March, the intermediation activity of the financial system with the private sector in national currency in real terms was reduced. In this regard, it is worth mentioning that the sustained recovery of economic activity until the beginning of the year, favored by the stimulus measures of the national government and the BCRA, the return to activity of various sectors and the beginning of vaccination, was tempered by the worsening of the health situation as of March.
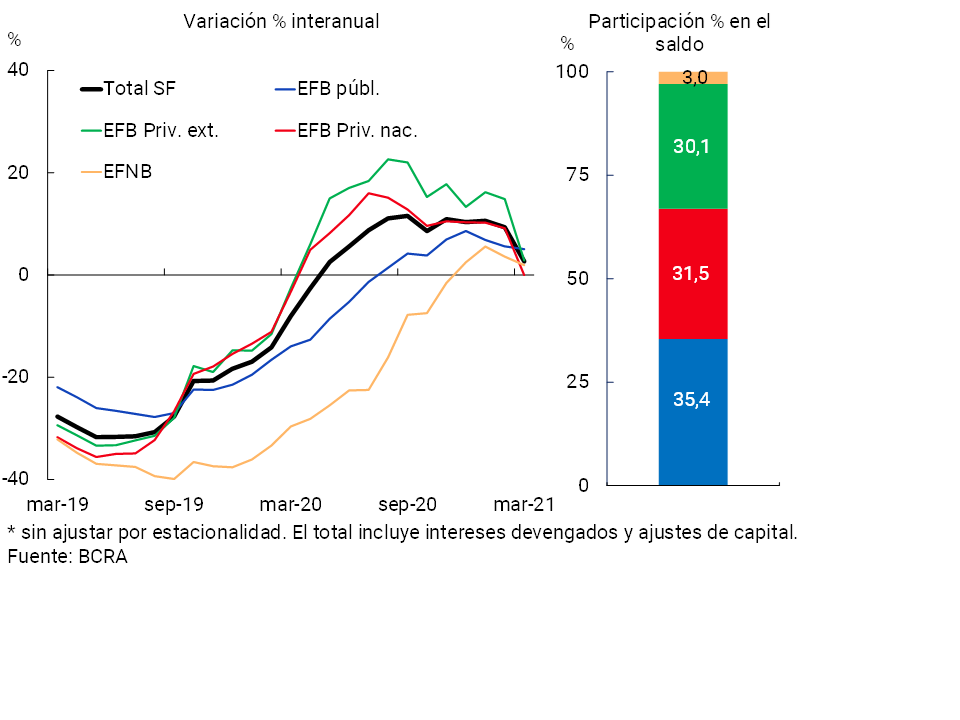
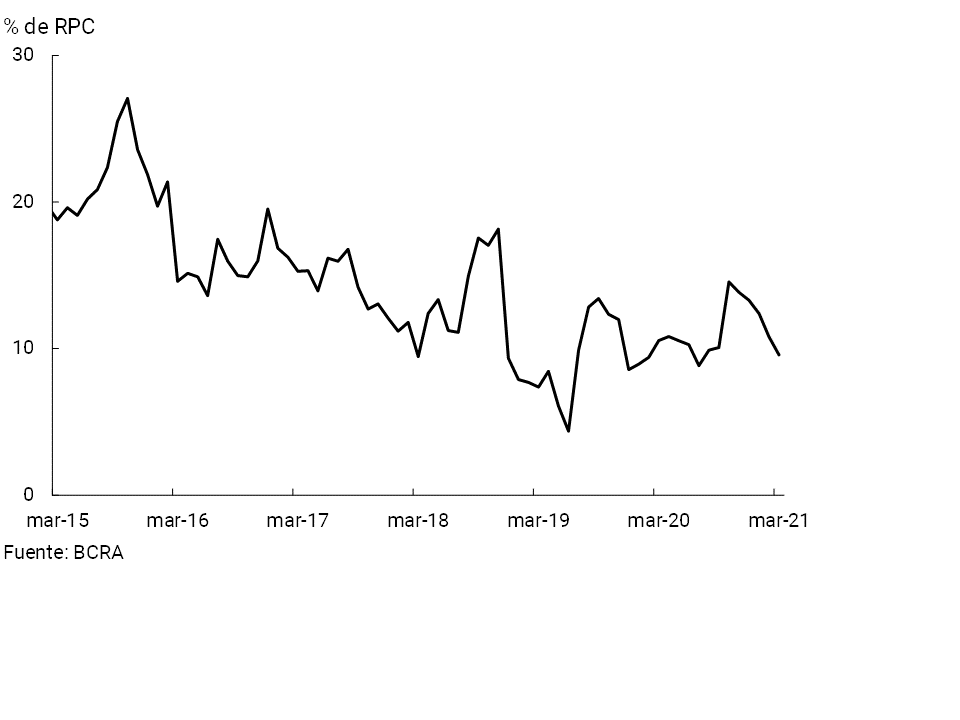
In the month, the balance of credit to the private sector in pesos fell by 3.4% in real terms (+1.2% nominal)1, 2. Within this segment, almost all credit lines showed decreases in real balances, with the exception of pledges and assets under financial lease. In year-on-year terms, financing in national currency to the private sector, after a sustained recovery until the beginning of 2021, continued to register growth, although at a slower pace, increasing 2.7% in real terms, with greater relative dynamism in public financial institutions. Although this variation was lower than the records observed in previous months, it continued to exceed the values of the same month in previous years (-27.7% real y.o.y. for 2019 and -8.1% y.o.y. real for 2020, see Graph 1)3.
Graph 1 | Credit to the private sector in pesos
In real terms*
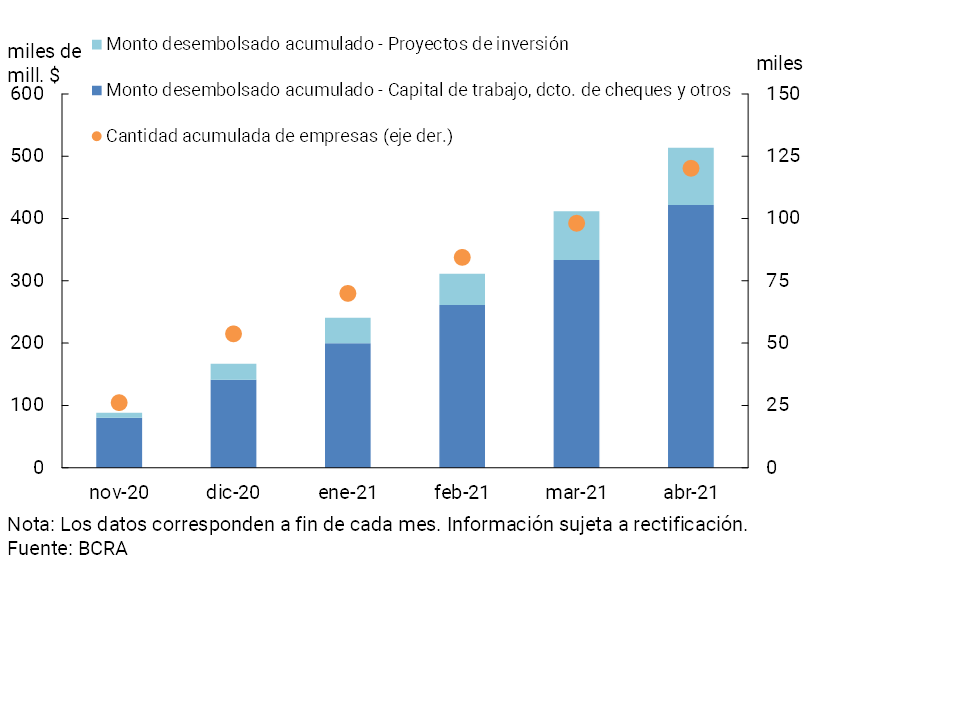
The BCRA continues to stimulate credit with favorable conditions for the productive sector, and in particular, for MSMEs, aimed at investment in machinery and equipment, as well as to rebuild working capital. Thus, within the framework of the set of credit promotion measures, in mid-March the BCRA renewed the quota of the Financing Line for Productive Investment (LFIP) of MSMEs4. Since its implementation in mid-October 2020 and until the end of April 2021, more than $513,300 million5 have been disbursed through the LFIP cumulatively (of which, 19.8% corresponds to the 2021 quota), reaching 120,181 companies (See Graph 2). National private financial institutions accounted for 36% of the total disbursed, public 33% and foreign financial institutions the rest.
Graph 2 | Financing line for productive investment of MSMEs
At the same time, through the line of financing at subsidized interest rates for companies enrolled in the “Emergency Assistance Program for Work and Production” (ATP)6, 20,912 loans have been granted for a total of $14,295 million until the end of April.
Considering the credit lines aimed at single-tax and self-employed people, throughthe Zero Rate 7 Credit lines, about $66,500 million have been granted until the end of April, and through the Zero Rate Culture8 line about $310 million.
With the aim of continuing to promote access to credit, financial inclusion and the use of electronic means of payment, in March the BCRA established a series of incentives for financial institutions through franchises for the constitution of minimum cash. To obtain the franchise, entities must prove that they granted financing to individuals or SMEs not registered as debtors of financial institutions, and/or that they increased transactions by electronic means and/or that they improved the operation of their ATMs9.
Considering the items in foreign currency, the credit balance in this denomination increased 7.2% in March —in currency of origin—, mainly driven by the performance of export financing by foreign private entities10, after maintaining a competitive and stable real exchange rate. As a result, the total balance of financing (in domestic and foreign currency) to the private sector decreased 2.4% in real terms compared to February (-5.9% y.o.y. in real terms).
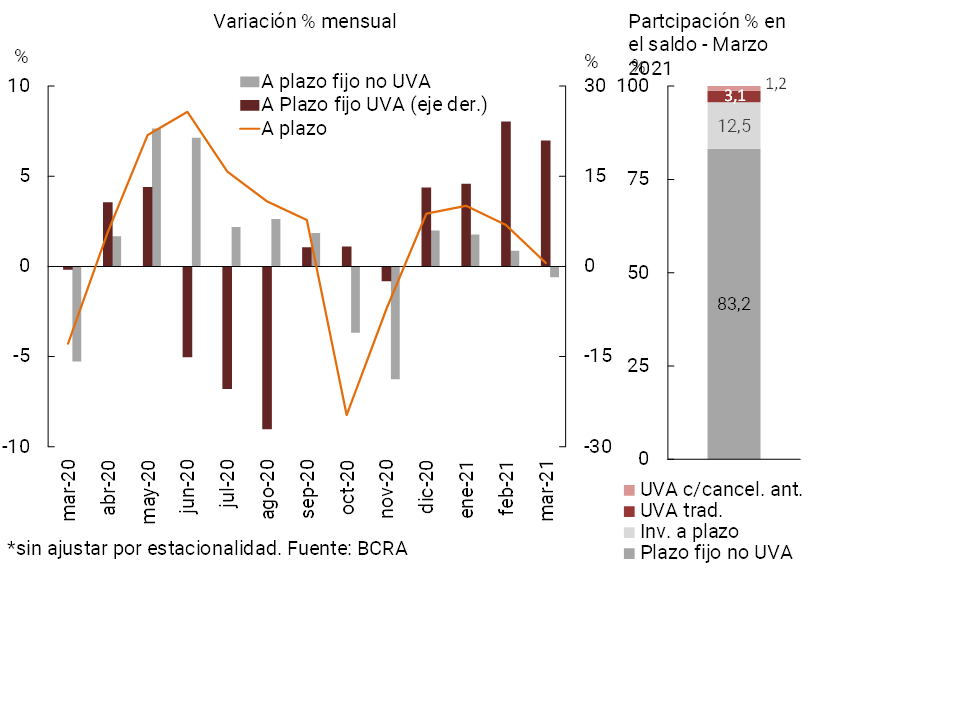
With regard to the funding of the financial system, in a context of unchanged minimum interest rates, the balance of deposits in pesos of the private sector in real terms remained unchanged in magnitude compared to February (+4.8% nominal) (see Chart 3). Demand accounts decreased by 0.4% in real terms (+4.4% nominal), while time deposits increased by 0.2% in real terms (+5% nominal). In recent months, the dynamism of savings alternatives with inflation coverage has been highlighted, among the various instruments that allow yields to be obtained11 (see Chart 4). In particular, UVA fixed terms with early cancellation – which the BCRA launched in January 2020 with the aim of providing an attractive savings alternative in local currency, adjustable to price evolution, at a positive real rate – increased by 34.8% in real terms compared to February, while traditional UVA deposits increased by 16.3% in real terms. Despite this dynamism, the balance of UVA time deposits in the private sector still has a low relative weight in the total time deposits in pesos of the private sector, representing 4.3% in March.
Graph 3 | Balance of private sector deposits in pesos
In real terms*
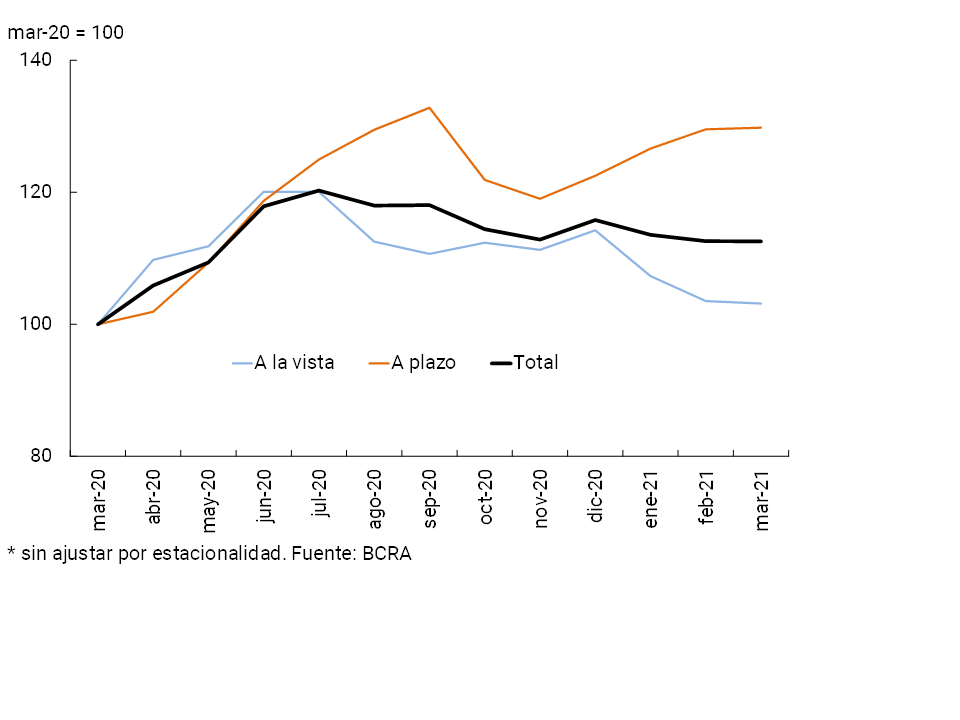
Figure 4 |Balance of private sector time deposits in pesos – In real terms*
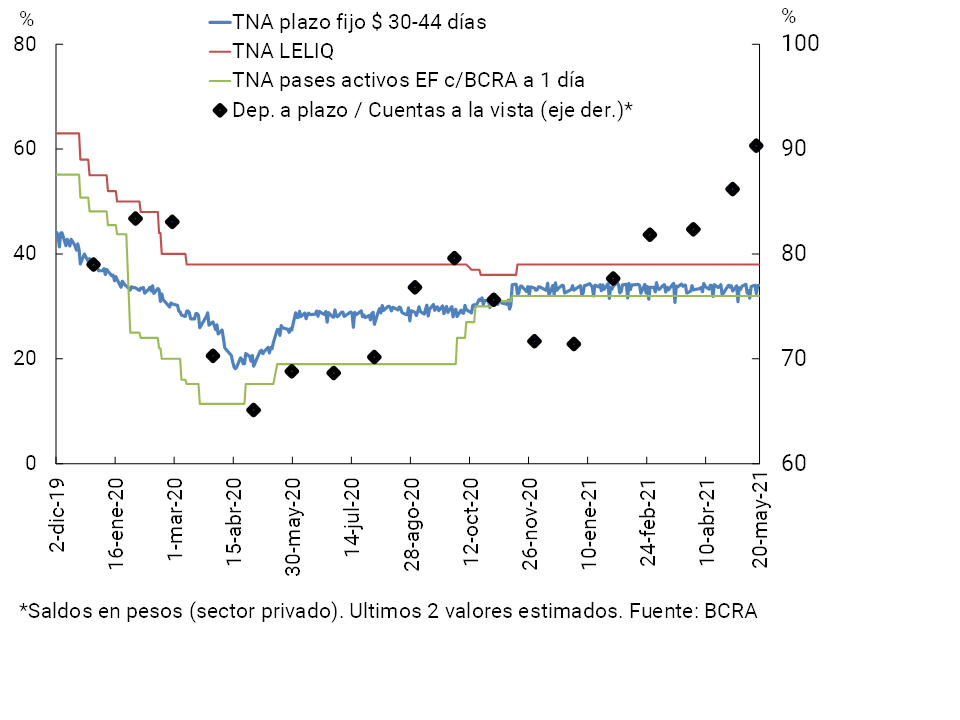
Monetary policy interest rates and nominal passive interest rates traded in pesos remained stable in the month (see Chart 5). In this context, since the beginning of the year, there has been an increase in the ratio between the balance of time deposits and private sector demand accounts in local currency.
Graph 5 | Interest rates and deposits in pesos*
In real terms
In March, private sector foreign currency deposits increased 1.6% compared to February – in source currency – a performance driven mainly by private financial institutions. Thus, the real balance of total private sector deposits (in domestic and foreign currency) decreased 0.2% compared to February (+4.6% nominal), accumulating an increase of 6.4% YoY.
In the last twelve months, the balance of deposits in national currency of the private sector increased by 12.6% in real terms (+60.6% nominal y.o.y.), while public sector deposits increased by 32.7% in real terms (+89.4% nominal y.o.y.) in the same period. Considering both sectors, the balance of deposits in pesos accumulated a year-on-year growth equivalent to 15.6% in real terms (+64.9% nominal YoY). Finally, taking into account both the private and public sectors and all currencies (domestic and foreign), in March the balance of total deposits increased by 9.6% YoY in real terms (+56.3% YoY nominal).
II. Aggregate Balance Sheet Composition
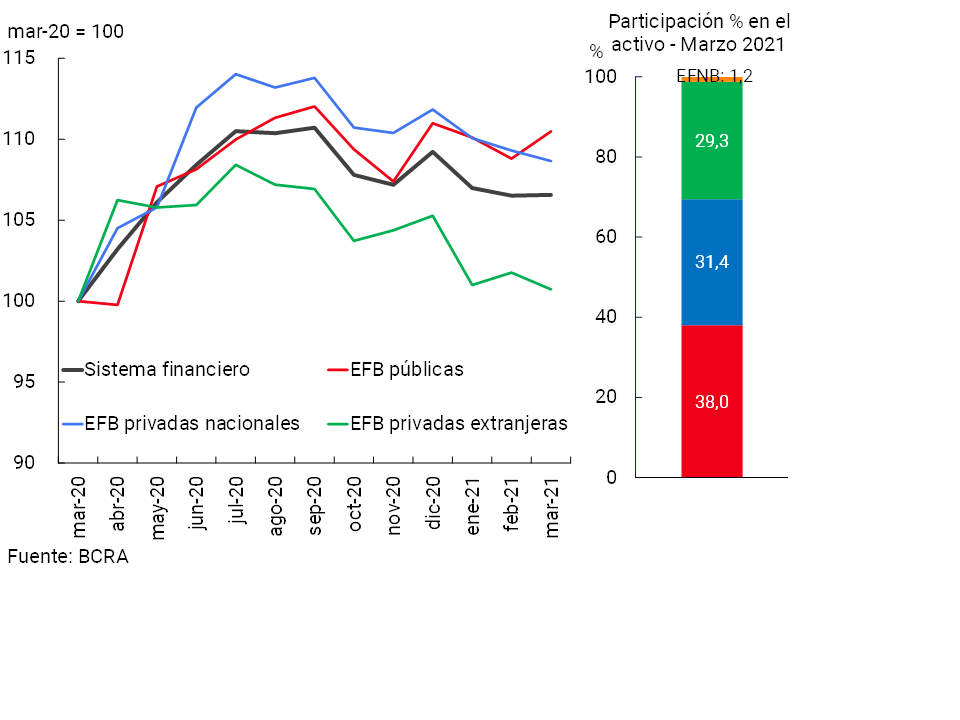
In March, the total assets of all financial institutions did not show any changes in real terms compared to February (+0.1% real or +4.9% nominal), increasing in the group of public financial institutions and decreasing in private financial institutions (see Chart 6). In a year-on-year comparison, the total assets of the aggregate financial system accumulated a growth of 6.6% in real terms, with increases in all groups of banking financial institutions.
Graph 6 | Total Asset Balance
In real terms
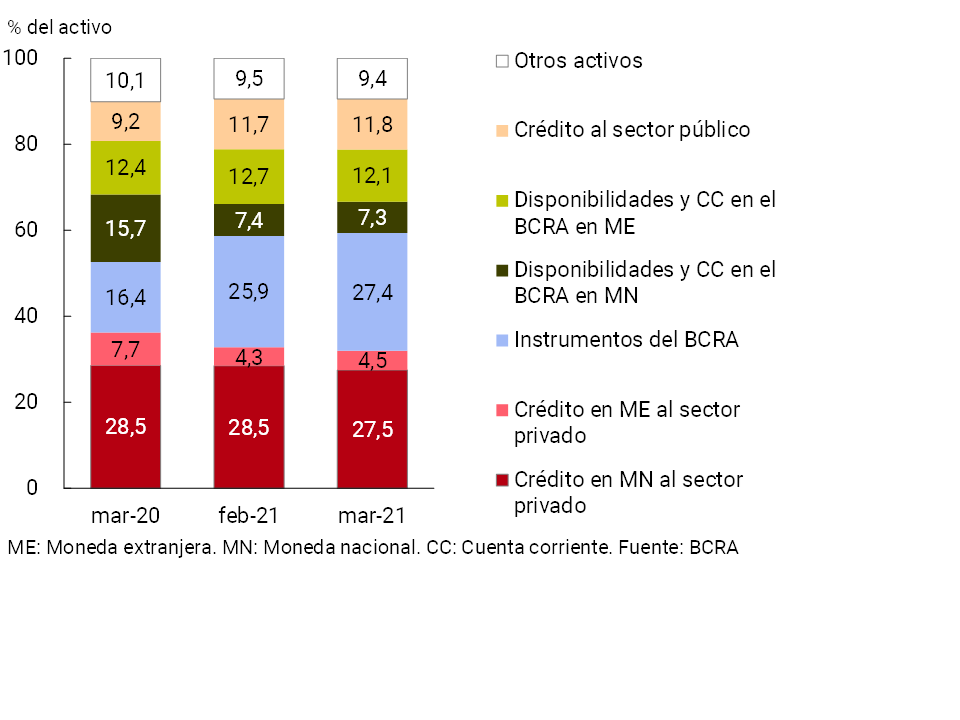
With respect to the composition of the total assets of the financial system, in March the weighting of the holding of monetary regulation instruments and the relevance of credit to the private sector in foreign currency increased (see Chart 7). For its part, in the month, financing in pesos to the private sector, tempered after the worsening of the pandemic, and the holdings of financial institutions in current accounts in foreign currency at the BCRA decreased their relative importance in total assets.
Figure 7 | Composition of total assets
Financial system – Share %
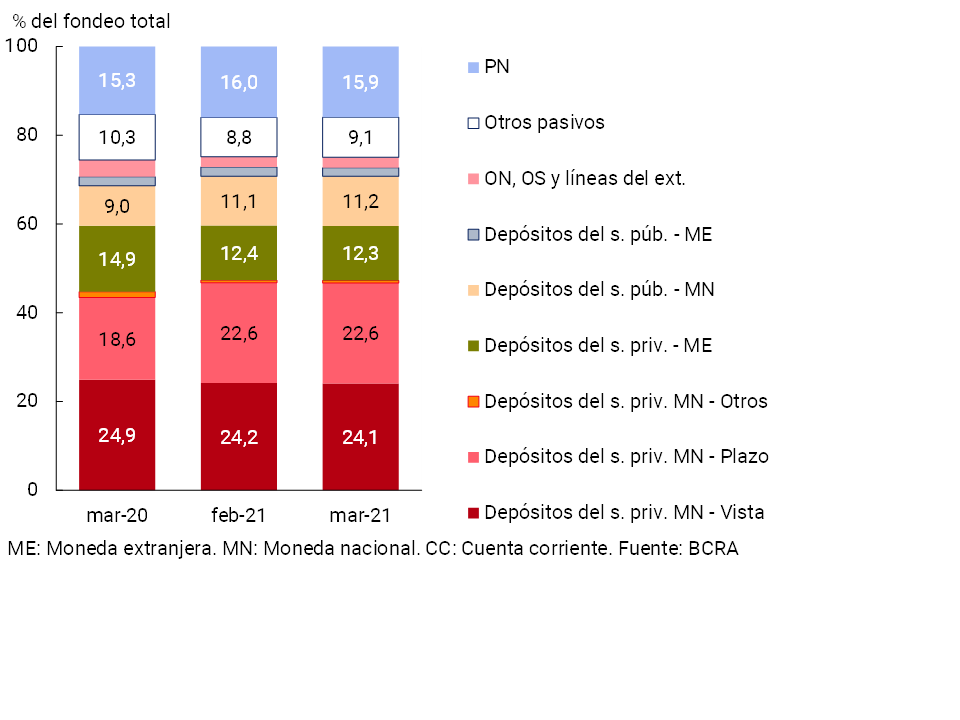
In relation to the composition of the anchorage, in March there were no changes in magnitude compared to the previous month (see Graph 8). Private sector deposits in national currency continued to have the highest relative weight, representing 47.3% of total funding (liabilities and equity).
Figure 8 |Total system funding composition
In % of total funding (liabilities + equity)
In March, the foreign currency assets of all financial institutions represented 19.2% of total assets, down 0.5 p.p. compared to last month and 3.5 p.p. compared to the level of a year ago. Liabilities in the same denomination presented similar performance, weighting 17.4% of total funding (liabilities and equity). Also considering the forward purchase and sale of foreign currency (classified off-balance sheet), the spread between assets and liabilities of the financial system in this denomination stood at 9.6% of regulatory capital, reducing both in monthly and year-on-year terms (see Chart 9).
Figure 9 | EM Assets – EM Liabilities + EM Forward Position (Financial System)
III. Portfolio quality
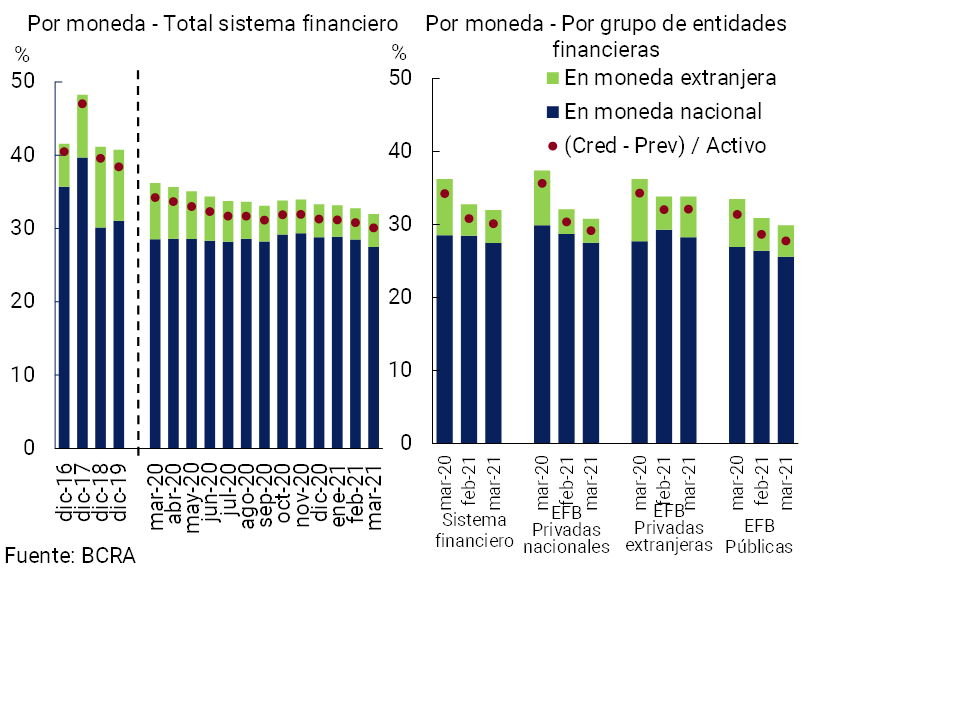
In March, the gross exposure of the financial system to the private sector (including domestic and foreign currency) stood at 32% of total assets12, falling 0.8 p.p. compared to February (-4.2 p.p. y.o.y.). The ratio stood at 27.5% when considering only financing in pesos, 1 p.p. less than in the previous month (-1 p.p. y.a.) (see Graph 10). On the other hand, credit to the private sector in foreign currency increased slightly in its share of total assets compared to the previous month (+0.2 p.p.), although it remained below the level of March 2020 (-3.2 p.p. y.o.y.).
Figure 10 | Credit balance to the Private Sector / Assets
In March, the irregularity ratio of credit to the private sector for the aggregate financial system increased slightly to 3.9% (-1.4 p.p. y.o.y.) (see Graph 11). The monthly increase was mainly explained by private financial institutions. This performance took place within the framework of the validity, until March 2021, of the transitory modification of the parameters for classifying debtors and the possibility of transferring unpaid installments at the end of the life of the credit – accruing onlycompensatory interest 13 – to alleviate the financial burden in the face of the pandemic scenario. In this regard, from the beginning of April 2021 until the end of May 2021, the BCRA decided to establish a gradual transition schedule in the guidelines for the classification of debtors of financial institutions14. After this transition, as of June 2021, financial institutions must classify their debtors according to the pre-existing default criteria as of March 2020. Finally, it was provided that financial institutions must incorporate at the end of the life of the credit the unpaid installments of assistance granted only to debtors who are employers covered by the Productive Recovery Program II (REPRO II), considering only the accrual of compensatory interest15.
Figure 11 | Irregularity of credit to the private sector
Irregular financing / Total financing (%)

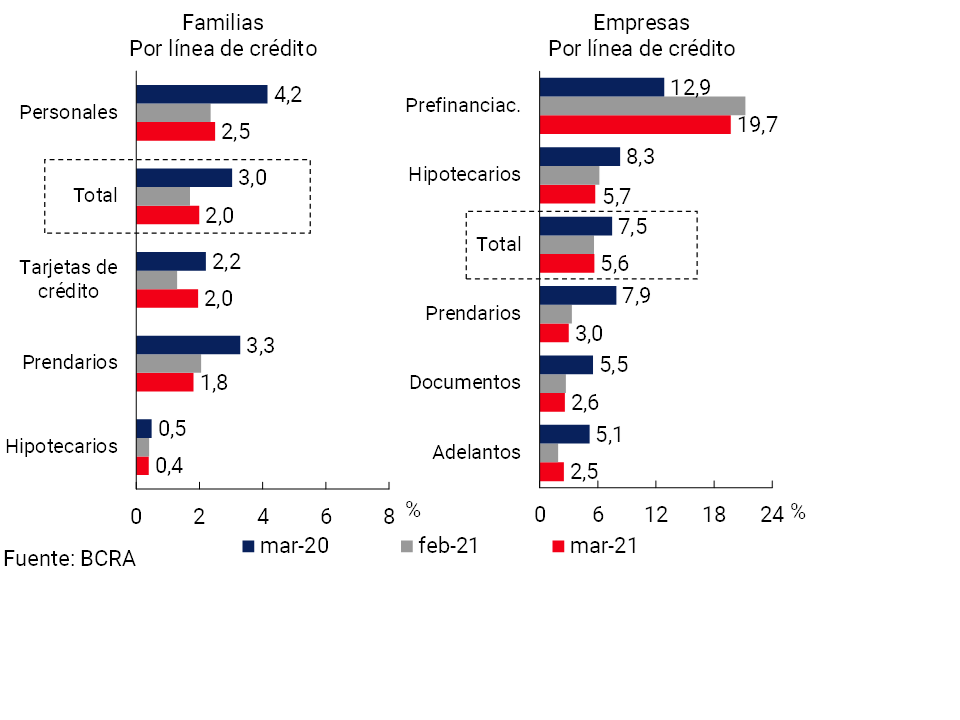
The non-performing loan ratio for households stood at 2% in the period, 0.3 p.p. above the February level (-1 p.p. y.o.y.). This monthly performance was mainly driven by the increase in credit card delinquencies (see Chart 12). As for loans to companies, the NPL indicator stood at 5.6% in March, in line with the previous month’s record (-1.8 p.p. y.o.y.). The monthly increase in the irregularity ratio recorded in advances was offset by the decrease in the rest of the credit assistance.
Figure 12 | Irregularity of credit to the private sector
Irregular financing / Total financing (%)
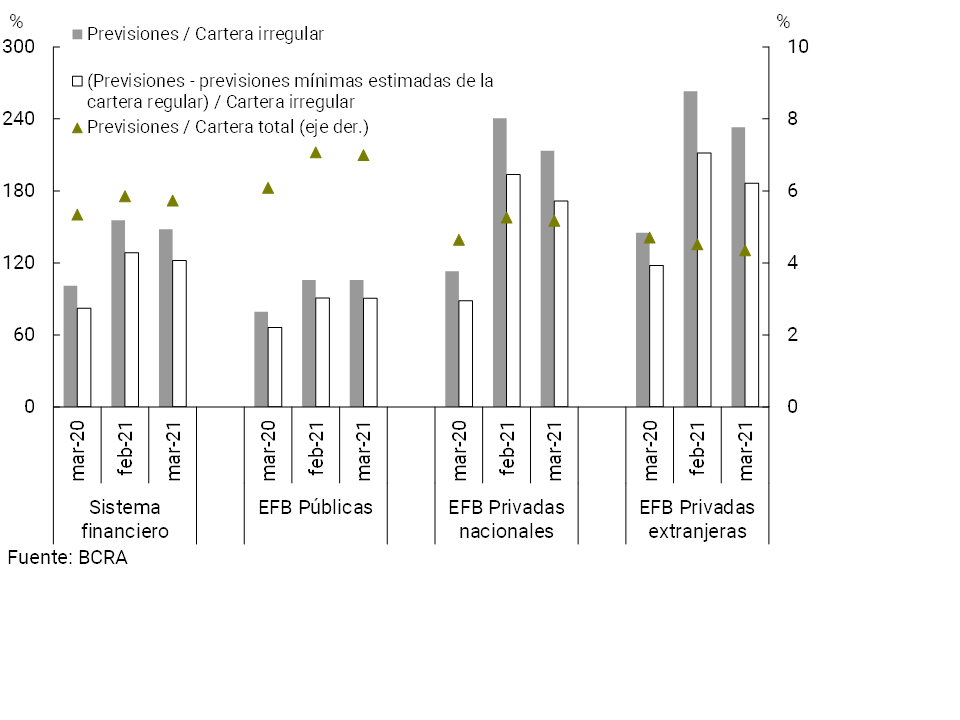
The forecasts accounted for by the aggregate financial system represented 5.7% of total credit to the private sector in March, slightly below the previous month’s figure (+0.4 p.p. y.o.y., see Chart 13). The total forecasts in terms of the irregular portfolio stood at 148% in the month. In turn, in March the balance of regulatory forecasts attributable to the non-performing portfolio (following the criteria of the minimum regulatory forecasts for uncollectibility risk) totaled 122% of said portfolio.
Figure 13 | Credit to the private sector and forecasts
By Entity Group
IV. Liquidity and solvency
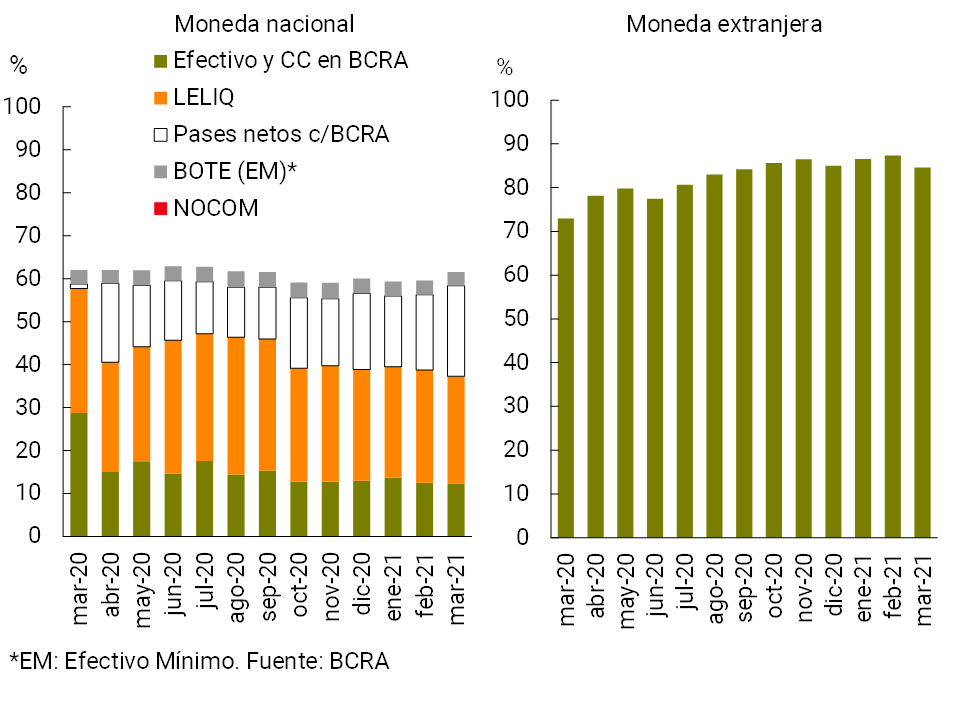
The liquidity of the aggregate financial system closed the first quarter of the year at high levels compared to the last 15 years. The sector’s broad liquidity ratio16 increased by 1 p.p. of total deposits in March, reaching 66% (+2 p.p. to 61.5% considering items in pesos and -2.7 p.p. to 84.6% for the foreign currency segment, see Chart 14). The monthly increase in liquid assets in pesos was mainly due to the higher balance of net passes with the BCRA, while the share of the balance of LELIQ and the current accounts that financial institutions have in this institution was reduced. In the last 12 months, broad liquidity increased by 1.4 p.p. of deposits, mainly due to the performance of the segment in foreign currency.
Figure 14 | Liquidity of the financial system
In % of deposits
The solvency indicators of all financial institutions increased in March. The regulatory capital integration (CPR) ratio in terms of risk-weighted assets (RWA) stood at 25.3% for the sector at the aggregate level in the month, 0.5 p.p. above the level observed in February (see Chart 15). All groups of entities increased their capital integration ratios in the month. In turn, the capital position (CPR net of regulatory requirements) of all institutions increased by 5.8 p.p. from the regulatory requirement in March to 202%. In a year-on-year comparison, the regulatory capital and capital position of the financial system increased by 3.3 p.p. of RWAs and 46.8 p.p. of regulatory requirements, respectively.
Figure 15 | Integration of regulatory capital
By financial institution group

The ratio of regulatory capital to credit to the private sector net of forecasts for the aggregate financial system provides a general understanding of the level of resilience of the sector to credit risk. In March, this ratio stood at 45.8% at the aggregate level, 1.3 p.p. more than in the previous month (+8.8 p.p. y.o.y.), being a high level compared to the average of the last 10 years (26.2%).
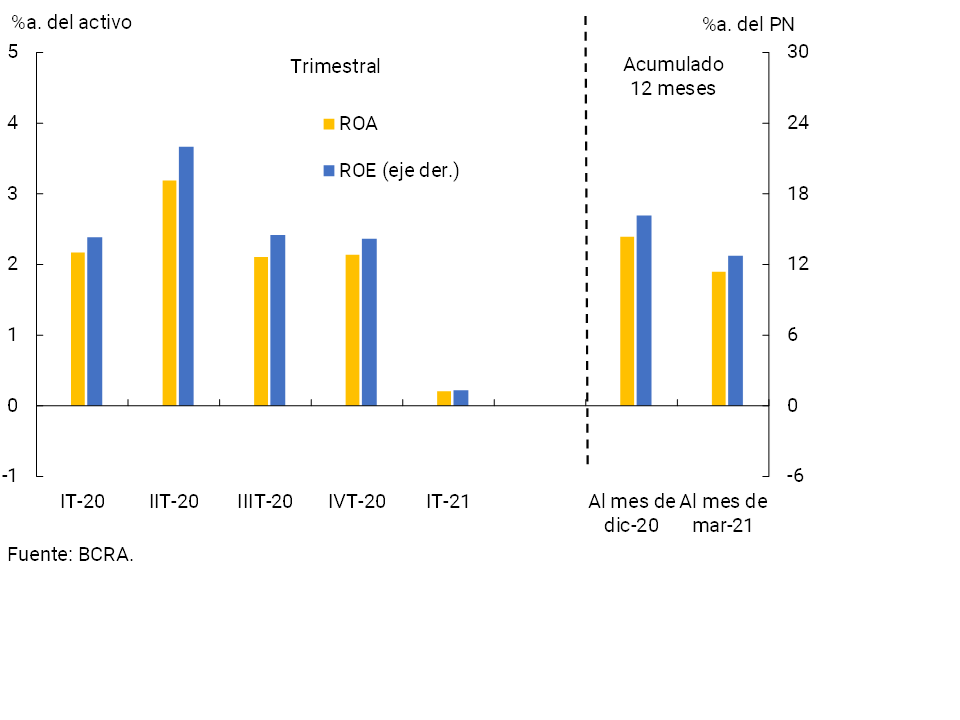
With regard to domestic capital generation, in the first quarter of 2021 the sector’s aggregate profitability indicators remained at positive levels, below the records of 2020. The financial system accrued comprehensive total results in homogeneous currency equivalent to 0.2% annualized (y) of assets (ROA) and 1.3% y. of equity (ROE) in the first three months of 2021 (see Chart 16). The lower profitability indicators of the first quarter of 2021 compared to what was evidenced in the cumulative figure for 2020 reflect, in particular, the dynamics of prices, a higher cost of funding for deposits in pesos (minimum rates and a growing proportion of time deposits), a decrease in the results for securities and a certain increase in some tax burdens. among others. These effects were tempered by lower charges for uncollectibility, administrative expenses and accrued income tax, among others.
Figure 16 | Comprehensive total profit in homogeneous currency of the financial system
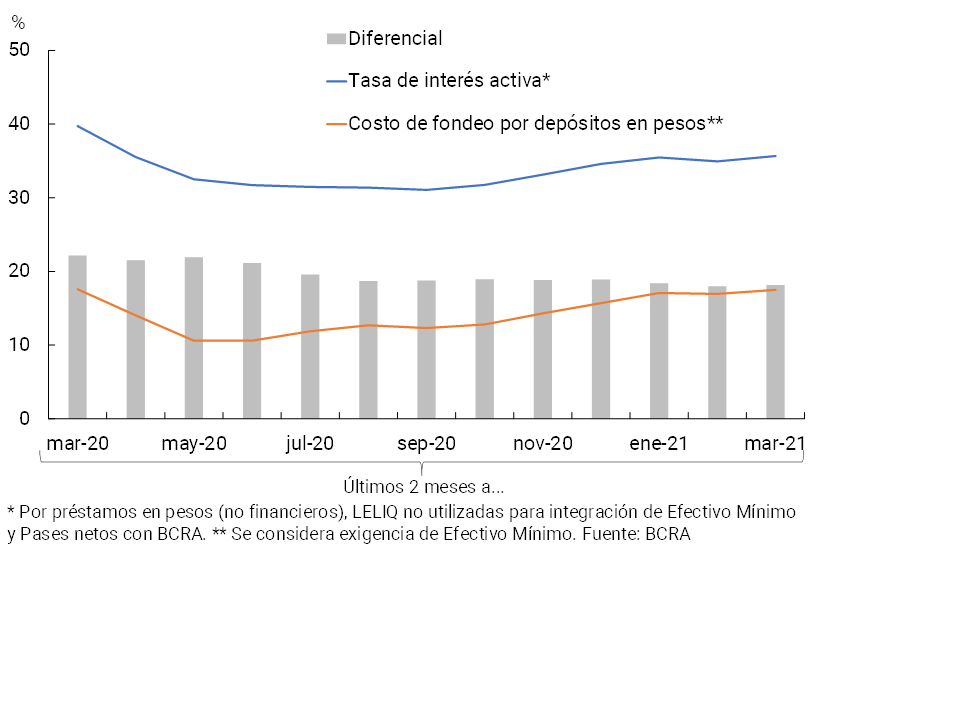
The lower profitability of the sector observed in recent months is, to some extent, in line with the evolution of the nominal implicit interest rate differential estimated by operations in national currency17, 18. Specifically, in the last two months, the spread between the average implicit lending rate in pesos and the implicit funding cost for deposits in the same denomination continued to decrease (see Chart 17). At the margin, this performance occurred in the context of increases in the cost of funding and in the lending rate, the former being relatively higher. Similarly, when estimating the behavior of implied interest rates by splitting the effect of inflation, there was also evidence of a reduction in the differential in the last two months and in a year-on-year comparison.
Figure 17 | Estimated (annualized) implied nominal interest rates for the financial system
Considering the last twelve months to March, the ROA of all financial institutions totaled 1.9% and the ROE reached 12.7%. The sector’s financial margin represented 11.6% of assets. Among the sources of financial income, the results from securities (8.7% of assets)19 and interest on loans (8% of assets) were the ones that stood out the most in the period. Other sources of profitability of lower volume were premiums for passes, adjustments of items with CERs and differences in prices. On the expenditure side, interest on deposits continued to be the most relevant item, totaling 9.2% of assets.
Among the non-financial items in the income statement, between April 2020 and March 2021, service income (1.8% of assets) stood out as sources of net income. Considering non-financial expenses, administrative expenses (6.5% of assets) and bad debt charges (1.4% of assets) were the most relevant.
V. Payment system
In recent months, electronic means of payment continued to gain relevance in the economy as a whole.
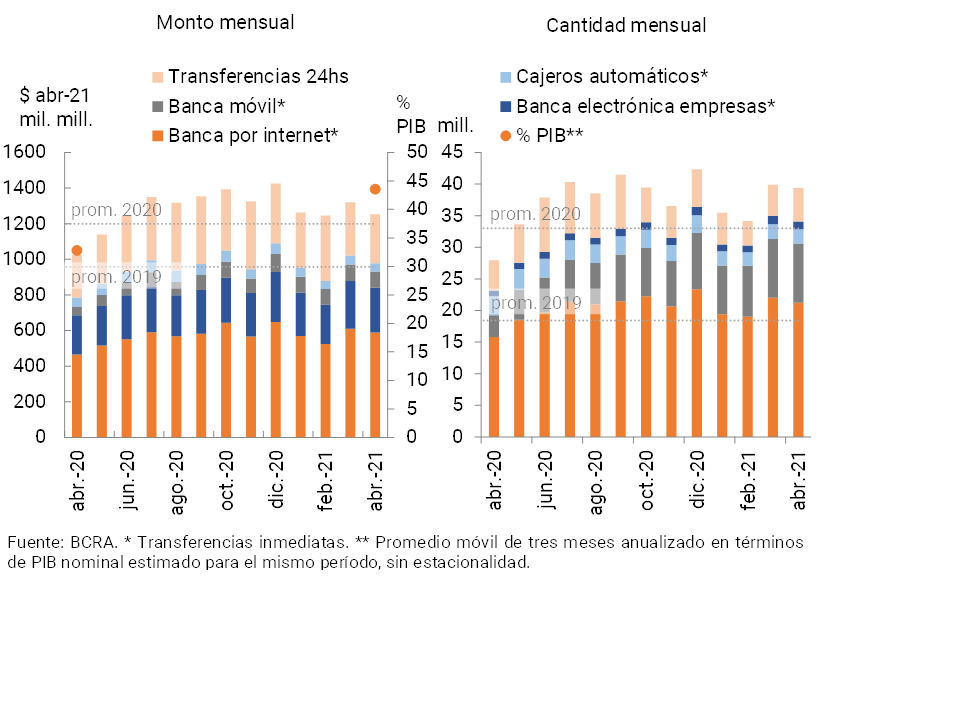
During April, total transfers in pesos (immediate and with accreditation in 24 hours) decreased compared to the previous month, although they remain at values higher than the monthly average of 2020. Moreover, compared to the same month of the previous year, total transfers in pesos increased 41% in amounts and 17.3% in real amounts (see Graph 18) in part as a reflection of certain changes in habits in the context of the pandemic. Immediate transfers boosted this performance, highlighting the relative expansion of operations carried out by families through mobile banking (+98% YoY in real amounts) and Internet banking (+26.5% YoY), followed by business electronic banking operations (+13.8% YoY). In particular, within the transfers made through mobile banking, the wallets of public financial institutions (DNI Account and BNA+) accounted for 40% of the number of operations carried out in April. Based on this performance, it is estimated that the amount operated through total transfers grew 10.7 p.p. of GDP in a year-on-year comparison, reaching 44% in April 2021. The observed trend of growth in transactions through immediate transfers is expected to continue in the coming months, both due to the changes in habits observed since the beginning of the pandemic, and due to the impetus made by financial institutions and the Central Bank in this regard (launch of the Payment with Transfers system and the incentives in terms of the Minimum Cash requirements promoted by the BCRA for the operations carried out electronically -debits in demand accounts, ECHEQs and credit invoices-).
Figure 18 | Total transfers in pesos (immediate and with accreditation in 24 hours)
It should be noted that since the end of 2020, the system to make payments with immediate transfers has been reformulated and deepened. Payment by Transfer is like paying in cash, but using demand or payment account access cards or quick response (QR) codes and has the advantages of being an interoperable, immediate, economical, competitive and flexible system20. With the new implementation, users can read QR codes with any virtual wallet or bank app. In particular, the number of transactions under the Transfer Payments system grew by 14% in the first 4 months of 2021.
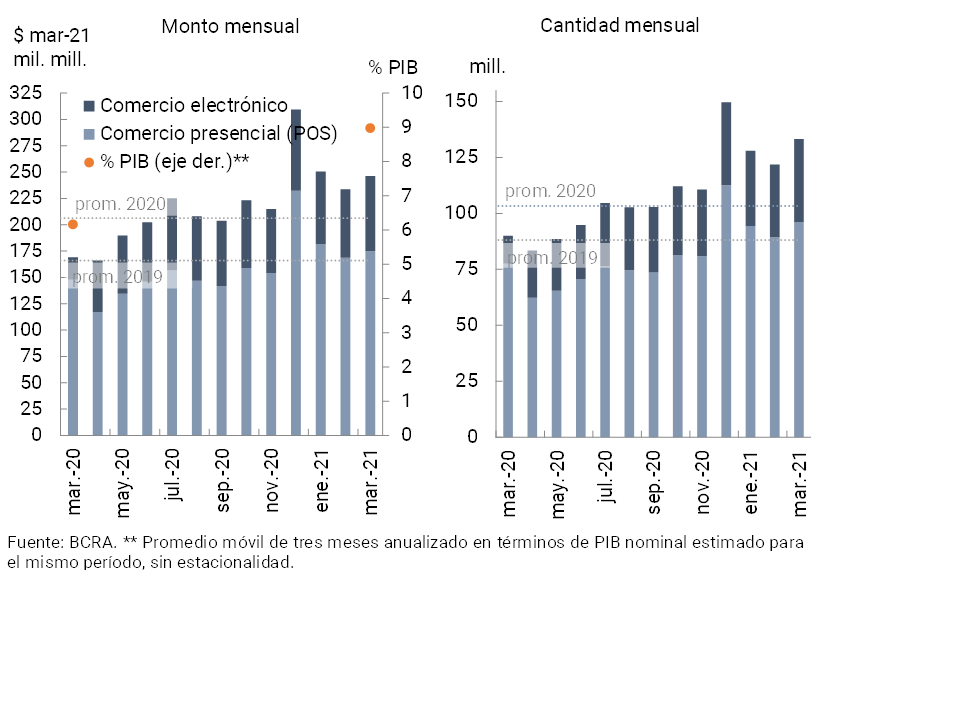
During March (latest available information), debit card transactions increased in amounts and in real amounts compared to the immediately previous month (see Chart 19), observing a relatively greater increase in operations through e-commerce in relation to face-to-face operations. In this way, operations in electronic format increased their participation in the total (to total 27.8% in quantities and 29% in amounts). In a year-on-year comparison, debit card transactions increased significantly (48% in amounts and 45.4% in real amounts).
Figure 19 | Debit card transactions
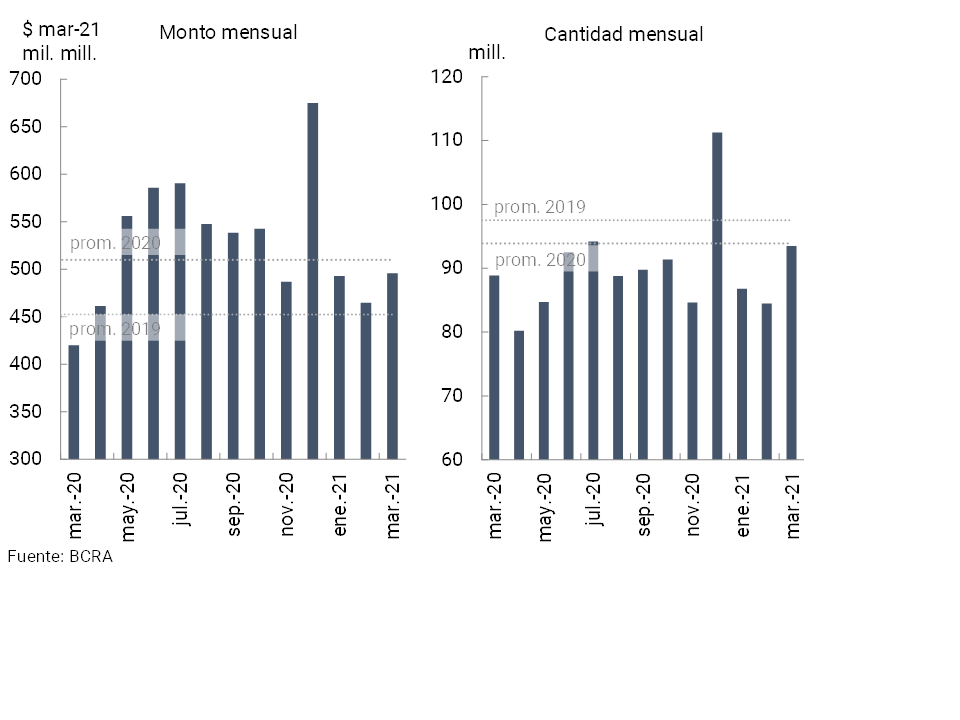
In March (latest available information) and within the framework of seasonal factors, there was a greater use and withdrawal of funds via ATMs compared to the previous month (see Chart 20). In year-on-year terms, there was an increase of 5.2% in the number of cash withdrawals through ATMs and an 18% increase in the amounts dispensed measured in homogeneous currency.
Figure 20 | Cash withdrawals
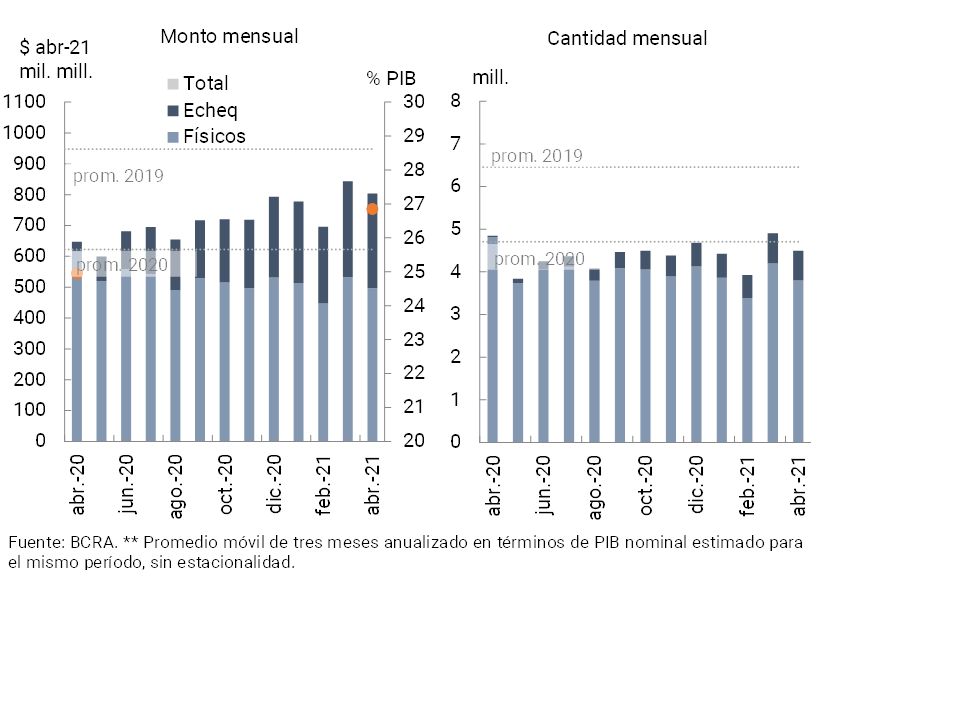
During the month of April, check clearing decreased compared to March in real amounts and amounts, remaining at levels similar to the monthly average of 2020 (see Chart 21). In the month, compensation was reduced in its two formats (ECHEQs and physical documents). Operations through ECHEQs increased their share of the total cleared both in amounts (up to 14.5%) and in amounts (up to 36.9%). Compared to the same month of the previous year, total transactions through check clearing decreased in amounts (-7.2%) and increased in real amounts (24.2%).
Figure 21 | Check clearing
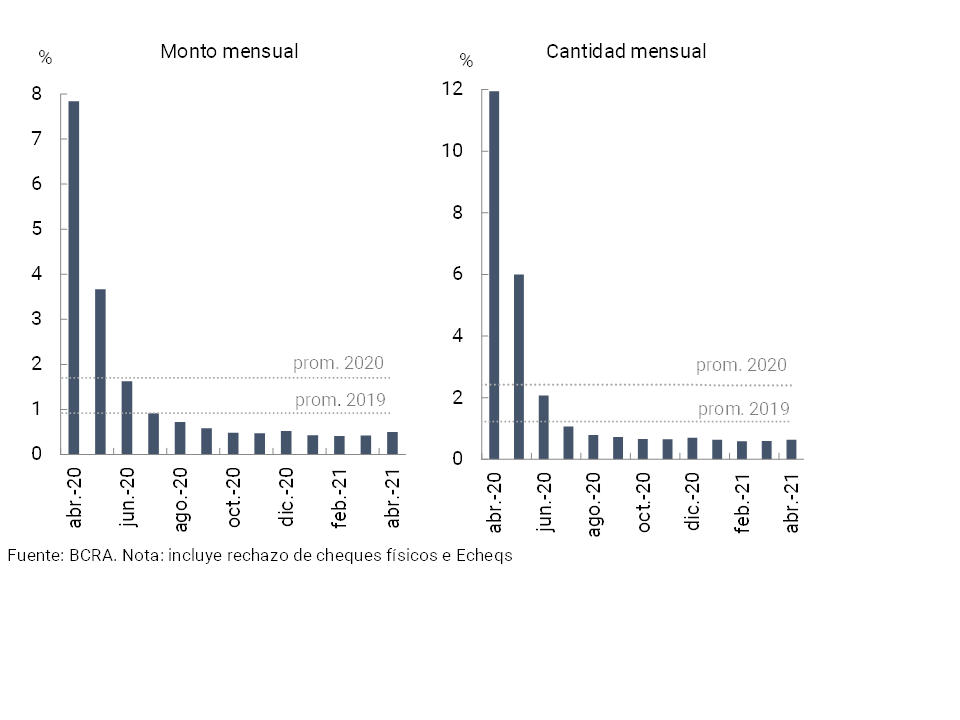
During the month of April, the rejection of checks due to lack of funds in terms of the total compensated increased slightly compared to the previous month: in amounts (+0.04 p.p., with a level of 0.64%) and in amounts (+0.07 p.p., with a level of 0.5%). The rejection ratio due to lack of funds remains below the annual average recorded in 2020. Compared to the peaks evidenced in the same month of the previous year, the rejection ratio decreased by 11.3 p.p. in quantities and 7.3 p.p. in amounts (see Graph 22).
Figure 22 | Bounce checks due to insufficient funds
References
1 Includes principal adjustments and accrued interest.
2 Differences in balance sheet balances expressed in homogeneous currency. Information extracted from the Monthly Accounting Information Regime (March 2021 latest information available at the time of publication of this Report).
3 Throughout the Report, when reference is made to groups of private (national and/or foreign) and public financial institutions, it corresponds to banking entities. Non-banking entities will be referred to as “EFNB”.
4 See Communication “A” “7240”.
5 Almost 18% of the total disbursed corresponds to investment projects.
6 See Communication “A” “7082” and Communication “A” “7102”
7See Communication “A” “6993”.
8 See communication “A” “7082”.
9 See communication “A” “7254” and “Press release” of 31/03/21.
10 For more details, see the Report “Evolution of the Exchange Market and Exchange Balance – March 2021”.
11 See “press release”.
12 This ratio reached 30.1% if credit to the private sector is taken out of the balance of forecasts accounted for.
13 Communication “A” “6938”, Communication “A” “7107”, Communication “A” “7181” and Point 2.1.1 of the Ordered Text “Financial Services in the Framework of the Health Emergency Provided for by Decree No. 260/2020 CORONAVIRUS (COVID-19)”.
15 Communication “A” “7285”. The BCRA will publish the list of such employers. It should be considered that the restructuring of the credit due to the application of the provisions will not imply a refinancing due to the customer’s inability to pay for the purposes of the rules on “Classification of debtors”.
16 Considers availability, integration of minimum cash and BCRA instruments, in national and foreign currency.
17 For the construction of implicit interest rates, concepts such as administrative expenses, tax expenditures, cost of capital or other components associated with hedging for risks intrinsic to the financial intermediation operation are not taken into account.
18 In this estimate, implied interest rates are constructed by accumulating flows over the last 2 months and annualized. For more details on the calculation methodology, see previous editions of the Banking Report.
19 In addition to this record, the group of financial institutions accounted for securities as “other comprehensive income”. The latter are estimated at around 1.7% of assets for the last 12 months.
20 For more details, see “press release” of 05/12/20.
Share on


