I. Activity
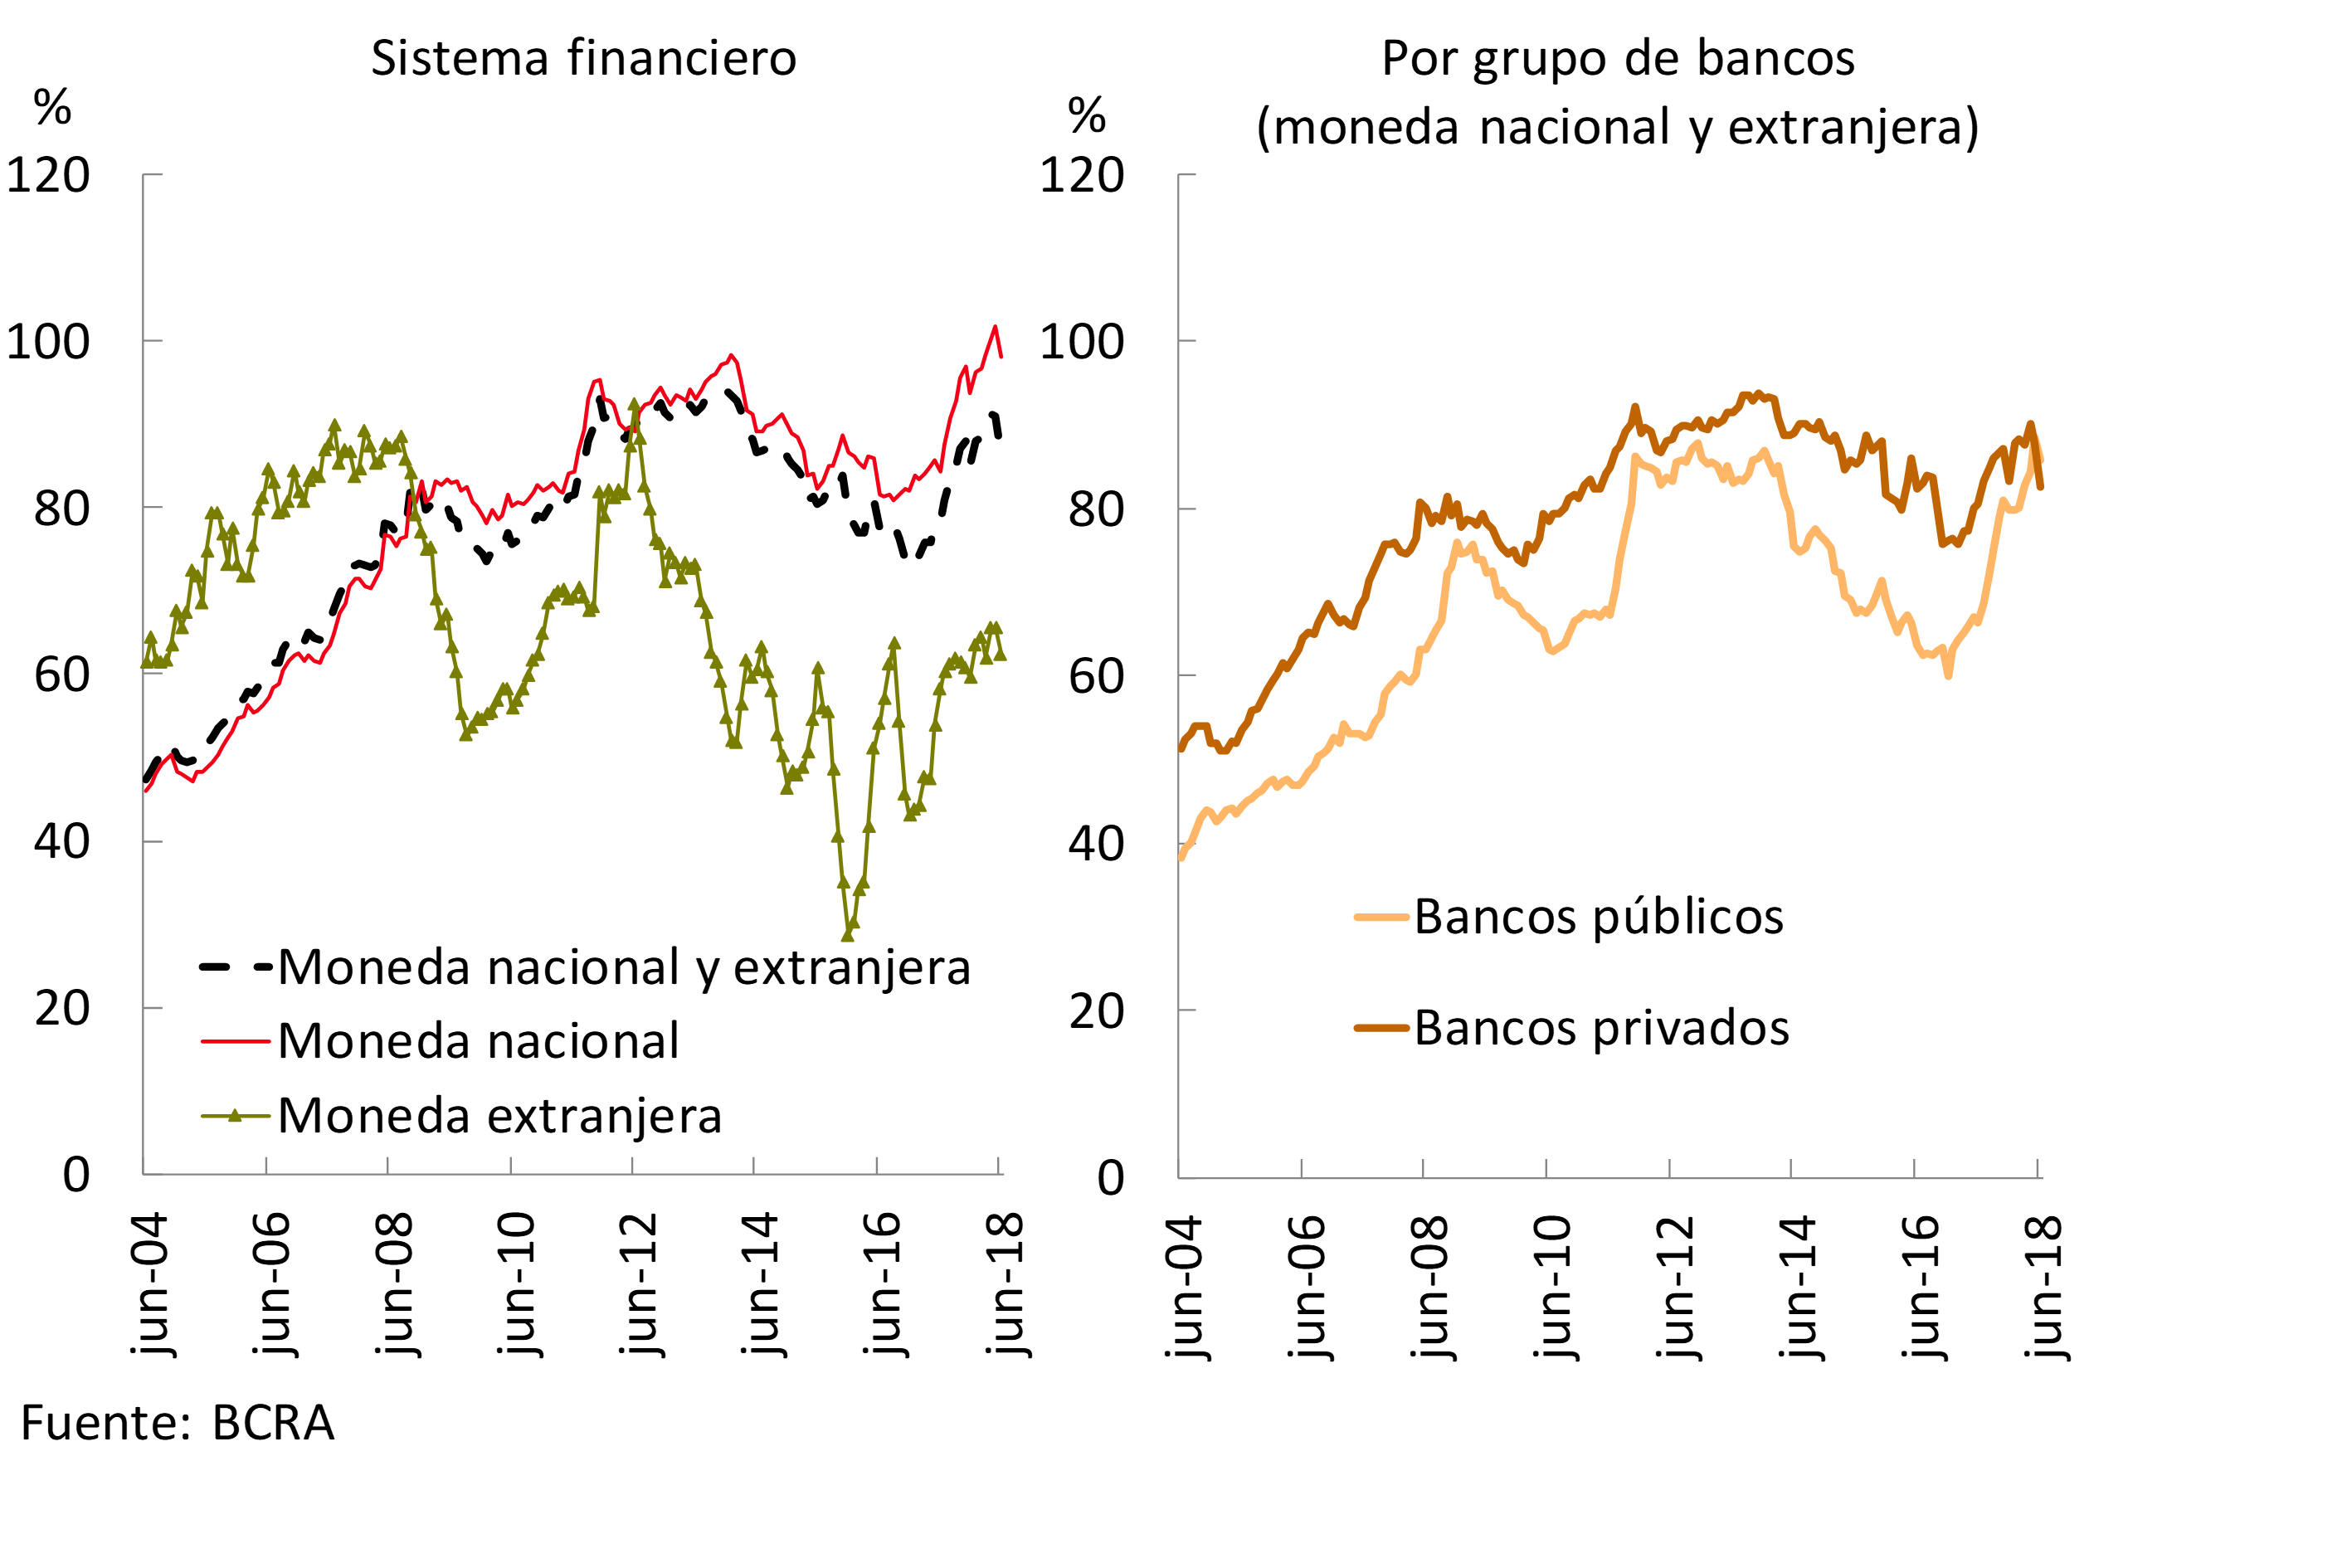
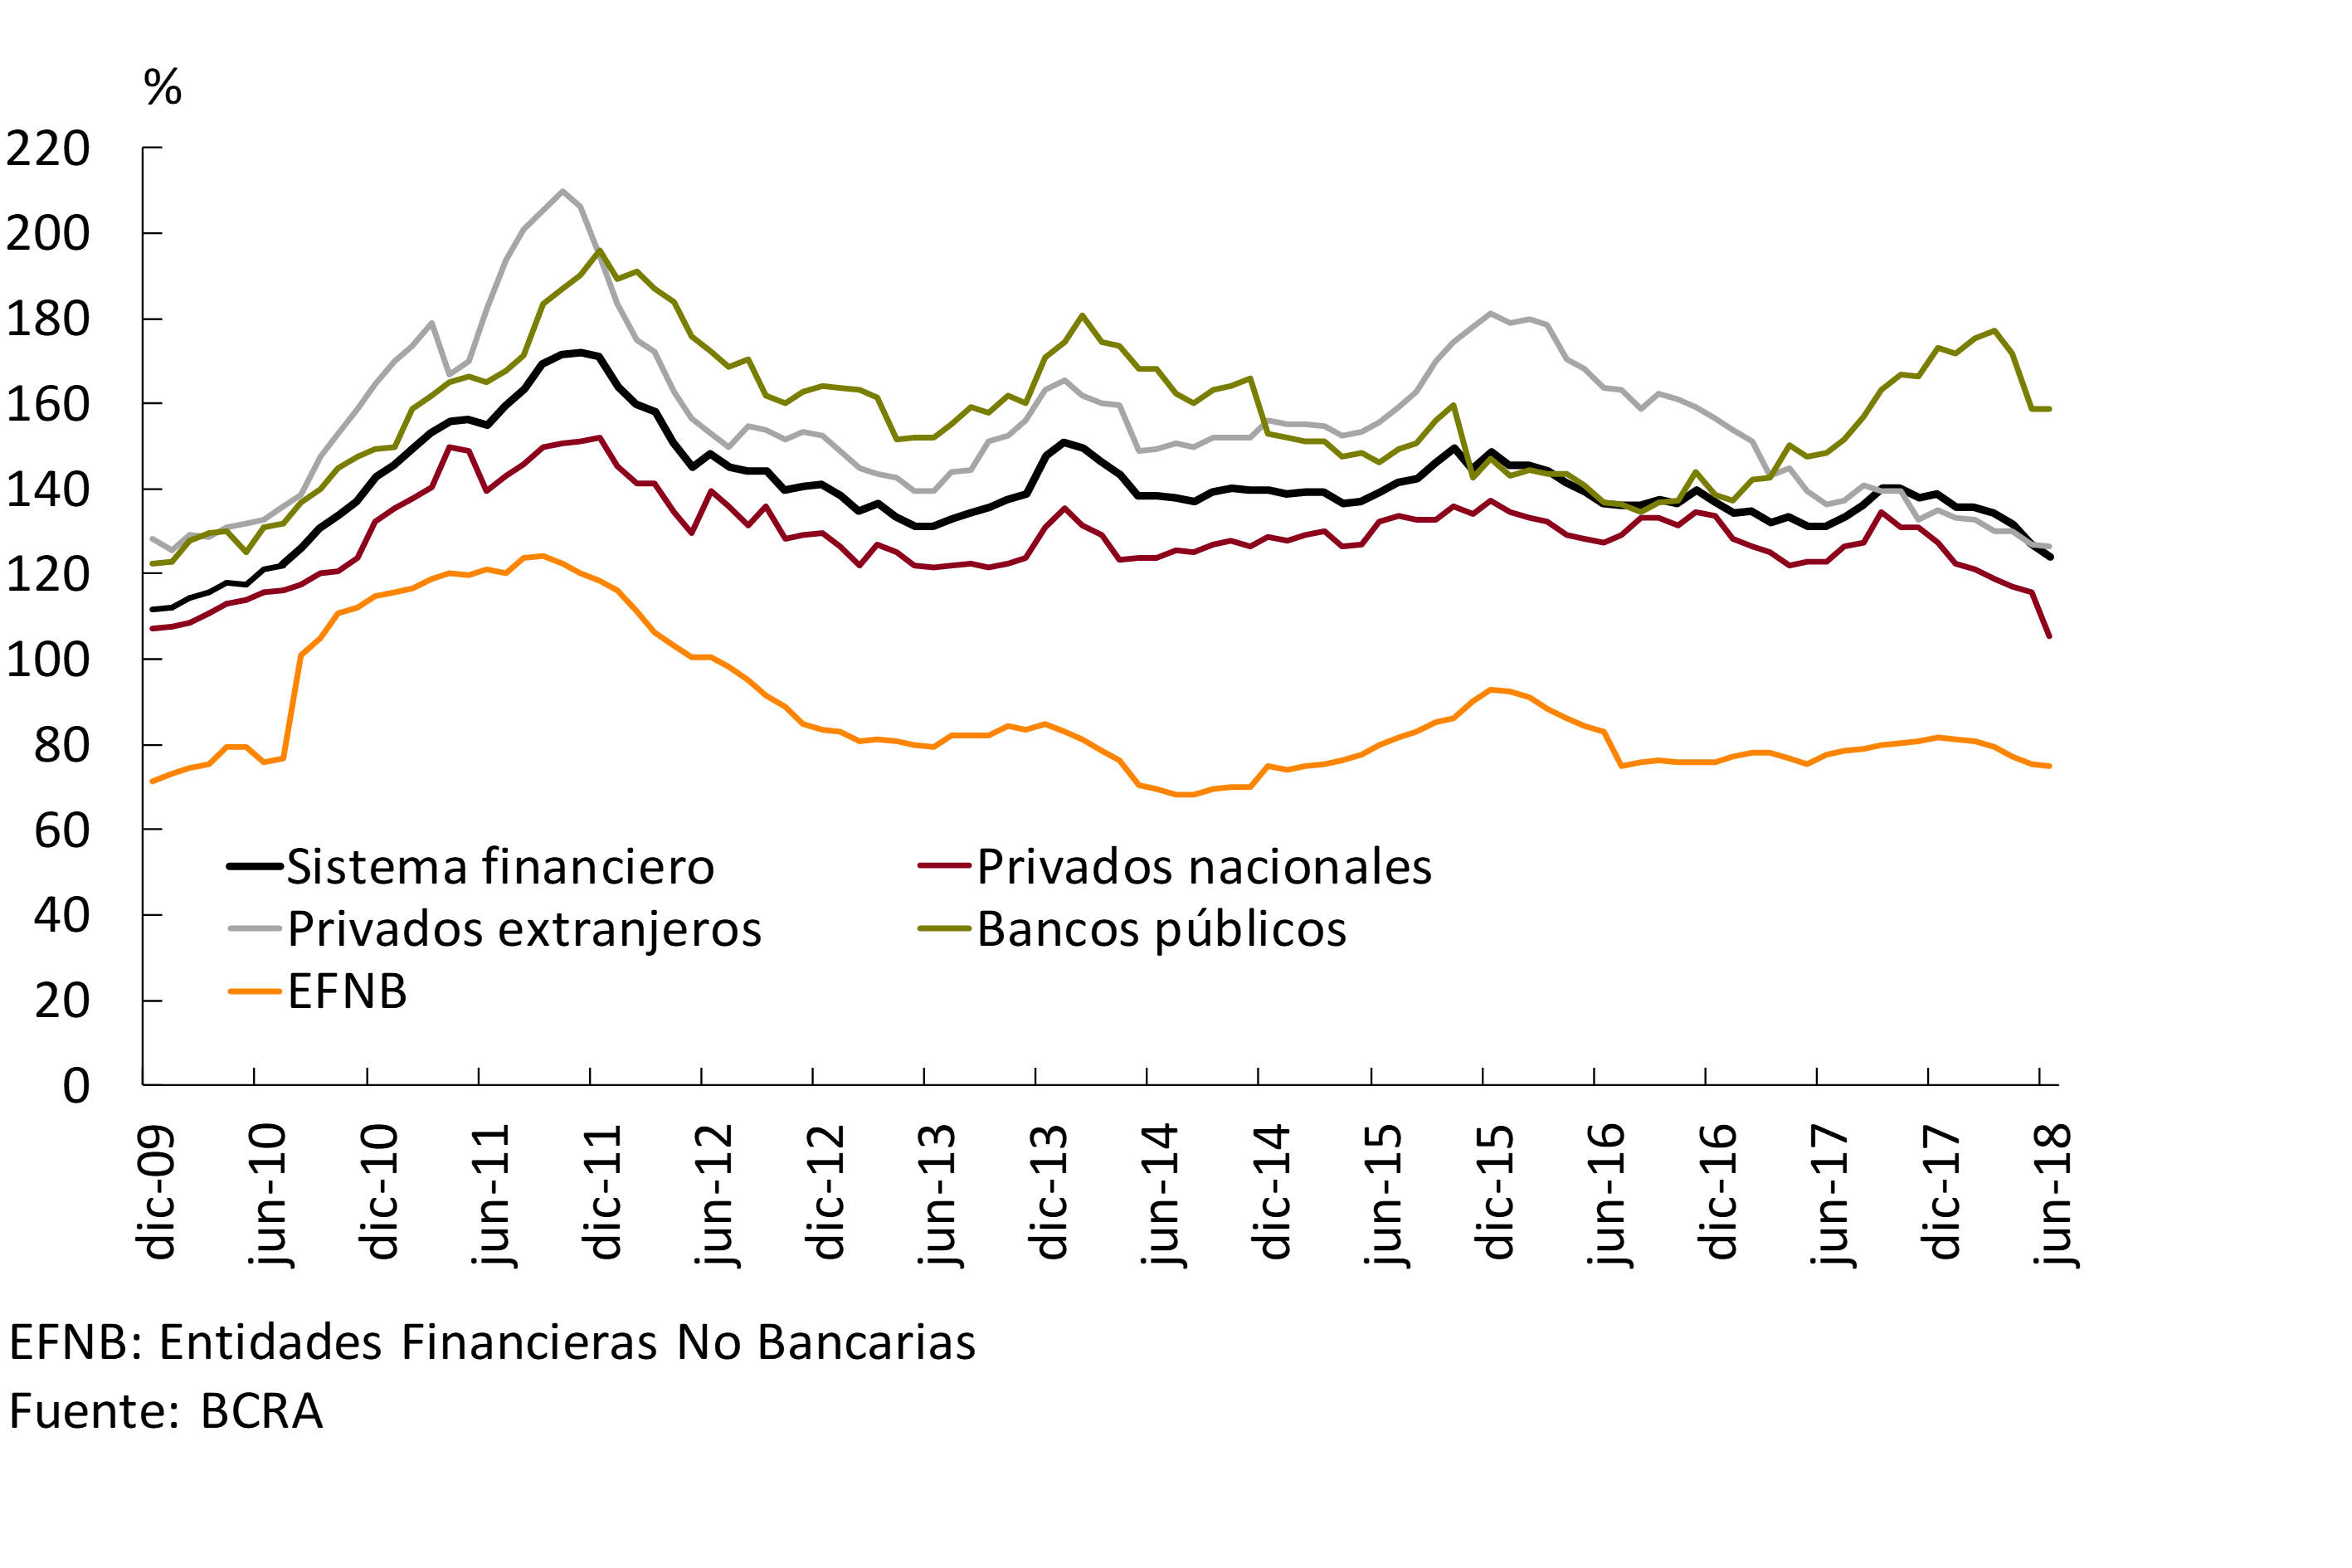
In June, financial intermediation with the private sector presented a moderate performance. During the period, the ratio of loans to private sector deposits fell to 86% (see Graph 1), although it remains above the average of the last 10 years. The monthly decrease in this ratio was evident both in the segment in pesos and in foreign currency items. Given that the reduction in this indicator was relatively greater in private banks, in June the quotient in this group was below that corresponding to public financial institutions. In this context, the net assets of the banks as a whole grew 4.1% in real terms1 in the month, accumulating an increase of 22.4% compared to mid-2017.
Graph 1 | Loans in Deposit Terms – Balance Sheet Balances – Private Sector
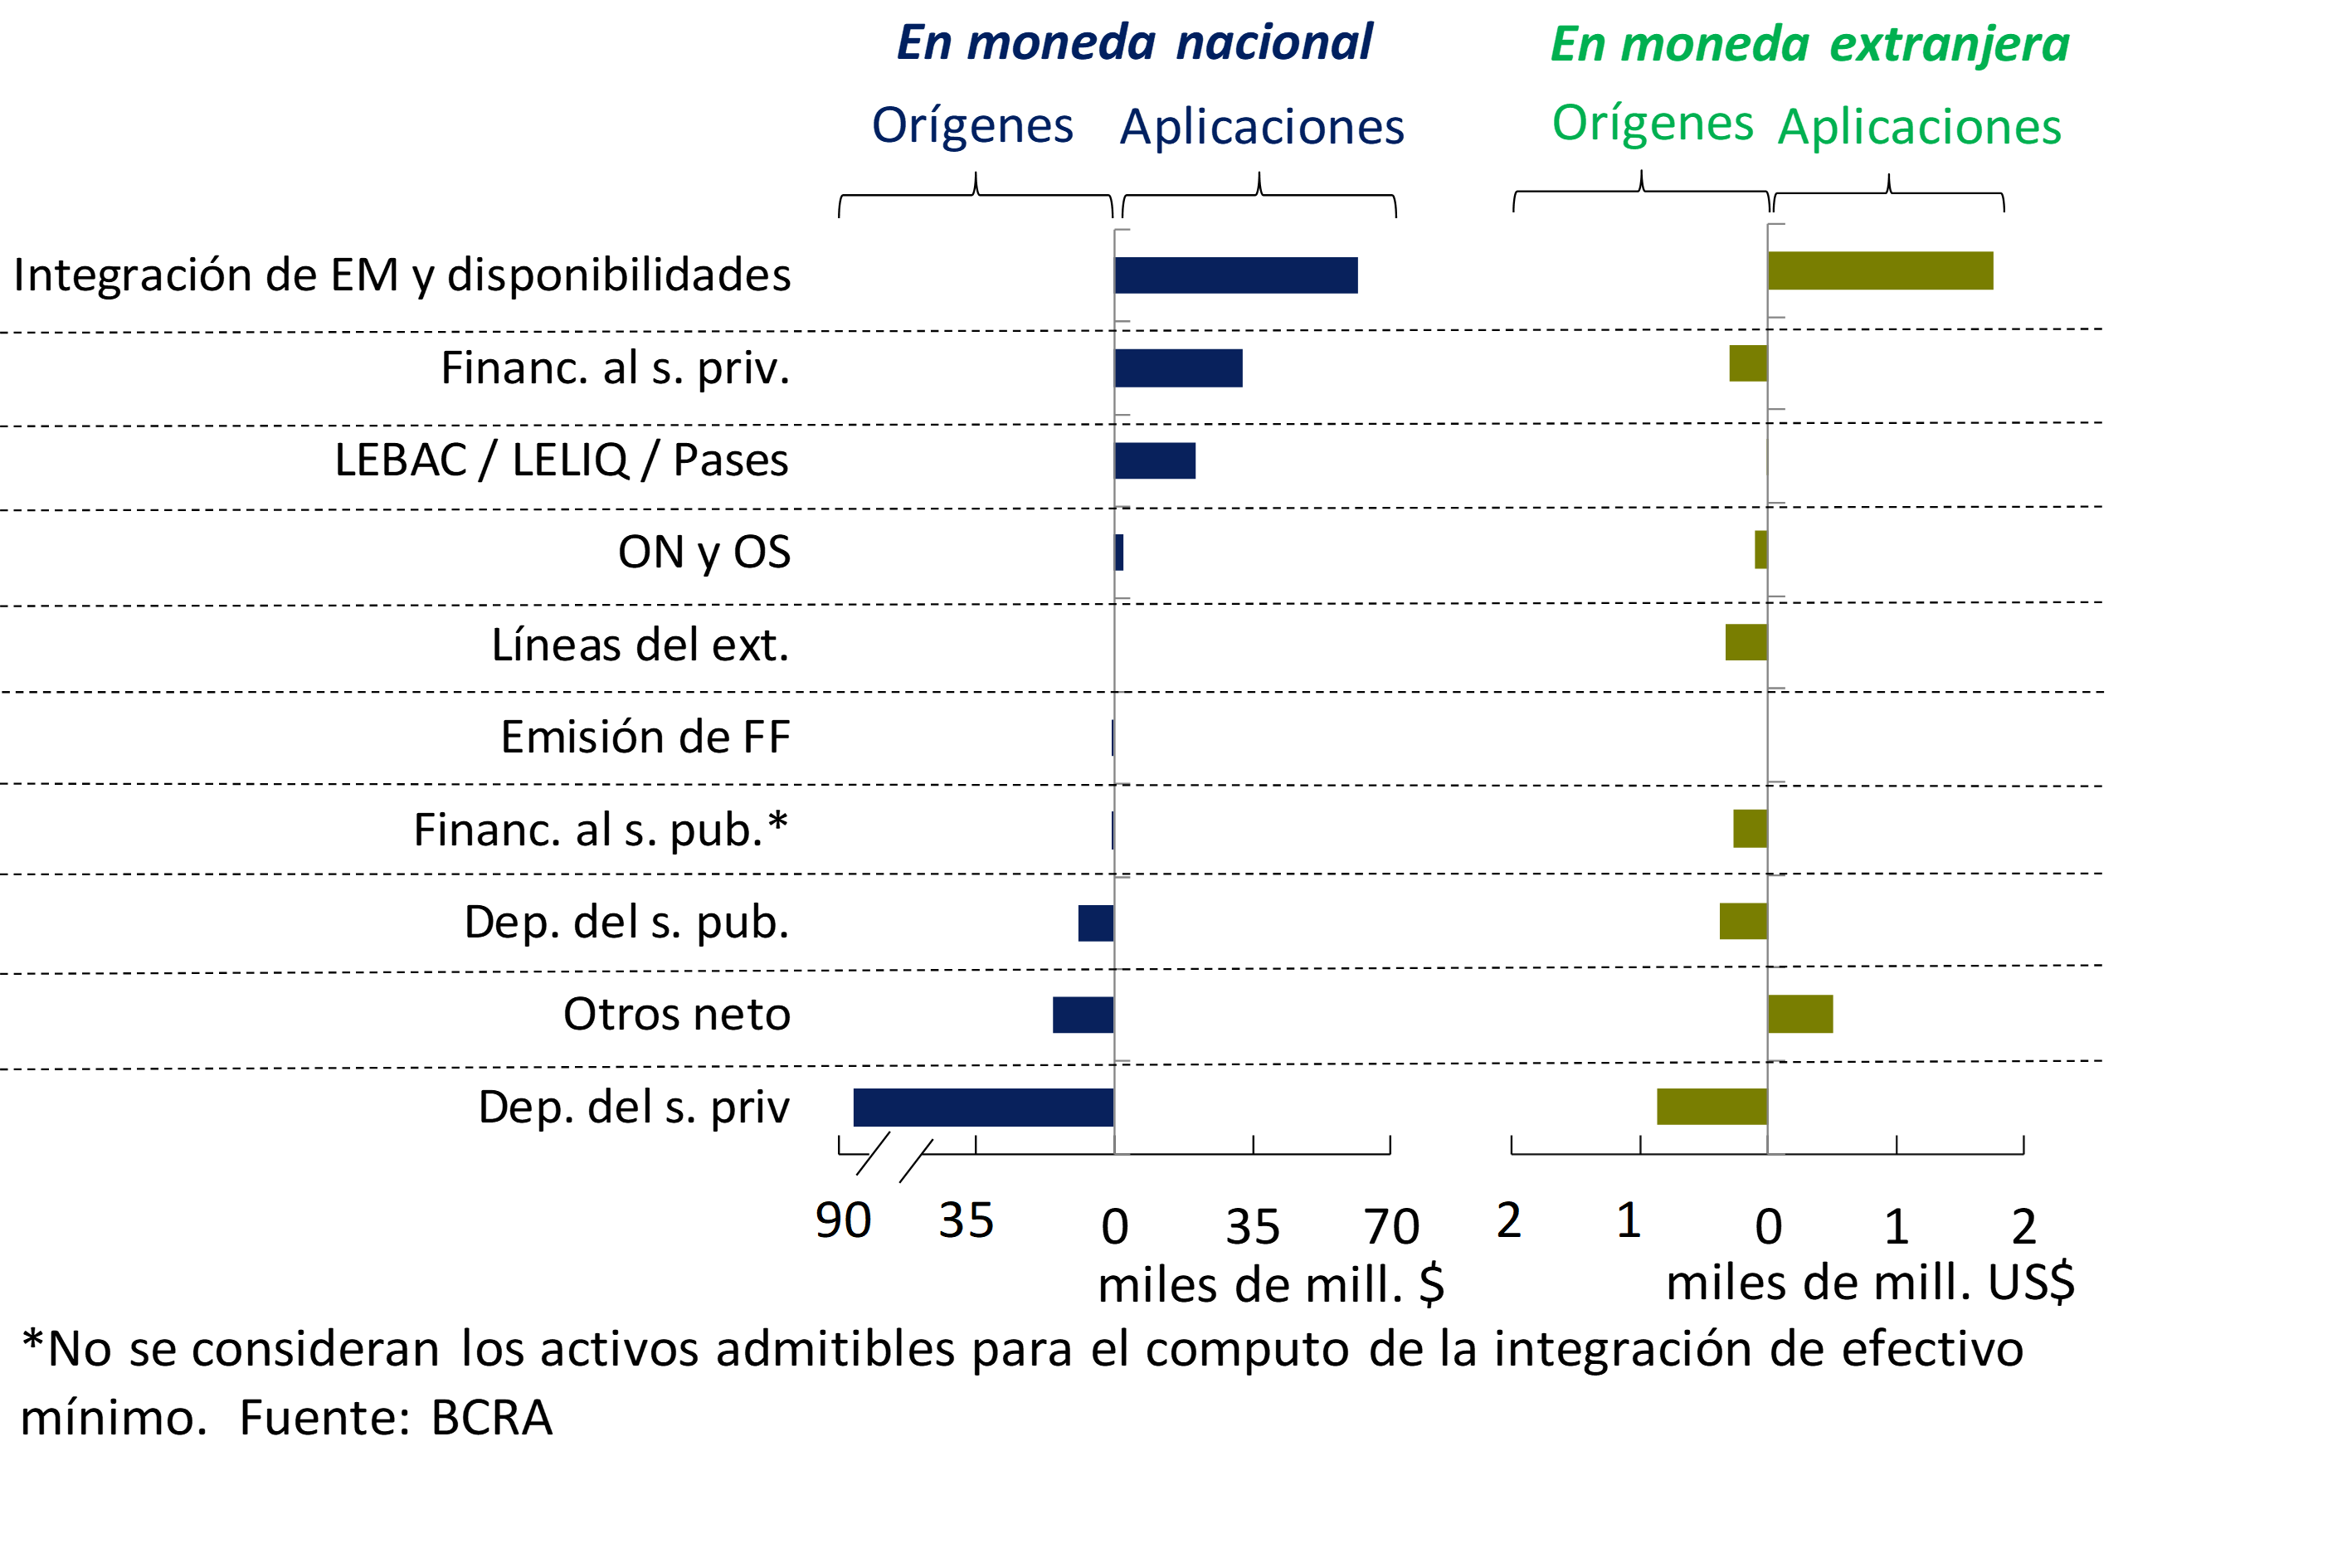
Considering the estimate of cash flow2 for operations in national currency, in June the increase in private sector deposits ($91,000 million) was the main source of resources for banks (see Graph 2). These funds were mainly applied to increase the integration of minimumcash 3 and availabilities ($62,000 million) and, to a lesser extent, to financing the private sector ($32,000 million). On the other hand, in the foreign currency segment, the most relevant source of funding was the increase in private sector deposits, followed by the increase in public sector accounts, the higher balance of foreign lines and lower financing. These funds were mainly used to increase liquidity in foreign currency.
Graph 2 | Monthly Cash Flow Estimate – June 2018 – Financial System – By Source Currency

According to the half-yearly cash flow4 in pesos, the increase in deposits from the public sector ($247,000 million) and the private sector ($160,000 million) was the most important source of resources for the financial system (see Graph 3). On the side of applications of funds in national currency, the expansion of credit to the private sector ($220,000 million) followed by the increase in the integration of minimum cash and availabilities ($139,000 million) were the most outstanding uses of funds in the period. On the other hand, considering the six-month evolution of items in foreign currency, the reduction in financing to the public sector and the increase in credit to the private sector were the origin and application of resources of greater magnitude in the first half of the year.
Graph 3 | Half-Year Cash Flow Estimation – Financial System – By Currency of Origin
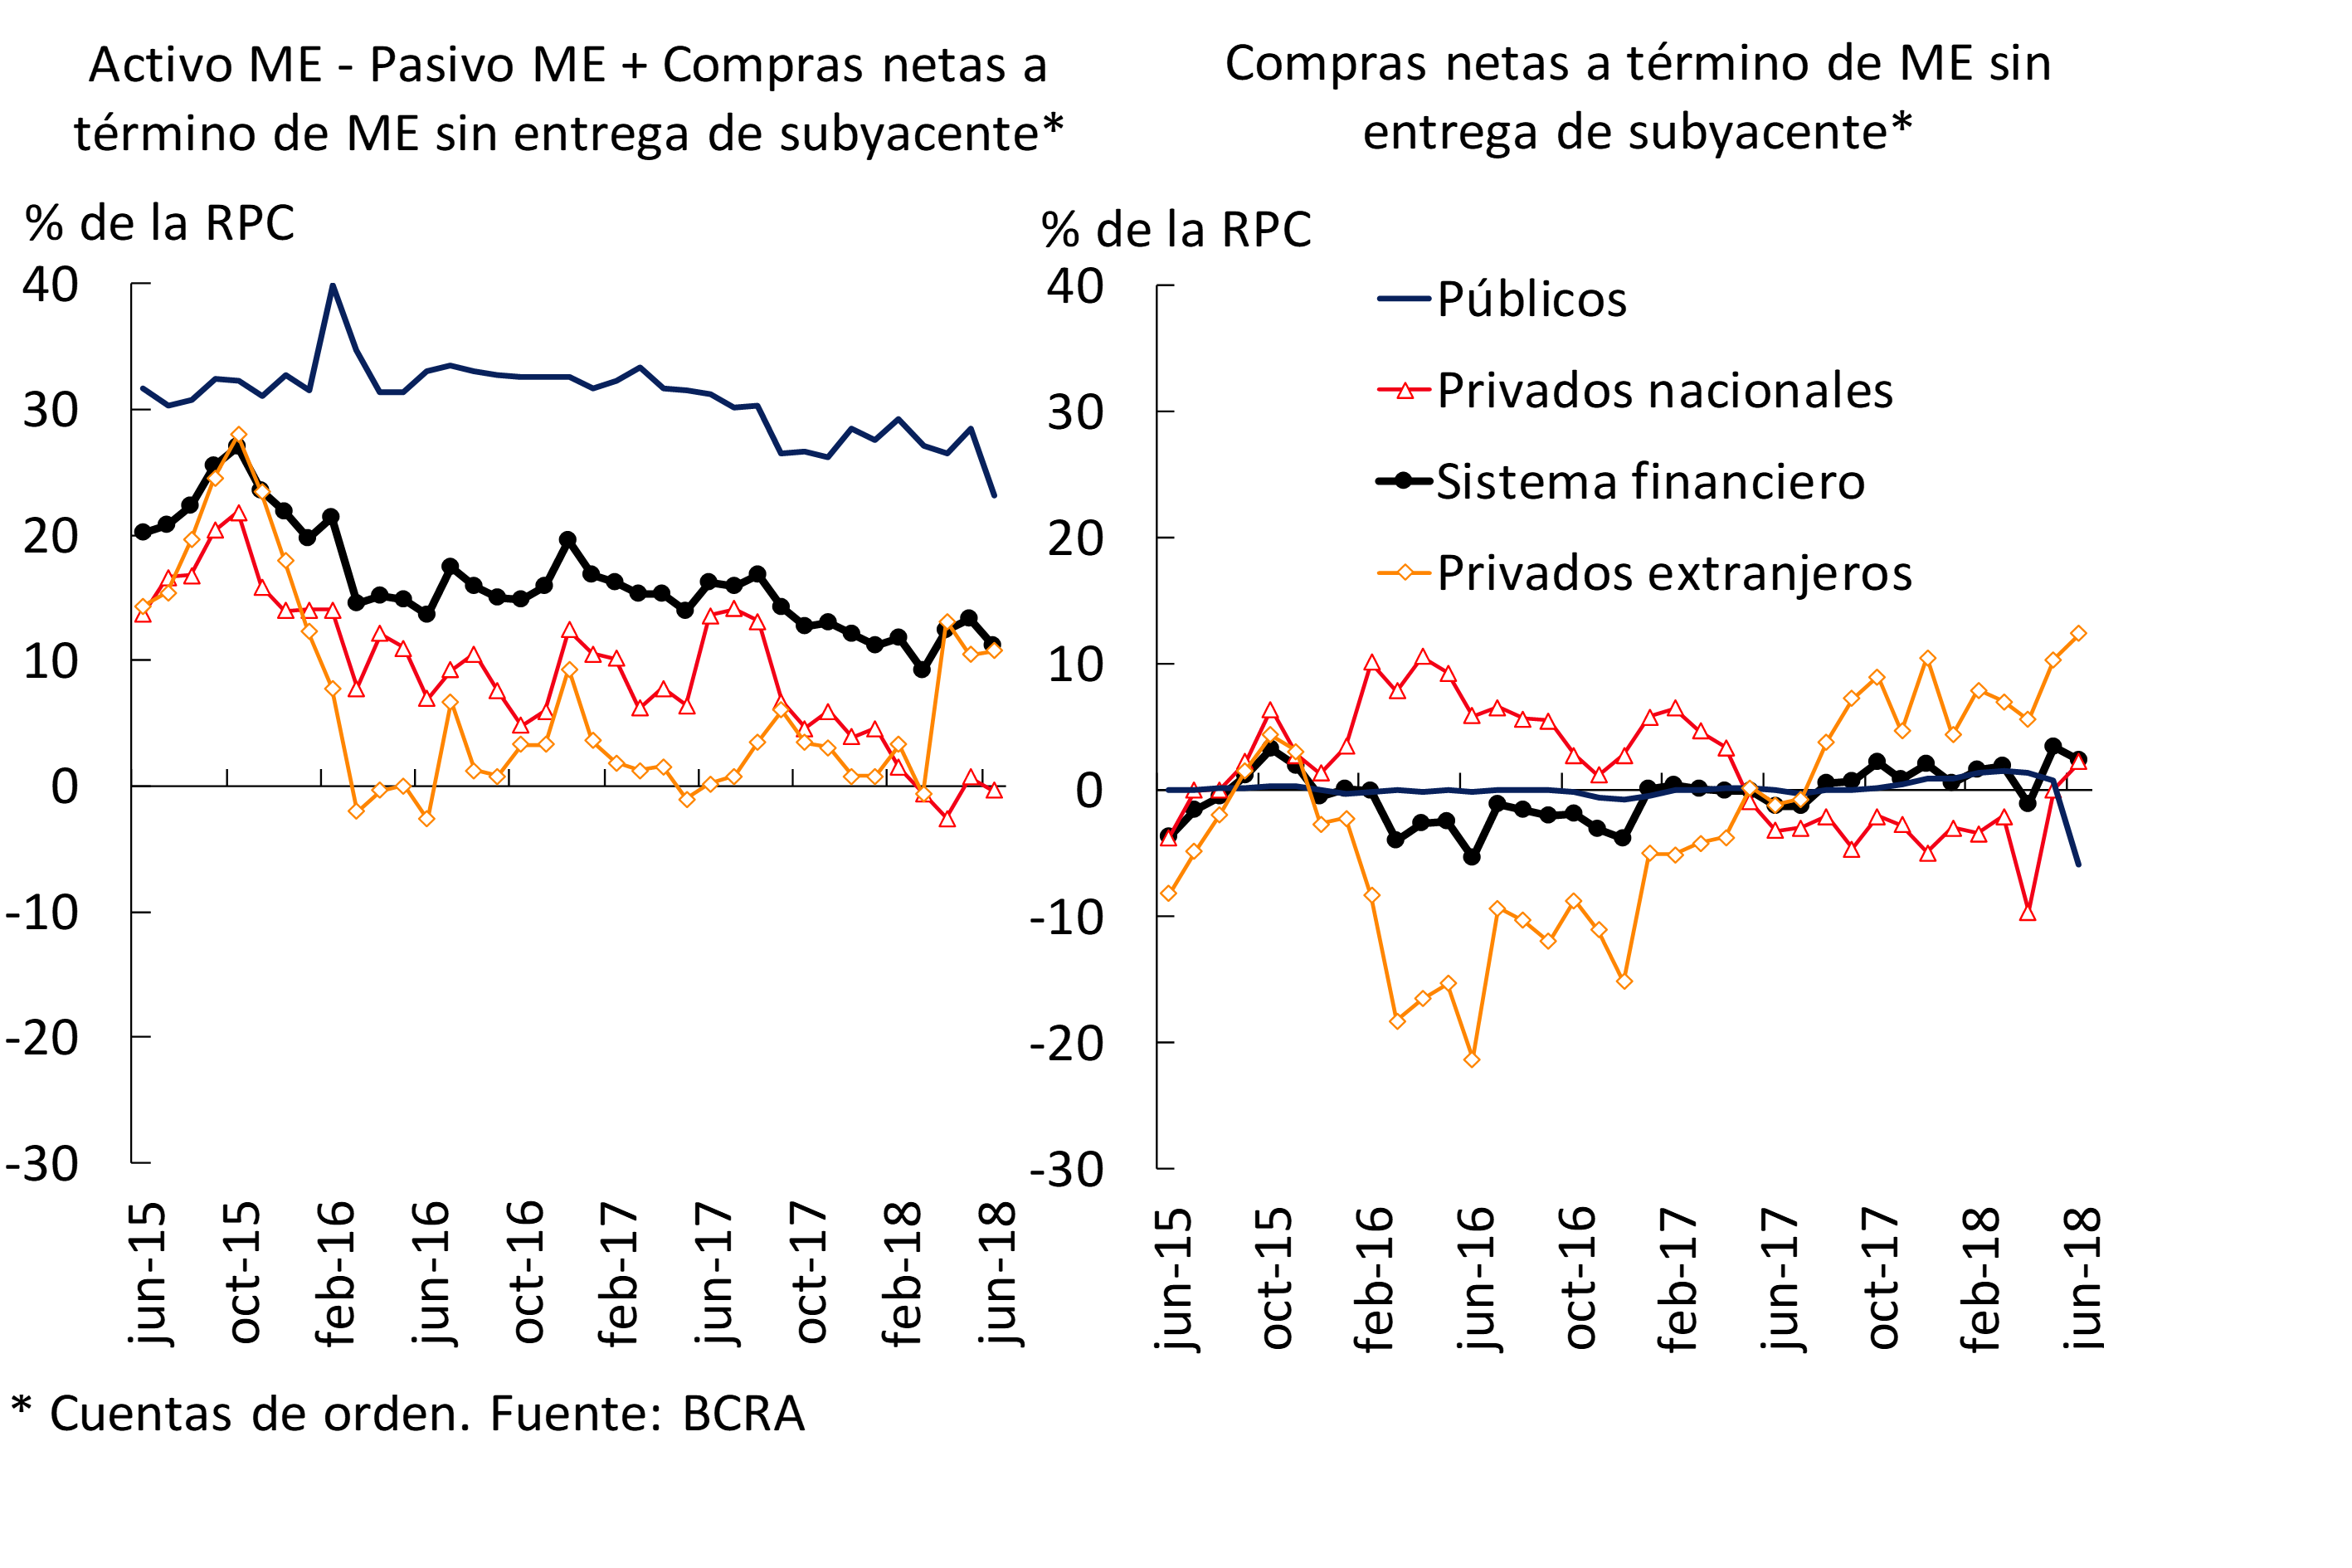
In June, the mismatch of foreign currency assets5 for the aggregate financial system was reduced by 2 p.p. of the Computable Patrimonial Liability (CPR) to 11.3% (see Graph 4). The monthly decrease was mainly explained by higher forward sales of foreign currency by public banks. It should be recalled that in June the regulatory change that reduced the positive limit of the Global Net Foreign Currency Position came into force and was migrated to a daily regulation of said position6. On the other hand, in relation to the evolution of bank assets and liabilities adjustable by CER, the spread of aggregate balance sheet balances in terms of the PRC did not show significant changes in June, representing 43.2%. This mismatch is mainly explained by public banks.
Figure 4 | Foreign Currency Mismatch by Bank Group
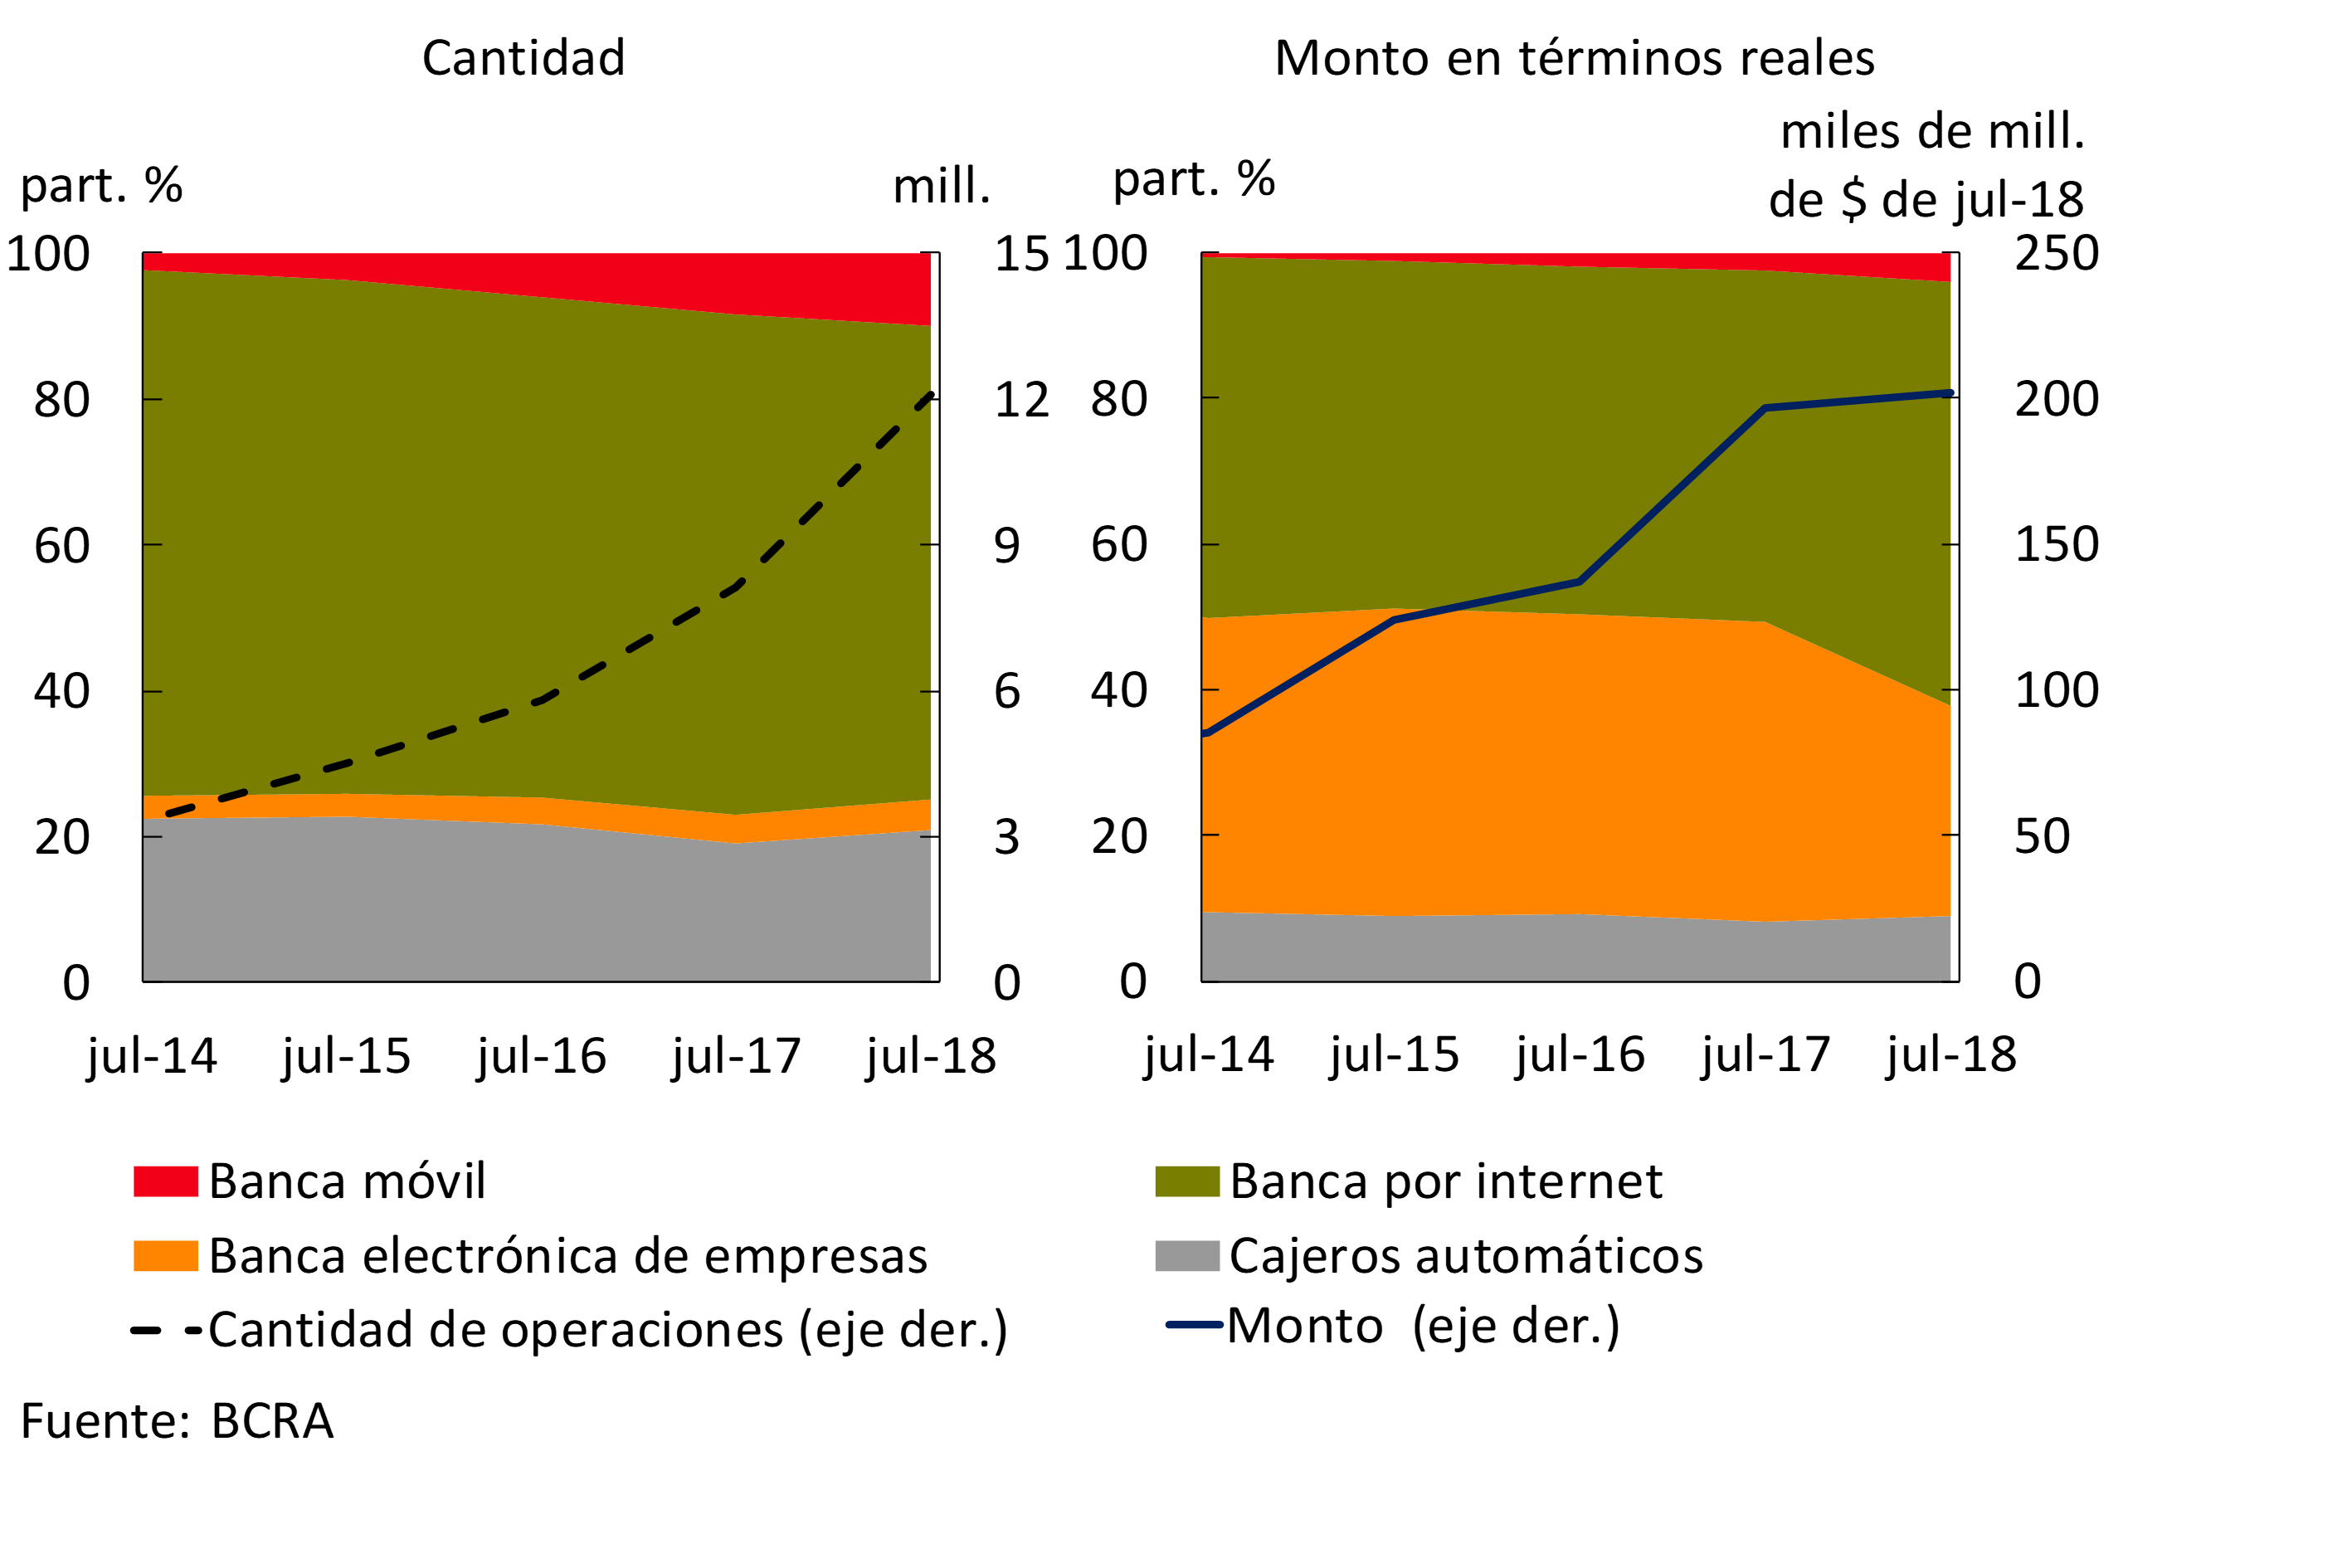
Taking into account the operations of the payment system, immediate transfers continued to grow. These operations increased 48.9% YoY in quantities and 2.8% YoY in real values as of July (latest information available). Considering the channels through which immediate transfers are made, the increase in the participation of mobile banking continues to stand out (see Graph 5). For its part, internet banking gained relevance in terms of the amounts traded to the detriment of electronic business banking.
Graph 5 | Immediate Channel Transfers of Funds
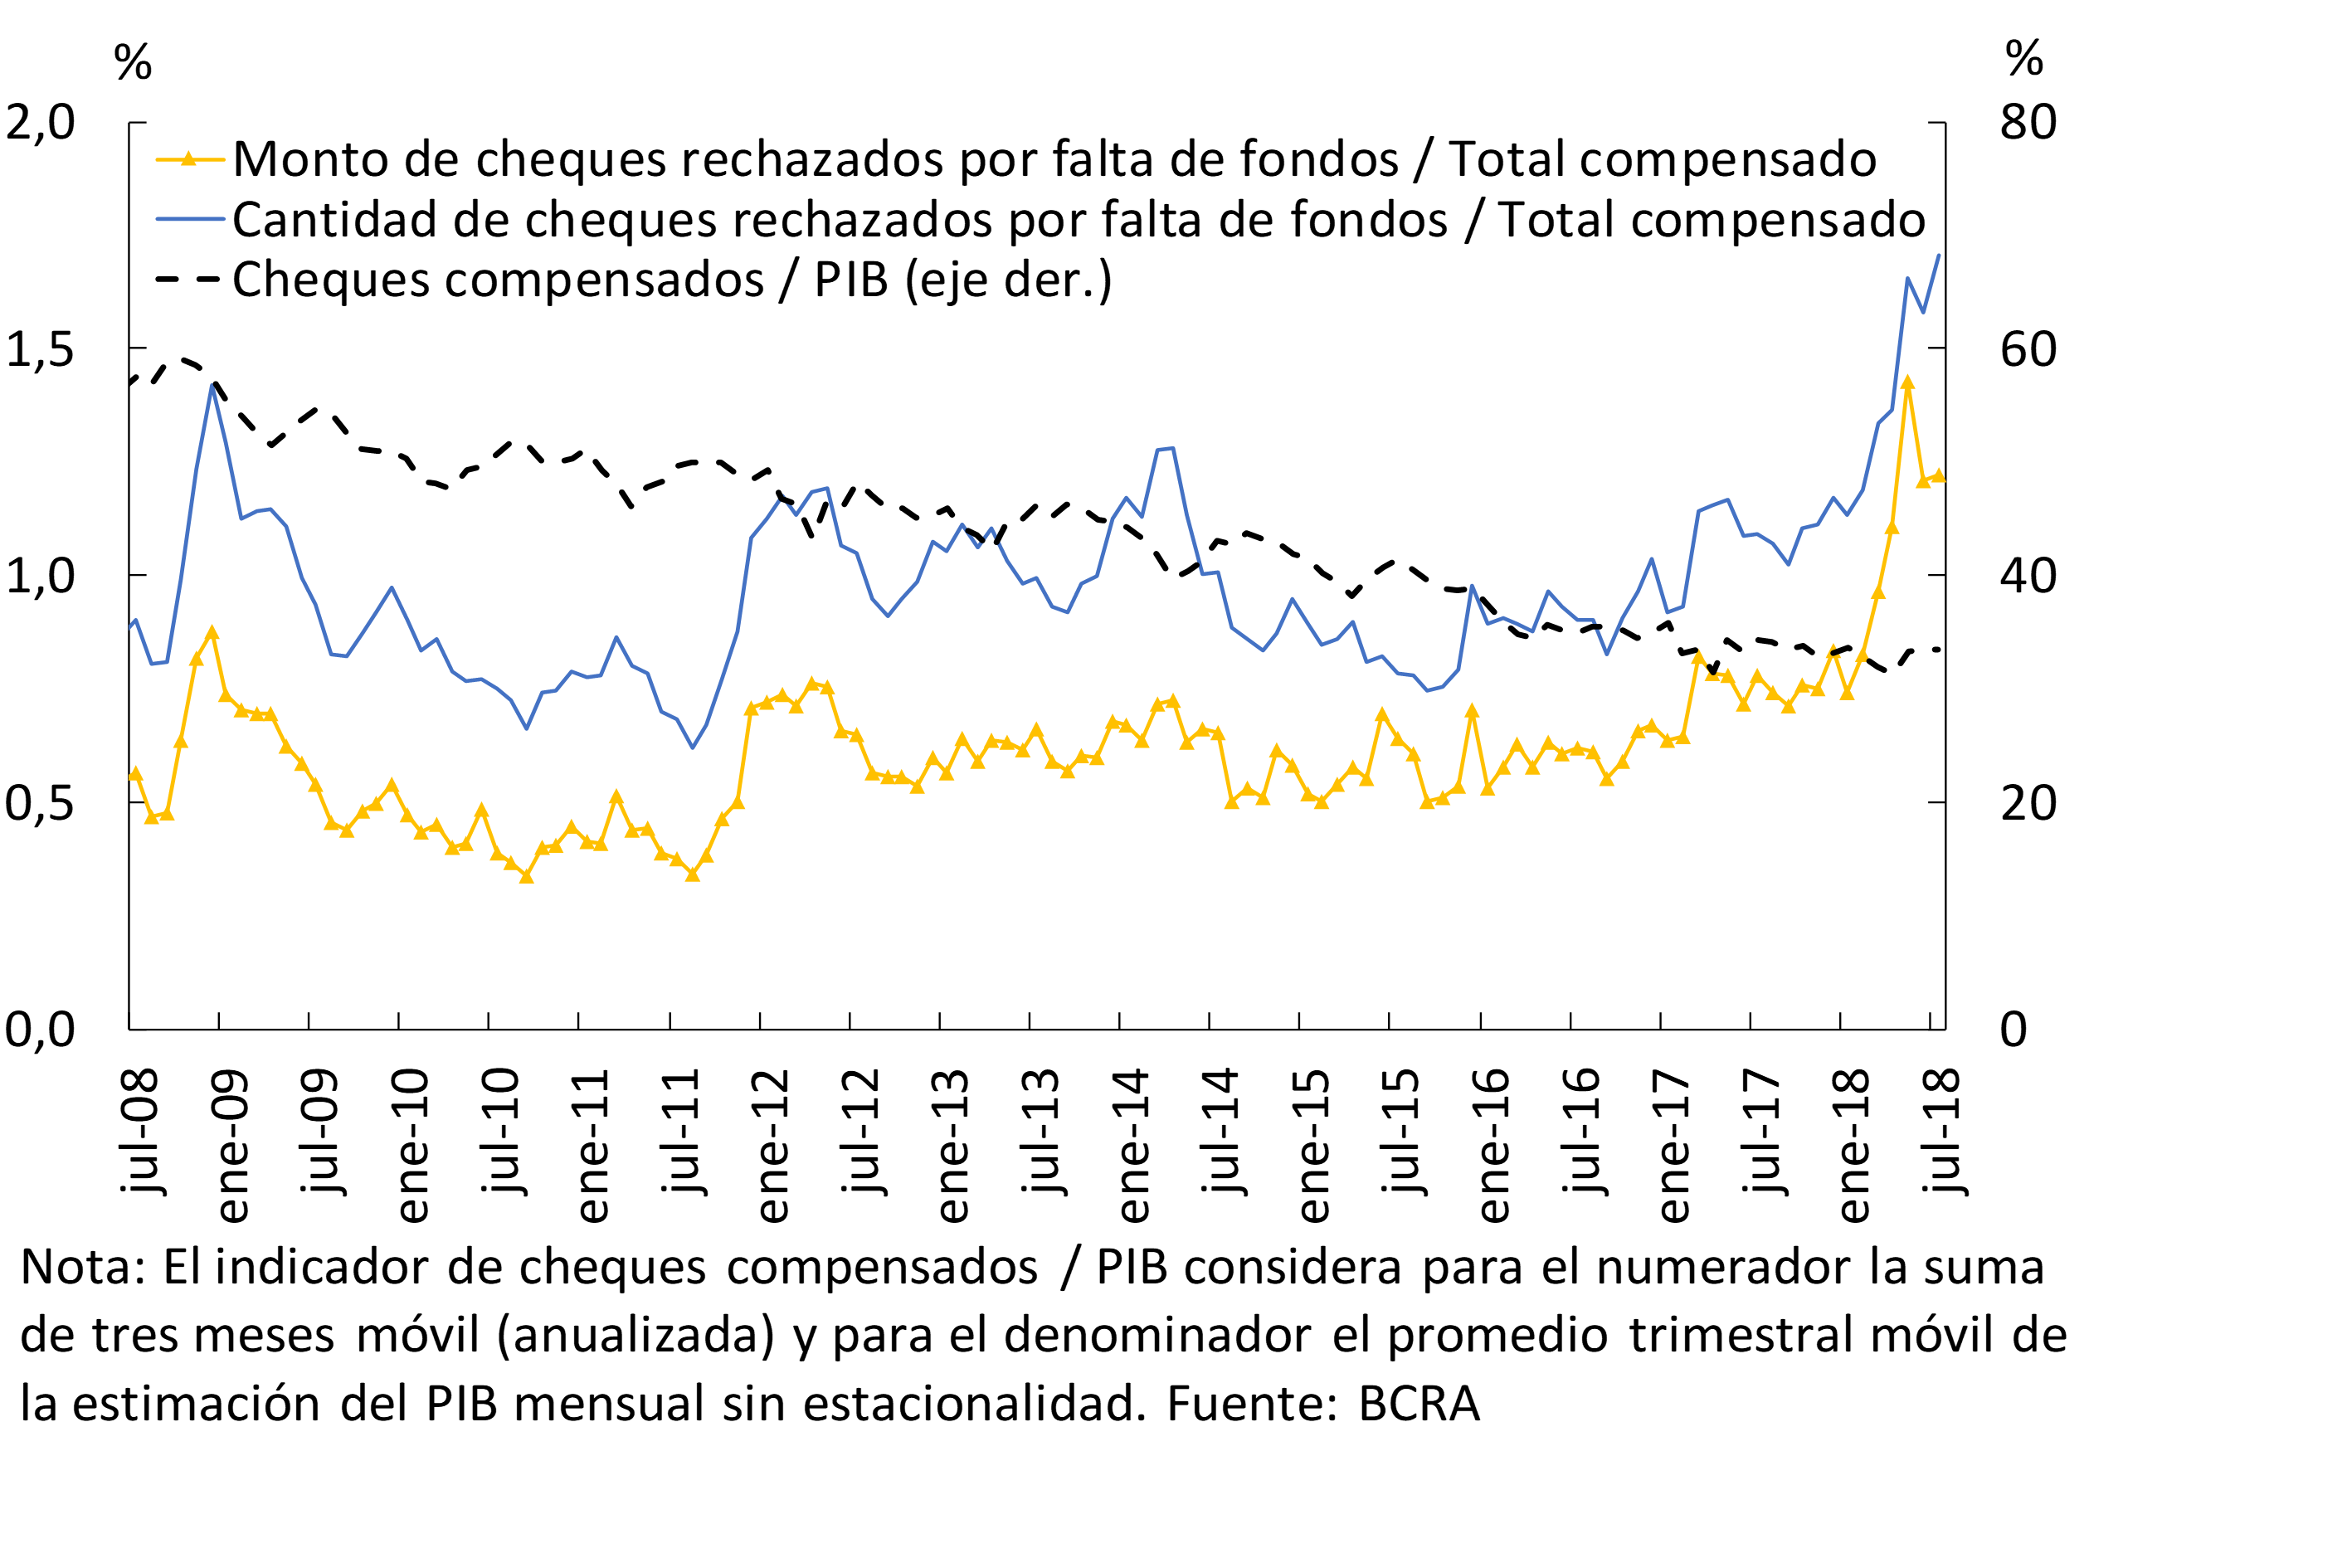
Check clearing continued to reduce its relevance. In particular, the amount of documents offset in relation to GDP was around 33.6%, 0.7 p.p. lower than in the same period of 2017 (see Graph 6). In this context, in July the ratio of checks rejected due to lack of funds did not present a significant monthly change in terms of amounts issued (level of 1.22%, remaining below the peak of May), while it increased slightly in terms of amounts (level of 1.71%).
Graph 6 | Cleared and Bounced Checks
II. Deposits and liquidity
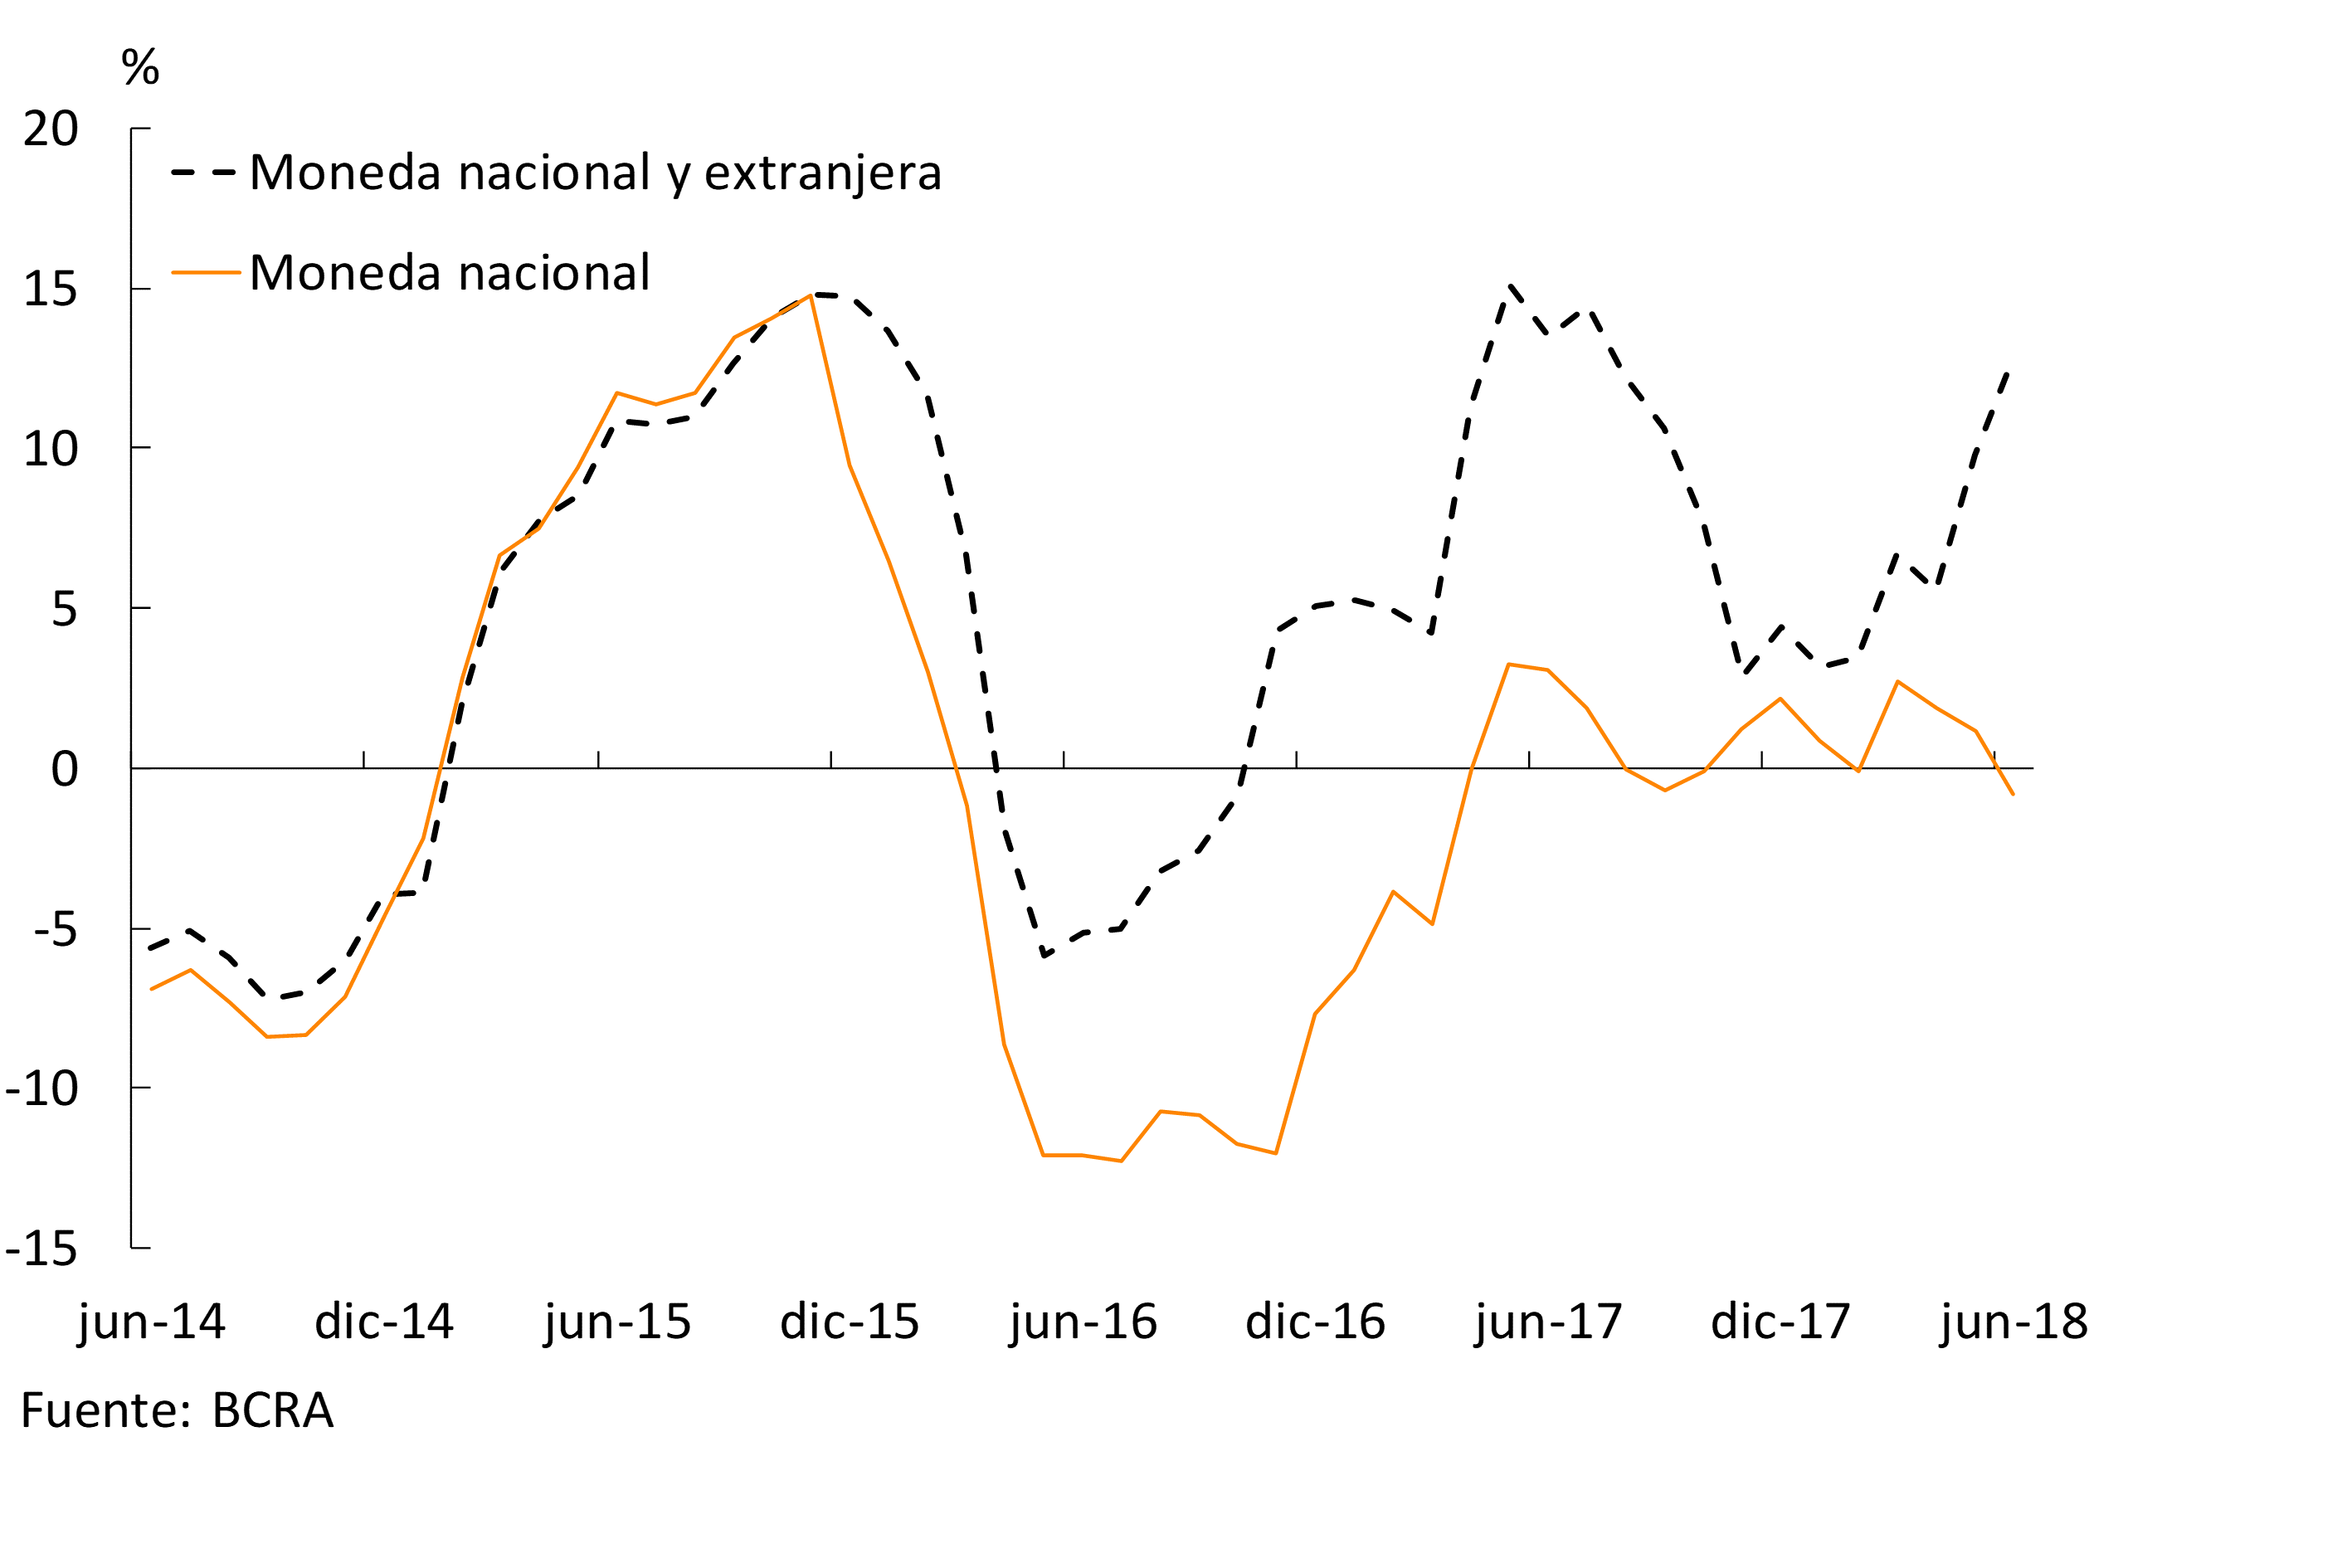
In June, total deposits in national currency increased 0.9% when adjusted for inflation, driven by private sector impositions that increased 2.1% in real terms in the period. Within the latter segment, demand accounts grew 7.9% in the month, while term placements fell 4.3% – both values adjusted for inflation – in a context characterized by the greater demand for liquidity to meet the payment of the complementary half annual salary. For their part, total deposits arranged in foreign currency increased 4.1% – in source currency – in June, driven by placements from the public and private sectors.
In a year-on-year comparison, the total balance of deposits in pesos grew 8.5% adjusting for inflation, a dynamic driven by public sector placements that grew 41.4% in real terms in the period. Meanwhile, private sector deposits in national currency remained unchanged in real terms (-0.8% YoY, see Chart 7). On the other hand, total placements in foreign currency expanded 19.4% – in source currency – in the last twelve months, with an increase of 18.2% y.o.y. – in source currency – in those of the private sector.
Figure 7 | Total Private Sector Deposits – Var. A.I. of the balance in real terms
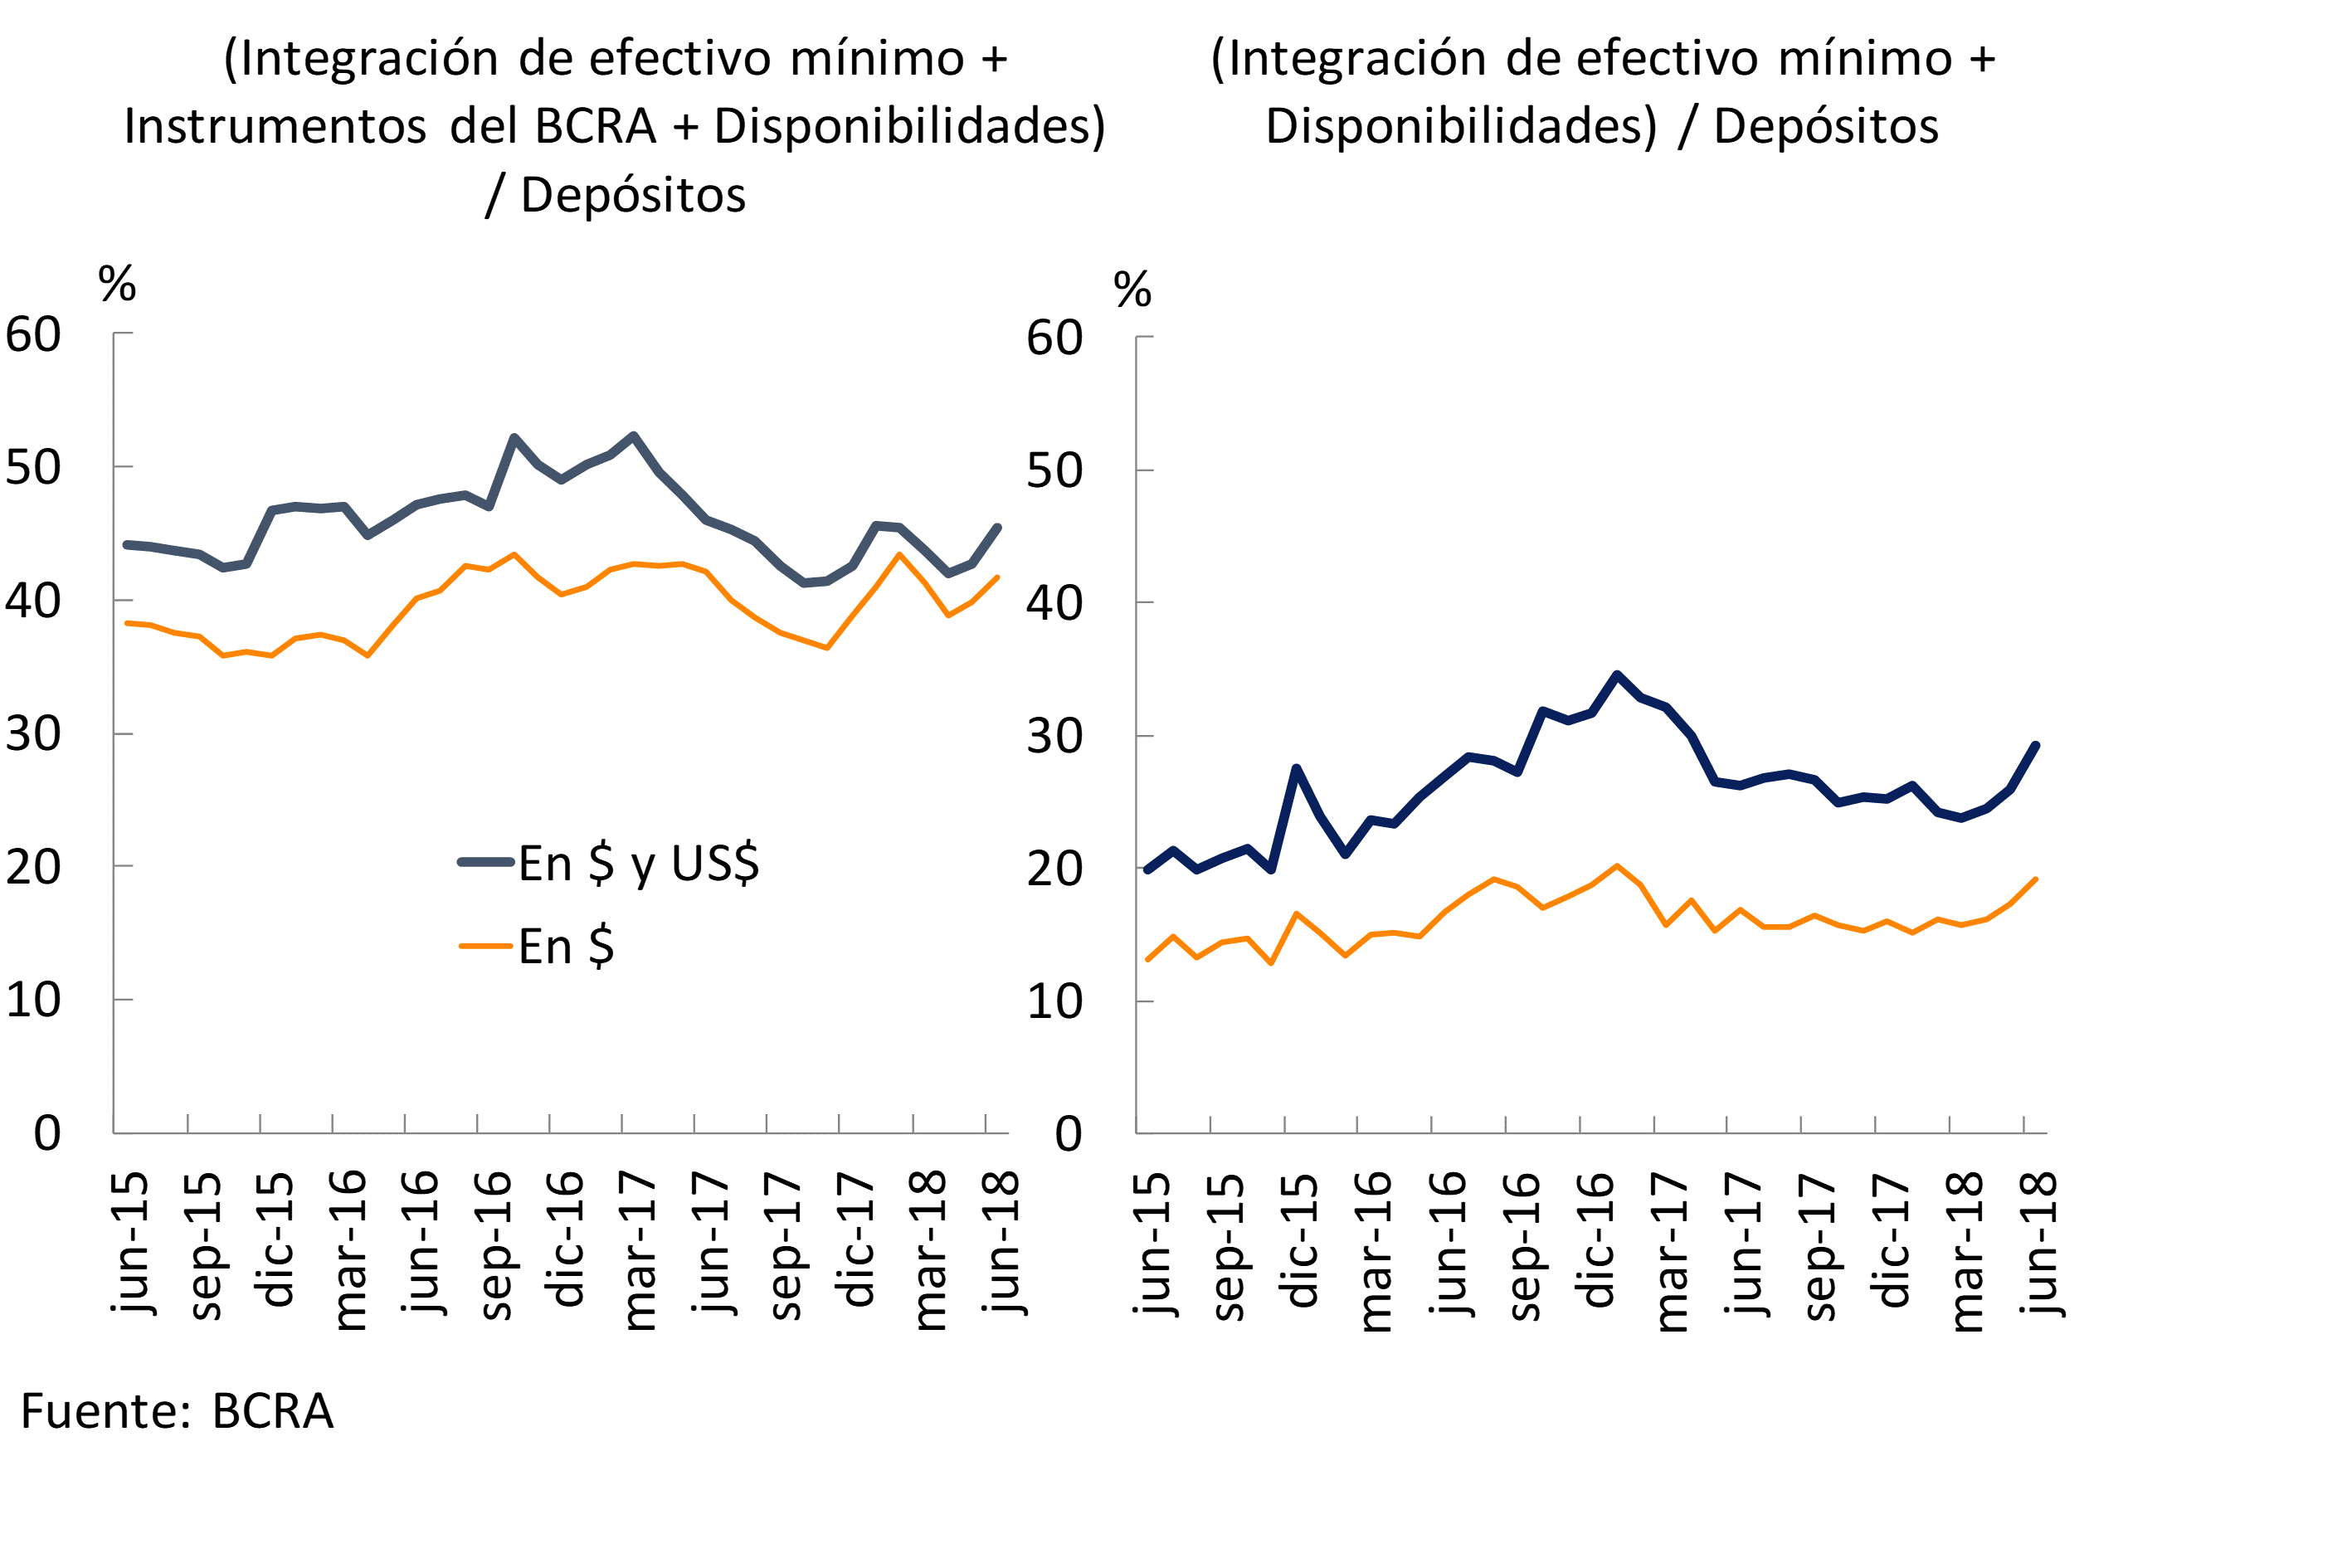
As of June, the BCRA ordered a phased increase in bank reserve requirements7, and the possibility of integrating these requirements through National Treasury Bonds maturing in 2020. In this context, the broad liquidity indicator of the financial system8 – in domestic and foreign currency – totaled 45.4% of total deposits in June (41.7% in peso items), increasing 2.6 p.p. (1.8 p.p.) compared to last month (see Chart 8). As a result of the new regulations, there was a change in the composition of liquid assets during the period, with a decrease in the holdings of LEBAC and LELIQ and an increase in the public sector assets admitted to comply with the reserve requirement requirement. The strictest liquidity indicator9 – in domestic and foreign currency – increased deposits by 3.3 p.p. in the month to around 29.3% (54.6% when considering only items in foreign currency). Compared to the same period last year, bank liquidity fell by 0.6 p.p. of deposits for the broad indicator and increased by 3.1 p.p. for the strict indicator.
Figure 8 | Liquidity of the Financial System
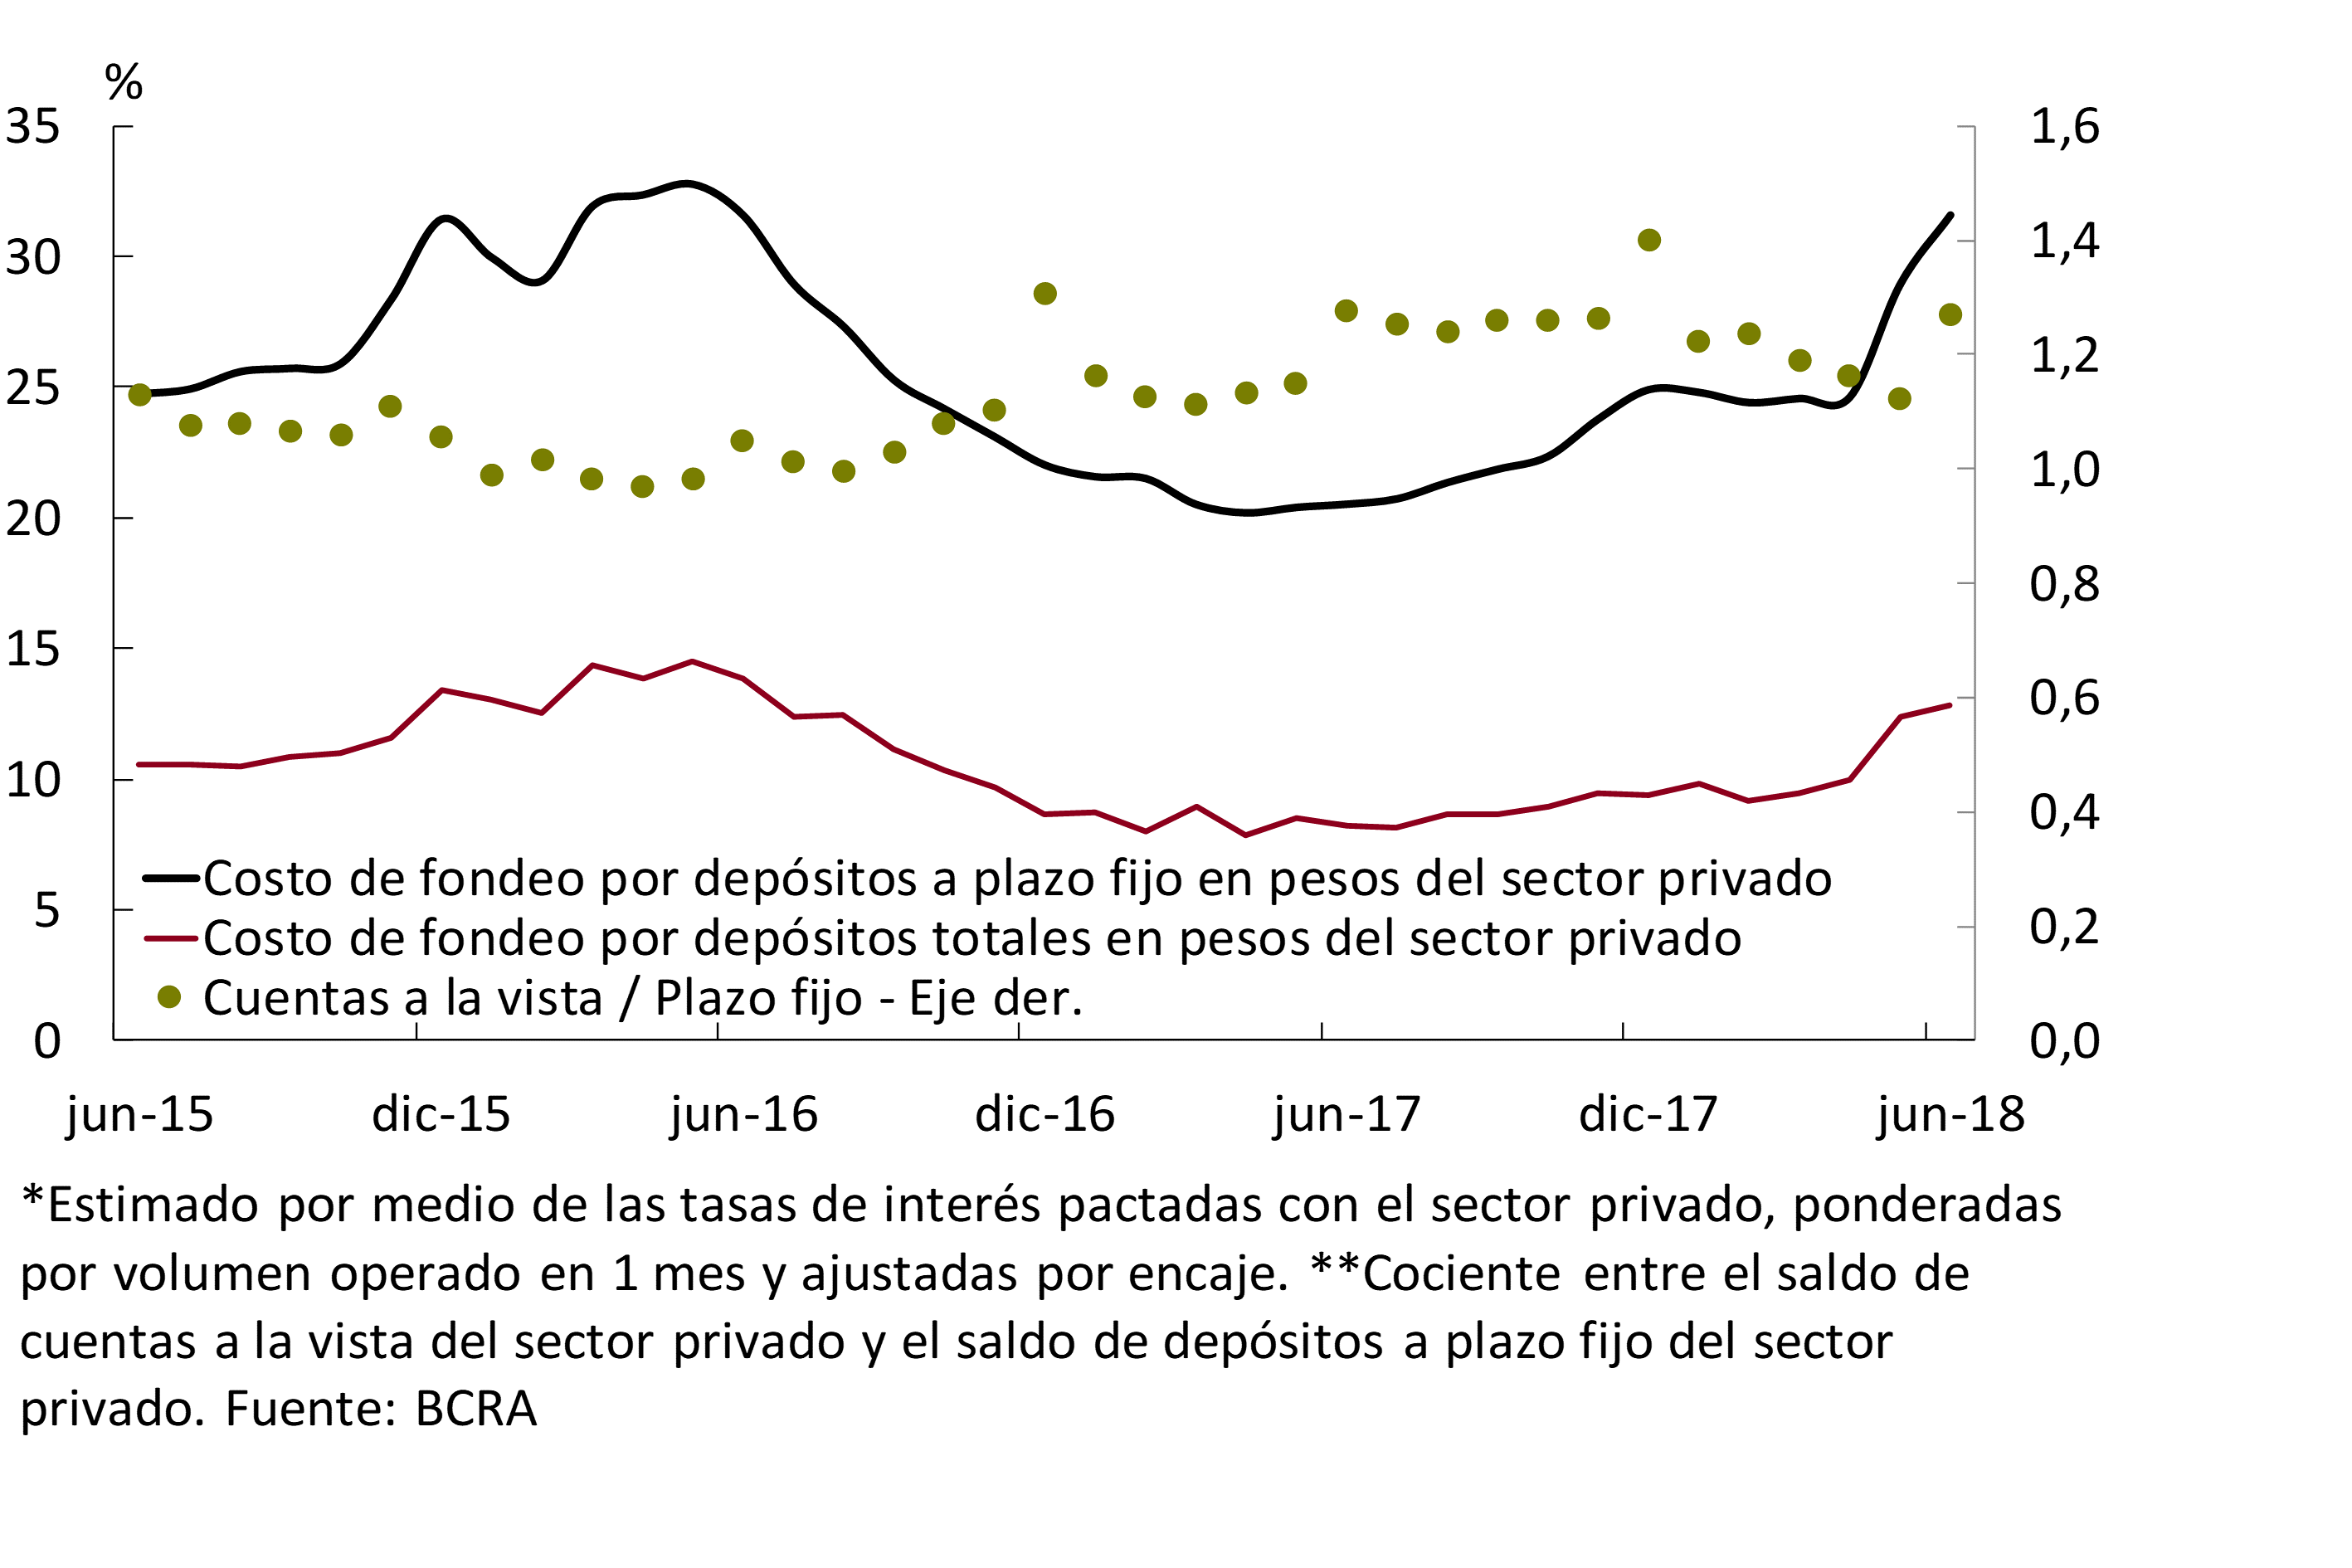
In line with the increase in the monetary policy interest rate that began at the end of April, the rate that banks operated with the private sector for fixed-term deposits in pesos increased 2.4 p.p. in June, to 28% nominal annual on average. In this context, it is estimated that the total funding cost for private sector deposits in national currency increased compared to May. This increase was mainly explained by the aforementioned rise in the interest rate operated, which was tempered by the lower weighting of time placements in the total private sector deposits in pesos (see Chart 9).
Figure 9 | Estimated Funding Cost for Private Sector Deposits in Pesos* and Ratio between Demand and Time Deposits**
III. Financing
In the month, the balance of bank financing in national currency to the private sector fell by 1.6% when adjusted for inflation (+2.1% nominal). Almost all credit lines showed declines in real terms compared to May, with the exception of advances. For its part, in June, financing in foreign currency decreased 1.8% – in currency of origin – with the card segment being the one that verified the largest relative monthly drop. In this context, when incorporating the effect of the depreciation of the peso against the dollar in the period, the total balance (in domestic and foreign currency) of loans to the private sector expressed in pesos increased by 0.8% in real terms.
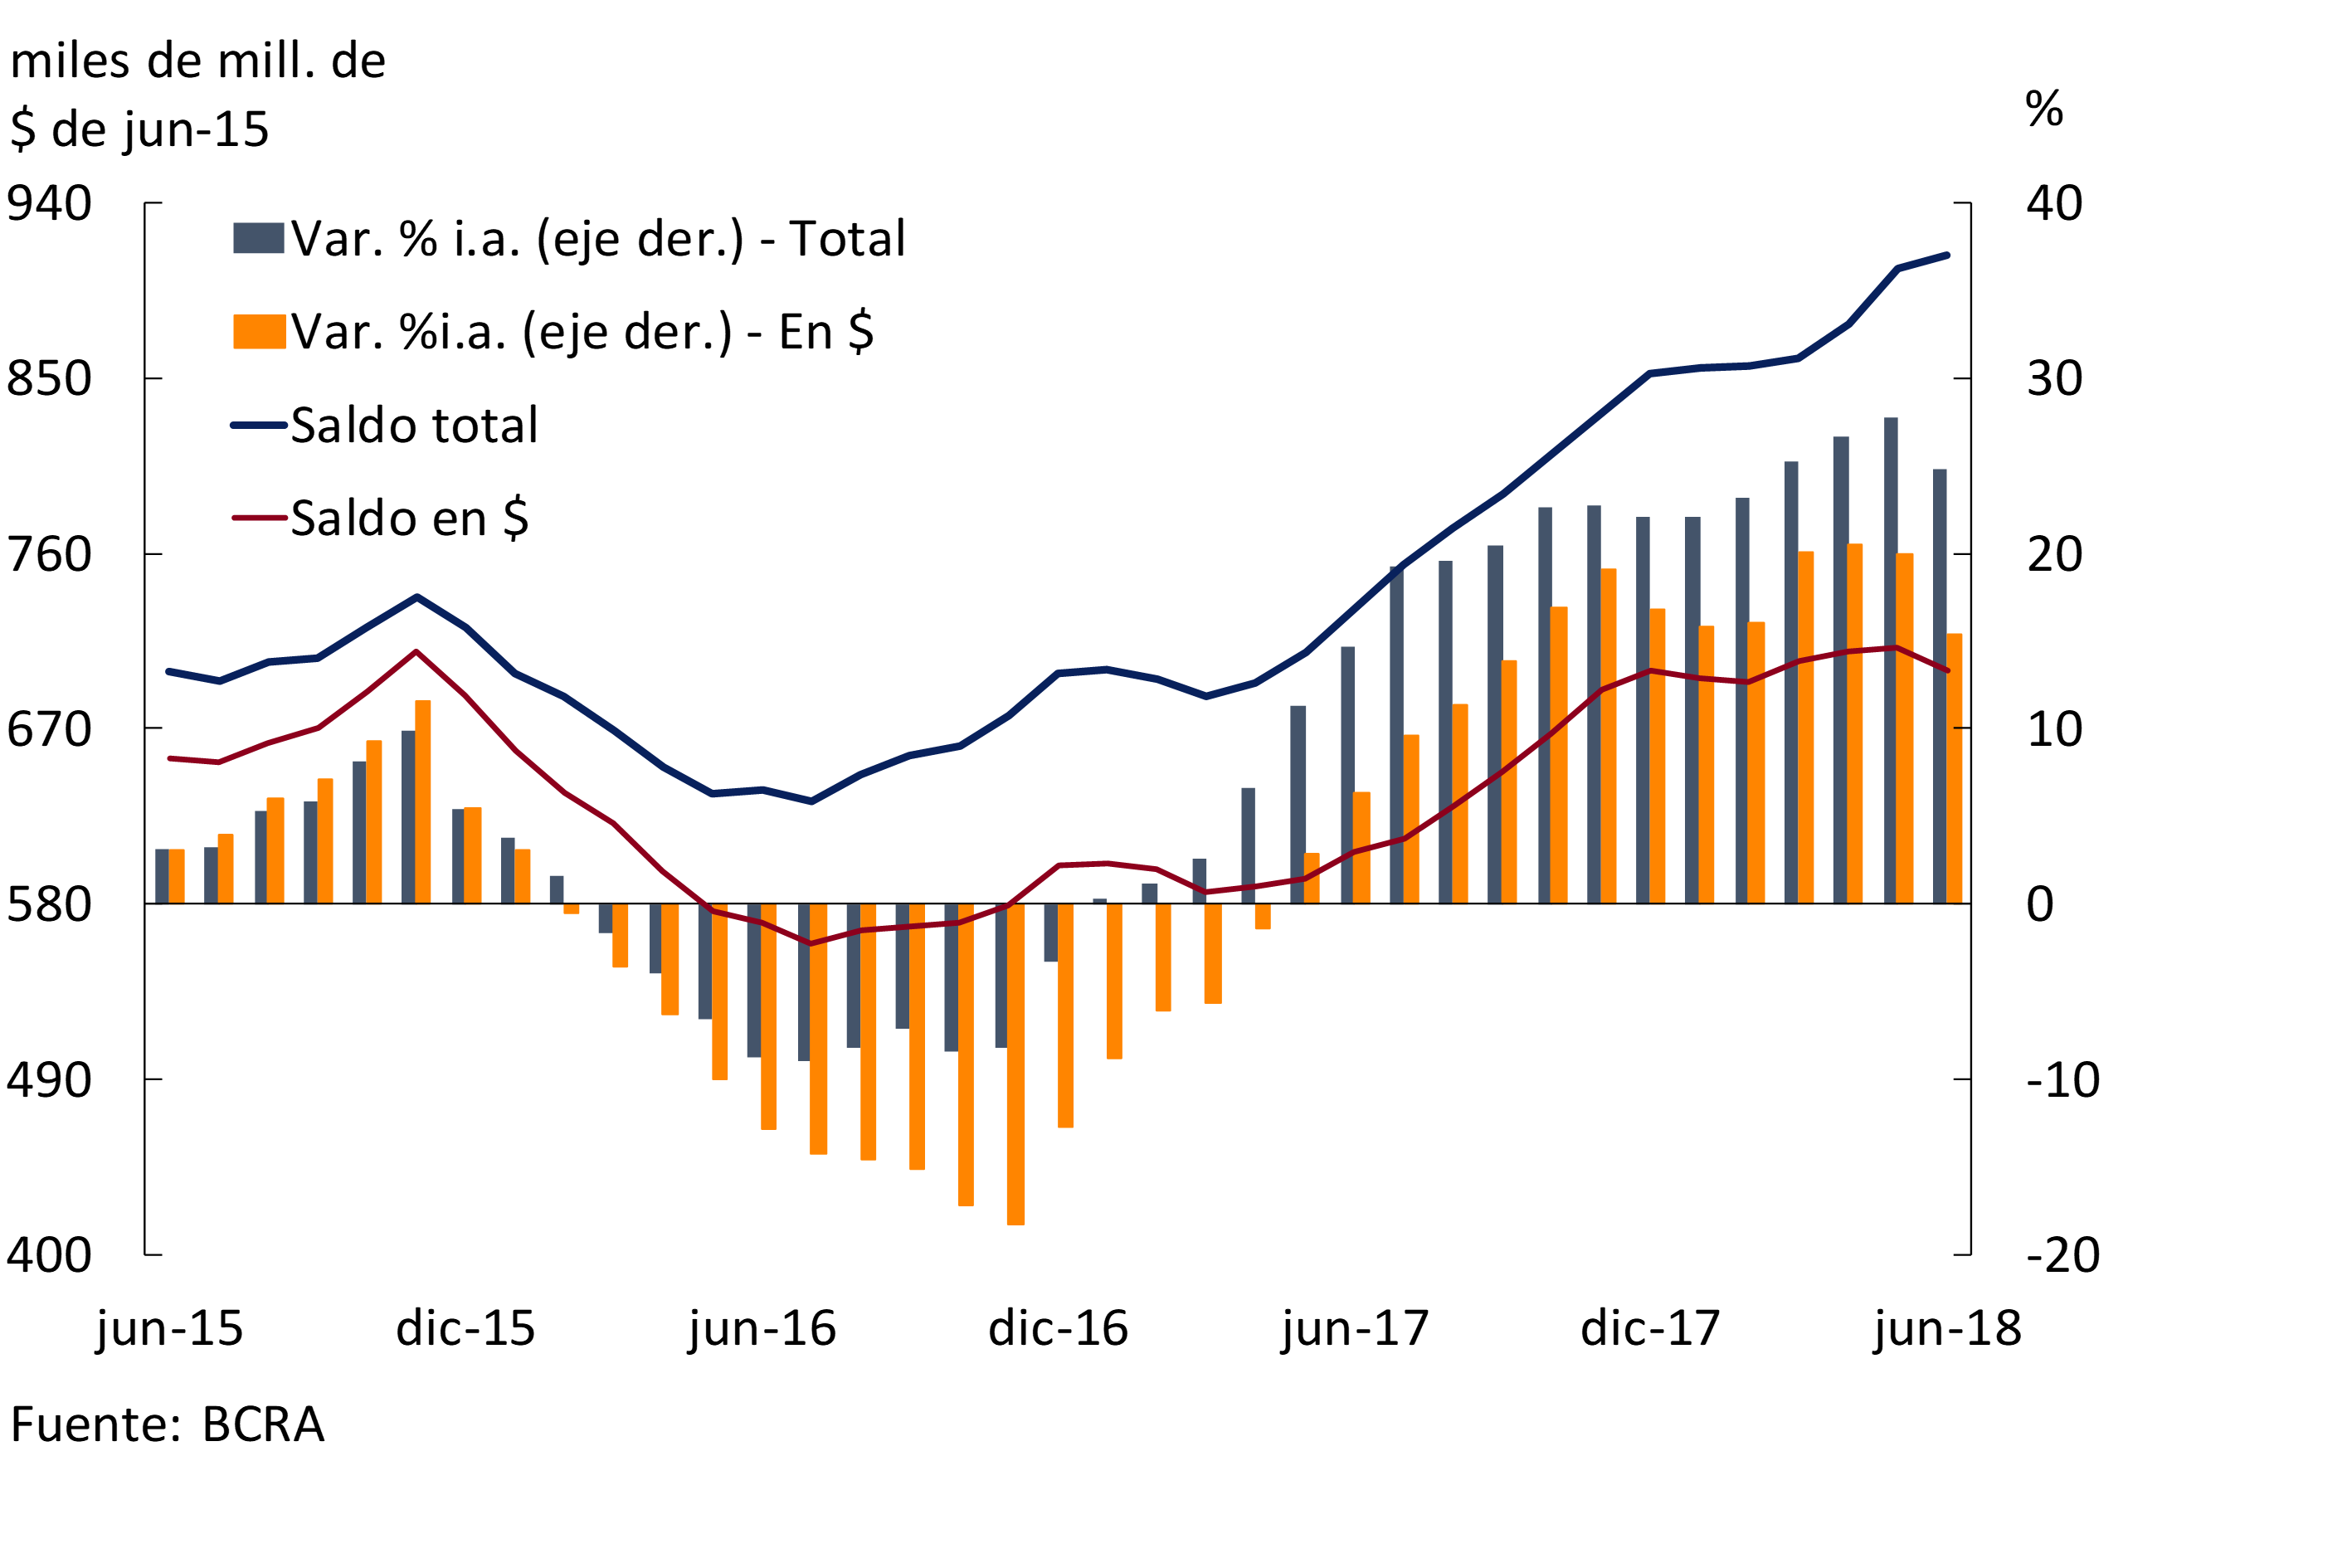
In the last twelve months, financing in national currency to the private sector increased 15.4% when adjusted for inflation. This level was 9 p.p. higher than the value a year ago, although it was below the records observed in recent months (see Graph 10). Consumer lines (personal and cards) and mortgage lines accounted for almost two-thirds of the year-on-year performance of loans to the private sector in pesos. Meanwhile, in the period, loans in foreign currency increased by 26.9% y.o.y. – in foreign currency – driven mainly by export pre-financing and documents. Thus, in June the total credit balance to the private sector of the financial system accumulated a real increase of 24.8% YoY, with a greater relative dynamism of public banks.
Figure 10 | Total Credit Balance to the Private Sector in Real Terms
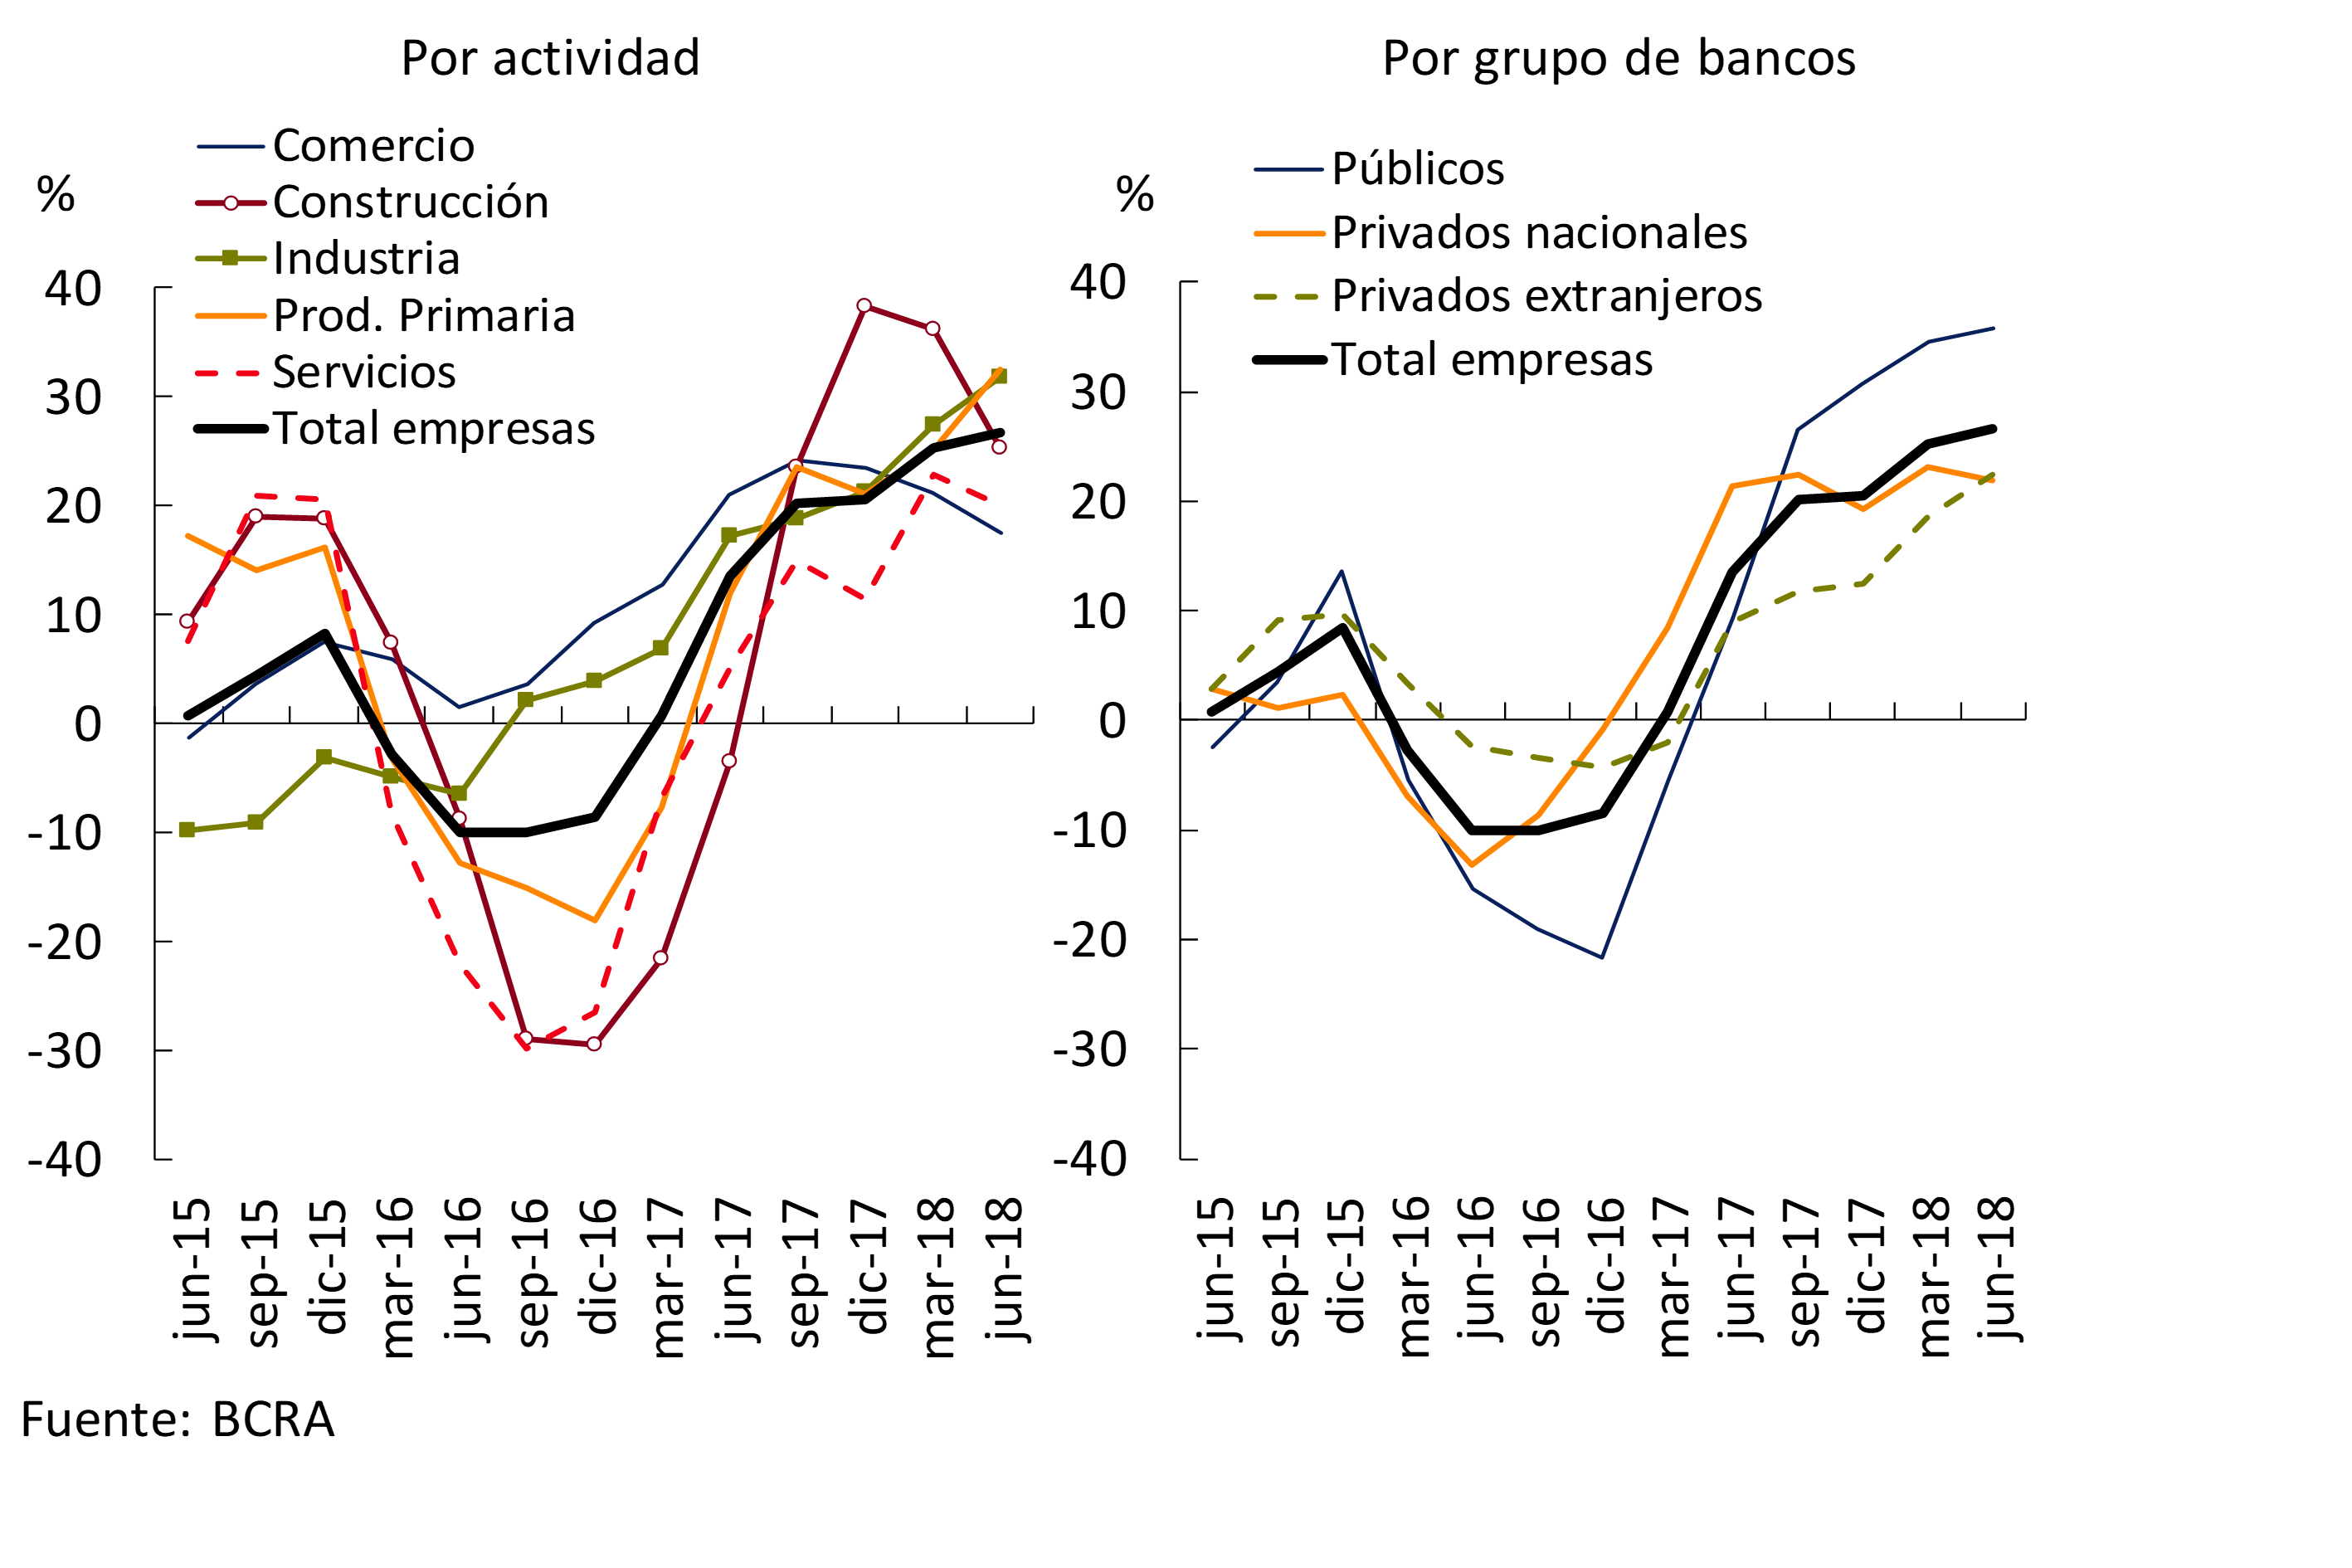
In June, total financing to companies10 grew 3.3% in real terms compared to the previous month11, a performance driven mainly by loans to industry and primary production. In year-on-year terms, as of June, the balance of credit to the productive sector accumulated a real growth of 26.7% YoY. (see Graph 11). Loans channeled by public banks were the most dynamic within this segment.
Figure 11 | Total Credit Balance to Companies – Real Year-on-Year % Change
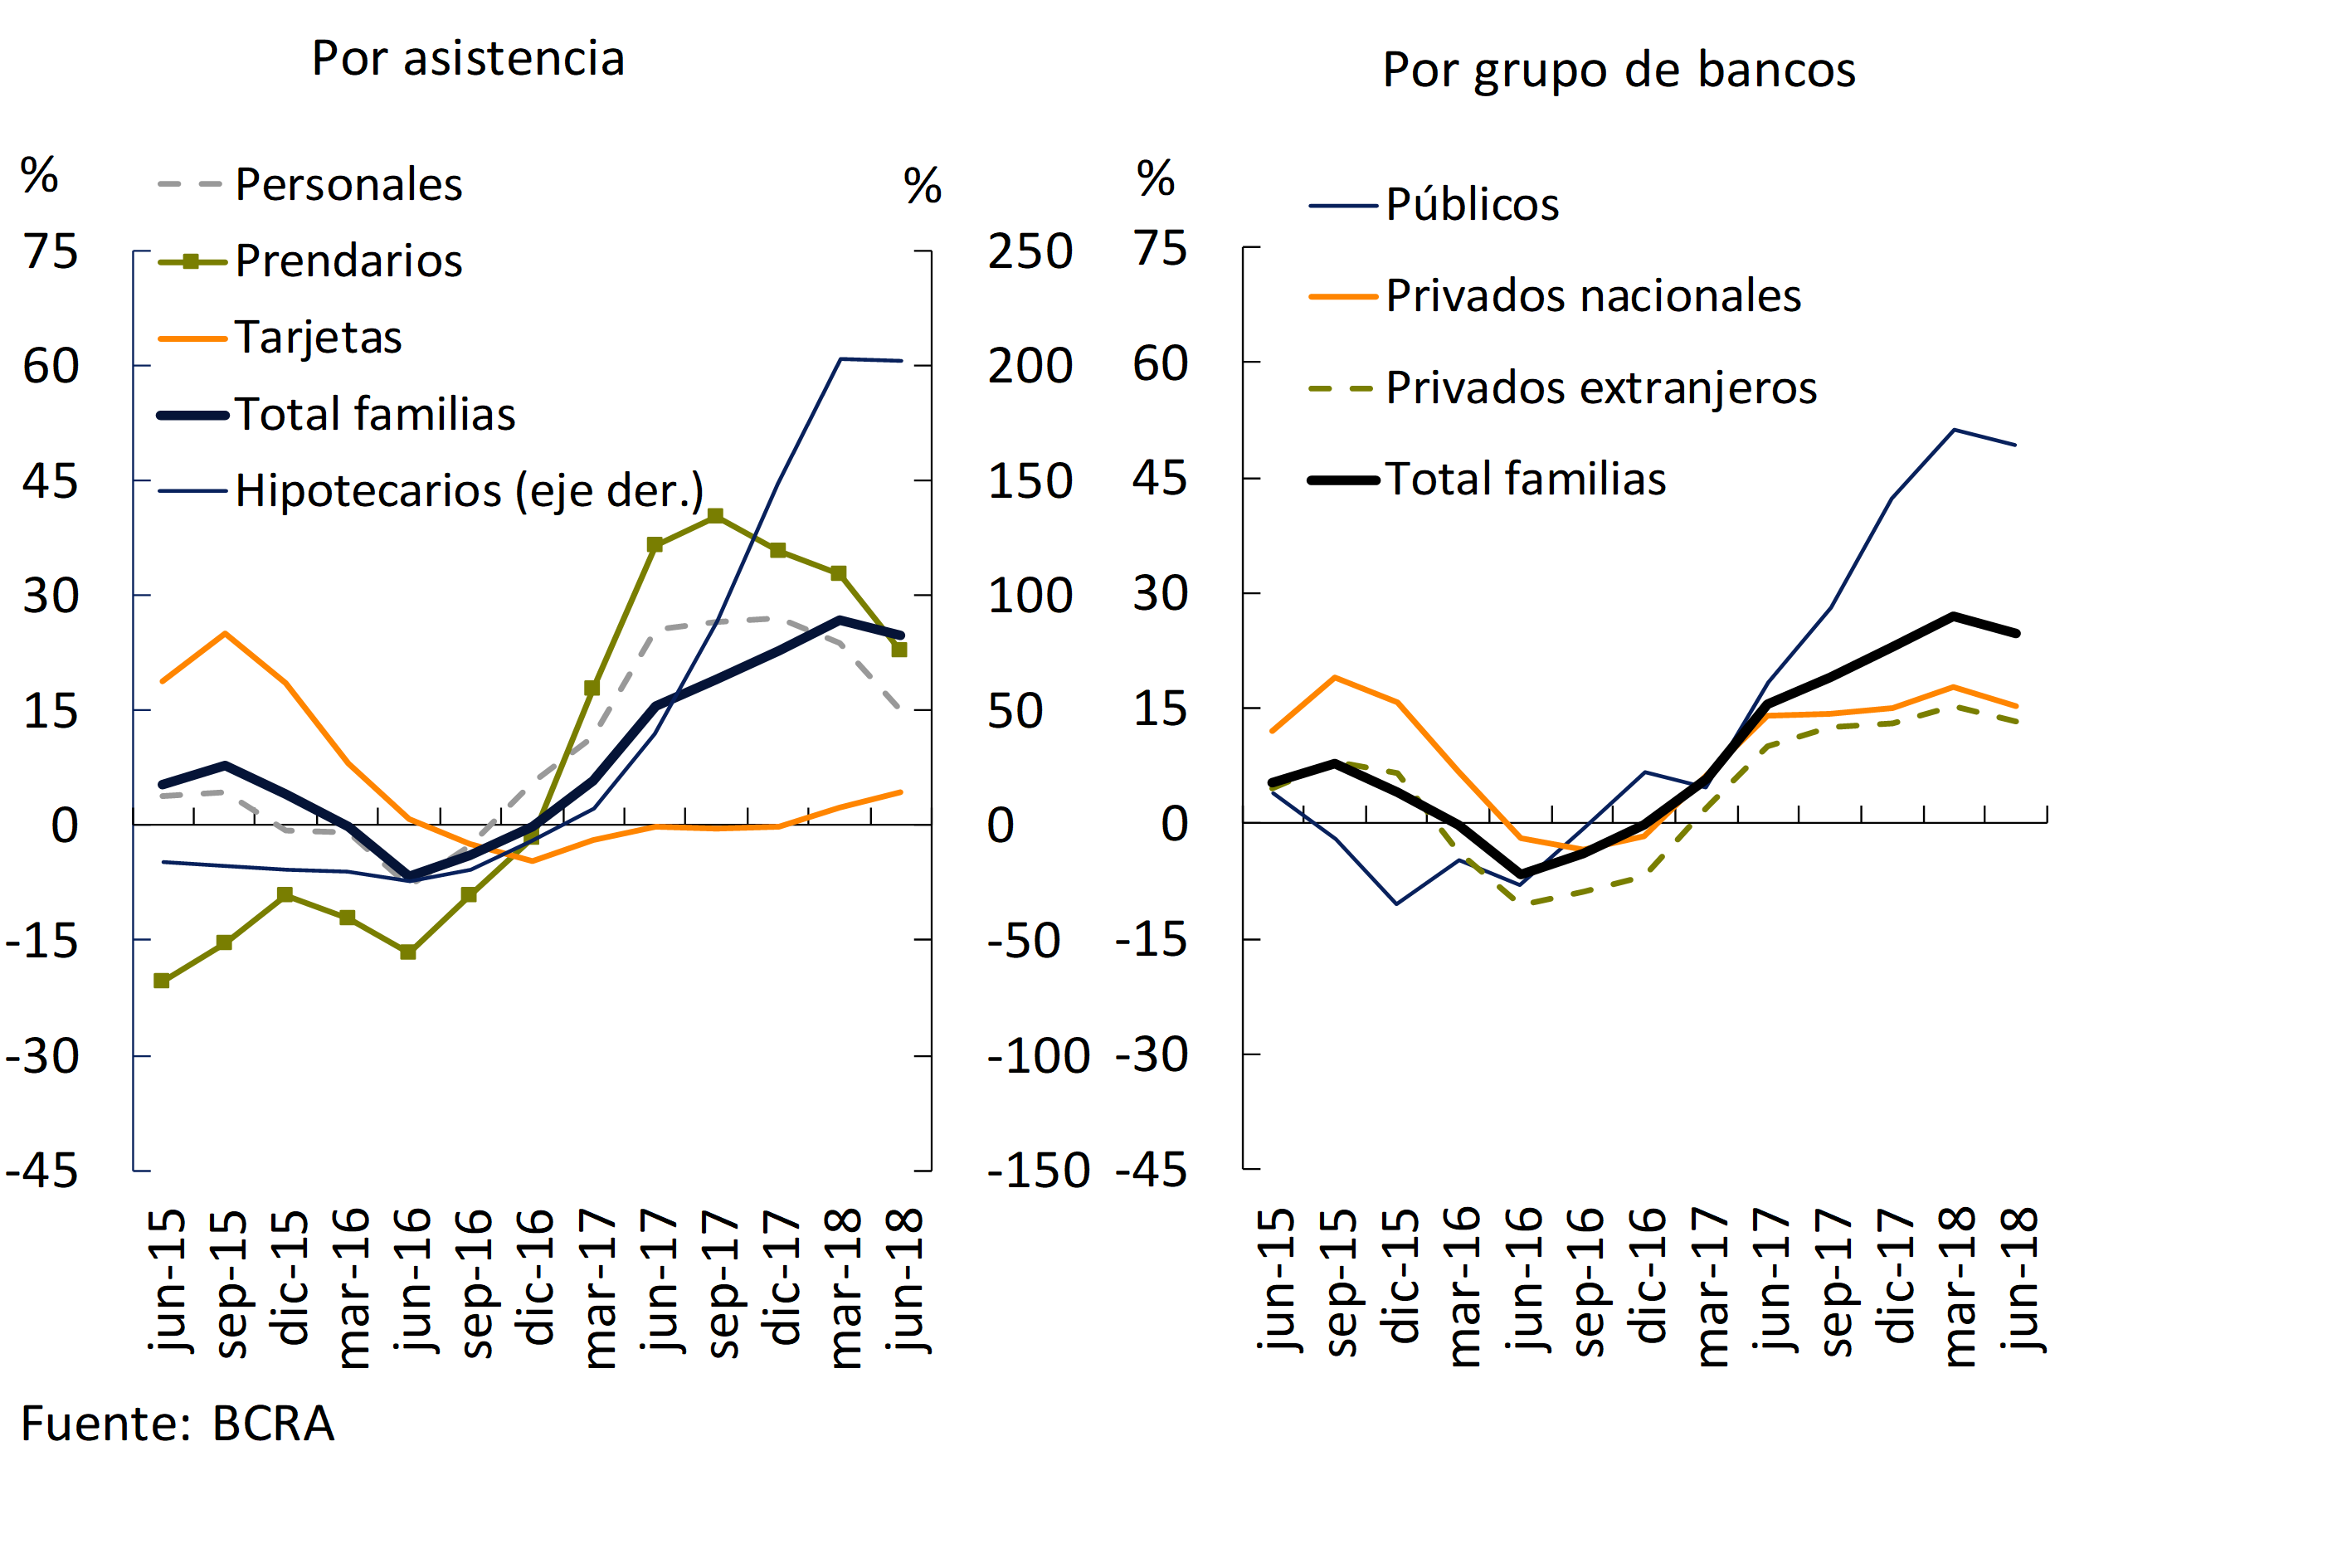
In the month, the balance of credit to households fell by 2.2% in real terms. This fall was widespread among the different lines of credit, with the exception of mortgage lines, which showed a real increase of 1.2% compared to May. In a year-on-year comparison, financing to households accumulated a growth of 24.7% y.o.y. in real terms, highlighting the performance of mortgage loans (see Graph 12). The year-on-year dynamics were mainly driven by public banks.
Figure 12 | Total Credit Balance to Households – Real Year-on-Year % Change
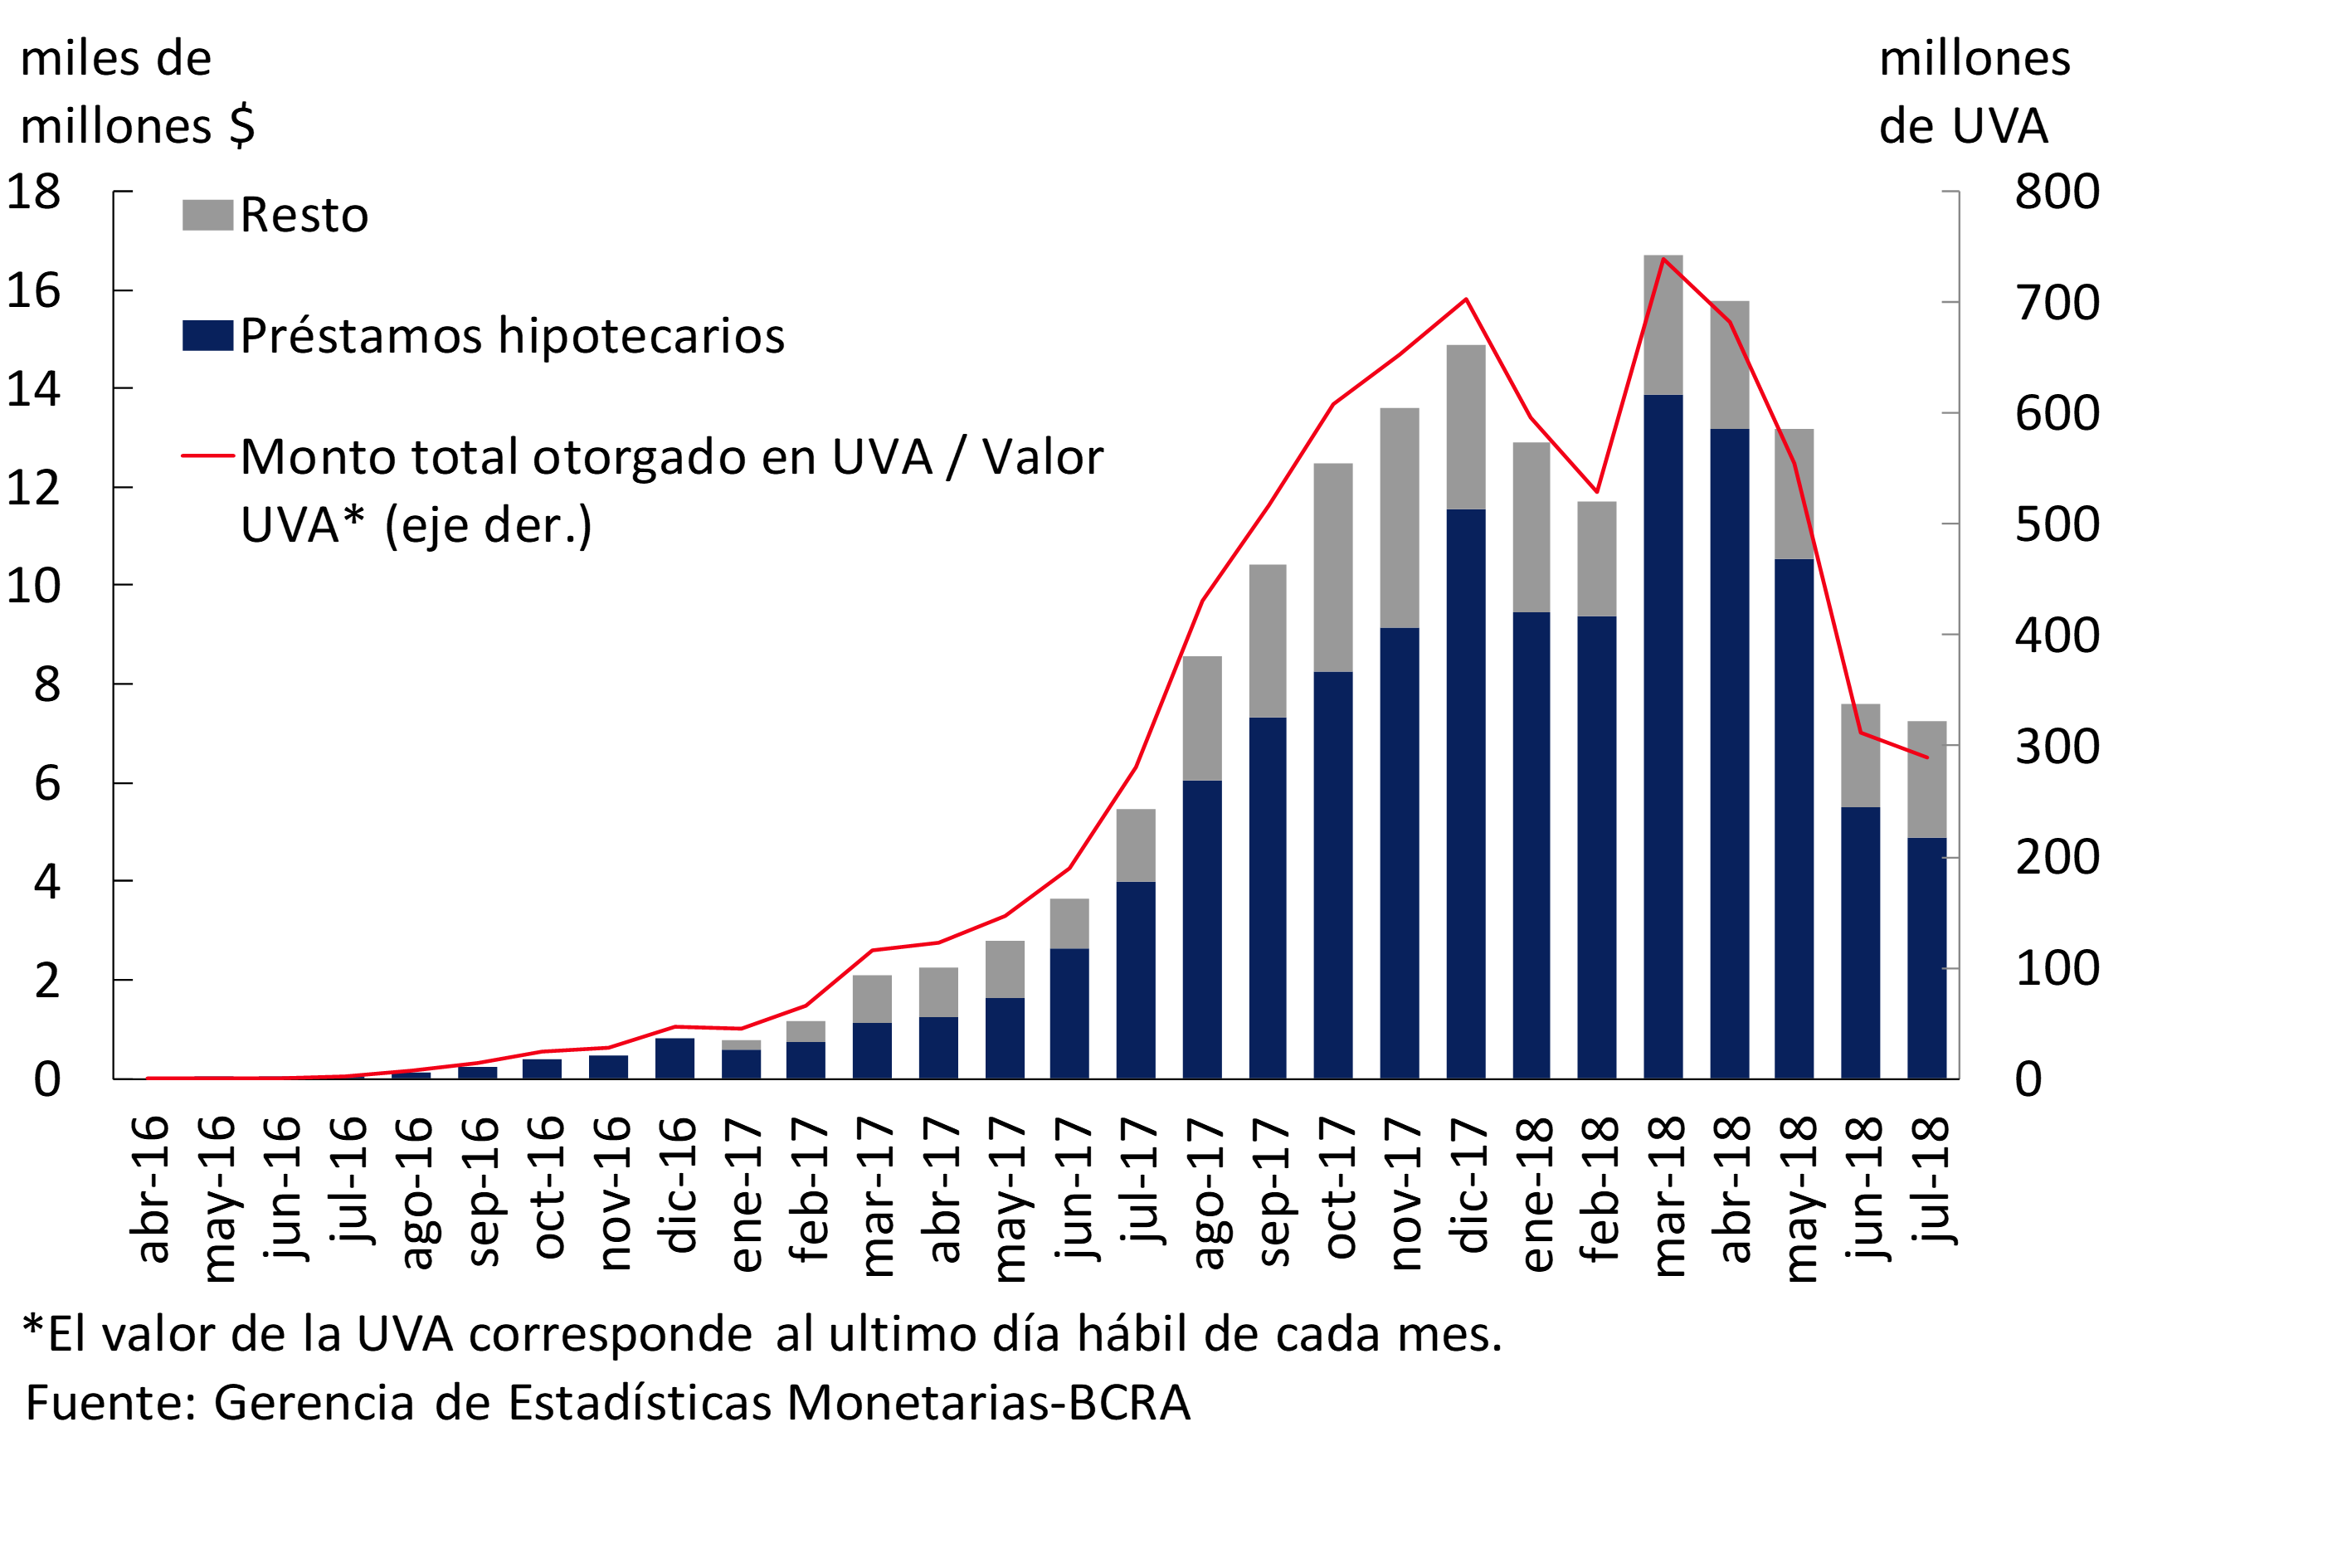
In July, financial institutions granted loans to the private sector in UVA for a total of $7,231 million (289 million UVA12), the lowest value in the last year (see Graph 13). Within these financings, 67.8% corresponded to mortgage loans, 24.3% to personal loans and the rest to pledges. Considering the balance of loans to the private sector, in June more than $184,100 million13 corresponded to the UVA segment (8.8% of the total balance of loans to the private sector). In particular, the balance of mortgage loans in UVA to this sector reached $137,262 million in June, representing more than 67% of total mortgage loans to the private sector.
Figure 13 | UVA Financing – Amounts Granted
In June, nominal interest rates operating with the private sector inpesos 14 increased across the board among the different credit lines. In particular, in the month the rates agreed in advances and in documents verified the largest relative increases. On the other hand, the average interest rates operated in UVA also showed increases in the period.
IV. Portfolio Quality
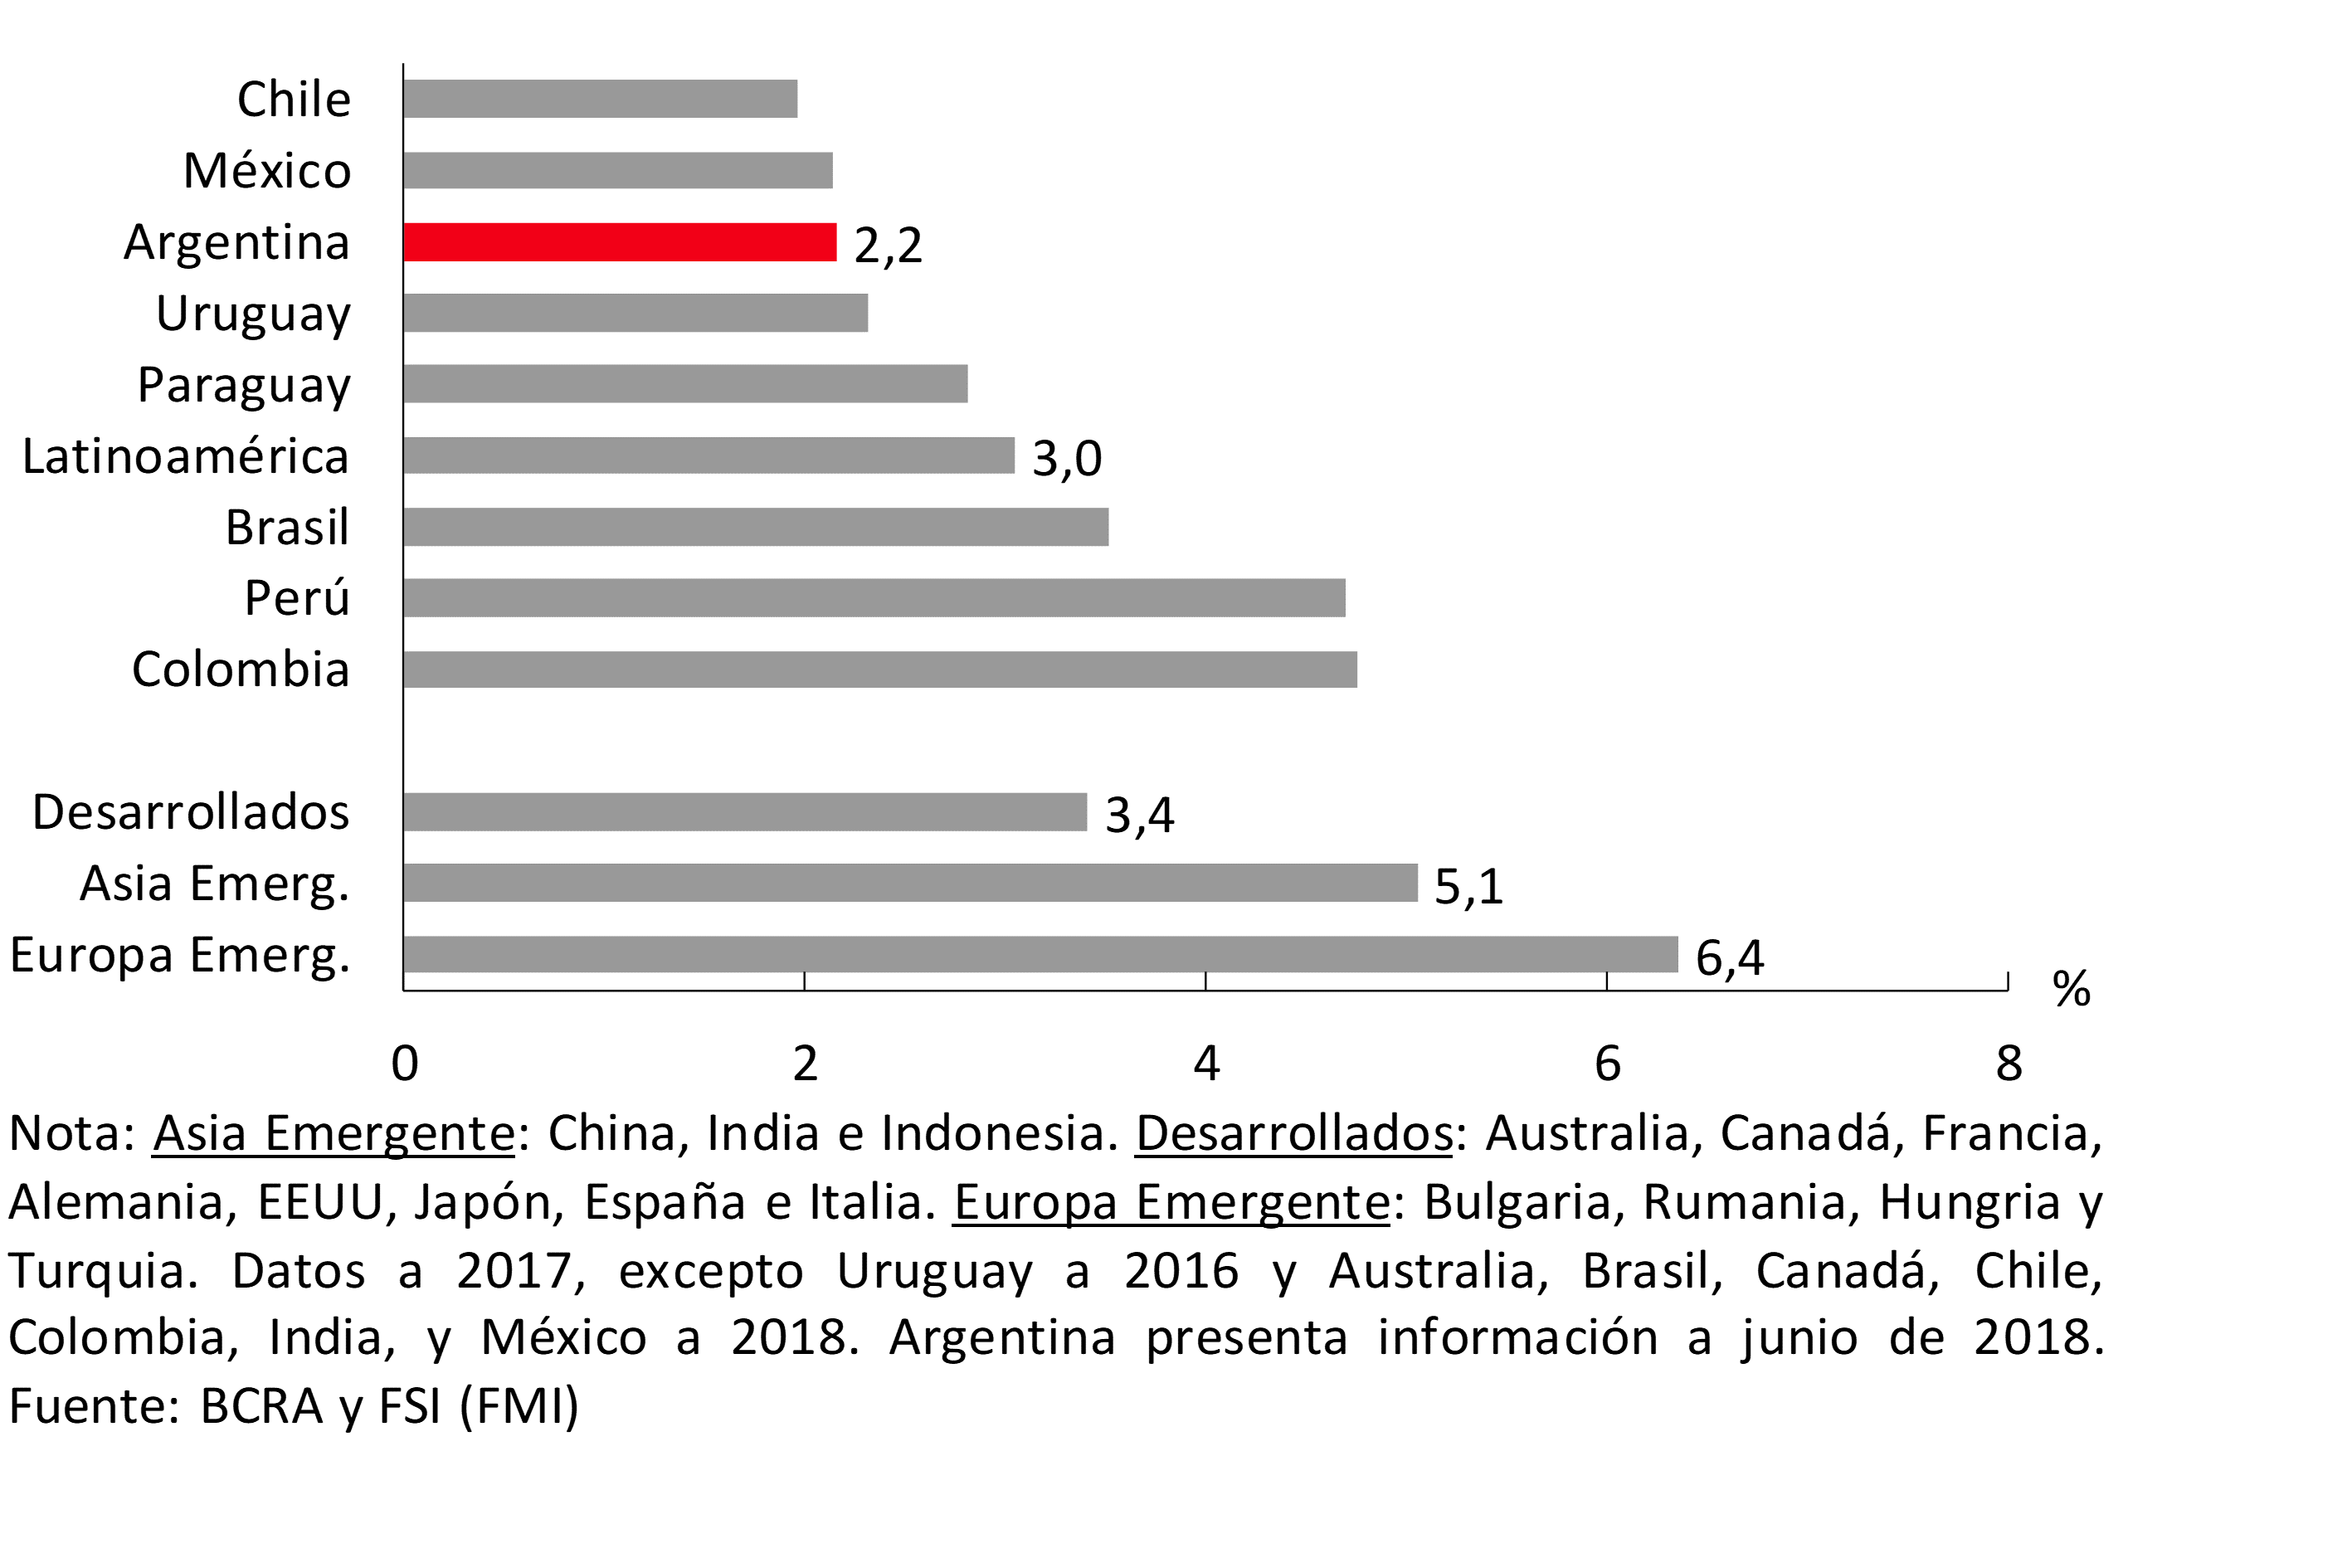
The non-performing loan ratio for private sector loans stood at 2.2% in June, remaining unchanged from the previous month. This level was slightly higher than that observed a year ago, a performance mainly explained by non-bank financial institutions and national private banks. The non-performing loans of the local financial system is at low levels both in comparison with the records of the last fifteen years (see Graph 14), and in relation to other economies in the region (average of 3%) and to other emerging and developed countries (see Graph 15).
Figure 14 | Irregularity of Credit to the Private Sector – Irregular portfolio / Total financing (%)
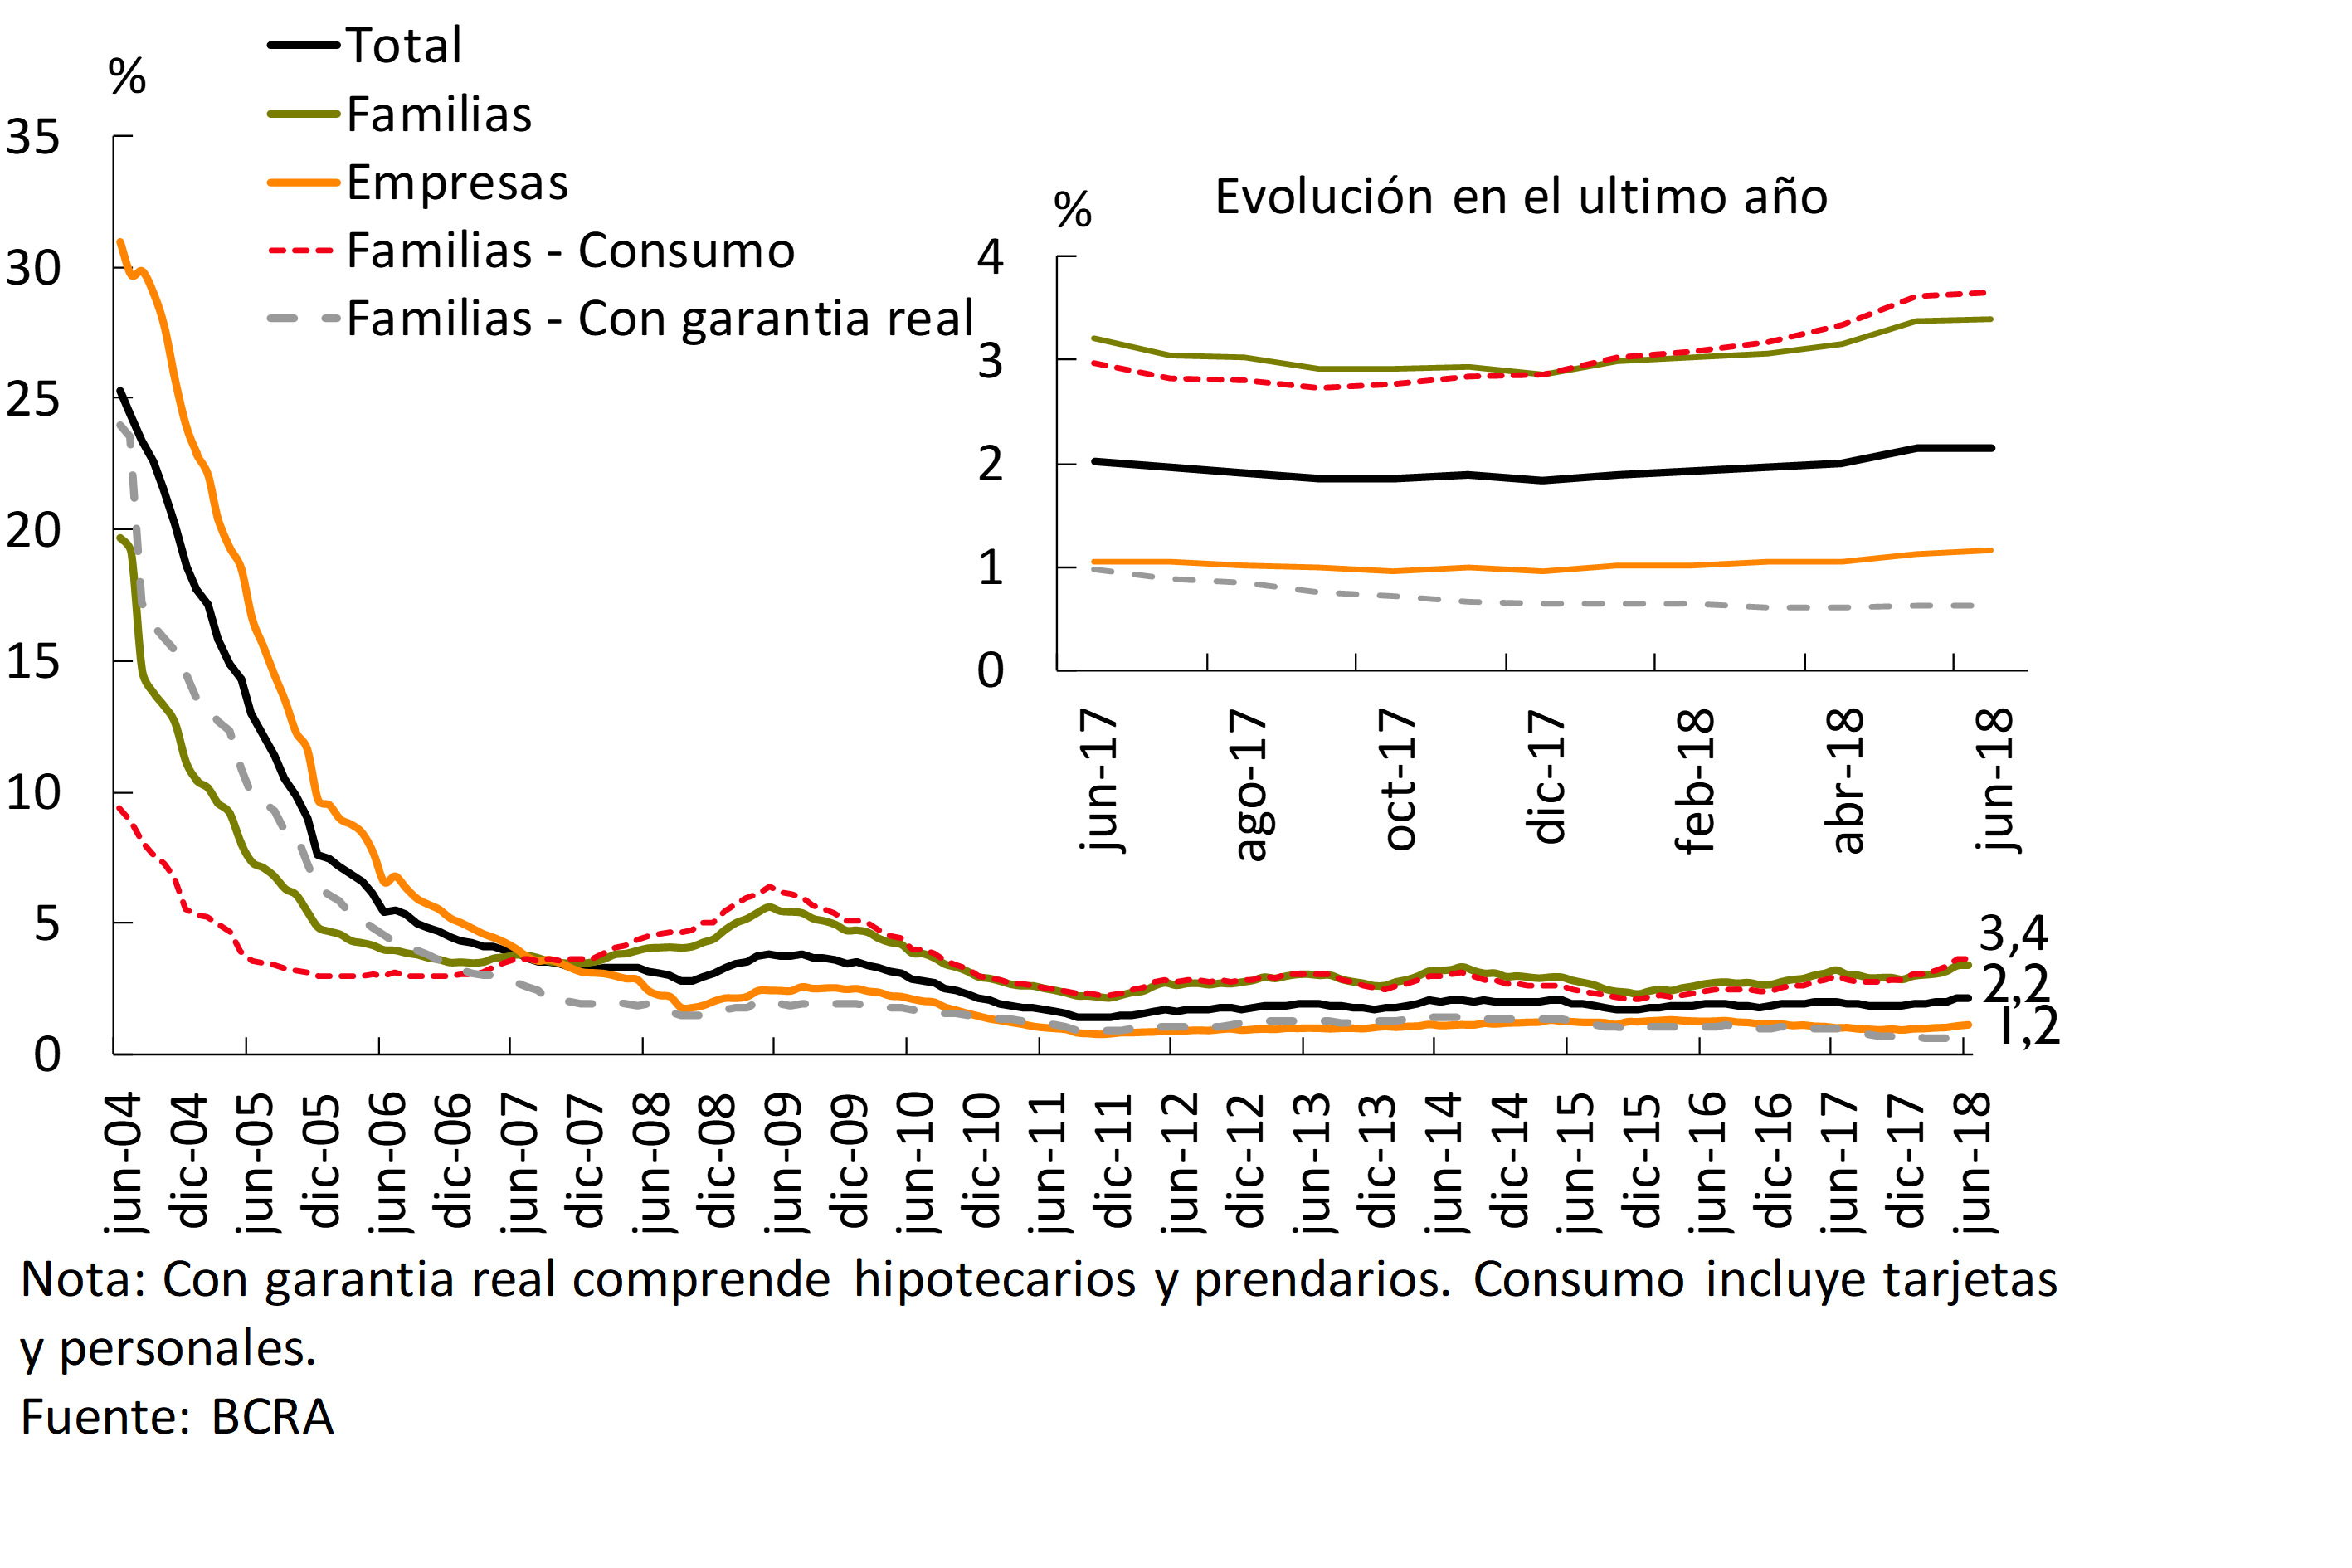
Figure 15 | Bank Credit Irregularity – Irregular Portfolio / Total Financing (%)
In June, the irregularity ratio of loans to households remained around 3.4% (see Graph 14). In the last twelve months, this ratio accumulated an increase of 0.2 p.p., mainly explained by consumer lines (credit and personal cards). On the other hand, the non-performing loan of collateral financing (mortgages and pledges) showed a fall of 0.4 p.p. compared to the value of June 2017, to represent only 0.6% of the portfolio, being one of the lowest levels in the last fifteen years15.
The non-performing loan ratio for firms increased slightly in the month, to 1.2% (see Chart 14). In the last twelve months, this indicator showed a slight increase, with mixed performances among the different productive branches. In particular, in the period, the default on trade and industry financing rose slightly; The irregularity of loans to primary production remained unchanged, while in the rest of the sectors (construction and service providers) it was reduced.
At the end of the first half of the year, the financial system’s accounting forecasts represented 124% of the private sector’s irregular portfolio, slightly lower than at the end of 2017 (see Chart 16). All bank groups continued to show high levels of forecasting, which exceed the minimum regulatory requirements in force. Excluding the minimum forecasts for the regular portfolio, this ratio would stand at 76% in June.
Figure 16 | Forecasting of the Financial System – Forecasts / Irregular portfolio to the private sector (%)
V. Solvency
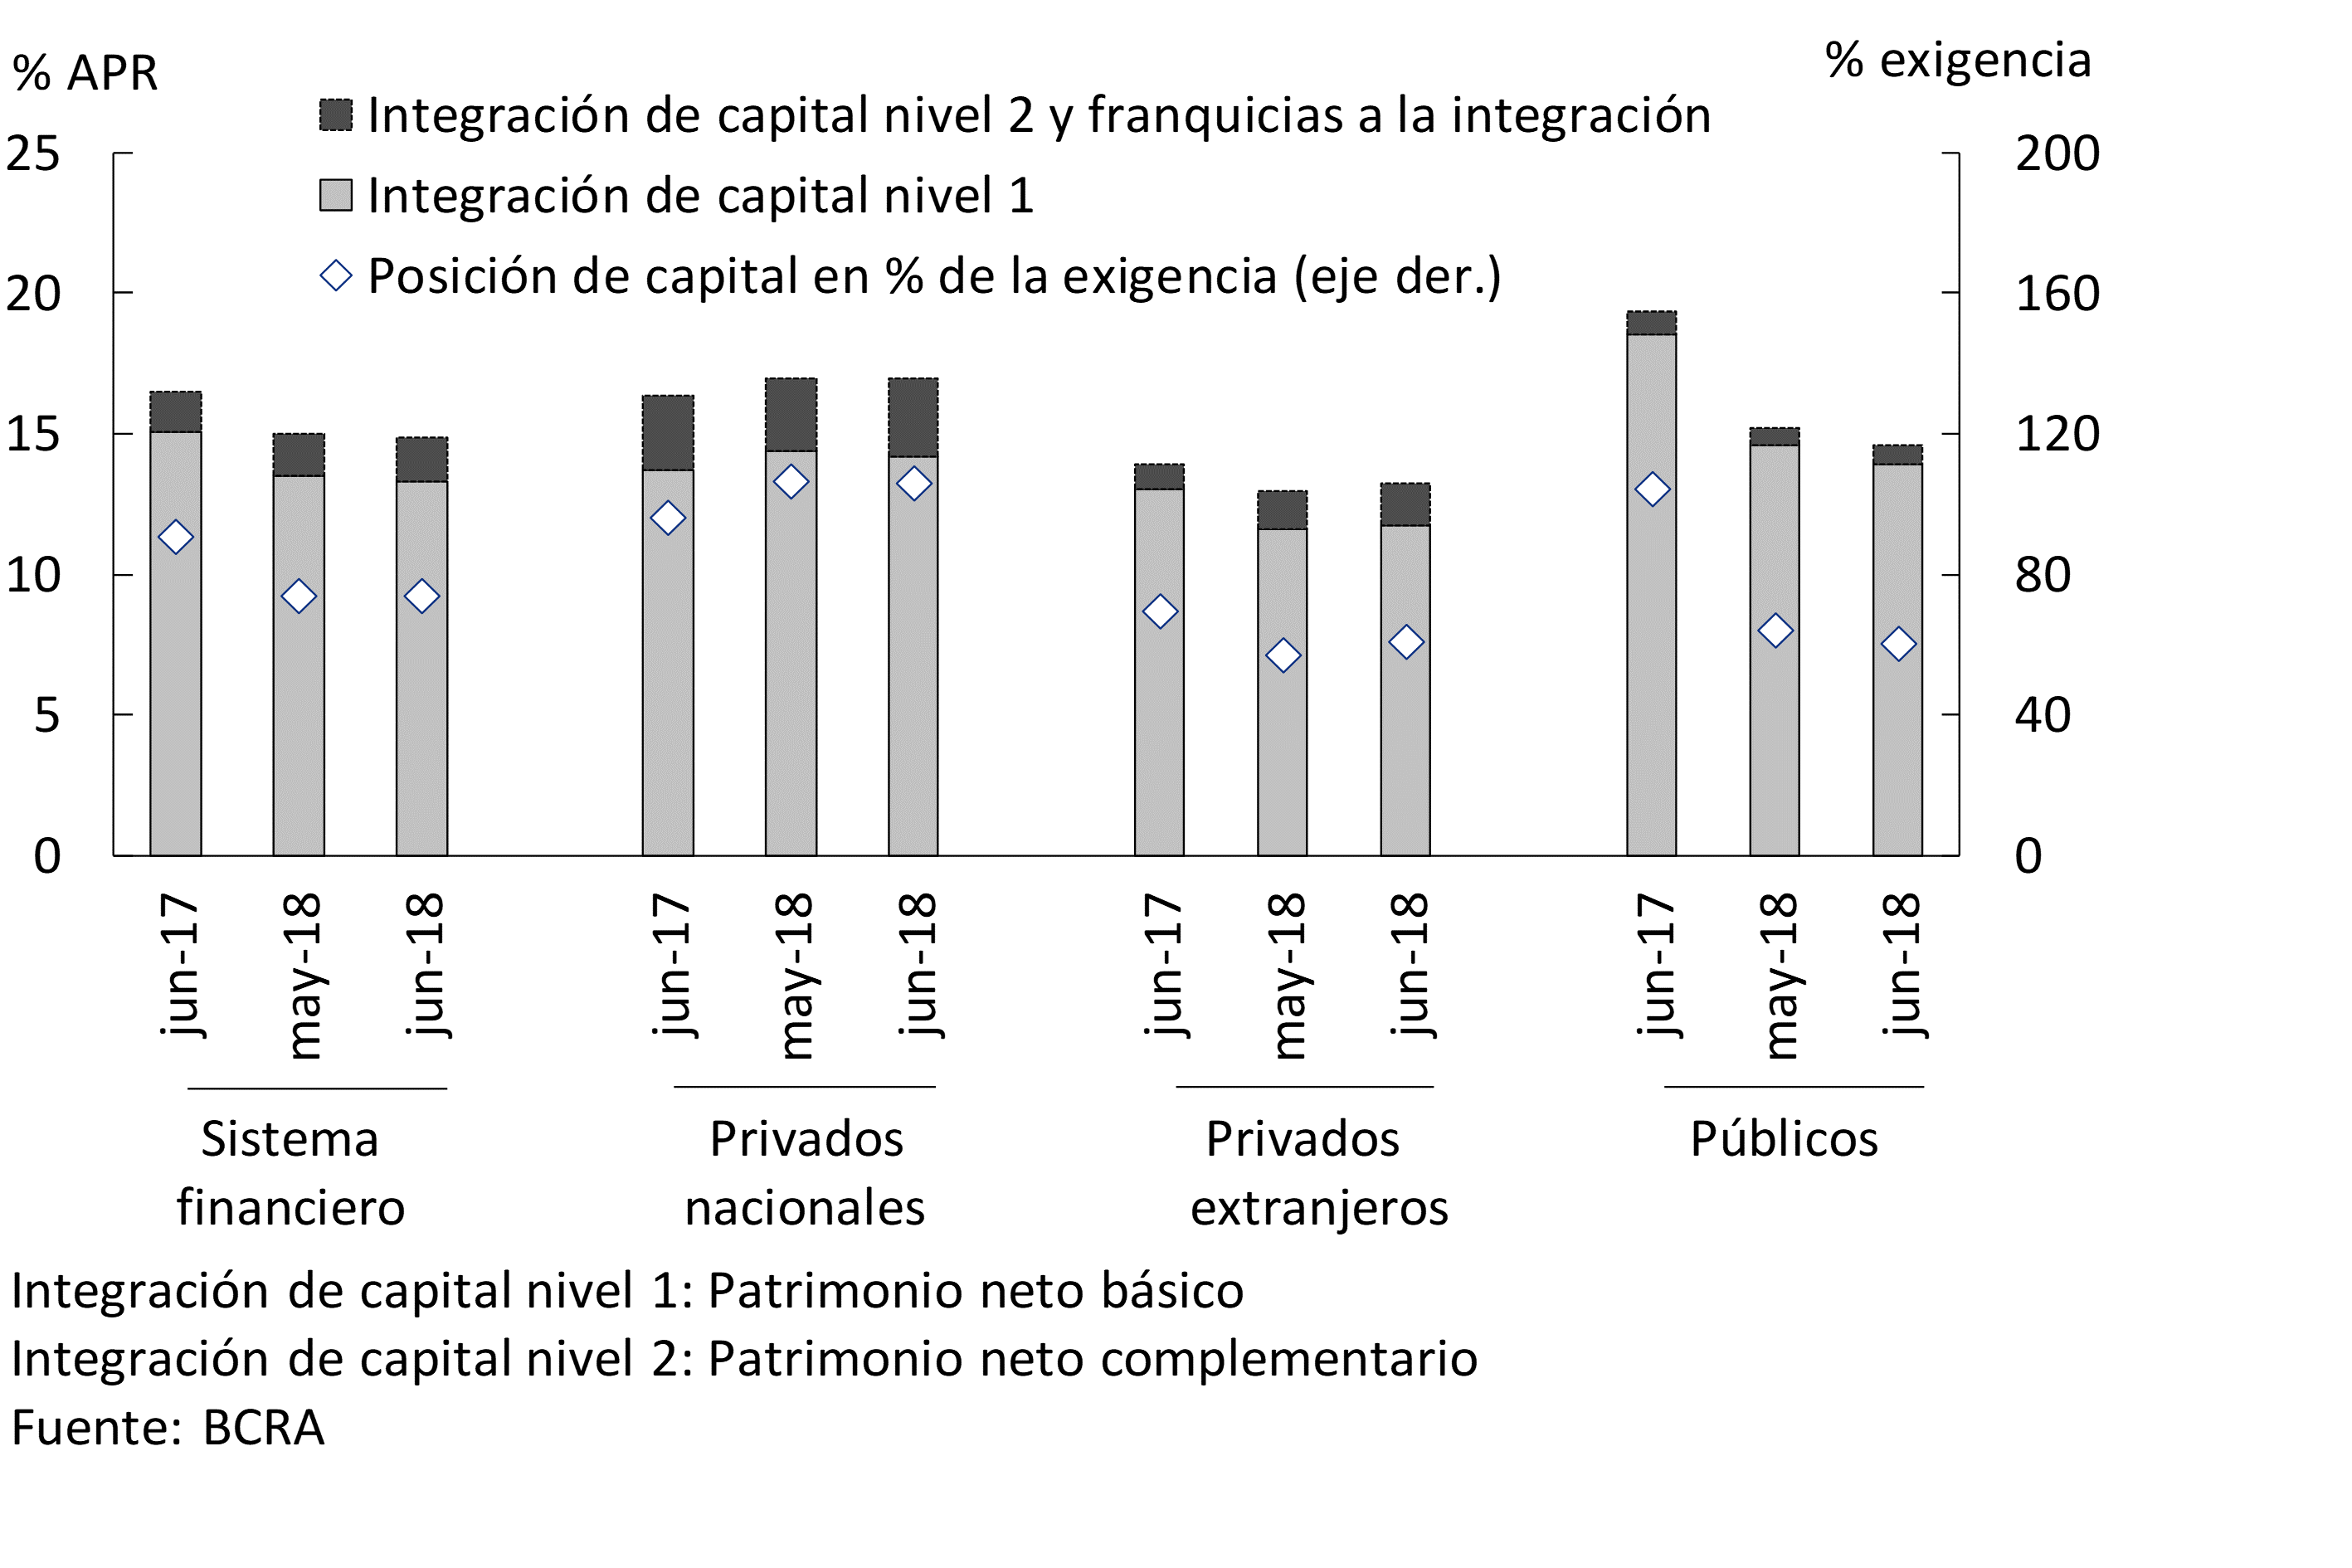
As of June 2018, the financial system maintained high solvency ratios. The integration of regulatory capital of the banks as a whole represented 14.8% of risk-weighted assets (RWA) in the middle of the year, in line with the level of May and slightly lower than the records of the same month last year. The highest quality capital to absorb eventual losses – Tier 1 – totaled 13.3% of RWAs in June, accounting for 90% of normative capital (see Chart 17). On the other hand, the excess of regulatory capital integration for the financial system was 74% of the prudential requirement.
Figure 17 | Integration and Excess Regulatory Capital (Position)
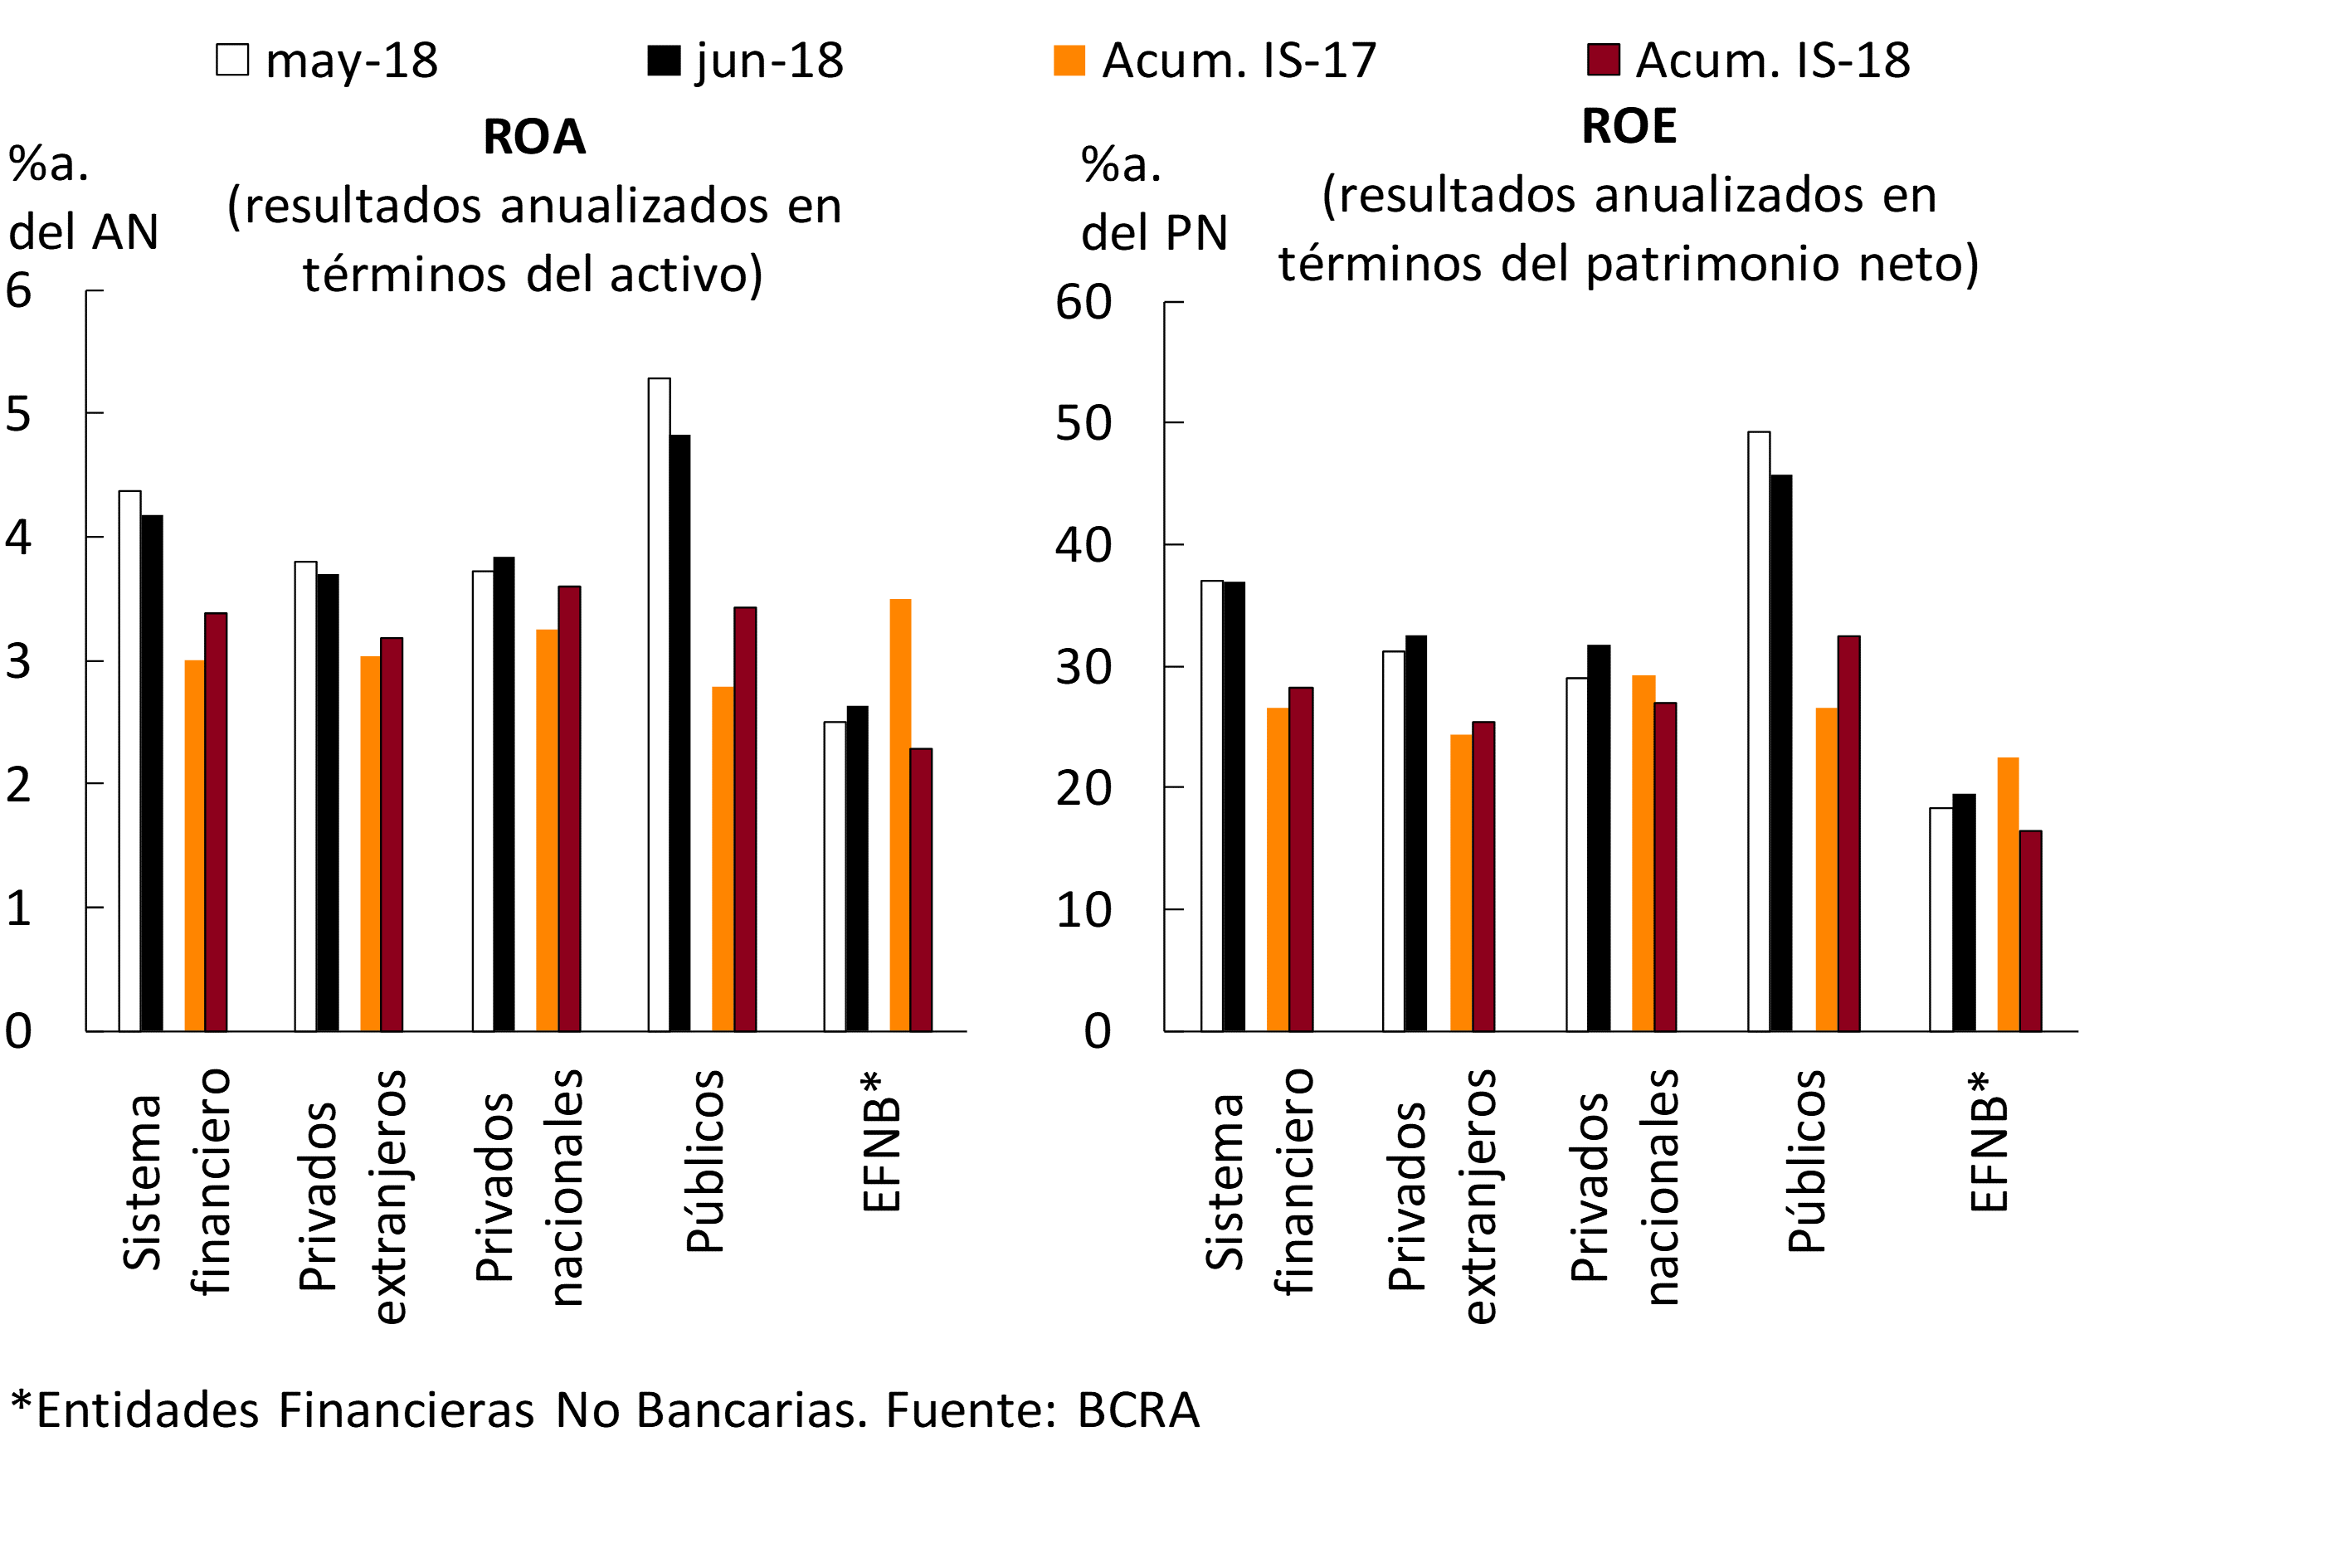
In June, the gains accounted for by the financial system represented 4.2% annualized (yr.) of assets (37% yr. of net worth -ROE). Although ROA and monthly ROE decreased slightly compared to the previous month – mainly due to reduced earnings on “other comprehensive income” of public banks16 – they were at relatively high levels compared to the last two years. In June, private banks obtained gains similar to those of May (3.8% y/y of assets), while public banks slightly reduced their profits (up to 4.8% of assets). In the first half of 2018, the ROA of the financial system was 3.4%y. (ROE of 28.3%y.y., see Chart 18), increasing 0.4 p.p. y.o.y. (+1.7 p.p. y.o.y.).
Figure 18 | Income Statement by Financial Institution Group
In June, the financial margin of the banks as a whole totaled 10.6% of assets, similar to that of May (see Chart 19). The monthly reduction in earnings due to exchange rate differences and lower interest income were offset by gains from forward operations in foreign currency (losses were recorded last month for this item), increases in results from securities, higher premiums for passes and a fall in interest expenses. Considering the first half of 2018, the financial margin represented 10.7% of assets, increasing 0.4 p.p. compared to the same period of 2017. The year-on-year increase was due to higher gains from securities, income from CER adjustments, interest income and share price differences. These variations were tempered by the increase in interest and CER expenditures and by the reduction in pass premiums.
Figure 19 | Components of the Income Table – Financial System
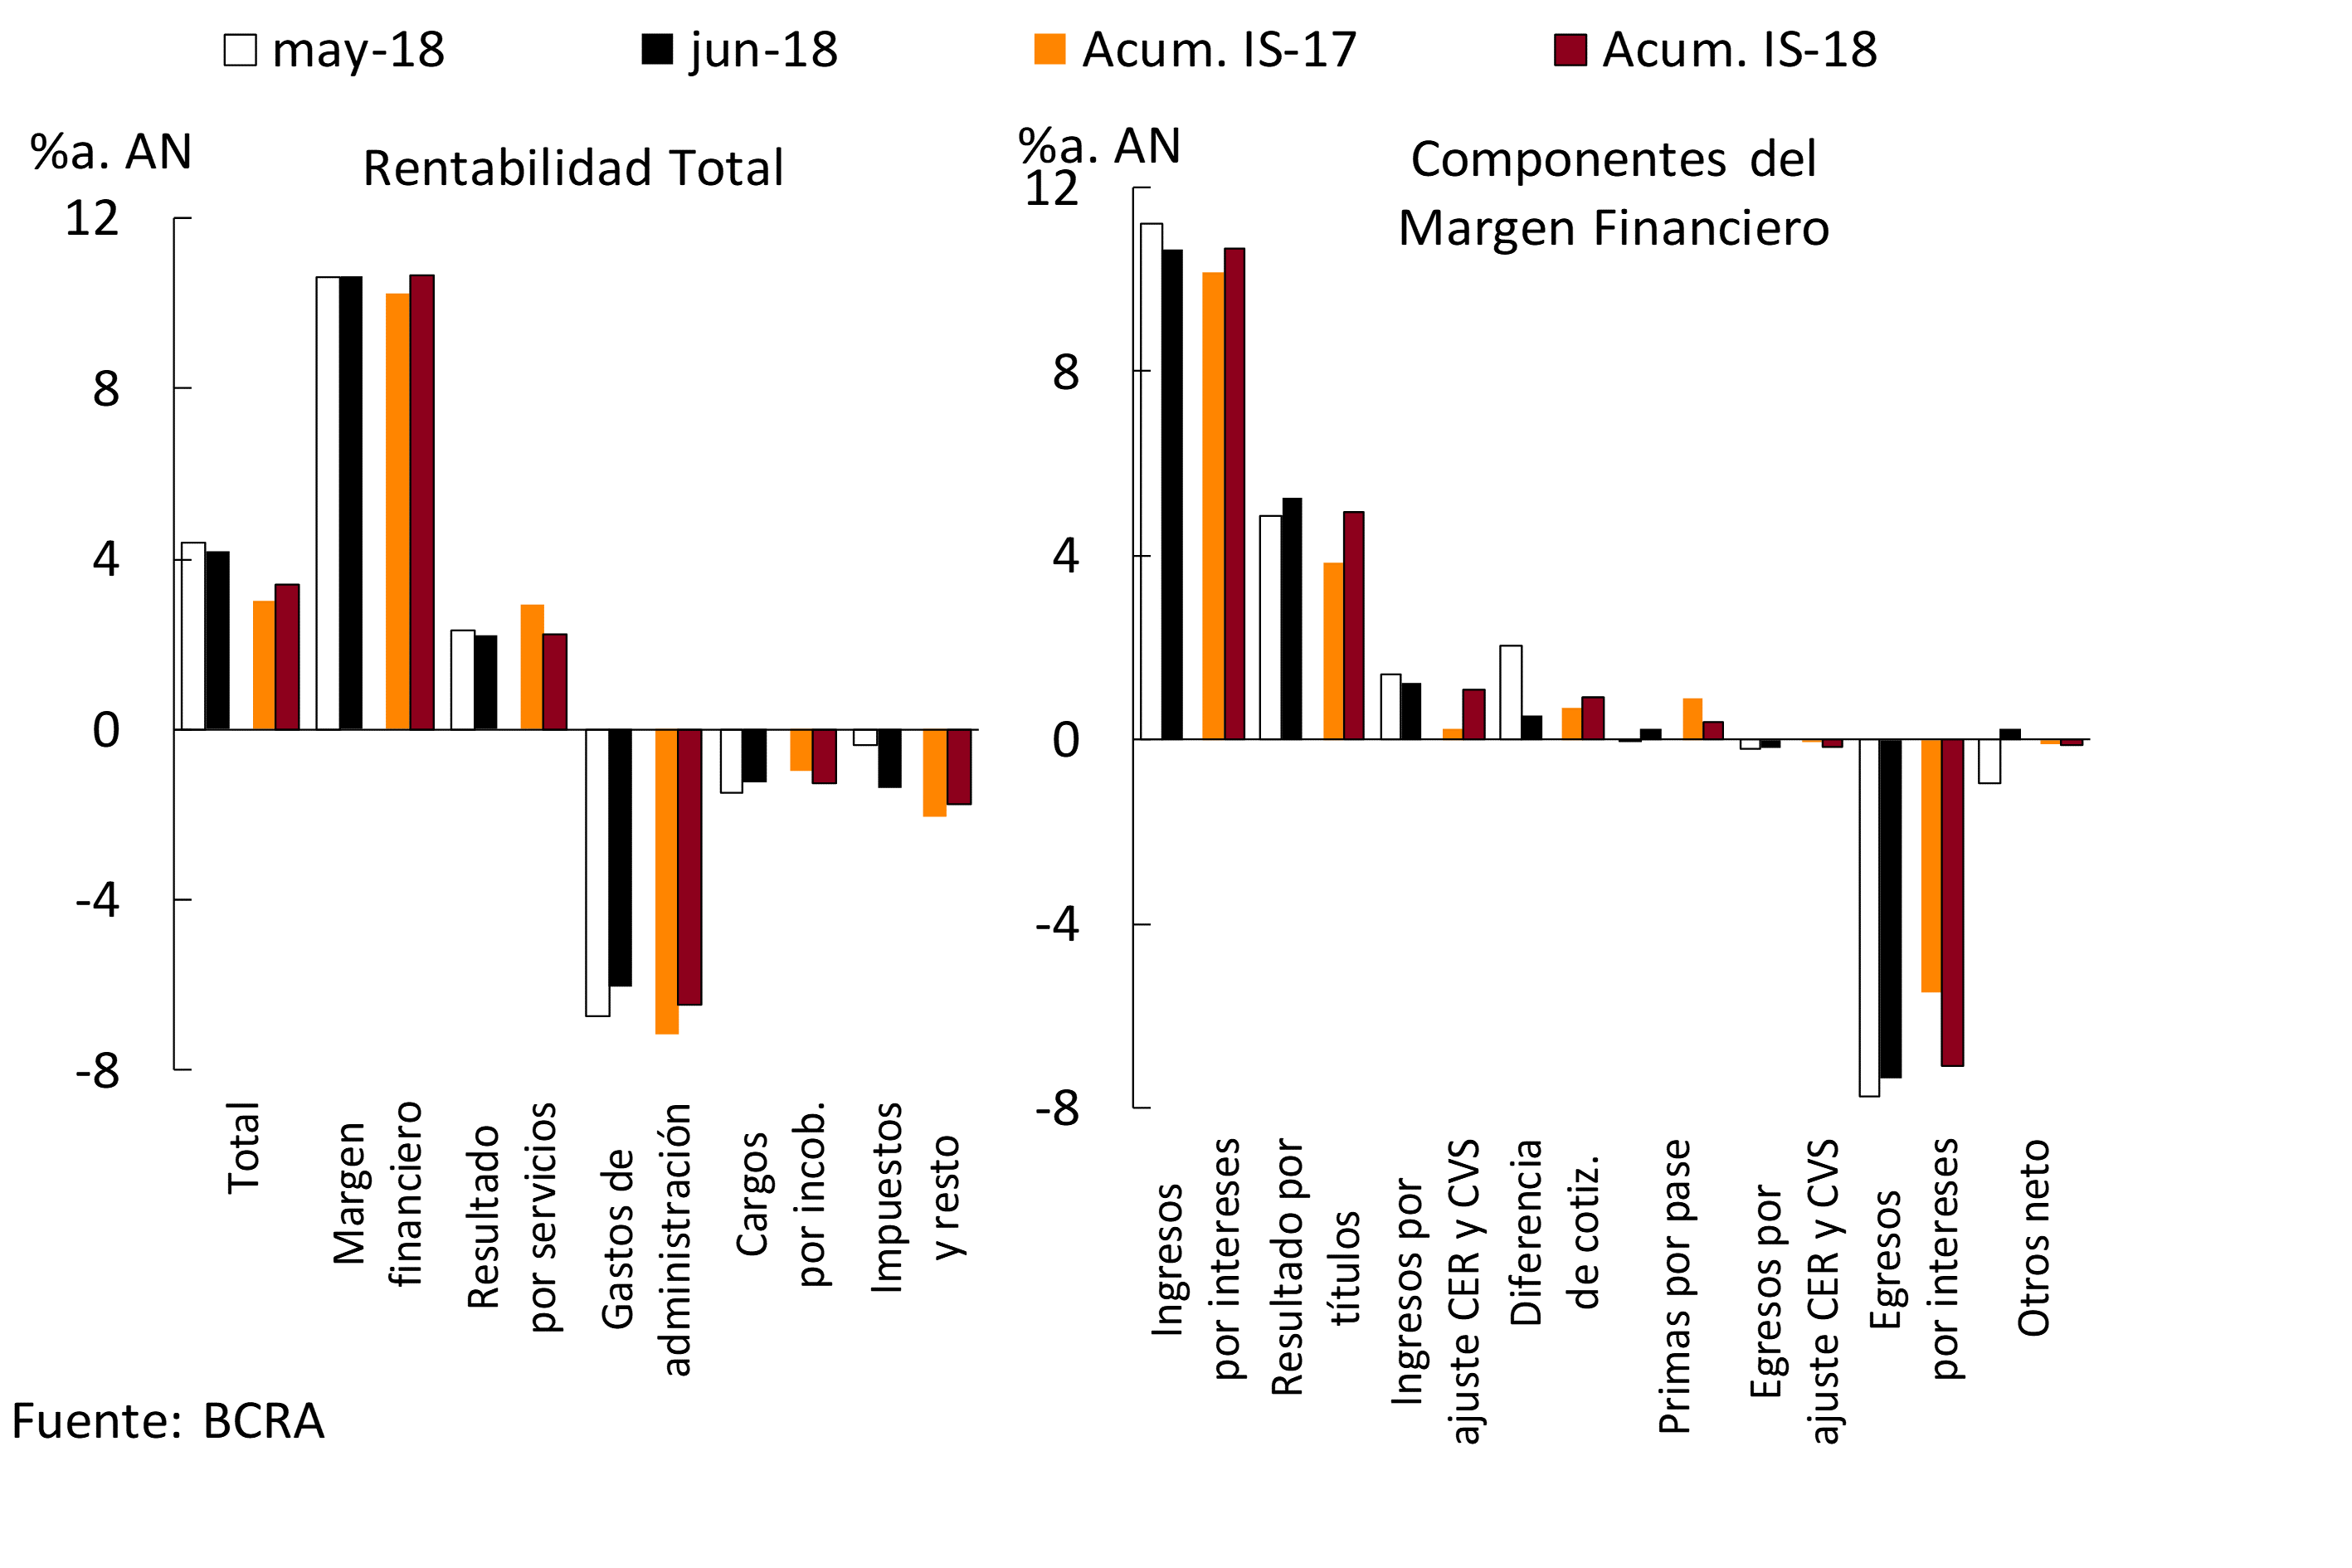
Net income from services in the financial system decreased slightly compared to May, representing 2.2% of assets in June. In six months of 2018, these results for services totaled 2.2% y.a. of assets, falling 0.7 p.p. in a year-on-year comparison (see Chart 19).
In June, bad debt charges accounted for 1.2% of assets, down from the May level. Between January and June 2018, bad debt charges reached 1.3% y/y. of assets, 0.3 p.p. higher in a year-on-year comparison (see Chart 19). In June, administrative expenses totaled 6% of assets, falling compared to May. In the first half of the year, administrative expenses represented 6.5% of assets, 0.7 p.p. less in a year-on-year comparison.
Regulations
Summary of the main regulations of the month, implemented by the BCRA, related to financial intermediation activity. The effective date of the regulation is taken as a reference.
Communication A6522 – 13/06/18
It is clarified in the rules on “Cash transactions to be settled and forward, passes, guarantees, other derivatives and with mutual funds” that the BCRA’s monetary regulation instruments are not covered by the limitation for financial institutions to carry out transactions that involve granting liquidity to mutual funds.
Communication A6523 – 14/06/18
The rules on “Cash transactions to be settled and forward, passes, guarantees, other derivatives and with mutual funds” are modified, incorporating as an exception to the limitation for financial institutions to carry out transactions that involve granting liquidity to mutual funds, to operations with private securities.
Communication A6525 – 14/06/18
It is established that the Value Transporters (TV) must have a comprehensive process for the management of the risk of committing crimes to safeguard the integrity of people, as well as the values transported, considering – among other aspects – the amounts to be transported, the distances to be traveled and the geographical areas in which they will operate. Its implementation does not require authorization from the BCRA. Likewise, a series of recommendations for the management of these risks are disclosed.
Communication A 6526 – 18/06/18
The minimum cash requirement rates in pesos are increased: from 6/21/18 (3 p.p. for demand and time deposits up to 59 days and 1 p.p. for those from 60 to 89 days) and from 7/18/18 (additional 2 p.p. for the former and 1 additional p.p. for the latter). It is admitted to integrate this increase in the requirement with National Treasury Bonds in pesos at a fixed rate maturing in November 2020 valued at market price. The holding of these securities, up to the amount corresponding to the integration carried out, will be excluded from the limits provided for in the rules on “Fractionation of credit risk”. The rules on “Credit Policy” are modified, admitting the application of the capacity to lend deposits in foreign currency to the acquisition of debt instruments of the National Treasury in foreign currency in the secondary market. The rules on “Net global position of foreign currency” are modified, reducing the limit of the daily positive position to 5% of the computable equity liability (CPR) of the entities, and admitting that this may reach up to 30% of the PRC as long as the excess corresponds to the increase in the position in National Treasury bills in foreign currency with respect to those held on 6/15/18.
Communication A6531 – 28/06/18
Effective as of 07/01/18, the minimum capital requirement that entities must have integrated if the funds are channeled to MSMEs is relaxed. In this framework, the “Minimum Cash” rules are modified. In addition, reserve allowances linked to credit lines for MSMEs and the “Ahora 12” plan are increased. In addition, the “Guarantees” rules are modified, eliminating the current limit of 15% of the Computable Patrimonial Liability (RPC) to consider a preferred guarantee to the discount of documents.
References
1 Throughout the Report, the series are deflated using a consumer price index (CPI). As of 2017, the CPI of national coverage prepared by INDEC is taken into account (in June 2018 it presented a monthly variation of 3.7% and 29.5% year-on-year). Until December 2016, the index calculated from the CPIs of the City of Buenos Aires, San Luis and Córdoba weighted according to the National Household Expenditure Survey corresponding to the period 2004-2005 is being worked on.
2 Based on balance sheet balance.
3 As of June, bank reserve requirements were increased and part of them was allowed to be integrated with National Treasury Bonds (for more details, see the Deposits and Liquidity section of this Report).
4 Idem, note 2.
5 In this report, the foreign currency (EM) mismatch is defined as EM assets minus EM liabilities plus net forward purchases of EM without delivery of underlying (off-balance sheet items). This indicator is used for analytical purposes and not in regulatory terms.
7 For more detail, see Section I of the May 2018 Banking Report.
8 It includes integration of minimum cash, BCRA instruments and availabilities.
9 Includes only minimum cash integration and availabilities.
10 Information extracted from the Central Debtors (includes both national and foreign currency). Loans to residents abroad are not included. Business financing is defined here as that granted to legal entities and commercial financing granted to individuals. On the other hand, loans to families are considered to be those granted to individuals, unless they are for commercial purposes.
11Part of this increase is explained by the re-expression in pesos of the balance of loans in foreign currency, within the framework of the monthly depreciation of the peso with respect to the dollar.
12 The value of the UVA is that corresponding to the last working day of July.
13 Includes capital and adjustment of capital for the evolution of the CER.
14 It includes a fixed and repacable interest rate.
15 In particular, the irregularity of mortgage loans remained at 0.2% in June, falling 0.2 p.p. compared to the value of a year ago. Within this segment, the NPL ratio of those denominated in UVA reached 0.08% of the balance as of June 2018.
16 A bank of magnitude accrued lower profits mainly due to exchange difference due to the translation of financial statements of foreign businesses.
Glossary
%a.: annualized percentage.
% YoY: Year-on-year percentage.
Liquid assets: availabilities (integration of “minimum cash” in current accounts at the BCRA and in special guarantee accounts and other concepts, mainly cash in banks and correspondent offices) plus the net credit balance for transfer operations of financial institutions against the BCRA using LEBAC and NOBAC.
Consolidated assets and liabilities: those arising from deducting transactions between entities in the system.
Net Assets (NA): Assets and liabilities are net of accounting duplications for pass-through, forward and spot transactions to be settled.
APR: Total Risk Weighted Assets.
BCBS: Basel Committee on Banking Supervision (BCBS).
Irregular portfolio: portfolio in situation 3 to 6, in accordance with the “Classification of Debtors” regime.
Credit to the public sector: Position in public securities (without LEBAC or NOBAC) + Loans to the public sector + Compensation to be received + Debt securities and Certificates of participation in financial trusts (with underlying public securities) + Miscellaneous credits to the public sector.
Credit to the private sector: loans to the non-financial private sector including accrued interest and CER and CVS adjustment and leasing.
Contribution differences: Results from the monthly update of assets and liabilities in foreign currency. The item also includes the results originated by the purchase and sale of foreign currency, which arise as a difference between the agreed price (net of the direct expenses originated by the operation) and the book value.
Miscellaneous: miscellaneous profits (including, but not limited to, gains on permanent shares, recovered loans and unaffected provisions) less miscellaneous losses (including, but not limited to, losses on permanent shareholdings, loss on sale or disposal of goods for use and amortization of business keys).
Equity exposure to counterparty risk: irregular portfolio net of provisions in terms of equity.
Administration expenses: includes remunerations, social charges, services and fees, taxes and amortizations.
IEF II-17: BCRA Financial Stability Report.
IPCBA: Consumer Price Index of the City of Buenos Aires.
CSF: Liquidity Coverage Ratio (LCR).
LEBAC and NOBAC: bills and notes issued by the BCRA.
LELIQ: BCRA liquidity bills.
LR: Leverage Ratio (LR).
Financial margin: Income minus financial expenses. It includes interest and securities earnings, CER and CVS adjustments, exchange rate differences and other financial results.
Mill.: Million or million, as appropriate.
IFRS: International Financial Reporting Standards.
ON: Negotiable Obligations.
ORI: Other comprehensive results.
OS: Subordinated Obligations.
Other financial results: rental income from financial leases, contribution to the deposit guarantee fund, interest on availabilities, charges for loan depreciation, premiums for the sale of foreign currency and other unidentified items.
PN: Net Worth.
p.p.: percentage points.
SME: Small and Medium Enterprises.
Consolidated profit: Results from permanent holdings in local financial institutions are eliminated. Available since January 2008.
Income from securities: includes results from public securities, temporary shares, negotiable obligations, subordinated obligations, options and other credits for financial intermediation. In the case of public securities, it includes the results accrued in terms of income, differences in share price, exponential increase based on the internal rate of return (IRR) and sales, in addition to the charge for forecasts for the risk of impairment.
Interest income: interest charged minus interest paid for financial intermediation, following the accrual criterion (balance sheet information) and not what is received. It includes interest on loans and deposits of government securities and premiums for passes.
Result for services: commissions charged minus commissions paid. It includes fees related to obligations, credits, securities, guarantees granted, the rental of safe deposit boxes and foreign and exchange operations, excluding in the latter case the results from the purchase and sale of foreign currency, the latter being accounted for in the “Differences in quotation” account. Expenses include commissions paid, contributions to the ISSB, other contributions for income from services and charges accrued from the gross income tax.
ROA: Final result as a percentage of net assets. In the case of referring to accumulated results, the average of the NA for the reference months is considered in the denominator.
SWEE: Final result as a percentage of equity. In the case of referring to accumulated results, the average net worth for the reference months is considered in the denominator.
RPC: Computable Patrimonial Liability. For more details, see Ordered Text “Minimum Capitals of Financial Institutions”.
TNA: Annual nominal rate.
US$: US dollars.
UVA: Unit of Purchasing Value.
ICU: Housing Units.
Share on


