Summary
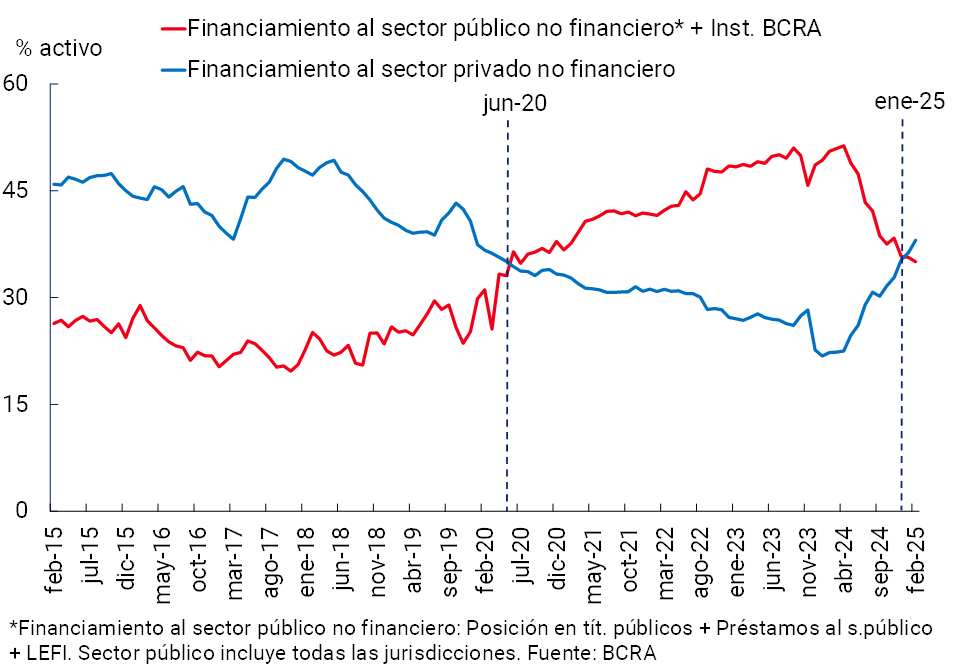
• In a context of marked growth in financial intermediation with the private sector since the beginning of last year, at the beginning of 2025 the exposure of the financial system to families and companies exceeded that of the public sector, after 4 and a half years of being below. In this context, the financial system continues to show high indicators of financial soundness.
• The real balance of credit in national currency to the private sector increased 2.6% in February, accumulating a year-on-year growth of 78% in real terms at the systemic level. Loans with collateral presented the greatest relative monthly dynamism, in a context in which all credit assistance increased in the period. The balance of credit to the private sector in foreign currency grew 8% compared to January – in the currency of origin – more than tripling the level observed a year ago (+250.2% YoY). The total balance of credit to the private sector in terms of assets for the aggregate of the financial system stood at 38.1% in February, reaching the highest value in the last 5 years.
• In February, the NPL ratio for loans to the private sector increased slightly, to 1.76%. The irregularity coefficient of financing to families reached 2.94% in the period (+0.28 p.p. in the month). The NPL ratio for loans to companies remained unchanged from the previous month at around 0.8%. At the aggregate level, the balance of accounting forecasts totaled 155% of the financing in an irregular situation.
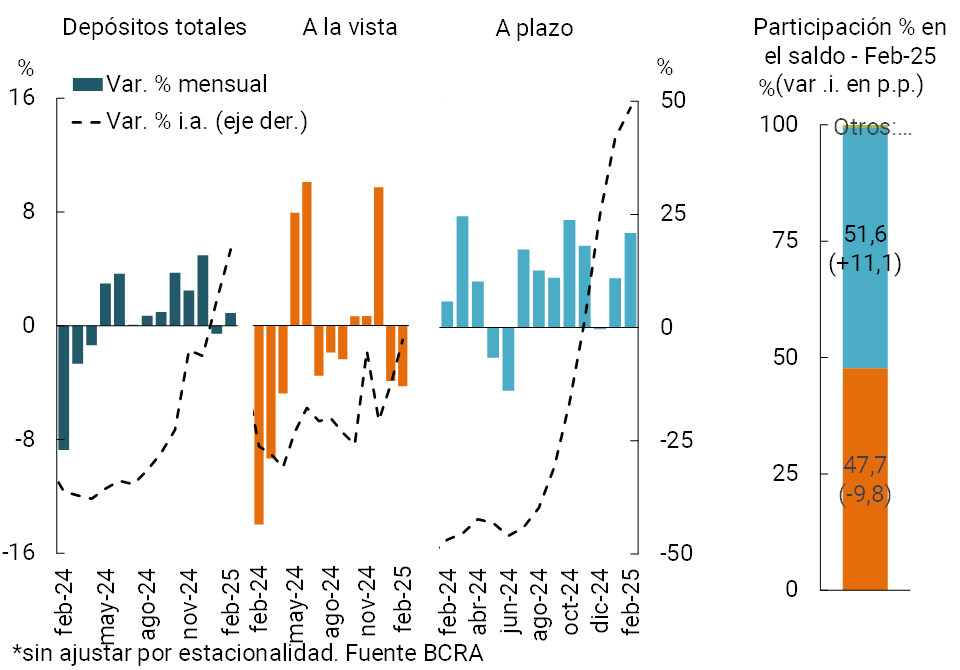
• In February, the real balance of deposits in pesos in the private sector increased by 0.9%, totaling a growth of 16.8% YoY. The real balance of time deposits increased 6.7% in the month, mainly due to those deposits arranged at a fixed interest rate. The real balance of private sector demand accounts fell by 4.3% in the period.
• The liquidity of the financial system fell slightly in February. The ratio between liquid assets in pesos and deposits in the same denomination totaled 36.1% for the broad measure and 11.3% when considering exclusively availabilities. Regarding the foreign currency segment, in a context of high liquidity and credit recomposition, in February the liquidity ratio of the financial system fell to 63.2% of deposits in that denomination.
• Capital integration of all entities stood at 29.1% of risk-weighted assets (RWA), unchanged from January and thus remaining in a relatively high environment. The capital position of the financial system (PRC minus requirement) remained at 261% of the regulatory requirement.
• Financial institutions accumulated profits – comprehensive totals in homogeneous currency – equivalent to 1.4% of assets (ROA) for the last 3 months to February 2025. In the accumulated 12 months to February, the ROA of the financial system reached 4%, 1.3 p.p. less than in a year-on-year comparison.
• As is common at the beginning of the year, the volumes traded of the main alternative means of payment to cash decreased compared to recent months. However, in year-on-year terms, significant growth is recorded, both in quantities and amounts. For example, the values of immediate transfers made expanded 46.3% in real terms year-on-year, payments with transfers 138.2% in real terms and ECHEQs compensation 39.2% in real terms. In the last year, all these means of payment gained share in terms of GDP.
I. Financial intermediation activity
The intermediation activity of the financial system with the private sector continued to grow in the second month of the year. Considering the variations in the most relevant items of the balance sheet in pesos of all entities – in homogeneous currency – in February the main sources of funds were the decrease in liquid assets and the balance of financing to the public sector, as well as the increase in the balance of private sector deposits. The increase in the real balance of financing to the private sector and the fall in real deposits of the public sector were the most important applications of resources in the period. With respect to foreign currency items, liquidity was reduced in February, mainly as a counterpart to the increase in credit to the private sector.
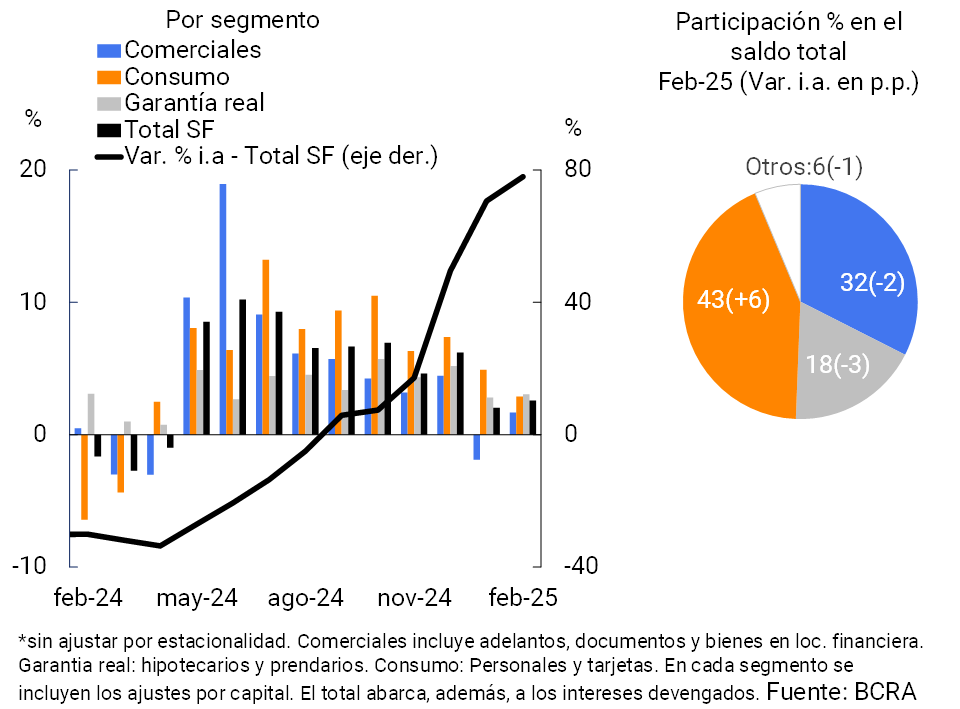
In February, the balance of financing in national currency to the private sector increased by 2.6% in real terms1 (see Chart 1). All credit assistance grew in the month, with a greater relative dynamism of loans with real collateral (+3.1% real in the month), followed by consumer and commercial lines (+2.9% real and +1.7% real monthly, respectively). In a year-on-year comparison, the balance of financing in pesos to the private sector accumulated an increase of 78% in real terms, with generalized increases among the different groups of financial institutions and credit lines.
Graph 1 | Real balance of credit to the private sector in pesos* Monthly changes
Graph 2 | Financial intermediation with the private sector in foreign
currency In source currency
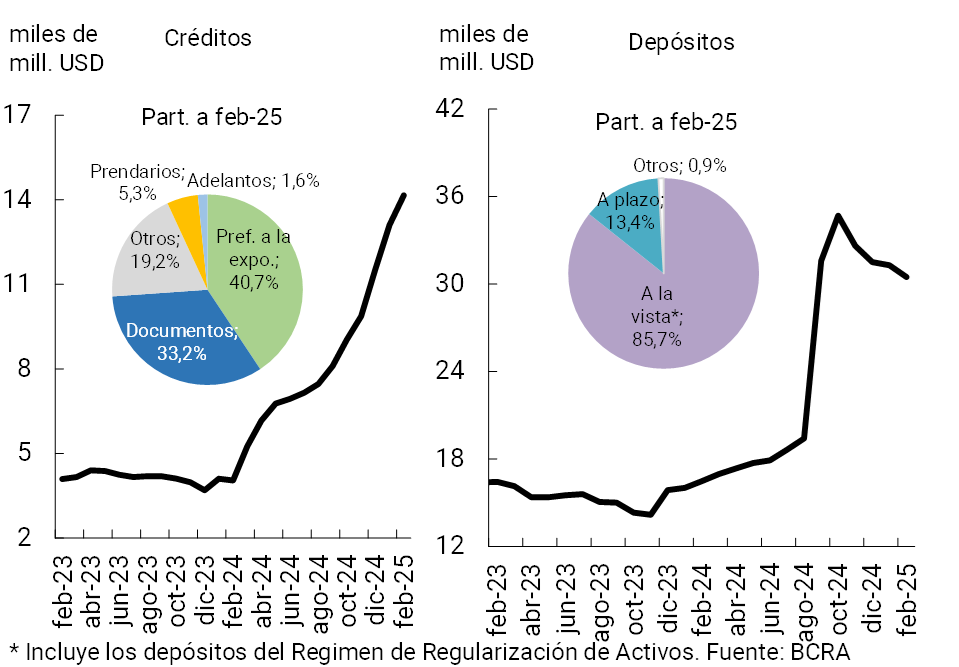
The balance of loans in foreign currency to the private sector increased 8% compared to January ( in source currency – ( see Graph 2). The monthly performance was mainly explained by export pre-financing (47% of the increase in the period) and by documents (36% of the increase). As a result of the positive dynamics that have been observed in recent months, the balance of financing in foreign currency to the private sector more than tripled the level observed a year ago (+250.2% YoY).
Accumulating the items in domestic and foreign currency, in February the total credit balance to the private sector increased by 3.3% in real terms compared to January (+89.3% real y.o.y.). On the household side, in February the increase in pledge and personal loans stood out (+11.6% real and +7.8% real monthly, respectively; see Graph 3). On the business side, financing to service providers and construction companies showed the highest relative monthly dynamism (+5% real and +4.1% real monthly, respectively)2.
Graph 3 | Real balance of total credit to the private sector*
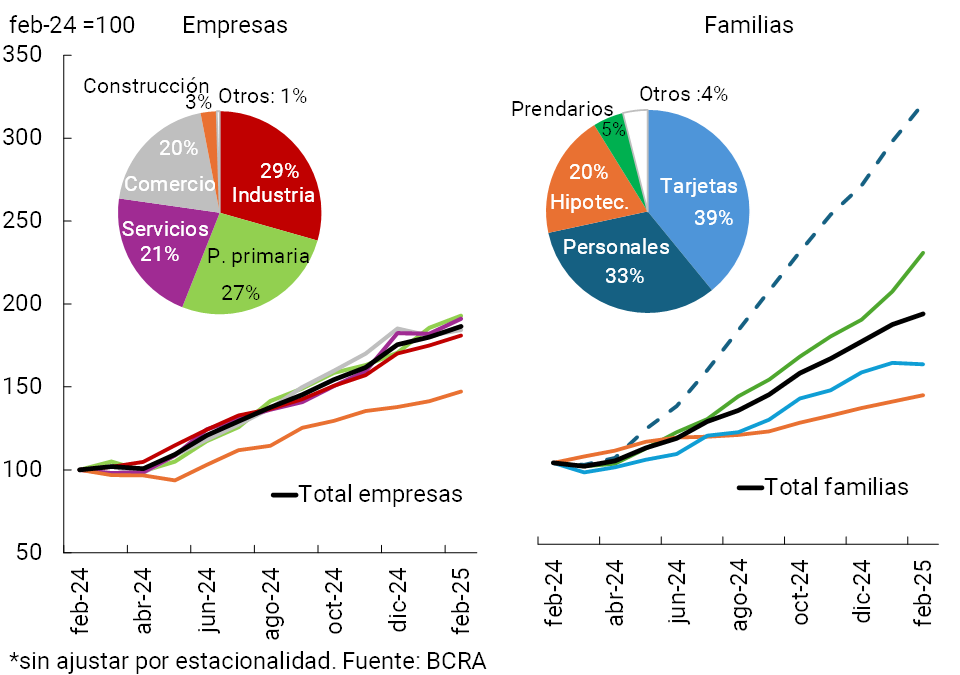
Figure 4 | Estimation of mortgage “registrations” (individuals)
Financial system
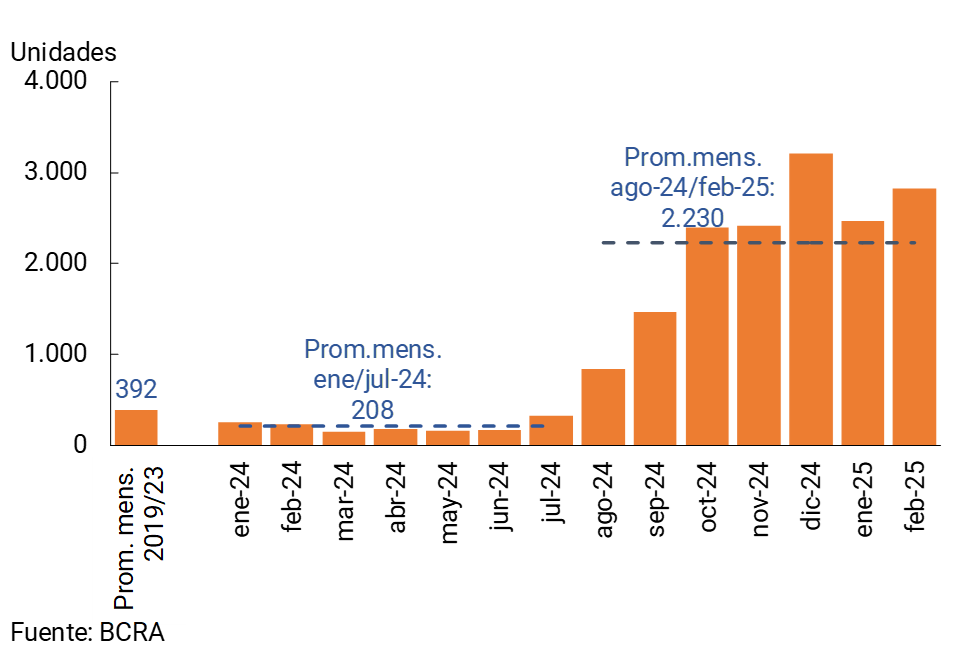
In February, the balance of mortgage loans to the private sector continued to grow at a rate of 2.5% real monthly (37% real y.o.y.). At the systemic level, it is estimated that more than 2,800 new mortgage debtors were incorporated in the month (registrations of individuals, see Graph 4), thus accumulating a total of approximately 16,800 new debtors in the last 12 months (almost 12,700 between August 2024 and February 2025).
Regarding the funding of all financial institutions, in February the real balance of deposits in national currency of the private sector increased by 0.9%, accumulating a growth of 16.8% YoY (see Graph 5). The real balance of time deposits increased by 6.7% in real terms in February (+48.6% YoY in real terms), with a greater relative dynamism in those deposits arranged at a fixed interest rate (+16.8% real monthly)3. The real balance of the private sector’s demand accounts fell 4.3% compared to January (-3.2% real YoY). Thus, the balance of time deposits came to represent 51.6% of the balance of total deposits of the private sector, increasing 11.1 p.p. in a year-on-year comparison.
Graph 5 | Real balance of private sector deposits in pesos*
The balance of private sector foreign currency deposits fell 2.6% in February (in source currency). Despite this monthly dynamic, the balance of deposits in foreign currency of the private sector accumulated an increase of 85% YoY, remaining at one of the highest levels in the last five years (see Chart 2). The real balance of total deposits (including all sectors and currencies) decreased by 2.1% compared to January (+15.7% real YoY).
II. Evolution and aggregate composition of the balance sheet
In the month, the total assets of the financial system fell 1.5% in real terms, while in year-on-year terms it reflected an expansion of 10.9% in real terms.
With respect to the composition of the system’s assets, in February the balance of credit to the private sector continued to gain share, especially the segment in pesos, while the total balance of availabilities (to a greater extent the foreign currency component) and exposure to the public sector reduced their relative weight in the aggregate balance sheet. As a result of this dynamic, the exposure of banks as a whole to the private sector was above exposure to the public sector4 for the second consecutive month (38.1% and 35% of assets, respectively (see Chart 6). In relation to the aggregate funding structure of the entities, the relative weight of time deposits in national currency of the private sector increased in the month, while the rest of the deposits (both public and private sector, and in national and foreign currency) reduced their participation.
Graph 6 | Credit to the private and public
sectors Financial system – As % of assets
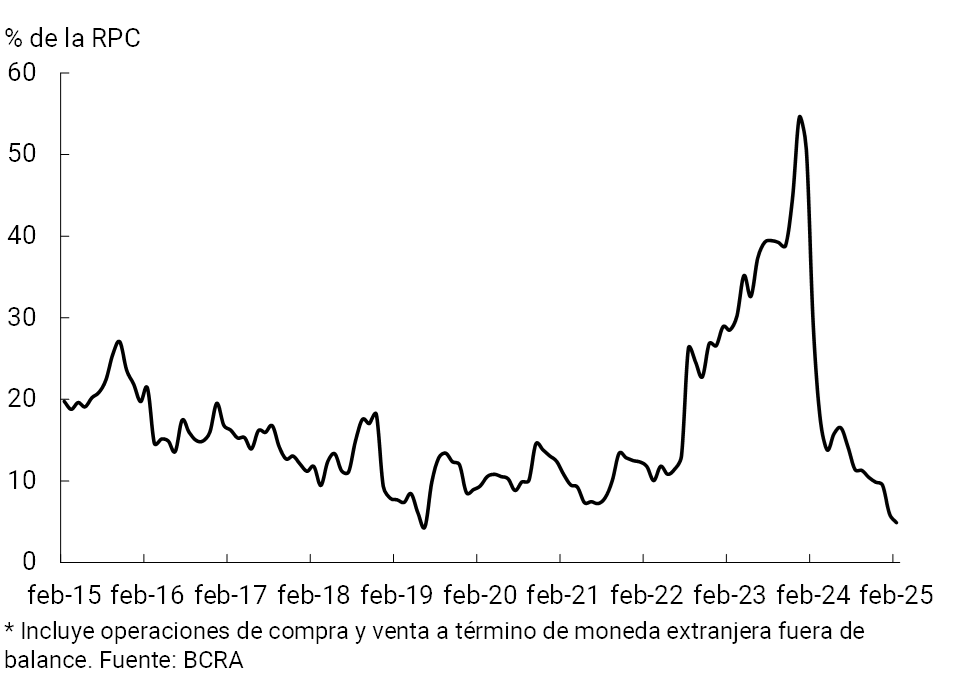
In February, the spread between foreign currency assets and liabilities narrowed, reaching a systemic level of around 4.9% of regulatory capital (RPC), 1.1 p.p. and 24.1 p.p. below the level of the previous month and February 2024, respectively5. The current figure was one of the lowest in the last 10 years for the financial system as a whole (see Graph 7), within the framework of the current regulations6. As of February, the estimated spread between assets and liabilities adjustable by CER (or arranged in UVA) totaled 90.3% of the PRC of the aggregate financial system, falling 7.7 p.p. compared to January (mainly explained by public securities) and 1.6 p.p. in relation to the same period in 2024.
Figure 7 | Spread between assets and liabilities in foreign currency*
Financial system – In % of the PRC
III. Portfolio quality
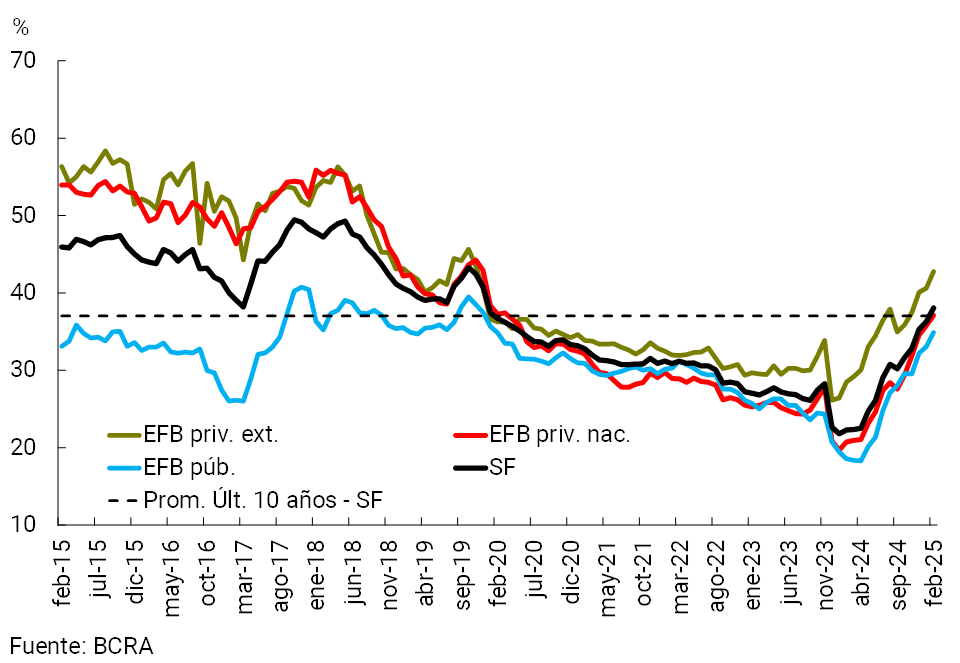
The balance of credit to the private sector in terms of assets stood at 38.1% in the month, increasing 1.8 p.p. compared to January, reaching the highest value in the last 5 years (see Chart 8). This increase was widespread among the groups of banking entities and was observed in both the peso and foreign currency segments7.
Figure 8 | Credit balance to the private sector in terms of assets
– By group of financial institutions
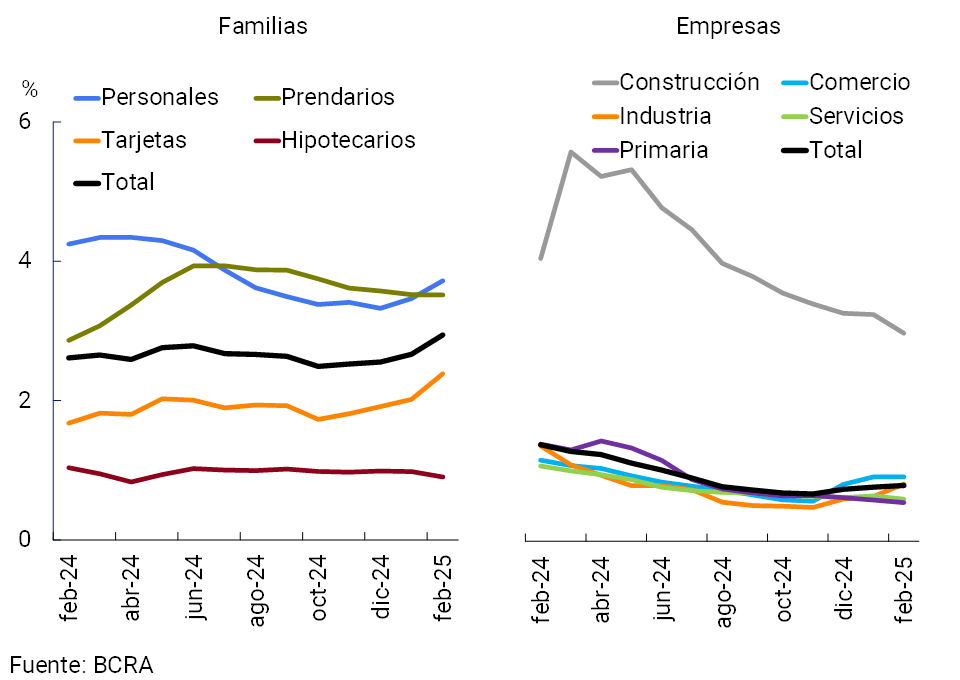
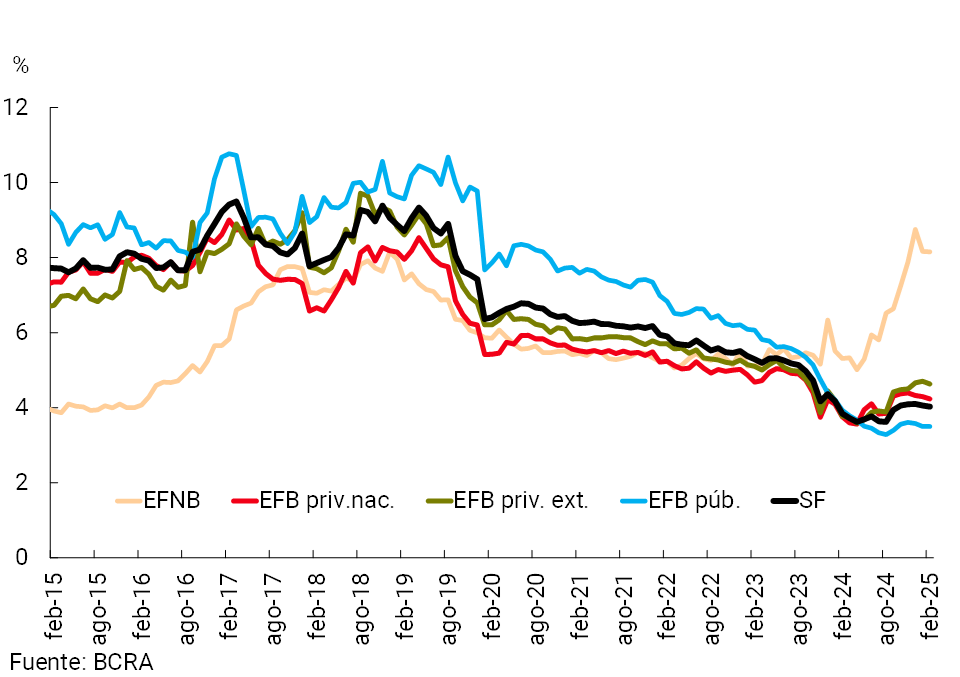
The NPL ratio for loans to the private sector increased slightly in the month, totaling 1.76% at the end of February (+0.13 p.p. compared to January and -0.15 p.p. y.o.y.; see Figure 9). The performance of the indicator in the period was generalized among all groups of financial institutions, with a greater relative increase in non-bank financial institutions. When distinguishing by segments, the indicator of irregularity of financing to families increased 0.28 p.p. in the month to 2.94% (+0.33 p.p. y.o.y.), mainly due to the performance of cards and personal cards (see Graph 10). The NPL ratio for loans to companies remained unchanged from the previous month, at around 0.8% (-0.58 p.p. y.o.y.)8.
Figure 9 | Private sector credit irregularity ratio by entity group
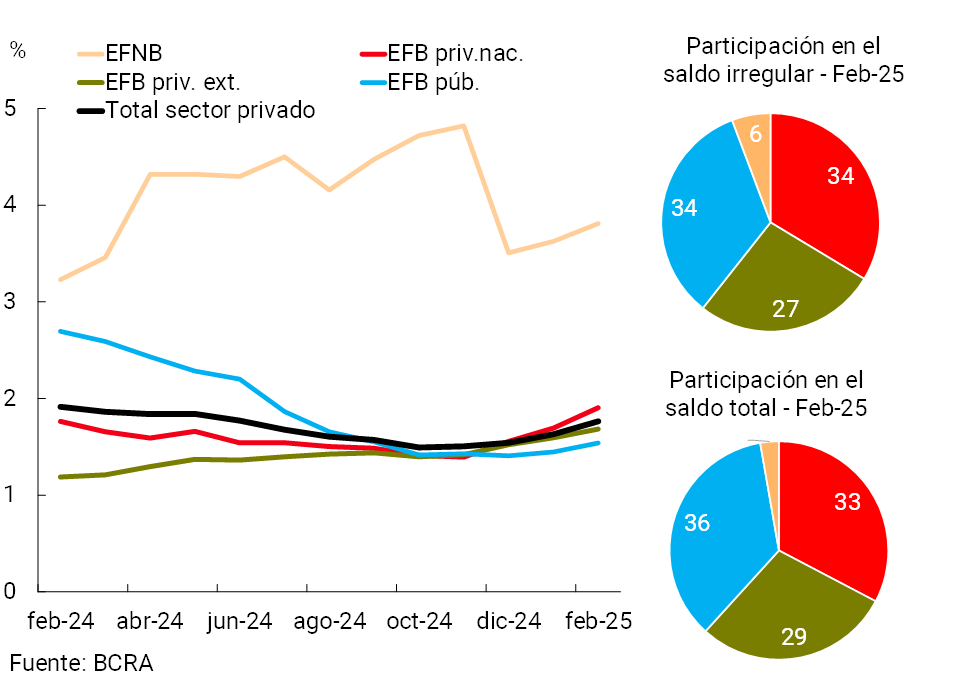
Figure 10 | Private Sector Credit Irregularity Ratio by Credit Segment
The balance of accounting forecasts of all financial institutions totalled 155% of the financing in an irregular situation at the aggregate level (-7.4 p.p. compared to January and -27.6 p.p. y.o.y.) and 2.7% of the total portfolio (+0.1 p.p. in the month and -0.8 p.p. y.o.y.).
IV. Liquidity and solvency
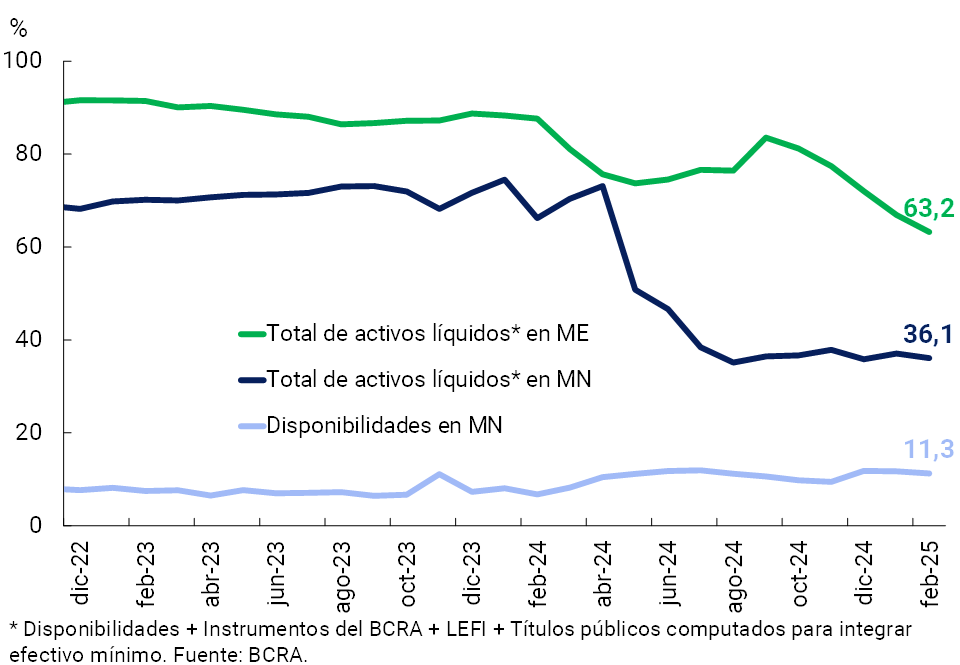
The sector’s liquidity fell slightly in February (see Chart 11). The ratio between liquid assets in pesos and deposits in the same denomination totaled 36.1% for the broad measure (-1 p.p. monthly)9 and 11.3% when considering exclusively availabilities (-0.5 p.p. monthly)10. In this context, in February the balance of LEFI and the current account that entities have in the BCRA reduced their weighting among the most liquid assets and, as a counterpart, the public securities used to integrate minimum cash increased in relative importance. Regarding the foreign currency segment, in a context of high liquidity and credit recomposition, in February the liquidity ratio of the financial system reached 63.2% of deposits (-3.7 p.p. monthly).
Figure 11 | Liquidity
indicators Financial system – As % of deposits in each denomination
With regard to the sector’s solvency, in February the integration of regulatory capital of all entities stood at 29.1% of risk-weighted assets (RWA), with no change in magnitude compared to January and thus remaining in a relatively high environment11. In the same vein, in the month the capital position of the financial system (CPR minus requirement) reached 261% of the regulatory requirement (similar to the level of January) and 42.5% of credit to the private sector net of forecasts (both ratios did not show significant changes in the month). Comfortable capital levels mean that the leverage of the aggregate financial system – measured as assets over equity – is historically low (see Chart 12). From these levels, greater leverage has gradually been observed in all groups of financial institutions in recent months.
Figure 12 | Leverage by Entity
Group Assets/Equity
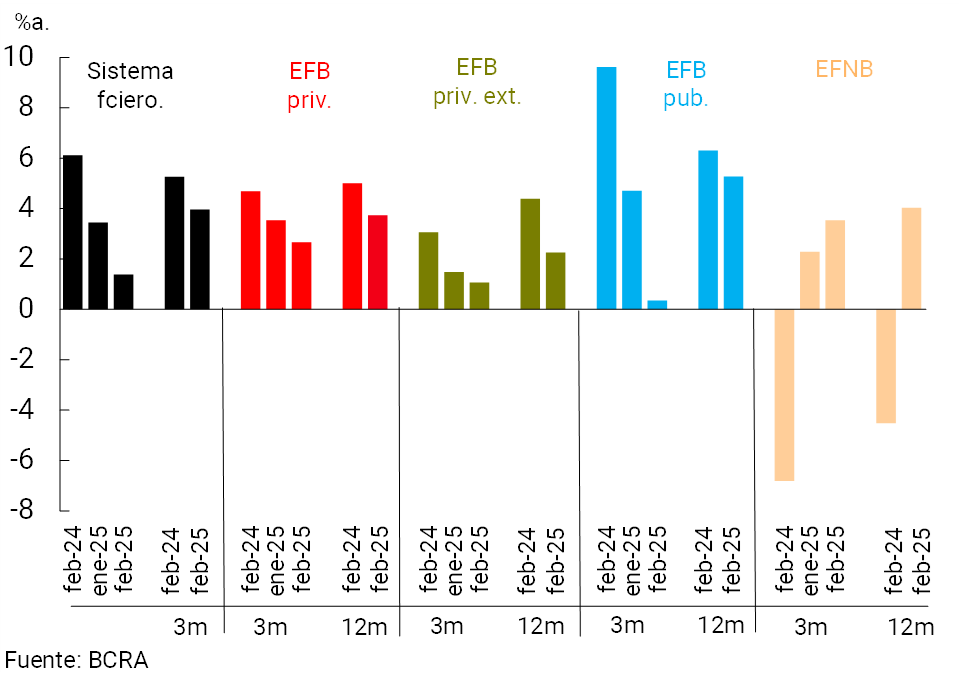
The financial system entities as a whole accumulated profits – comprehensive totals in homogeneous currency – at the end of 2024 and early 2025, thus totaling an ROA of 1.4%a. for the last 3 months to February 2025 (see Chart 13). This level was lower when compared to January and the same period in 2024, a performance reflected in all bank groups (EFNB increases). In the accumulated 12 months to February, the ROA of the financial system reached 4%, 1.3 p.p. less than in a year-on-year comparison.
Figure 13 | 3 and 12 months
cumulative ROA By financial institution group
V. Payment system
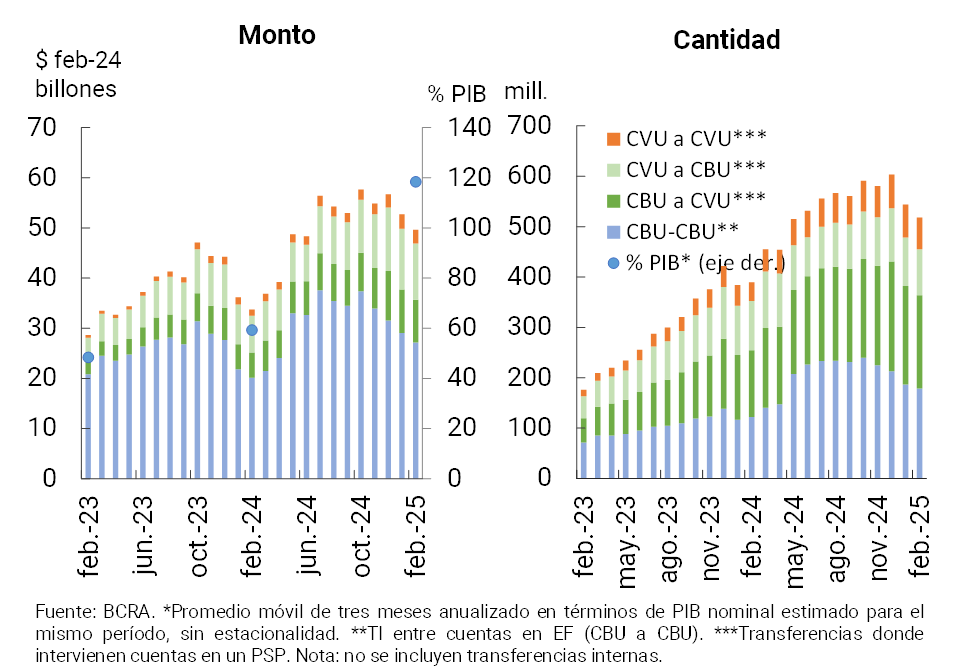
As is common at the beginning of the year, the volume of immediate transfers (TI) decreased compared to recent months. However, in year-on-year terms, IT expanded significantly: 32.9% in quantity and 46.3% in real amounts (see Graph 14). This year-on-year dynamic was mainly driven by transactions between accounts in payment service providers (CVU to CVU)12 13. As of February, the amount of IT processed represented approximately 118.6% of GDP, gaining more and more weight in the economy (+59.1 p.p. y.o.y.).
Figure 14 | Instant Transfers (TI)
Payments with Transfer (PCT) operations through QR codes were also affected by the seasonal factor when compared to the activity recorded months ago. When considering the year-on-year variation (isolating the seasonal effect) to February, this payment modality registered an increase of 91.4% in quantities and 138.2% in real amounts14. It is estimated that PCTs with QR grew 1.6 p.p. in terms of GDP in the last year to total a level of 2.8% as of February.
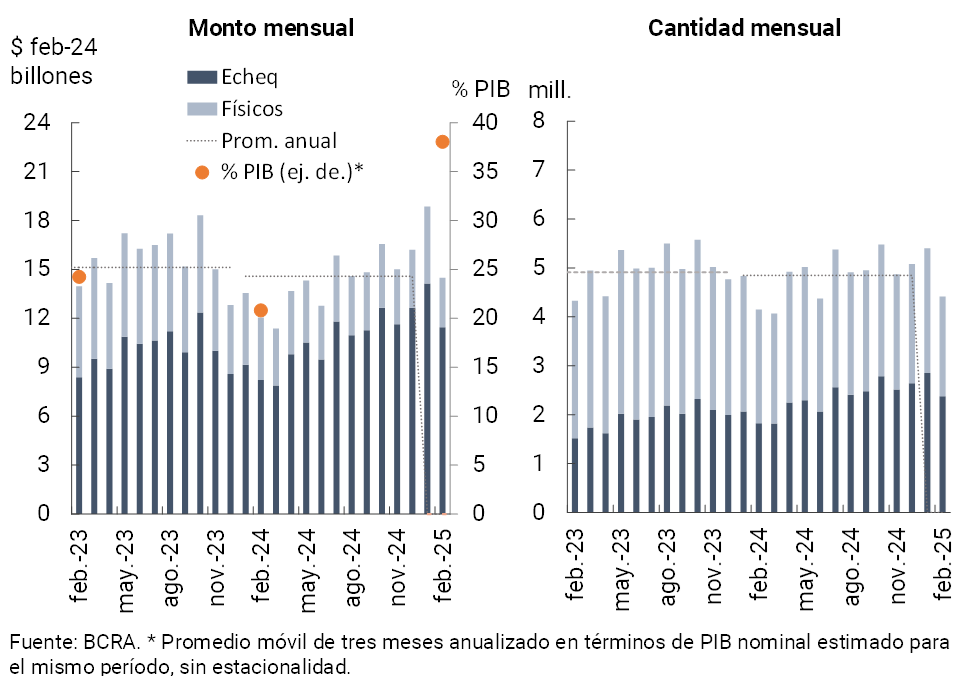
In February, the clearing of checks decreased compared to the first month of the year (-18.3% in amounts and -23.1% in real terms, see Chart 15)15. When disaggregated by type of check, it can be seen that the electronic modality (ECHEQs) continued to gain share in the last year (driven by a growth of 30% YoY in quantities and 39.2% YoY in real amounts). As a result, ECHEQs currently account for 53.8% of the total amount of cleared checks and 79% in terms of amounts. The increase in the volume traded through ECHEQs drove a greater share of check clearing in terms of the level of economic activity, reaching a value equivalent to 38% of GDP in the last quarter, which implies a year-on-year improvement of 17.2 p.p.
Figure 15 | Check clearing
The ratio of bounced checks due to lack of funds and total volume cleared increased again in February, both in quantities and in actual amounts. In the month, this ratio was around 0.95% in terms of quantities (+0.04 p.p. monthly) and 0.66% in terms of amounts (+0.1 p.p. monthly). Both indicators are above the levels observed in the same month of the previous year (+0.42 p.p. and +0.35 p.p., respectively) and in the average of 2024.
References
1 Changes in balance sheet (not seasonally adjusted). Includes principal adjustments and accrued interest.
2 Financing to companies is defined here as that granted to legal entities and commercial financing granted to natural persons. On the other hand, loans to families are considered to be those granted to individuals, unless they are for commercial purposes.
3 The balance of time deposits includes time deposits and time investments.
4 Considering both financing to the non-financial public sector and the BCRA’s instruments
5 Includes off-balance sheet foreign currency forward purchase and sale transactions. Liabilities include deposits that have variable remuneration depending on the evolution of the exchange rate – associated with the Export Increase Programme – and LEDIV are included in assets.
6 For more detail, see Global Net Foreign Currency Position.
7 The balance of total credit to the private sector net of forecasts represented 37% of assets in February, increasing 1.7 p.p. compared to last month and 15.5 p.p. in a year-on-year comparison.
8 In February, the Estimated Probability of Default (EDP) – for a detail on its construction see Section 3 of the IEF – I-24 – for credit to the private sector reached 0.99% (in terms of balances) and 2.5% (in terms of amounts), increasing both in a monthly and year-on-year comparison (+0.16 p.p. compared to January and +0.38 p.p. y.o.y.). The monthly increase in the indicator was mainly explained by the segment to families, whose PDE (in terms of balances) stood at 1.72% in February (+0.23 p.p. in the month and +0.6 p.p. y.o.y.). The EDP for financing to companies stood at 0.4% in the month (+0.09 p.p. monthly and +0.21 p.p. y.o.y.)
9 It considers availabilities (cash and current account at the BCRA), fiscal liquidity bills (LEFI), and the balance of the types of public securities that the entities compute as part of the Minimum Cash (until mid-2024 it also incorporated BCRA instruments).
10 When incorporating the holding of LECAPs that mature within the next 3 months, the broad indicator of liquidity in national currency would amount to 44.9% of deposits in pesos at the systemic level (+0.8 p.p. monthly).
11 The ratio between capital integration and risk assets is much higher than that recorded years ago (average of 22.4% for the last 10 years) as well as when compared to the countries of the region (average of 18.6%).
12 In year-on-year terms through February, the amount of IT among CVUs increased 69.5% (111.4% in real amounts), while those among CBUs grew 46.1% (33.3% in real amounts). On the other hand, operations going from CBU to CVU registered an increase of 39.8% year-on-year (69.8% in real amounts), while those from CVU to CBU showed a fall of -6.6% year-on-year, although with an increase of 53.1% in real amounts.
13 In February, the average value of IT was $93,500.
14 In February, the average value of PCTs through QR codes was $18,700.
15 In February, the average amount of cleared checks was $3.3 million ($1.5 million in the physical format and $4.8 million in ECHEQs).
Share on


