About the use of inclusive language in this publication
The use of language that does not discriminate and that makes all gender identities visible is an institutional commitment of the Central Bank of the Argentine Republic. This publication recognizes the influence of language on ideas, feelings, ways of thinking and evaluation schemes.
This document has sought to avoid sexist and binary language. However, for ease of reading, resources such as “@” or “x” are not included.
Executive summary
• In February, the aggregate financial system maintained relatively high liquidity and solvency indicators compared to the average of the last 10 years, with a slight decrease in financial intermediation with the private sector in the context of the influence of seasonal factors. In order to continue improving access to credit for MSMEs and individuals, promoting banking penetration and the use of electronic means of payment, the BCRA recently introduced a set of incentives for financial institutions through new franchises on minimum cash requirements.
• The balance of credit to the private sector in pesos fell 1.7% in real terms in the month (nominal increase of 1.8%), although it accumulated a real year-on-year growth (y.a.) of 9.4%. In the context of the pandemic, the BCRA timely promoted various credit assistance programs aimed at boosting the credit channel for companies and families. Among them, through the Financing Line for Productive Investment (LFIP) of MSMEs until the end of March 2021, $411,678 million were disbursed (of which $78,429 million correspond to investment projects), reaching 98,080 companies.
• In February, the ratio of irregularity of credit to the private sector for the financial system continued to fall to 3.8% (-2.4 p.p. y.o.y.), a period in which the transitory modification on the parameters for classifying debtors and the possibility of transferring unpaid installments at the end of the life of the credit remained in force. In this context, the financial institutions as a whole maintained high and growing levels of forecasts, totaling 5.9% of total credit to the private sector (+0.5 p.p. y.o.y.) and 155.6% of credit to the private sector in an irregular situation (+68.6 p.p. y.o.y.).
• The balance of deposits in pesos in the private sector fell by 0.8% in real terms in February (nominal increase of 2.7%), mainly due to the performance of demand accounts. On the other hand, time deposits in pesos of the private sector increased 2.3% in real terms in the month (nominal increase of 6%), highlighting the performance of the segment in UVA. In a year-on-year comparison, deposits in pesos in the private sector increased 19.3% in real terms, with growth in demand and time accounts.
• Liquidity in the broad sense of the aggregate financial system increased 0.3 p.p. of total deposits in February, to represent 65%. This indicator increased 1.2 p.p. compared to 12 months ago, mainly due to the performance of the segment in foreign currency.
• With regard to the solvency of the sector, in February all groups of financial institutions increased their capital integration levels (PROs) in terms of risk-weighted assets (RWA). The PRC of the aggregate financial system amounted to 24.7% of RWAs (+0.5 p.p. compared to January and +3.2 p.p. YoY), while the capital position (RPC net of regulatory requirements) stood at 196% of the requirement.
• In the first two months of 2021, the profitability indicators of all financial institutions were positive, although they were below those recorded both at the end of 2020 and in a year-on-year comparison. In the twelve months to February, the financial system’s comprehensive results in homogeneous currency reached 1.9% of assets (ROA) and 12.9% of equity (ROE).
I. Financial intermediation activity
Financial intermediation activity continued to show a relatively weak performance in the second month of the year, partly due to seasonal factors. According to the estimated flow of funds in homogeneous currency on items inpesos 1, in February the most relevant sources of resources for all financial institutions were the reduction of credit to the private sector, and, to a lesser extent, of liquidity in the broad sense. Meanwhile, the decrease in deposits from the private sector and the public sector were the main applications of funds in period2.
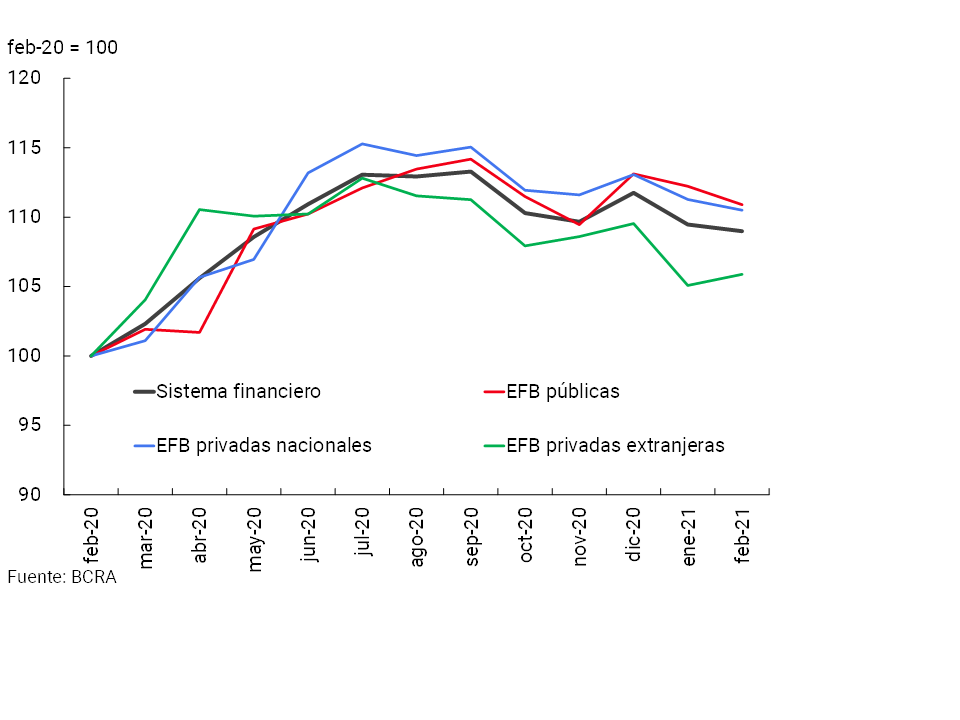
The real balance of financing to the private sector in pesos decreased by 1.7% in February (+1.8% in nominal terms)3. The monthly performance was generalized in almost all credit lines (with the exception of assets in financial leases) and in all groups of financial institutions. In a year-on-year comparison (y.a.), the balance of credit in pesos to the private sector accumulated an increase of 9.4% in real terms. The year-on-year increase was mainly driven by documents and, to a lesser extent, by card financing (see Chart 1), in a context in which credit channeled by foreign private financial institutions showed greater relative dynamism4.
Graph 1 | Credit to the private sector in pesos
In real terms*
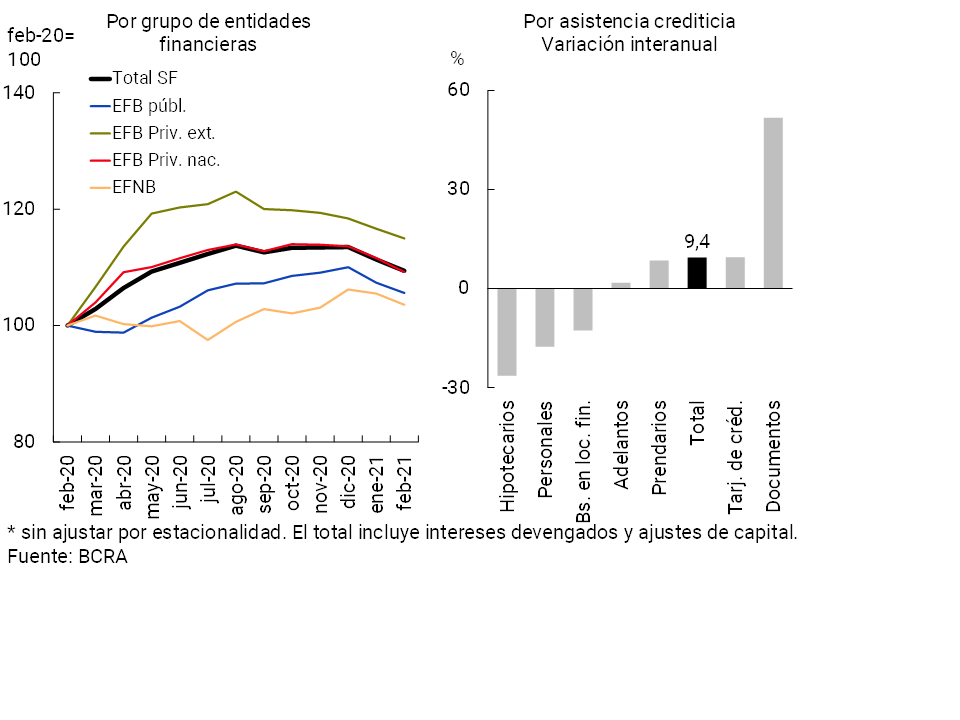
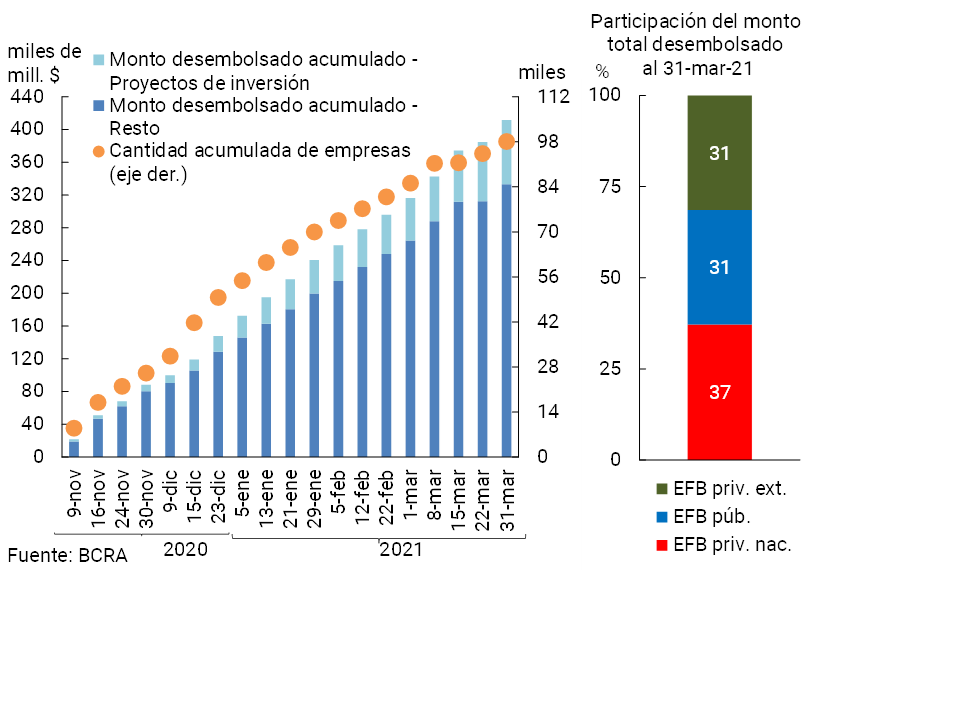
In the context of the COVID-19 pandemic, the BCRA promoted various credit assistance programs aimed at boosting the credit channel for the private sector. In particular, within the framework of the Financing Line for Productive Investment (LFIP) of MSMEs5, since its implementation and until the end of March 2021, $411,678 million were disbursed (of which $78,429 million correspond to investment projects), distributed among 98,080 companies (See Graph 2). Differentiating by group of financial institutions, so far, national private banks accounted for 37% of total disbursements, while foreign public and private banks accounted for 31% respectively.
Graph 2 | Financing line for productive investment of MSMEs
In order to continue expanding access to financing for MSMEs under conditions that are favorable to them, in mid-March the BCRA established a new LFIP quota. Until the end of September, the financial institutions reached6 must maintain a balance of financing included that is at least equivalent to 7.5% of their deposits from the non-financial private sector in pesos. Acts 7, 8
In addition, through the line of financing at subsidized interest rates for companies registered in the “Emergency Assistance Program for Work and Production” (ATP)9, $14,240 million were granted until the end of March, covering almost 607,800 workers.
For its part, within the framework of the credit lines aimed at single-tax and self-employed people, until the end of March, $66,478 million had been granted through the Zero Rate Credits10 and $309 million through the Zero Rate Credits Culture. 11
Recently, the BCRA designed a series of measures in order to: (i) improve access to credit for MSMEs and individuals not yet served by financial institutions, (ii) promote the banking penetration of individuals, (iii) stimulate the use of electronic means of payment and (iv) improve the operation and efficiency of ATMs. In particular, a set of incentives was provided for financial institutions through the implementation of new franchises for the constitution of minimum cash, to the extent that they carry out actions that are in line with the objectives listed12. Incentives in terms of minimum cash will be available to financial institutions that demonstrate that they granted financing to customers (whether individuals or SMEs) not registered as debtors by financial institutions in December 2020 at a maximum interest rate of 43% TNA, and/or that transactions by electronic means were increased (considering debits in demand accounts in pesos for individuals and the issuance of ECHEQ and electronic credit invoice MSMEs for legal entities) and/or that maintained a high operability of their ATMs, considering failures due to lack of banknotes. In other words, financial institutions will be able to access a franchise to the extent that they incorporate individuals or legal entities that only have loans originated outside the financial system, and promote their conversion into bank loans with lower interest rates. It should be noted that the franchise will only be applicable as long as the financial institution has implemented the remote and face-to-face opening of the “Universal Free Account”, which is a channel of access to the banking system that, due to its free characteristics and minimum access requirements, promotes the banking penetration of the population – relaunched by the BCRA in January 202013.
It should be noted that according to the results of the Credit Conditions Survey (ECC) corresponding to the first quarter of 2021 (published on April 15 of this year)14, the aggregate of participating entities shows a bias in the second quarter of the year towards a slight increase in credit demand from companies at a general level (after a first quarter without major changes in demand). a situation that would be reflected in large companies and would extend with greater intensity in SMEs. At the same time, demand growth is also expected in almost all credit lines in the household segment (after a first quarter with a certain increase in part of the consumption lines).
In February, the balance of financing in foreign currency to the private sector did not register any changes in magnitude compared to January (-0.1% in foreign currency). Thus, the total credit balance (in domestic and foreign currency) to this sector fell 1.6% in real terms in the month and accumulated a real fall of 2.6% compared to February 2020.
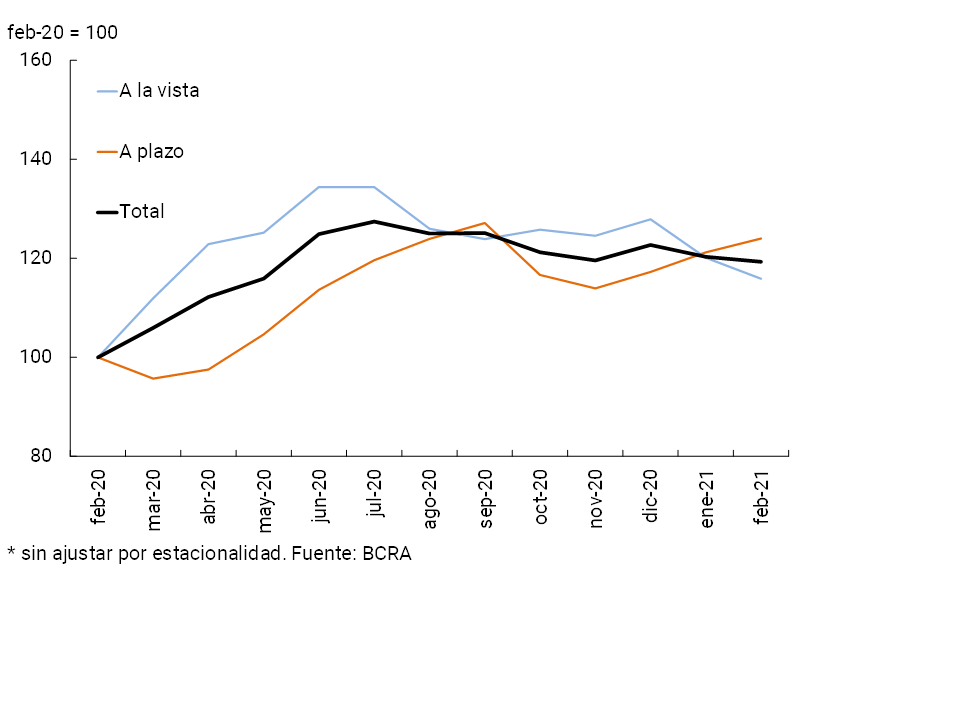
On the funding side of all financial institutions, in February the balance of deposits in national currency of the private sector decreased by 0.8% in real terms (+2.7% nominal), driven mainly by demand accounts (-3.5% real or -0.1% nominal) (see Chart 3). For its part, the real balance of time deposits in pesos of the private sector increased 2.3% compared to the previous month (6% nominal), driven mainly by the performance of foreign private financial institutions and EFNBs. In particular, time deposits denominated in UVA continued to grow at high rates: 36.9% in real terms for those with early repayment and 20.4% in real terms for traditional deposits. 15
Graph 3 | Balance of private sector deposits in pesos
In real terms*
It should be noted that the BCRA recently published a statement listing the rights and options available to people who use financial services16. Among these, the different modalities that exist for the constitution of a fixed term are described: (i) traditional fixed term, with a minimum term of 30 days; (ii) pre-cancelable UVA fixed terms from 30 days; (iii) traditional UVA fixed terms, with a minimum term of 90 days, among others. Fixed terms can be made – without limits on amounts – through the website or mobile banking of any financial institution, without paying any commission or charges for the use of this modality.
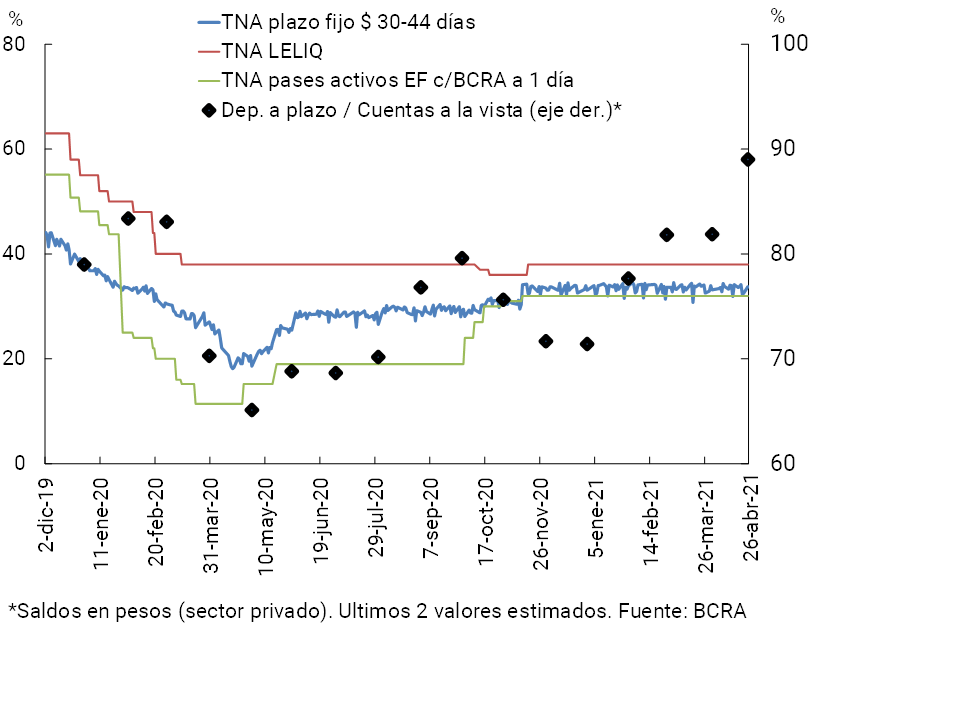
In February, monetary policy interest rates and nominal passive interest rates traded remained unchanged in magnitude compared to what was observed in the previous month (see Chart 4). In this context, the ratio between the balance of time deposits and the balance of private sector demand accounts in pesos continued to increase during the period.
Figure 4 |Interest rates and deposits in pesos*
The balance of foreign currency deposits of the private sector increased 0.3% in February —in source currency—. As a result, total private sector deposits (in domestic and foreign currency) fell 0.7% in real terms in the period, accumulating a real year-on-year increase of 10.7%.
In year-on-year comparison, in February deposits in pesos from the private sector increased by 19.3% in real terms (+67.8% YoY nominal), while those in the public sector increased by 34% in real terms (+88.5% YoY nominal). Thus, the balance of deposits in total pesos (including both sectors) increased 21.3% in real terms compared to the same period of the previous year (+70.6% nominal YoY). On the other hand, considering both the private and public sectors and all currencies, the real balance of deposits accumulated an increase of 13.4% YoY in real terms (+59.6% YoY nominal).
II. Aggregate composition of the balance sheet
In February, the total assets of the aggregate financial system fell by 0.4% in real terms (+3.1% nominal), accumulating a year-on-year increase of 9% in real terms. Disaggregated by group of financial institutions, in the month the assets increased in foreign private financial institutions and decreased in national public and private entities (see Graph 5).
Graph 5 | Total Asset Balance
In real terms
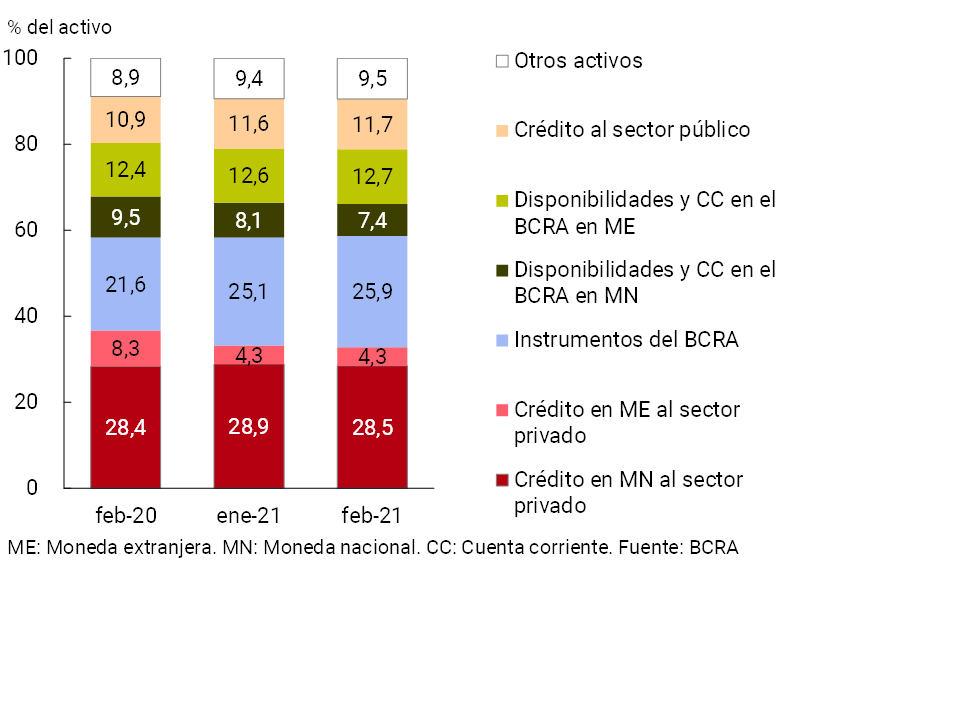
In relation to the composition of the total assets of the financial system, in February the relative importance of the holding of monetary regulation instruments increased slightly, while the balance of current accounts in the BCRA in pesos and, to a lesser extent, of credit to the private sector in the same denomination reduced their relative weight (see Chart 6). Regarding the relative weighting of items in foreign currency, there were no changes in magnitude in February.
Graph 6 | Composition of total assets
Financial system – Share %
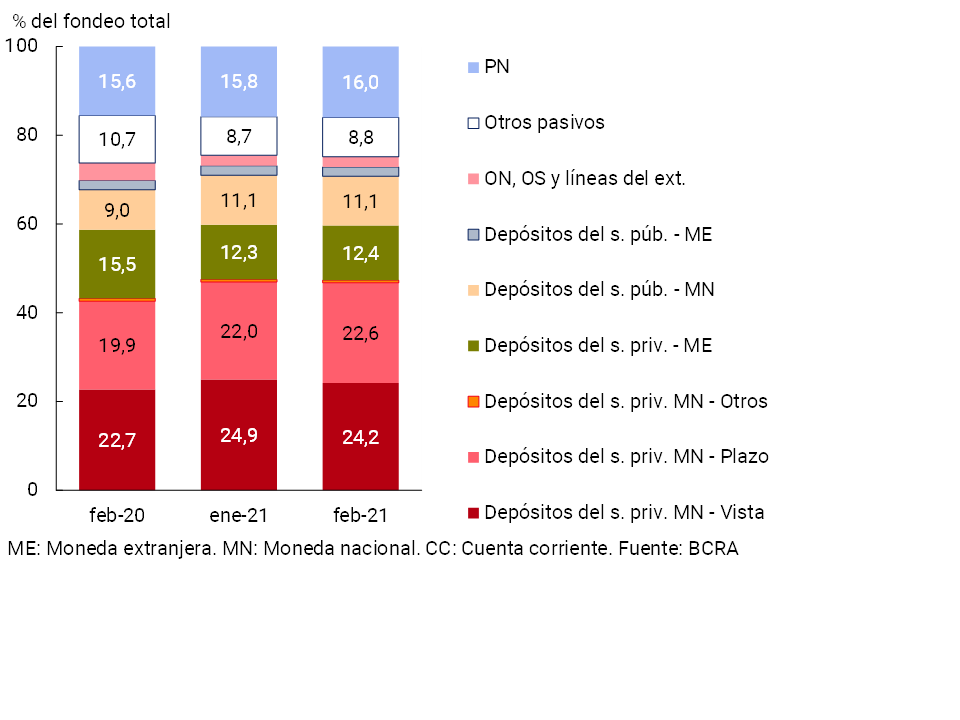
With regard to the composition of the funding of the financial institutions as a whole, in February the private sector’s time deposits in pesos increased their share of the total (see Chart 7), while the sector’s demand accounts in pesos decreased in relative importance. The rest of the items that make up the total funding did not show great variations in the month.
Figure 7 | Total system funding composition
In % of total funding (liabilities + equity)
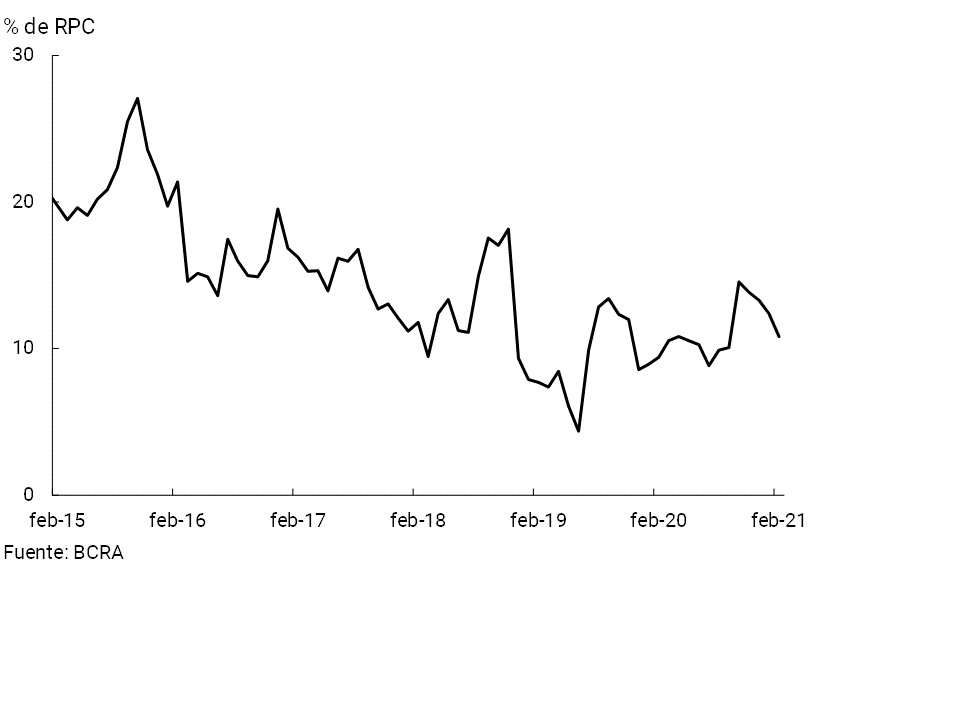
Foreign currency assets in the aggregate financial system totaled 19.7% of assets in February, unchanged from the previous month (+0.1% in the month; -3.8 p.p. y.o.y.). Liabilities in the same denomination accounted for 17.7% of total funding (liabilities and equity), also remaining unchanged in relation to January (-4.4 p.p. y.y.). When including forward purchase and sale of foreign currency – classified off-balance sheet – in February the spread between assets and liabilities of the financial system in this denomination represented 10.8% of regulatory capital, 1.6 p.p. below last month’s record and 1.4 p.p. above the level of a year ago (see Chart 8).
Figure 8 | EM Assets – EM Liabilities + EM Forward Position (Financial System)
III. Portfolio quality
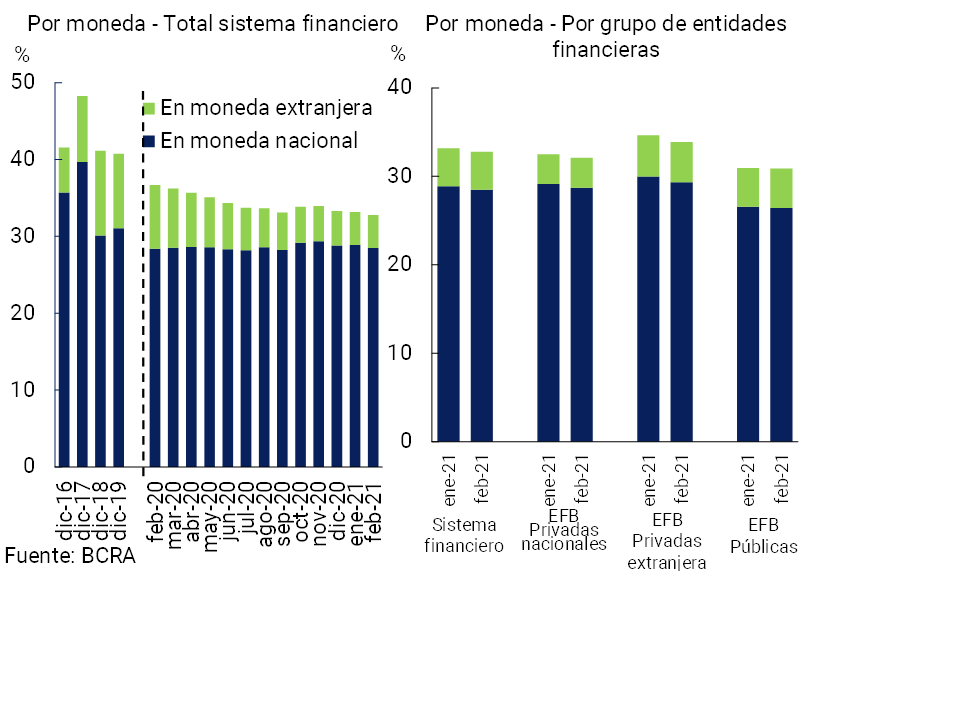
The financial system’s gross exposure to the private sector (including domestic and foreign currency) stood at 32.8% of total assets in February, 0.4 p.p. below the value of the previous month. When considering only financing in pesos, the ratio amounted to 28.5%, 0.4 p.p. less than in January and without significant changes with respect to the same month of the previous year (see Graph 9). For its part, credit to the private sector in foreign currency continued at levels similar to the previous month. Considering the balance of credit net of forecasts, in February the exposure of all financial institutions to the private sector totaled 30.8% of total assets, down 3.9 p.p. y.o.y.
Figure 9 | Credit balance to the Private Sector / Assets
In February, the transitory modification of the parameters for classifying debtors and the possibility of transferring unpaid installments at the end of the life of the credit – accruing onlycompensatory interest 17 – was still in force to alleviate the financial burden of people in the face of the pandemic scenario. In this scenario, the non-performing ratio of credit to the private sector for the aggregate financial system continued to fall slightly in the month to 3.8% (-2.4 p.p. y.o.y.) (see Graph 10). This drop was widespread among the different groups of financial institutions.
Figure 10 | Irregularity of credit to the private sector
Irregular financing / Total financing (%)
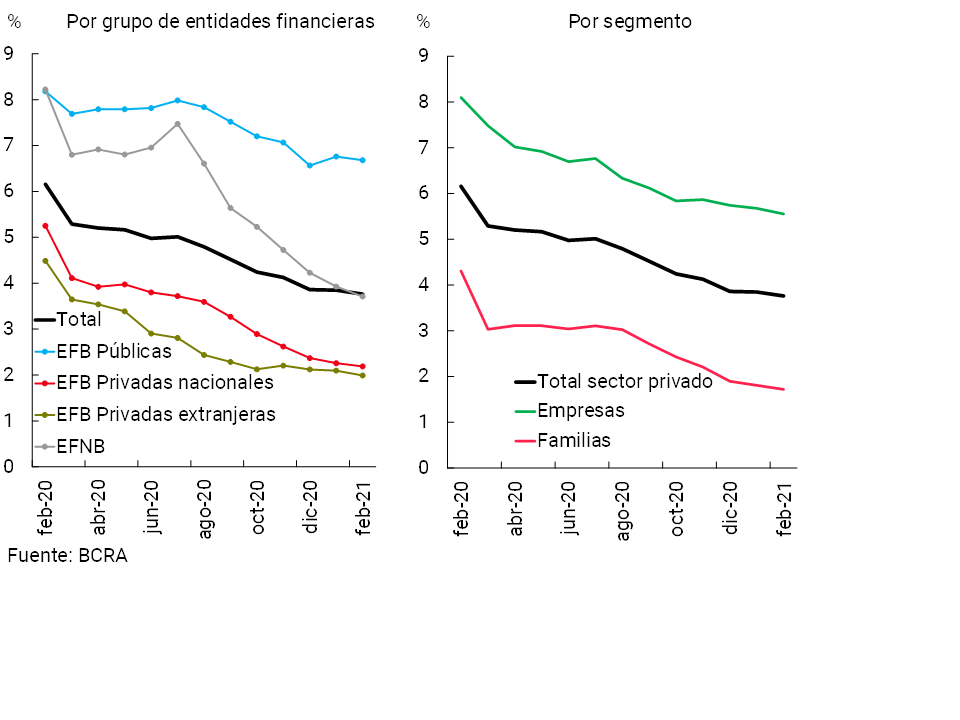
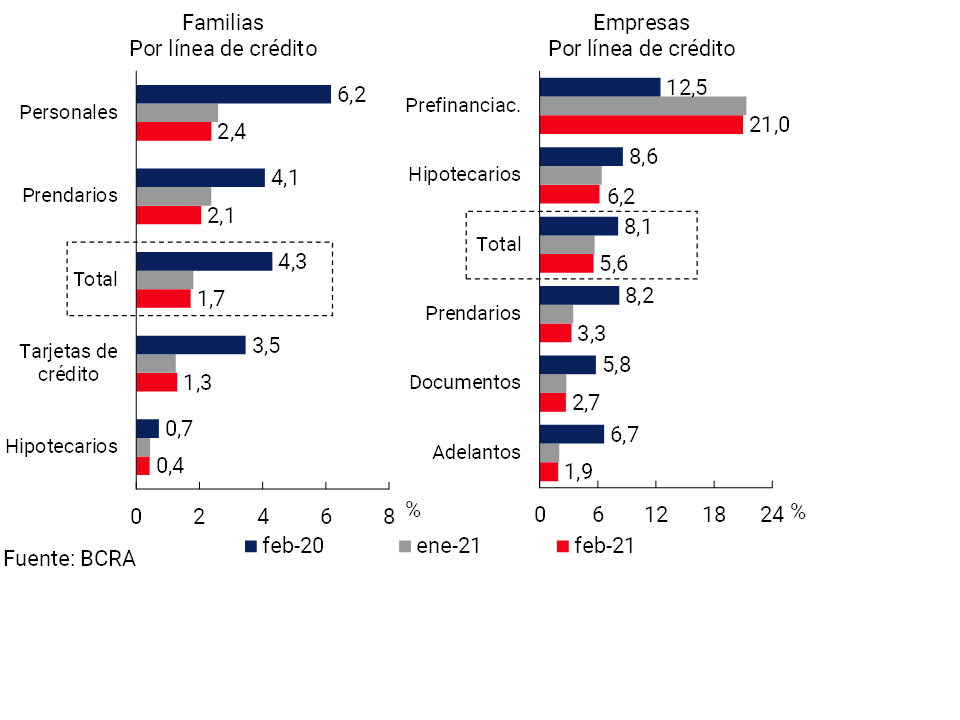
The non-performing loan ratio for households reached 1.7%, slightly below the previous month (-2.4 p.p. y.o.y.), mainly due to the performance of collateral and personal loans (see Graph 11). As for loans to companies, non-performing loans stood at 5.6% of the segment’s total financing, with a similar monthly decrease as in the case of families (-2.5 p.p. y.o.y.). This drop in the NPL indicator was widespread among credit lines.
Figure 11 | Irregularity of credit to the private sector
Irregular financing / Total financing (%)
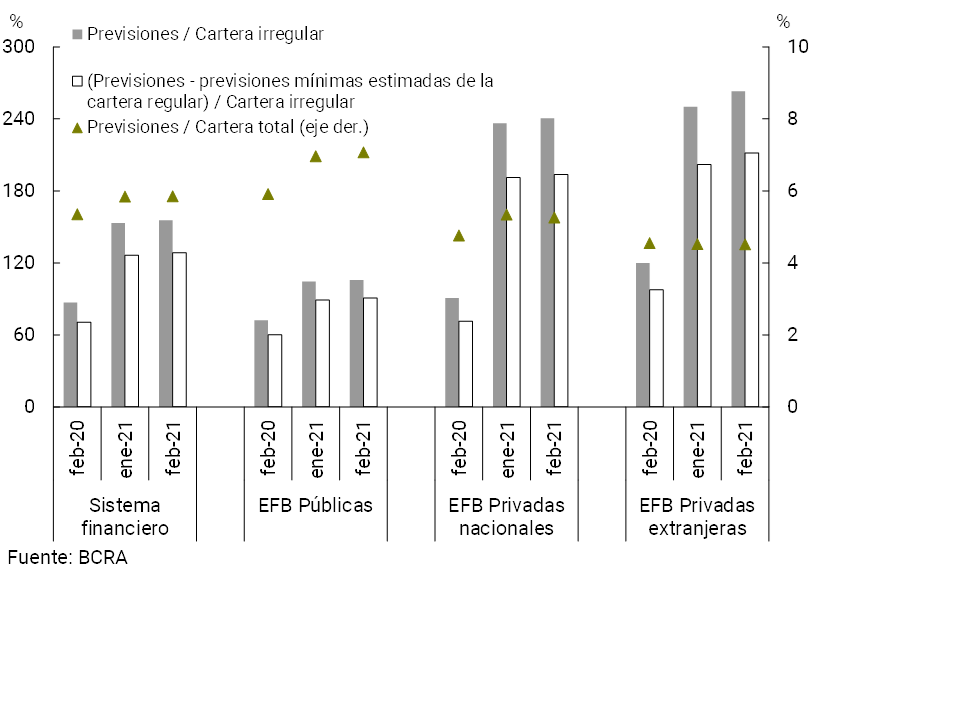
The aggregate financial system continues to show high levels of forecasting. In February, forecasts represented 5.9% of total credit to the private sector, in line with the previous month’s record (+0.5 p.p. y.o.y.). The total forecasts in terms of the non-performing portfolio stood at 155.6%, 2.4 p.p. more than in January (and +68.6 p.p. y.o.y.) (see Graph 12). In February, the balance of regulatory forecasts attributable to the non-performing portfolio (following the criteria of the minimum regulatory forecasts for uncollectibility risk) totalled 128.5% of said portfolio.
Figure 12 | Credit to the private sector and forecasts
By Entity Group
IV. Liquidity and solvency
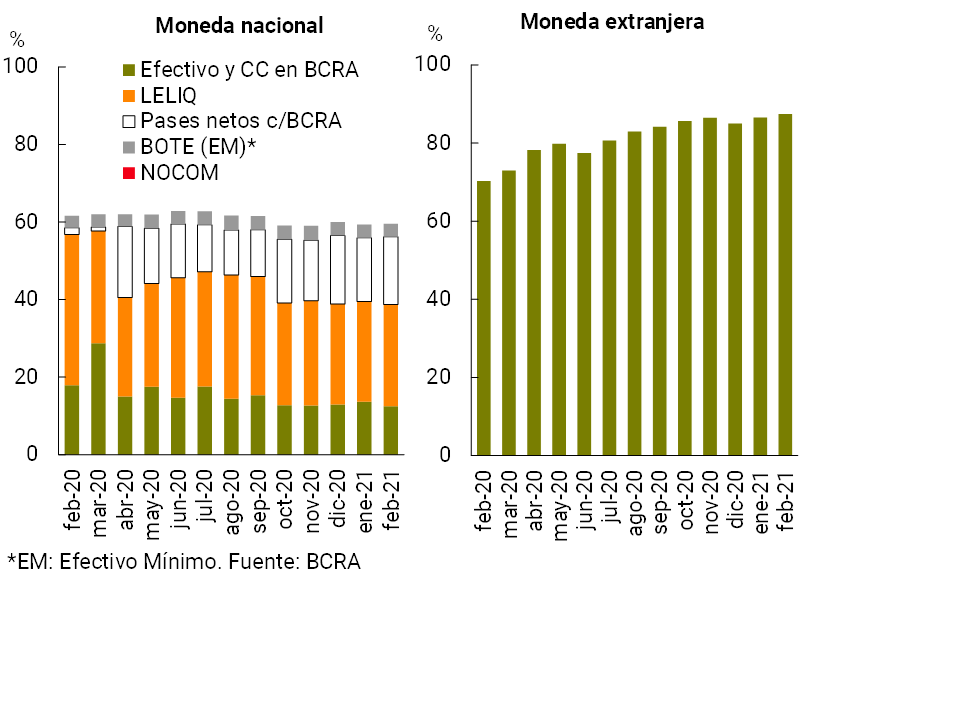
The liquidity of the aggregate financial system remained at high levels in February, exceeding the average of the last 10 years. In the month, broad liquidity indicator18 increased 0.3 p.p. of total deposits to represent 65% (+0.2 p.p. to 59.5% and +0.9 p.p. to 87.4% for the segment in local currency and foreign currency, respectively) (see Chart 13). Considering the items in pesos, with respect to January, the participation of the BCRA’s interest-bearing instruments (net passes and LELIQ) increased, and the relevance of the current account balance that financial institutions have in this Institution decreased. In a year-on-year comparison, broad liquid assets increased 1.2 p.p. of deposits (+17.1 p.p. y.o.y. in the foreign currency segment and -2.1 p.p. y.o.y. in the peso segment).
Figure 13 | Liquidity of the financial system
In % of deposits
The financial institutions as a whole continued to comfortably exceed the minimum required locally for the ratios recommended by the Basel Committee in terms of liquidity. The Liquidity Coverage Ratio (LCR) with information as of February 2021) and the Stable Net Funding Ratio (NSFR as of December 2020)—19, 20 stood at 2.2 and 1.9 (median of obligated entities —belonging to group A—) respectively, being levels that are practically double the minimum required.
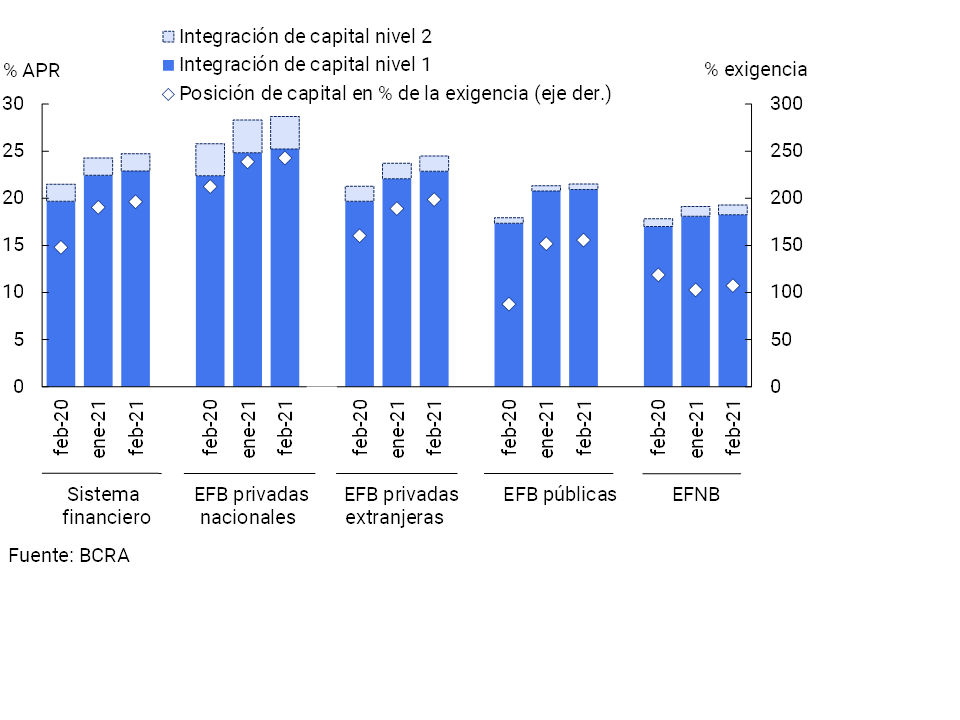
With regard to the solvency of the sector, in February all groups of institutions increased their capital integration levels (PROs) in terms of risk-weighted assets (RWA) (see Chart 14). This ratio amounted to 24.7% for the entire financial system in the month, 0.5 p.p. above the level observed in January. Similarly, the capital position (CPR net of regulatory requirements) of all institutions increased by 6 p.p. of regulatory requirements in February to 196%. In the last 12 months, the sector’s regulatory capital and capital position at the aggregate level increased by 3.2 p.p. of RWAs and 48.4 p.p. of regulatory requirements, respectively.
Figure 14 | Integration of regulatory capital
By financial institution group
The relationship between regulatory capital and credit to the private sector net of forecasts provides an additional general idea of the level of resilience of the sector in the face of possible scenarios of materialization of counterparty risk. In February, the ratio between regulatory capital and credit to the private sector net of forecasts stood at 44.5% at the aggregate level, 0.9 p.p. more than in the previous month (+8.3 p.p. y.o.y.).
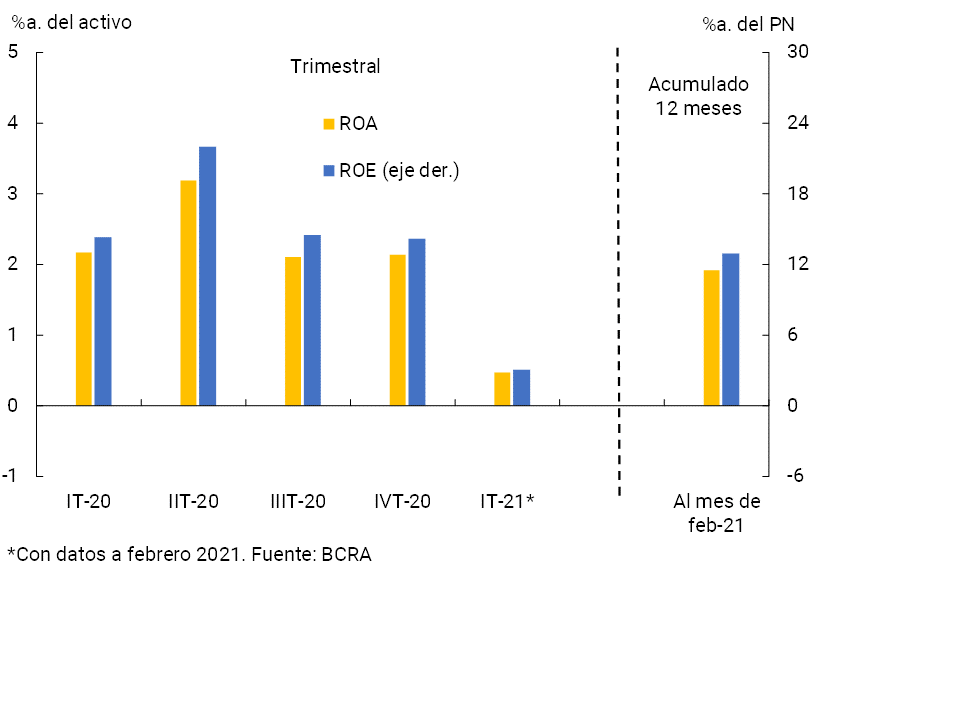
With regard to the profitability of the financial institutions as a whole, in February the total comprehensive results in homogeneous currency were equivalent to 0.9% annualized (a) of assets (ROA) and 6.1% y. of equity (ROE). Thus, although these profitability indicators were slightly higher than those recorded in January, at the beginning of 2021 they remain lower than those of 2020 (see Chart 15). In the cumulative twelve months to February, the ROA of the financial system reached 1.9% and the ROE totaled 12.9%.
Figure 15 | Comprehensive total profit in homogeneous currency of the financial system
Considering the accumulated 12 months to February, the financial margin of the entities as a whole represented 11.5% of assets. Among the main sources of income, the results from securities reached 8.7% of assets21 and interest on loans 8.1% of assets. To a lesser extent, other sources of profitability were premiums for passes, differences in share prices and adjustments in CER items. On the expenditure side, interest on deposits remained at 9% of assets.
Among the non-financial items in the financial system’s income statement, between March 2020 and February 2021, the results by services (1.8% of assets) stood out among the sources of net income. On the non-financial expenditure side, administrative expenses (6.5% of assets) and bad debt charges (1.5% of assets) were the most relevant.
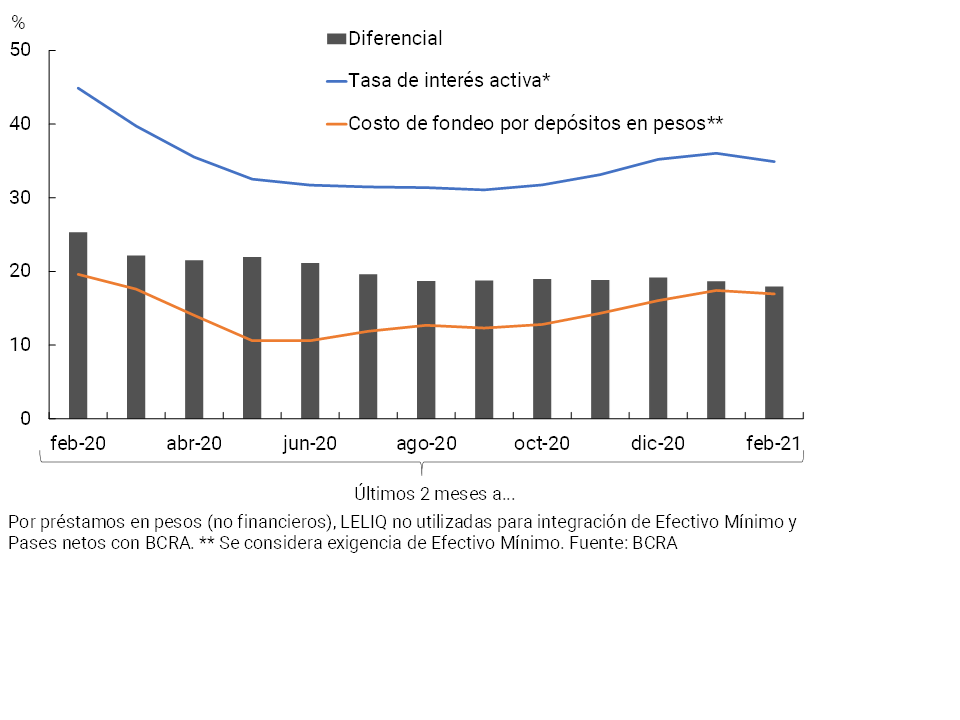
The pattern of gradual reduction in the financial system’s comprehensive results in homogeneous currency that has been evident is in line with a gradual reduction in the estimated implicit interest rate differential22, 23. In particular, it is estimated that in the first two months of 2021 the reduction in the nominal implicit interest rate was relatively greater than the decrease in the cost of funding for deposits, leading to a further fall in the differential between the two concepts (see Chart 16). It should be considered that in real terms, the differential between implied rates also narrowed compared to the previous two months and on a year-on-year basis.
Figure 16 | Estimated (annualized) implied nominal interest rates for the financial system
V. Payment system
Electronic means of payment continued to present a positive performance in the first quarter of 2021. Recently, the BCRA ordered new measures to deepen this dynamic. In particular, financial institutions that demonstrate that users increased their use of electronic means of payment will benefit from a reduction in the minimum cash requirements. 24
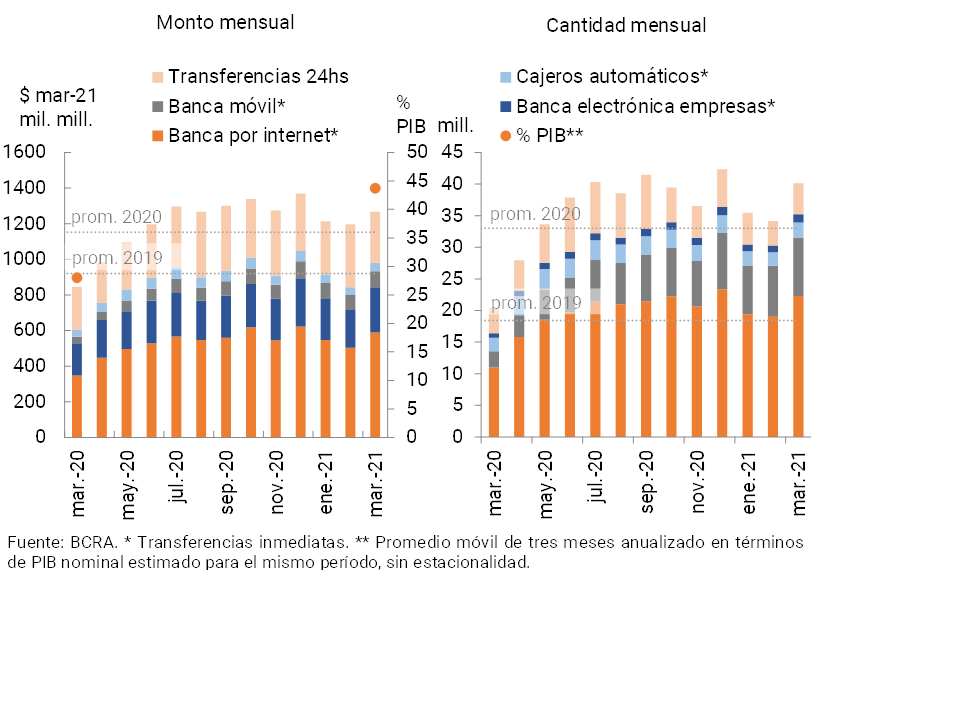
During March (latest available information) total transfers in pesos (immediate and with accreditation in 24 hours) increased compared to the previous month both in real amounts and in amounts, remaining at values higher than the monthly average of 2020. During the month, increases were observed in all transfer channels, with greater relative dynamism in those made through electronic business banking. Compared to the same month of the previous year, total transfers in pesos increased 96.5% in amounts and 50.1% in real amounts (see Graph 17), with increases in both immediate transfers and those that have accreditation in 24 hours. With regard to the channels through which immediate transfers are made, the year-on-year increase in mobile banking (+145% YoY in real amounts and 261% YoY in amounts) stood out. Based on this performance, it is estimated that the amount operated through total transfers grew 15.7 p.p. of GDP in a year-on-year comparison, reaching almost 44% in March 202125.
Figure 17 | Total transfers in pesos (immediate and with accreditation in 24 hours)
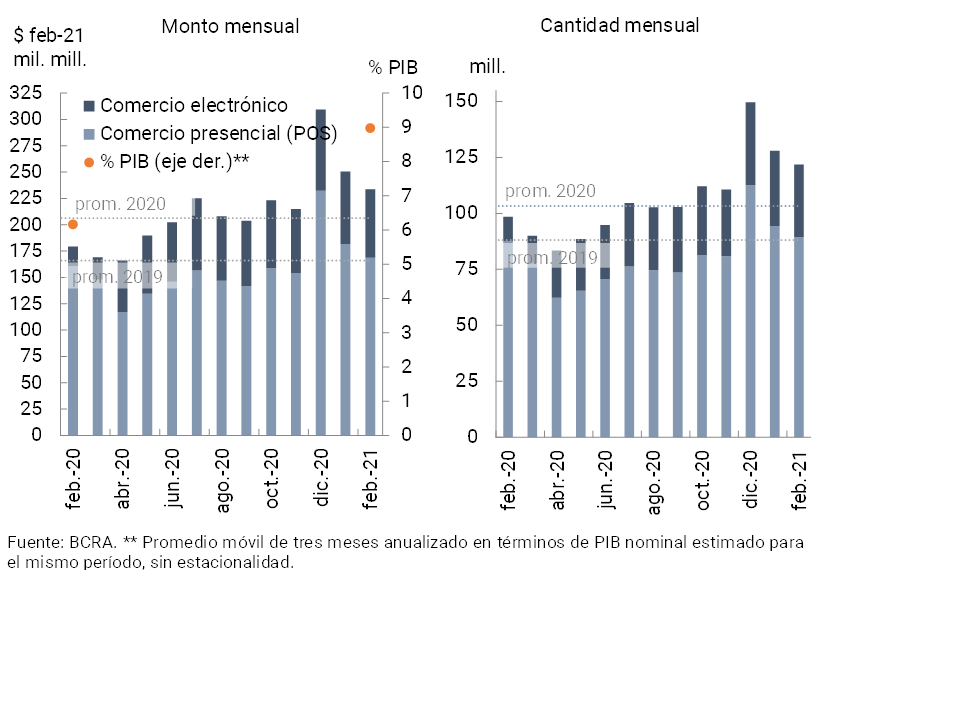
During February, debit card operations decreased compared to the previous month in real amounts and amounts, although they remained above the monthly average for all of 2020, with a relatively greater decrease in the face-to-face channel compared to e-commerce operations. In this way, transactions in electronic format increased their share between quantities (up to 26.6% of the total) and between real amounts (up to 27.8% of the total). Compared to the same month of the previous year, debit card operations increased in amounts (23.7%) and in real amounts (30.2%). In the year-on-year comparison, the growth of non-face-to-face payments with debit cards (e-commerce) over total debit card payments stands out (see Chart 18).
Figure 18 | Debit card transactions
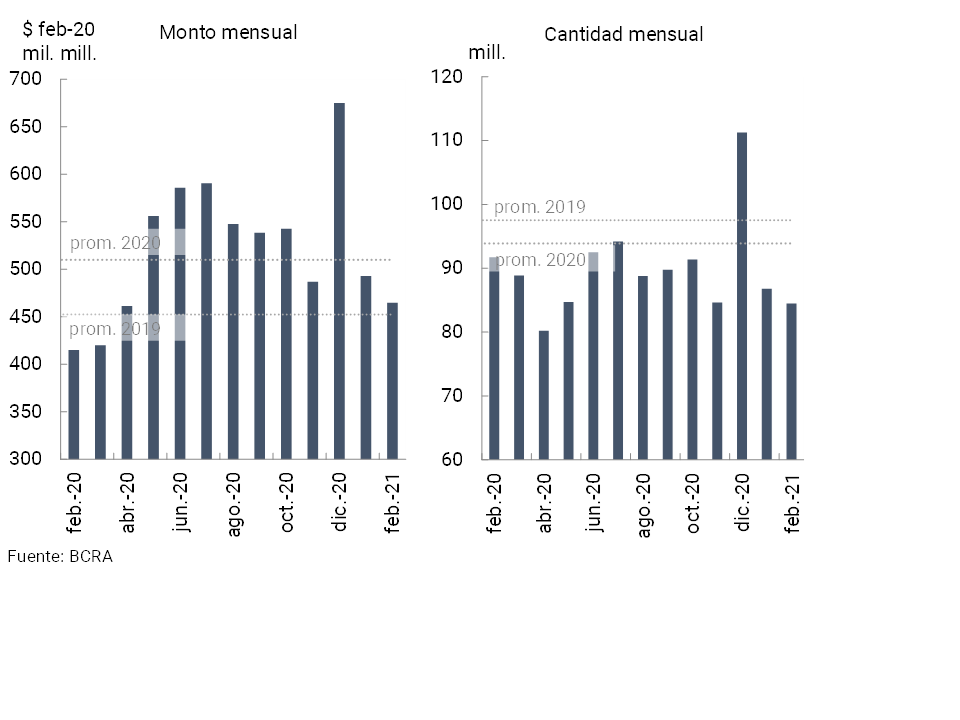
In February, cash withdrawals through the use of ATMs decreased compared to the previous month, both in real amounts and in amounts. Compared to February 2020, withdrawals decreased in quantities (-7.9%) and increased in real amounts (12.1%) (see Graph 19). In this regard, it should be remembered that cash withdrawals by ATM do not have associated costs for salary accounts, retirement payment accounts, or social plan accounts26.
Figure 19 | Cash withdrawals
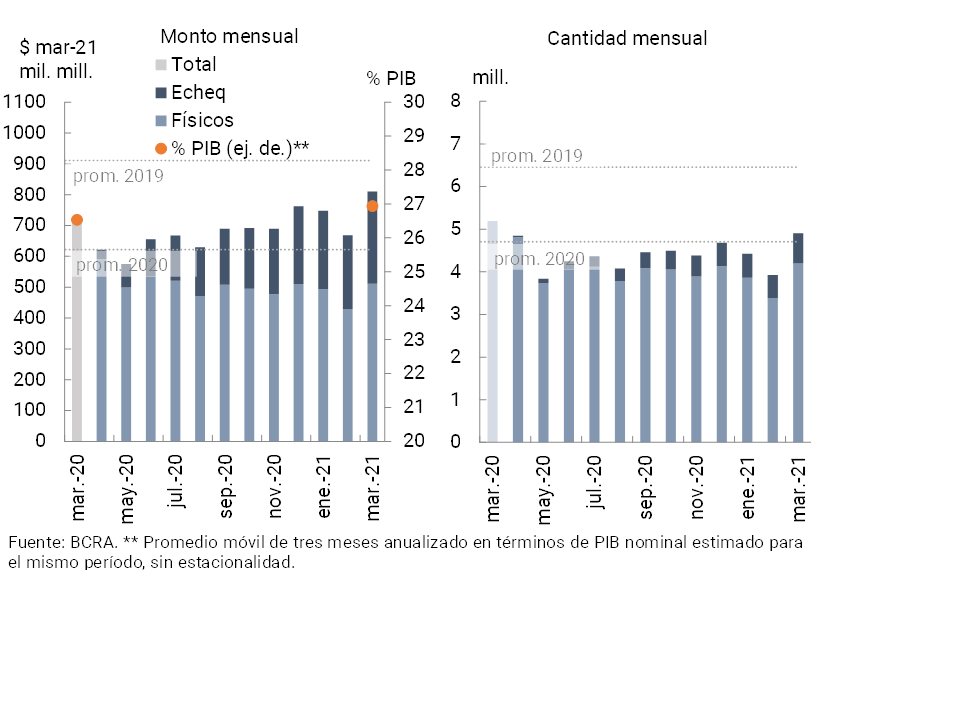
In March, the total clearing of checks increased compared to the previous month in both real amounts and amounts (see Chart 20), maintaining levels higher than the monthly average for 2020. This monthly increase in clearing operations was reflected in both physical and electronic formats. It is estimated that the amount of checks cleared during March stood at a level equivalent to 26.7% of GDP, similar to a year ago (+0.4 p.p. y.o.y.). Since its implementation, the Echeqs have been gaining share to account for 37% of the total amount compensated during March.
Figure 20 | Check clearing
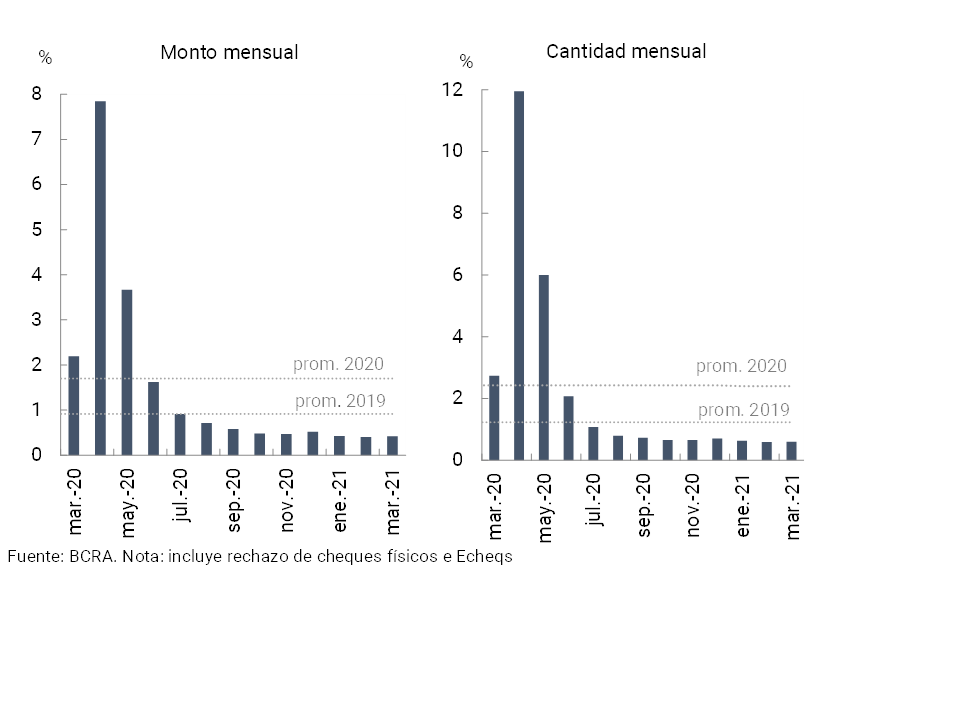
In March, the ratio of check declines due to lack of funds in terms of the total compensated increased slightly compared to the previous month. However, this ratio remained below the average for all of 2020. Moreover, in relation to the same month of the previous year, this indicator decreased in quantities (-2.14 p.p.) and in amounts (-1.77 p.p., see Graph 21).
Figure 21 | Bounce checks due to insufficient funds
References
1 Differences in balance sheet balances expressed in homogeneous currency.
2 Considering the segment of foreign currency items —expressed in source currency—, in February the increase in private sector deposits was the most prominent source of resources for the financial system. For its part, the increase in liquidity was the main application of funds in the month.
3 Includes principal adjustments and accrued interest.
4 Throughout the Report, when reference is made to groups of private (national and/or foreign) and public financial institutions, it corresponds to banking entities. Non-bank entities will be referred to as “EFNBs”.
5 For more details, see Communication “A” “7140” and amendments.
6 The entities covered are those included in group “A” as of April 1, 2021 and those that, although not in said group, operate as financial agents of the national, provincial, Autonomous City of Buenos Aires and/or municipal governments.
7 In the case of covered entities that are not included in group A, the minimum percentage to be applied will be 25% of the foreseen percentage.
8 See communication “A” “7240”.
9 See communication “A” “7082” and Communication “A” “7102”
10 See Communication “A” “6993”.
11 See Communication “A” “7082”.
12 See Communication “A” “7254” and “Press Release” of 03/31/21.
13 See Communication “A” “6876”.
14 To see the latest published results for the first quarter of 2021, click here.
15 The balance of UVA time deposits in the private sector is still of low relevance at the aggregate level, reaching only 1.5% of the total balance of deposits in national currency of the private sector.
16 “Press release” of 11/04/21.
17 Communication “A” “6938”, Communication “A” “7107”, Communication “A” “7181” and Point 2.1.1. of the Ordered Text “Financial Services in the Framework of the Health Emergency Provided for by Decree No. 260/2020 CORONAVIRUS (COVID-19)”
18 Considers availability, integration of minimum cash and BCRA instruments, in national and foreign currency.
19 The LCR considers the liquidity available to deal with a potential outflow of funds in the event of a possible stress scenario in the short term. See Ordered Text —TO— “Liquidity Coverage Ratio”.
20 The NSFR takes into account the availability of stable funding of the entities, in line with the deadlines of the businesses to which it applies. See TO “Stable Net Funding Ratio”.
21 It should be considered that, in addition to this record, the financial institutions as a whole accounted for securities as “other comprehensive income”. The latter are estimated at around 2% of assets for the last 12 months.
22Nominal implied interest rates arising from the main assets and liabilities in national currency are considered. For the calculation of implicit interest rates, concepts such as administrative expenses, tax expenses, cost of capital or other components associated with hedging for risks intrinsic to financial intermediation operations are not taken into account.
23In this estimate, implied interest rates are constructed by accumulating flows over the last 2 months and annualized. For more details on the calculation methodology, see previous editions of the Banking Report.
24For more details, see Communication “A” “7254”.
25It should be noted that the BCRA recently issued a “Press Release in which it highlights the main rights of users of financial services”. Regarding the amounts of immediate transfers for users, it was recalled that there is a maximum of $125 thousand per ATM and $250 thousand for internet banking
26See Press Release cited in the previous footnote.
Share on


