I. Financial intermediation activity
In April, the real balance of credit in pesos to the private sector increased. On the other hand, among the main changes in the balance sheet of all financial institutions – in homogeneous currency – in the month decreased liquidity in the broad sense and public sector deposits increased. With regard to foreign currency items, in April the availability and balance of deposits – both in the private and public sectors – were reduced1.
In April, the balance of credit in pesos to the private sector increased by 1.5% in real terms (+10.1% nominal (see Graph 1)2. The monthly performance was mainly driven by commercial lines (documents and advances), mainly reflected in private financial institutions. In a year-on-year comparison, the balance of financing in national currency fell 9.1% in real terms.
Graph 1 | Credit balance to the private sector in pesos
In real terms*
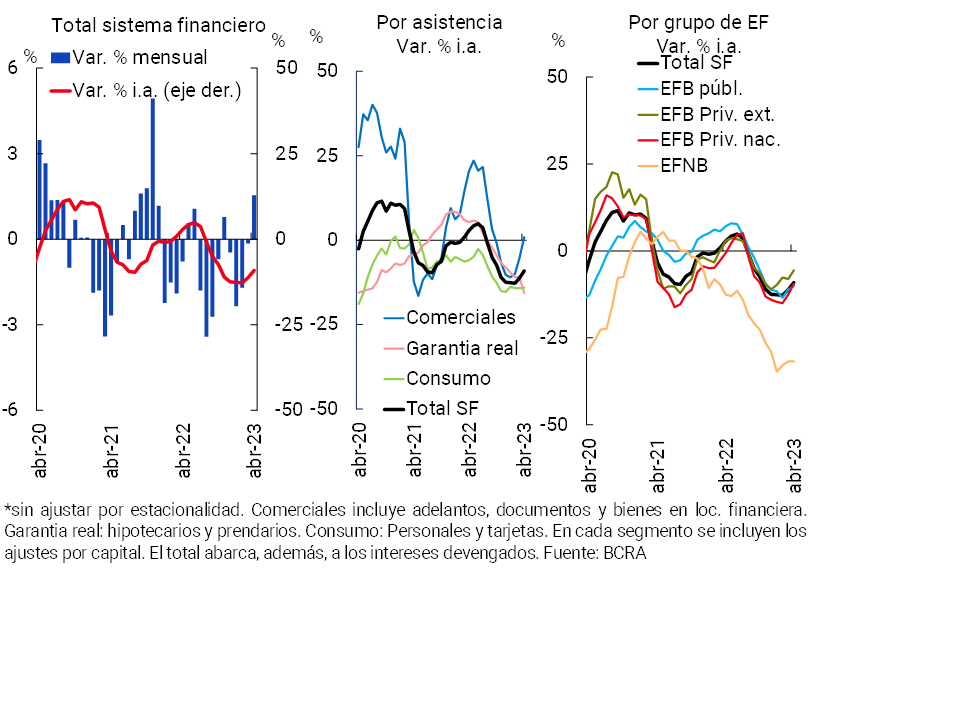
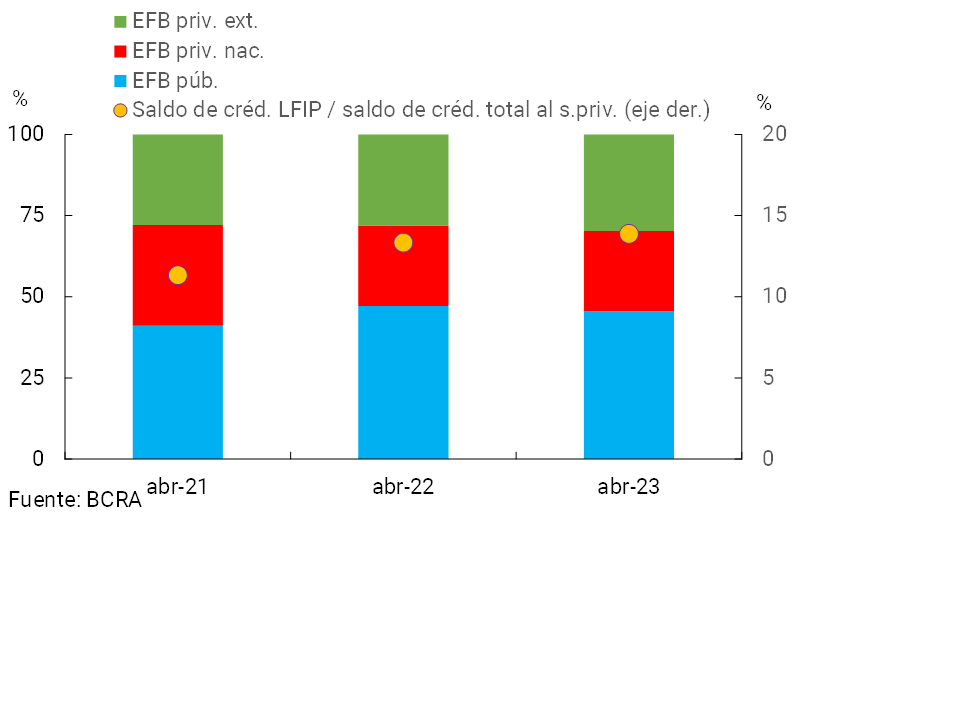
The growth – both monthly and year-on-year – of commercial financing lines has been driven by the credit policy implemented by the BCRA focused on productive development. The Financing Line for Productive Investment of MSMEs (LFIP), from its launch (November 2020) to May 2023, has disbursed more than $5.8 billion, benefiting 440,820 companies. The estimated balance of the LFIP was around $1.6 trillion in April 2023, representing 13.9% of total credit to the private sector (+0.5 p.p. y.o.y.), with a greater relative participation of public financial institutions (see Chart 2).
Graph 2 | Estimated balance of the Financing Line for Productive Investment in MSMEs (LFIP) – In % of the total balance
By Entity Group
In relation to foreign currency items, in April the balance of credit to the private sector increased by 5.7%, mainly driven by export pre-financing3. In this context, in the month the real balance of total credit (in domestic and foreign currency) to the private sector accumulated an increase of 1.7% in real terms (-8.7% real y.o.y.).
In April, the real balance of private sector deposits in pesos remained unchanged from the previous month (-0.1% real or +8.2% nominal),4 with falls in both demand and time deposits (see Chart 3).
Graph 3 | Balance of private sector deposits in pesos
In real terms* – Financial system
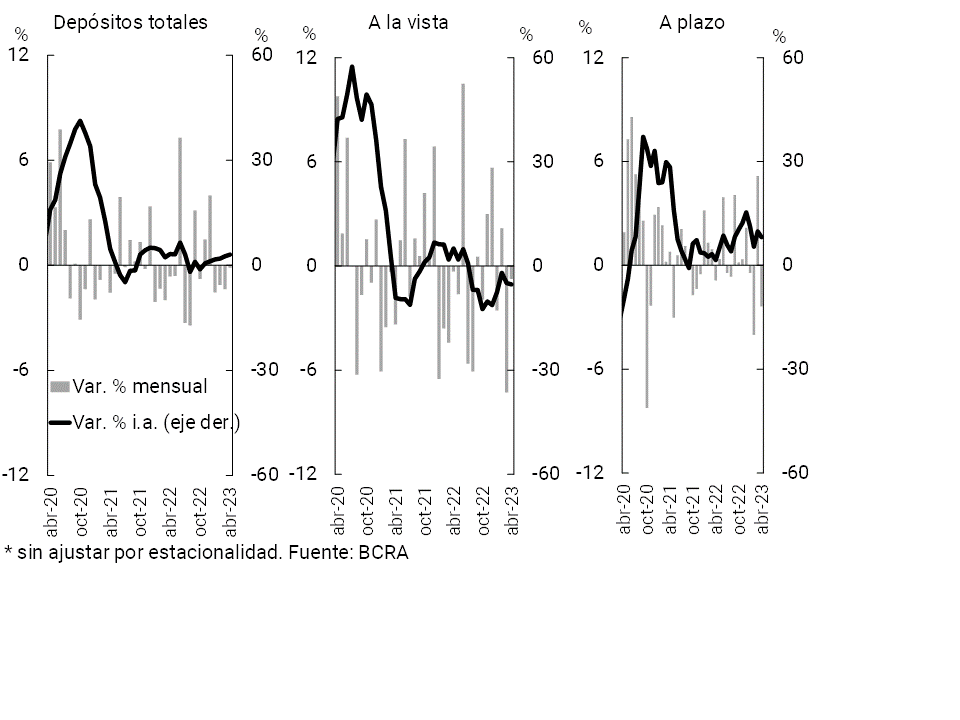
On the side of the segment in foreign currency, in the month the balance of private sector deposits fell 4.7% in source currency5, mainly explained by the performance of demand deposits. In this scenario, total private sector deposits (in domestic and foreign currency) accumulated a decrease of 1.1% in real terms in April.
In a year-on-year comparison to April, the real balance of deposits in pesos in the private sector increased 3.1%, with a greater relative dynamism of time deposits. The balance of total deposits (all currencies and sectors) decreased 1% in real terms in year-on-year terms to April.
II. Evolution and aggregate composition of the balance sheet
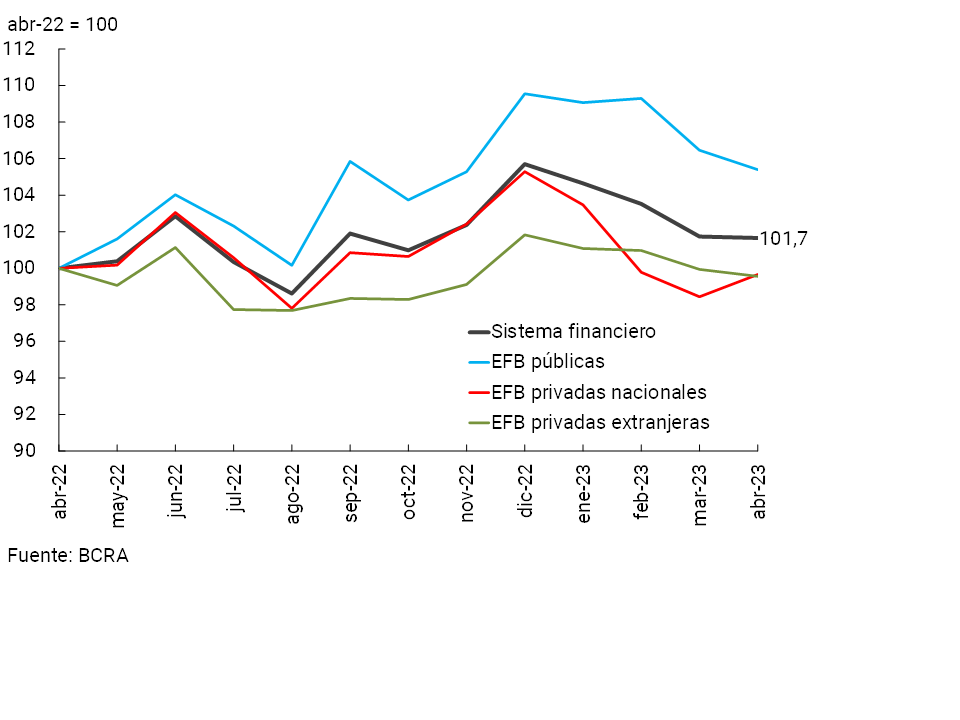
The size of the financial system’s balance sheet, measured by total assets in real terms, declined slightly in April, although it remained above the level of a year ago (see Chart 4). This monthly performance was observed in foreign public and private banking financial institutions.
Figure 4 | Total assets in real terms
Financial system
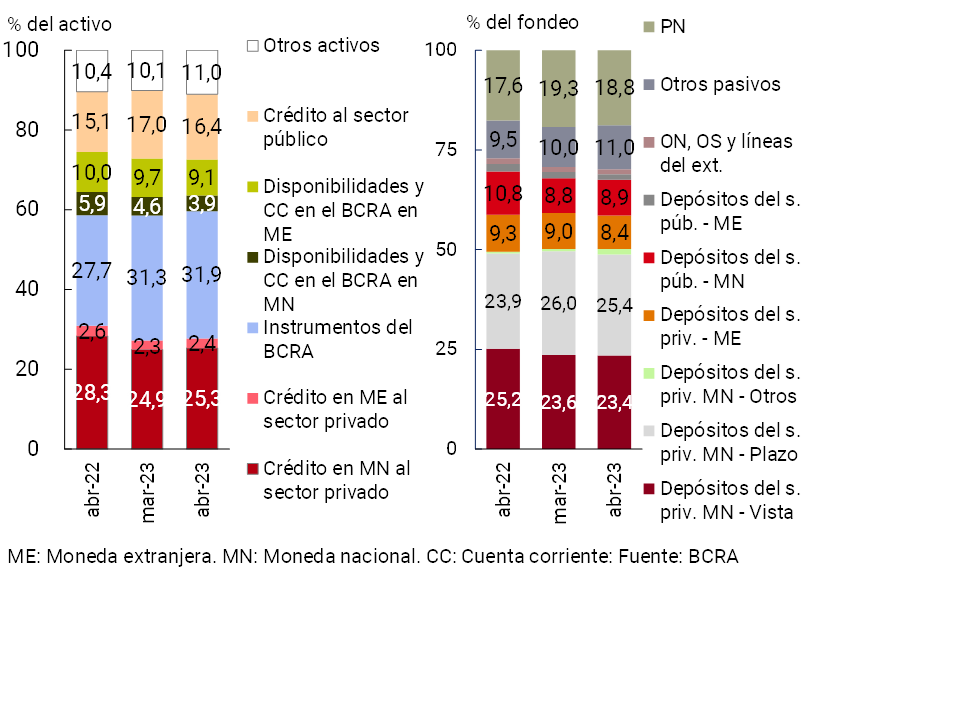
With regard to the components of the sector’s total assets, in April the relative weight of the BCRA’s current availabilities and accounts and of credit to the public sector decreased, while the BCRA’s instruments and credit in pesos to the private sector increased their weighting (see Chart 5). As for the composition of total funding, in April private sector deposits – both in domestic and foreign currency – and net worth reduced in relative importance. On the other hand, in the month the relevance of other liabilities increased (mainly obligations for financing purchases – associated with credit card financing – and taxes and dividends payable).
Graph 5 | Composition of assets and total funding
Financial system – Share %
The estimated spread between assets and liabilities in foreign currency of all financial institutions increased by 4.8 p.p. of regulatory capital (RPC) in April, to 35.2% (+23.4 p.p. y.o.y.)6. Regarding the estimated spread between assets and liabilities with CER adjustment (or in UVA), it stood at 57% of the PRC in the period for the aggregate of the sector, 1.5 p.p. less than in March (-13.5 p.p. y.o.y.).
III. Portfolio quality
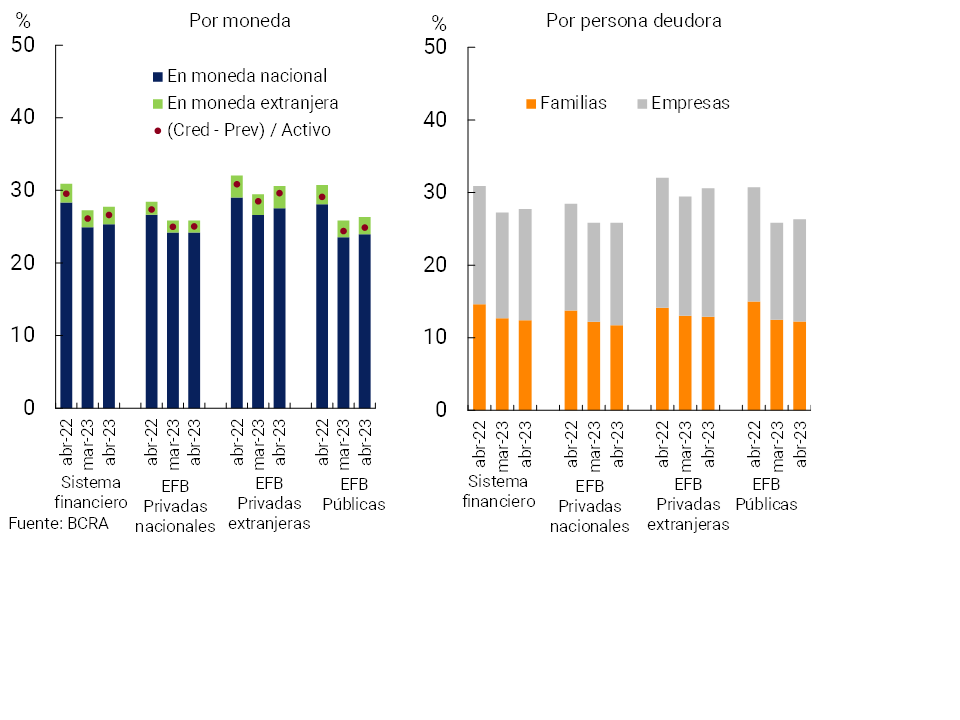
In April, the aggregate financial system’s gross exposure to the private sector (including domestic and foreign currency) stood at 27.7% of total assets, slightly above the previous month (+0.5% month-on-month), although 3.2 p.p. lower in a year-on-year comparison. The monthly dynamics were reflected in almost all groups of banking financial institutions and were mainly explained by the business lending segment (see Graph 6)7. The balance of credit to the private sector net of forecasts was equivalent to 26.6% of total assets in the month (-2.9 p.p. y.o.y.).
Graph 6 | Private Sector Credit Balance / Assets
By group of financial institutions
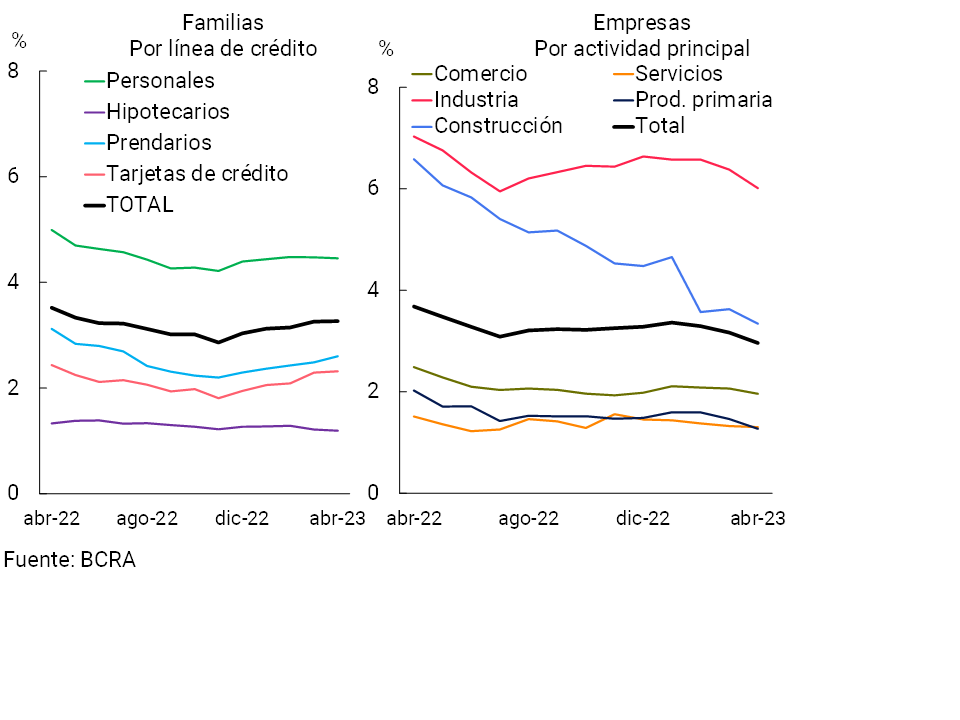
The non-performing ratio of credit to the private sector totaled 3.1% in April, remaining without significant changes compared to the previous month (-0.1 p.p.) and accumulating a decrease of 0.5 p.p. y.o.y. The non-performing loan indicator for financing to companies fell slightly in the month (-0.2 p.p.) to 3% (-0.7 p.p. y.o.y.), with falls in the records of almost all economic activities (see Graph 7). Meanwhile, the NPL indicator for loans to households remained unchanged in magnitude in the period, at 3.3% (-0.3 p.p. y.o.y.). This monthly performance extended to almost all loan lines (see Chart 7).
Figure 7 | Irregularity ratio of credit to the private sector – Financial system
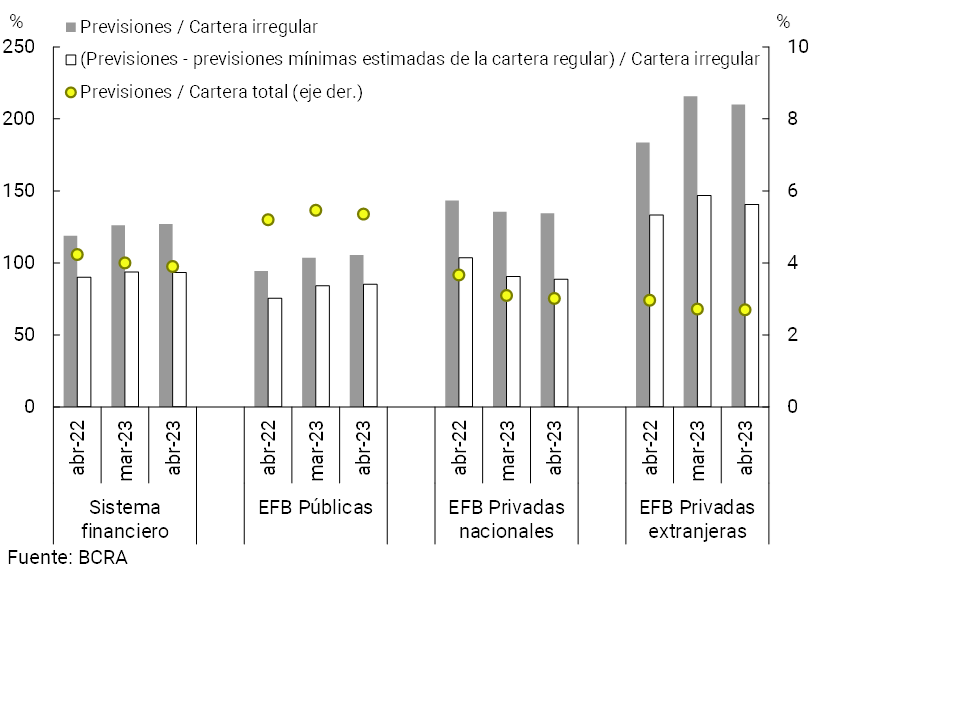
The financial system maintained comfortable levels of forecasting in April. The forecasts totaled 3.9% of total credit to the private sector in the month and 127% of financing to the private sector in an irregular situation (see Chart 8). During the period, the balance of forecasts attributable to the irregular portfolio8 continued to cover almost all of that portfolio at the aggregate level (93.4%).
Figure 8 | Credit balance and forecasts (private sector) by group of financial institutions
IV. Liquidity and solvency
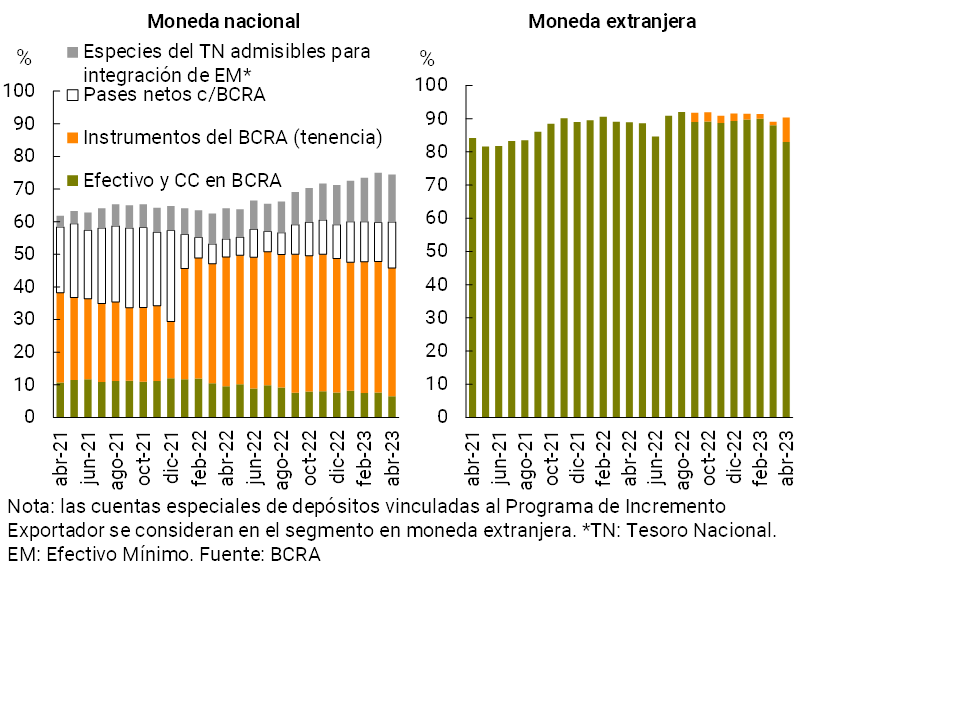
In April, the broad liquidity indicator9 of the financial system decreased 0.3 p.p. of deposits to 76.9% (+8.9 p.p. y.o.y.)10. Disaggregated by currency, the broad liquidity ratio stood at 74.4% for items in pesos (-0.6 p.p. monthly), and at 90.4% for the foreign currency segment (+1.2 p.p. monthly). In the month, there was a generalized decrease in the components of the liquidity ratio in national currency, with the exception of net transfers with this Institution (see Chart 9).
Graph 9 | Liquidity of the financial system
In % of deposits
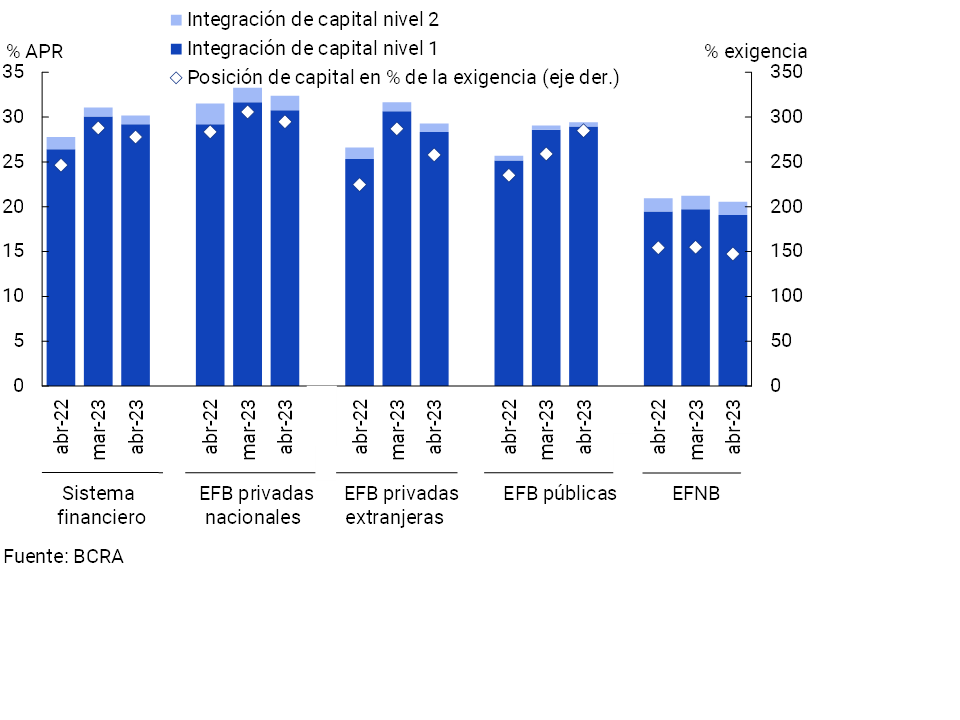
Regulatory capital integration (RPC) stood at 30.2% of risk-weighted assets (RWA) for all entities, down from the previous month11 but remaining 2.4 p.p. above the April 2022 figure (see Chart 10). 96.7% of the PRC was accounted for by Tier 1 capital, with a greater capacity to absorb potential losses. The capital position – regulatory capital net of the minimum regulatory requirement – totaled 278% of the requirement at the systemic level and 44% of the balance of credit to the private sector net of provisions, well above the average of the last 10 years (18.7%).
Figure 10 | Integration of regulatory capital
By financial institution group
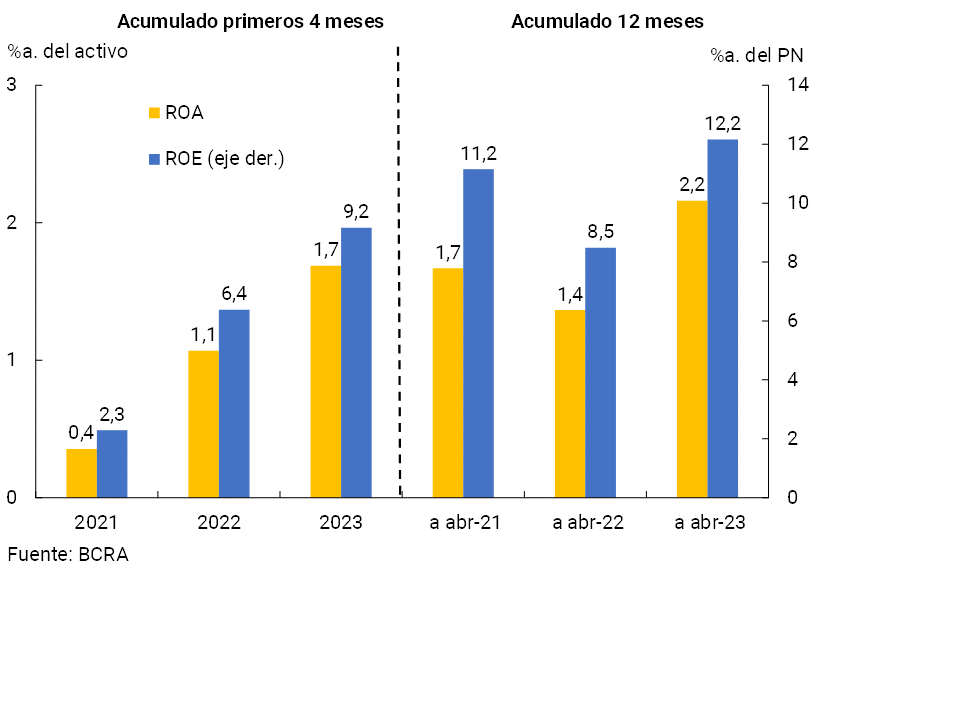
The profitability indicators of the financial system continued at positive levels in the period. The total comprehensive profit in homogeneous currency of the financial system accumulated in the last 12 months to April was equivalent to 2.2% of assets (ROA) and 12.2% of equity (ROE). These levels were higher than those recorded a year ago (see Chart 11), mainly due to a higher financial margin, despite the increase in losses due to exposure to currency items.
Figure 11 | Comprehensive total profit in homogeneous currency of the financial system
V. Payment system
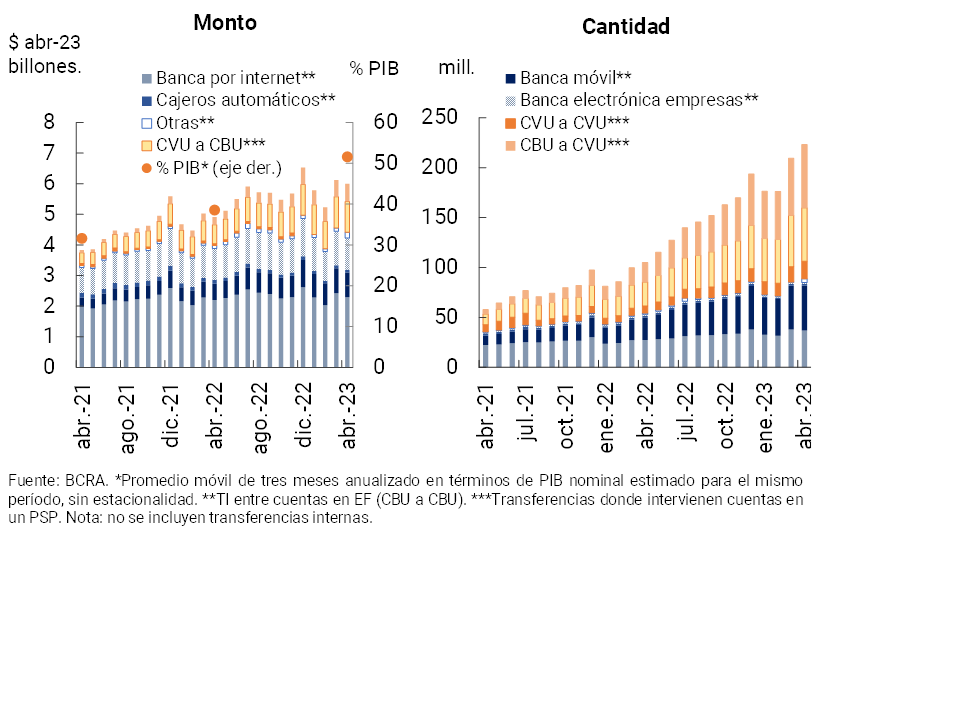
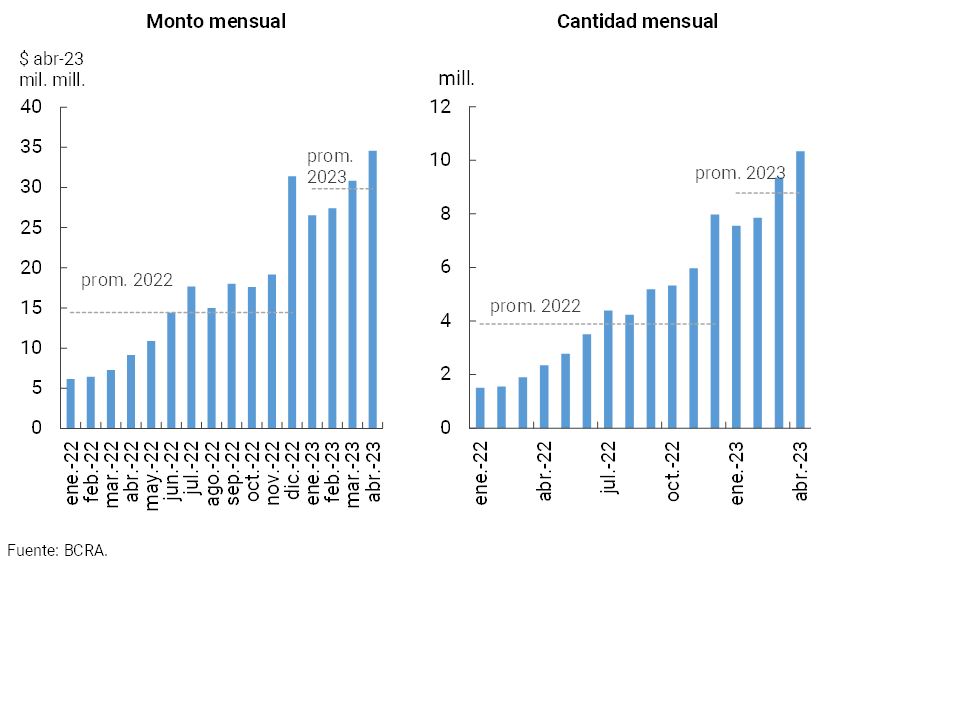
In April, immediate transfers (TI) increased 5.1% in amounts, although they decreased 3.1% in real amounts. In a year-on-year comparison, IT grew in quantities (112.3%) and in real amounts (22.6%). The IT carried out between CBUs grew 60.3% YoY in quantities (8.8% YoY in real amounts), highlighting the dynamism of Mobile Banking. IT involving the use of CVUs increased 167% YoY in quantities (81.9% YoY in real amounts), reflecting greater dynamism in operations ranging from financial institutions (FIs) to payment service providers (PSPs). It is estimated that the amount of IT operated in the last three months (annualized) represented 51.6% of GDP (+13 p.p. compared to the same month of the previous year, see Chart 12)12.
Figure 12 | Instant Transfers (TI)
Payments with Transfer (PCT) through interoperable QR codes experienced significant growth in real amounts and amounts in the month (+10.4% and +12.2%, respectively). In year-on-year terms, PCT operations practically quintupled. These results are supported by the measures implemented by the BCRA that promote the acceptance of payments with any interoperable digital wallet and guarantee a level playing field for merchants in terms of fees and crediting terms (see Chart 13)13.
Figure 13 | Payments with transfer (PCT) through interoperable QR codes
In March (latest available information) debit card transactions increased in quantity and in real amounts compared to the previous month. These transactions accumulated an increase of 12.3% y.o.y. in quantity and 2% y.a. in real amounts. Face-to-face operations increased year-on-year, while electronic operations decreased, continuing the process evidenced in the post-pandemic. As for credit cards, a monthly increase was observed in March (latest available information), accumulating an increase of 8.4% y.o.y. in transactions (without significant changes in real amounts)14.
In April 2023, partly due to seasonal reasons, check clearing showed a decrease in both the number of transactions (10.6%) and actual amounts (9.8%). This performance was reflected both in physical checks and in ECHEQs. However, compared to the same month of the previous year, there was a significant growth in the quantity (+32.4%) and actual amounts (+10.6%) of cleared ECHEQs, while physical checks continued to decline in both variables. It is estimated that the amount of checks cleared in the last three months (annualized) was equivalent to 24.3% of GDP (+1.5 p.p. compared to the same month of the previous year)15.
The ratio of rejection of checks due to lack of funds in relation to the total compensated remained practically unchanged in terms of amounts and actual amounts compared to March and slightly above in a year-on-year comparison (+0.2 p.p. y.o.y. to 0.87% in amounts and +0.09 p.p. y.o.y. to 0.6% in amounts).
Back to top
References
1 At the same time, in April, within the framework of the operations carried out through the “Export Increase Program”, the real balance of deposits with variable remuneration increased according to the evolution of the exchange rate. This movement was mainly offset by an increase in the holding of the BCRA’s Internal Bills in dollars and liquidable in pesos by the Reference Exchange Rate (LEDIV) at zero rate, a tool designed to cover these positions. Likewise, in the month there was a decrease in financing to the public sector in pesos (bonds and bills – with and without adjustment for CER) and an increase in financing denominated in foreign currency (dual currency instruments).
2 Includes principal adjustments and accrued interest.
3 Expressed in currency of origin.
4 If the balance of deposits in pesos of the private sector is considered without those that have variable remuneration depending on the evolution of the exchange rate (which increased in the month within the framework of the “Export Increase Program” (see Note 1) and which the entities account for in balance sheet accounts in national currency), In the month, there would have been a reduction in the balance of 1.4% in real terms.
5 If deposits with variable remuneration (mentioned in notes 1 and 4) are included, the balance of deposits in foreign currency of the private sector would have increased by 2.5% (in currency of origin) in the month.
6 Includes forward purchase and sale transactions of foreign currency classified off-balance sheet. Liabilities include deposits that have variable remuneration depending on the evolution of the exchange rate – associated with the Export Increase Program.
7 When distinguishing by currency, the balance of bank financing to the private sector in pesos represented 25.3% of assets (+0.4 p.p. monthly and -3 p.p. y.o.y.), while gross exposure in foreign currency stood at 2.4% of assets in the period (+0.1 p.p. monthly and -0.1 p.p. y.o.y.).
8 Total net forecasts of the minimum regulatory forecasts for debtors in situations 1 and 2, according to the criteria of the minimum regulatory forecasts for risk of uncollectibility.
9 Considers availabilities, BCRA instruments in national and foreign currency, and all public securities authorized to be used as minimum cash integration.
10 In the last 10 years, the average for this indicator was 53.9%.
11 This decrease occurred within the framework of the ordinary shareholders’ meetings that decided to reallocate resources to dividends to be paid.
12 In April, the average operation through IT was almost $27,000. The average IT operation between CBU reached about $49,770 and IT where CVU intervenes $12,620.
13 In April, the average operation through interoperable QR reached $3,350. At the beginning of 2023, the number of PCTs surpassed debit card operations. This trend has been strengthened with Transfers 3.0 and the promotion of the use of QR codes. For more details, see “Monthly Report on Retail Payments” of the BCRA, “Press Release” and “Communication “A” 7759″.
14 The average transaction with debit cards reached $4,550 and those with credit cards $9,480.
15 The average cleared check was $596,600 (physical checks $349,360 and ECHEQs $1,024,910).
Share on


