About the use of inclusive language in this publication
The use of language that does not discriminate and that makes all gender identities visible is an institutional commitment of the Central Bank of the Argentine Republic. This publication recognizes the influence of language on ideas, feelings, ways of thinking and evaluation schemes.
This document has sought to avoid sexist and binary language. However, for ease of reading, resources such as “@” or “x” are not included.
Executive summary
• In April, the financial system continued to develop its financial intermediation activities and the provision of means of payment in a context of pandemic. On the one hand, the performance of financial intermediation with the private sector was relatively limited during April. On the other hand, as the population’s practices were readapted, the use of electronic means of payment continued to expand, receiving the impetus of the measures opportunely introduced by the BCRA. At the end of 2020, the Payment with Transfers system was reformulated and since April regulatory incentives have been in force (lower minimum cash requirements) aimed at achieving improvements in electronic payment channels (debits in demand accounts, ECHEQs and credit invoices).
• In relation to electronic means of payment, the number of immediate transfers in pesos grew 33.4% year-on-year (y.o.y.) and monthly amounts expanded 13.3% y.o.y. in real terms (latest information as of May). The mobile banking channel showed the largest relative increase among transfers with instant credit. Transactions carried out with debit cards increased in amounts (52.3% YoY) and in real amounts (39.6% YoY), with a growing relevance of those made through e-commerce (April latest available data). Operations through ECHEQs continued to increase their share of total check clearing, representing 17% of the amounts and 39.5% of the total amounts in May.
• In the month, the balance of credit to the private sector in pesos fell 2.7% in real terms (+1.3% nominal), with a year-on-year (YoY) drop of 3.4%. In order to boost financing for the sectors most affected by the pandemic, the Financing Line for Productive Investment (LFIP) for MSMEs remained in force during the period. Since its implementation and until the end of May, almost $587,000 million have been disbursed, benefiting 131,305 companies.
• The irregularity ratio of credit to the private sector for the aggregate financial system amounted to 4.2% in April, 0.3 p.p. more than in the previous month (-1 p.p. y.o.y.). This monthly increase occurred within the framework of the validity of the transition schedule established by the BCRA for the gradual readjustment of the classification criteria for debtors, after the changes introduced in a timely manner with the beginning of the pandemic. From June onwards, entities must use the pre-existing criteria as of 19/03/2020. In accordance with the policy of focusing financial relief measures on the sectors that need it most, financial institutions are allowed to incorporate at the end of the life of the credit the unpaid installments of assistance granted to debtors who are employers covered by REPRO II.
• The balance of private sector deposits in pesos decreased by 1.6% in real terms (+2.5% nominal) in April, mainly due to the performance of demand accounts. Time deposits in pesos in the private sector increased 0.8% in real terms in the month. Within this segment, in April fixed terms in UVA grew 22.3% in real terms considering the modality with early cancellation and 11% in real terms in the case of traditional ones. The balance of private sector deposits in pesos increased by 4.7% in real y.o.y.
• Broad liquidity in the financial system remained at high levels in April compared to the average of the last 15 years. The broad liquidity ratio reached 66% of total deposits in the month (61.8% for the segment in pesos and 84.2% considering items in foreign currency), with no changes in magnitude compared to March and 0.3 p.p. higher than in April 2020.
• In April, the integration of regulatory capital (RPC) of all financial institutions totaled 25.4% of risk-weighted assets (RWA), with no significant changes compared to last month. The ratio of the financial system’s regulatory capital surplus position (CPR net of capital requirement) to credit to the private sector net of forecasts—an indicator of the sector’s degree of resilience to credit risk—stood at 31.3 percent in April, a high figure compared to the 10-year average of 13.2 percent.
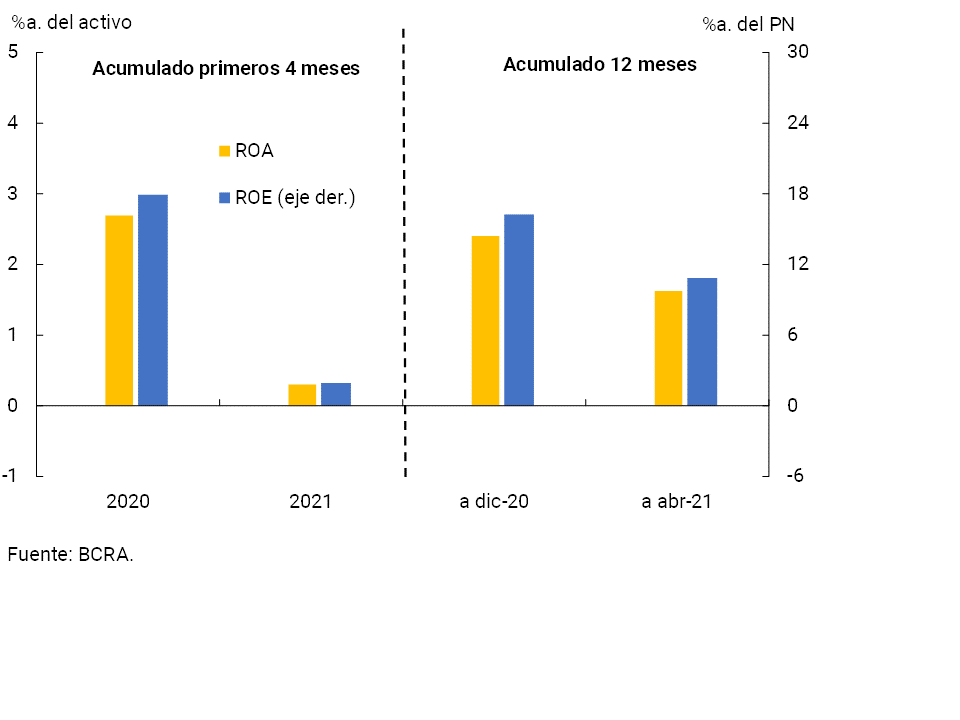
• The total comprehensive profit in homogeneous currency accrued by the financial system in the first 4 months of the year was equivalent to 0.3% annualized (y.) of assets (ROA) and 1.9% y. of net worth (ROE), reducing in a year-on-year comparison and with respect to the ratio evidenced in all of 2020.
I. Financial intermediation activity
In a context in which the economic recovery process evidenced in the second part of 2020 and at the beginning of 20211 was tempered, in April the financial intermediation of all entities with the private sector presented a relatively weak performance. Considering the main variations in the aggregate balance of the financial system in homogeneous currency on the items in pesos associated with intermediation2, in the month there was an increase in public sector deposits and a decrease in financing to the private sector. These monthly changes were mainly offset by a reduction in the real balance of private sector deposits and an increase in the real balance of financing to the public sector.
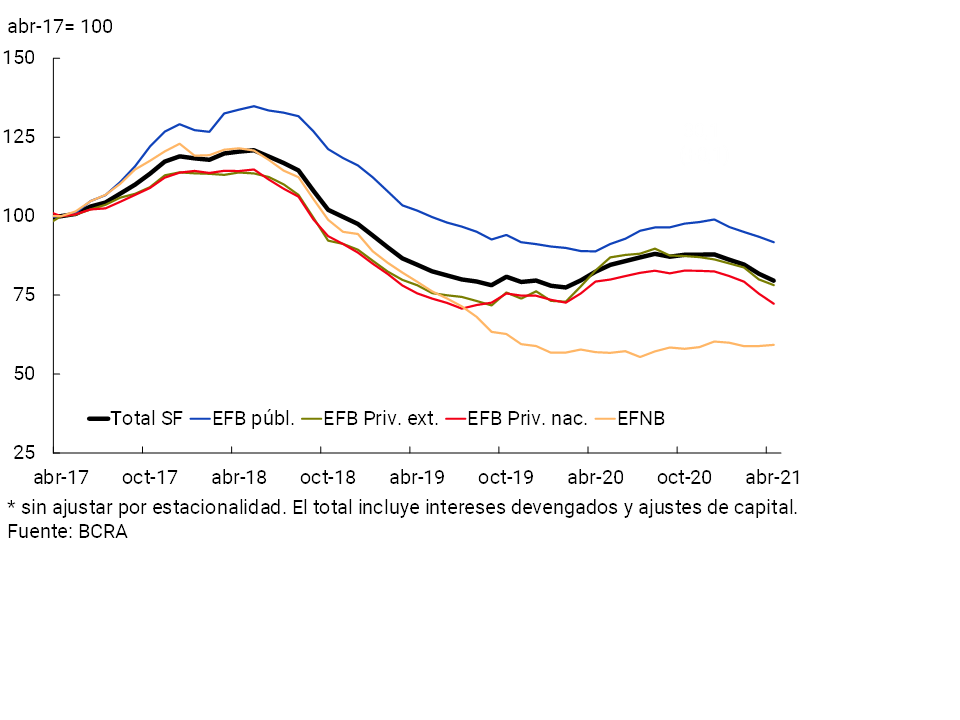
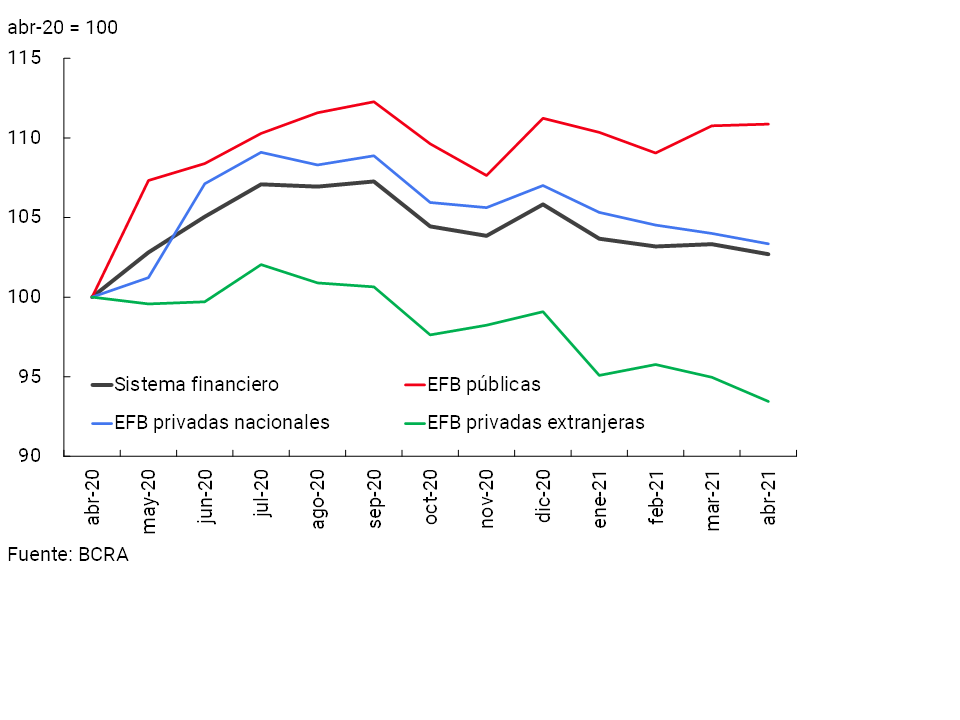
In April, the balance of financing to the private sector in pesos decreased by 2.7% in real terms compared to March (+1.3% nominal)3. With the exception of pledges and assets under financial lease, the monthly reduction in the real credit balance was verified in all credit assistance. In a year-on-year comparison, the balance of financing in pesos fell 3.4% in real terms. The performance of credit in recent months, with an impact on the year-on-year rate of change, partly reflects the effect of the worsening of the epidemiological situation on the development of economic activity. Considering the real variation in credit in pesos over the last twelve months, heterogeneous behavior was observed by group of entities: real increases in public financial institutions and non-bank financial institutions (NBEFs) and decreases in private financial institutions (see Chart 1)4.
Graph 1 | Credit balance to the private sector in pesos
In real terms*
During the period, the BCRA continued to promote the granting of loans under favorable conditions for the sectors most affected by the pandemic context. In particular, through the Financing Line for Productive Investment (LFIP) for MSMEs5, since its implementation and until the end of May, almost $587,000 million6 (about 30% corresponds to the 2021 quota) were channeled, benefiting 131,305 companies (See Graph 2).
Graph 2 | Financing Line for Productive Investment (LFIP) of MSMEs
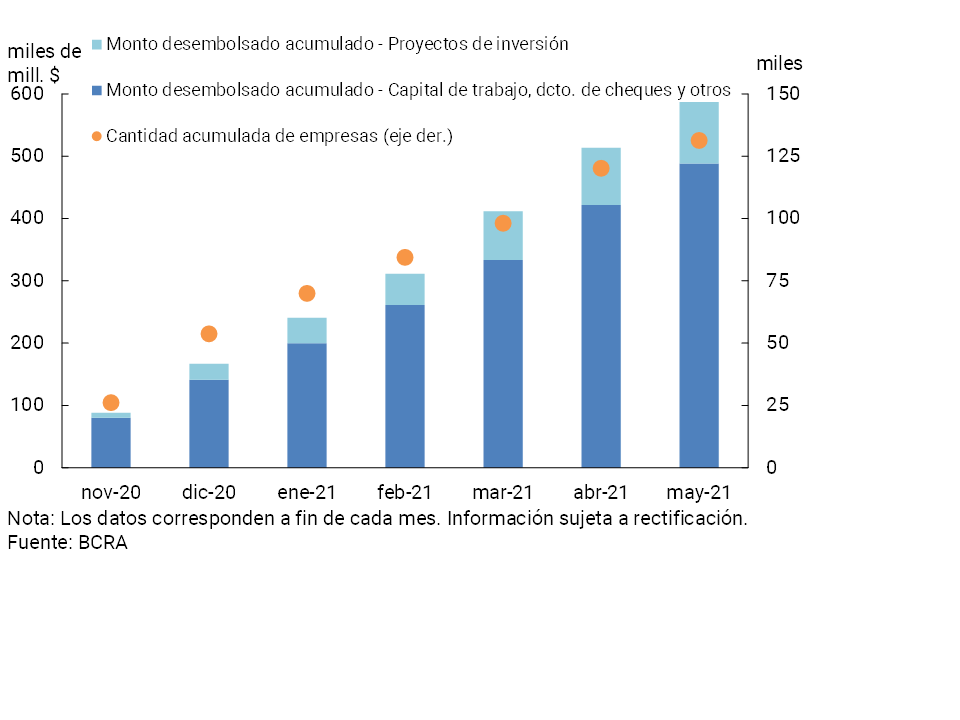
In addition, through the line of financing at subsidized interest rates for companies enrolled in the “Emergency Assistance Program for Work and Production” (ATP)7, more than $14,200 million were granted through 20,940 loans until the end of May. At the same time, within the framework of the credit lines for single-tax and self-employed people, through the Zero Rate Credit lines8 , $66,492 million were granted until the end of May, and through the Zero Rate Culture9 line about $311 million.
In April, the balance of financing in foreign currency remained unchanged from the previous month (-0.1% in foreign currency). In this context, the total credit balance (including domestic and foreign currency) to the private sector accumulated a fall of 2.6% in real terms compared to March and 9.9% in year-on-year terms.
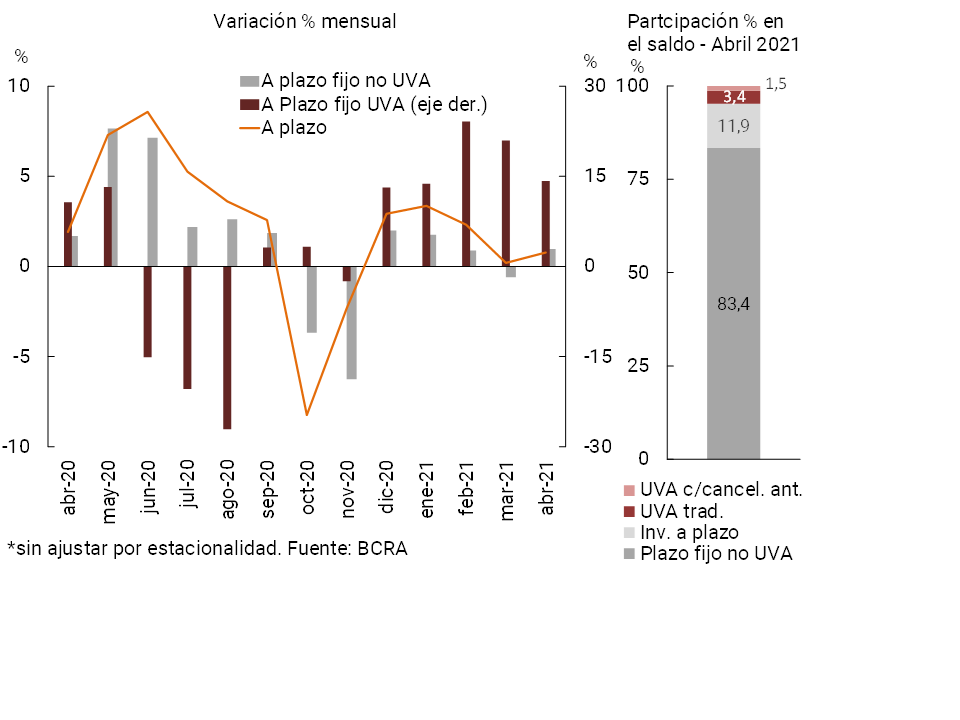
With regard to the funding of all financial institutions, in April the balance of deposits in national currency of the private sector fell by 1.6% in real terms (+2.5% nominal) (see Chart 3). The monthly performance was explained by demand accounts, with a reduction of 3.4% in real terms (+0.6% nominal). On the other hand, time deposits increased by 0.8% in real terms in April (+4.9% nominal), accumulating positive real monthly variations for the fifth consecutive month (see Chart 4). In particular, in the month, fixed terms in UVA increased by 22.3% in real terms for those with early cancellation and 11% in real terms for traditional ones.
Graph 3 | Balance of private sector deposits in pesos
In real terms*
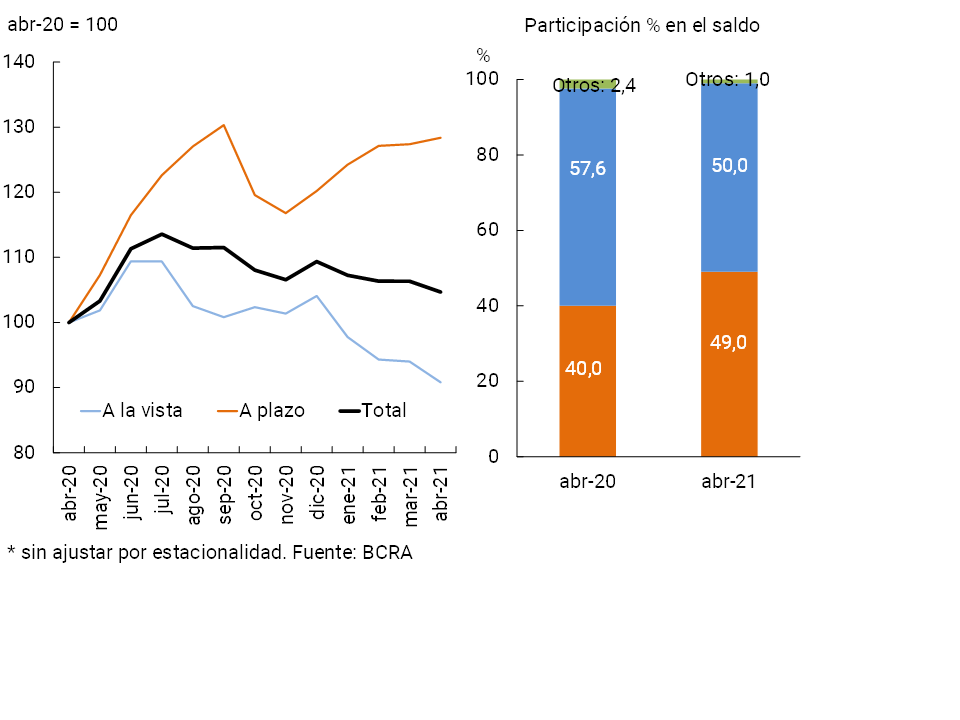
Figure 4 |Balance of private sector time deposits in pesos – In real terms*
Monetary policy interest rates and nominal passive interest rates operated in pesos remained unchanged in magnitude in the period. In this context, the ratio between the balance of time deposits and the balance of private sector demand accounts in pesos was at relatively high levels at the end of April (87%, compared to 83% in the average of the last 2 years).
In April, the balance of deposits in foreign currency of the private sector remained without significant changes compared to the previous month (+0.1% in foreign currency). As a result, the balance of total private sector deposits (in domestic and foreign currency) fell by 1.7% in real terms in the month (+2.3% nominal).
In a year-on-year comparison, the real balance of deposits in pesos in the private sector grew 4.7% (+53.1% YoY nominal), while those in the public sector increased 50.3% in real terms in the same period (+119.9% YoY nominal). Thus, the total balance of deposits in pesos (considering both the public and private sectors) increased by 11.7% in real terms in the last twelve months (+63.4% nominal YoY). When including the performance of deposits in dollars (+0.2% real y.o.y. in the case of private ones and +41.5% y.o.y. real in the case of public ones), the balance of total deposits in the financial system (all sectors and currencies) increased in April by 6.3% y.o.y. in real terms (+55.5% y.o.y. nominal).
II. Aggregate Balance Sheet Composition
In April, the total assets of the financial system fell by 0.6% in real terms compared to the previous month (+3.4% nominal), mainly due to the performance of private financial institutions. In a year-on-year comparison, the sector’s assets accumulated an increase of 2.7% in real terms (see Chart 5).
Graph 5 | Total Asset Balance
In real terms
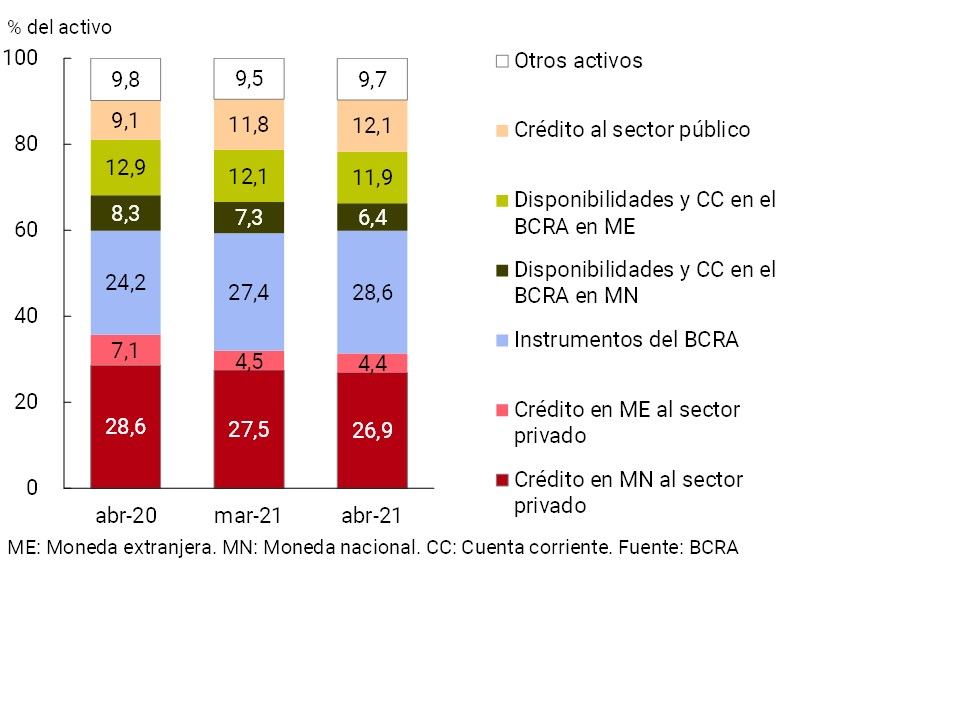
In relation to the composition of the total assets of all financial institutions, in April the relative relevance of the holding of monetary regulation instruments and credit to the public sector increased (see Chart 6). On the other hand, the rest of the main items that make up the asset slightly reduced their relative importance in the period.
Graph 6 | Composition of total assets
Financial system – Share %
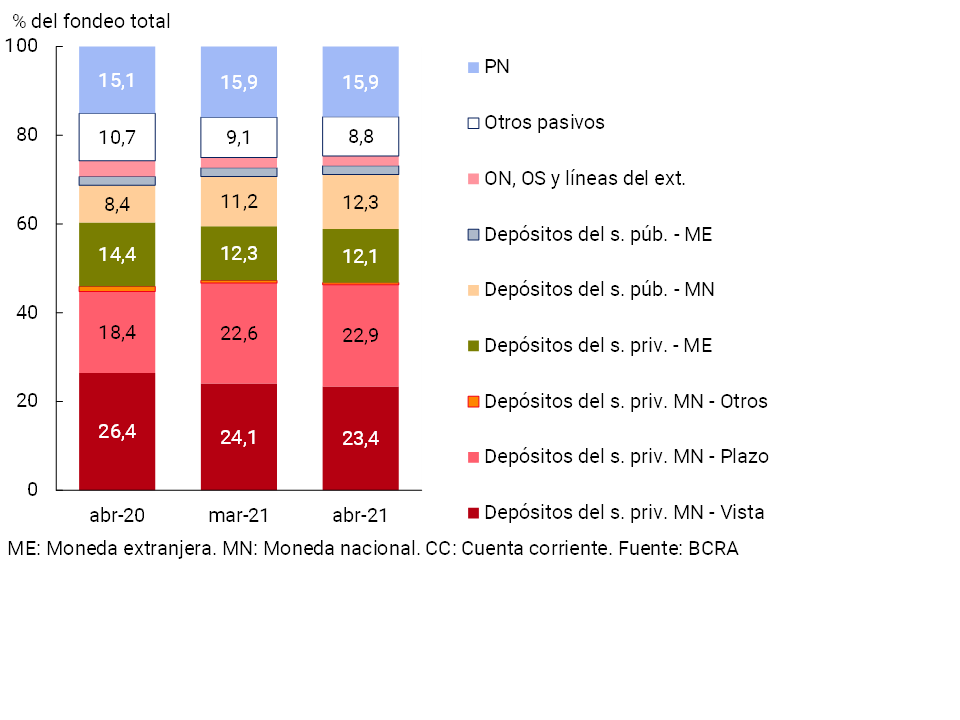
In terms of the composition of the financial system’s funding, the weighting of private sector time deposits in pesos and public sector deposits in the same denomination continued to increase during the month (see Chart 7). On the other hand, in the period, demand accounts in national currency, and private sector deposits in foreign currency decreased their relative weight in total funding.
Figure 7 | Total system funding composition
In % of total funding (liabilities + equity)
The aggregate financial system’s foreign currency assets totaled 18.9% in April, 0.3 p.p. below the value of the previous month and 3.5 p.p. less than the level of a year ago. Liabilities in the same denomination accounted for 17.1% of total funding (liabilities and equity), accumulating a monthly and year-on-year reduction similar to that observed in assets. When additionally considering the forward purchase and sale of foreign currency – off-balance sheet – carried out by financial institutions as a whole, the spread between assets and liabilities in this denomination stood at 9.2% of regulatory capital, falling slightly in the month and 1.6 p.p. in a year-on-year comparison (see Chart 8).
Figure 8 |EM Assets – EM Liabilities + EM Forward Position (Financial System)
III. Portfolio quality
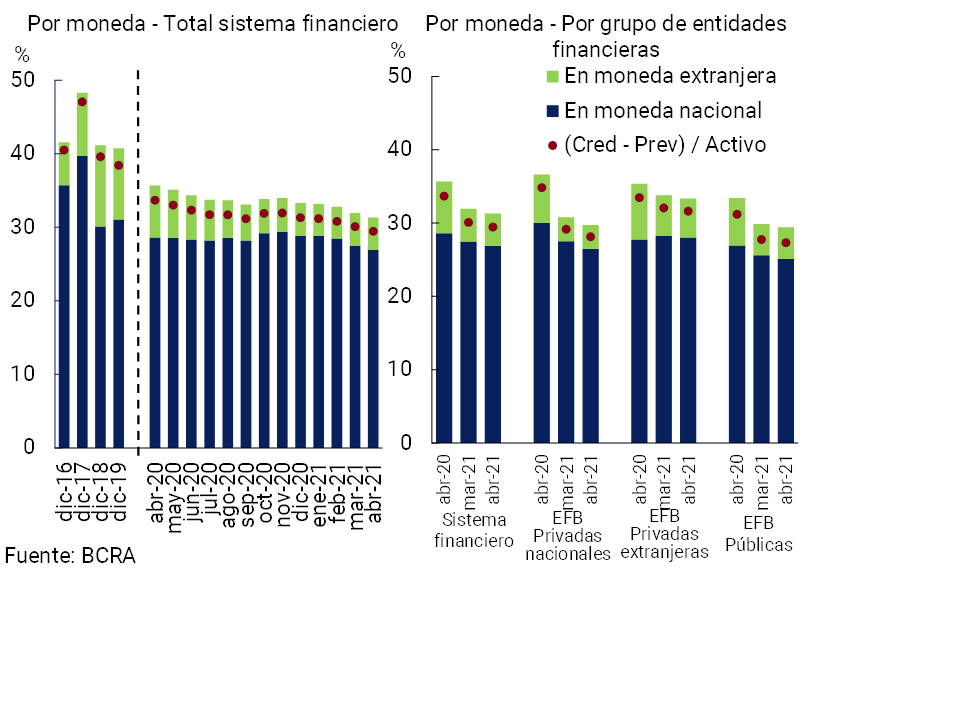
The financial system’s gross exposure to the private sector (including domestic and foreign currency) stood at 31.3% of total assets10 in April, 0.6 p.p. below the value recorded in the previous month (-4.4 p.p. y.o.y.). When considering only financing in pesos, the ratio stood at 26.9%, being 0.6 p.p. lower than in March (-1.7 p.p. y.o.y.) (see Graph 9). For its part, the share of credit to the private sector in foreign currency in total assets continued at levels similar to the previous month.
Figure 9 | Credit balance to the Private Sector / Assets
Between April and May, the transition schedule established by the BCRA for the classification of debtors carried out by entities was in force. Thus, until March 2021, banks had to increase the admitted default periods by 60 days for situations 1, 2 and 311, a period that was reduced to 30 days for April and May of this year, while from June the pre-existing criteria to 19/03/2020are used again 12. At the same time, the policy of focusing financial relief measures on the sectors most affected by the pandemic is maintained, allowing financial institutions to incorporate at the end of the life of the credit the unpaid installments of assistance granted to debtors who are employers covered by REPRO II. In this context, the irregularity ratio of credit to the private sector for the aggregate financial system rose to 4.2% in April, 0.3 p.p. more than in the previous month (-1 p.p. y.o.y.) (see Graph 10)13. The monthly increase was mainly explained by private financial institutions.
Figure 10 | Irregularity of credit to the private sector
Irregular financing / Total financing (%)
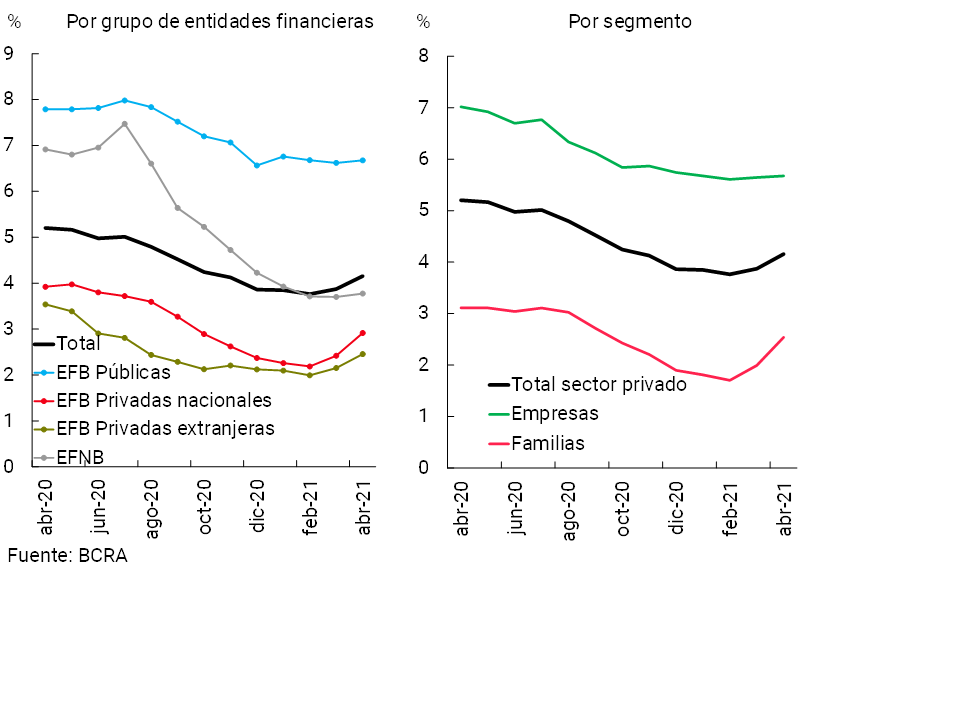
In April, the irregularity of financing to households stood at 2.5% of total credit to this sector, 0.5 p.p. above the level of the previous month (-0.6 p.p. y.o.y.). The monthly performance was mainly explained by the increase in consumer credit delinquencies (credit and personal cards, see Chart 11). For its part, the non-performing loan indicator for companies stood at 5.7%, a level similar to that of March (-1.3 p.p. y.o.y.). The performance of the irregularity of the corporate sector reflected the effect of a slight increase in the indicator corresponding to advances, being offset by the decrease in the rest of the credit assistance.
Figure 11 | Irregularity of credit to the private sector
Irregular financing / Total financing (%)

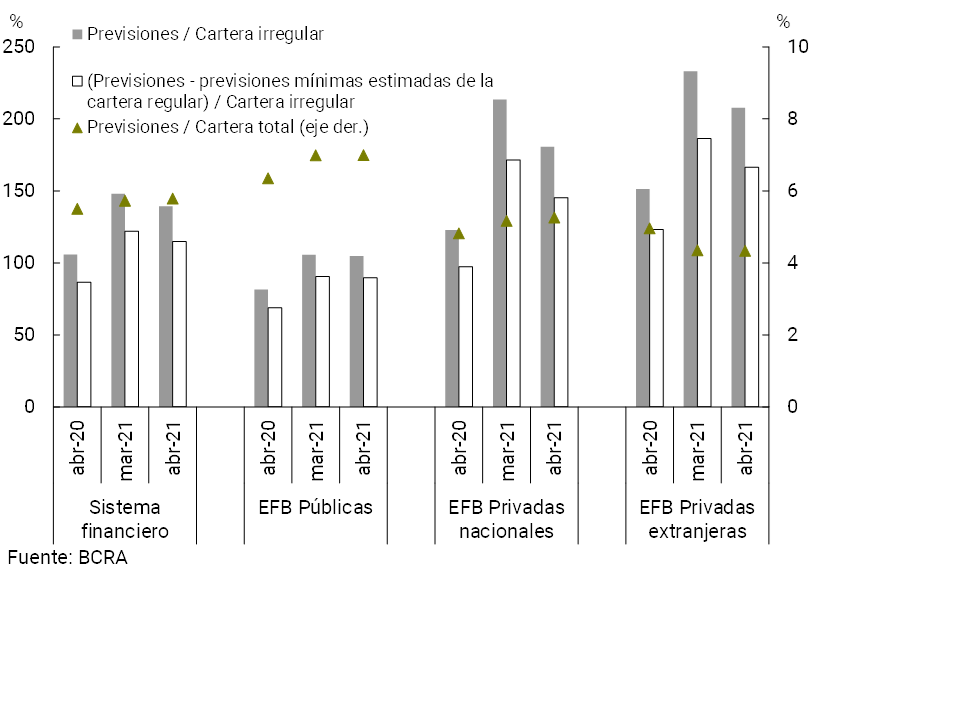
In April, the total forecasts for the financial system represented 5.8% of total lending to the private sector (in line with the previous month’s record and +0.3 p.p. y.o.y., see Graph 12) and 139.3% of the non-performing portfolio (-8.7 p.p. monthly and +33.5 p.p. y.o.y.). On the other hand, the balance of regulatory forecasts attributable to the non-performing portfolio (following the criteria of the minimum regulatory forecasts for uncollectibility risk) represented 114.9% of said portfolio at the systemic level in the month.
Figure 12 | Credit to the private sector and forecasts
By Entity Group
IV. Liquidity and solvency
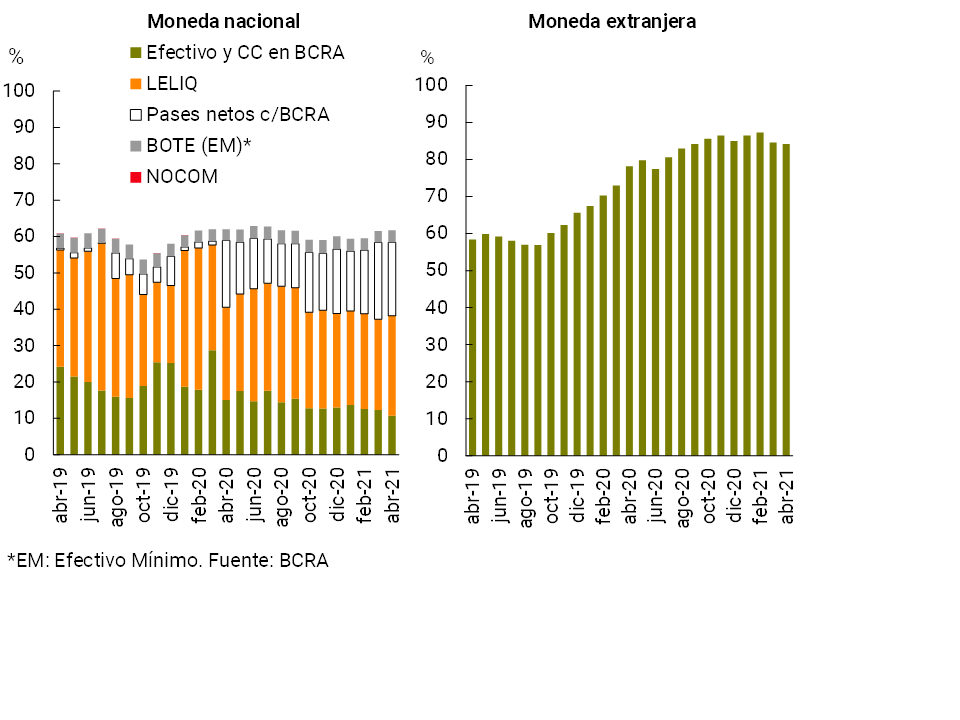
In April, the liquidity indicators of the financial system remained at high levels compared to the average of the last 15 years. Broad Sense Liquidity 14 represented 66% of total deposits in the month, with no change in magnitude compared to March (+0.2 p.p. to 61.8% for the segment in pesos and -0.4 p.p. to 84.2% considering items in foreign currency, see Chart 13). In terms of the composition of liquid assets in pesos, between the end of the month the weighting of net passes with the BCRA and of the current accounts that financial institutions have in this Institution decreased, while the relevance of LELIQ15 balances increased. In a year-on-year comparison, the broad liquidity ratio increased by 0.3 p.p. of total deposits.
Figure 13 | Liquidity of the financial system
In % of deposits
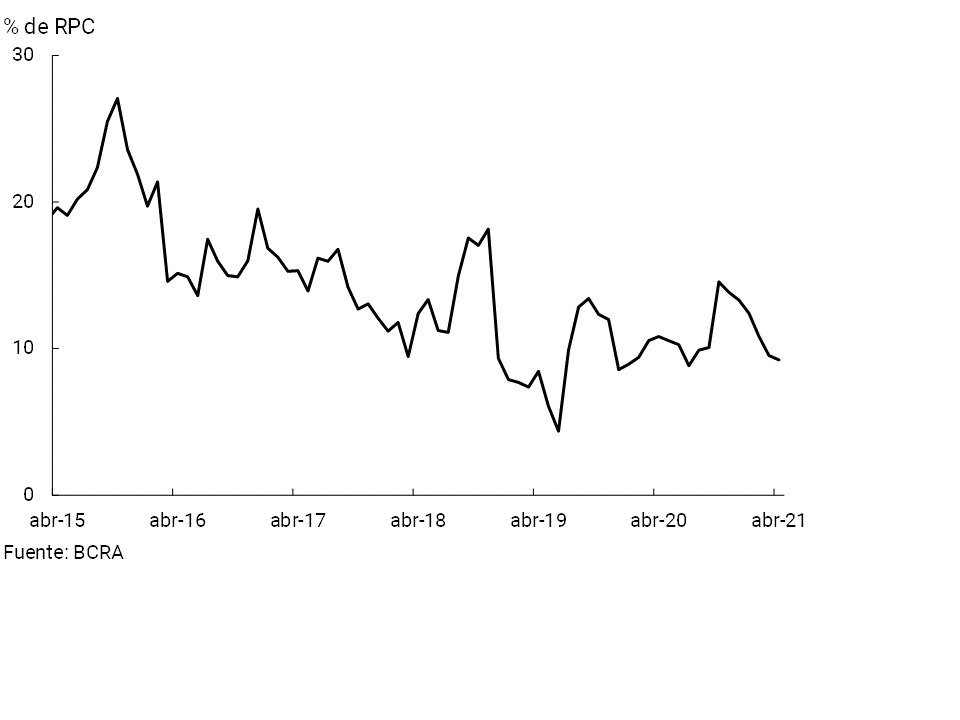
The sector’s solvency indicators did not show significant changes in April, remaining at high levels, partly due to the effect of the macroprudential regulations implemented by the BCRA that have contemplated the suspension of dividend distribution in the context of the pandemic. Regulatory capital integration (RPC) stood at 25.4% of risk-weighted assets (RWA) for all entities (see Chart 14). Regarding the composition of the PRC, almost 93% was explained by the Level 1 segment, with a greater capacity to absorb potential losses. In turn, the excess capital position (PRC net of the minimum regulatory capital requirement) in terms of the regulatory requirement totaled 208% in the month.
Figure 14 | Integration of regulatory capital
By financial institution group
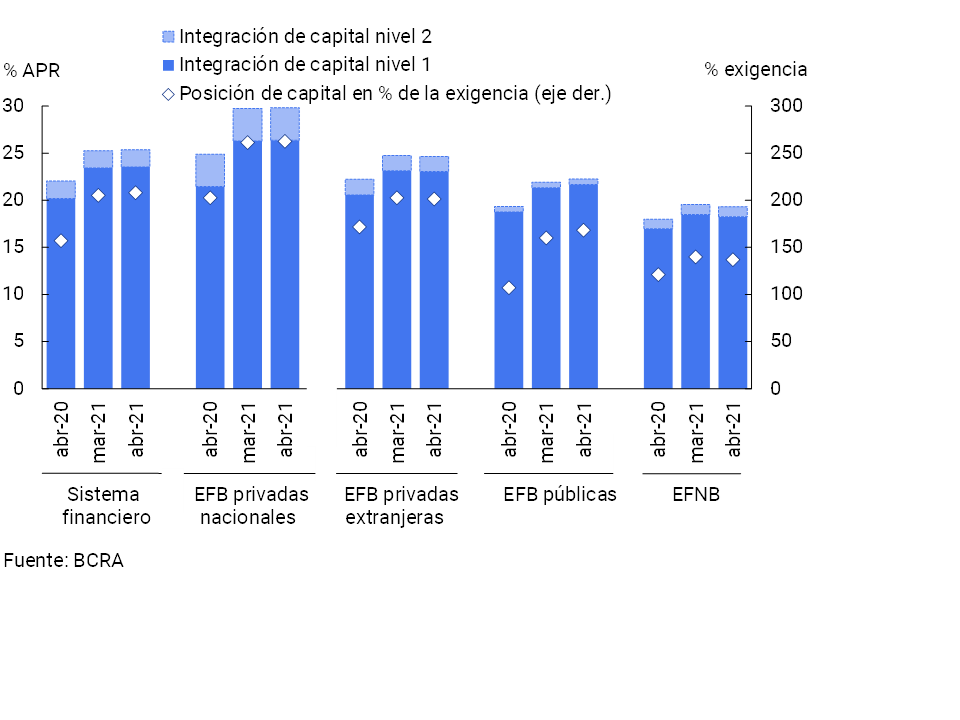
A reflection of the capital adequacy of the sector as a whole in the face of an eventual materialization of credit risk (extreme and very unlikely) can be illustrated by the ratio between the excess capital position and the credit to the private sector net of forecasts. In April, this indicator represented 31.3% for the aggregate sector (+0.5 p.p. compared to March and +8.8 p.p. y.o.y.), placing it above the average of the last 10 years (13.2%)16.
In the first months of 2021, a path of gradual reduction in the profitability indicators of the financial system continued to be observed, in line with what was observed in the second part of 2020. Thus, considering the accumulated in the first 4 months of the year, the accrued result was equivalent to 0.3% annualized (a.) of assets (ROA) and 1.9% y. of equity (ROE). These indicators were reduced in a year-on-year comparison (-2.4 p.p. of assets and -16 p.p. of equity, see Chart 15). This performance reflects, among other factors, the effect of the evolution of the general price level on the sector’s balance sheet, lower interest income in pesos, higher funding costs for deposits in pesos (minimum interest rates and a growing proportion of time deposits), lower results for services and a certain increase in some tax burdens. among others. These effects were partly tempered by higher premiums for passes compared to the same period of the previous year, gradually lower charges for uncollectibility, administrative expenses and accrued income tax, among others.
Figure 15 | Comprehensive total profit in homogeneous currency of the financial system
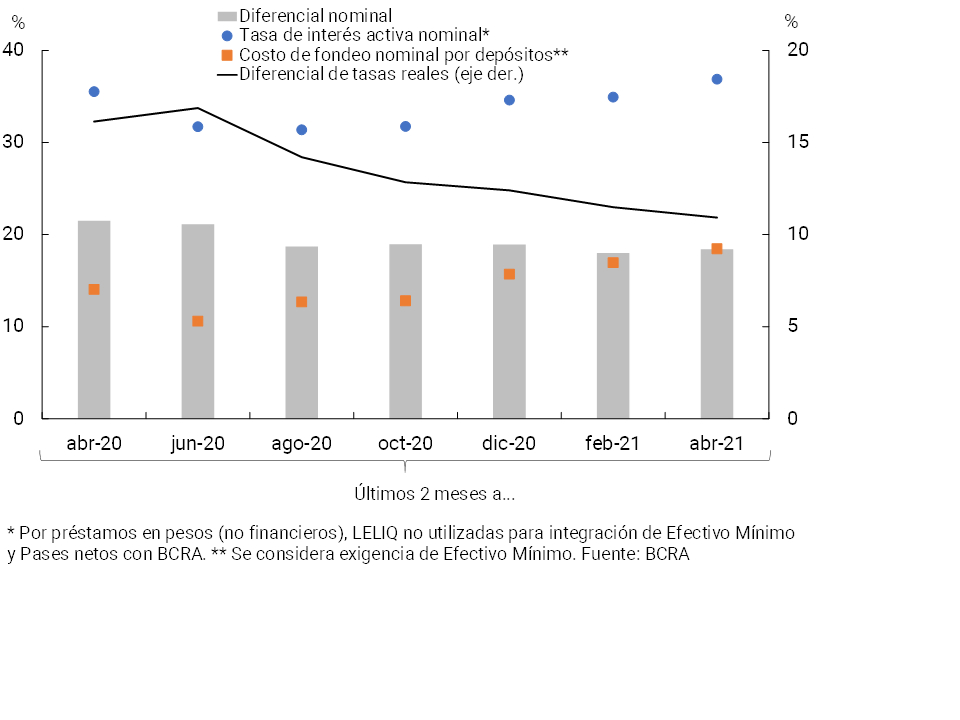
The evolution of the differential between lending and lending rates is a factor that helps to partly explain the downward pattern of the profitability indicators of the financial system.
With information as of April for the segment in pesos17, 18, it is estimated that there were 4 consecutive bimonths in which both the nominal implicit interest rate and the nominal implicit funding cost for deposits have increased similarly, leading to the differential between both nominal concepts not presenting significant changes. In this context, and given the performance of the general price level, a reduction in the real implicit interest rate differential is estimated (see Chart 16).
Figure 16 | Estimated Implied Interest Rates (Annualized) – Segment in Pesos – Financial System
V. Payment system
The use of electronic means of payment by the population continued to expand in the first part of 2021. This occurred in the context of changes in the usual practices of the population in the face of the shock of the pandemic, as well as the impetus caused by the measures opportunely introduced by the BCRA. In particular, at the end of 2020, the Payments with Transfers system was reformulated and since April of this year, regulatory incentives for entities have been in force through lower liquidity requirements, to the extent that improvements in the use of electronic payment channels are verified. More recently, in order to continue strengthening the fluidity of the payment system, the BCRA modified, as of July, the maximum period available to financial institutions to settle payments to suppliers or participating businesses for sales made with credit cards and/or purchases issued by them. A maximum settlement period of 8 business days was established from the time the sale is made if the supplier or business is a micro or small enterprise and/or is a natural person, (ii) 10 business days for medium-sized companies and health, tourism, and hotel companies; (iii) 18 business days for the rest of the cases19. The BCRA will continue to direct its actions to deepen the dynamism of the payment system, without losing sight of the security of operations.
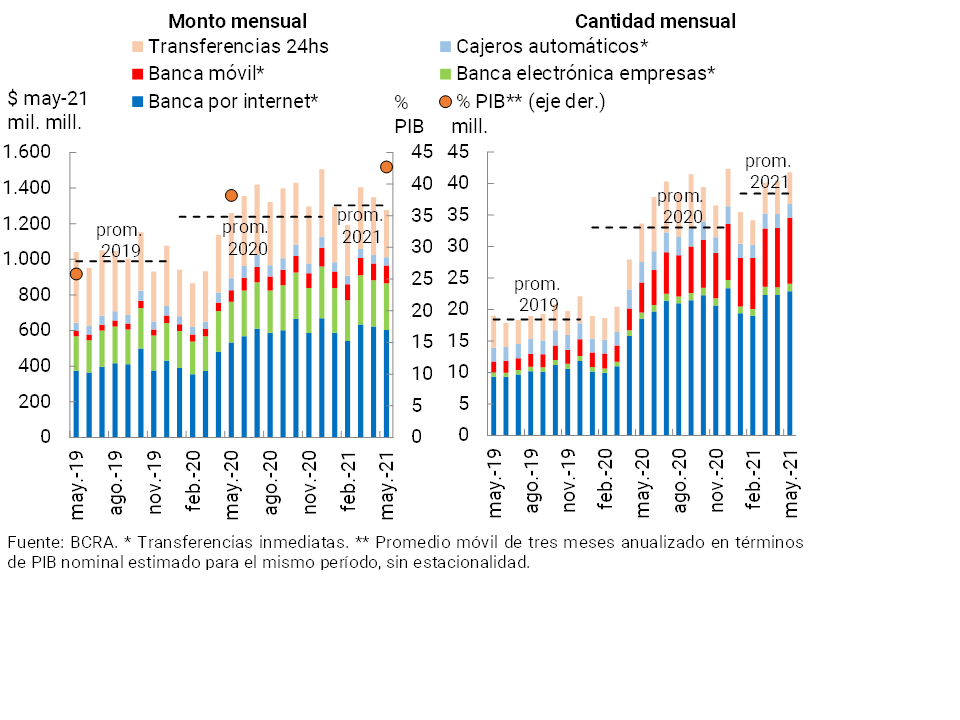
The number of transfers in pesos (immediate and with credit in 24 hours) continued to increase in May, registering monthly amounts at the beginning of this year that exceeded the averages of 2020 and 2019 expressed in homogeneous currency (see Graph 17). In a year-on-year comparison, in May transfers in pesos increased 24.1% in amounts and 1.3% in real amounts. The immediate transfers segment drove this performance (+33.4% YoY in amounts and +13.3% YoY in real amounts), with mobile banking being the channel used with the greatest relative dynamism (+118.6% YoY in amounts and +55.8% YoY in real amounts). 42% of the total amount (and 28% of the amount) of transfers made through mobile banking in May were explained by operations channeled through the wallets created by public financial institutions (DNI Account and BNA+). In particular, the use of such wallets has been growing throughout 2021. Within the framework of this positive performance, it is estimated that the annualized amount of transfers in pesos was equivalent to approximately 43% of GDP, increasing 4.5 p.p. y.o.y. Additionally, the number of operations under the Transfer Payments system increased by 40% in the first 5 months of 2021, as of the reformulation implemented by the BCRA in December 2020.
Figure 17 | Transfers in pesos (immediate by channel and with accreditation in 24 hours)
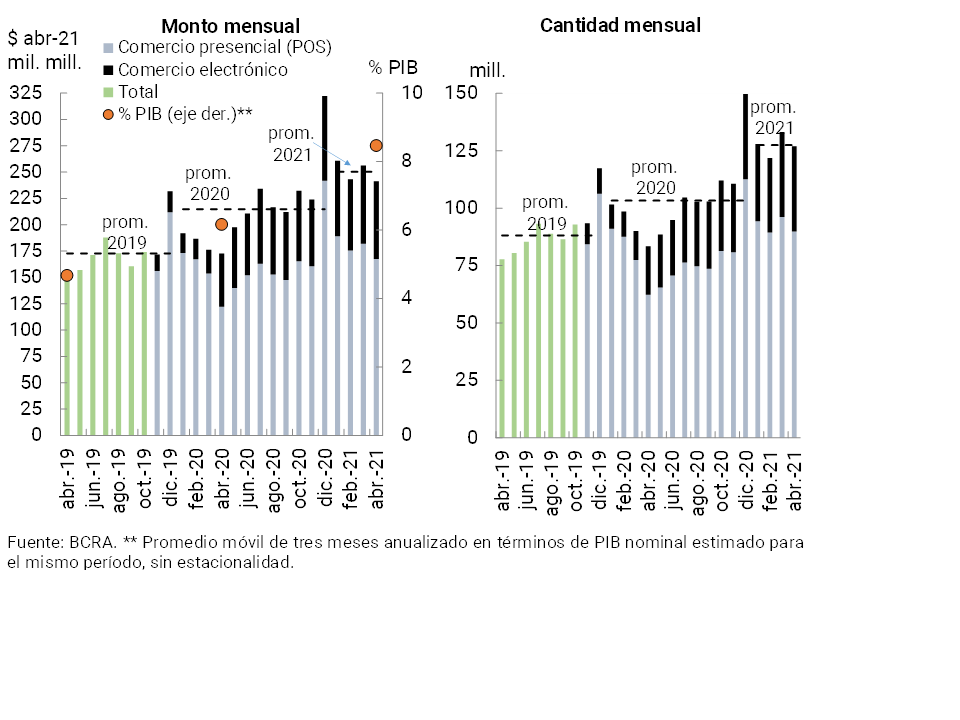
Debit card transactions declined in April (latest available information), partly due to seasonal reasons. Despite this performance, at the beginning of 2021 monthly levels were maintained above the average of the previous two years (see Chart 18). Debit card operations through e-commerce continued to increase their share of the total, to represent about 30%, both for the amounts and for the amounts of April. In a year-on-year comparison, debit card transactions increased in amounts (52.3%) and in real amounts (39.6%), with a significant increase in transactions in electronic format (76% in amounts and 45.5% in real amounts). Thus, it is estimated that the annualized amount of debit card operations represented 8.5% of GDP, increasing 2.3 p.p. y.o.y.
Figure 18 | Debit card transactions
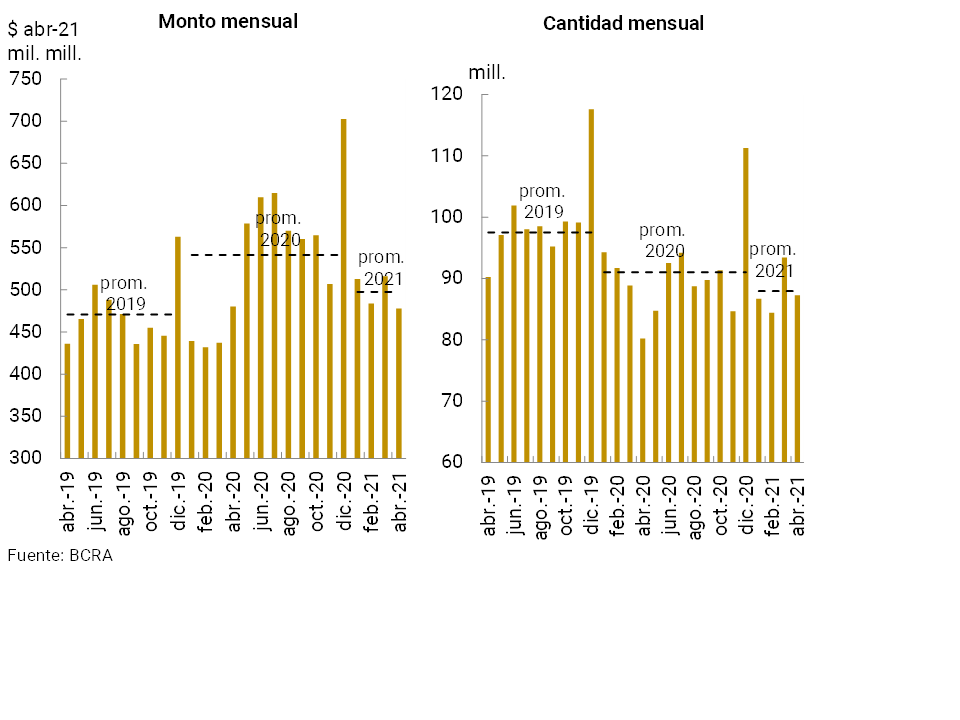
In April (latest available information) ATM withdrawals decreased, due in part to seasonal factors. Thus, at the beginning of 2021, monthly ATM withdrawals remained at levels lower than last year’s average, both in real amounts and in quantities (see Graph 19). Compared to the same month of the previous year, withdrawals increased in quantities (8.8%) and decreased slightly in real amounts (-0.5%).
Figure 19 | Cash withdrawals
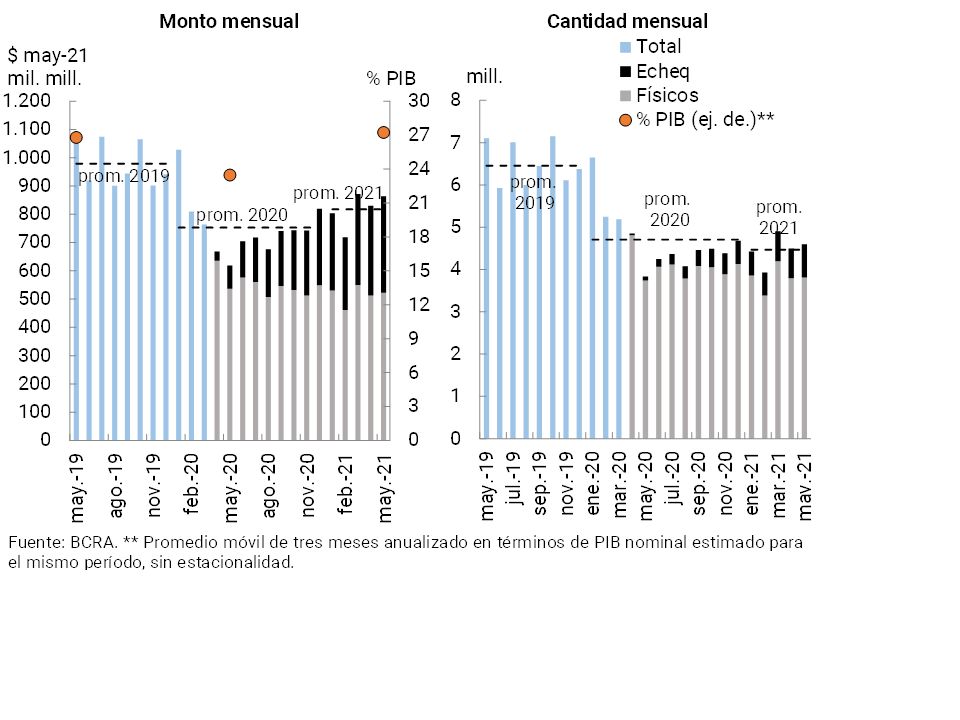
Check clearing increased in May. Thus, at the beginning of 2021, the real monthly amounts exceeded on average those recorded in 2020, while the amounts offset were at slightly lower levels than last year (also on average). In line with the stimuli implemented by the BCRA, ECHEQs continued to increase their share of the total offset to represent 17% of the amounts and 39.5% of the amounts (see Chart 20). Check clearing increased 19.8% YoY in amounts and 39.7% YoY in real amounts (the basis of comparison takes the levels of May 2020, when a minimum was evidenced both in the quantities of checks and in actual amounts cleared in the context of the pandemic).
Figure 20 | Check clearing
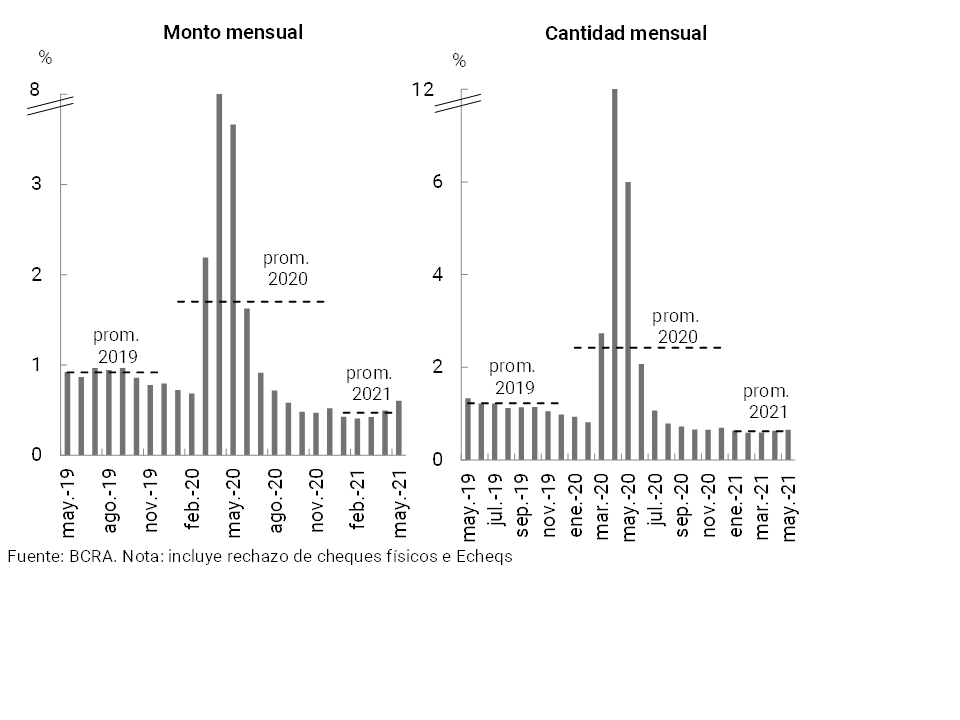
In May, the ratio of rejection of checks due to lack of funds increased slightly in terms of the total compensated: 0.02 p.p. in amounts (up to a level of 0.65%) and 0.11 p.p. in amounts (up to a level of 0.6%). Despite this performance, this indicator is much lower than the annual average recorded in 2020 and 2019 (see Chart 21).
Figure 21 | Bounce checks due to insufficient funds
References
1 For more details, see “IPOM” of May 2021.
2 Differences in balance sheet balances expressed in homogeneous currency. Information extracted from the balance sheet balances corresponding to the Monthly Accounting Information Regime.
3 Includes principal adjustments and accrued interest.
4 Throughout the Report, when reference is made to groups of private (national and/or foreign) and public financial institutions, it corresponds to banking entities. Non-bank entities will be referred to as “EFNBs”.
5 For more details, see Ordered Text “Financing Line for the Productive Investment of MSMEs”.
6 Almost 17% of the total disbursed until the end of April corresponds to investment projects.
7 See Communication “A” “7082” and Communication “A” “7102”.
8 See communication “A” “6993”.
9 See Communication “A” “7082”.
10 This ratio reached 29.4% when the balance of forecasts accounted for was net.
11 See Communication “A” “6938”, Communication “A” “7107”, Communication “A” “7181”, and Point 2.1.1. of the Ordered Text “Financial Services in the Framework of the Health Emergency Provided for by Decree No. 260/2020 CORONAVIRUS (COVID-19)”.
13 In the context of the provisions adopted in the field of relief measures, the level and variation of that indicator began to show some weakness in assessing the evolution of the quality of the credit portfolio in the financial system. Thus, based on the information available, some complementary indicators were prepared on the degree of credit exposure of all financial institutions. For more details, see the box “Resilience of the financial system in the context of COVID-19: exposure and coverage to debt that is estimated to be in a relatively more vulnerable situation” of the “IEF I-21”.
14 Considers availability, integration of minimum cash and BCRA instruments, in national and foreign currency.
15 In April, new deductions came into force for the requirement of minimum cash in pesos that must be verified by financial institutions (see Communication “A” “7254”). In the first place, the entities that have implemented the remote and face-to-face opening of the “universal free account (CGU)” were able to deduct from the aforementioned requirement the new financing in pesos granted to individuals and MSMEs that are not informed in the “Central of debtors of the financial system”, provided that they have been agreed at an annual nominal interest rate that does not exceed, at that time, the corresponding maximum established interest rate. Secondly, the minimum cash requirement of these entities was also reduced as a result of the growth rate in the use of electronic means through demand accounts held by natural persons, the evolution of electronic cheques (ECHEQ) and electronic credit invoices (FCE MSMEs). and the operability of its ATMs.
16 For more detail, see “IEF I-21.”
17 It should be considered that the definition used for these implicit interest rates does not contemplate the effect of: administrative expenses, tax expenses, cost of capital or other components associated with hedging for risks intrinsic to the financial intermediation operation.
18 Implied interest rates are estimated considering the accumulating and annualized flow for 2 months. For more details on the calculation methodology, see previous editions of the “Bank Report”.
19 According to Communication “A” “7305”. For more details, see “Press Release of 10/06/2021”.
Share on


