I. Financial intermediation activity
In June, the financial intermediation activity in pesos of entities with the private sector increased. Taking into account the most outstanding variations in real terms of the system’s balance sheet for items in pesos, the balance of private sector deposits increased during the month and, to a lesser extent, the balance of financing to the public sector was reduced. These movements were offset by increases in broad liquidity and the balance of credit to the private sector, and a reduction in public sector deposits. In the segment of items in foreign currency, there was a monthly drop in liquidity and an increase in financing to the private sector in period1.
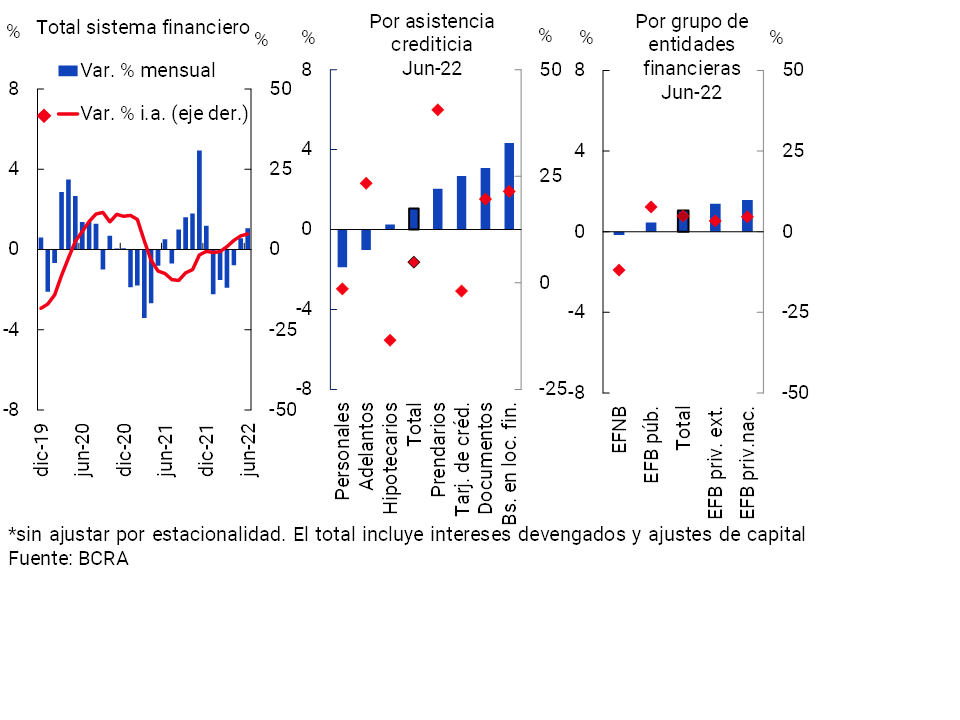
In June, the balance of credit in pesos to the private sector increased by 1.1% in real terms (see Chart 1; +6.4% nominal)2. Commercial lines (leasing and documents), as well as cards and pledges presented the largest relative increases in the period. In a year-on-year comparison, the balance of credit in national currency increased by 4.8% in real terms (+71.8% nominal YoY), with increases in all groups of banking entities. The year-on-year growth in credit in pesos was mainly explained by the performance of commercial lines and collateral loans. In particular, the dynamism of collateralized loans has been reflected mainly in the legal entities segment (+55.4% real y.o.y. as of June –latest available information–-) and in public financial institutions (+121.5% y.o.y. real).
Graph 1 | Credit balance to the private sector in pesos
In real terms*
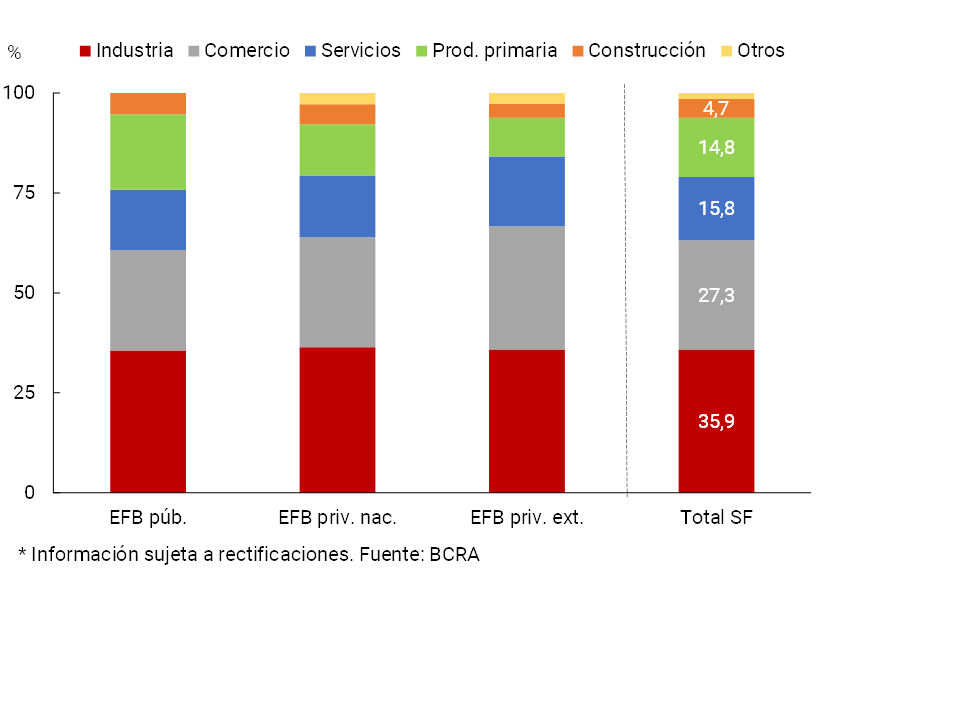
The positive performance of commercial loans in pesos in the last year (+20.7% real YoY) continued to be driven by the Financing Line for Productive Investment of MSMEs (LFIP). The loans channeled through this tool accumulated nominal disbursements of almost $2.5 trillion since its launch (in October 2020) and until June 2022, distributed among approximately 284,500 companies. As of June, the estimated credit balance of the LFIP reached more than $808,900 million (of which 40.6% corresponds to financing of investment projects). It is estimated that about 36% of the balance was channeled to companies linked to the industrial sector (see Graph 2), followed by trade and services (27.3% and 15.8% respectively).
Graph 2 | Financing Line for Productive Investment (LFIP) of MSMEs
Total balance as of June 2022*
The balance of credit in foreign currency to the private sector increased 3.3% in June —in currency of origin—, a dynamic explained in part by the performance of credit cards. It is worth mentioning that the BCRA recently decided to modify the financing rate applied to credit cards, to the extent that monthly consumption is recorded for an amount greater than 200 dollars3. In this context, the total financing balance (in domestic and foreign currency) to the private sector grew 1.2% in real terms compared to the previous month (+6.5% nominal), accumulating a decrease of 1.9% in real terms in year-on-year terms (+60.8% nominal YoY).
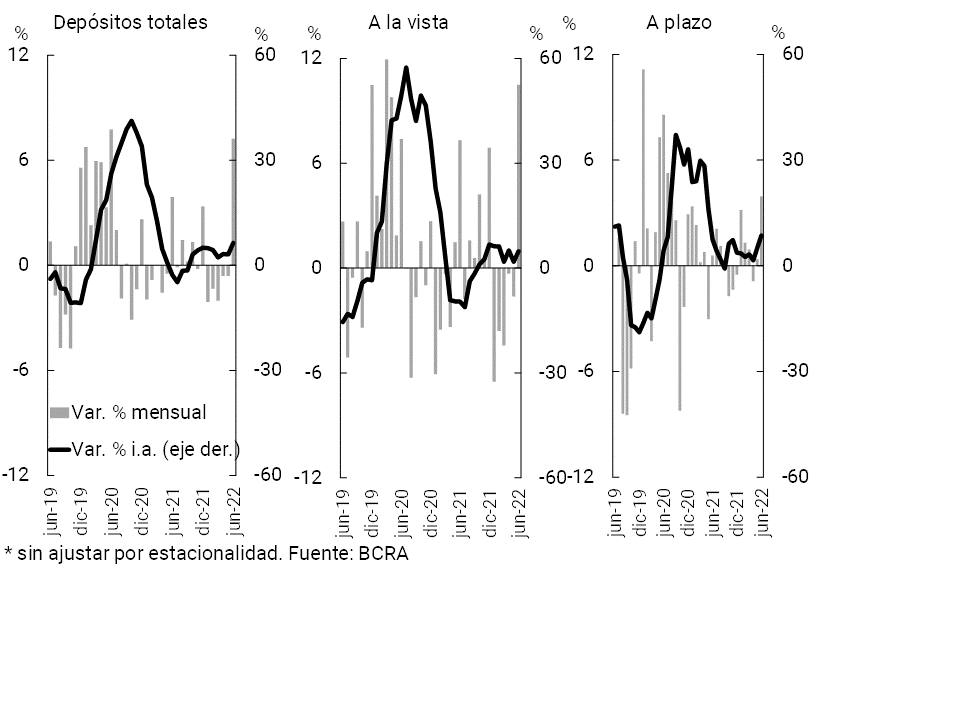
On the funding side of the financial system, the balance of deposits in national currency of the private sector increased by 7.2% in real terms in June (+12.9% nominal, see Chart 3). Demand accounts increased 10.5% in real terms in the month, reflecting the seasonal effect of the payment of the half bonus (+16.3% nominal). For its part, the balance of time deposits grew 3.9% in real terms (+9.4% nominal).
Graph 3 | Balance of private sector deposits in pesos
In real terms* – Financial system
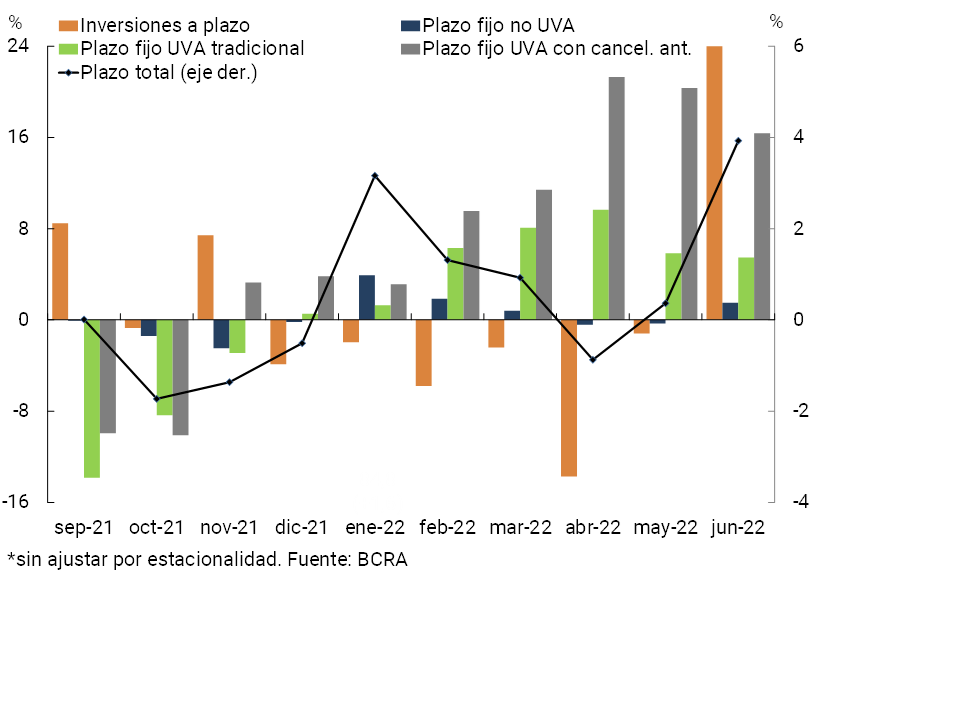
The monthly dynamics of time deposits was partly explained by a higher demand for UVA time deposits, instruments that offer positive real returns, and, to a lesser extent, by traditional fixed-term deposits and time investments. Within the UVA segment, pre-cancellable placements accumulated an increase of 16.4% in real terms in the month, while traditional deposits increased 5.5% in real terms (see Chart 4). Thus, in the first part of the year, the balance of UVA deposits increased by 67.5% in real terms, thus reaching the highest level – measured in homogeneous currency – since its launch. Based on this performance, time deposits in UVA accounted for 7.5% of the balance of time deposits in pesos in the private sector.
Figure 4 | Monthly change in the balance of private sector time deposits in pesos in real terms*
The increase in the balance of deposits in pesos occurred within the framework of successive increases in nominal interest rates throughout 2022. In order to accelerate the process of normalization of the economy’s interest rate structure and bring them closer to positive territory in real terms, in mid-August the BCRA ordered a new increase in the 28-day LELIQ interest rate, which went from 60% to 69.5% TNA, in addition to an increase in the minimum limits of interest rates on fixed terms. Thus, the interest rate on 30-day fixed terms of up to $10 million for individuals rose to 69.5% TNA (96.5% TEA), while for the rest of the private sector’s fixed-term deposits the minimum rate was set at 61% TNA (81.3% TEA)4.
In June, the balance of private sector foreign currency deposits remained unchanged (+0.2% in source currency). The balance of total private sector deposits (in domestic and foreign currency) increased by 5.9% in real terms in the period (+11.6% nominal).
In a year-on-year comparison, the balance of deposits in pesos in the private sector accumulated an increase of 6.4% in real terms (+74.4% nominal), with increases in demand and time deposits. Public sector deposits in pesos fell by 7.8% YoY in real terms (+51.1% YoY in nominal terms). The balance of deposits in pesos in all sectors increased by 3.8% YoY in real terms (+70.1% YoY in nominal terms). Considering all currencies and sectors, the balance of total deposits did not show significant changes compared to June 2021 in real terms (-0.8% real y.o.y. or +62.5% nominal y.o.y.).
II. Evolution and aggregate composition of the balance sheet
The size of the balance sheet (defined by total assets) of the financial system increased by 2.4% in real terms in June (+7.8% nominal), with similar performances in groups of entities. Year-on-year, the asset did not show changes in magnitude in real terms at the systemic level.
With regard to the composition of the total assets of all financial institutions, in June the weighting of the balance of BCRA instruments increased, while that of the remaining items decreased (see Chart 5). When disaggregating assets by currency, those denominated in foreign currency reduced their relative importance in the month (from 15% in May to 14.2% in June), while the components in pesos without adjustment for CER did not show changes of magnitude, remaining around 12% of the assets in June.
Graph 5 | Composition of assets and total funding
Financial system – Share %
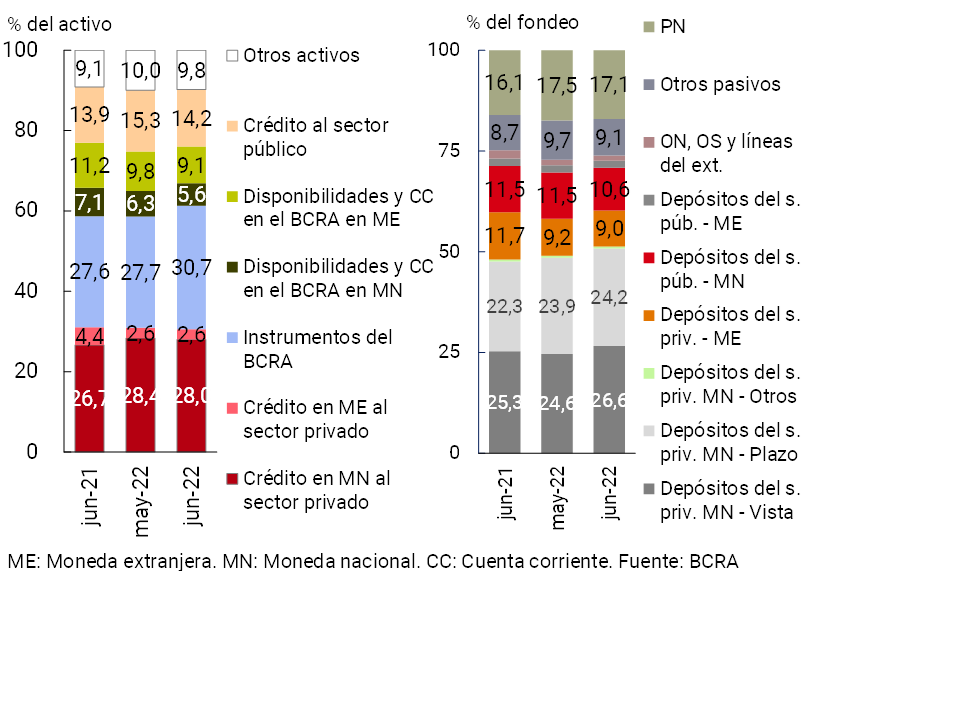
In terms of the composition of the total funding of the sector aggregate, the weighting of demand accounts and private sector time deposits in national currency increased during the month. Deposits in pesos in the public sector and deposits in foreign currency in the private sector reduced their relative weight (see Chart 5). When differentiating the total funding by currency, the items in pesos with an adjustment clause for CER or UVA slightly increased their weighting in the month, reducing the relevance of those denominated in foreign currency.
Under macroprudential regulation, the exposure of the financial system’s balance sheet to foreign currency items remained at relatively low levels towards mid-2022. The spread between assets and liabilities of all financial institutions in foreign currency5 stood at 11.6% of regulatory capital in June, 0.8 p.p. more than in May (+4.2 p.p. y.o.y.).
III. Portfolio quality
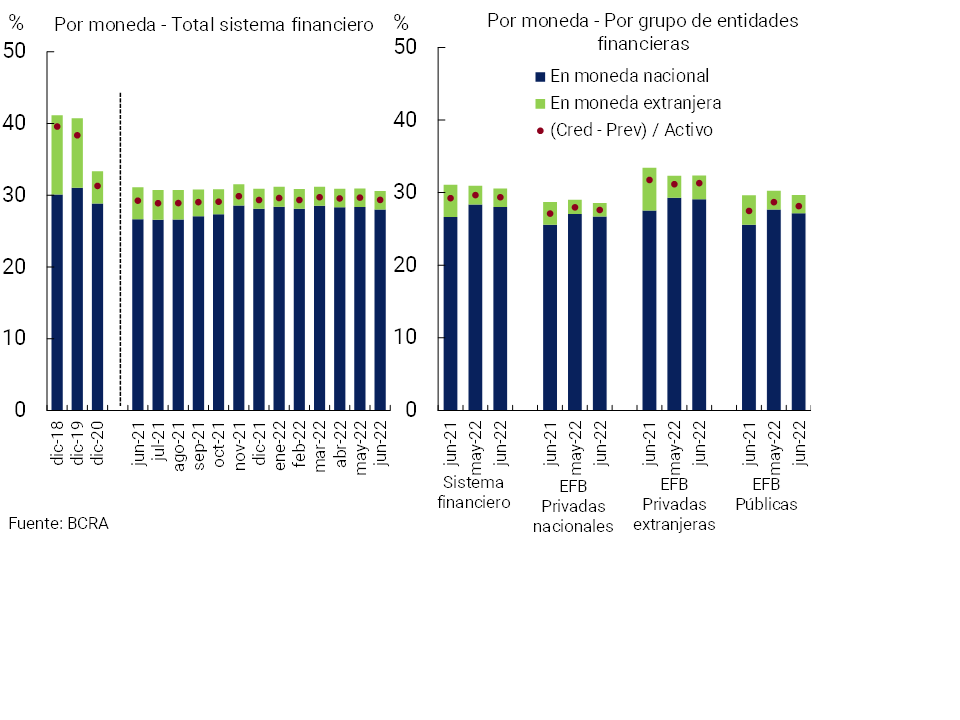
The financial system’s gross exposure to the private sector (in domestic and foreign currency) stood at 30.6% of total assets on June6, down 0.4 p.p. compared to May (-0.5 p.p. y.o.y.). The monthly decline was mainly driven by public and private national financial institutions. When considering only financing in pesos, this indicator stood at 28%, 0.4 p.p. below last month’s record (+1.3 p.p. y.o.y.) (see Graph 6). The share of credit to the private sector in foreign currency in total assets remained unchanged in the month, totaling 2.6% (-1.9 p.p. y.o.y.). The exposure of all entities to the public sector represented 14.2% of total assets in June, 1.1 p.p. less than in May (+0.3 p.p. y.o.y.).
Graph 6 | Private Sector Credit Balance / Assets
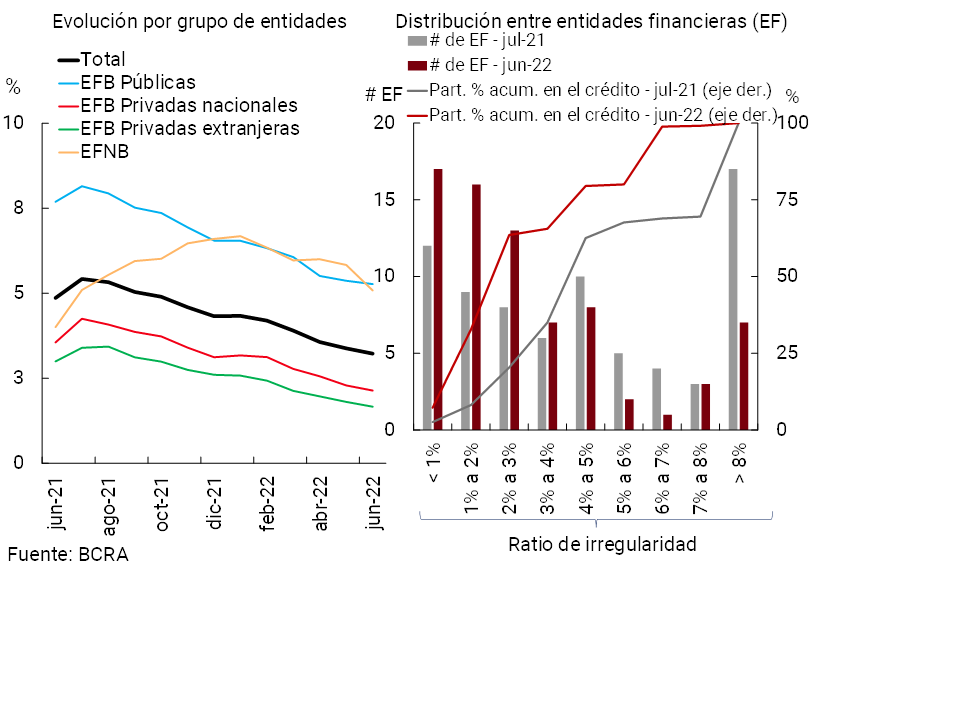
In June, the non-performing ratio of credit to the private sector stood at 3.2%, remaining unchanged in magnitude with respect to the value of May (-0.1 p.p.) and accumulating a reduction of 1.6 p.p. y.a.7. In terms of the distribution of the NPL ratio among financial institutions, since the peak recorded in July 2021 at the aggregate level, a generalized decrease in the indicator was observed, with a shift in the distribution towards lower records (see Chart 7).
Figure 7 | Regularity of credit to the private sector
Irregular financing / Total financing (%)
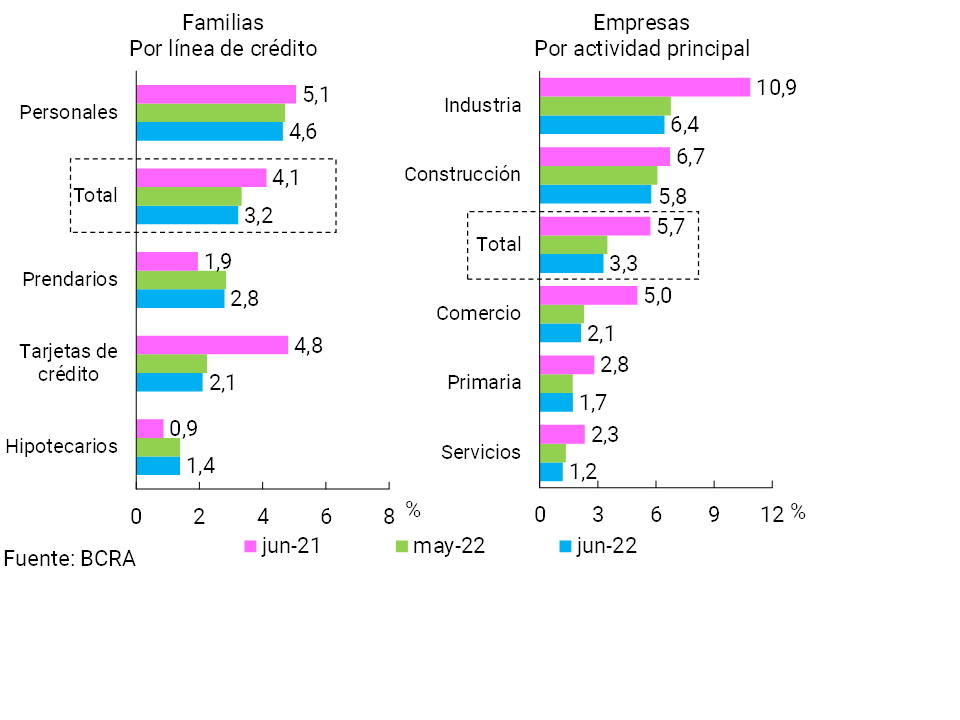
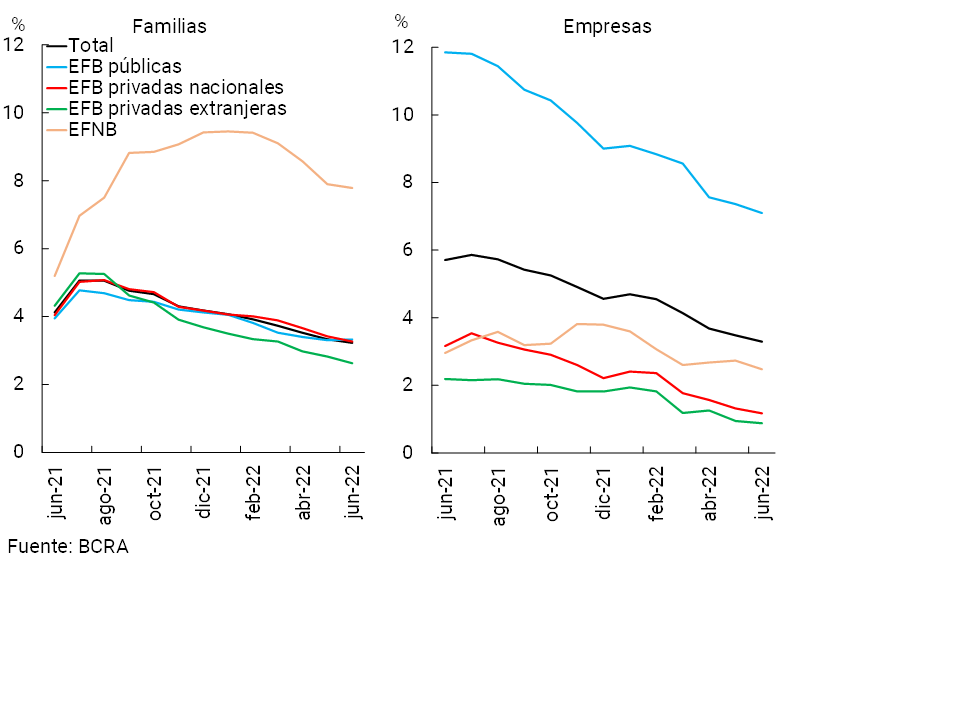
When distinguishing by credit segment, in June the NPL ratio of financing to households stood at 3.2% (-0.1 p.p. and -0.9 p.p. y.a., see Graph 8). For its part, the irregularity coefficient of credit to companies fell 0.2 p.p. in the month, to a total of 3.3% (-2.4 p.p. y.o.y.), a variation driven mainly by the performance of companies linked to the industry and construction sectors. Loans to companies channeled by public financial institutions presented a relatively higher level of irregularity than in the rest of the groups of entities, in a context in which there was a generalized decrease in the segment’s delinquency indicator in the last 12 months (see Graph 9). On the other hand, in financing to families, the highest levels of the irregularity ratio continued to be recorded in non-bank financial institutions.
Figure 8 | Irregularity of credit to the private sector
Irregular financing / Total financing (%)
Graph 9 | Irregularity of credit to the private sector
Irregular financing / Total financing (%)
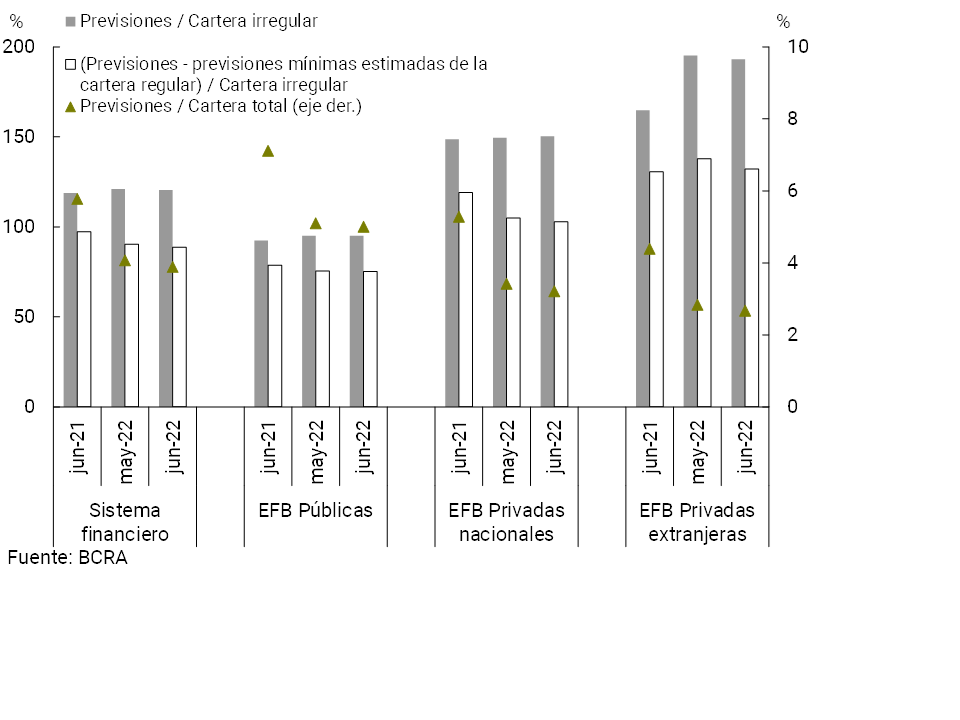
In June, the balance of total forecasts of all financial institutions represented 3.9% of total lending to the private sector (-0.2 p.p. compared to last month’s value and -1.9 p.p. y.o.y.) and 120.5% of the portfolio in an irregular situation (-0.5 p.p. monthly and +1.7 p.p. y.o.y.) (see Graph 10). For its part, in the period, the forecasts attributable to the irregular portfolio of the private sector (following the criteria of the minimum regulatory forecasts for uncollectibility risk) weighted 88.7% of said portfolio for the aggregate of entities.
Figure 10 | Credit to the private sector and forecasts
By Entity Group
IV. Liquidity and solvency
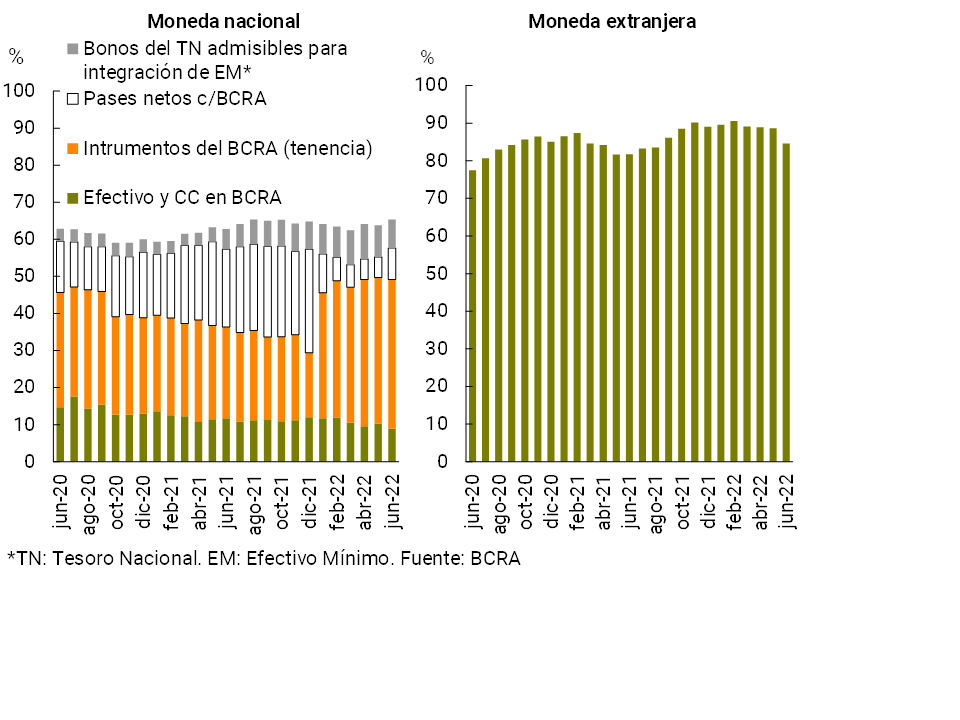
Towards the end of the second quarter of the year, the liquidity indicator in the broad sense of the financial system remained at historically high levels. Liquid assets reached 68.2% of total deposits in the month, 0.6 p.p. above the May record. Disaggregated by currency, the indicator stood at 65.4% for items in pesos and 84.6% for the corresponding items in foreign currency (+2.6 p.p. and –4 p.p. monthly, respectively) (see Graph 11). In terms of the composition of liquidity in national currency, the relative importance of net passes with the BCRA increased during the month. In a year-on-year comparison, ample liquidity (in pesos and in foreign currency) for all financial institutions increased by 1.9 p.p. of total deposits. At the end of June, the BCRA defined a simplification of the Minimum Cash Regime that will be implemented gradually between the months of October and January, seeking to strengthen the transmission channel of monetary policy, with a neutral monetary effect8.
Figure 11 | Liquidity of the financial system
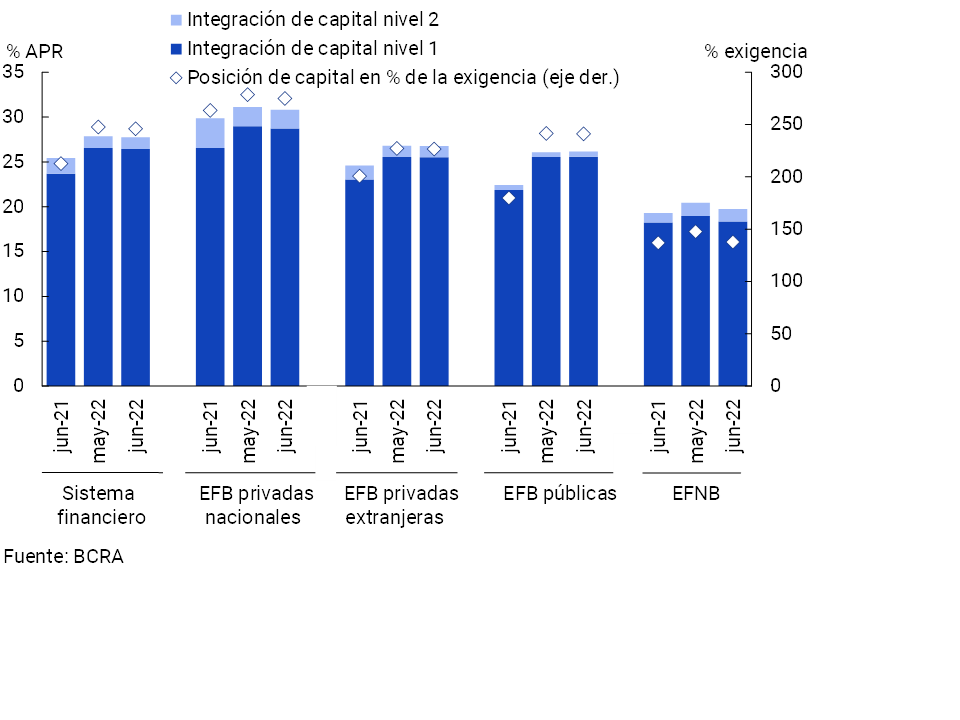
The financial system closed the first half of the year with high levels of solvency. The capital integration (PRC) of the aggregate of entities totaled 27.8% of their risk-weighted assets (RWA), a level similar to the May figure (-0.1 p.p. monthly and +2.3 p.p. y.o.y., see Chart 12). In relation to the composition of the sector’s PRC, more than 95% continued to be explained by Tier 1 Capital, with a greater capacity to absorb potential losses. The integration of regulatory capital continued at levels comfortably above the regulatory requirement, totaling 246% of the regulatory requirement at the aggregate level in the month (-1.8 p.p. monthly and +33.2 p.p. y.o.y.). The ratio between the excess regulatory capital position and the balance of credit to the private sector net of forecasts reached 34.9% at the systemic level in June, well above the historical average of the last 10 years (16%).
Figure 12 | Integration of regulatory capital
By group of financial institutions
With regard to internal capital generation, in the second quarter of 2022 the financial system registered a decrease in profitability indicators both compared to the previous quarter and to the same period of the previous year. Between April and June, comprehensive total results in homogeneous currency accumulated 0.8% y/y of assets (ROA) and 4.9% y/y of equity (ROE) (see Chart 13).
Figure 13 | Comprehensive total profit in homogeneous currency of the financial system
In % of deposits
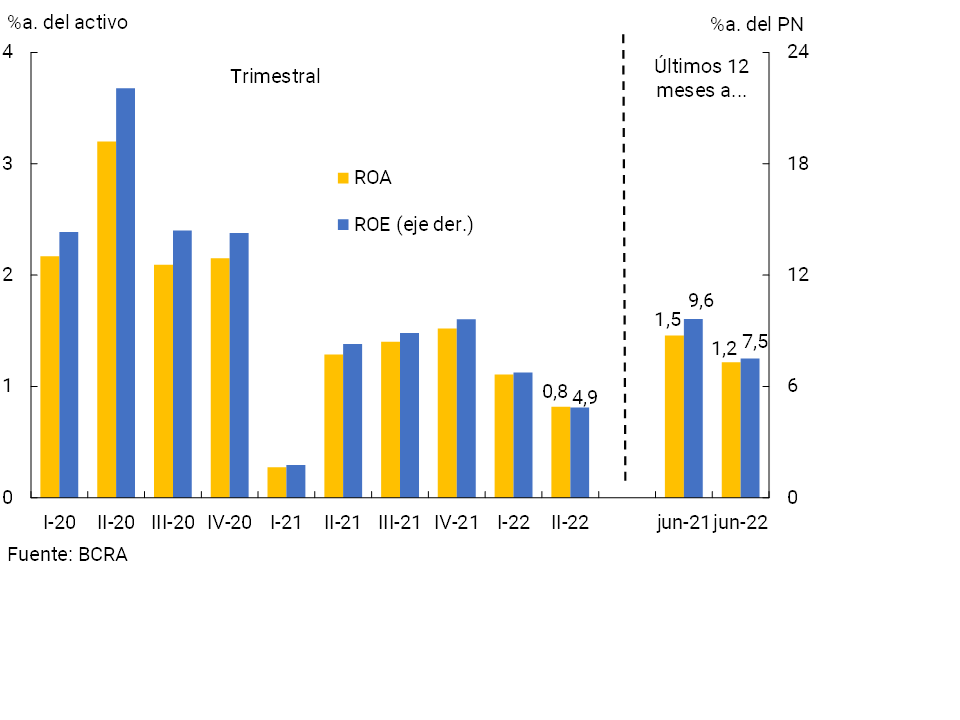
Considering the last 12 months to June, the group of entities accrued an ROA of 1.2% and an ROE of 7.5%, levels lower than those recorded in the same period of 2021 (-0.2 p.p. and -2.1 p.p. of assets and equity, respectively). This decrease reflects the effect of the increase in the cost of funding for deposits in pesos and greater monetary losses. These effects were partly tempered by higher securities revenues.
V. Payment system
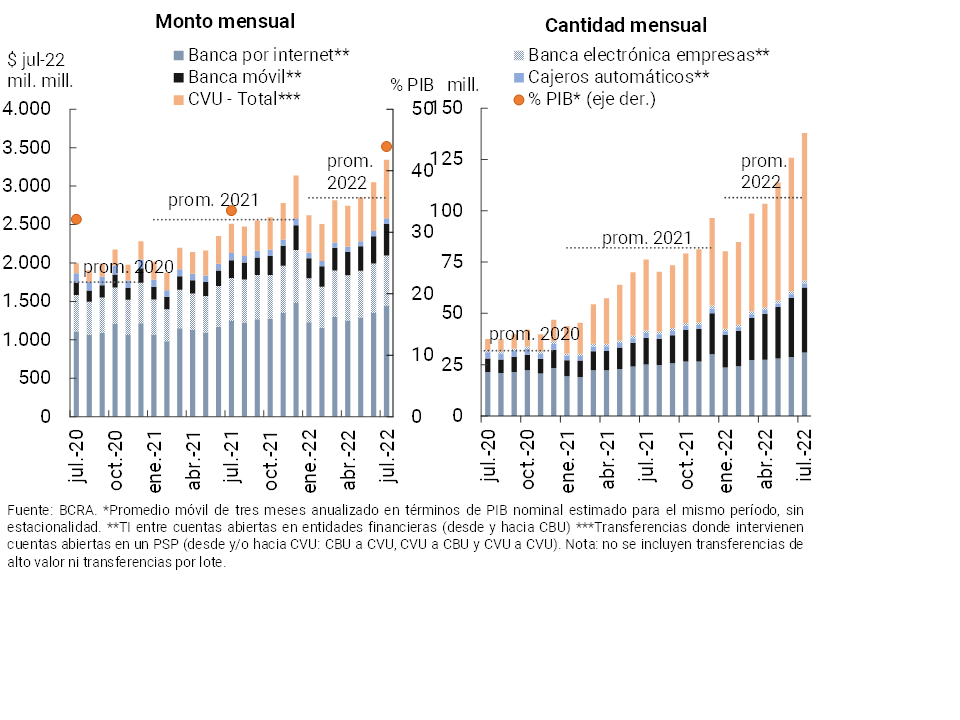
In July, immediate transfers (TI) increased compared to the previous month: 9.6% both in amounts and in real amounts. In year-on-year terms, these operations continued to show significant dynamism: growth of 80.9% YoY in quantities and 33.1% YoY in real amounts. IT between accounts opened in financial institutions (via CBU) expanded 58.1% YoY in amounts and 21.1% YoY in real amounts, highlighting the increase in transactions through Mobile Banking (+143.2% YoY in amounts and +78.1% YoY in real amounts). On the other hand, IT where accounts in payment service providers (PSPs) are involved from and/or to CVU also expanded: 108.5% YoY in quantities and 100.5% YoY in real amounts. In this way, the latter operations increased their participation in total IT: up to 52.1% in quantities (+6.9 p.p. y.o.y.) and 22.8% in amounts (+7.7 p.p. y.o.y.). It is estimated that in July IT accounted for 43.9% of GDP9 (+10.4 p.p. compared to the same month of the previous year, see Graph 14).
Figure 14 | Instant Transfers (TI)
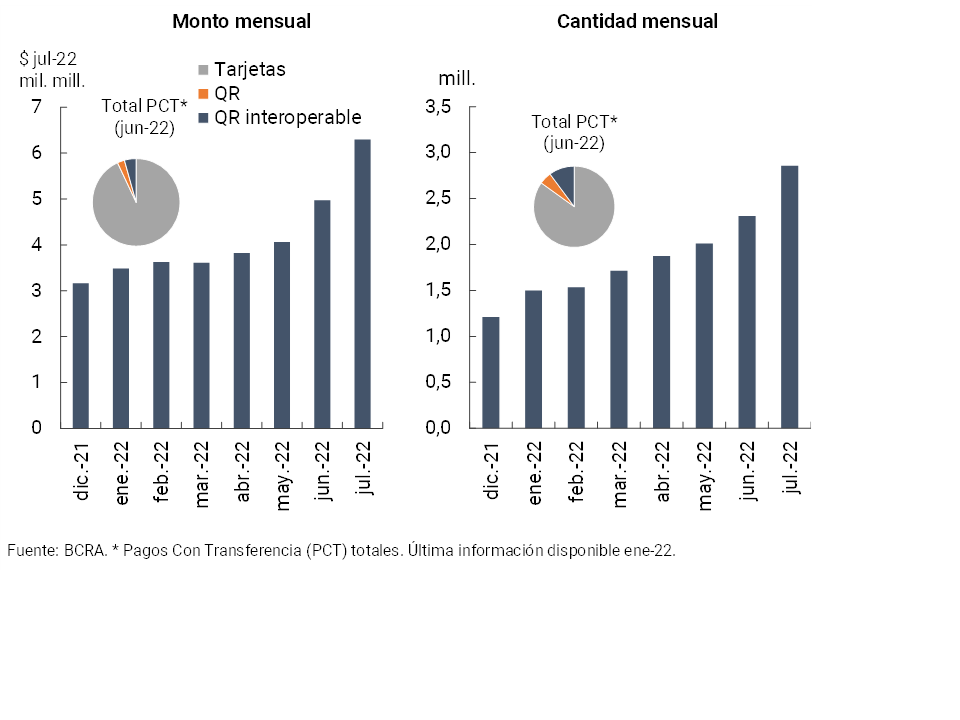
In July, transfer payments (PCT) initiated through interoperable QR codes10 increased significantly compared to the previous month in amounts (+23.7%) and in real amounts (+26.6%, see Chart 15). Since the beginning of the full QR interoperability scheme (end of November 2021), the number of operations under this modality accumulated to July reached 15 million, equivalent to $33,142 million at July 2022 prices.
Figure 15 | Payments by transfer (PCT)
In July, the clearing of checks remained at similar levels compared to the previous month in amounts (+0.3%) and decreased in real amounts (-3.7%). Compared to July 2021, these operations grew 5.8% in quantities and 7.3% in real amounts. Due to their higher relative growth, ECHEQs continued to increase their share of total compensation: in July they represented 29.7% in quantities (+11.5 p.p. y.o.y.) and 54.8% in real amounts (+12.9 p.p. y.o.y.). It is estimated that in the period the amount of cleared checks was equivalent to 25.6% of GDP (+2.4 p.p. y.a.). In July, the ratio of rejection of checks due to lack of funds in terms of the total compensated remained at moderate levels, with a slight decrease compared to the previous month in amounts (-0.01p.p. to 0.66%) and a slight increase in amounts (+0.05p.p. to 0.55%).
Back to top
References
1 Expressed in currency of origin.
2 Includes principal adjustments and accrued interest.
3 To finance unpaid balances on credit cards for consumption over $200, the rate regulated by law for credit cards will be applied. See “Press release” of 07/28/22 and Communication “A” “7559”.
4 Communication “A” “7577” and “Press Release” 11/8/22.
5 Includes forward purchase and sale transactions of foreign currency classified off-balance sheet.
6 When netting the accounting balance of forecasts, this indicator would stand at 29.4% at the aggregate level in June.
7 Part of this year-on-year reduction was explained by the transfer of debtors who were classified as having an irregular situation to off-balance sheet items (irrecoverable), in accordance with current regulations. These transfers did not imply effects on the income statement because the debts were already fully anticipated.
8 For more details, see “Press Release” and Communication “A” “7536”.
9 When considering annualized amounts of the last three months.
10 Within the framework of the Transfers 3.0 scheme, a registry of interoperable wallets was established (for more information, see “BCRA Communication “B” 12333″). The Registry is available on the “website of the Central Bank of the Argentine Republic (BCRA)”.
Share on


