I. Financial intermediation activity
In June, financial intermediation activity with the private sector grew again for the second consecutive month. Taking into account the main variations—measured at constant prices—in the peso balance sheet of the aggregate financial system, in the month the increase in the balance of private sector deposits and the reduction in liquid assets were the most important sources of resources1. As for the most relevant applications of funds in pesos, the real balance of credit to the public and private sectors increased in the period. The foreign currency segment presented a similar performance to that verified in the items in pesos, with increases in both deposits and loans to the private sector.
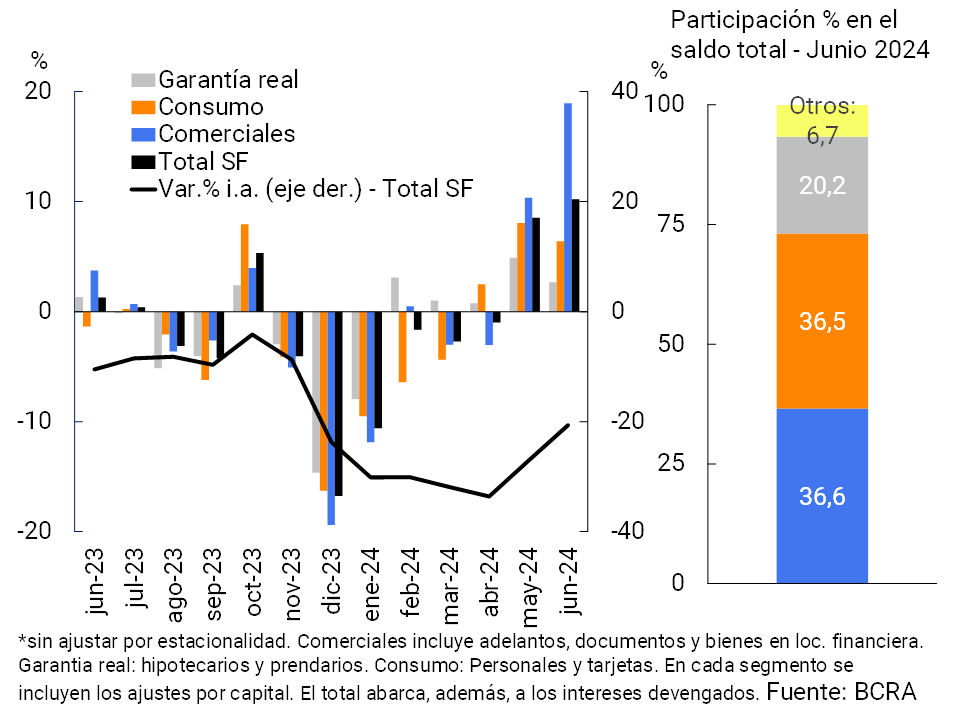
In June, the balance of credit to the private sector in national currency grew by 10.2% in real terms (+15.3% nominal)2. The monthly increase was widespread among groups of financial institutions and was mainly explained by commercial lines and consumer loans (with increases of 18.9% in real and 6.4% in real terms, respectively, see Graph 1)3.
Graph 1 | Credit balance to the private sector in pesos
In real terms*
The balance of financing to the private sector in foreign currency increased 2.5% compared to May, mainly explained by national private banks and public banks4. Title loans and financing through cards verified the largest relative increases in this denomination in month5.
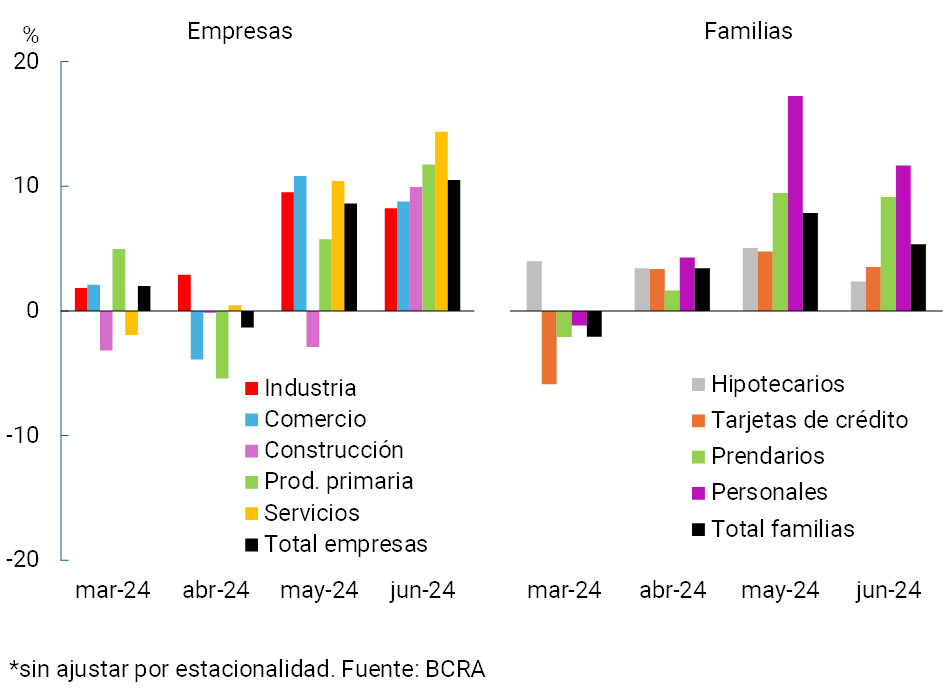
In this scenario, the real balance of total credit (in domestic and foreign currency) to the private sector accumulated an increase of 8.5% in the month (+13.4% nominal). When distinguishing by credit segment6, the total balance of financing to companies grew 10.5% in real terms in June (+15.6% nominal), with a greater relative dynamism of loans channeled to service providers and primary production (see Graph 2). For its part, total financing to households increased by 5.3% in real terms in the month (+10.2% nominal), mainly explained by the performance of personal loans. In a year-on-year comparison, the total credit balance to the private sector fell by 14.1% in real terms.
Graph 2 | Total credit balance to the private
sector Monthly changes in real terms*
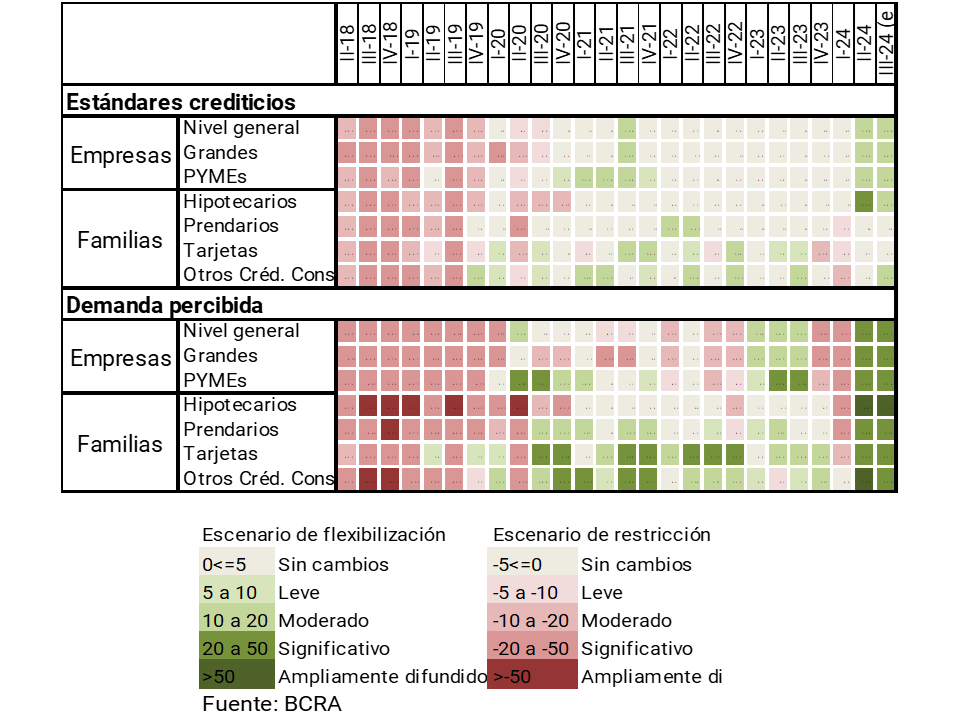
According to the results of the Credit Conditions Survey (ECC) corresponding to the second quarter of the year, the positive performance of credit occurred in a scenario of better credit supply conditions for companies and households (see Table 1). At the same time, the demand perceived by the participating entities also saw an increase in the period. According to the ECC’s results, favorable conditions for the increase in credit would be extended to the third quarter of 2024.
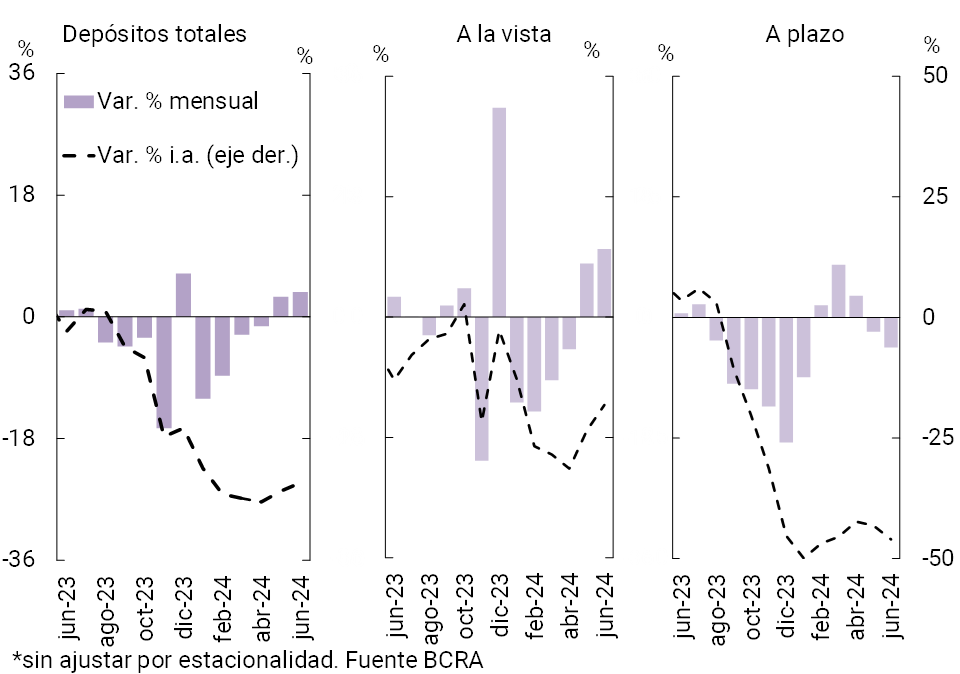
Regarding the funding of the aggregate financial system, in June the real balance of deposits in national currency of the private sector increased 3.7% compared to the previous month (+8.4% nominal). The monthly performance was explained by demand accounts, which grew 10.2% in real terms, partly reflecting the effect of the payment of the half bonus (see Graph 3). When distinguishing by type of segment, the increase in non-interest-bearing demand accounts stood out in the period. For its part, the balance of time deposits in pesos in the private sector fell by 4.5% in real terms (-0.1% nominal), with heterogeneous behavior among the deposit subgroups. In particular, traditional fixed-rate deposits (not adjustable by CER) fell 8% in real terms compared to May, while those denominated in UVA increased by 2.8% in realterms 8.
Graph 3 | Balance of private sector deposits in pesos
In real terms*
In June, the balance of deposits in foreign currency of the private sector increased 1.1% compared to May9. Considering all currencies and sectors, the real balance of total deposits grew 1.5% in real termsin month 10.
II. Evolution and aggregate composition of the balance sheet
In June, the total assets of the financial system grew monthly in real terms for the first time so far this year (2.7%). With this performance, total assets accumulated a year-on-year reduction of 11.3% in real terms.
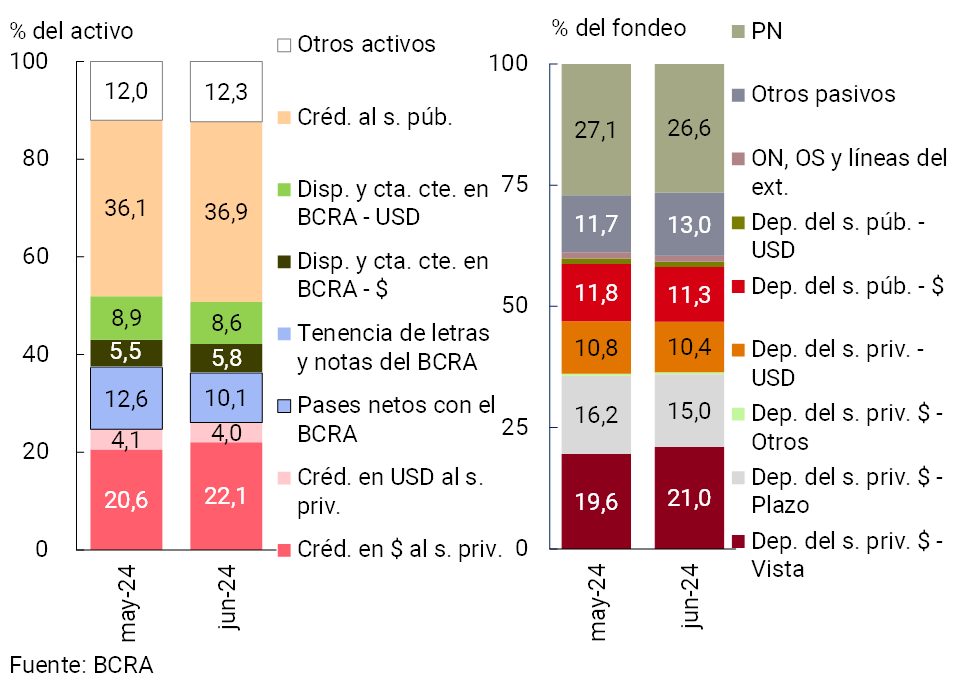
In a context of dynamism of loans in pesos to the private sector (see previous section), in June the weighting of this component in the total assets of all financial institutions increased. In addition, in the monthly comparison, the relative importance of financing to the non-financial public sector increased slightly and the relevance of net passes with the BCRA decreased (see Chart 4)11. On the side of total funding in the sector, the most relevant monthly changes were the increase in the share of demand accounts in pesos of the private sector in the total and the reduction of term placements in the same denomination.
Figure 4 | Composition of assets and funding Financial
system – Participation %
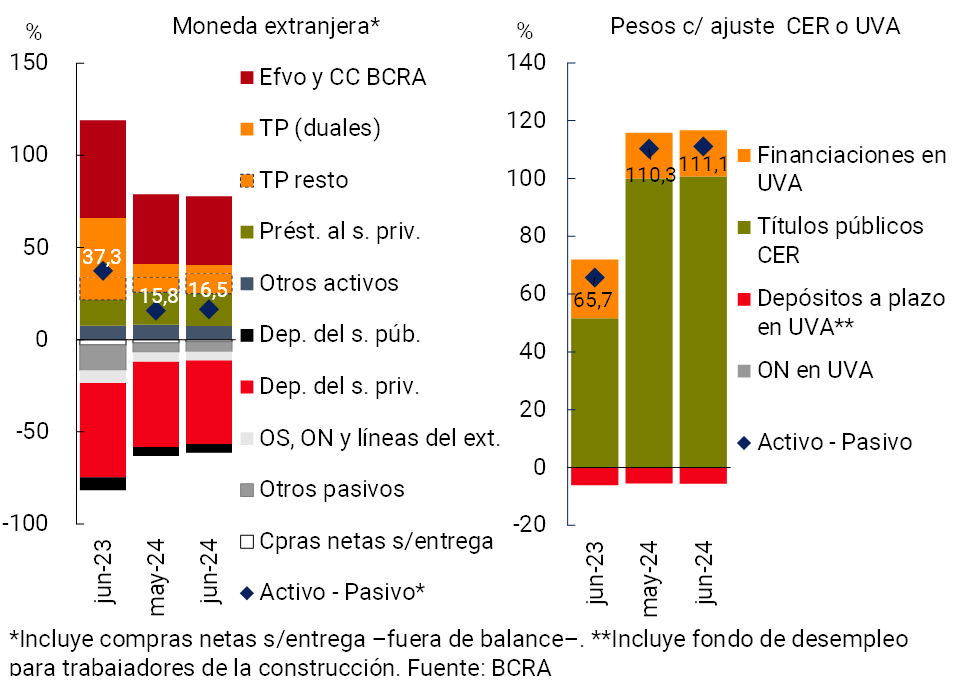
The estimated spread between assets and liabilities of the financial system in foreign currency12 increased slightly in June to 16.5% of aggregate regulatory capital (+0.7 p.p. in the month and -20.9 p.p. y.a., see Chart 5). On the other hand, the estimated spread between assets and liabilities in pesos with capital adjustment by CER (or agreed in UVA) totaled 111.1% of the PRC at the aggregate level in June (+0.8 p.p. monthly and +45.4 p.p. y.o.y.).
Graph 5 | Spread between assets and liabilities
In % of PRC
III. Portfolio quality
The system’s gross exposure to the private sector increased in June, in a scenario in which the real balance of credit to the private sector grew significantly (see Section I), outpacing the real increase in total assets.
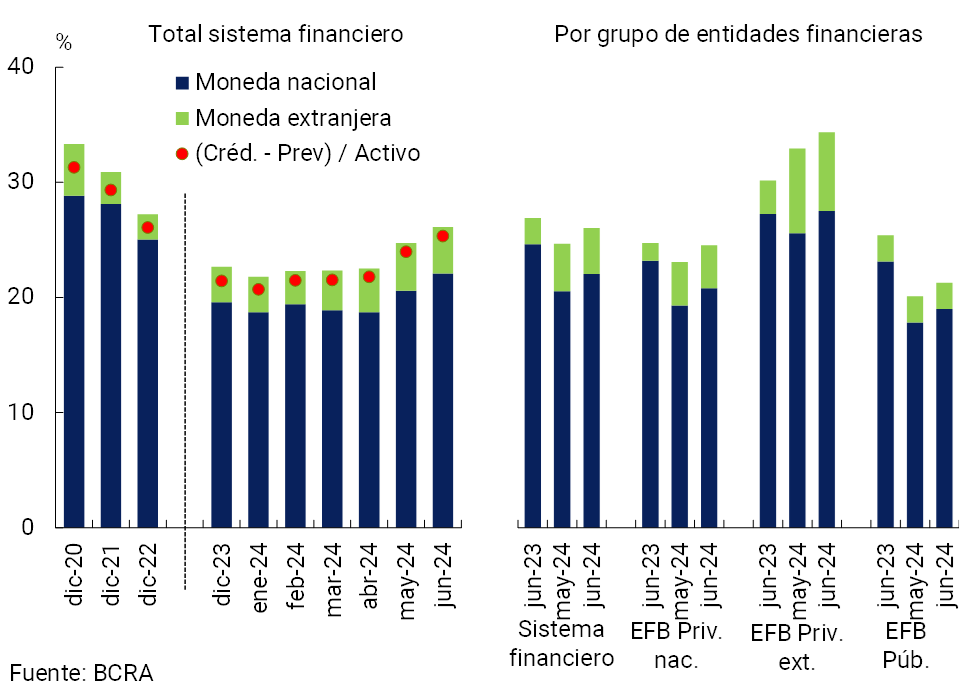
The balance of total financing to companies and households totaled 26.1% of total assets in June, increasing 1.4 p.p. between the peak of the month (-0.9 p.p. y.o.y.; see Figure 6). The monthly performance was generalized among the groups of banks and credit segments (companies and families). Considering only financing in pesos, the ratio reached 22.1% at the systemic level in the period (+1.5 p.p. monthly and -2.6 p.p. y.o.y.). On the other hand, the balance of financing to the private sector in foreign currency stood at 4% of assets (-0.1 p.p. monthly and +1.7 p.p. y.o.y.). When netting the balance of accounting forecasts, the balance of total credit to the private sector weighted 25.3% of assets in the month (+1.4 p.p. monthly and -0.6 p.p. y.o.y.).
Graph 6 | Credit balance to the private sector in terms of assets
The irregularity ratio of credit to the private sector stood at around 1.8% in June, remaining unchanged in the month (-0.1 p.p. compared to May and -1.3 p.p. y.o.y.; see Figure 7). When distinguishing by debtor, in the period the non-performing loan indicator for loans to companies totaled 1% (-0.1 p.p. in the month and -1.9 p.p. y.o.y.). Meanwhile, the NPL ratio of loans to households stood at 2.8% in June (unchanged in the month and -0.5 p.p. y.o.y.)Question 13.
Figure 7 | Irregularity ratio of credit to the private
sector Financial system
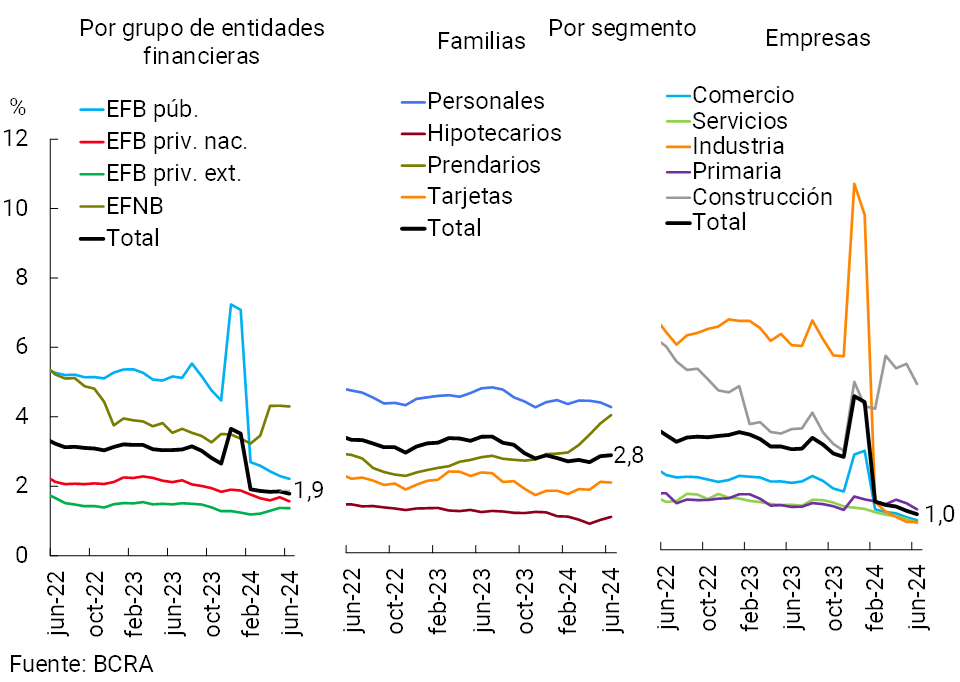
Figure 8 | Financial System Forecasting
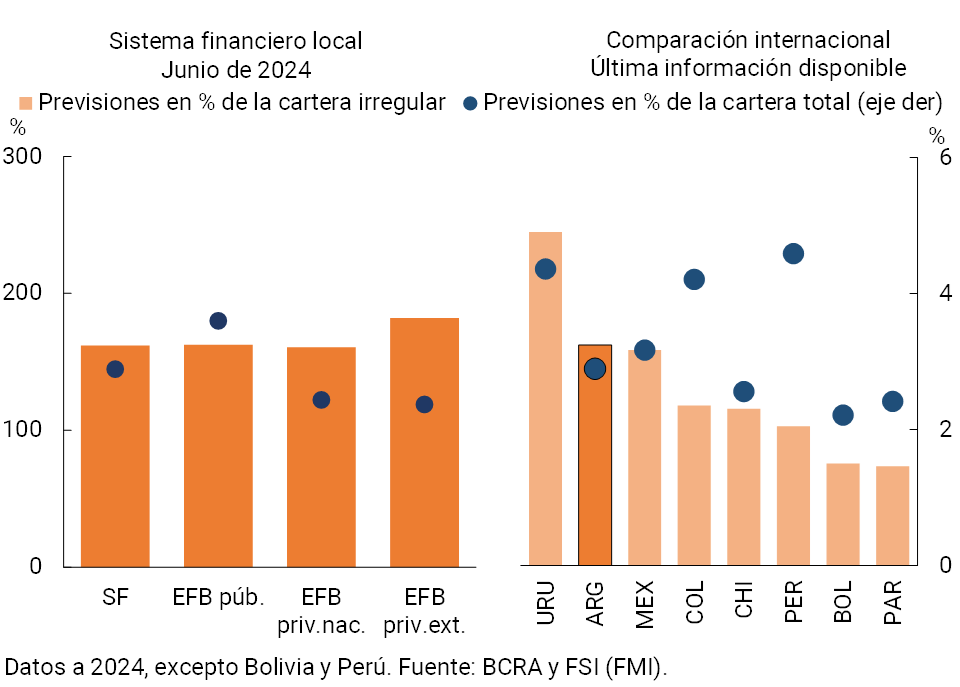
The financial institutions as a whole closed the first half of the year with high levels of forecasting. The balance of accounting forecasts in the financial system was equivalent to 162.1% of the portfolio in an irregular situation (+0.8 p.p. in the month and +35.8% y.o.y.). This level is above that observed in other countries in the region (see Graph 8). For its part, the estimated balance of forecasts attributable to the portfolio in an irregular situation weighted 104% of said portfolio for the aggregate of the system (-1.2 p.p. monthly and +11.6 p.p. y.o.y.)Question 14.
IV. Liquidity and solvency
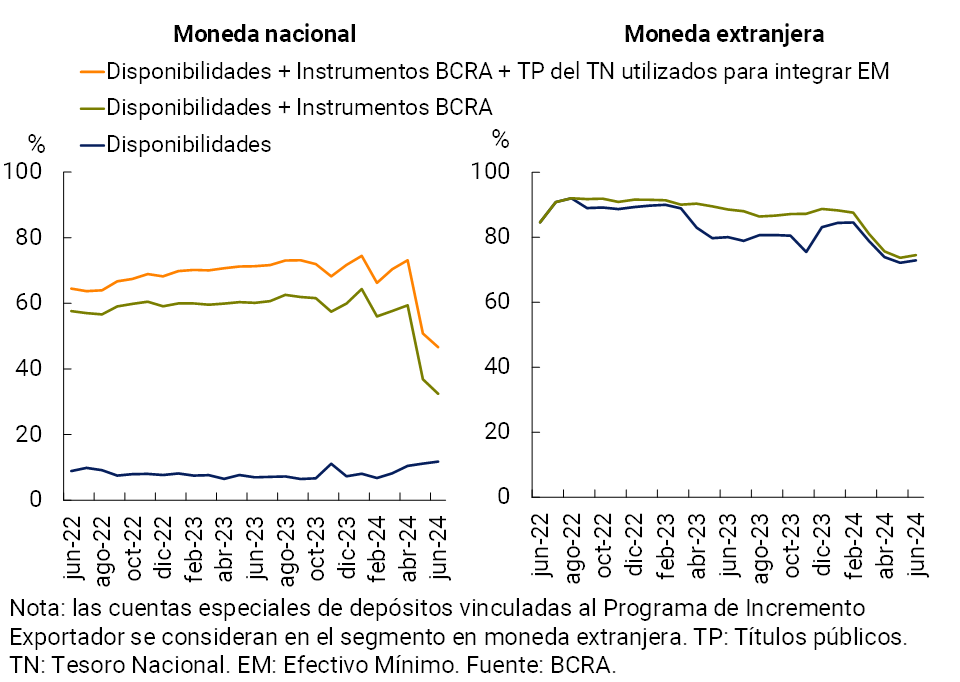
The liquidity indicator that considers the availabilities (cash balances and current accounts in BCRA) in terms of total deposits stood at 23.6% in June (11.8% for items in pesos and 72.9% for items in foreign currency; see Chart 9), increasing 0.3 p.p. in the month and 5.4 p.p. y.y.15 The broad liquidity indicator16 stood at 52.1% in month17 (-3.3 p.p. monthly and -21.9 p.p. y.o.y.), in line with the average record of the last 15 years. Regarding the composition of liquid assets in pesos in the broad sense, in the month the process of dismantling the position of passes of financial institutions continued, while the balance of National Treasury securities computed to integrate Minimum Cash and that of the current accounts that entities have in the BCRA increased slightly.
Graph 9 | Liquidity
indicators Financial system – As % of deposits
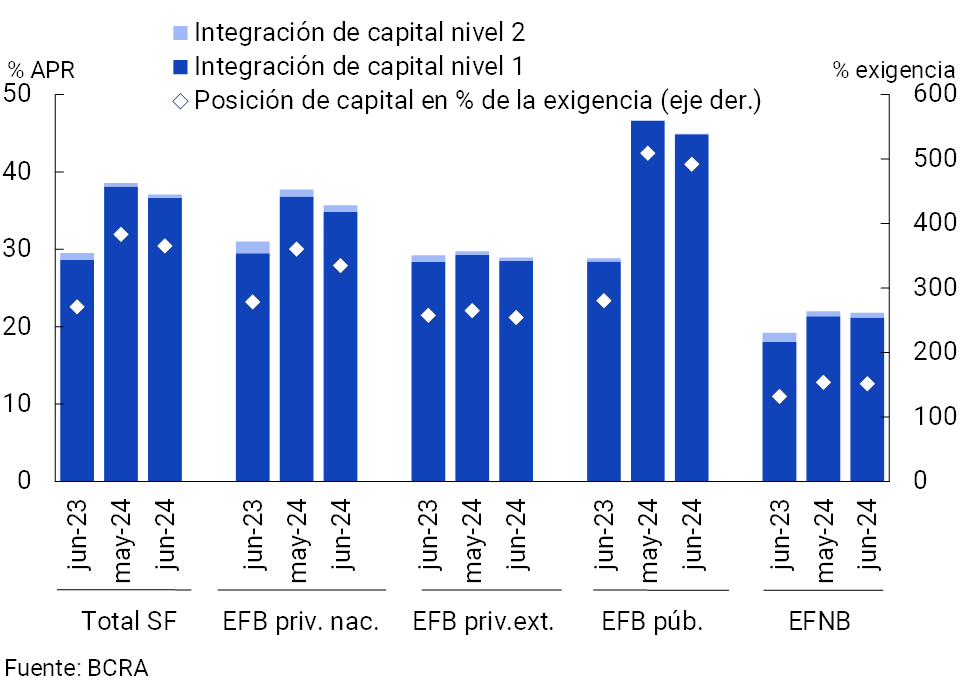
In June, the integration of regulatory capital (RPC) of the aggregate of entities stood at 37.1% of risk-weighted assets (RWA), 1.5 p.p. below the May figure (+7.5 p.p. y.o.y., see Chart 10). The monthly dynamics of this indicator occurred in a context of an increase of 4.6% in real terms in RWAs, in line with the positive performance of credit to the private sector in the period, and of 0.6% in real terms in the PRC. In June, excess regulatory capital (CPR minus minimum regulatory requirement) totaled 365.4% of the regulatory requirement at the systemic level and 68.9% of the balance of credit to the private sector net of provisions, well above the average of the last 10 years (24.6%).
Figure 10 | Capital Integration (RPC)
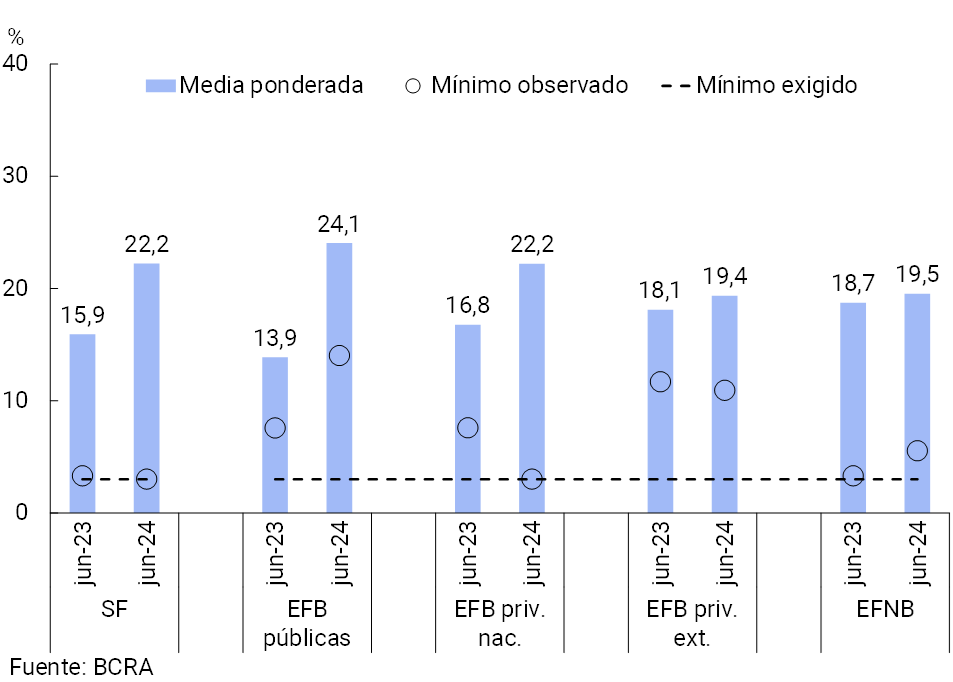
At the end of the second quarter of the year, the leverage ratio18 amounted to 22.2% for the financial system as a whole, 0.3 p.p. and 6.3 p.p. above the figure for the previous quarter and the one verified a year ago, respectively (see Chart 11). In addition, all entities verified a level higher than the regulatory minimum established at 3%.
Figure 11 | Leverage
ratio – Tier 1 capital in terms of a broad measure of exposure.
Considering the accumulated of the last 12 months to June, the total comprehensive result in homogeneous currency of the financial system was equivalent to 7% of assets (ROA) and 30% of equity (ROE). These indicators increased in a year-on-year comparison, with public banks being the group that presented the highest relative growth (see Chart 12).
Figure 12 | ROA by group of entities
Cumulative 12 months
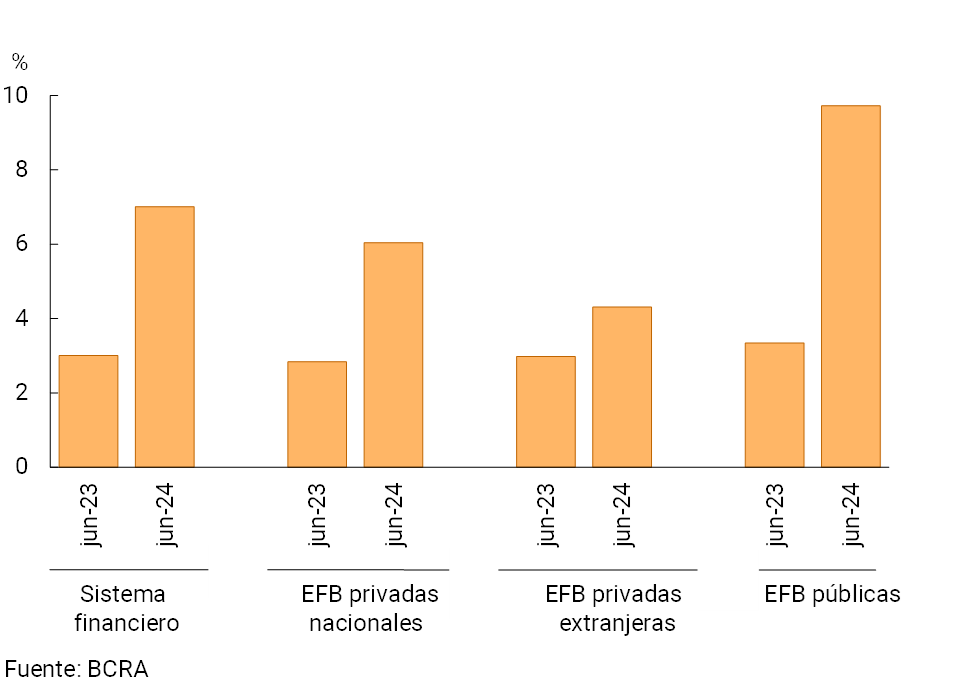
With respect to the components of the income statement, the year-on-year increase in the profitability of the aggregate financial system in the last 12 months was basically driven by a higher financial margin, which was partially offset by higher losses due to exposure to monetary items and by more tax expenses and administrative expenses.
V. Payment system
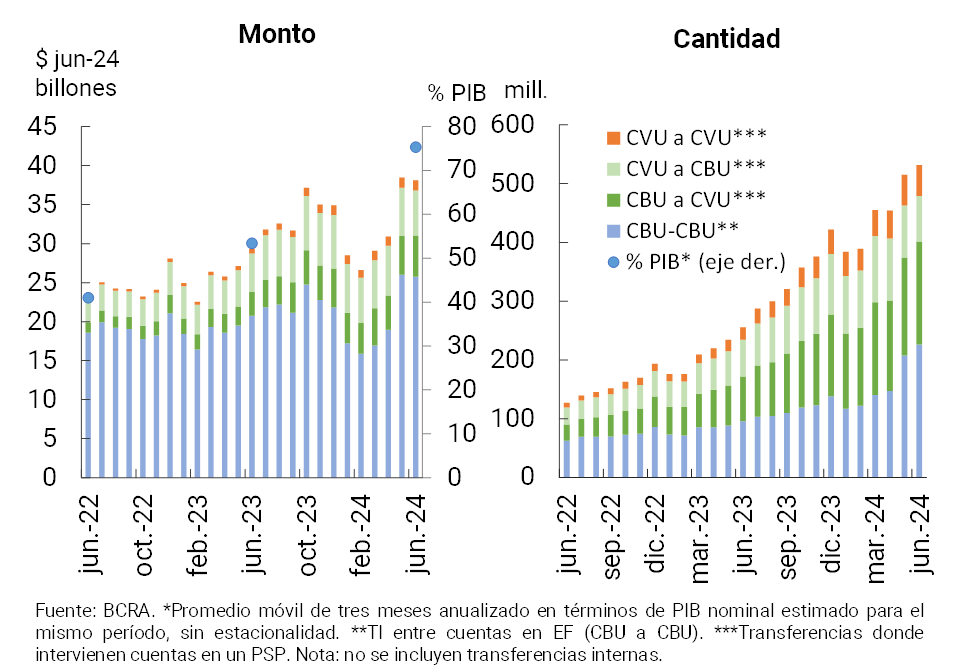
In June, immediate transfers (TI) had a mixed behavior, with an increase of 3.2% in quantities and a slight decrease of 0.6% in real amounts compared to the previous month (see Graph 13)19. In year-on-year terms, IT showed strong growth, doubling in quantity (+107.9%) and increasing 32.3% in real terms in amounts. This year-on-year dynamism in the number of transactions was mainly driven by transactions between accounts in financial institutions (CBU to CBU, with a better relative performance of mobile banking and internet banking channels) and in those between accounts in payment service providers CVU to CVU)20 21. During the last year, IT became more important with respect to the level of aggregate production: it is estimated that the total volume of IT in the last three months (annualized) represented approximately 75.3% of GDP, increasing 21.9 p.p. compared to the same period of the previous year.
Chart 13 – Immediate Transfers (IT)
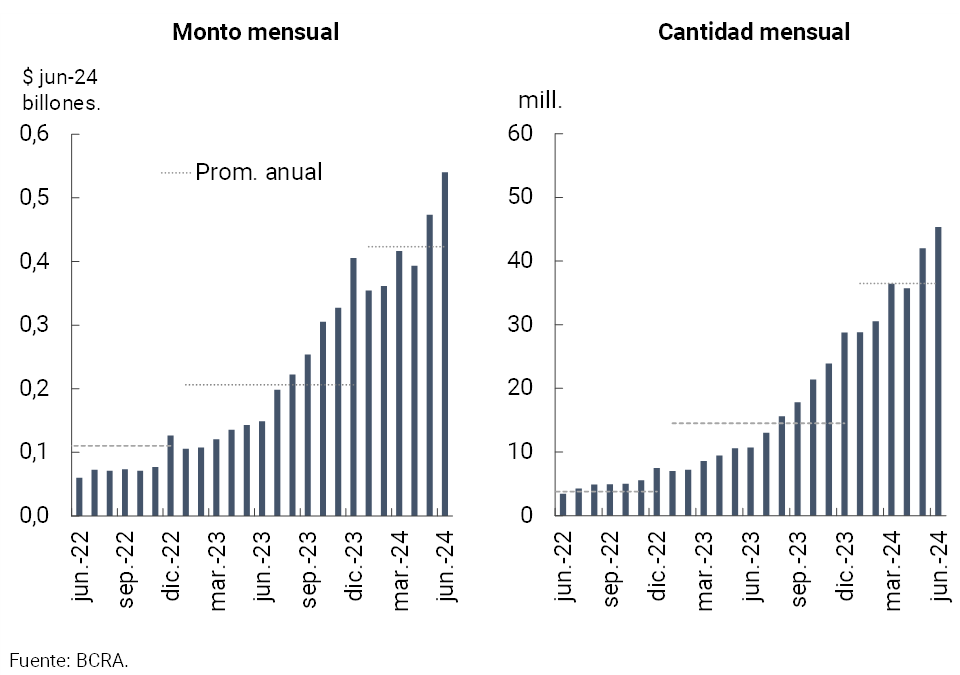
Among interoperable transfer payments (PCT), in June those made through QR codes grew 7.8% in amounts and 14.1% in real amounts, reaching a year-on-year increase of 322.9% in amounts and 263.4% in real values (see Chart 14)22. Comparing the modalities of PCT, the use of QR has surpassed the use of POS terminals. This performance is in line with the implementation of interoperability in digital wallets. This advance, promoted by the BCRA, has facilitated a greater use of digital payments, benefiting both businesses and users.
Figure 14 | Payments with transfer (PCT) through interoperable QR codes
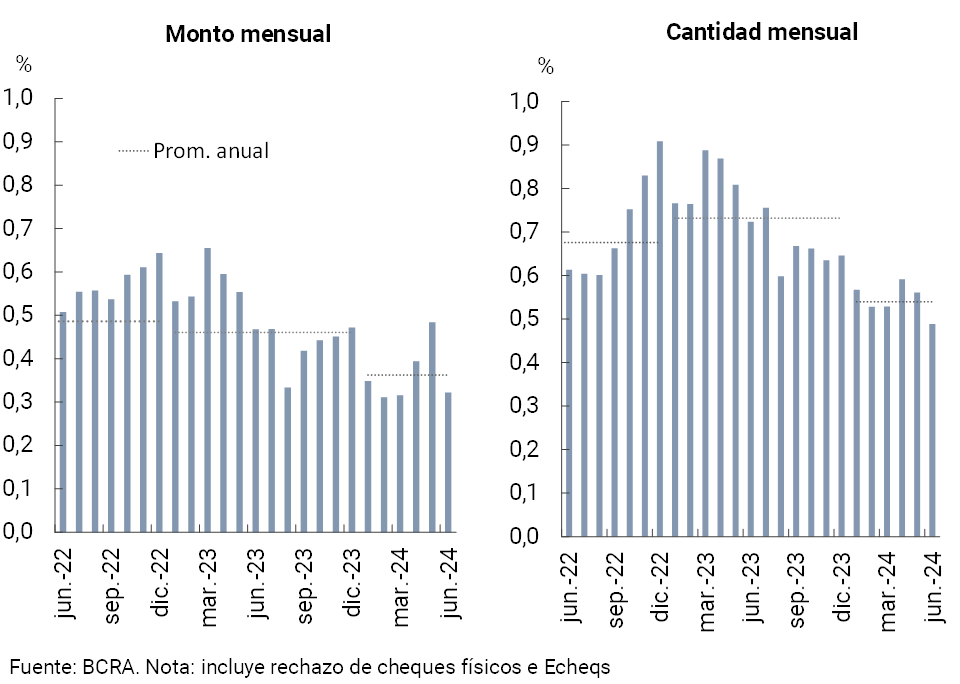
During the month, the clearing of checks decreased 12.8% in amounts and 10.8% in real values23. Despite this decrease, ECHEQs continued to gain ground in total compensation, concentrating 47.3% of total operations in quantities (+9.2 p.p. y.o.y.) and 74.1% in real amounts (+10 p.p. y.o.y.). As for the quotient between the rejection of checks due to lack of funds and the total compensated, in June there was a reduction of 0.07 p.p. in amounts (standing at 0.49%, see Graph 15), and 0.16 p.p. in values (reaching 0.32%).
Figure 15 | Bounce rate for non-funded checks – In terms of total compensated
References
1 The reduction in liquidity in pesos was mainly explained by the decrease in the balance of passes with the BCRA within the framework of the new Administration’s strategy to make progress in cleaning up the BCRA’s balance sheet. Part of this decrease was offset by increased LECAP holdings.
2 Includes principal adjustments and accrued interest.
3 In June, the balance of credit in pesos to the private sector decreased by 20.6% YoY in real terms.
4 In currency of origin.
5 The balance of credit in foreign currency to the private sector increased by 63.3% YoY – in the currency of origin – at the aggregate level.
6 Financing to companies is defined here as that granted to legal entities and commercial financing granted to natural persons. On the other hand, loans to families are considered to be those granted to individuals, unless they are for commercial purposes.
7 Diffusion indices (IDs) are constructed by weighting the responses both according to the participation of each institution in the credit, as well as by the intensity of the response. For more detail, see ECC.
8 In year-on-year terms, the balance of private sector deposits in pesos fell by 34.1% in real terms.
9 In currency of origin.
10 In a year-on-year comparison, the balance of total deposits (all currencies and sectors) accumulated a fall of 23.3% in real terms.
11 In line with the new framework that promotes the management of short-term liquidity through National Treasury securities to replace the BCRA’s interest-bearing liabilities.
12 Includes off-balance sheet foreign currency forward purchase and sale operations. Liabilities include deposits that have variable remuneration depending on the evolution of the exchange rate – associated with the Export Increase Programme – and LEDIV are included in assets.
13 The ratio of irregularity of UVA financing to families also remained unchanged in magnitude in the period, standing at 1% in the month. In particular, the default indicator for UVA mortgage loans to families stood at 0.9% (the mortgage segment accounted for 89% of the balance of UVA loans to households).
15 The growth observed – the indicator in national currency that includes only availabilities increased by 4.5 p.p. of deposits in the first half of the year – is largely explained by the modifications introduced in the minimum cash regulations. For more details, see the ordered text of Minimum Cash.
16 It considers availabilities (cash and current account at the BCRA), BCRA instruments, and the balance of the types of public securities that the entities compute as part of the Minimum Cash.
17 When adding that LECAP holding with a residual term of less than 3 months that is not used to integrate EM, the ample liquidity ratio in June would amount to 66% of deposits for the financial system as a whole.
18 Defined according to Basel Committee guidelines as Tier 1 Capital in terms of a broad measure of exposure.
19 The amount of IT carried out in the month was distributed as follows: 33.0% of CBU to CVU (representing 14.2% of the total amount), 14.6% of CVU to CBU (corresponding to 15.4% of the total amount), 9.9% between CVU (not including those made between accounts of the same PSP, representing 3.5% of the total amount) and 42.4% for those that originate from and reach CBU accounts (excluding those made between accounts of the same financial institution, representing 66.9% of the total amount).
20 Compared to the same period in 2023, the number of transfers from CBU to CBU grew 137% (+27.2% in real amounts), 129.4% from CBU to CVU (+73.6% in real amounts), 24.0% from CVU to CBU (+16.8% in real amounts) and 147.7% between CVU (+117.9% in real amounts).
21 In June, the average value of IT was $70,474 ($111,163 for IT between CBU, $24,938 for IT between CVU, $30,214 for CBU to CVU, and $74,266 between CVU and CBU).
22 In June, interoperable QR transactions averaged $11,917.
23 In the month, the average amount of cleared checks was $2,304,485 ($1,129,866 in the physical format and $3,614,585 in ECHEQs).
Share on


