I. Financial intermediation activity
Financial intermediation activity with the private sector declined in September. According to the main variations in the balance sheet of the financial institutions as a whole for the segment in local currency —at constant prices—, on the side of the estimation of sources of funds, in the period the balances of liquidity in the broad sense and financing to the private sector were reduced and public sector deposits increased. On the other hand, seeking to approximate the application of funds for the period, the real balance of private sector deposits decreased during the month, and to a lesser extent, credit to the public sector increased1.
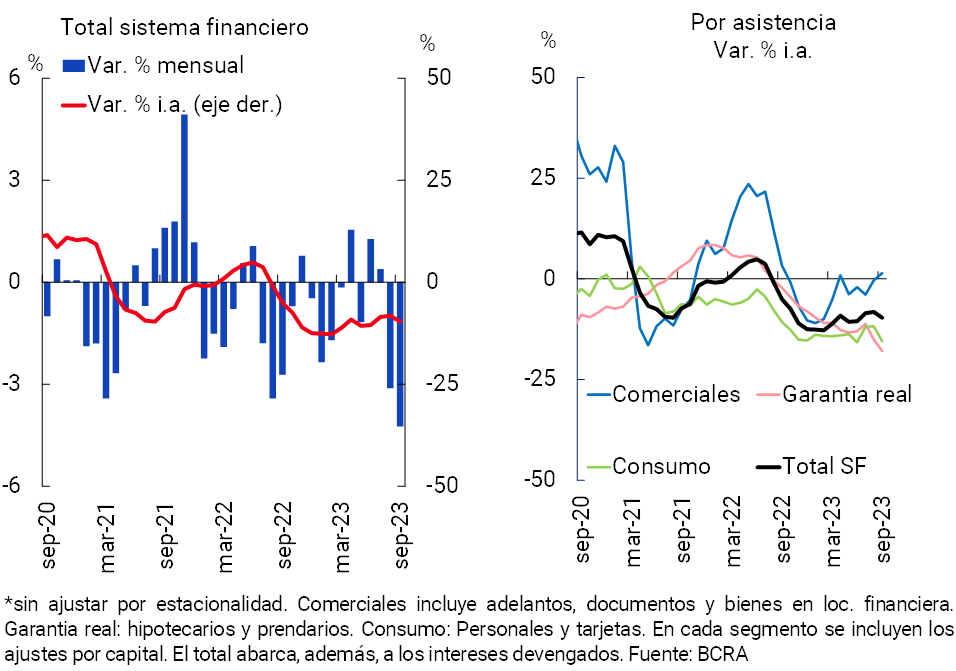
In September, the real balance of credit in pesos to the private sector fell 4.2% compared to the previous month (see Chart 1). The fall in the month was reflected in all groups of financial institutions and credit assistance2. In year-on-year terms, the balance of financing in pesos to the private sector decreased 9.7% in real terms. When distinguishing by credit segment, there was a mixed behavior in the last twelve months: a slight increase in the real balance of commercial lines, within the framework of the stimulus programs implemented by the BCRA, and falls in the rest of the assistance.
Graph 1 | Credit balance to the private sector in pesos
In real terms*
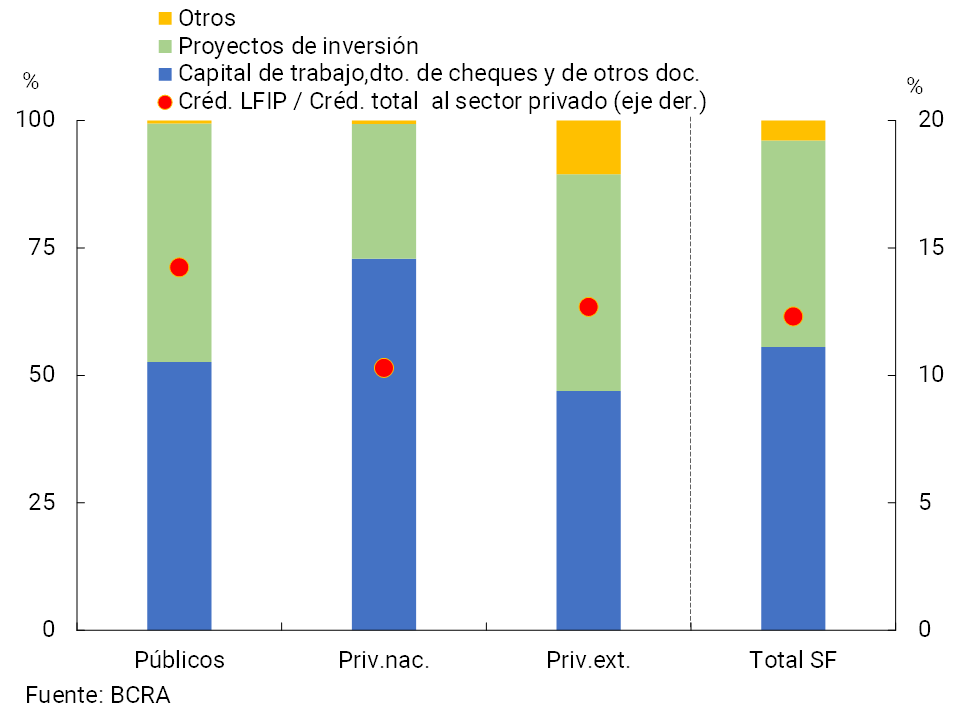
In order to continue providing facilities for the development of MSMEs, in September the BCRA renewed the Financing Line for Productive Investment of MSMEs (LFIP)3. In the first month of the new quota, more than $781,500 million were disbursed, thus accumulating more than $8.7 trillion since the beginning of this instrument (October 2020). The estimated balance of the LFIP as of September totaled $2 trillion, representing 12.3% of the total credit balance to the private sector. More than 40% of this estimated balance corresponded to investment projects, with a greater relative weighting of the financing channeled by public financial institutions (see Graph 2).
Graph 2 | Estimated balance of the Financing Line for Productive Investment in MSMEs (LFIP) – In % of total balance – In % of total balance
Based on the responses obtained by the participating banks in the latest Credit Conditions Survey (CCS), the performance of financial intermediation activity in the third quarter occurred in a scenario in which credit standards associated with loans to companies tended to remain unchanged in magnitude compared to the previous quarter. Meanwhile, in the third quarter, the demand for credit perceived by entities showed a slight bias towards an increase in all sizes of companies (mainly in SMEs). As for the segment of loans to households, in the third quarter of the year in all the entities participating in the CCP there was a moderate bias to the increase in the perceived demand for cards, with some flexibility in the credit standards for this line together with a restrictive bias in its terms and conditions.
With regard to the foreign currency segment, in September the balance of credit to the private sector remained unchanged compared to August (in currency of origin). The balance of total loans (in domestic and foreign currency) to the private sector fell 4.9% in real terms compared to August, accumulating a year-on-year drop of 8.6% in real terms.
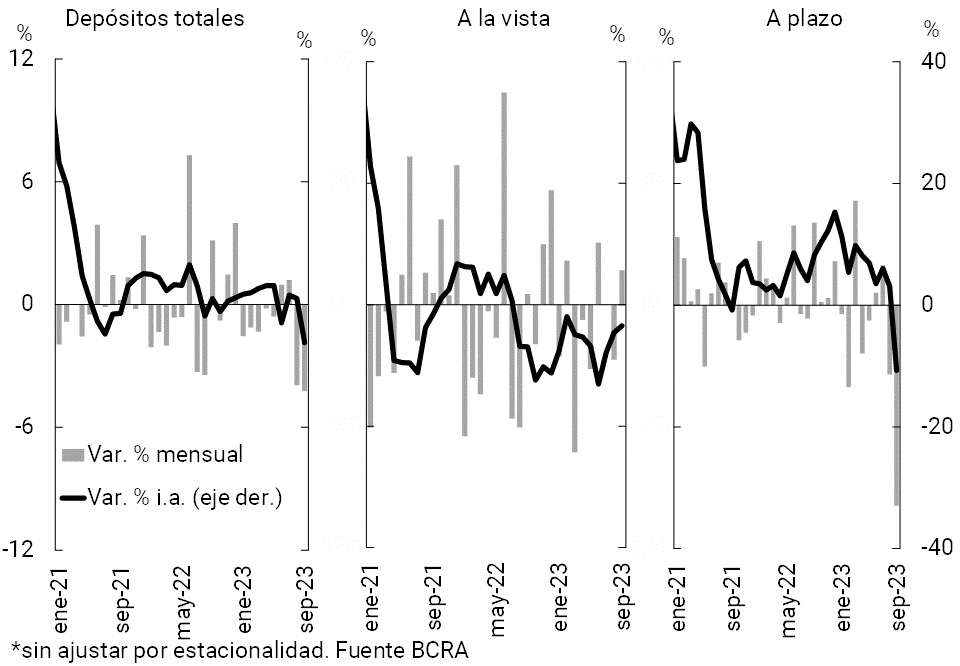
In the month, the balance of private sector deposits in pesos decreased by 4.4% in real terms, explained by the performance of time deposits (see Chart 3).
Graph 3 | Balance of private sector deposits in pesos
In real terms* – Sistema financiero
In order to preserve savings in pesos and limit the financial volatility of the electoral period, in October the BCRA raised the interest rate of the LELIQ to 28 days, as well as the minimum guaranteed interest rate on the fixed terms of individuals up to $30 million (at 133% TNA)4. For the rest of the private sector’s fixed-term deposits, the minimum guaranteed interest rate was set at 126% TNA.
In September, the balance of deposits in foreign currency of the private sector decreased 0.4% compared to the previous month5. Thus, the real balance of total private sector deposits (in domestic and foreign currency) accumulated a reduction of 5.6% in the month.
In year-on-year terms, the real balance of deposits in pesos in the private sector fell 6.2% in September. In this context, the total balance of deposits (considering all currencies and sectors) decreased by 5.4% in real terms at the systemic level.
II. Evolution and aggregate composition of the balance sheet
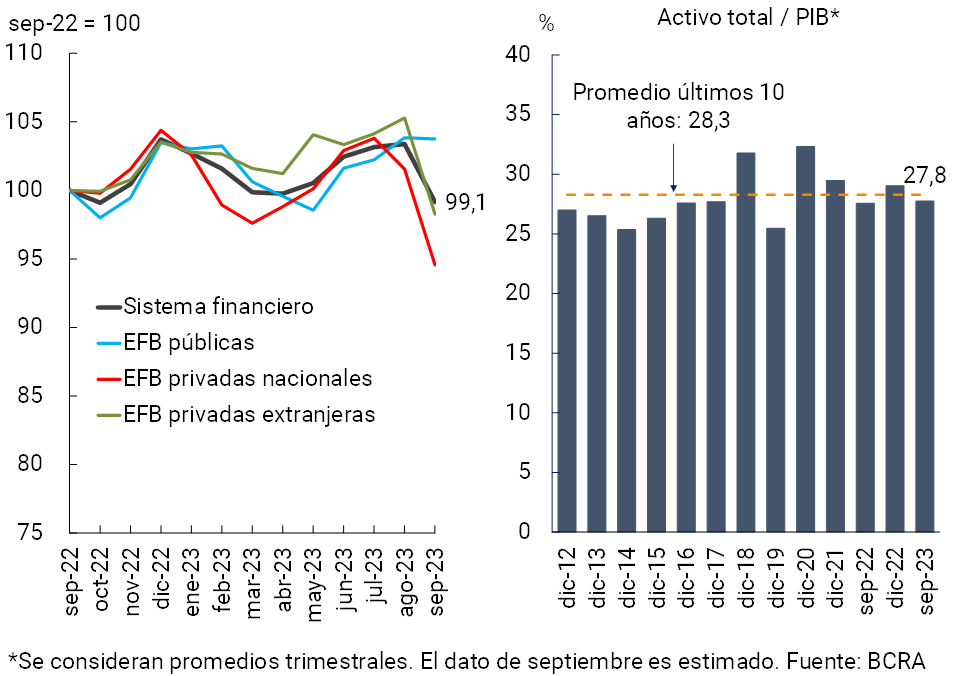
In September, the size of the balance sheet of the aggregate financial system was reduced. The balance of total assets of the sector fell 4.1% in real terms in the month, a performance mainly explained by private financial institutions (see Chart 4). In the last 12 months, total assets accumulated a slight reduction in real terms, with mixed performances among groups of financial institutions: decrease in private banks and increase in public banks. In this context, it is estimated that total assets represented 27.8% of GDP at the end of the third quarter of the year, similar to the level observed a year ago, and slightly below the average of the last 10 years (28.3%).
Figure 4 | Total assets in real
terms Financial system
In terms of the composition of the total assets of all financial institutions, in September there was a decrease in the share of the availabilities and current accounts that the entities have in the BCRA, while credit to the public sector increased its weight in the total. In relation to the components of the sector’s funding, the weighting of time placements in pesos by the private sector and deposits in foreign currency by the sector decreased during the month, while the relative importance of demand accounts in pesos of the private sector, deposits in pesos of the public sector and net worth increased (see Chart 5).
Graph 5 | Composition of assets and funding Financial
system – Participation %
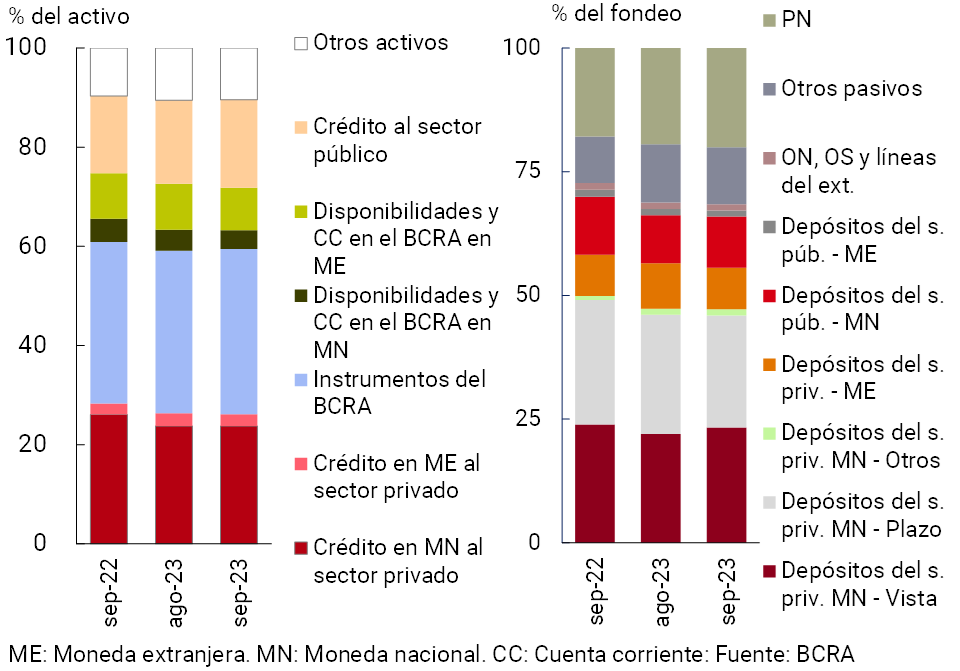
In the month, the estimated spread between assets and liabilities denominated in foreign currencystood at 39.3% of regulatory capital (RPC) for the sector aggregate, slightly below last month’s record. The financial intermediation of the aggregate of entities with the private sector in foreign currency continued to be at limited levels and without implying imbalances for the system. This scenario reflects the effect of macroprudential measures implemented after the local financial crisis of 2001-2002. In particular, the regulation that limits the application of the lending capacity of deposits in foreign currency only to debtors whose income correlates with the exchange rate, as well as the provision that defines that the lending capacity derived from deposits in that denomination not applied to loans is held in accounts available at the BCRA. Thus, at the end of the third quarter of the year, private sector deposits in foreign currency reached only 8.4% of the system’s total funding, loans to the private sector approximately 2.4% of total assets, and liquidity in that denomination 8.6% of total assets. For its part, in the period it is estimated that the mismatch between assets and liabilities in pesos with CER adjustment clause (and in UVA) totaled 64% of the PRC at the systemic level, 1.5 p.p. more than in August (+7.4 p.p. y.o.y.).
III. Portfolio quality
The weighting of the total credit balance to the private sector in the assets (gross exposure) of all financial institutions totaled 26.1% in September, falling by 0.2 p.p. in the month (see Chart 6). In relation to financing in pesos, this indicator reached 23.8% in the period (without significant changes in the month), while the share of credit to the private sector in foreign currency stood at 2.4% of assets (-0.2 p.p. monthly). If the balance of forecasts is deducted, in September financing to the private sector amounted to 25.1% of assets.
Graph 6 | Credit balance to the private sector in terms of assets
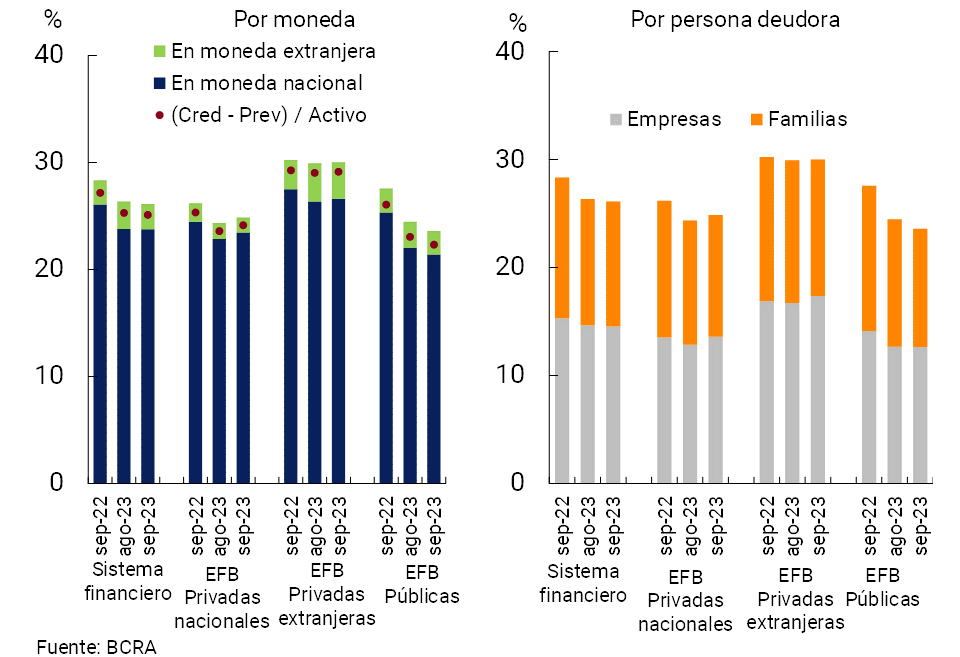
Figure 7 | Irregularity ratio of credit to the private
sector Financial system
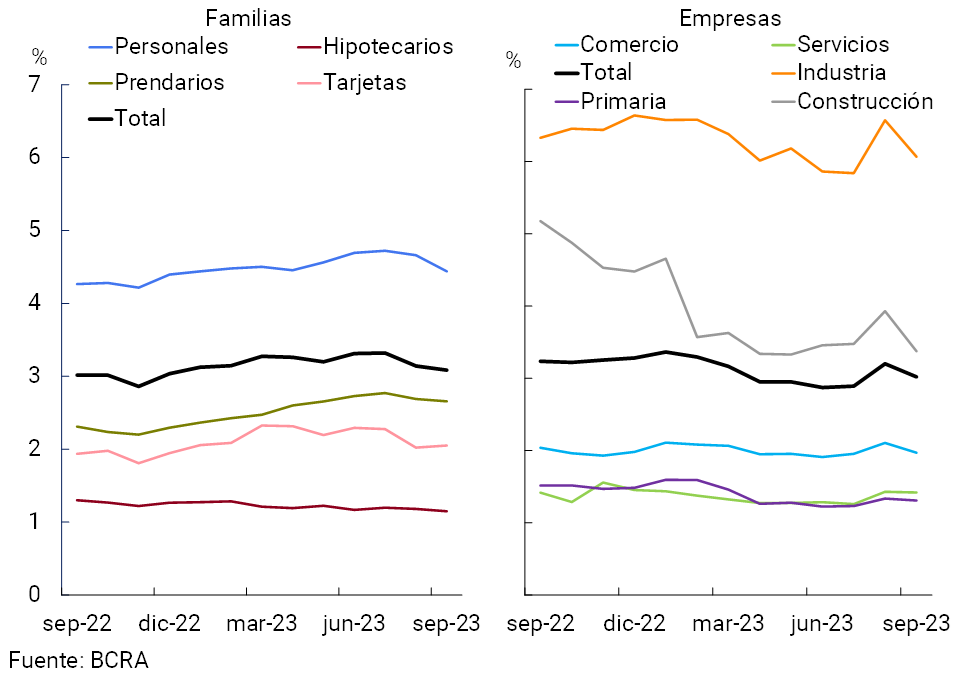
In September, the irregularity ratio of credit to the private sector stood at 3%, with no changes in magnitude compared to the August figure and in a year-on-year comparison. When distinguishing by debtor, in the month the indicator of delinquency of credit to families stood at around 3.1% (see Graph 7). For its part, the indicator of irregularity of loans to companies totaled 3%.
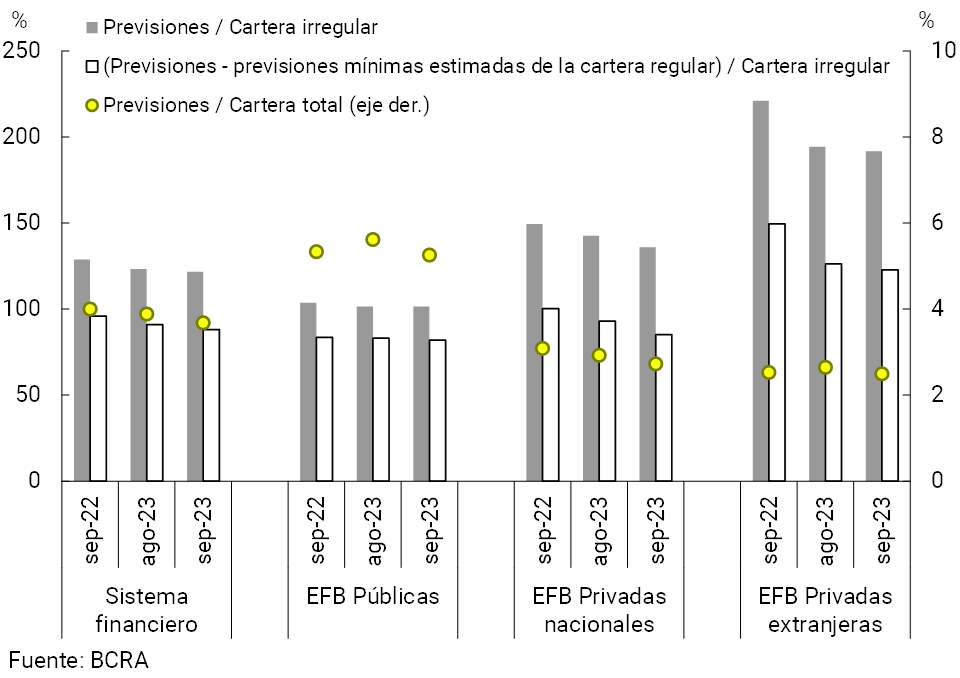
Forecast levels remained elevated in September. The forecasts accounted for by the aggregate financial system totaled 3.7% of total credit to the private sector in the period, falling by 0.3 p.p. in the last twelve months (see Chart 8). The balance of forecasts represented 121.8% of the portfolio in an irregular situation at the systemic level, 1.5 p.p. below the value of August and 7.1 p.p. less than the level of a year ago. For its part, in the month the balance of forecasts attributable to the portfolio in an irregular situation totaled 88.1% of said portfolio7.
Figure 8 | Credit balance and forecasts (private sector)
IV. Liquidity and solvency
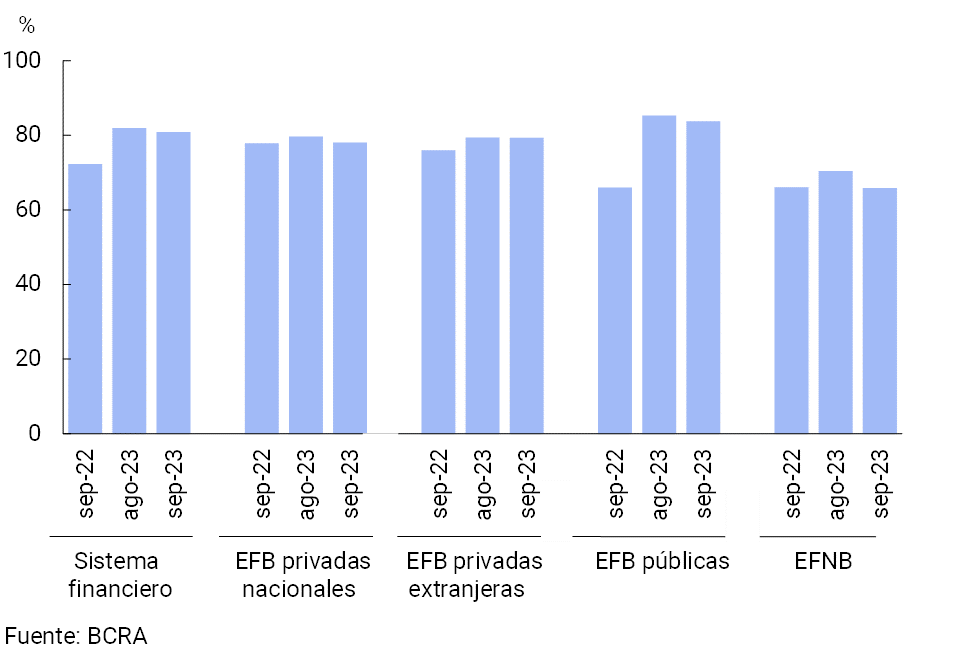
From high levels, the liquidity of the financial system was slightly reduced in September. In the month, liquid assets in the broad sense8 totaled 80.9% of deposits at the systemic level (79.8% for items in pesos and 86.7% for those in foreign currency), 1.1 p.p. less than the level at the end of August (see Chart 9). The monthly reduction in this ratio was explained by the segment in national currency and mainly associated with a lower holding of BCRA instruments. In a year-on-year comparison, the broad liquidity ratio of the financial system increased by 8.5 p.p. of deposits (+10.7 p.p. for the indicator in pesos and -5.1 p.p. for foreign currency). At the end of the third quarter, all groups of institutions maintained comfortable liquidity indicators (see Chart 10).
Graph 9 | Liquidity of the financial
system As a % of deposits
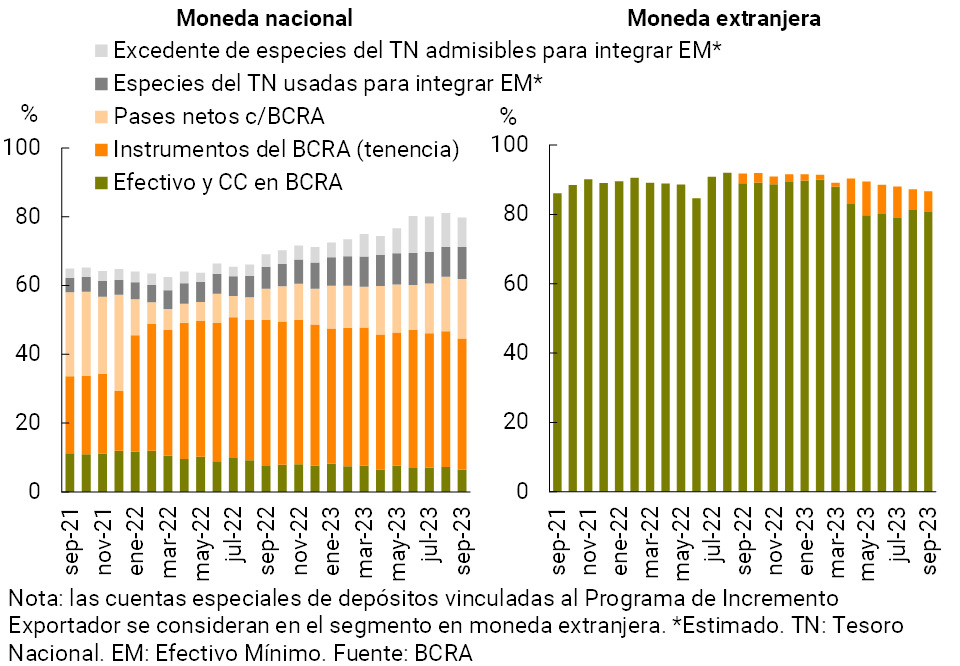
Figure 10 | Broad liquidity ratio by financial institution (domestic and foreign currency)
The solvency indicators of the financial system continued at high levels, both from a historical perspective and in an international comparison. In September, the capital integration (RPC) of the financial system totaled 31.1% of risk-weighted assets (RWA), 1.4 p.p. and 2.4 p.p. higher than the figure for last month and September 2022, respectively (+11.5 p.p. compared to the average of the last 10 years). It should be noted that 98.2% of the financial system’s PRC is made up of Tier 1 capital, a segment with the greatest capacity to absorb potential losses. In the same vein, the capital position (RPC – regulatory requirement) of the aggregate group of institutions stood at around 289% of the capital requirement and 49.6% of credit to the private sector net of provisions.
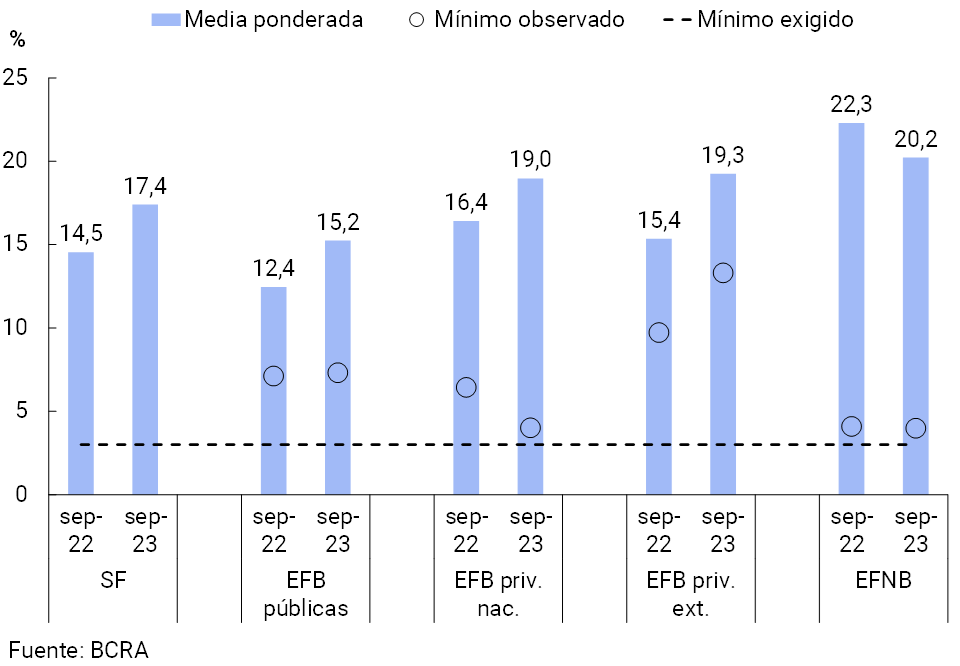
The leverage ratio, in line with international standards (Basel Committee)9, stood at 17.4% for the financial system as a whole at the end of the third quarter, thus growing 2.9 p.p. compared to the figure of a year ago. As of September, all financial institutions verified a level above the minimum requirement (established at 3%, see Graph 11).
Figure 11 | Leverage
ratio Capital Tier 1 in terms of a broad measure of exposure
With regard to the sector’s profitability indicators, the total comprehensive results – in homogeneous currency – accumulated in the last 12 months to September were equivalent to 3.2% of assets (ROA) and 17.2% of equity (ROE). These levels were higher in a year-on-year comparison, basically due to a higher financial margin. This effect was partially offset by an increase in losses due to exposure to monetary items and tax expenditures, among other items.
V. Payment system
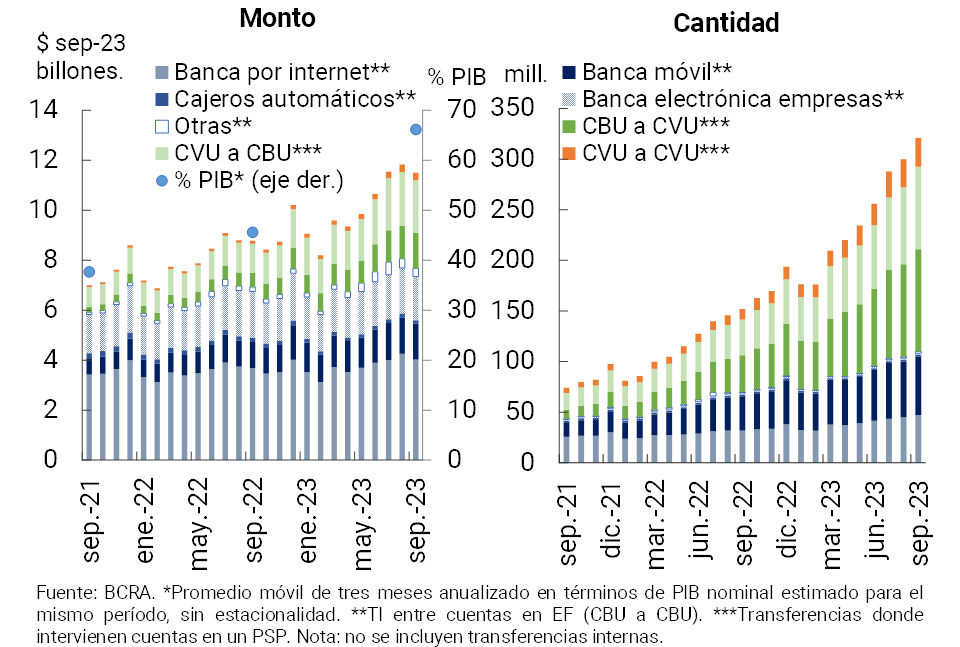
In September, immediate transfers (TI) presented a mixed performance: the number of operations increased (+7%) and the amounts traded decreased (-2.6% in real terms). In the month, the amount of IT between accounts in financial institutions (FI) increased 4.6% (-4.5% in real terms)10, 10.8% for those between accounts in EF and in Payment Service Providers (PSPs) (7.6% in real terms)11, 7.2% from PSP to EF (-2.7% in real amounts) and 2.4% for transactions exclusively in PSPs (CVU to CVU) (+2.3% in real amounts)12. On a year-over-year basis, the amount of IT more than doubled (+111.3%), driven mostly by transactions involving the interaction between EF and PSP accounts, as well as the PSP-only segment13 14. In this context, it is estimated that the amount traded in all ITs in the last three months (annualized) represented approximately 66.2% of GDP, which implies an increase of 20.6 p.p. compared to the same month of the previous year (see Chart 12).
Figure 12 | Instant Transfers (TI)
Payment with Transfer (PCT) operations through interoperable QR codes continued to expand significantly in September (about 14%, both in number of operations, as well as in actual amounts). In year-on-year terms, this payment modality expanded 261% and 246.4% in real terms in terms of the amount and values traded, respectively, thus accounting for the growing adoption and preference by users15.
In September, debit card transactions increased by 4.7% in quantity and 0.8% in real amounts. In a year-on-year comparison, these transactions accumulated a growth of 32.1% in quantity and 13.9% in real amounts. For its part, in September, transactions channeled with credit cards decreased 0.6% in quantity and 2.7% in real amounts. When compared to September 2022, the number of credit card payments increased 9.6% (remaining unchanged in magnitude in terms of actual amounts).
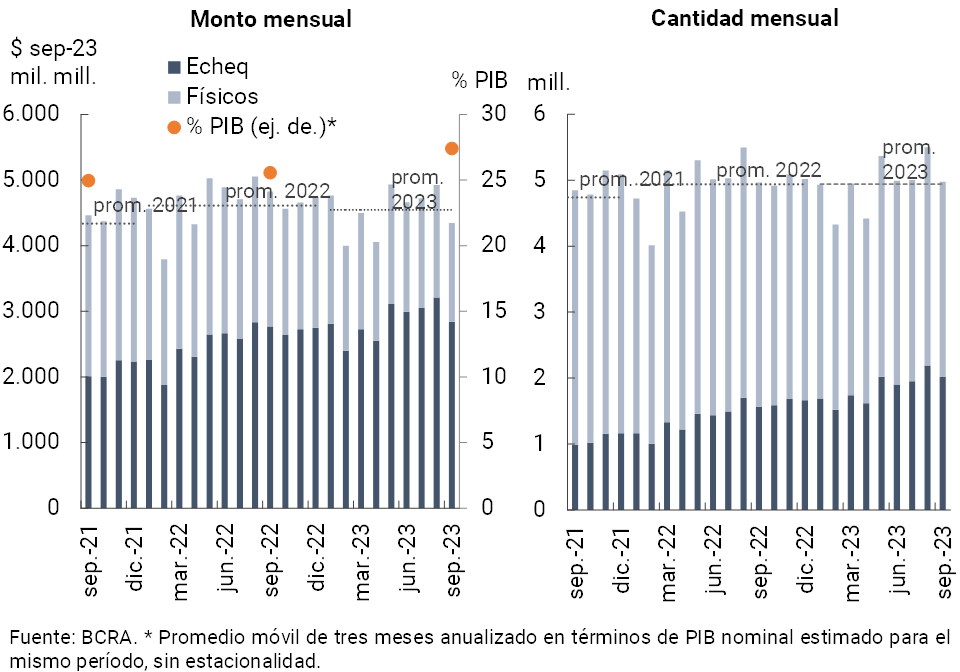
In the month, check clearing decreased compared to August (-9.6% in quantity and -11.8% in real amounts)16. Compared to September of the previous year, the number of documents cleared did not present significant variations, while the actual amounts decreased 10%. When disaggregated by type of check, the year-on-year performance of the electronic format (ECHEQs) stands out, which expanded 28.9% in amounts and 2.5% in real amounts, thus increasing its participation in the total clearing of checks (representing 40.6% and 65.4% of the amount and values traded in September, respectively, see Chart 13). It is estimated that the total amount of checks cleared in the last three months (annualized) was equivalent to 27.4% of GDP (+1.8 p.p. y.o.y.). On the other hand, the rejection of checks due to lack of funds over the total compensated increased slightly in the month, both in amounts and amounts (0.07 p.p. to 0.67% and 0.08 p.p. to 0.42%), standing at levels lower than those recorded on average in 2023.
Figure 13 | Check clearing
References
1 With regard to foreign currency items, in September the most notable movements were the increase in the balance of public sector deposits and financing to the aforementioned sector; to a lesser extent, the balance of private sector deposits in foreign currency was reduced. On the other hand, within the framework of the Export Increase Program, in the month the real balance of deposits with variable remuneration was reduced depending on the evolution of the exchange rate, impacting a fall in the holdings of BCRA Internal Bills in dollars and liquidable in pesos by the Reference Exchange Rate (LEDIV) at zero rate.
2 Includes principal adjustments and accrued interest.
3 See Communication “A” 7848 and Press Release of 09/28/23.
4 See Press Release of 12/10/23 and Communication “A” 7862.
5 Expressed in currency of origin.
6 Includes forward purchase and sale transactions of foreign currency classified off-balance sheet. Liabilities include deposits that have variable remuneration depending on the evolution of the exchange rate – associated with the Export Increase Program – and within assets the BCRA’s LEDIV are computed.
7 Total net forecasts of the minimum regulatory forecasts for debtors in situations 1 and 2, according to the criteria of the minimum regulatory forecasts for risk of uncollectibility.
8 Considers availabilities, BCRA instruments in national and foreign currency, and all public securities authorized to be used as minimum cash integration.
9 Tier 1 capital in terms of a broad measure of exposures.
10 In September, IT between CBUs (not including those carried out between accounts of the same FI) accounted for 33.9% of the total amount of IT (65.8% of the total amount). Within this group, in the month operations through Mobile Banking increased 4.7% in amounts (-1% in real amounts), Internet Banking grew 5.1% in amounts (-5.3% in real amounts), Electronic Business Banking decreased 2.3% in amounts (-5.2% in real amounts) and ATM transactions decreased 2.5% in amounts (-7% in real amounts).
11 In September 2023, IT from CBU to CVU accounted for 31.7% of the total amount of IT (12.7% of the total amount) and IT from CVU to CBU accounted for 25.5% of the amount of IT (18.9% of the total amount).
12 In the month, IT between CVUs (not including those made between accounts of the same PSP) accounted for 8.9% of IT (2.7% of the total amount).
13 Compared to the same period in 2022, transfers from CBU to CBU grew by about 57% (9% in real amounts), between CBU to CVU they increased 179% in quantities (147% in real amounts), between CVU to CBU they increased 131% in quantities (80% in real amounts), and among CVUs they increased 172% in quantities (155% in real amounts).
14 In September, the value of IT averaged approximately $35,000 ($67,800 for IT between CBU, $10,500 for IT between CVU, $14,000 from CBU to CVU, and $25,800 between CVU and CBU).
15 In the month, the average PCT operations was $5,200.
16 In the month, the average cleared check was $873,000 ($508,244 in the physical format and $1,407,000 in ECHEQs).
Share on


