Summary
1. Monetary policy: assessment and outlook
The global economy has tended to slow down in recent months. With core inflation persisting in many advanced economies and easing in much of the emerging economies, central banks in the former maintained, or even raised, benchmark interest rates; while those of the latter began to reduce them, especially in Latin America. This had an impact on capital flows to emerging economies, which lost dynamism, with its consequent impact on currencies. Likewise, the U.S. dollar has appreciated at the margin, putting downward pressure on agricultural commodity prices, while oil strengthens in the face of supply constraints.
In Argentina, economic activity contracted in the second quarter of the year, as a result of the severe drought that mainly affected the coarse harvest, as had been anticipated in the previous IPOM. For its part, the level of activity of the non-agricultural sectors as a whole remained stable compared to the first quarter and also in year-on-year terms, with the activities most linked to agriculture contracting and the rest growing. Formal employment in the non-agricultural sectors continued to increase. Domestic demand remained relatively stable compared to the first quarter, with some heterogeneity among its components. The contraction in net exports, falling inventories, both affected by the drought, and the decline in private consumption were partially offset by the increase in investment. Going forward, it is expected that the set of income reinforcement policies implemented by the National Government will contribute to sustaining domestic demand, in a context of high inflation and uncertainty associated with the electoral period.
The drought also caused a sharp drop in foreign trade flows, with an estimated loss of around US$20 billion, and in export duty revenues, which fell by 0.6% of GDP. With the aim of contributing to an improvement in the trade balance and favoring the accumulation of international reserves, as well as strengthening fiscal resources, since mid-July the National Government and the BCRA promoted a set of tax and exchange measures. Among them were the recalibration of the official exchange rate to a value of $/US$350, the extension of the PAIS tax on the import of other goods and services and a series of modifications to the Export Increase Program (PIE).
In this context and in view of the need to timely meet the payments of debt services with the International Monetary Fund (IMF), given the delay in the disbursements corresponding to the fifth review of the Extended Facilities Program (PFE), the BCRA had to provide financial assistance to the National Treasury on a temporary and extraordinary basis. In addition, to meet the commitments of the end of July and the beginning of August, extraordinary sources of funding were used (the placement of a non-transferable bill to the BCRA, financing from CAF and a bilateral loan with the State of Qatar). These operations made it possible to comply in a timely manner with debt services with the multilateral credit agency until the joint approval of the fifth and sixth revisions of the PFE. In it, the international reserves target was adjusted, reflecting the impact of the drought and maintaining a high accumulation effort in the rest of the year. On the other hand, the limit of monetary financing to the Treasury was increased from 0.6% to 0.8% of GDP; while maintaining the primary fiscal deficit target of the Non-Financial Public Sector.
Following the approval of the PFE review, on August 23 the agency made a disbursement of 5.5 billion SDRs (about US$7.3 billion) and the aforementioned bridge financing mechanisms began to be reversed. That same day, $0.5 billion of net transitory advances were canceled. The loan with the State of Qatar was also canceled and the National Government decided to advance the September payment to the IMF for 687.5 million SDRs (about US$ 910 million).
Inflation in recent months reflected the impact of greater financial volatility and the various measures aimed at offsetting the consequences of the drought on fiscal resources and international reserves, among which the recalibration of the official exchange rate stood out. The effect on prices would have been mainly concentrated in August and September, with average monthly inflation of around 12%. However, inflation showed a downward trend since the first week of September and a marked reduction in the monthly inflation rate is expected for October. The slowdown in inflation in recent weeks was mainly due to a series of measures implemented by the National Government and the BCRA.
The National Government renewed the price agreements within the framework of the Fair Prices program – limiting the rate of increase in products in the basic basket and stabilizing the prices of medicines. It also ordered the temporary freezing of prices of certain regulated products – such as gasoline and prepaid medicine fees – and postponed the increase in train, bus, gas and electricity fares.
The BCRA, for its part, readjusted the monetary policy interest rate with the aim of mitigating the transfer to prices of the recalibration of the official exchange rate. Specifically, it ordered to raise the interest rate of the LELIQ by 21 p.p. to 28 days, bringing it to 118% n.a. (209.4% e.a.). It also raised the minimum guaranteed interest rate for placements by individuals to an effective monthly yield of 9.7%. In this way, the aim was to tend towards positive real returns on investments in local currency and to contribute to financial and exchange rate balance.
On the other hand, the BCRA continued to use its intervention capacity through open market operations, in order to limit volatility and promote greater liquidity, depth and transparency of the sovereign debt markets. Likewise, it maintained its credit policy focused on productive development through the Productive Investment Financing Line (LFIP). This tool allowed bank financing to relatively smaller companies to be above the pre-pandemic record and the historical average.
In the coming months, the BCRA will continue to calibrate its policies in a context of greater volatility in the financial markets associated with the electoral period. In terms of interest rates, it will act within its structural objective of tending towards positive real returns on investments in local currency and favoring the accumulation of reserves. Likewise, the BCRA will continue to intervene in the secondary markets of public debt in order to avoid excessive volatility that compromises financial and exchange stability, and will maintain a prudent administration of monetary aggregates, sterilizing any surplus liquidity, in order to preserve monetary balance. Finally, in order to continue supporting the expansion of economic activity, the BCRA will continue to stimulate credit, particularly that linked to productive development through the Financing Line for Productive Investment.
2. International context
The global economy has tended to slow down in recent months. Of Argentina’s main trading partners, China is growing less than expected, while experiencing a real estate crisis. Brazil is also slowing, while the euro area and the United Kingdom are stagnating. Only growth in the United States shows signs of any strength.
With core inflation persisting in many advanced economies and easing in much of emerging and developing economies, central banks in the former maintain or even raise interest rates, while those in the latter have begun to reduce them (especially in Latin America). This has recently had an impact on currencies and capital flows to emerging economies.
A scenario of “higher rates for longer” is consolidating in the markets, with its impact on bonds and stocks, and currencies. The U.S. dollar, which had been depreciating so far this year, has appreciated at the margin; this is also reflected in the prices of raw materials. Agricultural commodities show some retraction, while oil strengthens in the face of supply constraints.
Risks to global activity remain skewed to the downside. In China, the financial impact of the real estate crisis is uncertain, and the economic policy response will be key. Meanwhile, the persistence of core inflation in some advanced economies could lead to additional interest rate hikes and eventual financial turbulence (banking or linked to situations of unsustainability of corporate and sovereign debts). Geopolitical tensions persist as sources of risk, and may imply greater trade fragmentation.
2.1. Lower global growth in a more uncertain context
In the second quarter of the year, global economic activity tended to slow down. In advanced economies, the picture was mixed: the euro area and the United Kingdom remained stagnant, with quarterly growth of 0.1% and 0.2% (seasonally adequate), respectively. In the United States, the strength of the economy in the face of contractionary monetary policy was surprising, with a growth rate similar to that of the previous quarter (+0.5% quarter-on-quarter s.e.); while in Japan growth accelerated unexpectedly (from +0.8% to +1.2% qoq/s.). Emerging economies continued to perform better, but with signs of slowdown in some relevant cases. In China, a real estate crisis in residential investment combined with less dynamism in household consumption and lower external demand due to the global slowdown. This led to an expansion of only 0.8% quarter-on-quarter s.e. in the second quarter of the year, after the 2.2% increase in the previous quarter. Likewise, in Brazil, economic activity grew 0.9% quarter-on-quarter, after expanding 1.8% in the previous quarter (see Figure 2.1). Labor markets remain robust in both groups of countries, with job creation dynamics sustaining, albeit at a slower pace, and unemployment rates remaining at historically low levels, but with some signs of deteriorating working conditions at the margin in some cases.
Figure 2.1 | Evolution of GDP of selected economies (real GDP without seasonality)
to. Quarterly % change
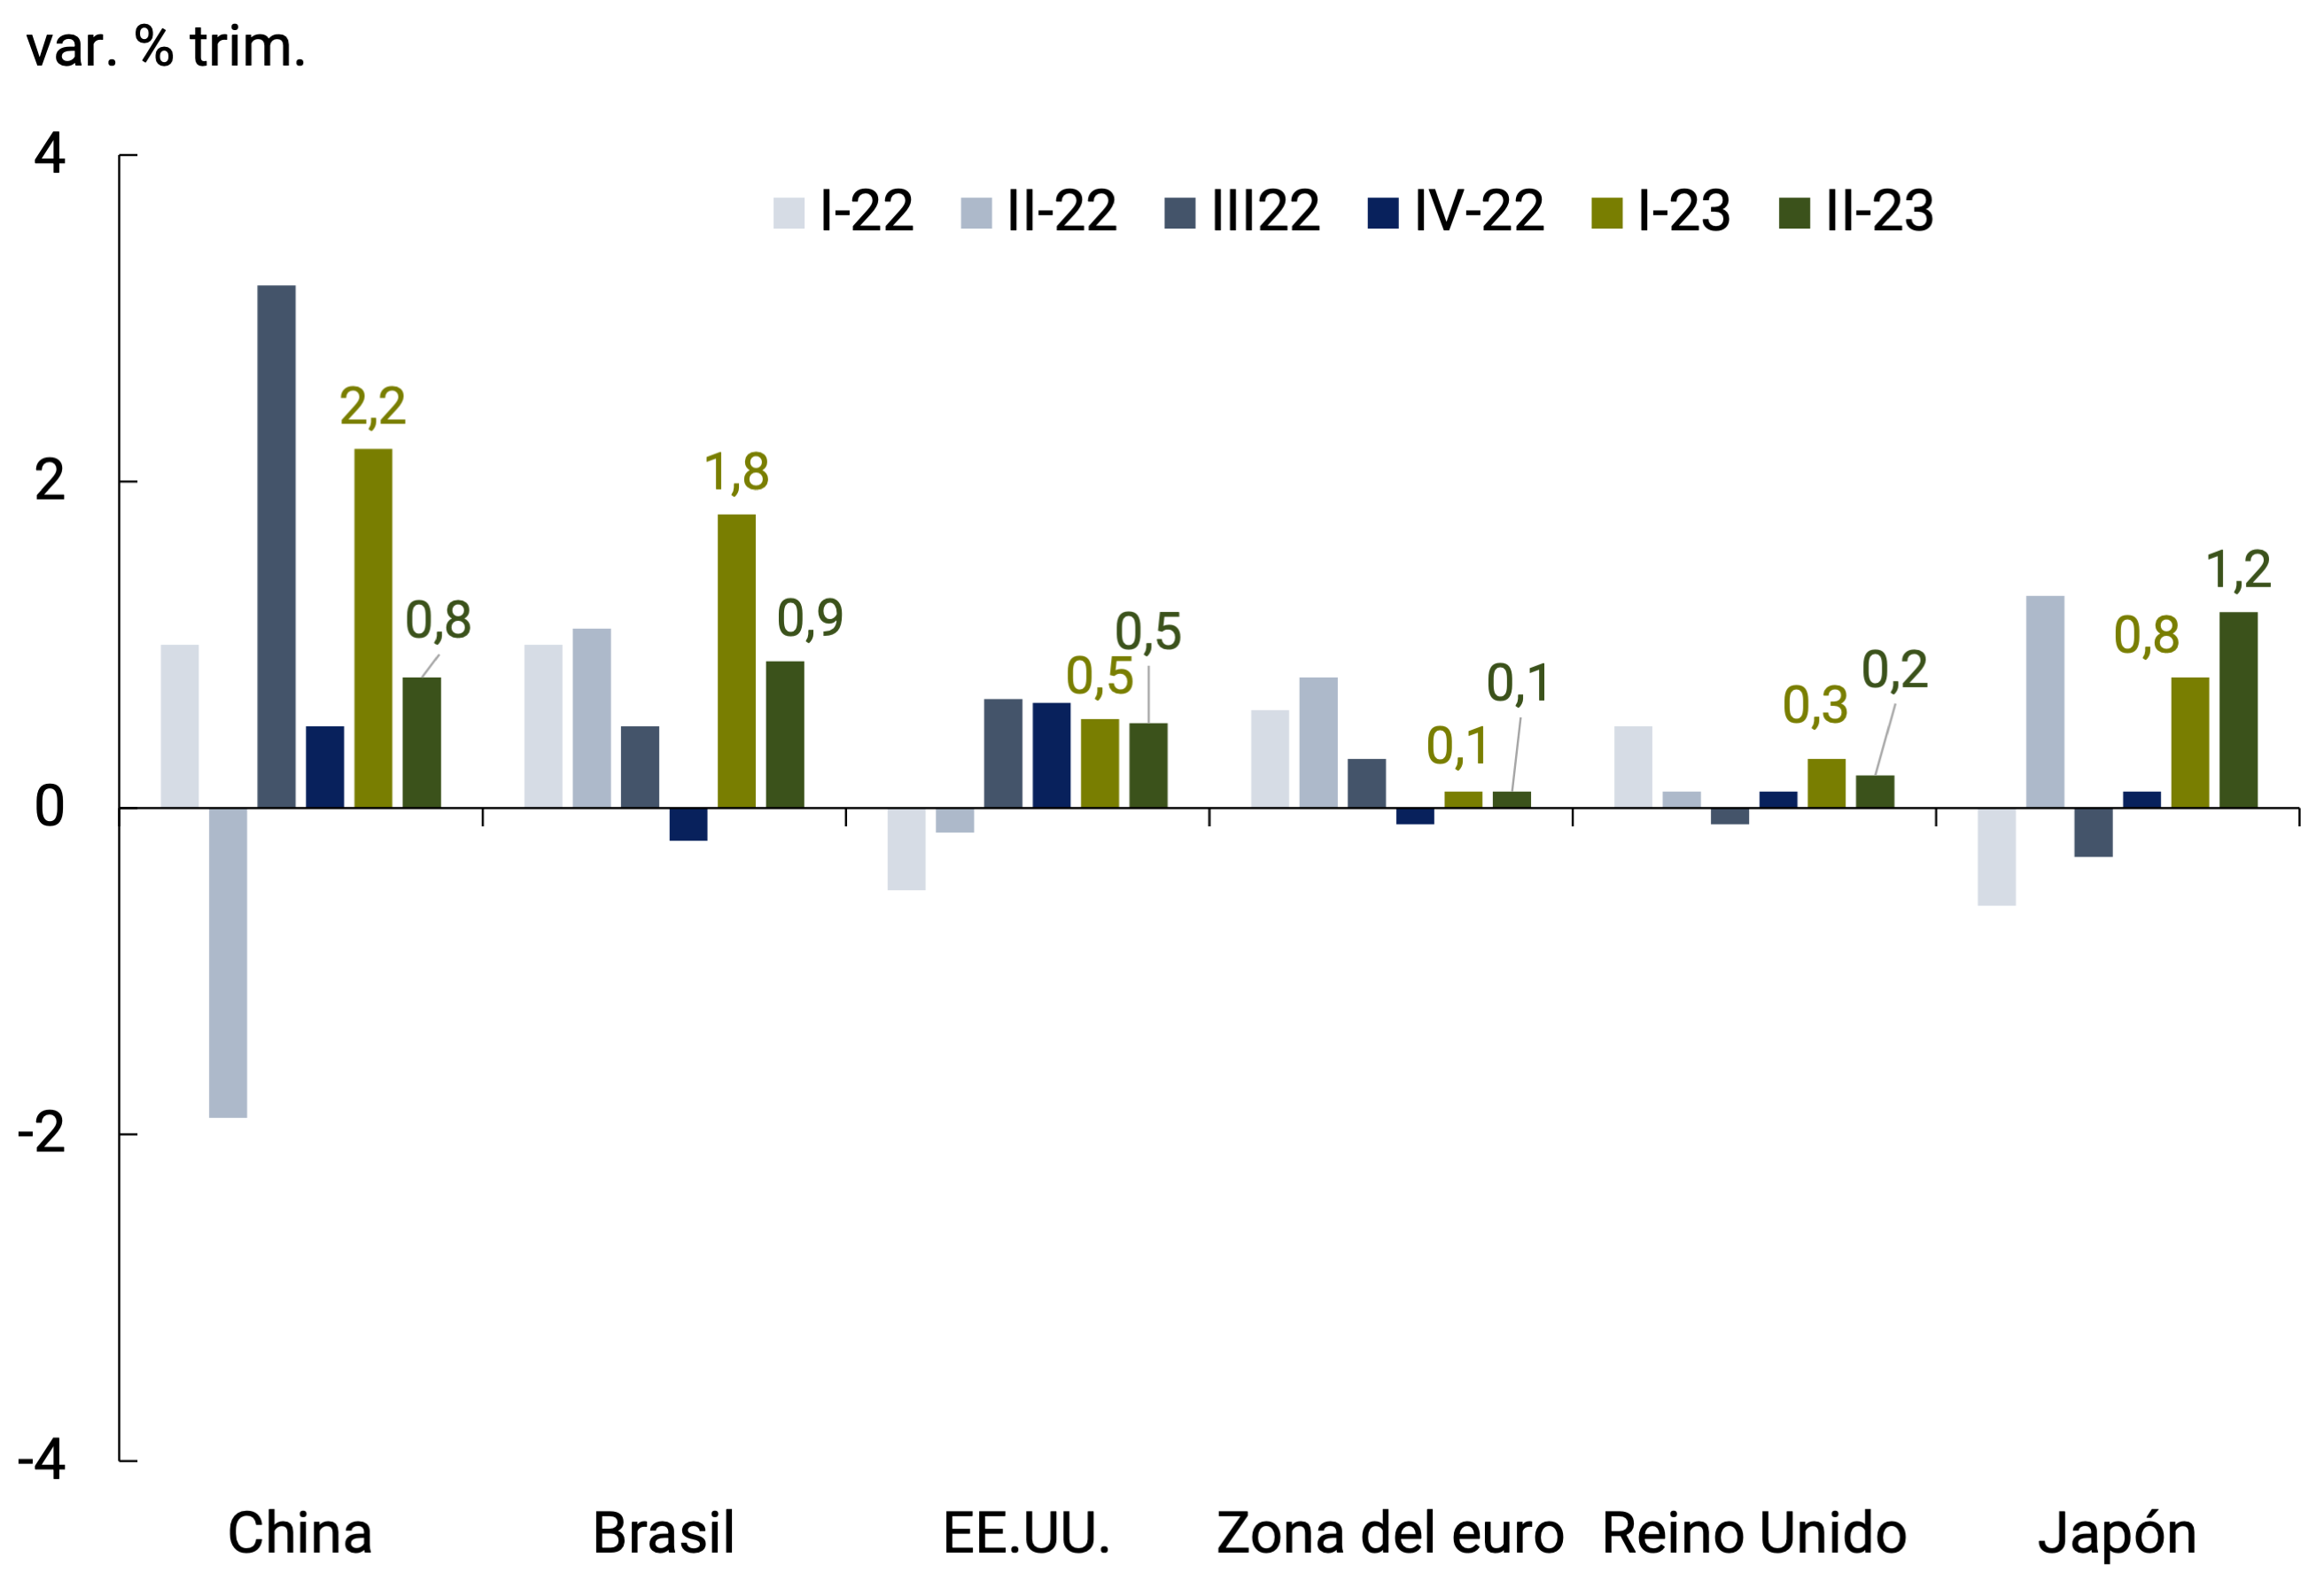
b. In levels, 4th. Quarter 2019=100
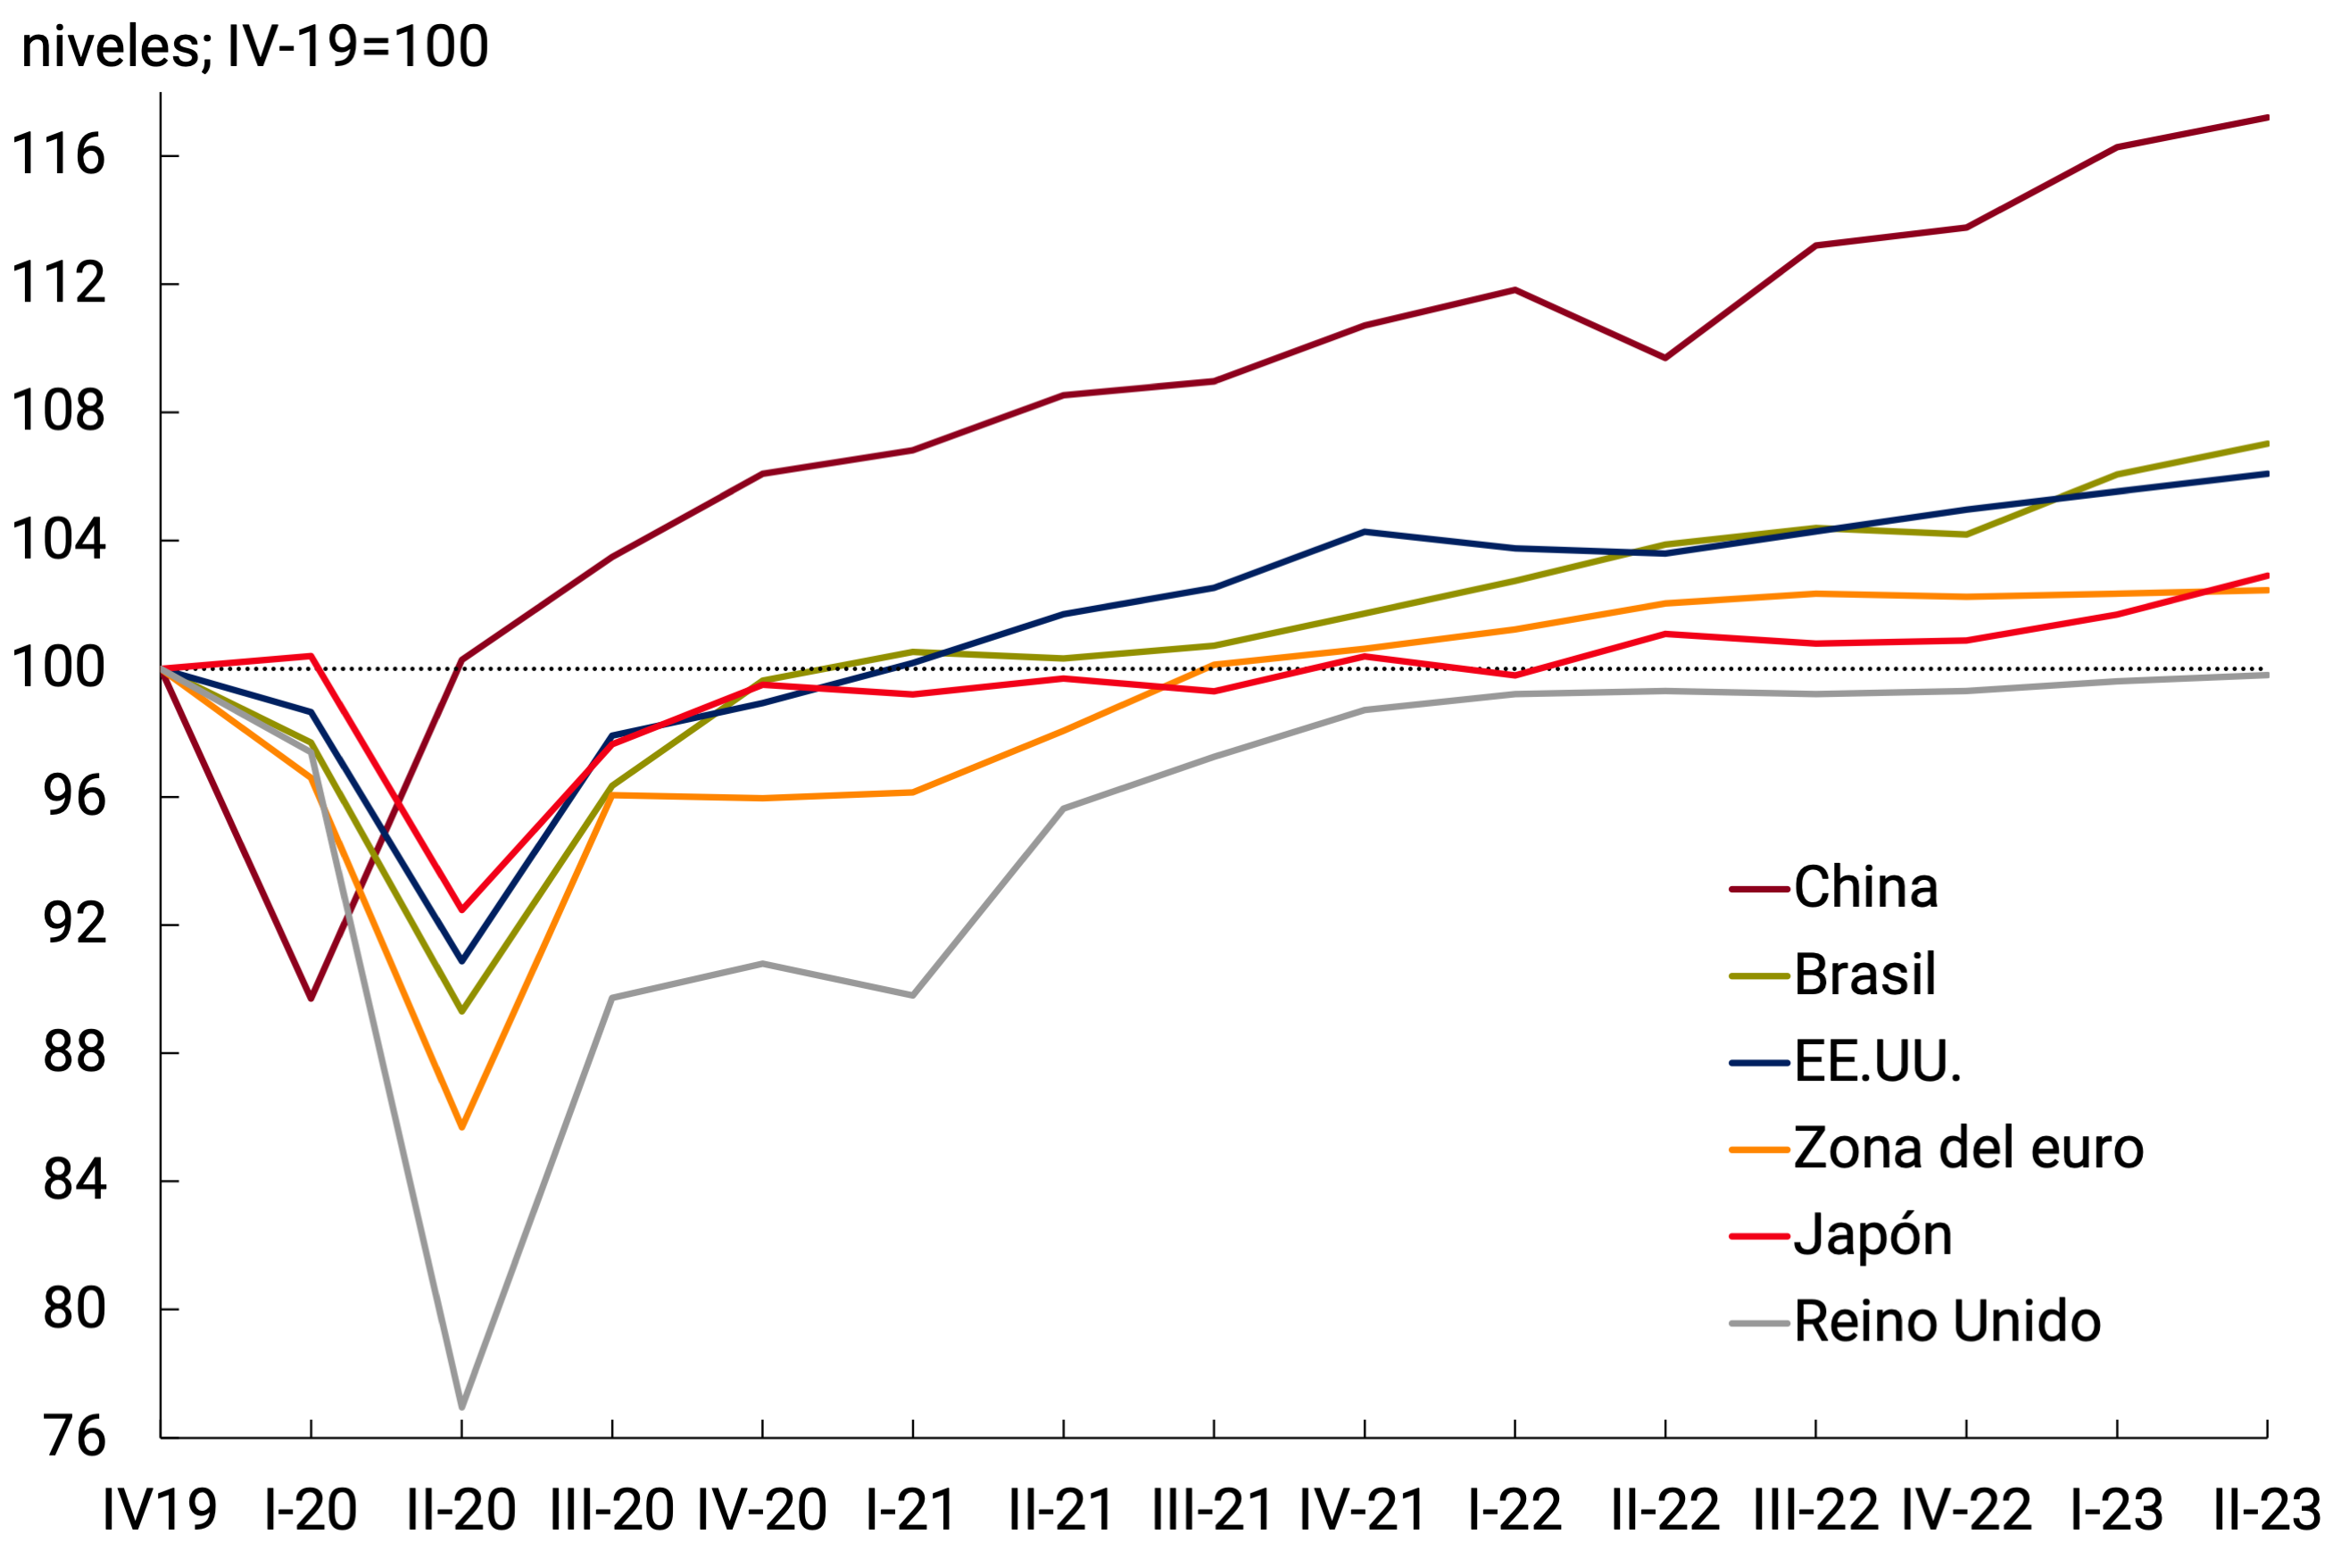
Source: BCRA based on data from national statistics institutes.
High-frequency indicators generally suggest a worse performance of economic activity in the third quarter in the euro area and the United Kingdom, with declines in industrial production and retail sales. In July, the bad signs for China remained, with retail sales and industrial production stagnating, but then recovering in August. The exception is the United States, where economic activity seems to be sustained, with monthly expansion of both variables in July and August (see Figure 2.2). On the other hand, world trade has been showing a slight recovery in recent months, in the context of a downward trend that began in mid-20211.
Figure 2.2 | Activity indicators
to. Industrial production
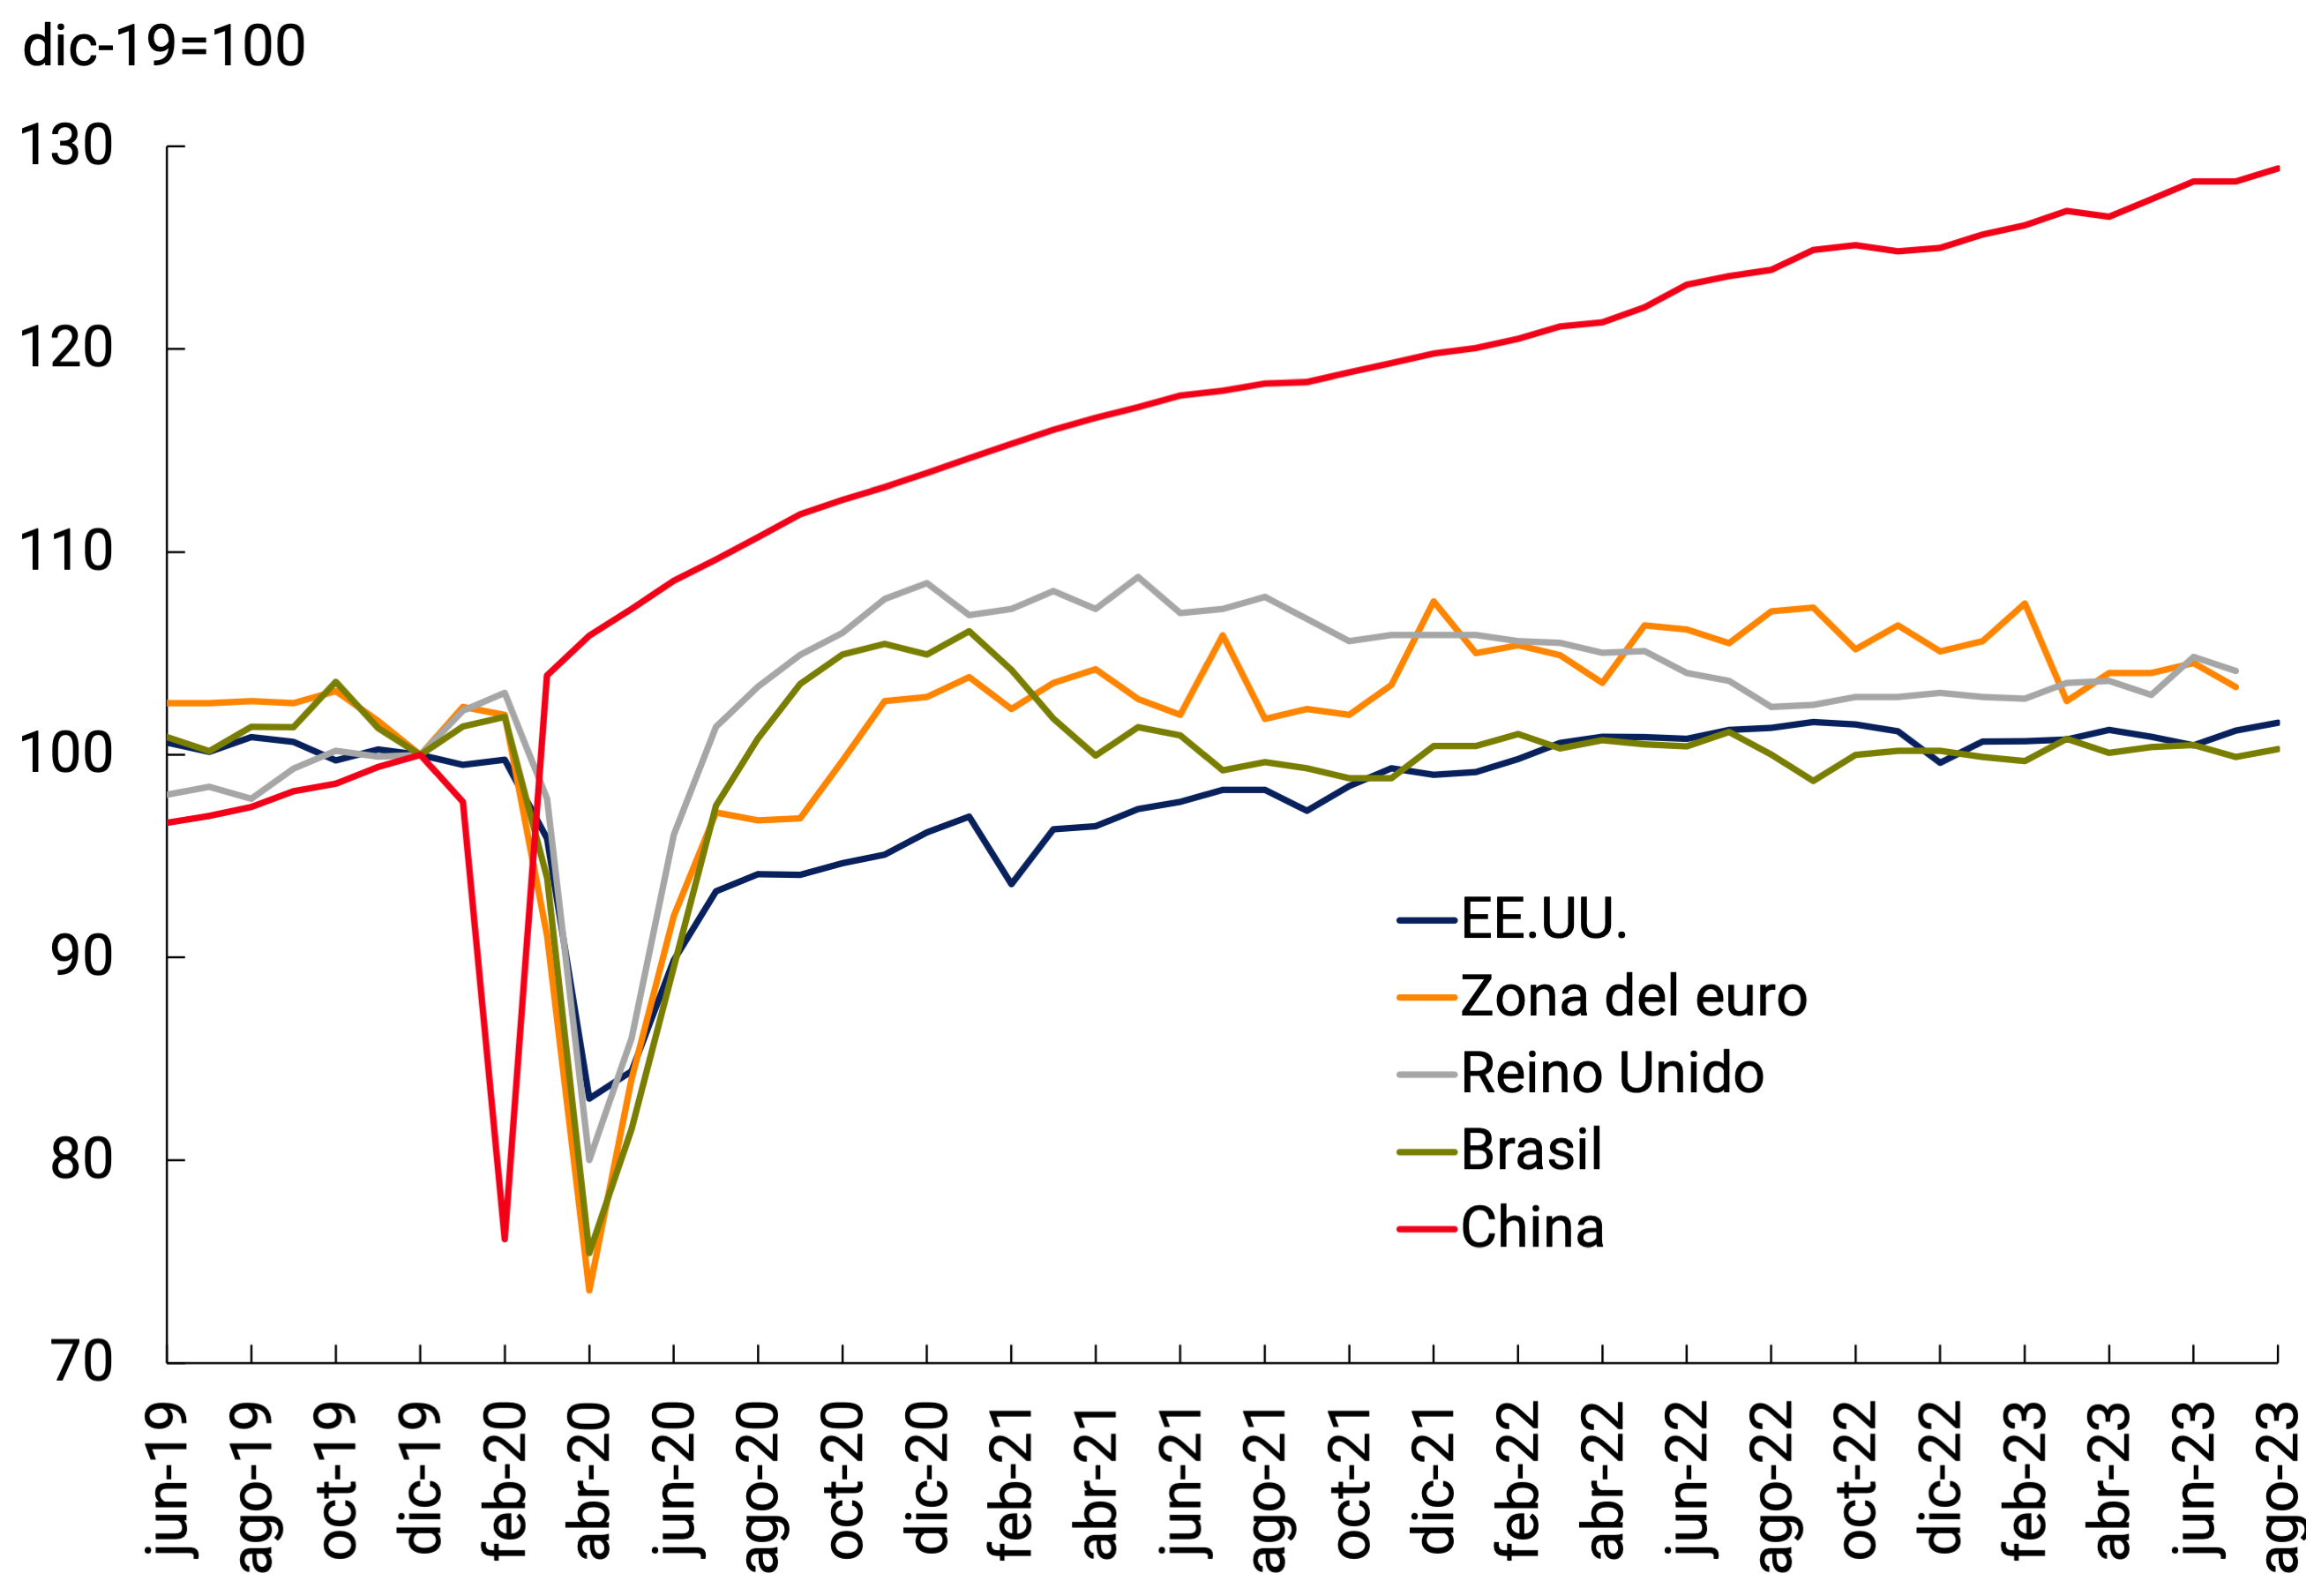
b. Retail Sales
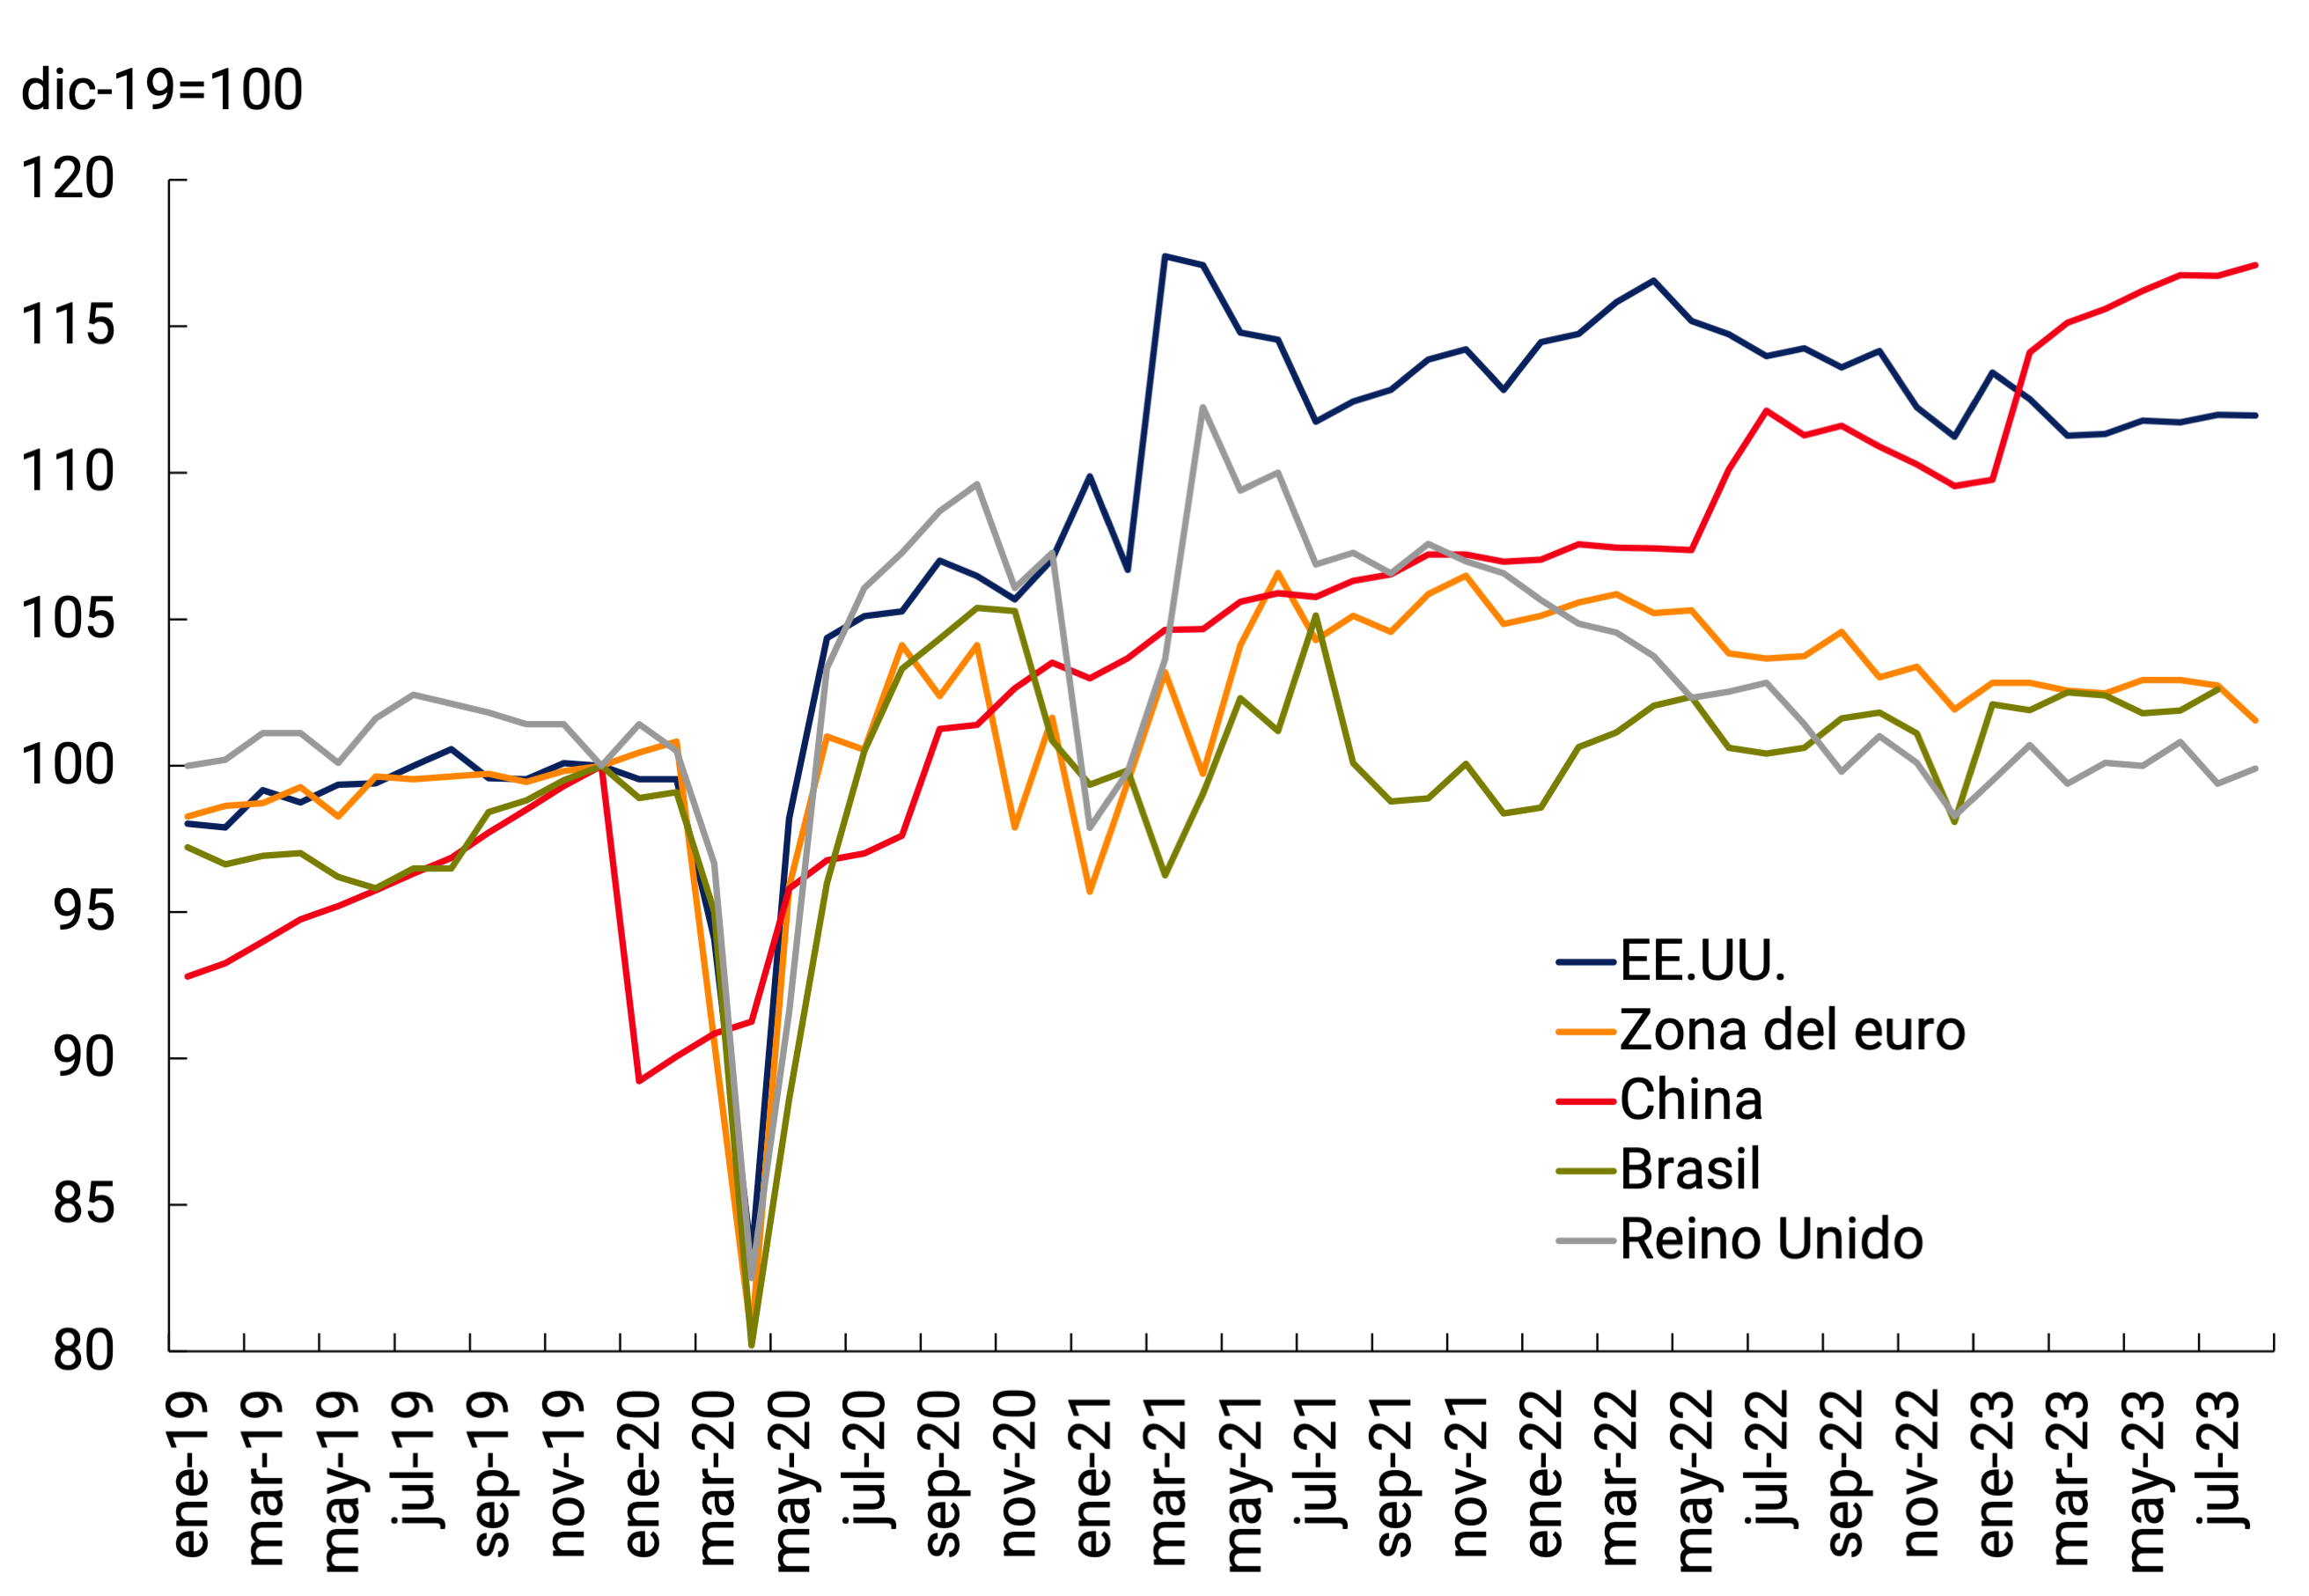
Source: BCRA based on data from the national statistical offices.
The forward-looking indicators also show the same dynamics of a deterioration in activity in the third quarter, with a reversal in its trend compared to the previous report. The composite index from purchasing managers’ surveys (PMIs) tended to decline in many countries (below the diagonal) and, in particular, moved into contraction zone in Europe (Figure 2.3a). The services sector, which was driving the expansion, experienced a significant decline (see Figure 2.3c) and the industrial sector, with the exception of the BRICS countries, remains in contraction (see Figure 2.3b).
Consumer confidence continued its recovery in the May-August period in the euro area, the United Kingdom, the United States and Brazil, but remained below the average of the last five years (except in Brazil, which has exceeded it) (see Chart 2.3d). In China, the latest available measurement is from April and showed a deterioration of such magnitude that the reported value returned close to the levels of December 2022 when health restrictions due to the COVID-19 pandemic began to be lifted. Analysts agree that consumer confidence has continued to decline.
Figure 2.3 | Forward-Looking Activity Indicators
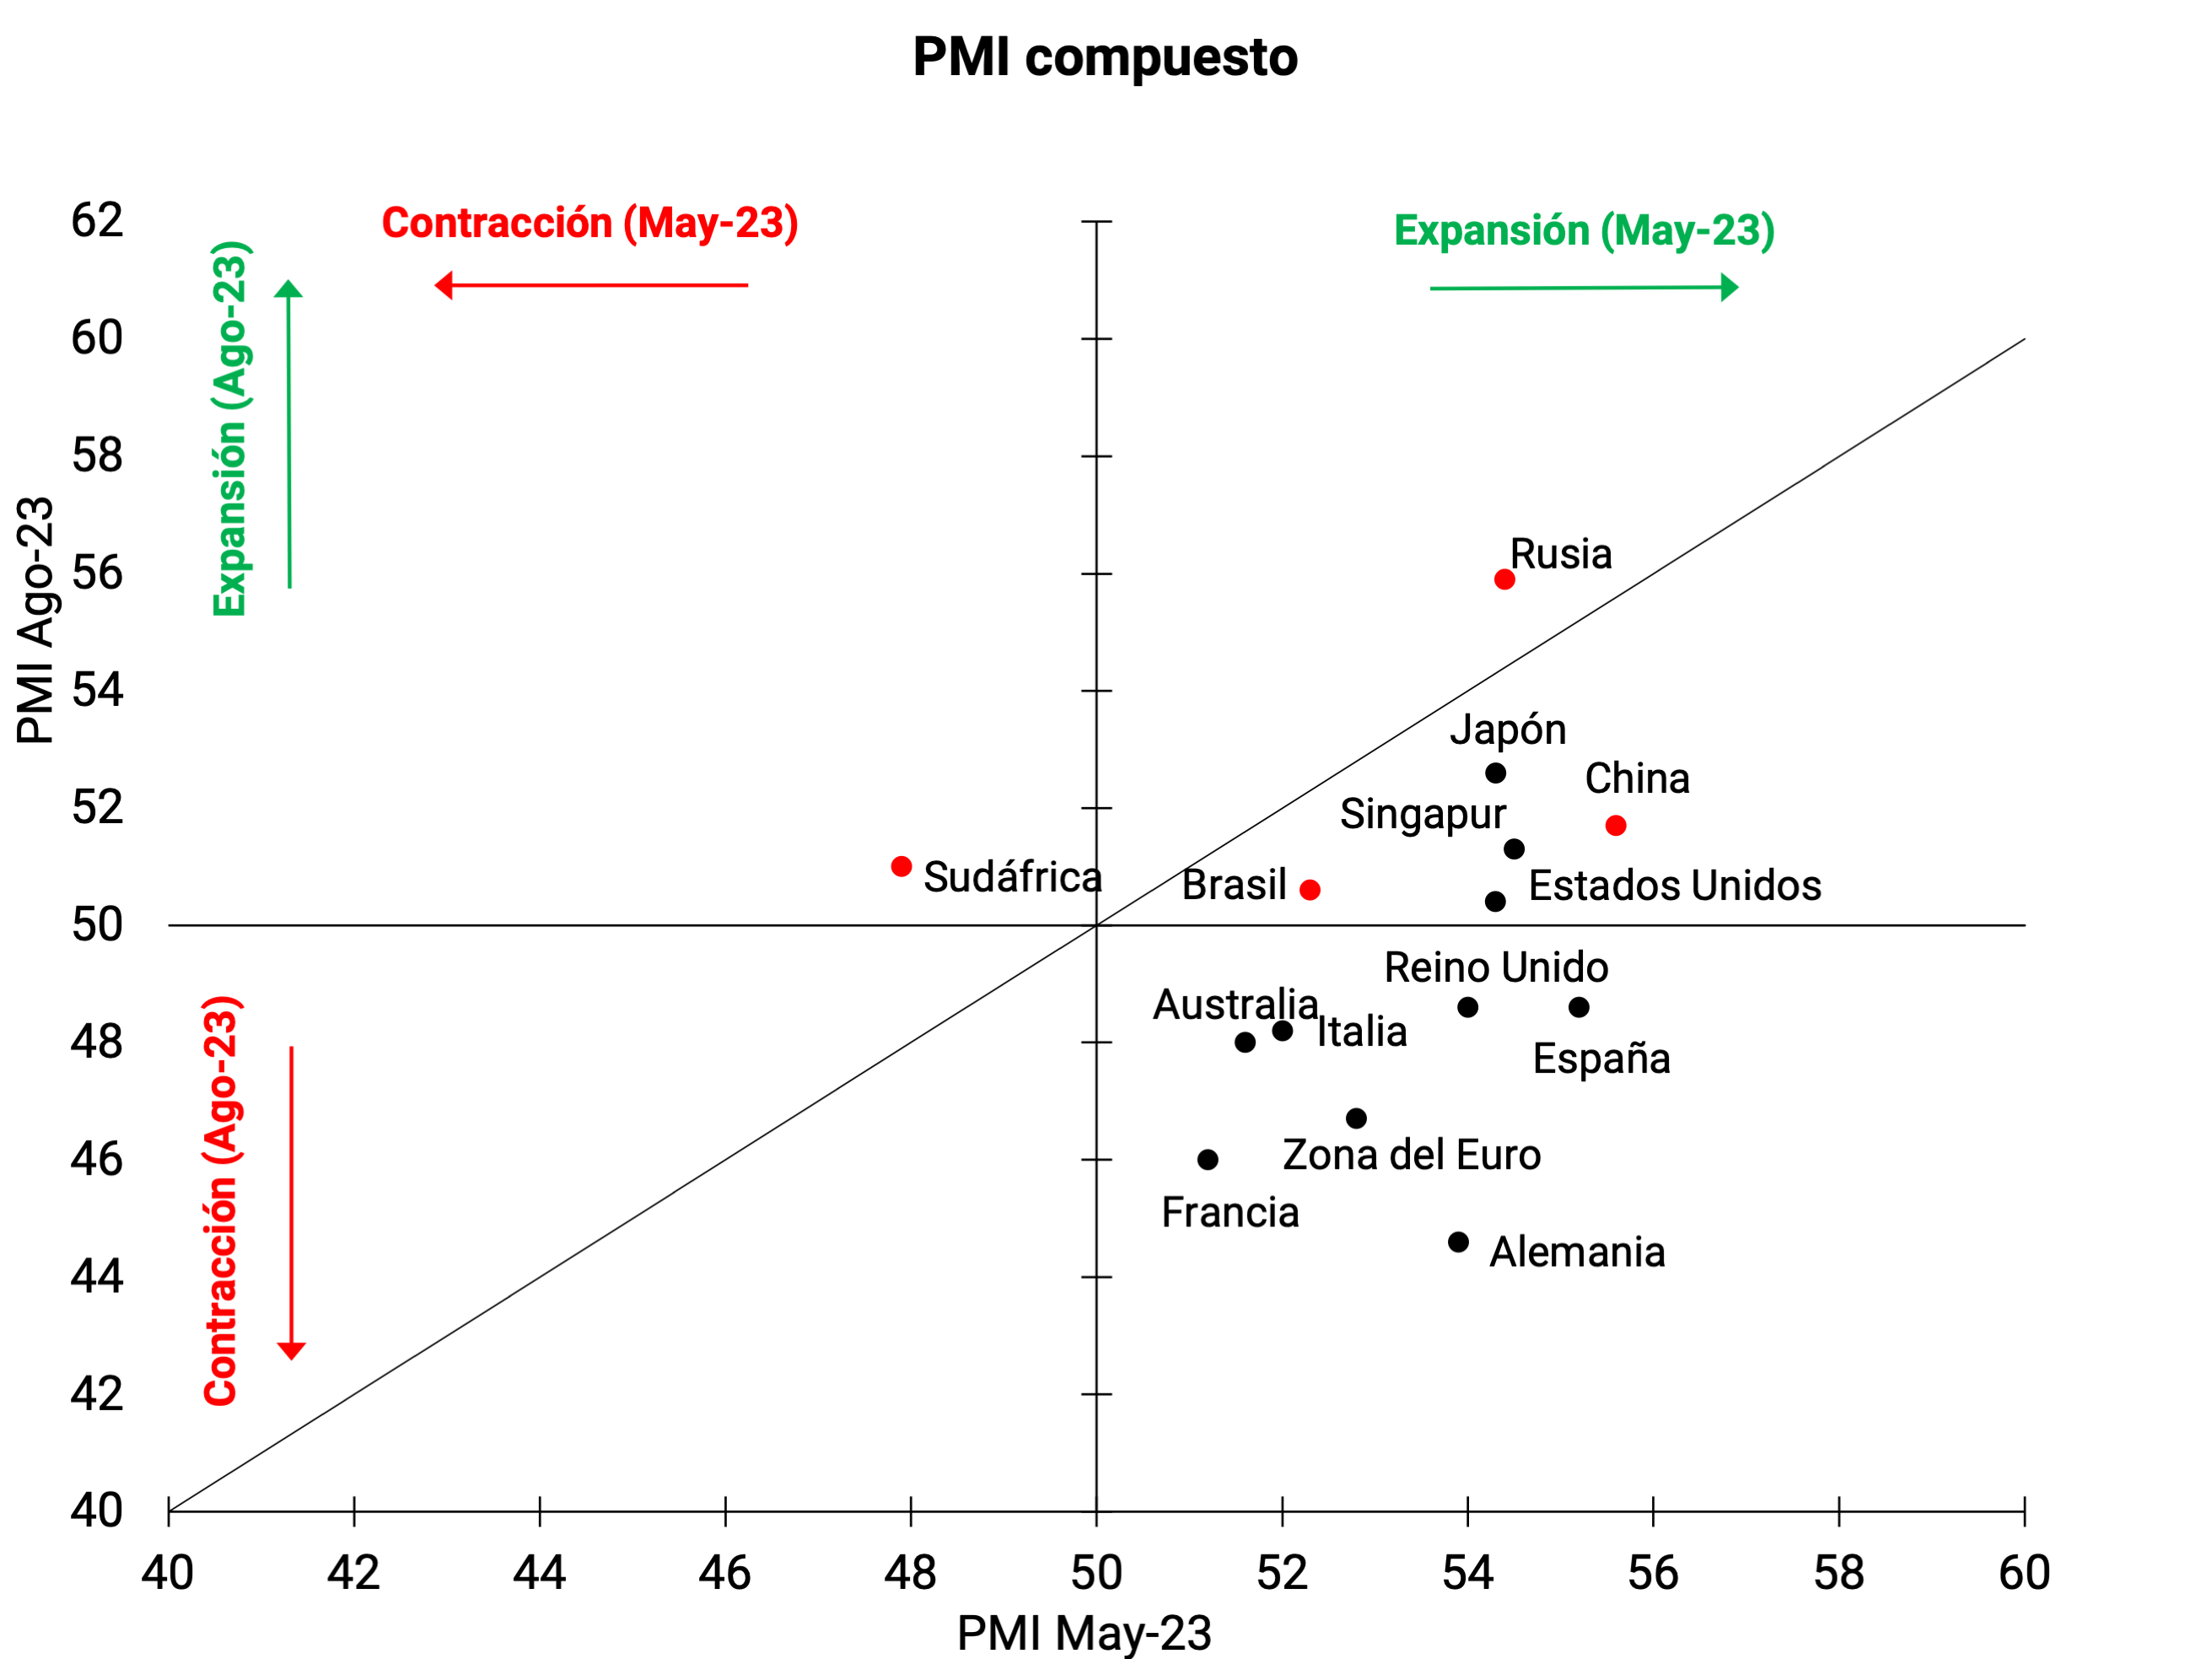
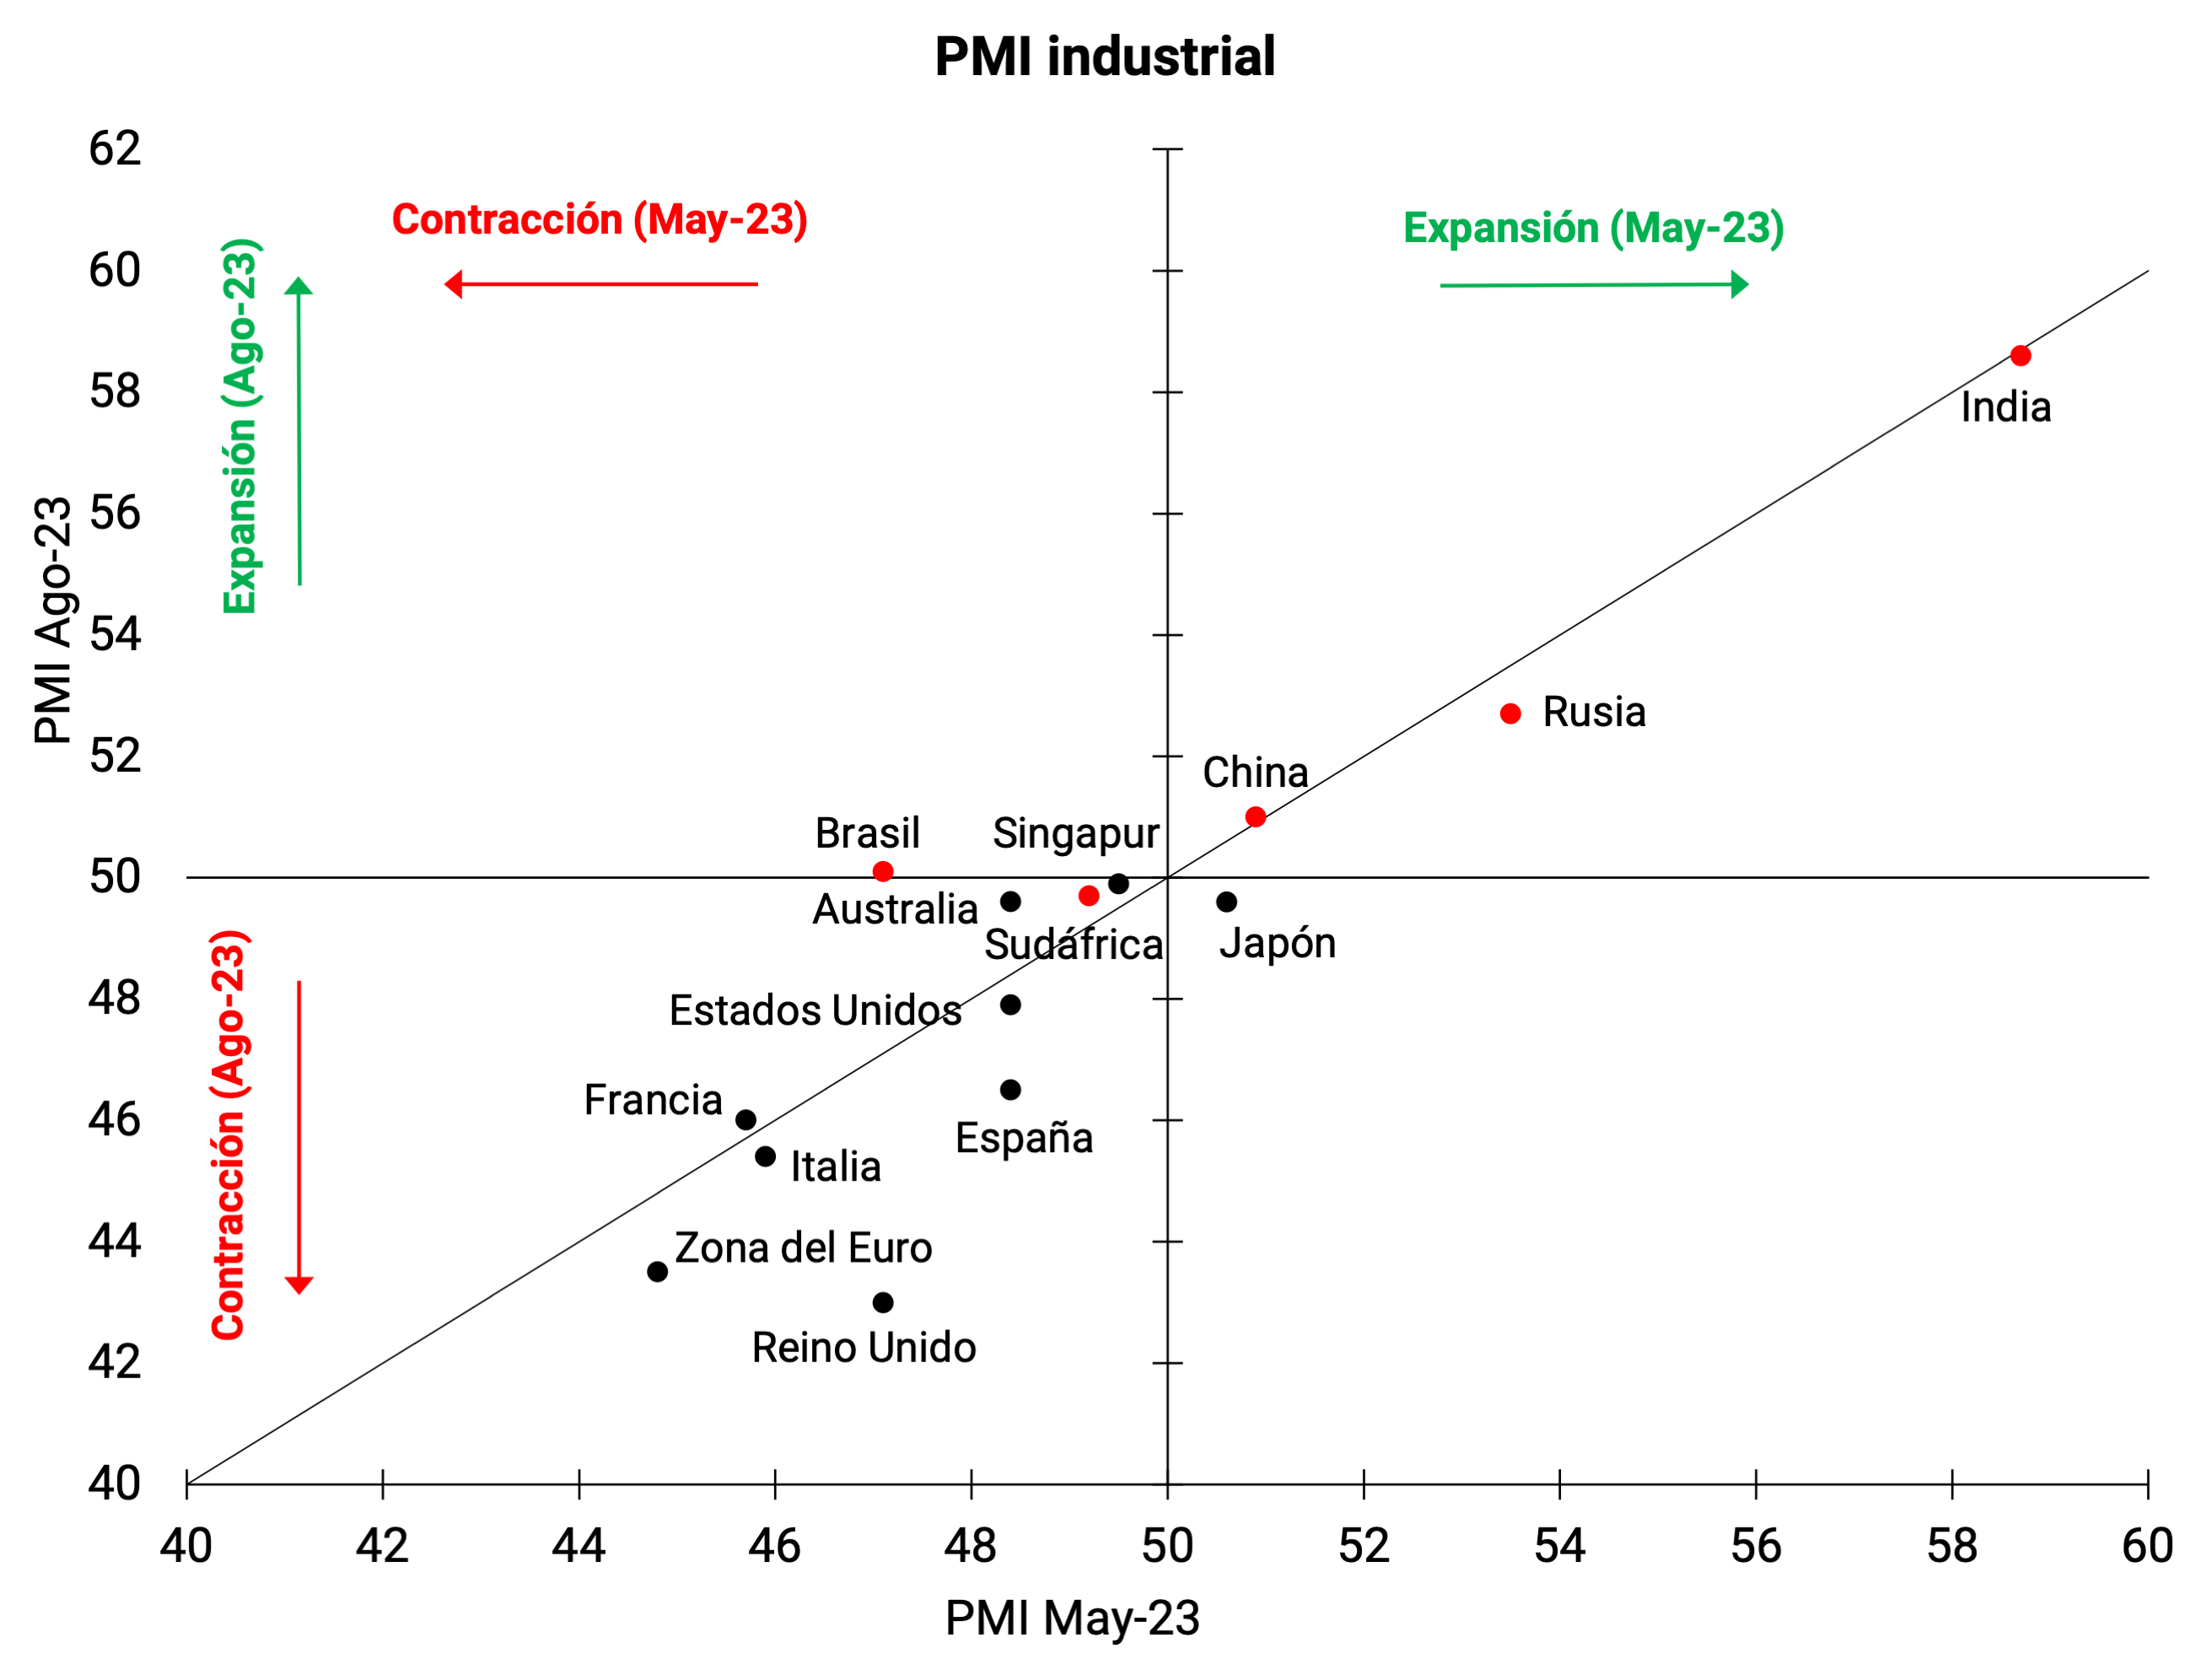
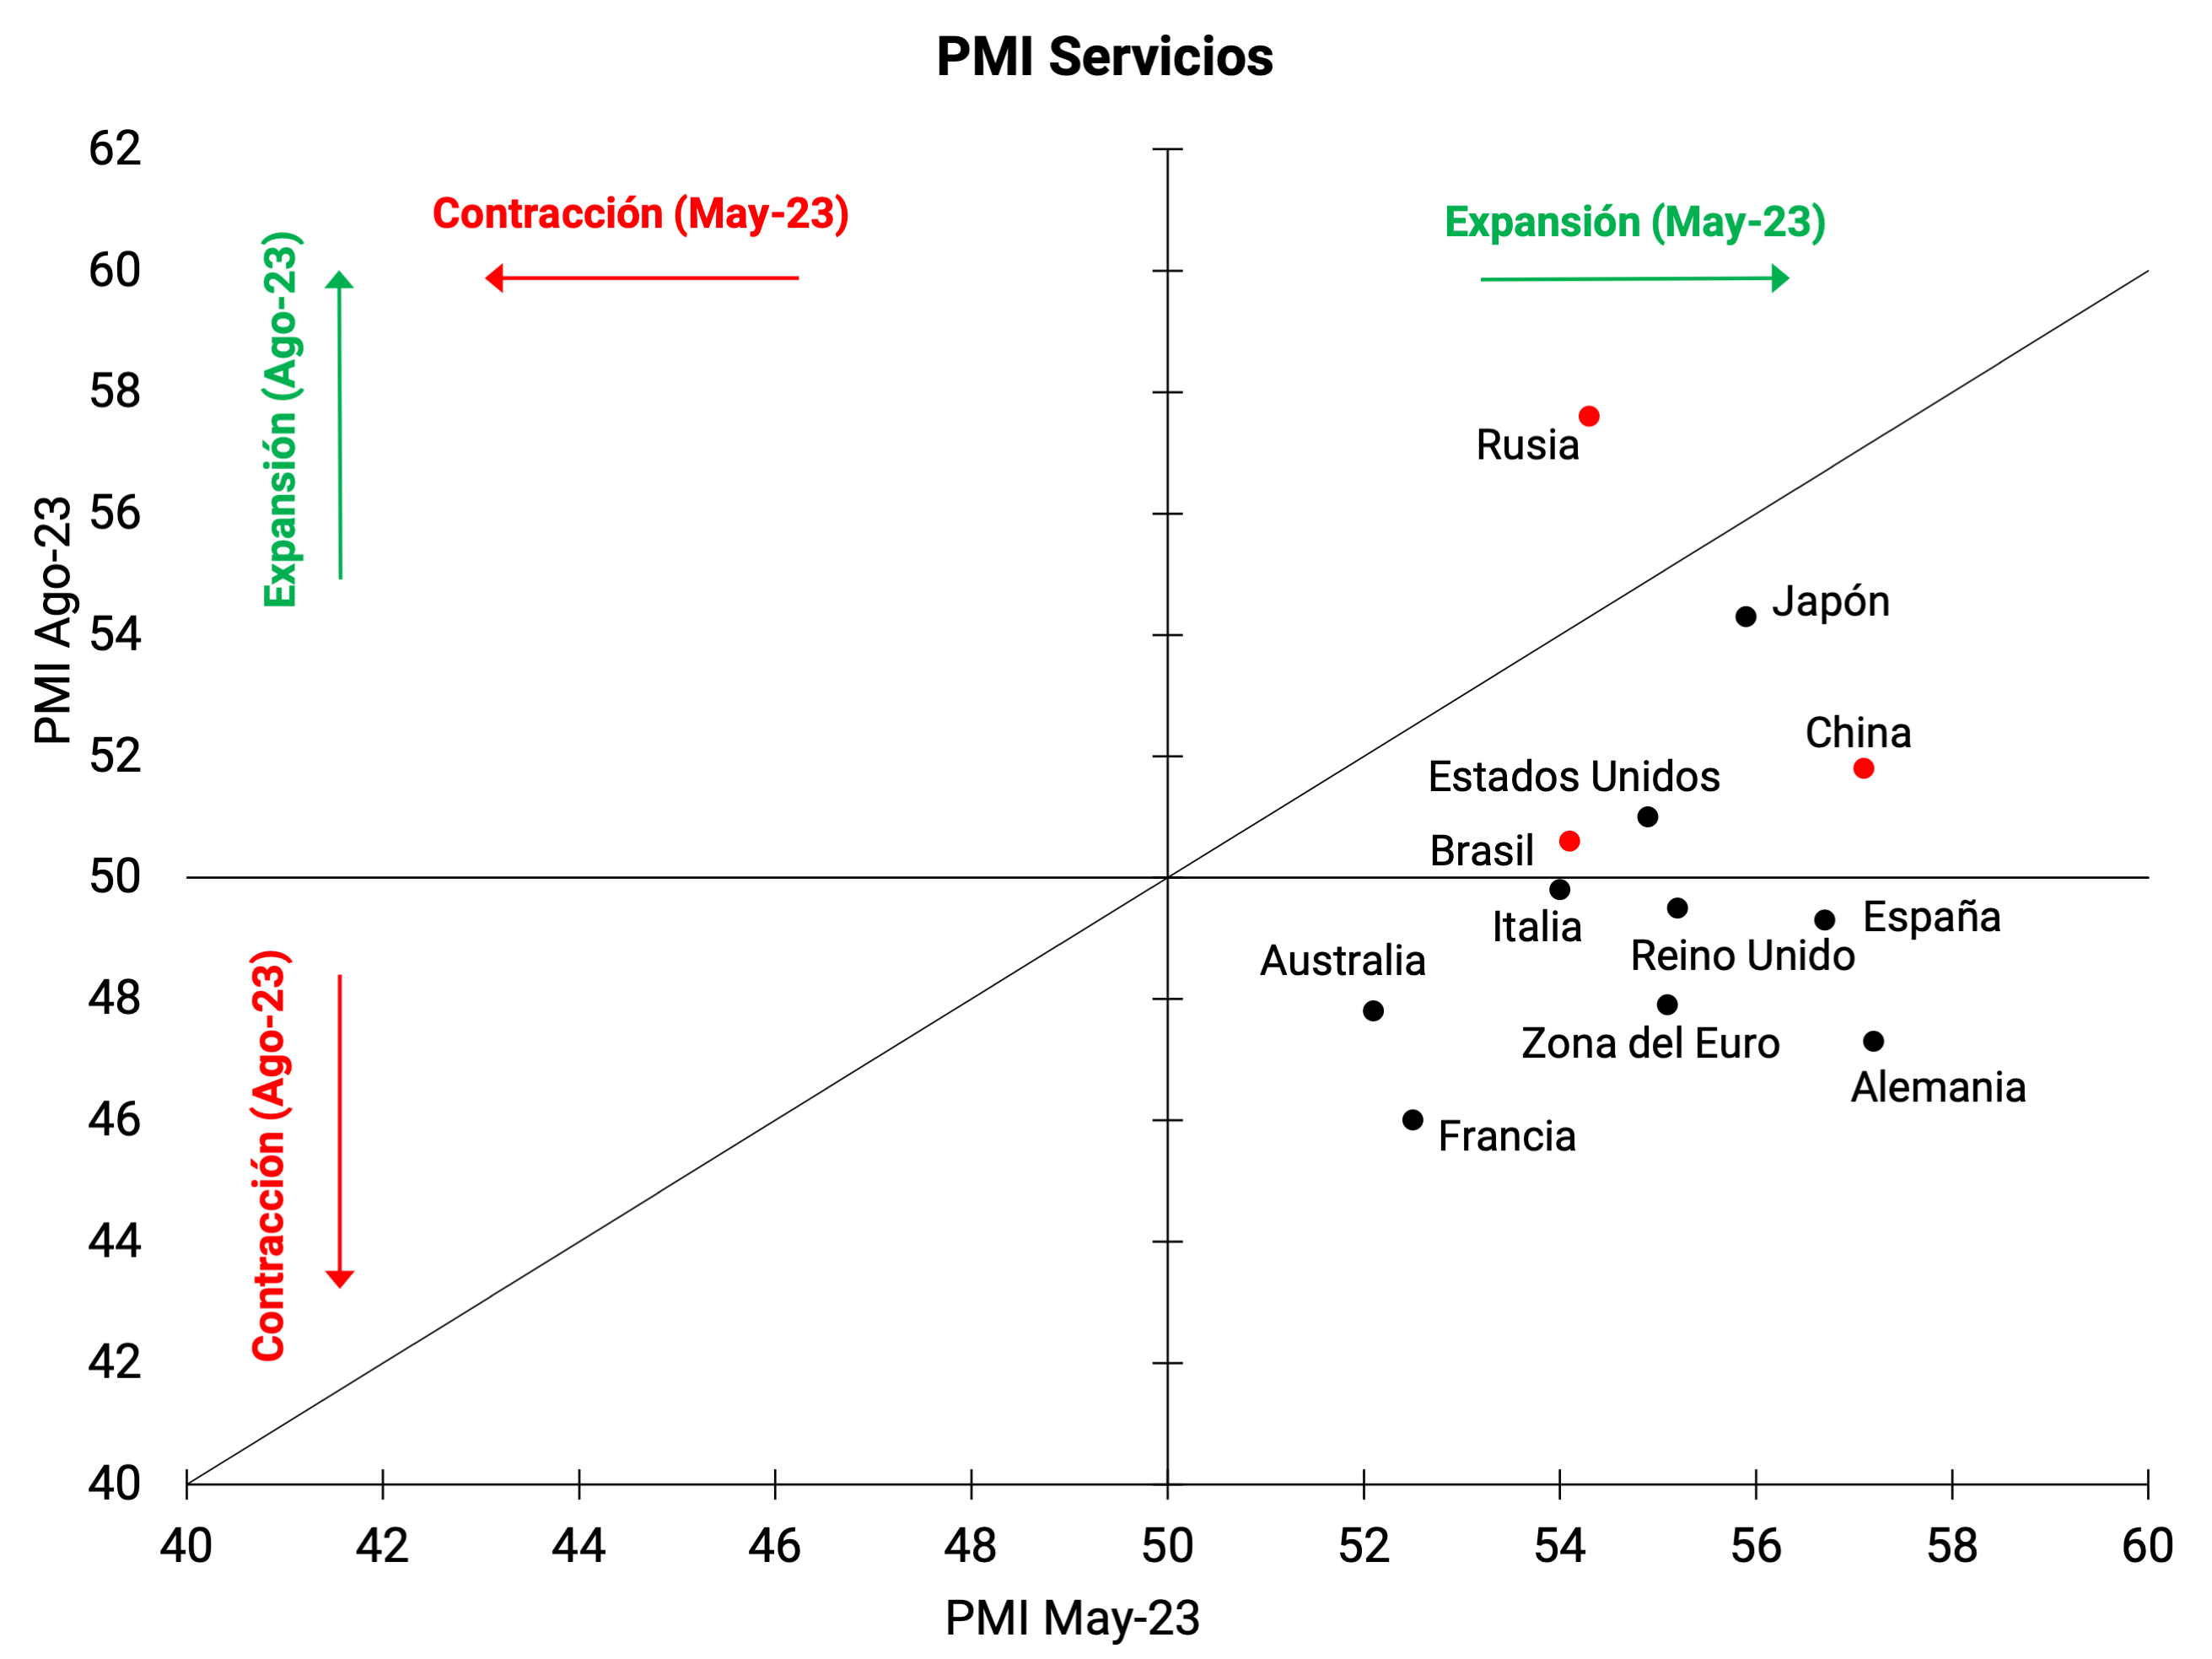
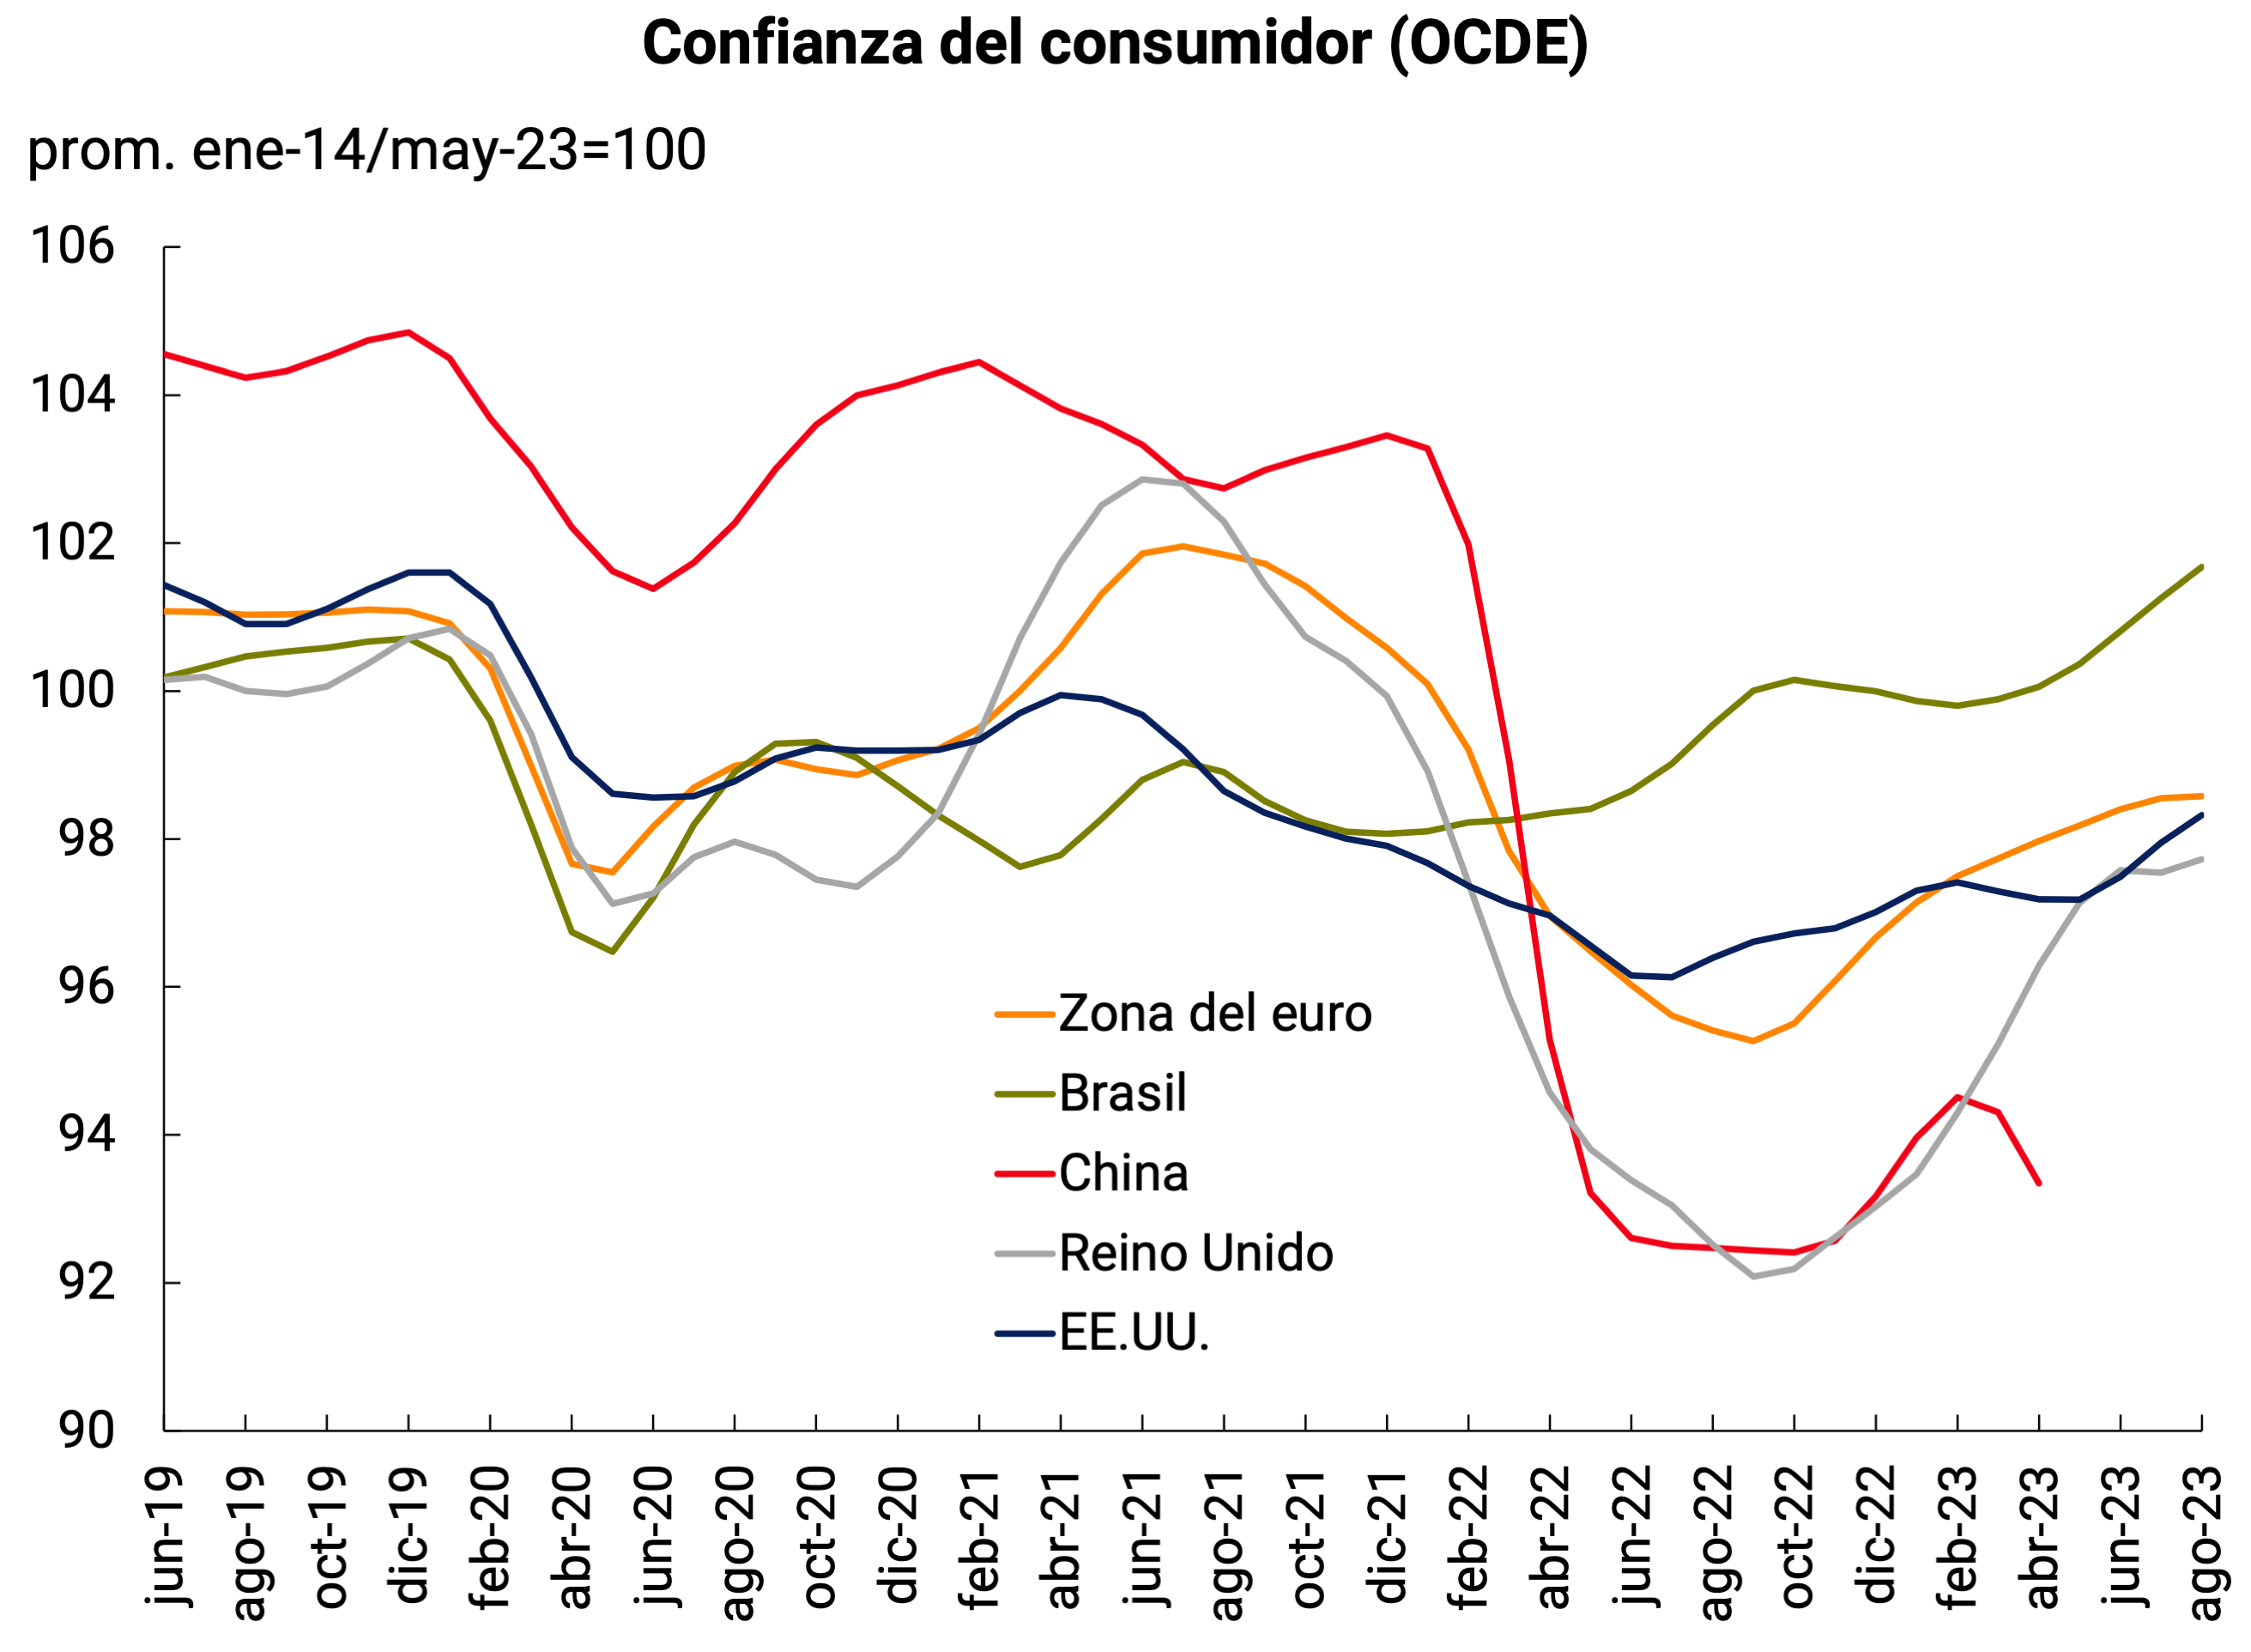
Source: BCRA based on data from IHS Markit, OECD and Trading Economics.
The outlook for economic activity continues to point to a slowdown in global growth this year, and a similar expansion for 2024, with persistent inflation, especially in advanced economies, and higher financial risks. Developing and emerging economies, particularly China and India, are expected to continue to show higher-than-advanced growth rates and lead the global expansion, albeit with greater downside risks (see Table 2.1). The latest forecasts, in general, have slightly increased the global growth projection for this year, although it remains below last year’s rate. Thus, the International Monetary Fund (IMF) forecasts that global growth will slow to 3% this year (after a 3.5% increase in 2022) and will also be 3% by 2024, while the consensus of analysts forecasts expansion rates of 2.7% for both years. On the other hand, forecasts also point to a gradual reduction in the global inflation rate, which will remain at high levels in 2023 and 2024. According to the IMF, headline inflation will fall from 8.7% in 2022 to 6.8% in 2023 and to 5.2% in 2024 (-0.2 p.p. and +0.3 p.p. compared to the previous forecast, respectively), but with core inflation (which excludes energy and food prices) more persistent.
Table 2.1 | Projections of economic activity 2022-2023
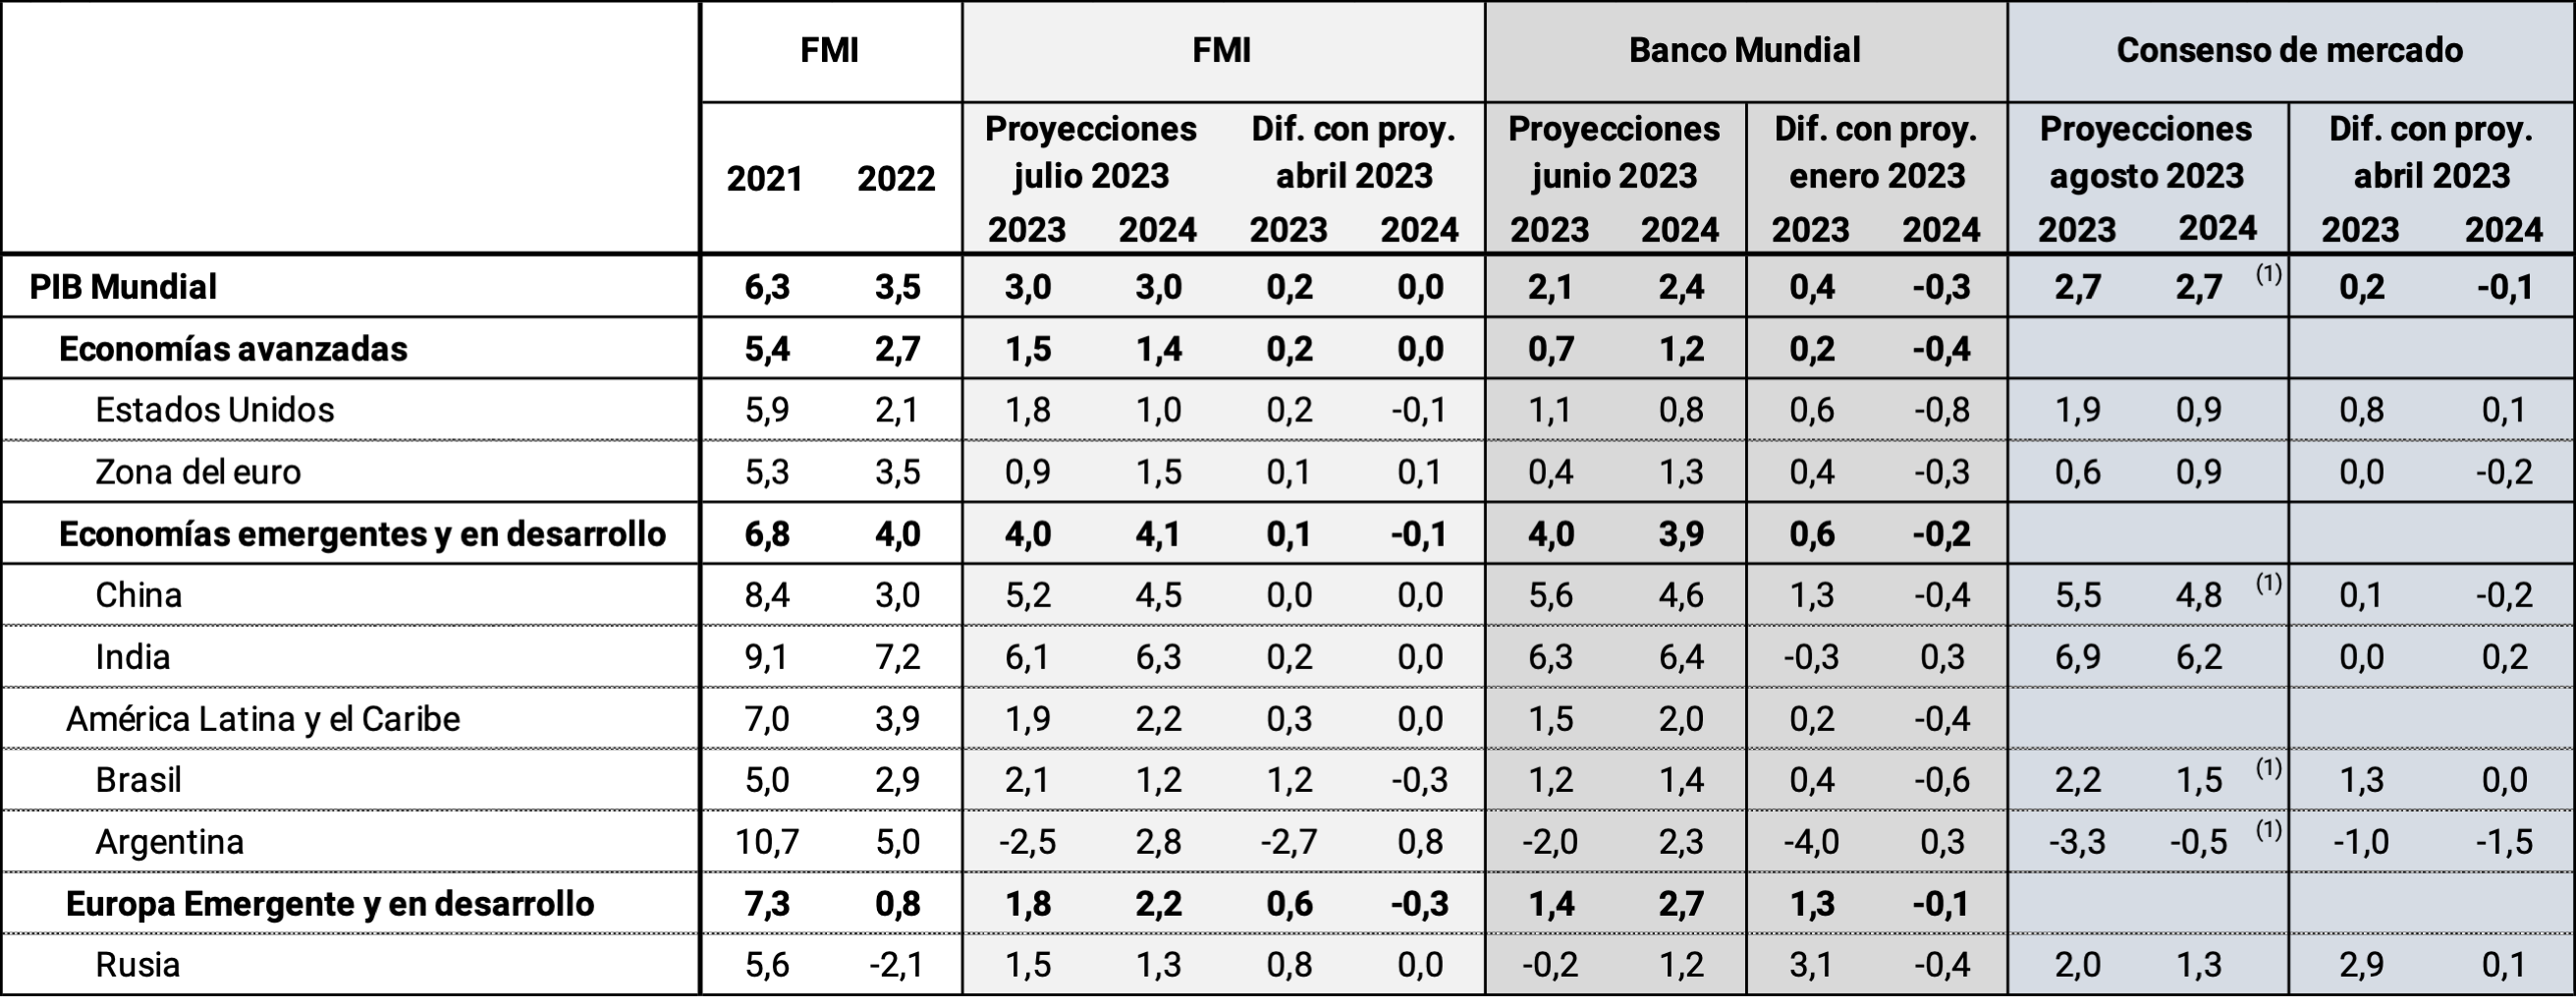
Source: IMF, World Bank and Reuters (market consensus). (1) July 2023 forecast.
Risks to global activity remain skewed to the downside. The risk of lower growth in China increased: the main factor of uncertainty lies in the impact of the real estate crisis on the financial system; And the economic policy response will be key, which, for the moment, the consensus of market analysts judges as modest. Another important factor is the persistence of core inflation, particularly in some advanced economies, in a context in which monetary policy cycles are lagging between advanced and emerging economies. This could lead to additional policy interest rate hikes and new financial turbulence, such as those recorded in the U.S. banking system in the first quarter or those linked to situations of unsustainability of corporate or sovereign debts. Public debt-to-GDP ratios remain above pre-pandemic levels in emerging countries and low-income countries. In the latter group, the situation is more delicate, with interest payments on the debt as a percentage of tax revenues growing in recent years. Geopolitical conflicts, such as an escalation of the war in Ukraine or an escalation of tensions between China and the United States, cannot be ruled out as additional sources of risk. In addition to the negative impact of these factors on international financial stability, they may imply greater trade fragmentation (see Box “Argentina in BRICS”).
2.2. Monetary policy: stable or rising interest rates in advanced countries, easing in developing countries
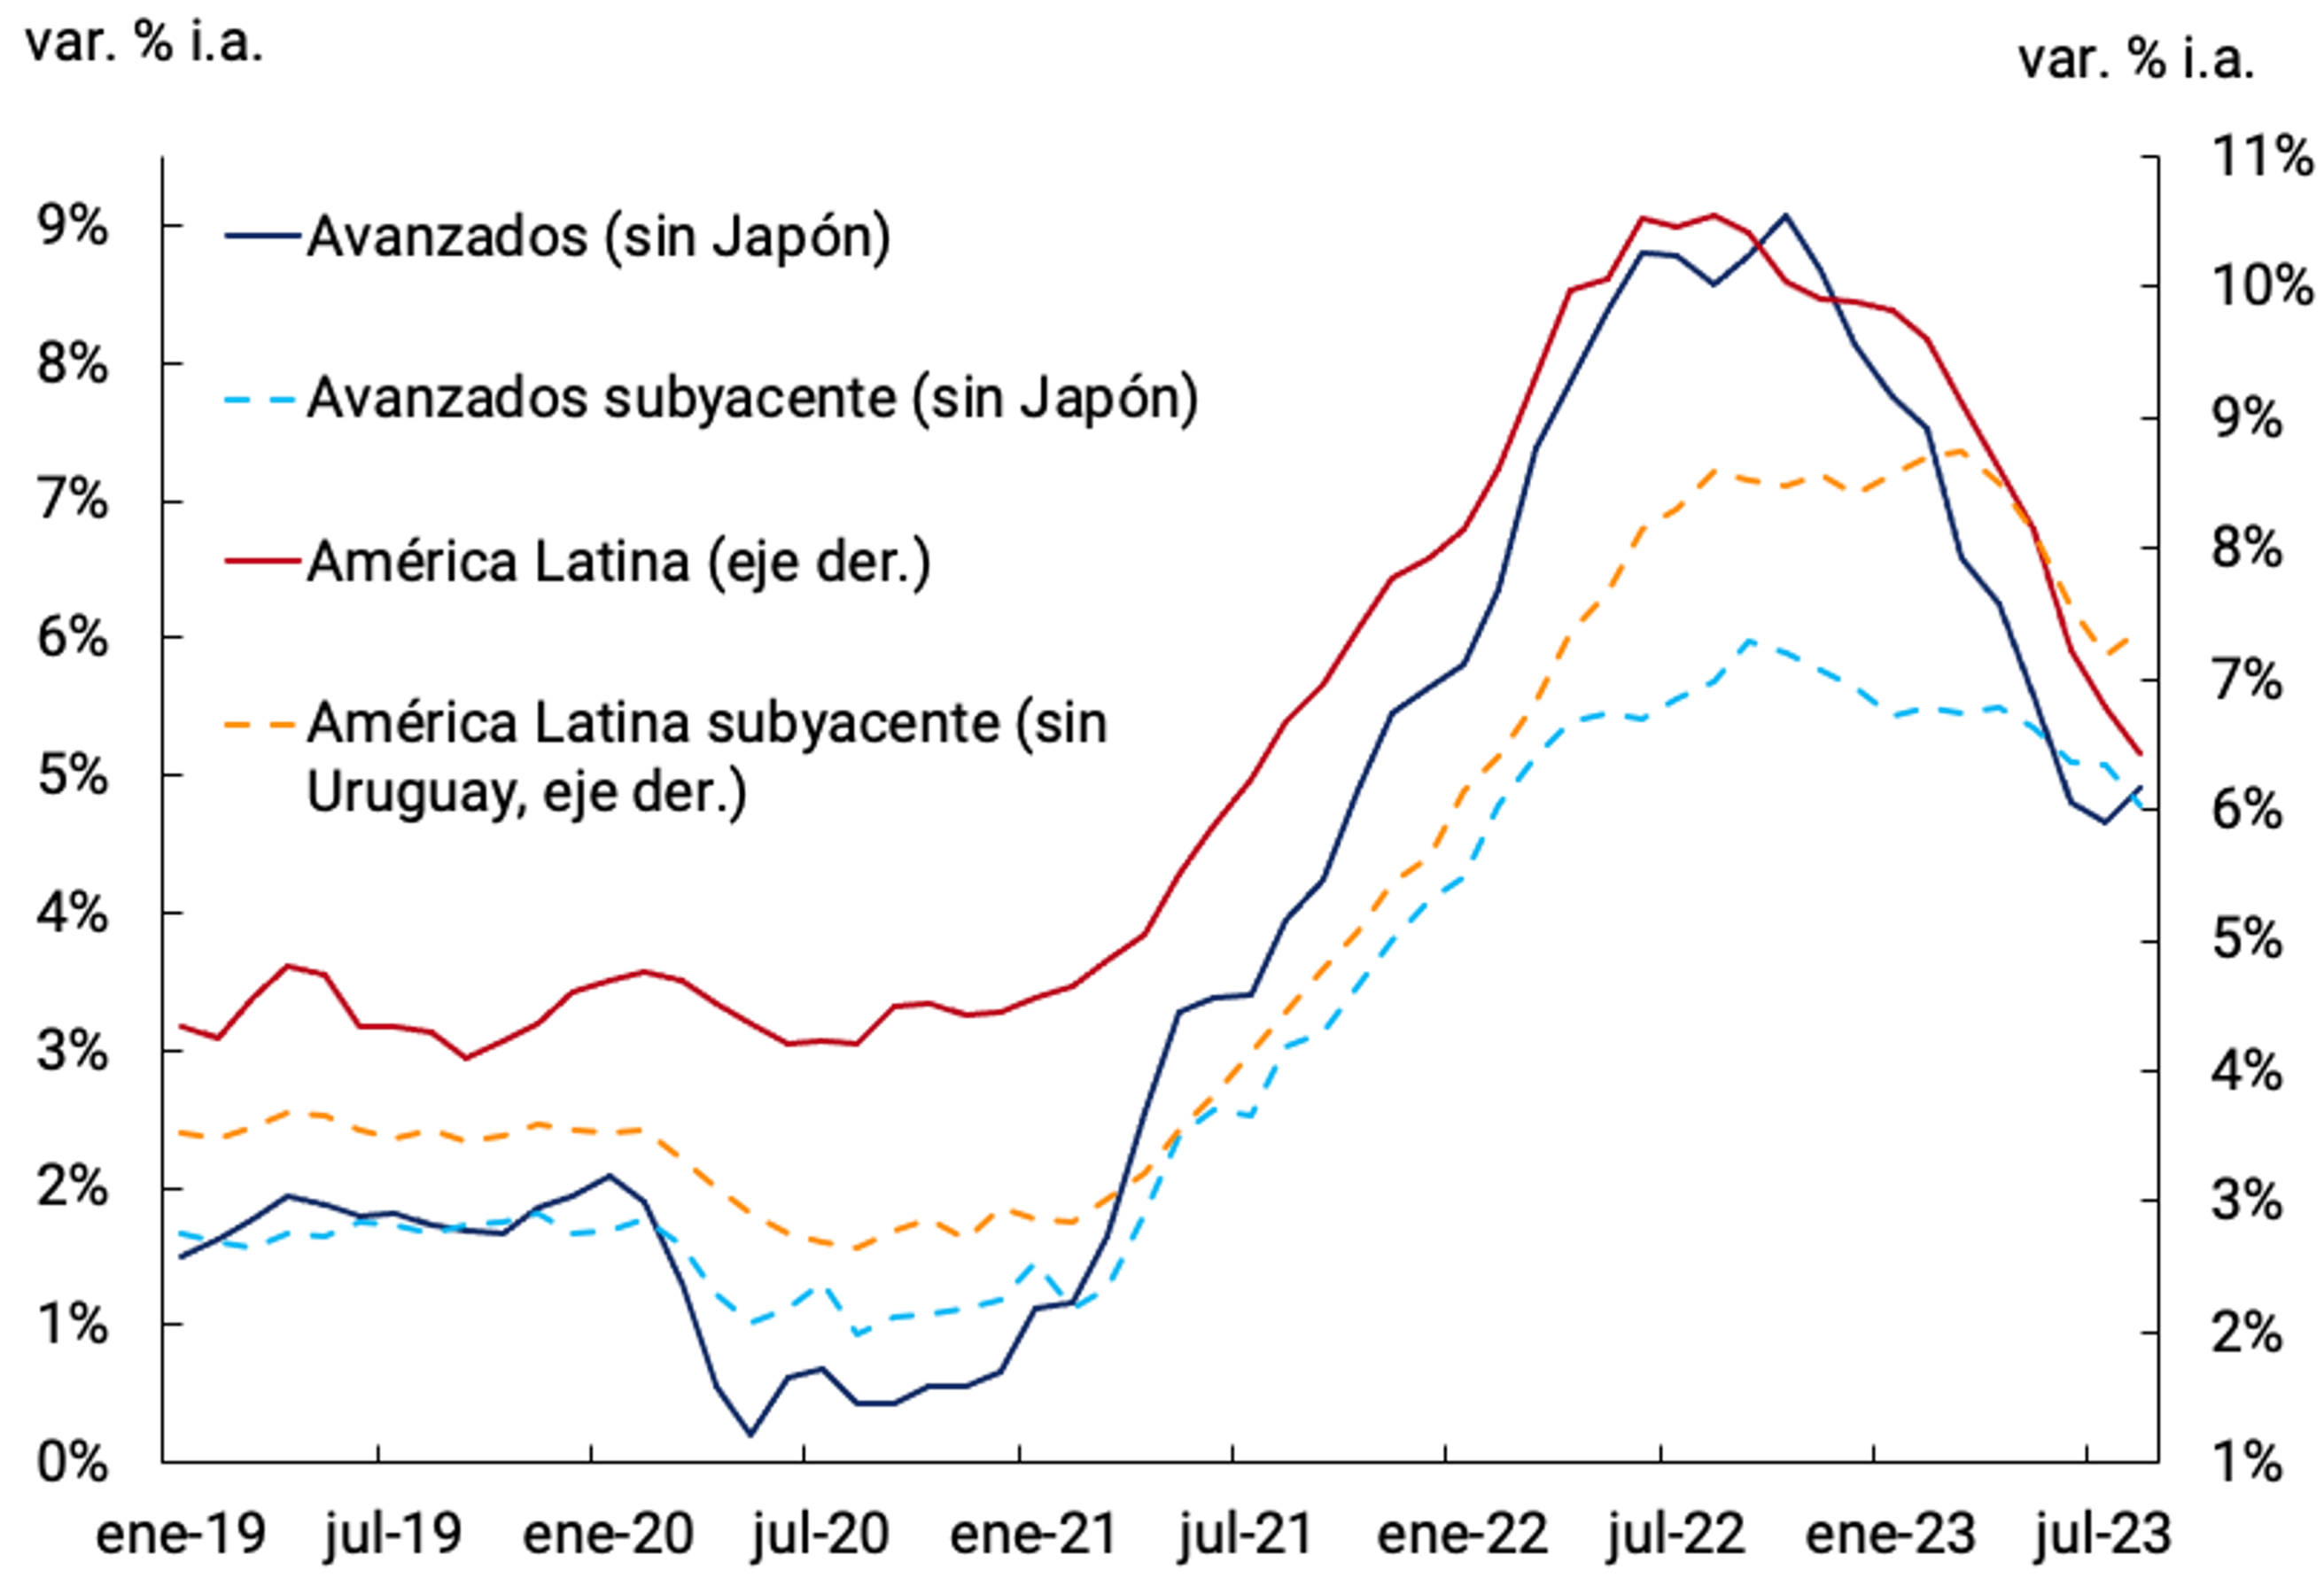
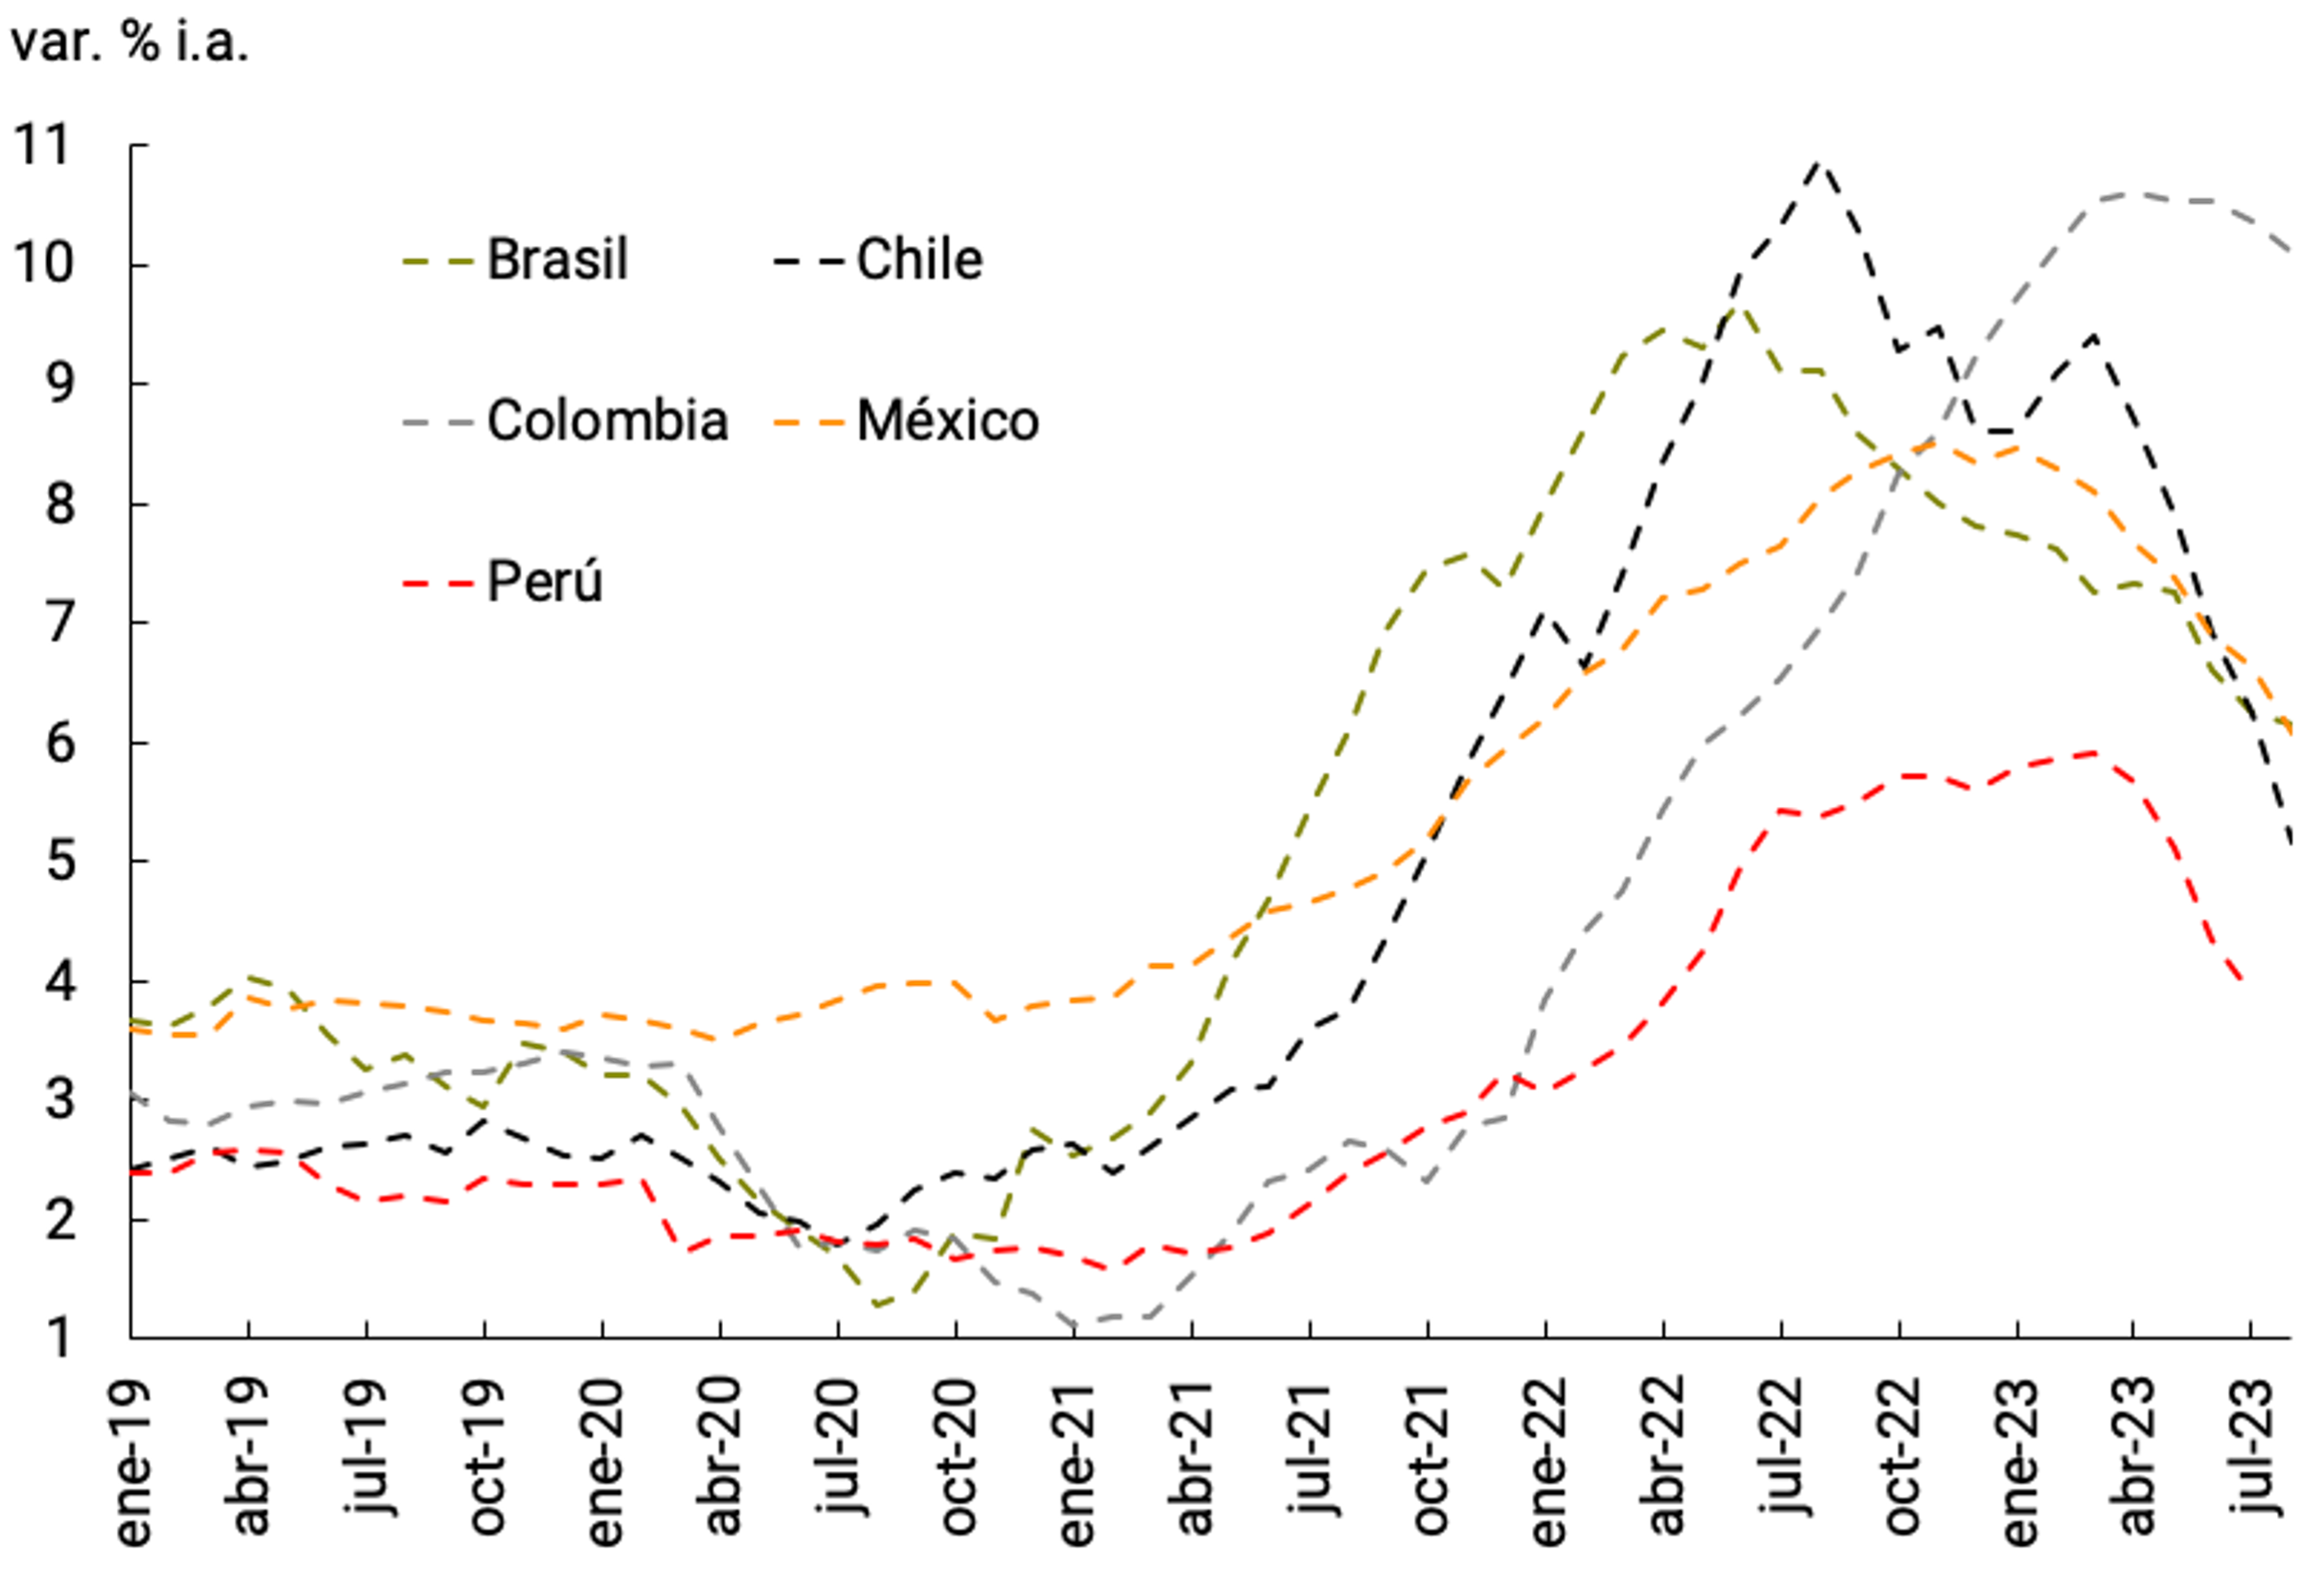
Monetary policy cycles remain outdated. Central banks in developed economies keep their policy interest rates (MPRs) “on pause” and could even raise them again (as the European Central Bank did in September); while those in developing countries have begun to lower them, particularly in Latin America. These monetary policy cycles are related to the evolution of inflation: Latin American central banks began to raise their MPRs earlier, and inflation in the region has begun to ease earlier (see Figures 2.4a and b).
Figure 2.4 | Monetary policy and inflation
to. Monetary Policy Rate
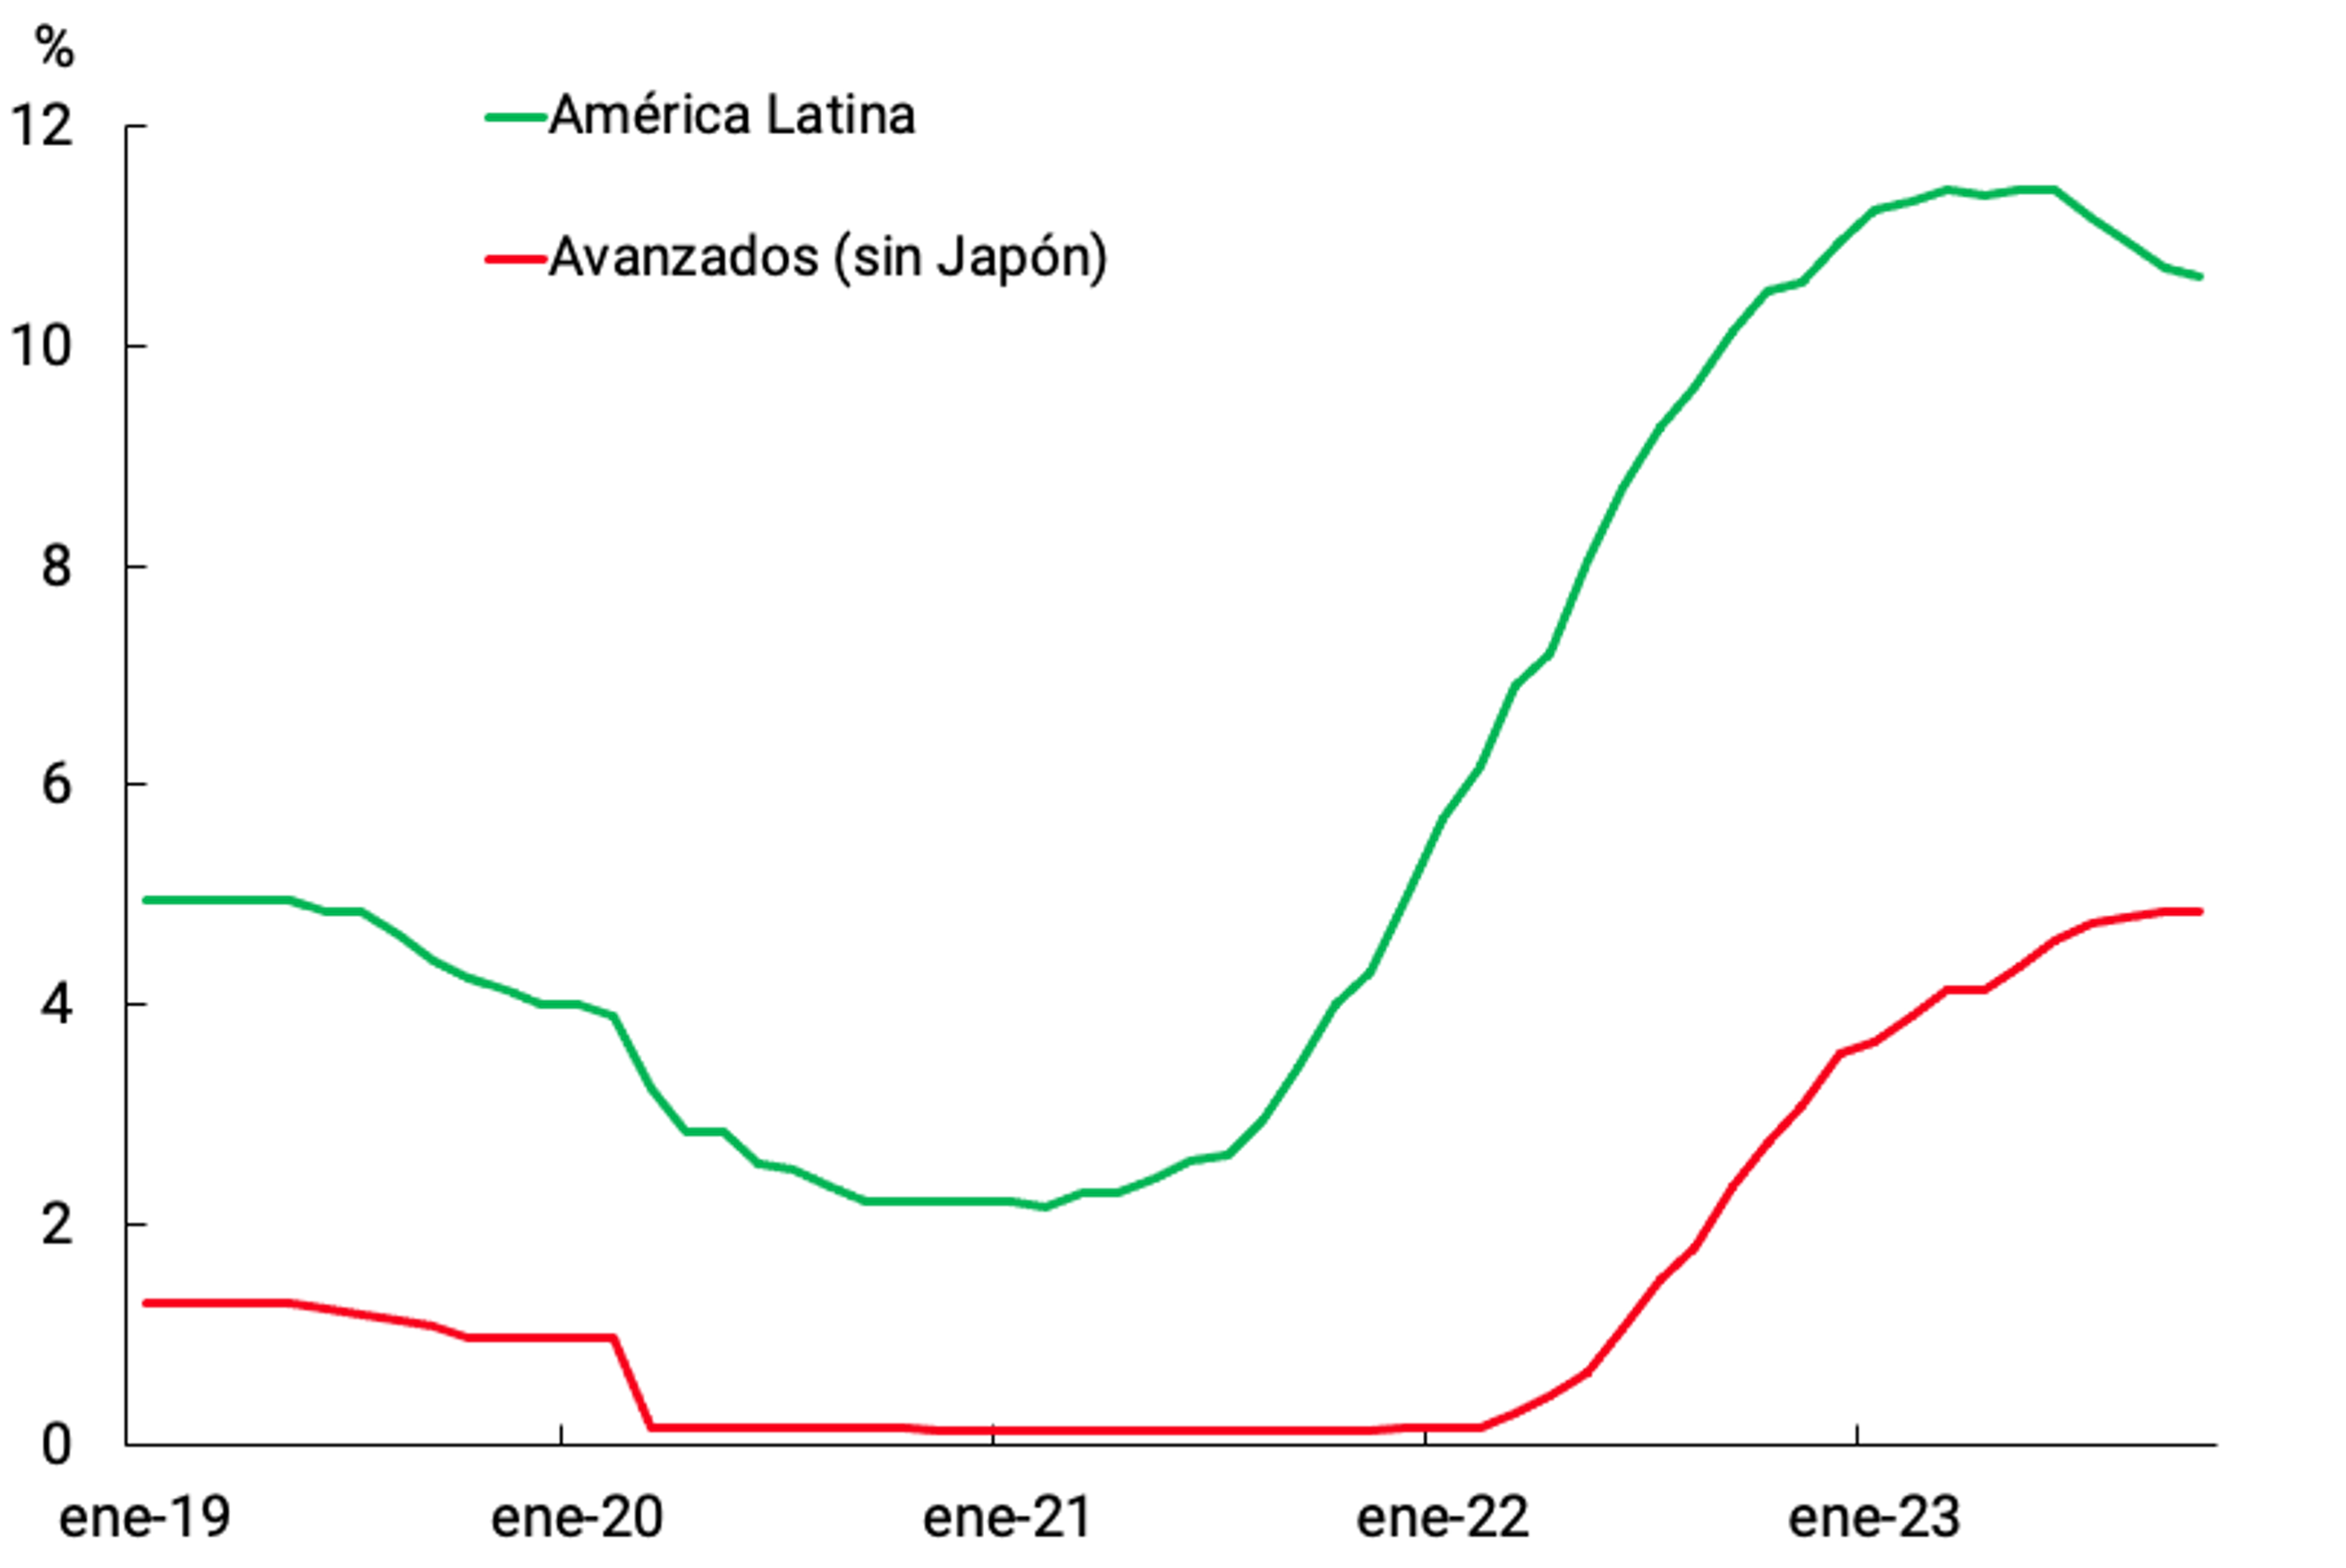
b. Inflation
Source: BCRA based on Reuters data.
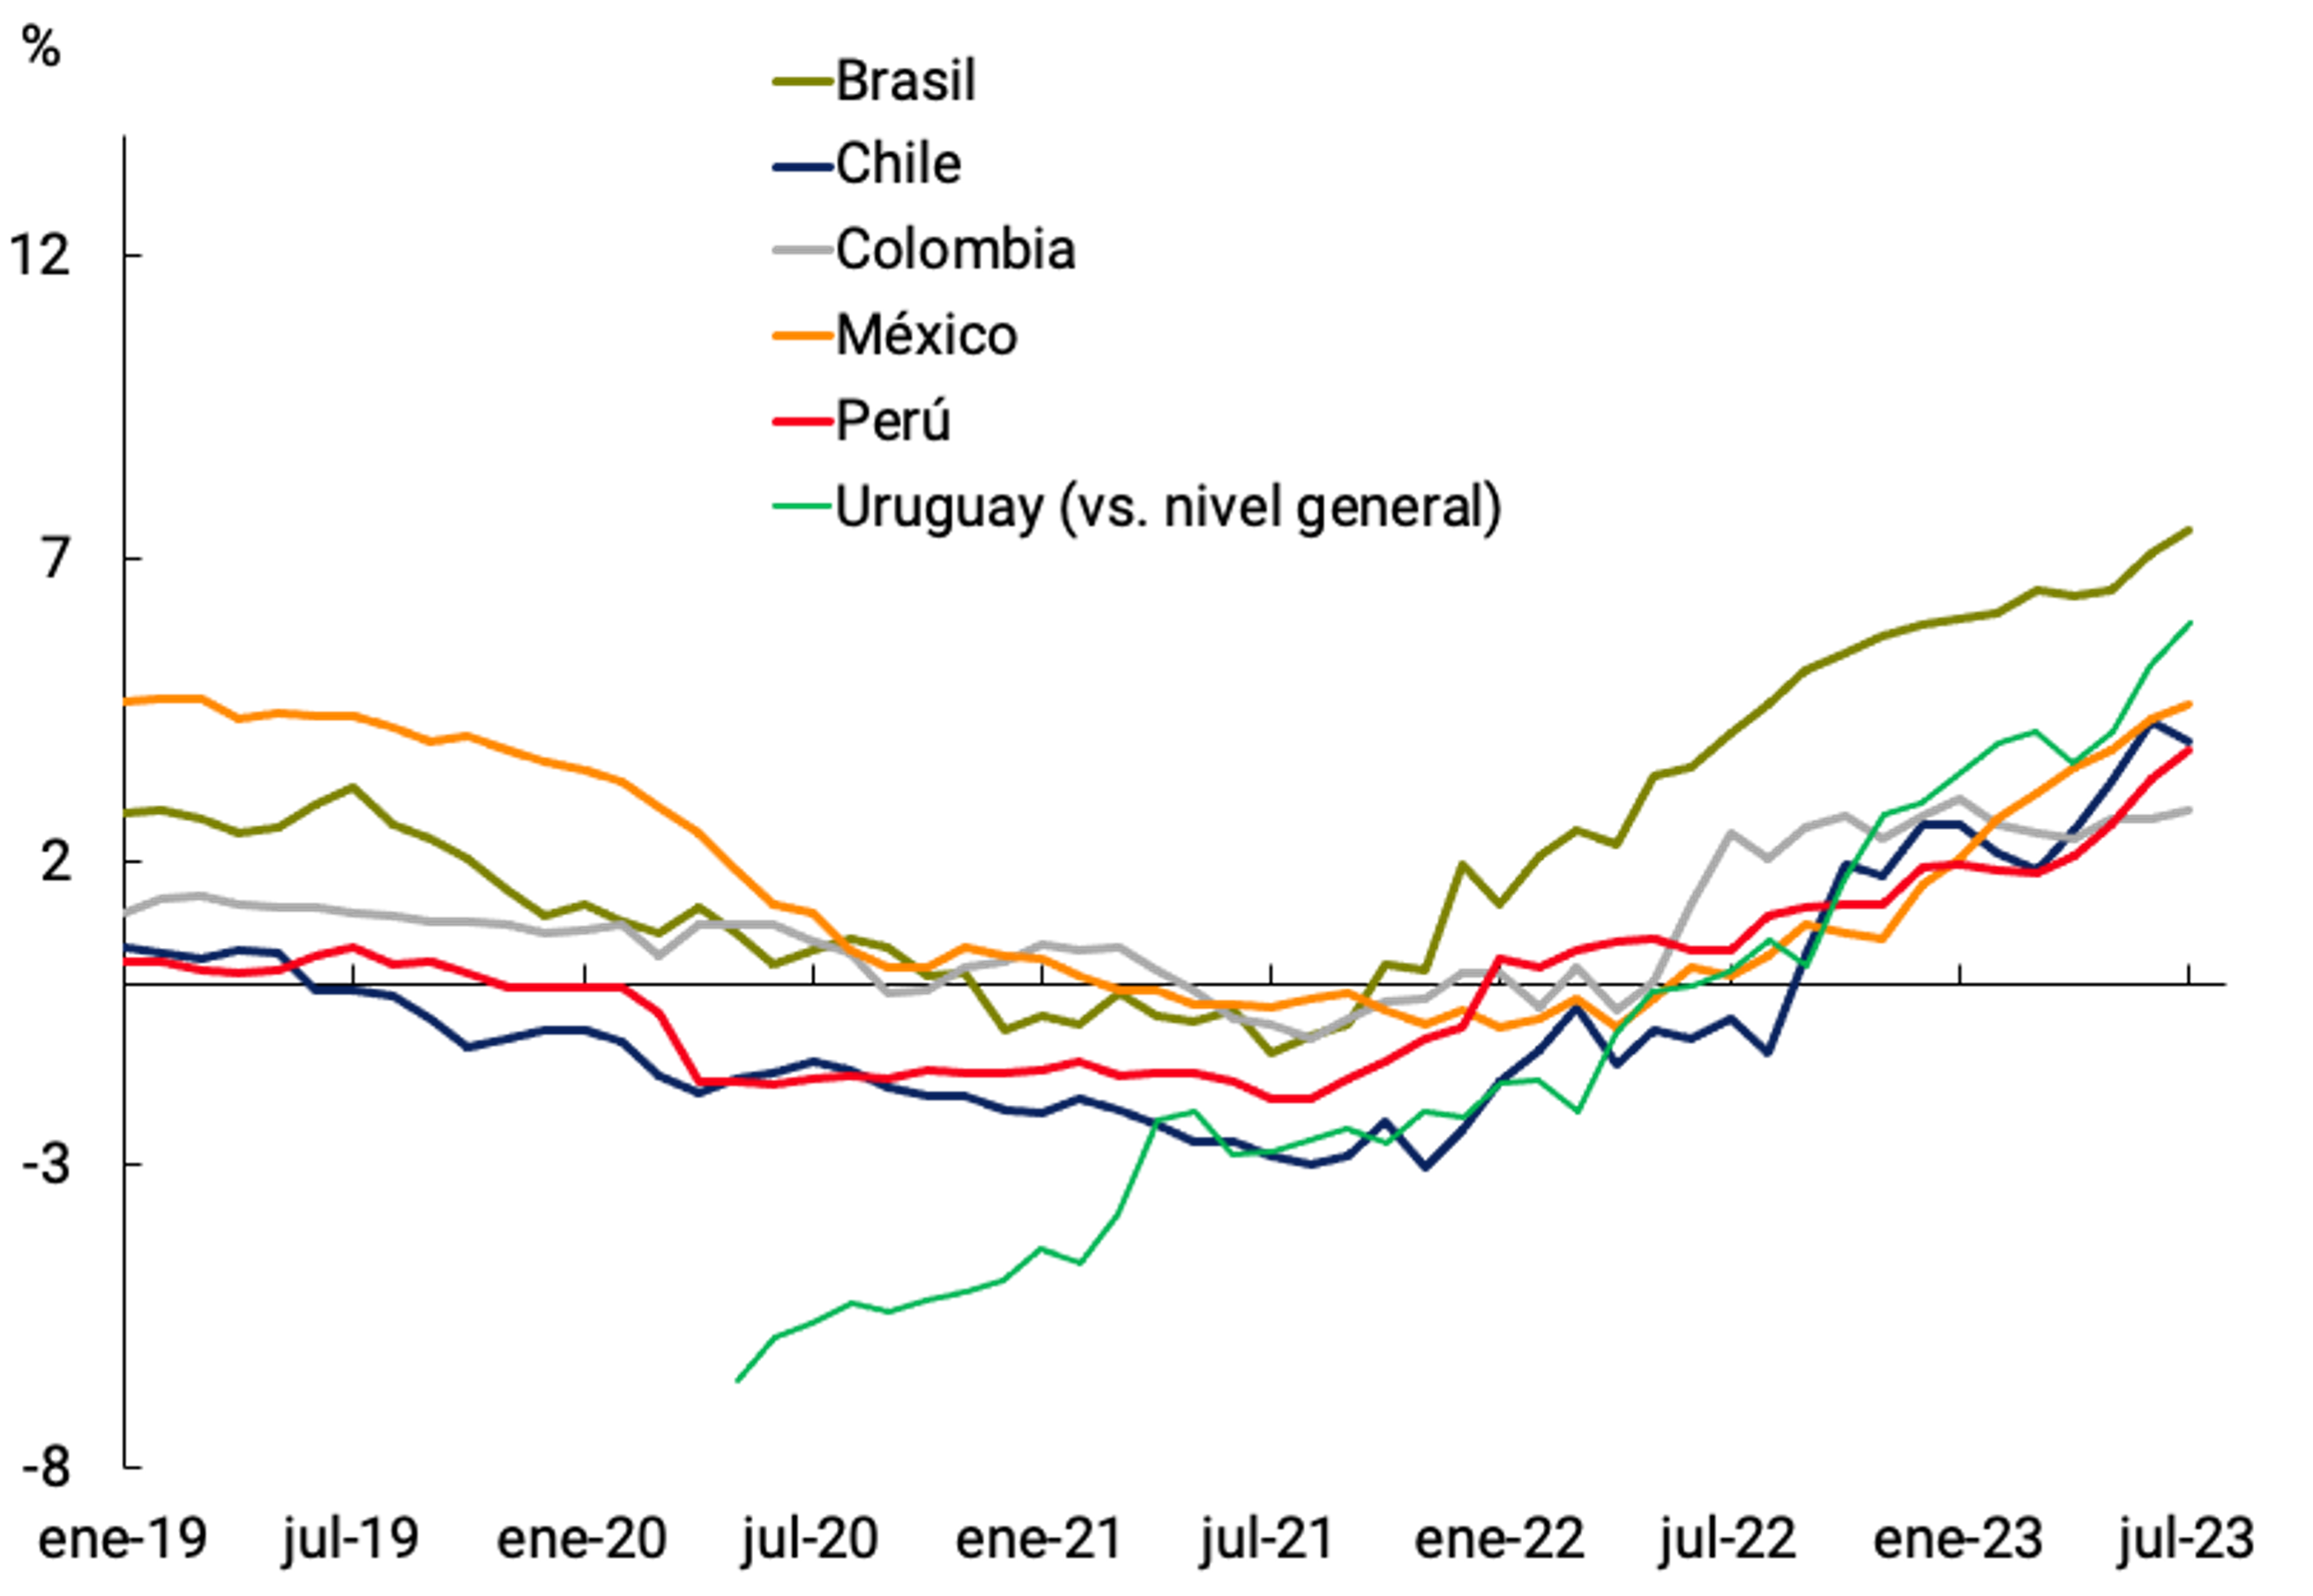
In Latin America, the Central Bank of Uruguay began reducing its MPR, followed by those of Brazil and Chile. In all cases, the MPR would have already passed its maximum level (perhaps with the exception of Colombia). The MPR in real terms (vs. core inflation) in all cases continued to increase, except in Chile. Core inflation is falling, except in Colombia (where, although it has stopped rising, it is constant at values close to 10.5%; see Figures 2.5a and b).
Figure 2.5 | Economies of Latin America
to. Real Monetary Policy Rate
b. Core inflation
Source: BCRA based on Reuters data.
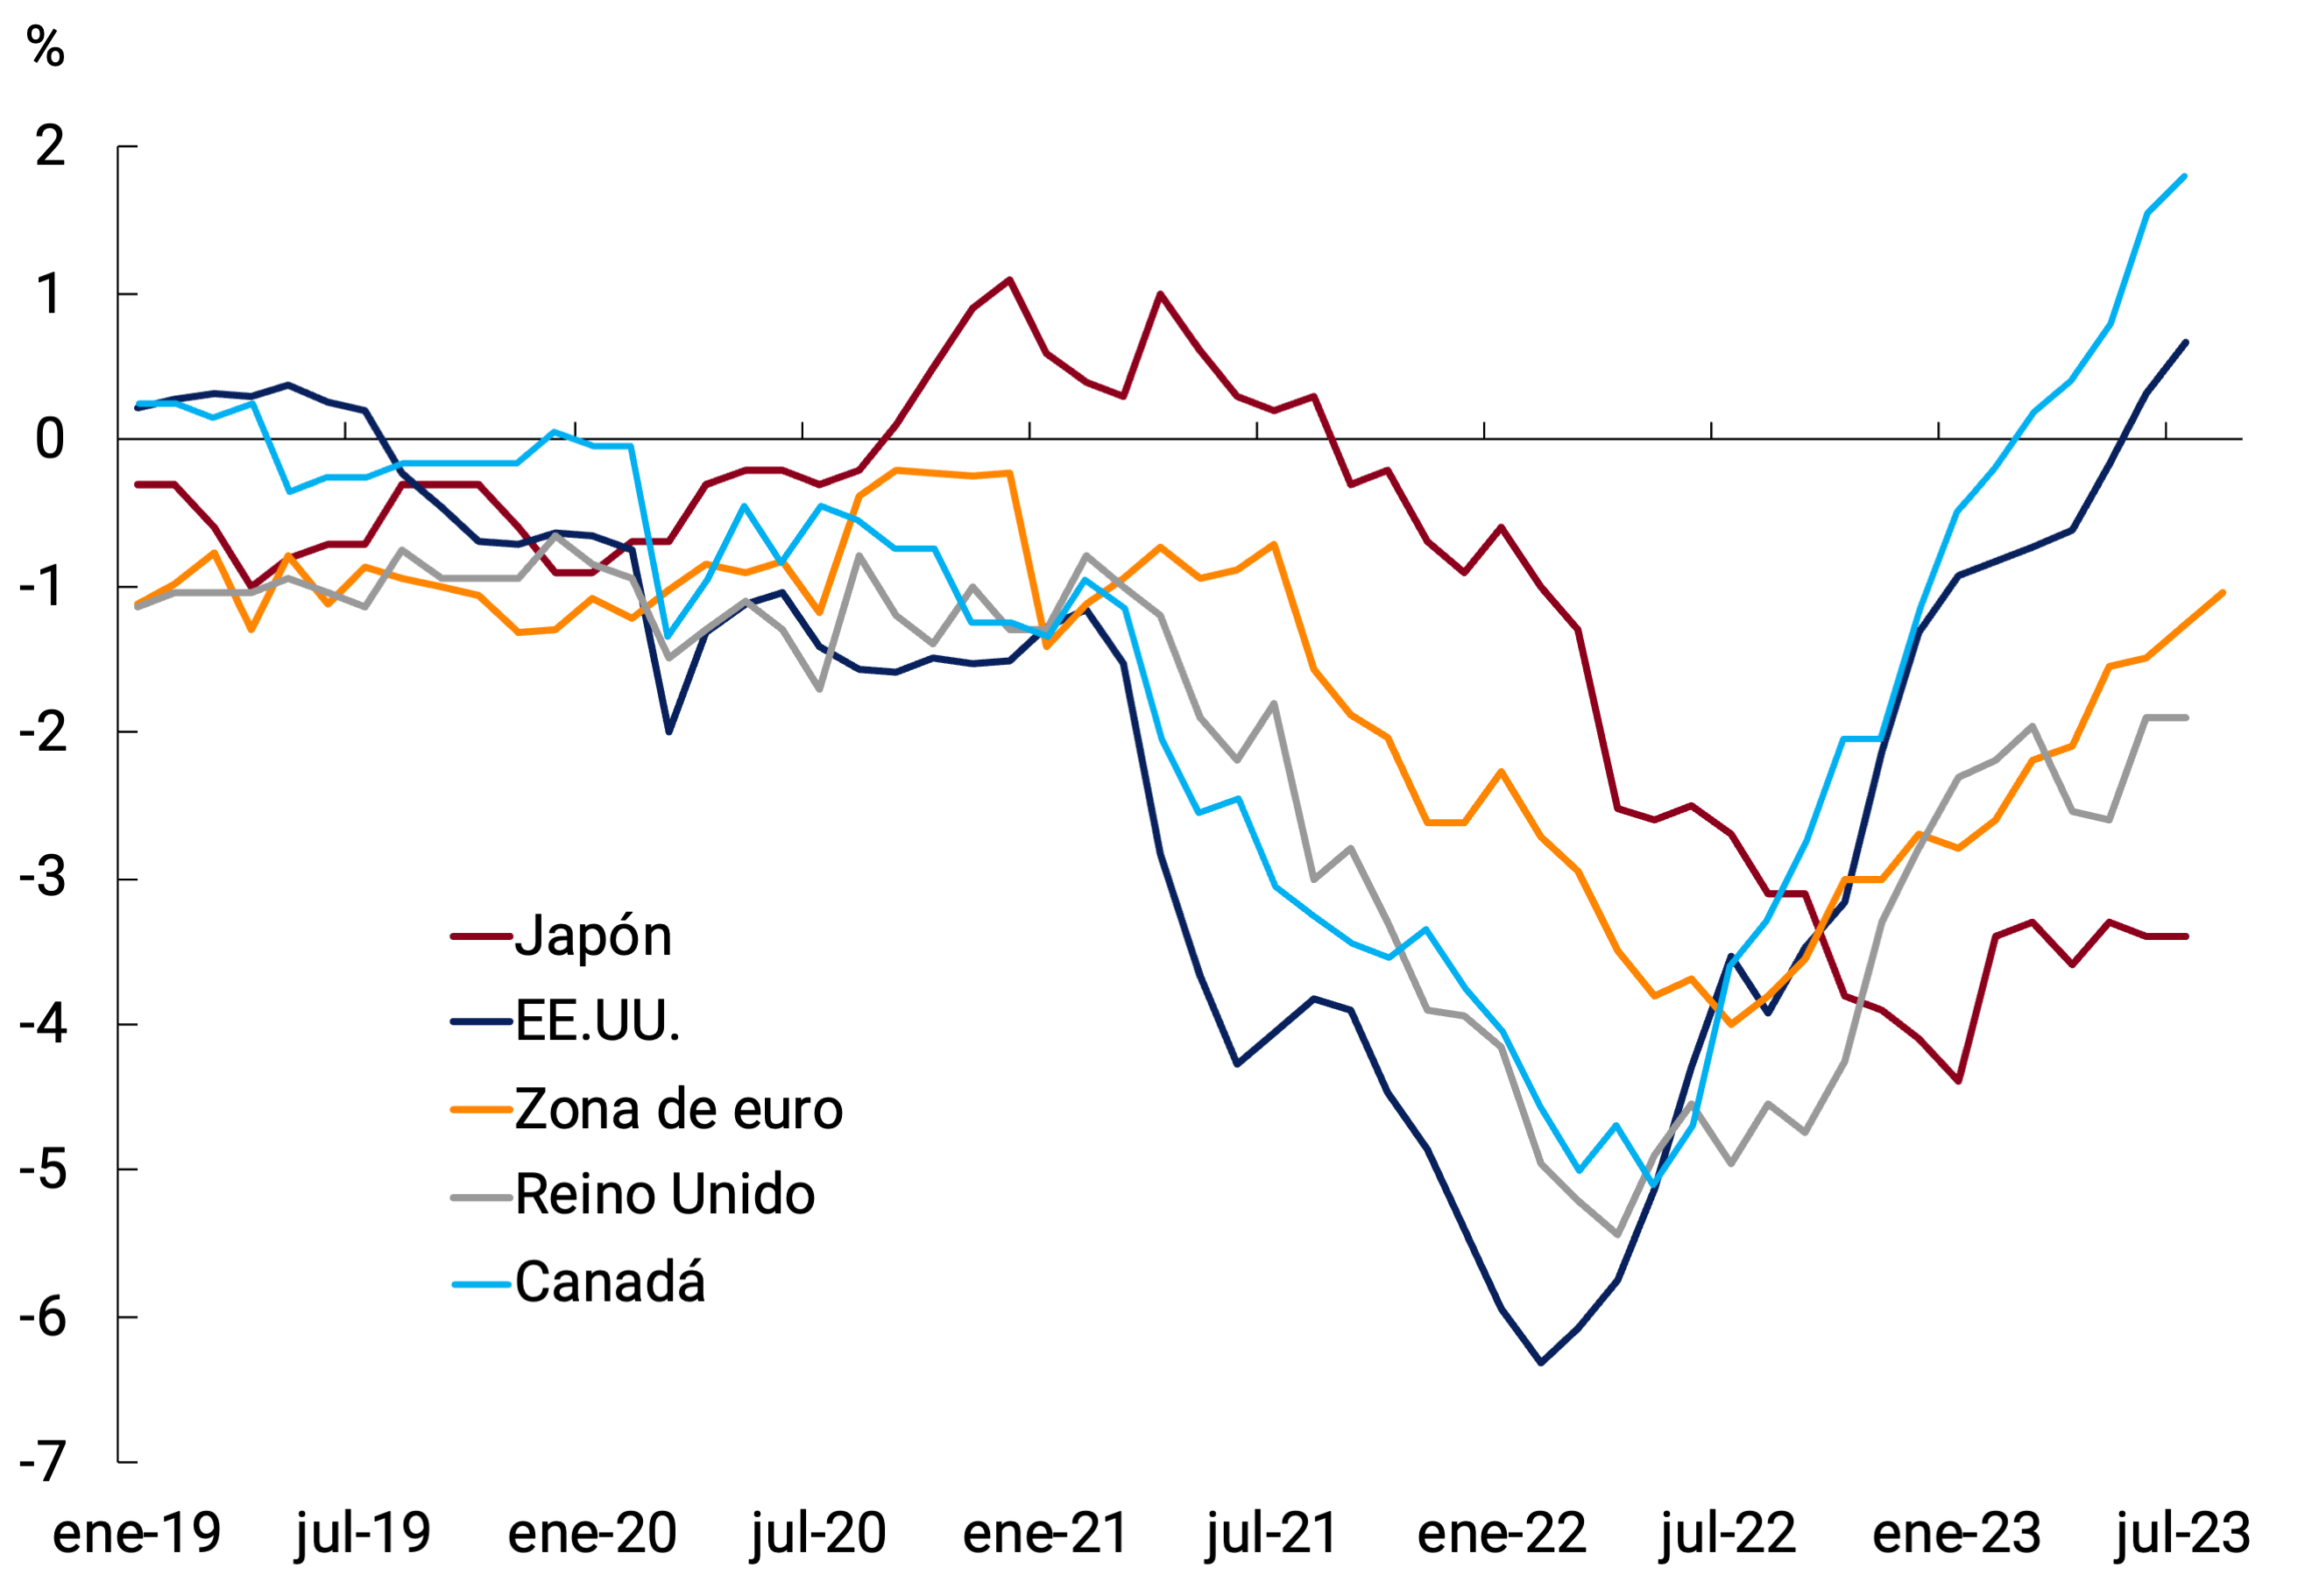
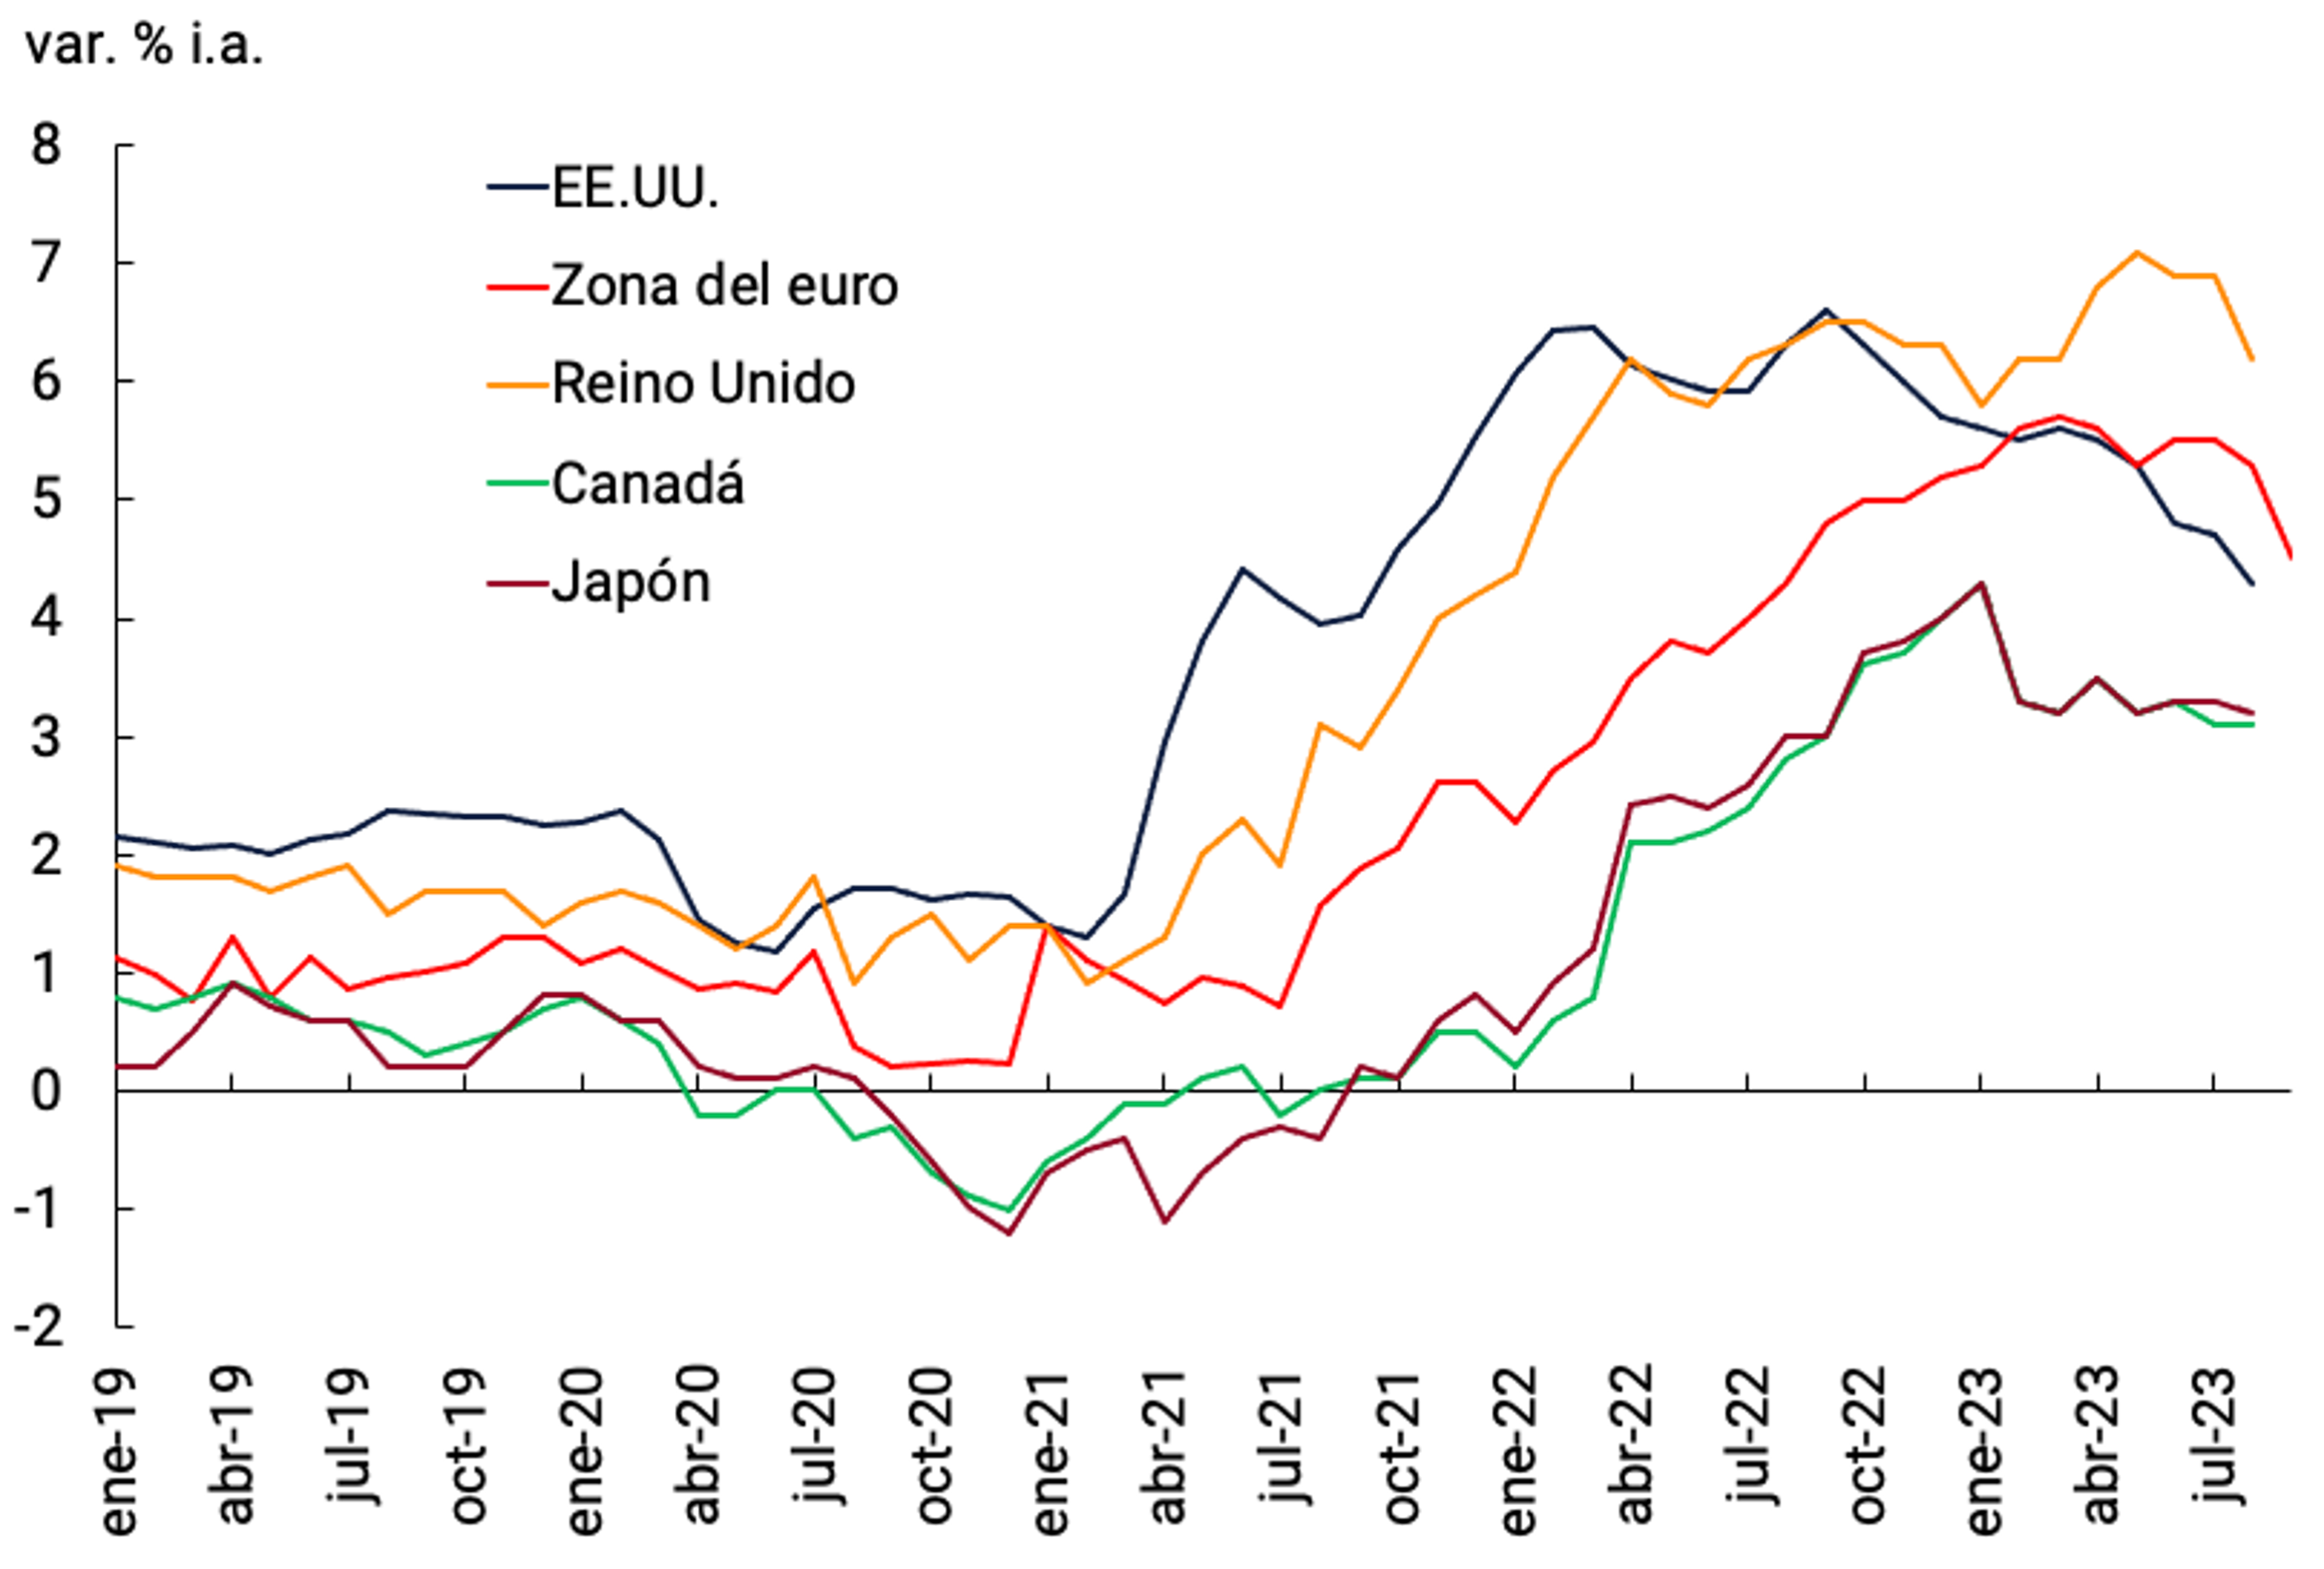
By contrast, while advanced economies are heading for the “terminal” rates of this cycle, there is no sign that they will begin to reduce them. Another difference with respect to Latin American economies is that in most of the developed countries in the sample, MPRs are projected at high levels for longer than expected so far; in part, because core inflation remains high and is slowly falling (see Figures 2.6a and b).
Figure 2.6 | Major advanced economies
to. Real Monetary Policy Rate
b. Core inflation
Source: BCRA based on Reuters data.
This interest rate dynamic has been reflected in the foreign exchange market. If for a good part of the year Latin American currencies had been appreciating -in part- driven by the rate differential, now this factor is reversed at the margin, and in fact depreciations of currencies are observed along with capital outflows in the main countries of the region.
In addition, within the region, Chile’s monetary authority (BCCh) began a new process of accumulating international reserves. The BCCh initiated a program to replenish and expand international reserves for a total of US$10,000 million, to strengthen the country’s international liquidity position, purchases that will have a zero monetary effect when sterilized (see Figures 2.7a and b).
Figure 2.7 | Indicators of Chile’s external sector
Chile’s Multilateral Real Exchange Rate
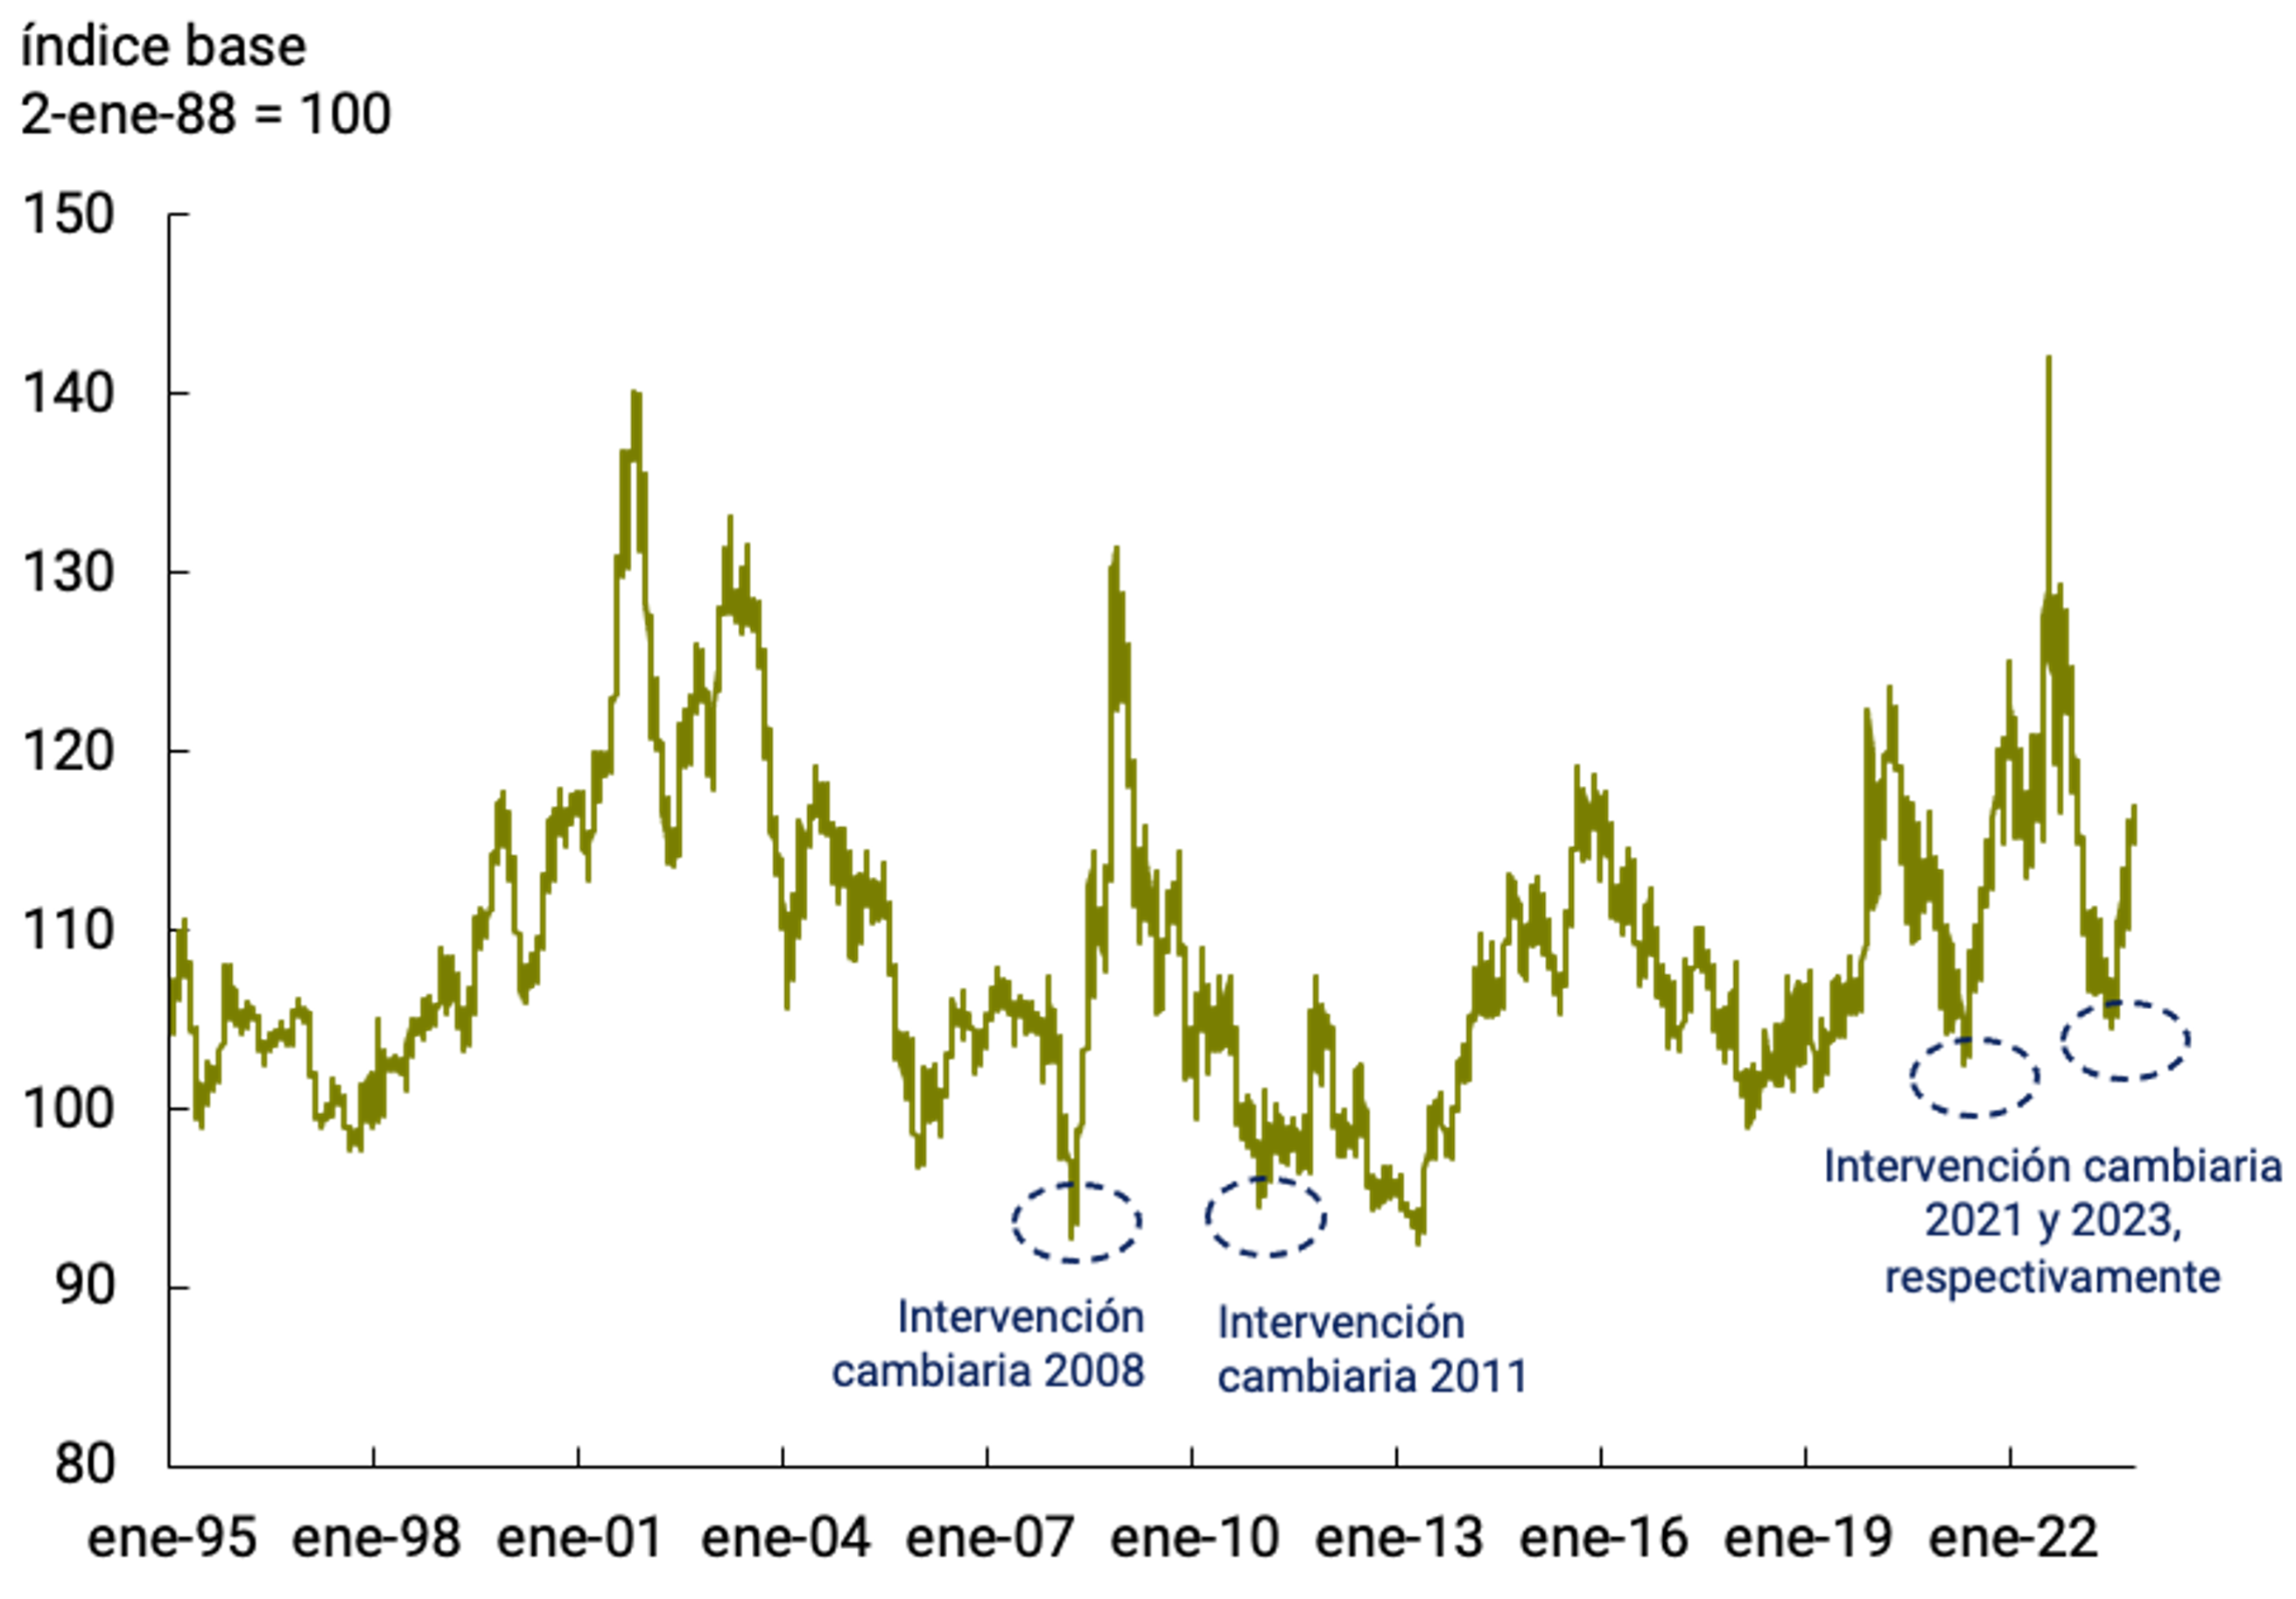
Chile’s International Reserves
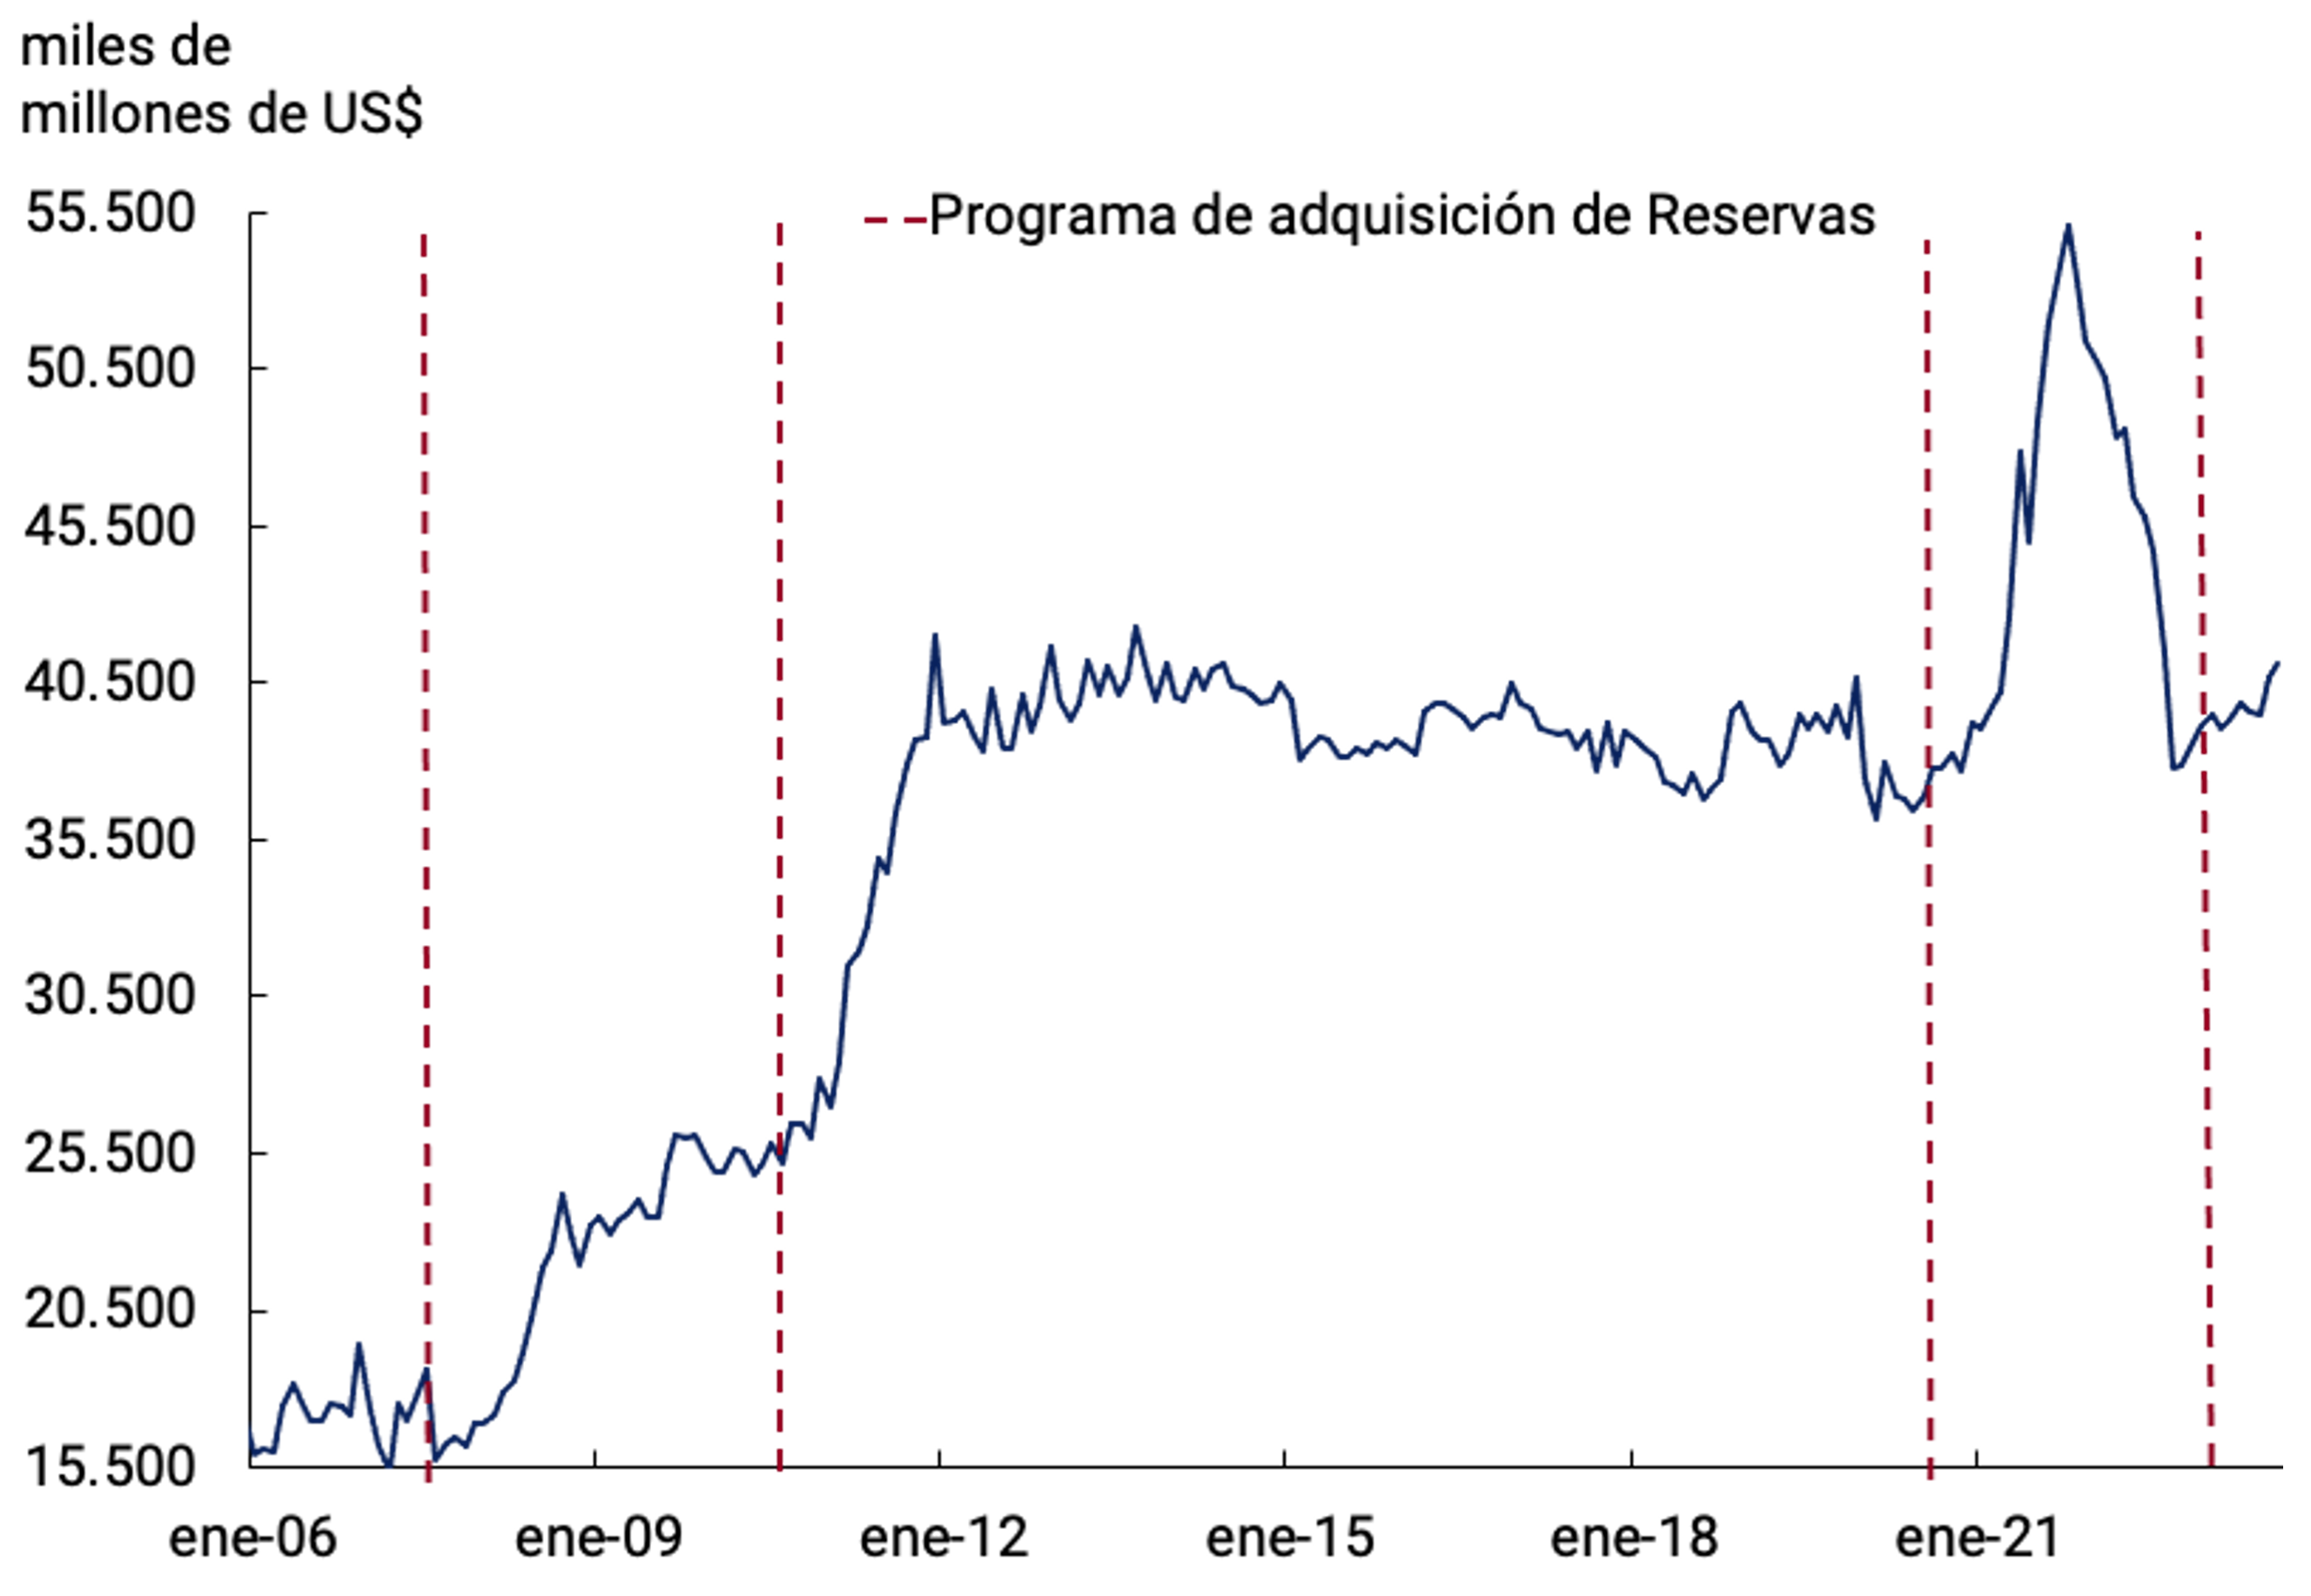
Source: BCRA based on data from the Central Bank of Chile.
Meanwhile, the Fed’s quantitative tightening programs continued as announced, and without new impacts on the financial sector, after what happened with Silicon Valley Bank, among others. In addition, the risks of an exit from the Bank of Japan’s expansive monetary policy continue, which, if it fails to be orderly, could have disruptive effects both locally, especially in non-bank financial institutions, and internationally due to the dismantling of carry trade positions.
For the rest of the major monetary authorities, slight reductions in the MPR for Southeast Asia are expected. Its central banks are the ones that in relative terms had raised their MPRs the least since their inflation rate remained within or very close to the target. On the other hand, Turkey’s monetary authority drastically changed its monetary policy strategy, and began to sharply increase its MPR to combat inflation.
Box. Argentina in the BRICS
Last August, the presidents of the BRICS group (Brazil, Russia, India, China and South Africa) invited six countries to become full members from 2024: Argentina, Egypt, Ethiopia, Iran, Saudi Arabia and the United Arab Emirates. The current members of the BRICS represent more than 42% of the world’s population, 30% of the territory, 23% of global GDP and 18% of international trade.
In 2001, a report by Goldman Sachs (“Building better global economic BRICs”) reported on the growth of these five emerging countries, stating that in the short term they would surpass those of the G-7 to become the future leaders of the world economy. The leaders of Brazil, Russia, India and China met informally for the first time in July 2006, and in September of that year, they agreed to incorporate the BRIC concept into foreign policy categories, stressing the need to strengthen mutual cooperation.
In 2008, the global financial crisis catalyzed the consolidation of the bloc within the G20: the BRIC Finance Ministers adopted joint declarations on global problems, making alternative proposals to deal with the crisis. In June 2009, the First BRIC Leaders’ Summit was finally held. They defined their fundamental mission: to promote the reform of the international financial institutions and cooperation on crucial issues of global development. They agreed to hold an annual Leaders’ Summit. South Africa was invited in 2010, and the group adopted the name BRICS.
Annually, the BRICS holds about 150 meetings on three pillars of cooperation: (i) political and security, (ii) financial and economic, and (iii) cultural and people-to-people. The signing of more than 30 agreements and memorandums of understanding provide the legal basis for cooperation in areas as diverse as the Contingent International Reserve Agreement, customs, taxation, banking, culture, science, technology and innovation, agricultural research, energy efficiency, competition policy and diplomatic academies.
The communiqué of this year’s Summit emphasizes that its members share the vision of BRICS as a group that defends the needs and concerns of the peoples of the Global South. These include the need for beneficial economic growth, sustainable development and reform of multilateral systems.
As has been made clear throughout Argentina’s participation in the G20, our country shares an agenda with the BRICS members on issues such as i) reform of the international financial architecture; (ii) food and energy insecurity; and (iii) climate change. For its part, it opens the possibility of accessing a new source of financing for infrastructure and sustainable development projects through the New Development Bank (NDB) established by BRICS members in 2015. At the end of 2022, the NDB had 96 approved projects for a total amount of US$32.8 billion.
Finally, the BRICS members have been promoting the use of their own currencies for trade within the bloc (see the section on Local Currency Payment System in Mercosur). This is of special interest for Argentina’s current situation since trade with members represents approximately 29% of exports and 43% of imports.
2.3. Markets: Higher interest rates for longer, with an impact on bonds, stocks and currencies
Despite the turbulence due to the banking crisis in the US at the beginning of the year, interest rates remained high and, with increases in the margin, they seem to stabilize in these values, which leads many analysts to propose a scenario of “higher rates for longer”, which would be a very relevant change for emerging countries.
Since the close of the previous IPOM, the 10-year US Treasury rate rose 75 bps and has reached highs not seen since 2007. Real interest rates, as measured by 10-year inflation-indexed bond (TIPS) rates, are also very high, up 88 bps over the year (see Figure 2.8a.). This is not only seen in the United States; in Europe, rates also stabilized at high values and with increases in the margin (see Figure 2.8b).
Figure 2.8
Interest Rates and Dollar Index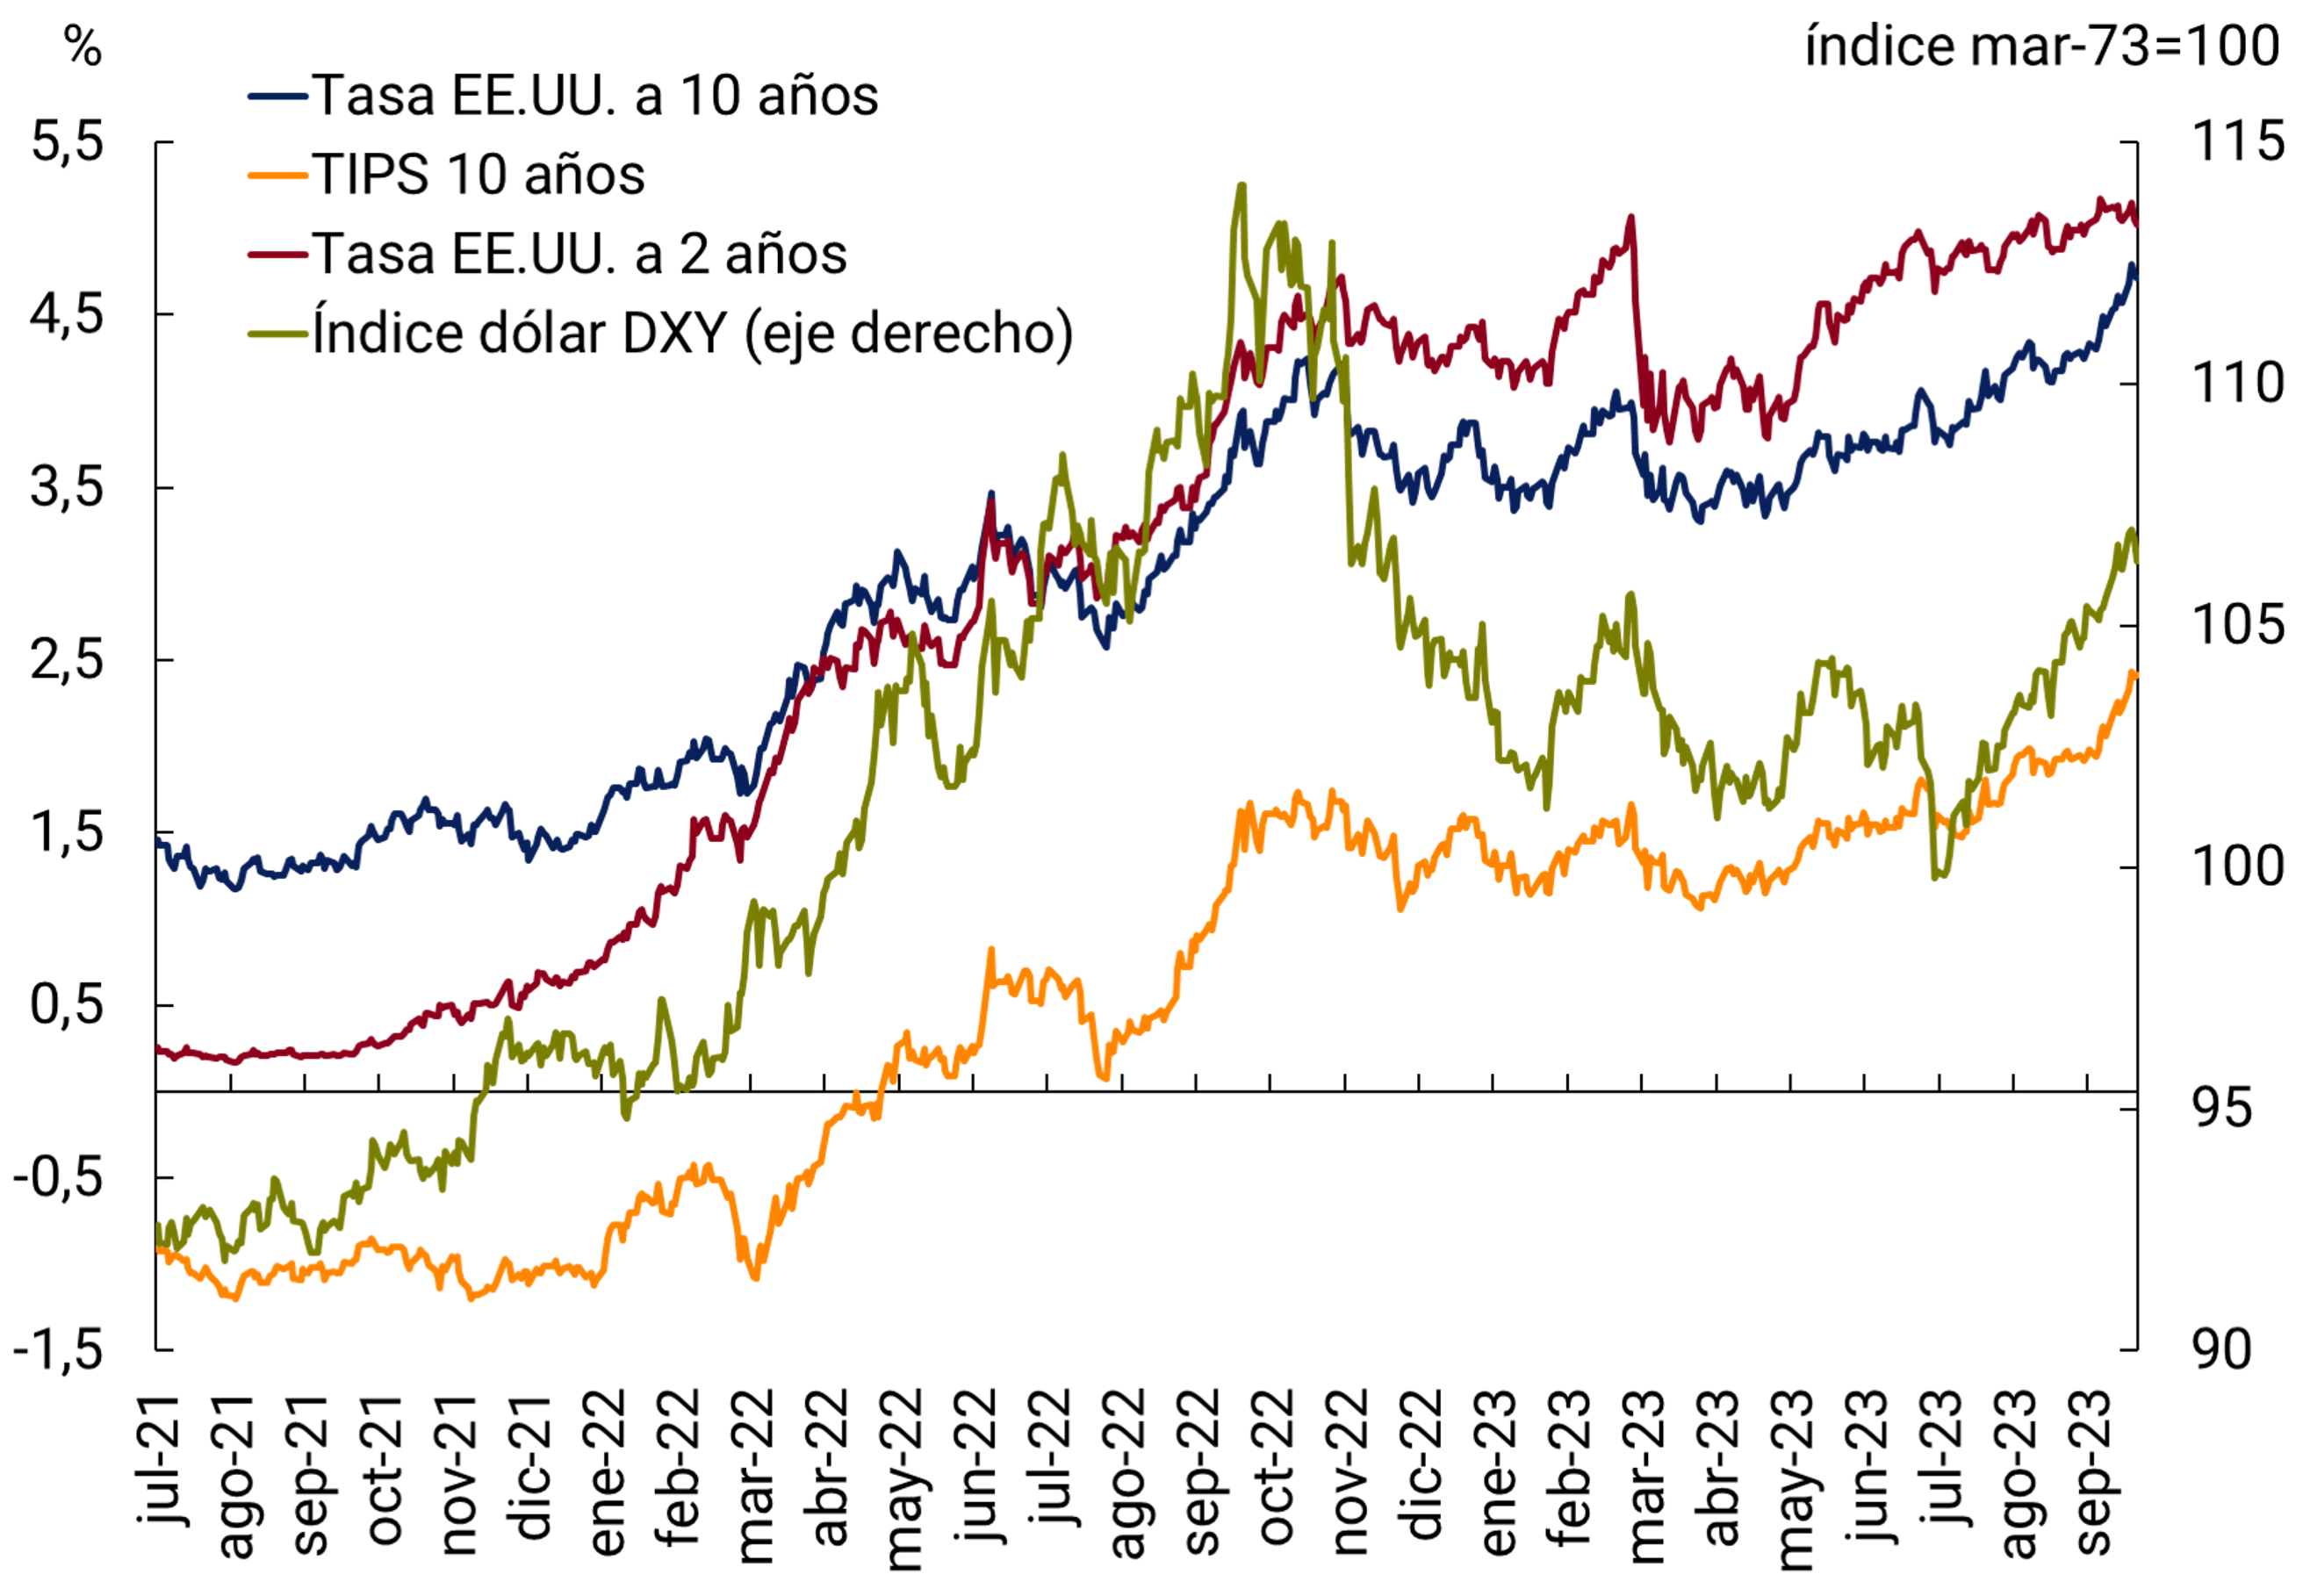
Interest rates in European countries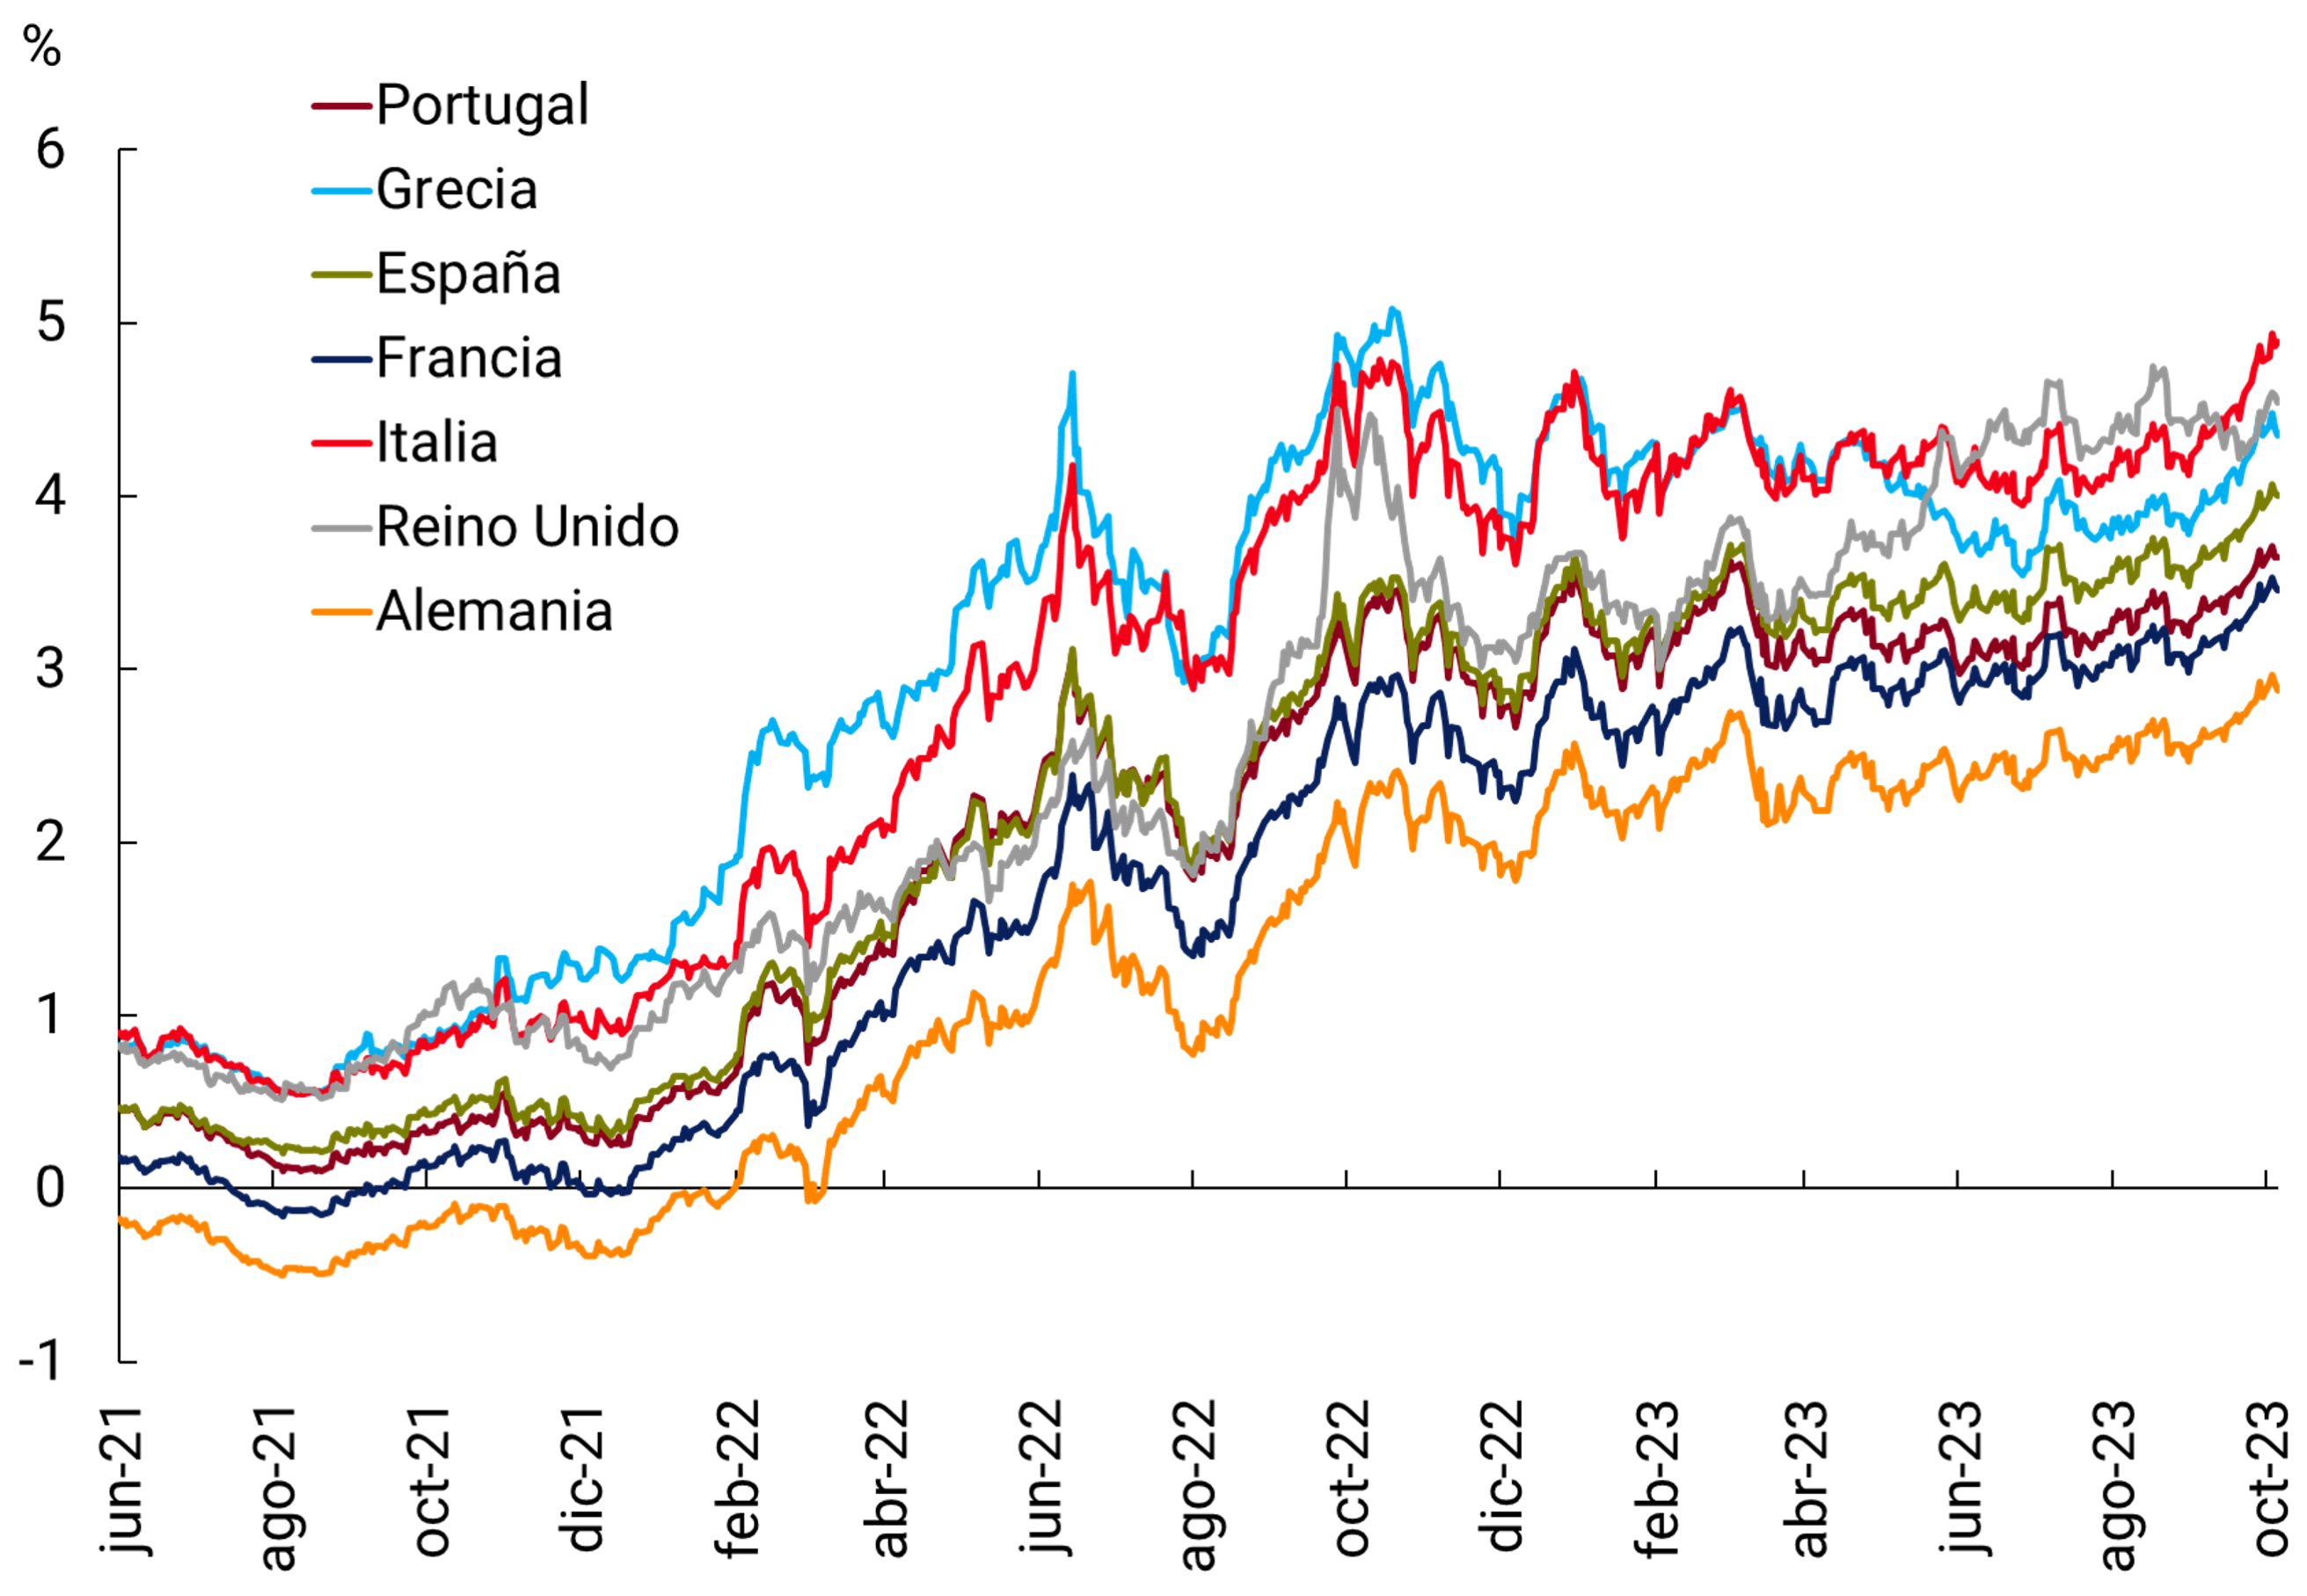
Source: Bloomberg.
These higher and longer interest rate levels have already begun to impact some sectors of the economy. On the one hand, there are beginning to be more restrictions on financing companies at a global level, for example, in the corporate bond sector. There are fears of the impact on the real estate markets, although for the moment the United States remains resilient to the new scenario. There are countries, such as Great Britain, that have a higher proportion of variable-rate mortgage loans and already show a cooling in the real estate market. Finally, China continues with its problems in the real estate sector that threaten the financial stability of banks and non-bank financial intermediaries, although the problems are idiosyncratic and unrelated to the global rate hike cycle.
In this context, global stock markets moderated the increases in the year and fell by about 4% compared to the previous IPOM close. Since the beginning of the year, European stock markets have risen by about 8%, and in the United States the S&P 500 and Nasdaq rose 11% and 26%, respectively (see Figure 2.9a). Latin American equities, as measured by the MSCI index, have fallen 14.9% since the end of July, a period that coincides with capital outflows from emerging countries in line with the rate cycle reversal described in the previous section (see Figure 2.9b). Although capital outflows occurred throughout the emerging countries, they were much more important in the case of China.
Figure 2.9 |
Stock indices
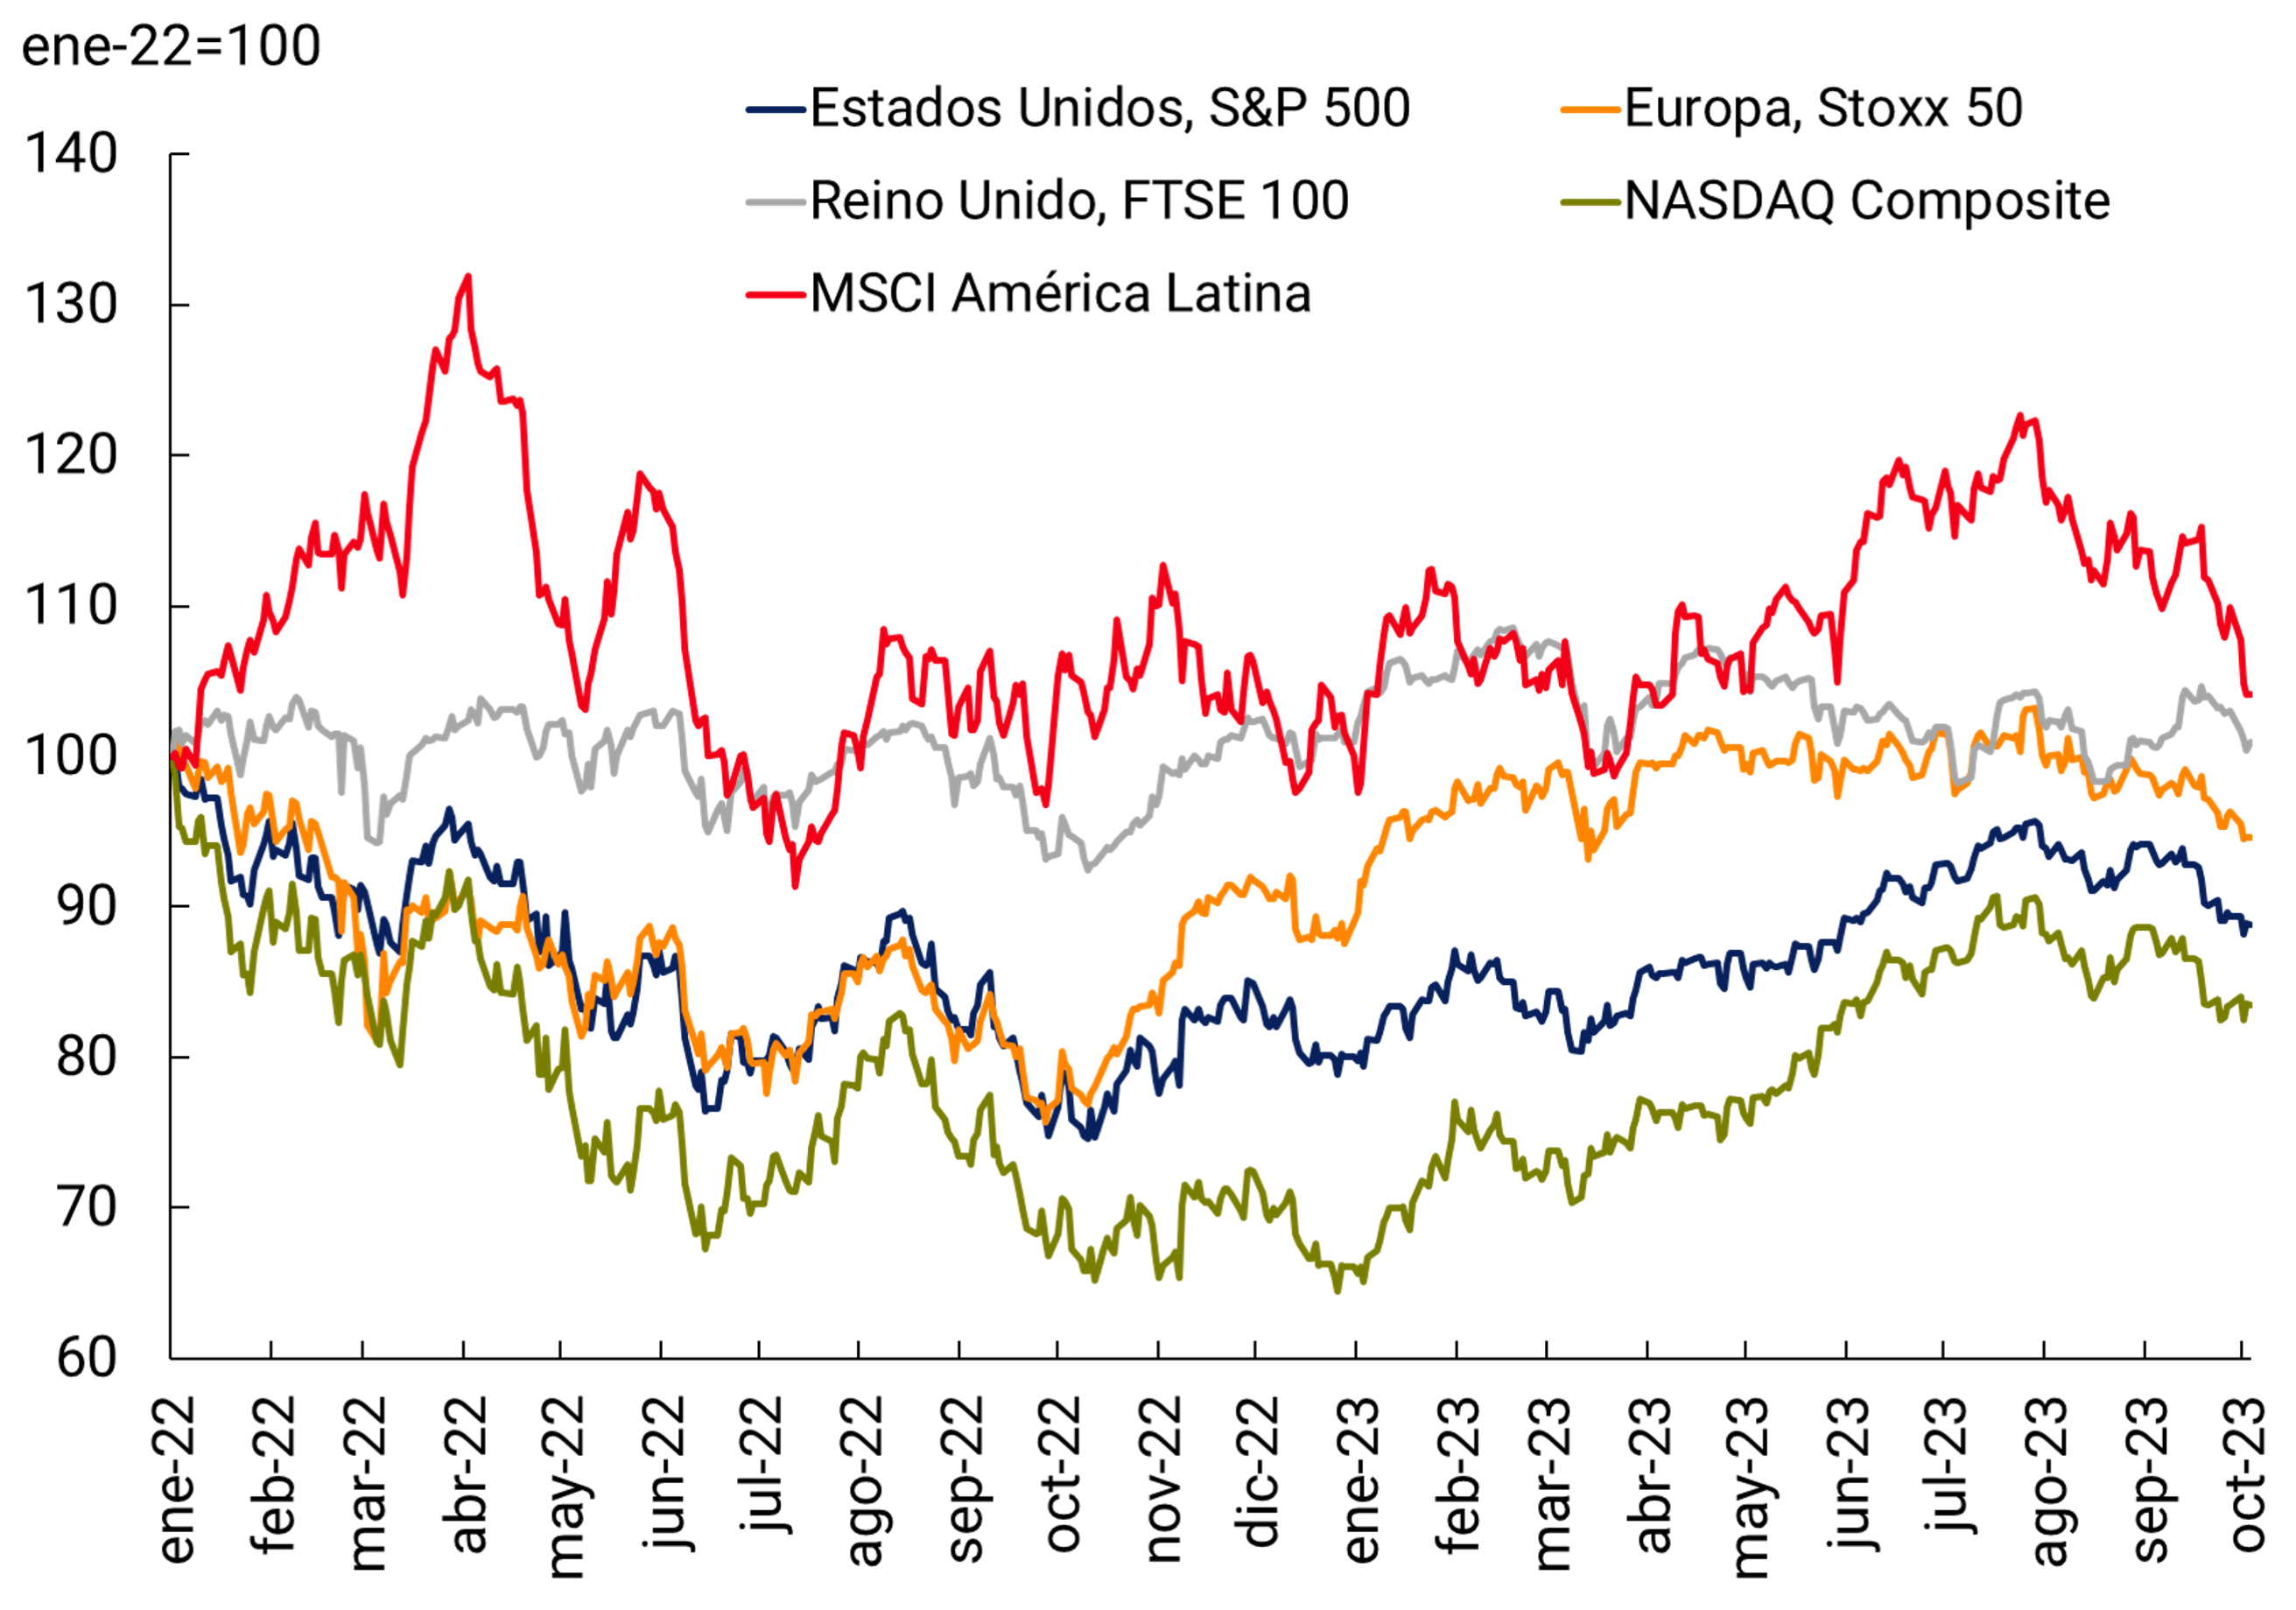
Capital flows to emerging countries
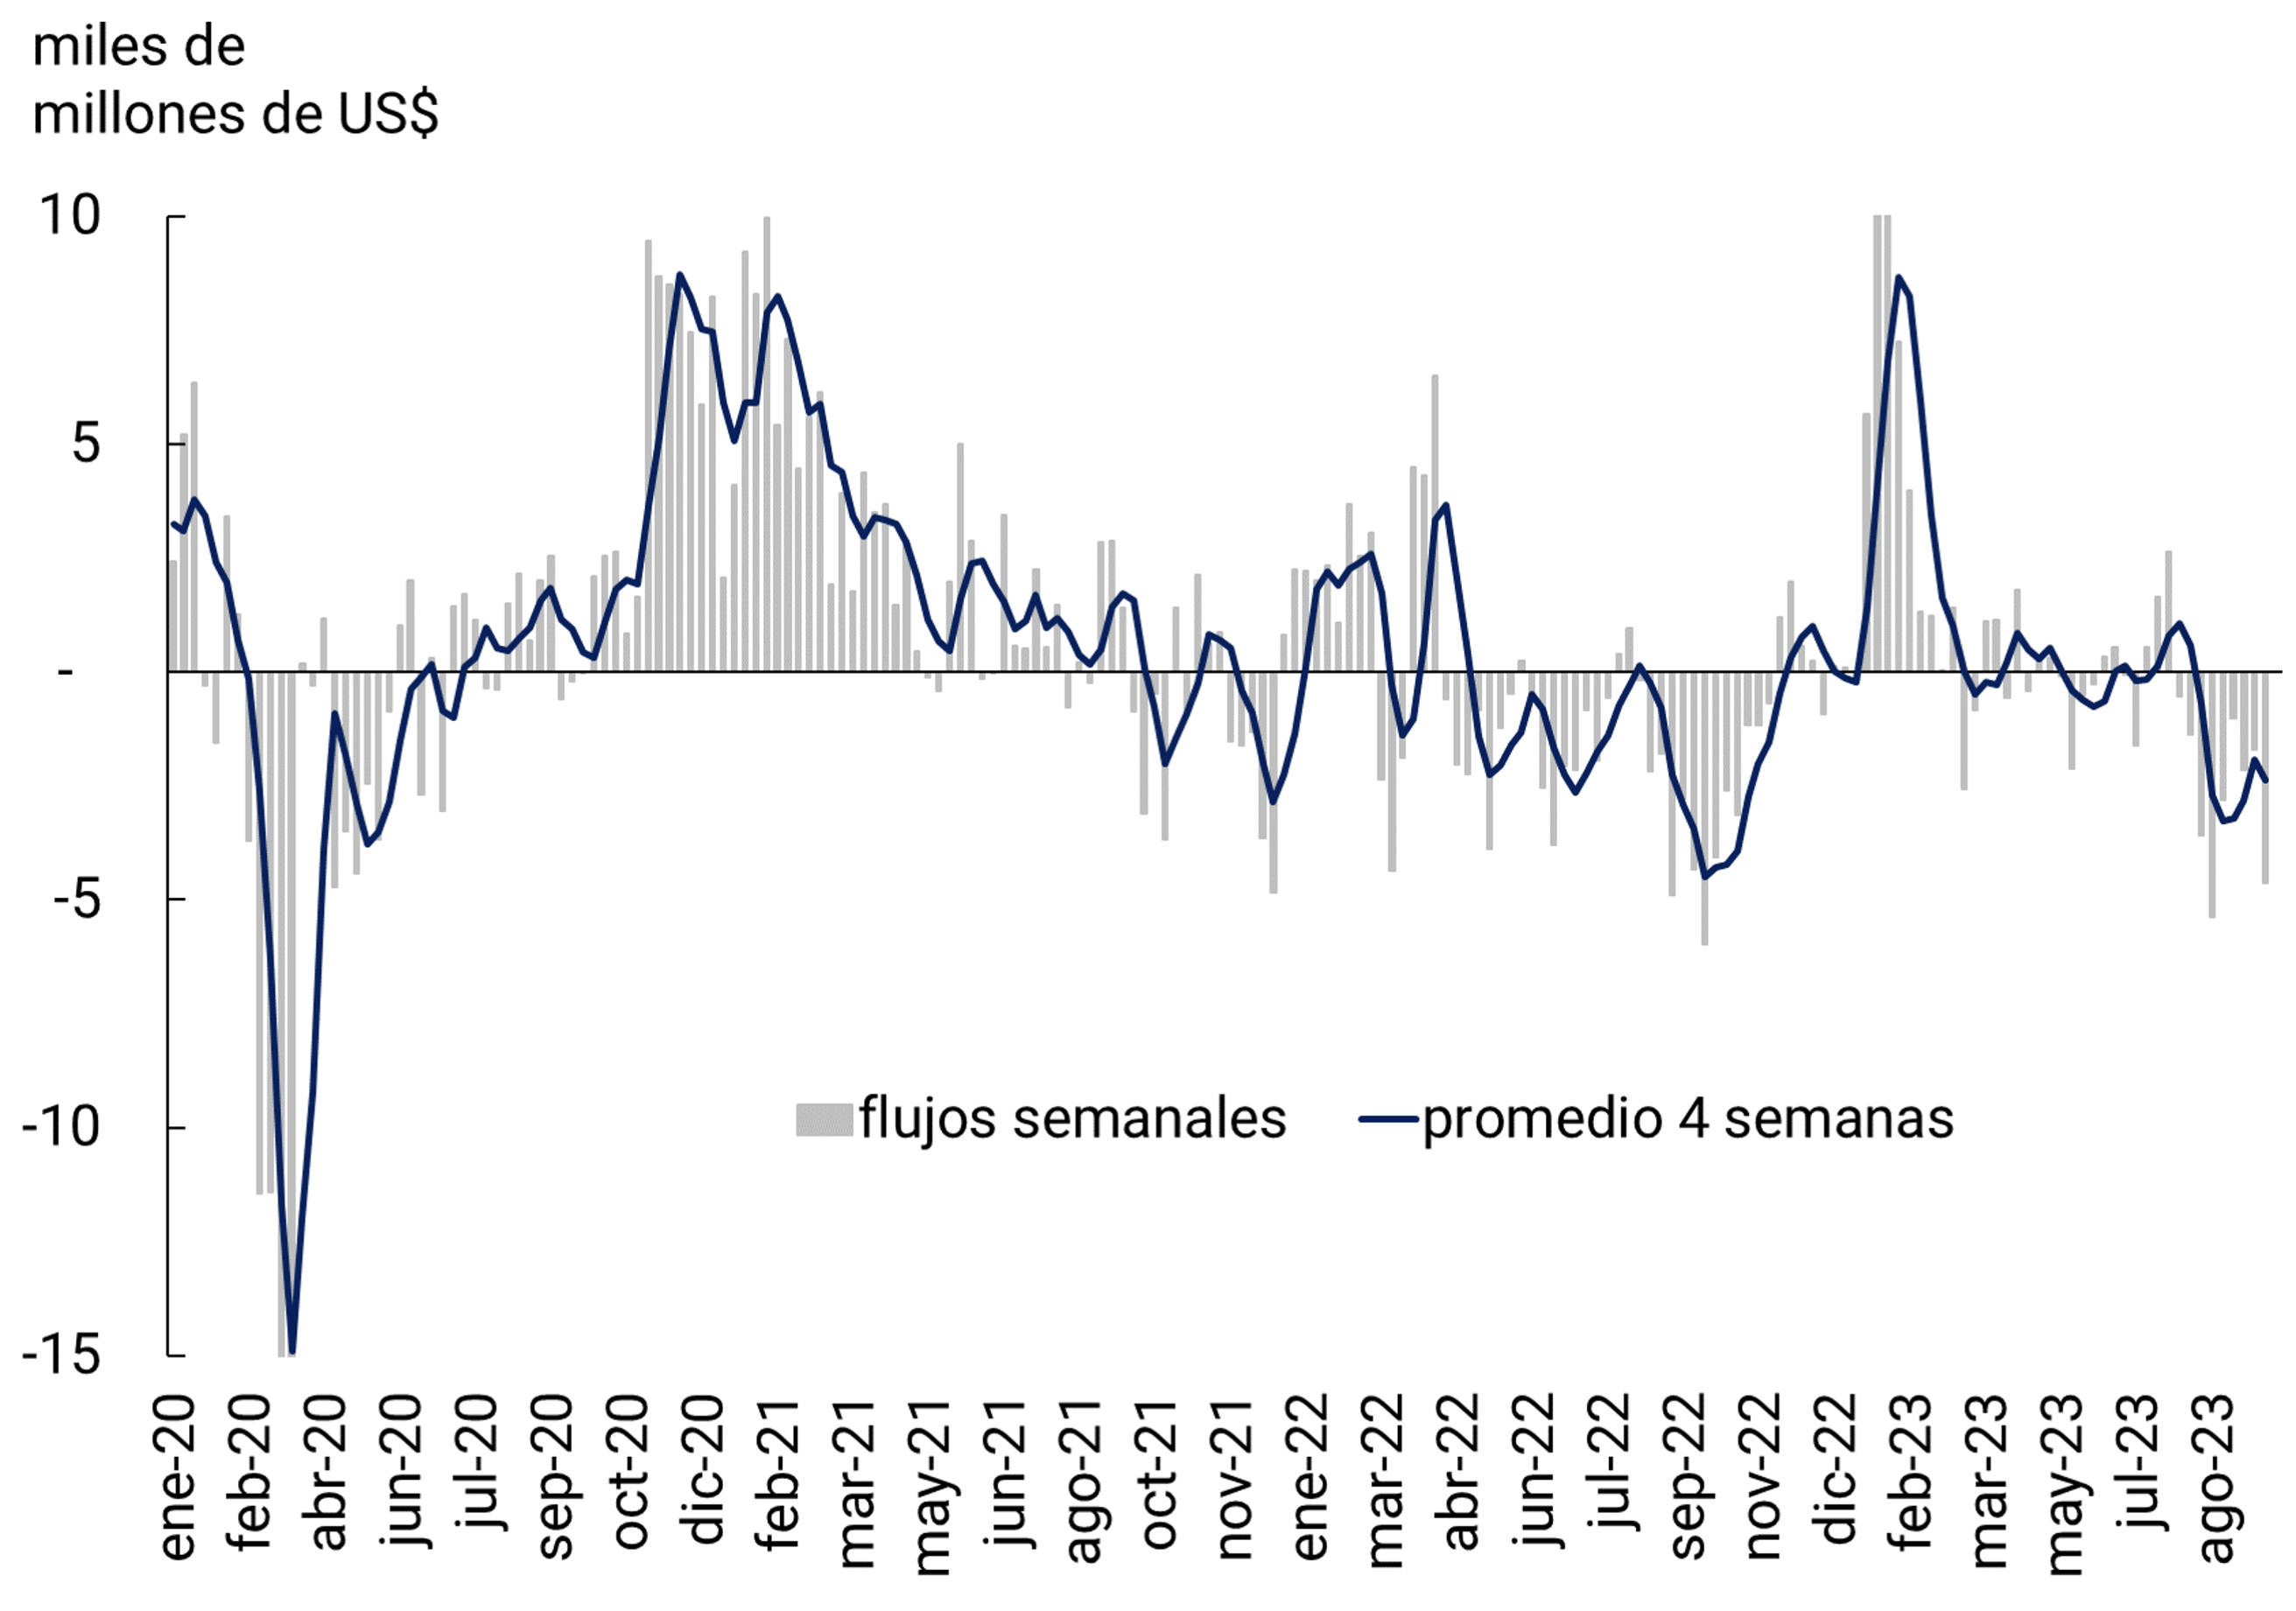
Source: Bloomberg.
During the first half of 2023, the U.S. dollar in multilateral terms experienced a depreciation that began to reverse from mid-July for various reasons, the divergence in the speed of the implementation of monetary policies with other economies, with its impact on the interest rate differential, and the increase in the price of oil, among others.
In particular, during the third quarter of 2023, the prices of the main agricultural commodities such as soybeans, wheat and corn continued to fall, while energy such as crude oil and gas rose. OPEC+’s decision to cut production at different meetings had an impact on the increase in oil prices, although the rise in global interest rates and the greater risk of recession would be the opposite factors that would work as a counterweight to the fall in commodity prices.
As noted in the June 2023 IPOM, commodity prices and the US dollar have moved in tandem recently, in contrast to their usual pattern of doing so in opposite directions (see Figure 2.10). The causes are partly temporary, such as the unusual combination of recent shocks, and partly structural, such as the emergence of the United States as a net exporterof energy.
Figure 2.10 | U.S. multilateral exchange rate and commodity
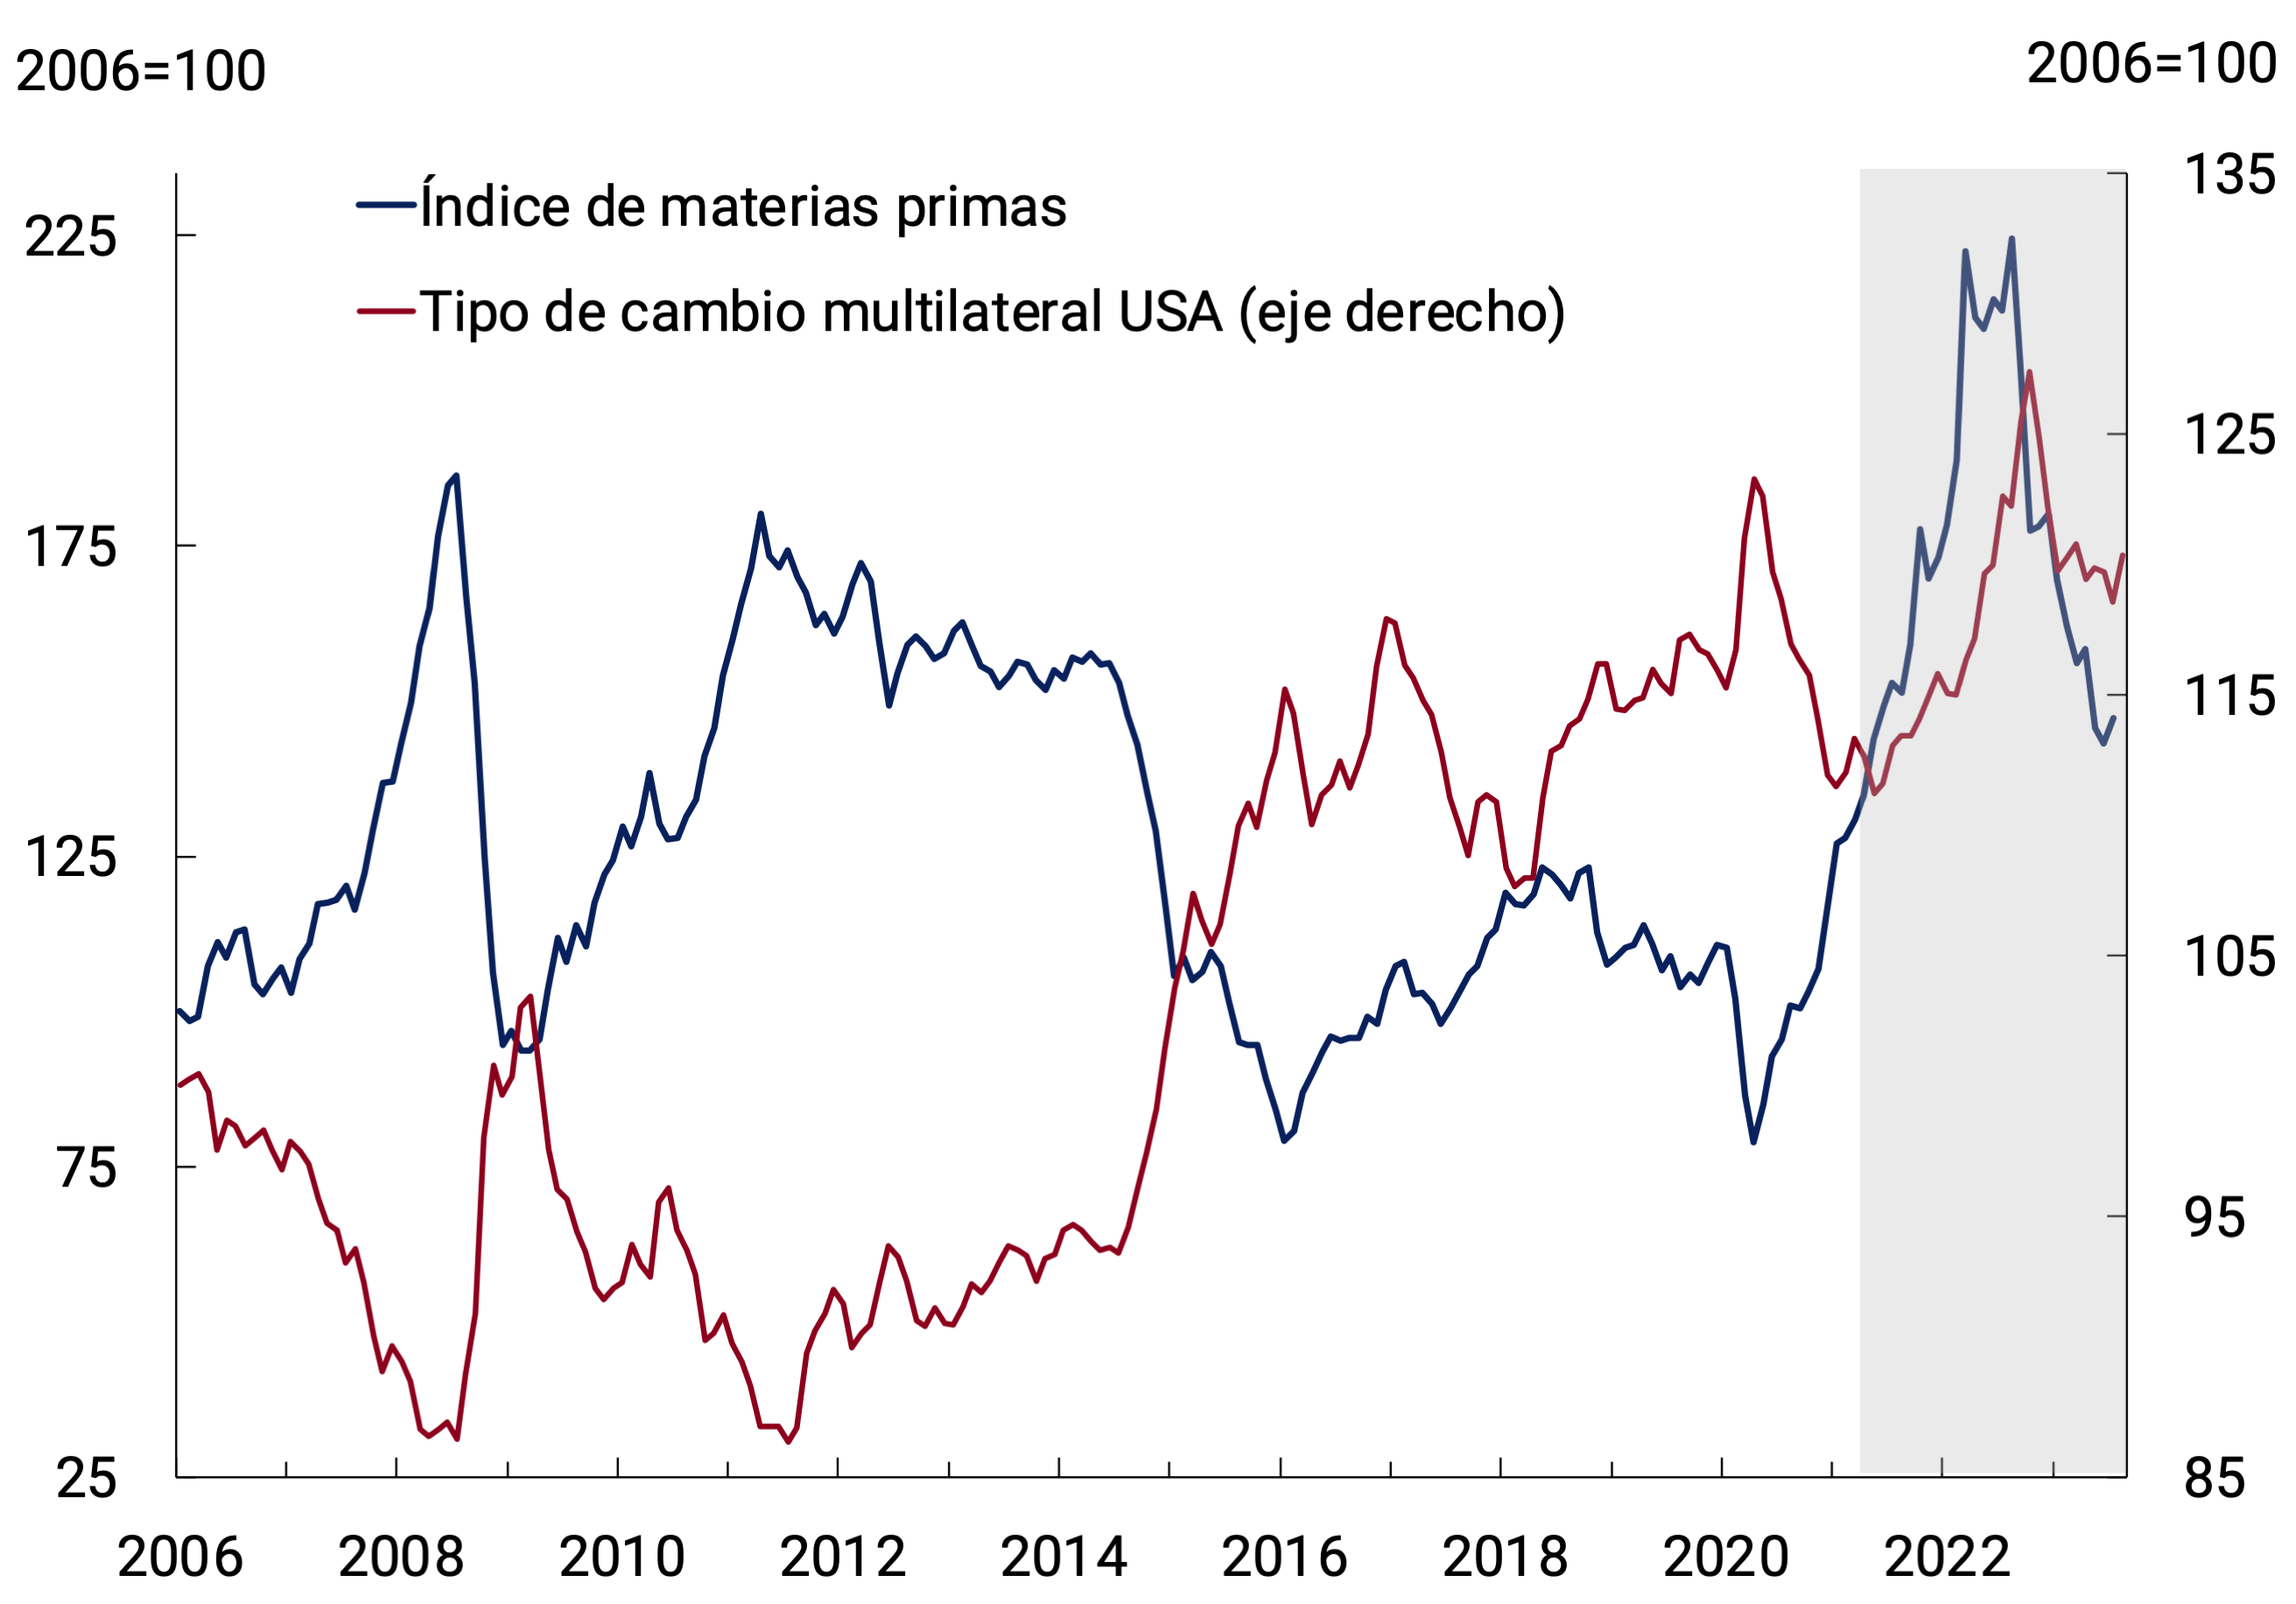
index
Source: BCRA based on data from FRED.
Brent oil began to rise from mid-June until reaching its highest value in the year in September as a result of the different cuts in production levels that the Organization of the Petroleum Exporting Countries (OPEC+) carried out, increasing its price by 25% during the third quarter3. The price of natural gas in Europe rose 30% this quarter, although starting from very low values due to the high levels of reserves reached in European deposits (see Figure 2.11a).
Figure 2.11 | Selected raw material prices
A. Natural gas and Brent crude oil

B. Corn, wheat and soybeans

Source: Bloomberg.
2.4. In summary
Several sources of risk are opening up for the global economy. China’s developments and the financial repercussions of its real estate crisis will be key. On the other hand, if the scenario of a “soft landing” of the US economy is consolidated, this would support global activity, in contrast to other advanced economies that are almost not growing. But at the financial level, the scenario of “higher rates for longer” would imply a yield differential in favor of the bonds of advanced economies, also strengthening the US dollar and tightening international financial conditions in general. The balance of risks looks bearish for global activity and persistent for inflation, especially in advanced economies.
3. Economic Activity and Employment
GDP fell 2.8% qoq/s/a and 4.9% y/y (y.o.y.) in the second quarter of 2023, as a result of the severe drought, as anticipated in the previous IPOM. The level of activity in the non-agricultural sectors as a whole remained in similar ranges to those of the first quarter and also in year-on-year terms, although greater heterogeneity was observed. The activities most linked to agriculture contracted while the rest averaged a positive variation. As a result, the creation of formal employment in the non-agricultural sector sustained a growth rate of 3.7% y.o.y.
Domestic demand remained relatively stable compared to the first quarter (-0.1% s.e.) and registered slight growth compared to the previous year (0.7% y.o.y.), with a contraction in private consumption and growth in investment. The negative effects of the drought were reflected in a contraction in net exports and inventories, being, together with lower private consumption, the main factors that explained the fall in output in the second quarter from the demand side.
In the third quarter, opposite effects on economic activity were combined. On the one hand, the recalibration of the level of the official exchange rate and the increase in financial volatility after the PASO elections would have had a contractionary impact on domestic demand. This effect would be attenuated by the set of income policies recently implemented by the National Government. The recovery in agricultural production and related activities would allow seasonally adjusted output to increase compared to the second quarter. In the same sense, unconventional oil and gas production is expected to continue to grow, driven by the commissioning of the Néstor Kirchner gas pipeline and investment in pipelines.
During the last quarter of the year, the economy is expected to operate in an environment of greater volatility associated with the political cycle, which could negatively affect consumption and investment decisions. By 2024, the economy is expected to gradually resume the growth path boosted by the favorable prospects for the agricultural harvest and the energy sector.
3.1. The fall in activity during the second quarter was mostly concentrated in the agricultural sector
The Gross Domestic Product (GDP) fell 2.8% quarter-on-quarter s.e. and 4.9% y.o.y. in the second quarter of 2023 (II-23) due to the direct impact of the drought on agricultural activity. In fact, the contraction of agricultural output fully explained both the quarterly (-3.0% s.e.) and year-on-year (-5.1%) variations in GDP measured at basic prices (excluding taxes).
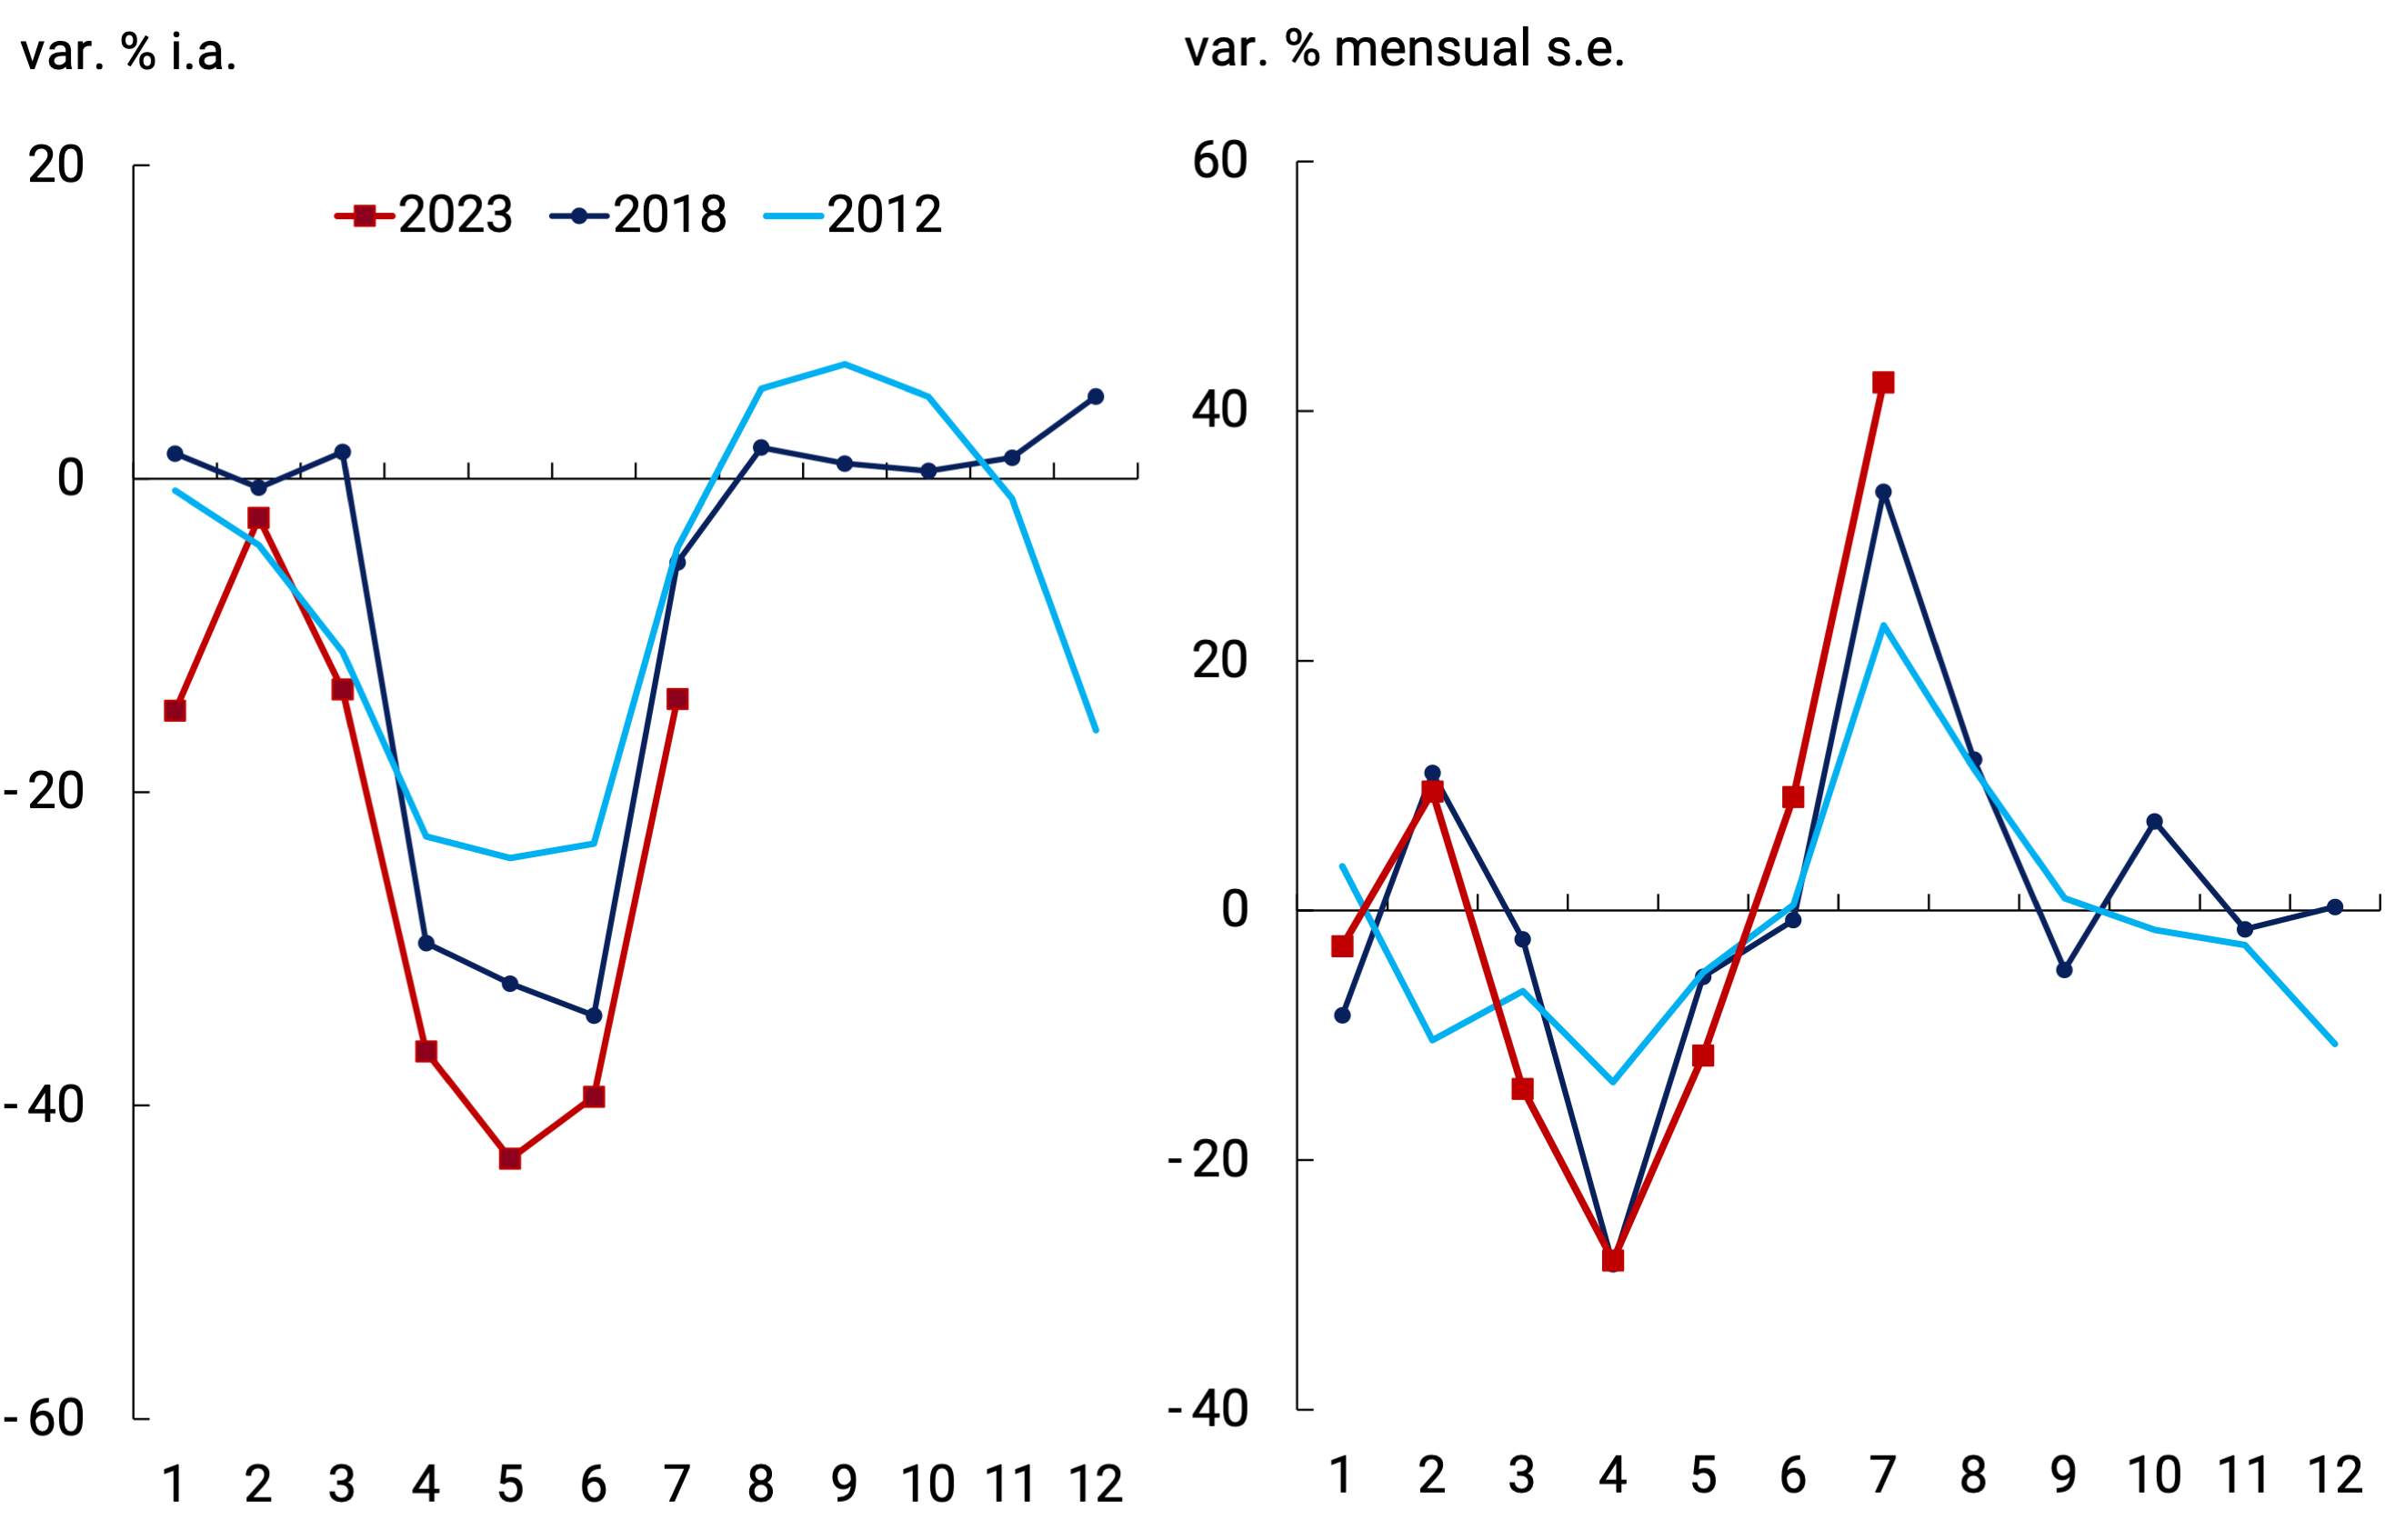
It should be noted that in the second quarter of each year, the product derived from the coarse harvest, mainly soybeans and corn, is counted in the GDP. These crops were the most affected by the drought, resulting in falls of 43% and 30% y.a., respectively12, thus explaining the severe contraction recorded in Output. Starting in June, and as expected based on what happened in previous episodes of drought, activity in the agricultural sector began to reverse the strong contractions recorded between March and May (see Figure 3.1). In fact, the Monthly Estimator of Economic Activity (EMAE) showed a monthly increase of 2.4% s.e. in July, which is made up of a strong increase in the agricultural sector (42.3% s.e.), which contributed approximately 1.8 p.p. to the monthly variation of the general level, while the rest of the sectors and taxes net of subsidies rose approximately 0.6% monthly s.e.
For the remainder of the year, agricultural output will reflect the evolution of the tasks carried out with a view to the next season13 and the result of the harvests of some crops, mainly wheat. The consolidation of the El Niño climate phenomenon with evident improvements in the water profiles of the soils in the core area of the country, would ensure the reversal of the climatic conditions that prevailed in the last three seasons. This allows us to foresee a substantial improvement in agricultural production corresponding to the 2023/2024 campaign (see Section 3 / Recovery forecasts for the next agricultural season).
Figure 3.1 | EMAE Agricultural
sector
Source: BCRA based on INDEC data.
3.1.1. Non-agricultural sectors lost momentum, registering a heterogeneous evolution
The non-agricultural sectors as a whole remained stable compared to the second quarter and also in year-on-year terms (0% quarter-on-quarter and 0.1% y.o.y.), with greater heterogeneity observed. This performance was the result of contractions in some sectors related to agriculture (Transport and communications and certain industrial blocks), the supply of electricity, gas and water (EGA) and financial intermediation, which were offset by the growth of the rest of the sectors.
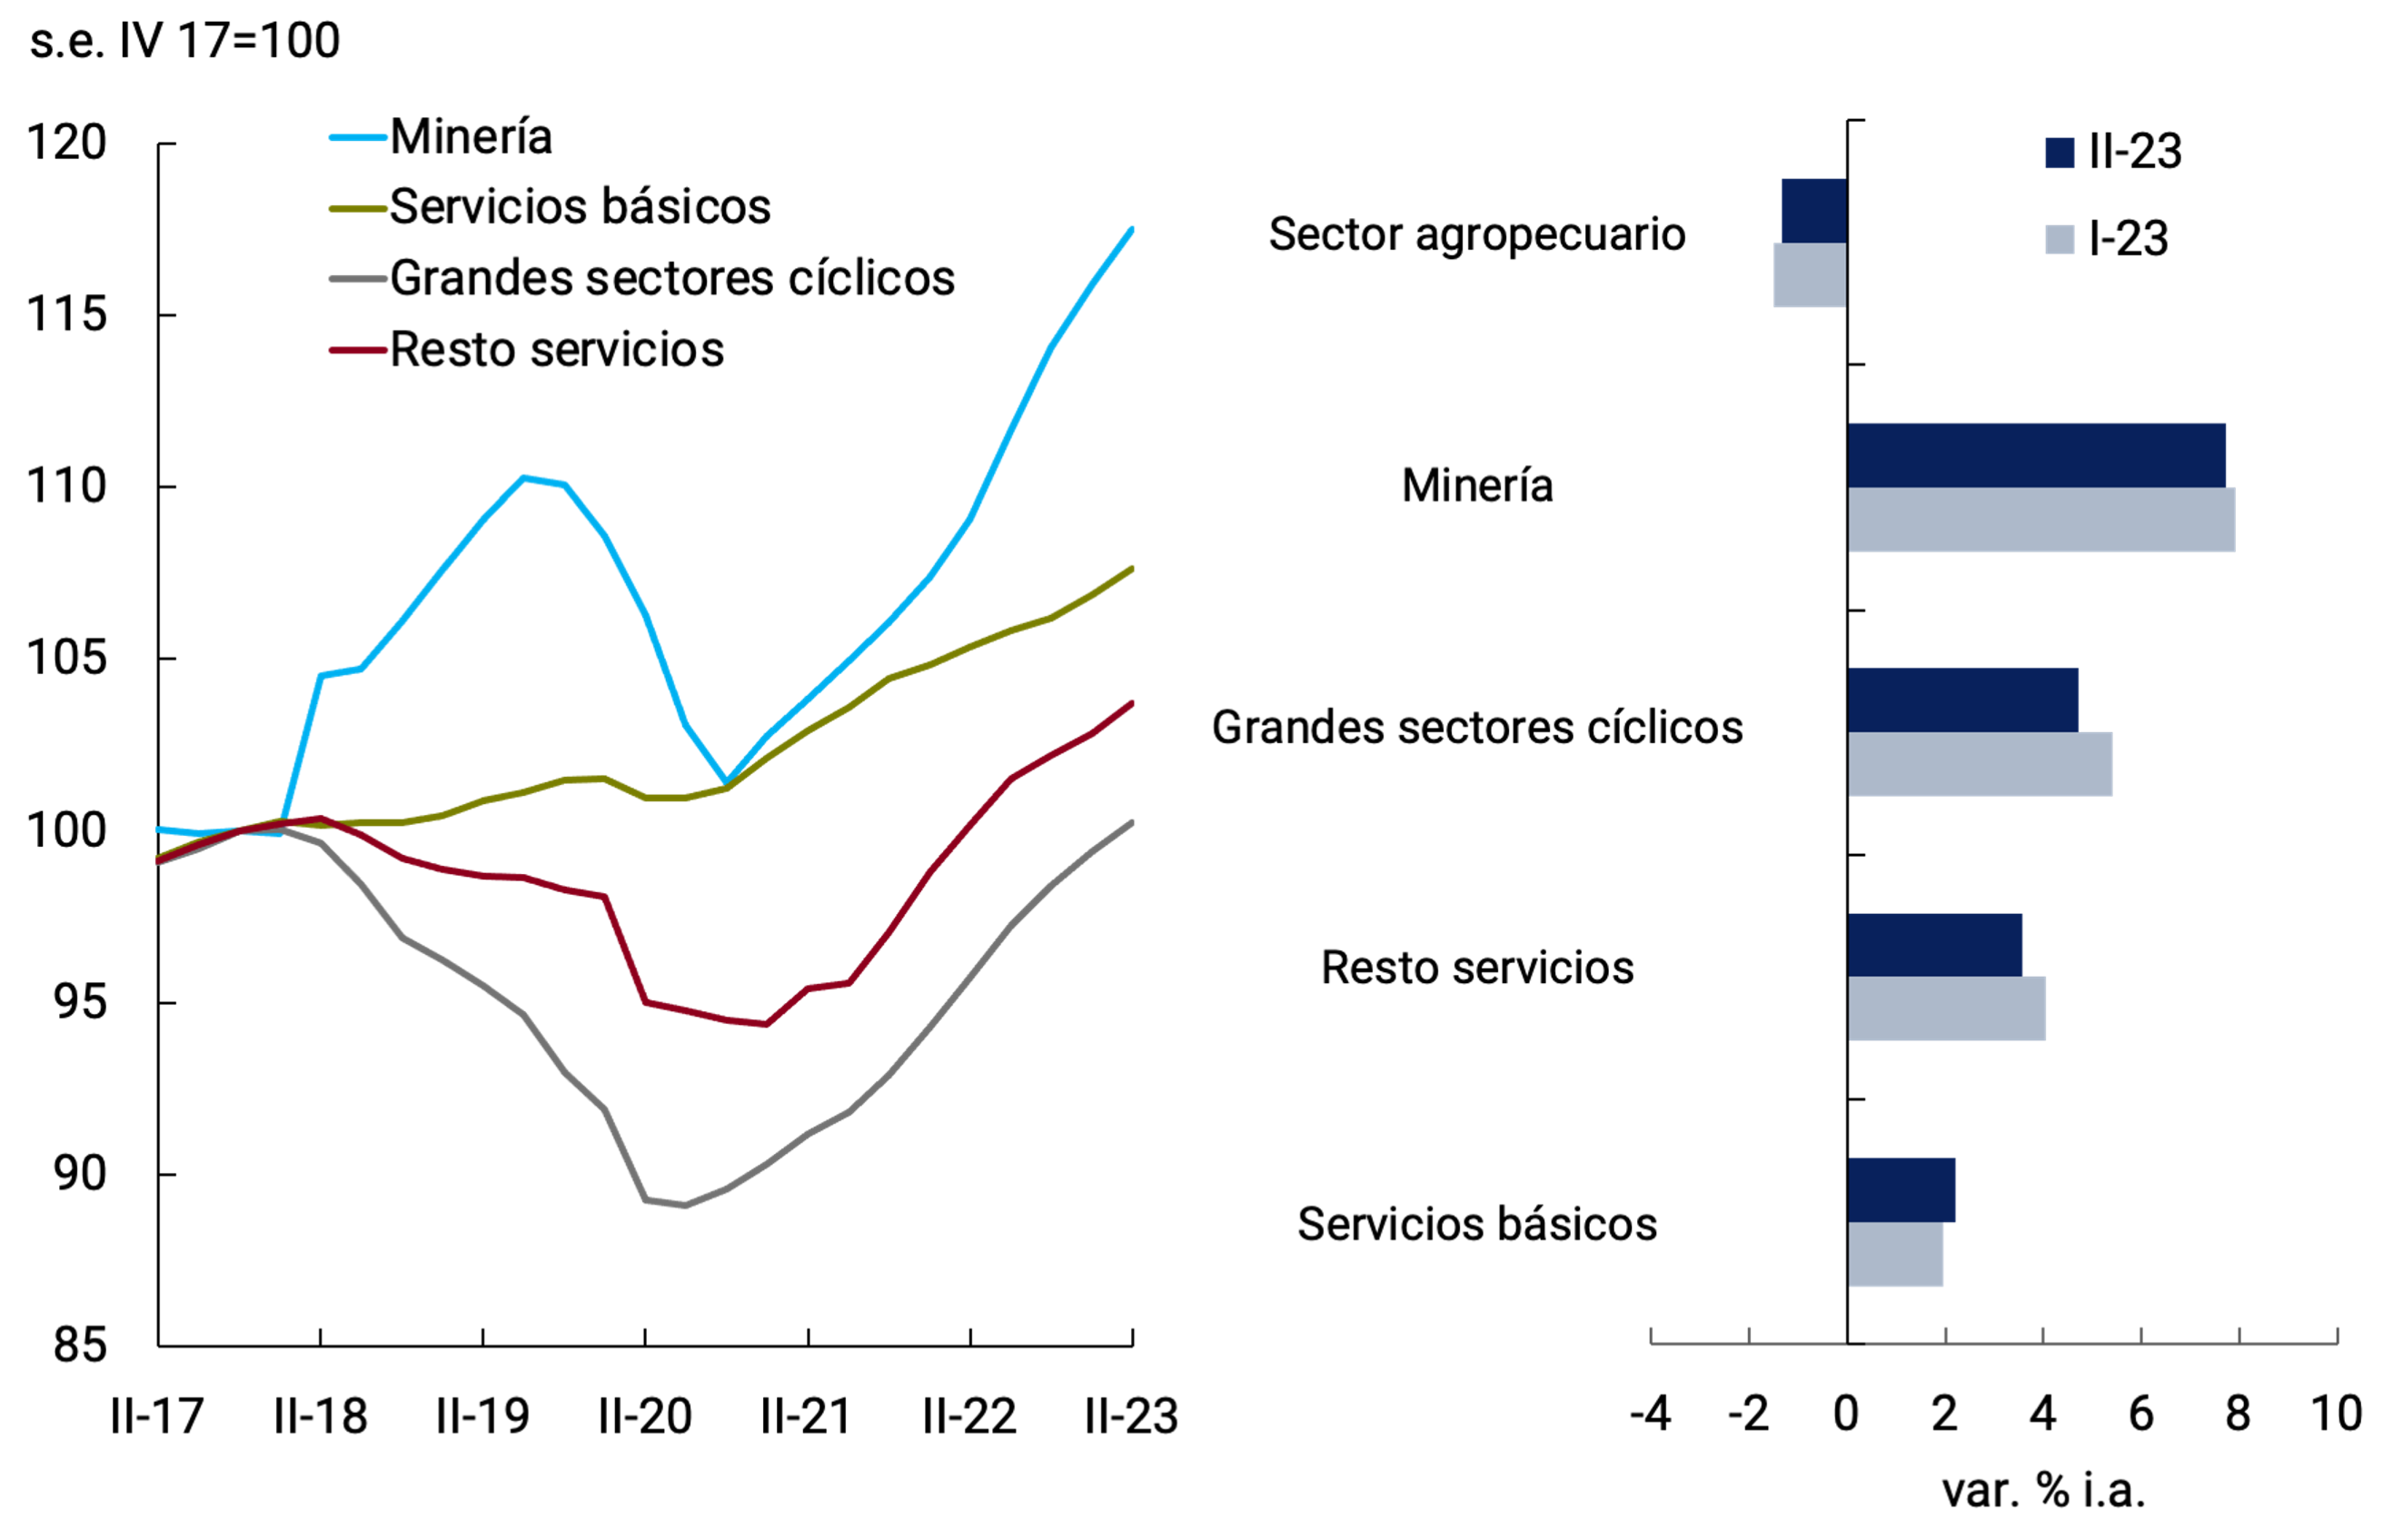
The most outstanding segment for its performance continued to be Mining and Quarrying (Mining) which, with an increase of 0.6% qoq s.e. and 6.3% y.o.y. during the second quarter of 2023, exceeded the level of the fourth quarter of 2017 by 18.8% s.e., a period in which GDP had reached the previous maximum (see Figure 3.2). The unconventional extraction of oil and gas, mainly developed in the Vaca Muerta field, is the main factor of expansion in this area. In fact, shale oil extraction increased 26.9% YoY in that quarter and represented 47% of national crude oil production, while in the case of natural gas, shale registered a growth of 7.8% YoY (40% of total production).
Figure 3.2 | Evolution of activity levels in supply sectors
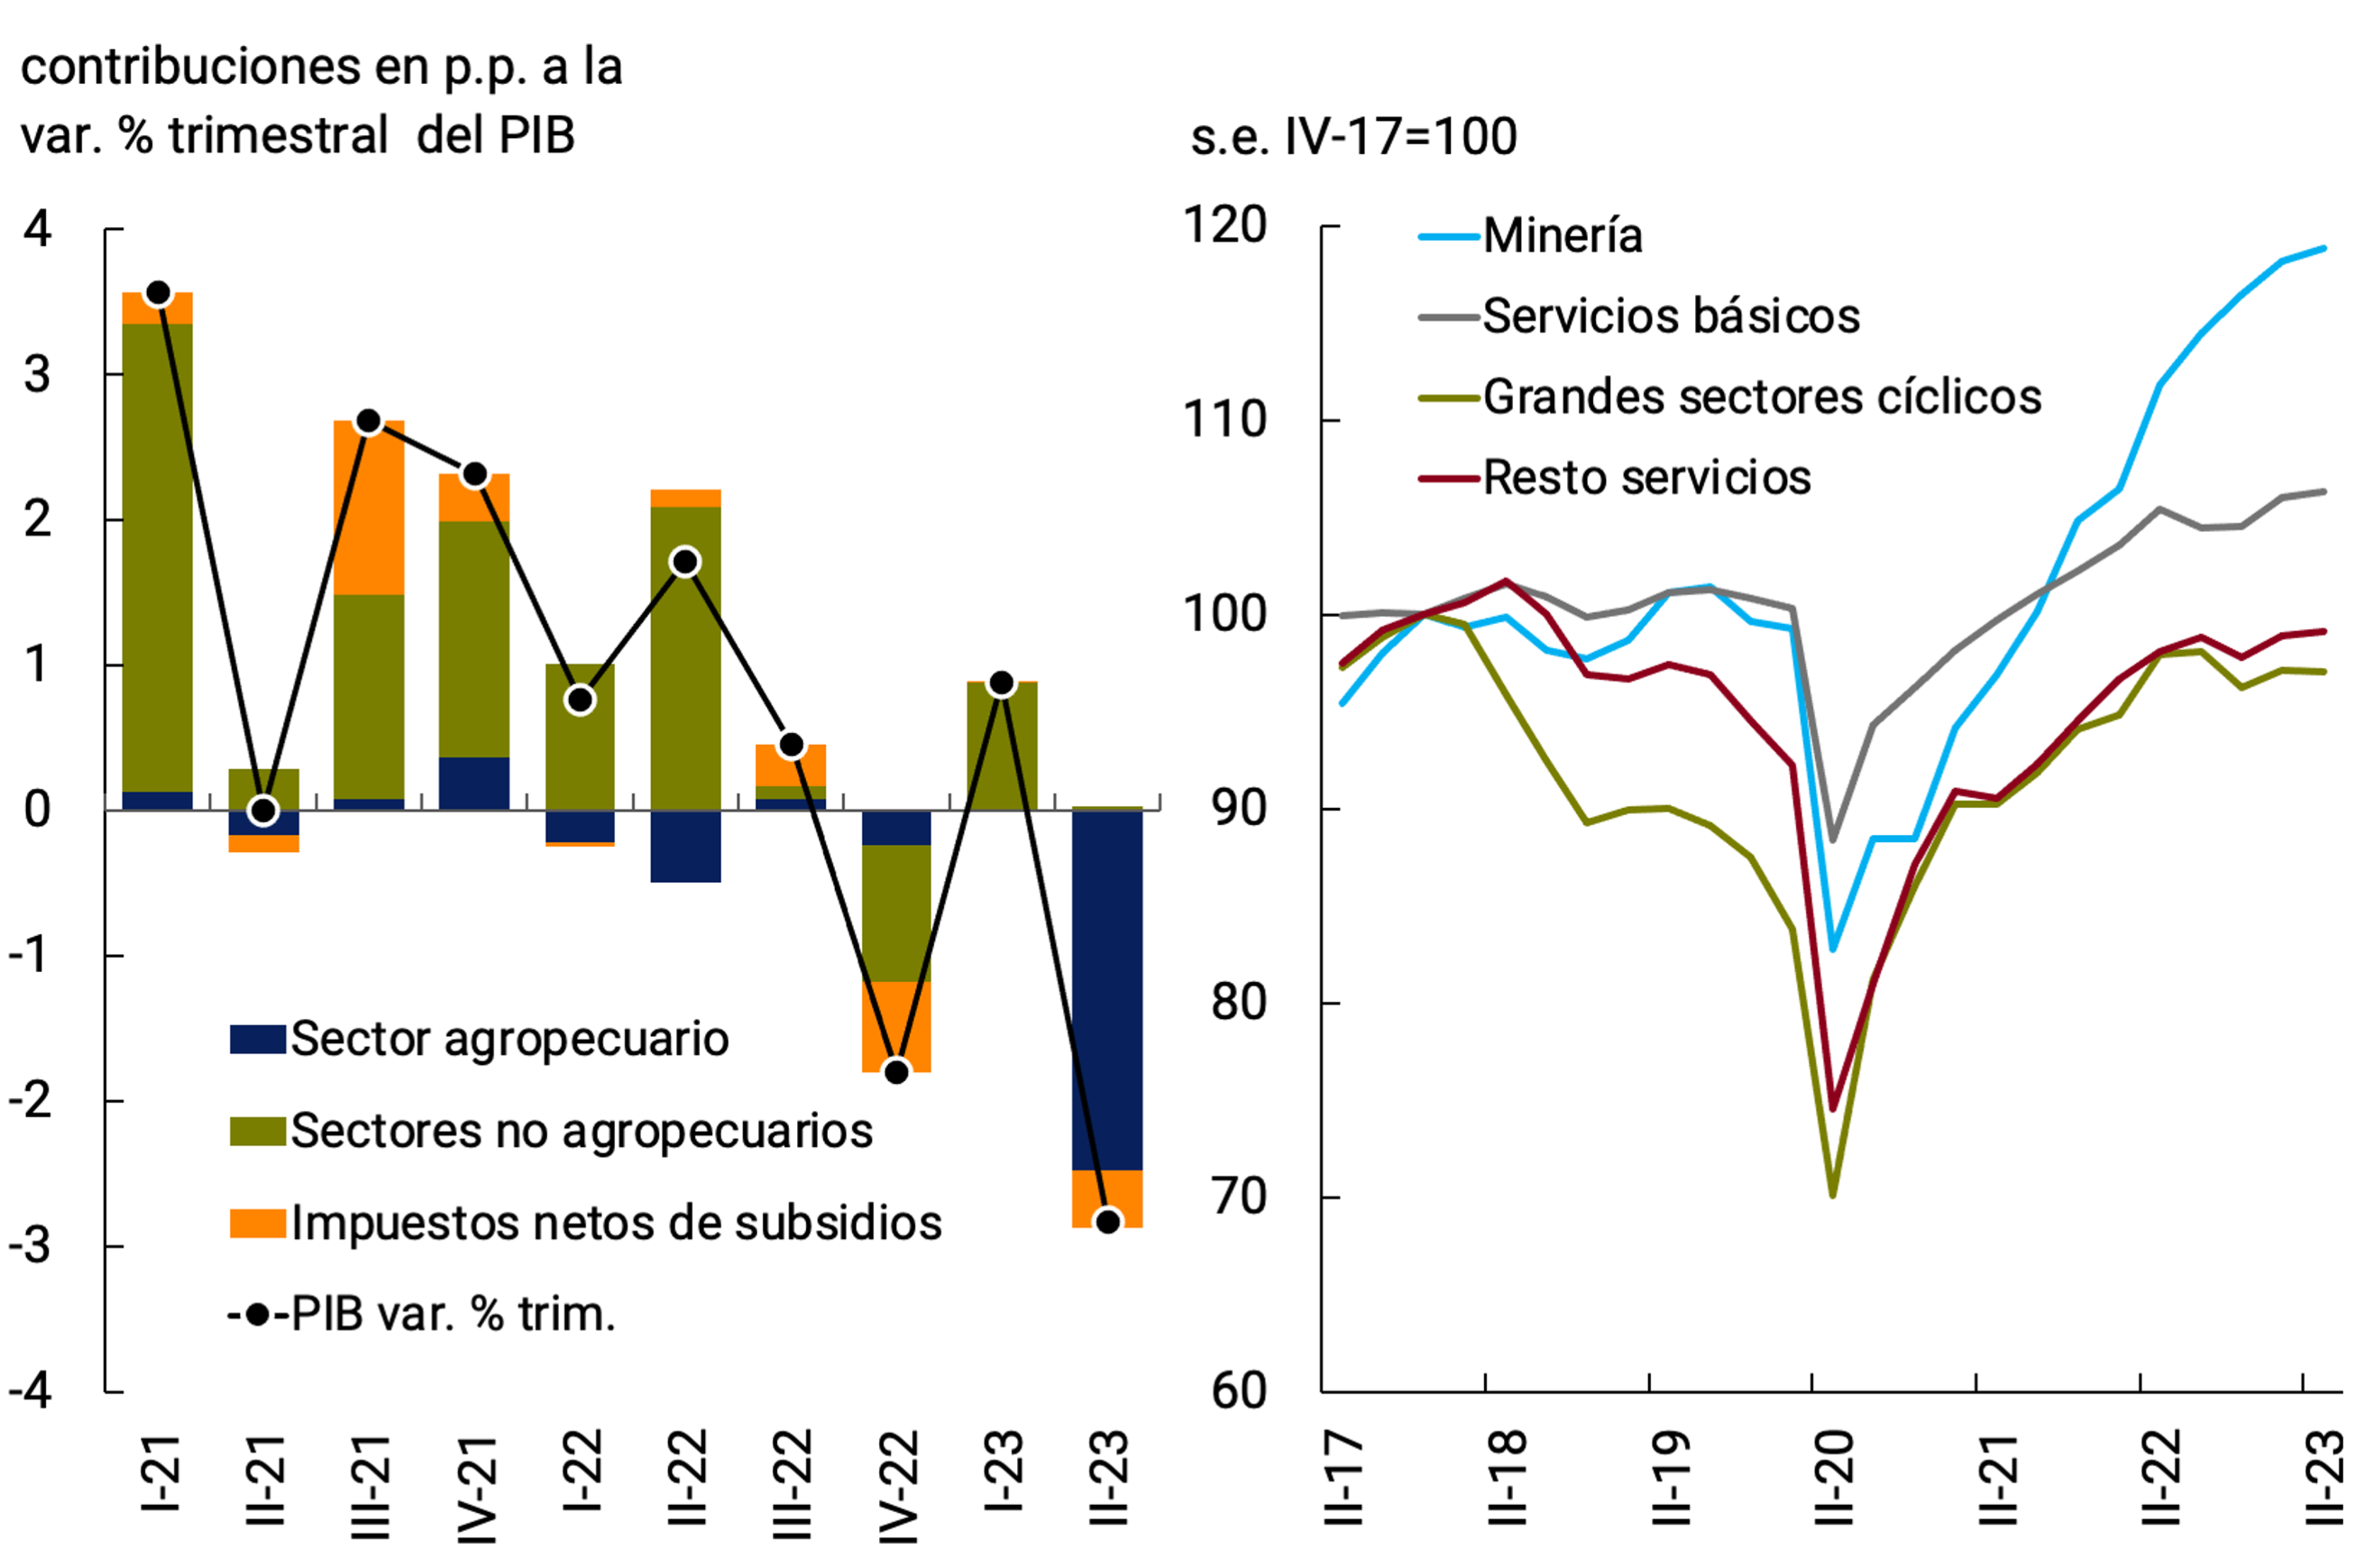
Source: BCRA based on INDEC data.
The activity of the group of sectors with the highest weighting in Output, due to their linkages, employment levels and procyclicality – Industry, Trade, Construction and Transport and communications – decreased compared to the first quarter of 2023 (-0.8% quarterly s.e.). This was mainly explained by the closer link between the agricultural sector and some segments of the agro-industrial chain, the transport of ships and trucks to ports and the trade in inputs for the countryside, among other segments, whose activity was indirectly affected by the lower harvest.
Finally, the other services averaged an increase in the second quarter, although they slowed the pace of increase. The set of the so-called basic products – Electricity, gas and water (EGA), Health, Education and Public Administration – rose 0.3% quarterly s.e. and 1% y.o.y. as a whole. The rest of the services—Hotels and restaurants, Financial intermediation, Real estate and business activities, and Other community services—showed a similar performance (0.3% quarterly s.e. and 1.1% y.o.y.) and exceeded the maximum level of 2022. However, it is relevant to note that, within these groups, both EGA (-7.6% s.e. and 6.3% y.o.y.) and Financial intermediation (-2.4% s.e. and -3.0% y.o.y.) contracted in the second quarter.
3.1.2. The level of formal employment continued to grow at a sustained rate in the non-agricultural sectors
The differentiated evolution between the levels of activity of the economic sectors during the second quarter of the year was reflected in the formal employment data of the Ministry of Labor, Employment and Social Security (MTEySS). In fact, in the non-agricultural sectorsas a whole14 employment grew by 3.4% YoY in the second quarter, while in the agricultural sector there was a fall of 1.3% YoY.
In line with the evolution of activity, Mining led the creation of formal employment in II-23, with an increase of 7.7% YoY and 17.5% s.e. accumulated since IV-17. Formal employment in the major cyclical sectors as a whole (Industry, Trade, Construction and Transport and Communications) increased significantly in the II-23 (4.7% YoY), with a higher rate than that experienced by “Other Services” (3.6% YoY). In the so-called “basic” services, formal job creation maintained its relatively stable trend at around 2.2% y.o.y. (see Figure 3.3).
Figure 3.3 | Registered private salaried employment
Source: BCRA based on data from MTEySS.
It should be noted that within private employment, there was a significant growth in self-employed workers (self-employed and single-payers; 1.0% monthly average s.e.), while private salaried employment also rose, although to a lesser extent (0.3%). The growth of private salaried employment as of July 2023 has shown, in terms of sectoral diffusion, historically high values, continuing the positive dynamics that began in the post-pandemic period.
According to data from the Permanent Household Survey (EPH), in the second quarter of 2023 both the employment rate (44.6%, unchanged)15 and the activity rate (47.6%, -0.3 p.p. y.o.y.), continued at high values, while the open unemployment rate contracted to 6.2% (-0.7 p.p. y.o.y.), reaching historic lows at least since the beginning of the series. in 201616.
3.1.3. From the point of view of demand, the lower activity during the second quarter was explained by the fall in net exports, the deaccumulation of stocks and the reduction in private consumption
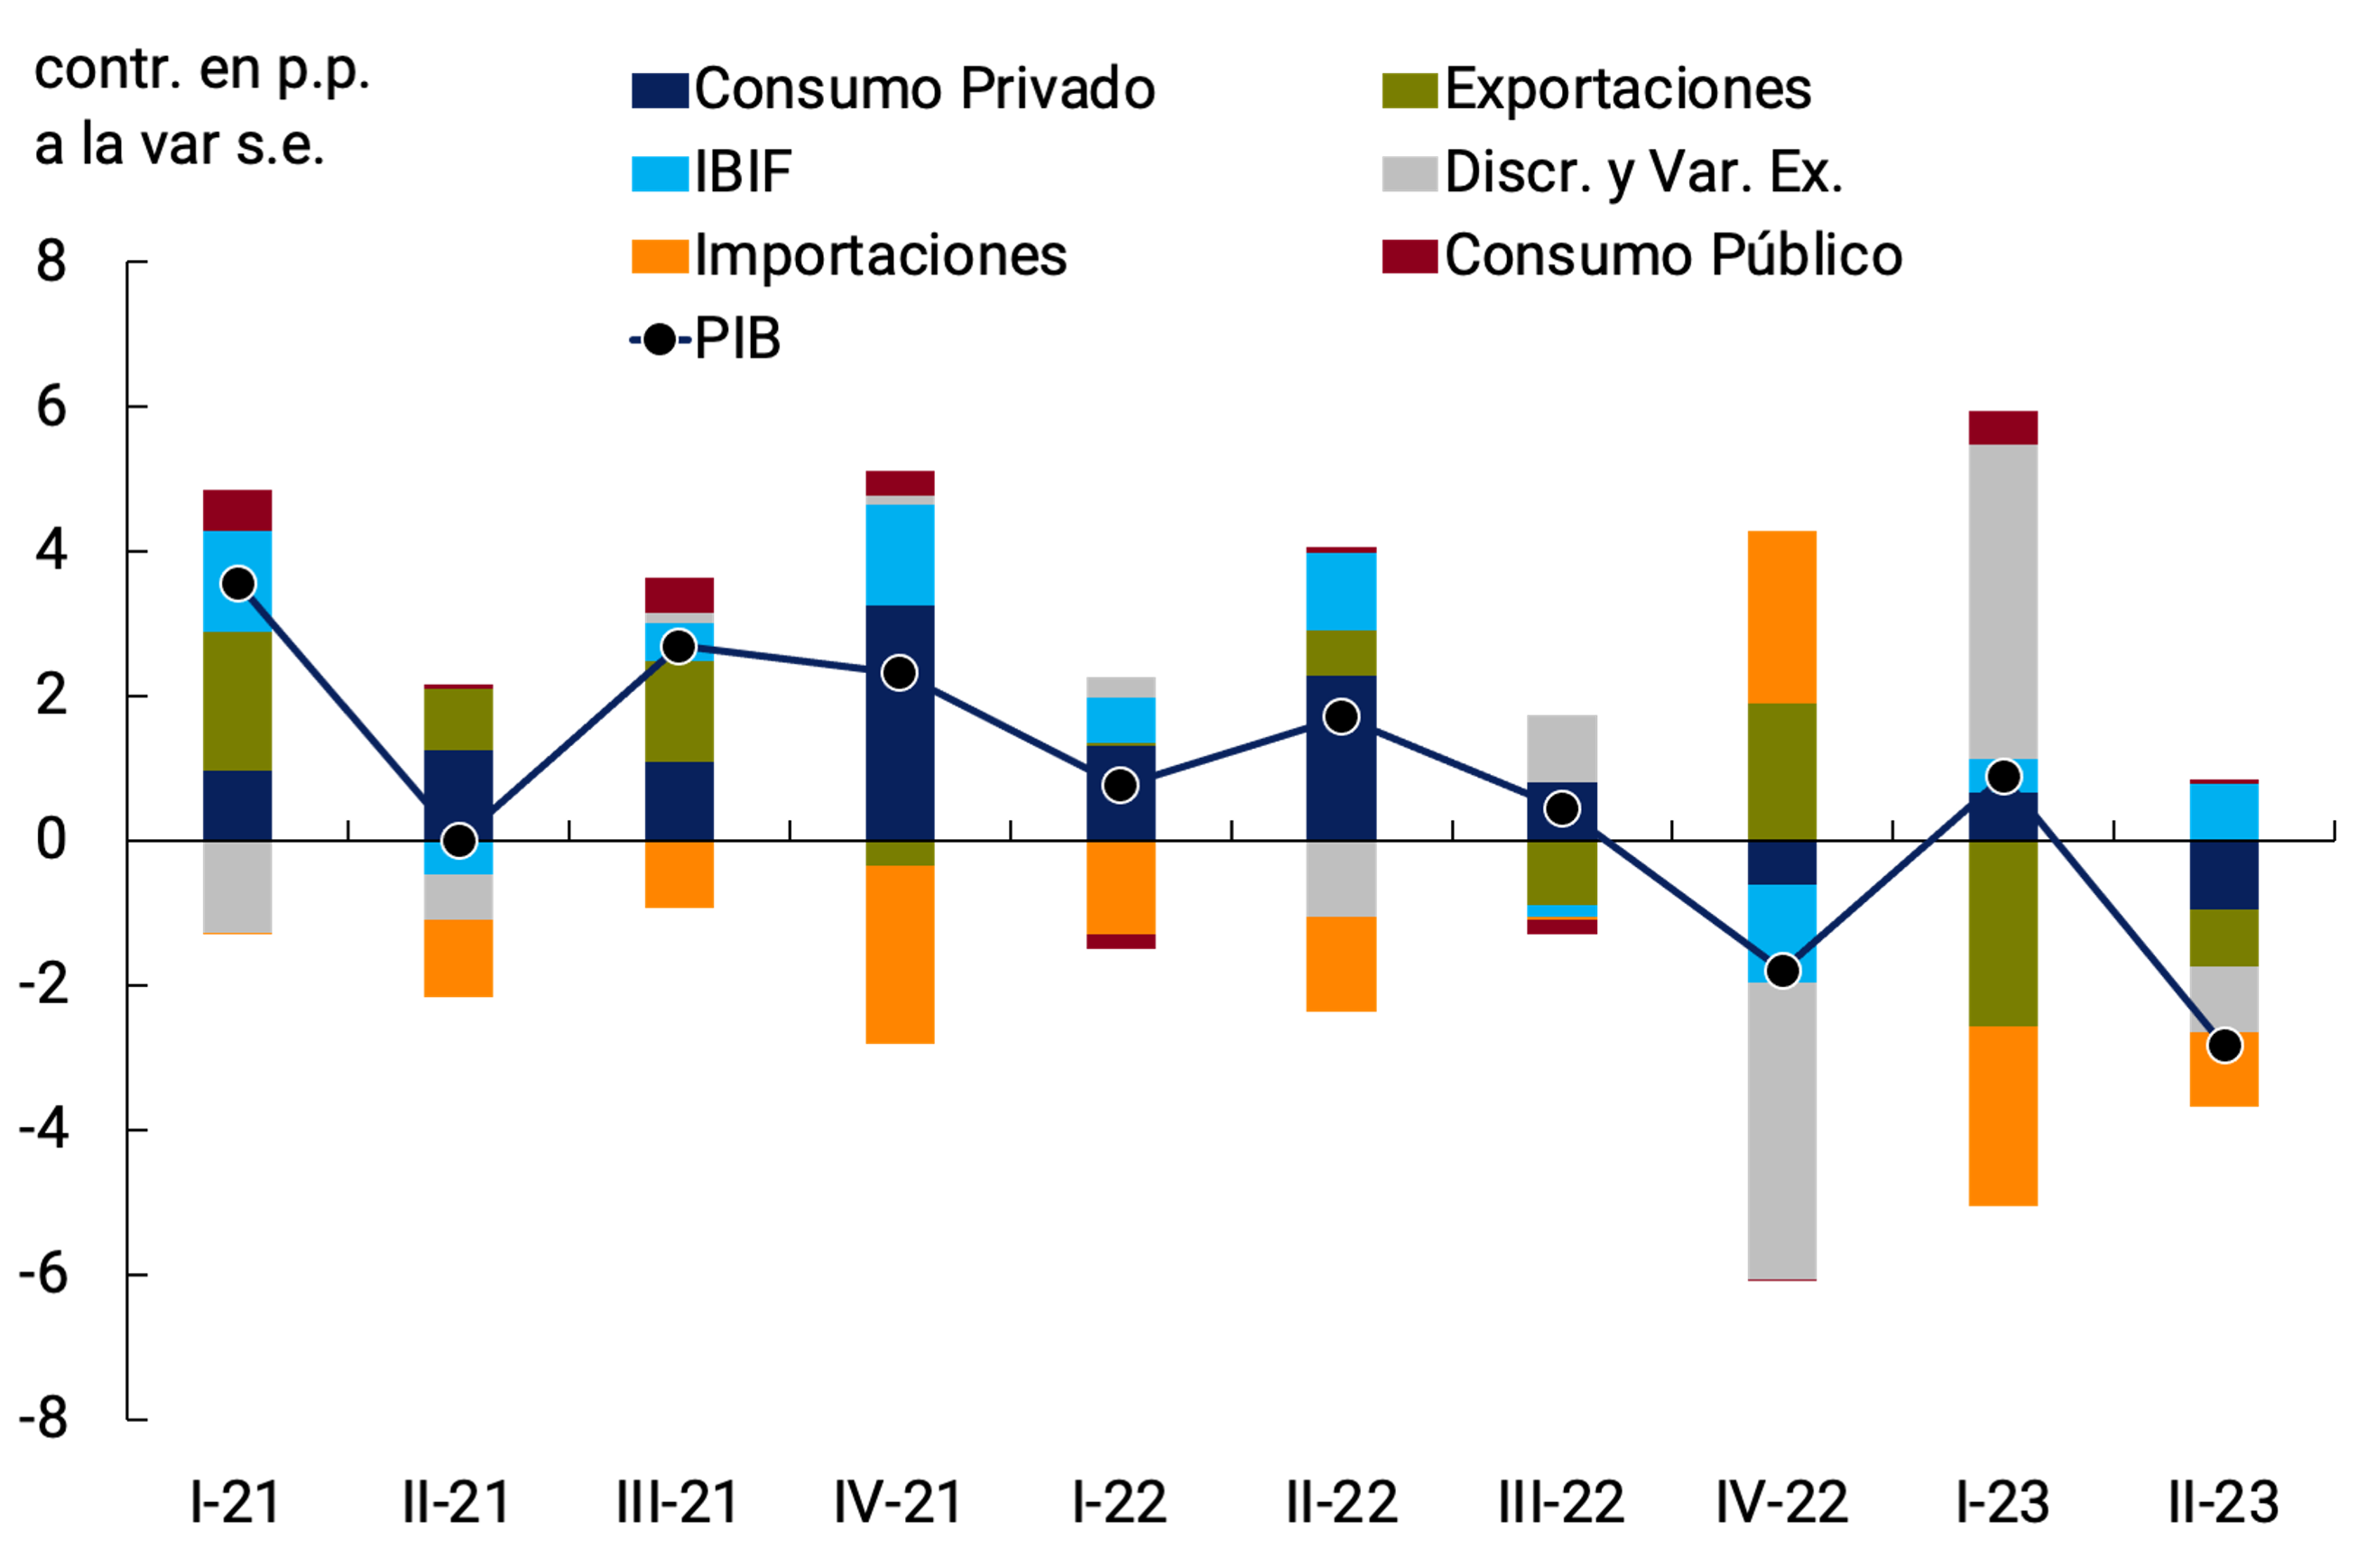
During the second quarter of 2023, domestic demand remained practically stable (-0.1% qoq s.e. and +0.7% y.o.y.), showing a differential behavior between Private Consumption, which fell 1.3% qoq s.e. (+0.8% y.o.y.), Public Consumption, which increased slightly (+0.4% qoq s.e. and 2.6% y.o.y.) and Gross Fixed Capital Formation (GFCF), which showed a significant expansion of 3.8% qoq s.e. (-1.1% y.o.y.). The growth in gross investment was verified both in Durable Production Equipment, which showed a 4.6% quarter-on-quarter increase, and also in Construction (2.3% quarter-on-quarter). Regarding domestic consumption, a differentiated behavior was observed, with a contraction in the demand for non-durables and a rise in that of durables, probably as a hedging strategy against the increase in inflation. In this sense, there was a drop in supermarket sales, while sales in shopping malls, car and motorcycle patents and the marketing of some large appliances grew in the17th quarter. Another evolution to highlight during the period was the growth recorded by the Hotels and Restaurants sector (4.7% s.e.; 6.4% y.o.y.).
Given the stability of domestic demand, the fall in output was mainly explained by the decumulation of stocks, which could largely be attributed to the agricultural sector, and by the performance of the external sector. In fact, the variation in inventories, together with the statistical discrepancy, subtracted 0.9 p.p. s.e. from the quarterly variation of the Product, after the strong contribution it had had in the I-23. In addition, imports of goods and services increased 3.7% quarter-on-quarter, while exports fell 4.1% quarter-on-quarter, mostly linked to the agricultural sector (see Chapter 4. External Sector). In this way, the net external sector subtracted 1.8 p.p. from the quarterly variation of GDP (see Chart 3.4).
Figure 3.4 | Quarterly variations in GDP and contributions from demand
Source: BCRA based on INDEC data.
3.1.4. Partial data for the third quarter show a recovery from the previous quarter
In July, the EMAE increased significantly (2.4% monthly s.e.), due to both the strong recovery of the agricultural product and the rise in the rest of the sectors, which averaged 0.6% monthly s.e. In this way, the statistical carryover left by the data was positive for the third quarter (+2.2 p.p.), but it is still negative for the 2023 average.
With respect to other available indicators that are useful for estimating the evolution of activity at the aggregate level, during the third quarter there was a contraction in July-August and then a recovery in September in the electricity consumption of large companies18. The General Activity Index (IGA) prepared by O.J. Ferreres, whose correlation with the official activity data is high, rose in July and August by 2.2% and 0.4% monthly, respectively. Finally, the Nowcast-BCRA – which more accurately predicts non-agricultural GDP – anticipates a 0.5% quarterly fall s.e. during the third quarter.
Figure 3.5 | EMAE and leading indicators of economic activity
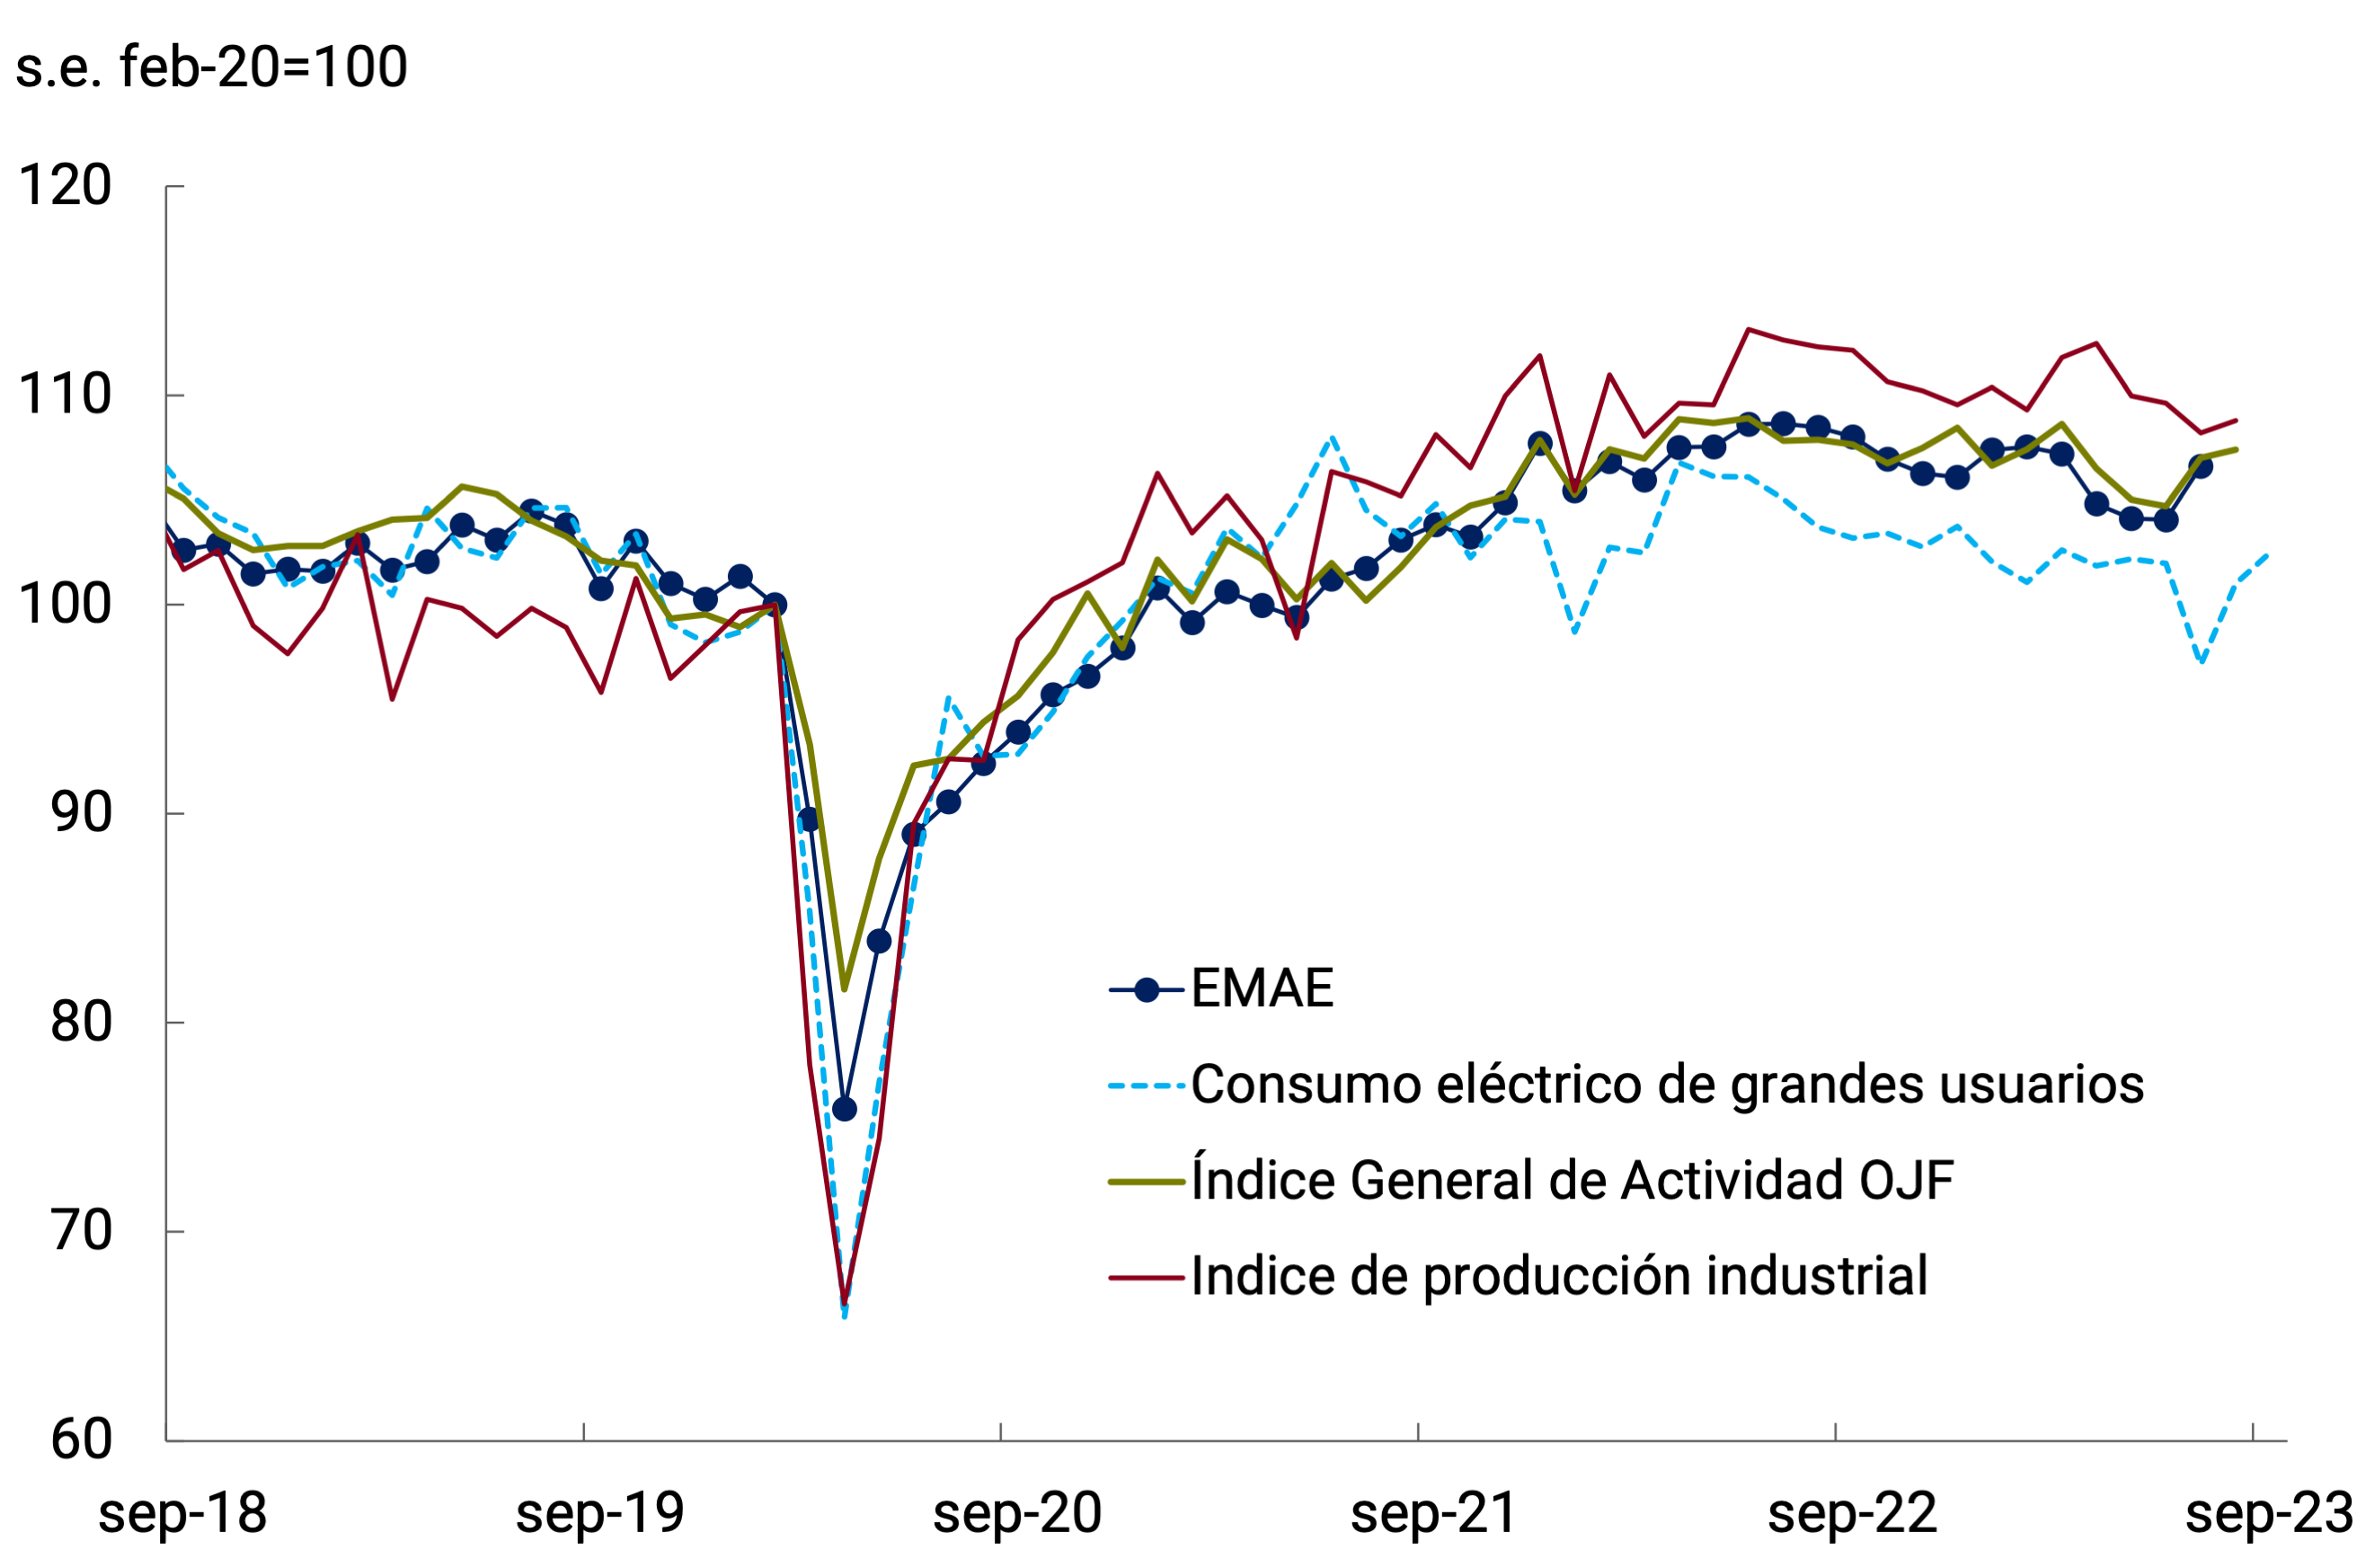
Source: BCRA based on data from INDEC, CAMMESA, OJF and Associates.
The industrial production statistics and construction indicators available for the third quarter19 anticipate a possible quarterly (s.e.) contraction in these sectors. On the other hand, the indicators show that services associated with tourism and leisure would remain in positive territory20.
Regarding private consumption, the available data suggest that the demand for durable goods showed a similar behavior in July and August to that observed in the first half of the year, with significant increases due to the same factors mentioned above. In the case of sales of domestic automobiles to the domestic market, they increased 1.2% quarter-on-quarter s.e. in the third quarter of 2023. Although since mid-August private consumption has been negatively affected by the increase in inflation and the greater electoral uncertainty after the PASO, the validity since September of a set of measures adopted by the National Government to shore up the real incomes of families and boost credit would have helped to offset its negative impact (see Chapter 5. Public Finance).
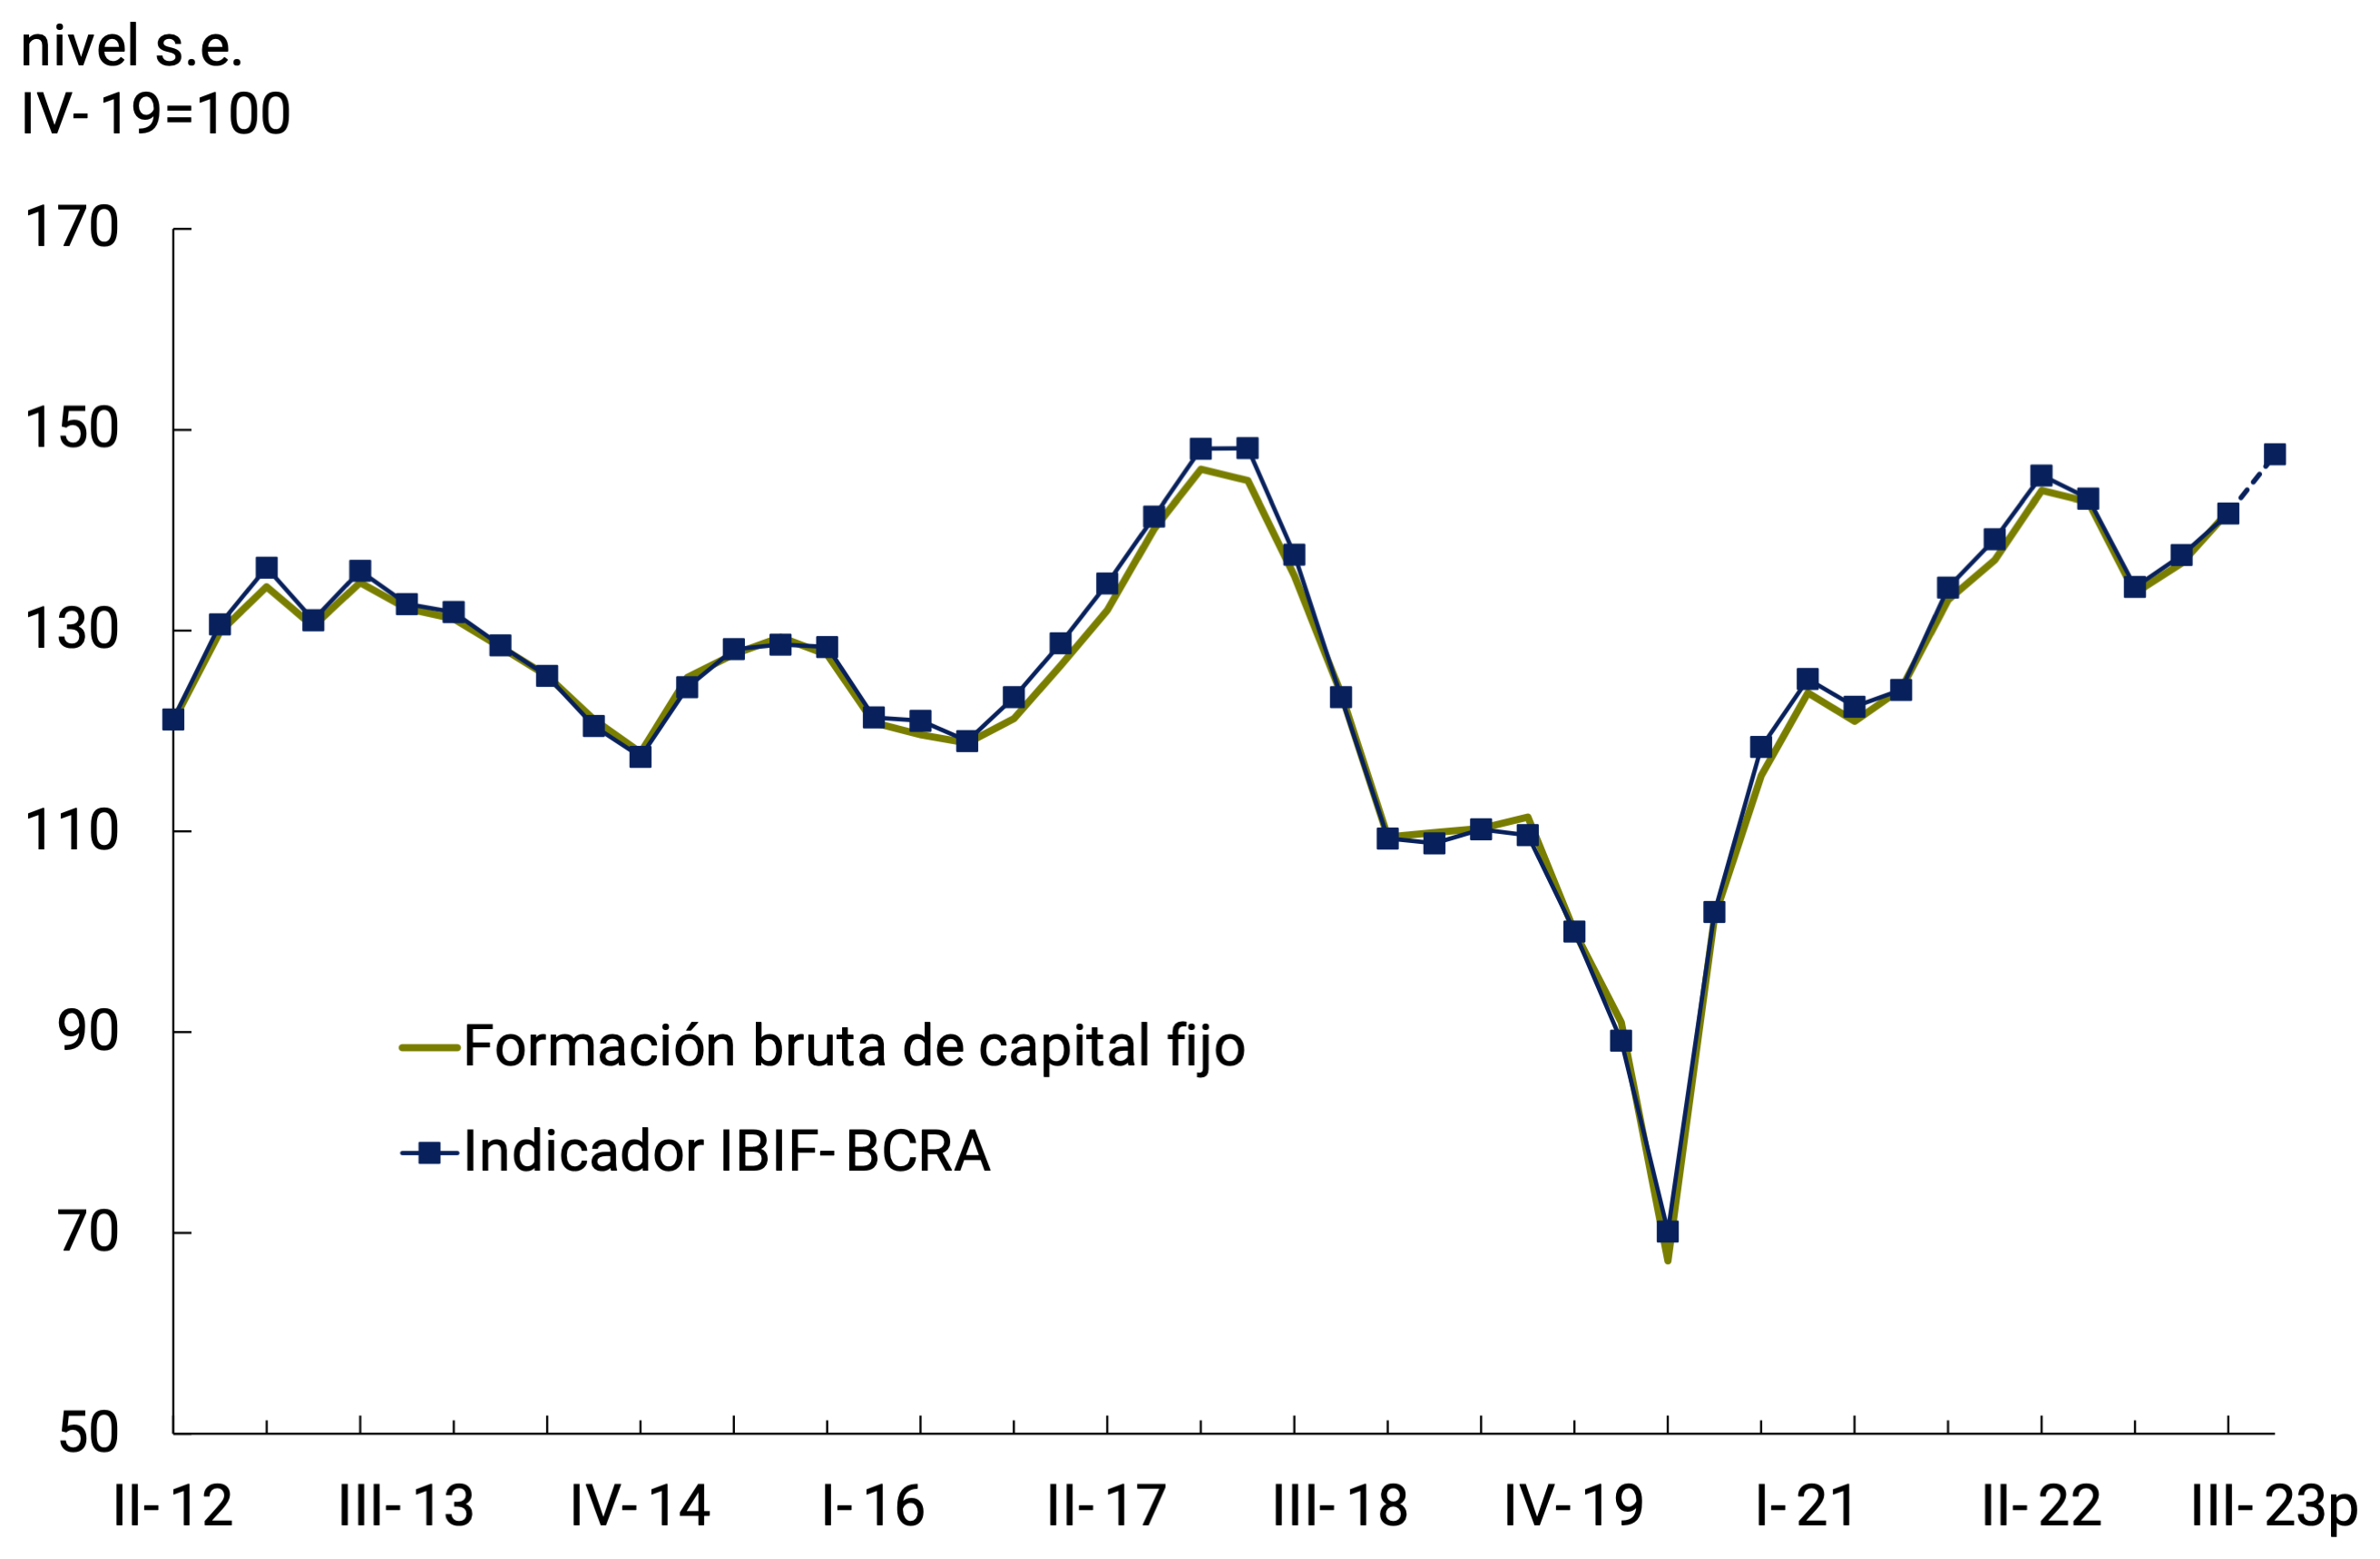
Gross investment is expected to increase again in the third quarter according to the IBIF-BCRA indicator (see Figure 3.6). Demand for imports of capital goods and industrial transport equipment would have explained the improvement, while domestic production of such goods and construction would have evolved in the opposite direction21.
Figure 3.6 | Gross
Investment
Note: The evolution of the IBIF-BCRA indicator is calculated using the variations in the index of industrial production in capital goods prepared by FIEL, the quantities imported of capital goods and the EMAE of construction. The III-23 was projected with the statistical carryovers of the respective series.
p: Projected.
Source: BCRA based on data from INDEC and FIEL.
In conclusion, although the indicators related to non-agricultural product show mixed signals, the expected recovery for agriculture would allow GDP growth compared to the second quarter in seasonally adjusted terms. Regarding domestic demand, although there are favorable indicators on durable consumption and investment in imported capital goods, it could be expected that during the third quarter it will have been affected by the increase in inflation in August and September. However, the negative effect on real incomes would have been attenuated by the maintenance of employment and by the set of compensatory measures adopted by the National Government. Regarding external demand, the data on the commercial exchange of goods for July and August showed an increase of 3.4% s.e. in the quantities exported compared to the previous quarter and a fall in imported volumes of 0.5% s.e. in the same period. Thus, estimating a behavior of the exchange of services similar to that of goods, the external sector would show a positive net contribution to the quarterly variation of GDP in the third quarter of 2023, after two strongly negative quarters (see Chapter 4. External Sector).
3.2. Perspectives
During the last quarter of the year, the economy will develop in an environment of greater volatility associated with the political cycle that could negatively affect consumption and investment decisions. In this context, domestic demand will continue to be underpinned by the broad set of income and social protection policies, implemented by the National Government since the third quarter with the aim of cushioning the possible contractionary effects of the recalibration of the level of the official exchange rate in mid-August. The labor market continued to create jobs until the third quarter and this trend is expected to continue in the last months of the year, according to the Survey of Labor Indicators (EIL).
From the sectoral point of view, it is expected that some items may exhibit a contraction in their activity levels as a result of the context summarized above, however, there are favorable determinants to sustain the good performance that some sectors showed during the first three quarters of the year. Among them, the growth recorded in recent years and the potential for development of the mining sector and, especially, the hydrocarbon sector enhanced by the recent commissioning of the Néstor Kirchner Gas Pipeline stand out. On the other hand, the agricultural product would also have a positive evolution, which, in the last quarter of the year, will mainly reflect the result of the wheat harvest, with an estimated growth of 30% compared to the previous season. In the short term, it is also expected that the increase in tourism, cultural and leisure services, favored by the PreViaje program, will continue.
By 2024, the economy is expected to gradually resume the growth path boosted by the favorable prospects for the agricultural harvest and the energy sector. This scenario is not without risks both locally and globally. In this context, the BCRA will intensify its actions to preserve exchange rate and financial stability and will continue to facilitate the financing of the productive sectors. In this way, it will seek to contribute to the sustainability of economic activity and the labor market.
4. External Sector
In the second quarter of 2023, the economy operated with a current account deficit mainly due to a widespread fall in exports of goods, in which the lower shipments of grains and their derivatives strongly affected by the drought stood out for their weight, which would have impacted lower revenues of about US$20,000 million. At the same time, imports of goods showed a quarterly increase, although concentrated in a few import categories, among which capital goods and their parts and soybeans in the context of the drought stood out. In the third quarter, a reduction in the trade deficit of goods was observed, in a context in which the National Government and the BCRA promoted a set of measures aimed at achieving this objective.
Despite a negative trade balance, the dynamics of the trade debt for exports and imports allowed the accumulation of a positive net result for goods in the foreign exchange market of US$6,267 million during the first nine months of 2023, 65% less than what was observed in the same period of the previous year. In addition, net outflows were recorded through the foreign exchange market for services, interest and other financial transactions for US$9,026 million. In this way, the BCRA was a net seller in the foreign exchange market for US$1,990 million, added to the net payments by the Local Currency Payment System (SML) for US$771 million.
As of September 30, the BCRA’s international reserves reached a level of US$26,925 million, showing a fall of US$17,673 million throughout the year. This reduction was mainly explained by the net cancellation of principal and interest with international organizations (excluding the IMF) and other financial debt of the National Treasury for US$5,197, by the net cancellation of principal, interest and charges with the IMF for US$4,020 million, by the fall of the current accounts in foreign currency of the entities in the BCRA by US$2,517 million, by the BCRA’s net sales in the foreign exchange market, by the BCRA’s net payments through the SML and by the fall in the price in US dollars of the assets that make up the reserves for US$723 million.
As a result of the measures recently adopted, a slight contraction in the current account deficit of the international balance of payments is expected from the third quarter onwards. For the last quarter of the year, exports are expected to be boosted by the entry of fine harvest products (mainly wheat), although they will continue to be conditioned by the effects of the drought on the coarse harvest and by the uncertainty associated with the electoral context.
4.1. In the second quarter of 2023, the economy deepened the current account deficit
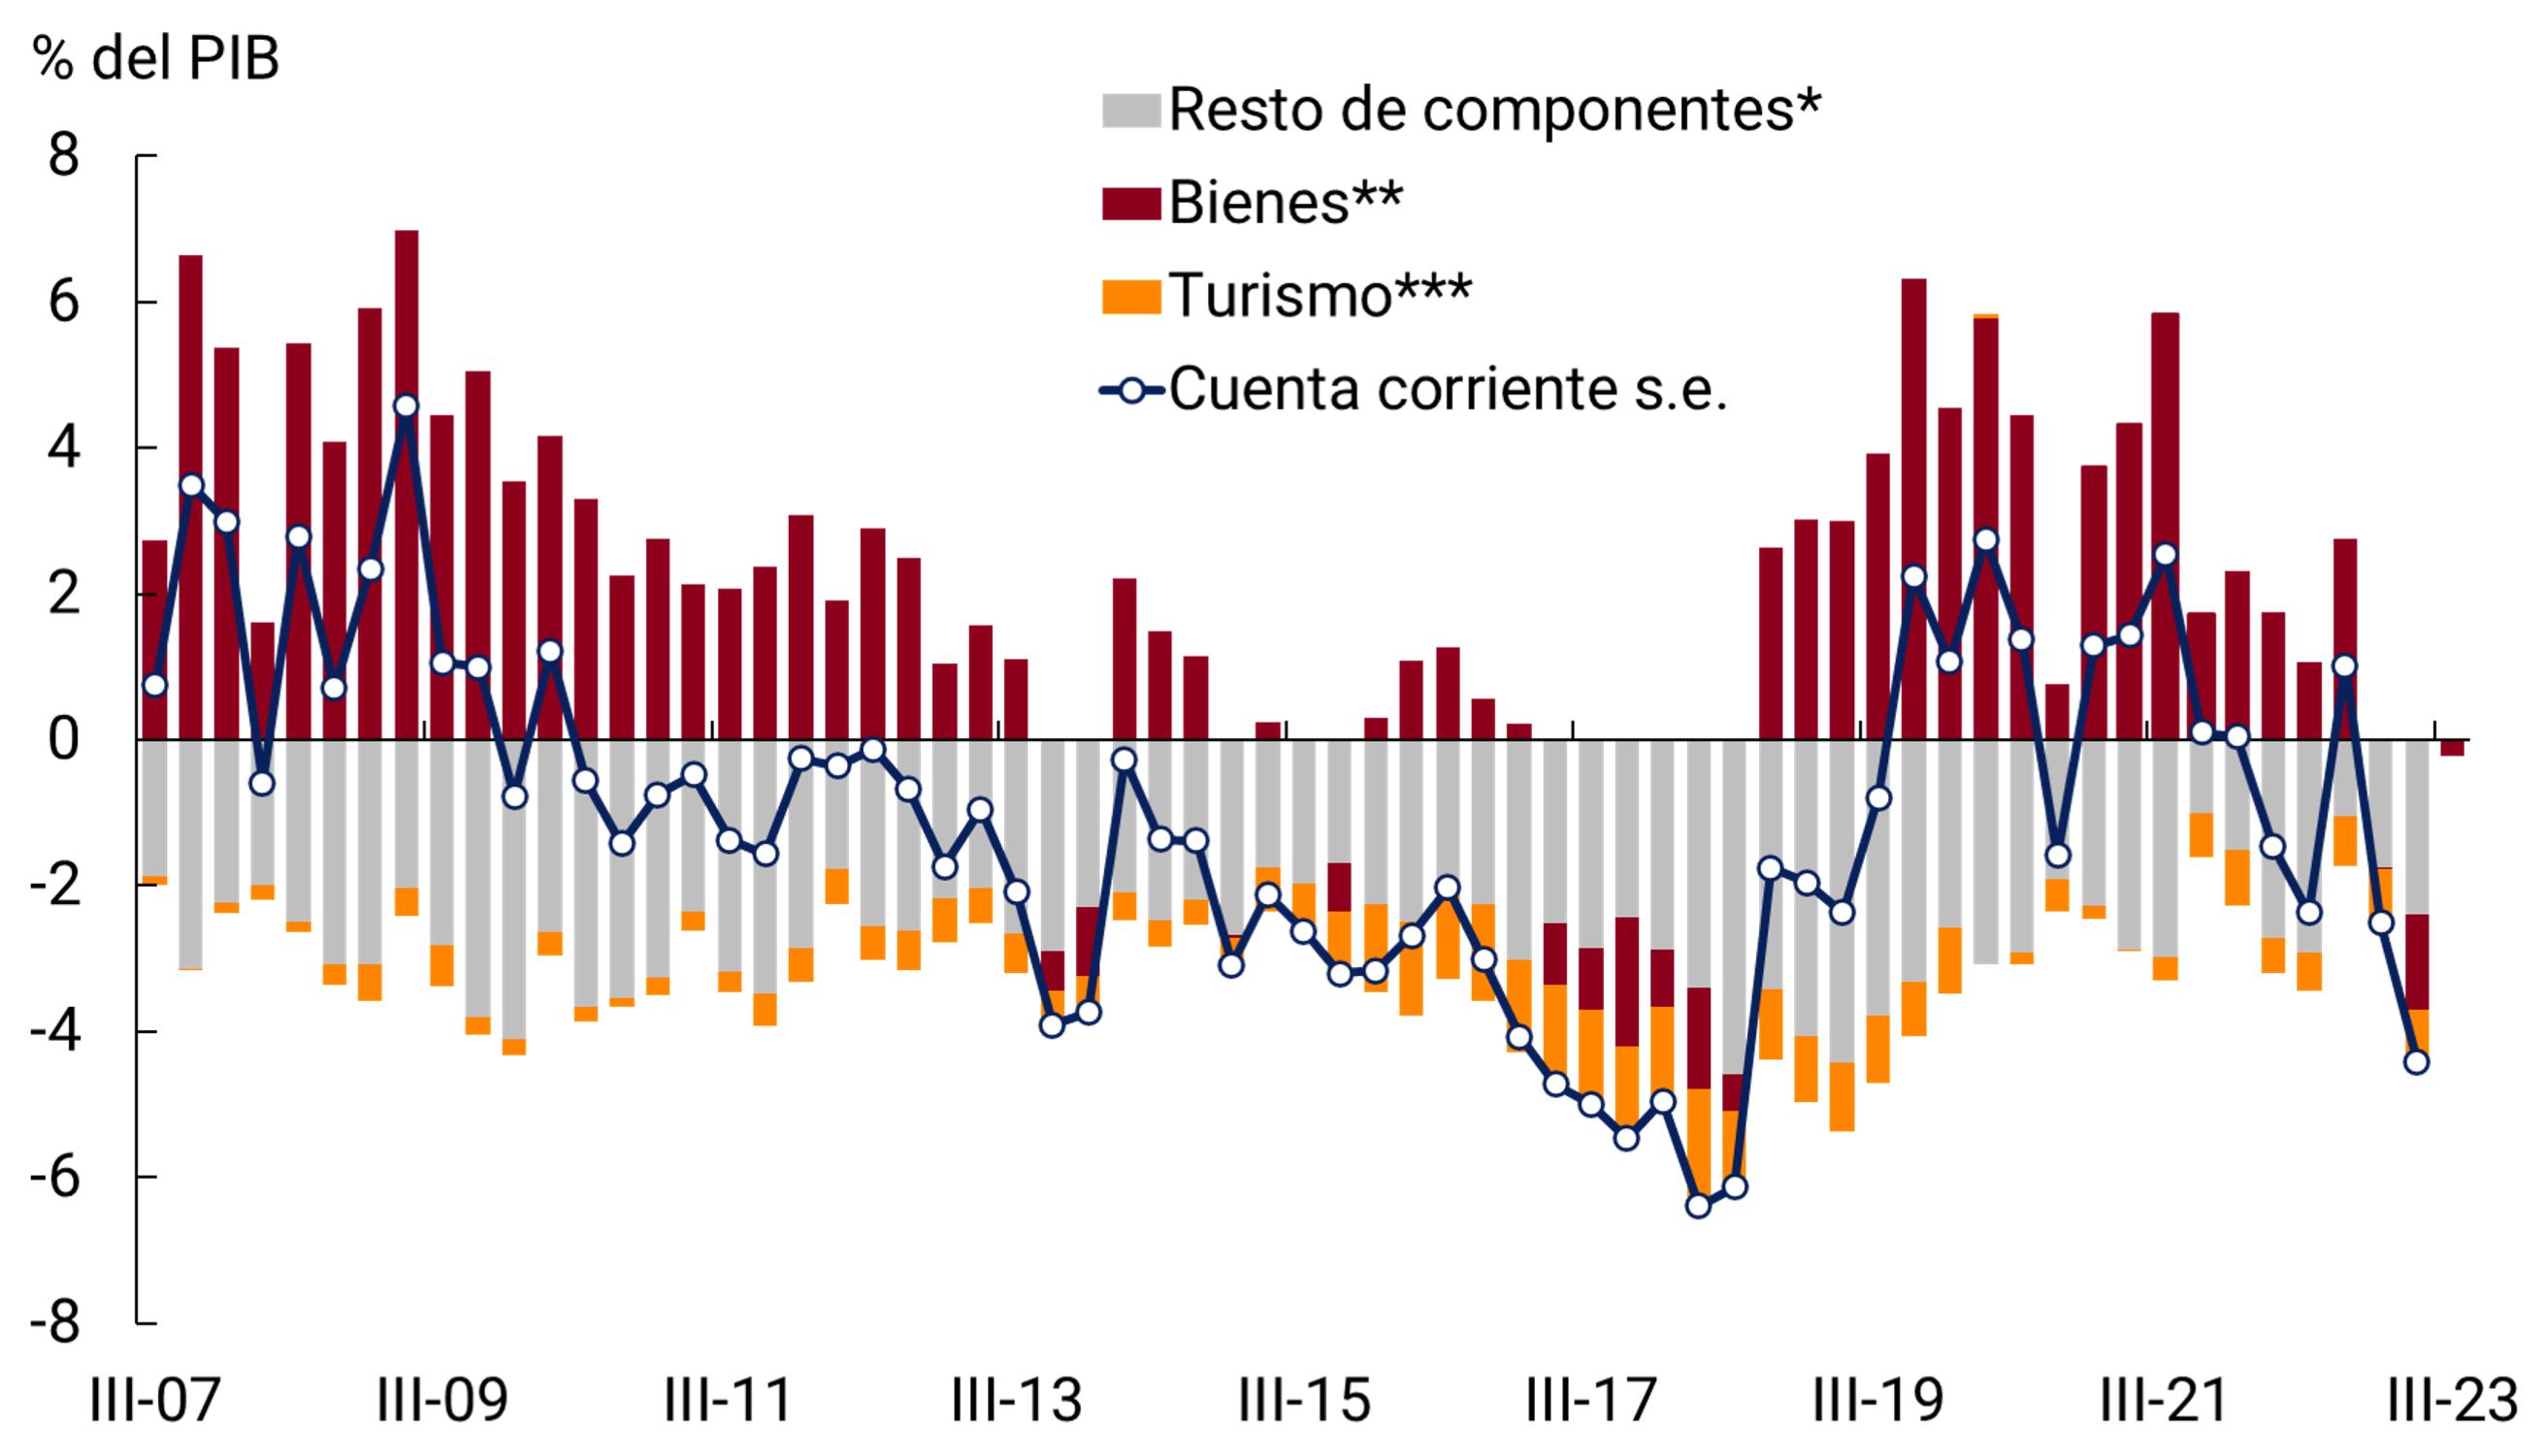
In the second quarter of 2023 (latest official data available) the Argentine economy recorded a current account deficit of US$6,351 million – equivalent to 4.4% of GDP in seasonally adjusted and annualized terms. This result occurred in the context of a fall in exports compared to the previous quarter and higher imports. In addition to the seasonally adjusted deficit from the exchange of goods (1.3% of annualized GDP), there are deficits caused by international tourism (0.7% of annualized GDP) and the rest of the current account items (2.4% of annualized GDP). With partial data for the third quarter, there was an improvement in the trade balance of goods, although a deficit result (0.2% of annualized GDP) is maintained.
This performance implied the year-on-year reversal of the trade balance of goods and services in the second quarter of the year of US$5,011 million, which was mainly due to a sharp fall in the values exported of goods by about US$7,400 million, partially offset by an approximate contraction of US$2,400 million in imports25.
On the other hand, rents continued to reflect the increase in international interest rates, while a high level of earnings from foreign direct investment would have been maintained. Thus, it is estimated that the seasonally adjusted current account would have yielded a new negative result in the third quarter of 2023 (see Figure 4.1).
Figure 4.1 | Seasonally adjusted current account. Annualized
values
* Includes accounts: primary income services and secondary income.
** II-23: Data as of August 2023.
Includes travel and ticket accounts.
Source: BCRA based on INDEC data.
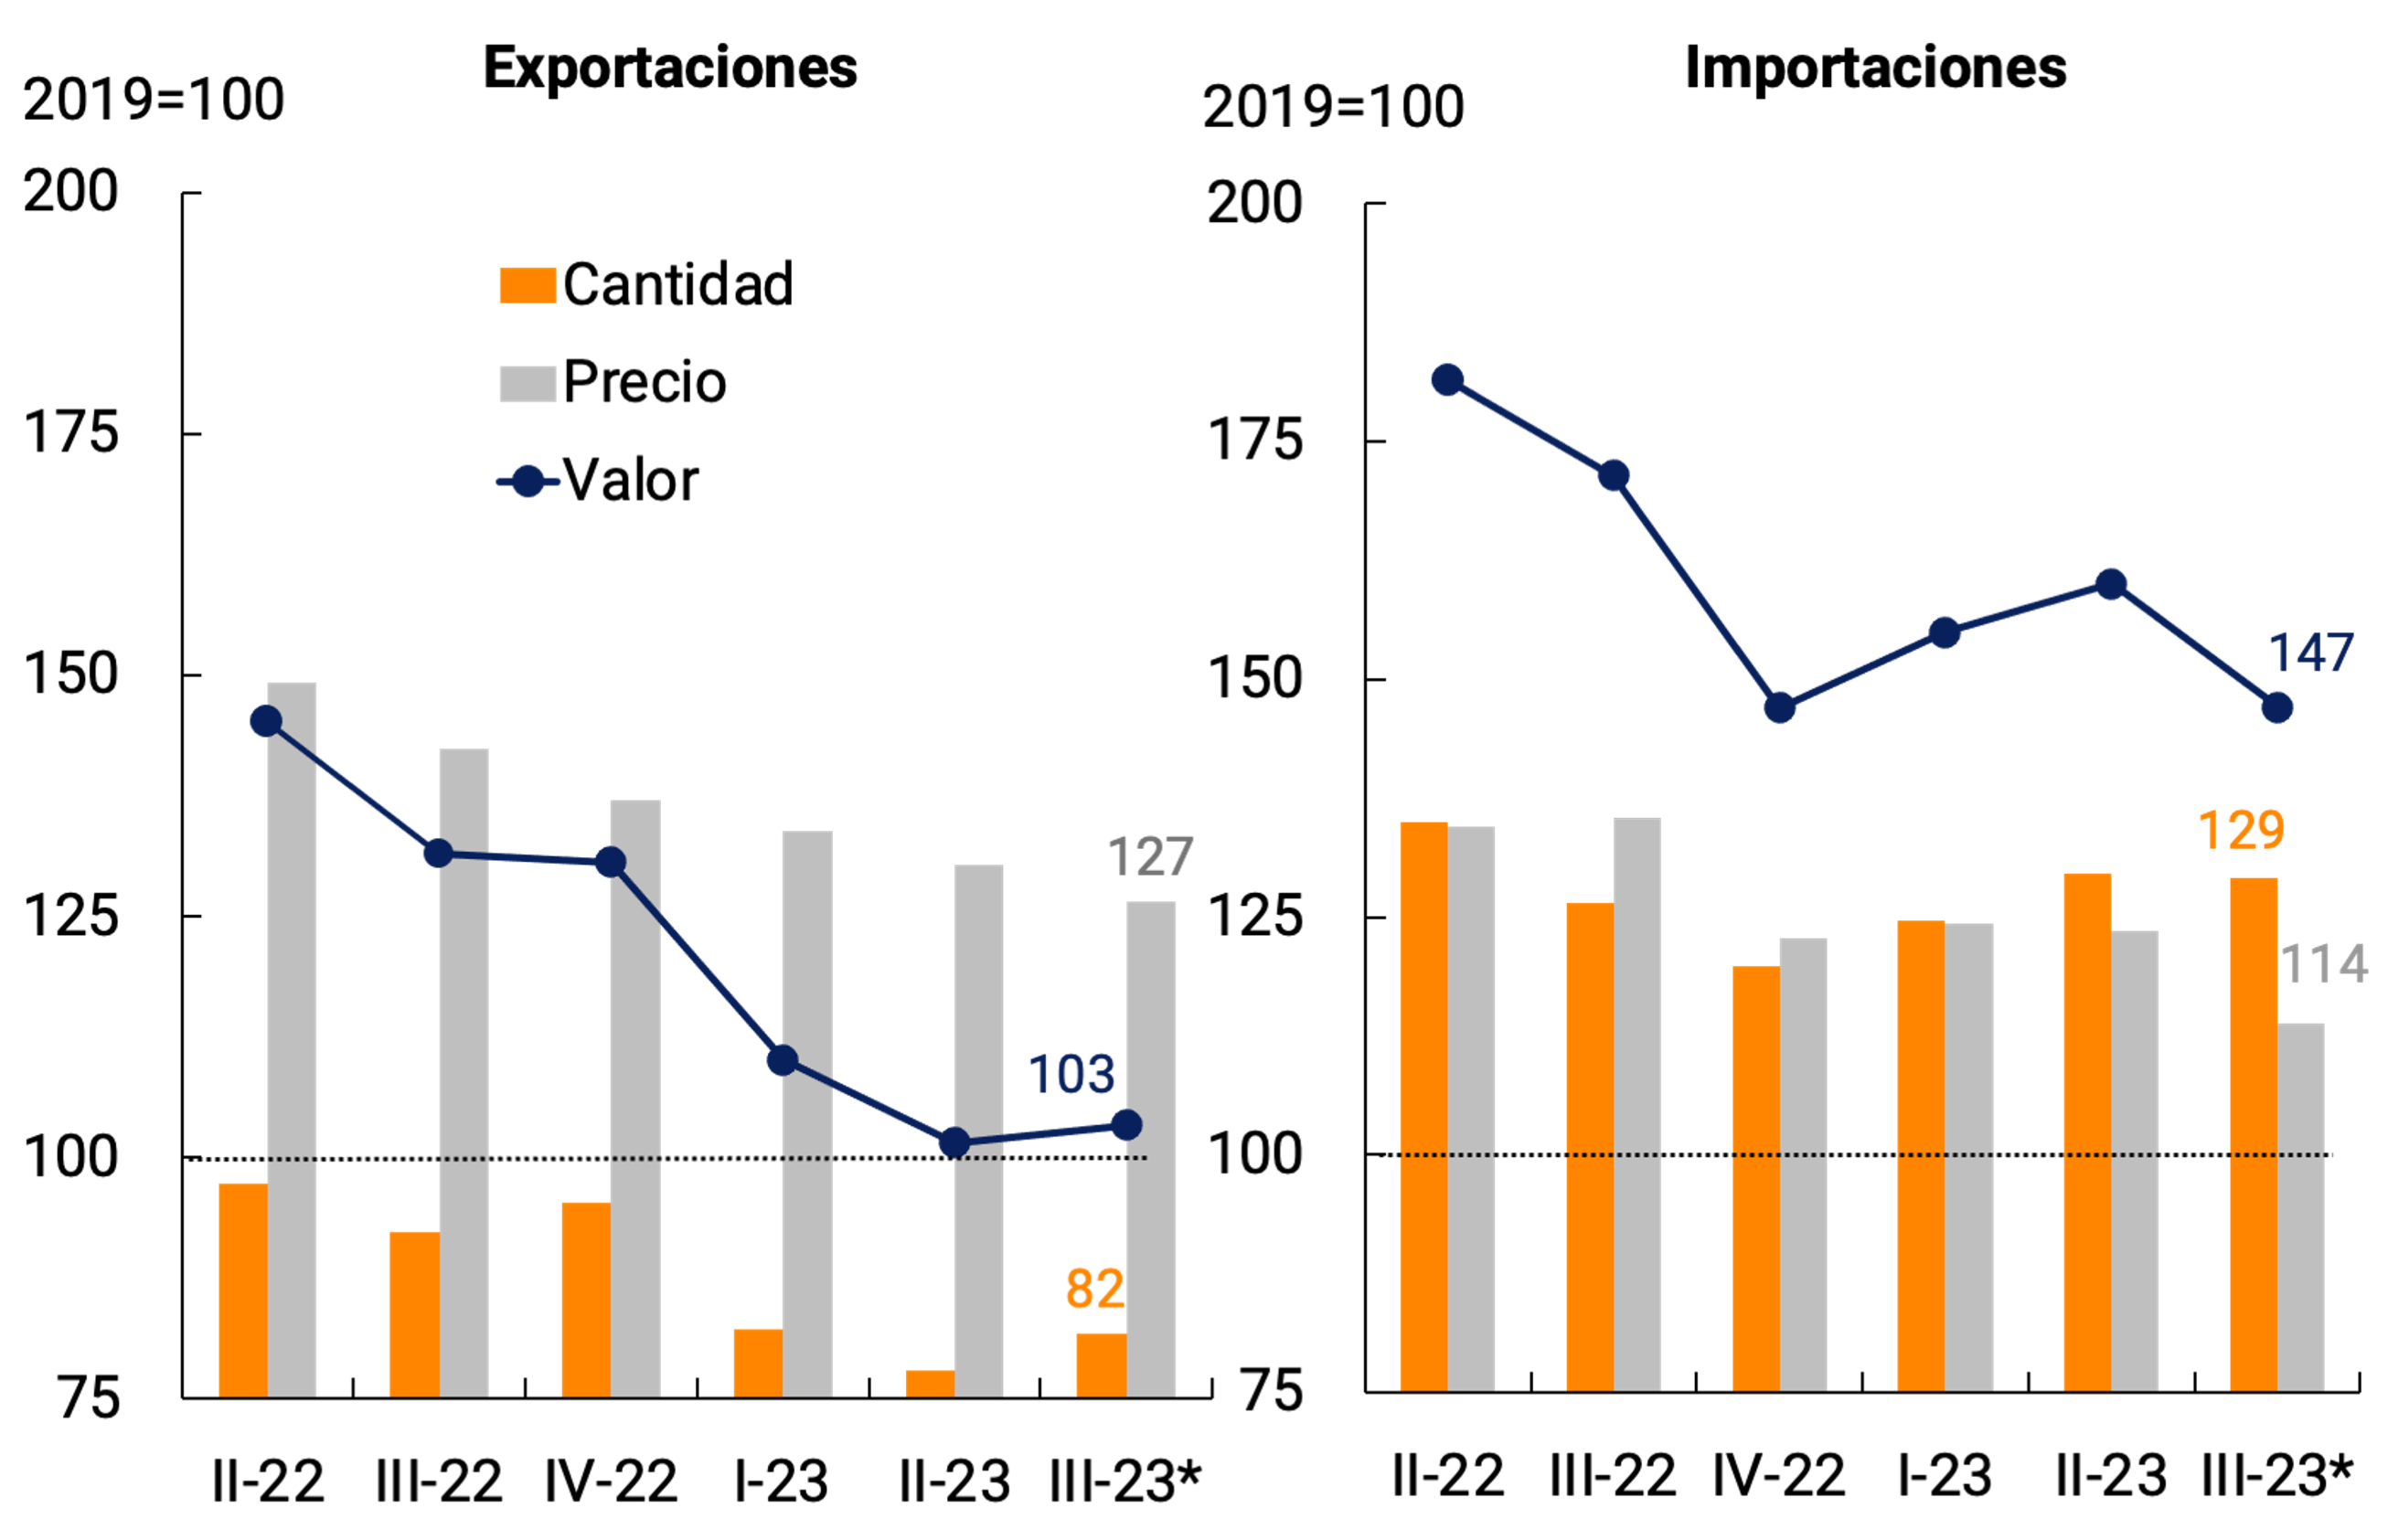
Between April and June 2023, the exported values of seasonally adjusted goods reached US$16,534 million (Free on Board (FOB)) at current prices, which represented a drop of 7.8% compared to the level recorded in the first quarter of 2023. This drop occurred as a result of a generalized decrease in quantities, which was enhanced by a slight fall in prices. In the July-August 2023 two-month period, exported values interrupted their downward trend mainly as a result of an increase in quantities sold, despite a further fall in export prices (see Figure 4.2).
Figure 4.2 | Trade in goods. Seasonally
adjusted series
* Data up to August 2023.
Source: BCRA based on INDEC data.
On the other hand, in the second quarter of 2023, seasonally adjusted imports of goods totaled US$19,659 million (Cost, insurance and freight (CIF)) at current prices, 3.3% higher than the figure for the first quarter of the year. This performance of imported values was mainly explained by an increase in the quantities acquired (+4.0% s.e.). In the July-August two-month period, a fall in the securities acquired was observed as a result of a fall in prices and a stagnation in quantities. The leading indicators for September suggest that the third quarter would close with a pronounced decrease in imported values, in the context of the measures recently implemented by the National Government and the BCRA (generalization of the PAIS tax on imports of goods and services and recalibration of the official exchange rate) and the aforementioned fall in prices.
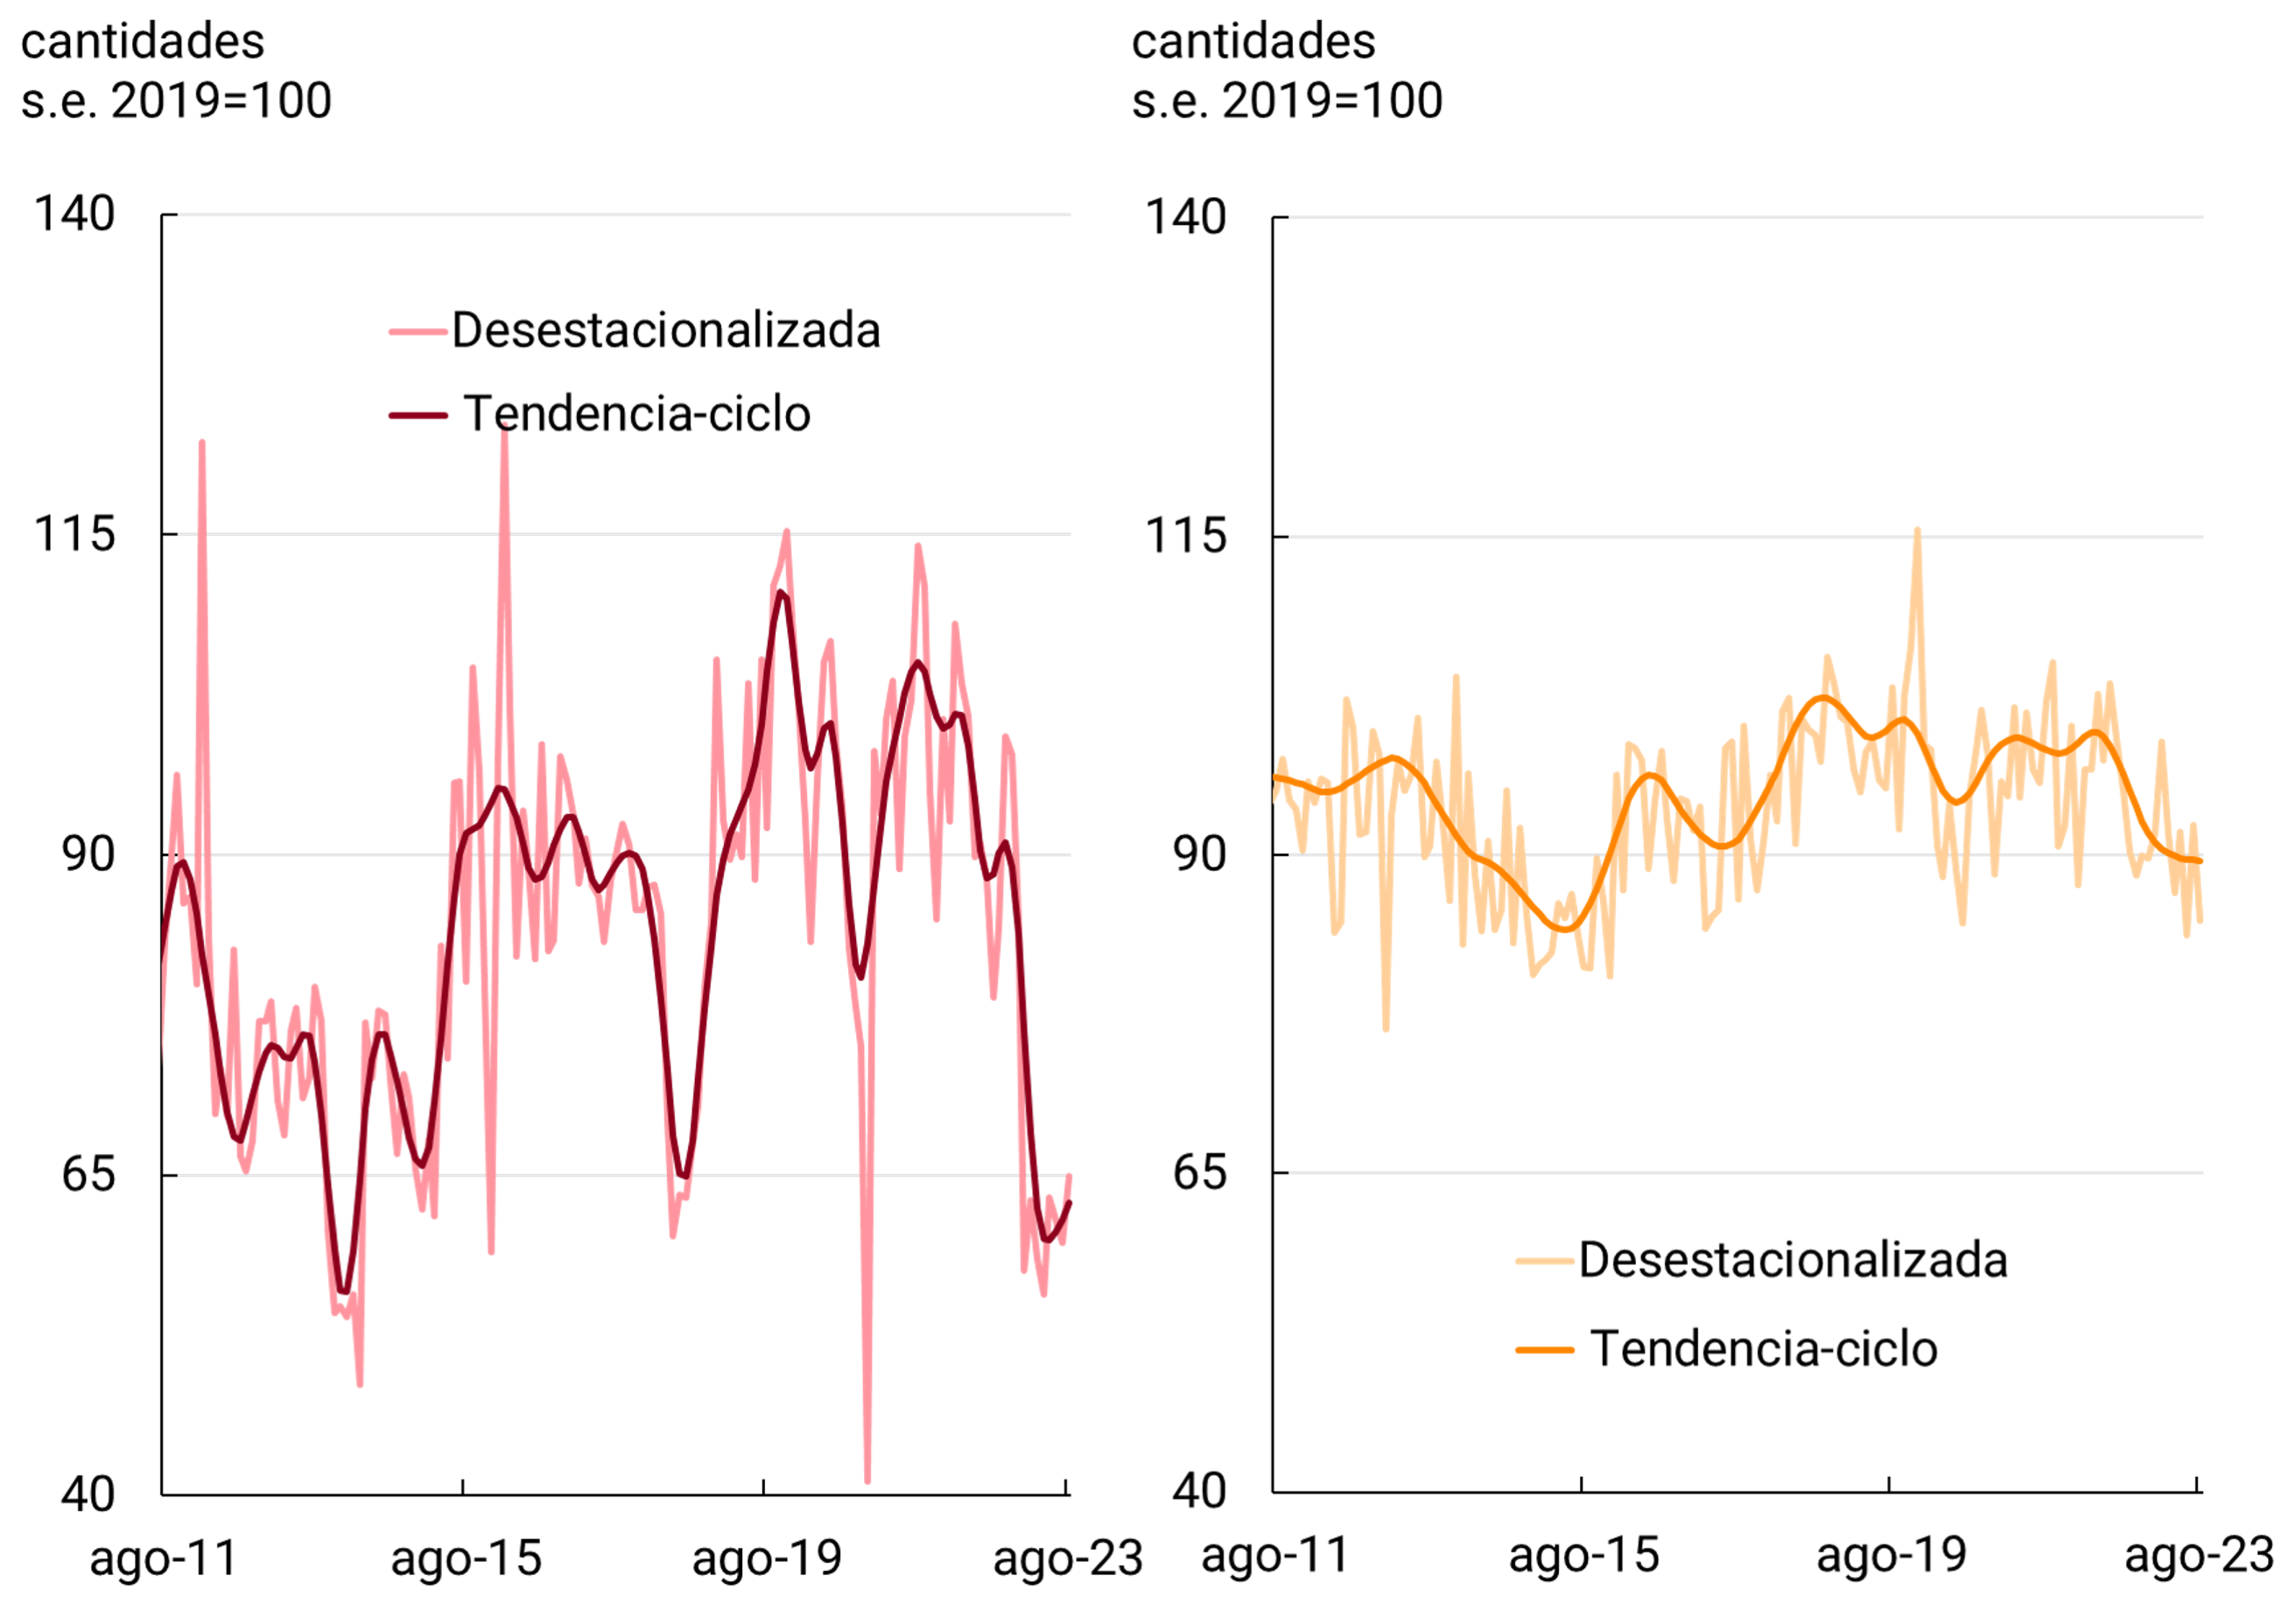
At the disaggregated level, the volumes exported largely replicated the trajectory of the general level. Foreign sales of agricultural crops (in grain and its derivatives —including biodiesel—) hit their bottom in the second quarter of 2023, reaching levels even lower than those observed in the drought episodes of 2018 and the months after the outbreak of the pandemic in 2020). The largest negative contributions in this group of exportable products were those of soybeans and corn. In the second quarter, falls were also observed in the rest of the Manufactures of Agricultural Origin (MOA) and Primary Products (PP) and Manufactures of Industrial Origin (MOI) – excluding biodiesel. In all cases, the decline in exports was widespread. Finally, between April and June, a brief interruption of the upward trend in external fuel sales was also observed.
On the other hand, in the July-August two-month period, the four product groupings contributed to the seasonally adjusted growth of exported volumes. The case of Fuels and Energy stands out, which, driven at the margin by gas shipments, resumed its upward trajectory (+10.4% s.e. compared to II-23) and remains at the highest levels in the last 12 years (see Chart 4.3).
Figure 4.3 | Quantities exported
Agricultural crops and derivatives Rest PP and MOA
MOI (excluding biodiesel) Fuels and energy

Source: BCRA based on INDEC data.
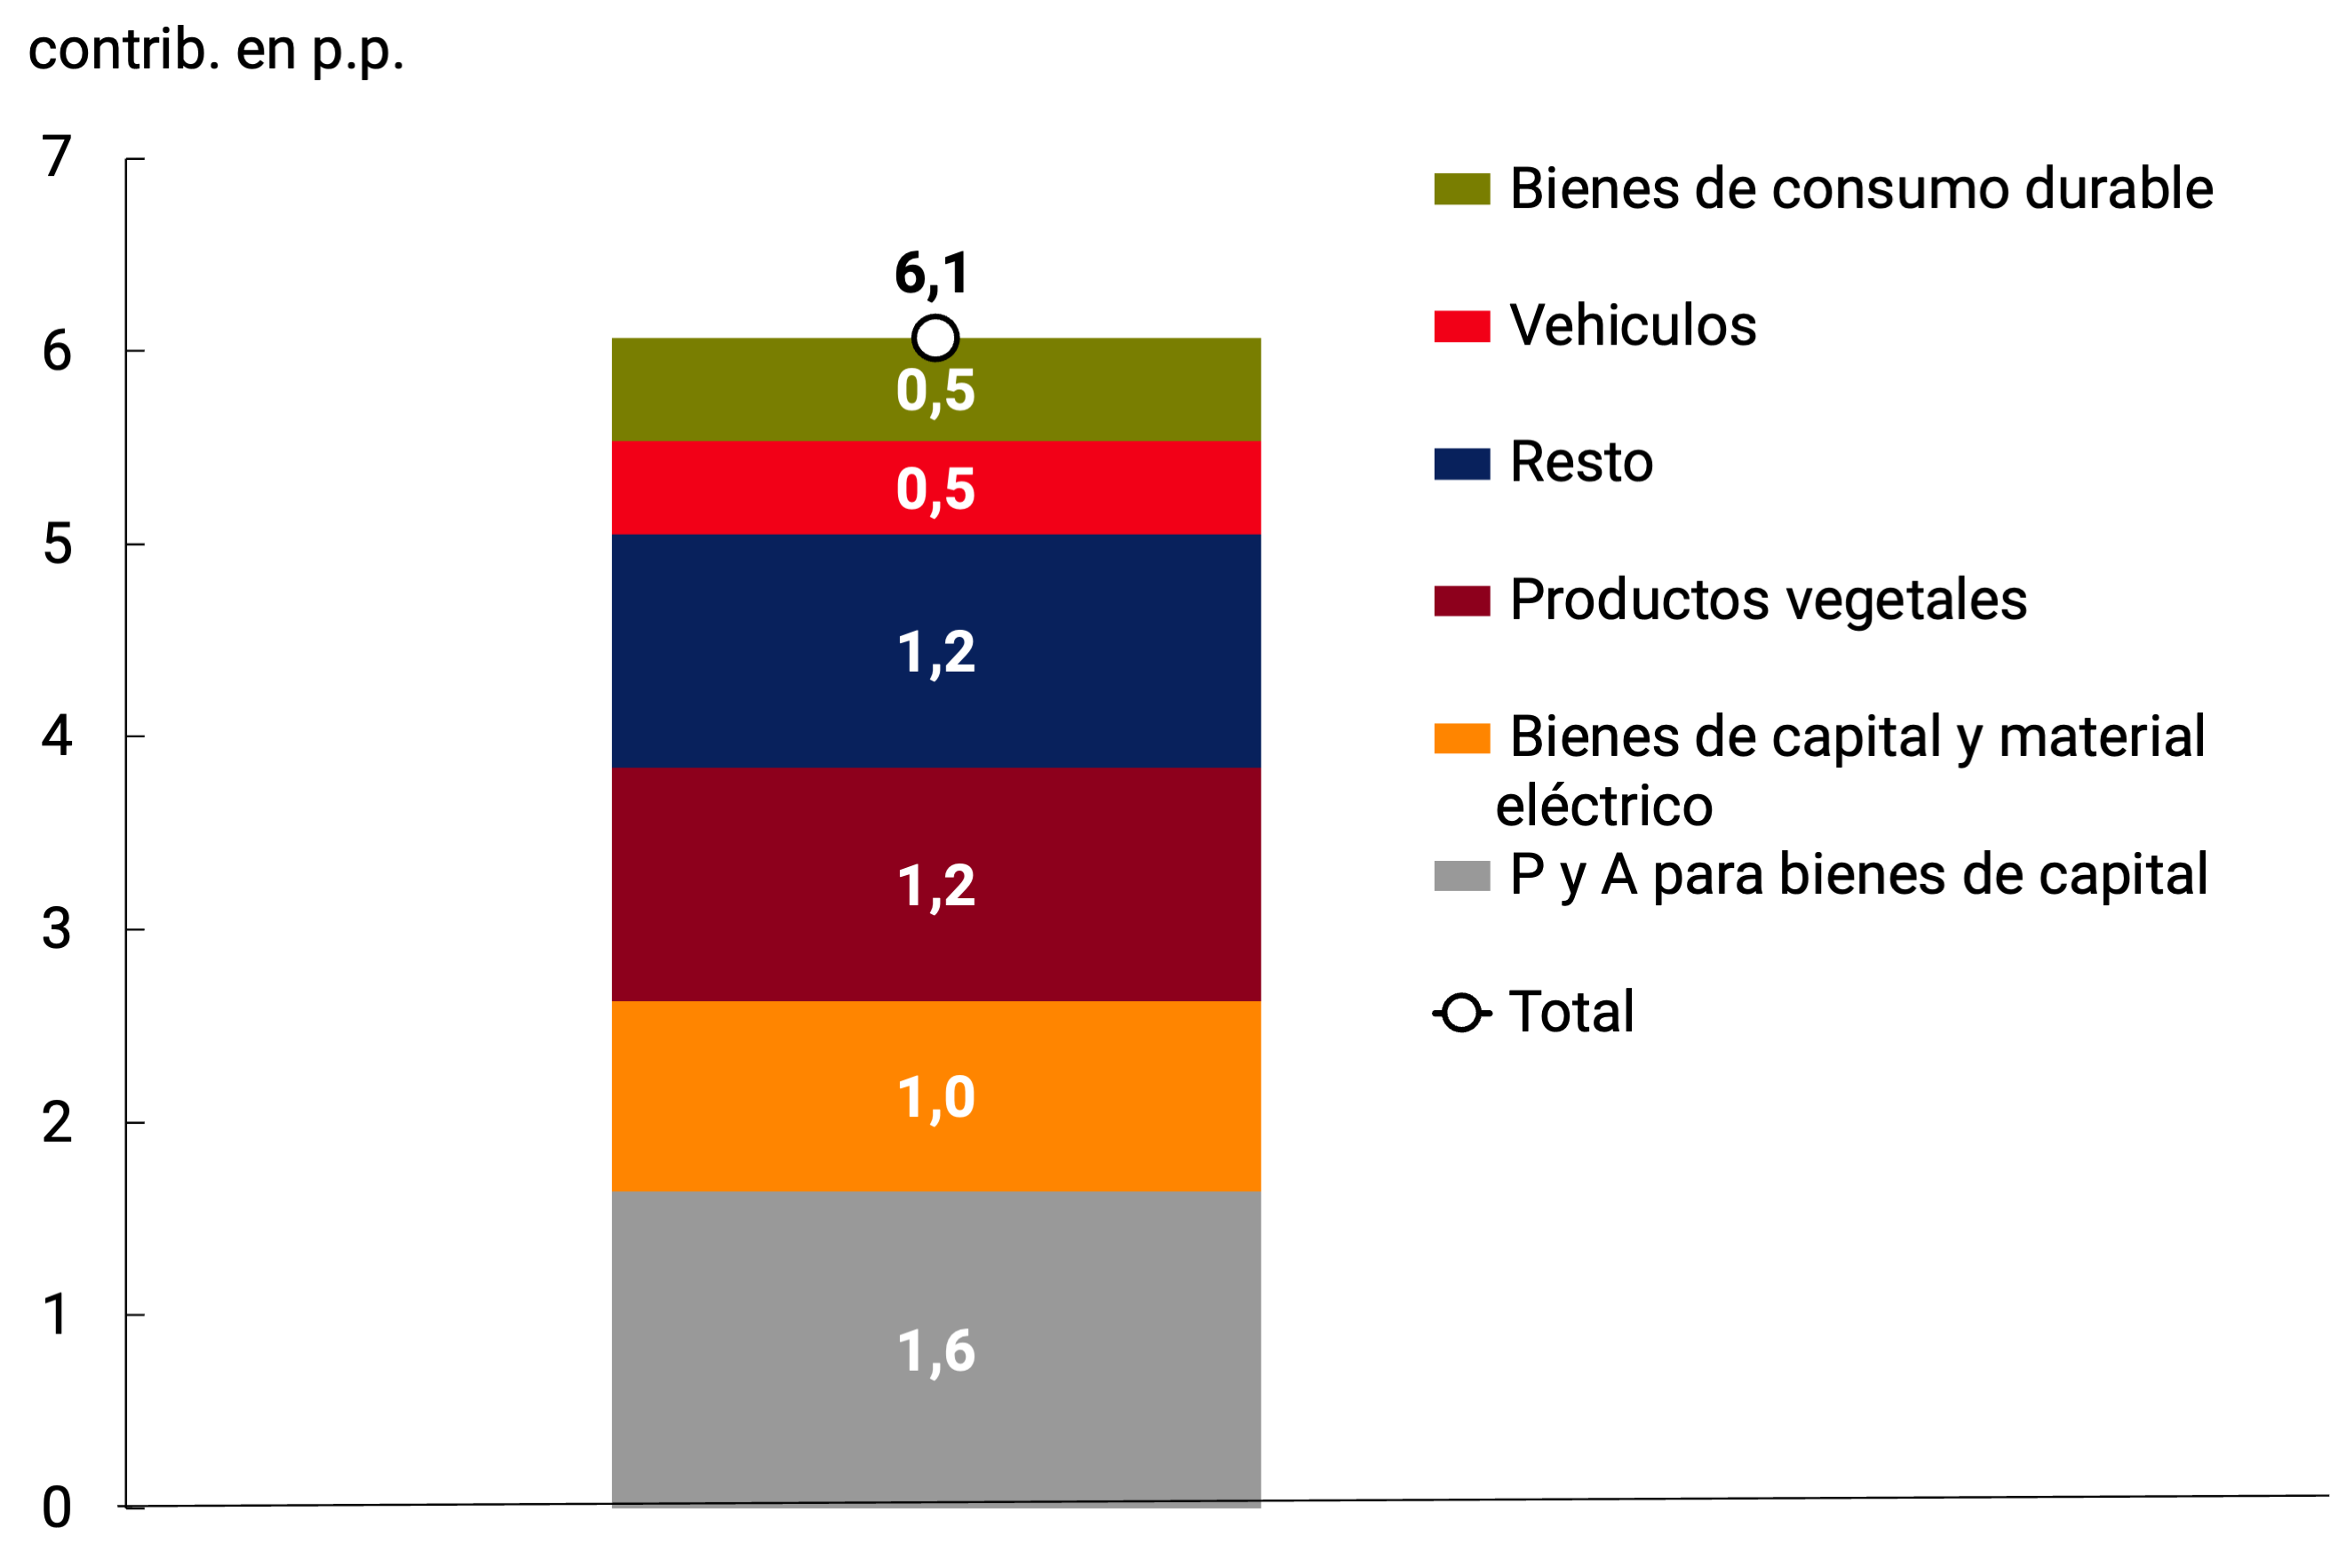
As for imports of goods, in the second quarter of 2023 the growth in quantities was concentrated in a few product categories: vegetable inputs (in the context of low availability of soybeans due to drought), capital goods and their parts, durable consumer goods, and vehicles (see Figure 4.4).
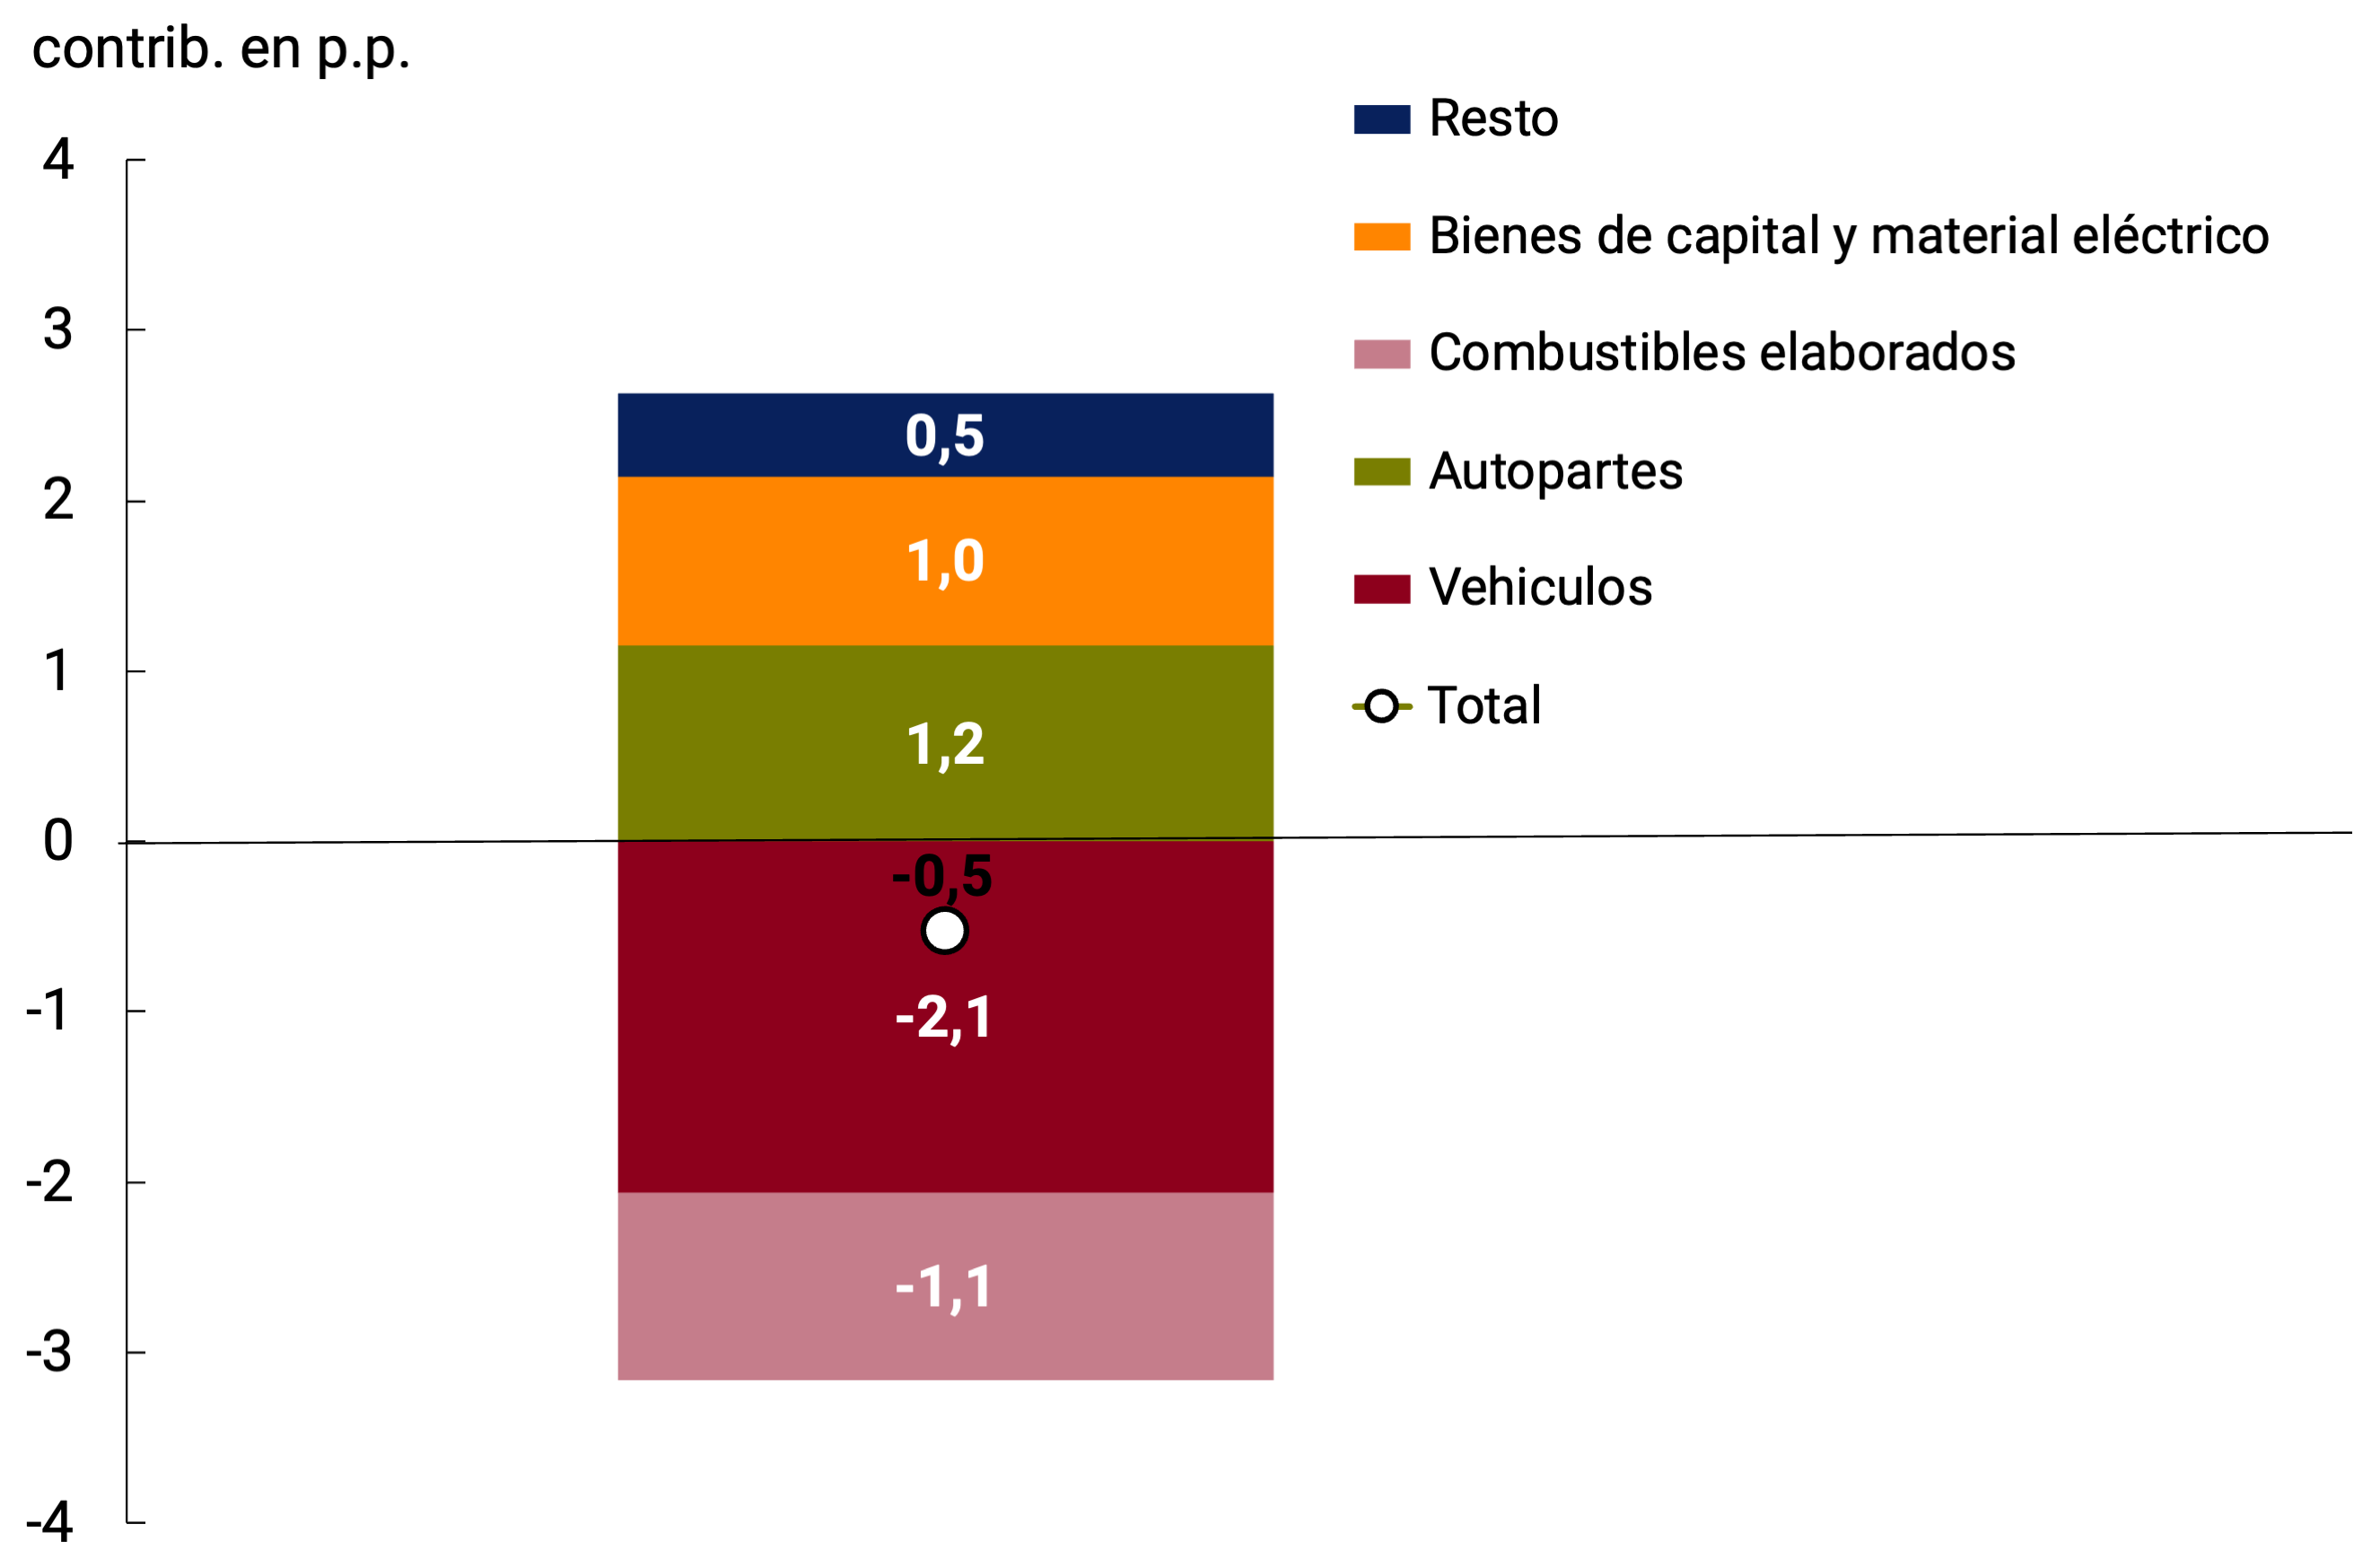
In the July-August two-month period, the quantities of goods imported showed a slight drop (0.5% s.e. compared to the previous quarter), with heterogeneous behaviors between product groups. The fall in purchases of vehicles and processed fuels stood out for its impact, which coincides with the commissioning of the Néstor Kirchner Gas Pipeline, partially offset by the increase in foreign purchases of capital goods and auto parts, accompanying the growth of gross investment (see Chapter 3. Economic Activity).
Figure 4.4 | Imported quantities by category. Seasonally adjusted series (var. % acum. s.e.)
II-23 vs I-23
III-23* vs II-23
* Data up to Aug-23.
The cumulative change in imports may differ from that obtained in Figure 4.2 because an indirect seasonally adjusted method was used on this occasion.
Source: BCRA based on INDEC data.
Box. Energy Trade Balance 2023
In the first eight months of 2022, a significant deterioration in the energy balance had been observed. This deterioration was mainly explained by the increase in imported energy values. The downspout of the rivers resulted in a lower contribution from hydroelectric sources that was replaced by imports of fuel oil and diesel for the thermal generation of electricity. In addition, Bolivia – our main supplier of natural gas – whose gas fields are in the declining phase, reduced the available supply, forcing Argentina to replace that energy source with greater imports of liquefied natural gas (LNG) and liquid fuels such as fuel oil and diesel. In the context of the war between Russia and Ukraine, the largest quantities imported were made at extraordinarily high international energy prices.
This situation was reversed this year. In the first eight months of 2023, the energy balance improved its result by US$4,016 million compared to the same period in 2022 (see Figure 4.5). Lower import prices meant savings of US$1,602 million, while lower imported quantities of energy accounted for savings of US$2,645 million. In addition, and despite the fact that lower energy export prices meant a deterioration of the energy balance by US$1,561 million, the higher quantities of energy exported added US$1,330 million to the improvement in the balance. In this way, the deficit was reduced from US$5,127 million to US$1,111 million.
Figure 4.5 |Factors of variation in the energy balance
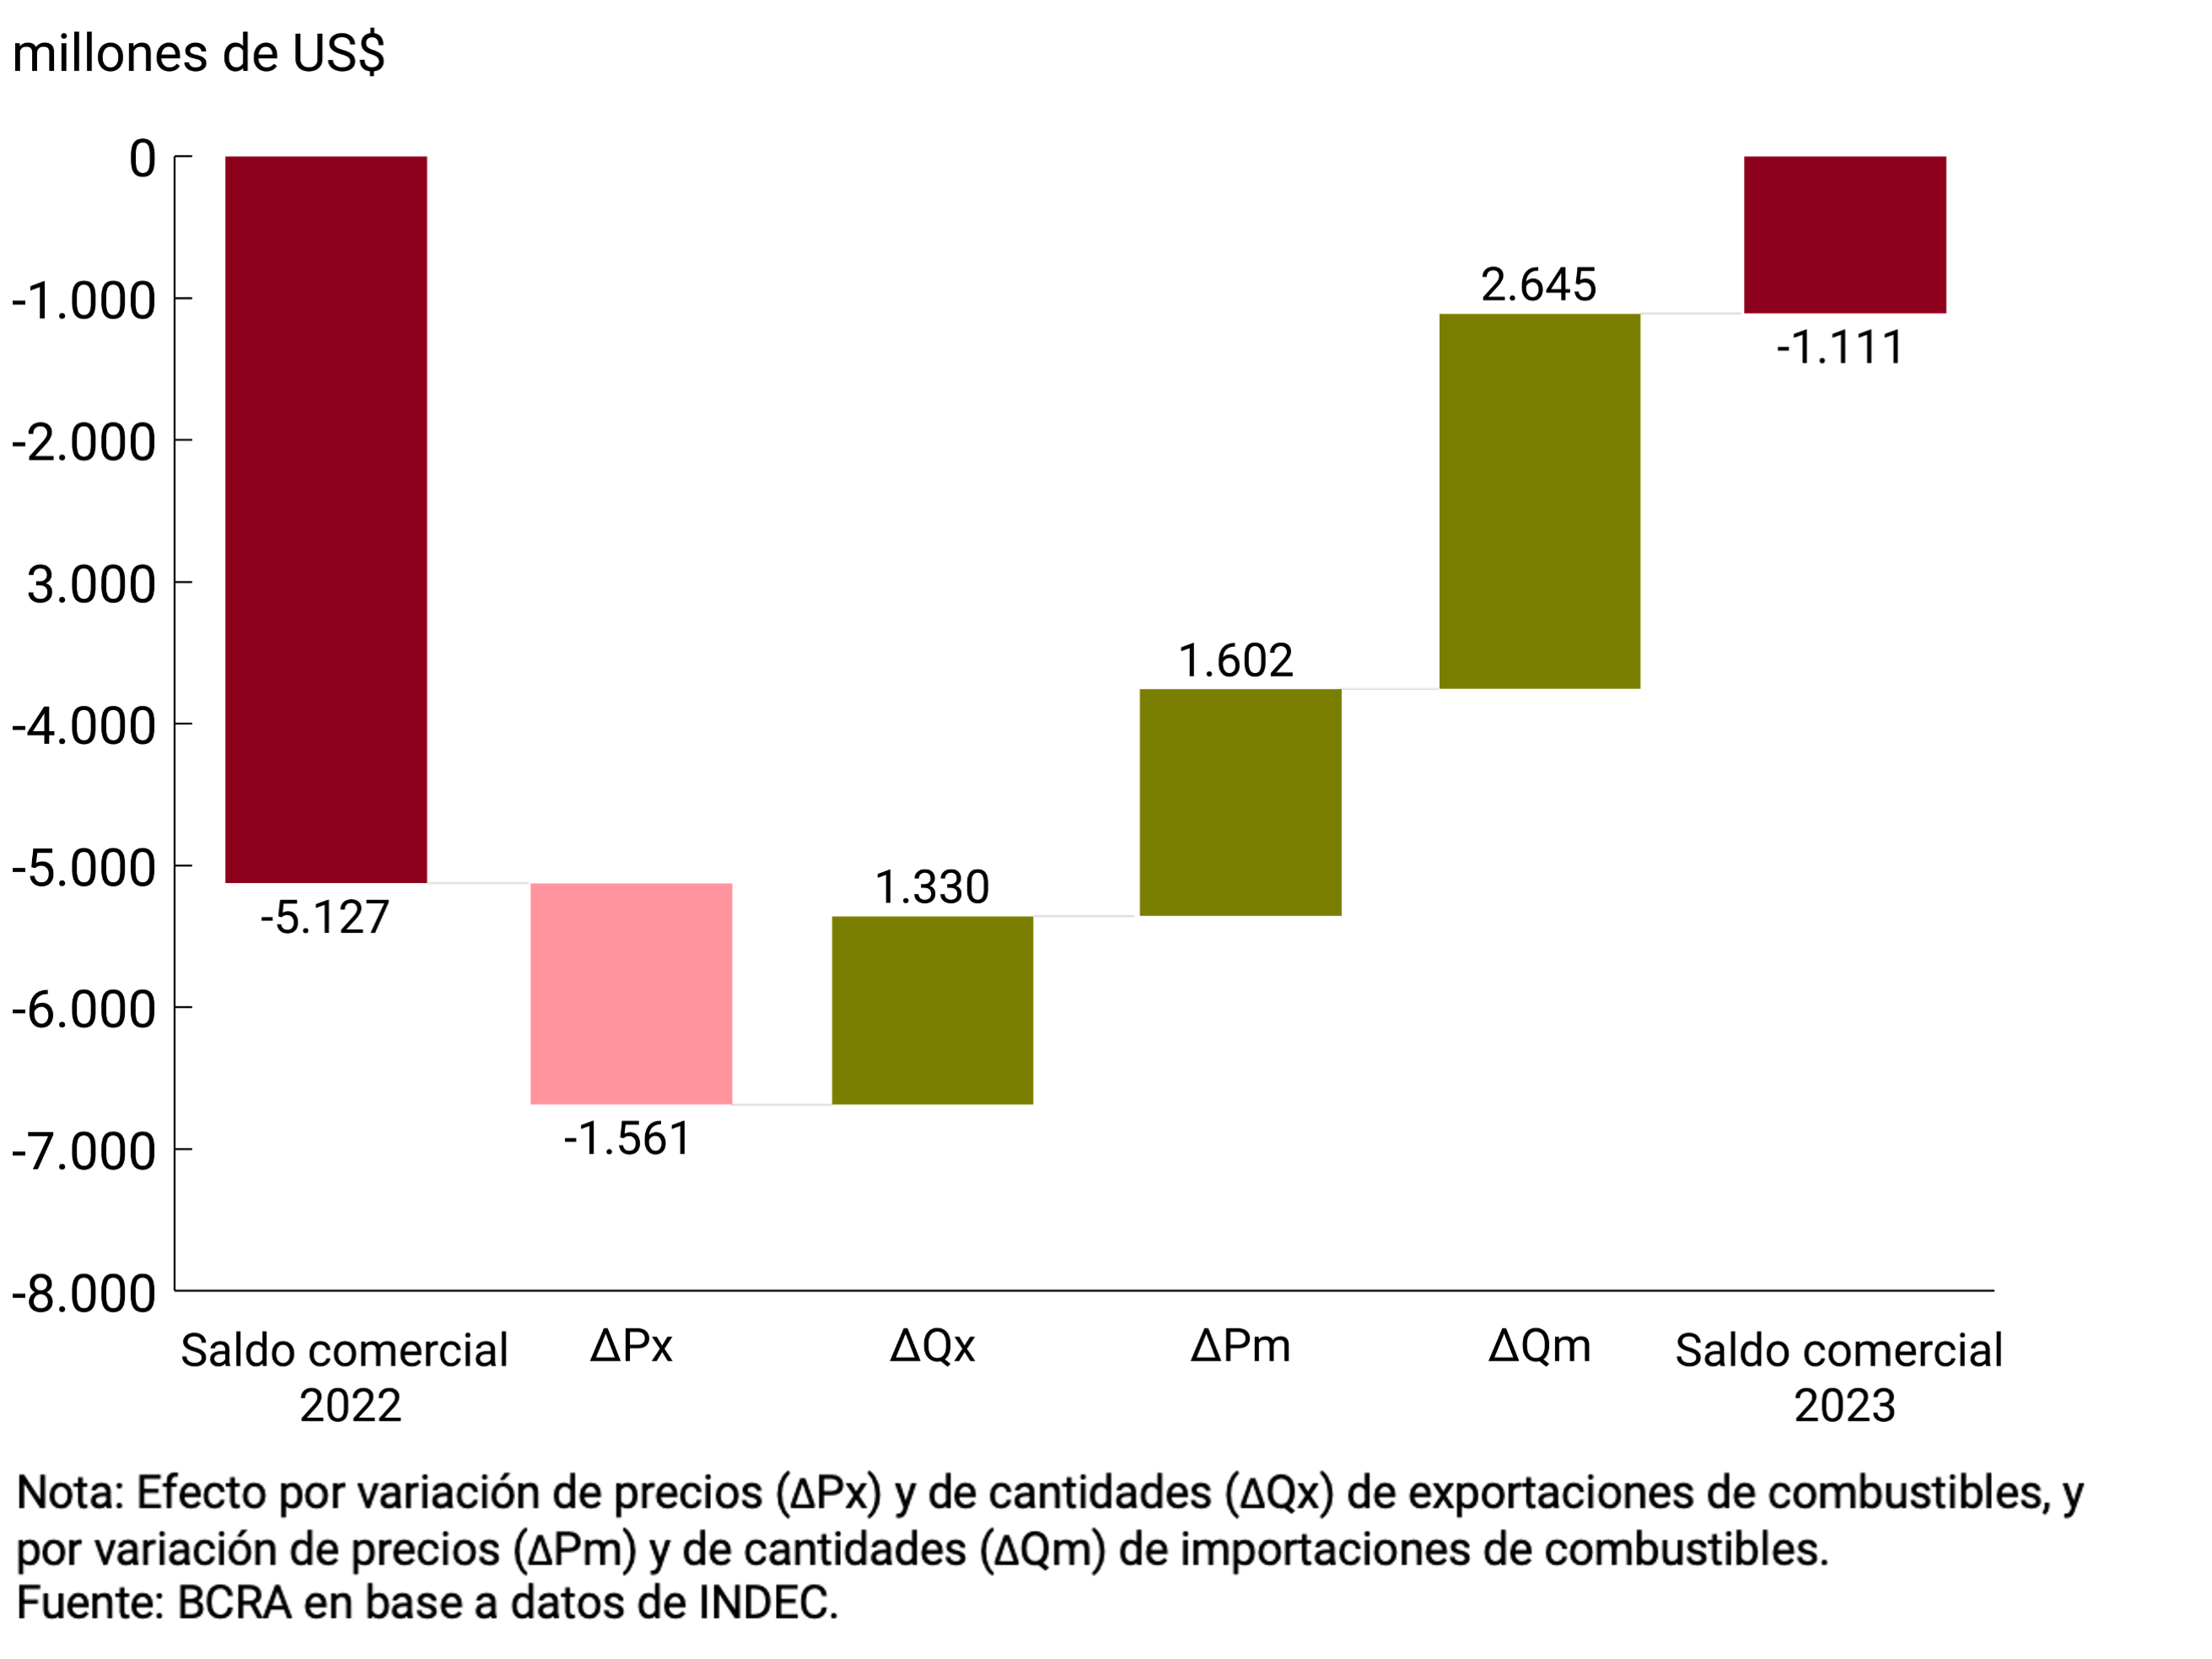
Note: Price change effect (? Px) and quantities (? Qx) of fuel exports, and by price variation (? Pm) and quantities (? Qm) of fuel imports.
Source: BCRA based on INDEC data.
The fall in fuel imports was influenced by a number of factors. The increase in electricity generation by hydroelectric means -due to the increase observed in the flow of water in the main rivers-, renewable and nuclear allowed a reduction in the share of thermal generation. Due to this and other factors, such as lower fuel consumption by the agricultural sector in a context of drought and the increase in local fuel refining, lower quantities of diesel oil (-47.8% YoY) and fuel oil (-51.3% YoY) were observed. Given the fall in prices, the savings in imports of diesel (-57.7% YoY) and fuel oil (-59.9% YoY) was US$2,631 million in the period. Second, the fall in imported quantities of natural gas (-41.1% YoY) and lower unit prices of imports meant lower imported gas values of US$545 million. On the other hand, the higher imported quantities of LNG were more than offset by lower import prices (-27.2% YoY), implying an additional saving of US$794 million.
Accumulated exports in the first 8 months of 2023 also contributed to the improvement of the energy trade balance. The exported volumes of fuels and energy have been on a growth trend of almost 7 years, supported by the exploitation of the unconventional resources of Vaca Muerta. This export take-off in quantities meant that there was no further fall in the values exported as a result of the fall in international prices.
As a result, in the first 8 months of 2023, there was a notable improvement in the cumulative trade balance of the energy balance (see Figure 4.6). Prospectively, the improvement in the energy trade balance is expected to be significantly more noticeable in the second half of 2023. In this sense, the completion of the construction and recent commissioning of the Néstor Kirchner Gas Pipeline as of June will increase the exploitation of the Vaca Muerta gas resource, compensating for the expected lower imports of gas from Bolivia and eventually LNG ships.
Figure 4.6 | Cumulative result of the energy
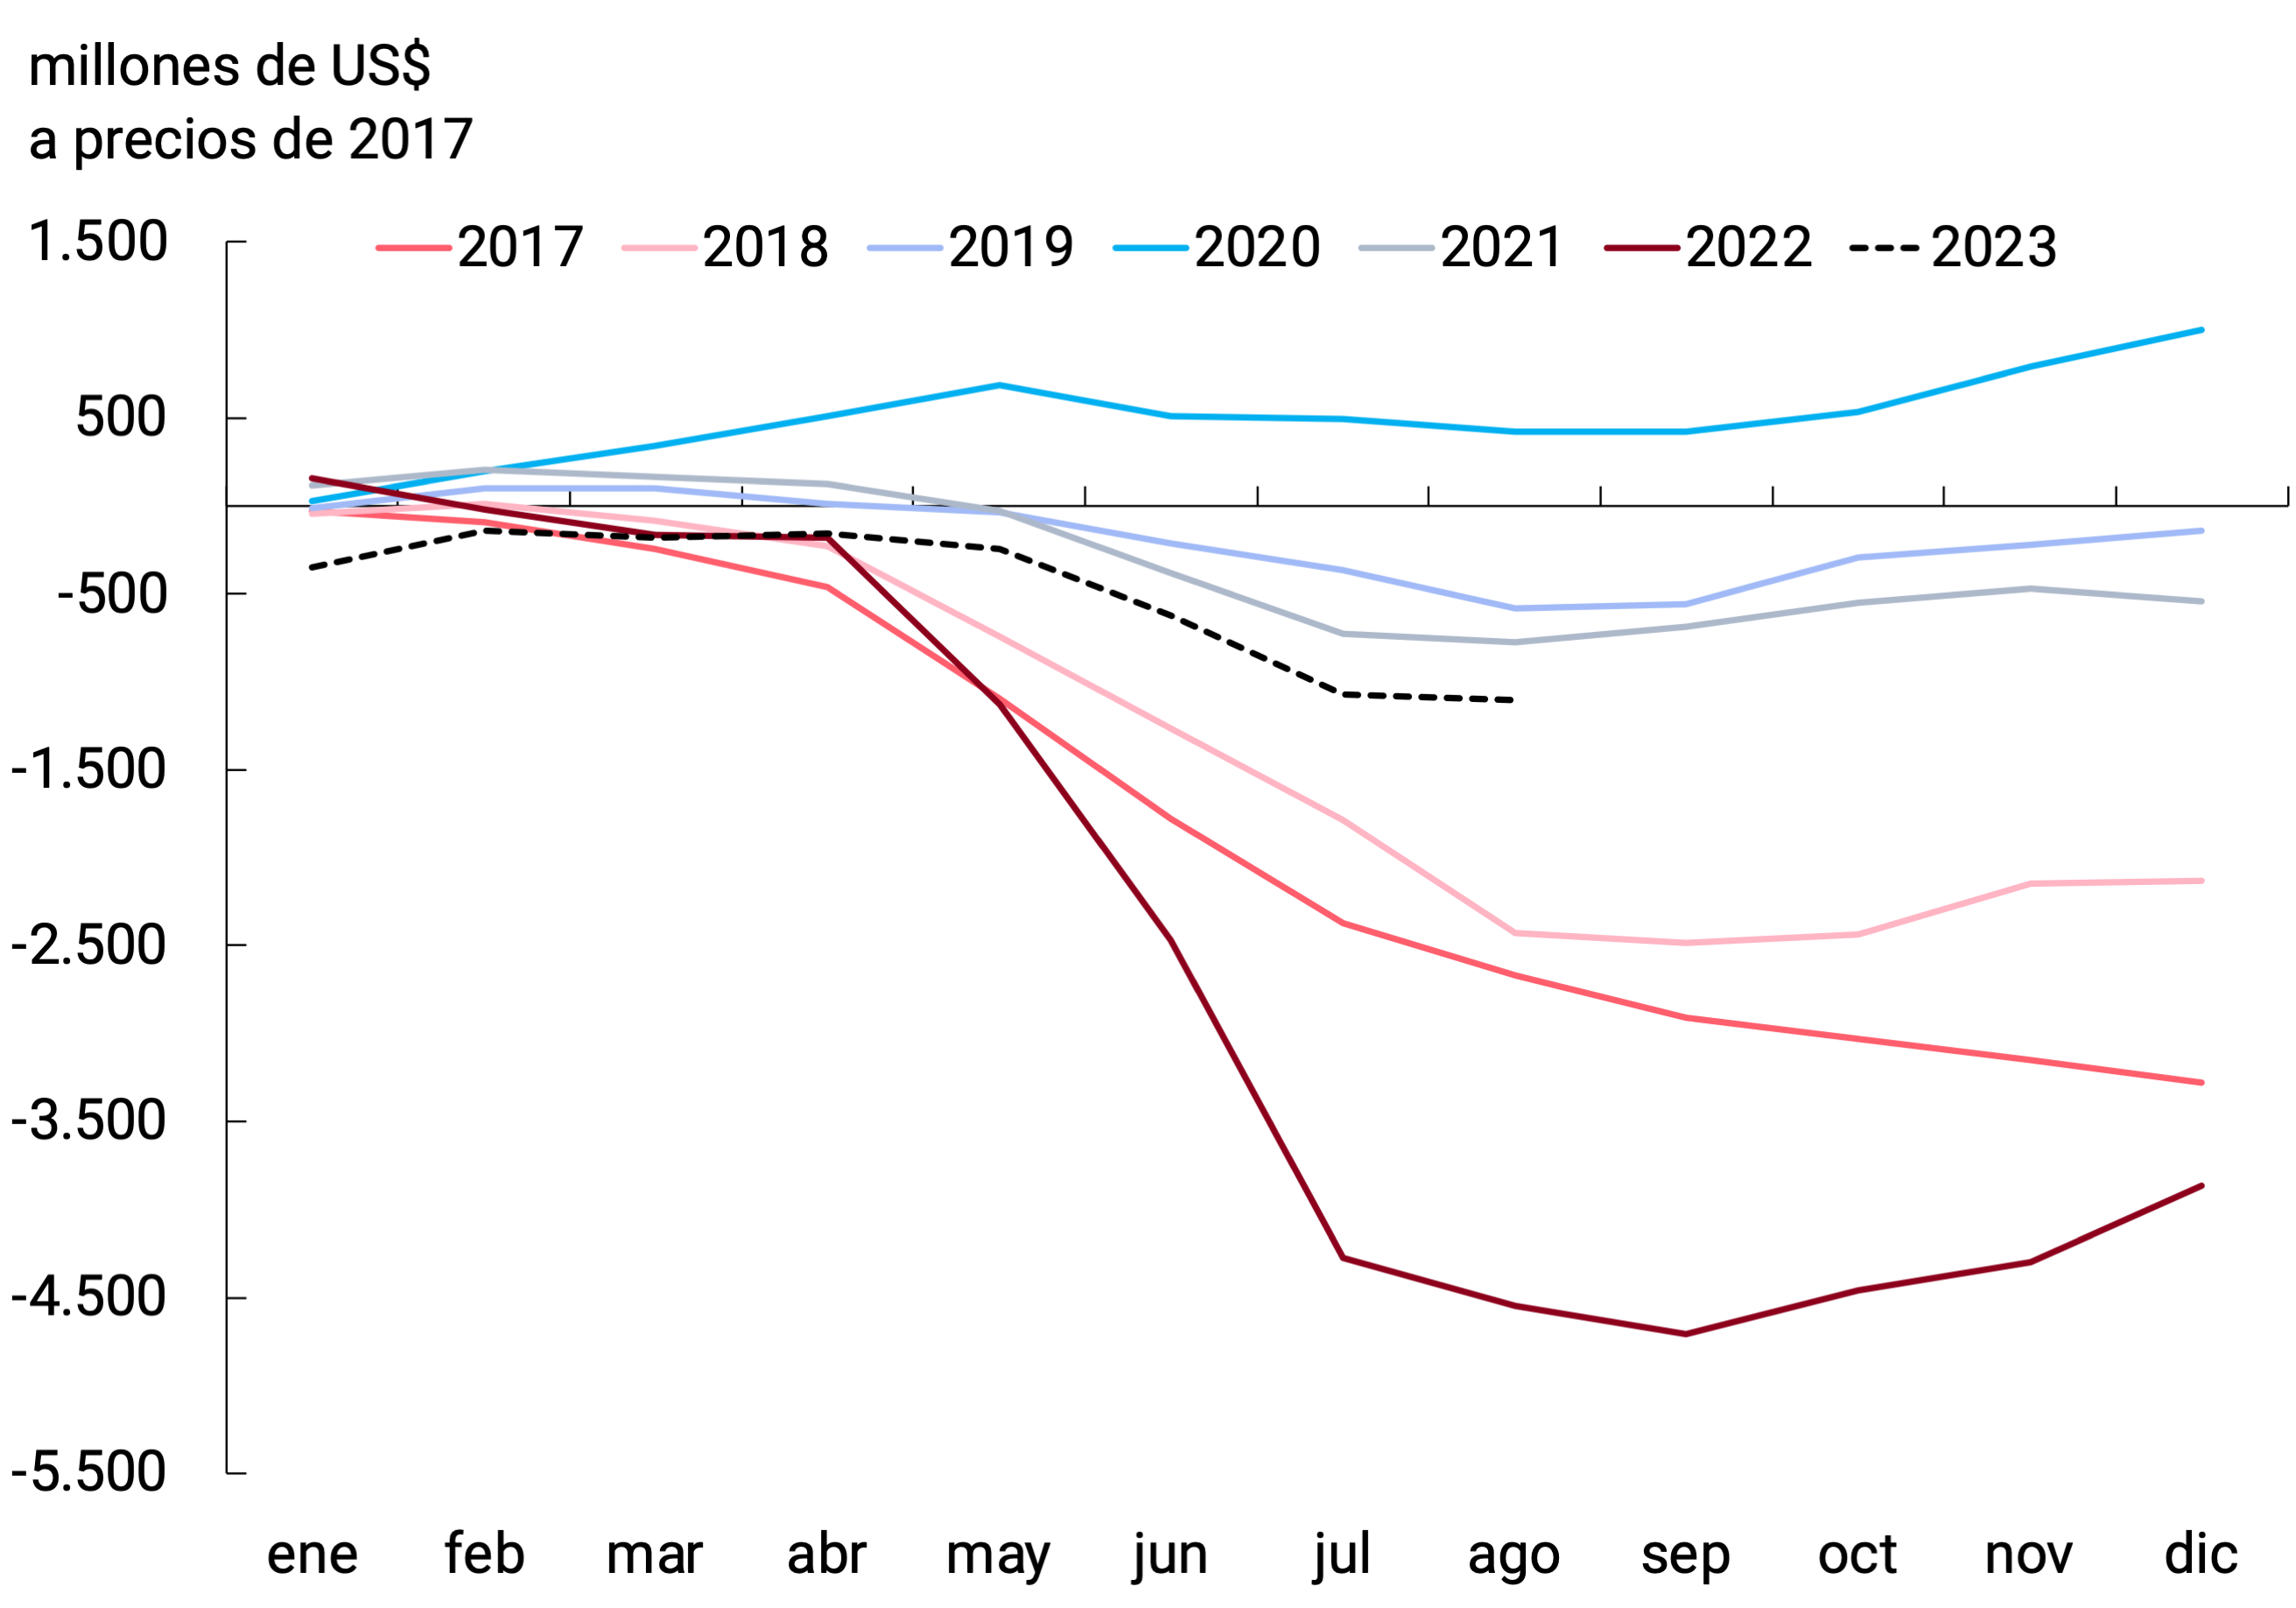
trade balance
Source: BCRA based on INDEC data.
Finally, the deterioration in the trade balance of goods so far in 2023 is not exclusively explained by the sharp drop in exported volumes and/or the recovery in imported quantities. The terms of trade also contributed negatively, although this effect was partially diluted in the margin as a result of lower import prices. This situation is different from what happened in other episodes of drought, such as 2009 or 2018, in which the improvement in the relationship of external prices was a buffer for the economy with respect to the harmful effects of losses in the agricultural harvest.
4.2. In the first nine months of 2023, the BCRA’s net sales in the foreign exchange market accumulated US$1,990 million
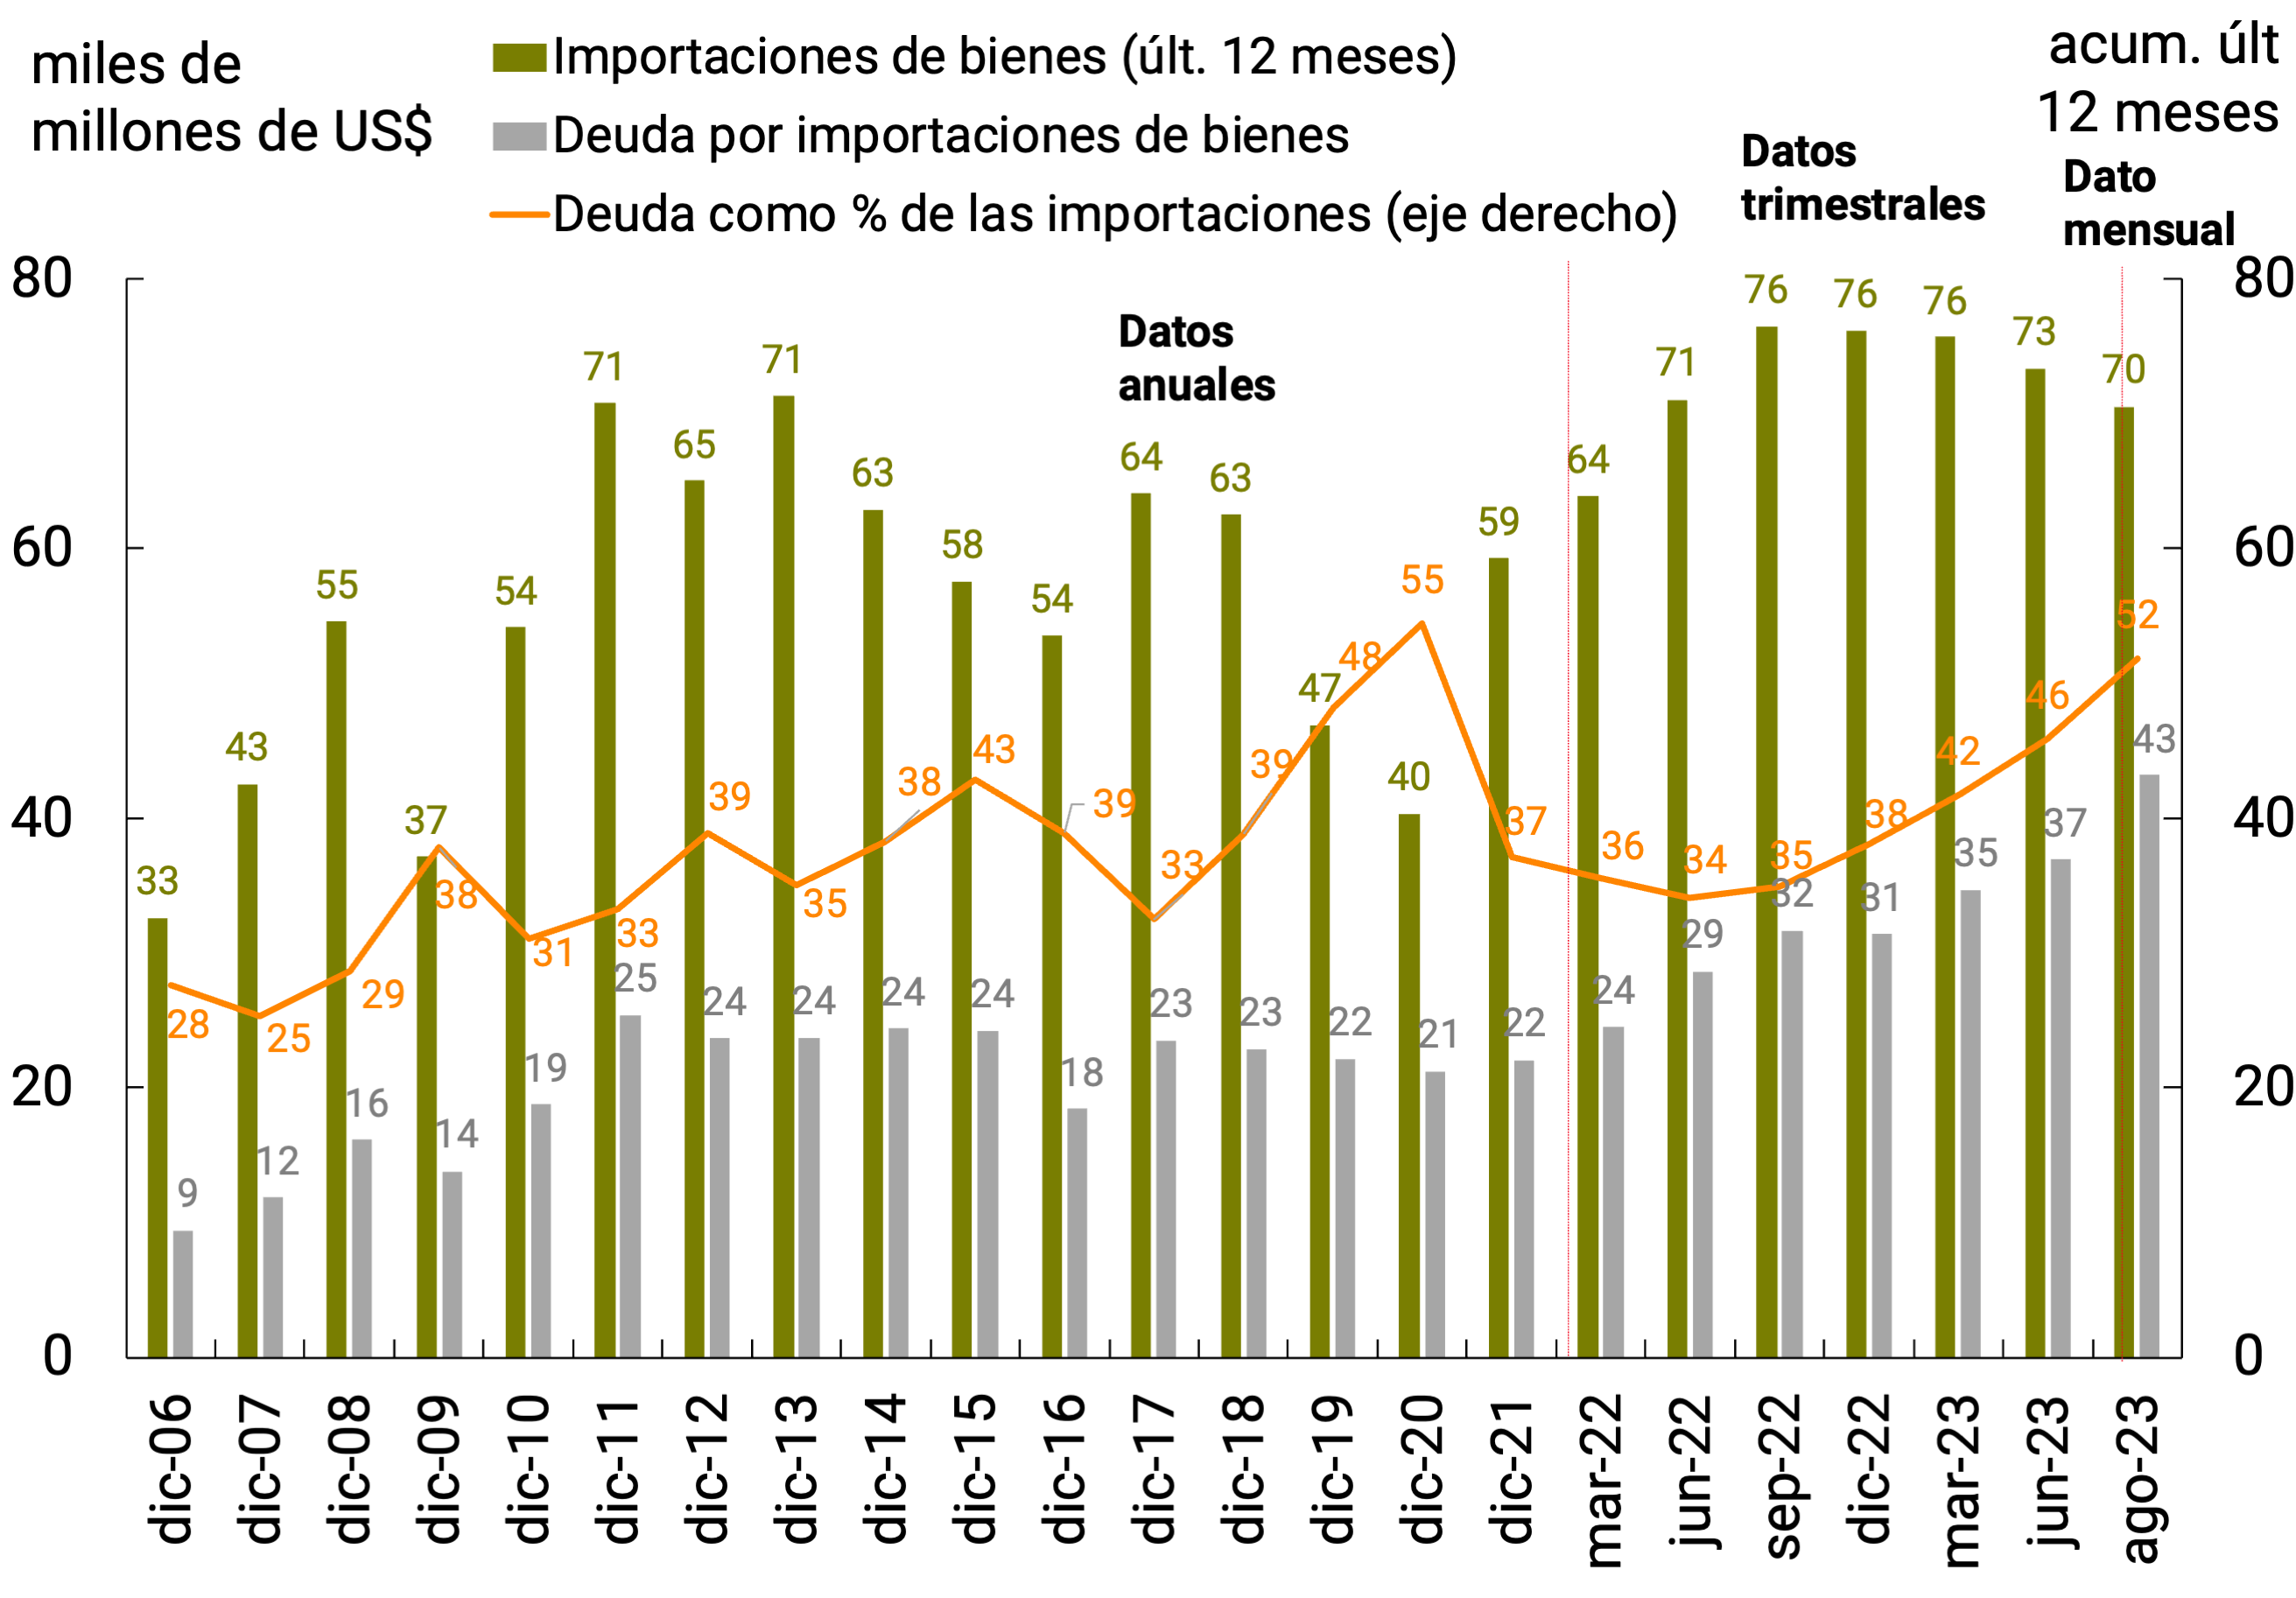
During the first nine months of 2023, exporters recorded revenues from collections of exports of goods of about US$50,400 million. For its part, exports of goods totaled about US$51,000 million, which would imply a reduction in external debt through advances and pre-financing of around US$600 million. Thus, the ratio of this type of indebtedness to exported securities was around 9%, with an increase of 0.7 p.p. compared to December 2022 (see Figure 4.7)26.
Figure 4.7 | Assets. Exports and external debt for exports
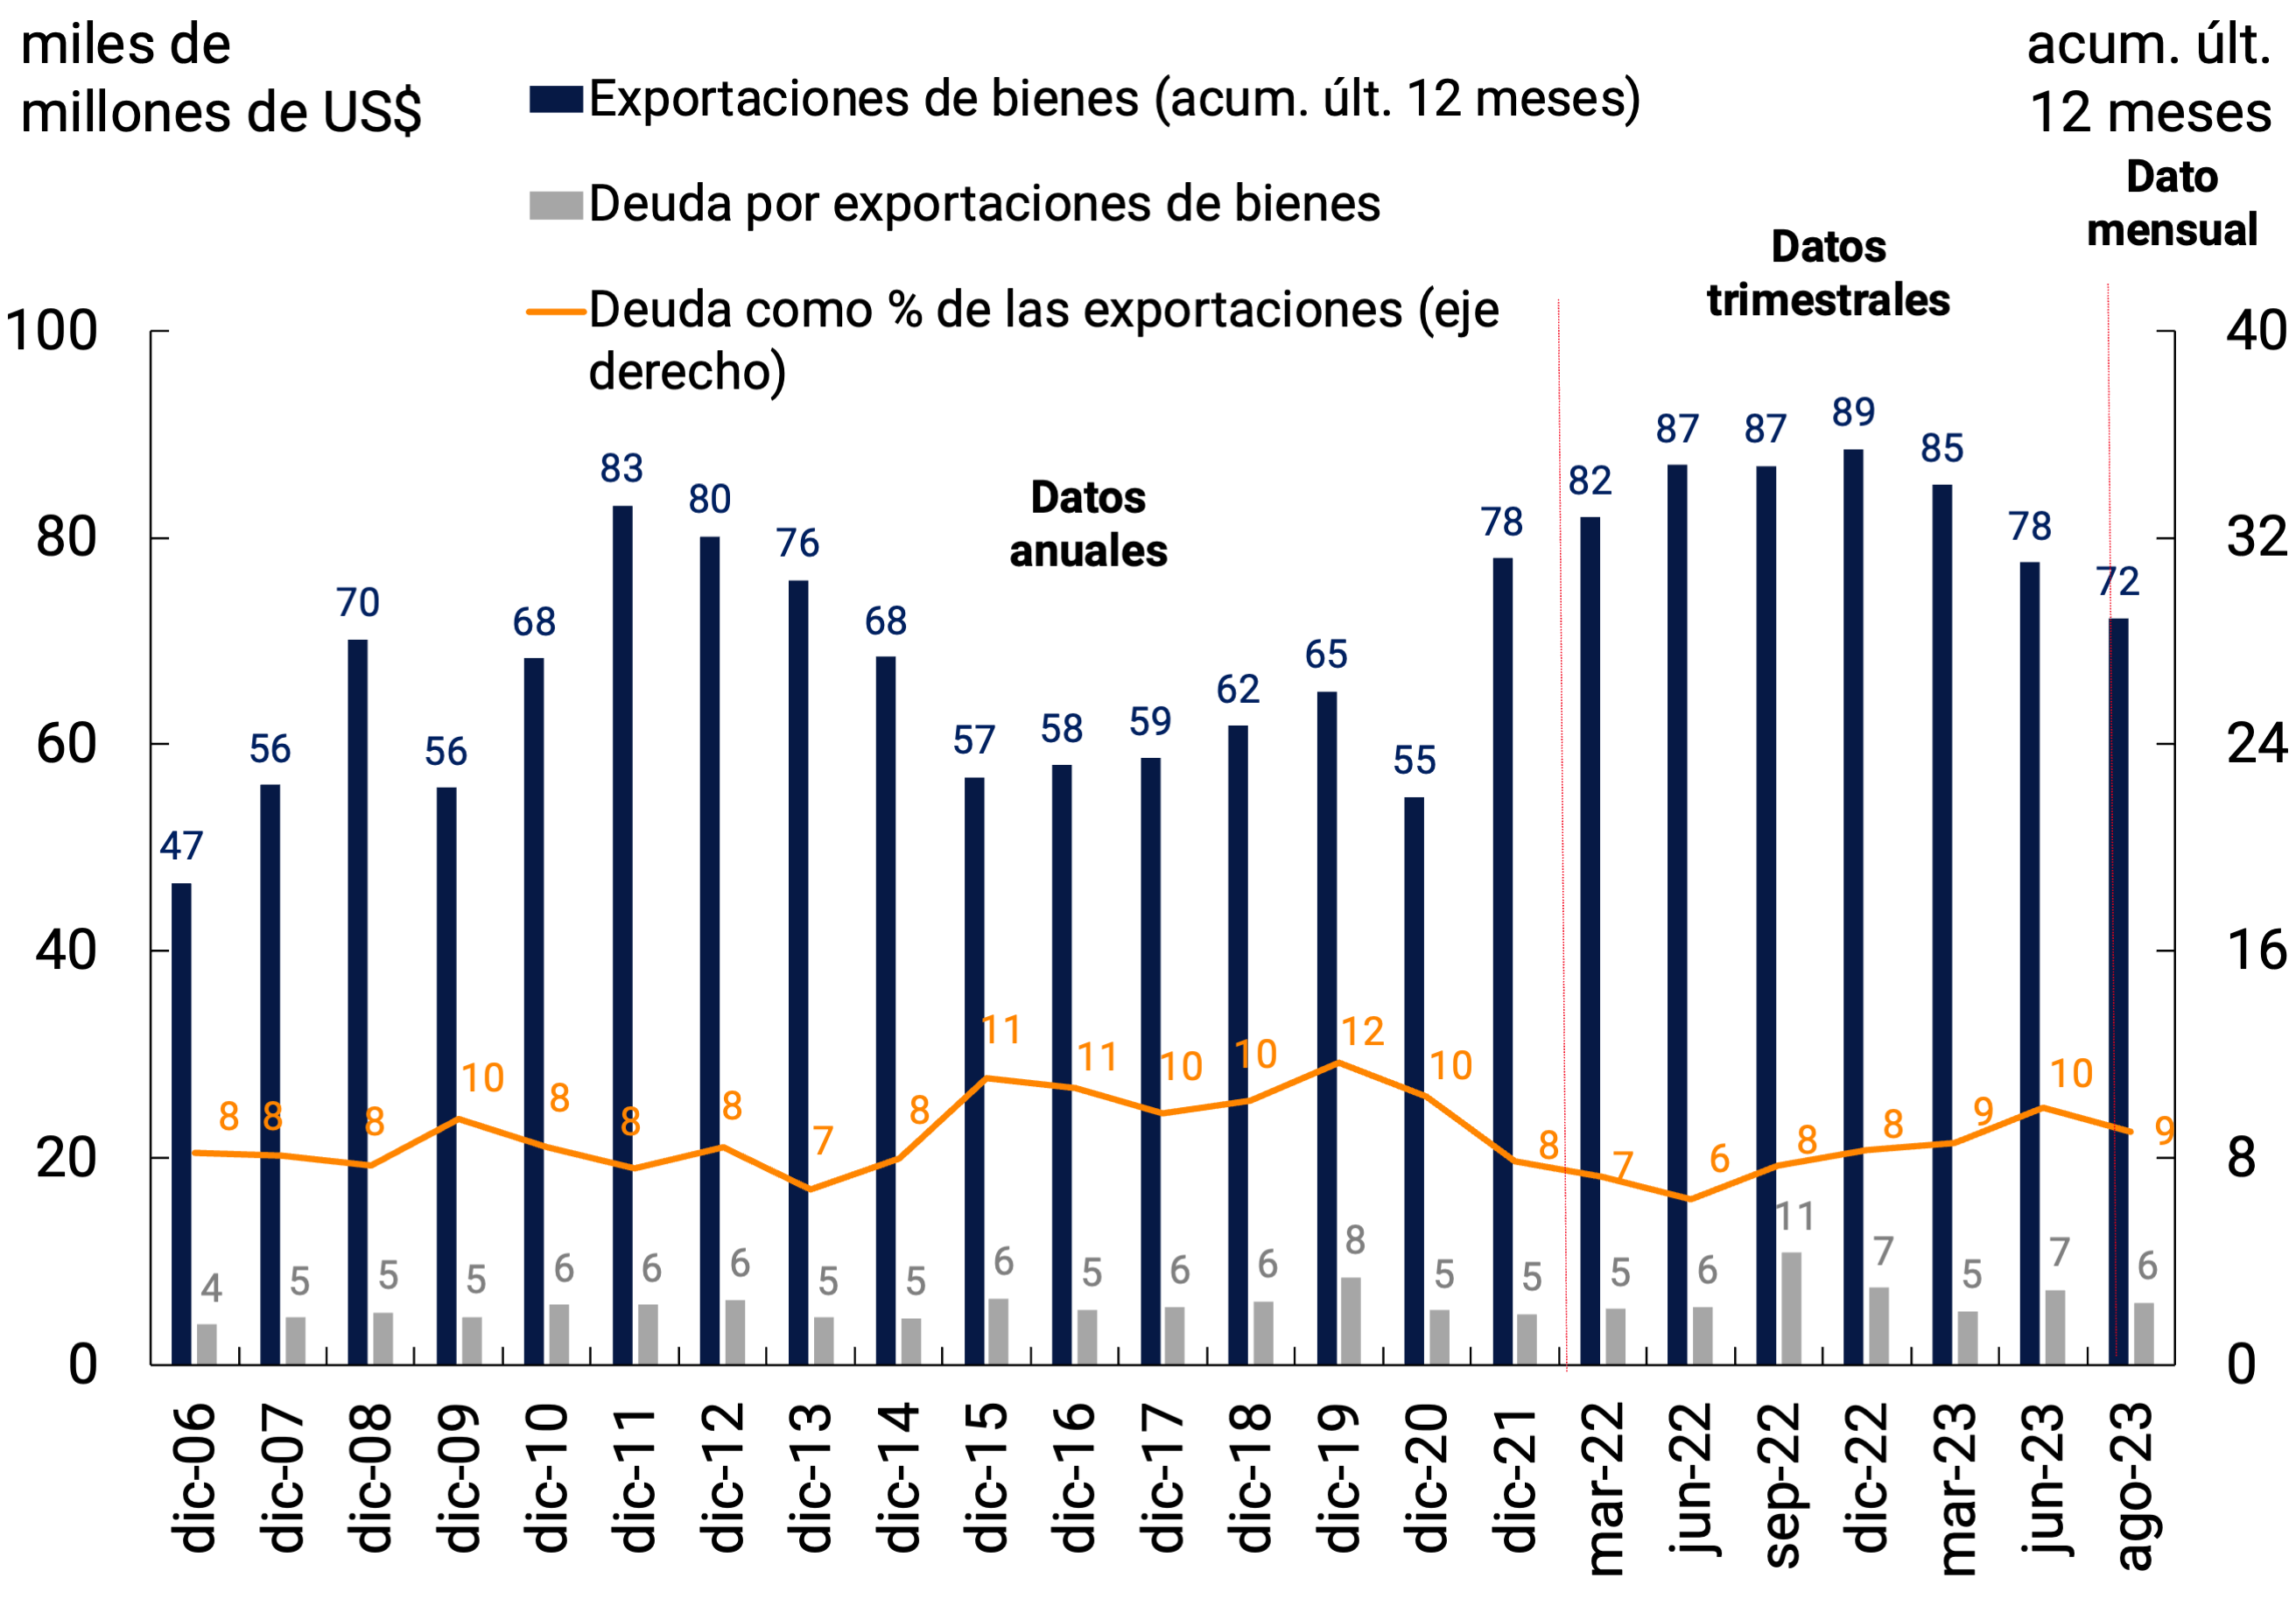
Note: II-23 debt subject to revision and debt of Jul-23, Aug-23 and Sep-23 estimated based on accrual data and cash.
Source: BCRA based on INDEC and own data.
For its part, it is estimated that the debt for imports of goods would have registered an increase of about US$11,800 million27 in the first 9 months of the year. Thus, the ratio of external debt to the level of imports rose by 13.7 p.p., to 51.8% (see Figure 4.8).
This evolution of exports and imports of goods, added to the dynamics of commercial debt for these concepts, resulted in a positive net result for goods in the foreign exchange market of US$6,267 million in the first nine months of 2023.
Figure 4.8 | Assets. Imports and external debt for imports
Note: II-23 debt subject to revision and debt of Jul-23, Aug-23 and Sep-23 estimated based on accrual data and cash.
Source: BCRA based on INDEC and own data.
With regard to financial debt, and as part of the current regulatory framework mentioned above, in September 2020, Communication “A” 7106 established the guidelines under which private sector companies could initiate a process of refinancing their respective external liabilities, which would allow their maturity profile to be adapted to the guidelines required for the normal functioning of the foreign exchange market. This communication, which reached certain capital maturities between 15-Jan-20 and 31-Mar-21, was extended by Communication “A” 7230, covering maturities from then until the end of 2021. Likewise, Communication “A” 7422 extended the term of the maturities until 30-Jun-22 and Communication “A” 7466 did so until 31-Dec-22. In October of last year, Communication “A” 7621 extended the capital maturities until Dec 31, 23.
In this context, from the renegotiations registered from the beginning of the regulation until September 2023, net payments made through the foreign exchange market represented 40% of the original maturities, impacting on lower net purchases of about US$5,350 million.
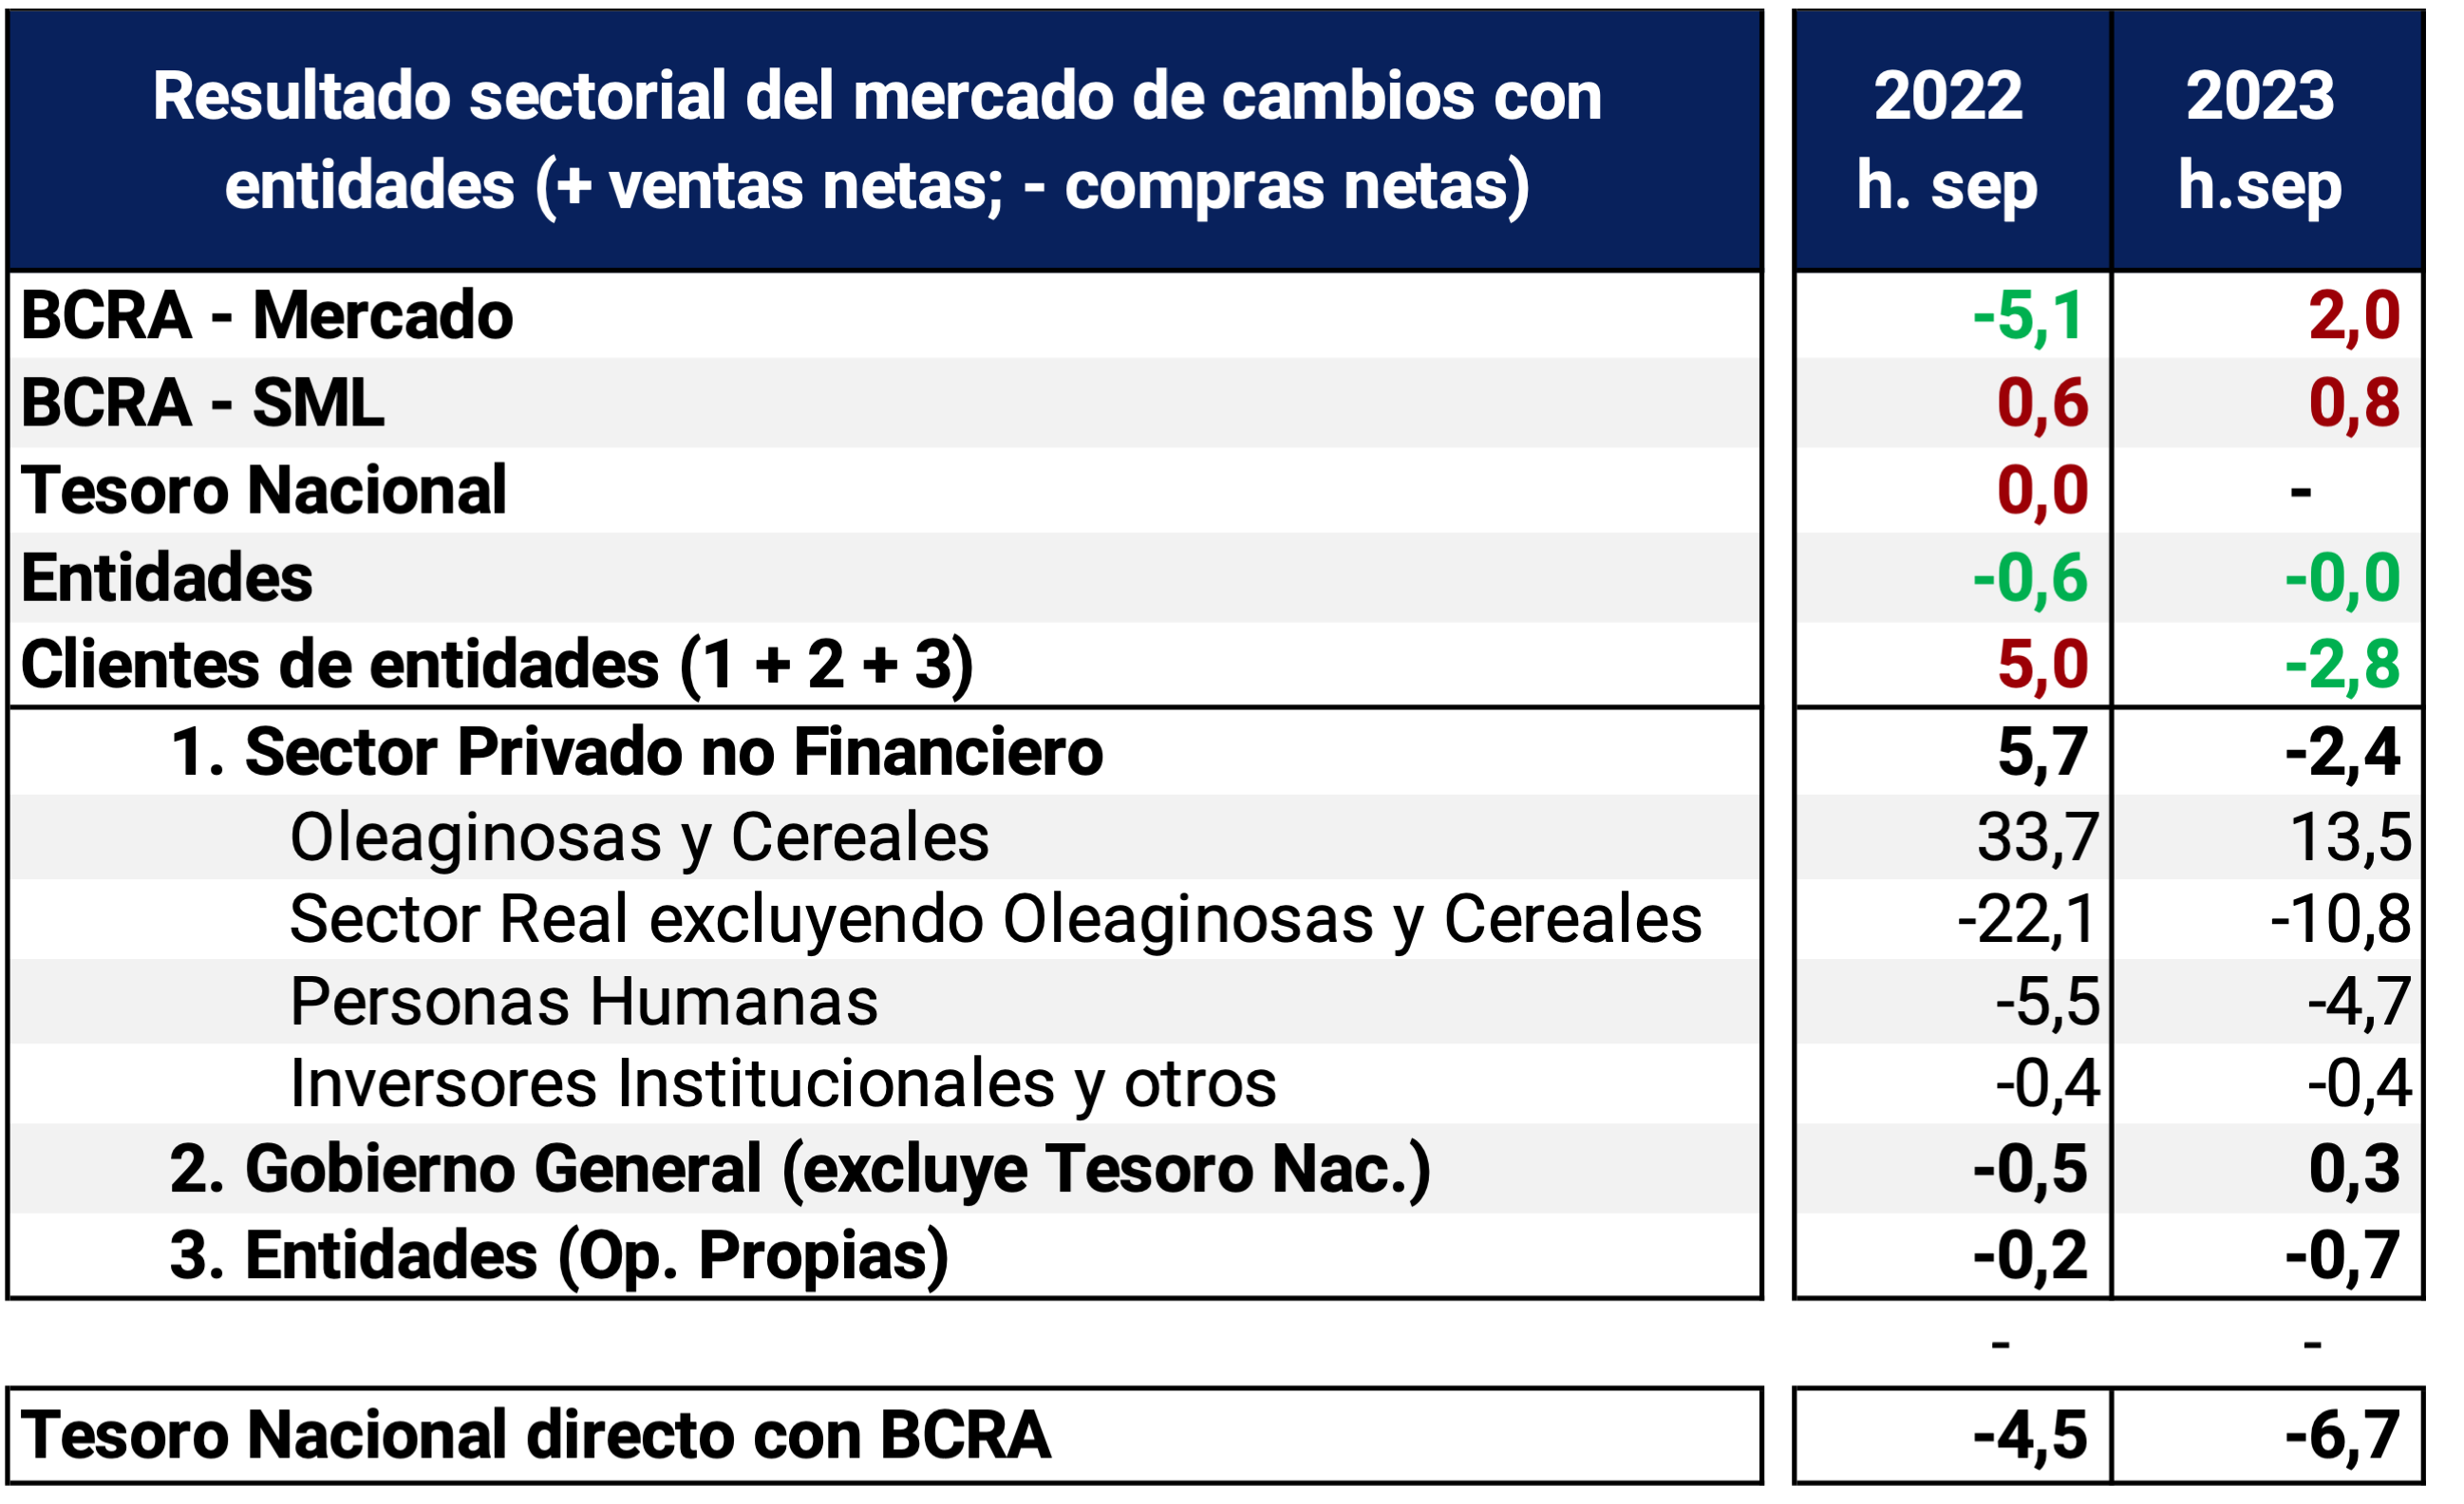
As for the BCRA’s result in the foreign exchange market, in the first nine months of the year it agreed on net sales of US$1,990 million and transfers through the SML for US$771 million. These sales were explained by purchases by customers and entities for US$2,758 and US$3 million, respectively. The result of customers within this period was explained by the purchases of the sectors “Real excluding Oilseeds and Cereals”, “Individuals”, the own operations of the entities and “Institutional Investors and others”, for US$10,847 million, US$4,660 million, US$431 million and US$699 million, respectively, partially offset by the sales of the “Oilseeds and Cereals” sector and the “General Government” for US$13,548 million and US$330 million. respectively (see Figure 4.9 and Table 4.1).
Figure 4.9 and Table 4.1 | Exchange market. Result

*Data as of 29-Sep-23.
Note: joint cumulative result of the BCRA and the National Treasury in the Foreign Exchange Market.
Source: BCRA.
In particular, the net income of the “Oilseeds and Cereals” sector through the foreign exchange market was impacted both by lower export collections and by higher payments for imports of goods.
Collections for exports of goods from the “Oilseeds and Cereals” sector – the main foreign exchange selling sector in the foreign exchange market – during the first nine months of the year accumulated a total of US$18,490 million, while in the same period of 2022 they had amounted to US$37,512 million, so they received 51% less foreign currency compared to the previous year. This was mainly explained by the severe drought and frost suffered by the crops of the 2022/23 campaign.
Payments for imports of goods were increased by the increase in imports of raw materials by the oil industry, as explained above (see section 4.1). Thus, in the accumulated until September 2023, the sector made import payments for US$4,861 million, while in the same period of 2022 they had been US$3,775 million, showing a year-on-year increase of 29%.
Thus, as a result of lower export charges and higher import payments, net revenues from the “Oilseeds and Cereals” sector fell by approximately 43% compared to the previous year.
In this context, in order to encourage the marketing of soybeans, their derivatives and other exportable products produced by regional economies, the National Government instructed, through Decree 194/202328 of April 10, the reestablishment of the “Export Increase Program” (known as PIE III), where an exchange rate of $300 for every US$1 was provided for income through the foreign exchange market for exports of those products. The validity of the decree was extended until June 2 for soybeans29 and its derivatives and until August 31 for the rest of the products. Subsequently, the program was modified by Decree 378/202330 of July 24, providing an exchange rate of $340 for every US$1 for income through the foreign exchange market for exports of products from regional economies, maintaining the validity until August 31, giving rise to the “PIE IV”. Additionally, through Resolution 216/202331 published on July 24 by the Ministry of Agriculture, Livestock and Fisheries, new eligible products (among which corn stands out) were included within the group of regional economies32. In turn, on Tuesday, September 5, decree 443/202333 was published, starting the new “Export Increase Program”, in force until the end of September, in which exporters were allowed to settle 75% of the foreign currency from exports at the official exchange rate and that the other 25% be freely available. On October 2, through Decree 492/202334, this program was extended, this time with a duration until the 25th of the same month, but making it explicit that 25% of the income that is not settled in the foreign exchange market must be channeled through purchase and sale operations with negotiable securities acquired with settlement in foreign currency and sold with settlement in local currency.
Within the framework of the third edition of this Program, from April 10 to July 24, US$5,630 million were received, of which US$4,520 million corresponded to export receipts from the “Oilseeds and Cereals” sector (mostly linked to exports of products from the soybean complex; see Figure 4.10) and US$1,110 million associated with exports of products from regional economies outside the “Oilseeds and Cereals” sector. Likewise, revenues under the validity of PIE IV were US$2,125 million, linked entirely to products from regional economies (mainly associated with external sales of corn by companies within the “Oilseeds and Cereals” sector). On the other hand, income from export collections through the foreign exchange market under PIE V was US$1,027 million. It should be clarified that, due to the characteristics of the last edition of the program, a considerable part of the sector’s export collections did not enter through the foreign exchange market, but did so through the stock market.
Figure 4.10 | Exchange market. Transfers for goods in the Oilseeds and Cereals

sector
Source: BCRA.
Thus, as of September 30, 2023, the BCRA’s international reserves reached a level of US$26,925 million, showing a fall of US$17,673 million throughout the year. This reduction was mainly explained by the net cancellation of principal and interest with international organizations (excluding the IMF) and other financial debt of the National Treasury for US$5,197, by the net cancellation of principal, interest and charges with the IMF for US$4,020 million, by the fall of the current accounts in foreign currency of the entities in the BCRA by US$2,517 million, by the BCRA’s net sales in the foreign exchange market, by the BCRA’s net payments through the SML and by the fall in the price in US dollars of the assets that make up the reserves for US$723 million.
4.3. Perspectives
Recently, the National Government and the BCRA adopted policy measures that began to contain the growth of imports (in the face of the generalization of the PAIS tax on imports of goods and services and the recalibration of the official exchange rate in mid-August). Leading indicators for September suggest that the third quarter would close with a sharp decline in imported values. In any case, it is expected that the supply of imported products will continue to be prioritized to sustain local production. In this regard, import authorizations were recently approved within the framework of the SIRA (Import System of the Argentine Republic) for more than 7,400 SMEs for an amount of US$700 million for the provision of spare parts, intermediate goods for production and consumption.
In addition, these policies have provided a boost to the export sectors through the new exchange rate values, new lines of credit for pre-financing foreign sales, promotion of agricultural fertilization and the redefinition of the export increase program to include soybeans (during September and October), hydrocarbons and some derivatives (during October). the extension of the program for regional economies (until October) and the announcement of the incorporation of SME exports into this scheme. To boost exports from regional economies with high industrial value, withholdings on certain products (wine, must, rice, tobacco, forestry and citrus peel, among others) were reduced or eliminated. The improvement in the trade balance for the remainder of the year will be supported by the expected evolution of the energy trade balance. Indeed, a significant substitution of fuel imports is expected after the commissioning of the new Néstor Kirchner gas pipeline and a greater boost for oil exports after investments in pipelines.
As a result of the measures recently adopted, a slight contraction in the current account deficit of the international balance of payments is expected from the third quarter onwards. For the last quarter of the year, exports are expected to be boosted by the entry of fine harvest products (mainly wheat), although they will continue to be conditioned by the effects of the drought on the coarse harvest and by the uncertainty associated with the electoral context.
5. Public Finance
National tax revenues were mainly affected by the impact of the drought on agricultural production in the first three quarters of the year. In a context of normal development of the rest of the taxes, there were lower revenues from Export Duties – associated with the worst agricultural harvest in recent history – for an amount equivalent to about 0.6% of GDP. The National Government took a set of measures to strengthen public revenues: after modifying the system of withholdings on imports in the Value Added Tax (VAT) in April, since the end of July it imposed a generalized tax on imports of goods and services (PAIS tax) and in the last days of September the extraordinary payment of an advance of the income tax to banks was arranged. financial companies and insurance companies. Likewise, in mid-August, the direct impact of the higher official exchange rate on taxes associated with international trade was added.
Primary cash expenditure of the National Non-Financial Public Sector (NFPS) continued to decline in real terms, but the fall was less than the decrease in resources in the period and the June targets established in the agreement with the International Monetary Fund (IMF) were not met. In this context, progress was made with the aforementioned reinforcements of tax revenues and new increases were applied in the rates of public services aimed at reducing the amount of economic subsidies.
The primary deficit accumulated a balance equivalent to about 1.3% of annual GDP as of August 2023. Going forward, a fiscal impact is expected from the announcement of income reinforcement policies for the population in a situation of greater vulnerability to the transitory increase in inflation. Among the measures announced is the VAT refund scheme on the basic consumption basket for lower-income families and tax relief for formal salaried people, single-payers, self-employed and MSMEs. For the year 2023, both the 2024 National Budget Bill and the fifth and sixth revisions of the IMF’s Extended Facilities Program maintained the NFPS deficit target on a cash basis of 1.9% of GDP for 2023 and 0.9% of GDP for 2024, although it was recently announced that an addendum with modifications to the bill would be sent.
Finally, the greater needs derived from lower tax revenues were covered with net financing that the National Treasury obtained through auctions of instruments in the domestic market. However, during the months of June, July and August, the need to meet timely payments of services to the IMF in the face of the delay in the fifth review of the program with the IMF required extraordinary temporary financial assistance from the BCRA.
5.1.La total revenue fell year-on-year in real terms in the third quarter at a similar rate to that of the previous two quarters
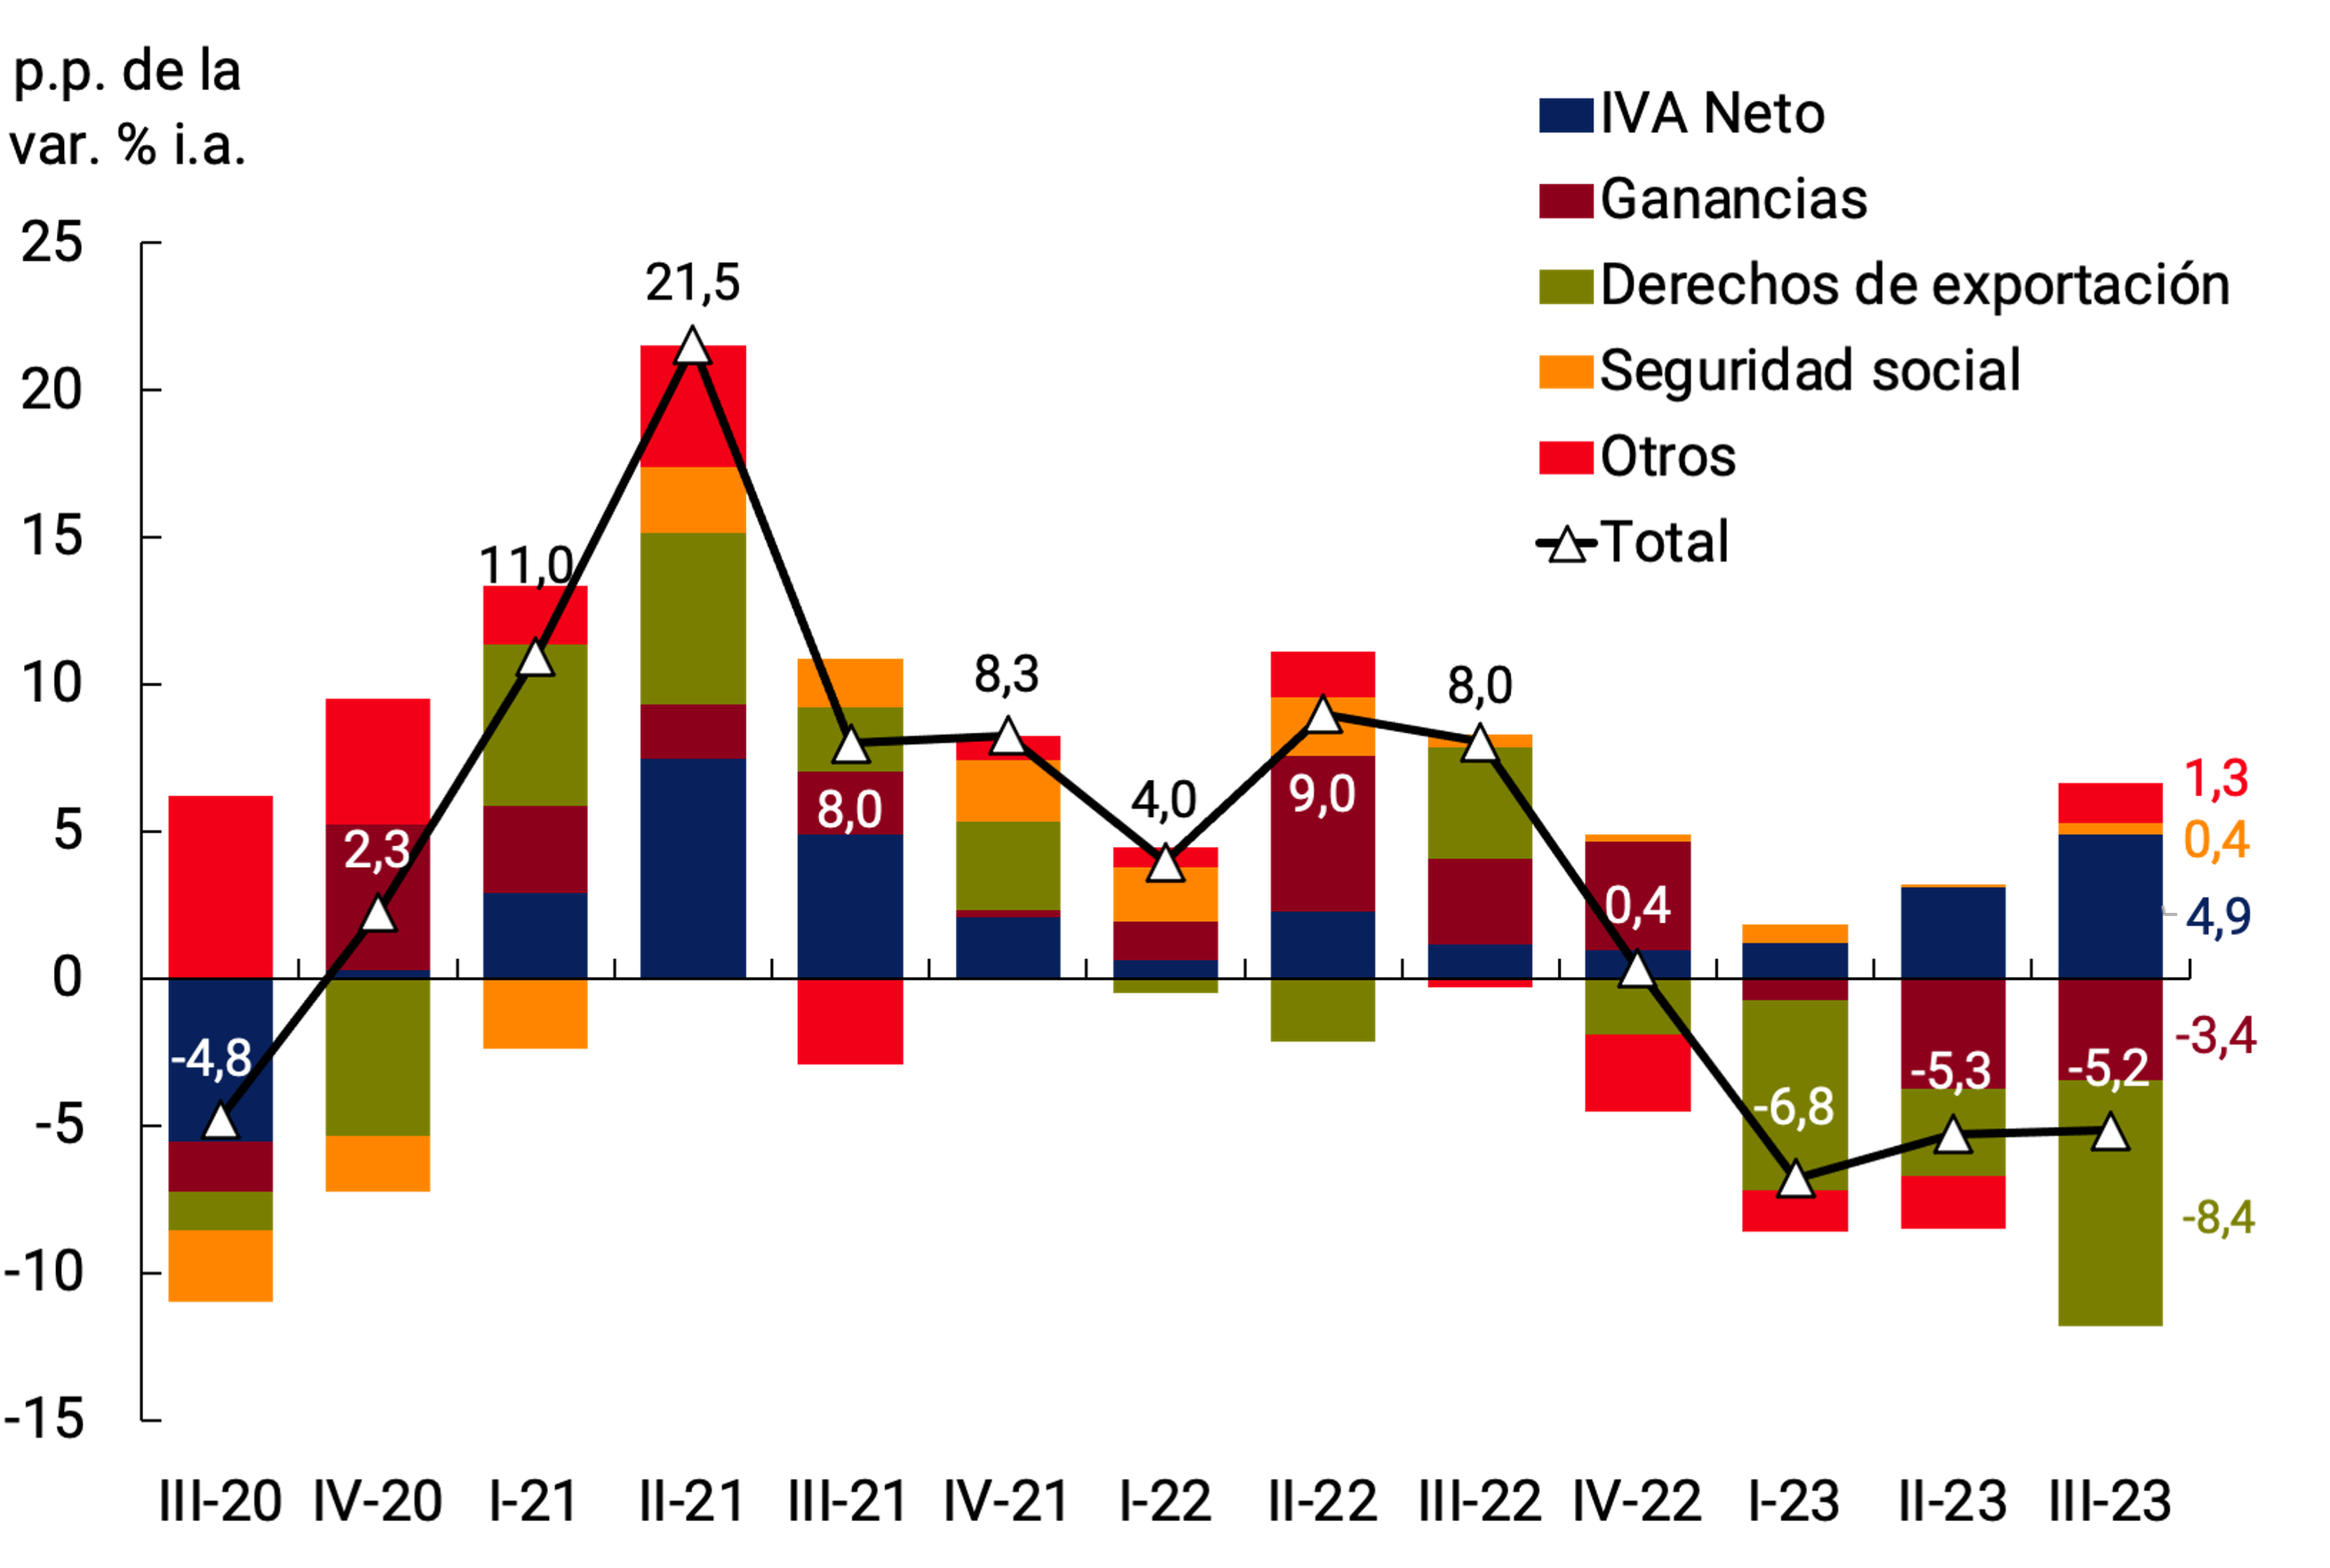
National tax collection increased by 113.0% YoY during the third quarter, which would have meant approximately a real drop of 5.2% YoY, similar to previous quarters (-6.8% YoY and -5.3% YoY in the first and second quarters of the year, respectively; see Figure 5.1). The performance of collection in the third quarter had dissimilar behaviors between taxes.
On the one hand, Export Duties continue to be negatively impacted by the drought, by the advancement of affidavits encouraged by the successive Export Increase Programs (PIE) of 2022 and by early frosts. Export Duties fell by 76.1% YoY in real terms between July and September (-74% YoY and -41.8% YoY in the first and second real quarters), despite the boost in foreign sales due to the fourth Export Increase Program40 aimed at encouraging exports from regional economies, including corn, and the higher nominal exchange rate since mid-August. In September, this right improved its performance due to the implementation of a new PIE41 focused on the soybean complex, but the record collection during September 2022 within the framework of the first PIE has a negative impact on the international comparison.
The Value Added Tax (VAT) maintained the good performance shown throughout the first half of the year, in line with the growth of domestic demand and, in particular, of the real consumption of durable goods (see Chapter 3. Economic Activity and Employment). The effect of tax administration measures (monitoring, payment facility plans) and regulatory changes (changes in the collection regime) continued to weigh positively on this tax42. Net VAT increased by 17.5% YoY in real terms between July and September (+4% YoY, +10.8% YoY in the first and second quarters). In mid-September, theimplementation 43 of the “Buy Without VAT” program was announced, which consists of the refund of 21% VAT for consumption with debit cards of the basic basket for approximately 12 million people with monthly incomes of up to $708,000, while continuing with the refund announced since August to approximately 7.8 million retired and pensioned people; and approximately 2.3 million single-payers are incorporated.
Other taxes linked to the domestic market had a more limited behavior at constant prices, such as the “check” tax and internal taxes (-0.3% y.o.y. and -0.6% y.o.y. in real terms in the third quarter, respectively). Social security resources increased by 1.9% real y.o.y. in the third quarter of 2023 (+0.6% y.o.y. in real terms in the second), basically responding to the improvement in formal employment (see Chapter 3. Economic Activity and Employment).
Figure 5.1 | Contribution to the growth of national tax collection, in constant
currency
Source: BCRA based on data from AFIP and INDEC.
In the third quarter, income tax collection continued to show the impact of the effect of the extraordinary advance payment made by large companies during the last months of last year44, falling by 15.4% YoY in real terms in the period, a magnitude similar to that of the second quarter (-14.7% YoY). Likewise, the updates of the non-taxable minimum and the scale of the tax for individuals and the reduction, as of the second half of August, to 5% of the additional rate of 25% on travel and expenses abroad for certain subjects45. In addition, in mid-September, a modification was implemented by Decree46 that raises, for the second half of the 2023 fiscal period, the Minimum Non-Taxable Amount (MNI) of the Income Tax, up to a monthly sum equivalent —according to the amount in force on October 1, 2023—, to fifteen minimum wages (Minimum Living and Mobile Wage —SMVM—)47. As of this modification, workers in a relationship of dependency and retirees ceased to be covered by the tax, with the only exception of those with remuneration linked to managerial positions or very high incomes or retirements from special regimes. This measure will have an impact on tax collection in the last quarter of the year. On the other hand, the real fall in the tax was cushioned by the increase in the withholding on account of taxes on Income (and on Personal Property) for the consumption of foreign currency for travel and expenses abroad and other taxable operations48. At the end of September, the extraordinary payment of an advance on income tax to banks, financial companies and insurance companies was arranged.
Meanwhile, Import Duties and the Statistical Tax cut the reduction to 1.9% YoY in real terms in the third quarter (vs. -20.7% YoY and -12.4% YoY in the first and second quarters respectively), due, in part, to a higher nominal exchange rate since August. However, the contraction was again basically explained by lower imported values (see Chapter 4. External Sector).
Since the end of July, revenues have grown significantly due to the generalized imposition of the PAIS tax on imports of goods and services. The newrates 49 range from 7.5% to 25%. Thus, the collection of this tax in the months of August and September increased by about 270% compared to the monthly average of the previous50 months.
The evolution of tax revenues implied that the total revenues of the National Non-Financial Public Sector (NFPS) cut the fall in real terms to 2.2% y.o.y. in the third quarter of 2023 (with partial data as of August). The annual comparison was impacted by the decrease in Export Duties already described and lower revenues from non-tax resources, in particular Property Income related to primary emissions51. Net of Export Duties, funds would have shown a real increase of 2.2% YoY in the third quarter.
5.2. Primary expenditure decreased in real terms in the third quarter of the year
Primary expenditures accumulate 5 quarters (with partial data up to August) of real year-on-year reduction and would have cut the real fall to 3.0% y.o.y. in the third quarter of the year. In real and seasonally adjusted terms, real primary expenditure contracted by 2.5% s.e. compared to the second quarter (see Figure 5.2).
Figure 5.2 | Primary expenditures in constant
currencySeasonally
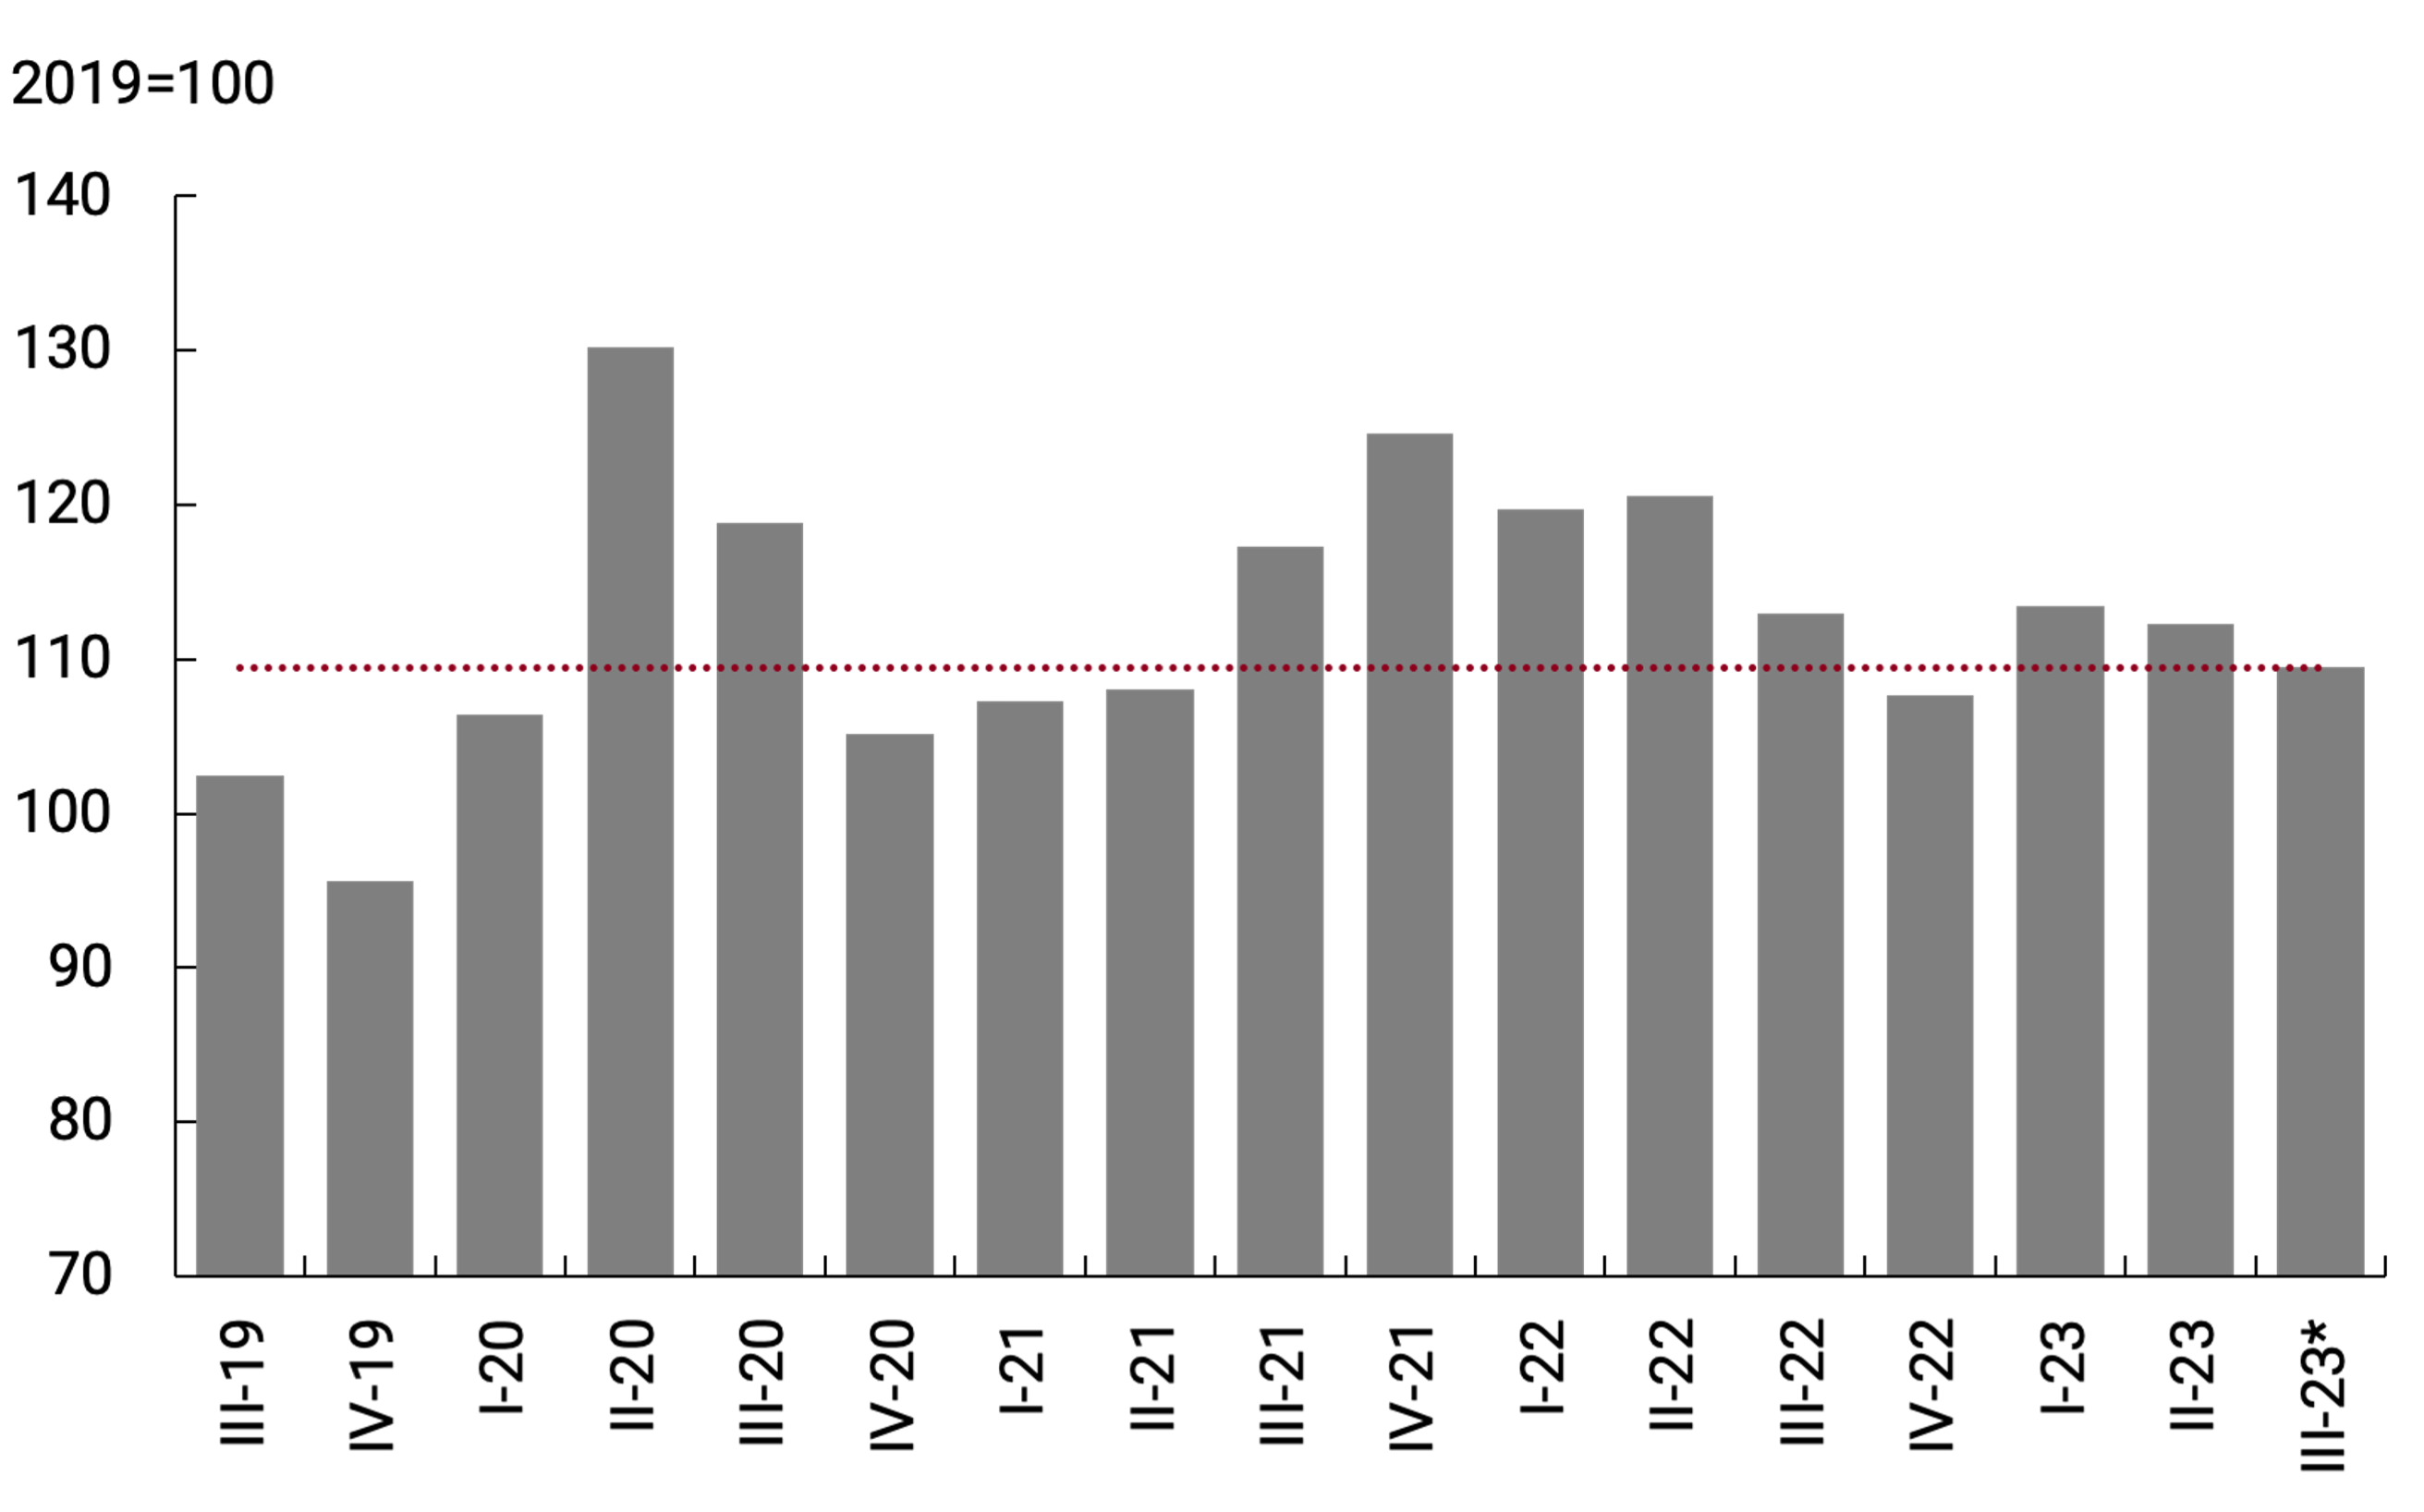
adjusted
*Data as of Aug-23.
Source: BCRA based on data from the Ministry of Economy and INDEC.
This decrease in spending was made without affecting capital expenditure (+14.1% YoY with data as of August), associated with road infrastructure, housing, transport and energy works, mainly highlighting the construction of the Néstor Kirchner Gas Pipeline, which, in fiscal matters, will reduce the cost of energy from the second half of the year and thus strengthen fiscal consolidation in the medium term.
Expenditure on social benefits increased 0.2% y.o.y. in real terms in the third quarter – with partial data as of August. Within this category, pension benefits fell by 5.8% YoY between July and August as they advanced at the pace imposed by the Retirement Mobility Law, which showed increases of 17.0% in March and 21.0% in June (89.2% YoY as of June). However, retirements and pensions, particularly those of those who receive the lowest benefits (up to two minimum salaries) were increased by the bonuses that were granted on a monthly basis since the end of 2022 to partially offset the inflation observed. Including these compensations, spending on pension benefits would have fallen by 2.5% in real y.o.y. in the third quarter. Among the measures announced in August and September, the amount of this bonus was increased again for the months of September, October and November, thus trying to make those who receive the lower salaries compensate for the increase in the general price level.
In general terms, the Government took a series of measures aimed at cushioning the effect of the exchange rate movement on the incomes of retired and unemployed people, workers in a relationship of dependence on lower wages, monotributistas and entrepreneurs, among others. In contrast, to compensate, an extraordinary income tax advance was provided to banks, financial companies, and insurance companies (see Table 5.1).
The set of other current transfer programs of Aid to People, linked to programs such as the Food Card or Empower Work, among others, had increases above inflation during the third quarter, with partial data to August. On the other hand, current transfers to the provinces also increased at constant prices by 11.6% YoY in the third quarter – with data as of August – compared to the previous year, after having fallen in real terms for much of the year. The items corresponding to the subnational jurisdictions dependent on the tax sharing regime, which are not affected by the reduction in the collection of taxes on foreign trade, also grew by 2.0% YoY in real terms in the third quarter (after falling by 1.3% YoY in the second quarter).
Table 5.1 | Main measures announced in August and September for compensation and income
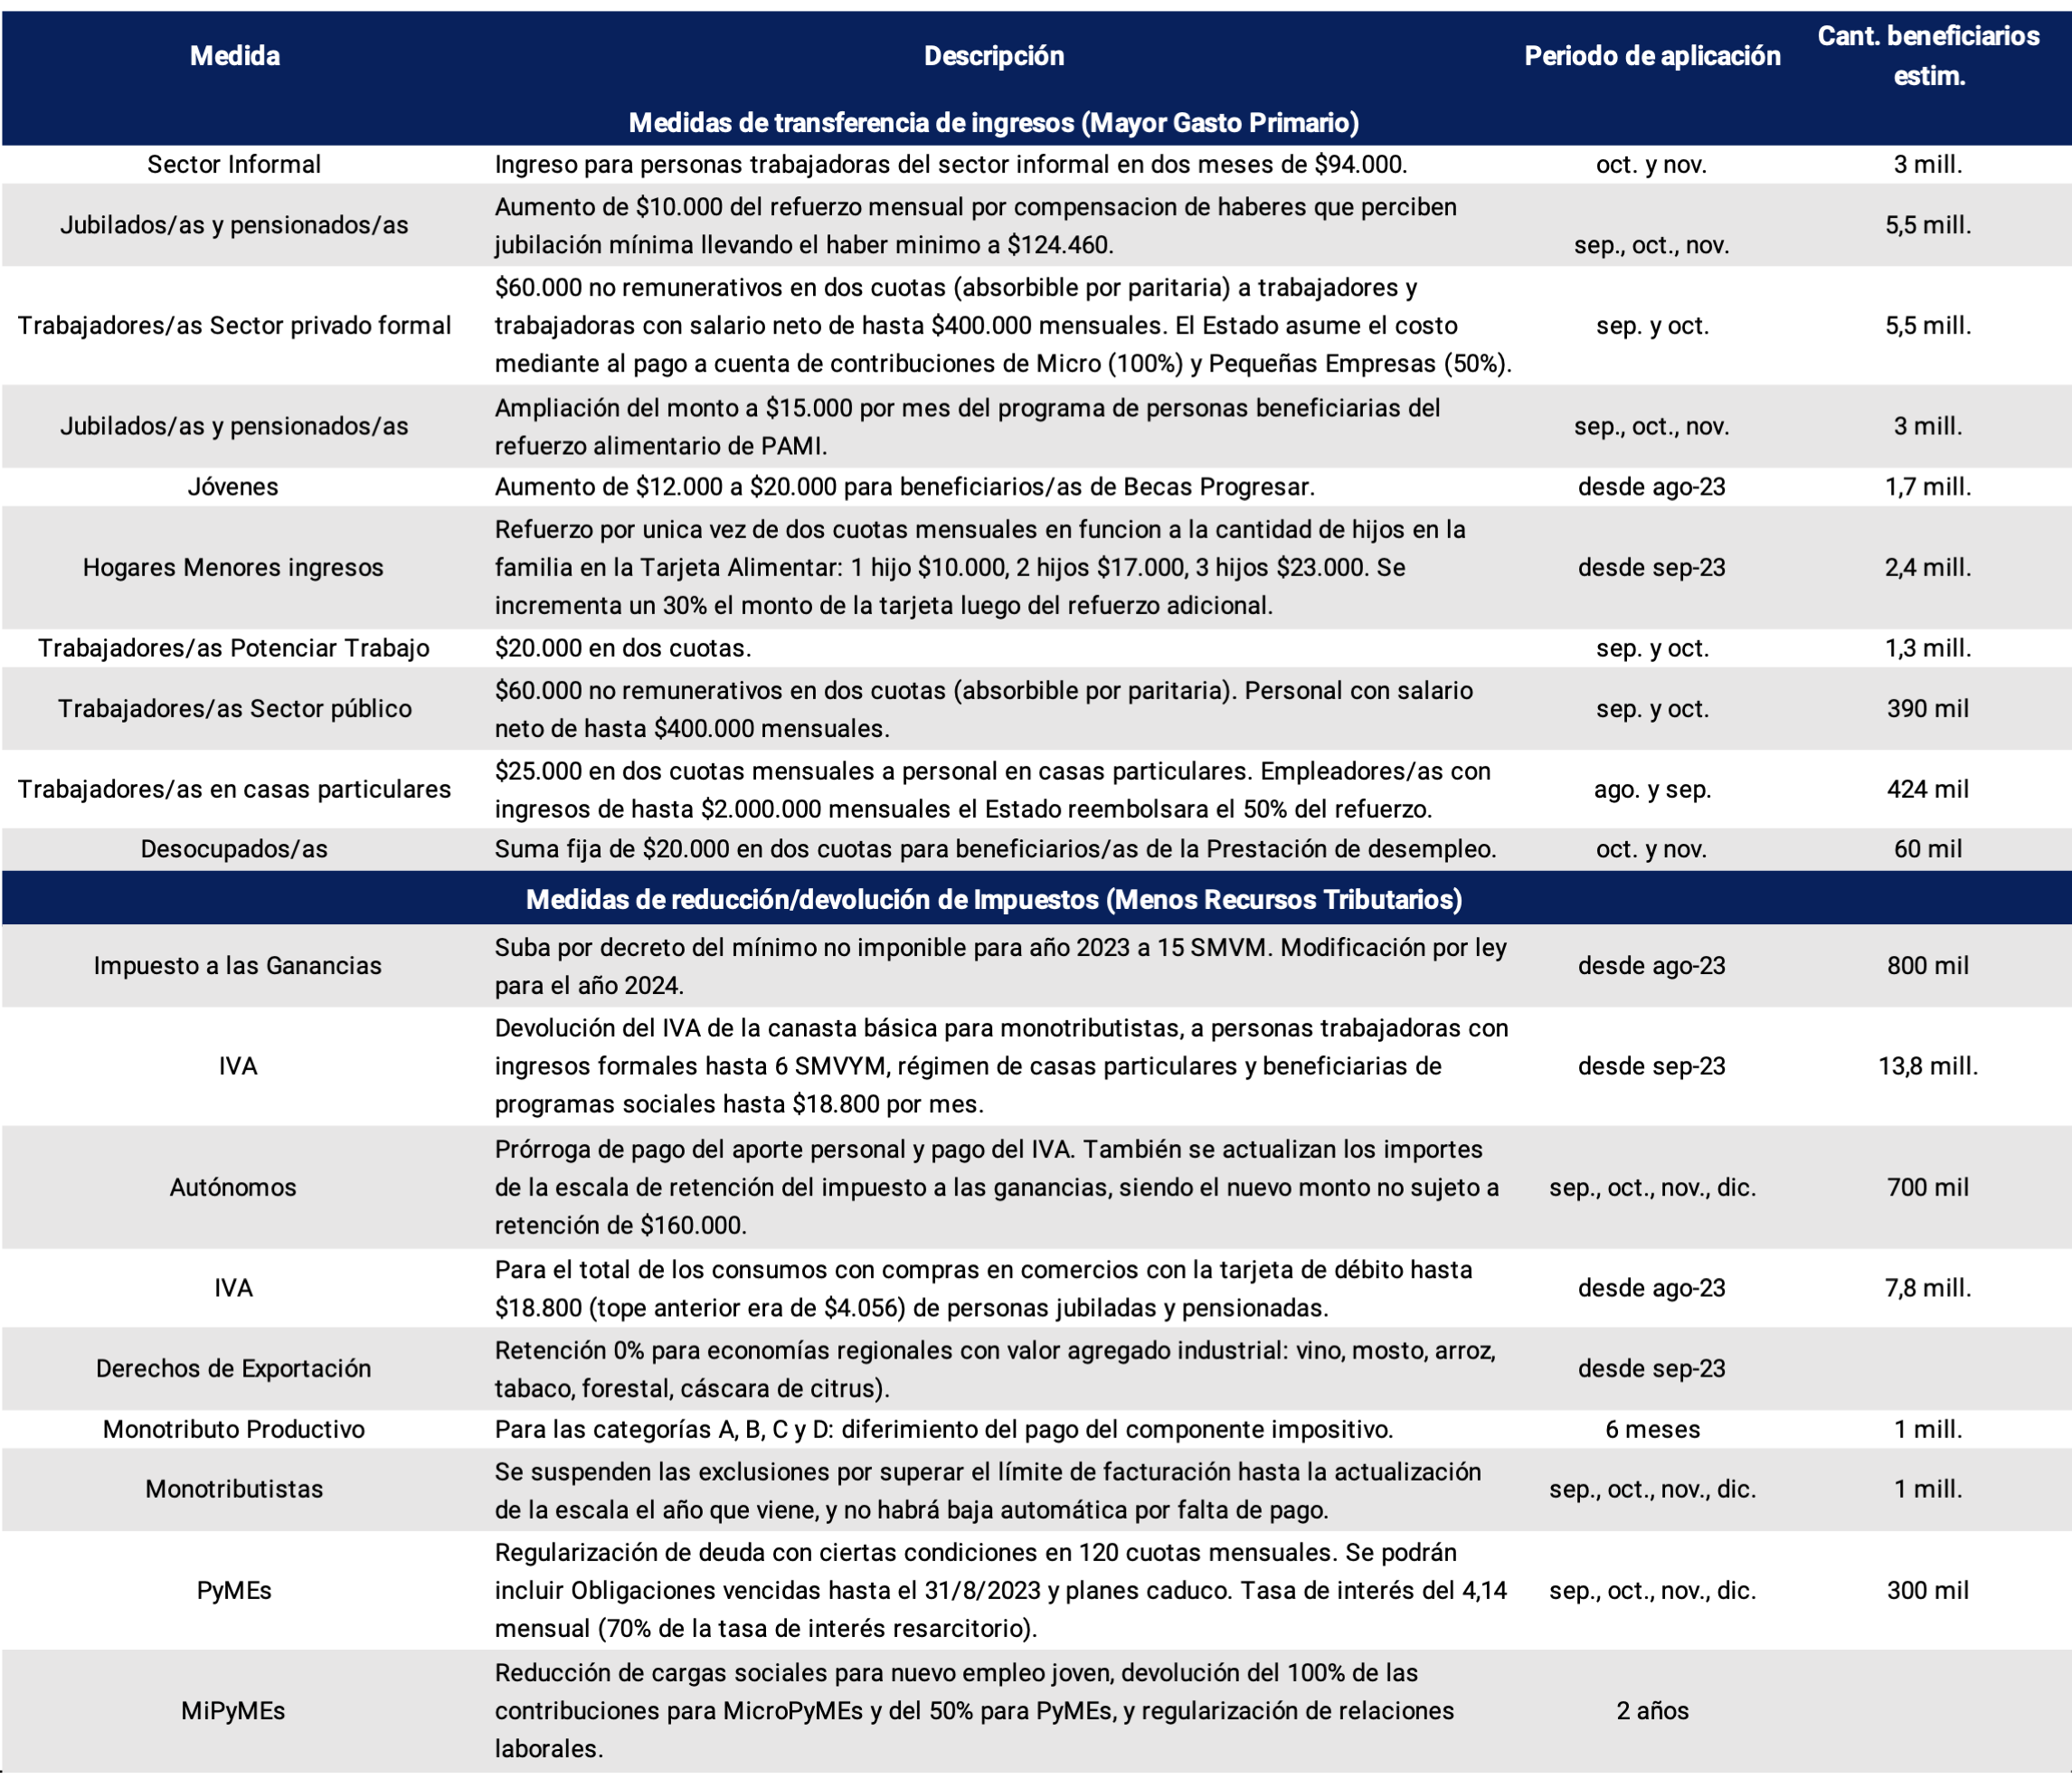
reinforcement
Source: BCRA based on official information.
Spending on subsidies, which had been amplified by the increases in international fuel and energy prices during 2022, so far in the third quarter of the year registered a decrease of 28.2% y.o.y. in real terms. The increases in public service tariffs, within the framework of the advance of tariff segmentation, allowed the gradual reduction of the burden of the cost of these services on public accounts. It should be added that while energy subsidies fell by 33.4% YoY in real terms between July and August (vs. +12.2% YoY in the second quarter), transport subsidies fell by 0.5% YoY in real terms in the same period (vs. -22.2% YoY between April and June). In the course of the months of September and October, new increases in the rate of water services also operated, while the planned increases in urban transport rates were frozen for two months until October within the framework of the acceleration of the general price level during August and September.
Items associated with salaries and operating expenses grew 7.0% y.o.y. in real terms in the third quarter with data up to August. In particular, wages increased 7.5% YoY in the first quarter and 6.3% YoY in the second quarter, basically as a result of the agreed wage agreements, and moderated their increase in the third quarter to 5.9% YoY. Current transfers to universities, also closely associated with personnel expenditure, grew 6.6% y.o.y. in the third quarter, after advancing 12.7% y.o.y. in the second quarter and falling 3.4% y.o.y. in real terms in the first quarter of the year.
5.3. The impact of the harvest on tax revenues was partially reflected in the evolution of the primary result
The cut in NFPS primary expenditure in real terms was smaller than the decline in total revenues (see Figure 5.3). In June, the primary deficit of the accumulated NFPS exceeded the target set under the agreement with the IMF for the second quarter of the year, while in August it reached approximately 1.3% of annual GDP.
Figure 5.3 | NFPS Primary Income and ExpenditureIn constant currency*Data as of Aug-23.
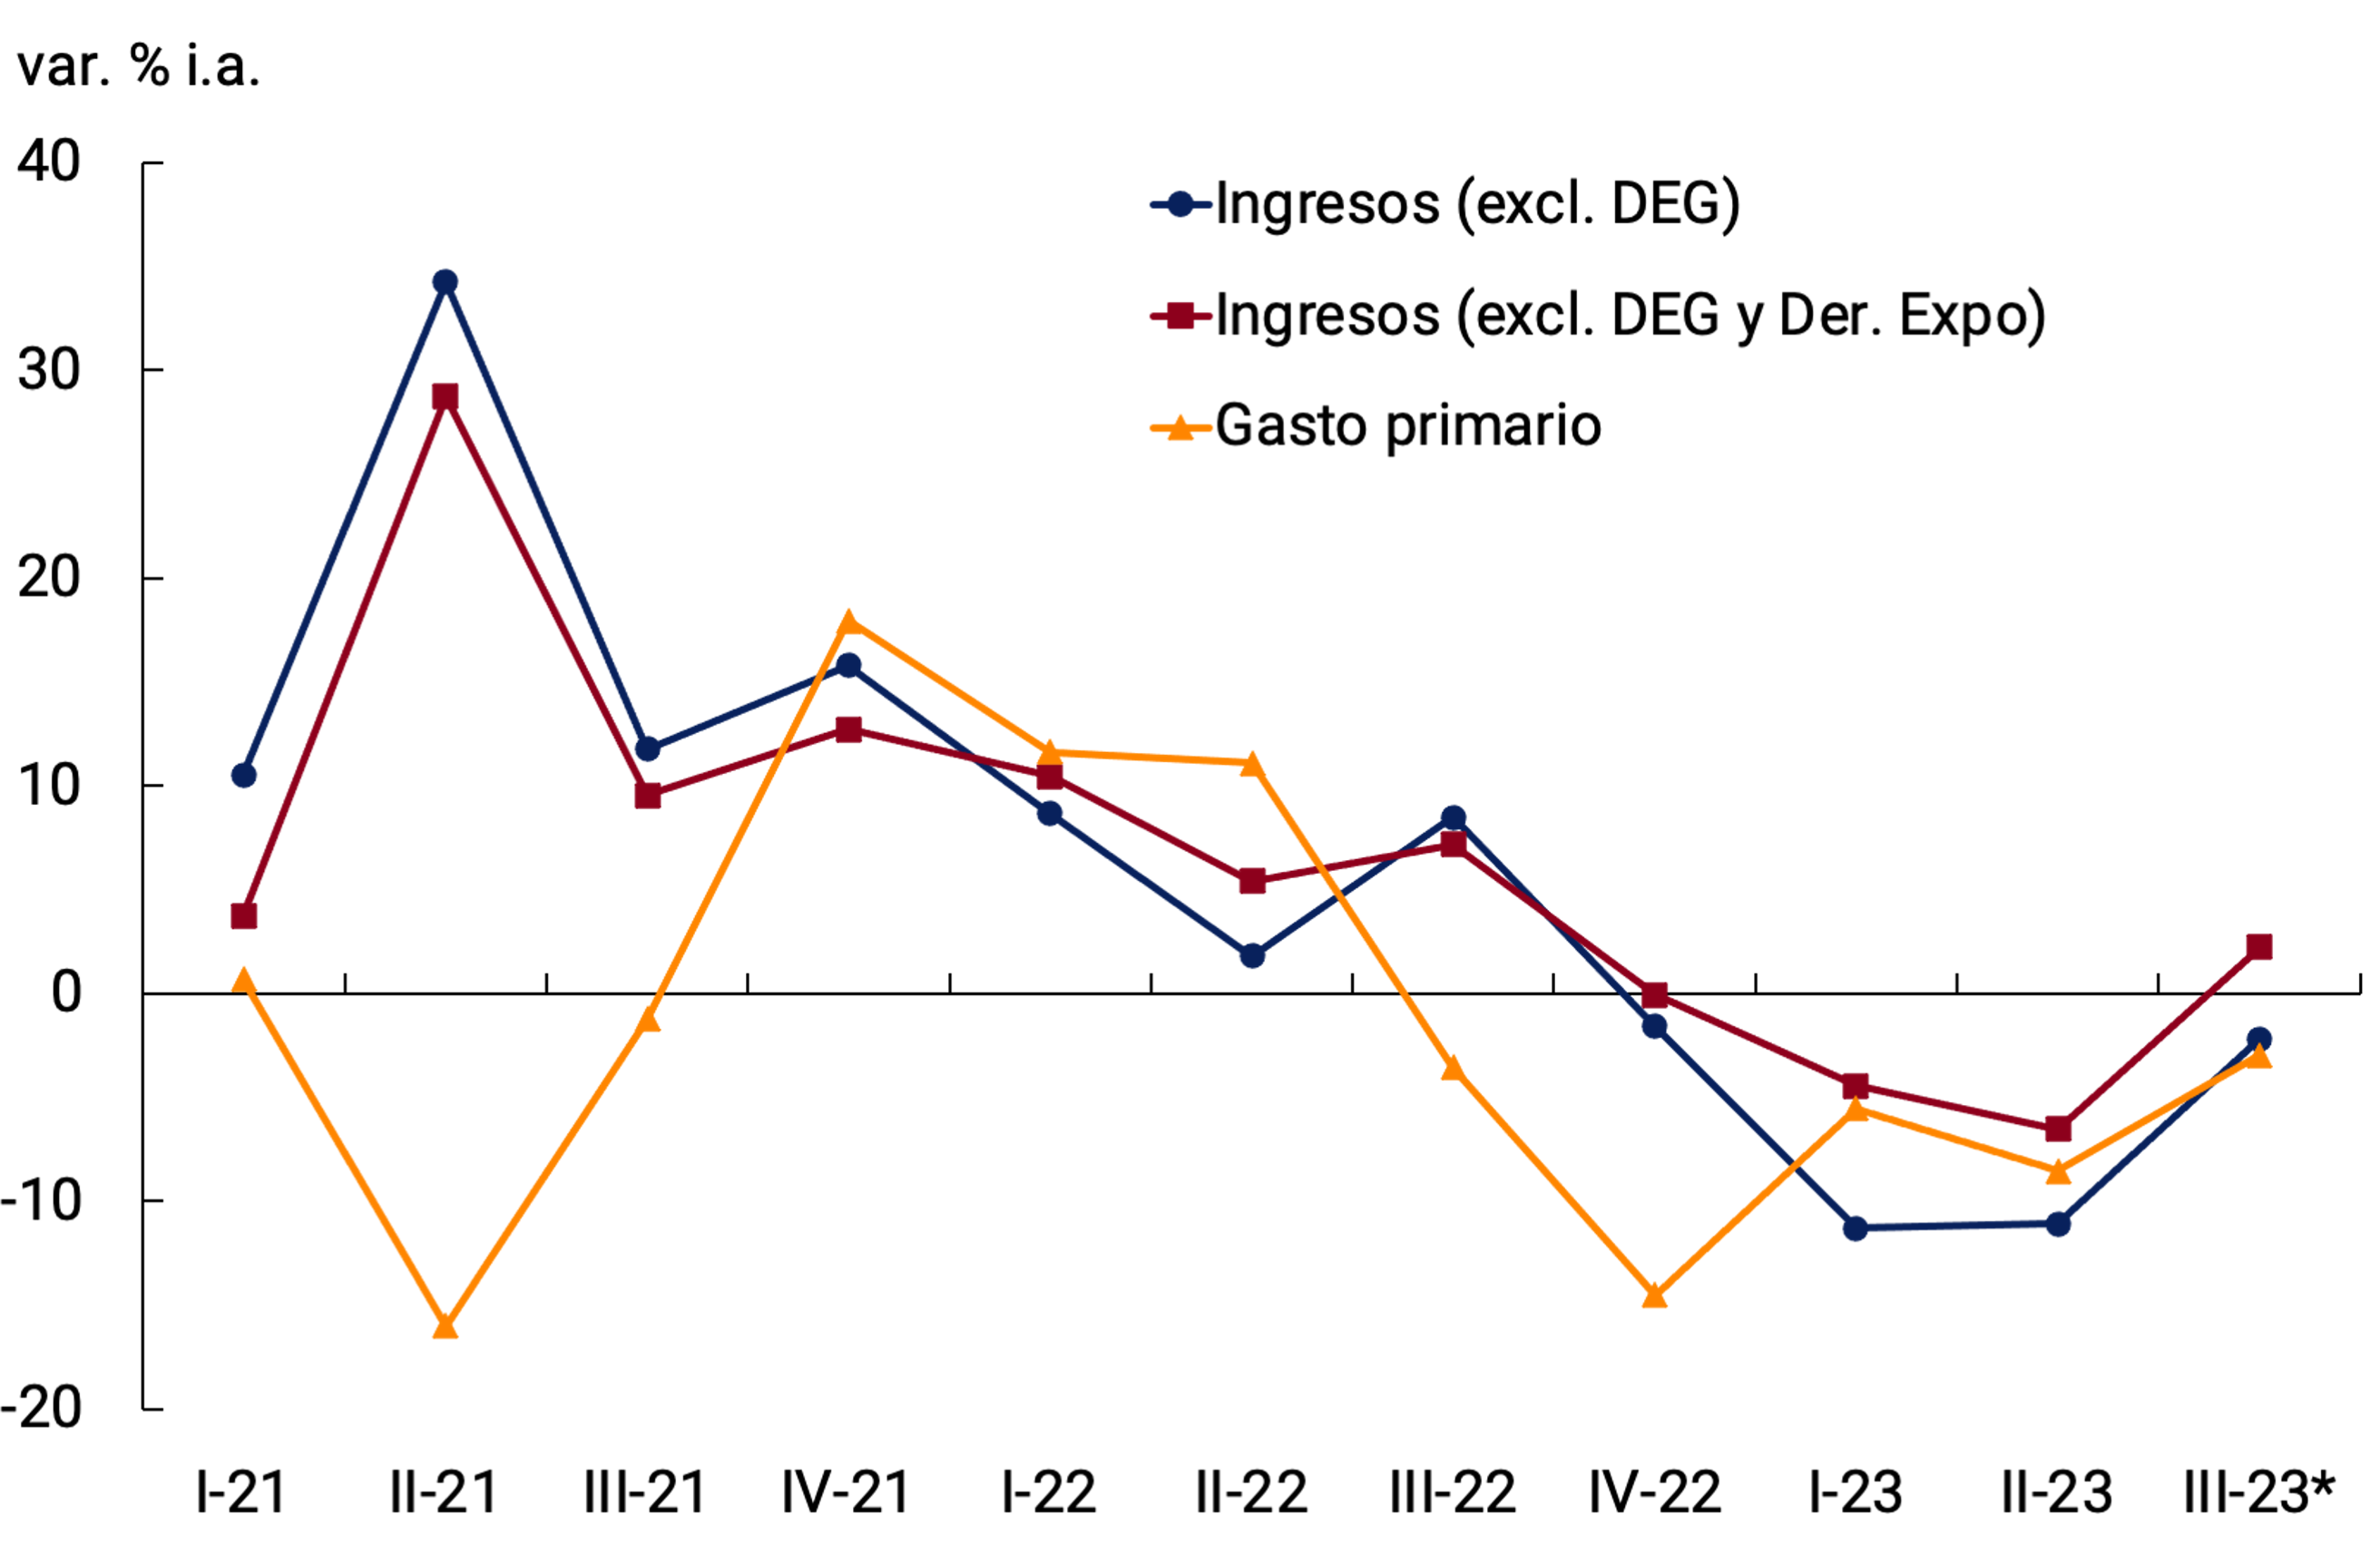
Source: BCRA based on data from the Ministry of Economy and INDEC.
The primary deficit of the NFPS accumulated in the last 12 months, as of August 2023, represented approximately 2.3% of GDP. For its part, the financial deficit of the NFPS accumulated in the same period stood at 4.3% of GDP (see Figure 5.4). For 2023, both the 2024 National Budget Bill and the fifth and sixth revisions of the IMF’s Extended Facilities Program maintained the NFPS deficit target on a cash basis of 1.9% of GDP for 2023 and 0.9% of GDP for 2024, although it was recently announced that an addendum with modifications to the bill sent in mid-September would be sent.
Figure 5.4 | Cumulative NFPS
Result 12 months
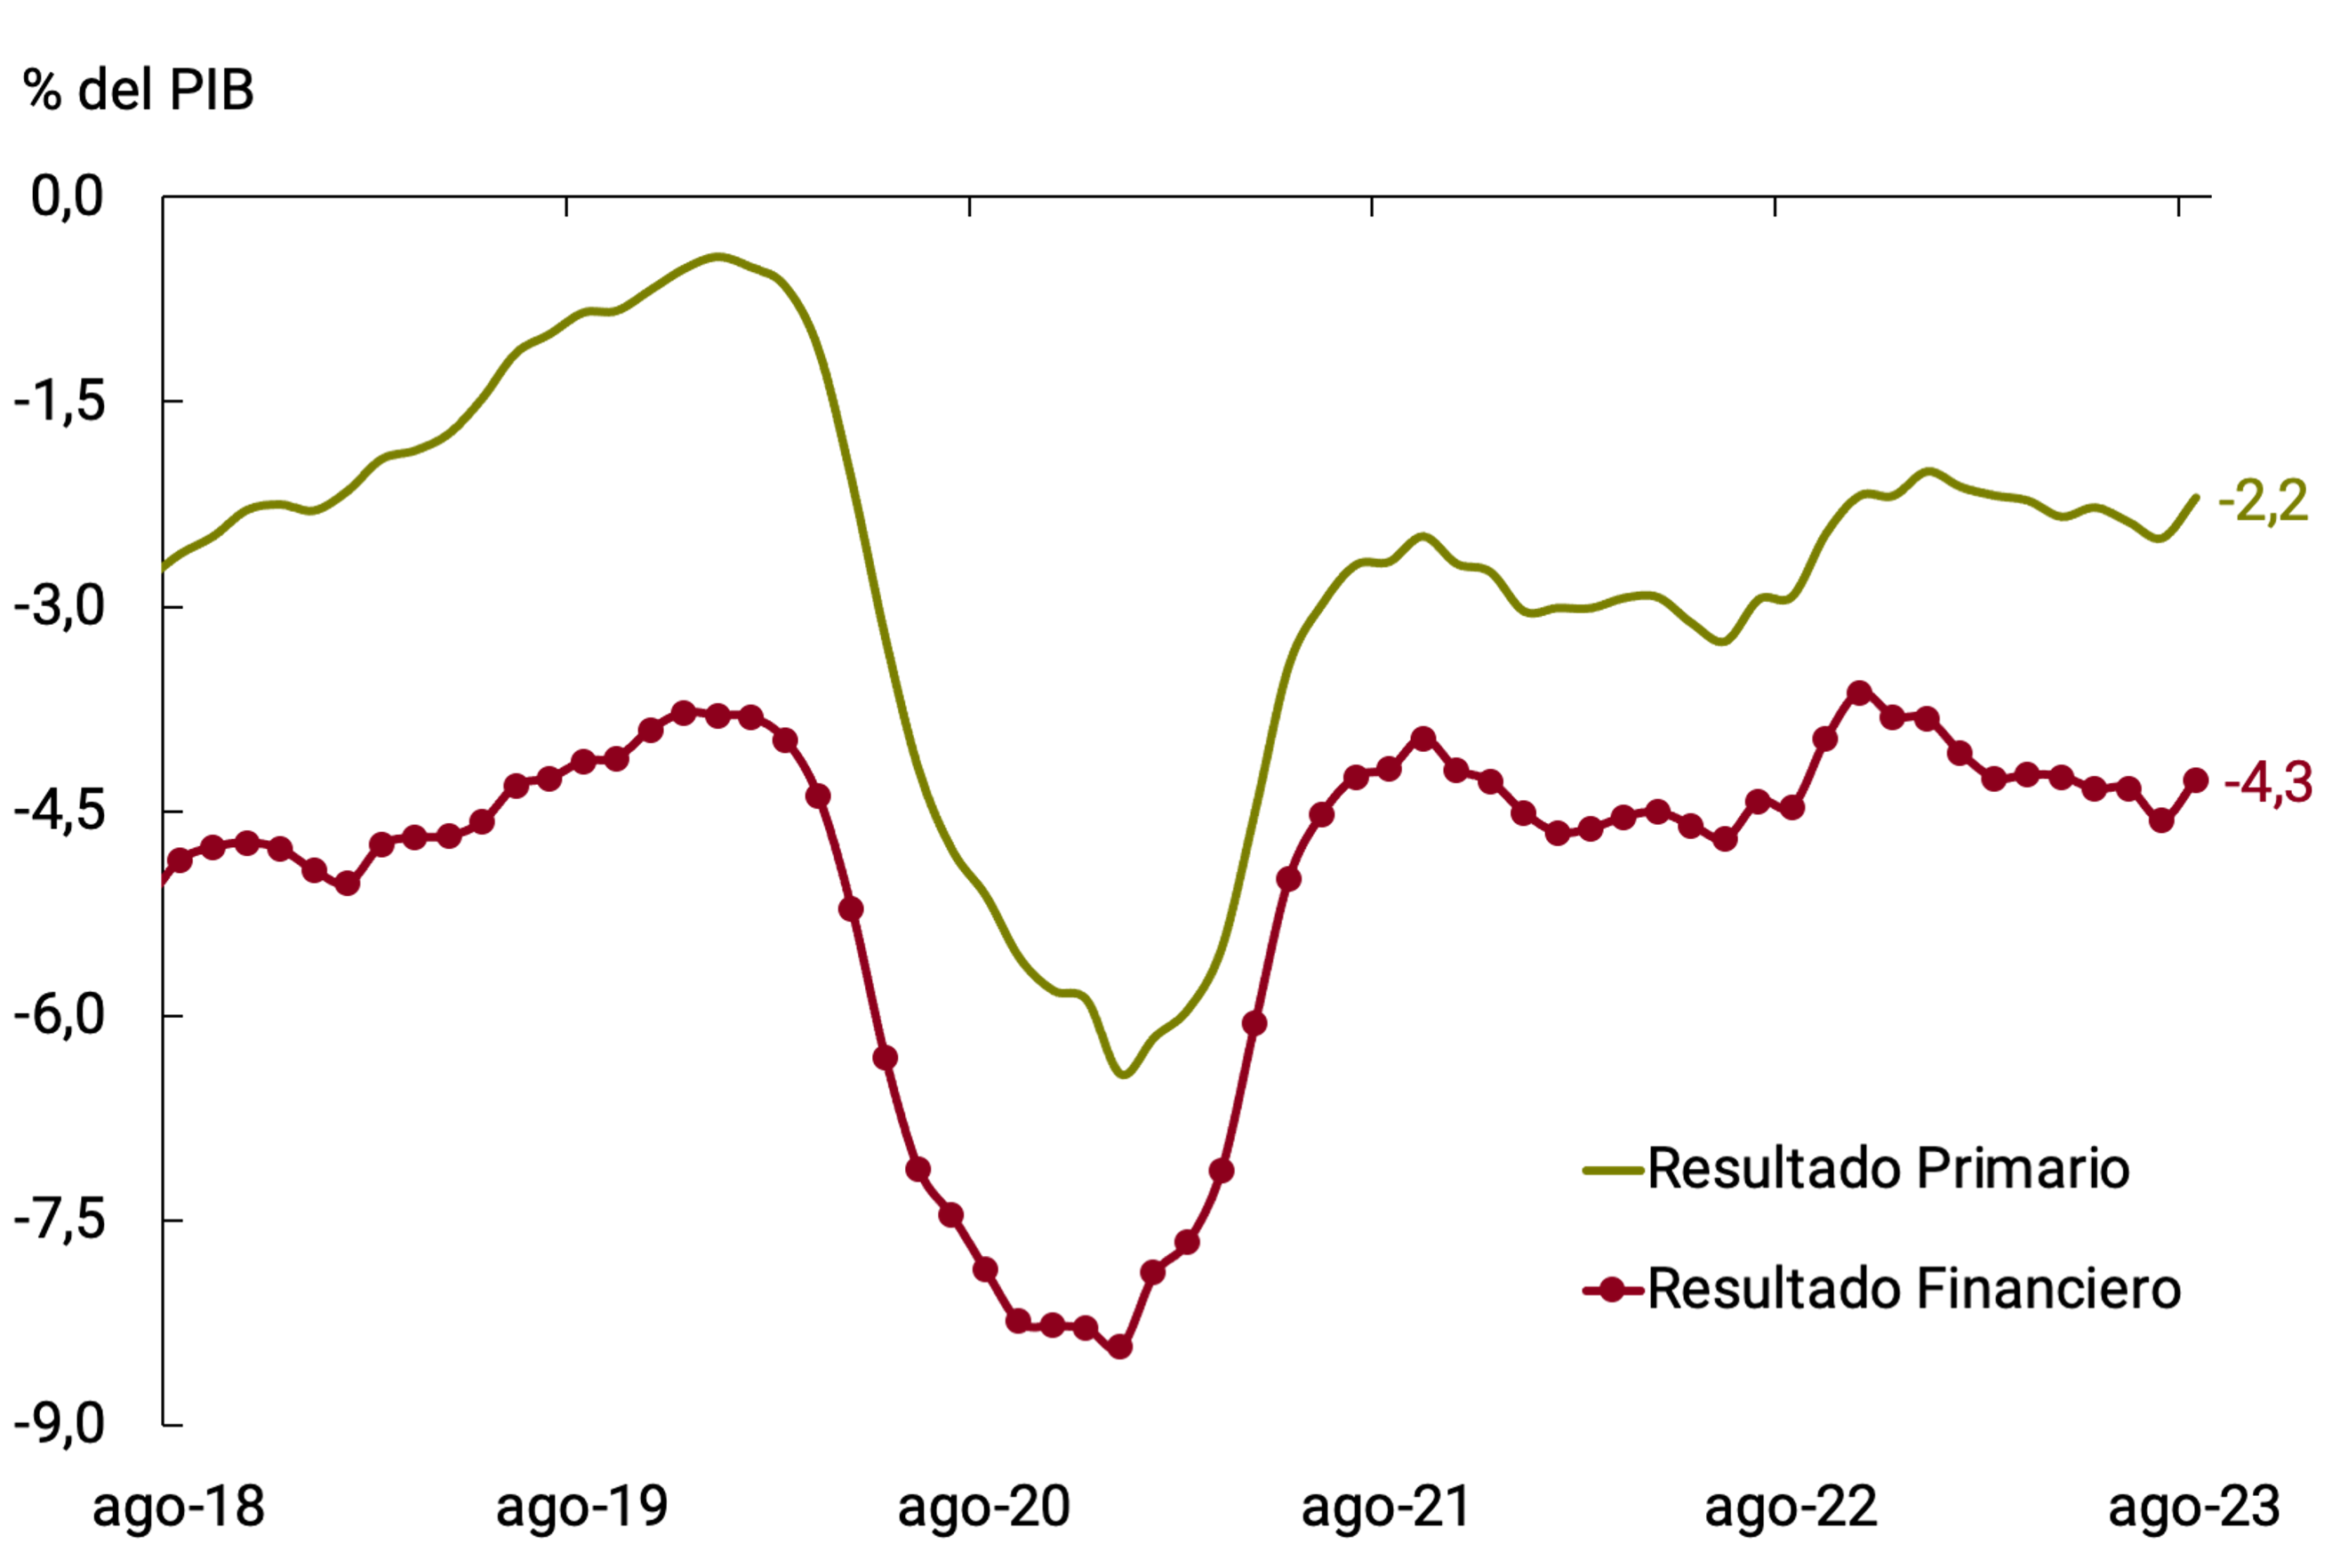
Source: BCRA based on data from the Ministry of Economy and INDEC.
5.4. During the third quarter, the financial needs of the National Treasury were covered with placements in the local market and extraordinary transitory assistance from the BCRA
During the first 9 months of 2023, the National Treasury (TN) achieved a refinancing of 150% of capital and interest services in pesos, which implied a net financing of approximately $4.1 trillion. Debt instrument issuances during the third quarter were concentrated in securities adjustable by the Reference Stabilization Coefficient (CER), dollar-adjusted securities (DLK) and dual instruments (greater variation between the dollar and CER) and, to a lesser extent, fixed-rate discounted peso bills were placed.
Compared to what had happened at the end of July, the weighted term by amount of the instruments issued increased. The September tenders had a weighted average term of 291 days, in line with the average of 310 days of the tenders held in August and during the second quarter of the year, and above the average of 244 days in July. Considering discount bills as a reference, the annual effective rates rose considerably in the last auctions. The annual effective rate of discount bills in the last auction in September stood at 171.9%.
Likewise, in order to continue clearing the maturity profile, a conversion operation will be carried out voluntarily and under market conditions, aimed at National State entities with relevant holdings of instruments maturing during the last quarter of the year. With this, an extension of these maturities is expected by more than $600,000 million to 2025 and 2026.
The stock of National Public Debt at the end of August 2023 amounted to US$395,395 million and represented about 103% of GDP, showing a level similar to that of the end of 2020.
As highlighted in the July IPOM, despite the net financing that the NT obtained through tenders of instruments in the domestic market, the fiscal result, added to the need to timely meet the payments of services to the International Monetary Fund (IMF) in the face of the delay in the disbursements of the fifth review of the PFE, required extraordinary temporary assistance from the BCRA. Of the almost $2 trillion that the BCRA transferred to the NT from the beginning of 2023 to mid-August—through net Transitory Advances, as well as profits—almost half was allocated to the IMF’s capital and interest services, and therefore did not imply an expansion of liquidity. In addition, in order to meet the commitments of late July and early August, other non-conventional sources of funds were temporarily resorted to (the placement of a non-transferable bill to the BCRA and a bilateral loan with the State of Qatar). These financial bridges made it possible to meet the program’s maturities with the IMF in a timely manner. After the approval of the 5th and 6th revisions of the agreement with the IMF, on August 23 the gross disbursement of about US$7,400 million was achieved by the organization and the financing mechanisms used for payments made to the international organization began to be reversed. On the same day, $0.5 billion of net transitory advances were canceled, as was the bridge loan with the State of Qatar.
6. Pricing
The increase in financial volatility and various measures aimed at offsetting the consequences of the extraordinary drought, both on fiscal resources and on international reserves, had an effect on inflation in the quarter. The greatest impact would have been concentrated in August, when monthly inflation stood at 12.4%, and in September, due to the statistical drag left by the price increases verified in the second half of the previous month. In this way, the third quarter of the year would end with a rate of price increases of around 10% monthly average (approximately 2.6 p.p. higher than that of the II-23). Accumulated inflation up to August was 80.2% while year-on-year inflation reached 124.4%.
The acceleration of the general price level was concentrated to a greater extent on goods, given their tradable nature, accounting for the impact of the expansion of the tax base of the PAIS tax and mainly of the recalibration of the official exchange rate. The highest incidence was in food, especially in the Meat and derivatives group, partly evidencing the influence of the increase in corn prices after the stimulus of the Export Increase Program (PIE). The Core (13.8%, +7.3 p.p. compared to July) and Seasonal (14.8%, +5.5 p.p.) categories were the ones that showed the greatest accelerations in August, while the Regulated category increased its pace, although to a lesser extent (8.3%, +1.6 p.p.).
In response to the increase in inflation, the National Government adopted a series of measures aimed at containing inertia and avoiding a spiraling process. These include the renewal of price agreements within the framework of the Fair Prices program – limiting the rate of increase in products in the basic basket and stabilizing the prices of medicines – the temporary freezing of prices of certain regulated products – such as gasoline and prepaid medicine fees – and the postponement of increases in train fares. buses, gas and electricity. The BCRA, for its part, raised the monetary policy interest rate, kept the exchange rate stable and continued with its interventions in the financial markets with the aim of helping to limit volatility.
As a result of these measures, inflation slowed down in the last weeks of September and, in the absence of new shocks, a marked reduction in the monthly inflation rate is expected for October. The BCRA will continue to focus its decisions on mitigating financial and exchange rate volatility, in a period marked by tensions associated with the political cycle.
6.1. During the third quarter, inflation reflected the impact of increased volatility and various measures aimed at offsetting the effect of the drought
After monthly inflation remained relatively stable in July (6.3%) compared to June (6.0%), in August there was a significant acceleration in the general price level, reaching a 12.4% monthly increase. The marked increase in inflation was the result of the recalibration of the official TCN and, to a lesser extent, the generalization of the PAIS tax on imports of goods and services, the implementation of the Export Increase Program for corn and the increase in the implicit exchange rates in the quotations of financial assets after the PASO elections. among other factors.
In response to the increase in inflation, the National Government adopted a series of measures aimed at containing inertia and avoiding a spiraling process. Among them are the renewal of price agreements within the framework of the Fair Prices program, limiting the rate of increase in products in the basic basket and stabilizing the prices of medicines, the temporary freezing of prices of certain regulated products – such as gasoline and prepaid medicine fees – and the postponement of increases in train fares. buses, gas and electricity. Although these policies contributed to slowing prices during September, the high statistical drag left by the price increases verified in the second half of August would have implied a very high average monthly inflation again for the ninth month of the year (in a range similar to that of August54), while the reduction would only be reflected in the monthly index of October. Thus, the third quarter would end with an average rate of increase in prices of around 10% per month (approximately 2.6 p.p. higher than in II-23, see Figure 6.1).
Figure 6.1 | CPI. Monthly and quarterly evolution of the General
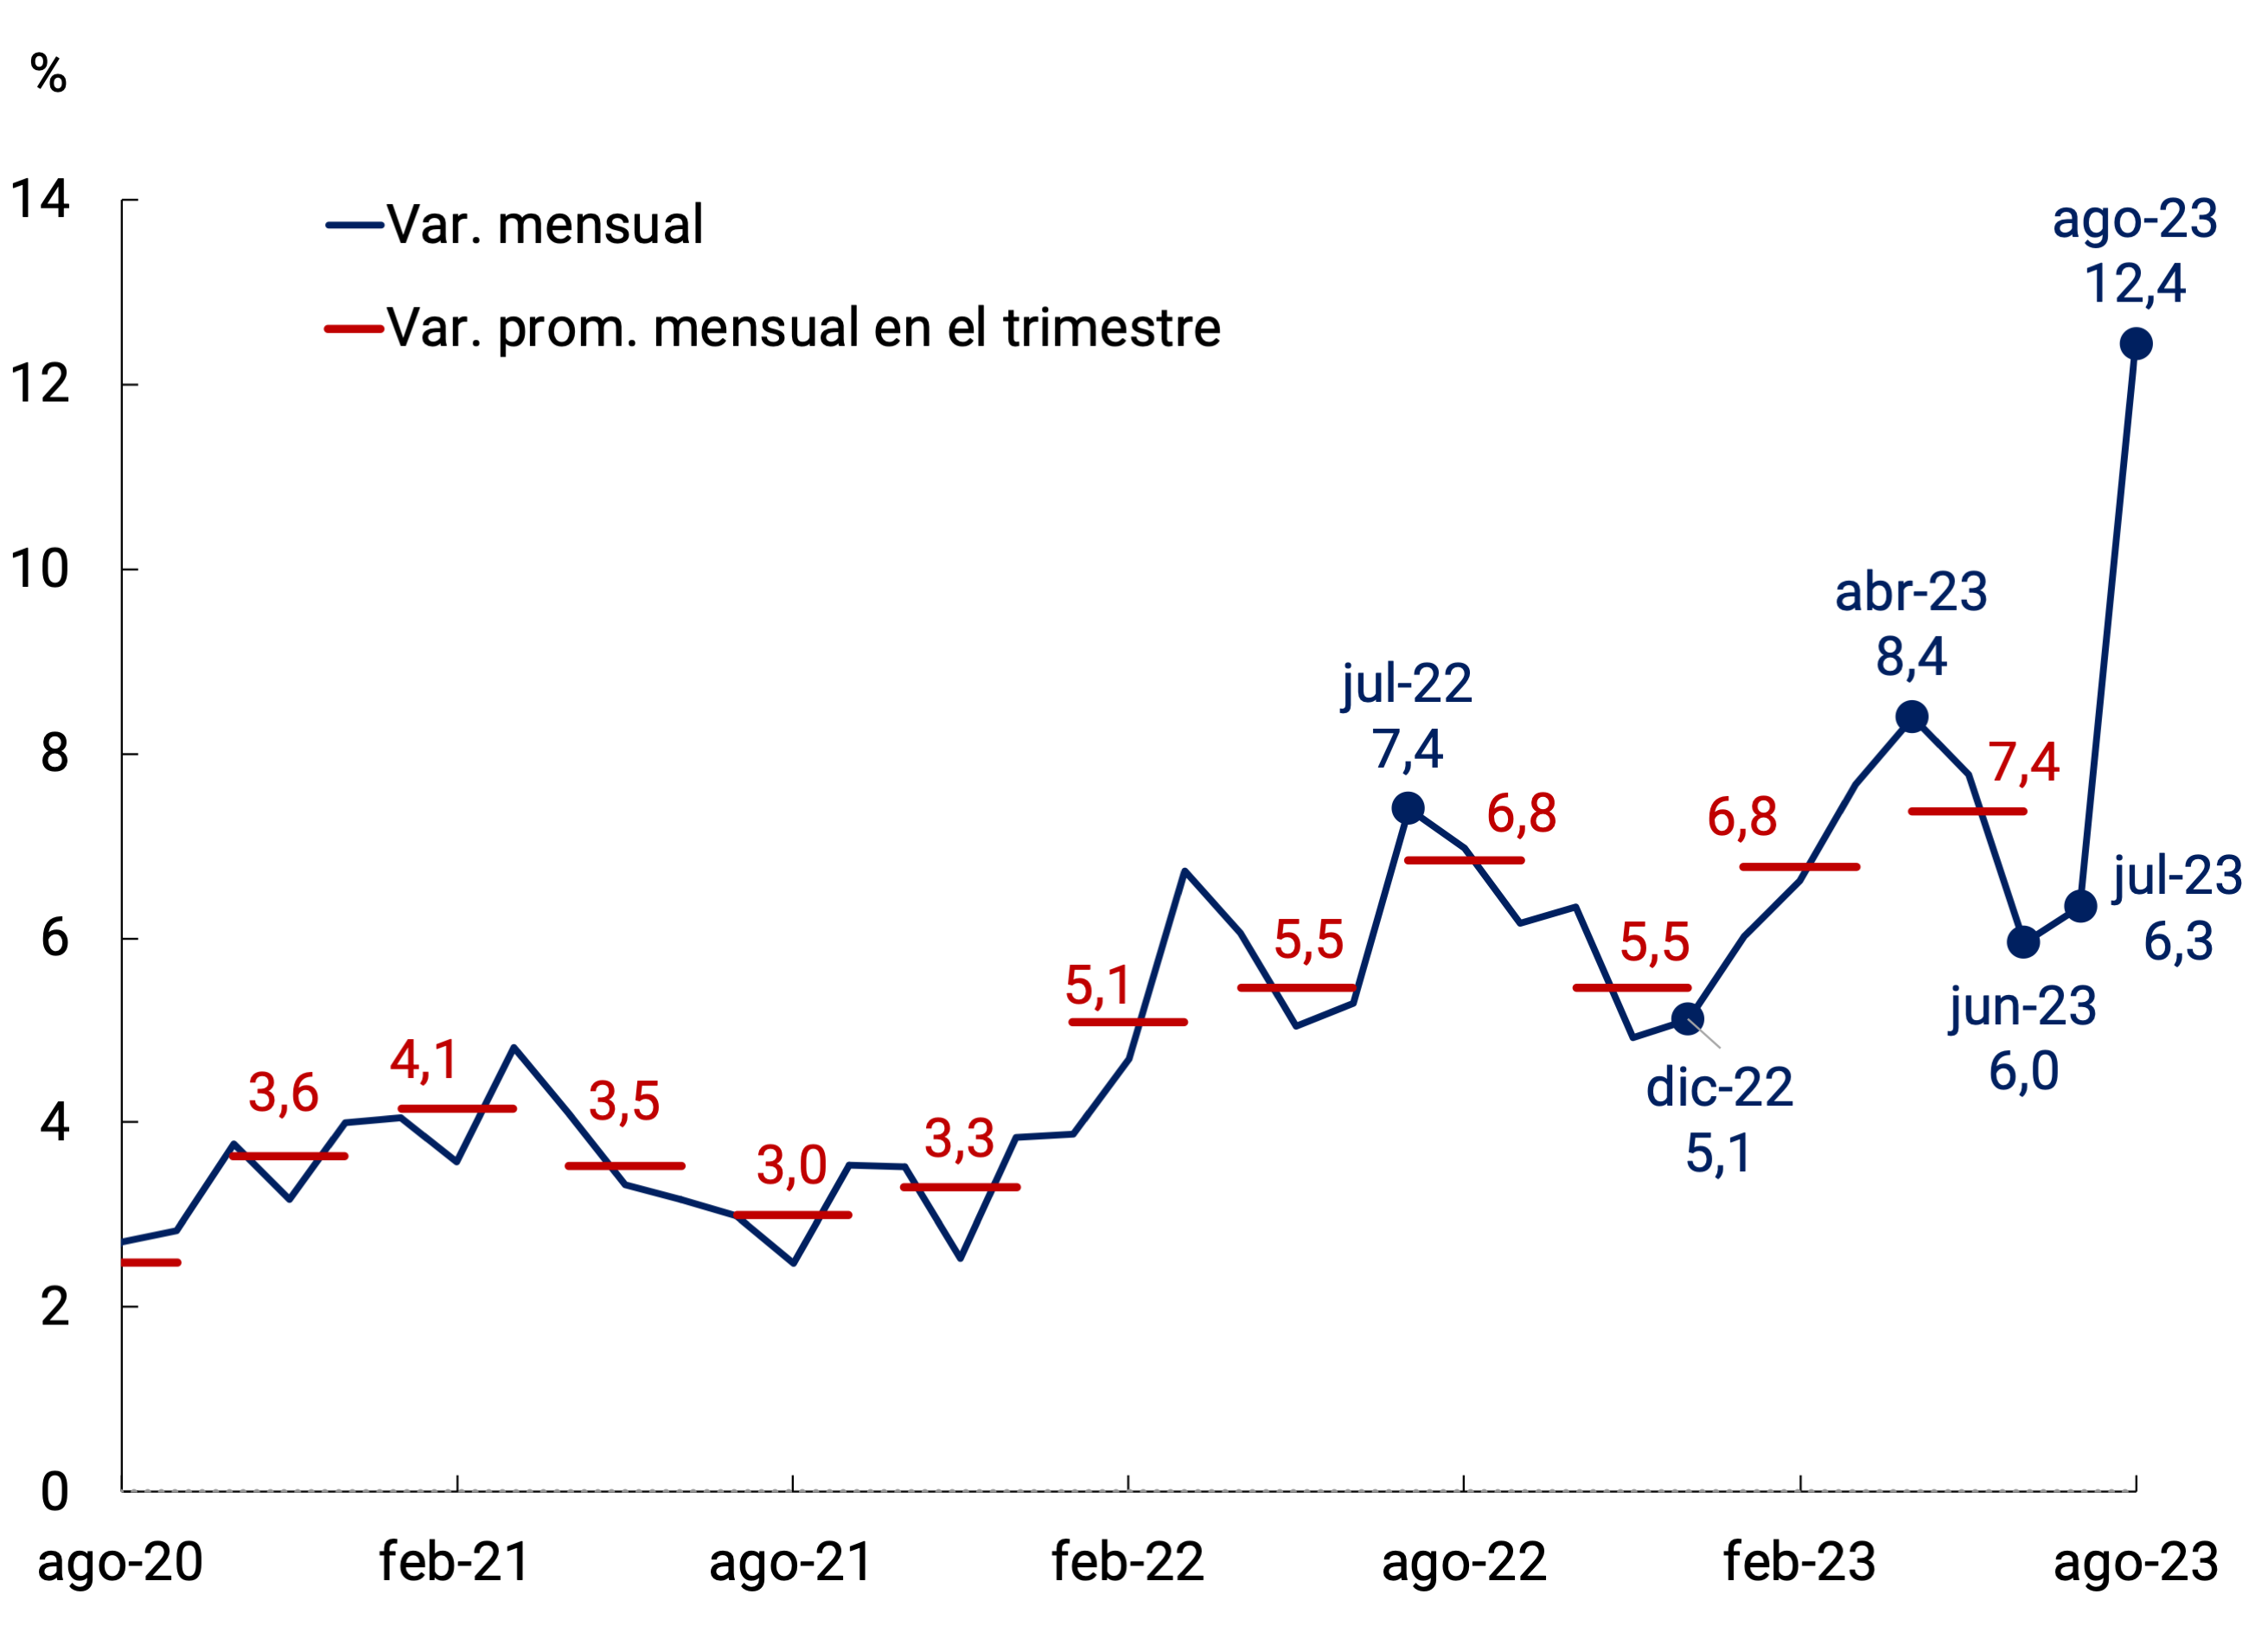
Level
Source: BCRA based on INDEC data.
The Core (13.8%, +7.3 p.p. compared to July) and Seasonal (14.8%, +5.5 p.p.) categories were the ones that showed the greatest accelerations in August, while the Regulated category increased its pace, although to a lesser extent (8.3%, +1.6 p.p.). Core inflation excluding Meat and derivatives – which could be considered a more structural measure of core inflation – was 12.2% monthly (+5.2 p.p.), this aggregate accounting for 7.4 p.p. of August’s monthly inflation (see Chart 6.2.).
Figure 6.2 | CPI. Main categories
Contributions in p.p. to the average monthly
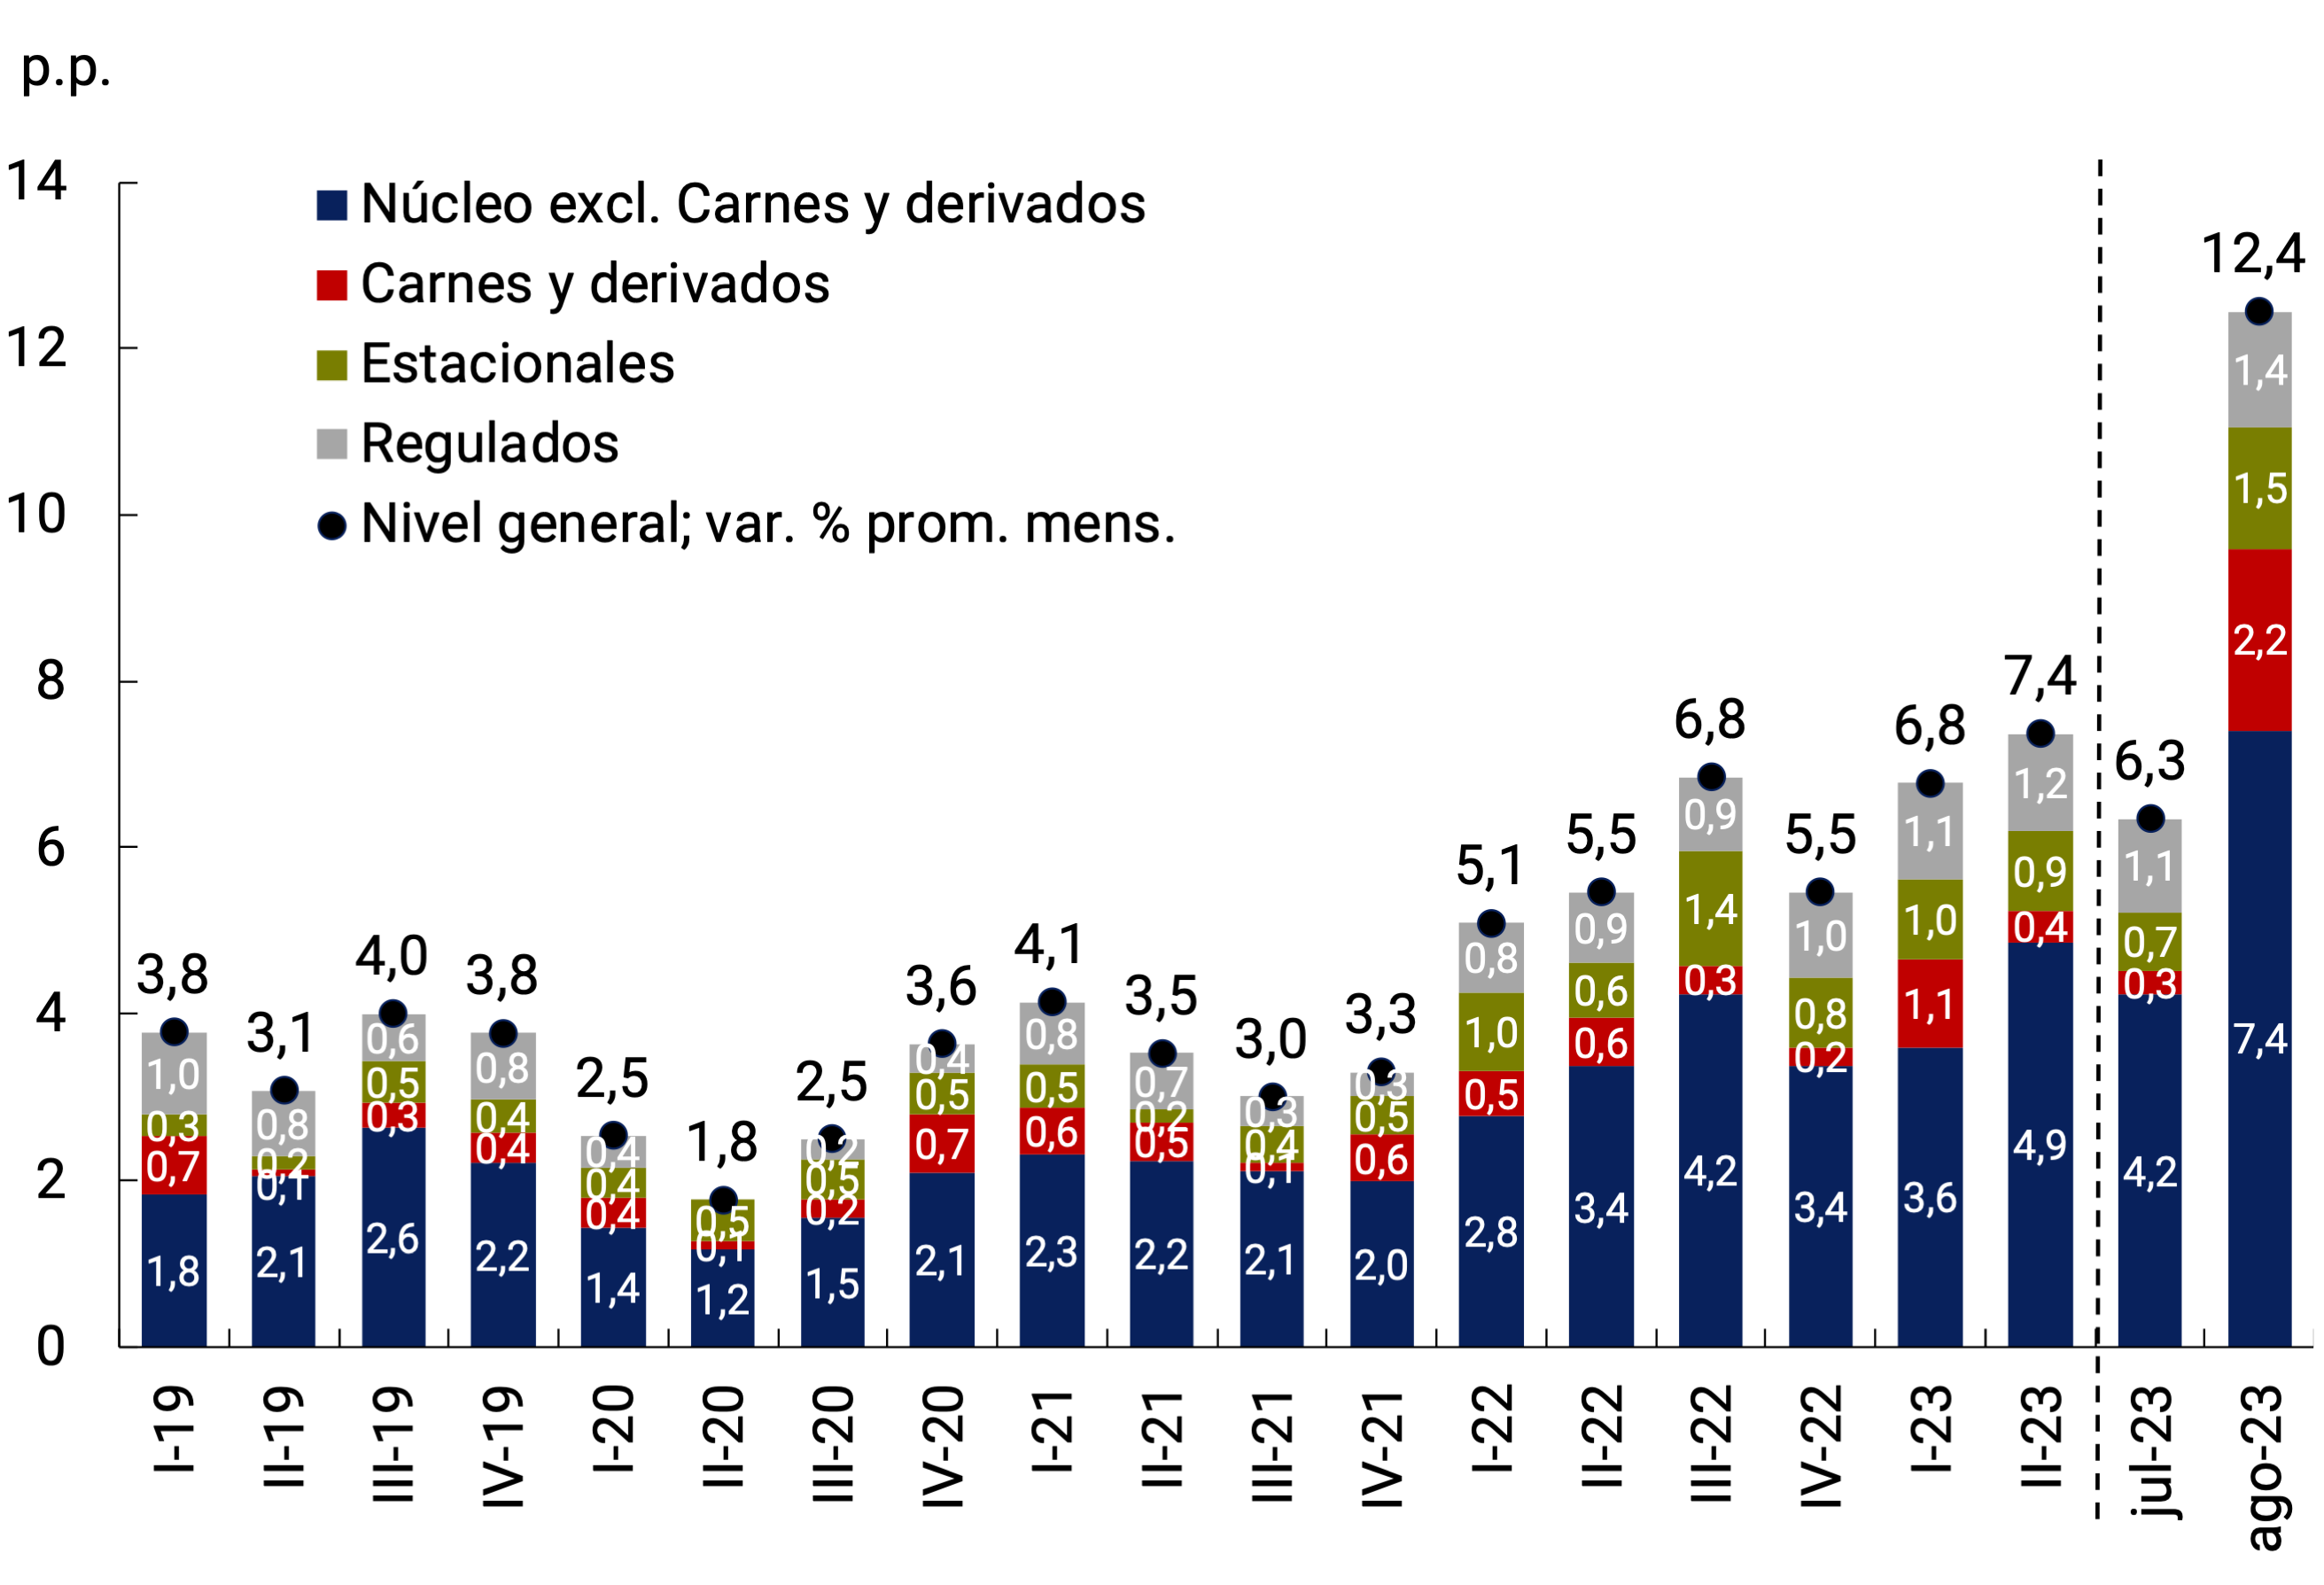
variation
Source: BCRA based on INDEC data.
Figure 6.3 | Nominal exchange rate, CPI Goods and CPI Services. Notable
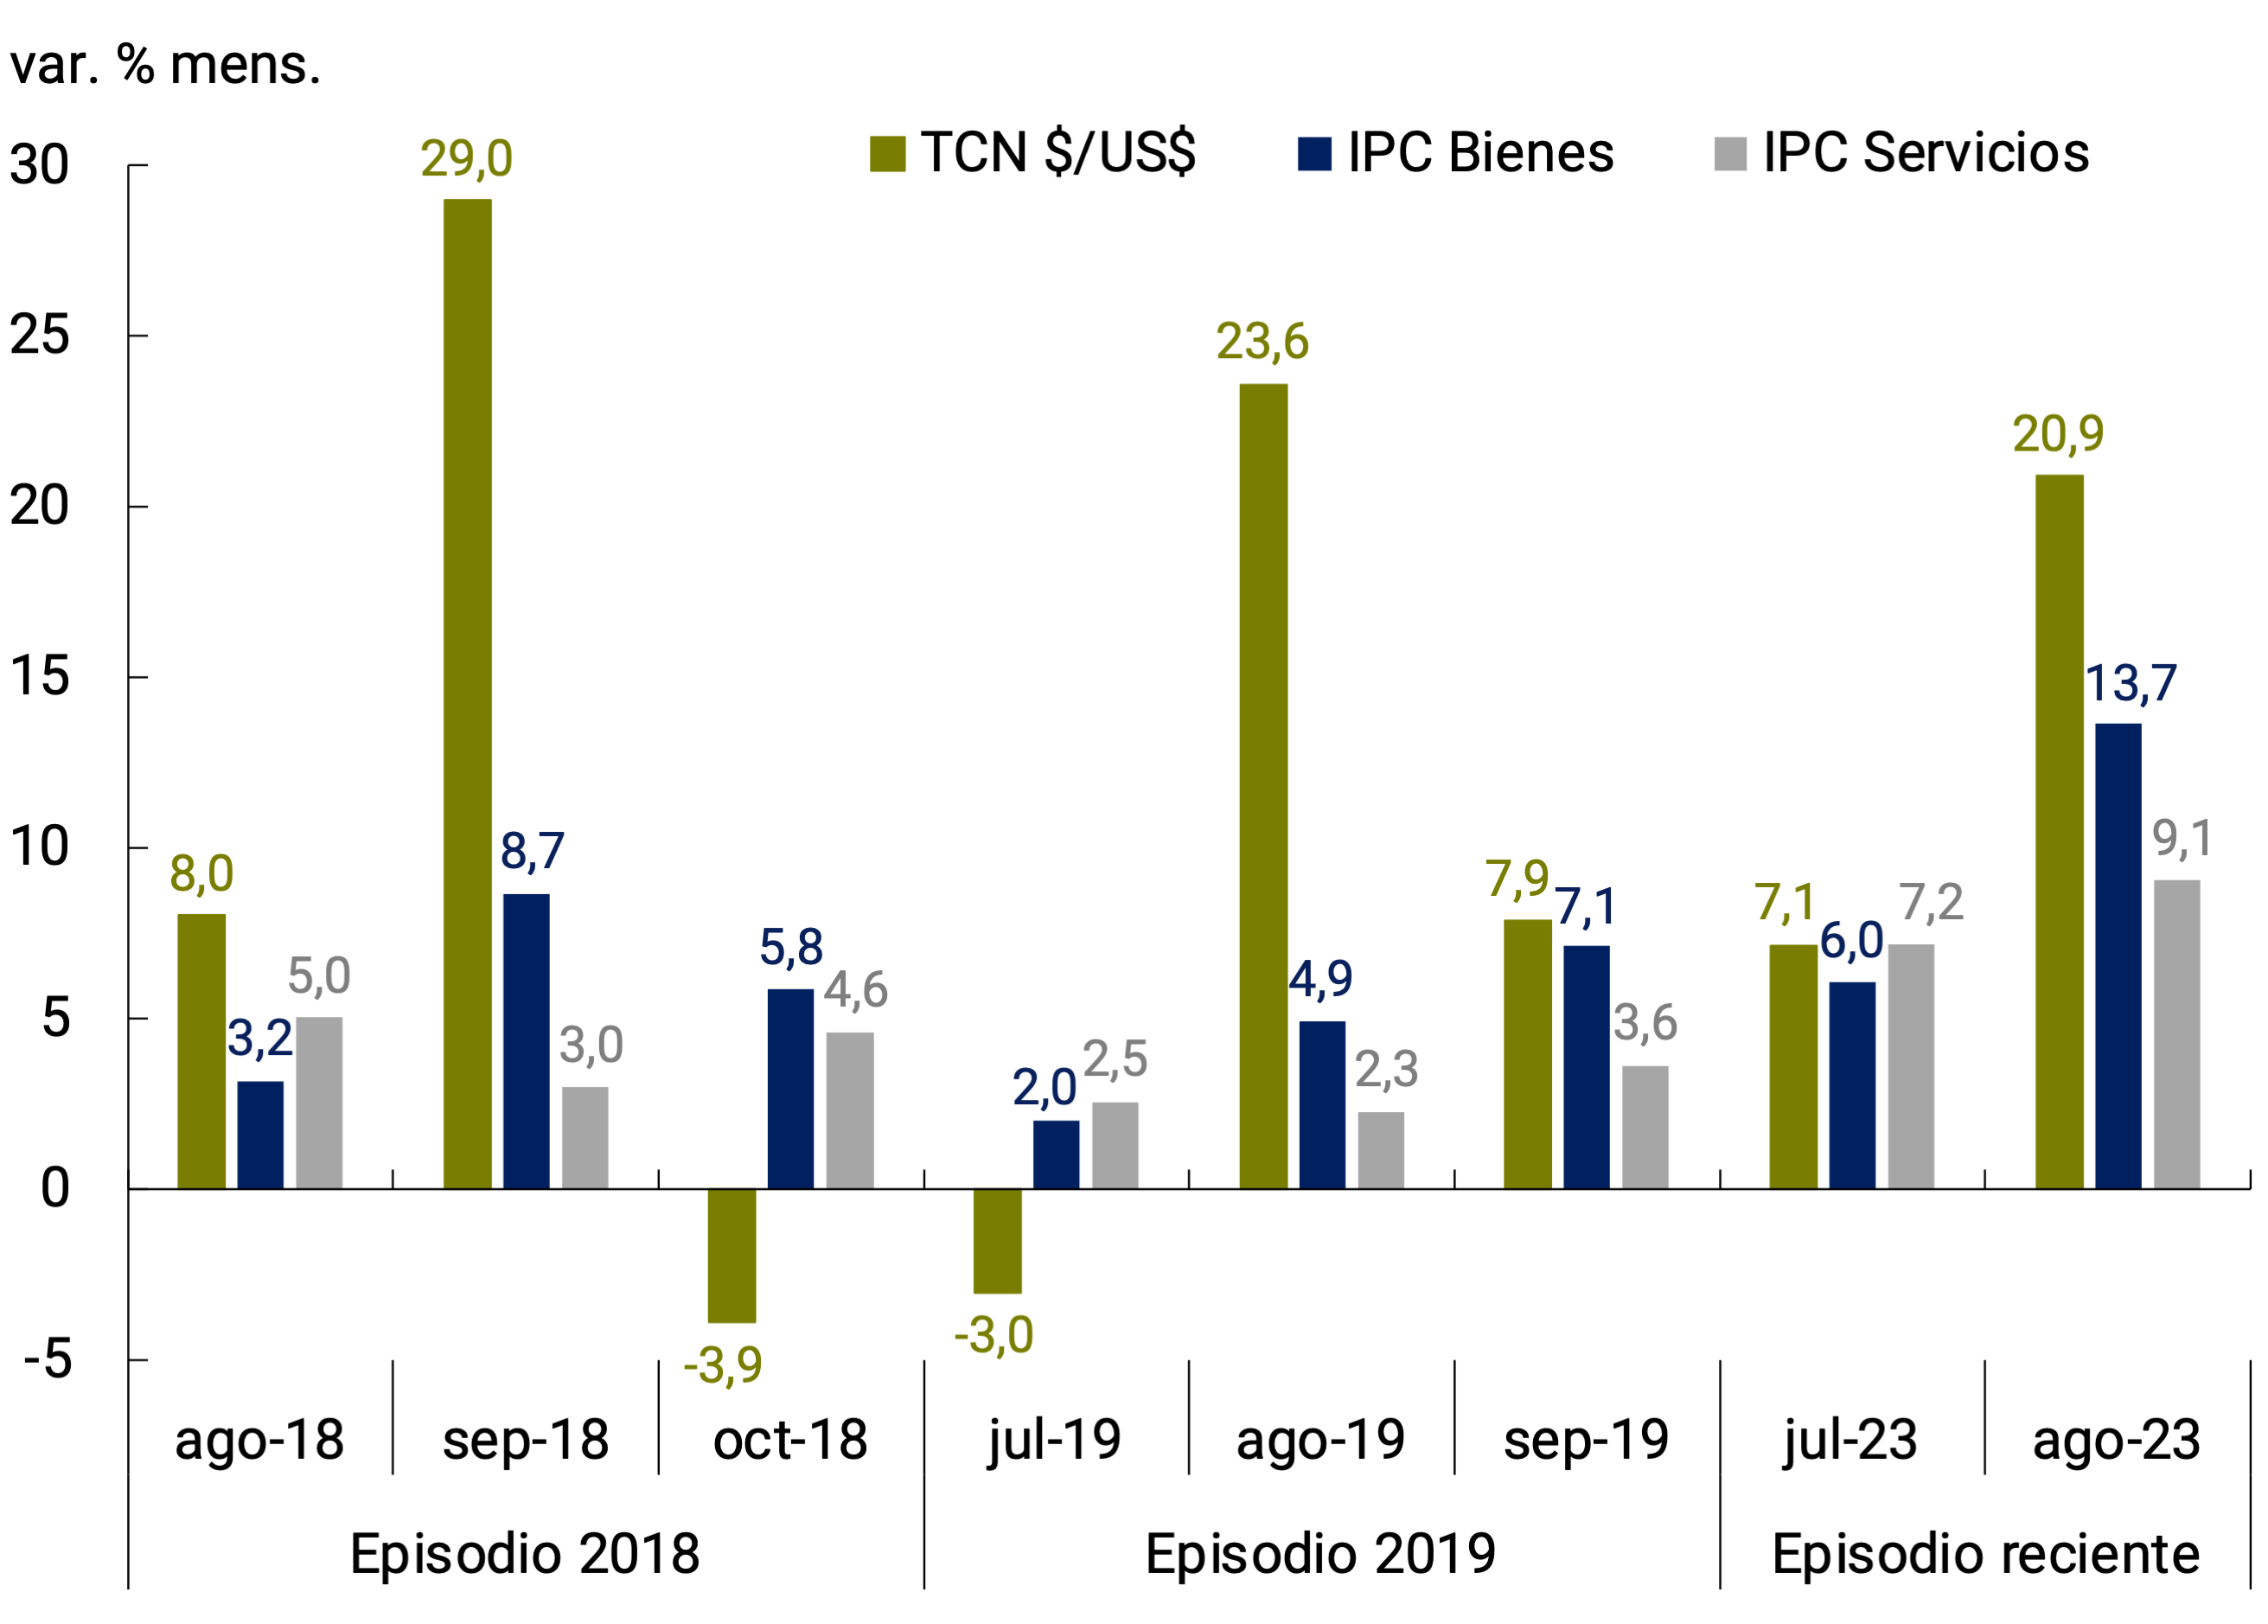
episodes
Source: BCRA based on data from INDEC and Com. A 3500.
The acceleration of the CPI in August was concentrated to a greater extent in goods, given their tradable nature, registering an average increase of 13.7% (+6.7 p.p. compared to July). Services also increased their rate of increase, although to a lesser extent (9.1%, +1.9 p.p.). The greater reaction of the prices of goods is typical of accelerations in the exchange rate, and usually occurs in the month of the devaluation and leaves a statistical carryover for the following month, something that was verified, for example, in the last episodes in 2018 and 2019 (see Figure 6.3). Therefore, the CPI for September is expected to once again register a higher rate of increase in goods than in services.
Among the goods in the CPI, the increase in the rate of increase in August was widely publicized, with a high incidence of the Food and non-alcoholic beverages division (15.6%, +9.8 p.p. compared to July). In the month, the increases verified in groups such as Medicinal Products and others (18.3%, +8.7 p.p.), Vehicle Acquisition (11.1%, +6.6 p.p.), Fuels (11.1%, +4.4 p.p.) and Clothing and footwear (9.1%, +6.1 p.p.) were also noteworthy. On the other hand, some groupings of the CPI also accelerated significantly, including goods and services, including Household Equipment and Maintenance (14.1%, +7.9 p.p.), which is largely made up of totally or partially imported items.
With regard specifically to the Food and non-alcoholic beverages (AyB) division, the acceleration was mainly concentrated in what we call fresh foods (meats, vegetables and fruits), which increased 21.6% month-on-month in August, after a relatively limited increase in July (3.9%). Packaged foods and beverages also accelerated (10.1%, +2.6 p.p.), although to a lesser extent compared to fresh foods (see Figure 6.4).
Figure 6.4 | Monthly evolution of the prices of fresh and packaged
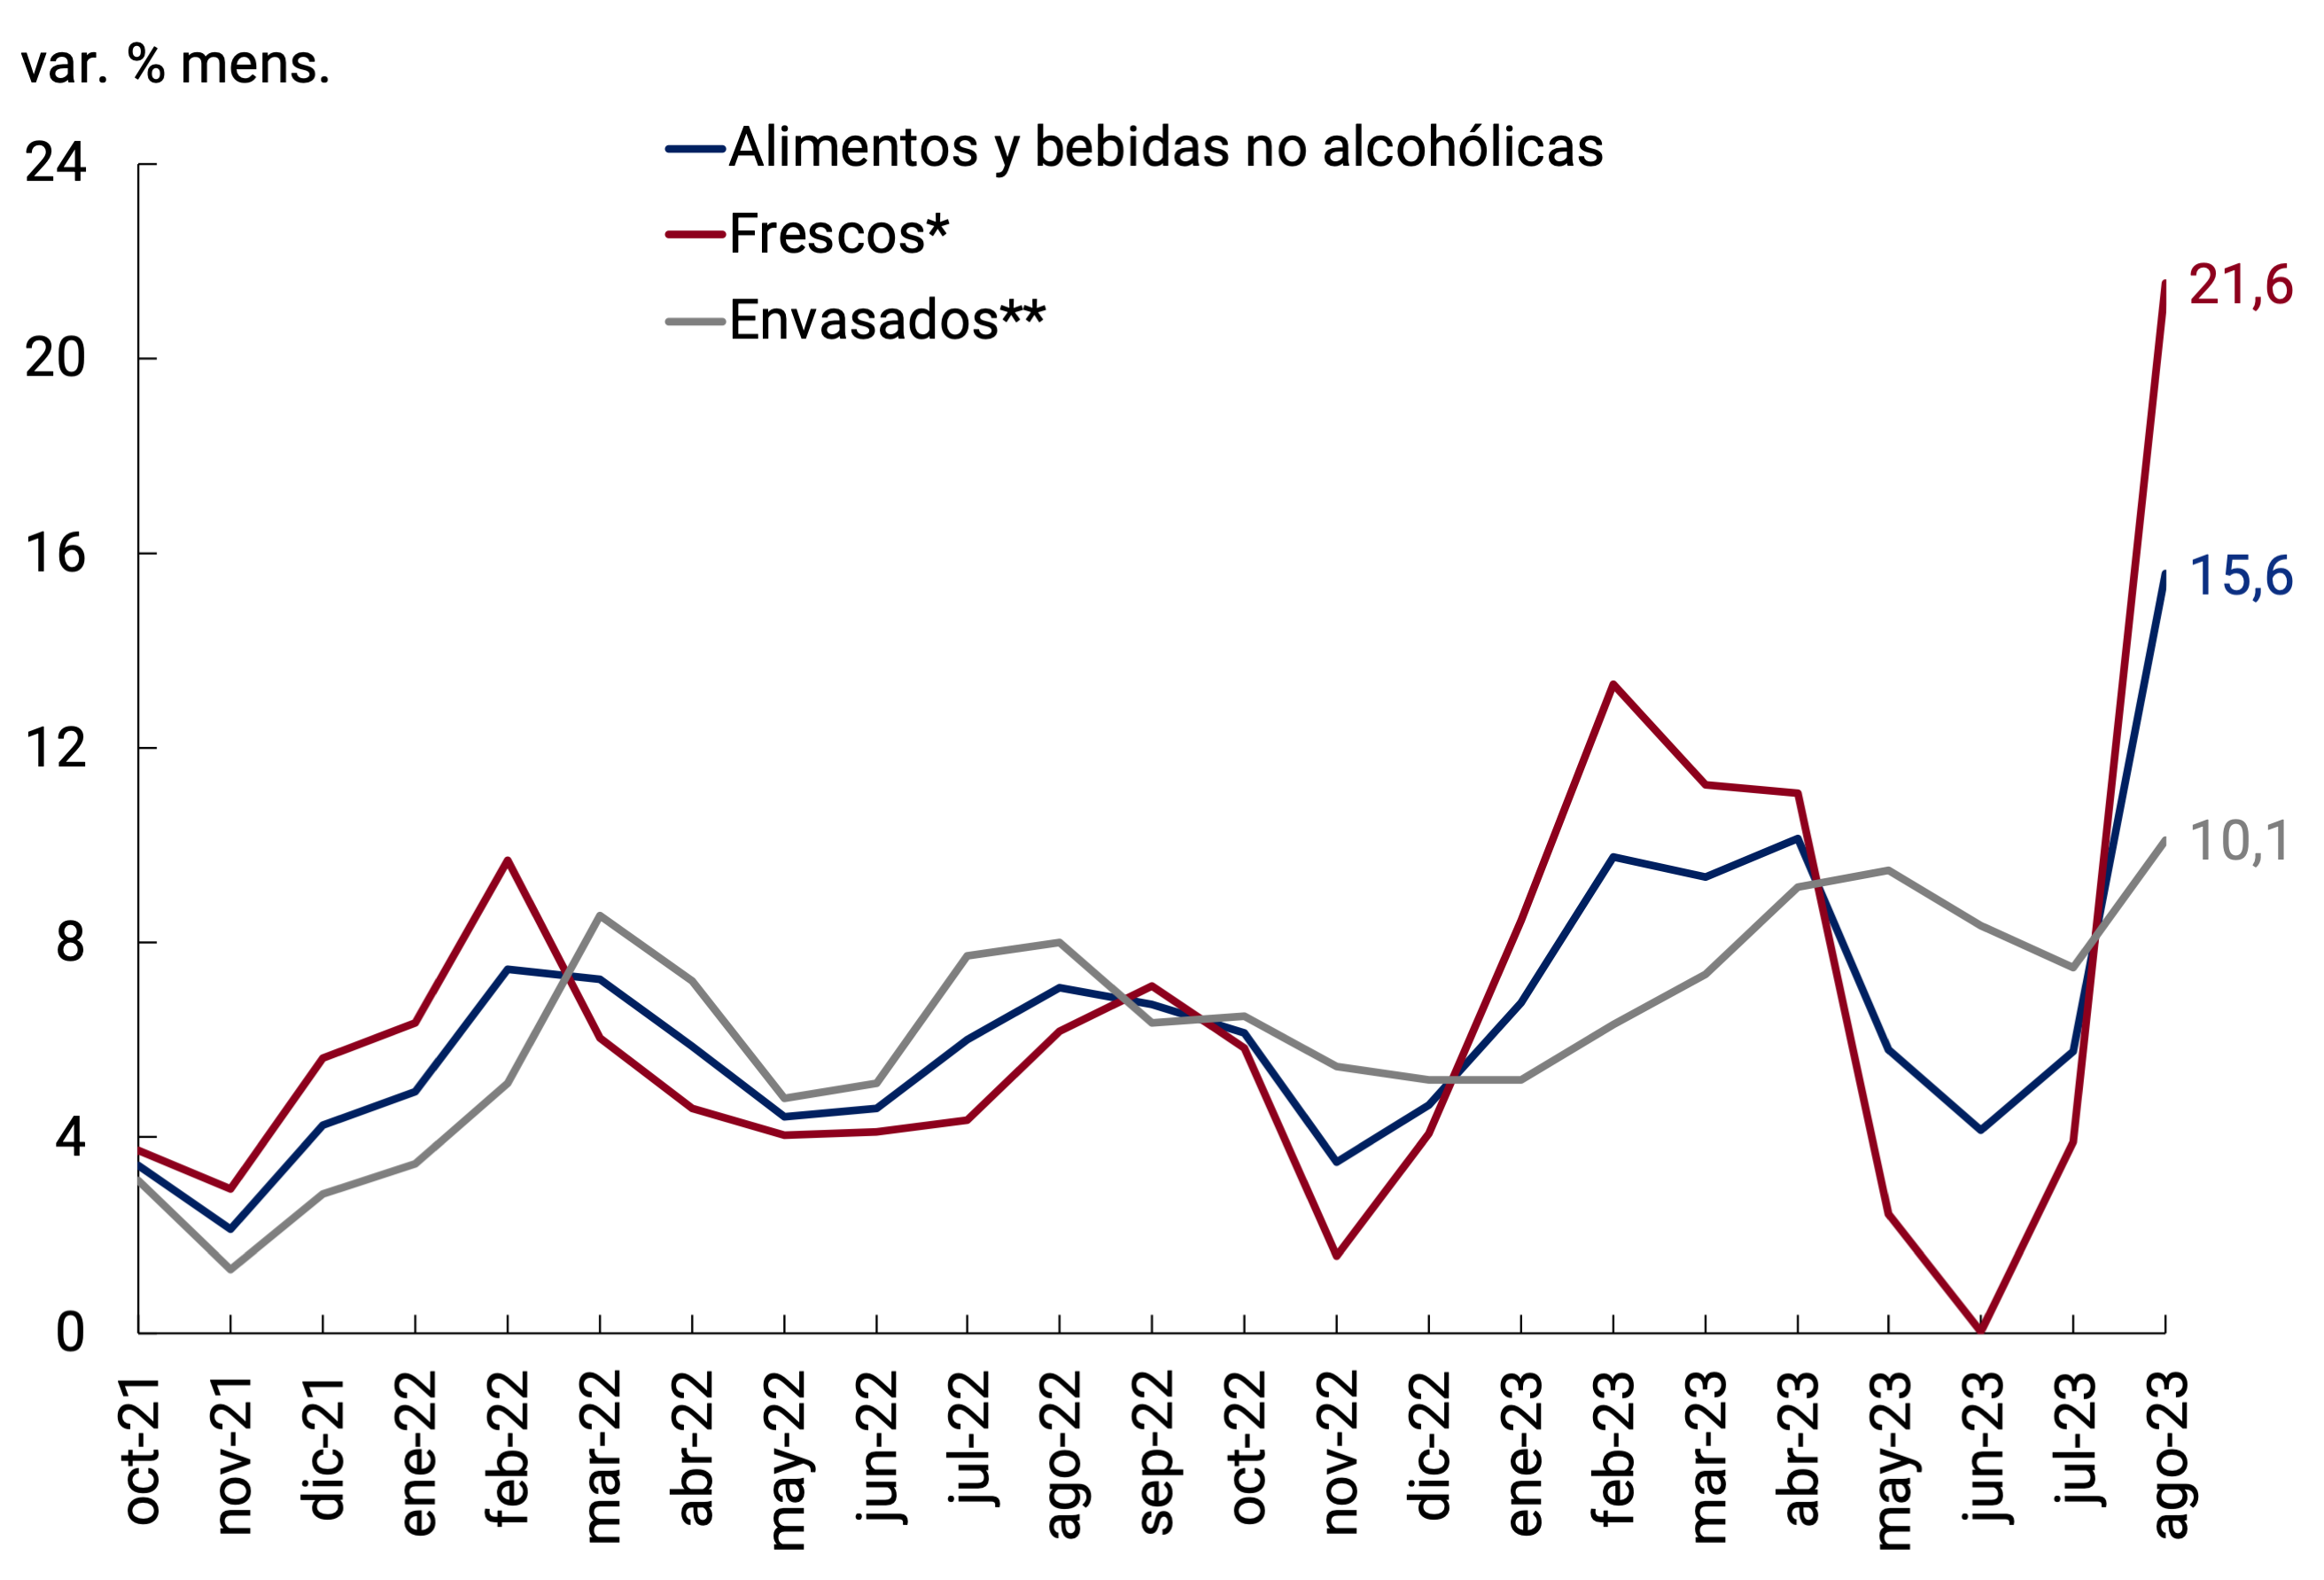
foods
Source: BCRA based on INDEC data.
Among fresh foods, the Meat and derivatives grouped – the one with the highest weighting in the household consumption basket – was the one that showed the most marked acceleration and the one that had the greatest impact on the monthly variation of the CPI in August. In the month, this group averaged an increase of 24.6% after limited increases in the previous three months (average of 2.0% per month). In addition to the lag in relative prices, at least two factors can be identified that explained the recent acceleration. Since the beginning of August, wholesale, and then retail, meat prices have reflected the increase in corn prices – the main feed input – as a result of its inclusion in the fourth edition of the Export Increase Program (PIE). Subsequently, in the second half of the month, prices reacted quickly to the recalibration of the official exchange rate. In fact, the prices of live cattle averaged a monthly increase of 44.5% in August according to the INMAG (Steer Index of the Agricultural and Livestock Market). This significant increase was gradually transferred to retail prices, impacting the CPI for August and left a high statistical drag for September, the month in which the Meat and Derivatives group would again register a rise of around 20%. The weekly falls in cattle prices during September allow us to expect, in the absence of new shocks, a marked slowdown in meat at the retail level in the CPI for October, which would help to contain the rise in the General Level of the index (see Figure 6.5).
Figure 6.5 | Agricultural and Livestock Market Steer Index and CPI Meat and derivatives
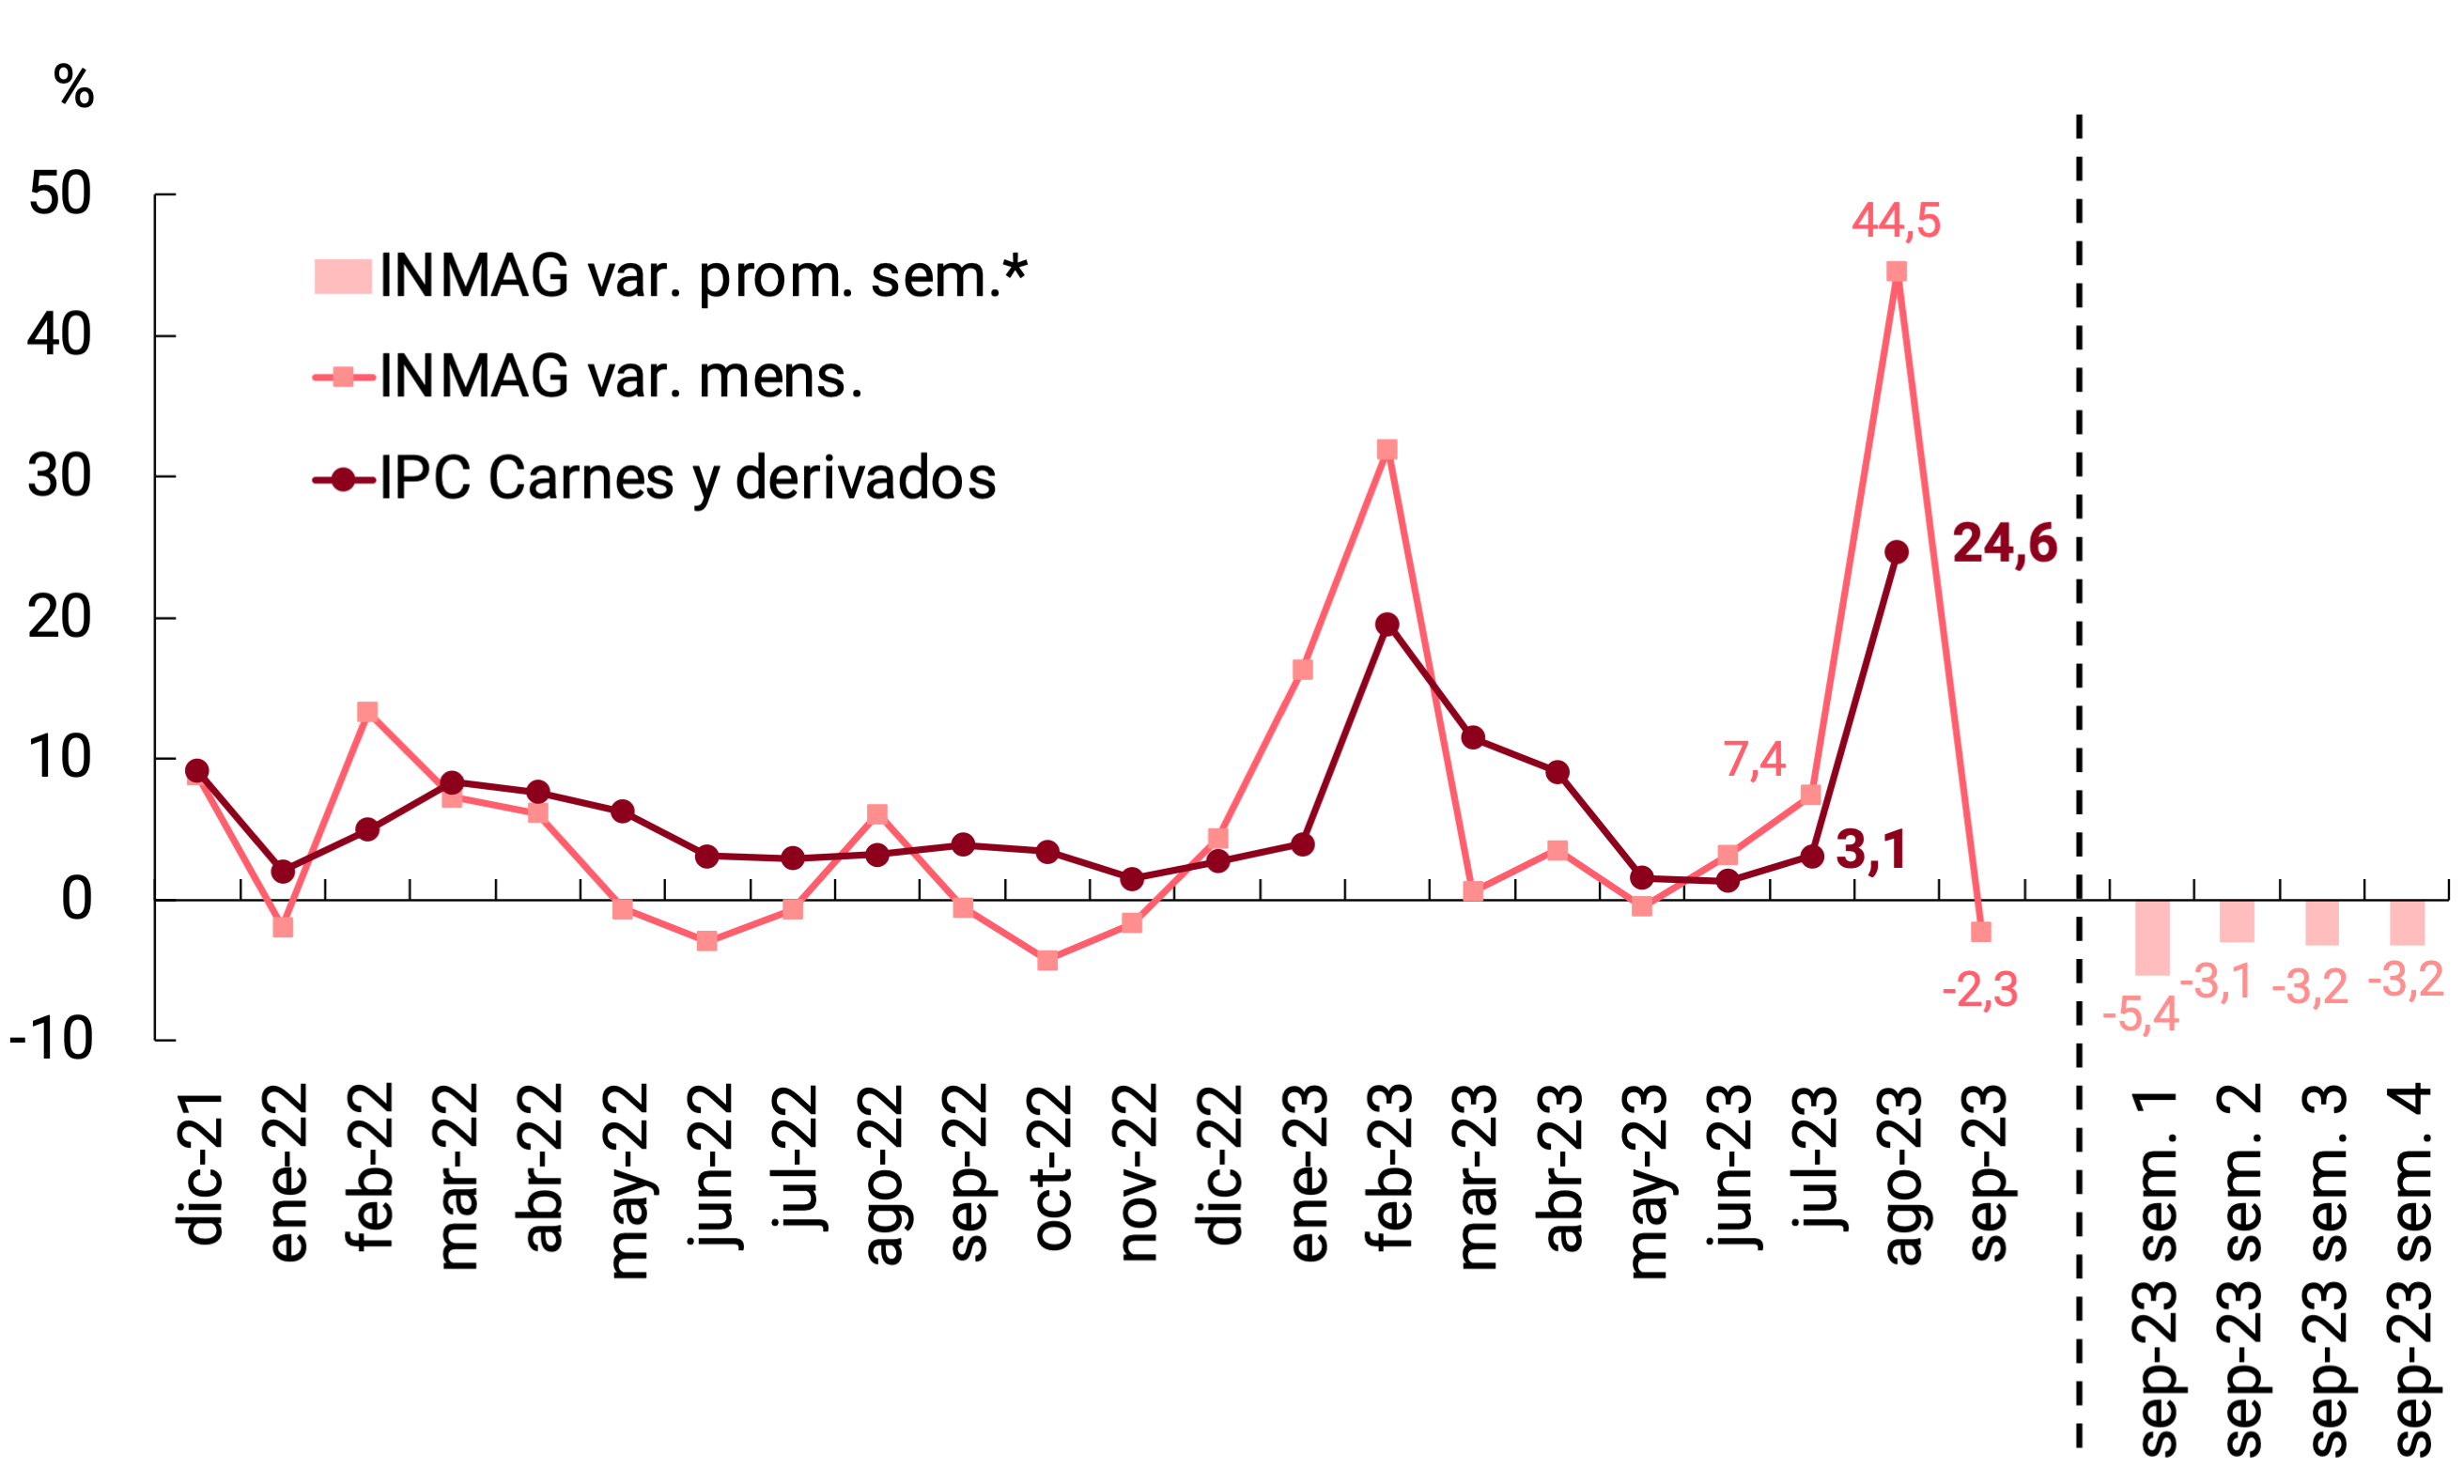
*Week 1 runs from the 1st to the 7th of each month; week 2, from the 8th to the 15th of each month; week 3, from the 16th to the 23rd of each month and the fourth week, from the 24th to the end of the month.
Source: BCRA based on data from INDEC and the Agricultural and Livestock Market.
For its part, the Vegetables, tubers and legumes grouping also accounted for a significant proportion of the higher rate of increase in fresh food, registering a monthly increase of 18.2% in August (+12.6 p.p. compared to July). Finally, fruits also accelerated in the month (11.2%, +6.3 p.p.), although their incidence was lower due to their relatively low weighting in the CPI.
Regarding the evolution of packaged foods, in August the increases of more than 10% were highlighted in the grouped Bread and cereals (12.2%) and Sugar, sweets and others (11.0%). Dairy products and eggs (8.6%) and Oils and fats (8.1%) also accelerated in the month, but showed the smallest increases among packaged products. Among non-alcoholic beverages (9.2%), there was a significant increase in the prices of the infusions that make up the grouping of coffee, tea, yerba mate and cocoa (12.2%), explained by the imported nature of part of the products that make it up (see Figure 6.6).
In response to the significant rise in food prices, the National Government launched the “Buy without VAT” program, which will benefit a wide range of the population (see Chapter 5. Public finances). Although this policy contemplates the refund of up to $18,000 per month per beneficiary of the Value Added Tax (VAT) that they paid at the time of making purchases, especially food, this will not be reflected – according to the corresponding methodology – in the measurement of the CPI or in the Basic Food Basket or the Total Food Basket (CBA-CBT).
Figure 6.6 | Evolution of the prices of food and non-alcoholic
beverages Contributions to the average monthly
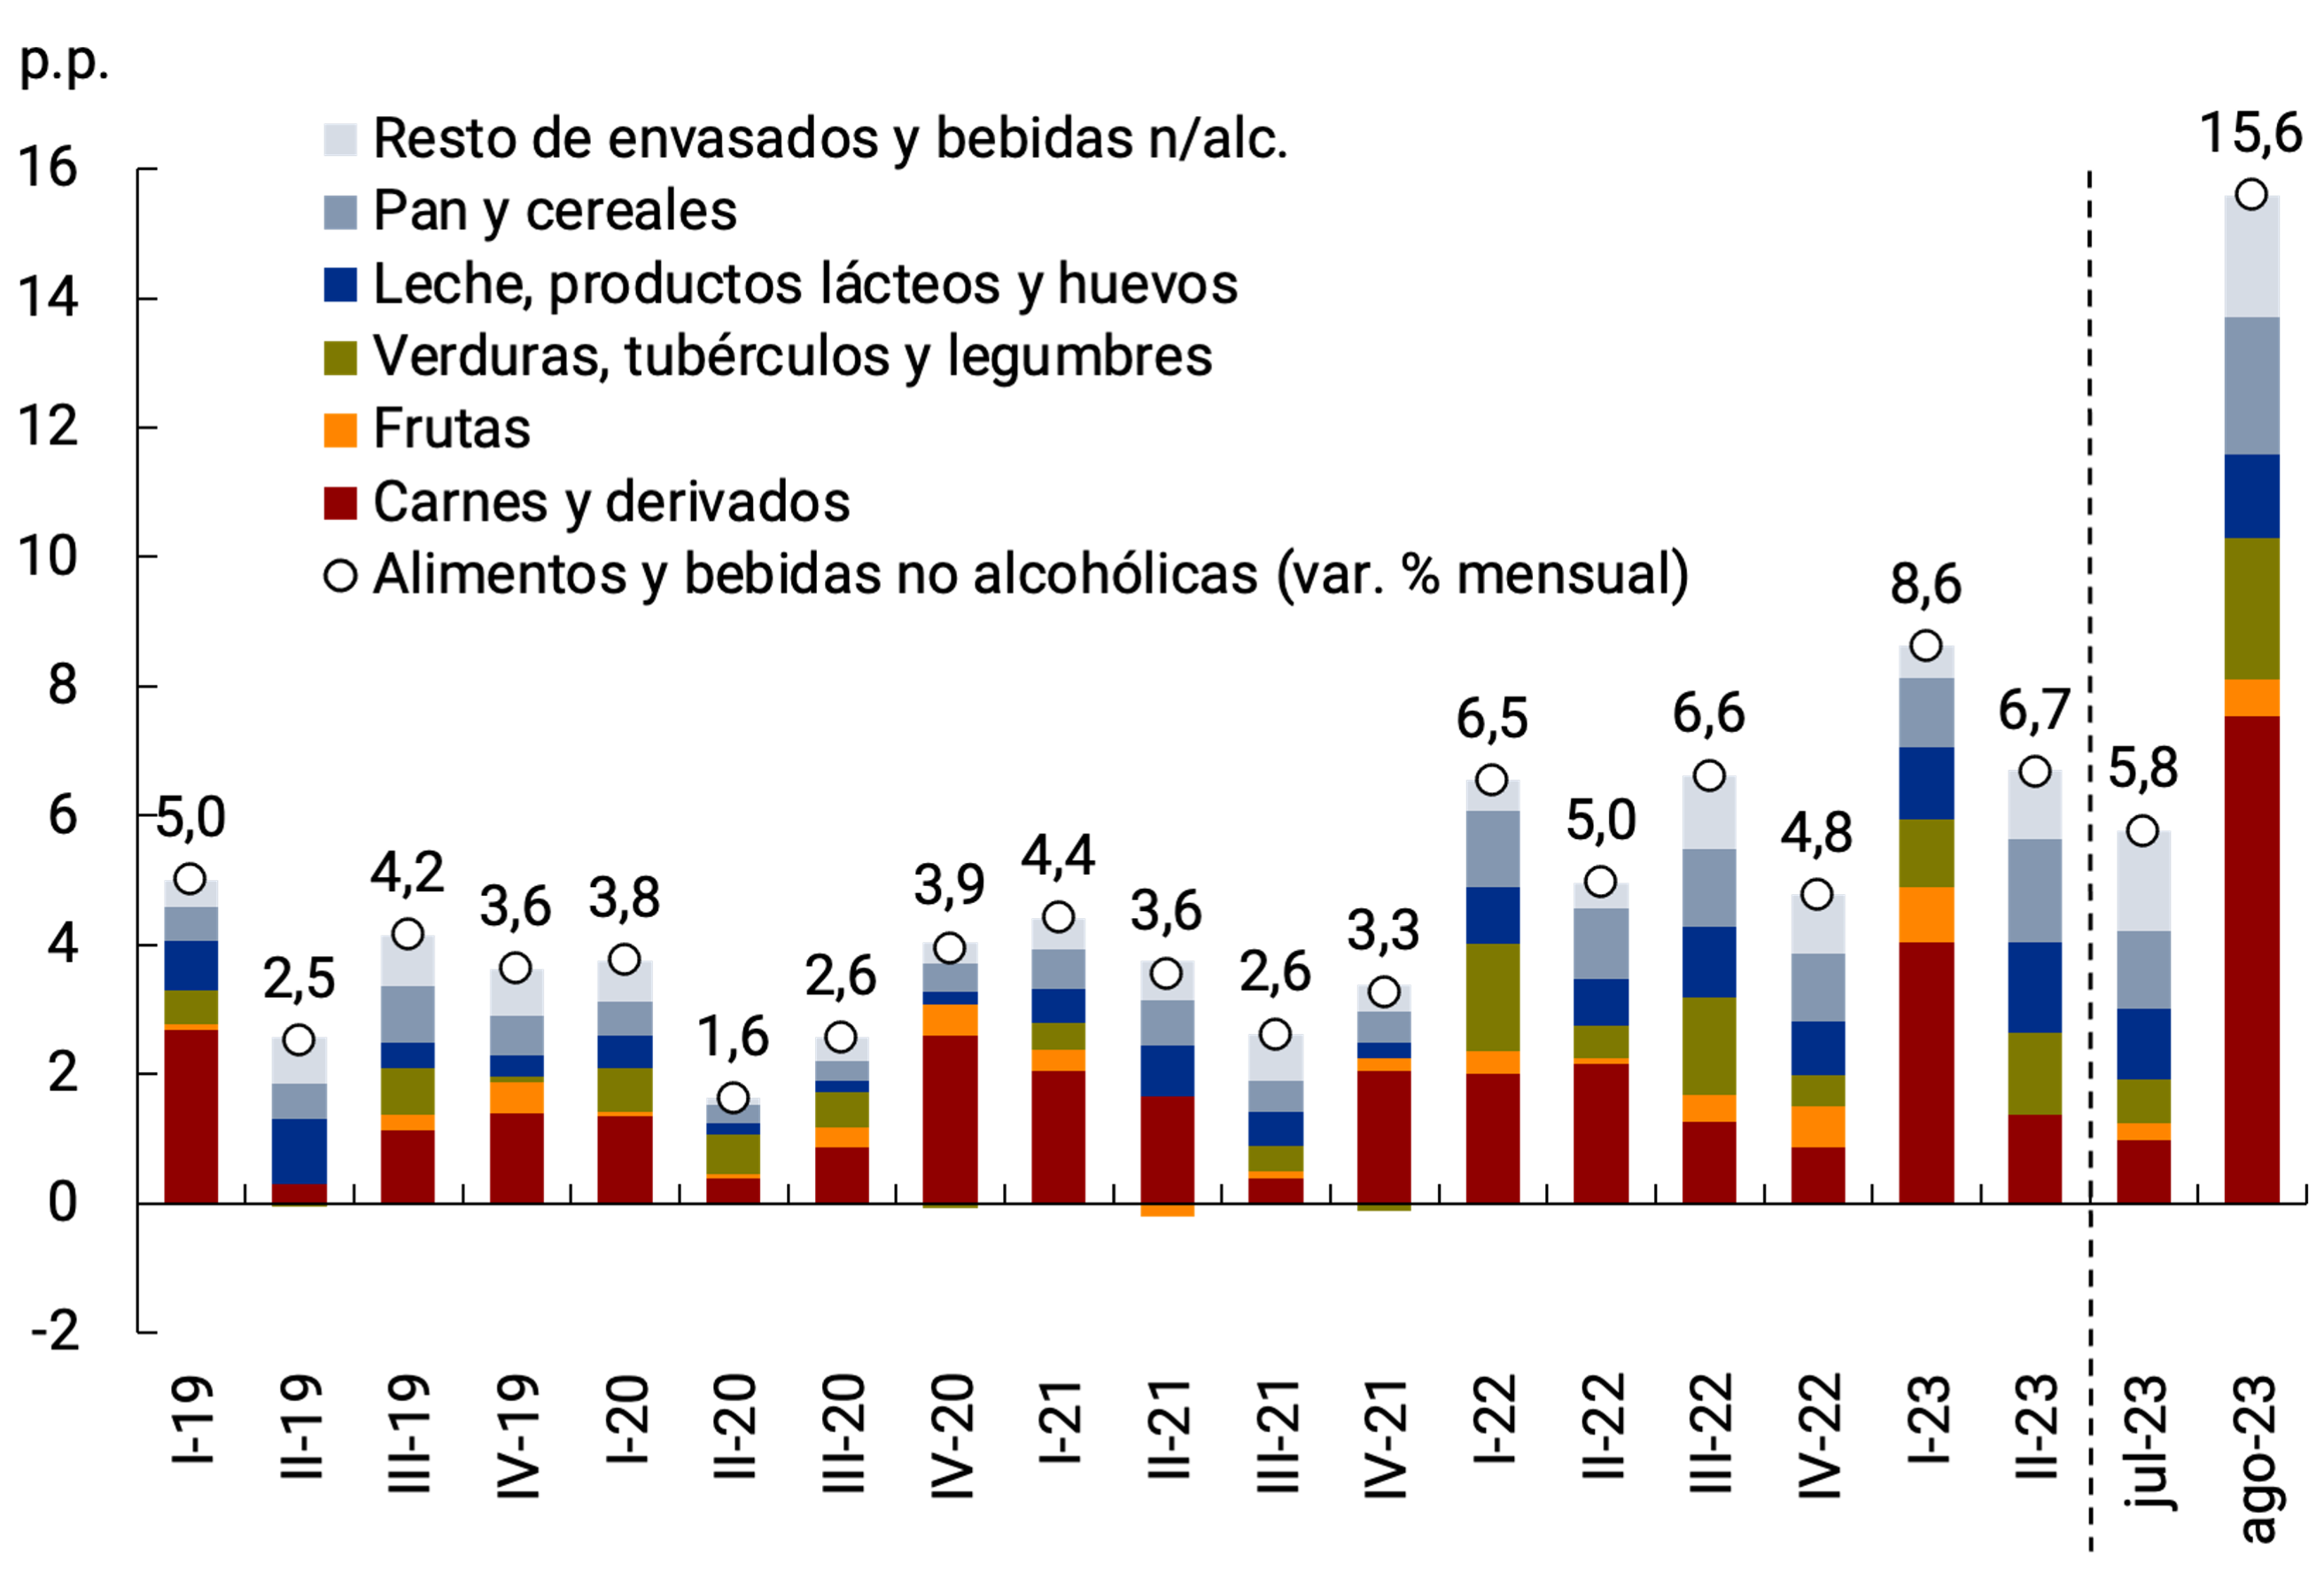
variation
Source: BCRA based on INDEC data.
Regarding the CPI groupings made up of services, there was a very heterogeneous evolution in August; regulated companies registered relatively limited increases while non-regulated companies showed a very significant average increase, accelerating compared to July.
Among regulated services, public services rose 4.4% in August, a slightly higher rate than the previous month (3.3%), although significantly lower than in the second quarter (10.8%). The moderation of public services is mainly explained by the evolution of the Electricity, gas and other fuels group, since after 6 months in which it averaged increases of 10.6% monthly, it slowed down to 1.6% in July and 3.3% in August. For its part, the Public Transport group increased 5.8% in August, a similar pace to that of July (5.6%). It should be noted that since March the fare tables of the train and bus service in the AMBA were updated by the general level of inflation of the previous two months55, an adjustment that was suspended since September56.
Private regulated services slowed down in August and rose 7.0% month-on-month (-1.9 p.p. compared to July). The lower rate of increase was explained exclusively by the evolution of telephone and internet services, which had increased 12.0% in July and in August increased only 3.9% monthly. The grouped Prepaid Expenditures maintained a similar pace to that of July (8.6%, +0.1 p.p.), adjusting according to the monthly update formula in force57 until August, based on the evolution of health costs. For the period September/November, a suspension of increases based on the income of the family group and other demonstrable requirementswas ordered 58. For its part, the Education grouping accelerated in August to 8.7% monthly (+2.5 p.p. compared to July), mainly as a result of the higher authorized increases in the fees of initial, primary and secondary level establishments, largely accompanying the evolution of teachers’ salaries.
Finally, non-regulated services significantly increased their rate of increase in August to 11.1% monthly (+3.4 p.p. compared to July), an evolution mainly explained by the increase in the Restaurants and meals away from home grouping (12.4%, +5.0 p.p.), directly affected by food prices. In the month there was also an increase in the rate of increase in housing rent and related expenses (7.5%, +2.2 p.p.), although its incidence was lower compared to other services. Finally, the groups most linked to tourism such as Recreational and Cultural Services (7.1%, -0.6 p.p.) and, especially, Hotels (9.1%, -11.1 p.p.) slowed down in August after the winter recess.
The outlook for services prices is partly linked to the evolution of nominal wages. In a context in which there is a shortening of contractual terms and an increase in the number of tranches of increases in agreements, a rapid reaction of nominal wages is expected to the recent increase in inflation that would have impacted real wages in August. In this sense, the National Government decreed59 that a fixed sum be granted in two tranches to salaried employees of the registered private sector and the national public seeking to quickly cushion this impact. The salary renegotiations that will be carried out during the last quarter will seek to finish recomposing the real income of salaried workers.
6.2. The year-on-year inflation rate reached 124.4%
After a slight drop in July (113.4%, -2.1 p.p. compared to June), the year-on-year inflation rate (y.o.y.) increased again in August reaching 124.4% y.o.y. At the level of its main categories, the evolution verified during 2022 continued, with seasonal goods and services showing the highest average rate (128.8% y.o.y.), although the marked increase in core year-on-year inflation (125.3%, +13.8 p.p. compared to July) reduced heterogeneity between categories. The year-on-year variation of the Regulated category also continued to increase and reached 116.6%, once again being the one with the lowest rate of increase. Using another relevant breakdown, it can be seen that in August Goods (125.5% YoY) showed a year-on-year increase higher than that of Services (120.8% YoY), a trend that had been temporarily interrupted in July after more than four consecutive years of deterioration in the relative prices of services (see Chart 6.7).
Figure 6.7 | Retail prices (CPI)
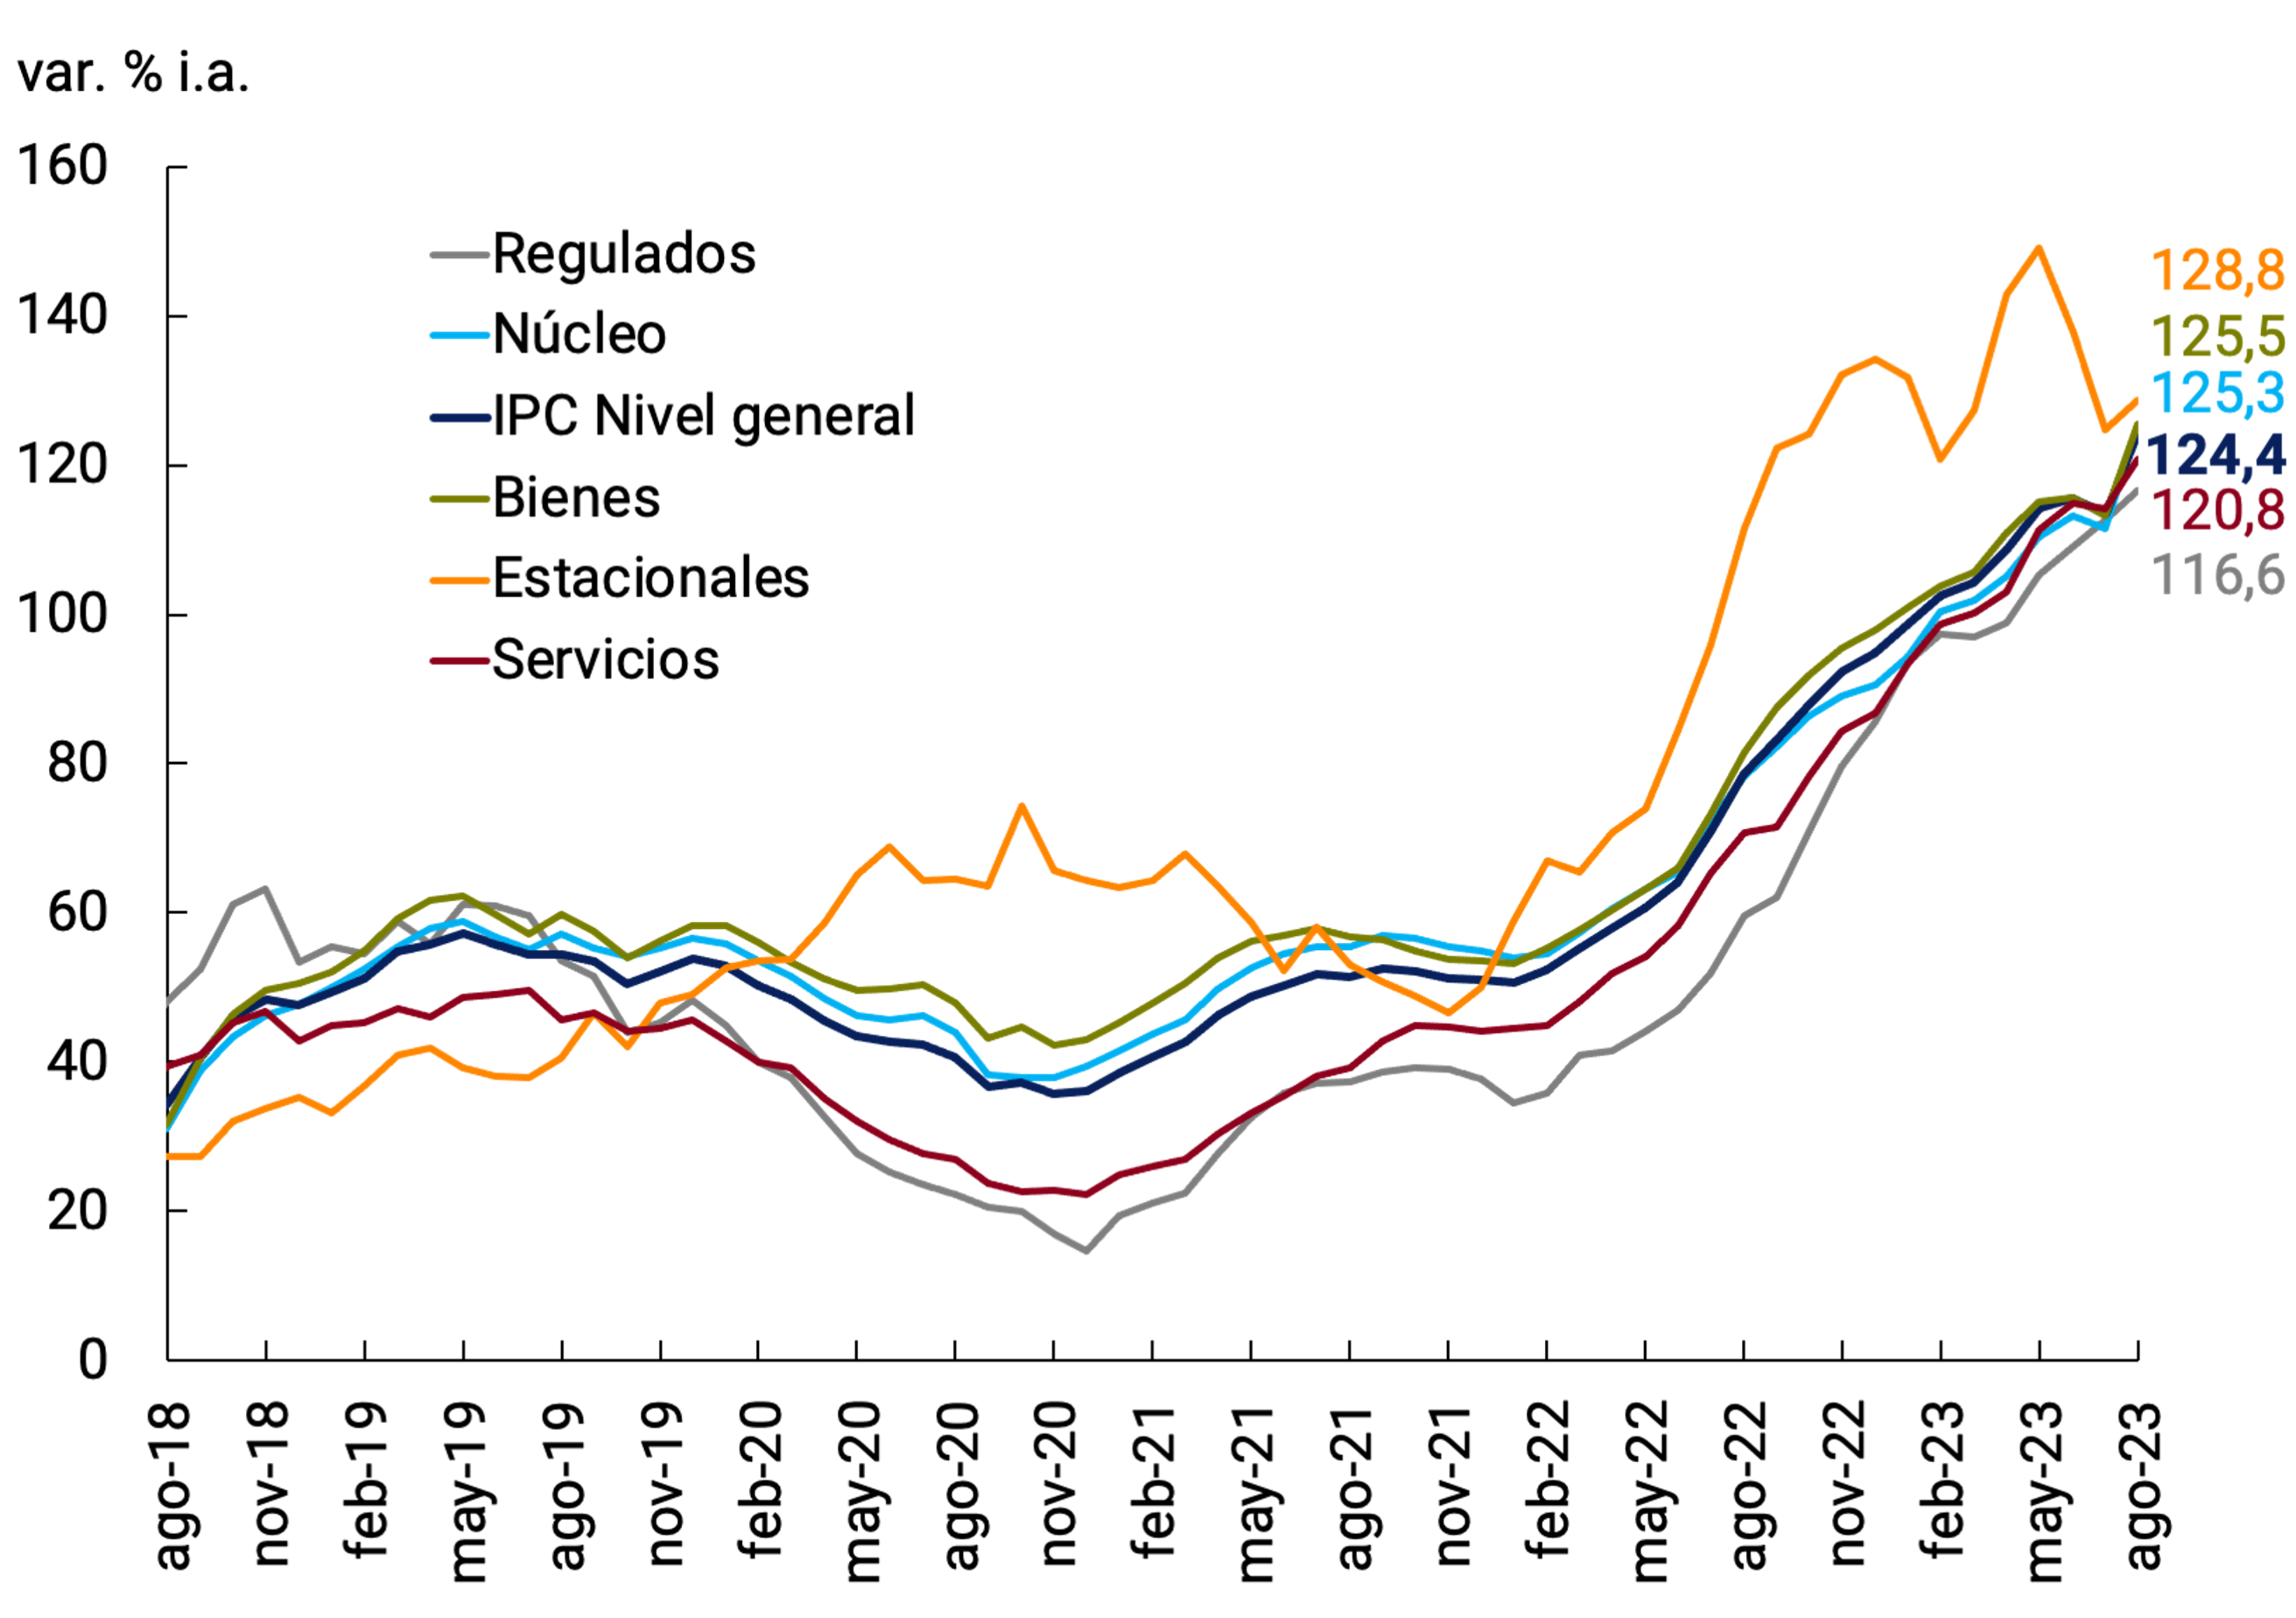
Source: BCRA based on INDEC data.
In this way, the heterogeneity between the year-on-year variations of the main openings of the CPI has been reduced in recent months. However, by analysing with a higher level of disaggregation, it is possible to detect differentiated evolutions among the CPI groupings (see Figure 6.8).
Figure 6.8 | Evolution of the CPI by selected
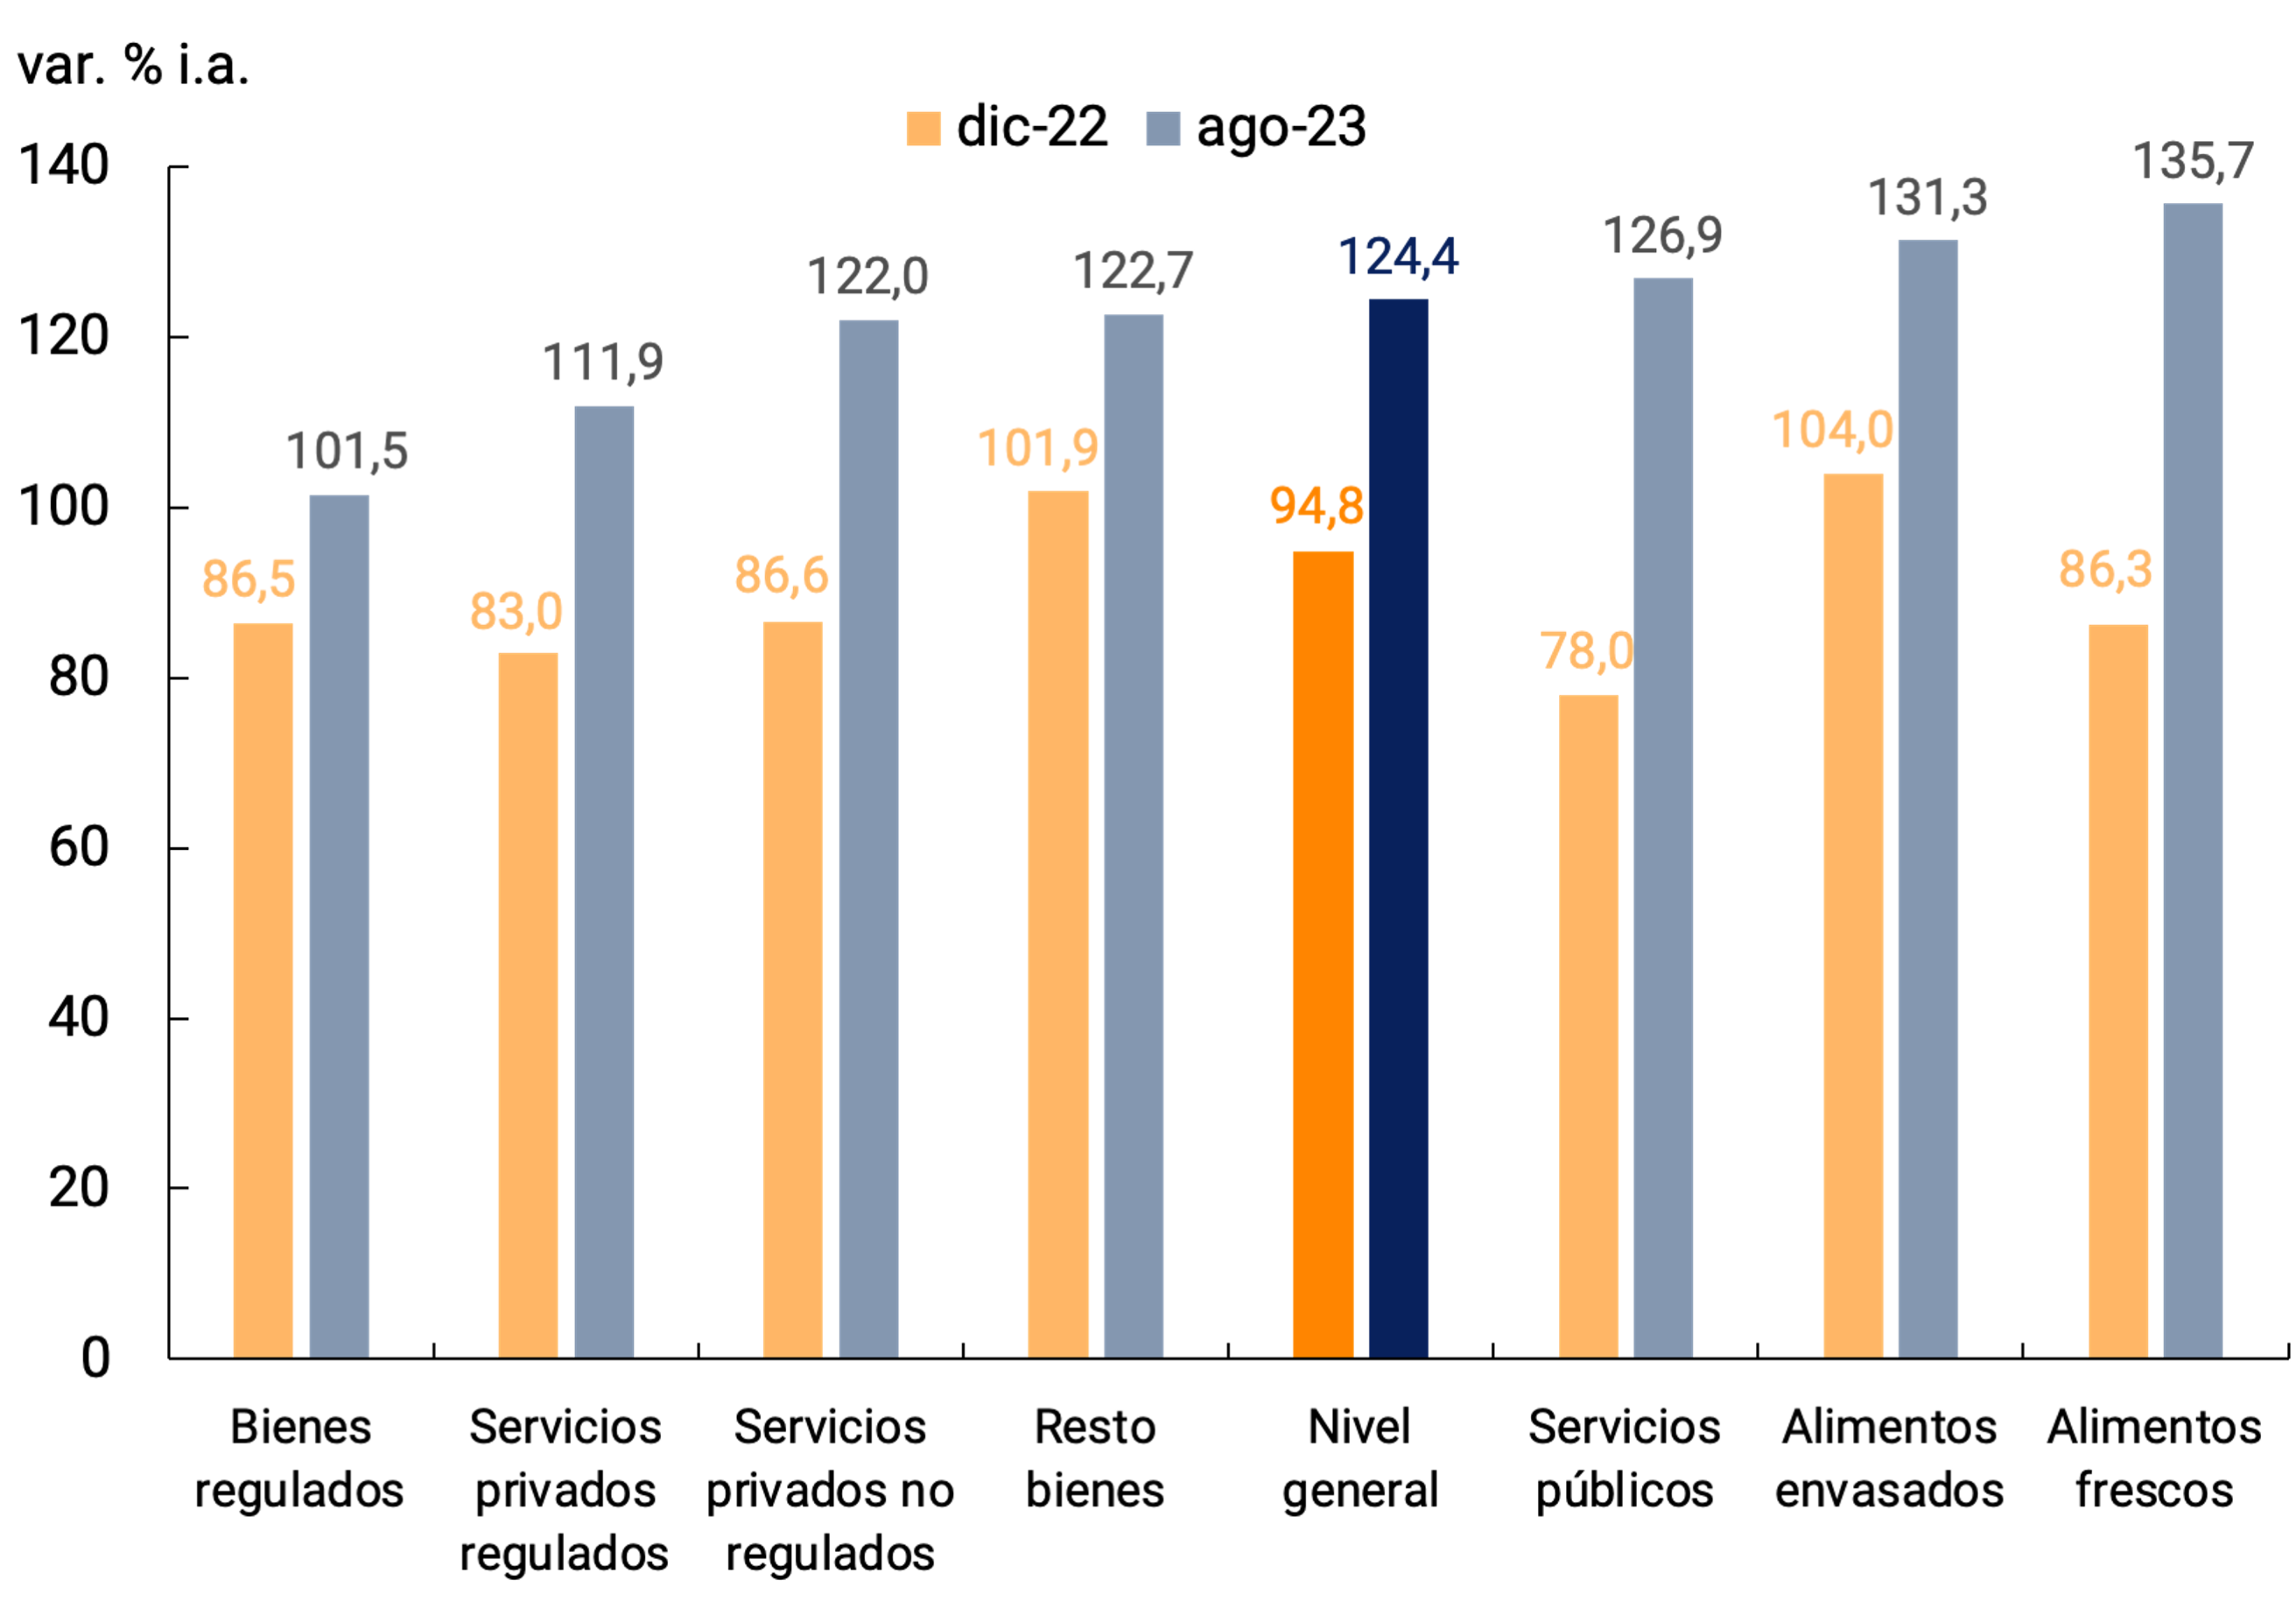
groups
Source: BCRA based on INDEC data.
Food and non-alcoholic beverages (both Fresh and Packaged) registered above-average year-on-year increases, in a year marked by drought and recently by the increase in the exchange rate. Another of the groupings whose year-on-year variation in August was higher than inflation was that of Public Services (126.9% YoY), marking a significant change compared to what happened in 2022, when these services had increased 16.8 p.p. less than the general level of inflation. The implementation of the segmentation of subsidies to electricity and gas tariffs was the main determinant that explained the slowdown in the deterioration of their levels relative to the CPI until August. The rest of the goods, which do not belong to the Food and non-alcoholic beverages division and are not regulated, increased 122.7% y.o.y. in August, just below the rise in the CPI, after having exceeded inflation by 7.1 p.p. in 2022. Unregulated services (122.0% y.o.y.) also rose slightly less in year-on-year terms than the general level of the CPI.
Finally, regulated goods and regulated private services (101.5% YoY and 111.9% YoY respectively), registered year-on-year increases in August significantly below the general level of inflation, repeating the pattern observed in 2022.
6.3. Perspectives
Since September, the measures implemented by the National Government to contain the evolution of prices began to have an impact, which was reflected in a reduction in weekly inflation estimated from various high-frequency indicators. However, this moderation in the rate of price increases will be fully reflected in the CPI only from October onwards. After the increases in fuel prices following the exchange rate readjustment, an agreement was reached with actors in the sector that implies a price freeze until October 31. Along the same lines, agreements were renewed with more than 340 companies within the framework of the Fair Prices program, which establishes a monthly increase cap of 5% for more than 52,300 products for 90 days. As for the pharmaceutical sector, a new price agreement was announced that contemplates the freezing of drug prices until the end of October. Similarly, a price freeze was agreed with companies providing prepaid medicine services. Finally, it was decided to postpone until November the tariff increases previously scheduled for September and October, both for public transport in the AMBA and for residential electricity and gas services.
If the dynamics observed in the last weeks of September are sustained and in a context of stability of the official exchange rate, the inflation rate for the month of October would be significantly reduced, a forecast shared with analysts specialized in the latest Market Expectations Survey. In the following months, the room for a further slowdown in prices will be conditioned by high inflation expectations, the renewal of price agreements, the possible unfreezing of some public service tariffs since November and by the wage renegotiations planned for the last quarter.
The BCRA will continue to focus its decisions on limiting financial and exchange rate volatility in order to contain inflation in a period marked by tensions associated with the political cycle.
7. Monetary Policy
The BCRA continued to calibrate its monetary policy, adapting it to a complex macroeconomic environment. In the days leading up to the Primary, Open, Simultaneous and Mandatory (PASO) elections, there was high volatility in the financial markets, which increased expectations of devaluation and acceleration of inflation. In this context, a set of measures were implemented with the aim of favoring the accumulation of international reserves and containing financial exchange rates. After the PASO, the BCRA decided to recalibrate the level of the official exchange rate, bringing it to $350/US$. Likewise, modifications to the Export Increase Program (PIE) were announced, highlighting the incorporation of corn and malting barley to the products of the regional economies and a new modality by which the exporters reached must settle 75% of the foreign currency in the Single and Free Exchange Market (MULC) and will have free availability for the remaining 25% of the foreign currency.
In parallel with the recalibration of the official exchange rate, and with the aim of mitigating its transfer to prices, the reference interest rates and fixed-term deposits were simultaneously readjusted, aligning them at a level consistent with medium-term inflation expectations. In this way, the aim was to tend towards positive real returns on investments in local currency and to contribute to financial and exchange balance.
On the other hand, the BCRA continued to use its intervention capacity through open market operations, in order to limit volatility and promote greater liquidity, depth and transparency of the sovereign debt markets.
During the third quarter of the year, the effects of the drought on agricultural activity began to dissipate. Meanwhile, the rest of the sectors continued to present a mixed performance. In this context, the BCRA continued to stimulate credit intermediation, particularly that linked to productive development through the Financing Line for Productive Investment.
Finally, it should be noted that within the framework of the 5th and 6th review of the Extended Facilities Program (EFP), the disbursement of approximately US$7,300 million (5,500 million SDRs) was received from the IMF, which made it possible to strengthen the International Reserves and advance the September payment of about US$910 million (687.5 million SDRs).
In this context, the BCRA will continue to calibrate its policies in a context of greater volatility in the financial markets associated with the electoral cycle, while continuing to carry out prudent management of the current regulatory framework.
7.1. The BCRA recalibrated the official exchange rate after the PASO, in a context of greater financial volatility
After the Primary, Open, Simultaneous and Mandatory (PASO) elections, in a context of high financial volatility, the BCRA recalibrated the level of the official exchange rate with the aim of favoring the accumulation of international reserves. In fact, on August 14, the nominal exchange rate (TCN) against the U.S. dollar was raised to $350/US$, which implied an increase of 21.8% compared to the previous business day, 20.9% on the average for August, and 8.8% in September due to the carry-over effect (see Figure 7.1).
Figure 7.1 | Bilateral nominal exchange rate with the United
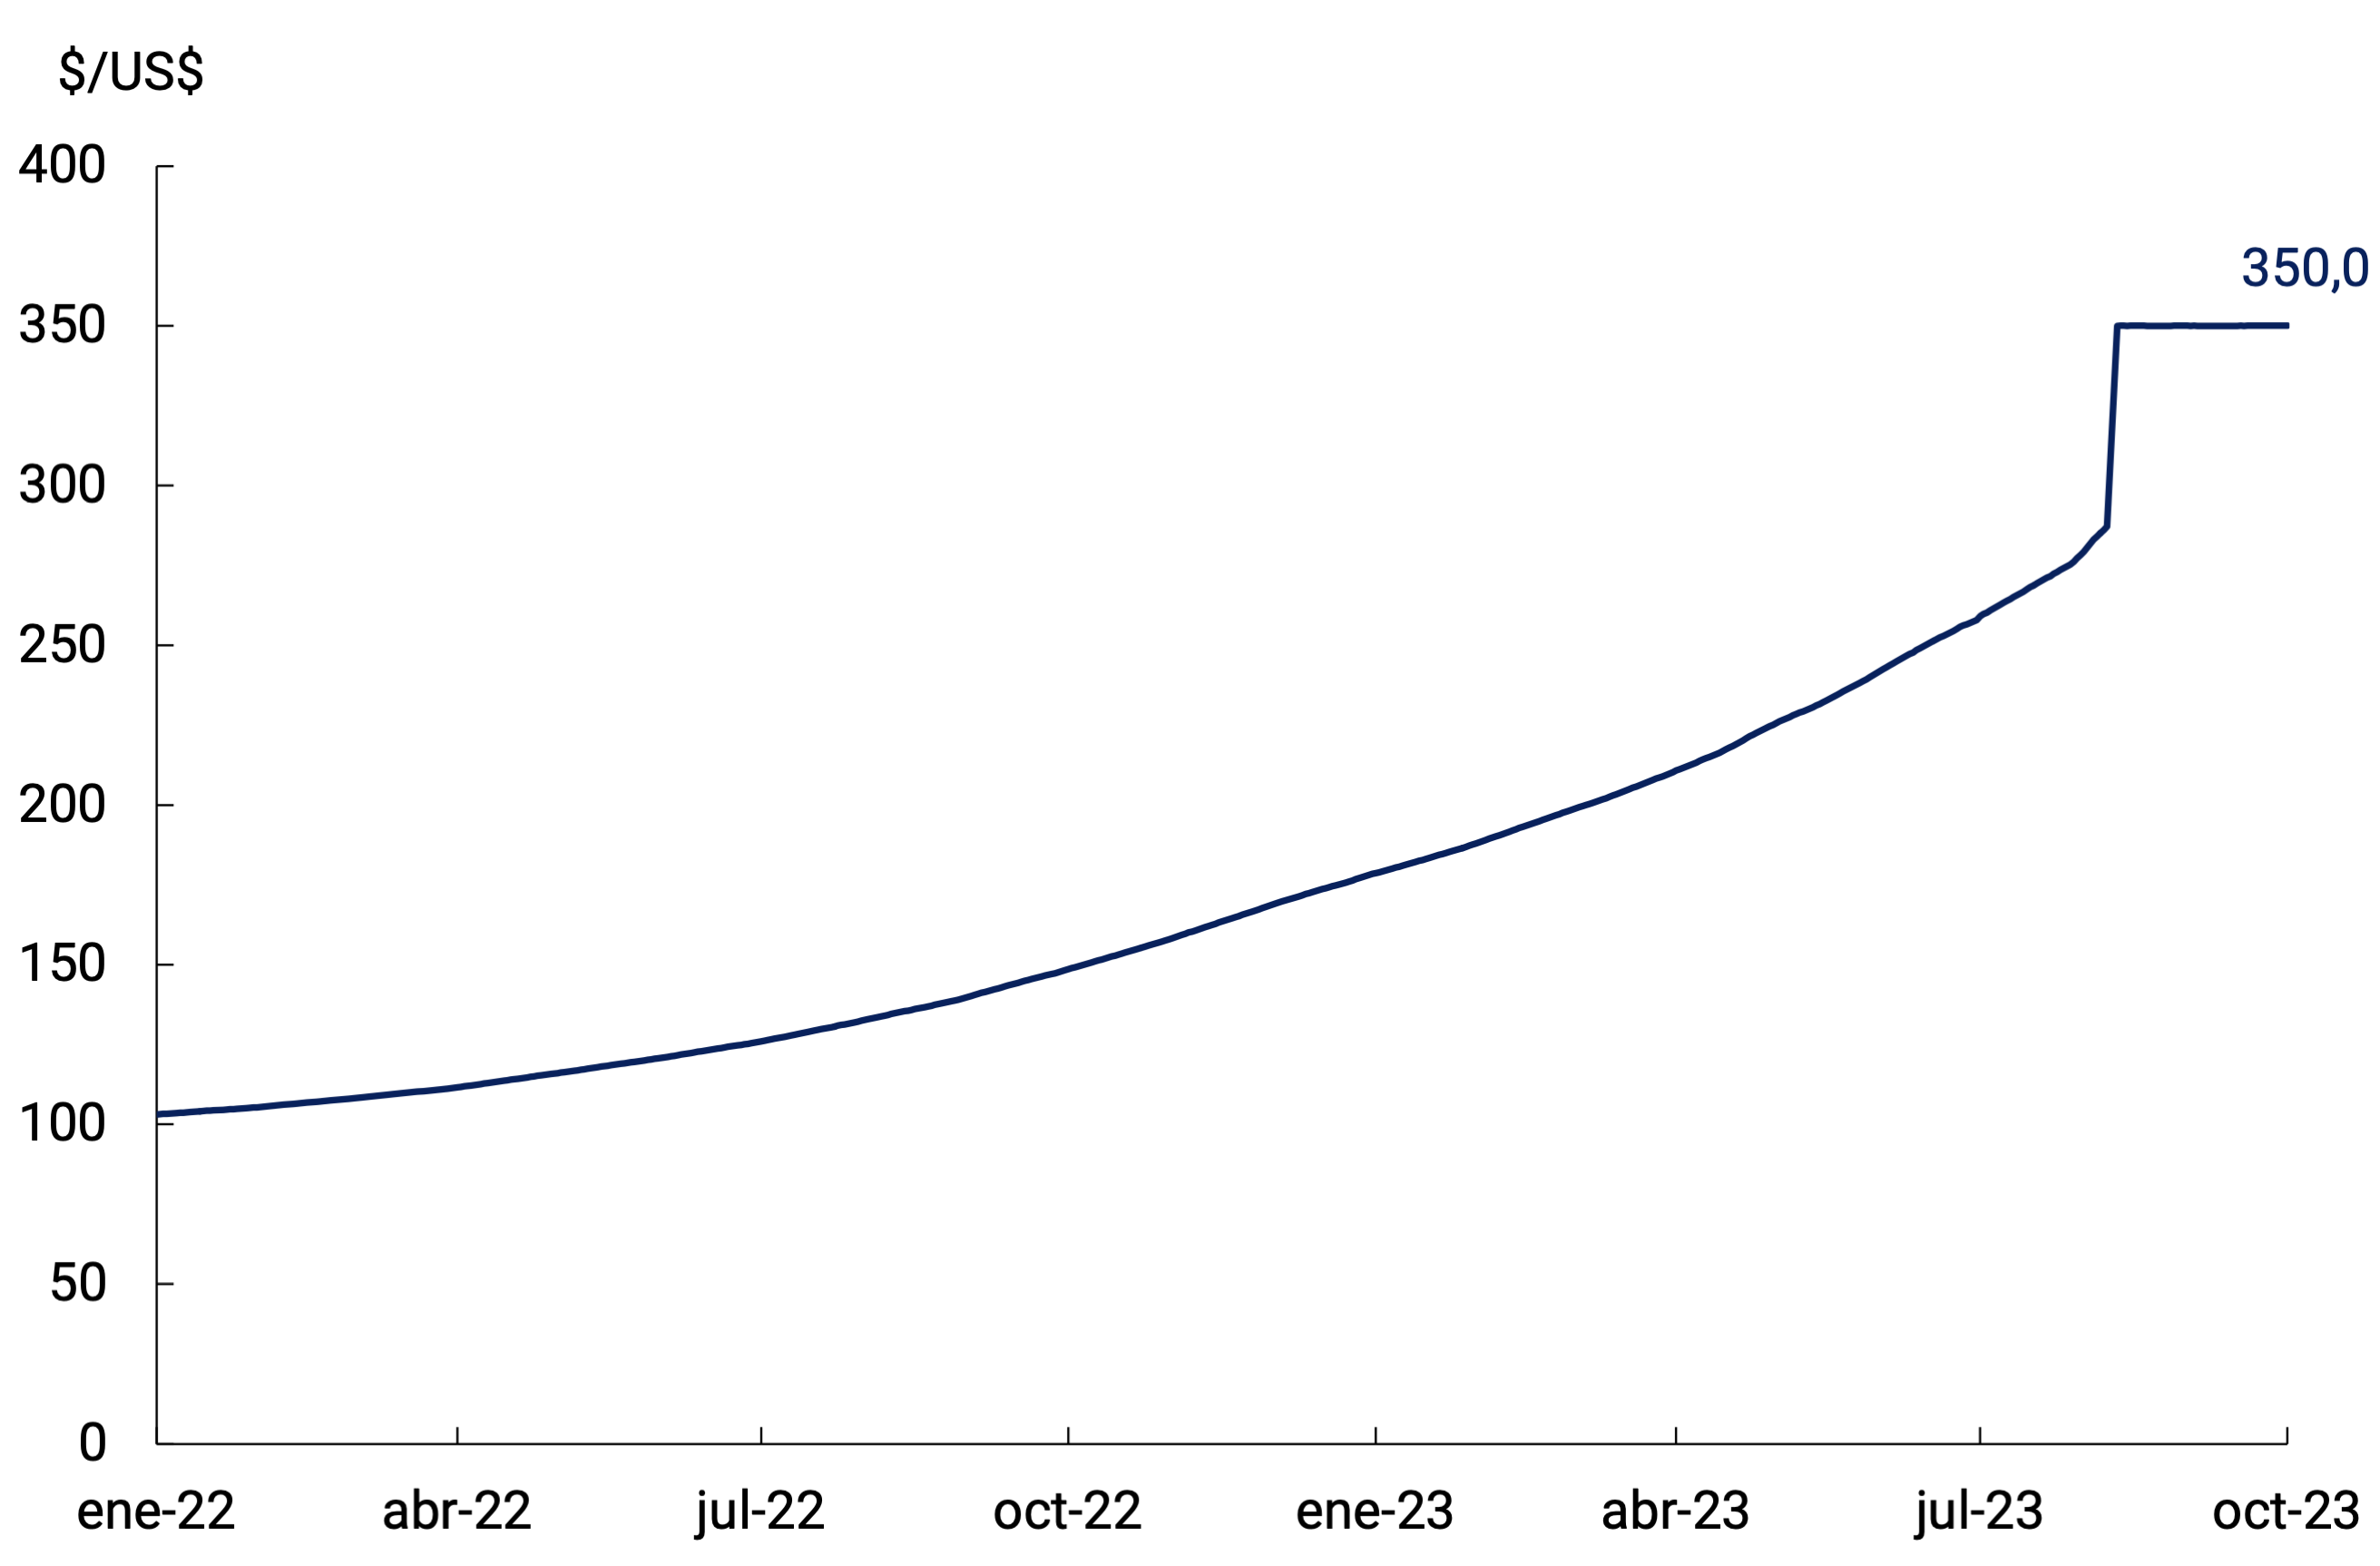
States
Source: BCRA.
At the same time, in the third quarter of the year, various regulatory modifications were made in foreign exchange matters, aimed at favoring an efficient allocation of International Reserves69. Thus, measures were taken regarding access to the foreign exchange market by individuals and the rates with which certain consumption in foreign currency is taxed were modified, as well as the purchase of foreign currency intended to pay for services abroad. At the same time, the conditions for the subscription of Internal Bills of the Central Bank of the Argentine Republic in dollars liquidable in pesos for the Reference Exchange Rate Com. “A” 3500 (LEDIV) at zero rate were extended. In addition, the Local Currency Payment System (SML) between Argentina and Uruguay was expanded, which allows payments for certain trade operations and transfers in local currencies.
On the other hand, with the aim of increasing the supply of foreign currency, the “Export Increase Program” was reestablished. In the new editions, the production of corn and malting barley was incorporated into the tariff positions of products of the regional economies70. In addition, since the first days of September, it was established that 75% of the equivalent value of the export of the goods reached should be entered into the country in foreign currency and negotiated through the Single and Free Exchange Market (MULC); meanwhile, the remaining 25% would be freely available70. At the beginning of October, this program was extended and extended until October 25, 2023, establishing that the remaining 25% must be used to carry out purchase and sale transactions with negotiable securities acquired with settlement in foreign currency and sold with settlement in local currency72. Among the new products reached are hydrocarbons73.
In this context, the BCRA’s International Reserves stood at US$26,470 million at the beginning of October, reflecting a decrease of US$1,456 million compared to June 30. Among the main factors of variation of the Reserves, the net income of international organizations stood out, which showed a balance of about US$2,500 million. This increase was mainly explained by the disbursement by the International Monetary Fund (IMF) of approximately US$7,300 million made at the end of August within the framework of the Extended Facilities Program (PFE). This was partially offset by payments made to the agency throughout the quarter, which totaled approximately US$4.4 billion. The purchase of foreign currency resulting from the liquidations from the new editions of the Export Increase Program was another factor in the expansion of International Reserves. However, these effects were more than offset by the cancellation of the National Government’s foreign currency debt, the fall in minimum cash accounts and the net sale of foreign currency to the private sector outside the PIE.
7.2. The BCRA also readjusted the level of monetary policy interest rates and managed liquidity according to the needs of the macroeconomic environment
Figure 7.2 | Interest Rate Structure
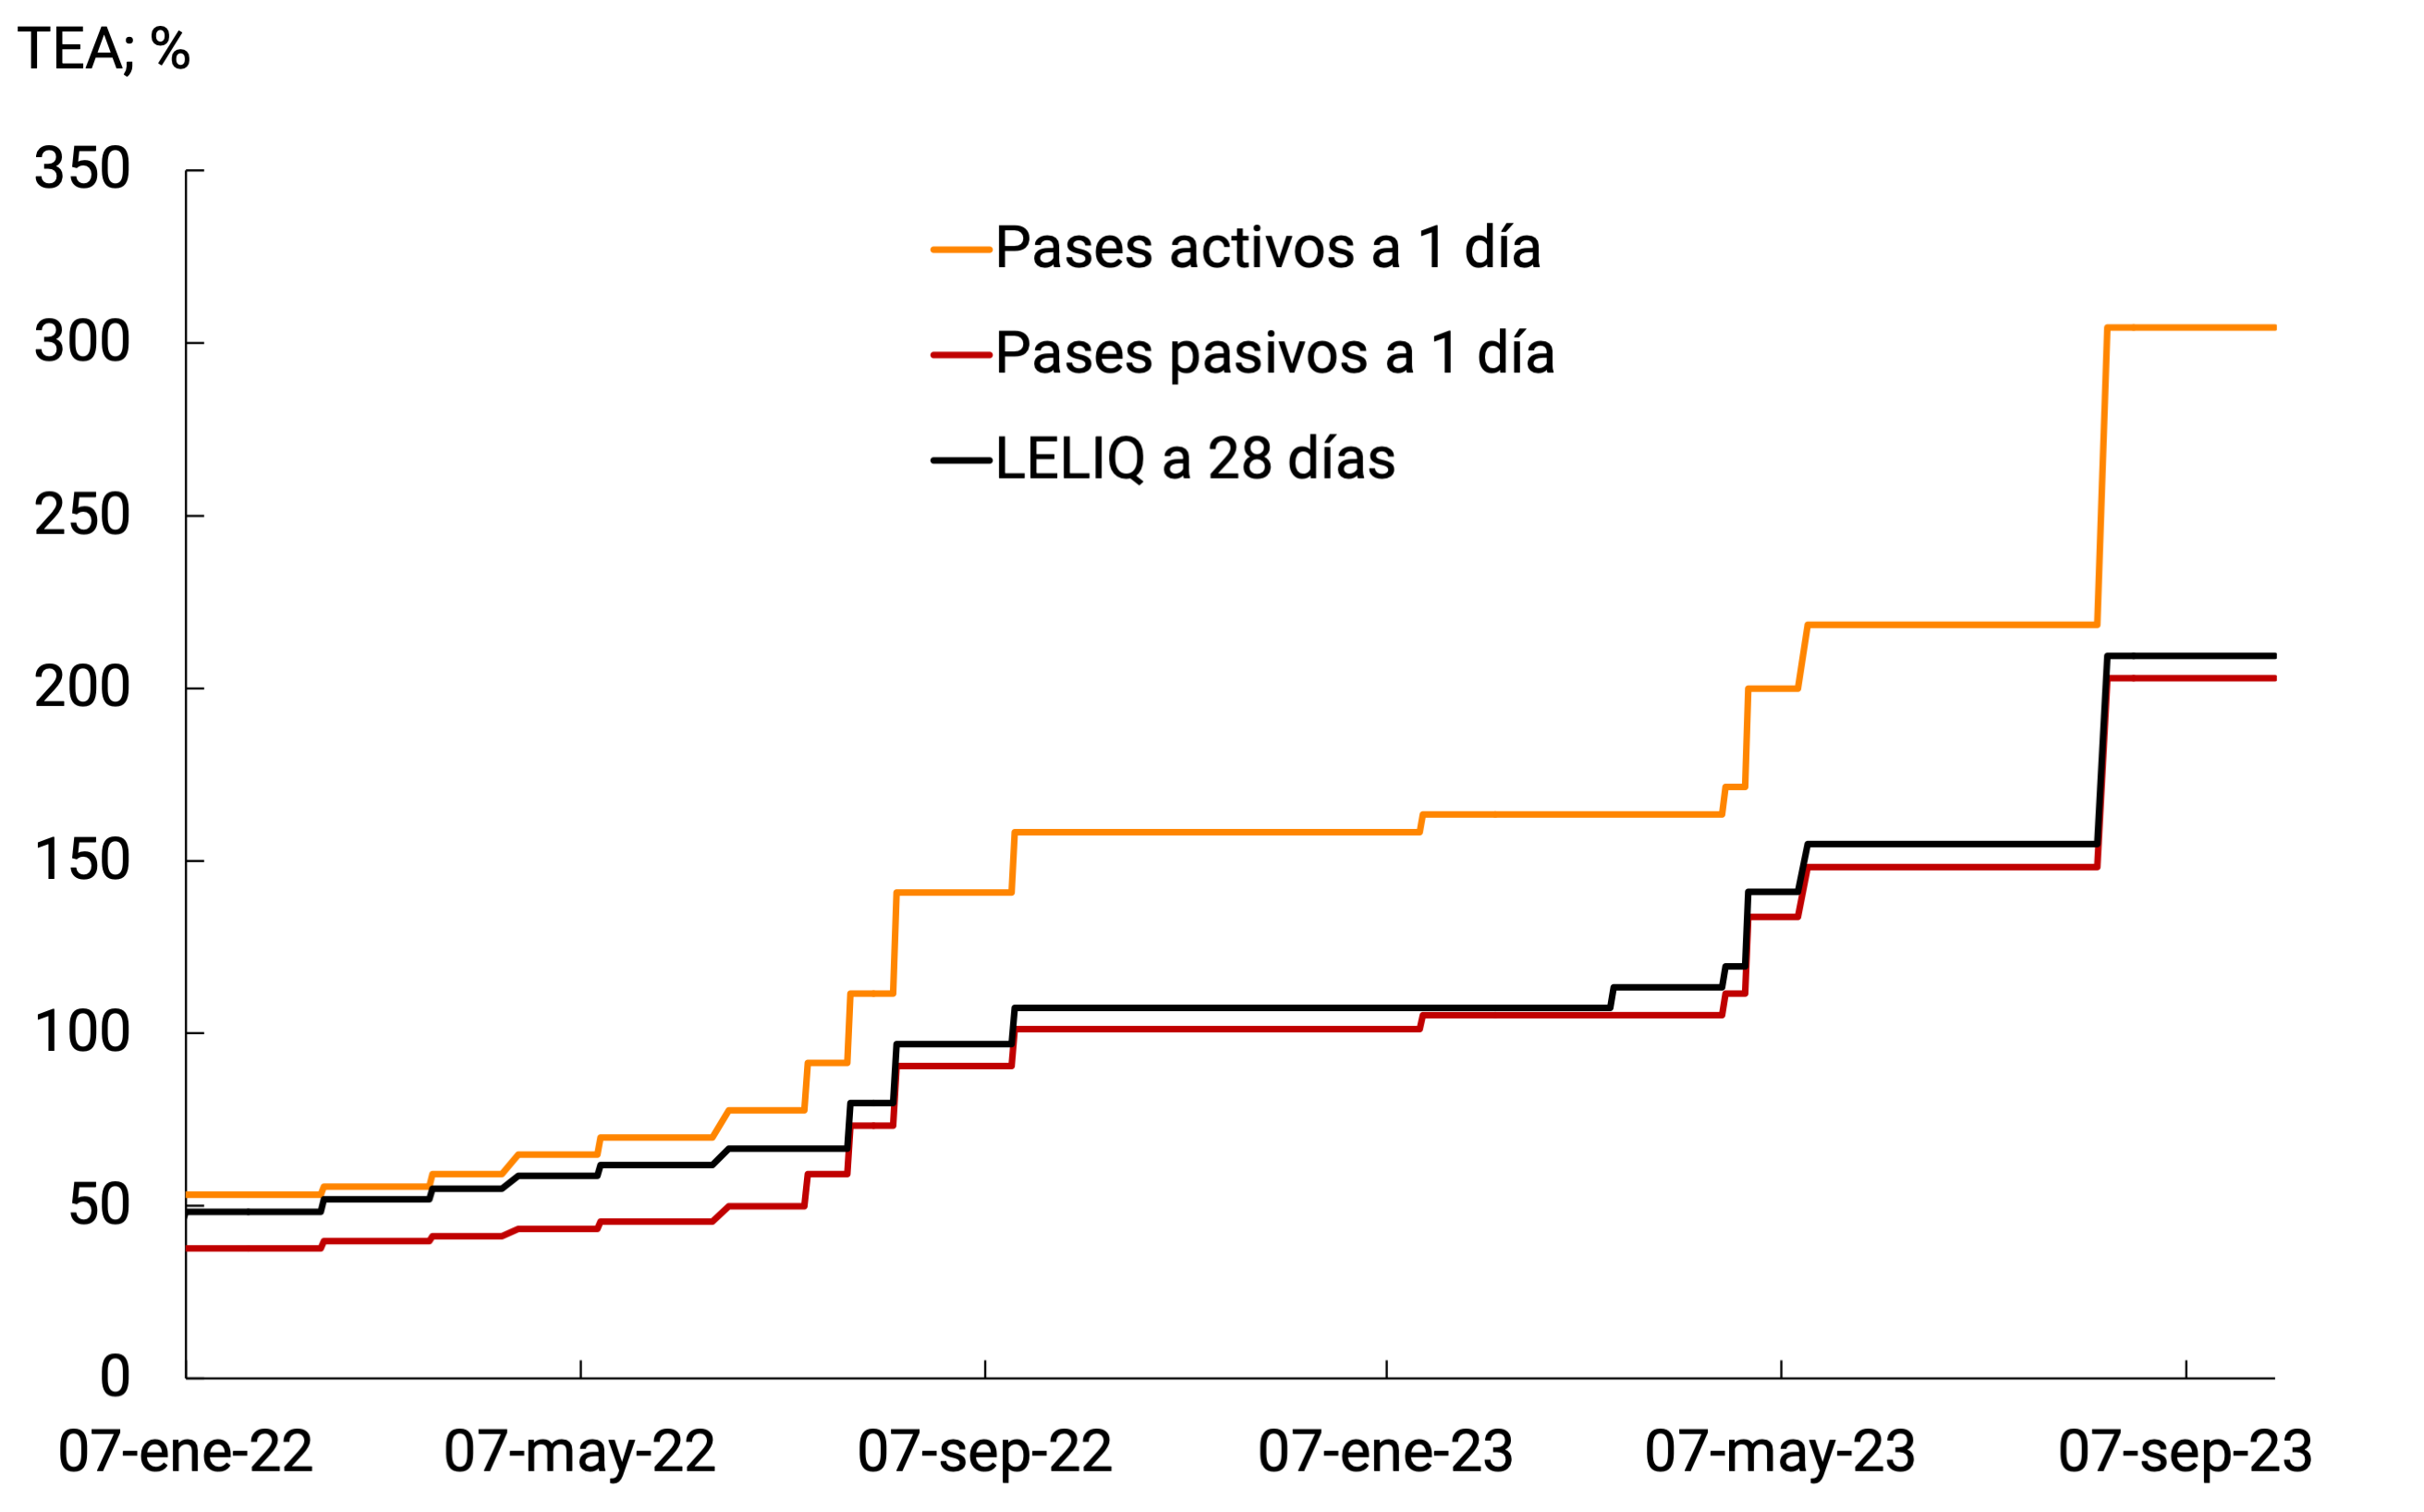
*Until Apr 27-23 corresponds to the minimum regulated rate for individuals up to $10 million.
Source: BCRA.
At the same time as the recalibration of the official exchange rate in mid-August, the BCRA decided to readjust the level of interest rates on monetary policy instruments, after keeping them unchanged since mid-May (see Figure 7.2). The objective of the interest rate hike was to cushion the transfer of the exchange rate correction to prices, tend towards positive real returns on investments in local currency and contribute to the financial and exchange rate balance. Specifically, it ordered to raise the interest rate of the LELIQ by 21 p.p. to 28 days, bringing it to 118% n.a. (209.4% e.a.). The interest rate on the LELIQ with a 180-day term was increased by 15 p.p. and stood at 120.5% n.a. (157.5% y.a.). As for shorter-term instruments, the interest rate on 1-day pass-by-passes increased from 91% n.a. to 111% n.a. (202.9% y.a.); Meanwhile, the interest rate on 1-day active passes was set at 140% n.a. (304.4% e.a.). Finally, the spread of the NOTALIQ was set at 2.5 p.p. in the last auction of the quarter.
Figure 7.3 | Historical evolution of the Monetary Base
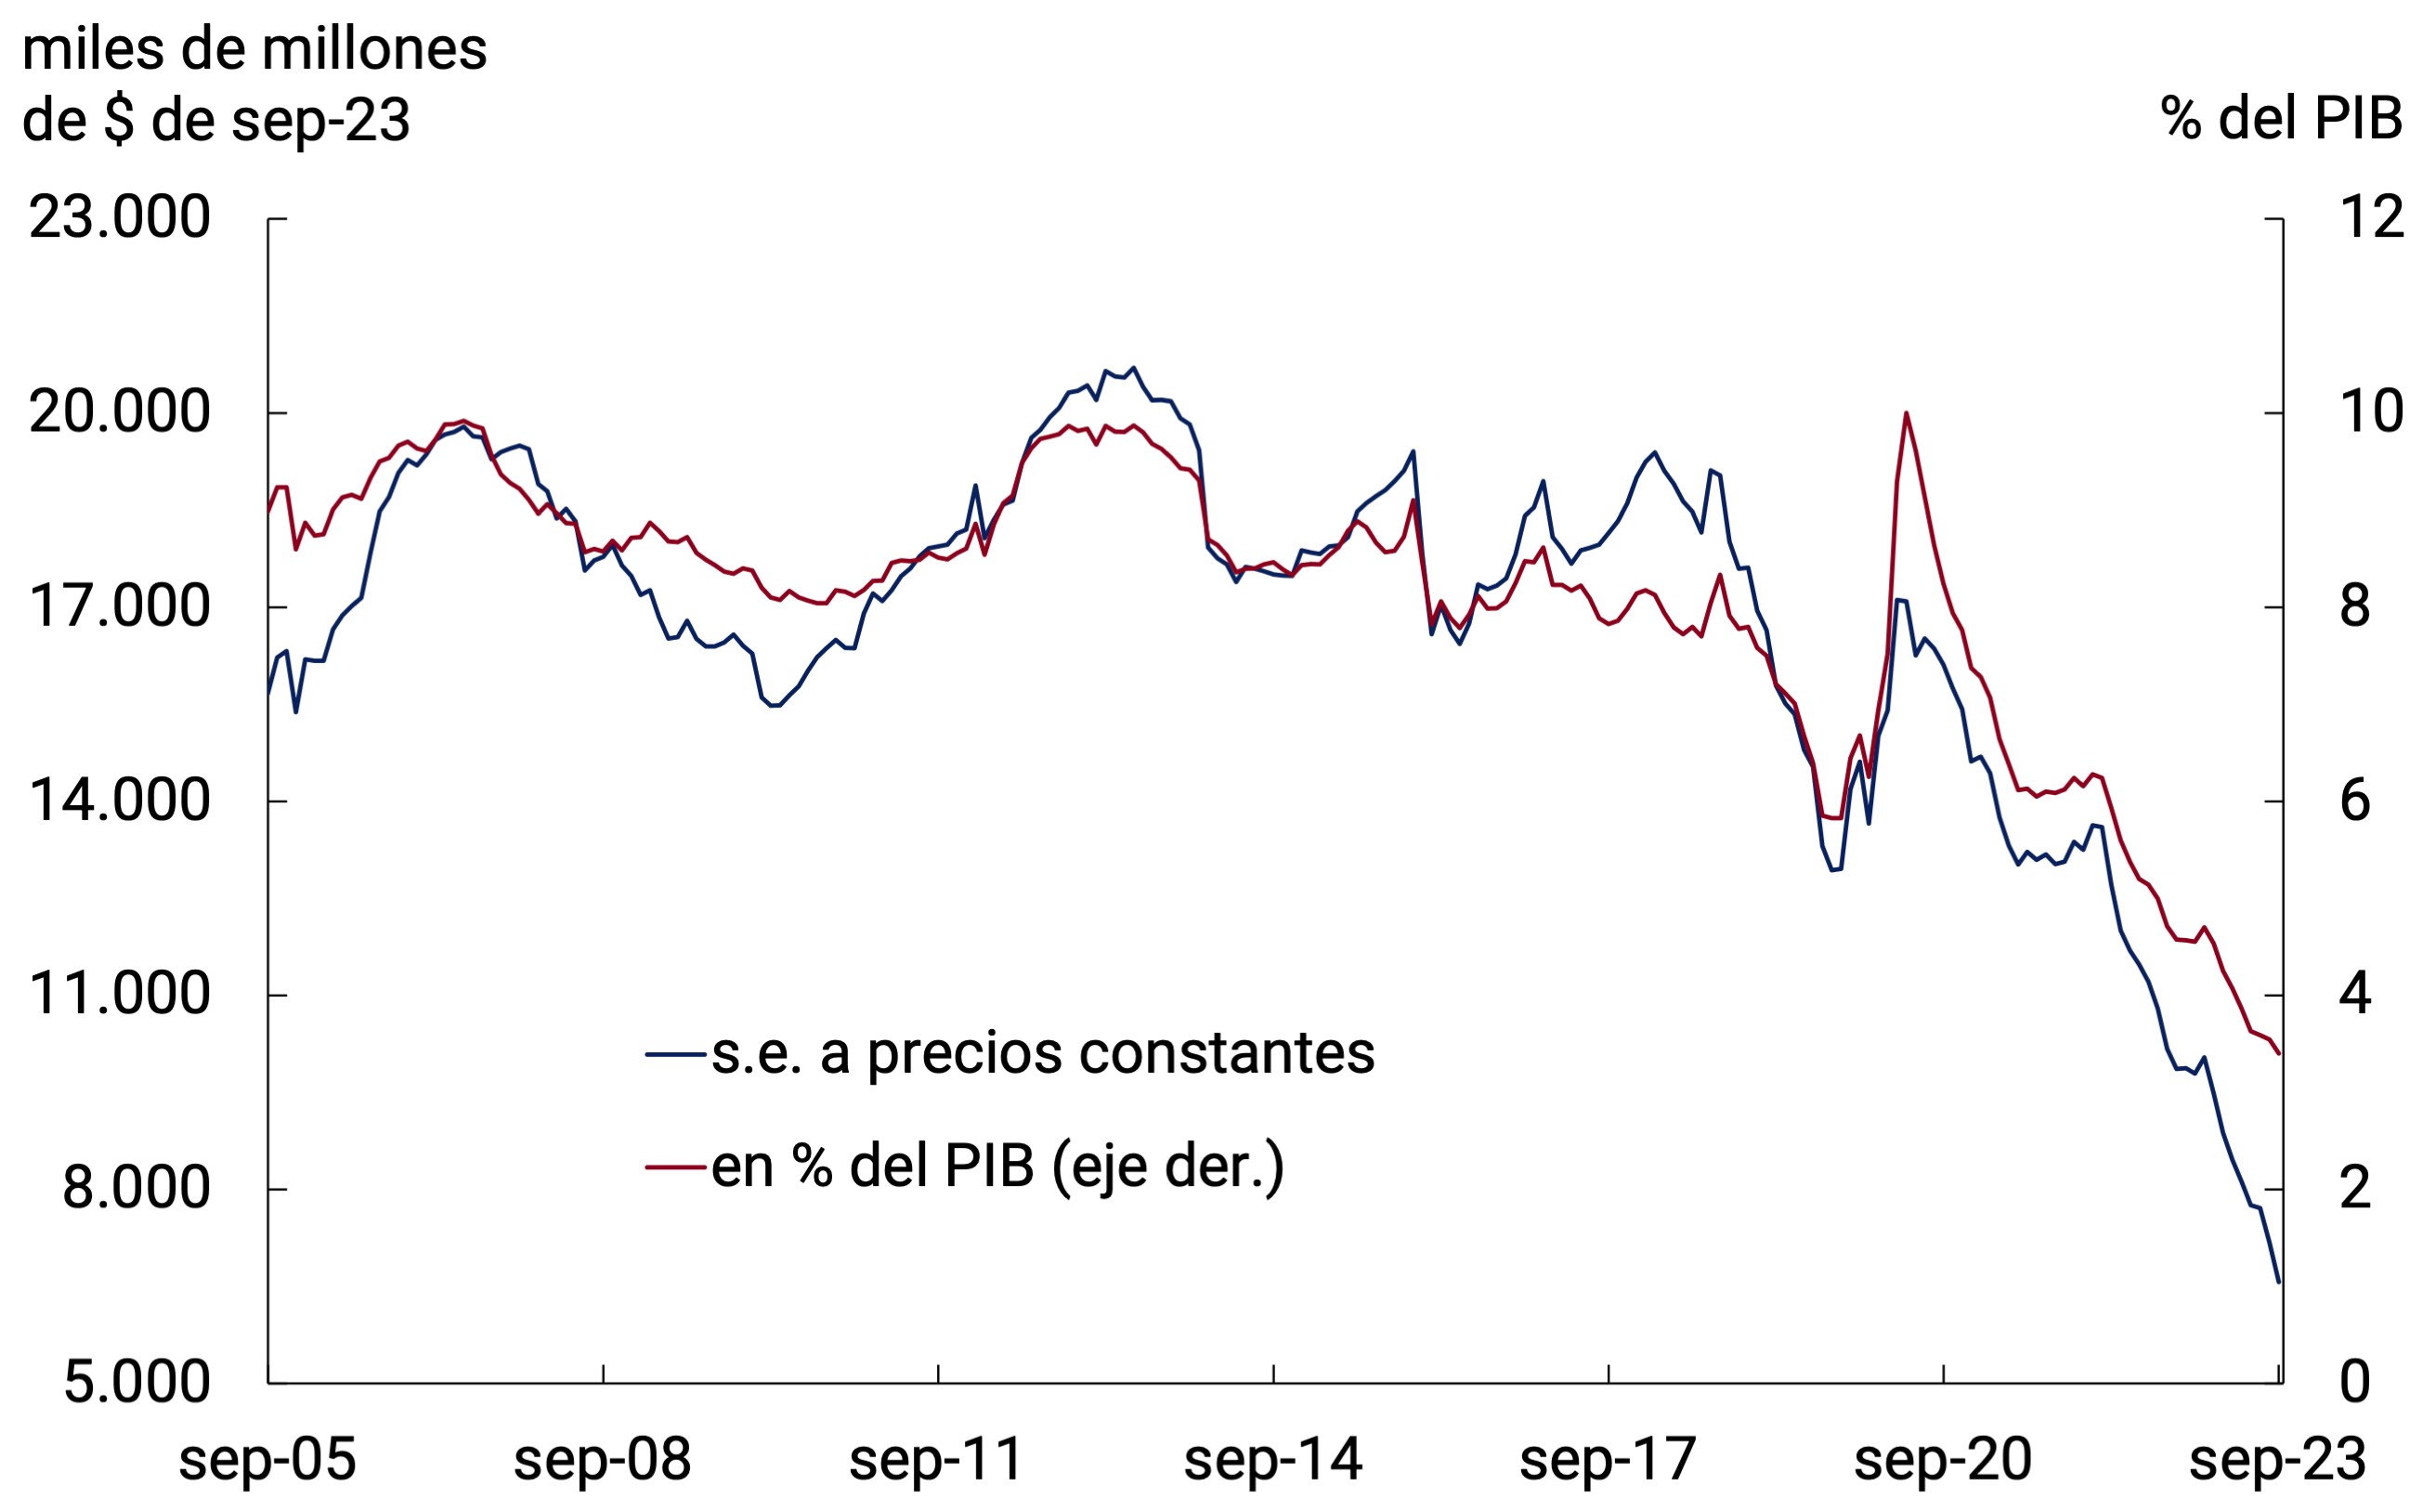
*Calculated using GDP s.e. average mobile 3 months.
Source: BCRA.
In an environment of high interest rates, the Monetary Base, adjusted for seasonality and at constant prices, registered an average monthly contraction of 5.4% in the third quarter of the year, accumulating a 35.4% drop in the last twelve months. In this way, it continued to contract and remained at historically low values. As a GDP ratio, the Monetary Base stood at 3.4% in September, which represents its lowest level in the last 20 years (see Figure 7.3).
As for the supply factors of the Monetary Base, operations associated with the public sector had an expansionary effect. On the one hand, in a context of lower revenues from export duties (see Chapter on Public Finances) and delays in disbursements corresponding to the 5th Review of the Extended Facilities Program, the BCRA covered part of the Treasury’s needs. Between July and August, Transitory Advances were granted for $440,000 million and part of the non-capitalized profits of the year 2022 were distributed for $400,000 million. Once the IMF review was concluded and the disbursement was made, at the end of August the Treasury proceeded to cancel Transitory Advances for $500,000 million. This last operation had a full impact on the September average. Net purchases of government securities, either through the secondary market or through the execution of PUT by financial institutions, also generated monetary expansion74. It should be noted that these operations are aimed at containing excessive price volatility of National Treasury debt instruments75.
Another relevant factor in the expansion of liquidity was the net purchase of foreign currency from the private sector, driven by the new editions of the PIE and a more competitive exchange rate, following the exchange rate correction that took place in mid-August (see Figure 7.4).
Figure 7.4 | Supply factors of the Monetary
Base Acum. quarterly
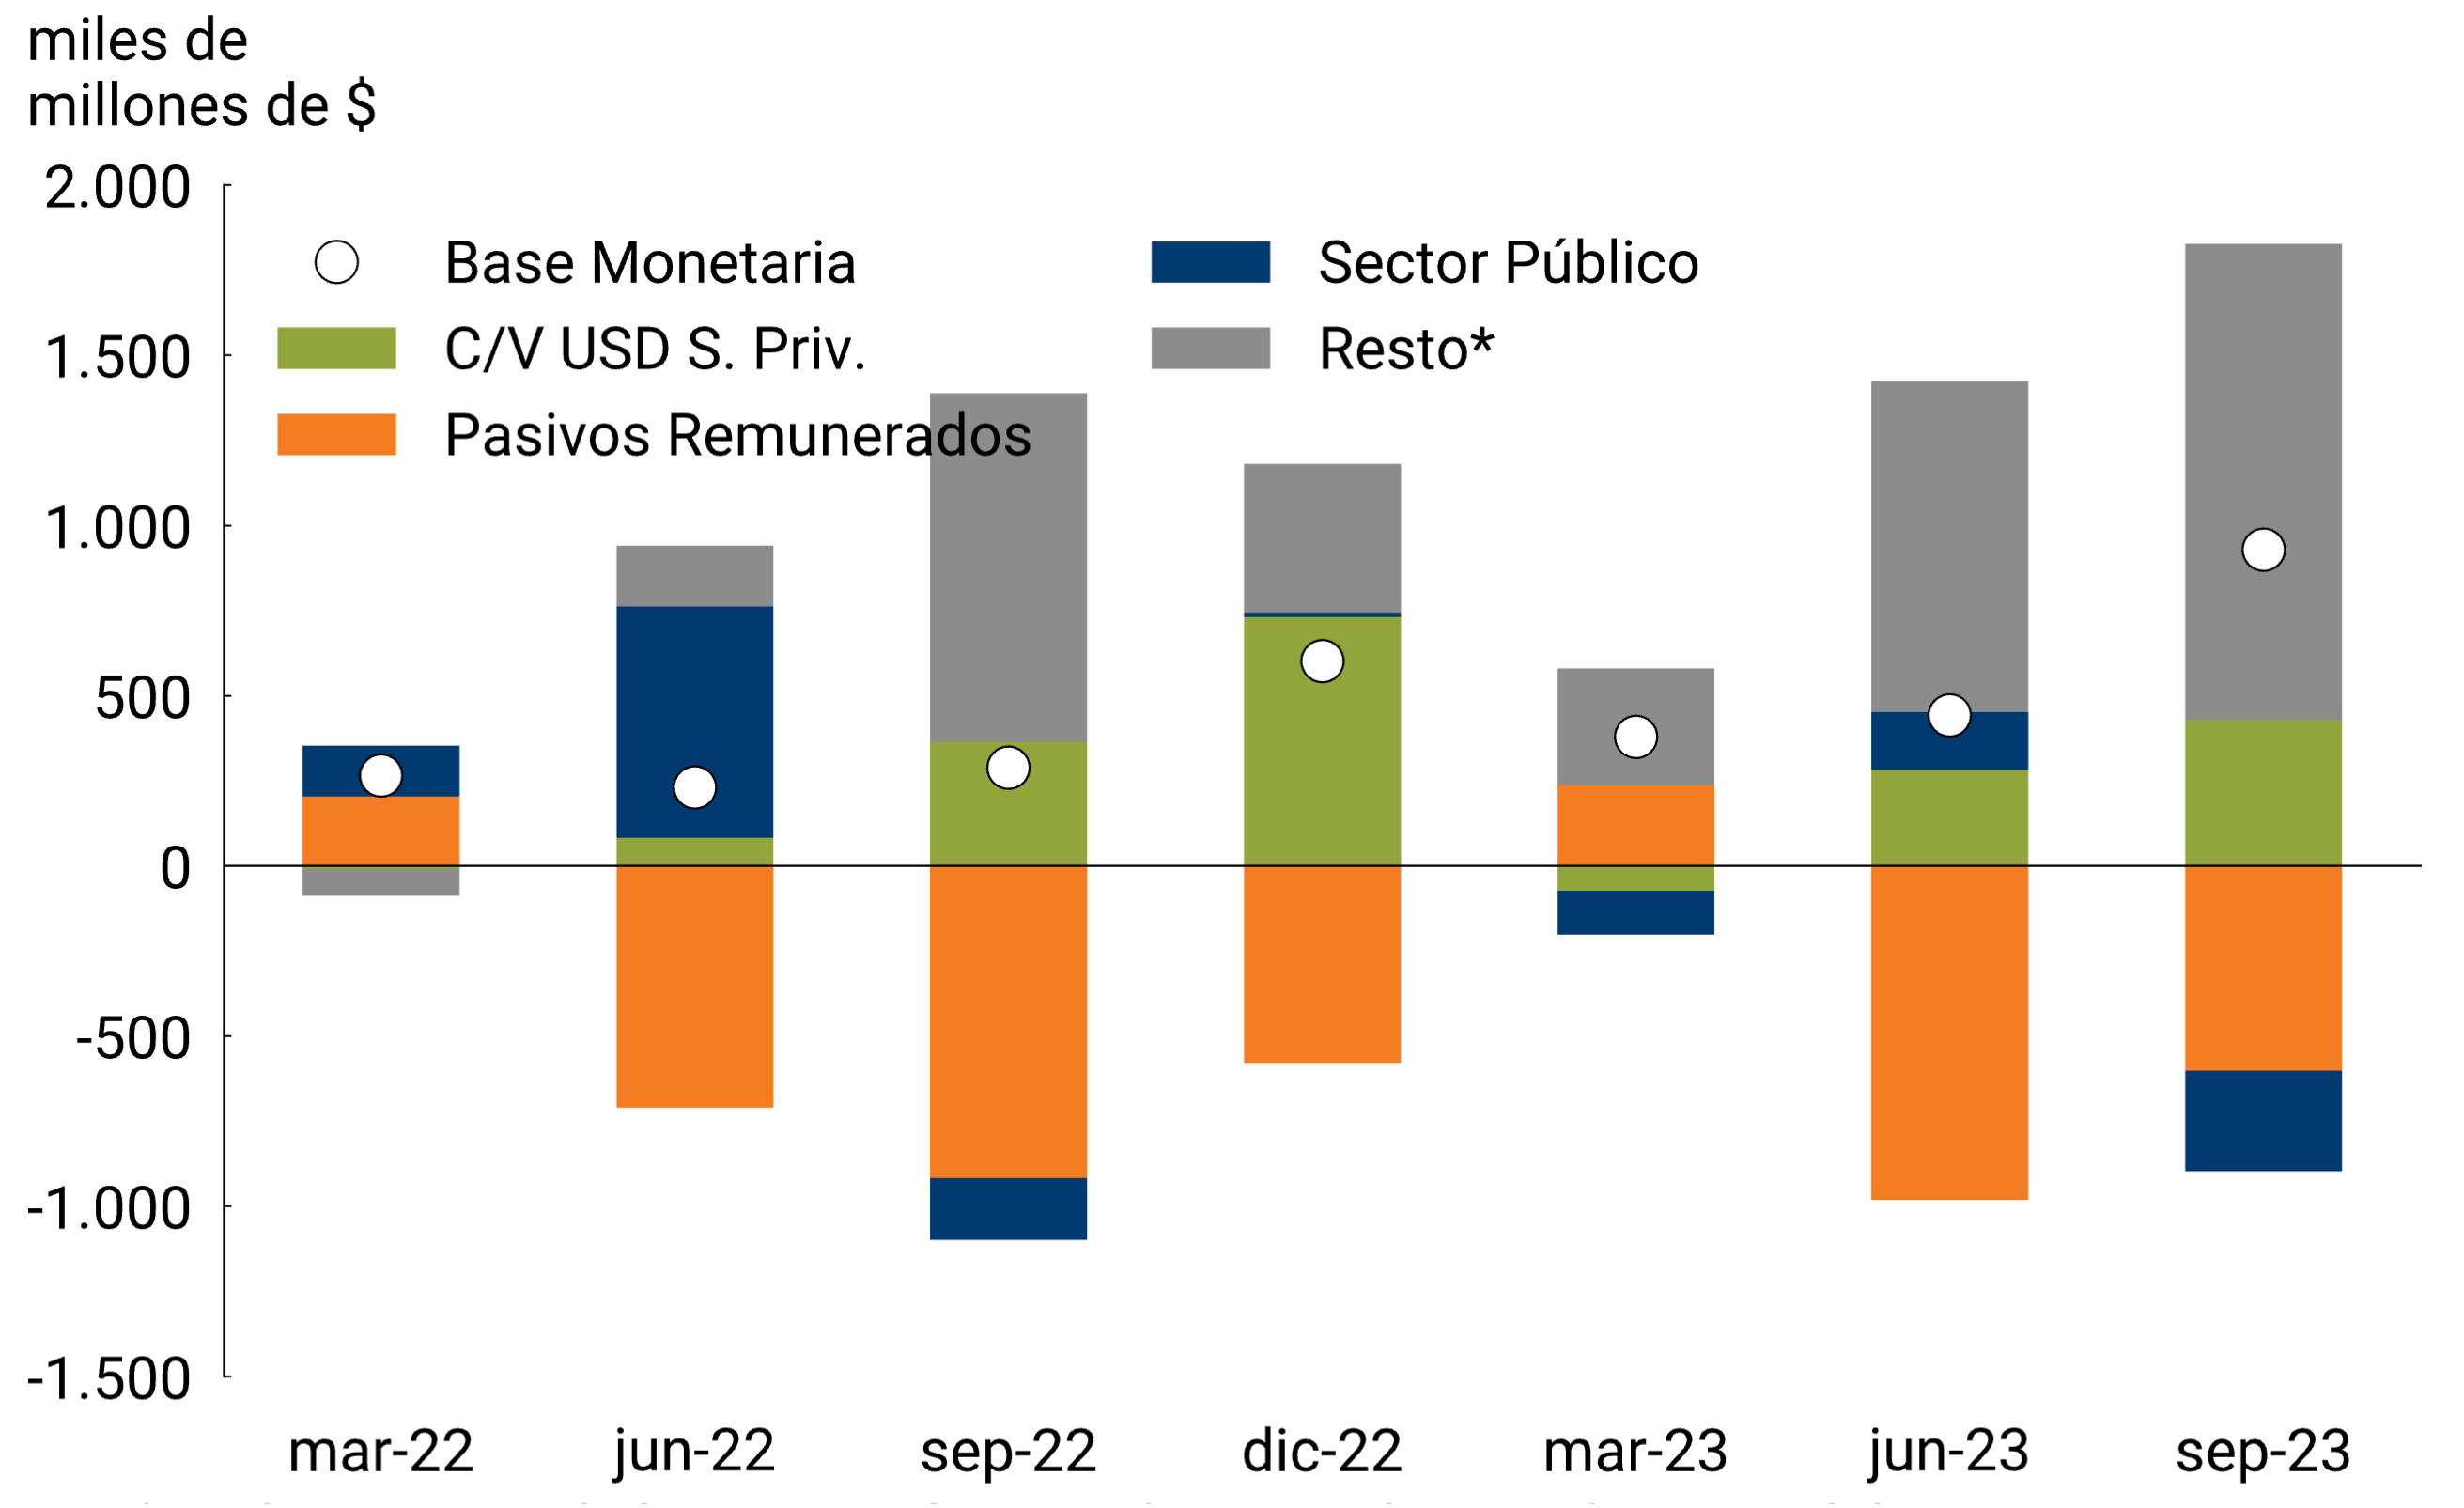
*Includes the cpra/vta of bonds in the secondary market and the exercise of the PUT
Source: BCRA.
Finally, the balance of the BCRA’s interest-bearing liabilities expanded in the period under analysis, partially sterilizing the increase in the rest of the components and the interest paid on the stock of instruments. Regarding the composition of these, a shortening in the average term is observed, linked to the gradual dismantling of LELIQ 180 days and NOTALIQ (see Figure 7.5).
Figure 7.5 | Interest-bearing
liabilities Share of interest-bearing liabilities by instrument
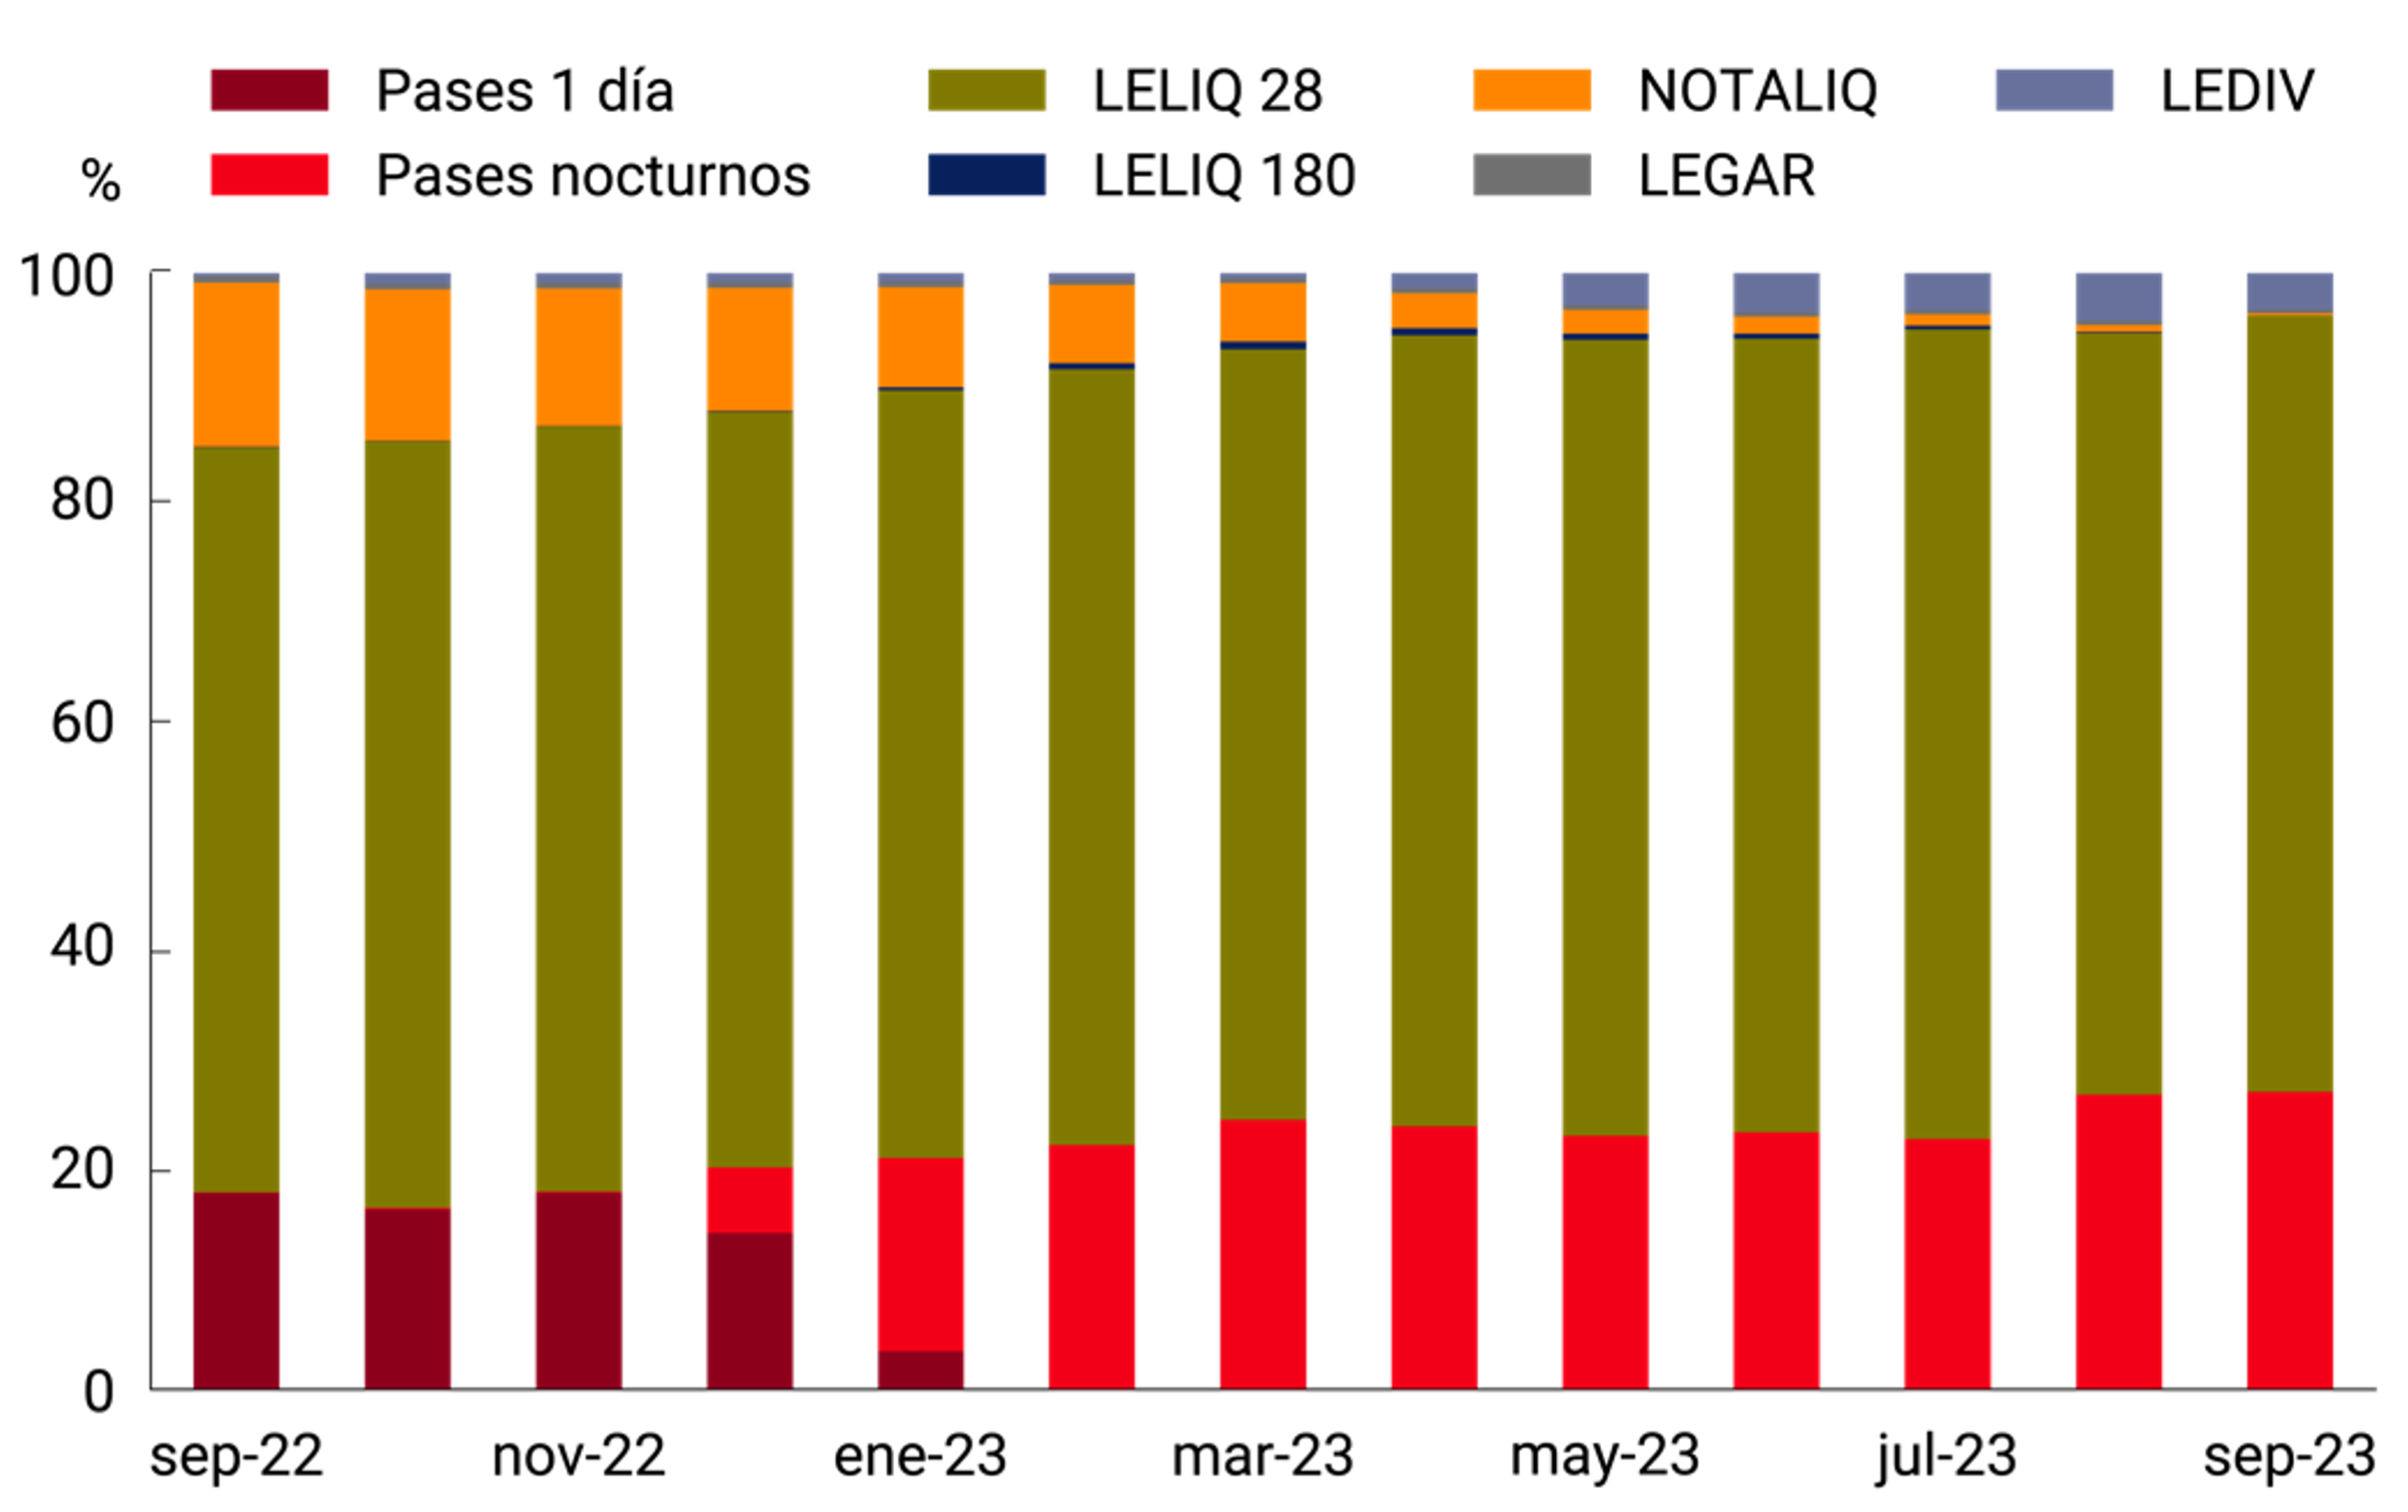
Source: BCRA.
7.3. Dynamics of the demand for monetary balances
7.3.1. Transactional means of payment in terms of GDP were around the lowest values of the last 20 years
Transactional means of payment, in real terms and without seasonality, accelerated their monthly rate of decline in the third quarter. In particular, private transactional M2 would have an average monthly contraction of 4.5% s.e. in the third quarter and would accumulate a fall of 22.1% so far this year76. In terms of its components, this behavior was explained both by the dynamics of the working capital held by the public and of non-interest-bearing demand deposits; however, the drop was more pronounced in the case of the former. Thus, in September the private transactional M2 registered a year-on-year fall of around 22.5% in real terms.
As a Product ratio, payment methods would have stood at 7% in September, registering a fall of 0.3 p.p. compared to the last month of last quarter and 1.1 p.p. in the first nine months of the year. In particular, the working capital held by the public reached a new all-time low, while demand deposits are, in terms of GDP, slightly above the minimum values reached at the end of 2019 (Figure 7.6).
Figure 7.6 | Means of payment
As a percentage of Output
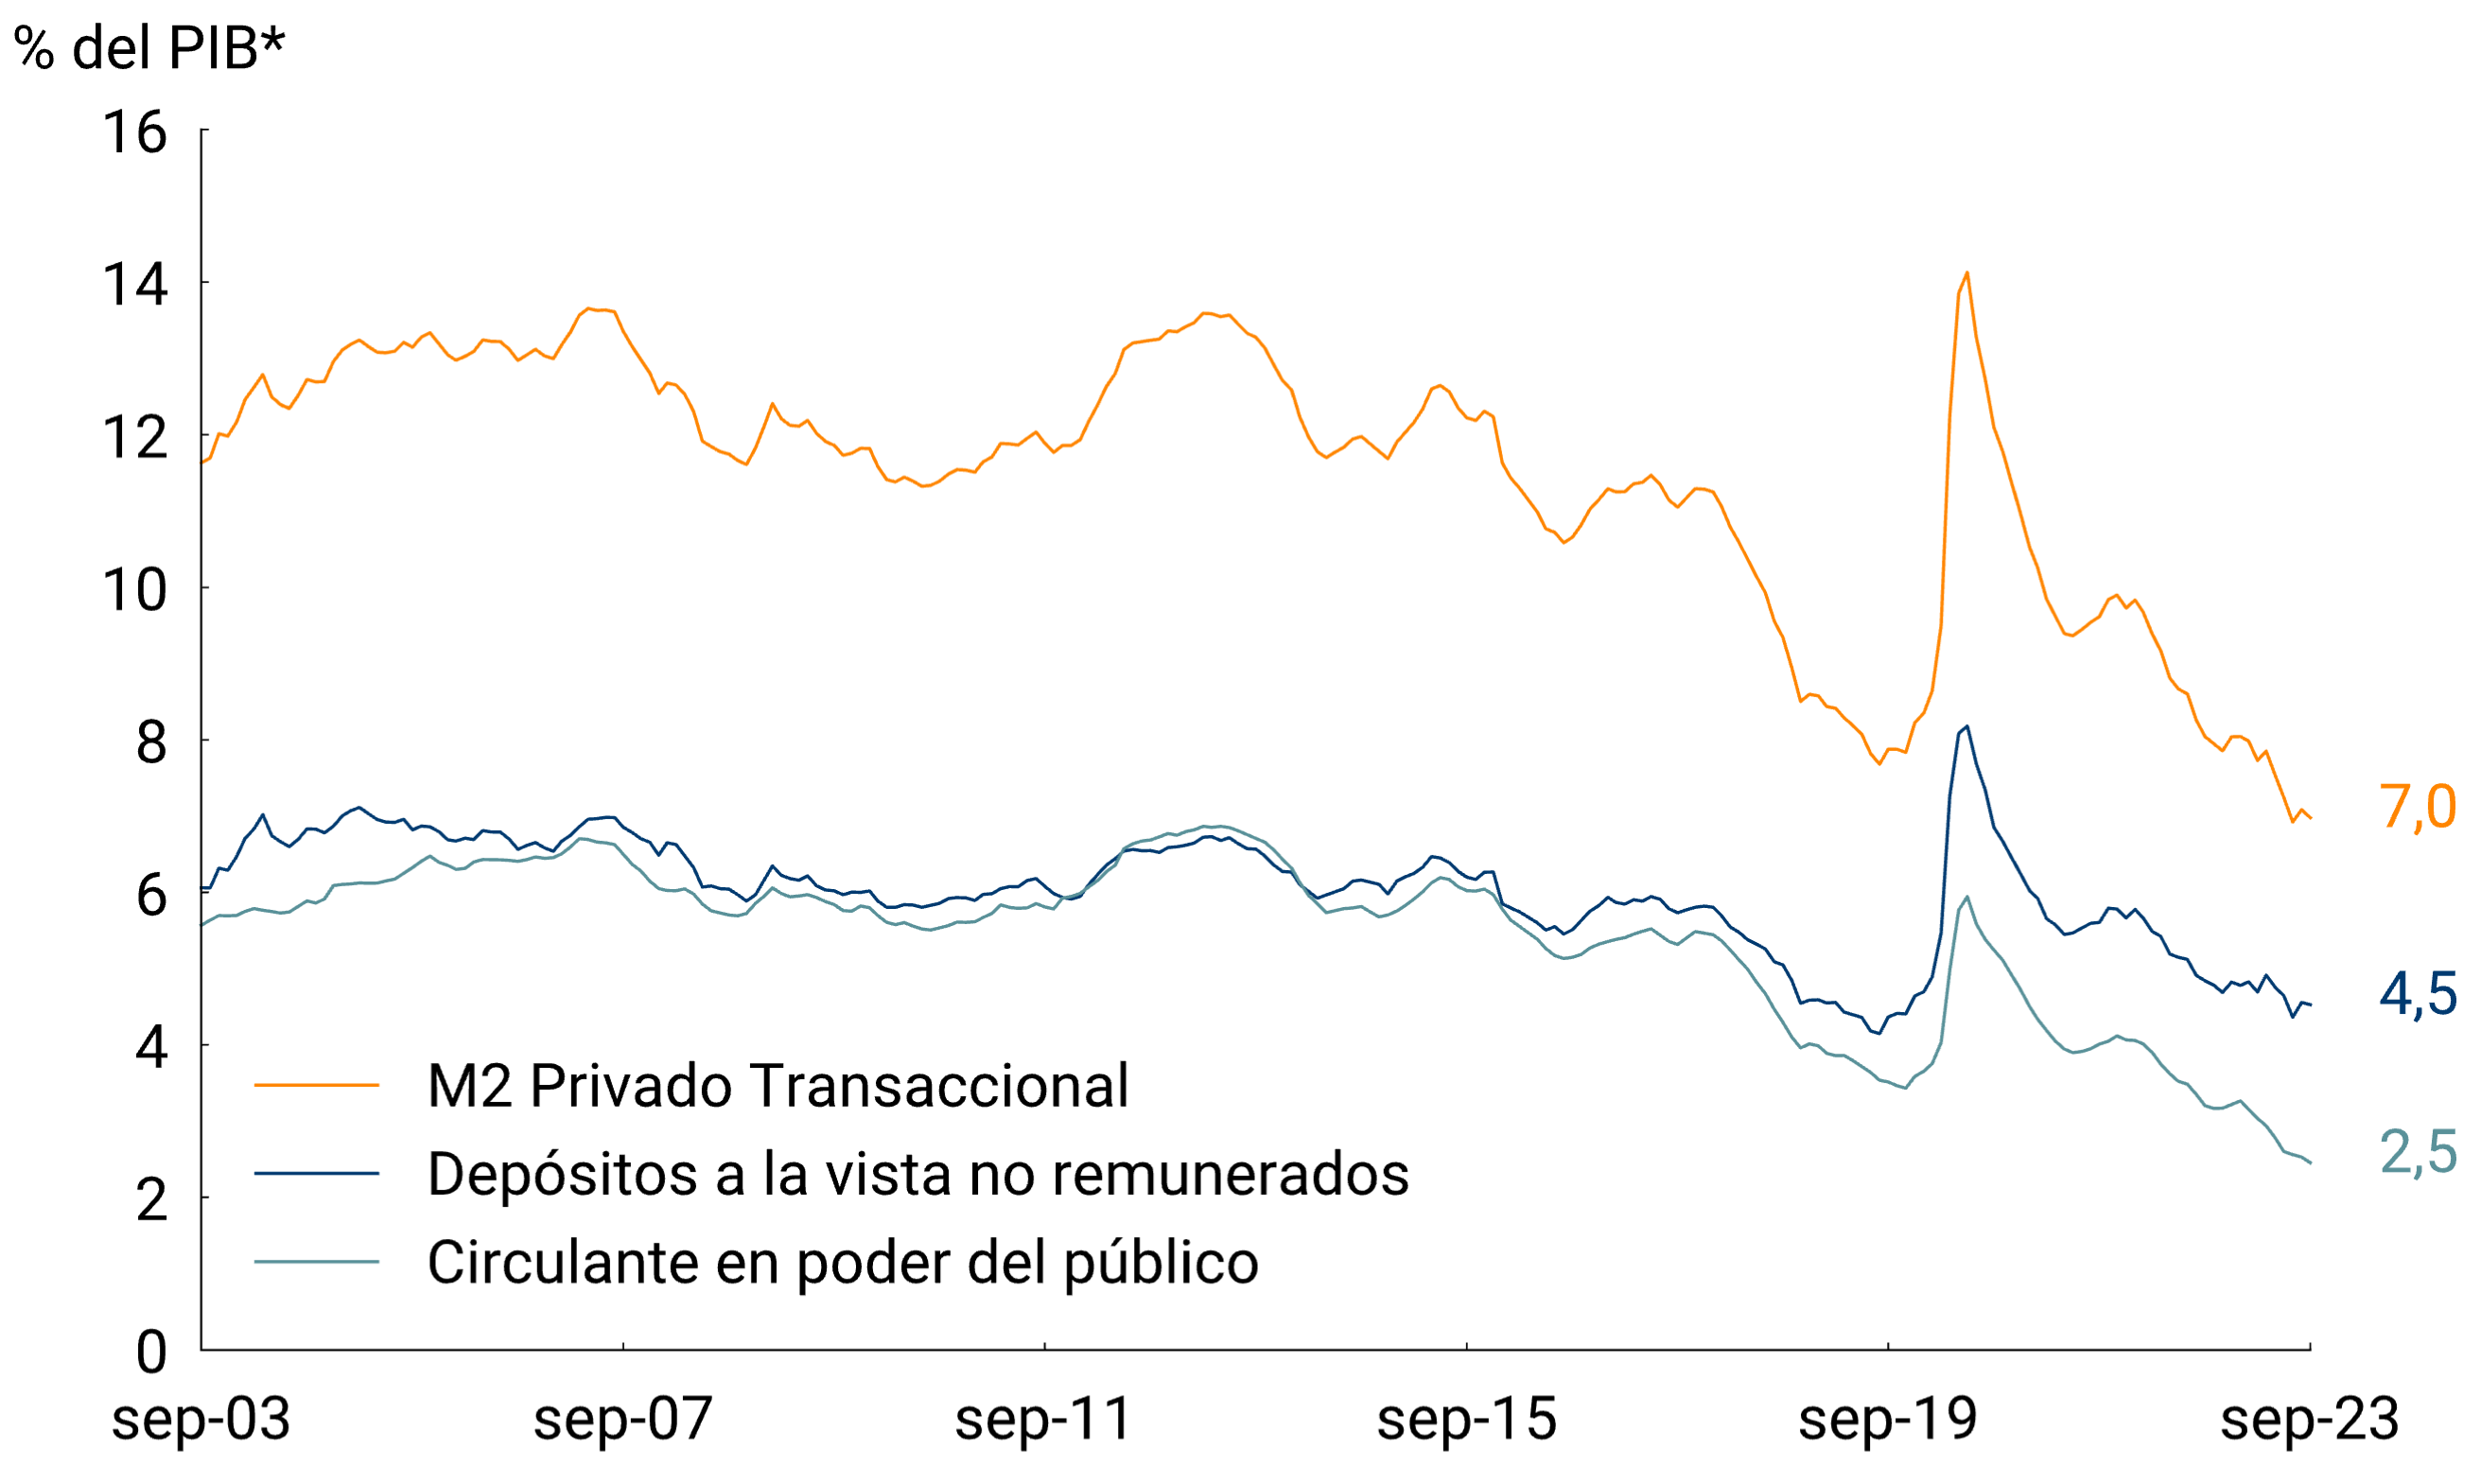
* Calculated using GDP s.e. prom. movable 3 months.
Source: BCRA.
7.3.2. In the remunerated segment, a preference for demand placements was observed
In line with the readjustment of interest rates on monetary policy instruments, the Board of Directors of the BCRA decided to increase the minimum guaranteed rates on fixed-term deposits77. In this way, the aim was to maintain the incentive to save in domestic currency and contribute to financial and exchange rate balance. Specifically, the monetary authority raised the minimum guaranteed interest rate for placements by individuals from 97% n.a. to 118% n.a., which is equivalent to an effective monthly yield of 9.7%. Meanwhile, for the rest of the depositors in the financial system, the minimum guaranteed interest rate rose from 90% n.a. to 111% n.a., with the effective monthly interest standing at 9.2%78.
Despite the improvement in the interest rate, interest-bearing deposits in pesos in the private sector would have registered an average monthly contraction of 2.4%, in real terms and without seasonality in the third quarter of the year. Likewise, within this segment, there was a change in composition, reflecting a greater preference for liquid assets. Thus, interest-bearing demand deposits rose during the quarter under analysis to the detriment of demand for fixed-term deposits (see Figure 7.7).
Figure 7.7 | Private sector interest-bearing deposits in pesos by type of deposit
Contribution to real and non-seasonal monthly variation
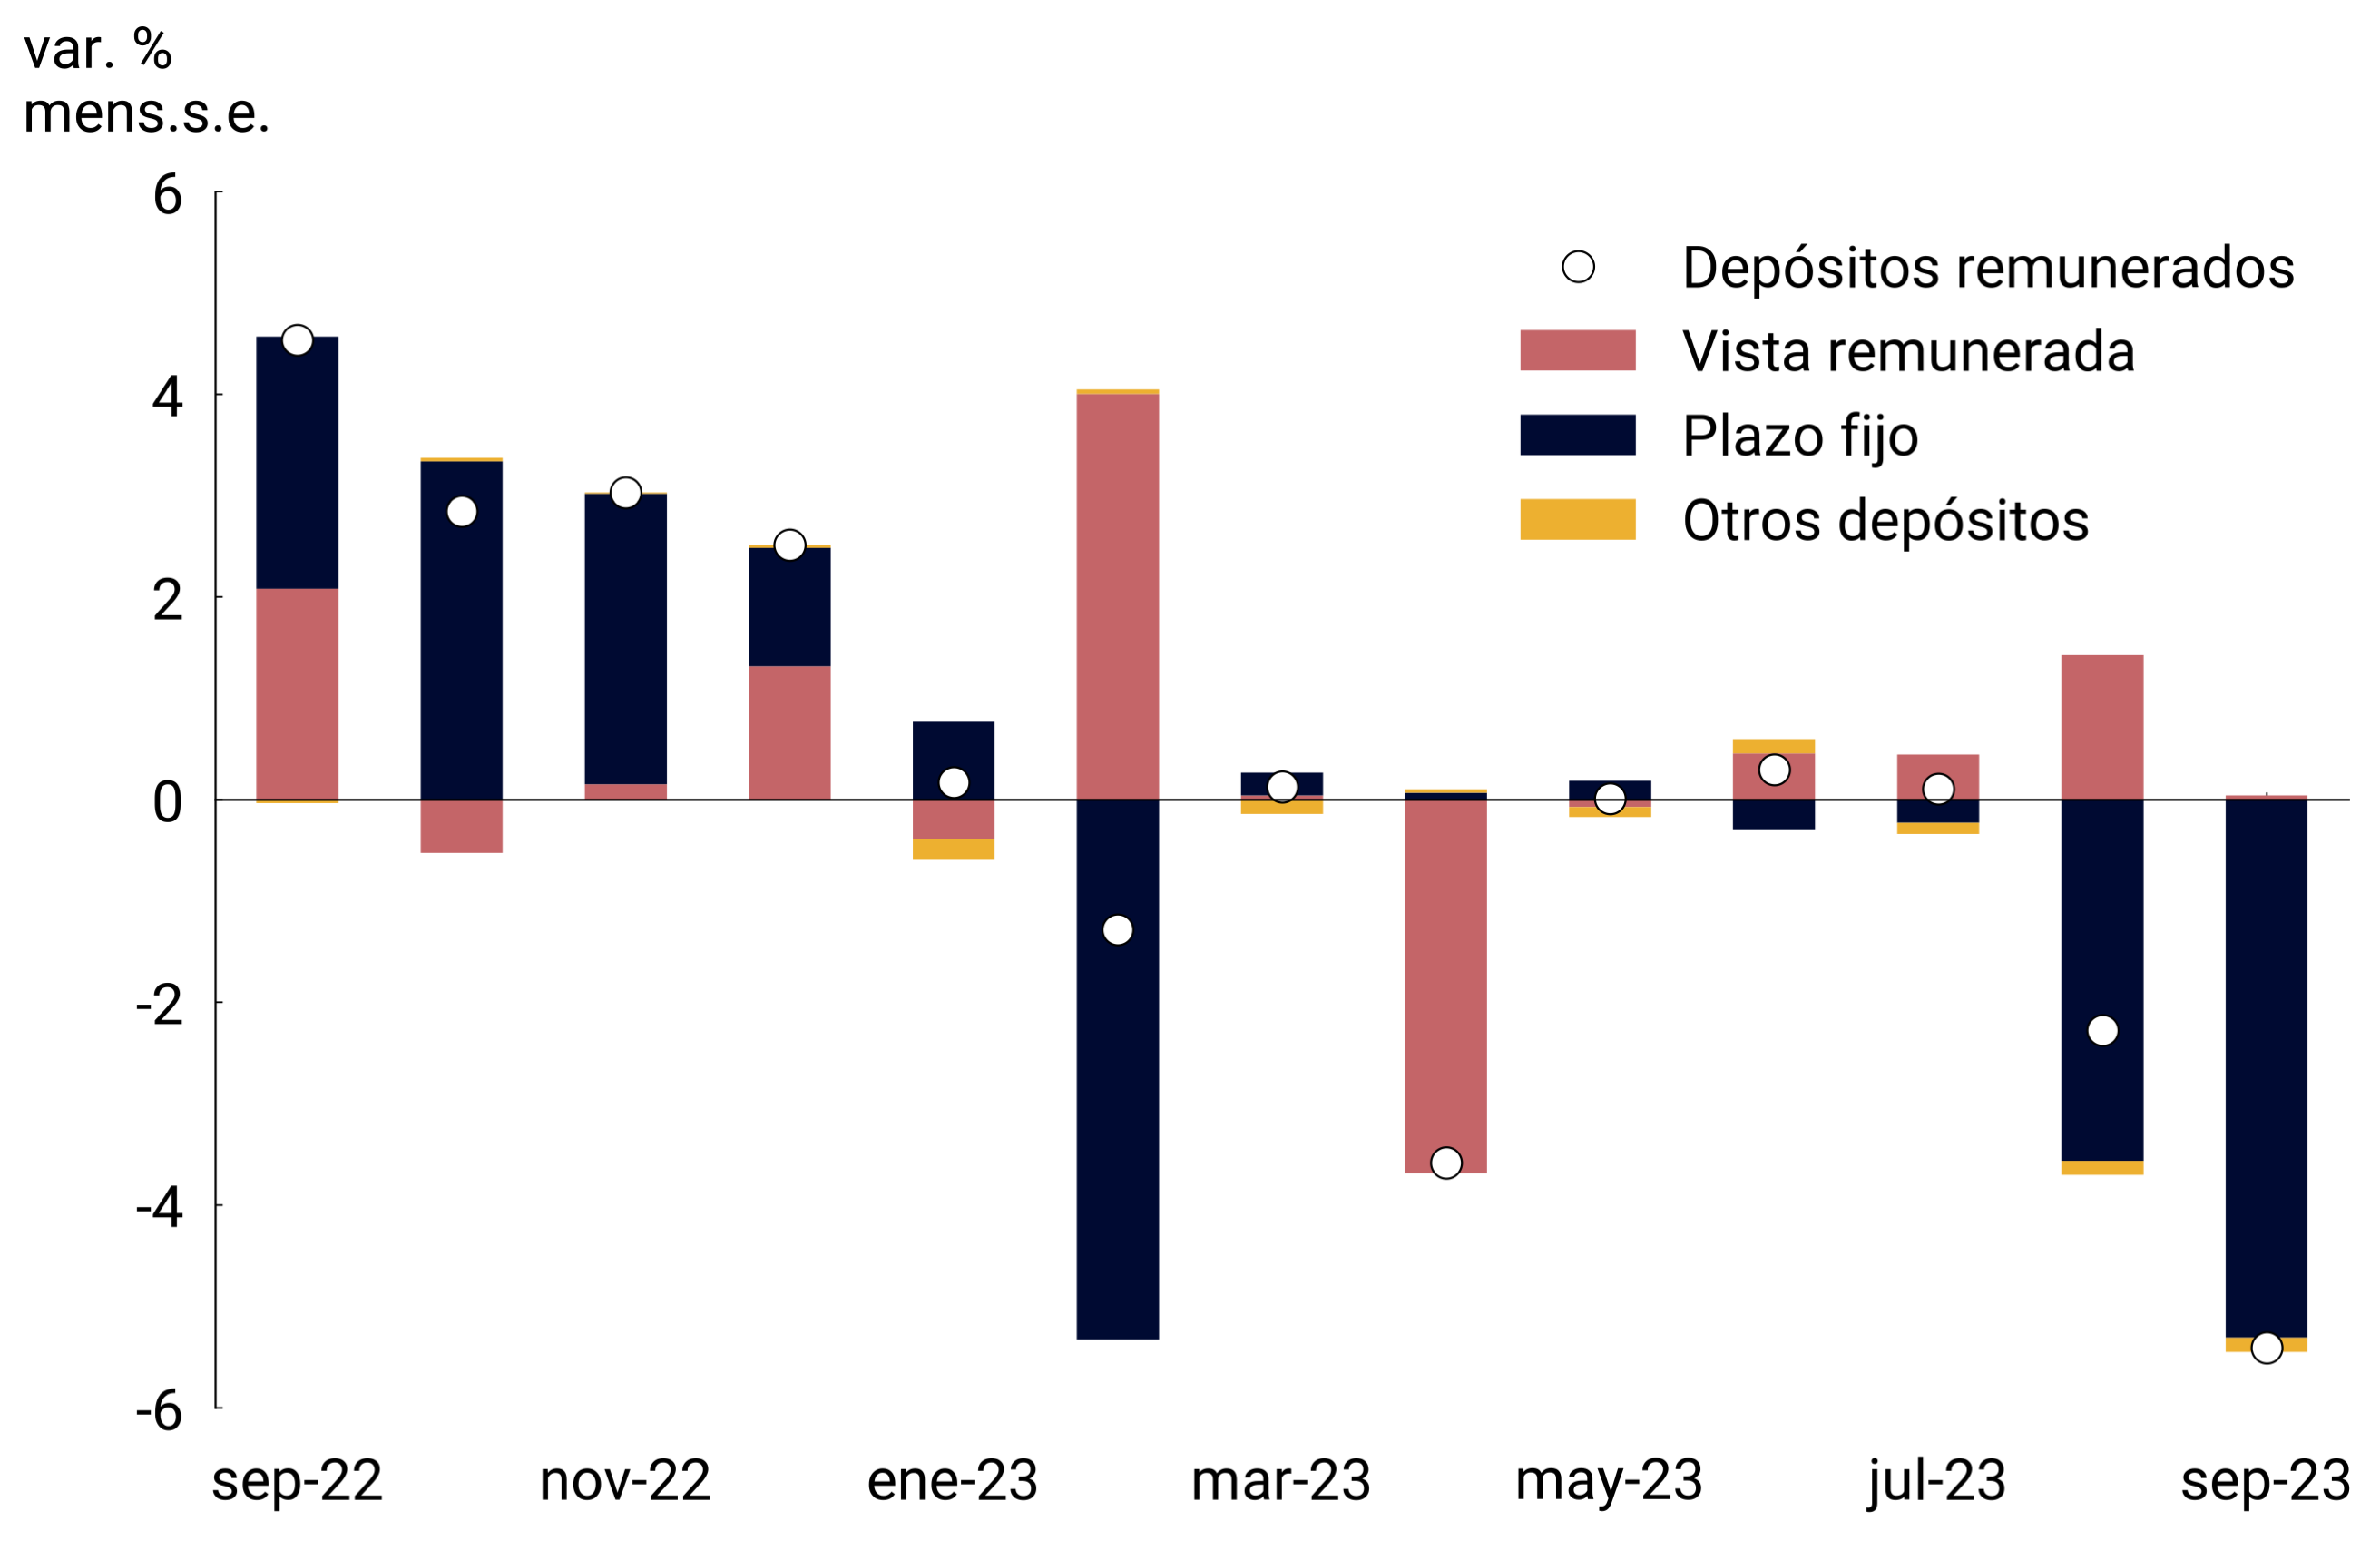
Source: BCRA.
This rotation in the composition of interest-bearing deposits was explained by the behavior of Financial Services Providers (FSPs), whose main players in the deposit market are the Mutual Funds of Money Market (FCI de MM). These agents opted for more liquid peso savings instruments, which explained the fall in their term positions and an increase in interest-bearing demand deposits. Thus, interest-bearing demand loans, which at the end of September already represented close to 90% of the FCI MM portfolio, expanded in real terms at an average monthly rate of 3% s.e. in the quarter, while the PSF time deposits remained stable on average.
Individuals and other companies also reduced their position in time deposits at constant prices and without seasonality in the quarter. In this context, fixed-term placements contracted in that period at an average monthly rate of approximately 4% at constant prices. However, these deposits remain historically high in both real terms and GDP (see Figure 7.8).
Figure 7.8 | Fixed-term
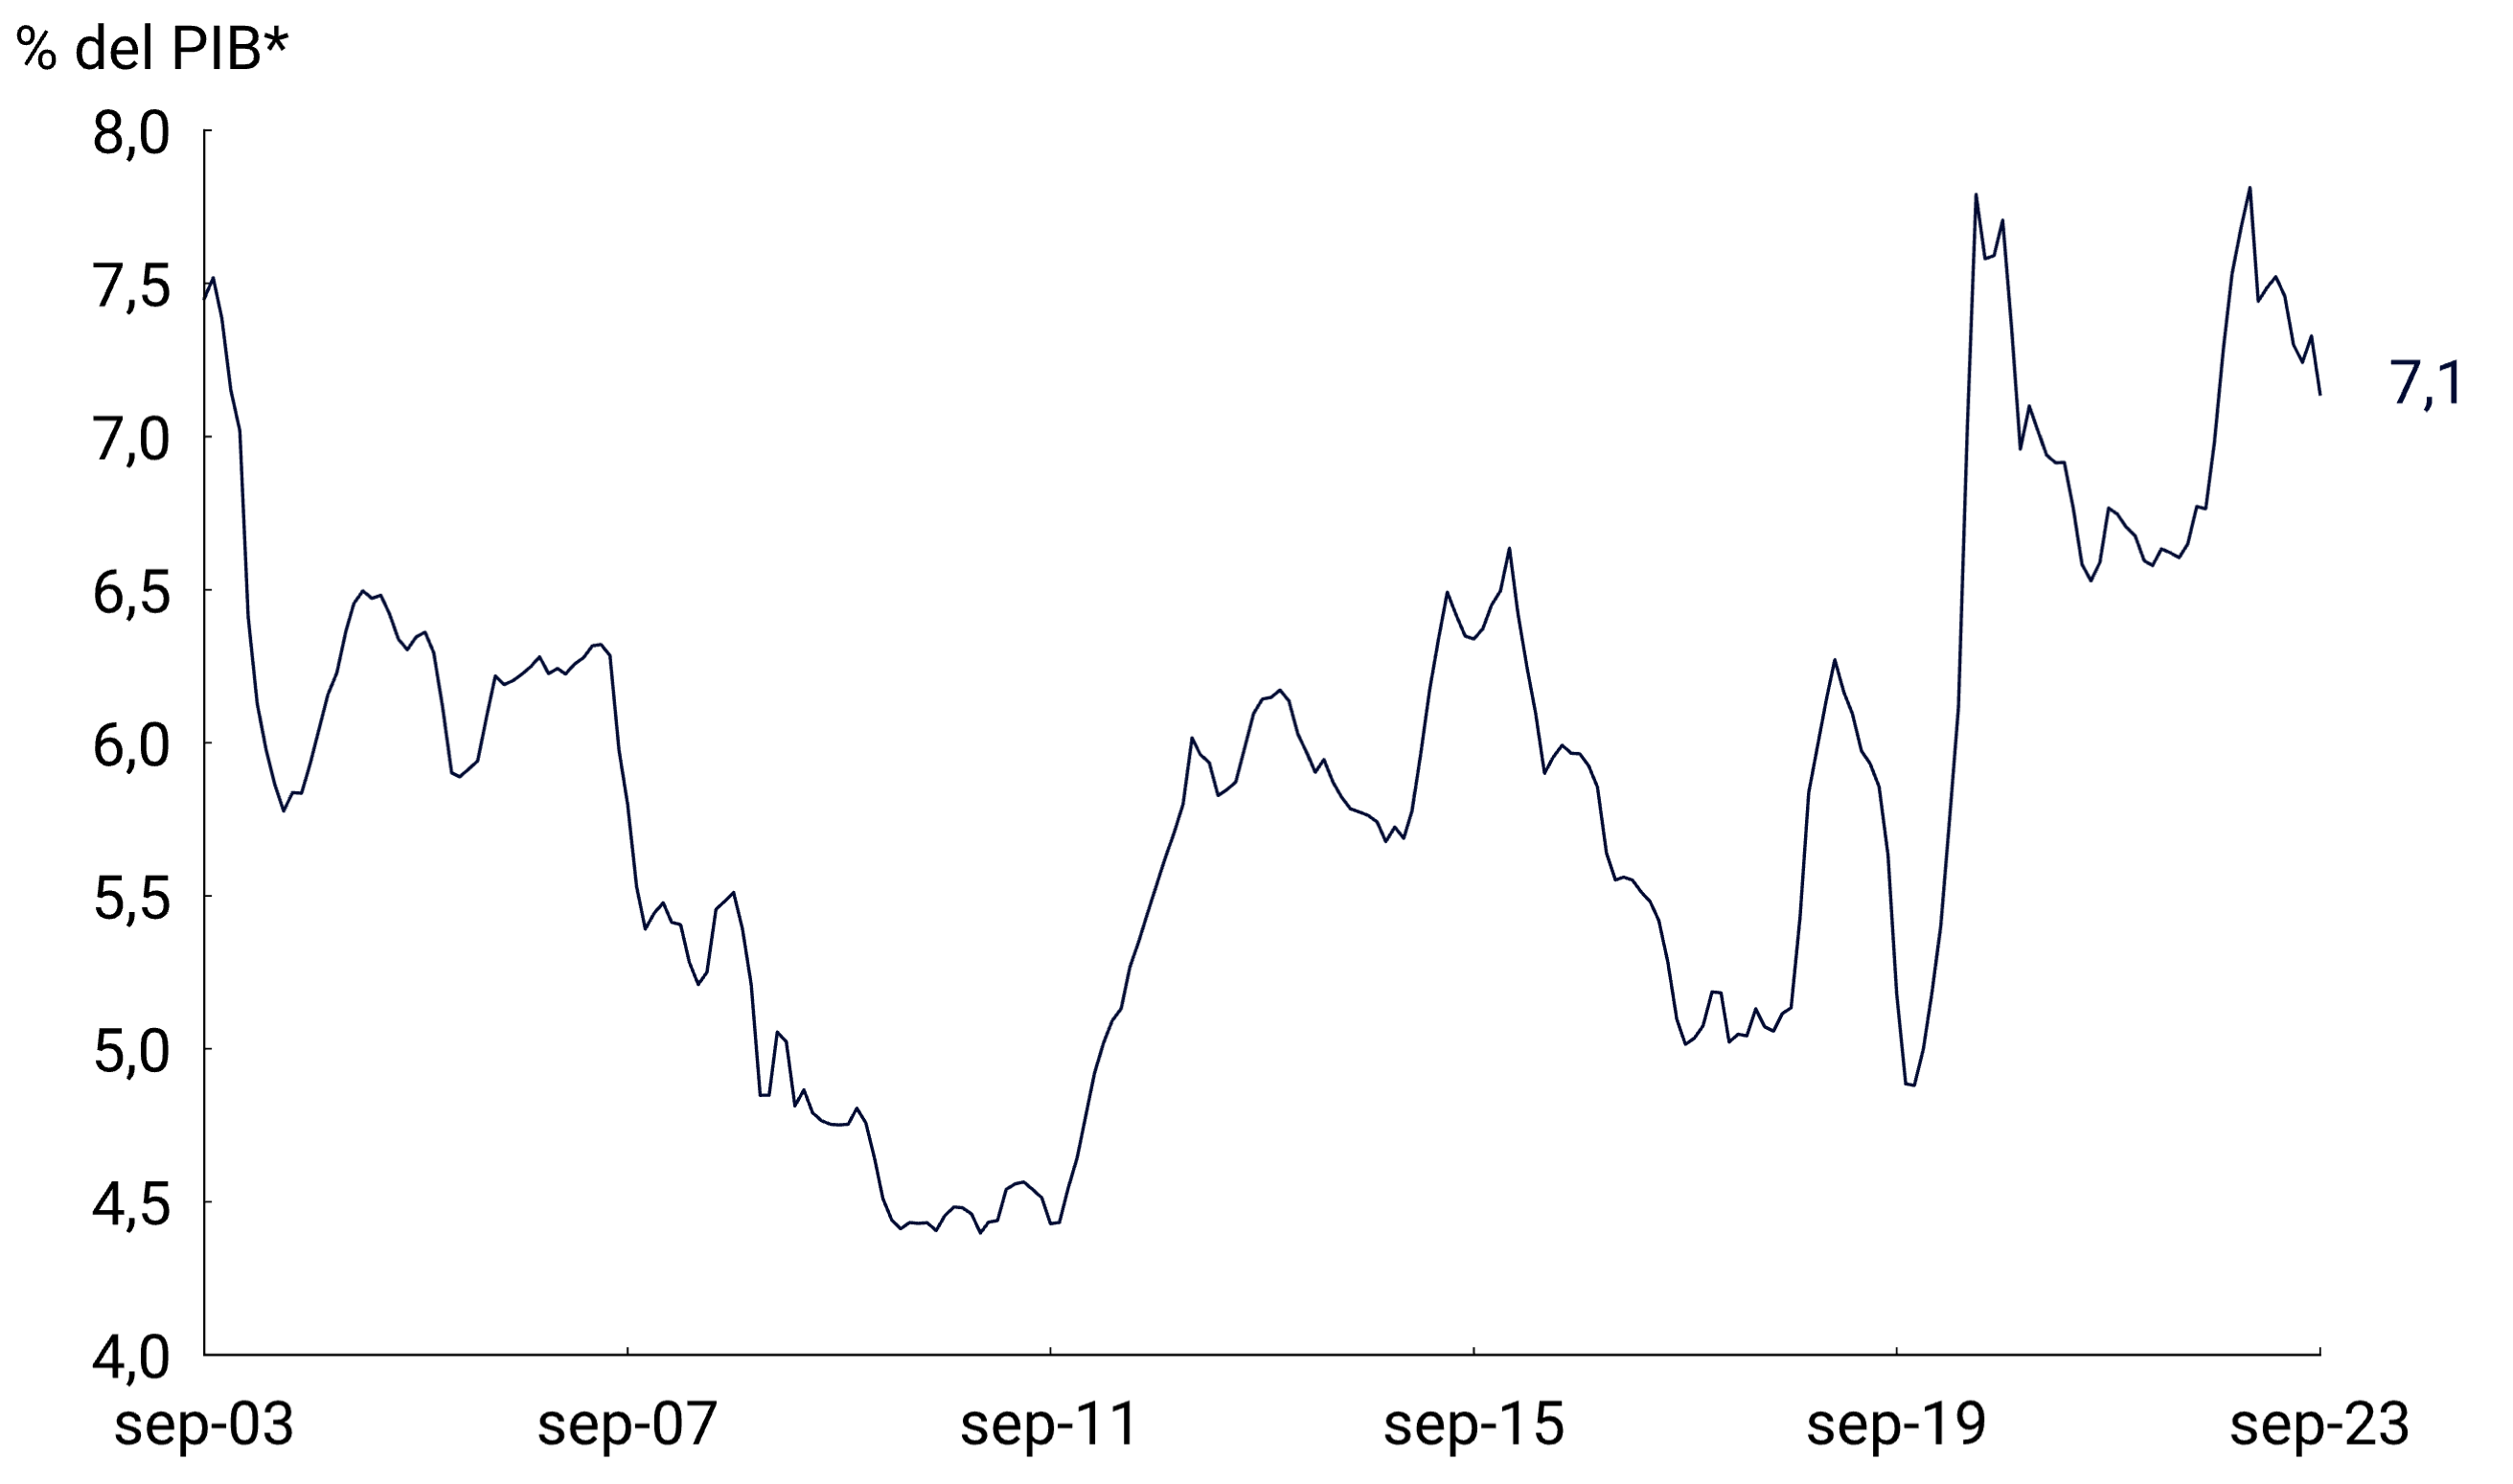
deposits
* Calculated using GDP s.e. moving prom. 3 months.
Source: BCRA.
However, during the third quarter, the broad monetary aggregate M3 private79 experienced an average monthly contraction of 3.3% s.e. at constant prices (-12.5% y.o.y.). As a ratio of Output, the broad monetary aggregate stood at 16.6%, which implied a fall of 1.2 p.p. so far this year.
7.4. Credit policy continued to focus on sustaining financing for MSMEs
The BCRA maintained its credit policy focused on productive development. The Productive Investment Financing Line (LFIP) continued to be the main tool used to channel productive credit to MSMEs.
Since its implementation, and with data up to September 2023, loans granted under the LFIP accumulated disbursements of approximately $7.9 billion. This implied an increase of 160% compared to the record of the same month in 2022. By the end of that month, approximately 480 thousand companies had accessed loans within the framework of the LFIP. It should be noted that the average balance of active financing granted through the LFIP reached approximately $1.9 trillion in August (latest available information).
Despite the boost of the LFIP, commercial lines presented a contraction at constant prices in the third quarter of the year, which was concentrated in the months of August and September. The average monthly rate of change for the period would have been -3.7% s.e. at constant prices. At the level of the main commercial lines, advances registered a greater contraction than documents in the quarter. Thus, in year-on-year terms, financing granted through advances contracted around 18% at constant prices, while the balance of documents remained at a level similar to that of a year ago.
When analyzing the composition of commercial loans by type of debtor, we observe that, as a ratio of Product, bank financing to relatively smaller companies was above the pre-pandemic record and the historical average. In contrast, in the case of large firms, the credit-to-GDP ratio is around the lowest in historical terms (see Figure 7.9).
Figure 7.9 | Business loans by type of debtor
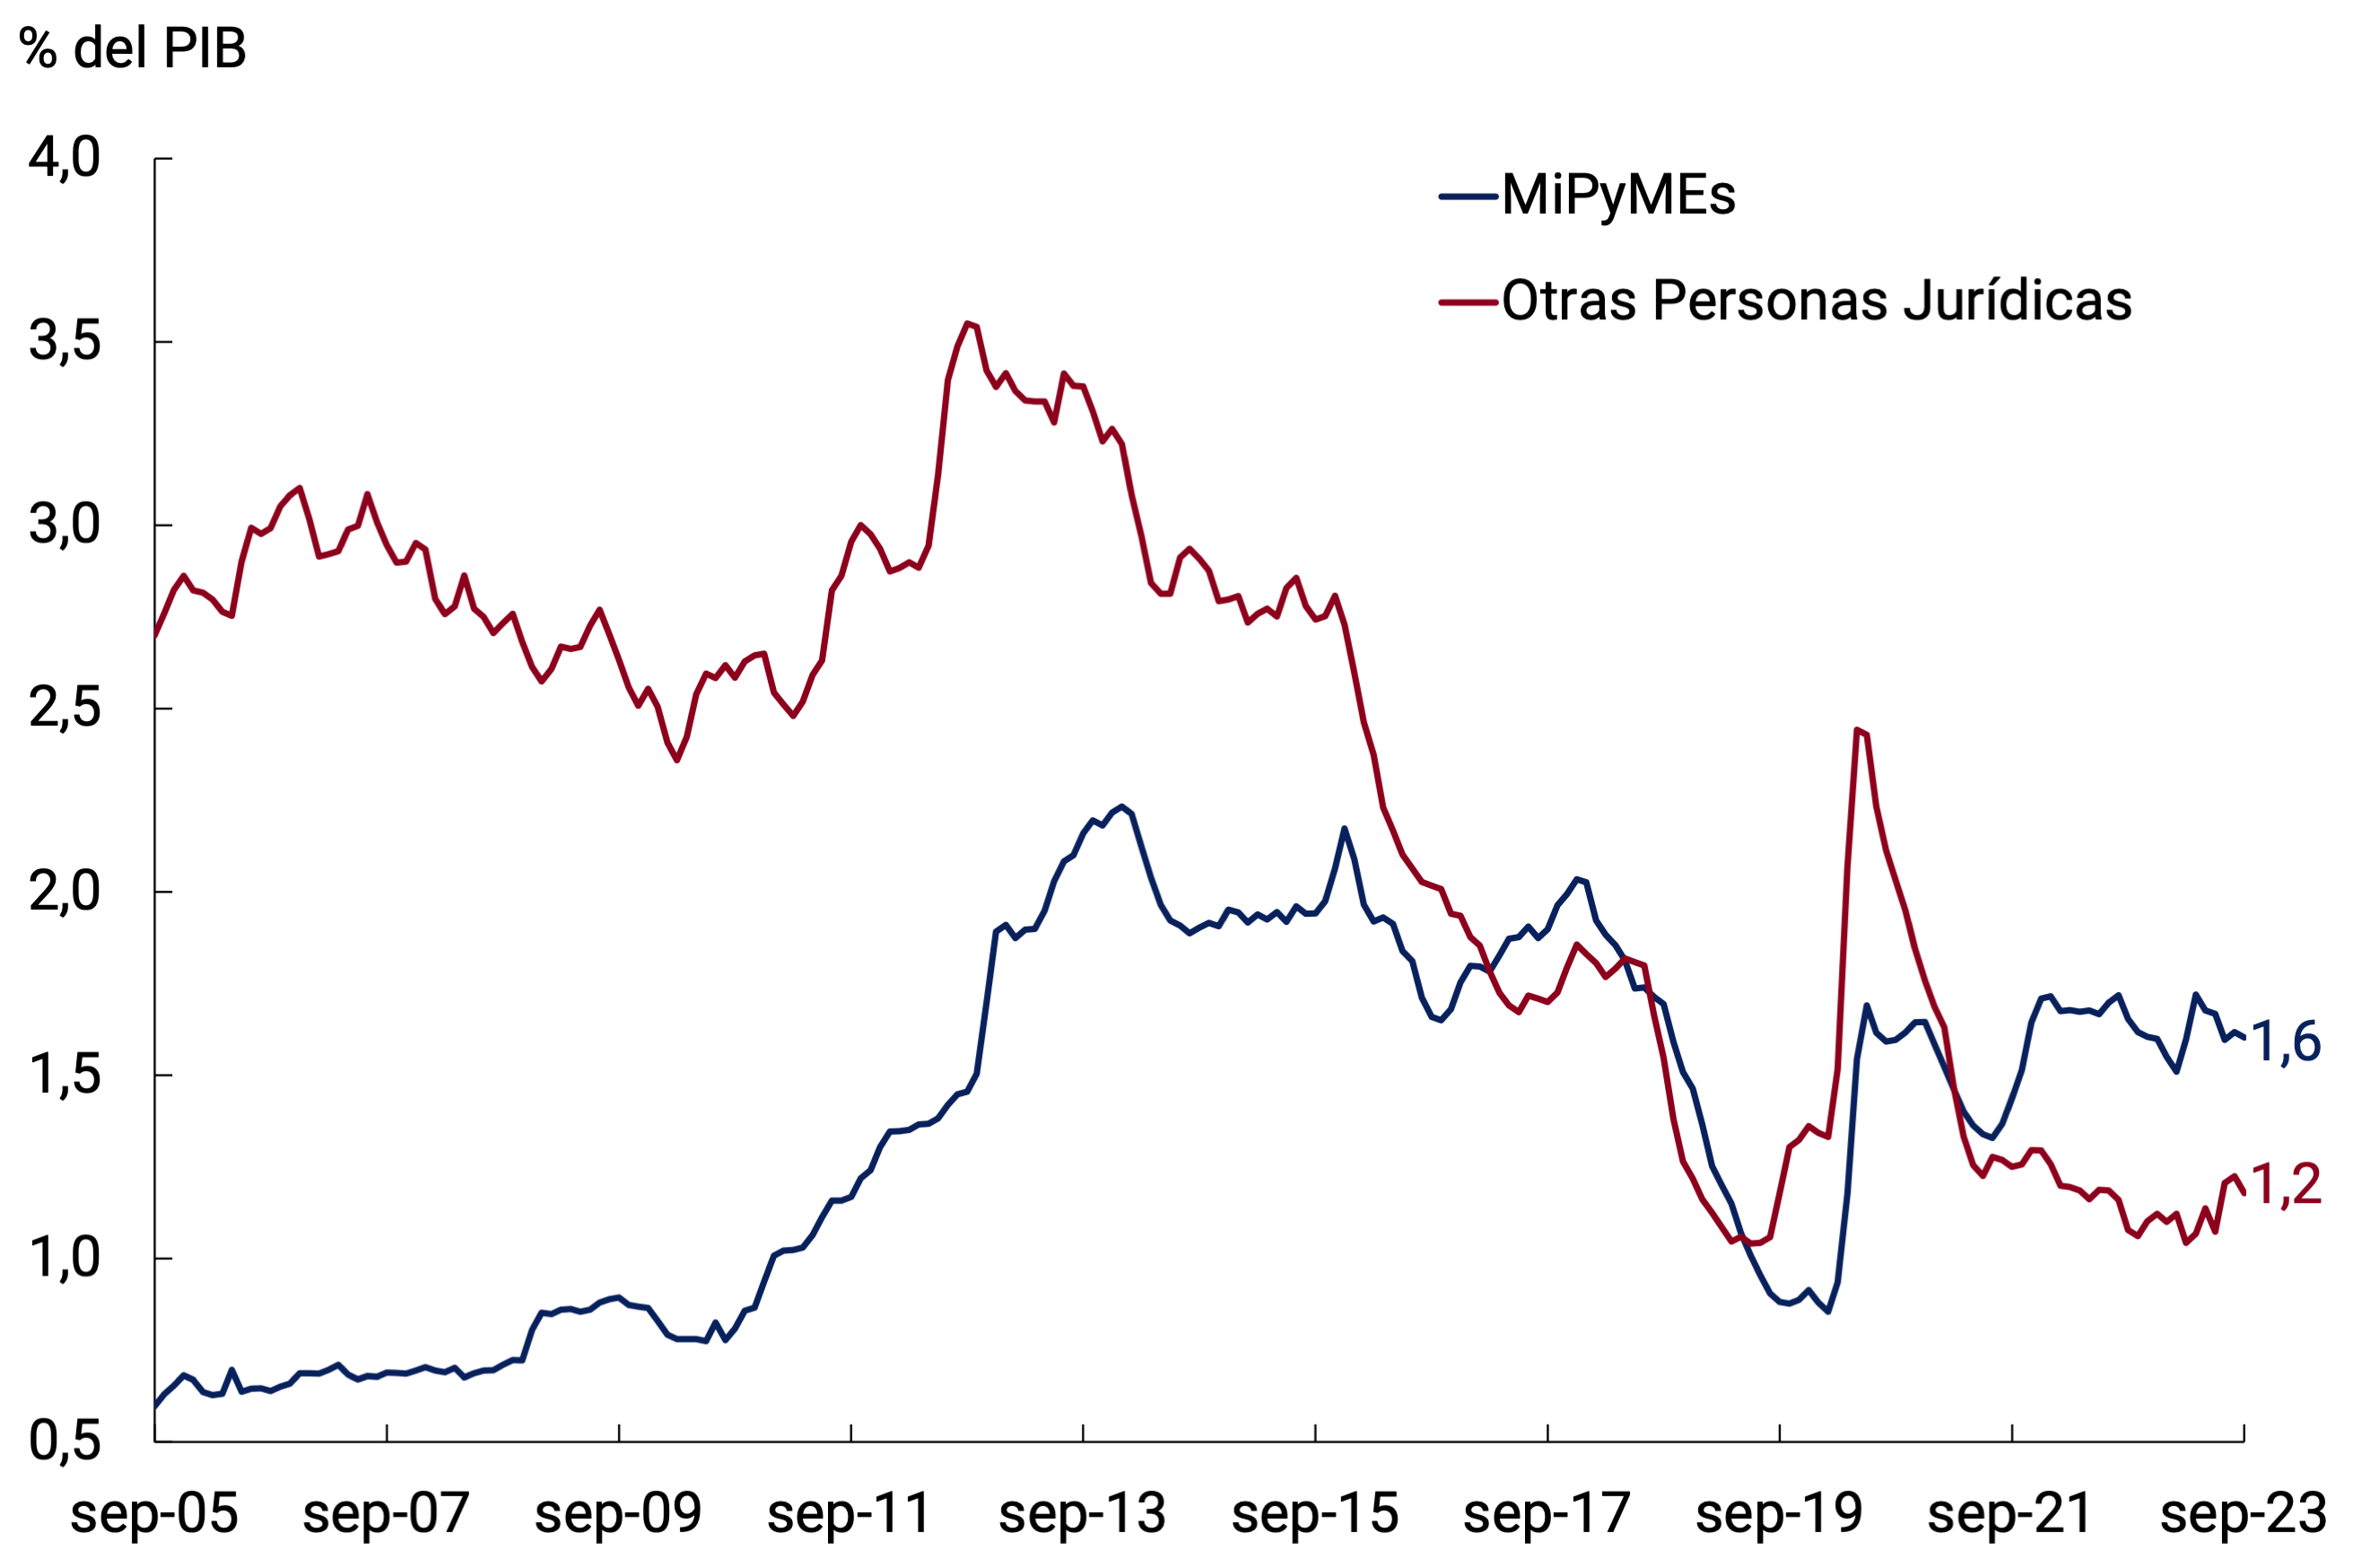
Source: BCRA.
The balance of consumer loans also contracted in the period under review. At constant prices, the average monthly variation of credit card financing would have been 3.2% s.e. and that of personal loans 5.6% s.e. In year-on-year terms, these lines showed real declines of around 14% and 29% respectively.
Finally, with regard to lines with real collateral, the balance of collateral loans would have fallen in the third quarter at an average monthly rate of 4.9% s.e. at constant prices and accumulate a decrease of 22% in the last twelve months. For its part, the balance of mortgage loans fell at an average rate of approximately 5.9% s.e. per month in real terms, registering a contraction of close to 45.0% year-on-year.
However, loans in pesos to the private sector, measured at constant prices and without seasonality, registered a contraction in the third quarter of the year. Thus, the loan balance fell at an average monthly rate of around 4.0% in the quarter, accumulating a fall of close to 17% in year-on-year terms. In relation to GDP, bank loans to the private sector in pesos stood at around 6% in September (see Figure 7.10).
Figure 7.10 | Loans in pesos to the private sector as % of GDP
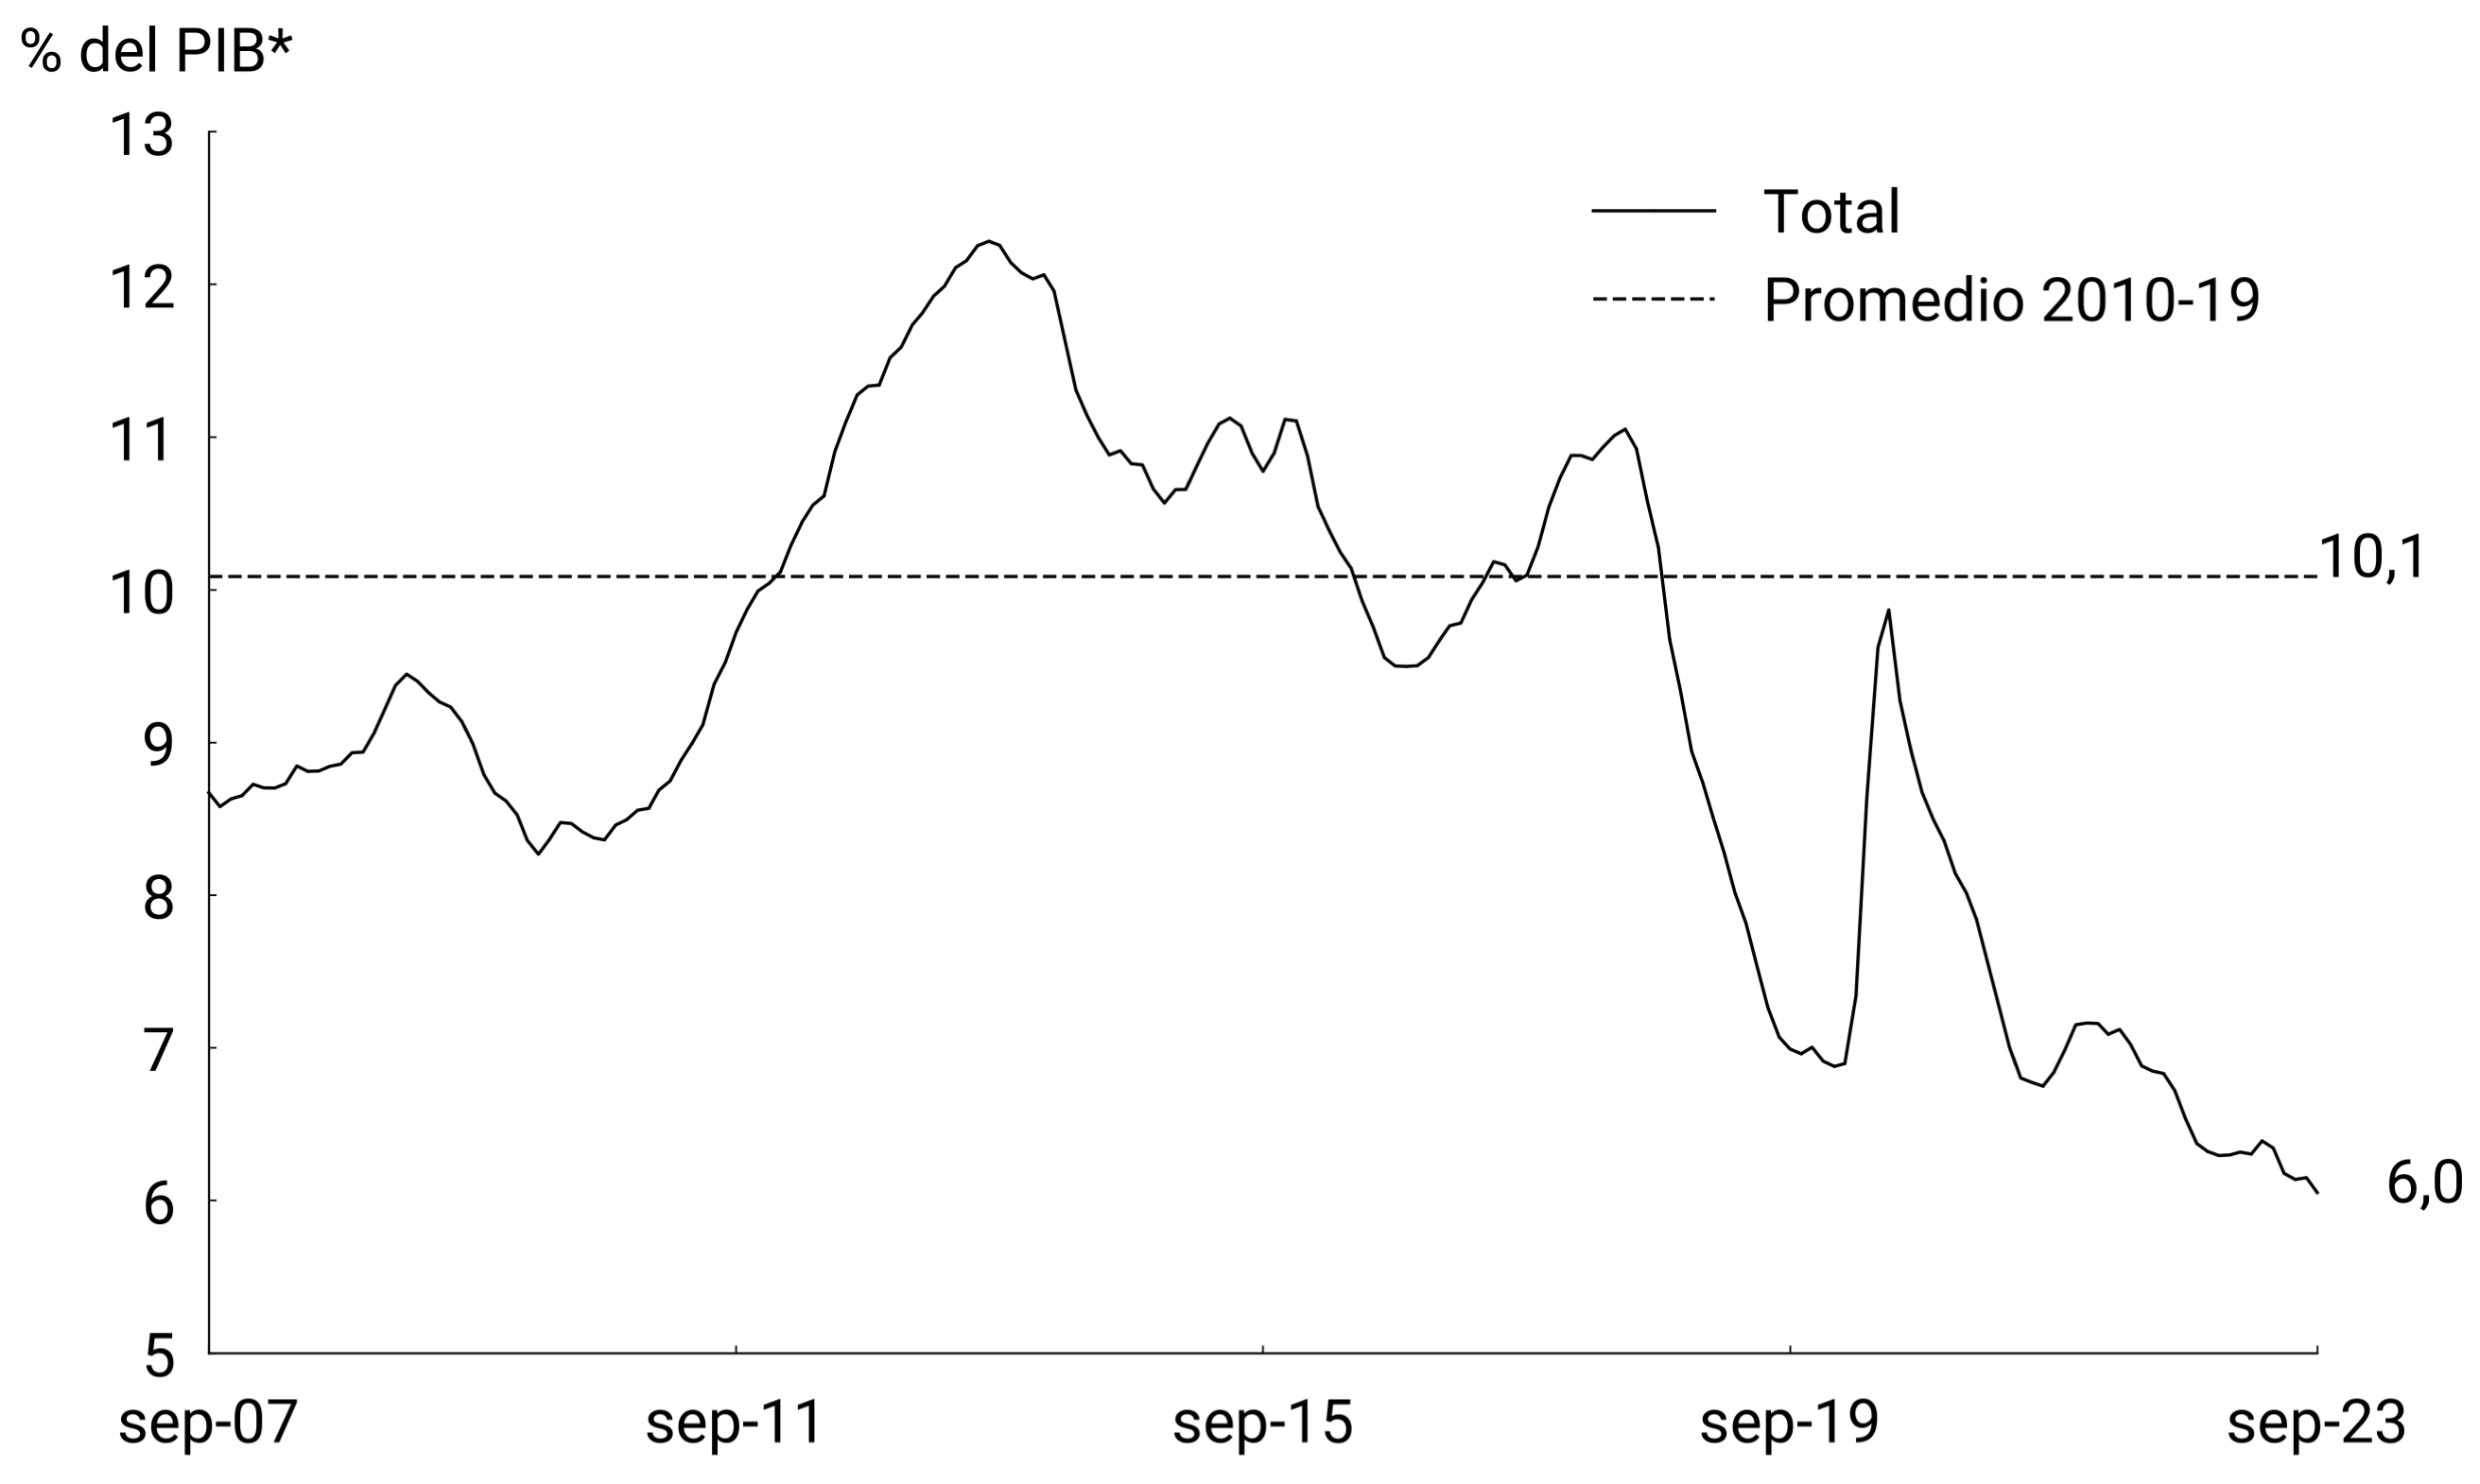
* Calculated using GDP s.e. mobile prom. 3 months.
Source: BCRA.
7.5. Monetary policy outlook for the rest of the year
The BCRA will continue to calibrate its policies in a context of greater volatility in the financial markets associated with the electoral cycle, while continuing to carry out prudent management of the current regulatory framework. To the extent that macroeconomic conditions permit, exchange rate regulations will be made more flexible, with the aim of maintaining in the medium and long term a set of macroprudential regulations compatible with the dynamization of capital flows aimed at the real economy.
In terms of interest rates, the BCRA will continue to monitor the macroeconomic situation, paying special attention to the past and prospective evolution of the general price level, the level of economic activity and the dynamics of the foreign exchange market. All this within the structural objective of the BCRA to tend towards returns that allow safeguarding the value of investments made in instruments denominated in domestic currency and to consolidate exchange rate and financial stability.
In order to continue supporting the recovery of economic activity, the BCRA will continue to stimulate credit intermediation, particularly that linked to productive development through the Financing Line for Productive Investment.
Likewise, the BCRA will continue to intervene in the secondary market of National Treasury instruments in order to avoid excessive volatility that compromises financial stability. In this sense, the intervention will be limited to maintaining the normal functioning of the market. Consolidating a transparent, deep and liquid peso debt market is a necessary condition for the development of the local capital market.
Finally, the BCRA will maintain a prudent administration of monetary aggregates, sterilizing any surplus liquidity, in order to preserve monetary balance.
Section 1 / Mercosur Local Currency Payment System (SML)
At the meeting of Mercosur finance ministers and central bank governors in July 2023, the central topic was macroeconomic convergence and the use of local currencies in regional trade. Since 2008, Mercosur’s central banks have created local currency payment systems (LWS) between the bloc’s countries. The SMLs aim to facilitate trade between countries in local currency (aiming at a lower use of the dollar), deepen the market for these currencies and reduce the cost of operations, especially for SMEs. This theme is part of international efforts to: improve cross-border payment systems, such as those made by the G20 in its Roadmap to Improve Cross-Border Payments; and developing capital markets in domestic currency, such as those carried out in the G20 International Financial Architecture group; or the development of international trade in local currencies stimulated by the BRICS group. This section describes how this system works, its potential benefits and limitations, how it is used, and measures that could encourage greater use of it.
The SML is a bilateral payment system for making payments for certain transactions between individuals and legal entities of two countries using local currencies. It aims to facilitate transactions between the two countries in local currencies and reduce foreign currency (US dollars) transfers between them. The implementation of the SML seeks to promote foreign trade in local currencies, deepen the market for those currencies and reduce transaction costs.
There are six SML agreements signed between the Mercosur countries that bilaterally bind the four countries of the region (the first in 2008). Most of the SML agreements signed allow the payment of trade in goods (plus services and associated expenses), the payment of trade in services associated or not with trade in goods, transfers for retirements and pensions and the payment of remittances. In the case of Argentina’s agreements with Paraguay and recently with Uruguay, payments for trade in services and the payment of remittances are allowed (the bilateral agreement of the SML has not yet been extended to this field with Brazil). The agreements do not include payments for financial services.
How does the SML operate?
The SML cycle has three major steps, which can require up to three days of operation at most. It begins with the person who imports/remits the funds, who registers the operation, reports the bank details provided by the exporting party and makes the payment in their own currency at an authorized financial institution in their country (see Diagram 1).
Diagram 1 | Diagram 1. Operation of the SML
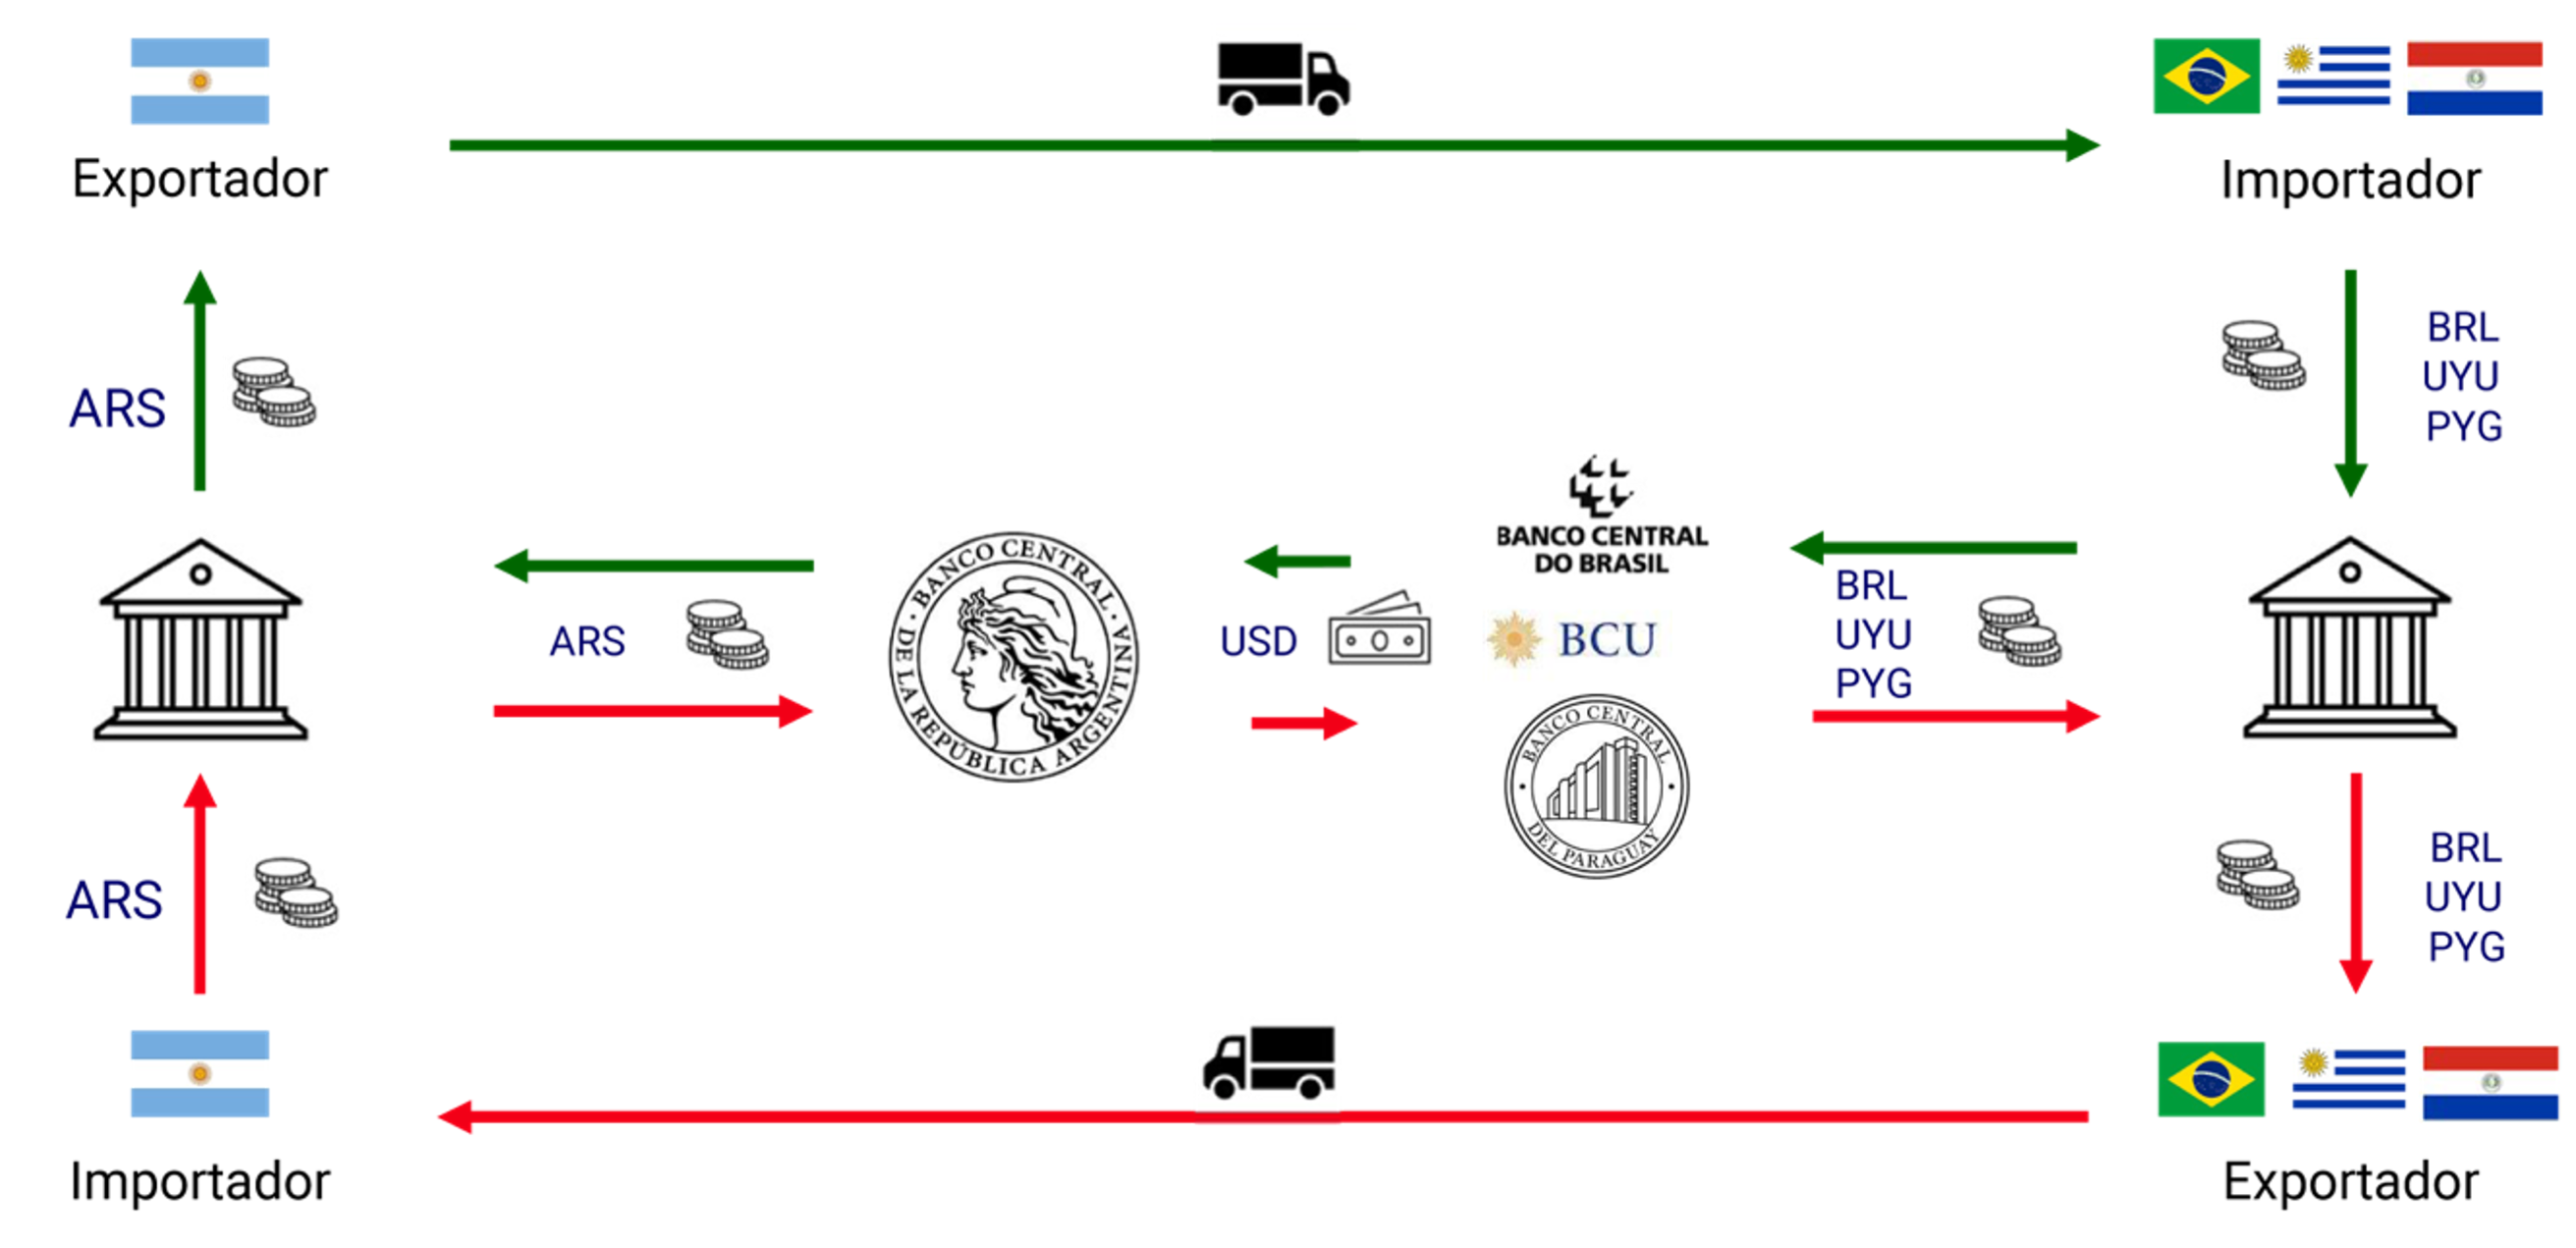
Source: BCRA.
Payment is made in local currency at the agreed exchange rate or at the SML Rate disclosed by the central bank at the end of the day. The SML Exchange Rate is representative of the wholesale market in the two countries and is a buyer-seller average. This rate is used to settle operations to the intervening banks and is published daily by the central banks. The exchange rate is uniform regardless of the volume of the transaction settled through the SML.
Secondly, the central banks control the confirmation of the payment of the operations declared on the previous day by the financial institutions and the balance between the operations of both countries is calculated. The balance is calculated based on the sum of the values of the operations carried out by the SML on the day, in the currency originally registered, converted to the dollar based on the reference exchange rates of each country. The value thus obtained in dollars is settled by the debtor central bank through its correspondent in New York.
Finally, each central bank informs the respective financial institutions and credits their accounts with the amount corresponding to the payments made by the SML to be transferred to exporters and/or social security beneficiaries in local currency.
Advantages of the SML
The main potential advantage of the SML is the reduction of costs for its users, in particular for SMEs. The exchange rate used is representative of the wholesale market, and does not change with the volume of the transaction; this allows companies, especially SMEs, to access a lower exchange rate. On the other hand, administrative expenses are lower, since central banks do not charge commissions or expenses to each other and do not charge financial institutions expenses of any kind. Likewise, an interconnection of the payment systems of the countries of the region is generated through a cross-border payment infrastructure.
Degree of use of the SML
The use of the SML by the countries of the region varied over time, but is still low. The SML as a percentage of bilateral trade between the countries that make up Mercosur is a value that ranged between 1% and 4% in the last decade, so there is room to continue growing (see Graph 1).
Graph 1 | Trade carried out through the SML as a percentage of total trade (exports plus imports) in Mercosur
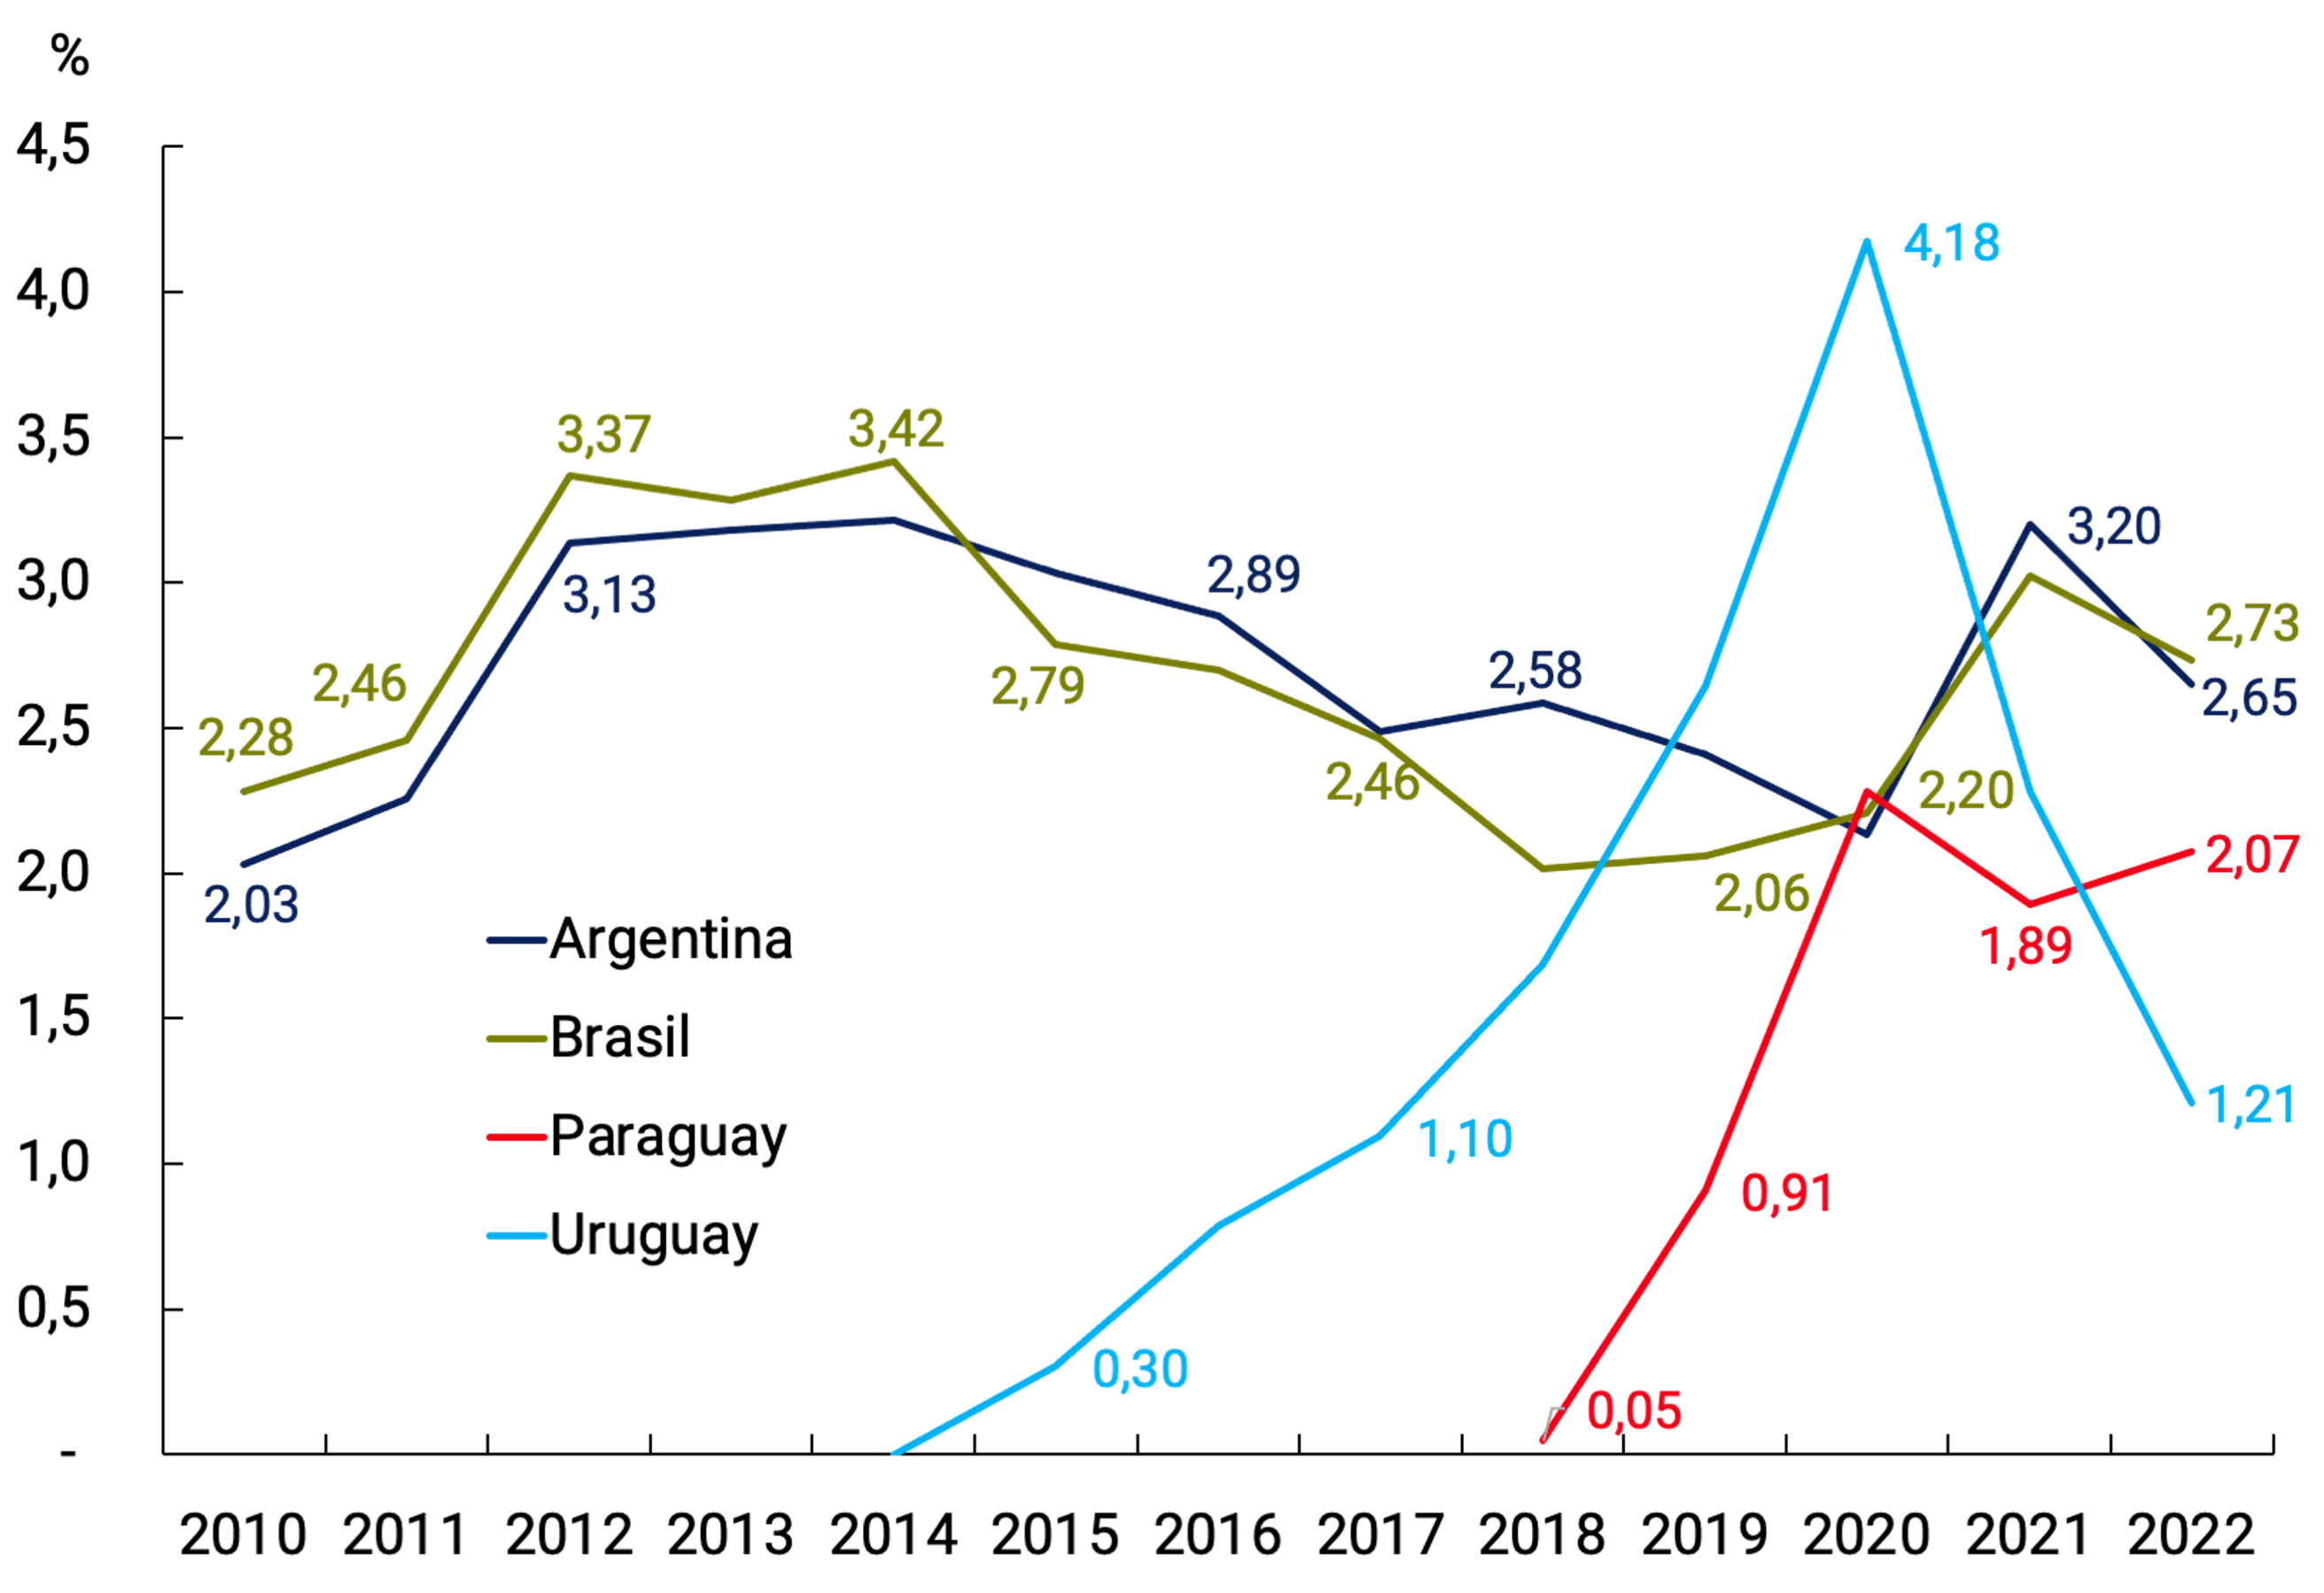
countries
Source: Central Banks and Statistical Institutes of Mercosur.
Among the factors that explain its low use can be mentioned: a low knowledge of the SML by users and their eventual difficulty in perceiving the advantages of its use (such as lower exchange rate and/or lower commissions). Linked to this, there is a misalignment of the incentives of financial institutions that results in few banks offering the SML and in the lack of interest in encouraging their customers to use it. The 2-3 day timeframe could also be a disadvantage as it involves some currency risk. In the case of retirement and pension payments, the delay in some of the agreements between the countries’ pension funds makes it difficult for the system to function properly for this type of transfer.
Likewise, factors more linked to the macroeconomy should be noted: the demand for local currency by those who operate in foreign trade depends on its attractiveness as a medium of exchange and store of value. In this way, the exchange rate volatility of the region’s currencies threatens the use of local currencies in general. This may be reflecting the impact of asymmetric shocks or differentiated policy responses to common shocks that translate, for example, into disparate inflation rates or very different exchange rate regimes among countries in the region.
How to encourage greater use of the SML?
The diagnosis of the low use of the SML reveals a series of possible actions for the improvement of the system. These range from a shorter to a longer term, and from less to more complex in their implementation.
In the short term, operational aspects of the system can be improved. They include further promoting the operation and use of the SML; aligning banks’ incentives to encourage greater use of the system; reducing payment terms to reduce costs and exposure to foreign exchange risk; and to speed up agreements between the region’s pension agencies.
Among the longer-term and more complex recommendations, bilateral to multilateral agreements could be shifted: they can help allocate liquidity more efficiently and reduce exchange rate volatility. Another way to encourage the use of the SML would be to offer lines of credit for foreign trade operations that are carried out exclusively through the system; It would be a way of “stimulating demand”, making operations through this system more attractive to potential users.
From a macroeconomic point of view, the maintenance of low inflation rates and greater homogeneity of exchange rate regimes, including exchange rate regulations, can help to reduce exchange rate volatility. More stable local currencies help to stimulate demand and holding on the balance sheets of the region’s central banks.
Over the longer horizon, greater macroeconomic convergence and the reduction of exchange rate volatilities may open the door to developing an SML with compensation in Mercosur currencies, avoiding net compensation with dollars, which would reduce the demand for reserve assets in non-Mercosur currencies.
Section 2 / Real and Financial Determinants of Productive Investment at the Firm Level: Structural Trends and Post-Pandemic Changes in Latin America (1995-2022)
Introduction
In this section, we study the long-term determinants of productive investment and the new post-pandemic dynamics for the main countries in Latin America4, using information from accounting records and distinguishing the effects by company size5.
Recent documents indicate that, in both developed and emerging countries, Gross Capital Formation (GFK) managed to recover after the recession caused by the COVID-19 pandemic, although without resuming the previous growth trend (Schabel, 2023). In Latin America, on the other hand, the GFK during the post-pandemic remains at levels considerably lower than in 2019 and with signs of slowing down (ECLAC, 2022). In parallel to this dynamic, recent statistics indicate an overaccumulation of liquid financial resources immobilized on the balance sheets of companies in emerging countries, contributing to pessimism about the new investment dynamics (IMF, 2022).
Trends during the period
Graph 1 shows the evolution of productive investment in the region between 1995 and 2022, as recorded by the national accounts and information from the balance sheets of companies6. In both cases, there are 3 different stages for the growth and investment cycle. The first of these covers the period 1995-2002, when investment expanded until 1998, and then stagnated and began a contractionary cycle from 2002, coinciding with the crises in Brazil in 1998 and Argentina in 2001. In the second stage, from 2003 to 2012, there is an expansion in parallel with the cycle of improvement in the terms of trade and income distribution, even with the brief interregnum of the impact of the international financial crisis in 2008/09. Then, from 2012 onwards, investment shows a gradual slowdown, which transforms into a fall during the pandemic in 2020, and then recovers, although without exceeding the maximum levels reached in the previous cycle.
Graph 1 | Dynamics of gross capital formation and productive investment of companies in Latin America 2000 to 2022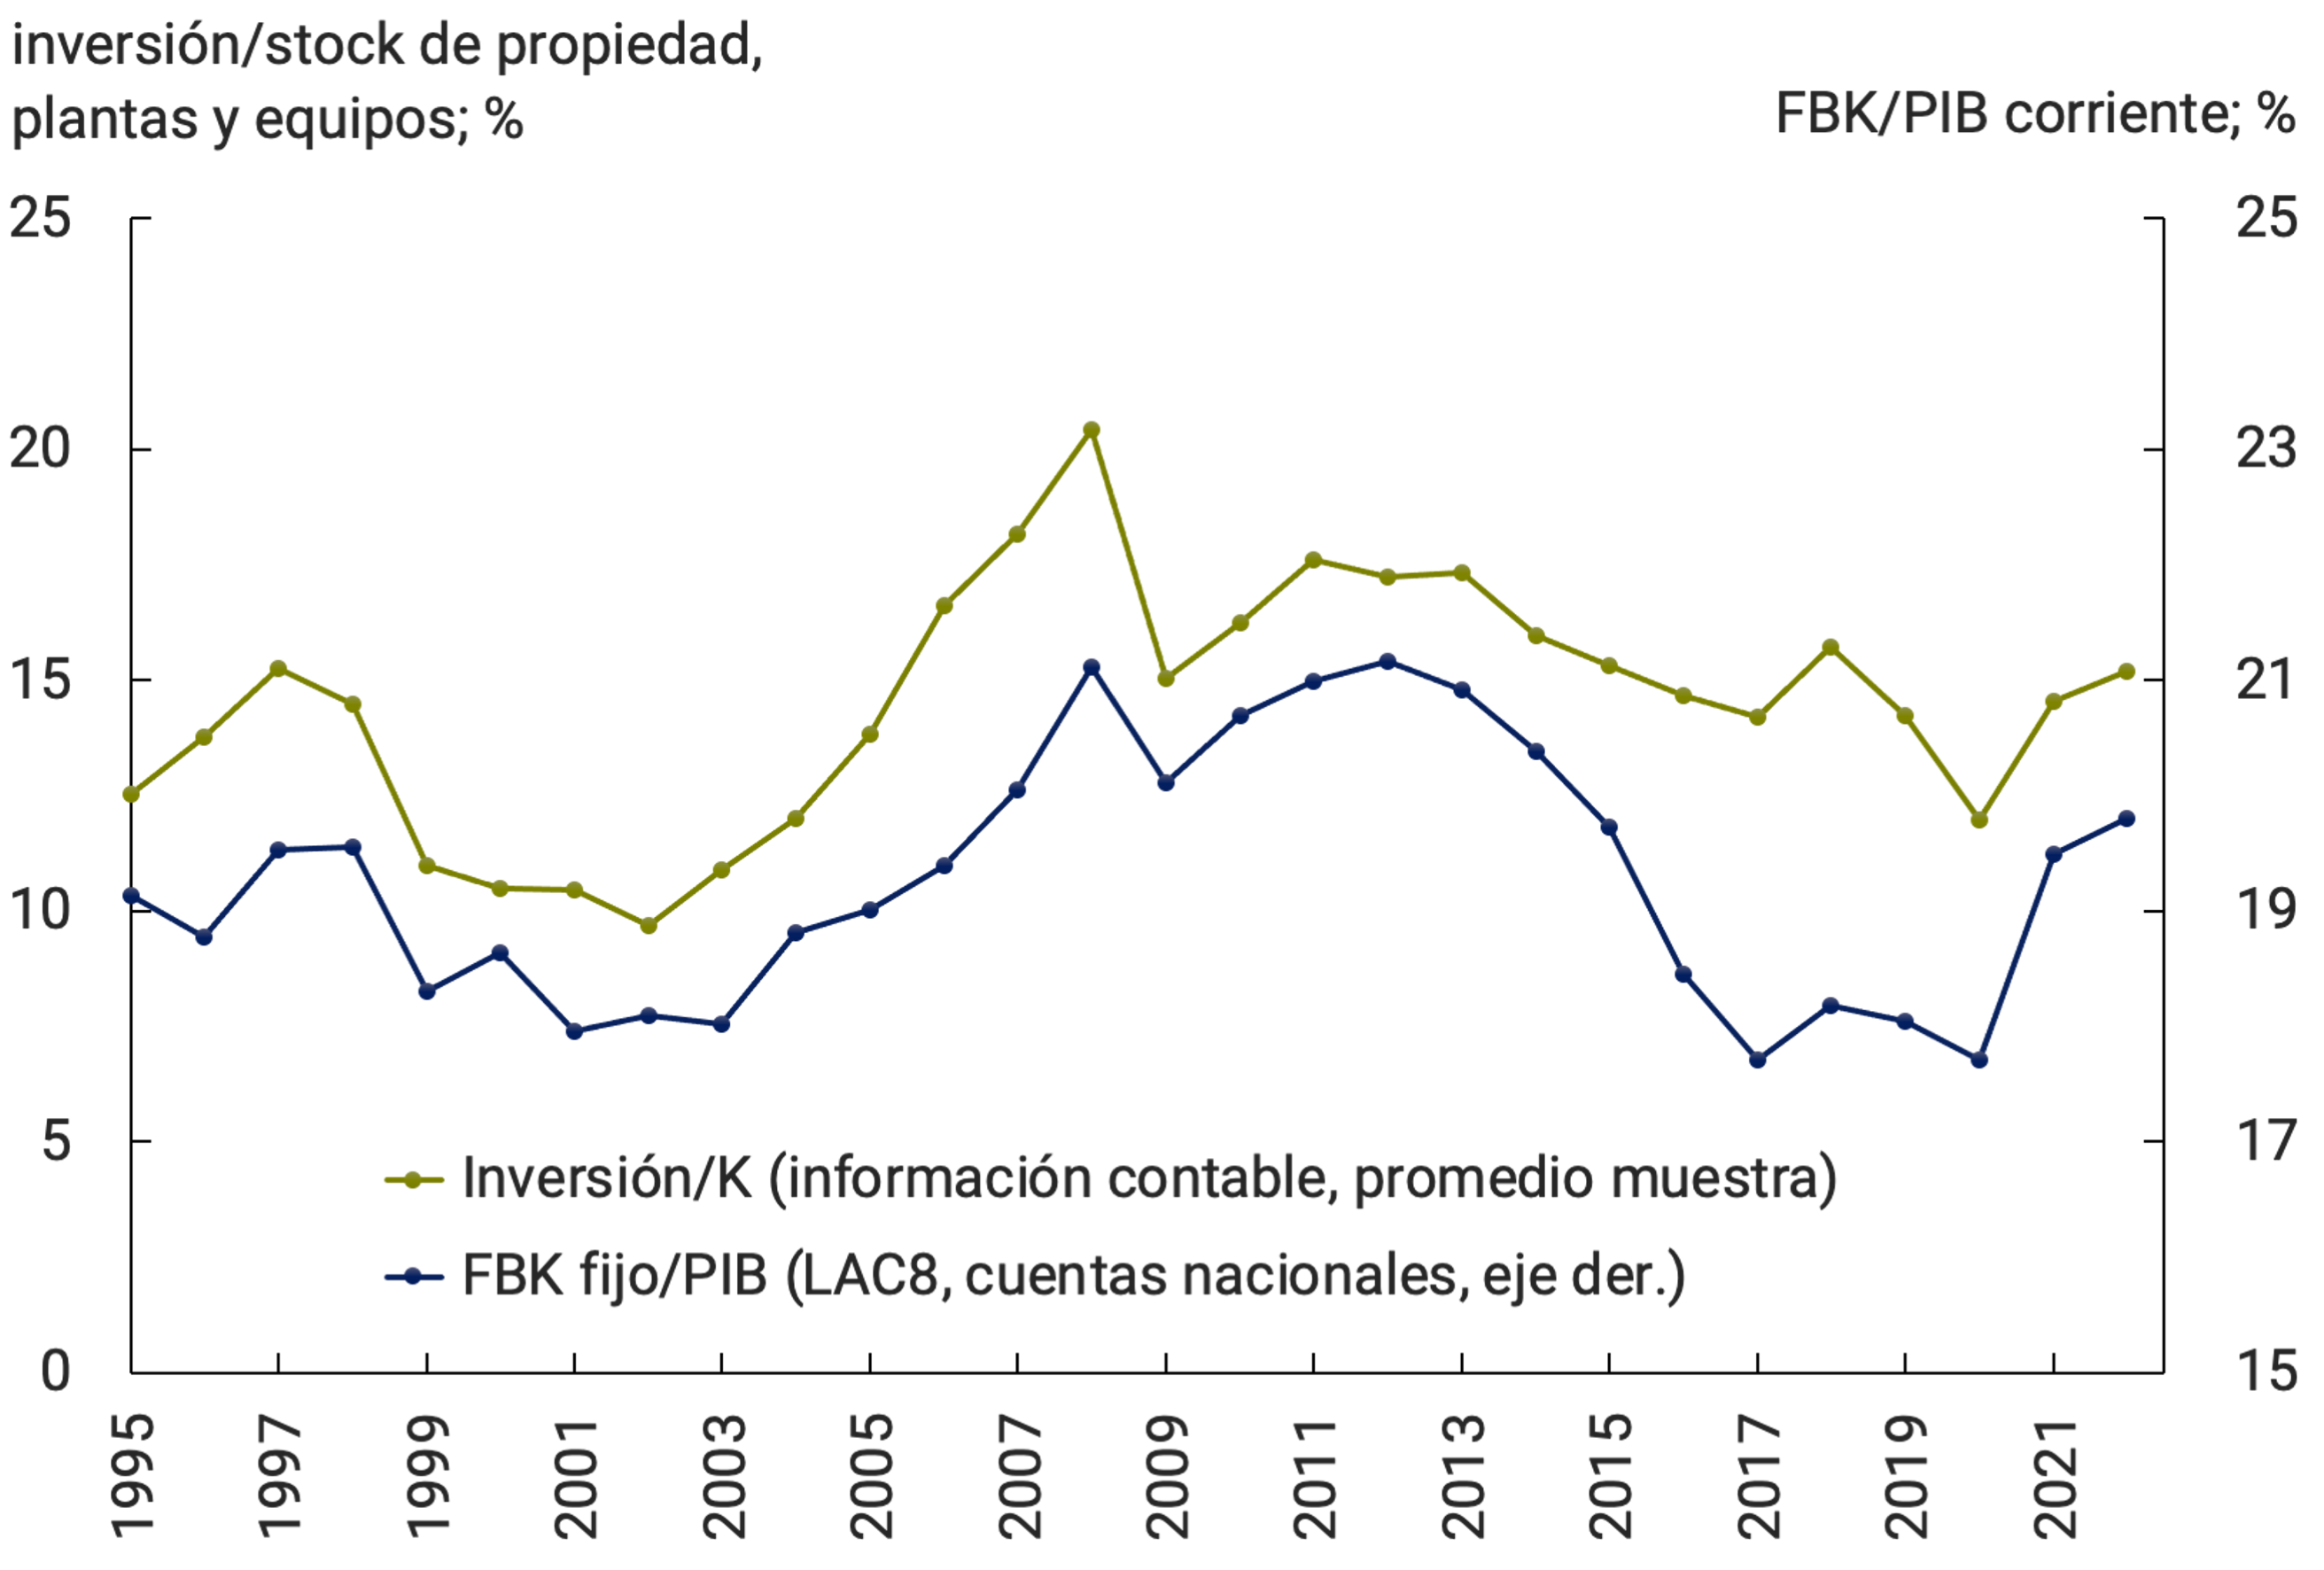
From 2018 to 2022 information not available for Venezuela. Year 2022 includes projected national accounts data based on national statistics. Source: BCRA based on data from ECLAC, Reuters-Eikon and National Statistics7.
Graph 2, in turn, shows the changes in the composition of the financial structure of firms. Between 1995 and 2022, there was an increasing trend in the ratio of holdings of financial assets to productive assets. This dynamic changes over time and, it should be noted, is heterogeneous depending on the size of the firm. First, the increase is persistent for all 3 stages of investment, peaking during the global financial crisis and in the pandemic, although in neither case does it register a complete reversal to previous levels. Secondly, the greatest dynamism is observed in the Current Financial Assets component (Demand funds, short-term bonds, fixed-term deposits), which suggests the relevance of carry-trade investment strategies. Third, this expansion of financial assets on balance sheets was more accentuated in larger firms.
Graph 2 | Dynamics of the holding ratio of financial assets to productive assets according to size of firms
In percentage

Source: BCRA based on data from Eikon-Reuters.
Econometric Analysis
To analyze how transformations in the firm’s financial-equity structure have modified the long-term determinants of productive investment, we estimate an investment function8. The dependent variable will correspond to the accounting record of net expenses in plants, properties and equipment adjusted by the capital stock. The explanatory variables include a standard set of controls, similar to previous studies for Argentina and the region, among which is the investment in the past as an estimator of the inertial effect; sales, operating profit and stock valuation (Q-Tobin) – as a proxy for the higher utilization rate and favorable expectations about investment – and total debt, which measures the degree of leverage. Then, a particular set of controls is included, less treated in the traditional literature, linked to financial flows and assets, such as income (interest, dividends and exchange differences), payments (interest and dividends paid) and assets (cash, current financial assets and non-current financial assets) that account for recent transformations in the financial practices of companies.
The results of the estimate are presented in Table 1 below. Two models were estimated. On the one hand, a general specification that includes the standard and additional controls already mentioned; on the other hand, a specification that, in addition, distinguishes by the size of the signature. Likewise, two temporary cuts are presented to test robustness and changes in the results9, 9.
Table 1 | Determinants of productive
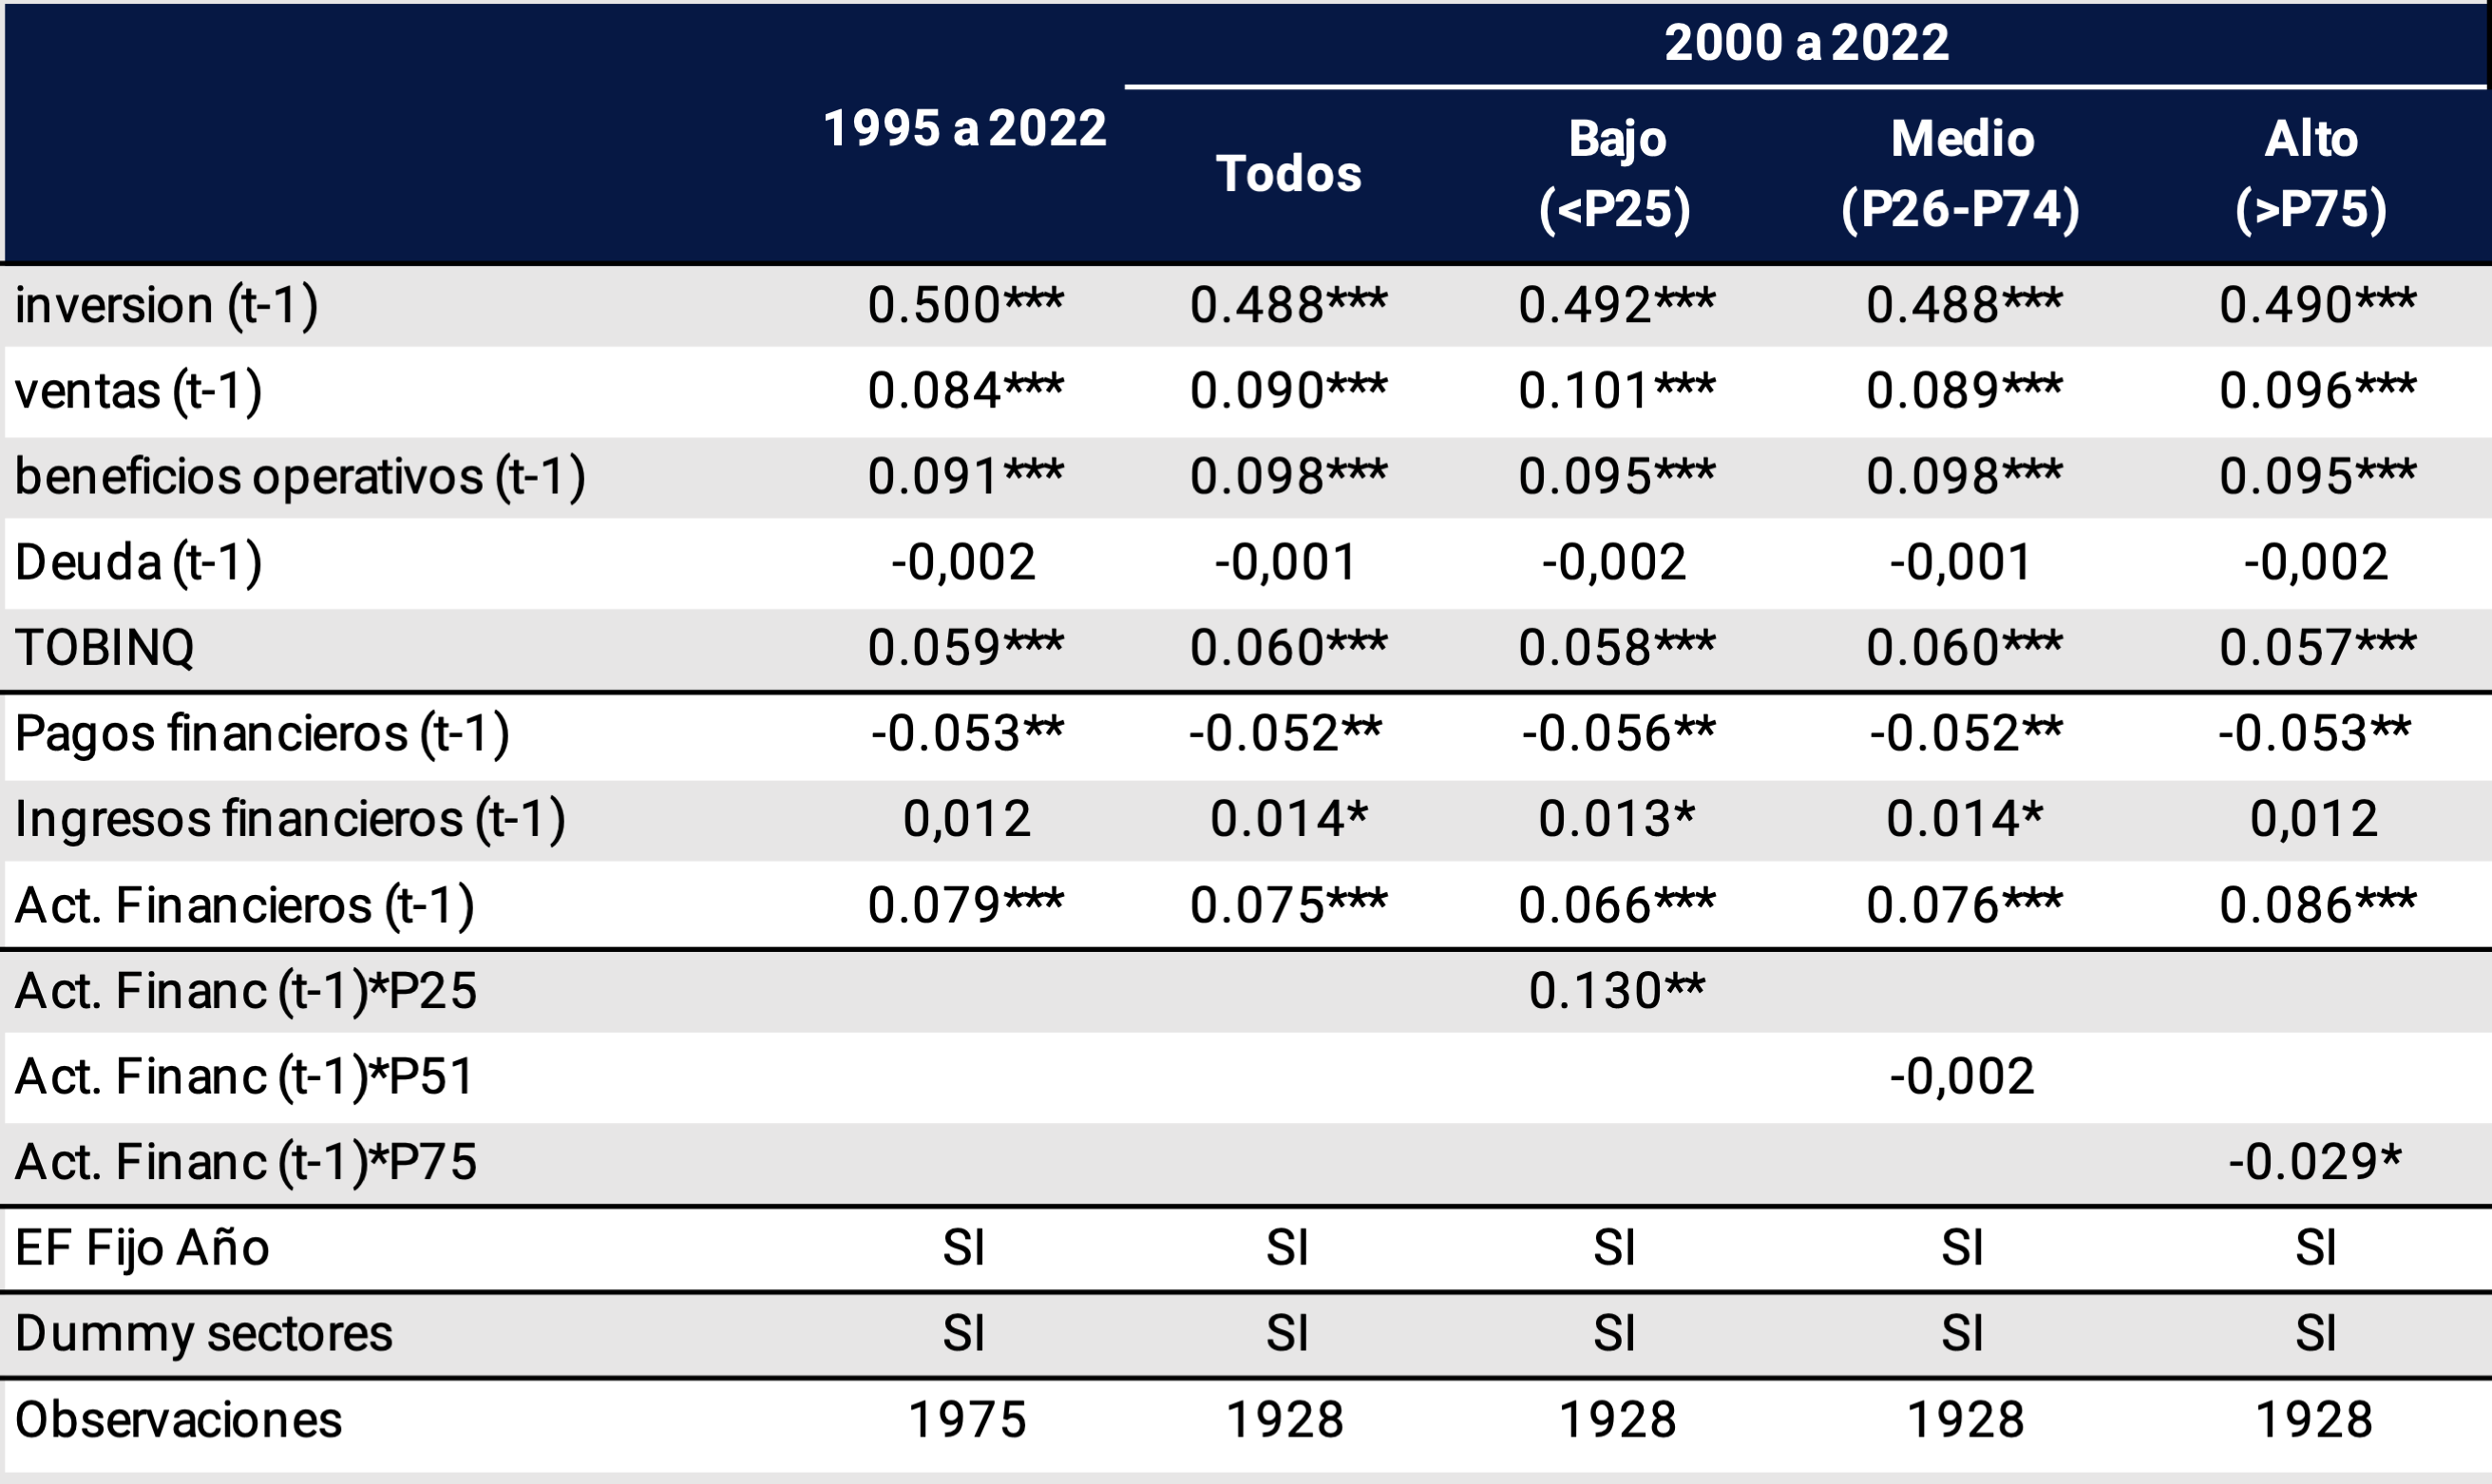
investment
Note: p-value * 0.10 * 0.05 ** 0.01
Source: BCRA based on data from Eikon-Reuters.
The results of the specification show the expected sign and a high significance for the set of standard variables. That is, the higher past investment, sales volume, operating profits and stock valuation have a positive effect on the firm’s investment level. There is no statistically relevant relationship for the degree of leverage. These results are robust for different time specifications.
With respect to the set of financial variables of interest, it is observed, firstly, that a greater distribution of dividends and other financial payments tends to reduce the internal resources of companies, negatively affecting investment. This result is in line with the findings of the literature from developed countries and other preliminary works for the region.
Second, it is observed that higher income from financial benefits tends to increase investment. In other words, there is no “financial displacement” effect, but the evidence suggests that companies allocate resources from other activities to productive investment. Likewise, it should be noted that this is a significant channel only since the 2000s and does not reach the largest firms in the distribution of assets.
Third, the greater holding of financial assets implies a better performance for productive investment. However, this effect depends on the size of signatures. As can be seen in Graph 3, there is an additional favorable impulse due to the accumulation of financial resources in companies belonging to low percentiles in the distribution of total assets (relatively smaller companies), neutral in medium-sized companies and adverse in larger companies. In other words, given the remaining real and financial flows, and in the face of changes in their productive investment, larger firms have a total elasticity of only 1/3 with respect to smaller firms11.
Graph 3 | Coefficient of interaction between productive investment and ratio of holding of financial assets to capital stock according to size of the firm (2000 to 2022)
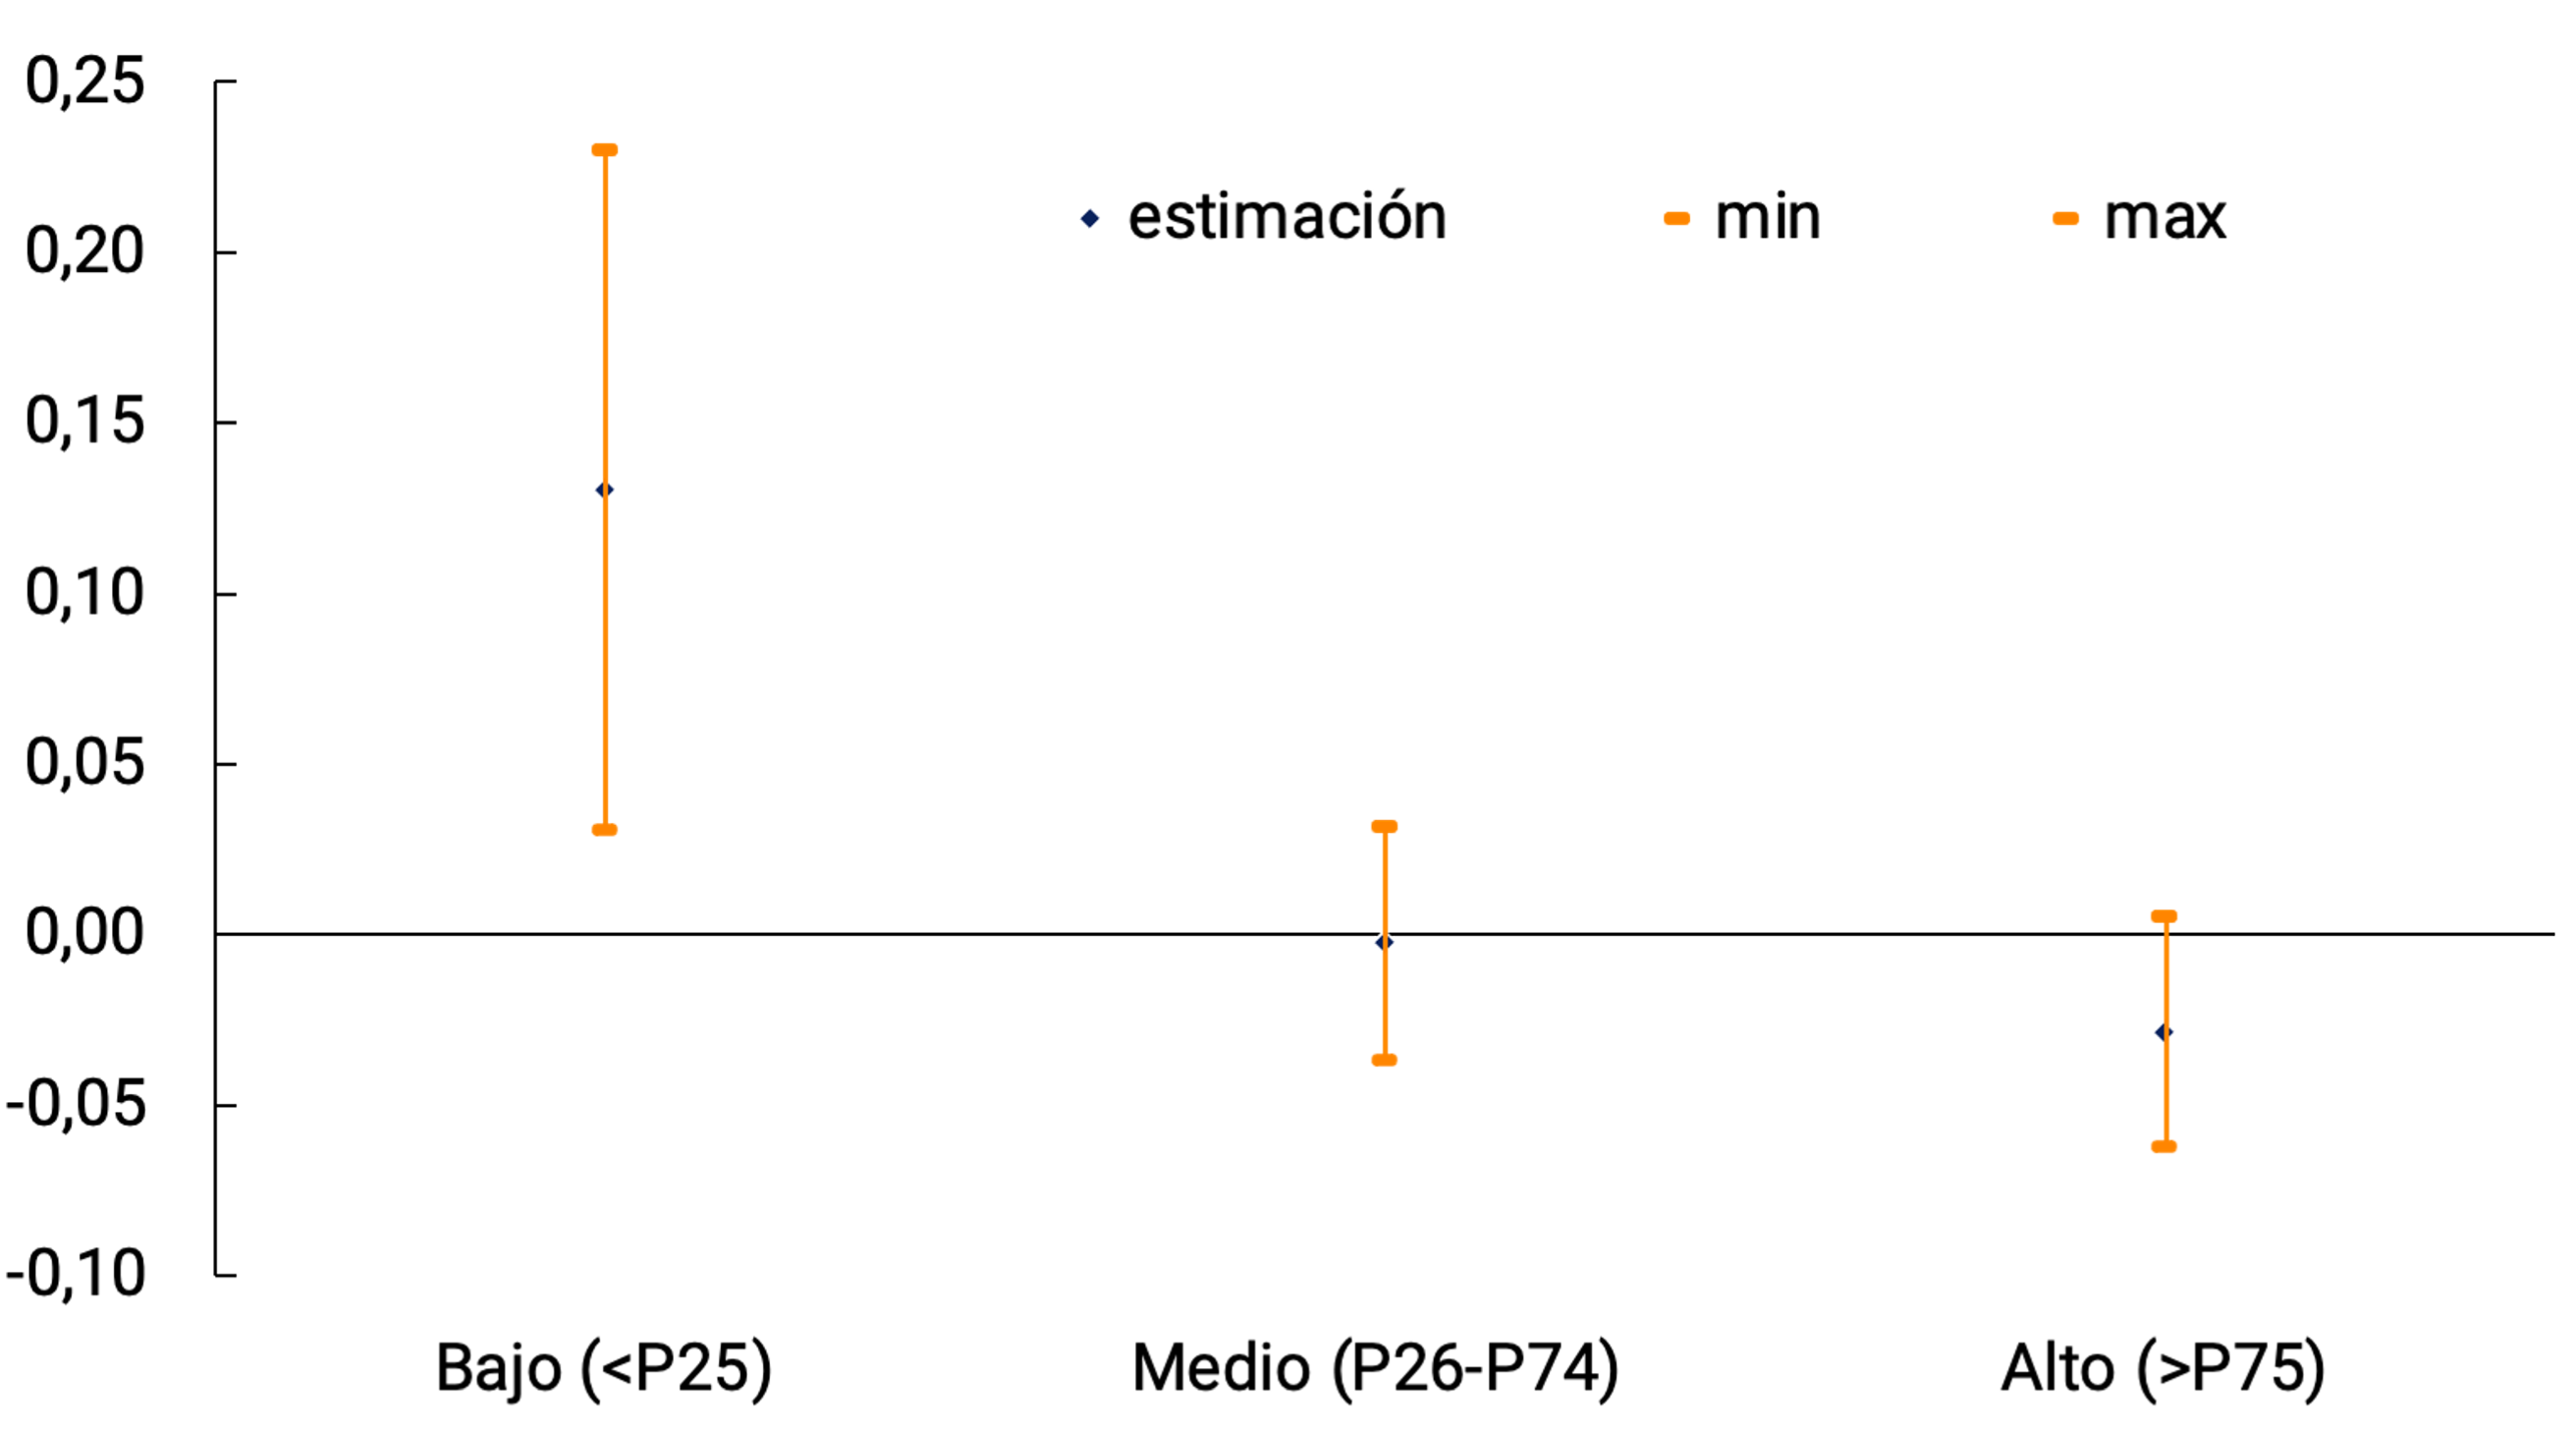
Note: ranges for a 95% confidence interval.
Source: BCRA based on data from Eikon-Reuters.
Post-pandemic trends
During the period between 2018 and 2020, the holding of Current Financial Assets grew from 7% to 10.6%, measured as a proportion of Total Assets, and from 340% to 440% measured as a proportion of Debt Interest Payments. Subsequently, in the context of isolation, the preference for greater financial flexibility implied a strong growth in liquidity ratios.
As can be seen in Graph 4, since 2020 the holding of immobilized financial assets has increased, especially for current financial assets, without a presumed equivalent correlation in productive investment.
For the year 2022, although a reversal from maximum levels was observed, these indicators remained above previous values, while deteriorating in relation to the ratio of Current Financial Assets to Debt Interest Payments. In other words, although fixed assets increased, the financial hedging position deteriorated. Likewise, this greater accumulation of current financial assets was transversal to all sectors of the economy, with a greater preponderance in educational services, professional services and leisure.
Figure 4 | Expanded liquidity ratio in the post-pandemic
period Source
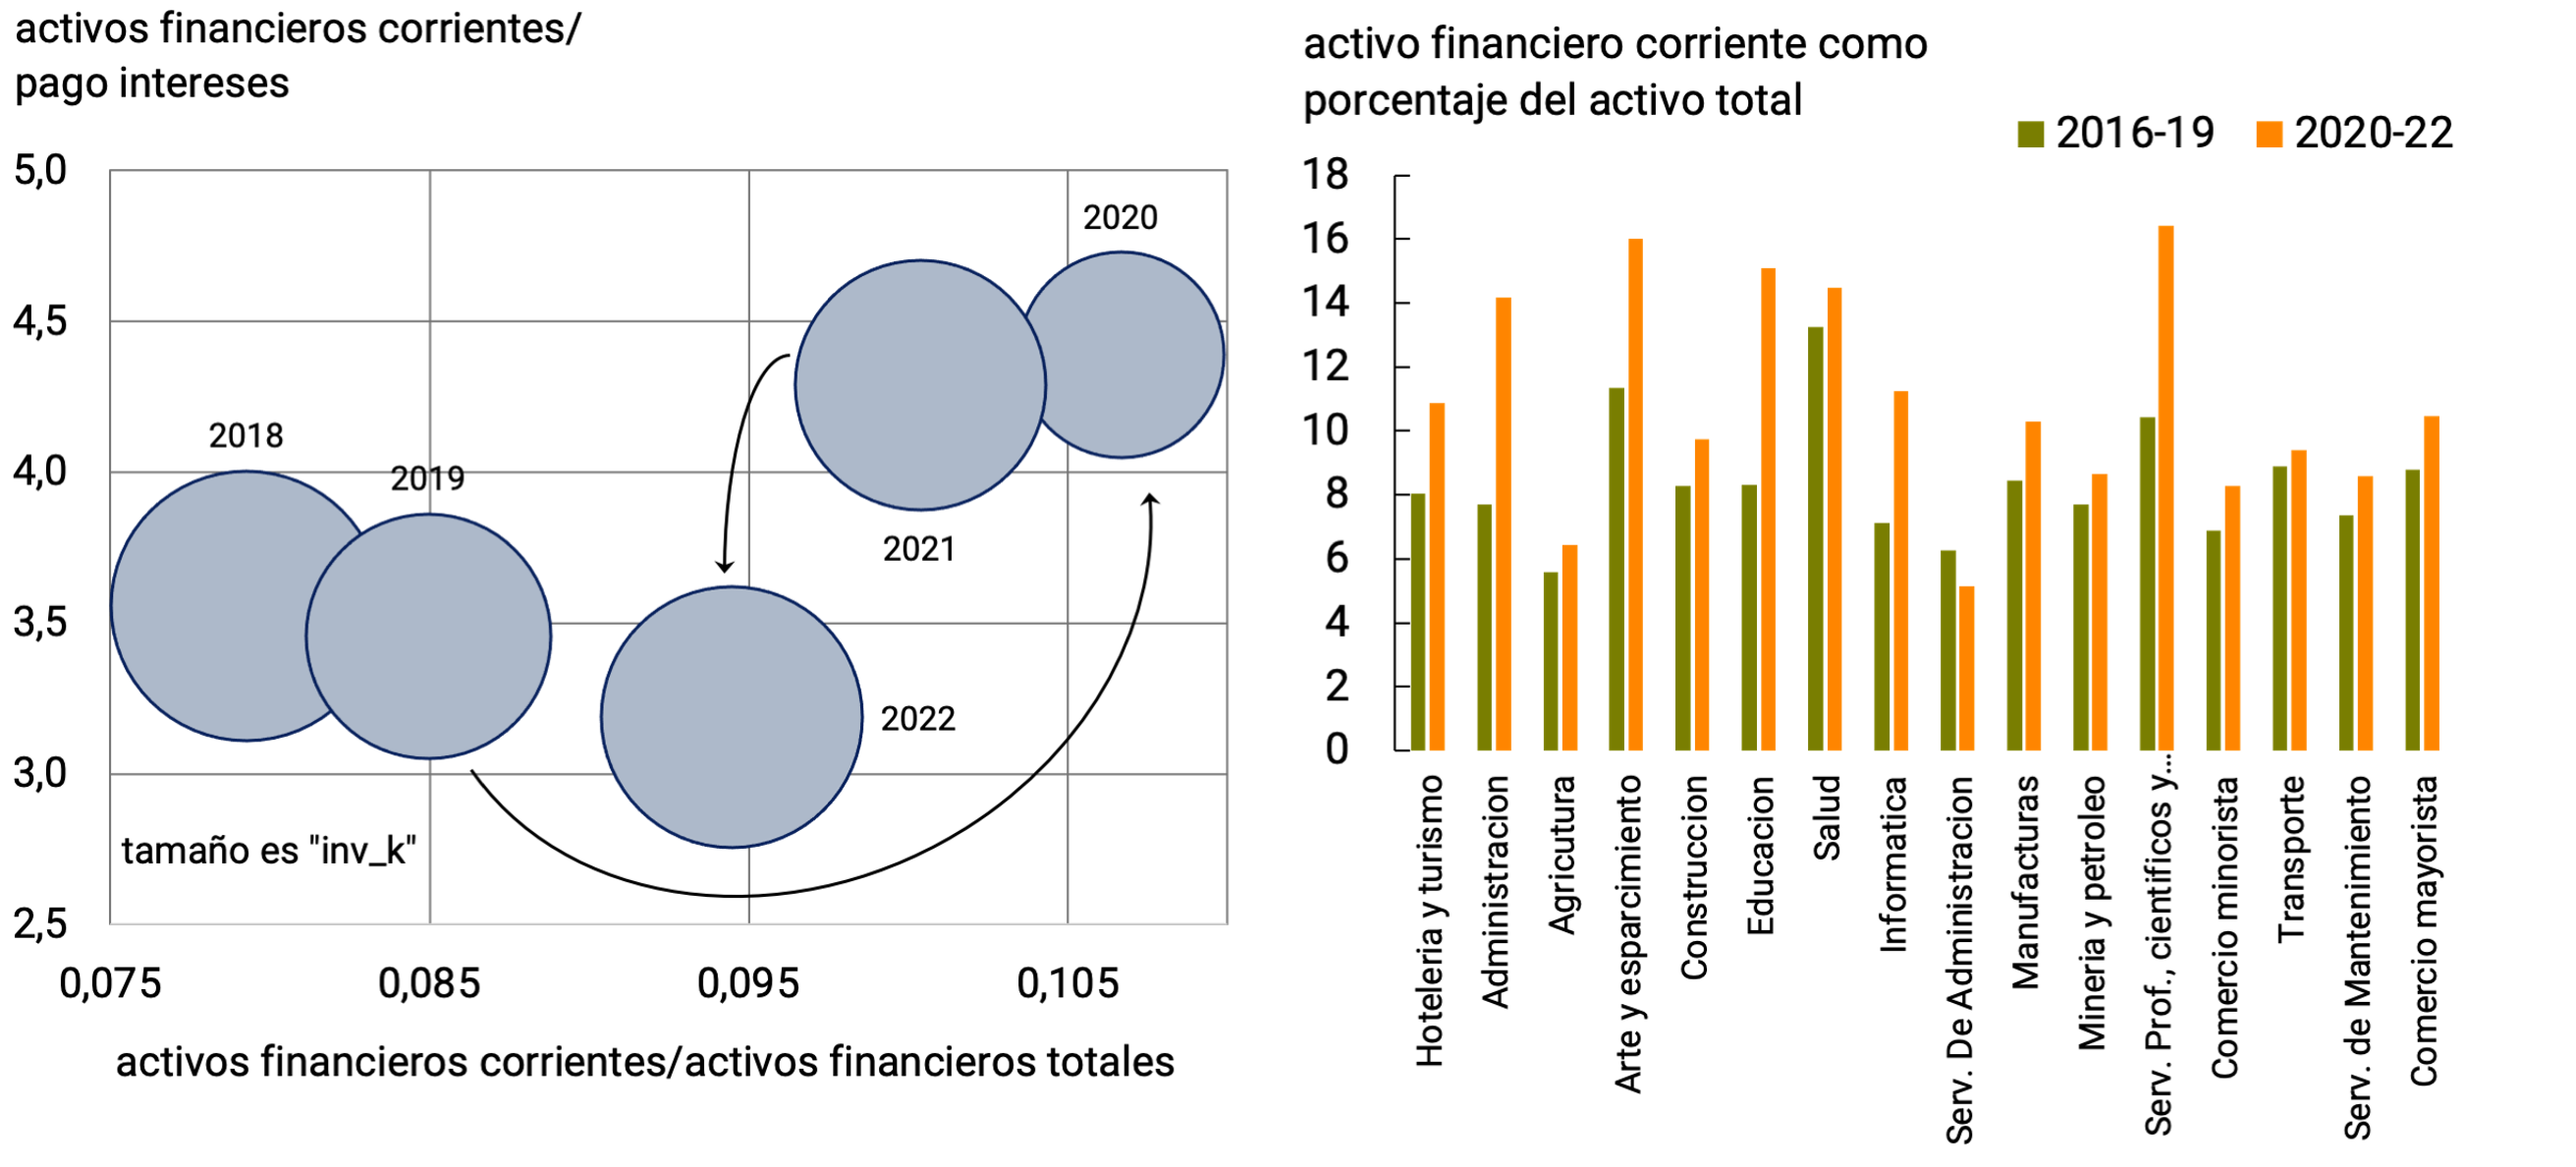
: BCRA based on data from Eikon-Reuters.
These results encourage us to closely follow the transformations that the new financial practices of companies generate on the structural determinants of productive investment.
References
Acosta, P., Loza, A. (2005). Short and long run determinants of private investment in Argentina. Journal of Applied Economics, 8(2), 389-406.
Bebczuk, R. (1994). Private investment in Argentina. Annals of the AAEP. Buenos Aires.
ECLAC. (2022). Economic Survey of Latin America and the Caribbean: Investment Dynamics and Challenges to Drive a Sustainable and Inclusive Recovery. Santiago, Chile: Economic Commission for Latin America and the Caribbean (ECLAC).
Elosegui, P., Sotes Paladino, J., Español, P., Panigo, D. (2006). Alternative methodologies for the analysis of financing constraints in Argentina. Working Paper No. 1. Buenos Aires: Central Bank of the Argentine Republic.
Fanelli, J., Bebczuk R., P. J. (2002). Determinants and consequences of financial constraints facing firms in Argentina. Washington D.C.: Inter-American Development Bank.
Fernandez, V. (2011). The driving factors of firm investment: Latin American evidence. Emerging Markets Finance and Trade, 47(5), 4-26.
IMF. (2023). Global Financial Stability Report: Safeguarding Financial Stability amid High Inflation and Geopolitical Risks. Washington, DC, April: International Monetary Fund.
Panigo, D., Depetris-Chauvin, E., Pasquini, R., Pussetto, L. (2007). Evolution and determinants of private investment in Argentina. Buenos Aires : Center for Financial Stability.
Schnabel, I. (2023). The risks of stubborn inflation. Speech by Isabel Schnabel, Member of the Executive Board of the ECB, at the Euro50 Group conference on “New challenges for the Economic and Monetary Union in the post-crisis environment” (pp. 1-19). Luxembourg, 19 June 2023: European Central Bank, available online at the following link.
Section 3 / Recovery forecasts for the next crop year
The expected recovery for the agricultural product in the remainder of 2023 and in 2024 is based on the expected normalization of the sector’s activity levels after the impact of the drought, mainly on the coarse harvest, which is accounted for in GDP during the second quarter. Estimates for the 2023/24 campaign imply significant increases in the production of the main crops.
In the case of wheat, the impact of the recovery in the level of the harvest on GDP will be felt mainly in the fourth quarter of this year. According to data from the Ministry of Agriculture, Livestock and Fisheries, at the end of September wheat was fully planted nationwide, with 80% of the total planted in good and very good condition. However, in some areas and due to the lack of adequate rainfall, the crop showed low growth22. The area sown with wheat reached 5.6 million hectares (Mha), 5.1% below that corresponding to the previous season. However, with that area and if the yields obtained in 2021/22 are recovered, wheat production could amount to about 18 million tons (Mton), which would mean an increase of 42% year-on-year (y.o.y.).
The main determinant of the outcome of the wheat harvest is the level of rainfall in the flowering stage of the crop. In August, it rained less than expected in the core region and that generated an environment of uncertainty with a view to the planting of the thick crop. At the moment, the agricultural outlook presents disparate situations at the national level, with a band clearly better positioned within the core zone, but with rains that have not yet managed to sustain the improvements in soil moisture profiles that were evident from May (see Graph 1).
In the same sense, and according to the latest Weekly Agricultural Panorama of the Buenos Aires Grain Exchange (BCBA), the soils in the core area, in which more than 30% of the national wheat production is concentrated, denote adequate moisture conditions, but in the north of the country the rains were insufficient on average sowing. For this reason, many producers decided not to take risks in the fine harvest, confident that the weather conditions will be more favorable for the thick harvest. In any case, according to the BCBA, 72.5% of the wheat sown is in normal or excellent condition and the production estimate is 16.5 Mton, which would mean an improvement of 35.2% y.o.y. A more conservative estimate was presented by the Rosario Stock Exchange, estimating a production of 15 Mtons of wheat, 30.4% higher than last year.
For its part, the available forecasts from the Climate Prediction Center23 indicate that the seawater temperature anomalies in the equatorial Pacific Ocean are persistent and robust to ensure the presence of the El Niño climate phenomenon, associated with a higher level of rainfall. For the quarter ending next November, there is a 99% probability that these weather conditions will continue, while for January-March, the models assign a probability of 95% to that situation. In other words, the improvements observed since last May in the water profiles of the soils in the main productive areas of the country would most likely extend until the summer.
Graph 1 | Graph 1 | Water profile in soils. Year-on-year
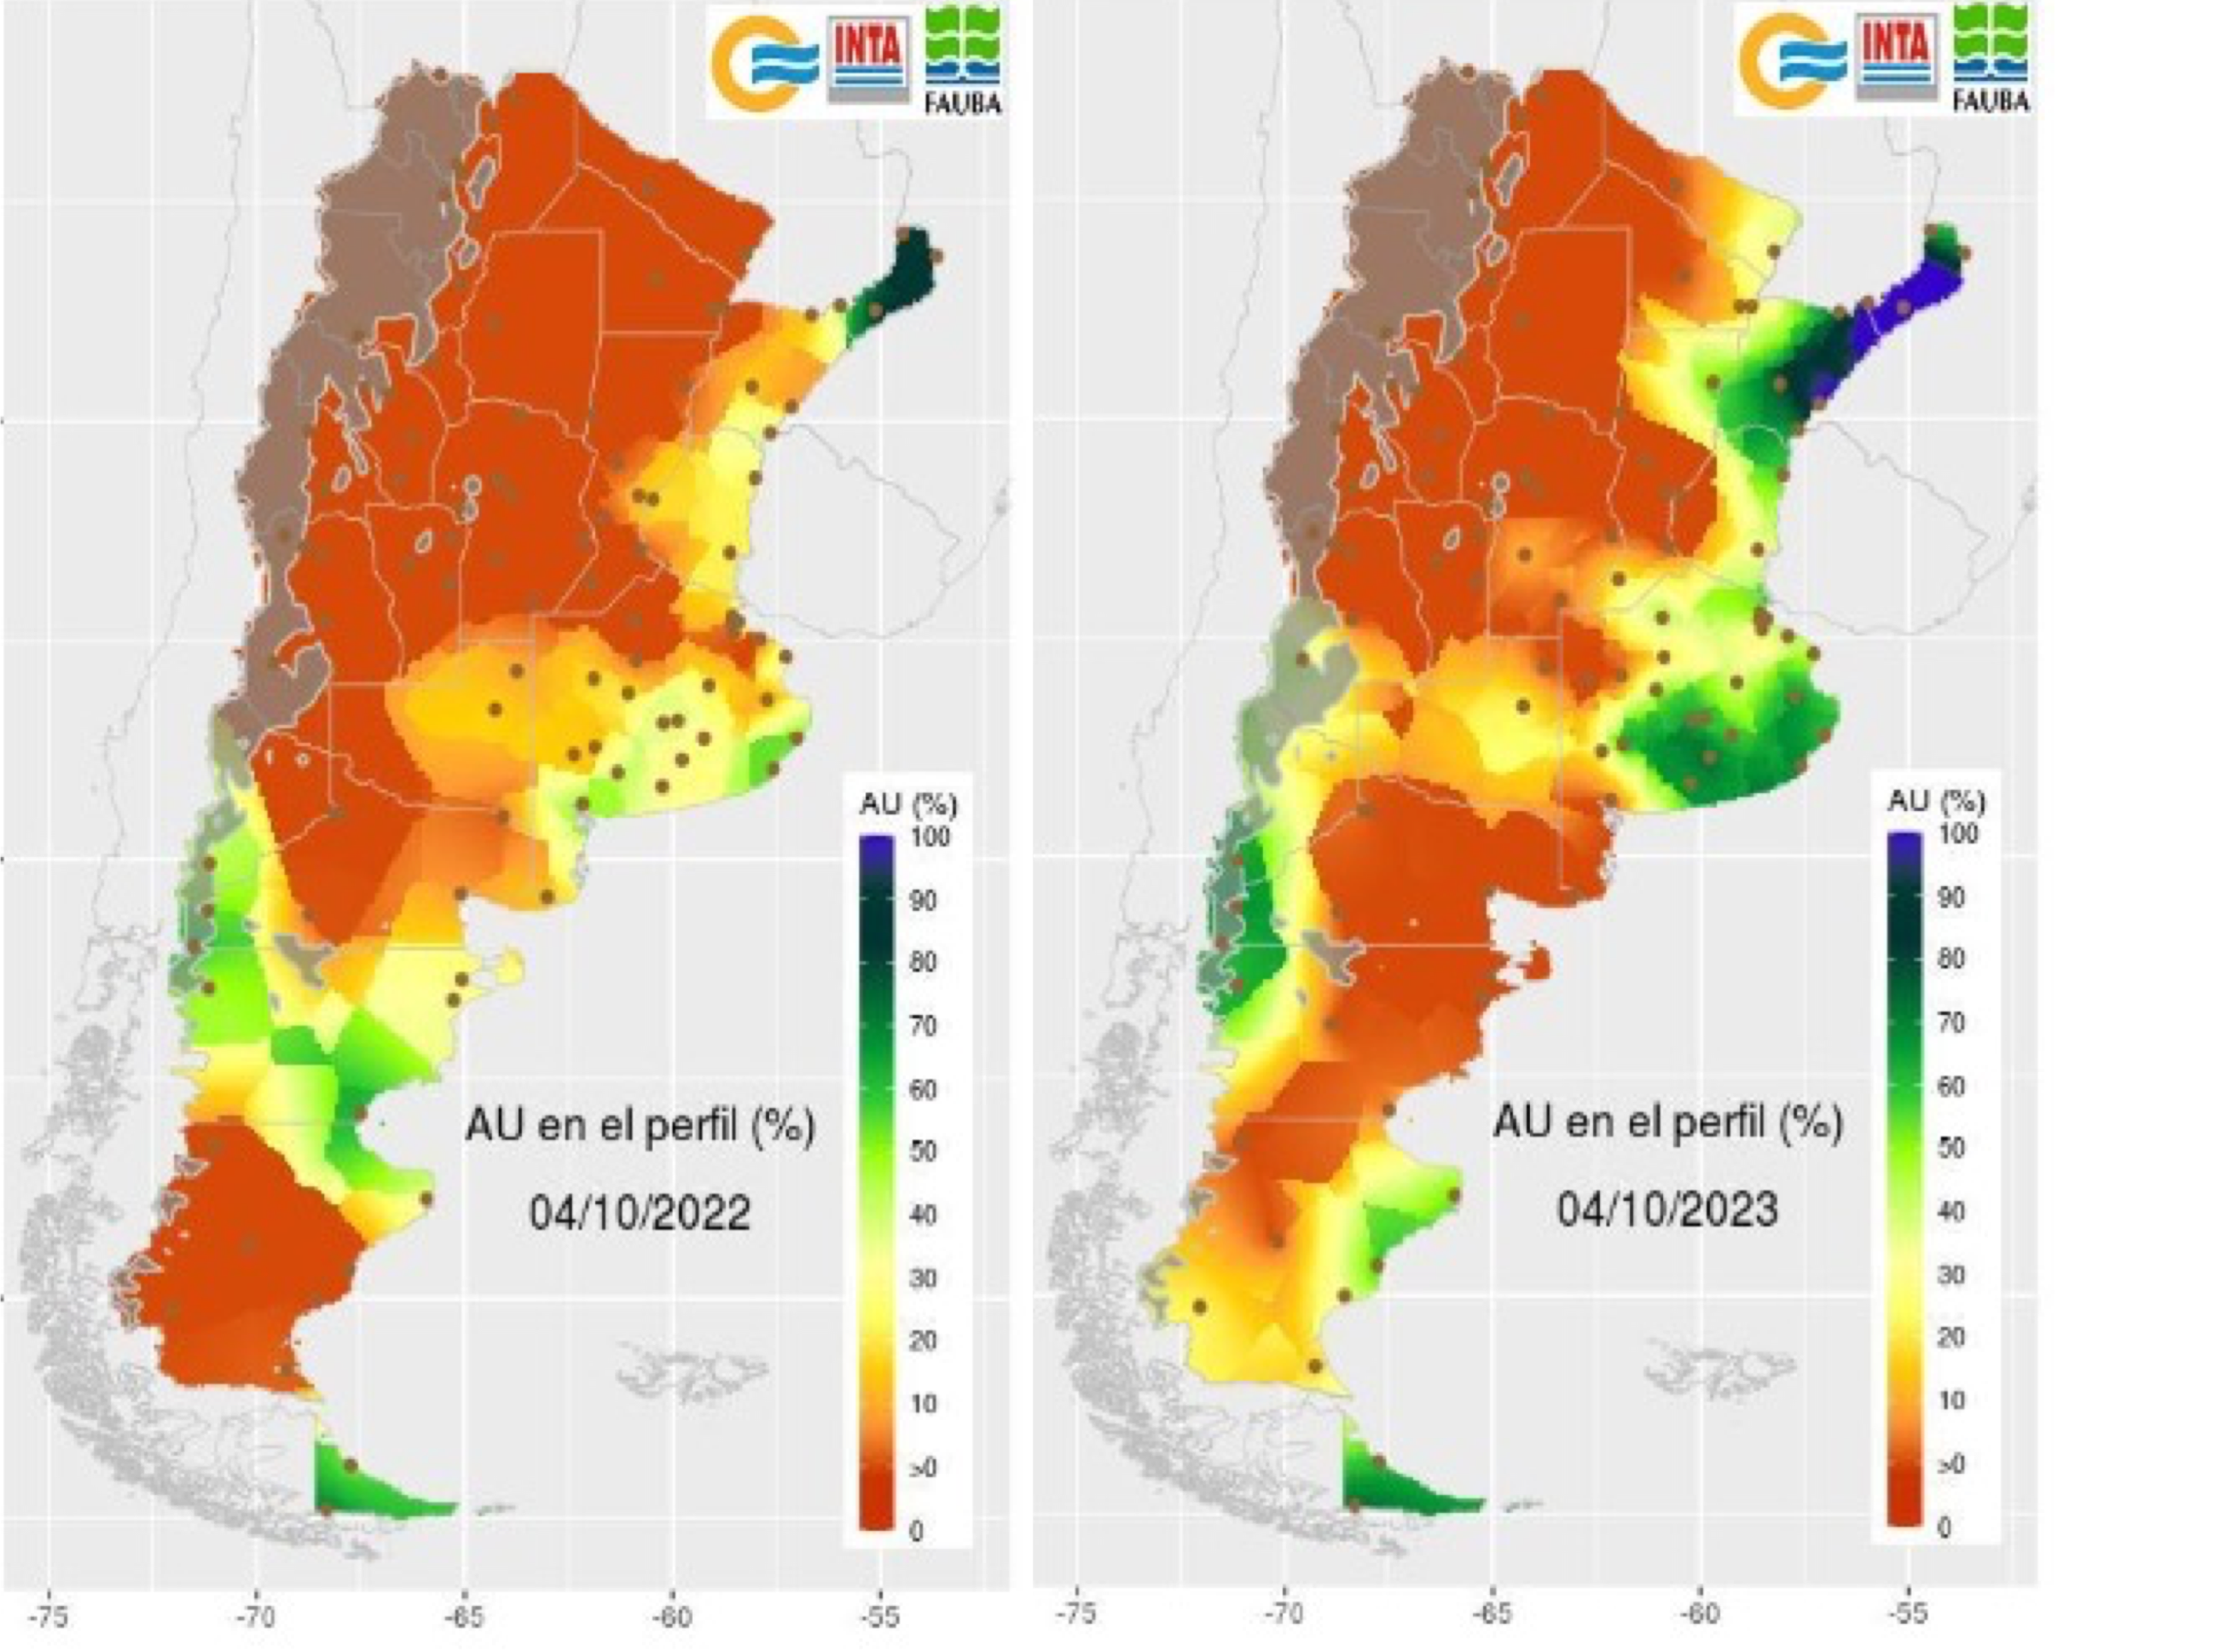
comparison
Source: National Meteorological Service.
The expectation of improved soil conditions underpins optimism regarding the next heavy harvest, whose impact on GDP will be mainly concentrated in the second quarter of 2024, when the agricultural product would reach a significant recovery from drought-affected levels in 2023.
In the case of corn, the 2022/23 campaign was officially ended in mid-September. Early sowing has recently begun in some areas of Santa Fe, Entre Ríos and Córdoba, although very slowly24. Late planting could take place until December and would have a higher cost for the producer, especially due to the expenses demanded by weed control, but greater moisture in the soils could offer a higher yield. The estimates of the area sown for the 2023/24 campaign place it at levels similar to those of the previous season (10.5 Mha), with about 65% corresponding to late sowing. If the yields obtained in the 2020/21 Campaign recover (the lowest since the 2018 drought), total corn production could grow by 42% YoY (see Graph 2).
In the case of soybeans, the first estimate of the Ministry of Agriculture, Livestock and Fisheries regarding the intention to plant the oilseed is 16 Mha, the same as that of the previous season. With a slight improvement compared to the minimum yields obtained in the campaign that has just ended, the production of this oilseed could show very high growth rates. In particular, if the scenario in terms of yields were similar to that of 2021/22, the increase in production could reach 75% y.o.y. It should be recalled that the 2022/23 soybean production was the lowest since 1999/2000.
Graph 2 | Planted areas and production of the main grains
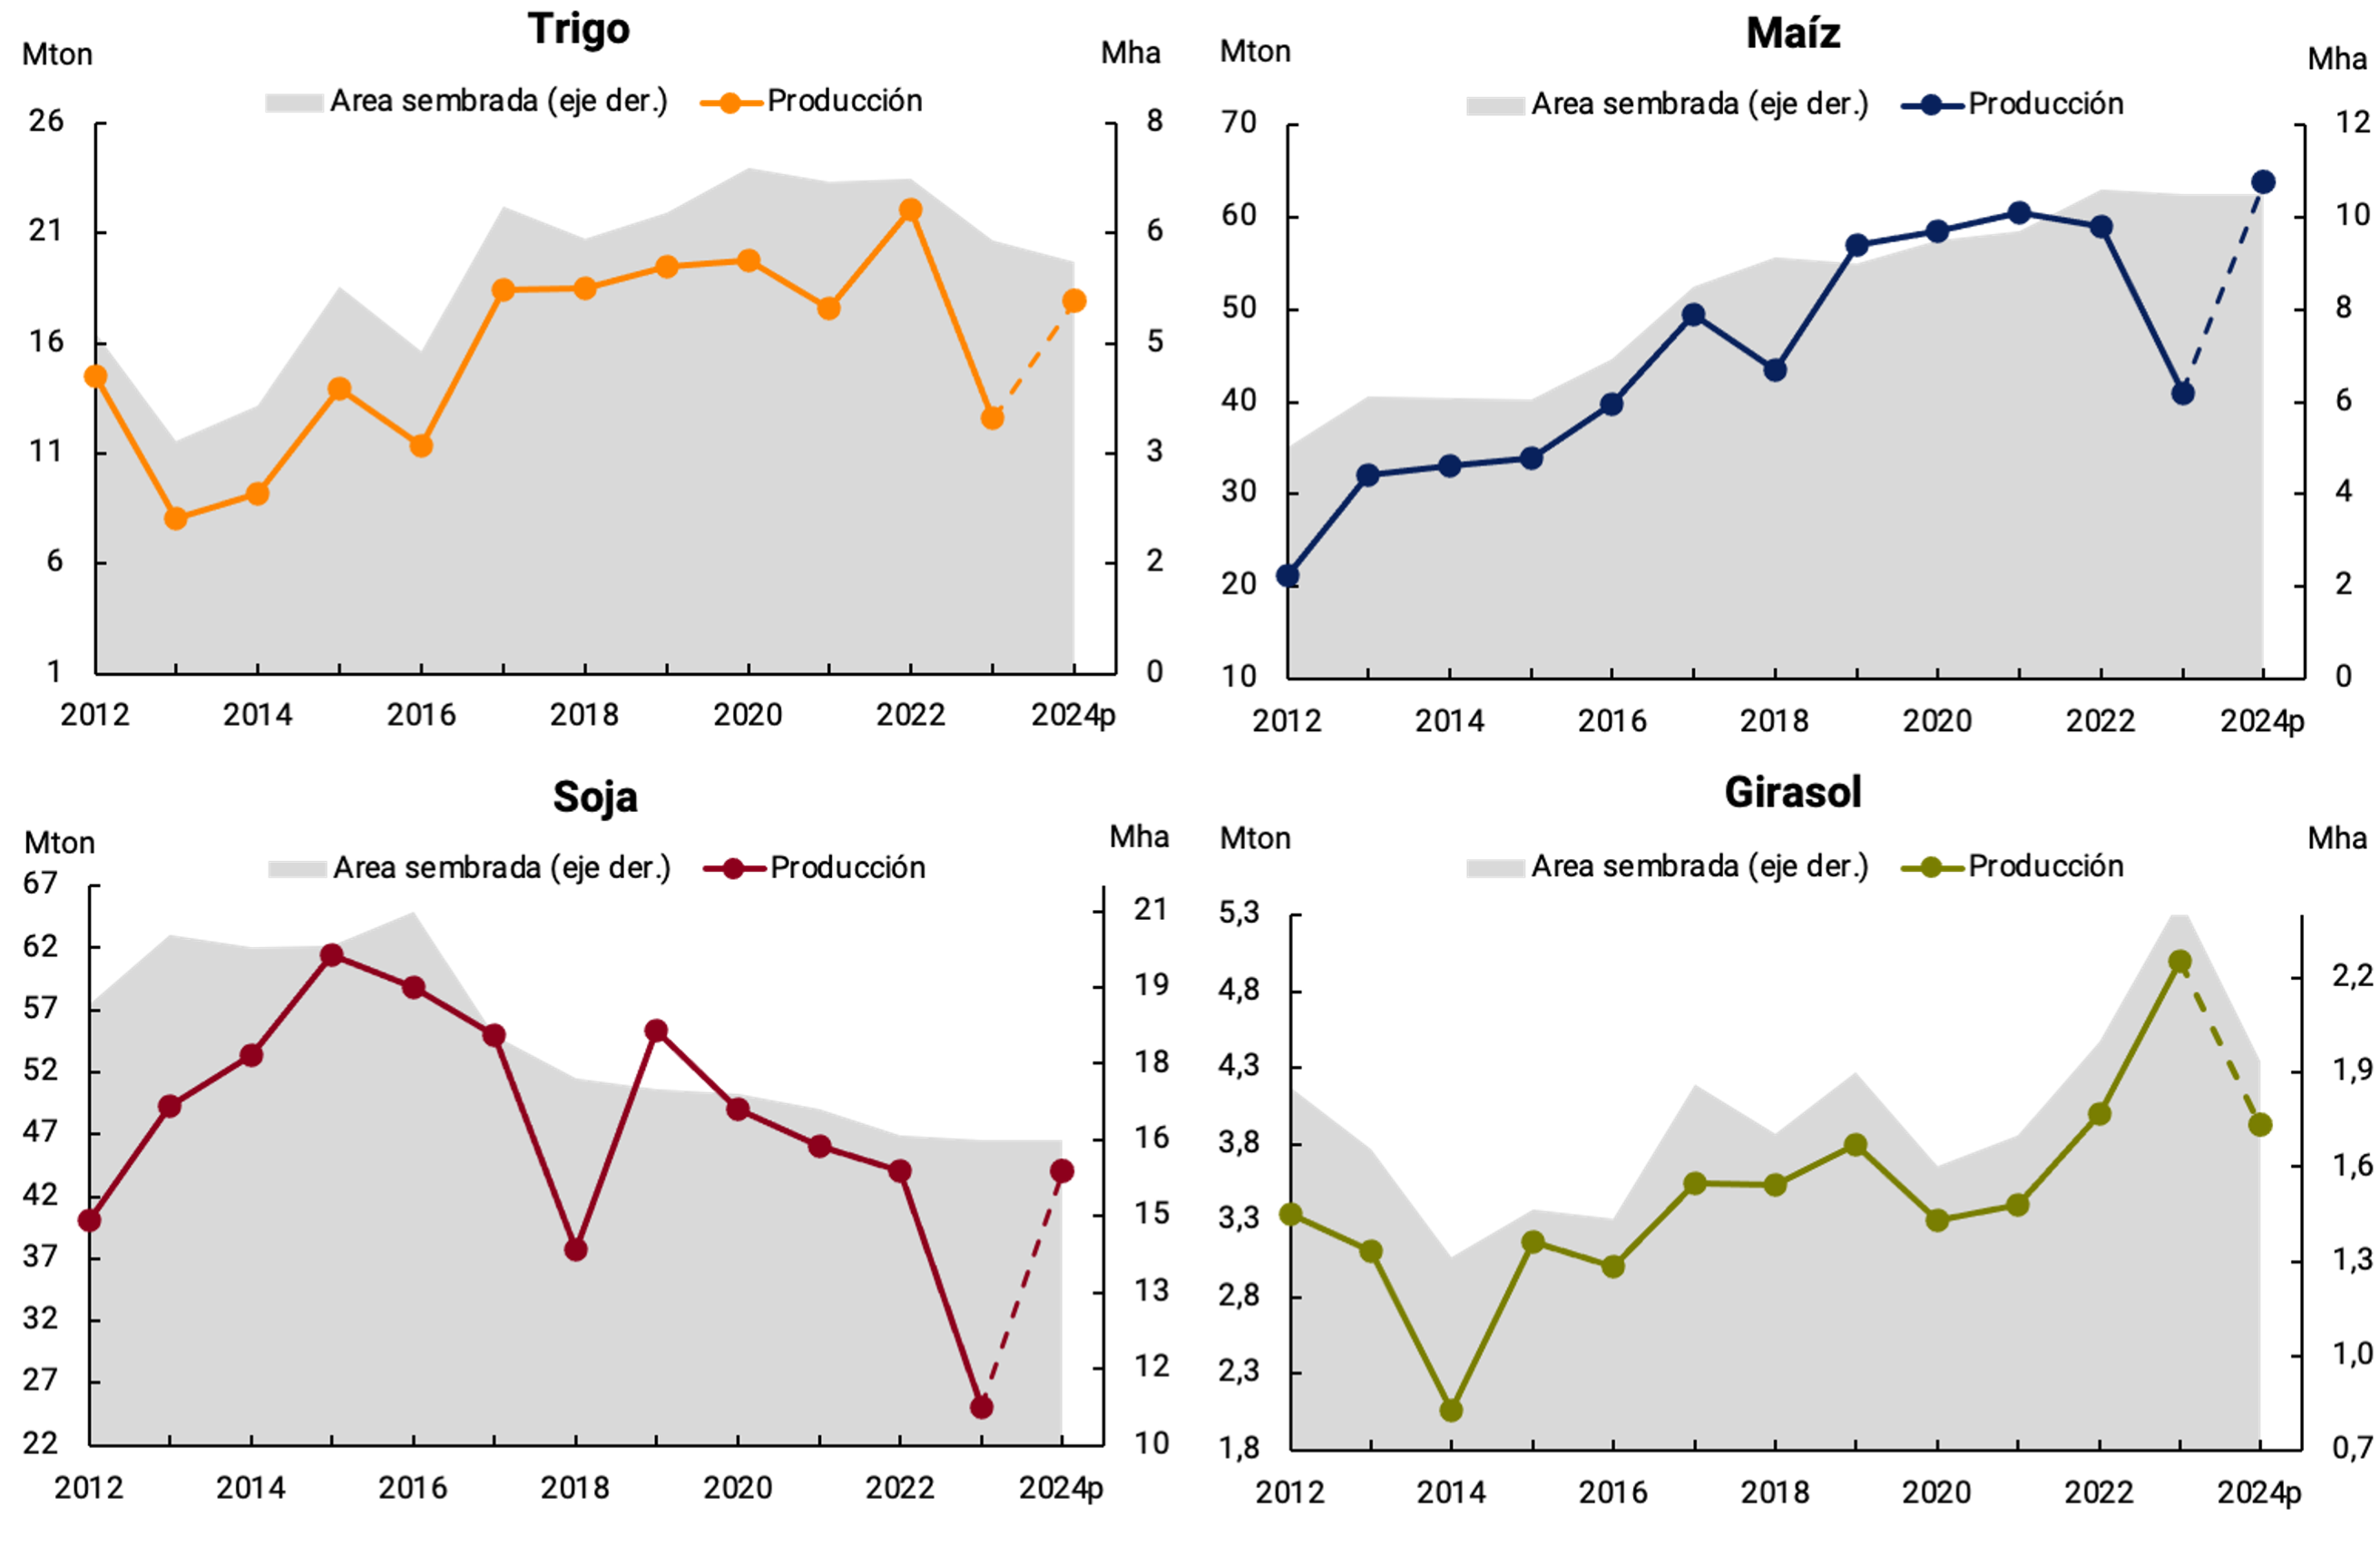
Source: BCRA based on SAGyP data and own projections.
For sunflowers, the planting intention surveyed by the Ministry of Agriculture, Livestock and Fisheries is somewhat lower than last year (-4%), with the low price of the oilseed and the possibility of planting other more profitable crops mentioned as determinants in the face of the possible occurrence of rainfall. So far, 16% of the estimated area has been planted, while at the same time last season that level reached 21%.
Regarding the production projections of other specialized agents, they all take for granted a context of “El Niño” climate phenomenon. The BCBA projects increases in the planted hectares for both soybeans (5.6% YoY) and corn (2.8% YoY), higher than those exhibited by the official agency, while for sunflower the expected drop in the cultivated area is greater than the official one (-13.6% YoY). The harvest would amount to 50 MTn for soybeans and 55 MTn for corn, implying very significant increases, of 138.1% and 61.8% y.o.y., respectively. For sunflower, it expects a fall of 10.4% y.o.y. For its part, the Rosario Stock Exchange estimated the 2023/24 wheat harvest at 15 Mtn (30% YoY), soybean harvest at 48 Mtn (140% YoY) and corn for the same cycle at 56 Mtn (65% YoY).
In summary, the reversal of the weather conditions already observed added to the forecasts of greater moisture in the soils throughout the spring and summer allow us to foresee a very significant growth in the harvest of the next campaign, with increases of more than 30% in wheat (which will impact agricultural activity in the remainder of this year). 50% in corn and 90% in soybeans, with the consequent positive impact not only on economic activity but also on fiscal results – based on the associated export duties – and on the flow of foreign currency that exports of grains and their derivatives will imply during 2024.
Section 4 / The BCRA resumes the publication of the Foreign Direct Investment Report35
As of August 2023, the Central Bank of the Argentine Republic resumed the publication of its “Report on Foreign Direct Investment”, this time on a quarterly basis, and with the estimates prepared based on the Survey of External Assets and Liabilities (RAyPE) established through Communication “A” 640136.
Since its implementation, this survey has become the main source for the estimation of Direct Investments in Argentina. The design of the same was the product of the joint work carried out between the BCRA and INDEC in the context of the Framework Cooperation Agreement signed between both organizations in 2016, and implied the introduction of changes both in the data collected and in the way in which they are collected. All this work was carried out with the joint objectives of: achieving improvements in the quality of information, collecting data that could meet the growing demand for information, that they would adapt to the new international standards (IMF Balance of Payments Manual – 6th edition and OECD Framework Definition of Foreign Direct Investment – 4th edition) and that in turn would simplify the process of data collection and validation, in order to facilitate the burden on the declarants37.
Particularly, with regard to the estimates of Foreign Direct Investment, the changes introduced in the loading forms made it possible to improve the identification of the different direct investment relationships that can occur between local companies and their non-resident investors, since not only direct investors are identified through their participation in the capital of the local company. rather, it is possible to identify more complex direct investment relationships, such as related companies or reverse investment38.
Finally, it should be noted that all this work had the collaboration of INDEC, not only in the development of the new upload forms, as indicated above, but also in the continuous exchange of technical opinions regarding the estimation methodologies and the revision of the data collected, which ended with the agreement between both agencies of the series currently published by this BCRA.
As a result of this agreement, periodically, and after the process of validation and control of the information, the BCRA’s Foreign Direct Investment estimates are shared with INDEC, which uses them as an input for the estimation of the Balance of Payments and the International Investment Position.
Foreign Direct Investment
The gross passive position of foreign direct investment (FDI) reached, as of Mar 31, 23, the record level of the series, with a stock of FDI of US$133,034 million, with equity participations of US$91,901 million, and debt instruments of US$41,403 million (Graph 1). An upward trend in gross liabilities was observed since the beginning of 2017, with an acceleration in the growth rate from 2021, registering a 33% increase between 31-Mar-21 and 31-Mar-23.
Graph 1 | Gross Passive Position of Foreign Direct Investment in Argentina
Survey Com. A 4237, Com. A 3602 and Survey Com. A 6401
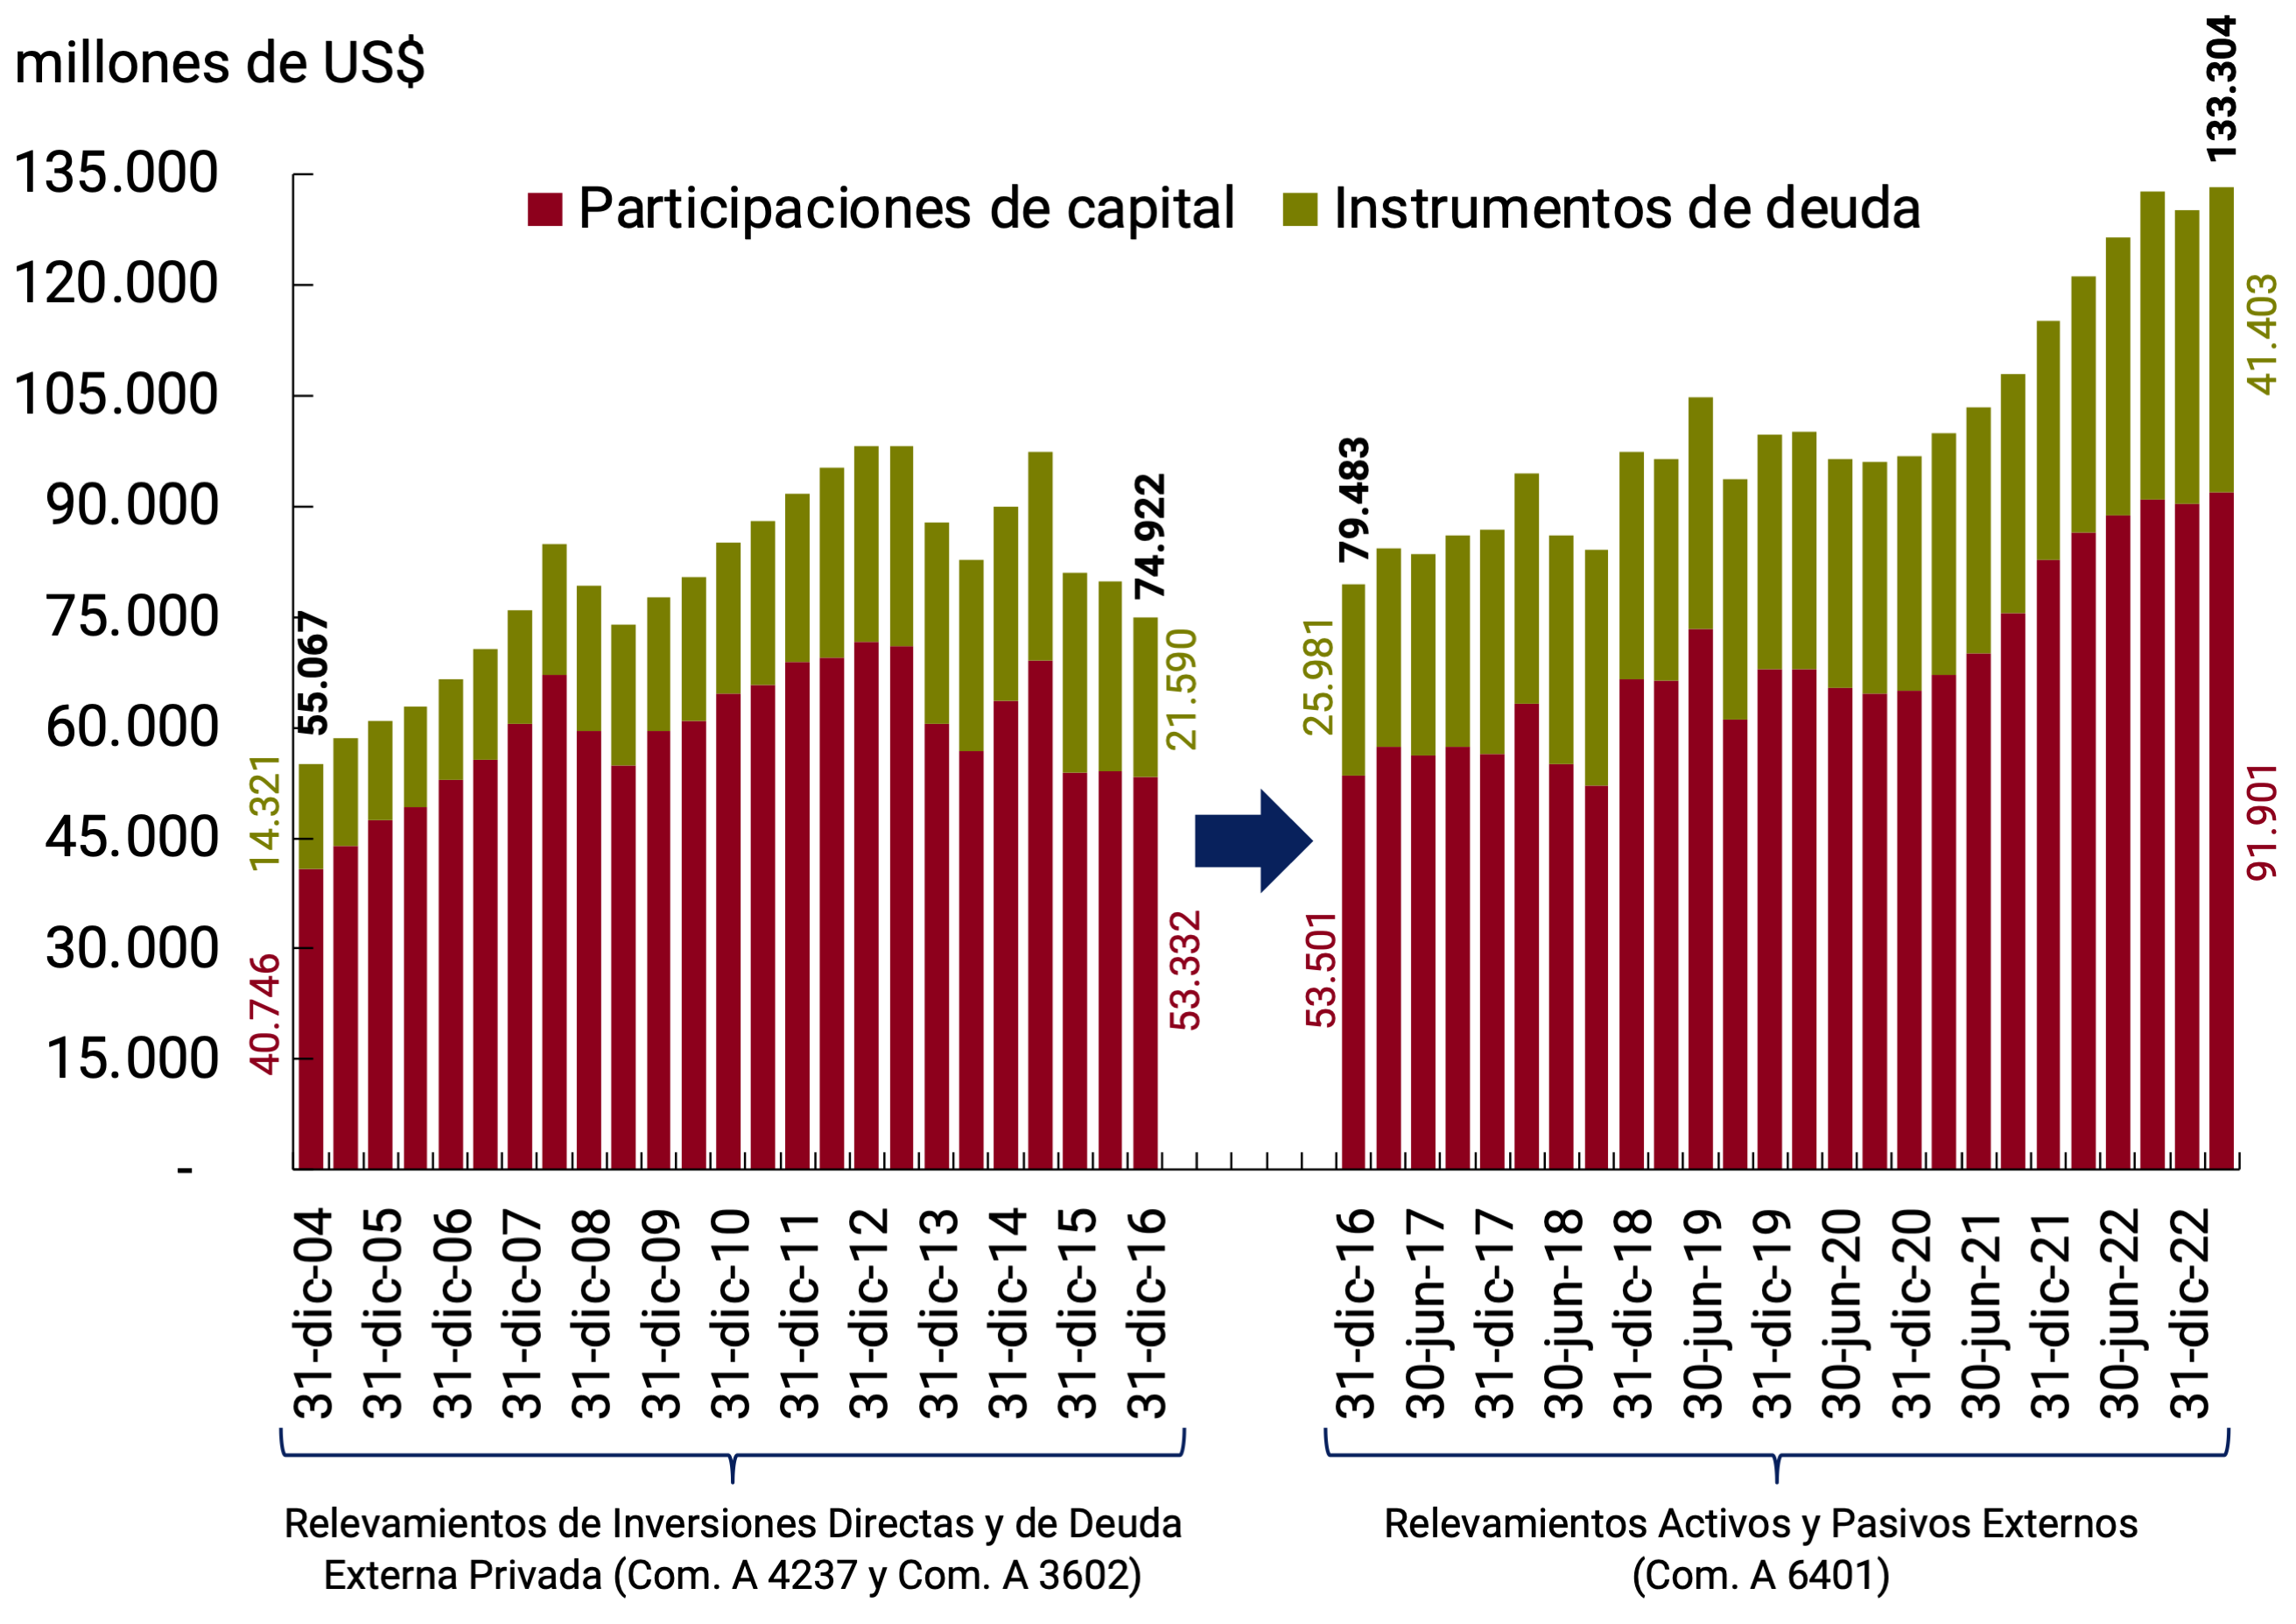
Source: BCRA.
This increase in the position was mainly explained by FDI transactional flows, which showed a recovery and growth from 2021, registering a year-on-year increase of 59% in 2021 and 88% in 2022, reaching net FDI inflows of US$15,144 million in that year. Meanwhile, in the first quarter of 2023, US$3,810 million of transactional flows were obtained (see Chart 2).
Making a distinction by type of transaction, this increase in the position registered during the last two years was basically explained by the net financing of related companies, for about US$10,700 million; the reinvestment of profits that, after the crisis caused by COVID-19 that affected the economic activity and income of FDI companies mainly in 2020, recovered its relative importance reaching flows of US$10,000 million; and net contributions from direct investors of about US$4,000 million.
Graph 2 | Transactional flows of foreign direct investment in Argentina
Survey Com. A 4237, Com. A 3602 and Survey Com. A 6401
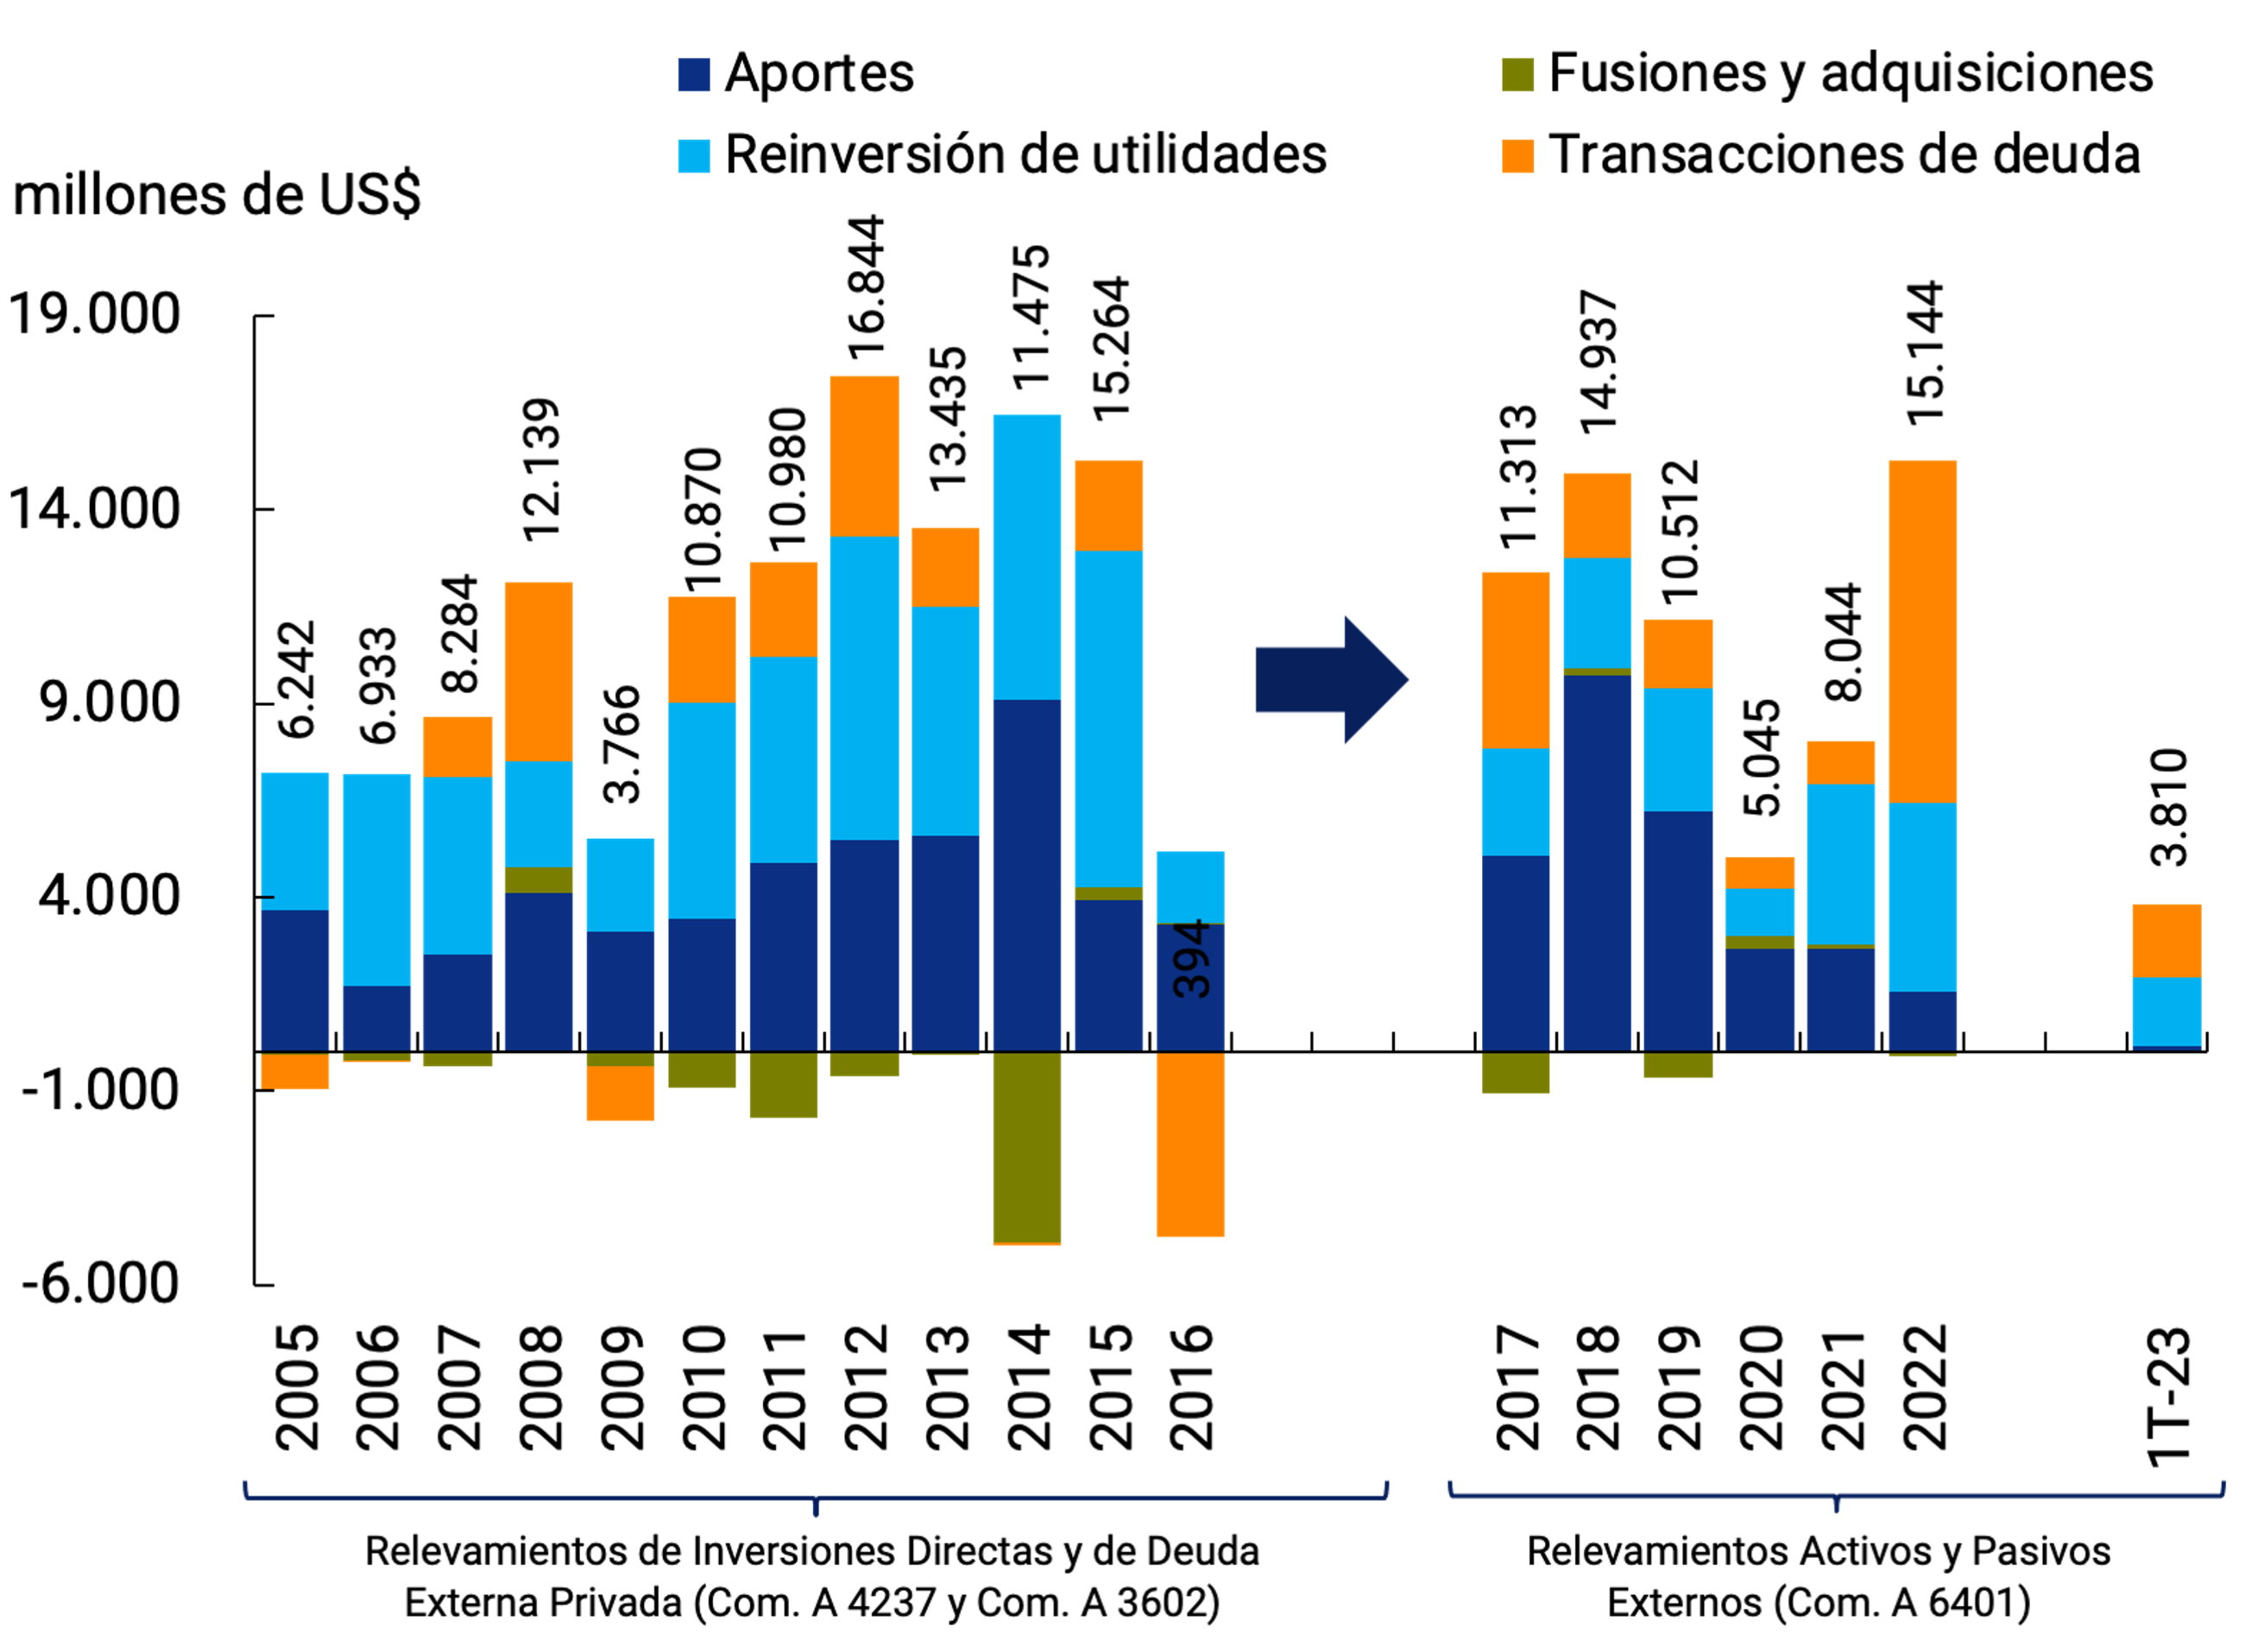
Source: BCRA.
At sectorallevel 39 (see Graph 3), the main destination sector of FDI as of Mar 31, 23 was the “Manufacturing Industry”, with a position of US$48,081 million. Following in importance are the sectors “Mining and quarrying”, with a position of US$29,872 million and “Wholesale and retail trade, repair of motor vehicles and motorcycles”, with a stock of US$14,986 million. Then came “Information and communications”, with an FDI stock of US$10,457 million; “Deposit-taking companies, except the central bank”, with US$8,968 million; and “Information and communications”, with a gross passive position of US$4,215 million.
Graph 3 | Gross Passive FDI Position in Argentina by Sector
In US$ million
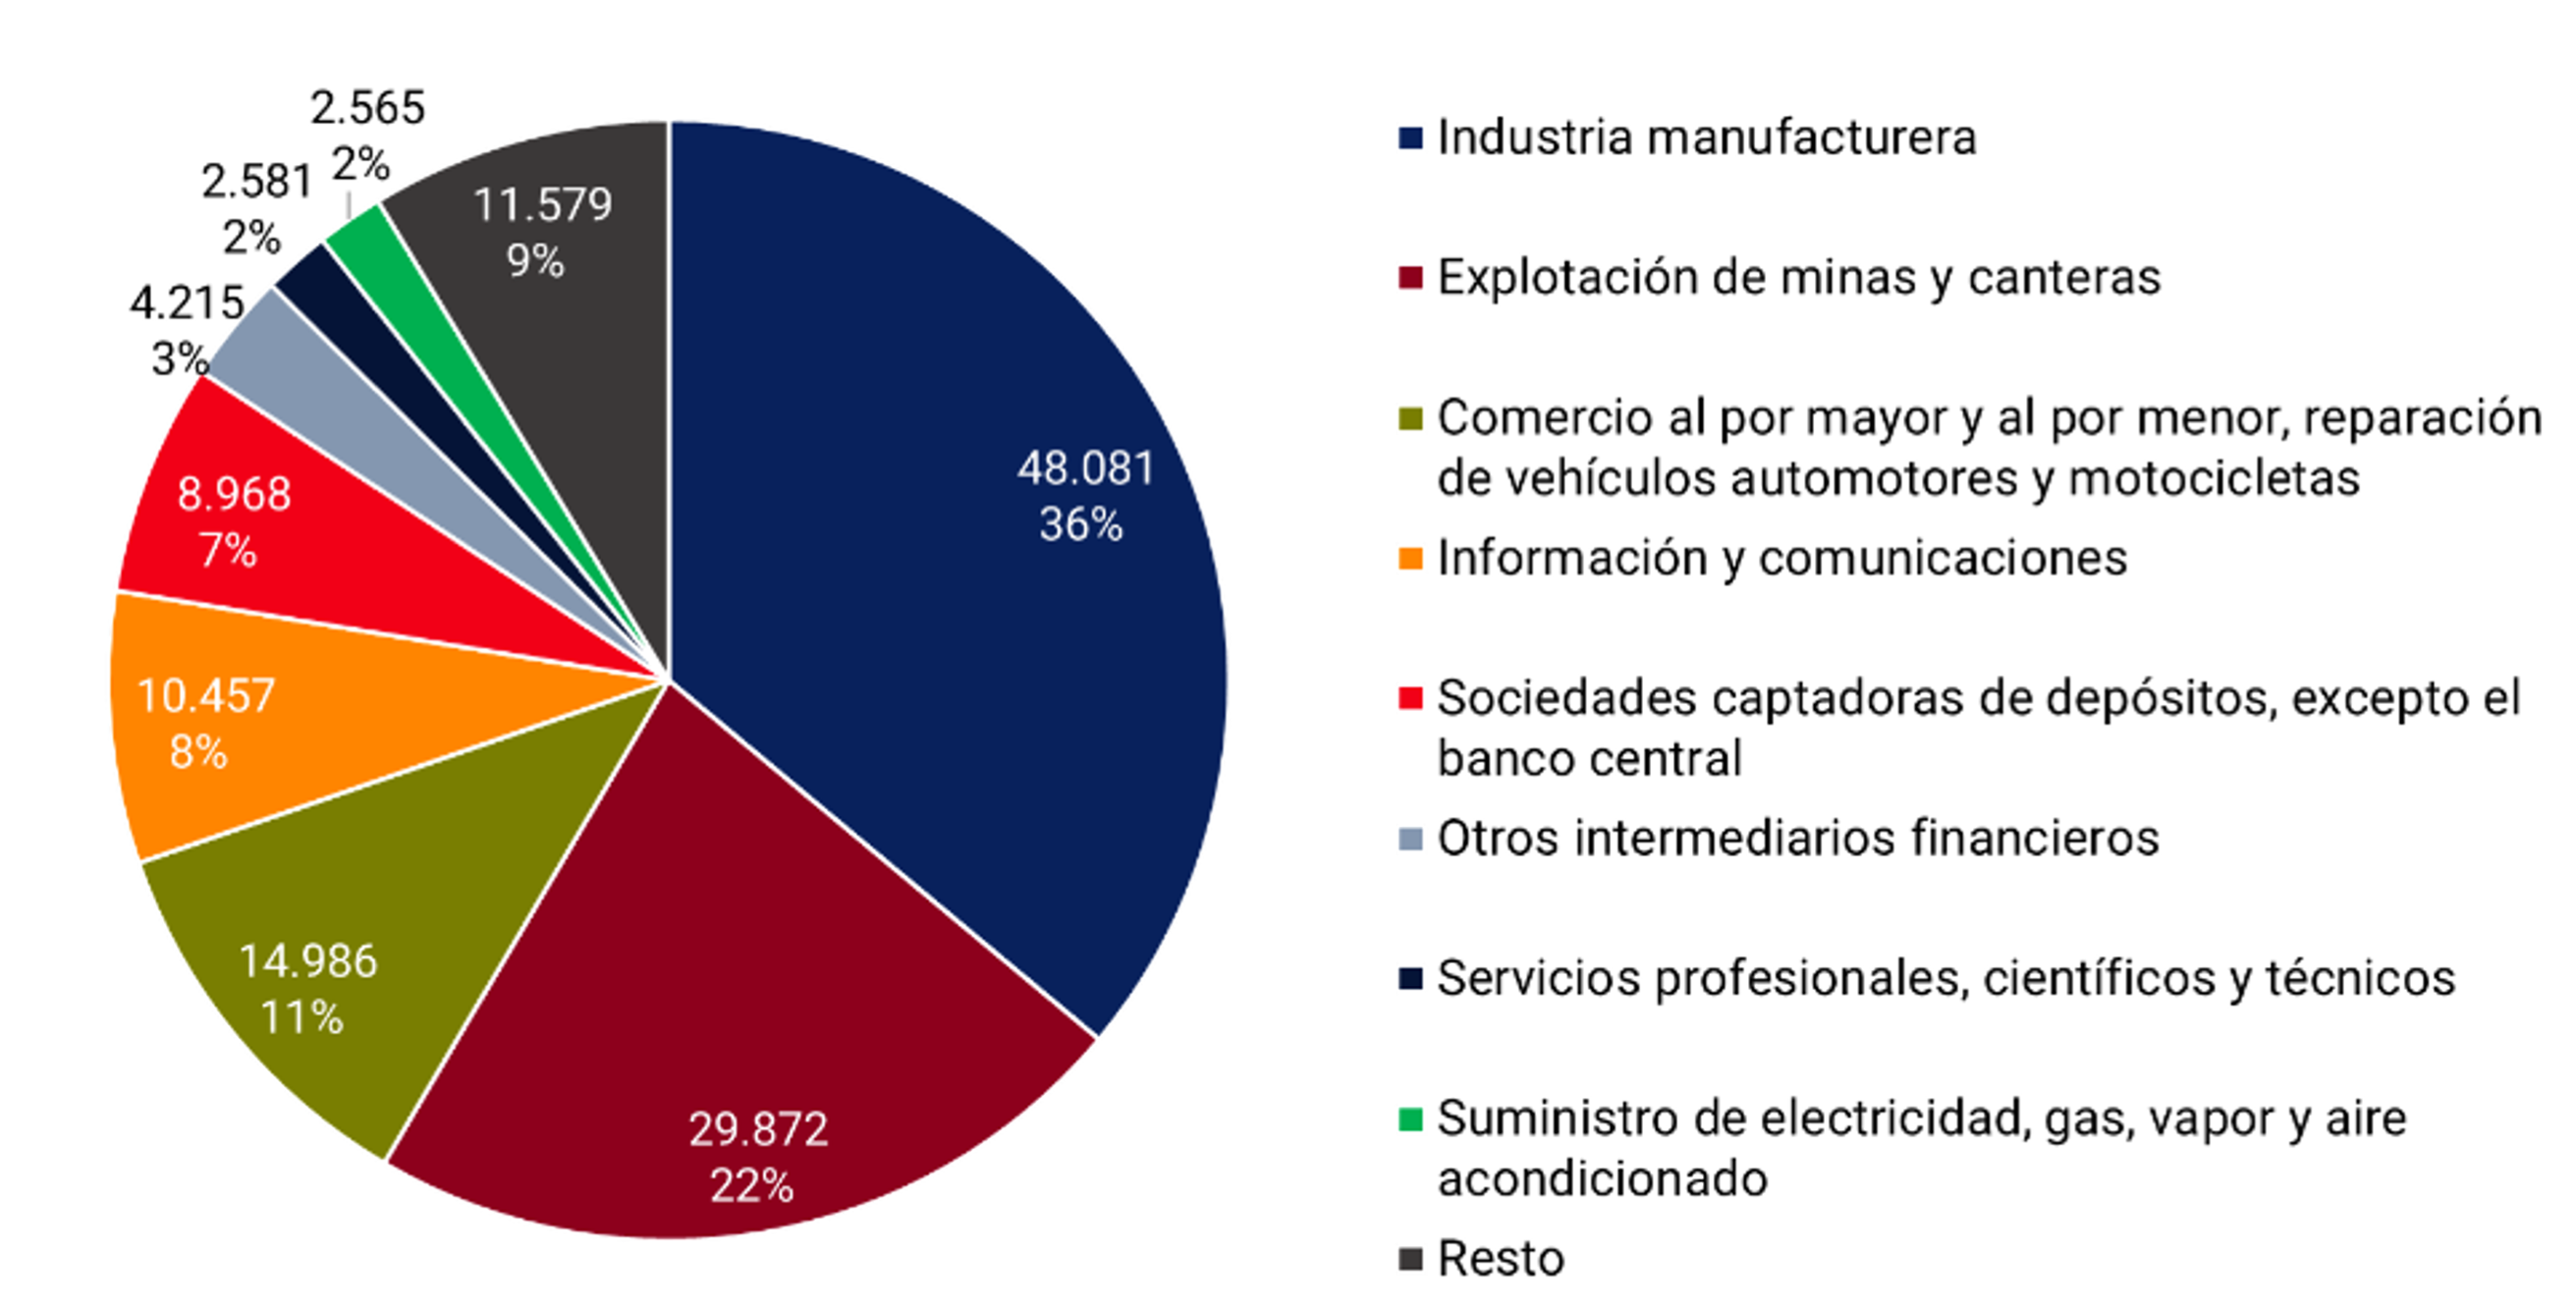
Source: BCRA.
In relation to the geographical origin of FDI in Argentina, direct investors from a total of 145 countries were observed as of 31-Mar-23 (see Graph 4). However, despite this apparent geographical dispersion, the gross passive FDI position was concentrated in a small group of countries in North America, Europe and South America.
Figure 4 | Gross Passive FDI Position in Argentina countries
Note: Higher color intensity indicates a higher Gross Passive FDI Position.
Source: BCRA.
The United States is the main source of FDI in Argentina, with a stock of US$25,684 million as of March 31, 23, which represented 19% of the total holdings. In second place is Spain, with a gross passive position of US$21,084 million (16% of the total), and in third place is the Netherlands, with US$16,343 million (12% of the total). These three countries concentrated almost 50% of the stock in Argentina. It is followed in importance by Brazil (US$9,174 million), Switzerland (US$6,346 million), Uruguay (US$6,066 million), the United Kingdom (US$5,140 million) and Chile (US$5,125 million).
Section 5 / Main aspects of the 2024 National Budget Bill
On Friday, September 15, the Executive Branch submitted the 2024 National Budget Bill (PPN-24) to the National Congress. The project outlines a set of public policies at the national level that seek to promote macroeconomic stability, rebuild the purchasing power of income, and strengthen the domestic market, with the aim of improving the quality of life of the population.
The macroeconomic assumptions included in the PPN-24 contemplate a 2.5% drop in the economy in 2023 and a growth of 2.7% for the following year. In particular, the expansion expected for 2024 will be disseminated among the components of demand, highlighting advances of 17.4% in exports and 1.6% in investment.
The PPN-24 projects exports of goods and services of US$101,248 million (+19.6% YoY) and imports of US$91,876 million (+1.3% YoY) for 2024, resulting in a surplus of the balance of goods and services of US$9,372 million. The year-on-year inflation stipulated in the bill decreases from current records to 69.5% y.o.y. by December next year. Finally, the exchange rate in December 2024 is estimated to be $607/US$ (see Table 1).
Table 1 | PPN 24 Main macroeconomic

assumptions
Source: BCRA based on PPN-24.
On the fiscal front, it is estimated that national tax collection will reach $84.3 billion in 2024, which implies an increase of 105.5% y.a. compared to the projection for 2023. The increase in revenue would be driven mainly by export duties (+356% YoY), due to higher exportable balances due to an annual improvement in the harvest, representing 1.43% of GDP (+0.79 p.p. compared to what is expected for 2023). Other taxes that would increase above nominal GDP would be the PAIS Tax (+0.34 p.p. of GDP; 184% y.o.y.) and Profits (+0.23 p.p. of GDP; 112.2% y.o.y.). On the other hand, VAT net of refunds would be reduced by 1.15 p.p. of GDP compared to 2023, due to tax credits arising from higher customs charges collected in 2023. In this way, the Collection would represent 23.6% of GDP in 2024, 0.32 p.p. more than in 2023. This collection performance would increase the NFPS’ tax resources by 115% YoY in 2024. The total revenues of the NFPS would total $62.1 billion and represent 17.6% of GDP (+0.54 p.p. in relation to what is stipulated in the PPN-24 for the end of 2023; see Graph 1).
Graph 1 | NFPS
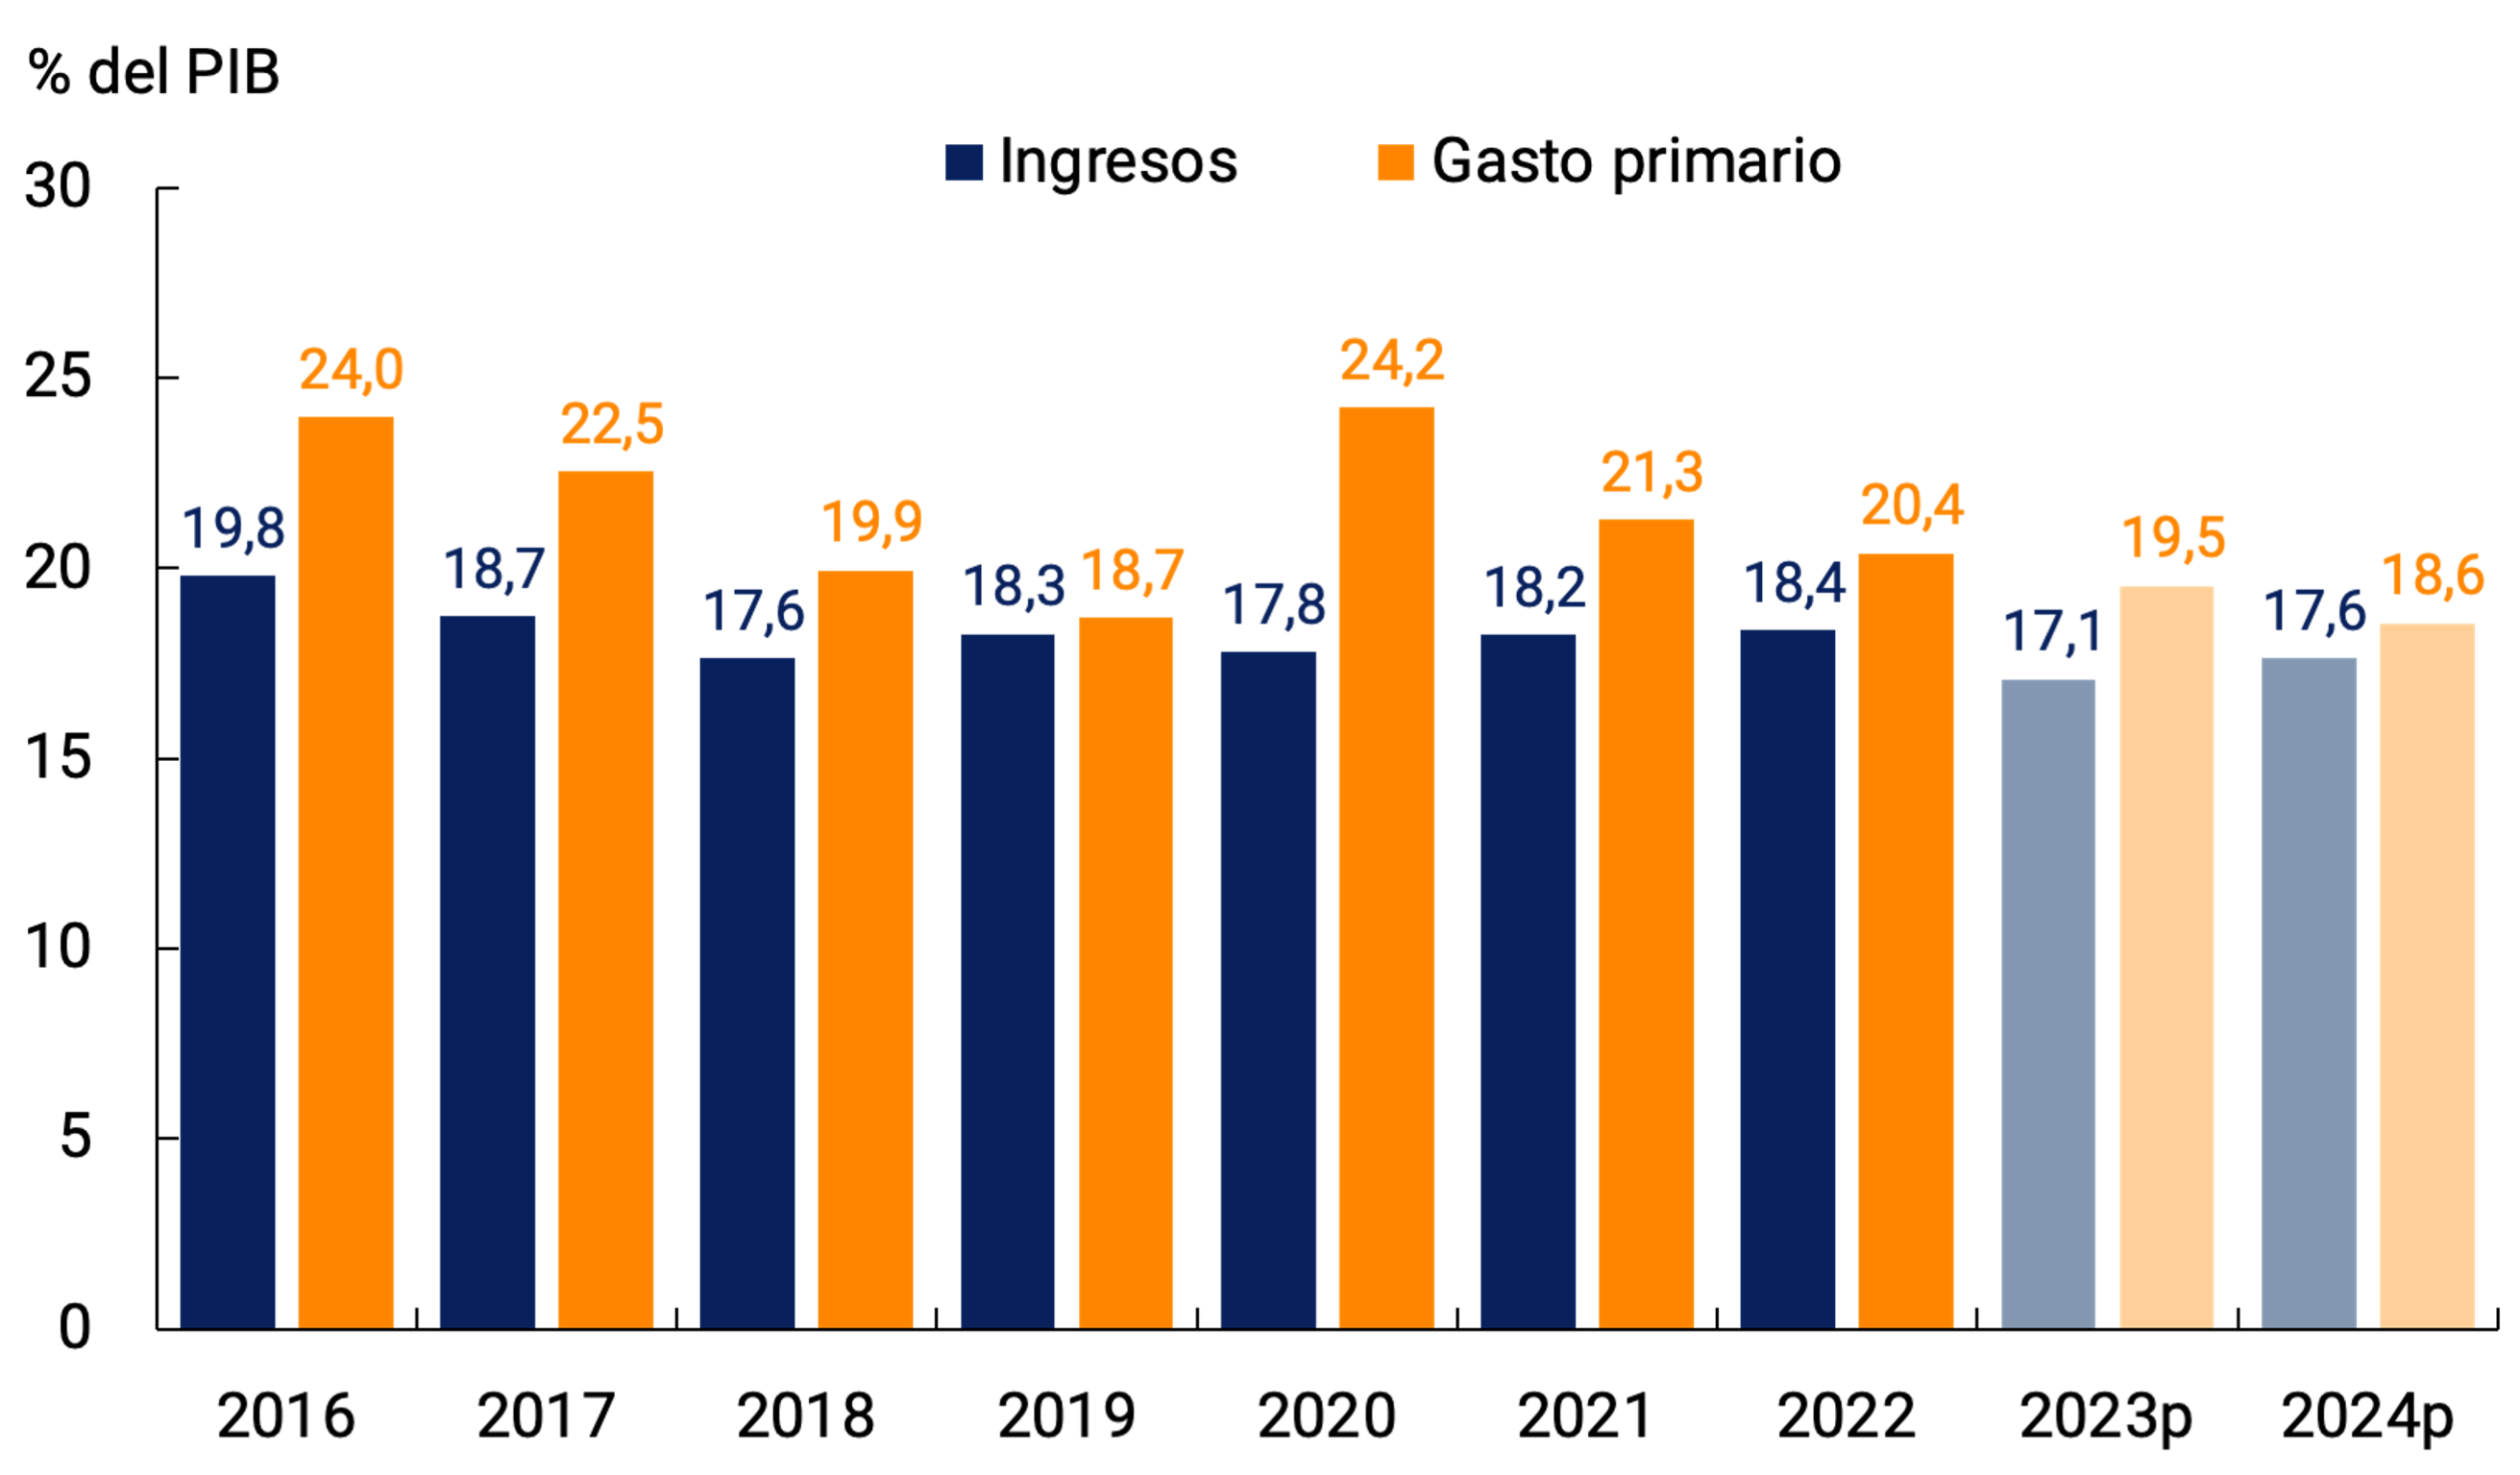
primary income and expenditure
p: Projected Note: Until 2022 cash basis. From 2023, on an accrual basis. In 2021, revenues were deducted from the allocation of SDRs from the IMF for the equivalent of $427,400 million.
Source: Ministry of Finance, PPN-24 and INDEC.
On the other hand, the PPN-24 contemplates a moderate nominal slowdown in the growth rate of NFPS primary expenditures, which would go from a growth of 102% YoY in 2023 to 93% YoY next year, totaling $65.4 trillion (18.6% of GDP; -1.0 p.p. YoY). The year-on-year reduction in primary expenditure in terms of GDP is mainly concentrated in current transfers, and in other current expenditures, including the deficit of public enterprises. The main item that would drive the growth of primary expenditures would continue to be that of Social Security benefits, which would grow by 0.4 p.p. of GDP in 2024 and would represent 41% of total primary expenditure. Meanwhile, capital spending is expected to maintain its share at 1.6% of GDP.
As a result of the dynamics of revenues and expenditures, it is estimated that in 2024 the NFPS will have a primary deficit of $3.3 trillion (0.9% of GDP). This primary result is consistent with the fiscal target set in the current program with the IMF. Interest with private, bilateral, and public financial organizations considered for next year would total $6.4 trillion (1.8% of GDP). Thus, the PPN-24 forecasts a financial result of the NFPS deficit of $9.7 billion for next year (2.7% of GDP; see Graph 2). Thus, the financial deficit, without accounting for the extraordinary income from the allocation of SDRs from the IMF in 2021, would be at the lowest level since 201552.
Graph 2 | Results of the National Non-Financial
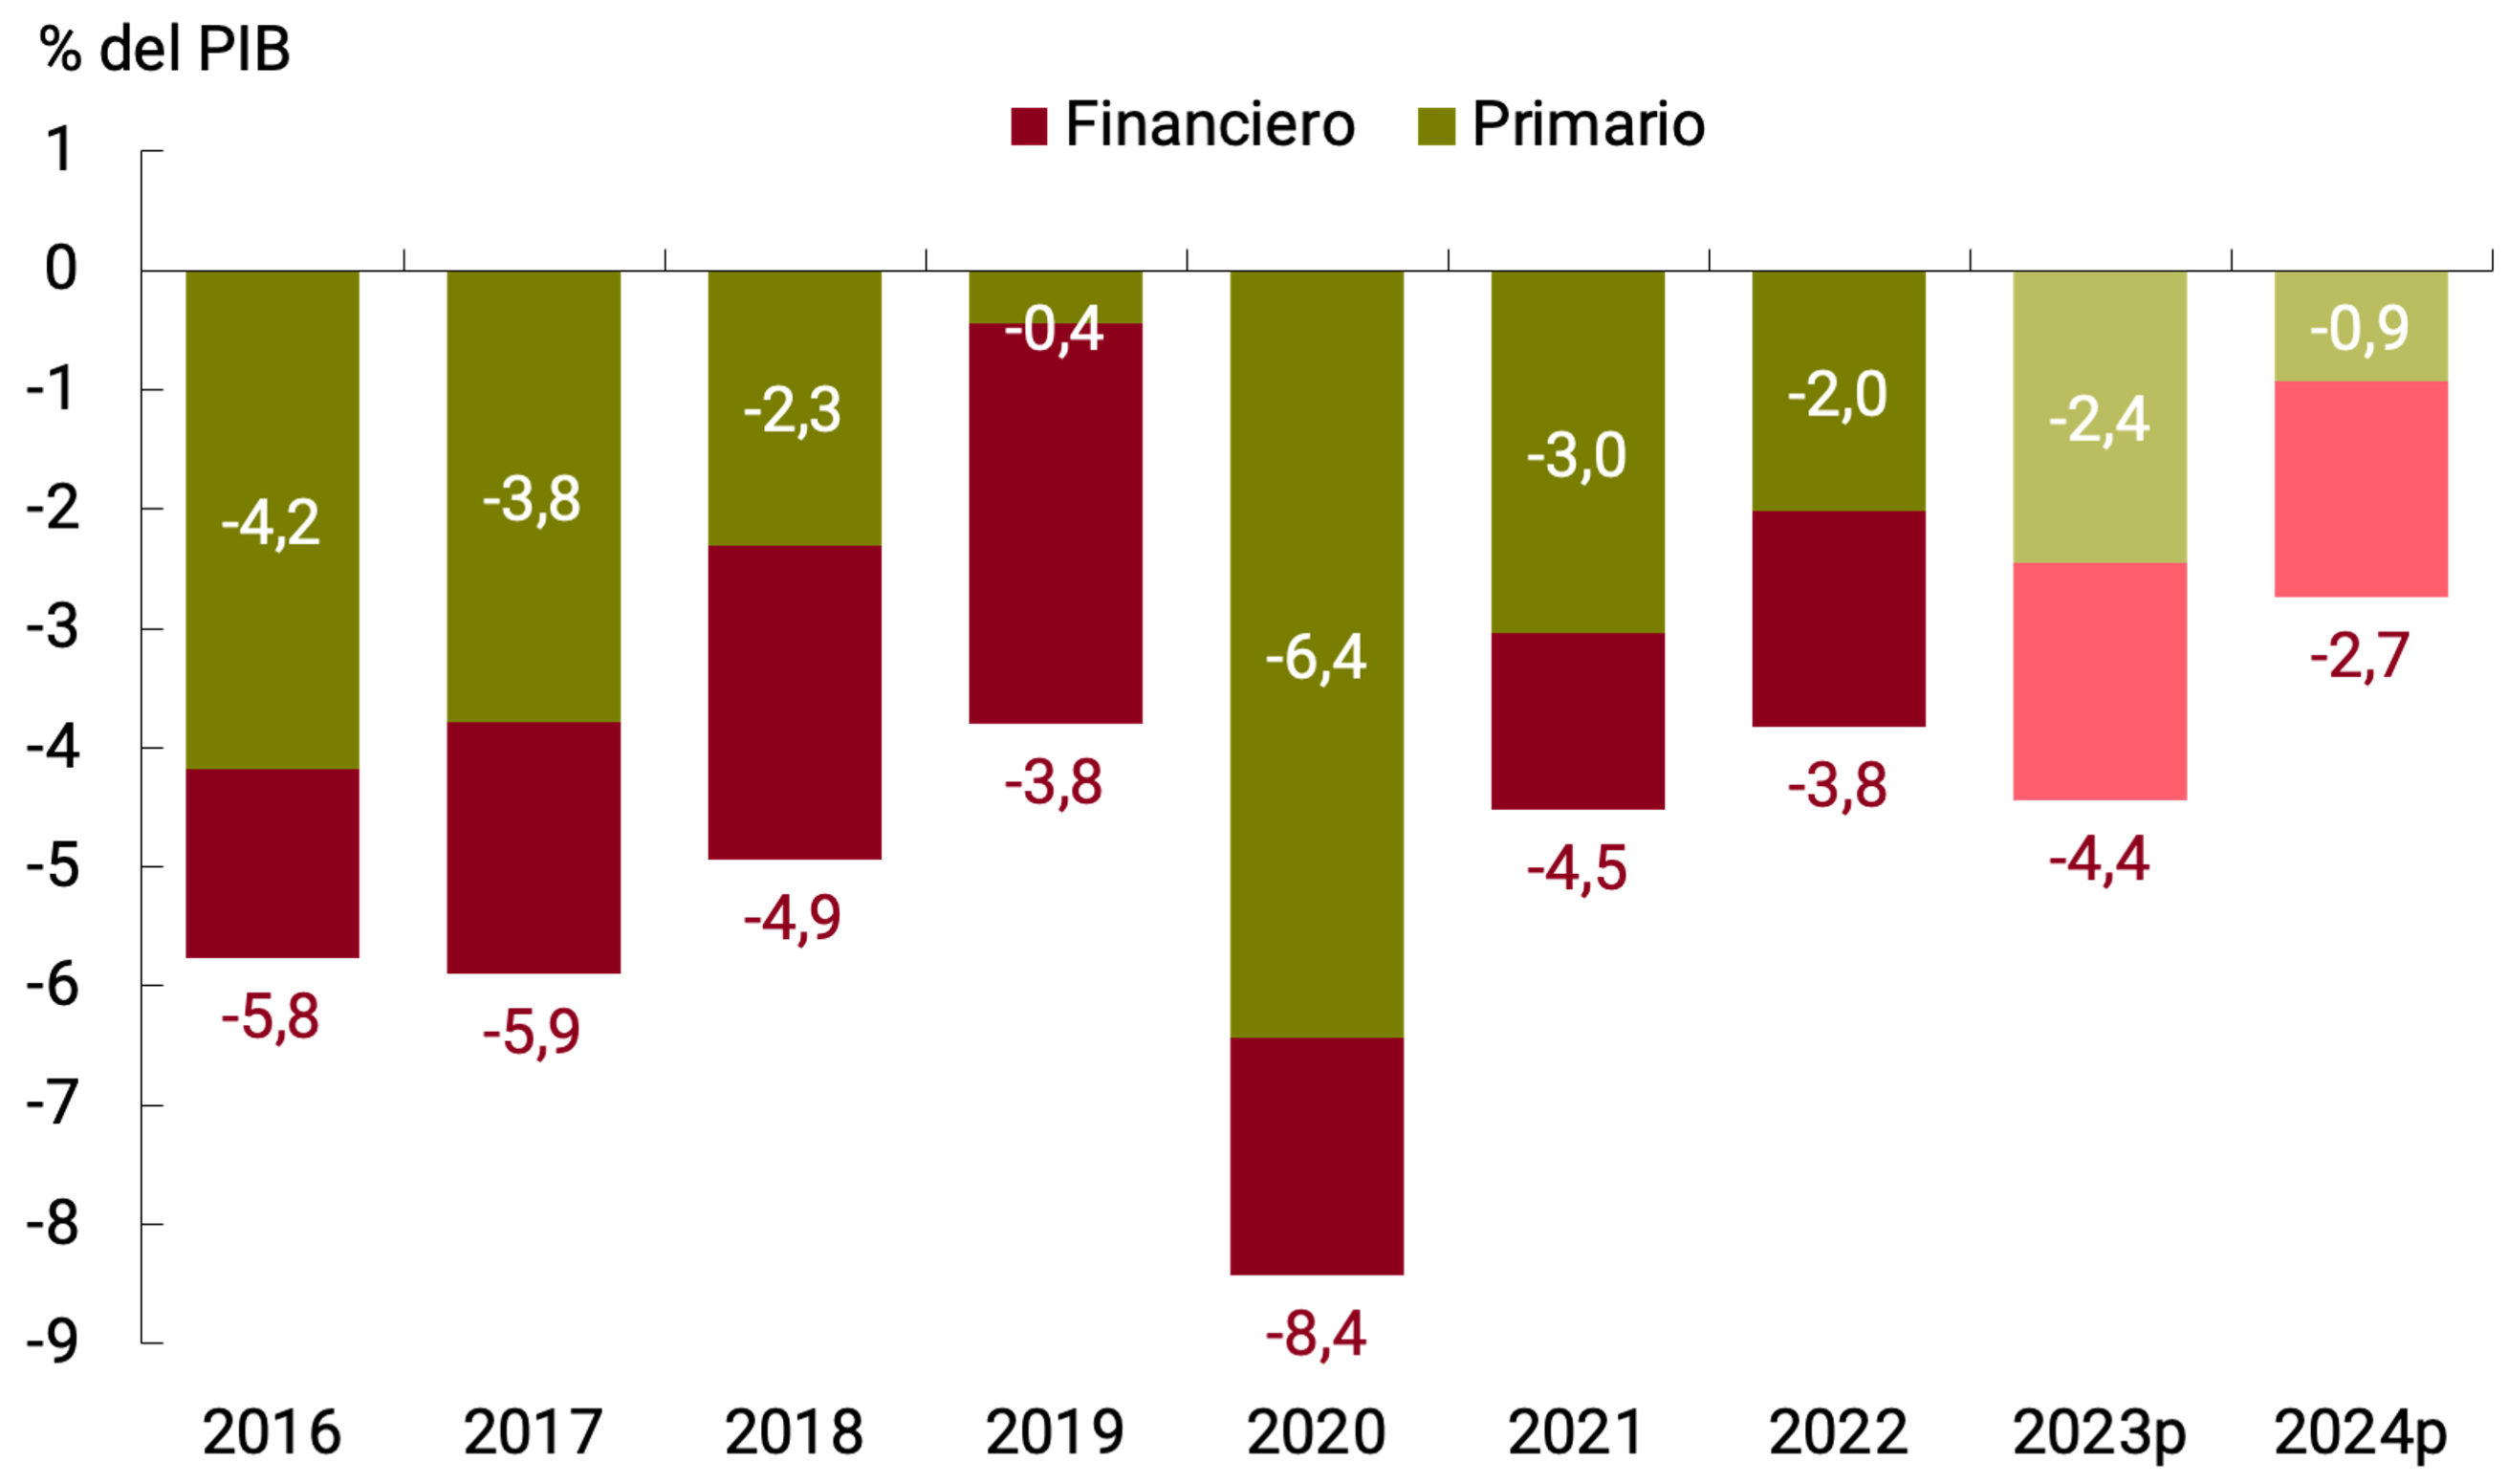
Public Sector
p: Projected. Note: Until 2022 box base. From 2023, on an accrual basis. In 2021, SDR allocation of $427,400 million was deducted from revenues.
Source: Ministry of Finance, PPN-24 and INDEC.
In terms of financing, PPN-24 contemplates total needs for the equivalent of 3.5% of GDP. These would be financed from net placements with securities and bills in national currency for 1.5% of GDP53 and net financing with multilateral credit organizations for 0.1% of GDP. In line with the 5th and 6th revisions of the agreement with the IMF, neither Transitory Advances nor BCRA Profits are foreseen (see Table 2).
Table 2 | Net financing of the National Public Administration (PPN-24)
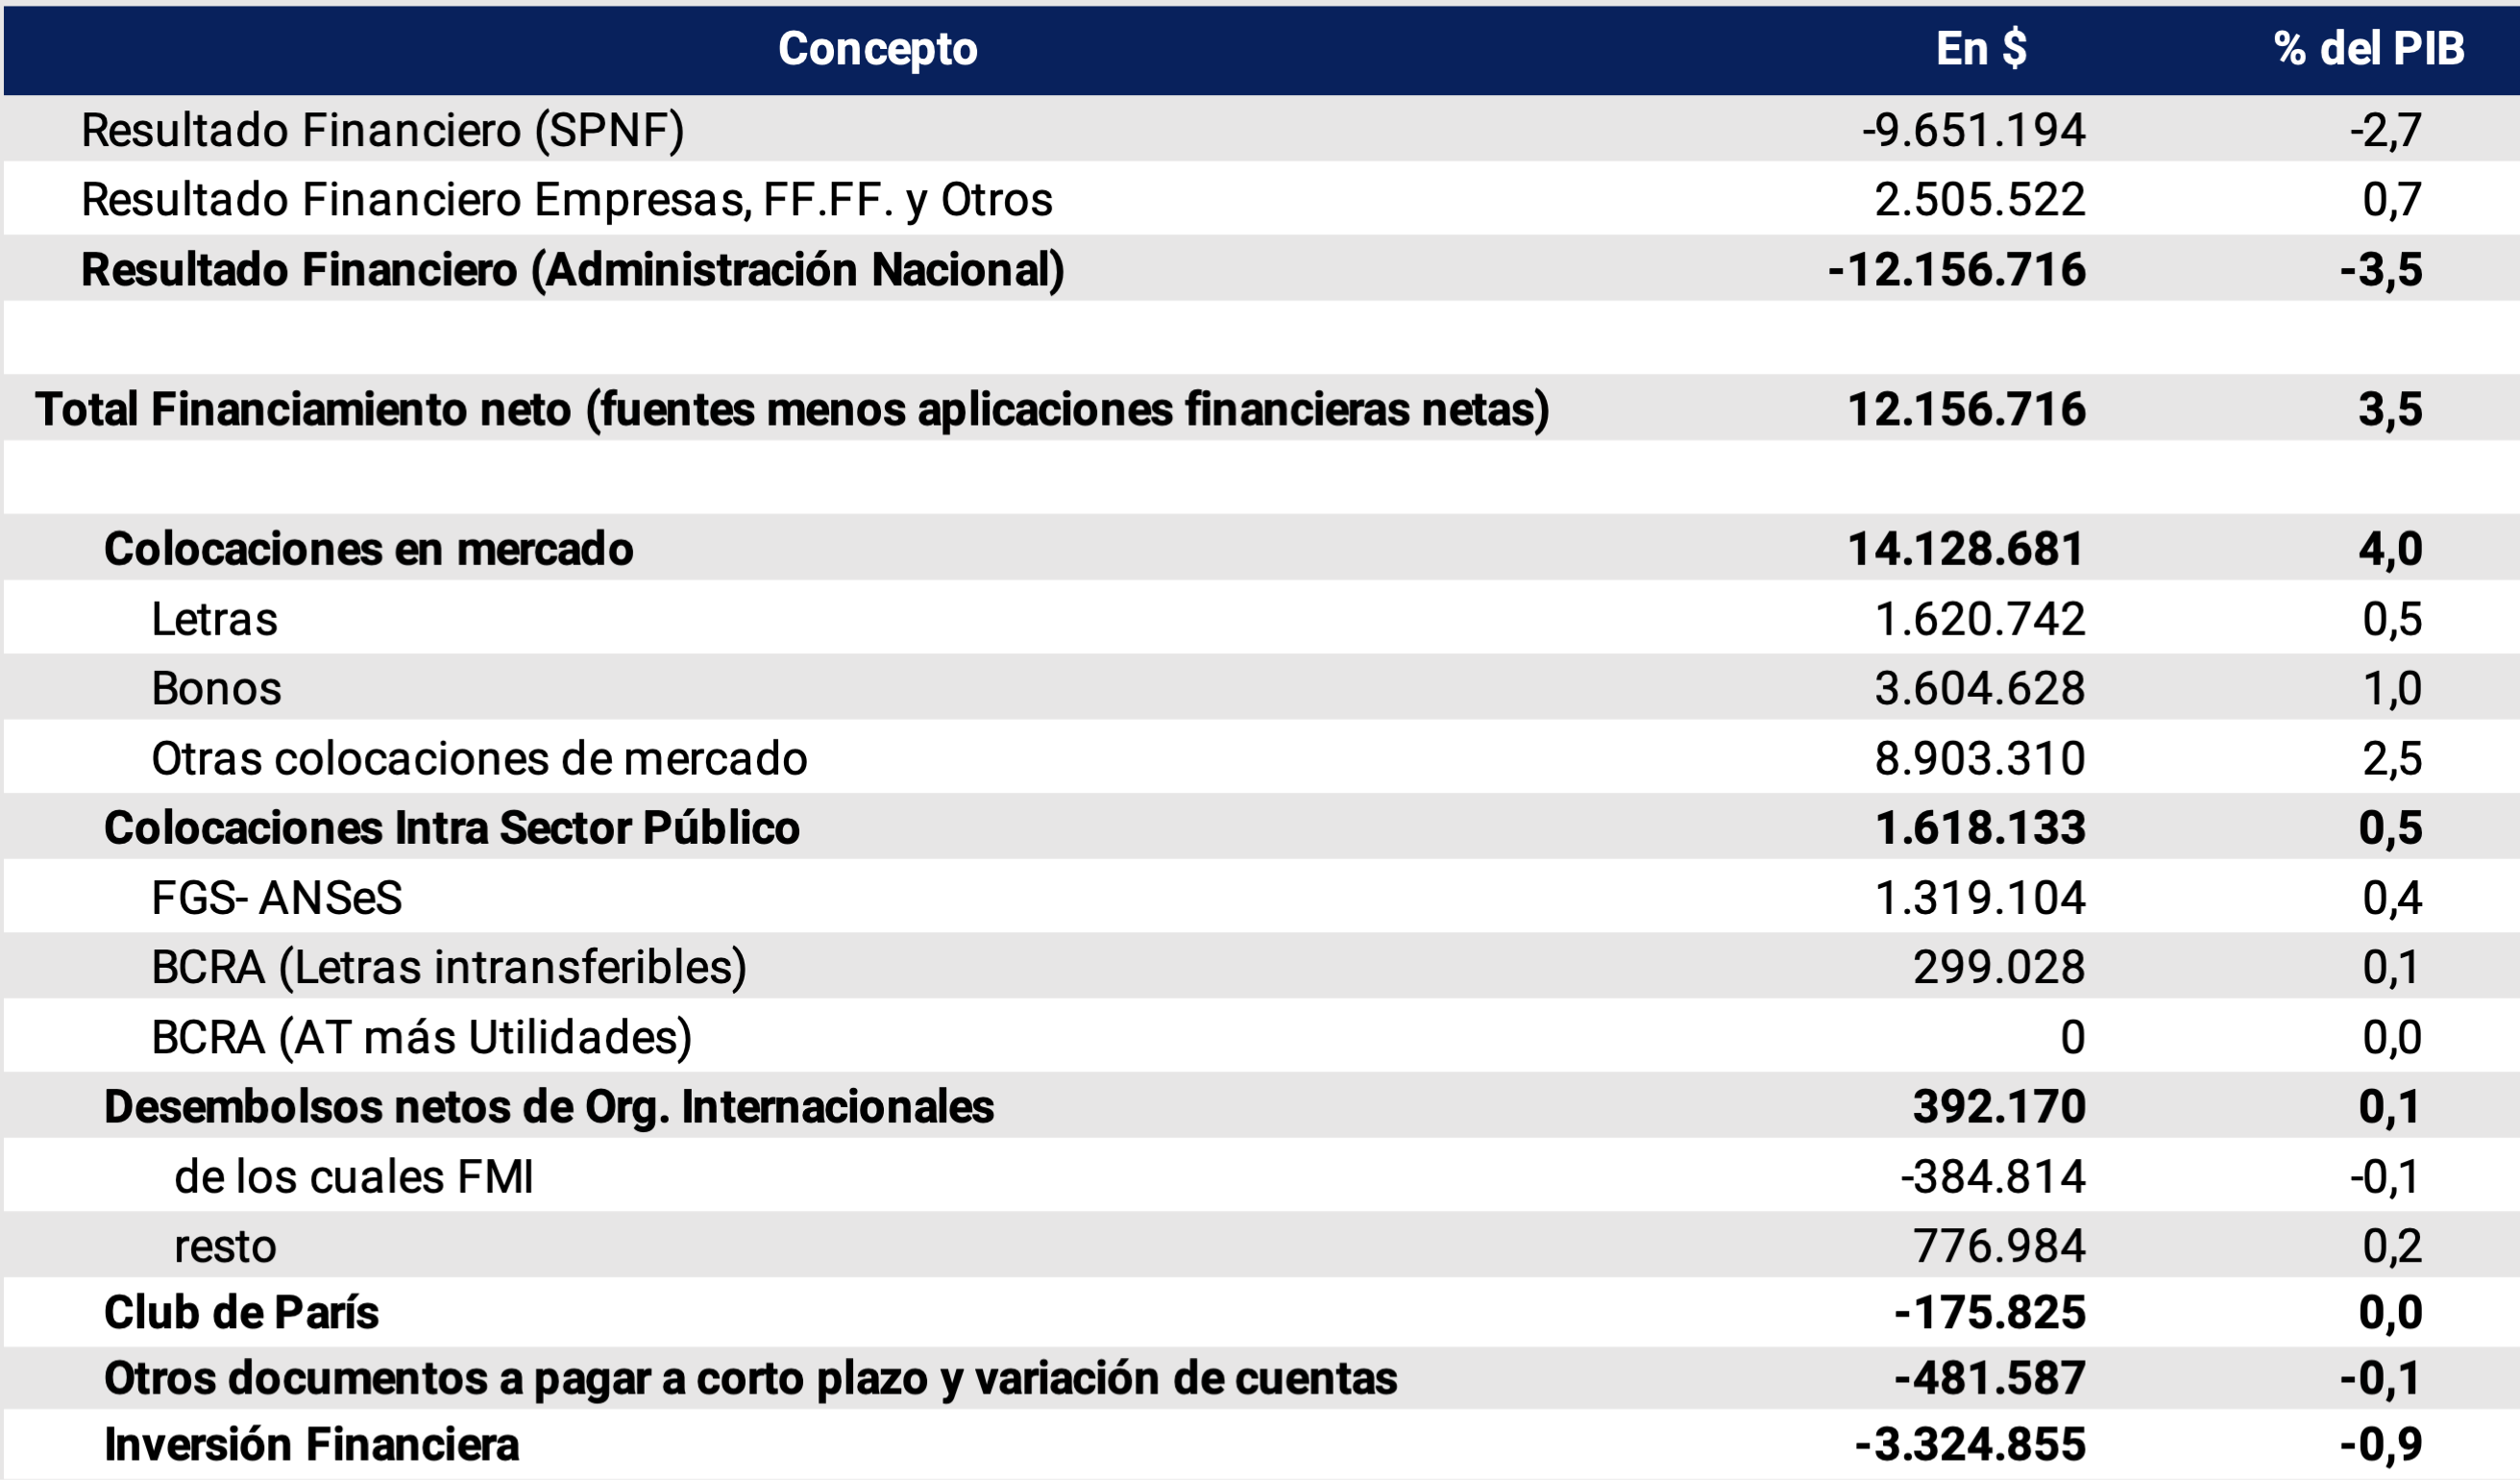
Source: BCRA based on PPN-24.
The effects of the drought on the supply of fruits, vegetables and poultry meat were left behind and since May there has been a significant slowdown in their prices. In addition to this, from that month onwards began the stage of the year in which there are usually more limited increases in beef prices, so the rate of increase in the group of Meats and CPI derivatives was abruptly reduced compared to previous months43. In this way, the food that we call fresh significantly reduced its rate of increase to 1.2% monthly average in May and June (-10.7 p.p. compared to the average between February and April). In June, there was a reduction in the rate of increase of packaged foods and non-alcoholic beverages to 8.4% monthly, after averaging 9.3% in April and May. Thus, the Food and non-alcoholic beverages division moderated its pace to 5.8% and 4.1% month-on-month in May and June, respectively, after registering a 10.1% increase in April (see Graph 4).
Section 6 / The impact of commodities and capital goods and inputs on inflation: a long-term analysis for Argentina
Introduction
Argentina’s productive structure has, on the one hand, a high share of raw materials in its export basket60, and, on the other, it exhibits a strong dependence on imports of capital goods and inputs. This explains the weight of the external sector in domestic inflationary dynamics61. Although exchange rate fluctuations are of the first order to understand this process, autonomous movements in international prices cannot be ignored either, especially after the COVID-19 pandemic and the war between Russia and Ukraine have revived the inflationary phenomenon at the global level, precisely in a context where inter-industrial relations between countries influence international trade62.
To account for these factors, in this section we present a new analysis of the long-term determinants of inflation in Argentina for the period 2004-202263, incorporating the Agricultural Commodity Price Index (IPMPA) published by the BCRA, and a new External Price Index (IPE), which allows us to capture the dynamics of producer prices in the main countries that supply inputs and capital goods used in local production.
External Price Index (IPE)
The IPE follows the methodology used by Morlin (2022)64, who prepares the same index to study the impact of the costs of imported capital goods and inputs on inflation in Brazil. The EPI is a weighted average of the producer price indices of Argentina’s trading partners:
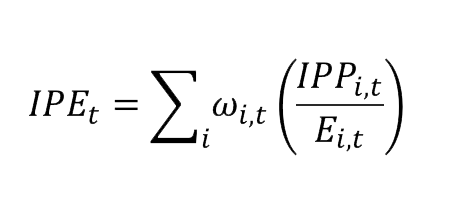
(1)
Where ω i,t65 measures the share of imports of capital goods, parts and pieces for capital goods and intermediate goods from country i in period t in Argentina’s total imports of those uses. IPPi,t represents the producer price index of country i in period t and Ei,t is the nominal exchange rate of the currency of country i against the United States dollar, in the same period. The ratio of each country’s producer price to the dollar exchange rate provides a measure of producer inflation in dollars. This prevents that, in the event that a trading partner experiences a sustained increase in its price level in relation to the rest, that country ends up dominating the behavior of the index. In the same way, it allows moderating the impact of devaluations by trading partners, in a context in which high inflation can be associated with currency devaluations.
Data from the INDEC trade base on imports of capital goods, parts and accessories for capital goods, and intermediate goods were used to select the countries considered in the preparation of the index. The countries selected are those that individually exceed 5% of trade for each use, and together are responsible for approximately 80% of imports of those uses in the last eleven years (period 2012-2022; (see Table 1)).
Table 1 | Share of Trading Partners in Imports 2012-2022, in percentage
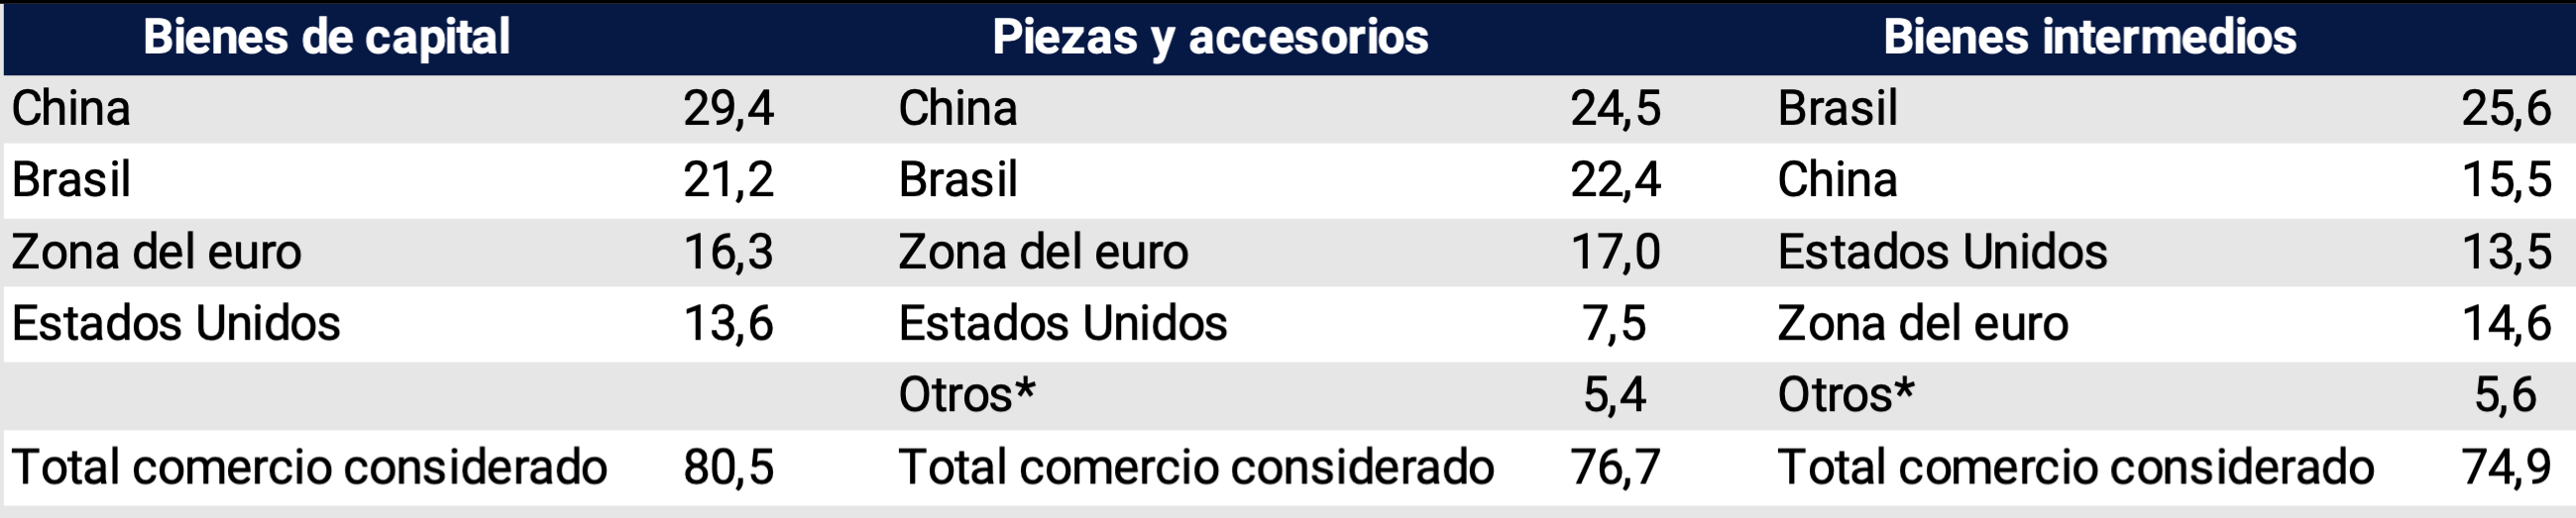
*Other corresponds to imports from Thailand and Paraguay.
Source: BCRA based on INDEC data.
Graph 1, in turn, allows us to observe the evolution of the participation of these countries as Argentina’s trading partners, and accounts for the strong increase of China to the detriment of the rest, such as the United States and Brazil.
Graph 1 | Trade Weights of the External Price Index
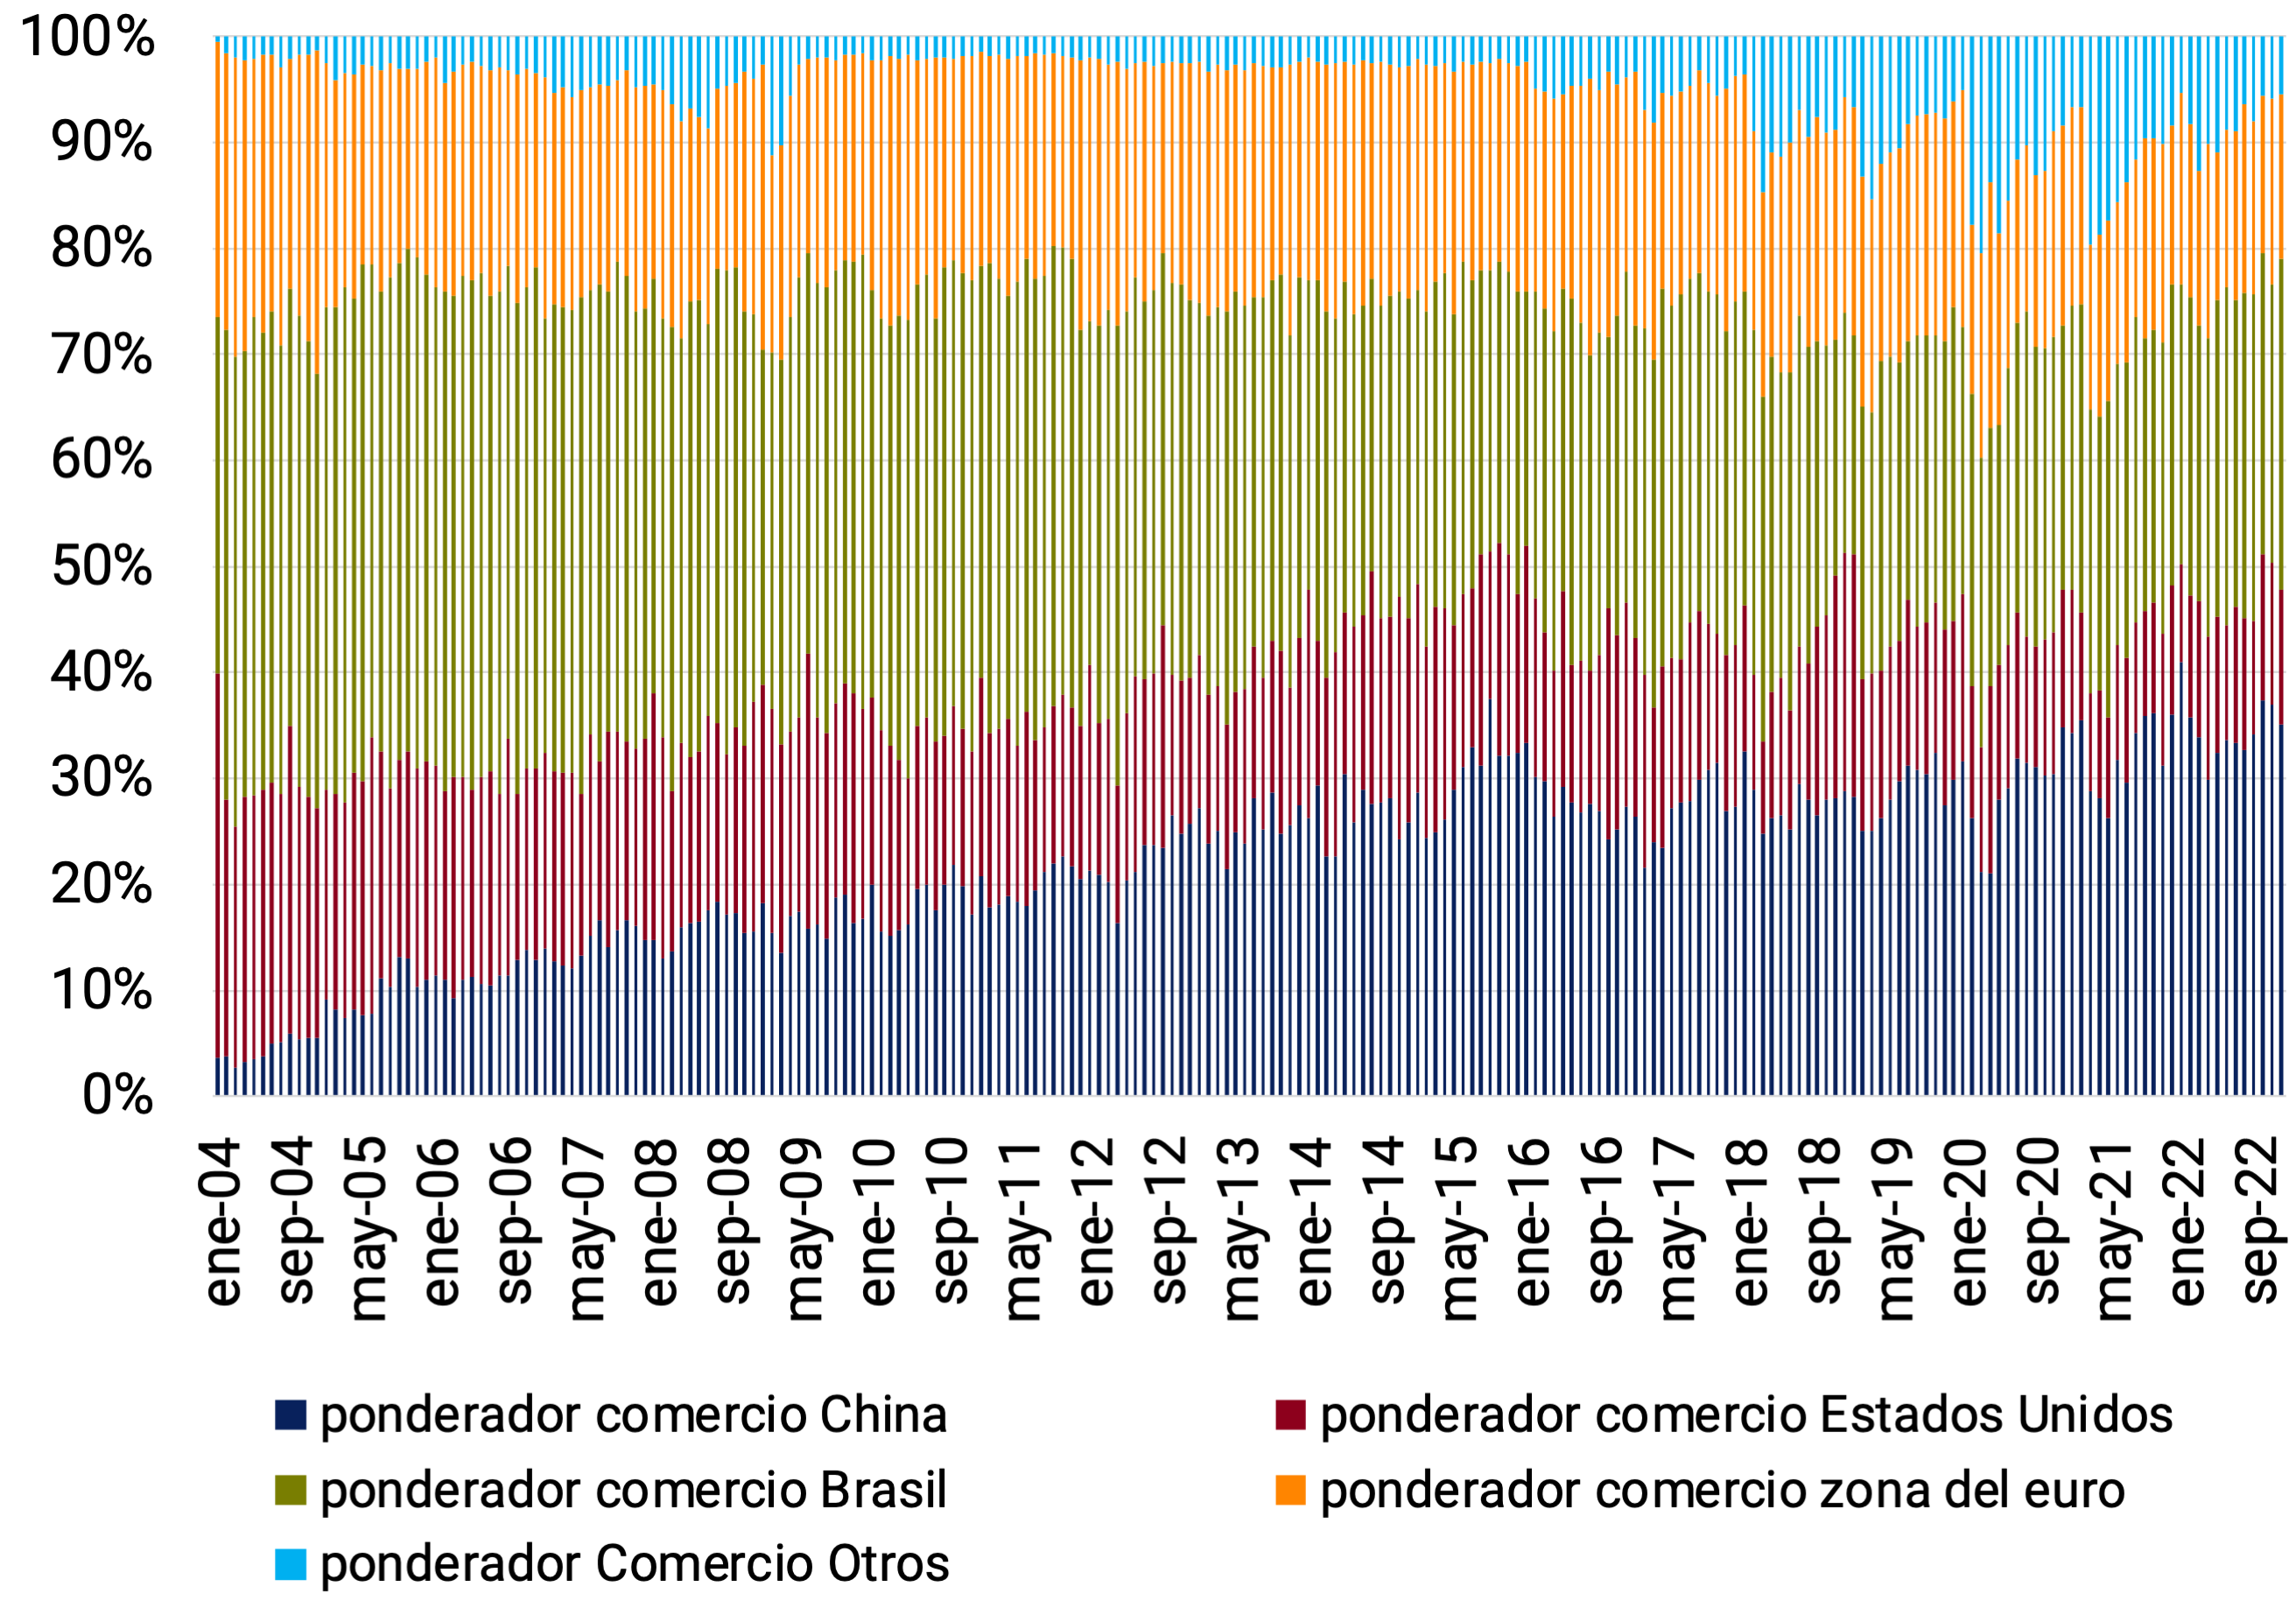
Source: BCRA based on INDEC and own data.
Long-term analysis
The analysis of the long-term link between core inflation and domestic and external variables is carried out using the “cointegration” methodology66. The period considered extends between 2004 and 2022.
The price index used for the calculation (P) is the Core category of the Consumer Price Index (CPI), with nationwide coverage, prepared by INDEC. Among the domestic determinants, wages (W) were considered, in particular the average remuneration of registered workers in the private sector, published by the Ministry of Labor (MTEySS). To quantify the impact of the external variables, in addition to the IPE, the nominal exchange rate (E), corresponding to the BCRA’s Communication A3500 , and the agricultural commodity price index (IPMPA), from the same source, were included.
Applying the cointegration approach to the series of interest, a single long-term relationship is found:
P=0.20 x E+0.80 x W+0.02 x IPE +0.01 x IPMPA (2)
All variables are significant with the expected sign67. The first result is that the values for the weights of wages and the nominal exchange rate obtained in previous estimates are maintained. 80% of the evolution of prices is associated with the path of wages, while 20% depends on the exchange rate. It is confirmed, for the period 2004-2022, that persistent real depreciations have been associated with lower real wage levels on average, and vice versa. The second result confirms the relevance, although significantly lower, of external prices in the determination of domestic prices, since both the IPE and the IPMPA were significant in the cointegration relationship.
This methodology also allows us to evaluate whether any (some) of the variables considered respond to deviations or imbalances in the long-term relationship, which is known in the literature as “weak exogeneity” analysis. This concept of exogeneity has the advantage of allowing modeling a group of variables (the endogenous variables) without necessarily specifying how the second group (the exogenous variables) is determined68. As expected (see Table 2), in addition to the nominal exchange rate, both the IPE and the IPMPA are exogenously weak variables, while domestic prices and nominal wages are the variables that respond endogenously to long-term imbalances.
The tests reported in Table 2 are the conventional tests of weak exogeneity. The hypothesis evaluated is αi = 0 vs αi ≠ 0, with i = 1,2,3,4,5 (which correspond, respectively, to P, W, E, IPE and IPMPA). These coefficients represent the response of each variable to deviations from the long-run relationship.
Table 2 | Weak exogeneity analysis

Source: BCRA.
Conclusions
In this section, we have incorporated the IPMPA prepared by the BCRA and a new external price index (IPE) to account for the role that, in the long term, international prices have on domestic inflation, expanding the set of relevant information used in previous estimates.
Although the nominal exchange rate and monetary wages continue to have the greatest weight in local inflationary dynamics, the econometric results allow us to conclude that international prices play a limited but significant role in this process. And, like the nominal exchange rate, they are weakly exogenous variables in the long-run relationship, while wages and domestic prices are the variables that adjust for deviations from the long-run relationship.
References
Auer, R., Borio, C.E., Filardo, A. J. (2017). The globalisation of inflation: the growing importance of global value chains. Technical Report DP11905, CEPR Discussion Paper.
BCRA (2020). Monetary Policy Report, November, Section 7.
BCRA (2023). Monetary Policy Report, July, Section 1.
Dogliolo, F., Dvoskin, A., Garegnani, L., Sangiacomo, M. (2023). The elasticities of foreign trade in Argentina (2004-2022). Technical Note No. 6, BCRA.
Engle, R., Hendry, D.F., Richard, J.F. (1983). Exogeneity. Econometrica, 51(2), 277-304.
Johansen, S. (1988). Statistical Analysis of Cointegration Vectors. Journal of Economic Dynamics and Control, vol.12, issue 2-3, 231-254.
Johansen, S. Juselius, K. (1990). Maximum Likelihood Estimation and Inference on Coinategration-With Applications to the Demand for Money. Oxford Bulletin of Economics and Statistics, vol. 52, issue 2, 169-210.
Juselius, K. (2006). The Cointegrated VAR Model. Methodology and Applications. Oxford University Press.
Morlin, G.S. (2022). International Inflation and Trade Linkages in Brazil under Inflation Targeting. Working Paper N. 16, DISEI, Universit’a degli Studi di Firenze.
Montes Rojas, G. Noguera, D. (2023). The Direct and Indirect Effects of an Asymmetric Sectoral Shock at the Global Level: A Dynamic Analysis of Input-Output Relationships. Working Paper No. 111, BCRA.
Glossary of abbreviations and acronyms
ADEFA: Association of Automotive Manufacturers of the Argentine Republic.
AFCP: Portland Cement Manufacturers Association.
AFIP: Federal Administration of Public Revenues.
AMBA: Buenos Aires Metropolitan Area.
ANSES: National Social Security Administration.
AT: Transitory Advance.
AUH: Universal Child Allowance for Social Protection.
BADLAR:Buenos Aires Deposits of Large Amount Rate (interest rate paid for fixed-term deposits of more than one million pesos in the 30 to 35-day bracket by the average of banking entities).
BCRA: Central Bank of the Argentine Republic.
BOAT: National Treasury Bond.
CABA: Autonomous City of Buenos Aires.
CAME: Argentine Confederation of Medium Enterprises.
CAMARCO: Argentine Chamber of Construction.
CAMMESA: Compañía Administradora del Mercado Mayorista Eléctrico Sociedad Anónima.
ECLAC: Economic Commission for Latin America and the Caribbean.
CER: Reference Stabilization Coefficient.
S Fuels and Energy.
DECNU: Decree of Necessity and Urgency.
DLK: Securities adjusted to the evolution of the dollar.
EDP: Durable Production Equipment.
EIL: Survey of Labor Indicators.
EMAE: Monthly Estimator of Economic Activity.
EMBI+: Emerging Markets Bond Index Plus.
EPH: Permanent Household Survey.
EUR: Euros.
Fed: Federal Reserve of the United States.
FAITHFUL: Latin American Economic Research Foundation.
IMF: International Monetary Fund.
FSB: Financial Stability Board.
G20: Group of 20.
GBA: Greater Buenos Aires.
A.I.: Year-on-year.
IBIF: Gross Fixed Domestic Investment.
ILA: Leading Indicator of Economic Activity.
INDEC: National Institute of Statistics and Censuses.
National CPI: Consumer Price Index of national coverage released by INDEC.
CPI BA: Consumer Price Index of the Autonomous City of Buenos Aires.
IPIM: Internal Wholesale Price Index.
IPOM: Monetary Policy Report.
ISAC: Synthetic Construction Indicator.
VAT: Value Added Tax.
LELIQ: Letrax de Liquidez of the Central Bank of the Argentine Republic.
M2: Banknotes and coins + quasi-currencies in circulation + current accounts in $ and savings accounts in $.
MSMEs: Micro, small and medium-sized enterprises.
Mens: monthly/monthly.
MOA: Manufactures of Agricultural Origin.
MOI: Manufactures of Industrial Origin.
MTEySS: Ministry of Labour, Employment and Social Security.
N.A.: Annual nominal.
NEA: Northeast Argentina.
NGFS: Network for Greening the Financial System.
NOA: Northwest Argentina.
OECD: Organization for Economic Cooperation and Development.
P.B.: Basic points.
P.P.: Percentage points.
Q: Projected.
COUNTRY: Tax for an Inclusive and Supportive Argentina.
EAP: Economically Active Population.
PFE: IMF Extended Facilities Program.
GDP: Gross Domestic Product.
FOOT: Export Increase Program.
PMI: Purchasing Managers’ Index. Index of surveys to purchasing managers.
PP: Primary products.
SMEs: Small and medium-sized enterprises.
REM: Survey of Market Expectations of the BCRA.
s.e.: Series without seasonality.
NFPS: National Non-Financial Public Sector.
TNA: Annual Nominal Rate.
Trim.: Quarterly / Quarter.
US$: US dollars.
UTDT: Torcuato Di Tella University.
UVA: Unit of Purchasing Value.
Var.: Variation.
WEO: World Economic Outlook prepared by the IMF.
References
1 According to the Nowcasting of global export data built by the Kiel Institute for the World Economy.
3 Saudi Arabia announced that it would extend its voluntary production cut of 1 million barrels per day until the end of December. Russia also extended its voluntary reduction in oil exports by 300,000 bpd until the end of the year.
4 The analysis will use information based on systematized financial statements from Eikon-Reuters for Private Non-Financial Companies in Latin America, listed in the main stock market indices, between 1995 and 2022, and belonging to the 8 main economies of the region (LAC8) (Argentina, Brazil, Chile, Colombia, Peru, Mexico, Venezuela and Uruguay).
5 Among previous studies that study this problem, it is possible to distinguish between those that use aggregated information (see Bebczuk, 1994; Acosta Losa, 2005; Panigo et. al., 2007, for an analysis of Argentina) and those that are based on the use of micro-data, from tax, accounting or similar records (see Fanelli and Bebczuk, 2002; Panigo and Oliveri, 2007, Elosegui et. al. 2006; Fernandez, 2011 for an analysis of Argentina and Latin America).
6 Various correspondence tests between the information in national accounts and the accounting information show that, despite the bias of the base towards large companies, there is a high link between the sales cycle and the national GDP, the profit cycle and the Gross Operating Surplus of the GDP and the dynamics of corporate investment in Properties, Plants and Equipment and the FBK at the national level.
7 LAC8 corresponds to the eight main economies of Latin America such as Argentina, Brazil, Chile, Colombia, Mexico, Peru, Venezuela and Uruguay. From 2018 to 2022 information not available for Venezuela. Year 2022 includes projected national accounts data based on national statistics.
8 The estimation methodology uses the generalized Arellano-Bond moment method with the transformation of dynamic Bundell-Bond panels using instruments in levels for years and sectors and levels and differences for the rest of the controls.
9 The variables are scaled by the capital stock of each firm, and in logarithms, so the reported coefficients can be interpreted as elasticities.
10 Routine over-identification and autocorrelation tests were performed with favorable results.
11 The total elasticity of the financial asset-to-investment ratio for firms belonging to the low percentiles of the asset distribution is 0.196 (sum of 0.066 of the average effect plus 0.130 of the specific effect of the 25th percentile), while the total elasticity for firms of the high percentiles in the asset distribution is 0.057 (sum of 0.086 of the average effect minus 0.029 of the specific effect of the 75th percentile).
12 According to data from the Ministry of Agriculture.
13 For example, soil repair, tasks related to planting such as renting machinery, buying seeds, among others.
14 Includes the national public administration.
15 In year-on-year terms, the variation in the employment rate remained unchanged due to the positive contribution of salaried workers with a retirement discount (+1.2% YoY), which was fully offset by the falls of both salaried employees without a retirement discount (-0.5% YoY) and employers (-0.4% YoY) and family workers (-0.1% YoY).
16 Notwithstanding the methodological differences duly explained by INDEC between the survey procedures prior to 2016 of the Permanent Household Survey (EPH) and the subsequent procedures, it should be noted that the unemployment rate recorded in the second quarter of 2023 is the lowest since the beginning of the continuous EPH survey. in 2003.
17 In the case of Supermarkets, deflated sales registered a 1.5% quarterly drop s.e. according to INDEC. However, the units sold of domestically produced cars increased 13.3% quarter-on-quarter s.e. according to ADEFA data, deflated sales in shopping centers grew by 16% quarter-on-quarter s.e. according to INDEC, with growth in all items, and units sold of large household appliances also increased, such as refrigerators and freezers (2.9% quarter-on-quarter s.e.), gas cookers (16.2% quarter-on-quarter s.e.), Water heaters and water heaters (14.6% quarterly), washing machines (3.4% quarterly), and televisions (12.1% quarterly).
18 The demand data of the large companies supplied by CAMMESA were seasonally adjusted and normalized.
19 Between July and August 2023, the level of industrial production, measured in seasonally adjusted terms, registered a fall of 2% compared to that observed during the second quarter. The demand for construction inputs (INDEC’s ISAC) decreased by 1.2% in the same period.
20 Hotels and restaurants increased 0.4% s.e. and Other community services, which include cultural and recreational activities, 0.4% s.e. according to the July EMAE.
21 It corresponds to the classification of Capital Goods of the IPI of FIEL, which registered a carry-over of -2.2 p.p. for III-23 and the IPIm Machinery and Equipment of INDEC, which left a carry-over of 2.1 p.p. in Aug-23 for III-23, in both cases the deseasonalization is its own. The EMAE of construction left, on Jul-23, a carryover of -1.8 p.p. for III-23 and the ISAC of August left a carryover of -1.4 p.p. Meanwhile, the imported quantities of capital goods and transport equipment registered a sharp increase of 13.4% in the July-August 2023 two-month period, compared to II-23.
22 Particularly in the west of the province of Buenos Aires, La Pampa, Chaco and north of Santa Fe. On the same date in 2022, the percentage in good and very good condition was somewhat lower, at 74%, but 5% was already declared in bad condition, something that did not happen in the current campaign.
23 https://www.cpc.ncep.noaa.gov/products/analysis_monitoring/enso_advisory/ensodisc.shtml.
24 5% of the estimated area at the national level, according to the BCBA. On average, 19.6% has already been planted in the core zone, although several areas still report scarce water reserves that partially limit the area corresponding to early plantings.
25 In the accounting of the balance of payments, imports of goods are recorded at FOB value. In the first 8 months of the year, the year-on-year reversal of the trade balance (FOB-CIF) was about US$8,300 million, mainly due to a sharp fall in export values of about US$14,300 million and a contraction of around US$6,000 million in imports (CIF).
26 Data estimated based on the stock of debt as of II-23 that arises from the Survey of External Assets and Liabilities and the debt of exports of goods in July, August and September estimated from the difference between export collections by the foreign exchange market and FOB exports.
27 Data estimated based on the stock of debt as of II-23 arising from the Survey of External Assets and Liabilities and the debt of imports of goods in July, August and September estimated from the difference between imports and import payments by the foreign exchange market.
29 Originally, Decree 194/2023 established May 31 as the end of validity for the settlements of the soybean complex, however, the term was extended by Resolution 203/2023 until June 2. You can access the aforementioned resolution at the following link. /p
32 In addition, the National Government took another series of measures linked to the foreign exchange market, among them, at the end of July the application of the PAIS tax was established for a large part of imports of services, with an aliquot of 25% (in the case of freight, 7.5% is applied and health and education services remain exempt). For its part, the AFIP modified the personal property tax collection regime that applies to operations covered by the “PAÍS” tax, through General Resolution 5403/2023 of August 14. In particular, for operations involving the acquisition of services abroad and the transport of passengers to outside the country, a collection of personal property of 5% (previously 25%) will be made.
35 The data presented are derived from the declarations validated within the framework of the Survey of External Assets and Liabilities established by the Central Bank of the Argentine Republic by Communication “A” 6401 and can be consulted at the following link.
36 Until December 2016, the series were presented with an annual report and the data underlying the estimates were prepared on the basis of the Direct Investment Survey (Communication “A” 4237 and complementary ones) and the Survey of Debt Securities and Other External Liabilities (Communication “A” 3602 and complementary ones), which were replaced by the Survey of External Assets and Liabilities (RAyPE) as of 2017.
37 The upload forms of the new survey now include information on foreign assets, and information on positions in financial derivatives, and are in line with the Sixth Edition of the International Monetary Fund’s Balance of Payments Manual, and with the G20 Data Gaps Initiative, in which the world’s major economies recognized the existence of information gaps on which it was imperative to work. It also modernized the compilation methodology, working on the information upload platforms (it offers the possibility of carrying out the upload in bulk by extracting data from the declarant’s own systems or manually) and on the elimination of the associated transaction costs. In this sense, the new survey is completed electronically by entering through the AFIP website and the validations of the uploaded data are carried out in a more agile manner, minimizing errors in the upload and ensuring the consistency of the information received by the BCRA.
38 Related companies are those that are under the influence or control of the same immediate or indirect investor, but none of the related companies controls or influences another. Meanwhile, reverse investment occurs when a direct investment company lends funds to its immediate or indirect direct investor, or acquires an equity stake in it, as long as it does not own an equity stake equivalent to 10% or more of the votes in that direct investor. Previous surveys failed to identify or capture these types of direct investment relationships.
39 The sectoral classification was made considering the main activity of the company receiving the investment, according to the National Economic Census, complemented, in particular cases, with the National Classifier of Economic Activities (CLANAE 2010), at the letter level. In the case of “Financial intermediation and insurance services” (letter K), it was grouped into four different sectors: Deposit-taking companies, except the Central Bank; Insurance; Financial Assistants and Other Financial Intermediaries.
41 Decree 443/2023 . Unlike previous programs where they were settled at a preferential value of the currency, in this case 75% of the equivalent value of the exports that are subject to adhesion to the program must be entered into the country in foreign currency and negotiated through the Exchange Market (MC), while the remaining 25% will be freely available.
42 By RG 5339/2023 of 29/3/23, the Federal Administration of Public Revenues (AFIP) suspended until 31 December the collection regime that allowed, through an exclusion certificate, large importing companies to be exempted from the payment of Value Added Tax (VAT) and Income Tax. The year-on-year comparison was attenuated by the higher VAT refunds, which advanced 39.1% in real terms in the first half of the year.
43 A bill was also submitted to the National Congress to implement it by law.
44 RESOG-2022-5248-E-AFIP-AFIP – Income Tax. Payment on account applicable to subjects listed in Article 73 of the Tax Law, with extraordinary income.
45 The 25% rate had been implemented as of July 2022.
46 In turn, a Law was approved in the National Congress that modified, in line with what was implemented, the Tax Law in force since January 2024.
47 Tax relief measures were also provided for single-payers and self-employed workers.
48 The rate on account of this tax on purchases taxed with the PAIS tax had been increased from 35% to 45%, as of July 14, 22. It should be noted that on Oct. 13, 22, the scope of the PAIS tax was extended to new operations (importation of sumptuous goods), and new collections were established on account of income tax and personal property tax on transactions covered by said tax. Since July 2023, the income tax and/or personal property tax rate for those who buy foreign currency to hoard has been raised from 35% to 45%.
49 The applicable rates will be 25% for those who buy foreign currency to pay for services, and 7.5% for those who buy foreign currency to pay for imports of goods (imports of luxury goods that are already covered by the PAIS tax are excluded at the 30% rate). In addition, those who acquire freight services and other transport services abroad for import or export operations of goods will also be covered by the PAIS tax at a rate of 7.5%. In all cases, the Decree indicates that the financial institutions involved in the exchange operation will fulfill the function of agent for the collection and settlement of the PAIS tax at the time the exchange operation is carried out.
50 In cases of purchase of foreign currency to pay for imports of goods, Decree No. 377/2023 authorizes the AFIP to establish payments on account of the PAIS tax of up to 95%. Thus, by General Resolution a payment on account of 7.125% was established to import goods in general, and a payment on account of 28.5% to import luxury goods. In both cases, this payment on account is made when the import clearance is made official and is applied to the resulting obligation at the time of accessing the MC. 51 In the months of July to August 2022, $88,658 million were recorded as income from these resources that were not recorded in 2023.
51 It should be noted that a growing portion of public debt is indexed by inflation (CER) or by the official dollar, without this being reflected in the dynamics of interest rates.
52 The budget contemplates net financing from placements in the financial market of around 4.0% of GDP.
53 In September, the CPI of the Autonomous City of Buenos Aires (IPCBA) showed an increase of 12% compared to August.
54 Resolution 1017/2022 of the Ministry of Transport of the Nation.
55 Resolution 501/2023 of the Ministry of Transport of the Nation.
56 The National Government provided through DNU No. 743/2022 the formula for updating the values of prepaid medicine fees effective from February 2023 and an extension of 18 months that establishes a ceiling for those who receive a net income of less than six (6) Minimum, Vital and Mobile Wages (SMVM) and certify their income monthly. For those who do not register to access the benefit of the cap or receive more than 6 SMVM, the value of the fee increases according to the variation of the Health Cost Index, approved by Res. 1293/2022 of the Ministry of Health (see link).
57 The prepaid medicine companies agreed with the Government to suspend the increases in their services for the next 90 days for family groups whose income does not exceed $2 million per month. The other requirements to access the benefit include: not owning two or more properties, not owning three or more vehicles, unless there is at least one person in the household with a Single Certificate of Disability, not owning one or more aircraft or luxury boats and not owning corporate assets that demonstrate full economic capacity. Contracting holders of interested health plans must upload an Affidavit of Income Certification on the website of the Superintendence of Health Services at the beginning of each month.
58 DNU 438/2023.
60 In the period 2016-2022, approximately 70% of Argentine exports are concentrated between primary products (30%) and manufactures of primary origin (40%) (see Dogliolo et al., 2023).
61 For a recent analysis of the structural heterogeneity of the Argentine economy, reflected in its low price elasticities of foreign trade, see Dogliolo et al. (2023).
62 For a recent analysis of input-output relationships at the global level and their effects on trade, see Section 1 of the IPOM of July 2023 and Montes Rojas and Noguera (2023).
63 For a previous analysis, see section 7 of the IPOM (2020).
64 See also Auer et. al (2017). 65 The participation of the trading partners was re-weighted, so that the sum of the weights is equal to unity.
66 The cointegration analysis was carried out using the Johansen-Juselius approach. See Johansen (1988), Johansen and Juselius (1990) and Juselius (2006).
67 The hypothesis that the coefficients add up to one cannot be rejected at 1% significance.
68 Engle, Hendry and Richard (1983) define three concepts of exogeneity: weak, strong and super, depending on the purpose of the model, inference, forecasting and evaluation of policies and the parameters of interest.
69 For more detail, refer to the Monthly Monetary Reports (MMI) for the year 2023.
70Resolution 295/2023 of the Ministry of Agriculture, Livestock and Fisheries.
71 Decree 443/2023 of the National Executive Branch.
72 Decree 492/2023 of the National Executive Branch.
73 Resolution 808/2023 of the Ministry of Energy.
74 Refers to the execution by financial institutions of the put option on National Government securities. It should be recalled that the put option is a financial derivative instrument that gives the holder the right, but not the obligation, to sell an underlying asset at the price established in the contract, on a certain date or at any time until the maturity of the contract, and the issuer of this option the obligation to buy it under the same conditions mentioned above.
75 It is worth remembering that Communication “A” 7546 issued in July last year established that the BCRA would maintain an active presence in the domestic debt market, purchasing securities foreclosed as of July 2022 (with a residual term of at least 15 days) at a curve similar to the last one validated in the primary market plus a spread of 200 basis points (bp).
76 The means of payment are measured through the transactional private M2, which corresponds to the private M2 net of interest-bearing demand deposits.
77 The interest rates currently in force are those established by Communication “A” 7726. }
78The rest of the depositors are made up of individuals with deposits of more than $30 million and legal entities.
79 Includes working capital held by the public and deposits in pesos of the non-financial private sector (demand, time and others).