Summary
1. Monetary policy: assessment and outlook
The global economy continued to navigate the COVID-19 health crisis, with the emergence of a new wave attributed to the Delta variant, which is more contagious and possibly more aggressive than the other strains in circulation. However, the economic recovery continued its course, with marked differences between countries due to inequalities in the pace of vaccination and in the monetary and fiscal space available to continue implementing stimulus measures. In this context, during the second quarter, inflation accelerated globally, driven by the increase in the price of raw materials and the reopening of activities. The potential actions of the central banks of advanced economies in the face of this inflationary outbreak could affect global financial conditions, with negative implications for emerging countries.
In Argentina, economic activity showed signs of recovery in June, after the slowdown observed during April and May due to the arrival of the second wave of COVID-19 infections. In mid-March, the National Government, in coordination with the provincial authorities, adopted measures to contain the outbreak, individually calibrated for each region of the country according to its epidemiological situation. This time the measures had a shorter duration, thanks to the advances in the vaccination process and the improvements made in the health system. To contain the economic and social effects of this second wave, the Central Bank and the National Government focused their stimulus measures on the most vulnerable social strata and on assistance to companies in the affected jurisdictions. Economic normalization is expected to continue in the coming months, although it cannot be ruled out that, as observed in other countries, the circulation of new variants of the virus may delay this process.
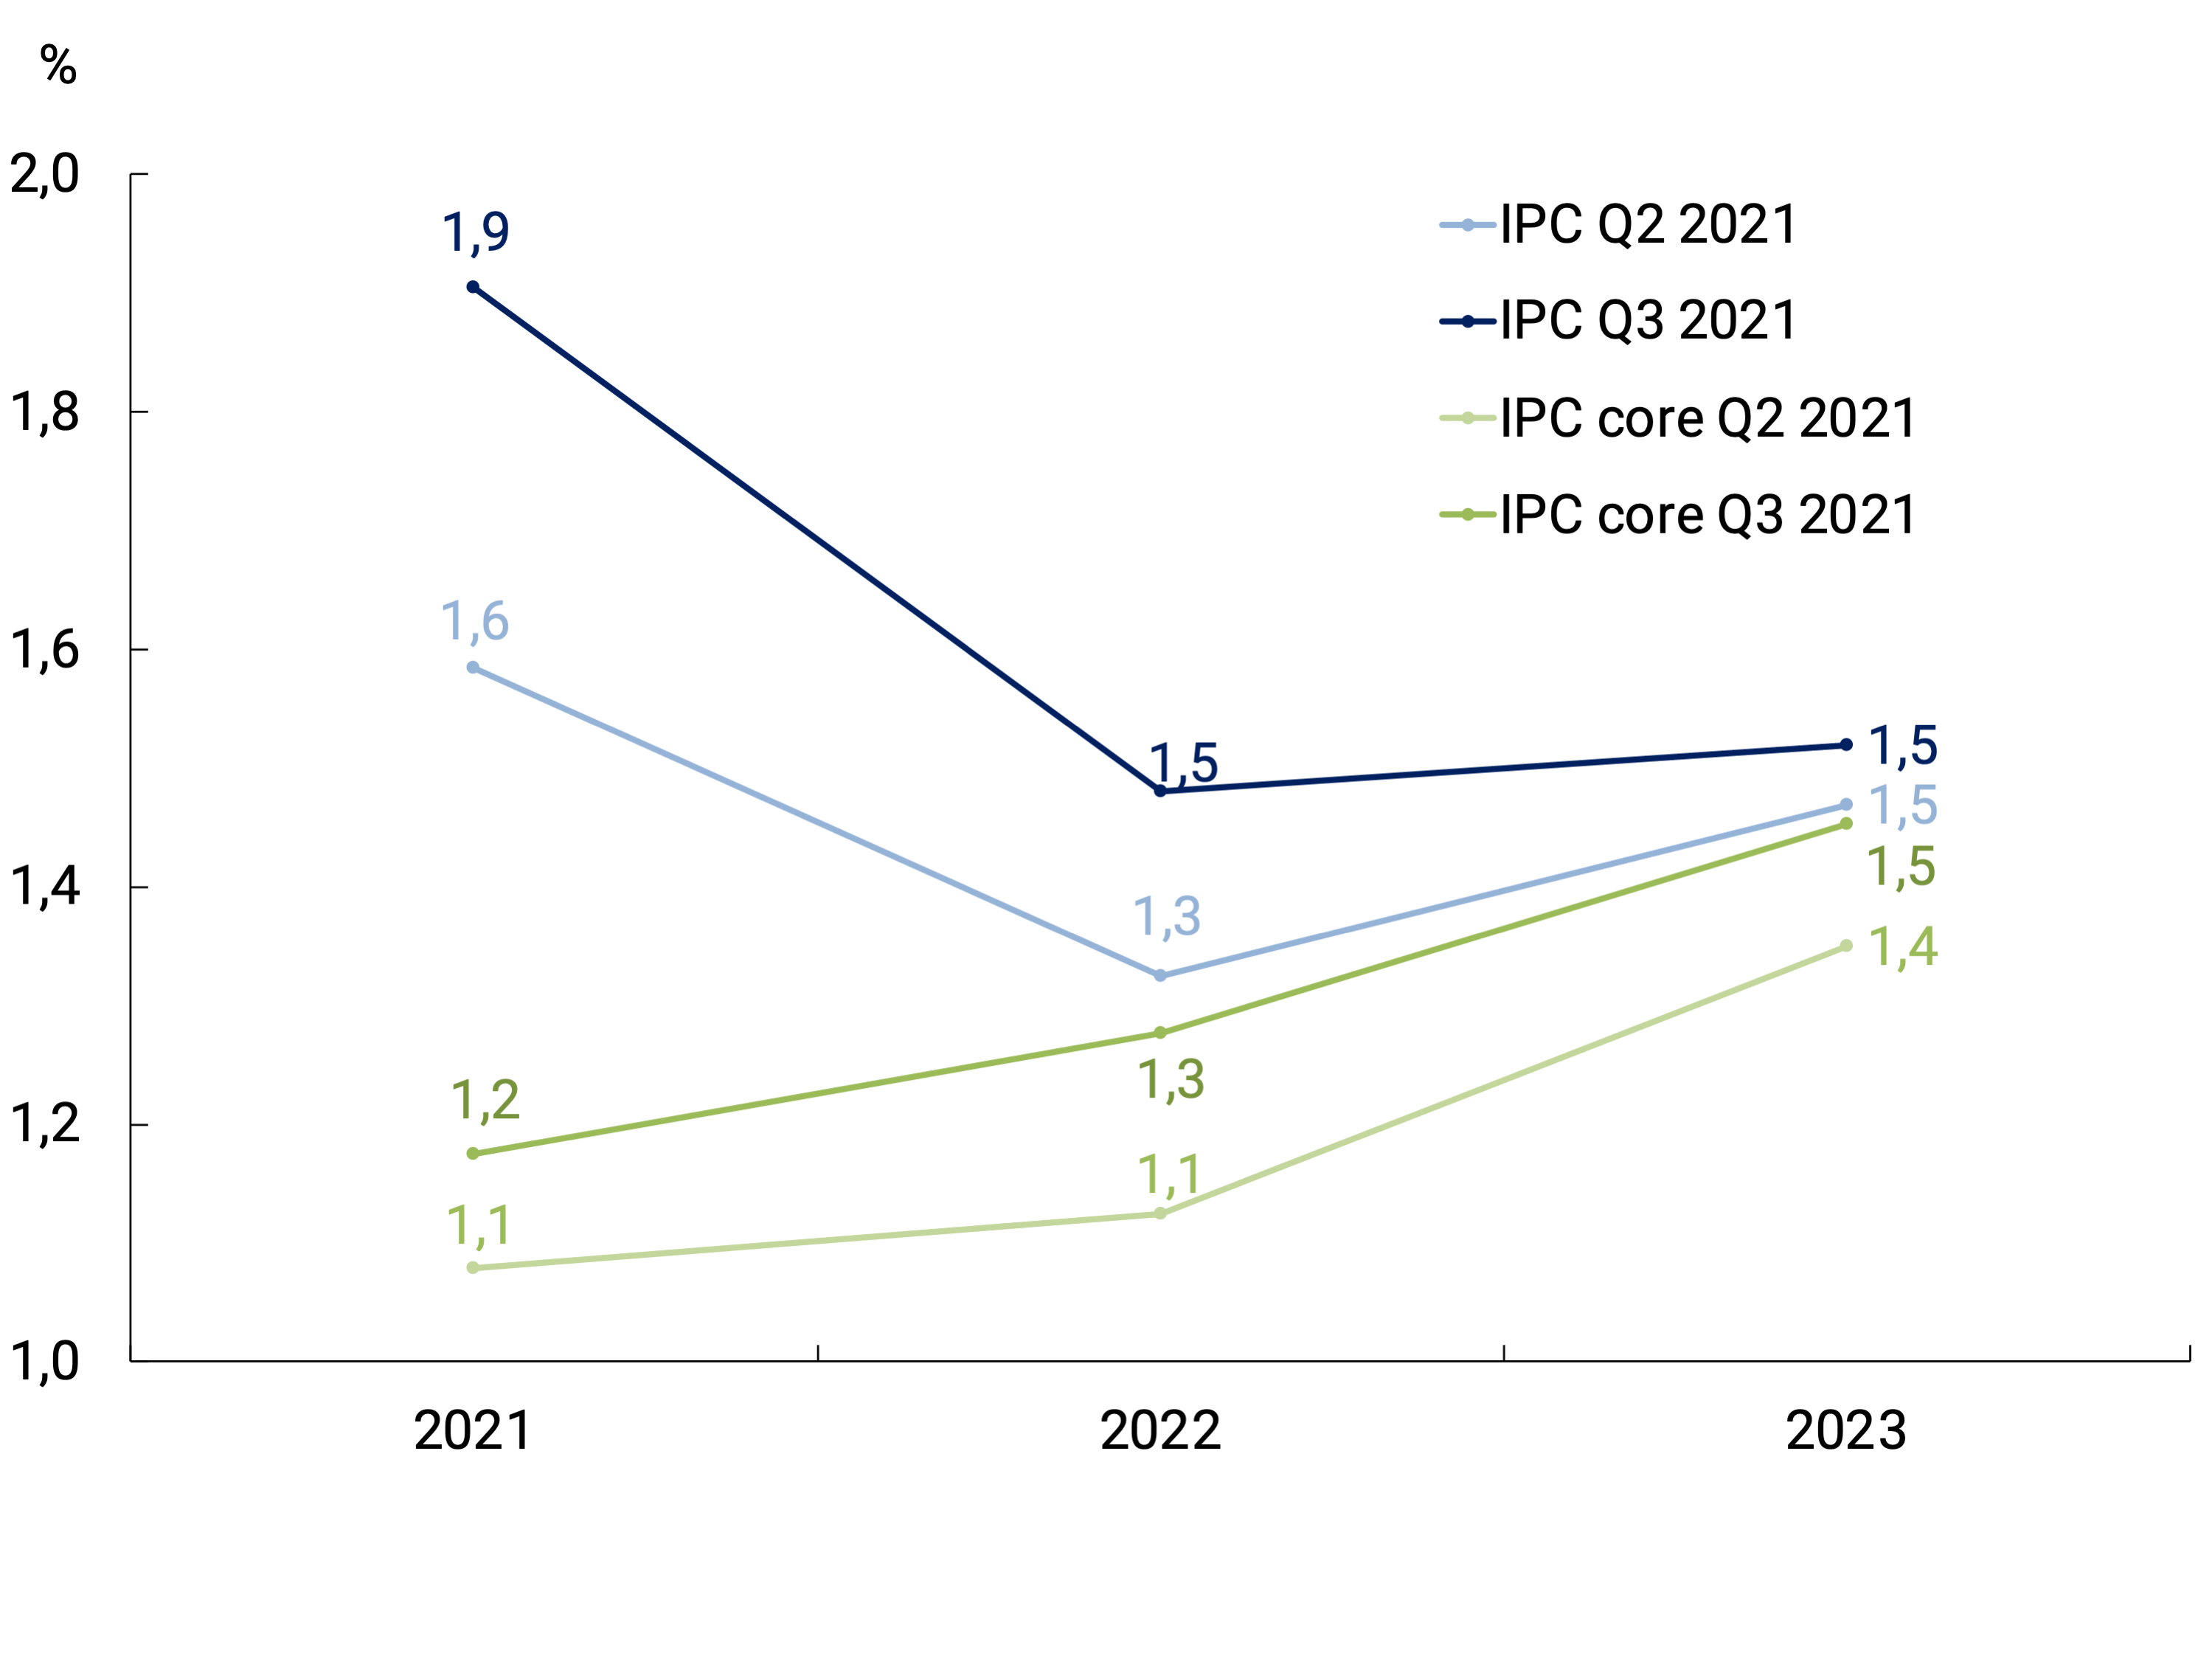
In terms of prices, as we anticipated in the previous IPOM, the monthly inflation rate began to decelerate gradually, given the lesser influence of the transitory factors that drove an increase in the rate of price increases towards the end of last year. Among the latter, the increase in the international price of food and key inputs in manufacturing value chains, the dynamism of the price of meat and certain seasonal goods, and the recomposition of profitability margins, especially in those sectors most affected by the pandemic, stood out. once the economy began to reactivate. This trend of gradual and sustained decline in inflation continued in July, with a 3% increase in the general level of the CPI and a 3.1% increase in core inflation, these being the smallest monthly increases since September 2020. For its part, the Domestic Wholesale Price Index (IPIM), which had cut its average monthly expansion rate in the second quarter to 3.7% (-1.5 p.p. compared to the first quarter), deepened its slowdown in July, with an increase of 2.2% compared to June. The monthly slowdown in prices compared to the previous quarter is expected to continue in the coming months, contributing to a decline in year-on-year growth rates towards the end of the year.
In this regard, the BCRA will continue with its exchange rate management policy, ensuring that the exchange rate dynamics continue to contribute to consolidating the drop in inflation. In addition, monetary policy will continue to focus on absorbing countercyclical efforts in order to preserve monetary and financial balances, ensuring the necessary conditions for the gradual process of reducing the inflation rate to continue. These macroeconomic policies will continue to be accompanied by other more specific policies promoted by the National Government, both in the area of income policies and in the regulation of certain markets with non-competitive price formation.
With a more limited fiscal deficit and financed in a greater proportion by the market, the primary monetary expansion linked to the public sector in the first seven months of the year was at levels similar to those of previous years, excluding 2020. In order to continue contributing to the development of the local capital market, in June financial institutions were enabled to integrate the fraction of reserve requirements that until May were remunerated with LELIQ through Treasury bonds in pesos. This regulatory modification led to a change in the composition of bank liquidity: approximately 20% of the requirement previously integrated into LELIQ was integrated into National Treasury Bonds. In the same sense of deepening liquidity in the capital market, the Central Bank began to operate in the public securities futures market.
The main factor in the expansion of the monetary base during the first half of the year was the purchase of foreign currency by the BCRA in the foreign exchange market. The administration of the foreign exchange market made it possible to strengthen the balance of International Reserves. Between December 2020 and August 2021 (with data as of August 19), net purchases of US$8.0 billion were recorded. The greater external slack simultaneously made it possible to adjust the pace of adjustment of the exchange rate with the aim of contributing to the slowdown in the rate of increase in domestic prices.
In this context, towards the end of the second quarter of the year, the means of payment expanded again in real terms. This dynamic was influenced by transfers from the public sector to vulnerable sectors and the recomposition of real wages. To cope with a higher level of salary expenses and the payment of tax obligations, legal entities reduced their position in investment assets in pesos. All this contributed to an increase in the demand for liquidity.
Credit policy continued to focus on the sectors most affected by the pandemic and on leveraging investment projects. The main instrument used by the BCRA was the Productive Investment Financing Line (LFIP), designed to channel productive credit to MSMEs under favorable conditions. Since its implementation, and with data as of July 31, the accumulated disbursements through the LFIP totaled $801,000 million. Thus, in the second quarter of the year, the average monthly nominal growth of these placements was 19%. Recently, the BCRA decided to extend the line “Financing of investment projects”, which contemplates an interest rate of 30% n.a., to all companies, regardless of their size, that make investments aimed at increasing the production capacity of poultry and pork. These sectors have a potential margin to increase their production and contribute both to the diversification of the meat consumption basket and to the increase in net exports.
In addition, measures were taken to increase the level of bank financing to the private sector. The deferral of unpaid installments (with the exception of credit card financing) was granted to beneficiaries of the Productive Recovery Program II. The National Government extended the “Ahora 12” program until January 31, 2022, with some modifications to encourage consumption and boost credit card financing. Finally, the National Government announced that as of the end of August, credits will be available for more than one million single-tax people, who will be able to request an amount of up to $150,000, depending on their category, and repay it in 12 interest-free installments after a six-month grace period.
The BCRA has a robust position to face possible episodes of greater financial volatility, which in Argentina have typically coincided with electoral periods. In the last 9 months, the monetary authority has rebuilt its stocks and perfected exchange rate regulation, increasing its firepower to preserve exchange rate stability. In fact, since the beginning of December 2020, when international reserves reached a minimum of US$38.6 billion, the BCRA has accumulated reserves in the amount of US$3.4 billion. This dynamic of recomposition of balances, together with the entry of the allocation of Special Drawing Rights (SDRs) by the IMF to mitigate the effects of the pandemic for a total of US$4.3 billion, allowed the stock of international reserves to currently stand at around US$46 billion.
Likewise, the BCRA has a wide margin of intervention in the dollar futures market, which makes it possible to contain any distortion that could be generated in the depreciation expectations and interest rates that arise from these contracts. Finally, the improvement of foreign exchange regulations ensures the normal functioning of the foreign exchange market, avoiding a repeat of certain exchange rate tensions that took place during 2020 in the midst of the pandemic.
In a context still marked by the effects of the COVID-19 pandemic, the BCRA will carry out a monetary policy that, in addition to preserving monetary and financial stability, will lay the foundations for a path of economic development with social equity.
2. International context
Since the previous IPOM, there has been a sharp rise in COVID-19 cases in Europe, North America and Asia, which would be due to the spread of the more contagious Delta variant. However, unlike previous waves of the pandemic, deaths have increased by a smaller amount, possibly due to the positive effect of vaccines. The vaccination process has accelerated globally, but the gap between countries in the percentages of the population fully vaccinated is still notorious.
The global economic recovery continued, especially after several countries left behind the impact of the “second wave” during the first quarter of the year. The divergence between advanced and developing countries was also accentuated, based on the former’s greater fiscal and monetary space, as well as their faster progress in vaccination.
Along with expansionary policies and the recovery, inflation accelerated in many countries: “base of comparison” effects and increases in certain goods and services affected by the pandemic would account for much of this acceleration. In emerging countries, inflationary pressures were accentuated by higher commodity prices and exchange rate depreciation in response to the crisis. The consensus so far is that this acceleration would be transitory (it is not reflected in expectations of higher inflation more than a year into the future).
Going forward, the global recovery continues to face a set of health, economic and financial risks. Inequality in vaccination would translate into recoveries of dissimilar pace. Shrinking policy space—especially in developing countries—makes it difficult to contain the economy in the face of new waves of the pandemic. Finally, the strong pace of increase in the prices of financial assets continues to present a certain disconnect from the real economy, and with it the risk of a correction. It could materialize, for example, if inflation in advanced countries led to a higher or sooner than expected rise in interest rates, with the consequent volatility in the financial conditions faced by emerging countries.
2.1. Pandemic: daily cases on the rise and uneven vaccination progress
New COVID-19 cases fell from peaks of 5.7 million per week recorded in the previous IPOM to a floor of 2.5 million per week towards the end of June. Since then, there has been a resurgence in Europe, North America and Asia (in the latter case, with an epicentre in the Southeast; see Figure 2.1). On the other hand, cases fell in South America. As of the date of publication of this report, new cases exceeded 4.5 million per week globally.
The resurgence may have been due to the spread of the Delta variant, which is more contagious and became dominant in most countries for which information is available, with the exception of South America. The studies known so far found that the vaccines are still effective (although somewhat less effective than against the other variants), especially in preventing hospitalization1.
Figure 2.1 | Evolution of confirmed COVID-19 cases and deaths by continent
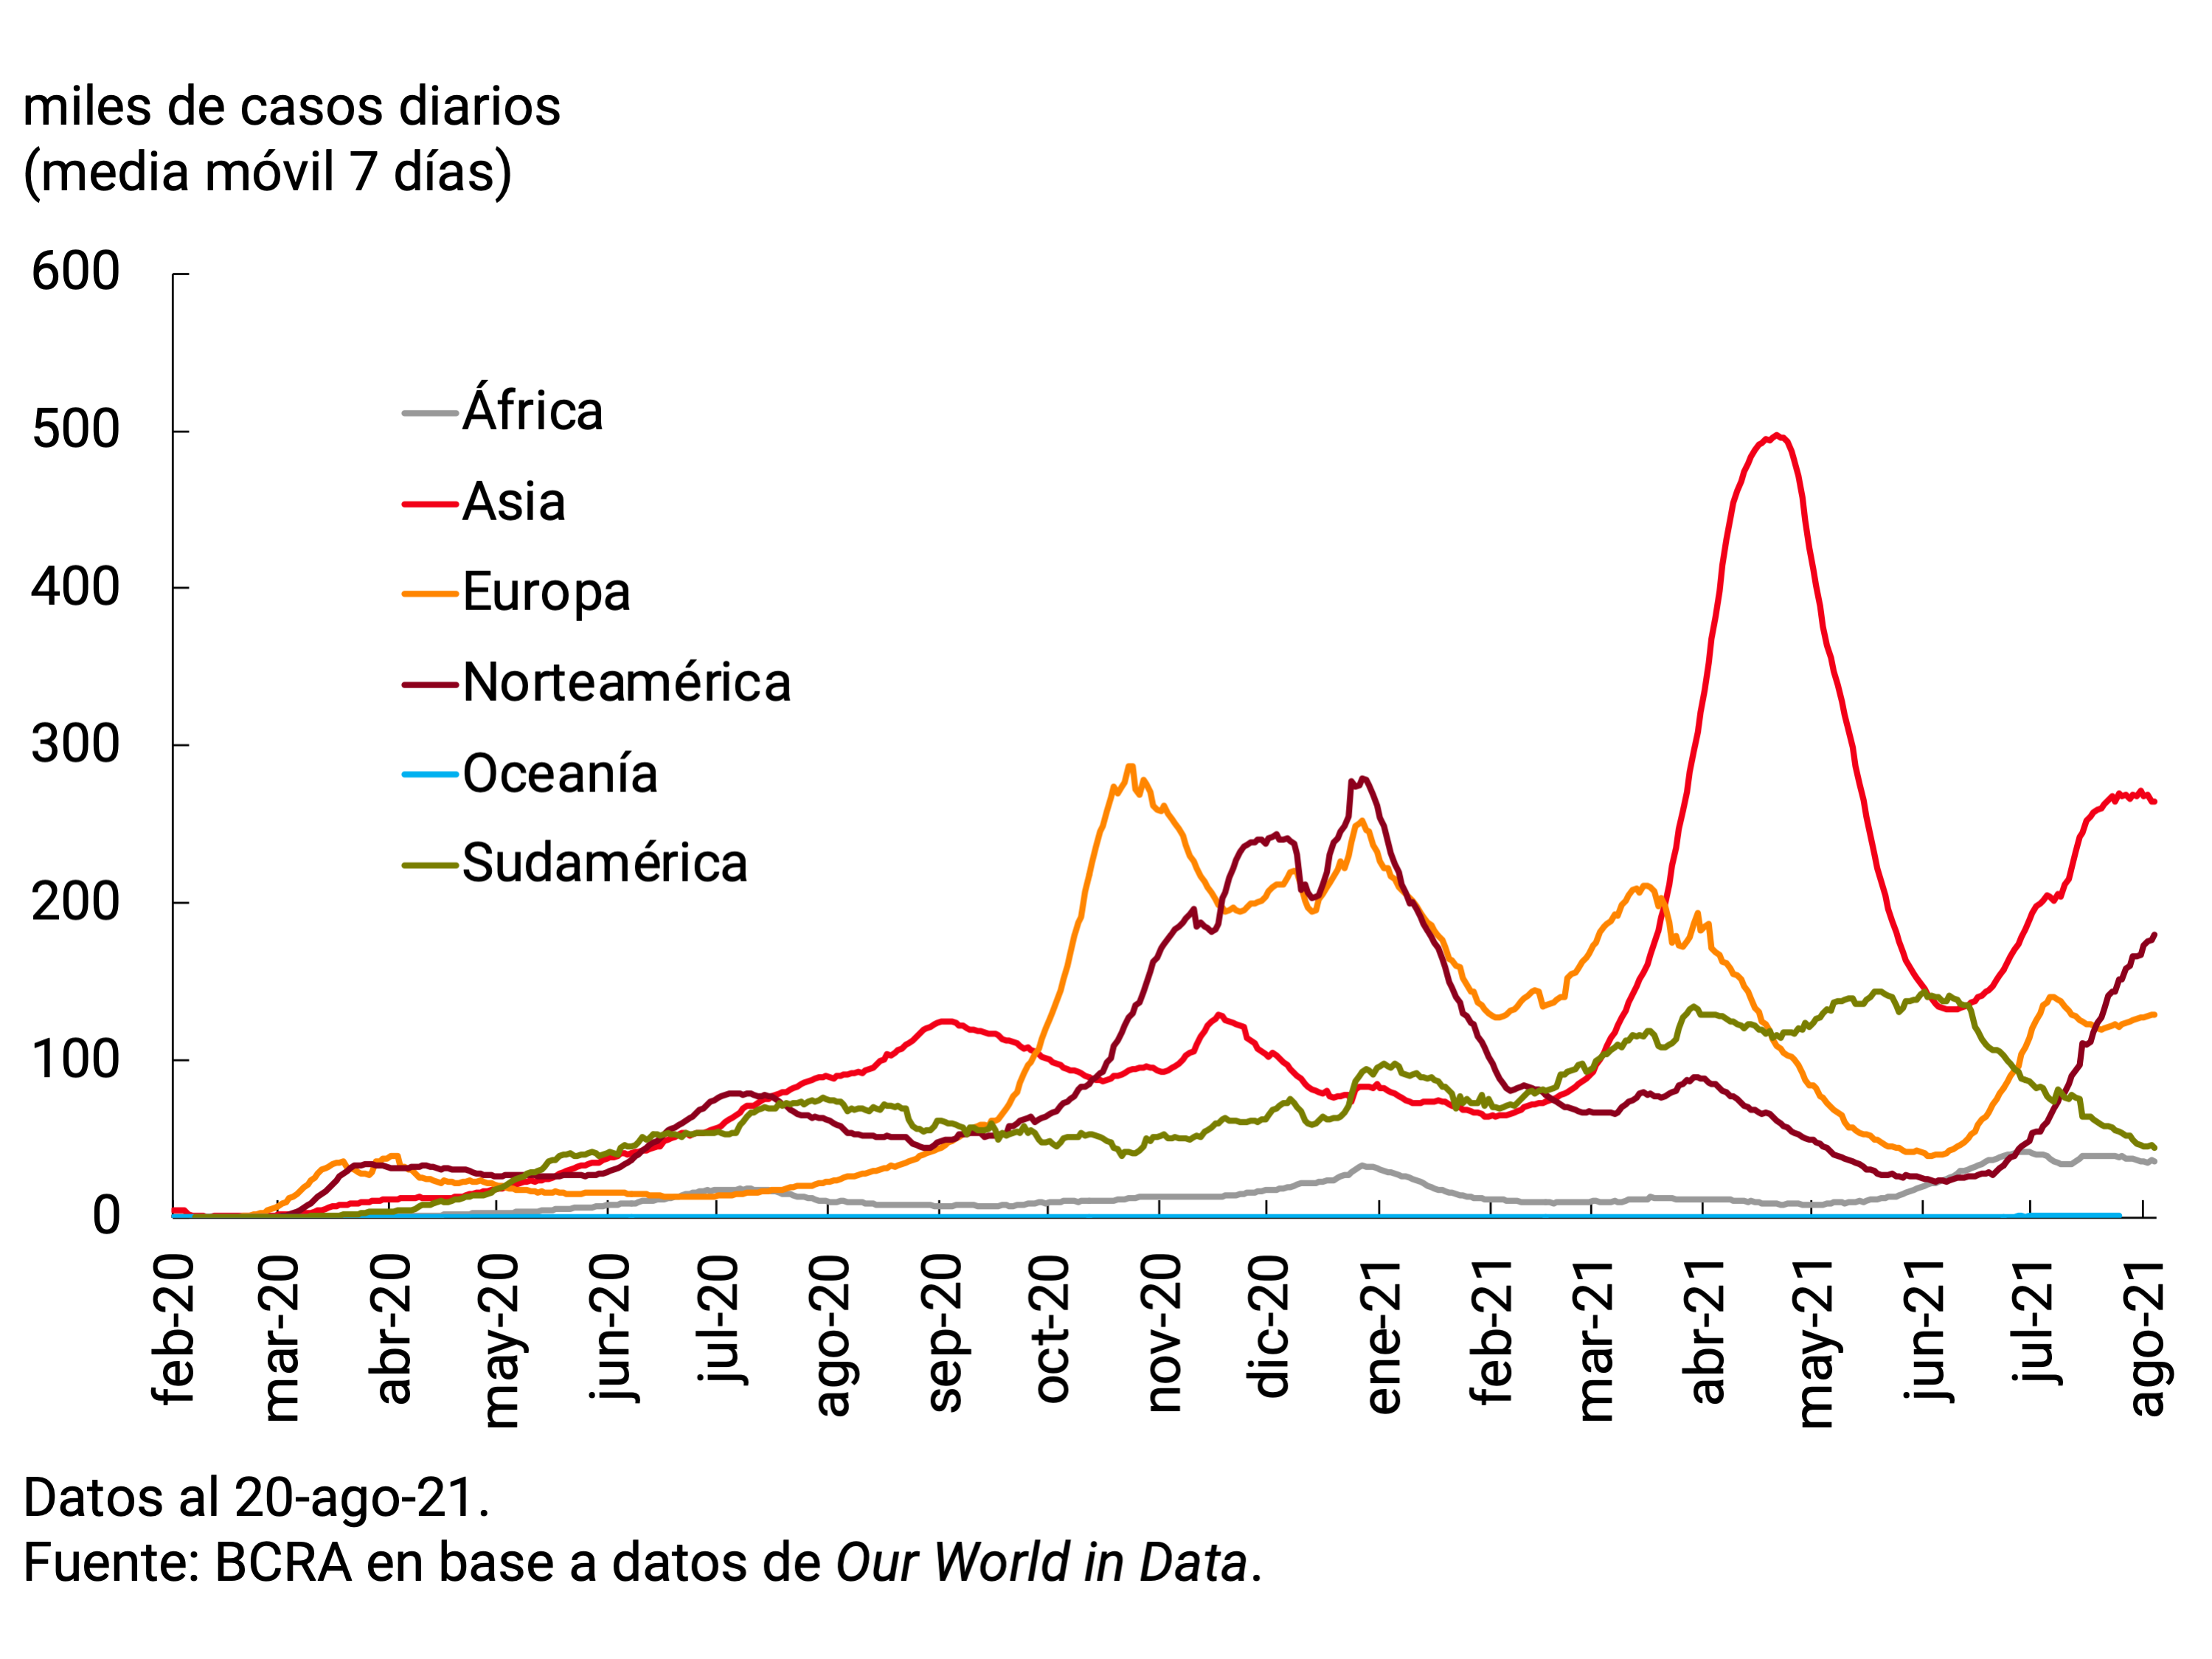
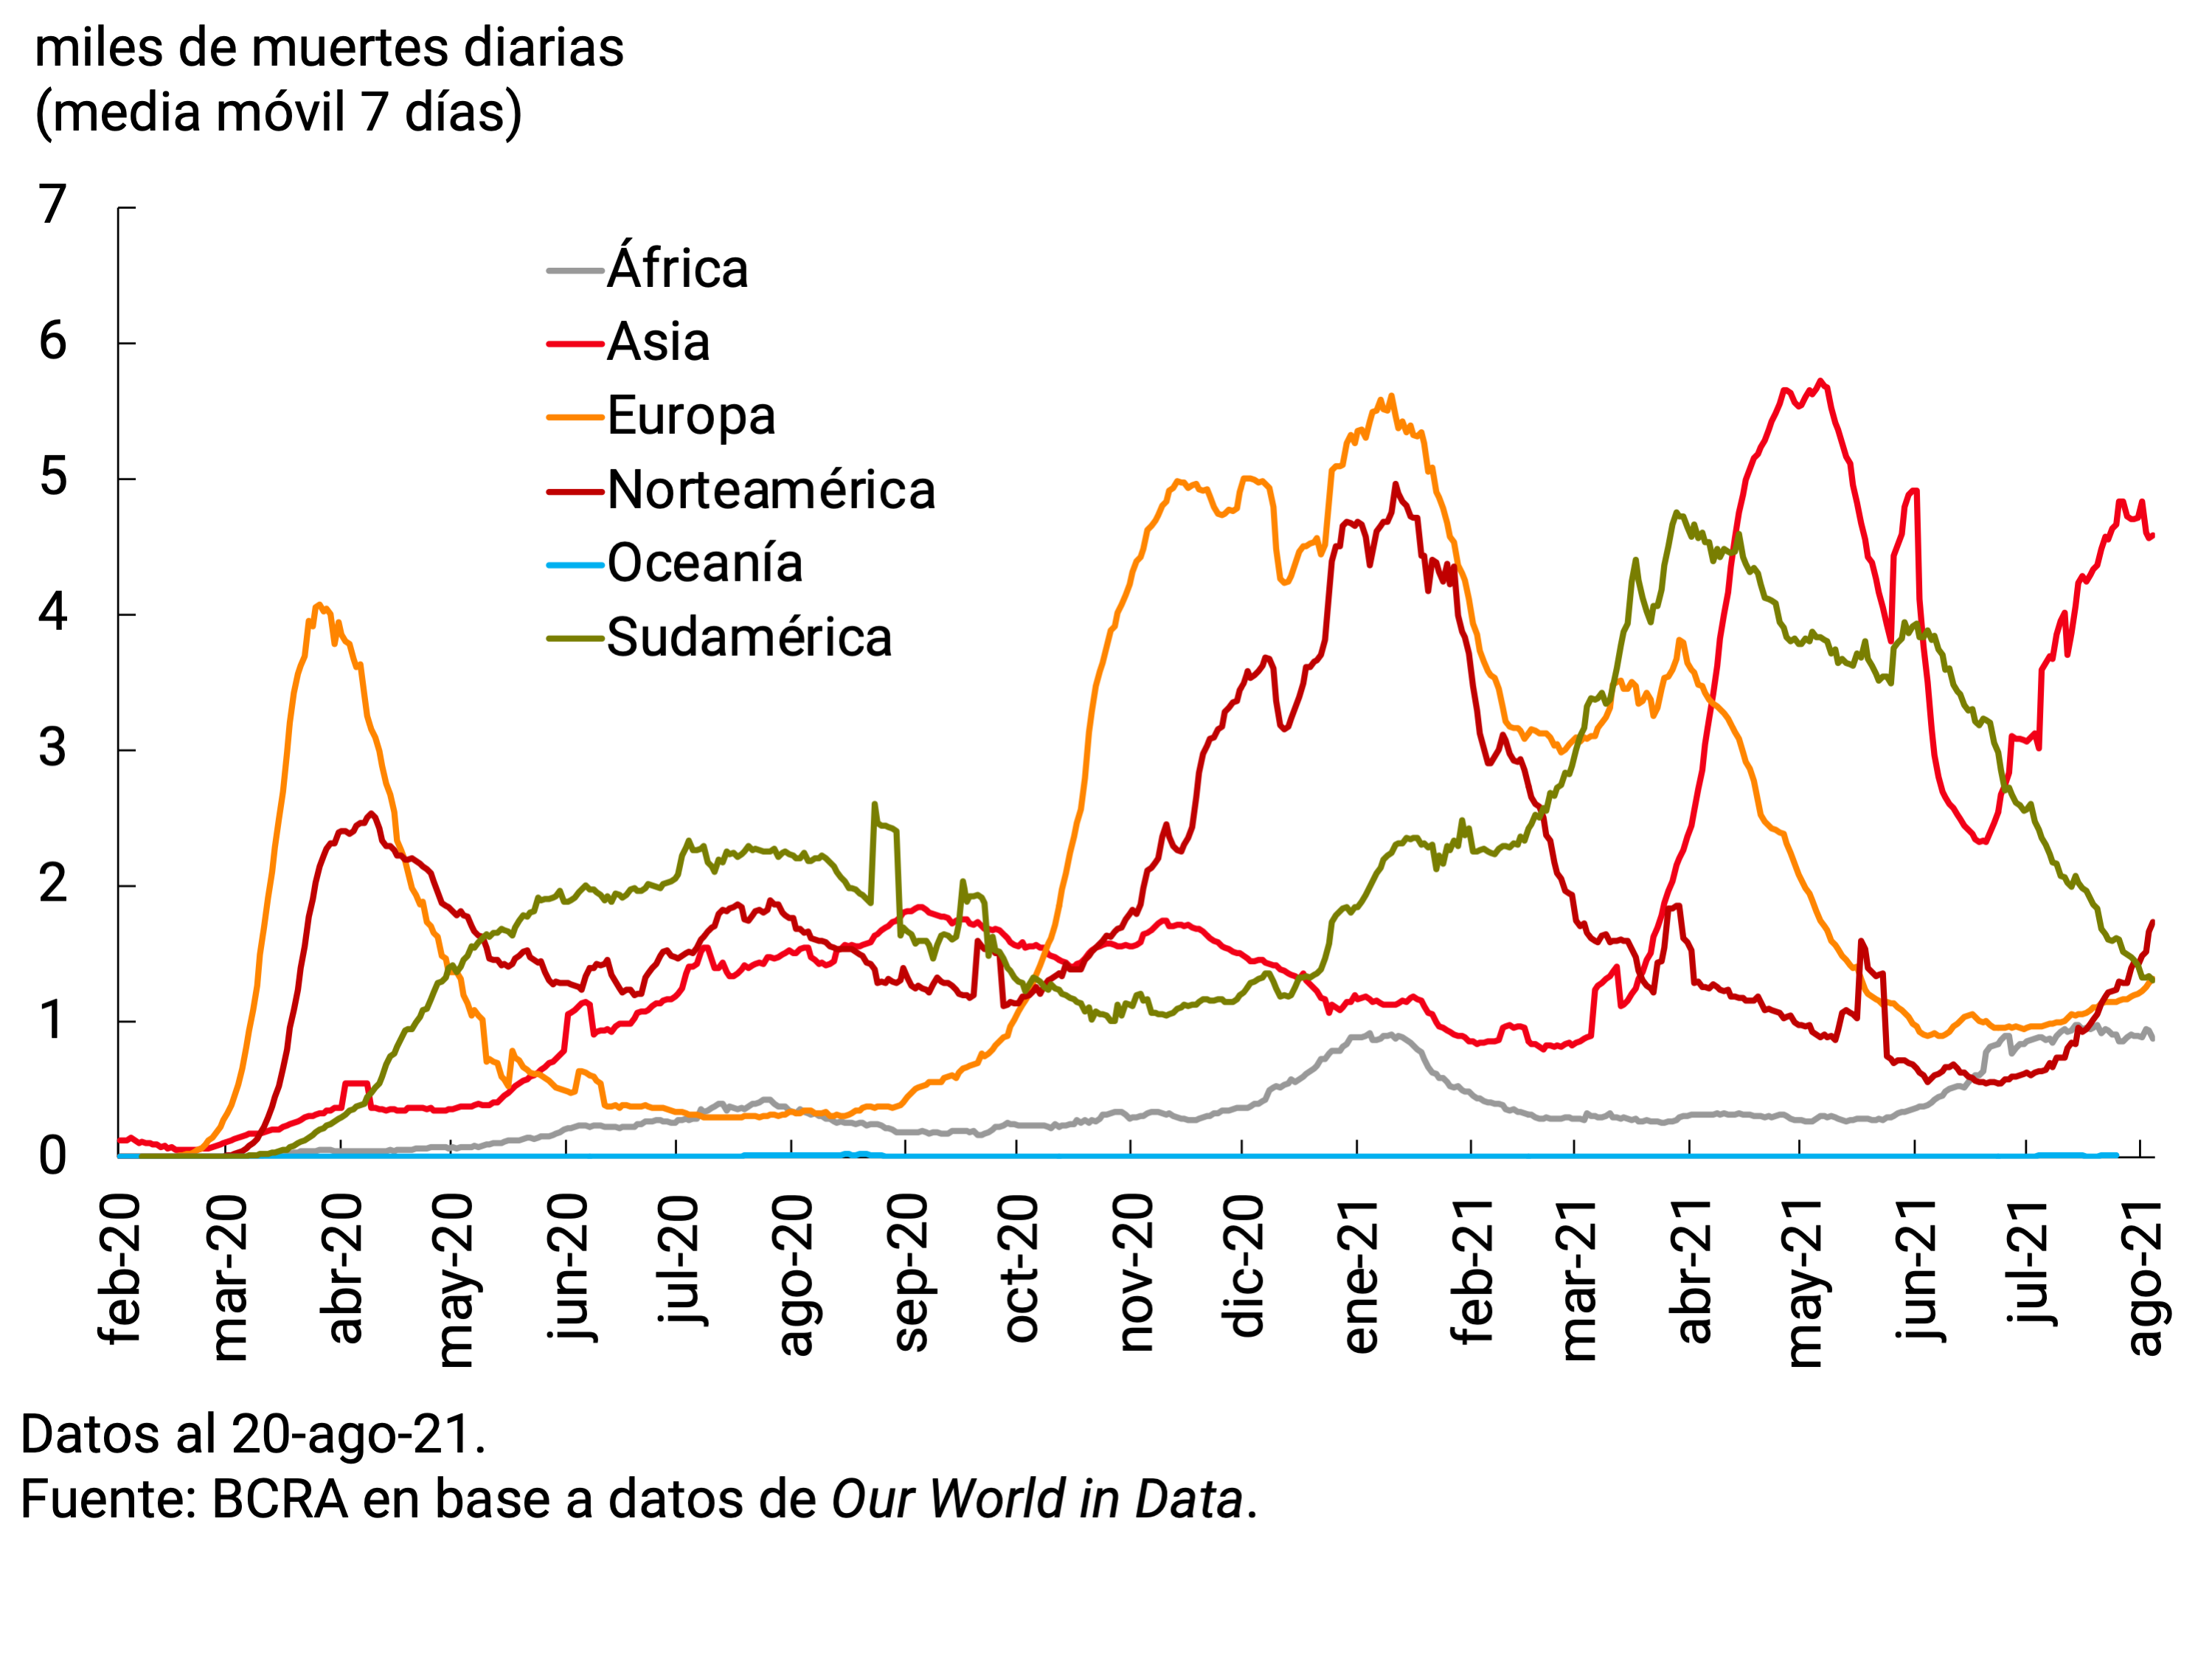
Unlike in previous waves, daily deaths increased less than cases in countries in Europe and North America, the continents with the highest percentage of the population vaccinated with two doses. By contrast, deaths have risen in tandem with the increase in cases in Asia (see Figure 2.1). Between February and June, the pace of application of doses in the world accelerated, but the gap between countries persists.
Figure 2.2 | Vaccination evolution by continent
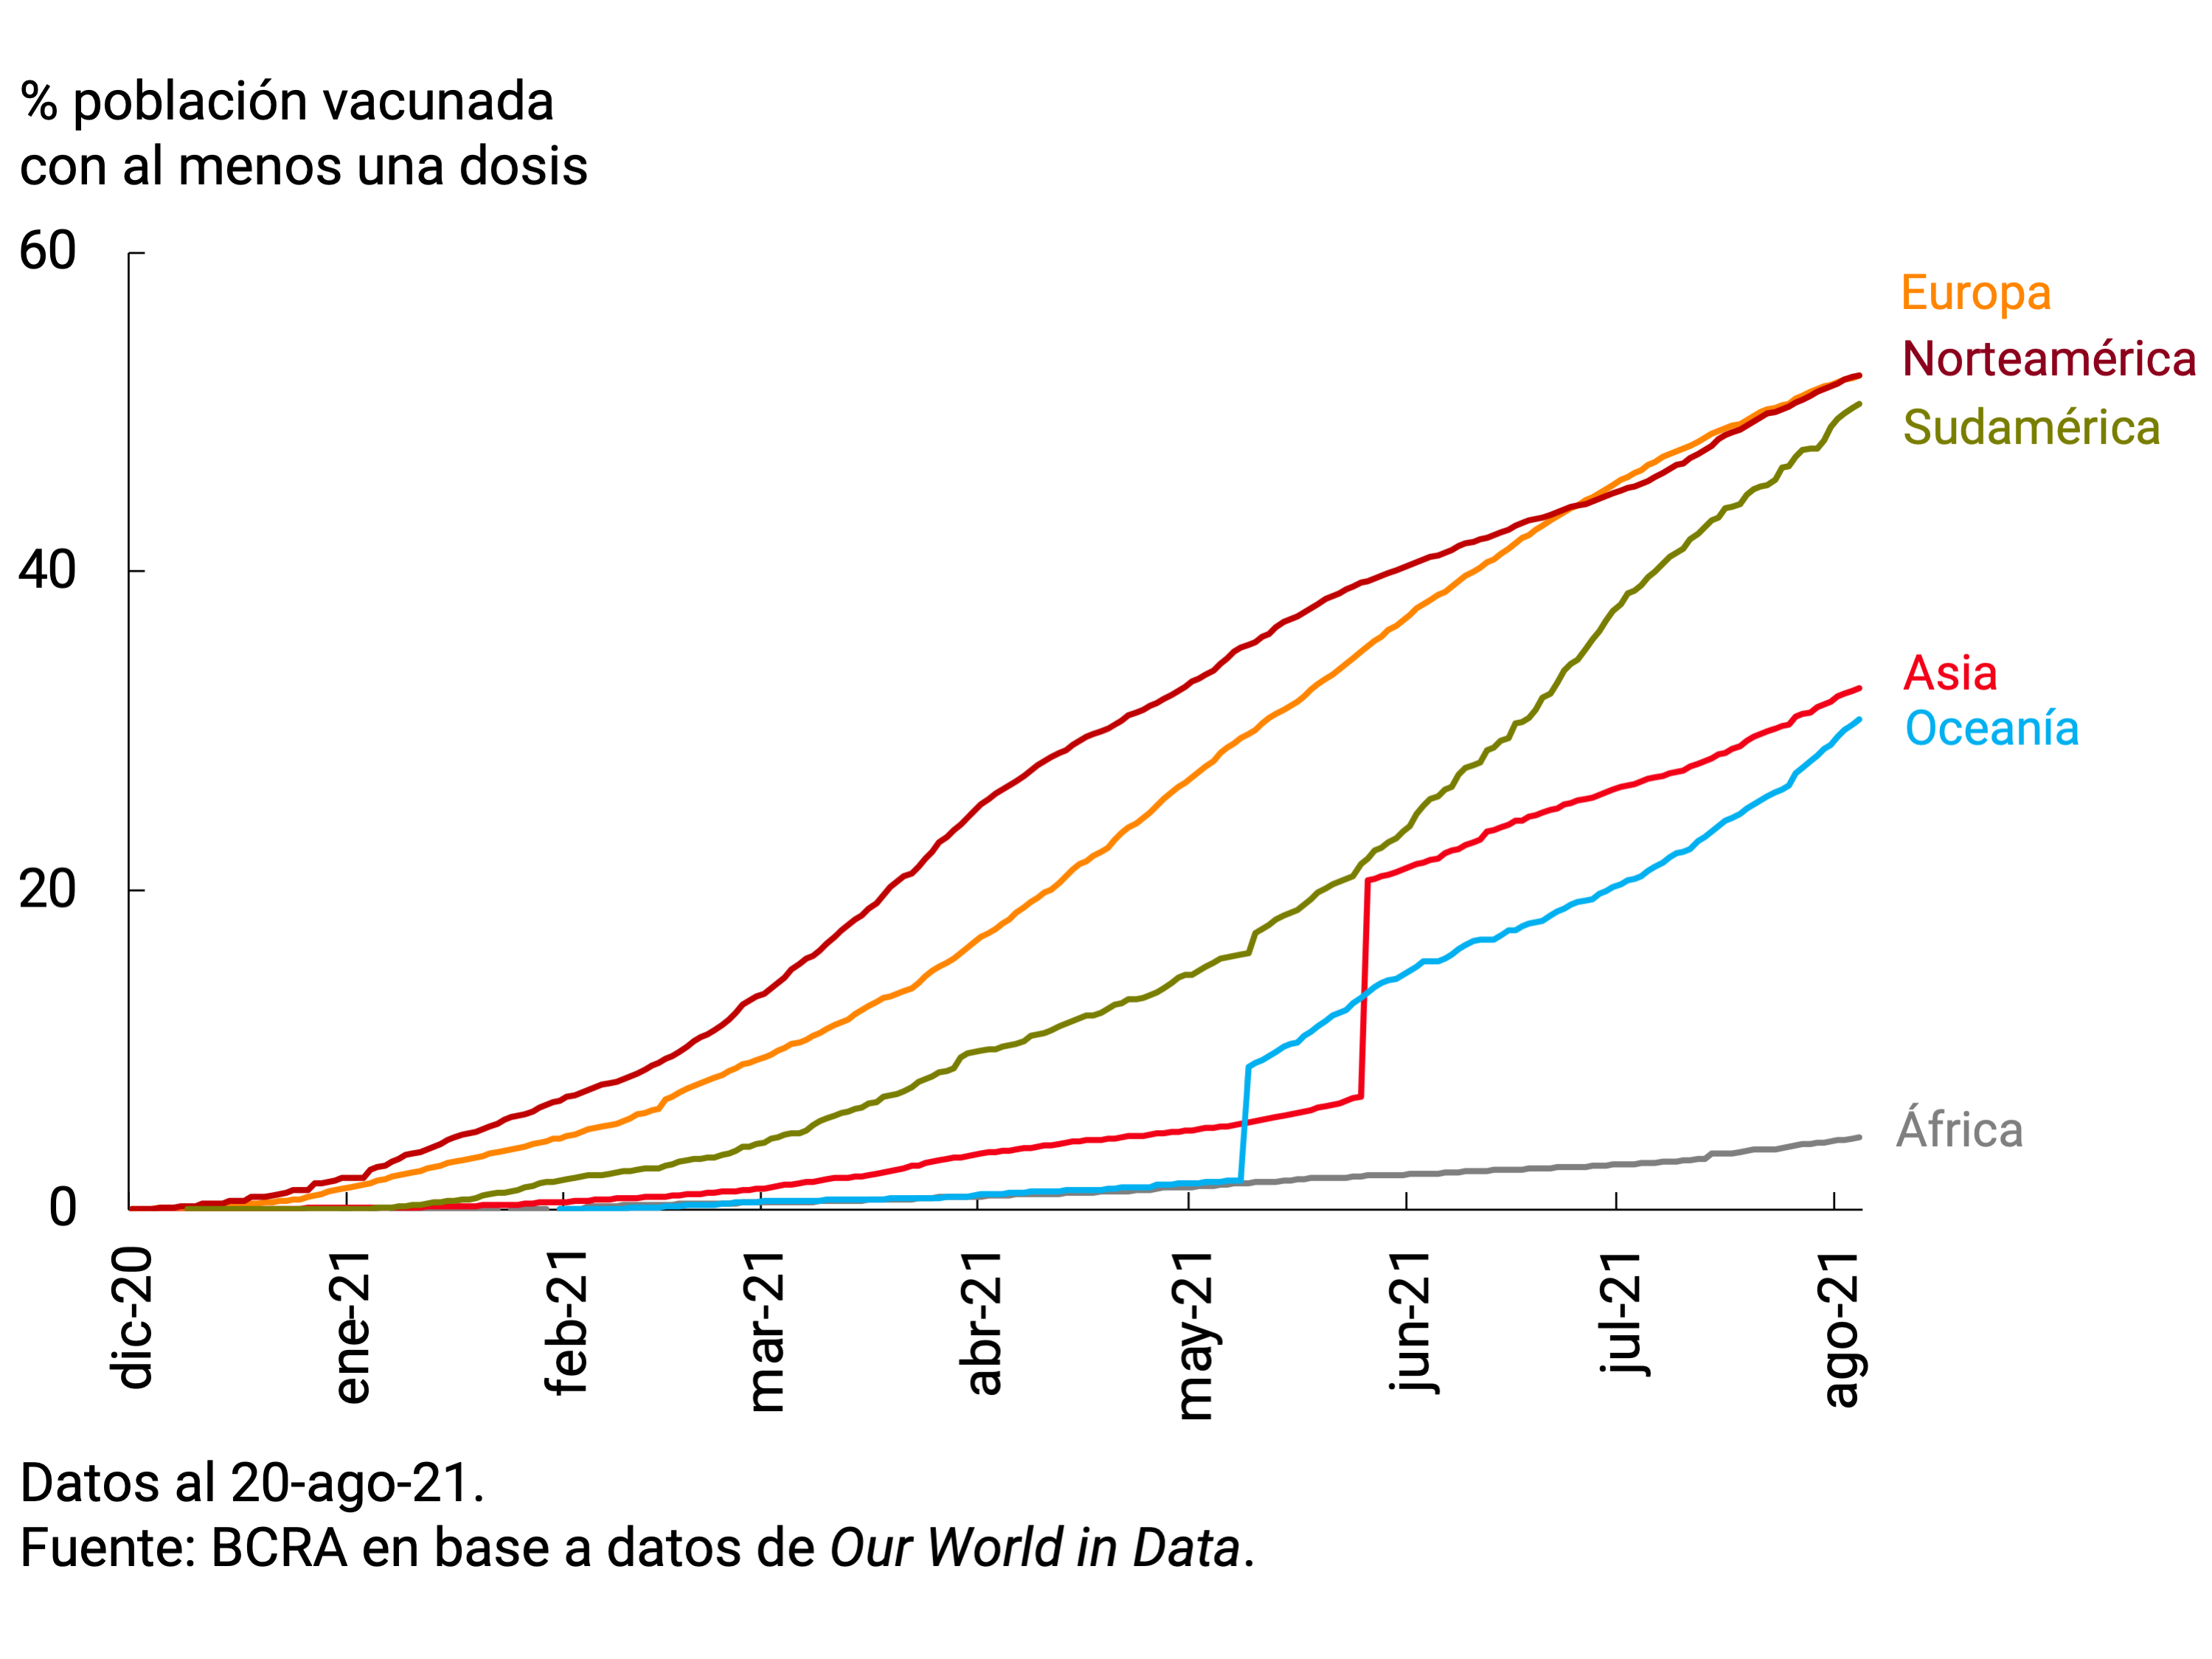
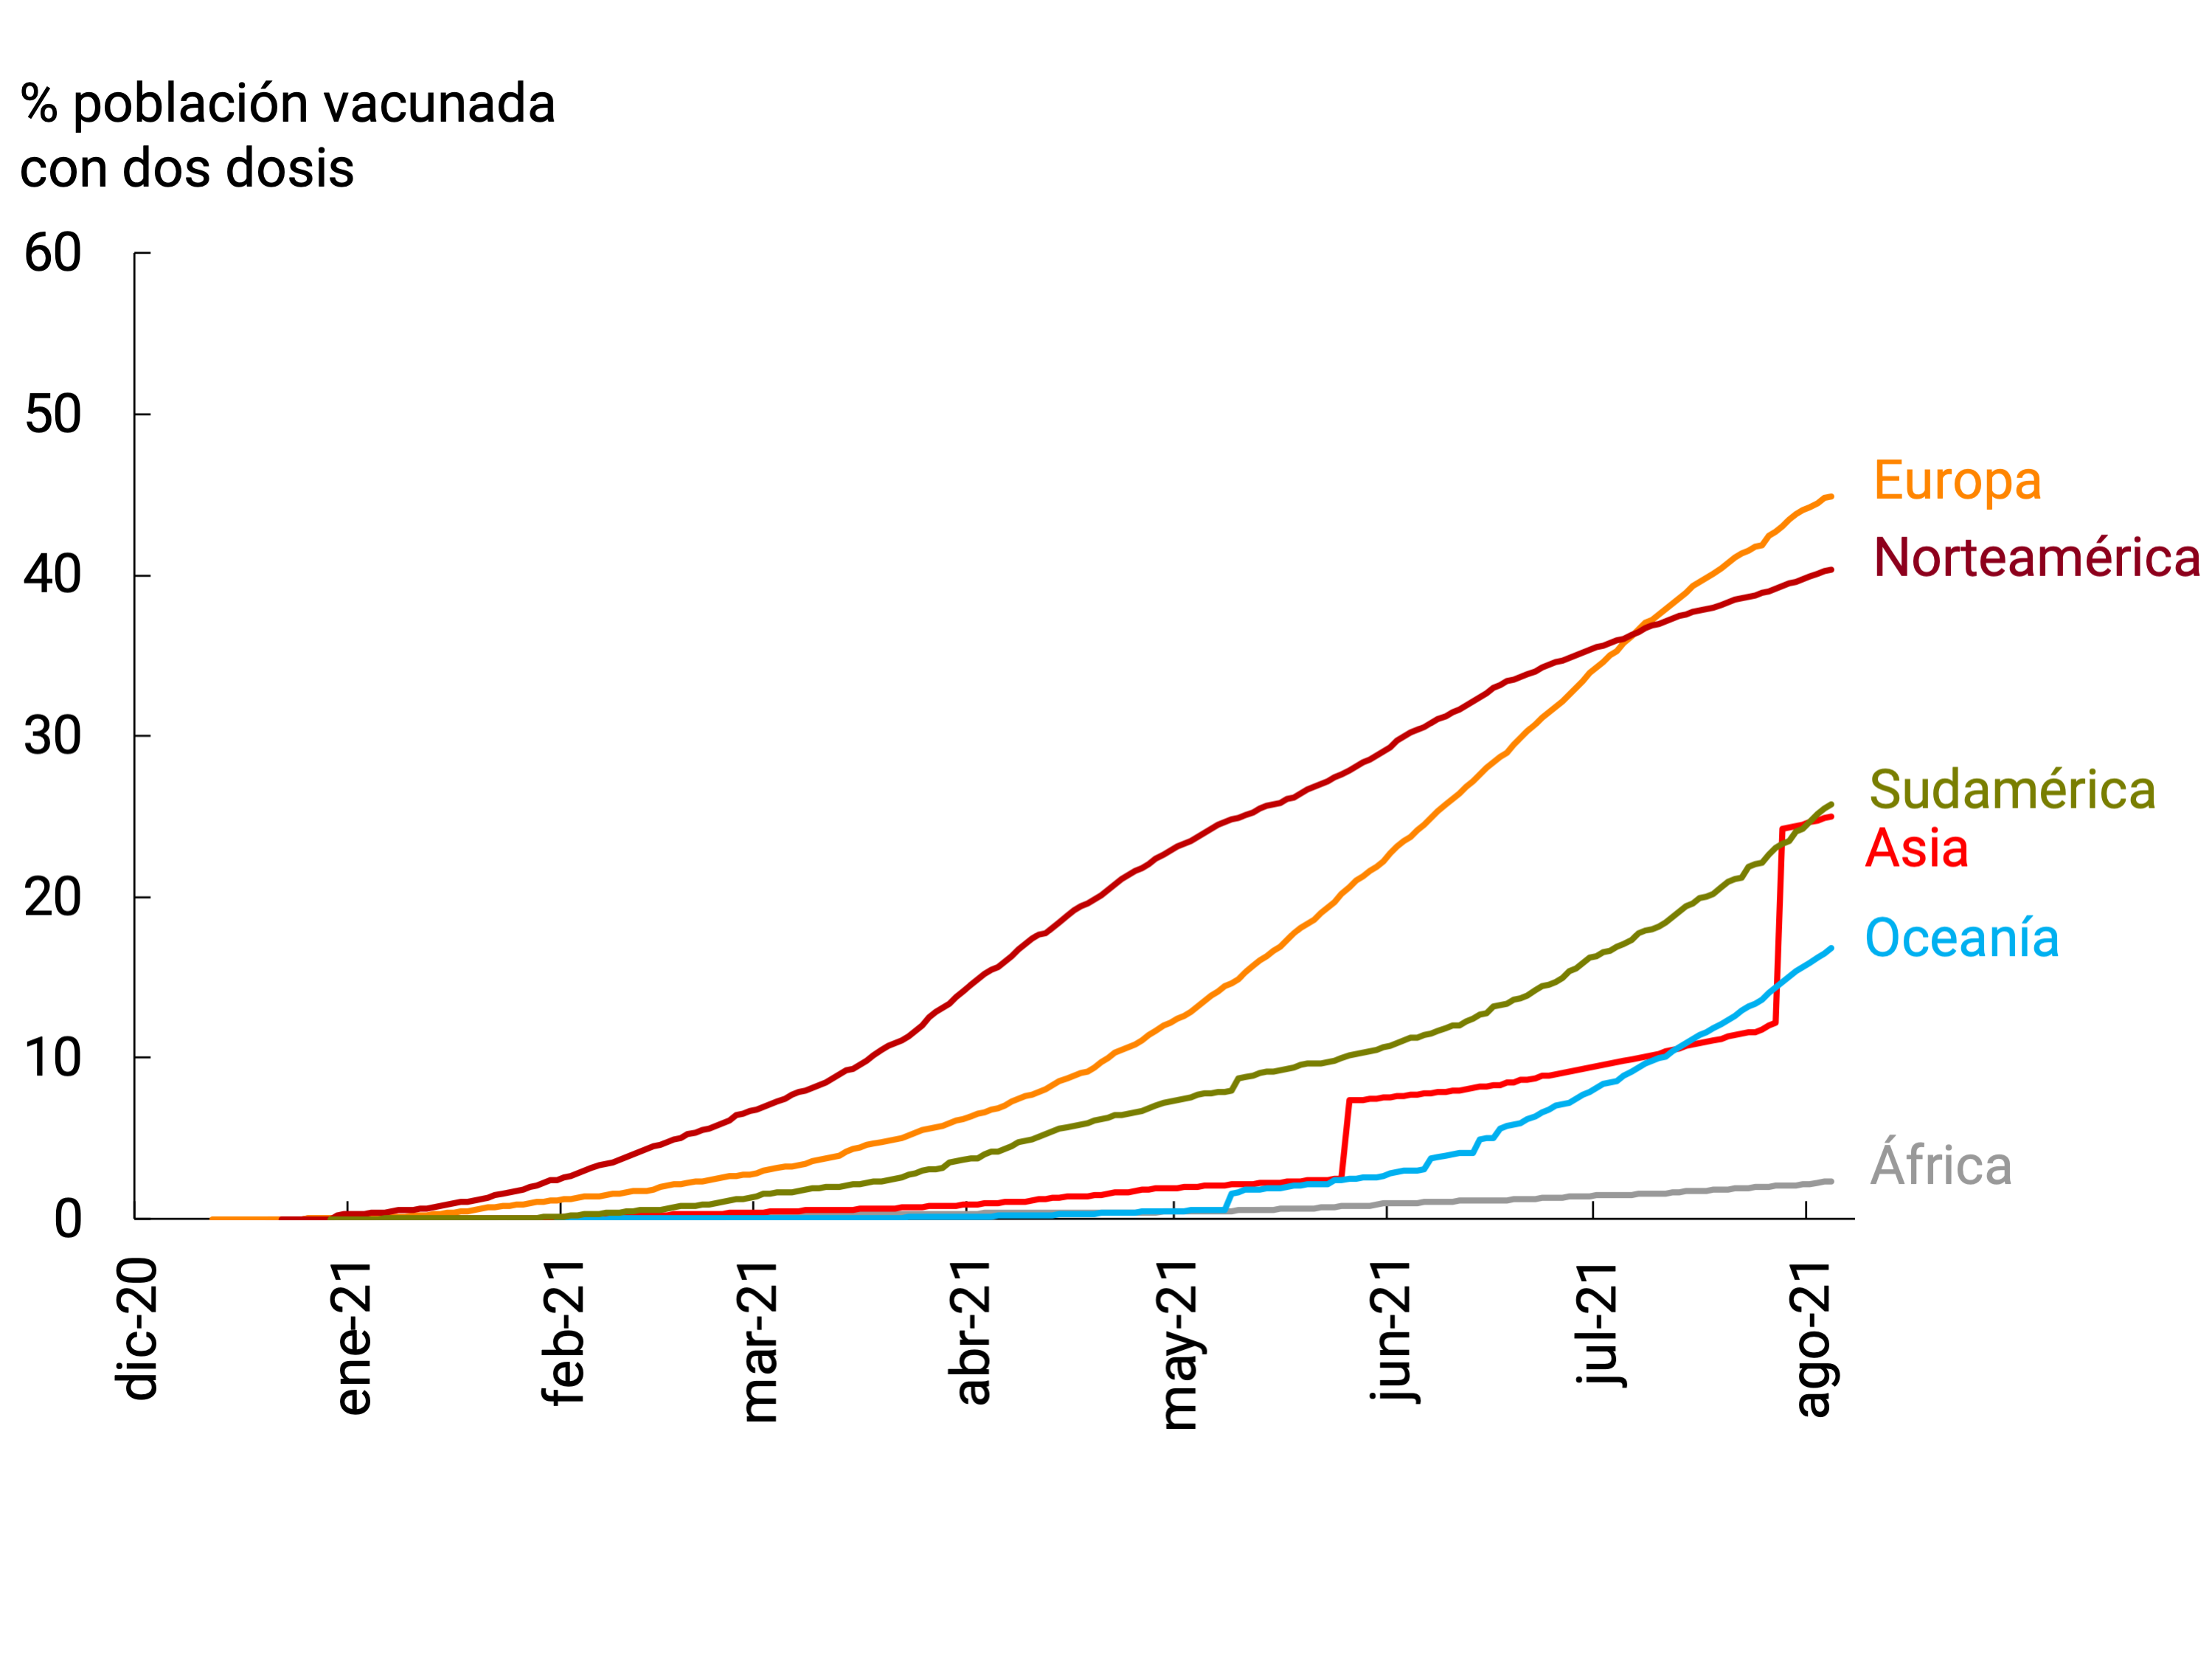
The intensity of vaccination not only depends on the severity of the pandemic, but at the same level of deaths per million, lower-income countries vaccinated much less (see Figure 2.3). Between continents, the gap narrowed in the application of first doses, but continued to be noticeable in the proportion of the population vaccinated with two doses (see Figure 2.2).
Figure 2.3 | Vaccination (doses applied per capita) and deaths from COVID-19 according to GDP per capita
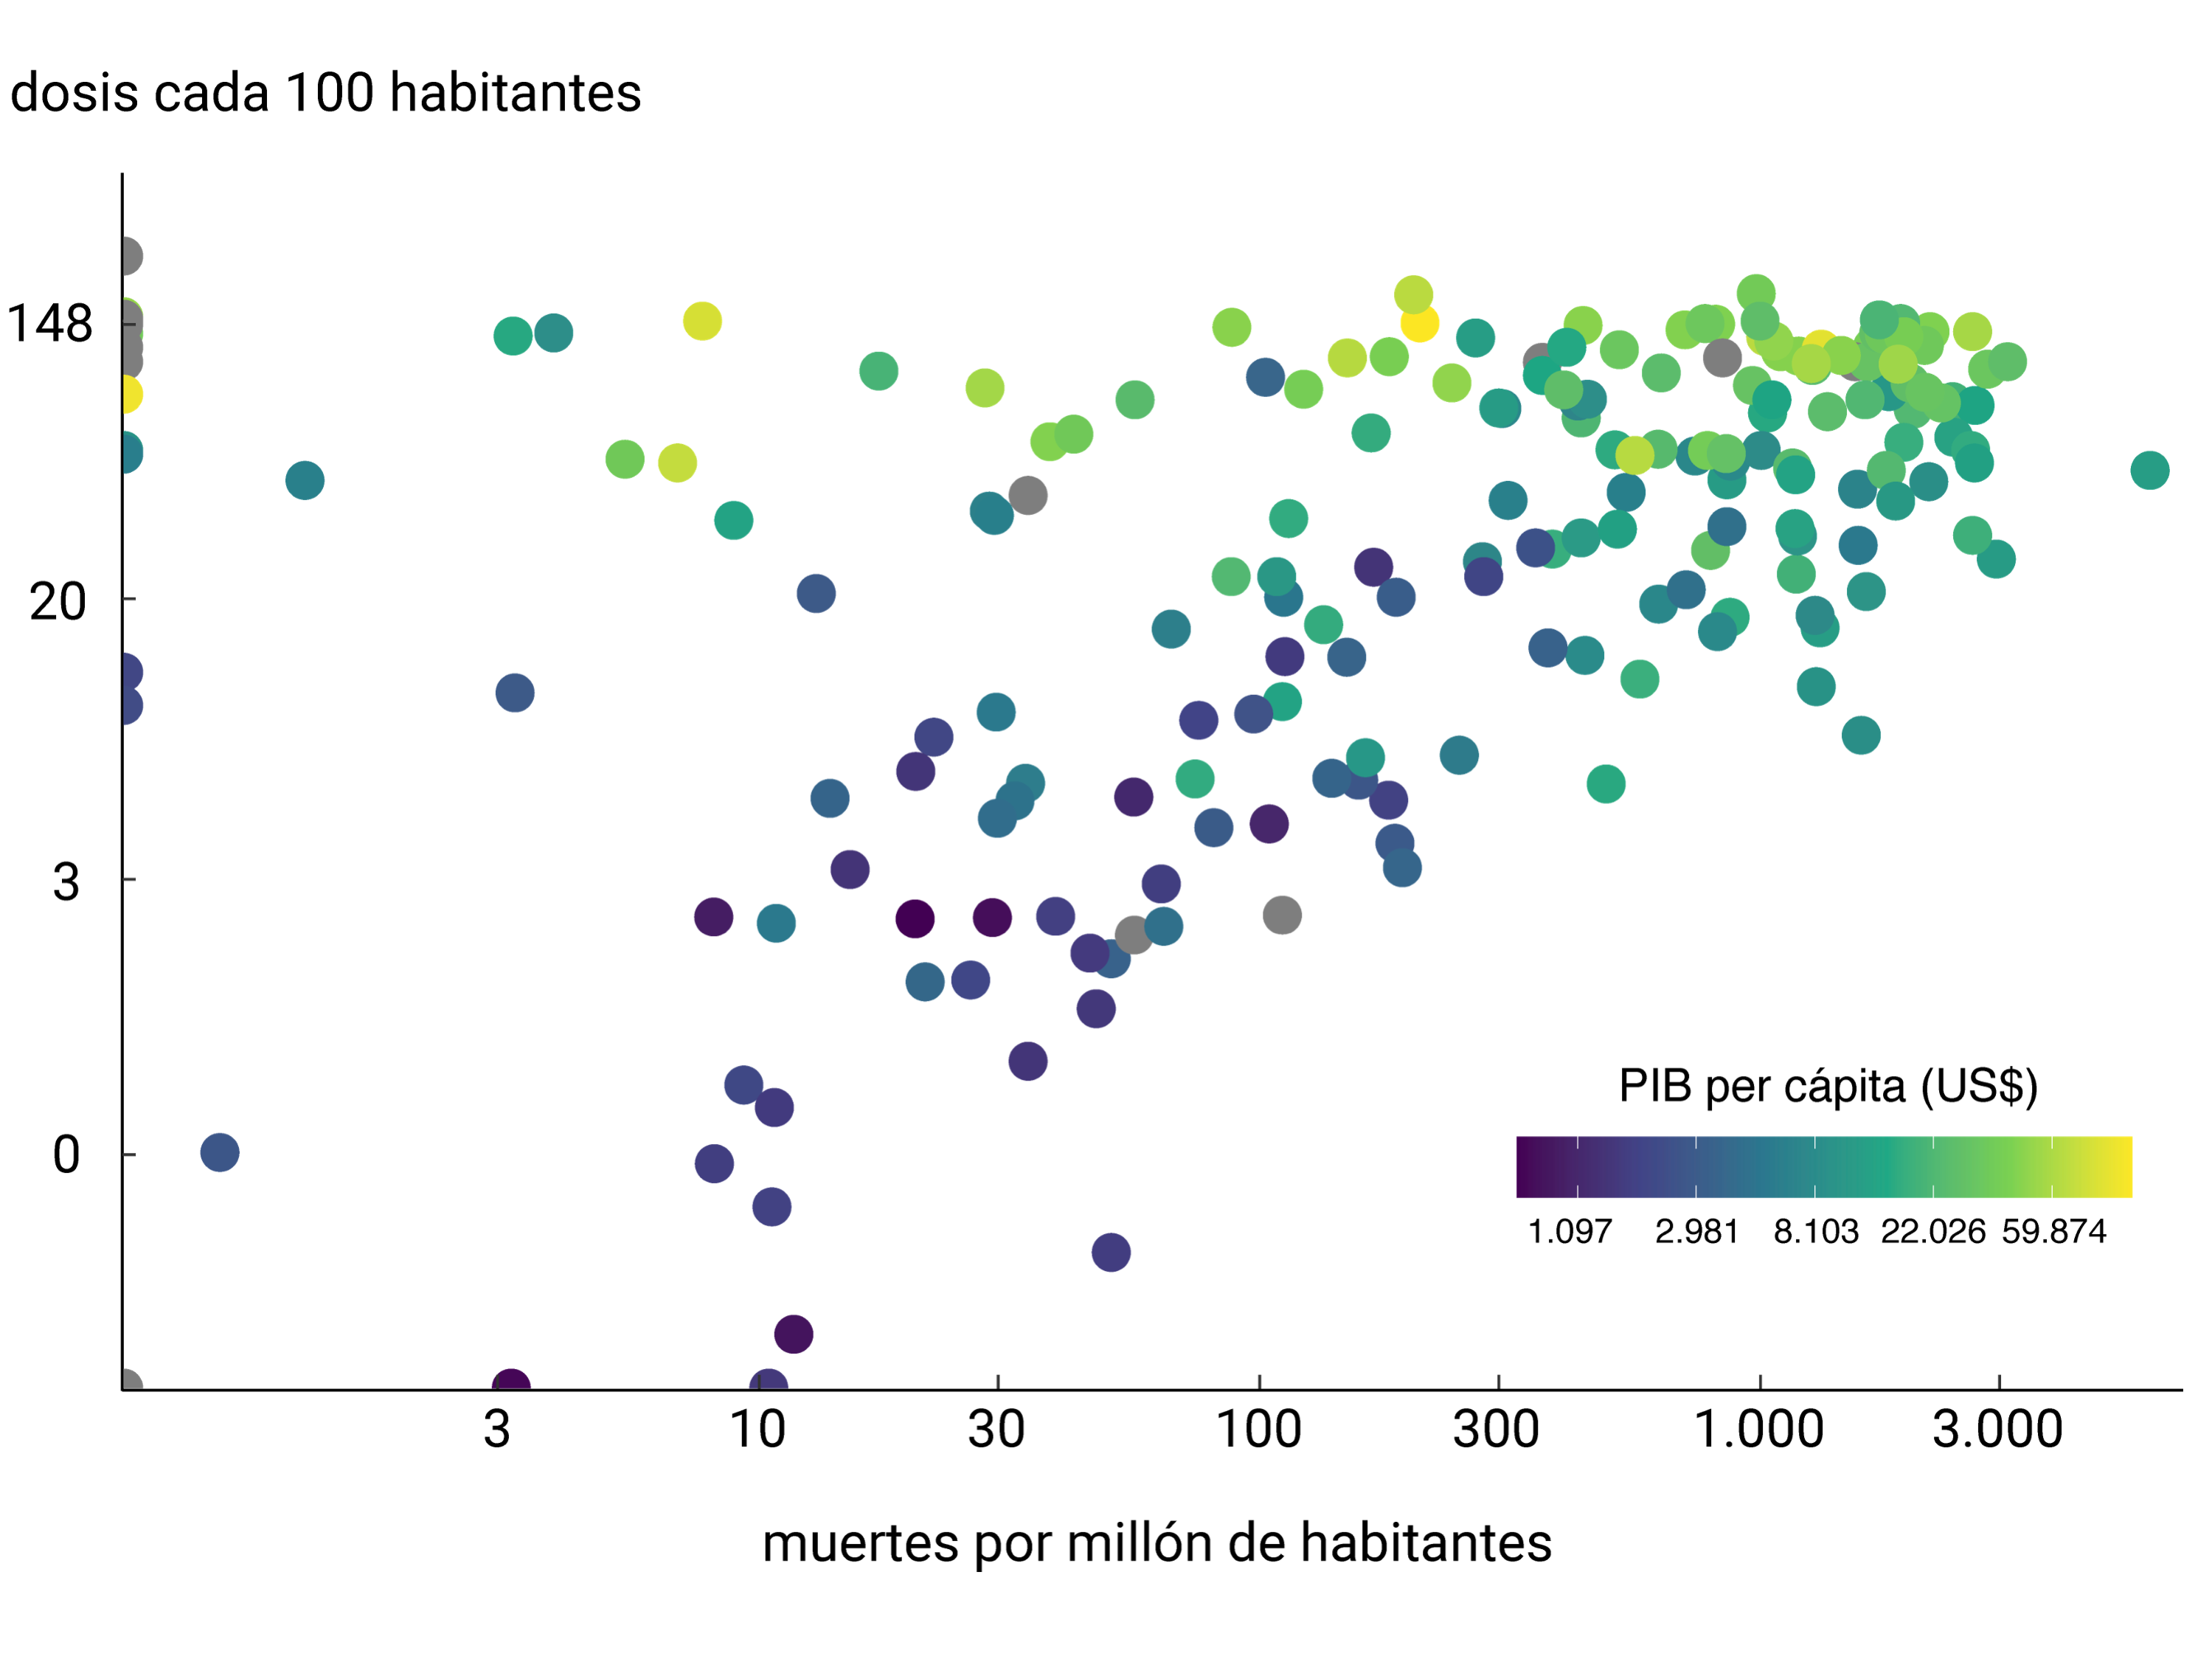
Figure 2.4 | Variation in the rigidity index of social distancing measures according to vaccination progress
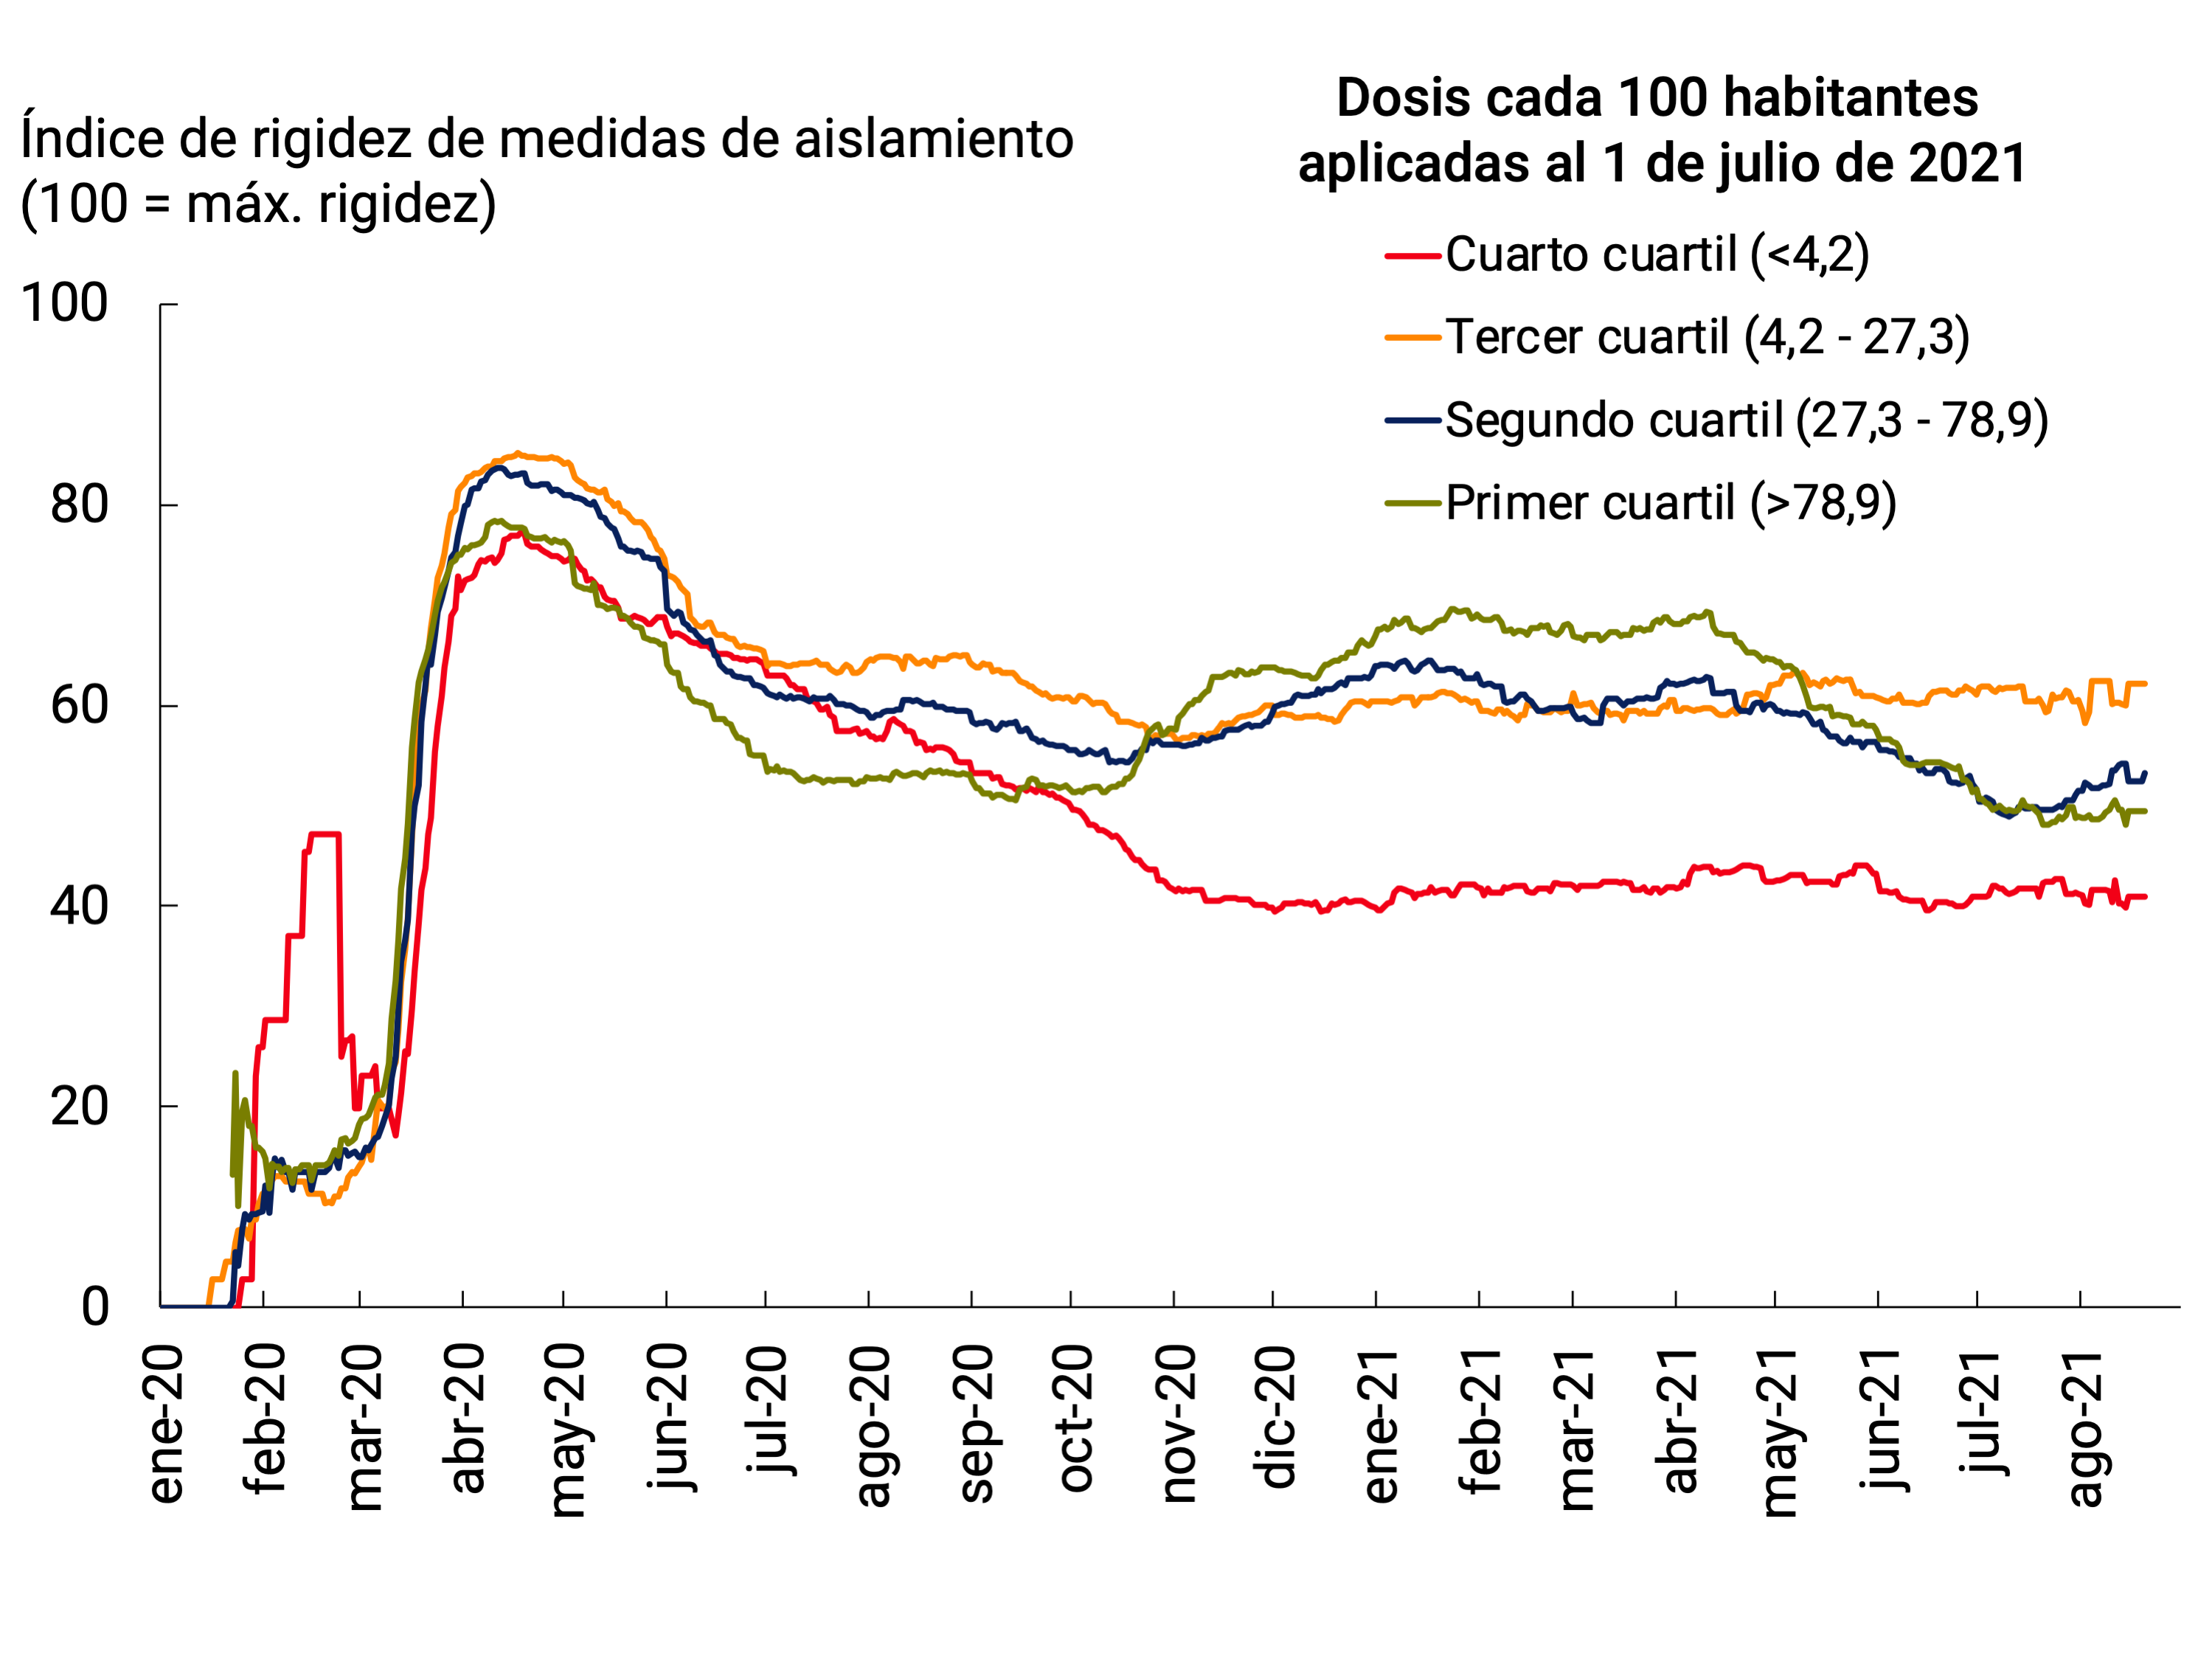
Since May there has been a general increase in mobility. The countries that made the most progress in vaccination removed the most restrictions in recent weeks (see Figure 2.4)2. The inequitable distribution of vaccines, then, is relevant for at least two reasons: the emergence of new, potentially more aggressive variants in areas of high viral circulation; and because it could accentuate an uneven recovery in activity.
2.2. Global economic recovery continues, but divergence between groups of countries is accentuated
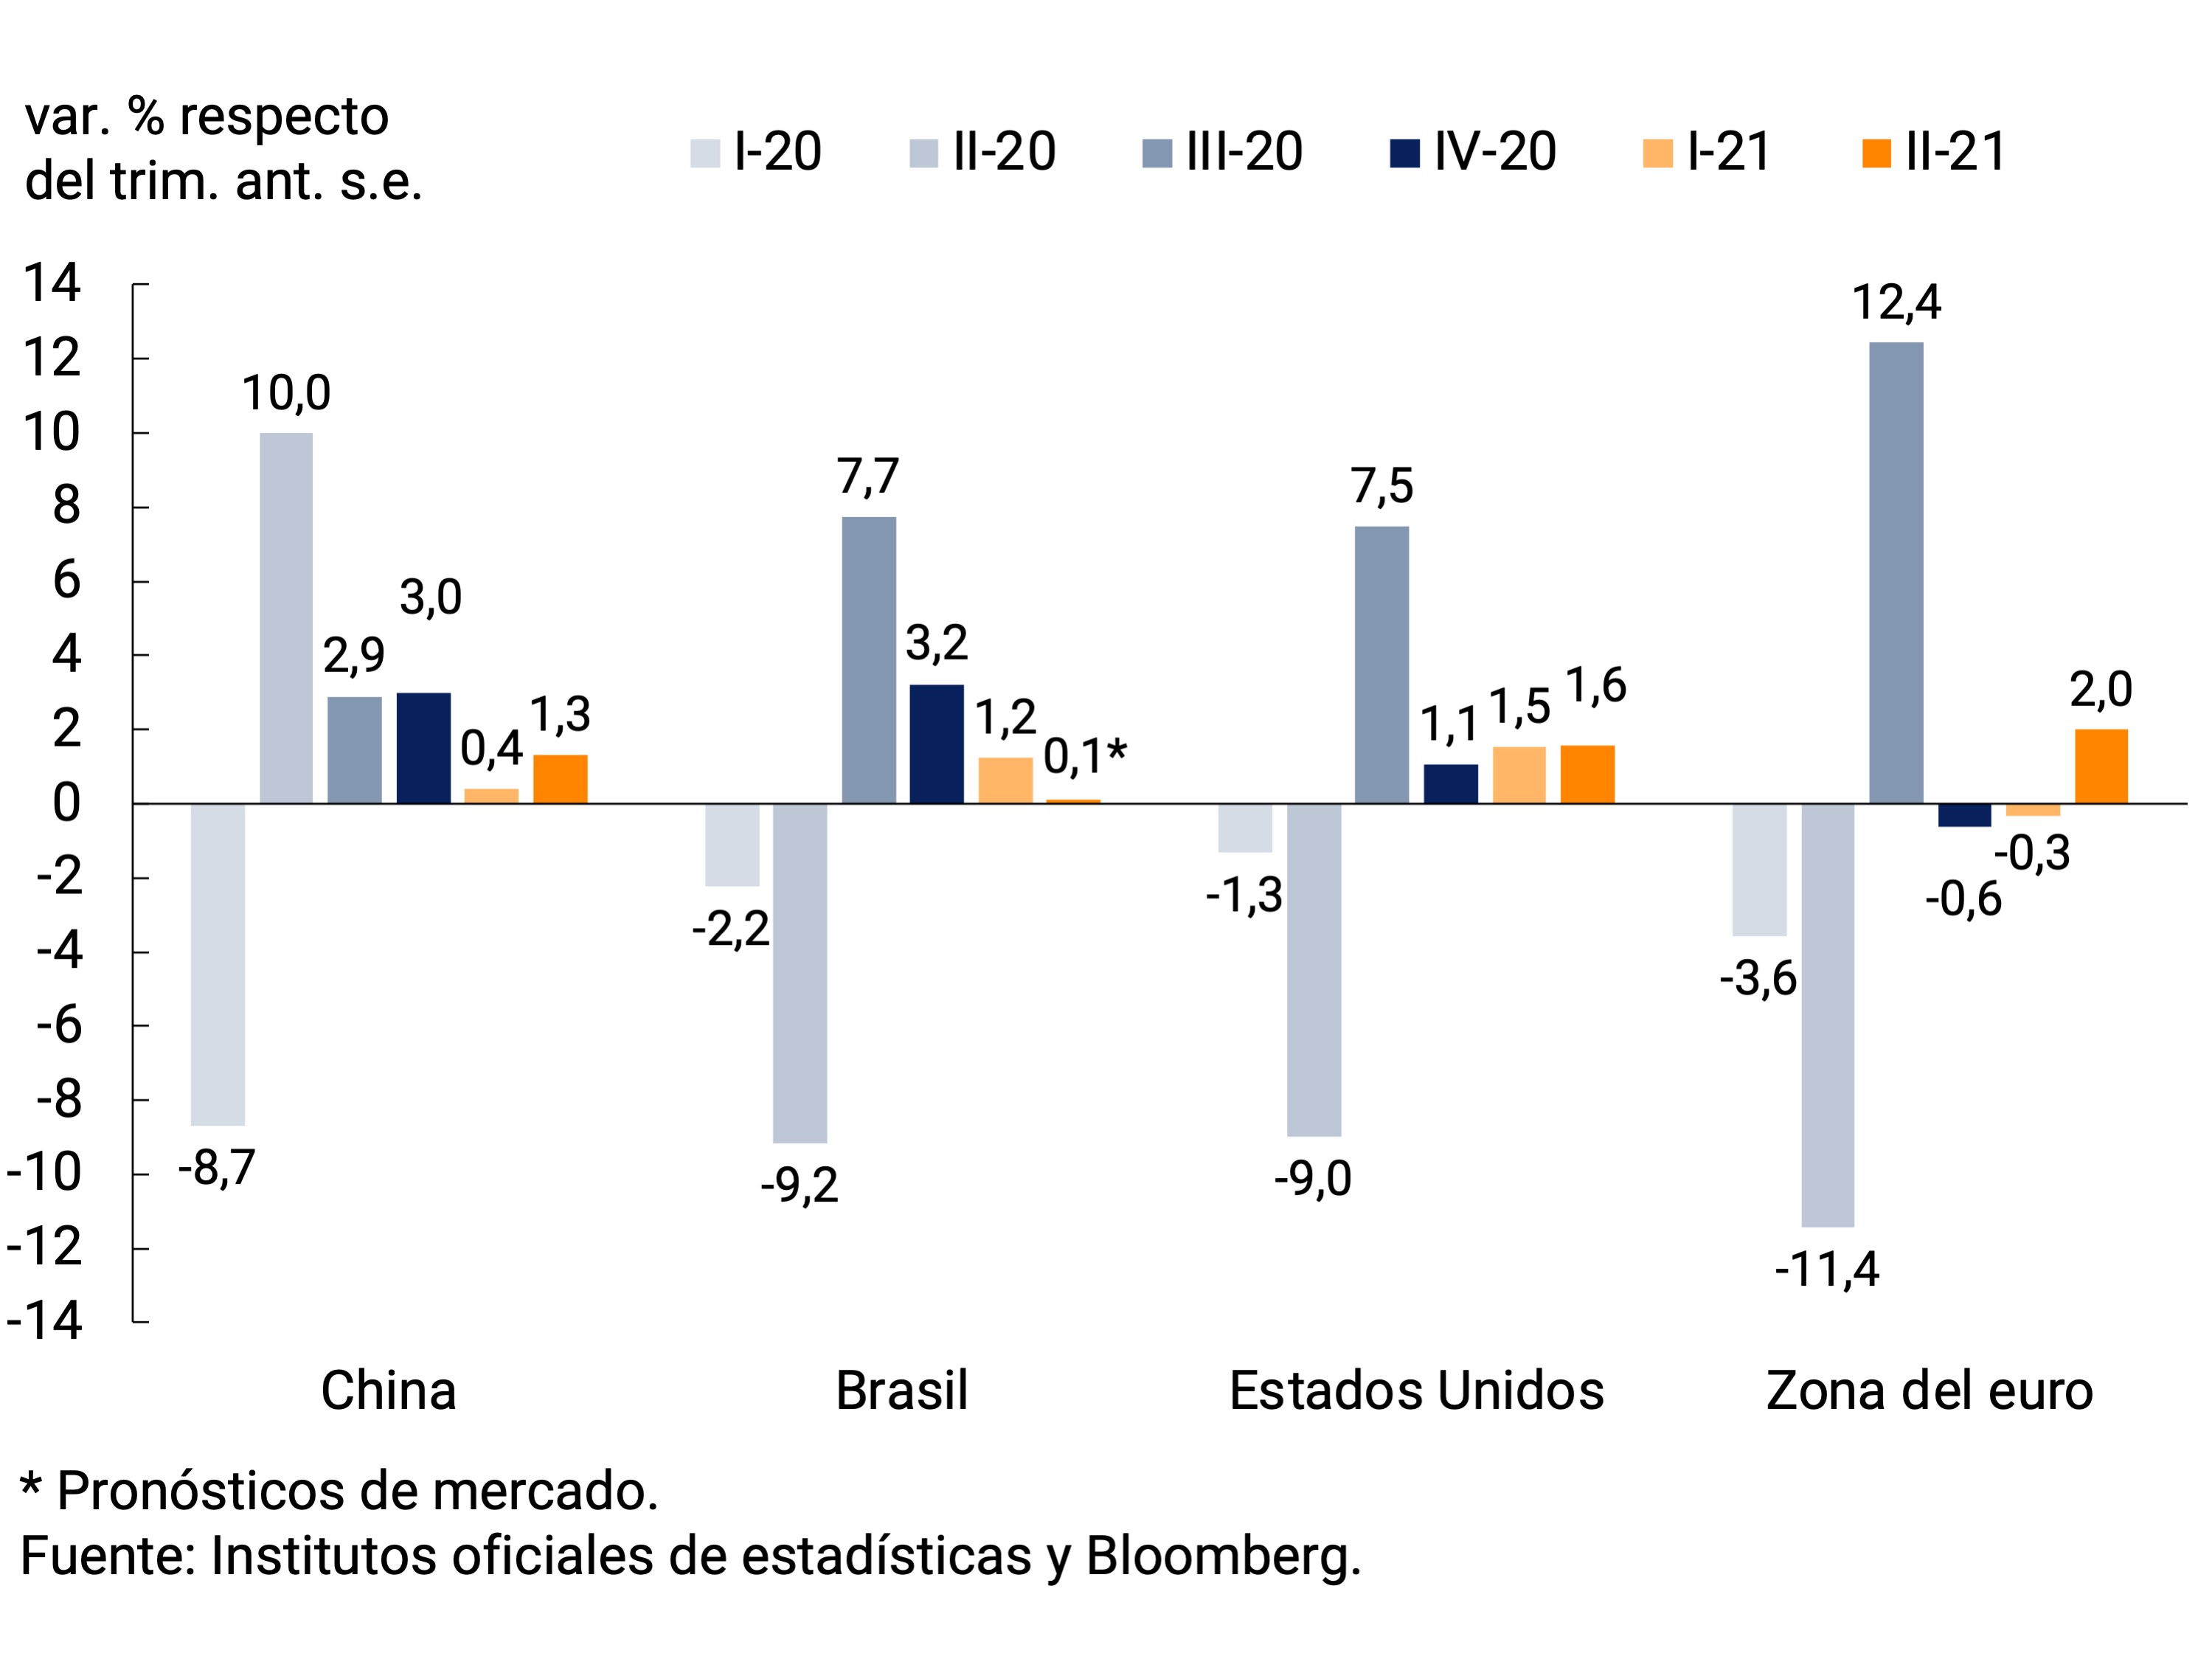
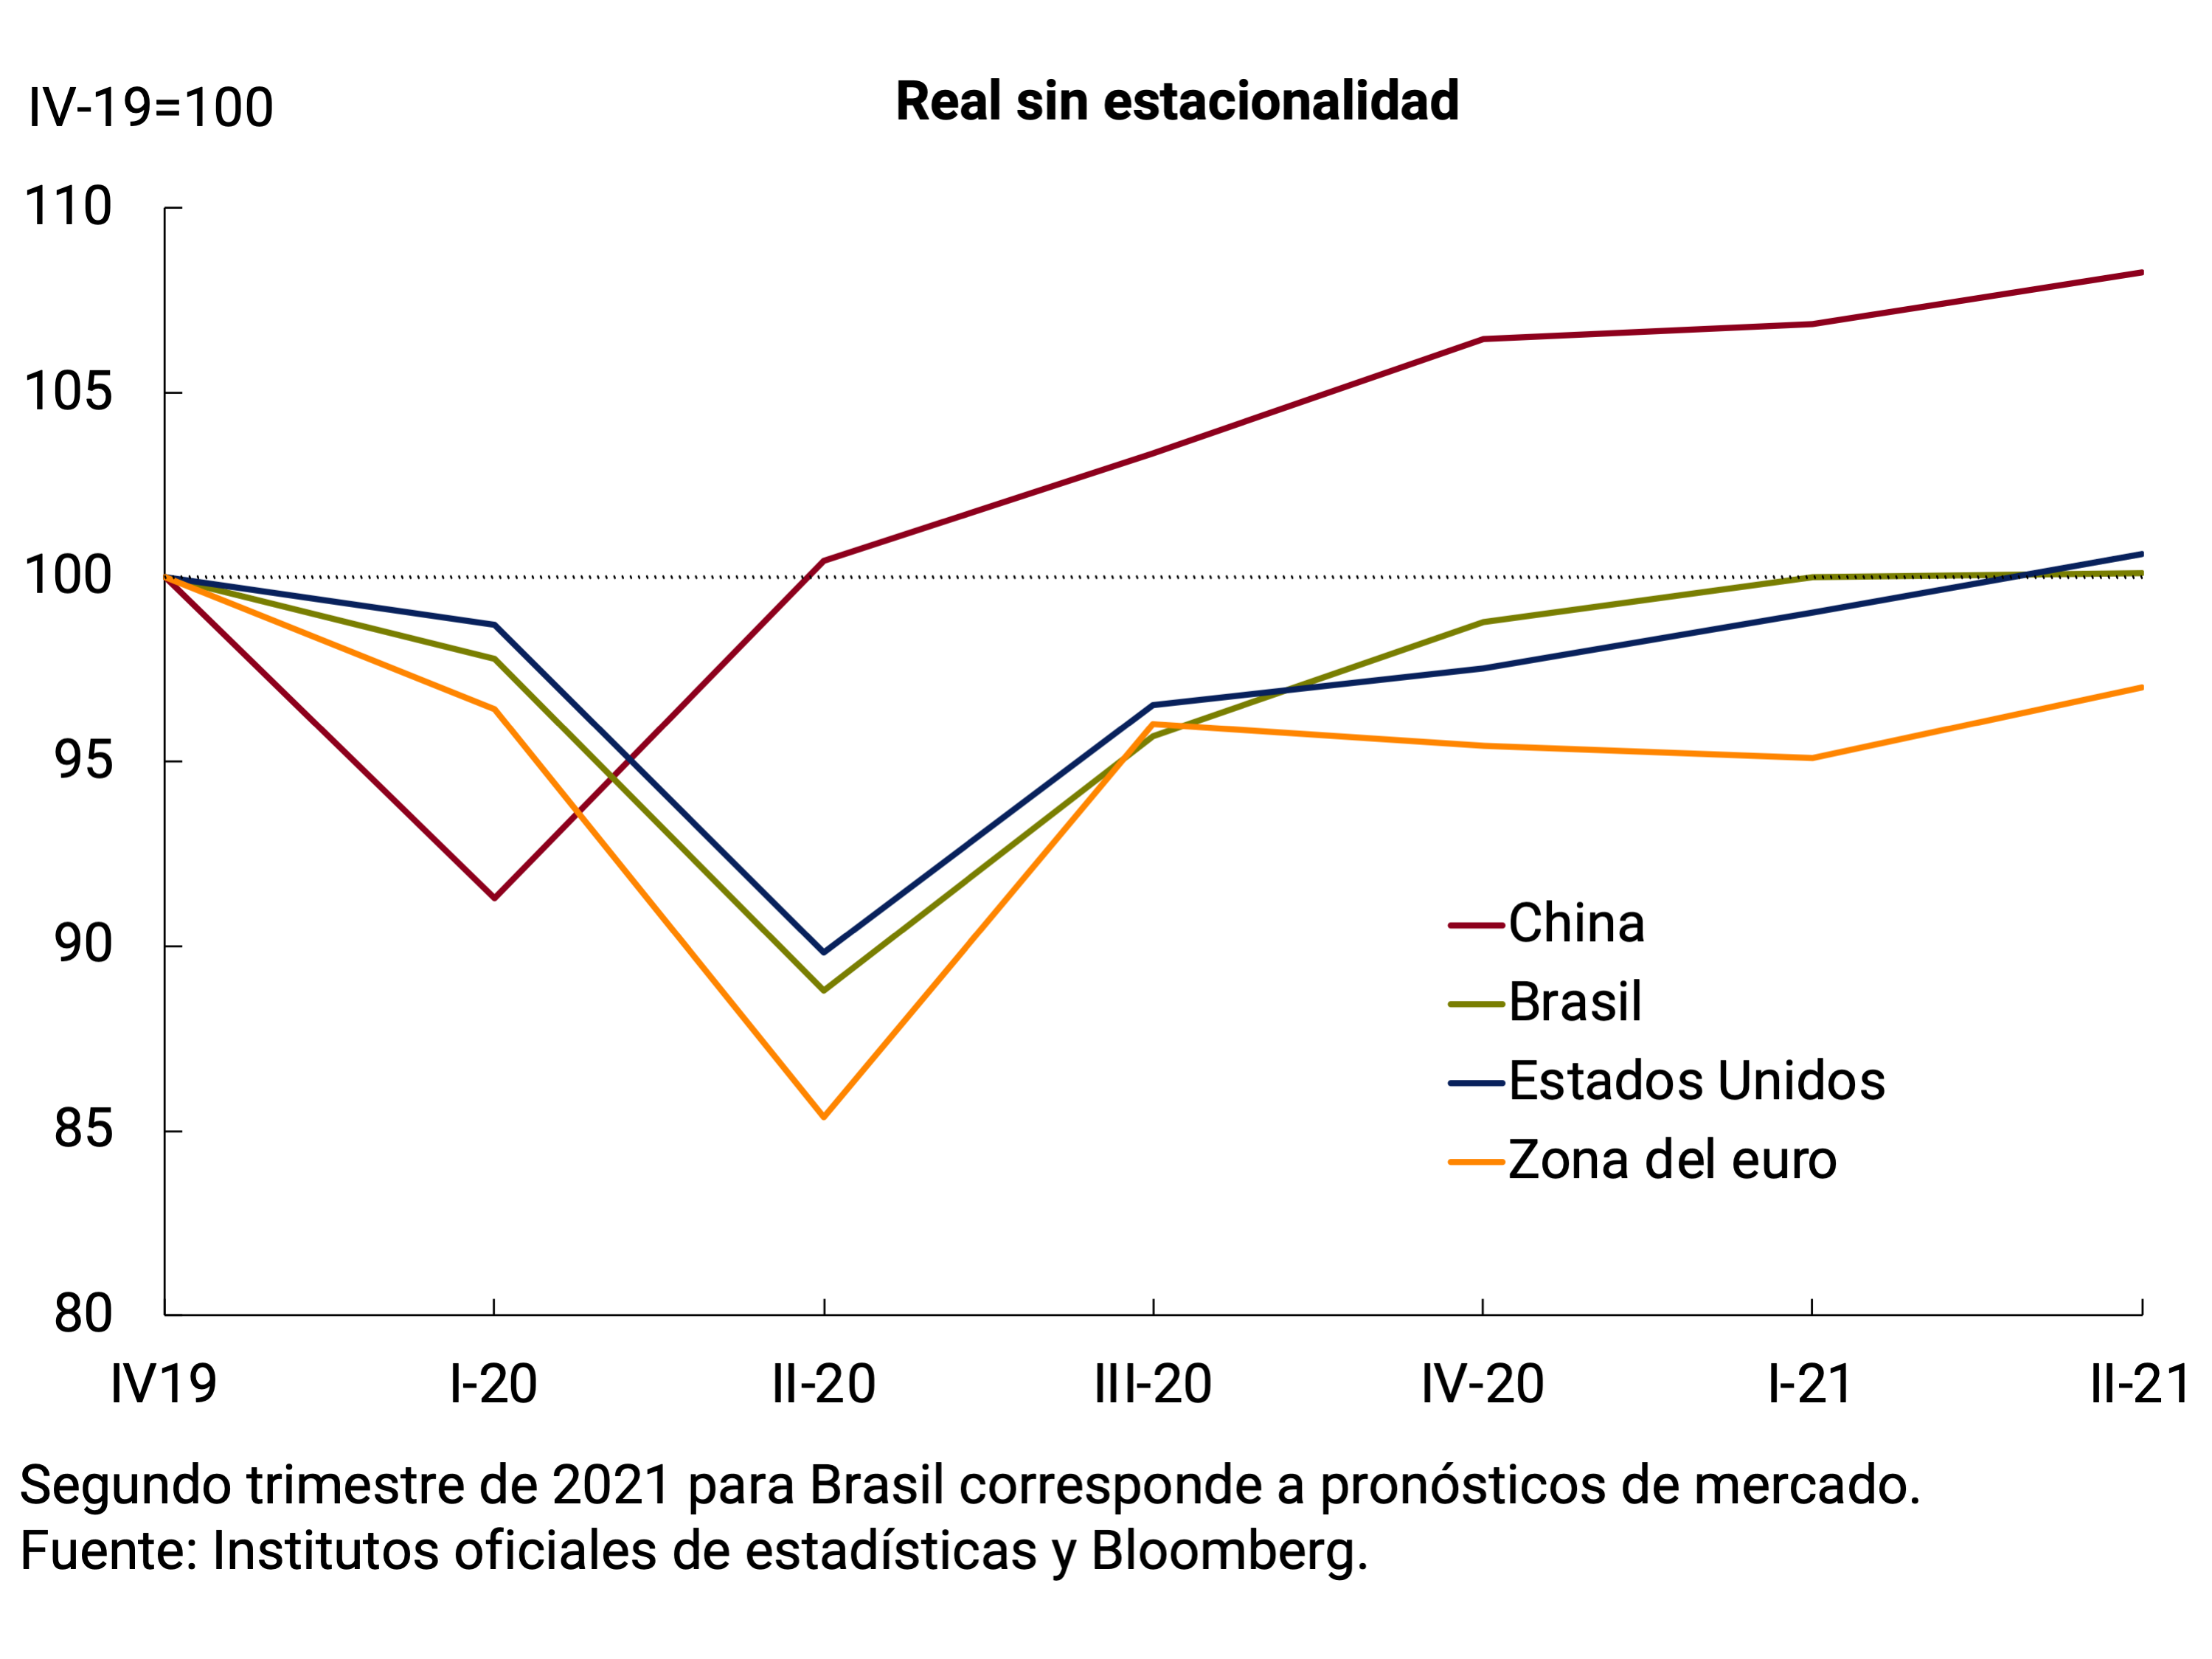
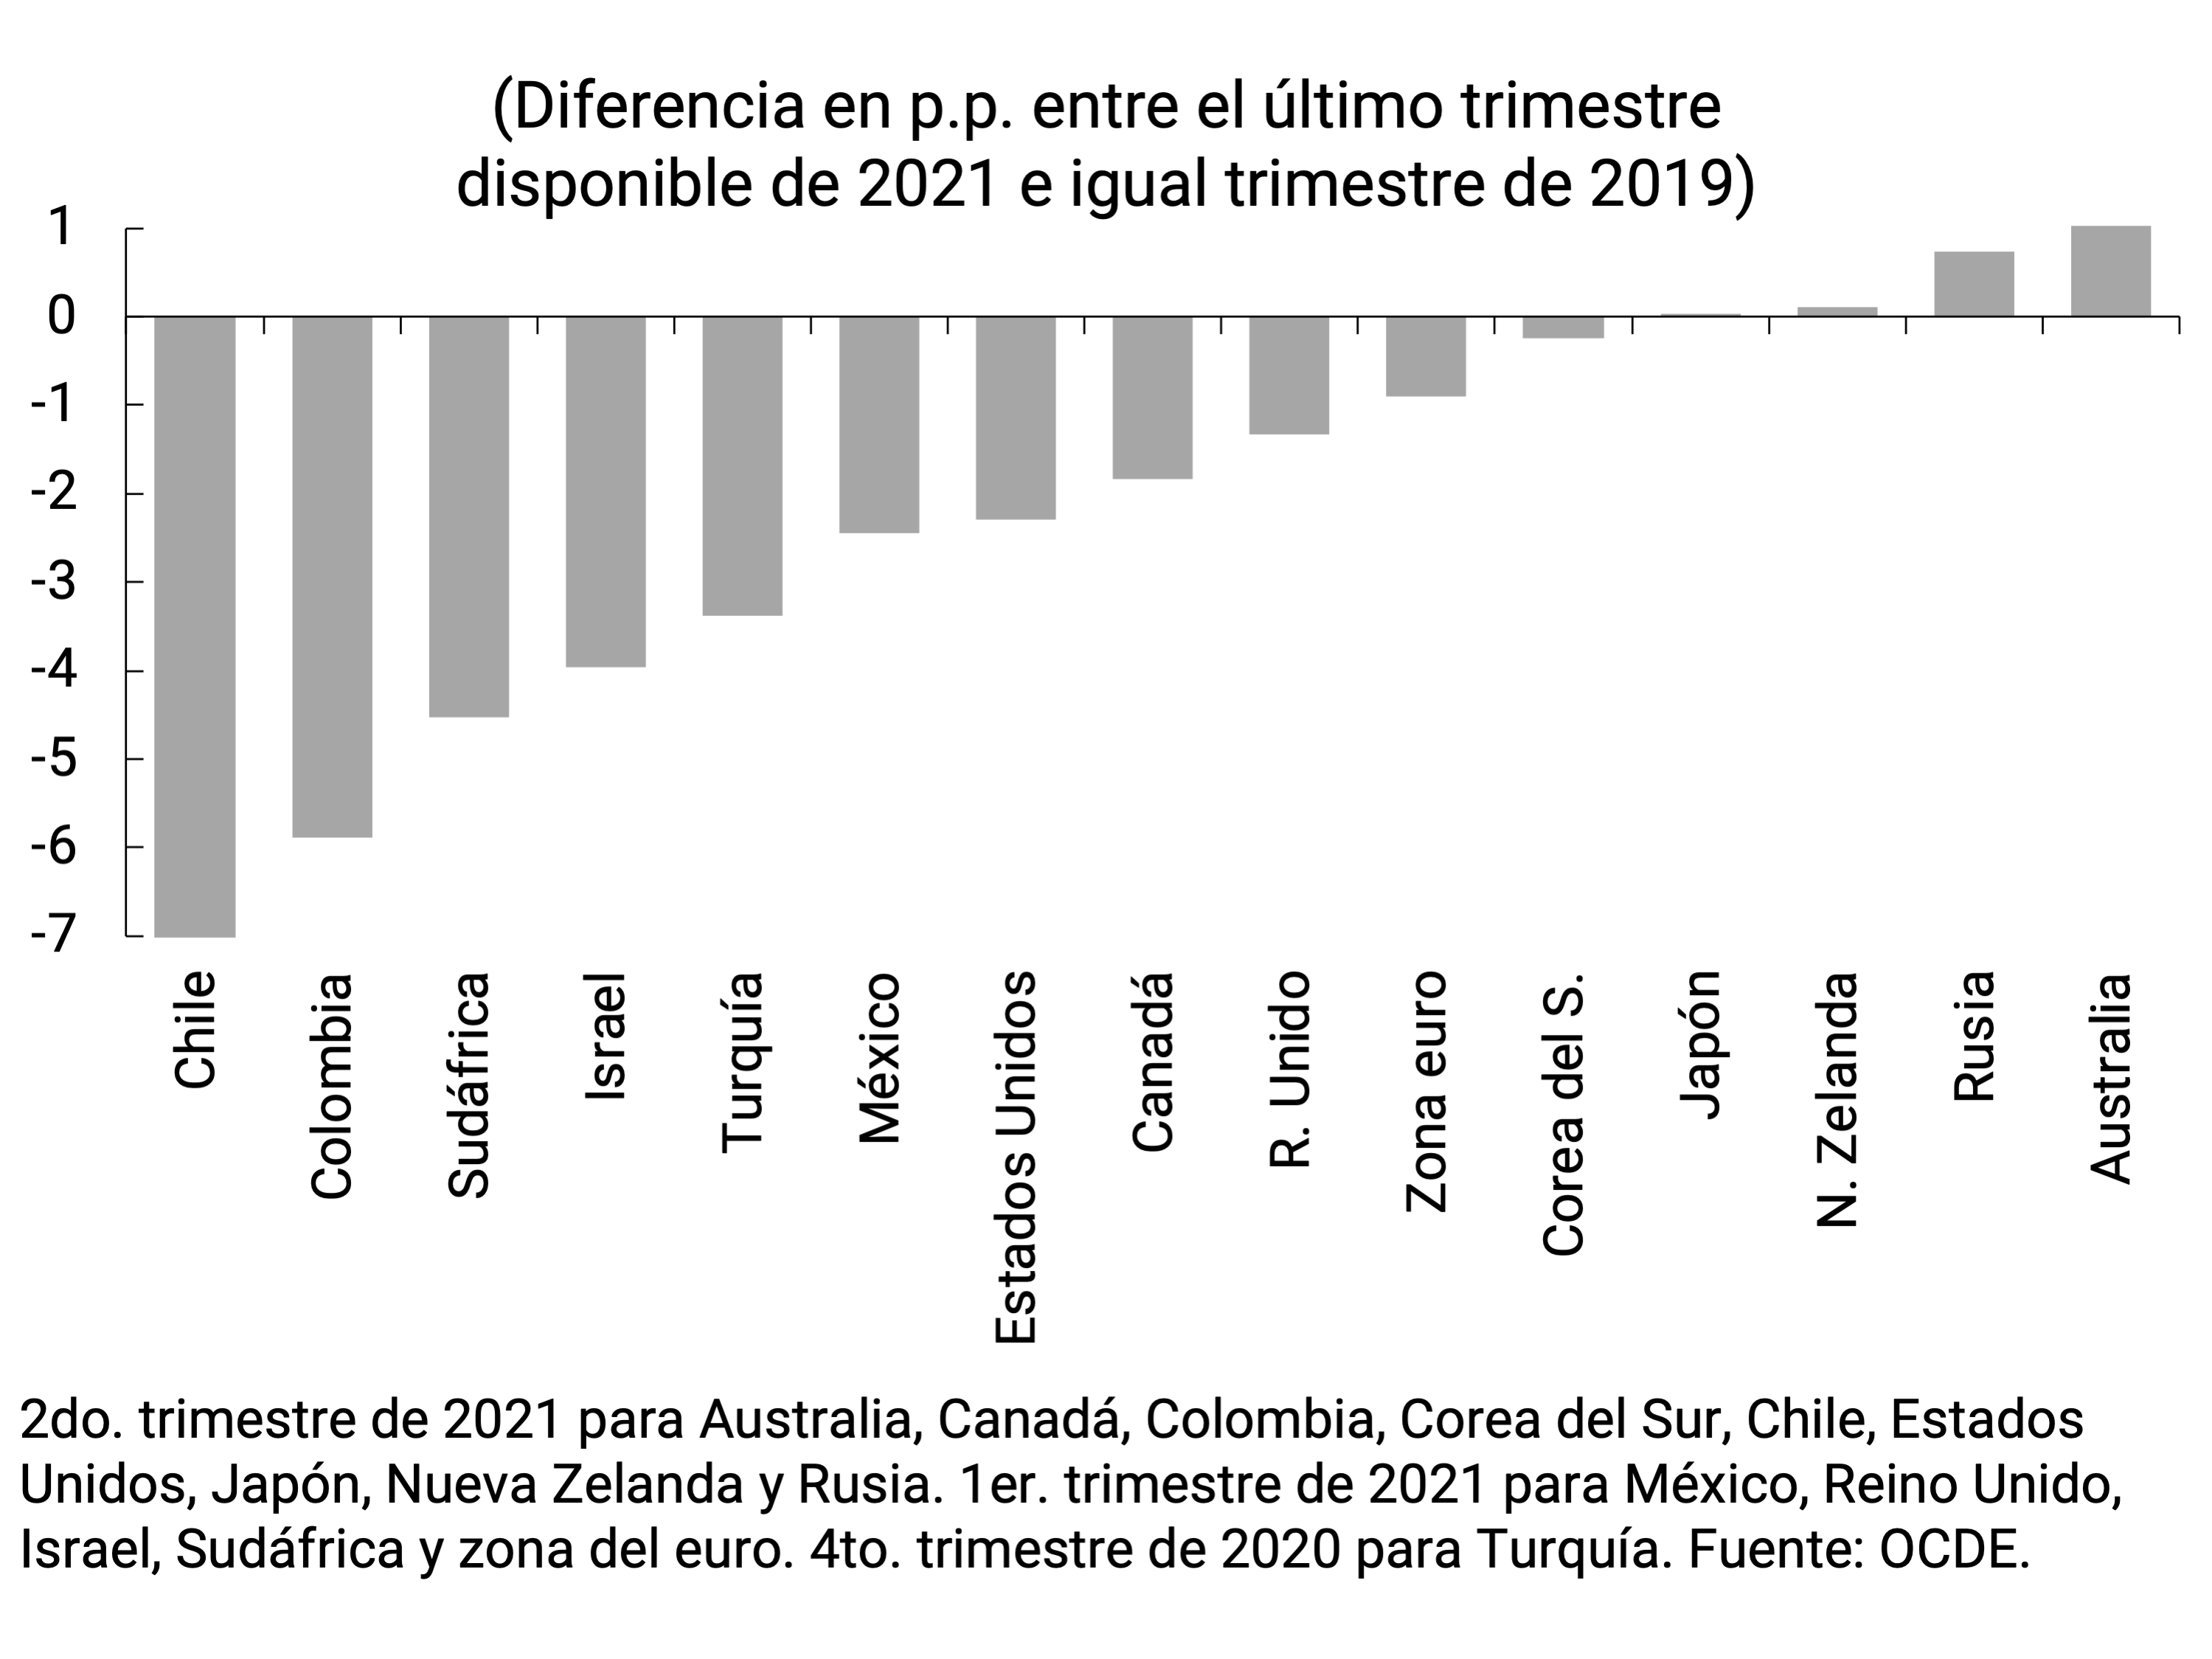
The global economy continued to recover in the second quarter of the year (see Figure 2.5). With regard to Argentina’s main partners, in the United States, economic activity accelerated in the first two quarters compared to the last quarter of last year, due to the progress of vaccination and greater fiscal stimulus. In the euro area, after the fall in the economy in the first quarter due to the impact of the second wave, activity grew again in the second quarter thanks to the reopenings and also a greater fiscal boost in some countries. In Brazil, the second wave reduced the economy’s growth rate in the second quarter, while in China it accelerated, after a first quarter of more moderate expansion. Thus, at the end of the first half of the year, activity levels in China, the United States and Brazil were above or close to pre-pandemic levels, while in the euro area they were still 3% below.
Figure 2.5 | Evolution of the GDP of Argentina’s main trading partners
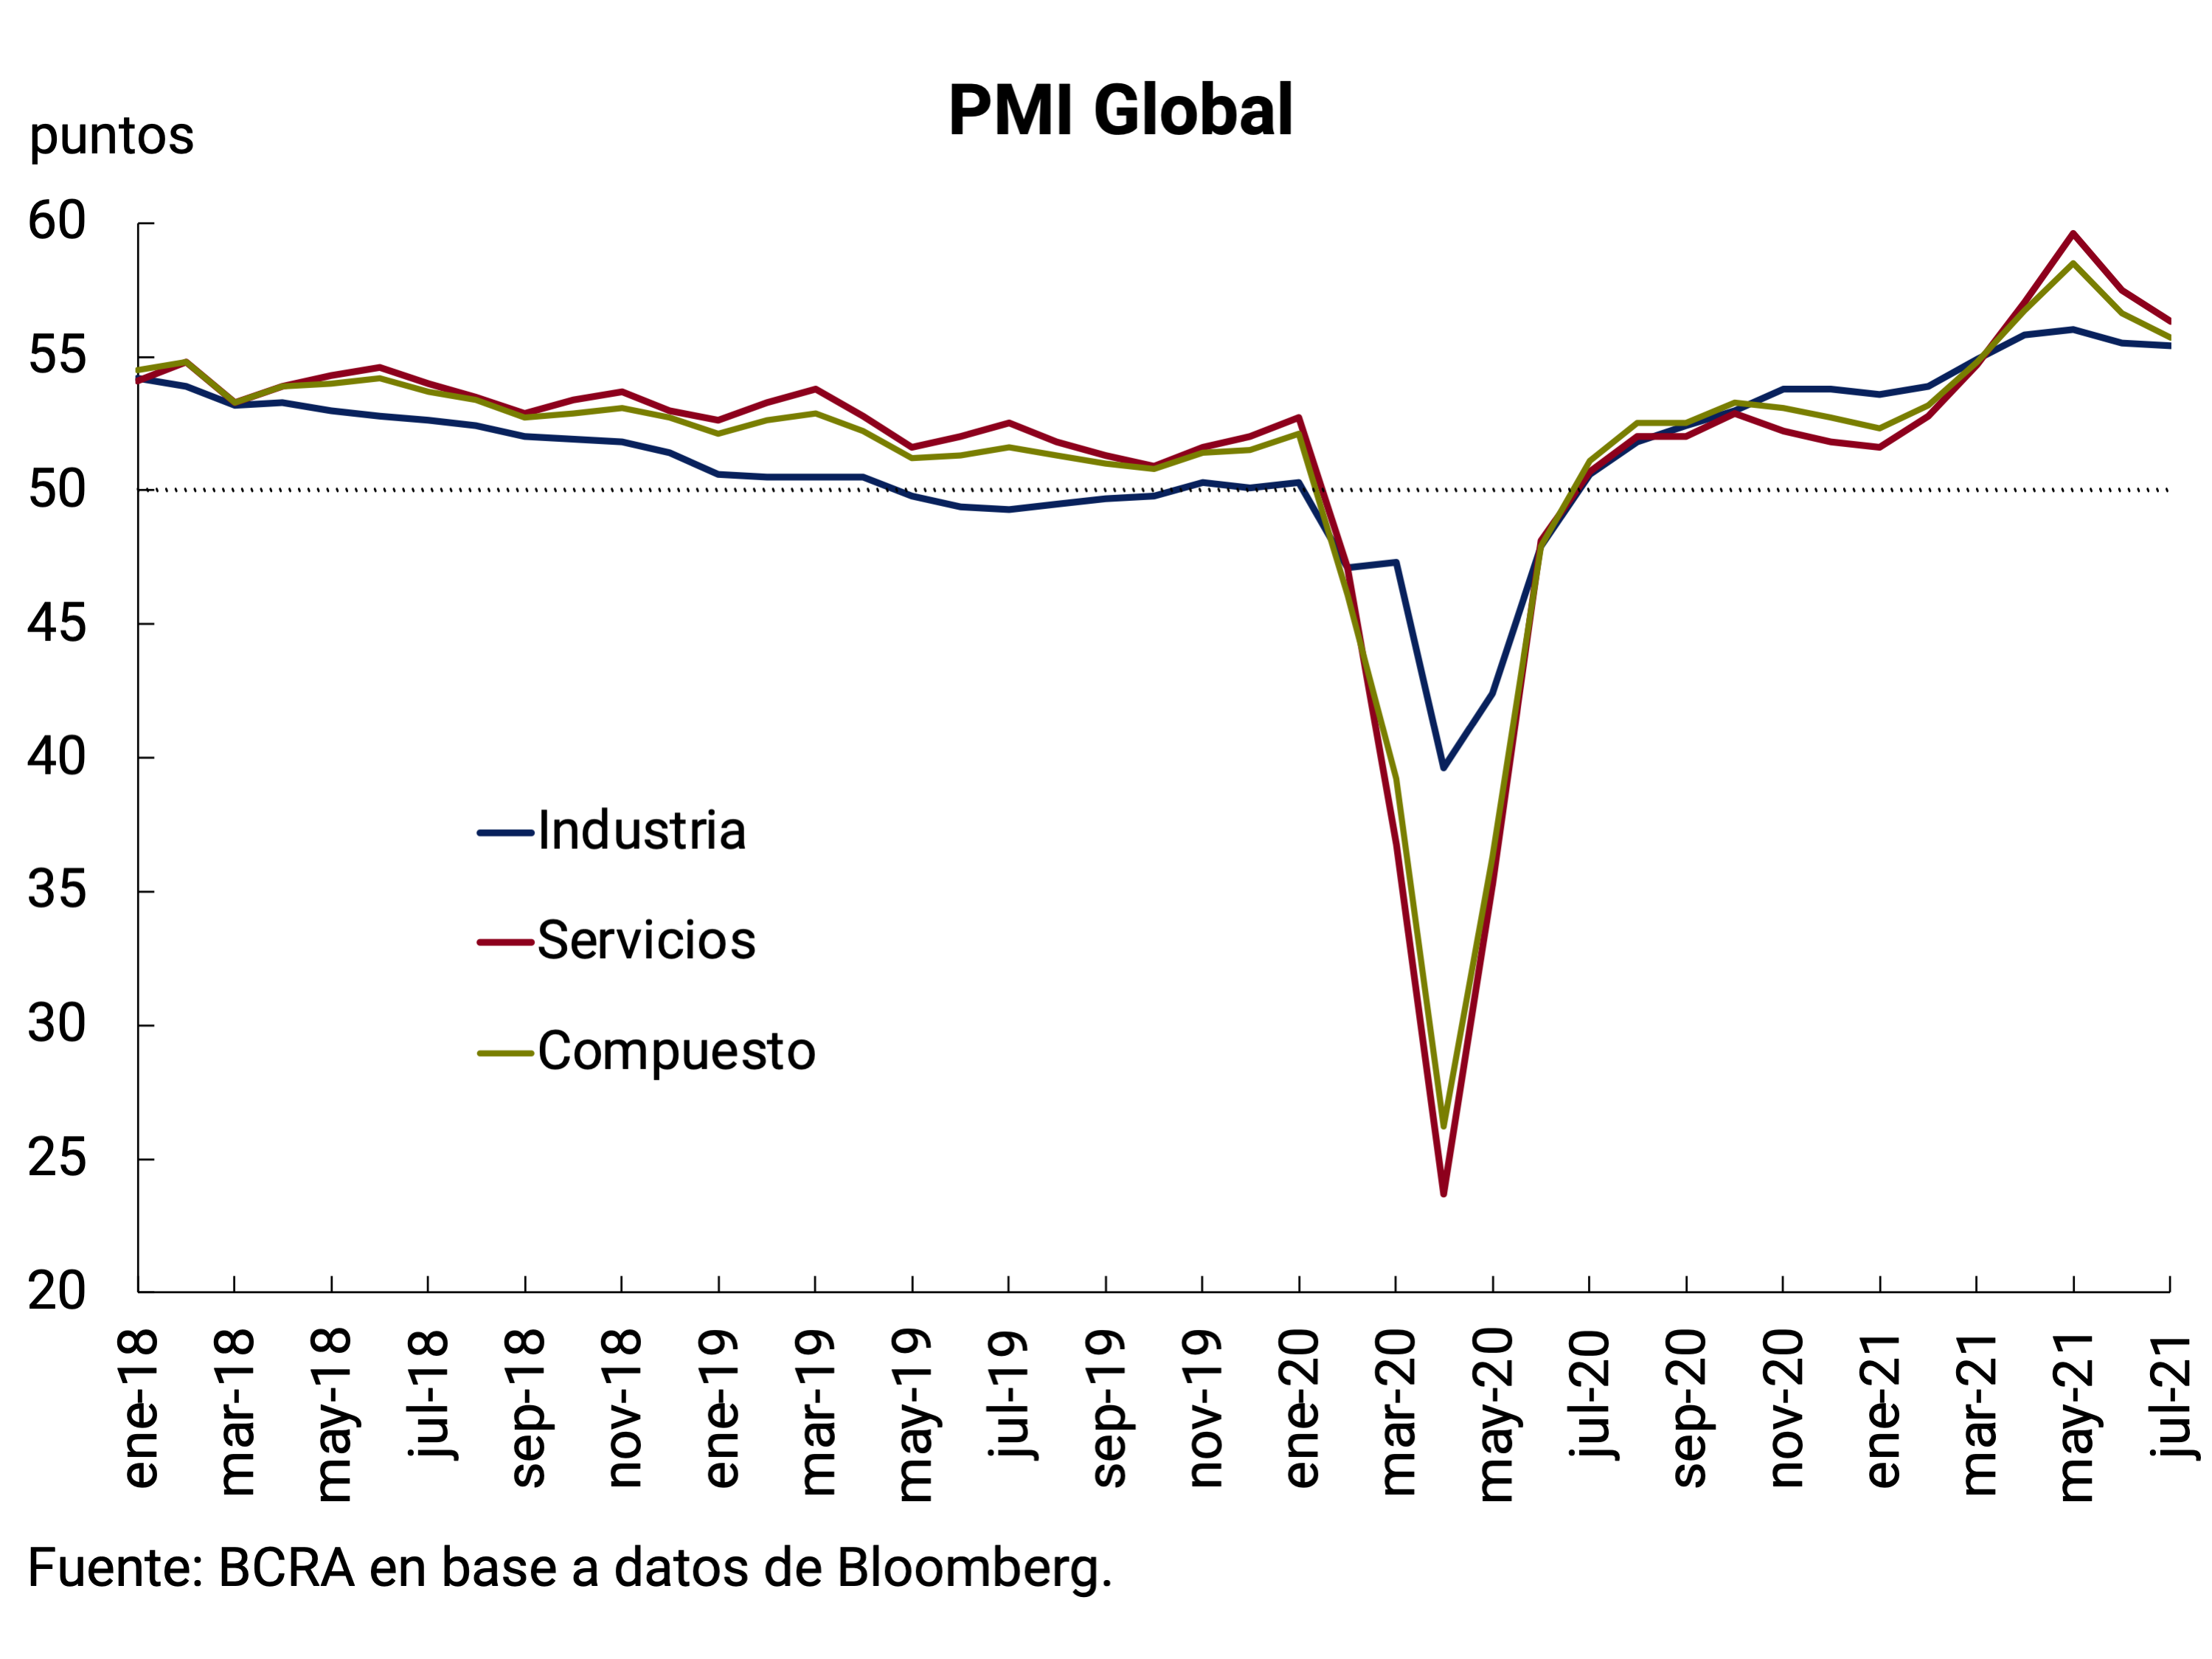
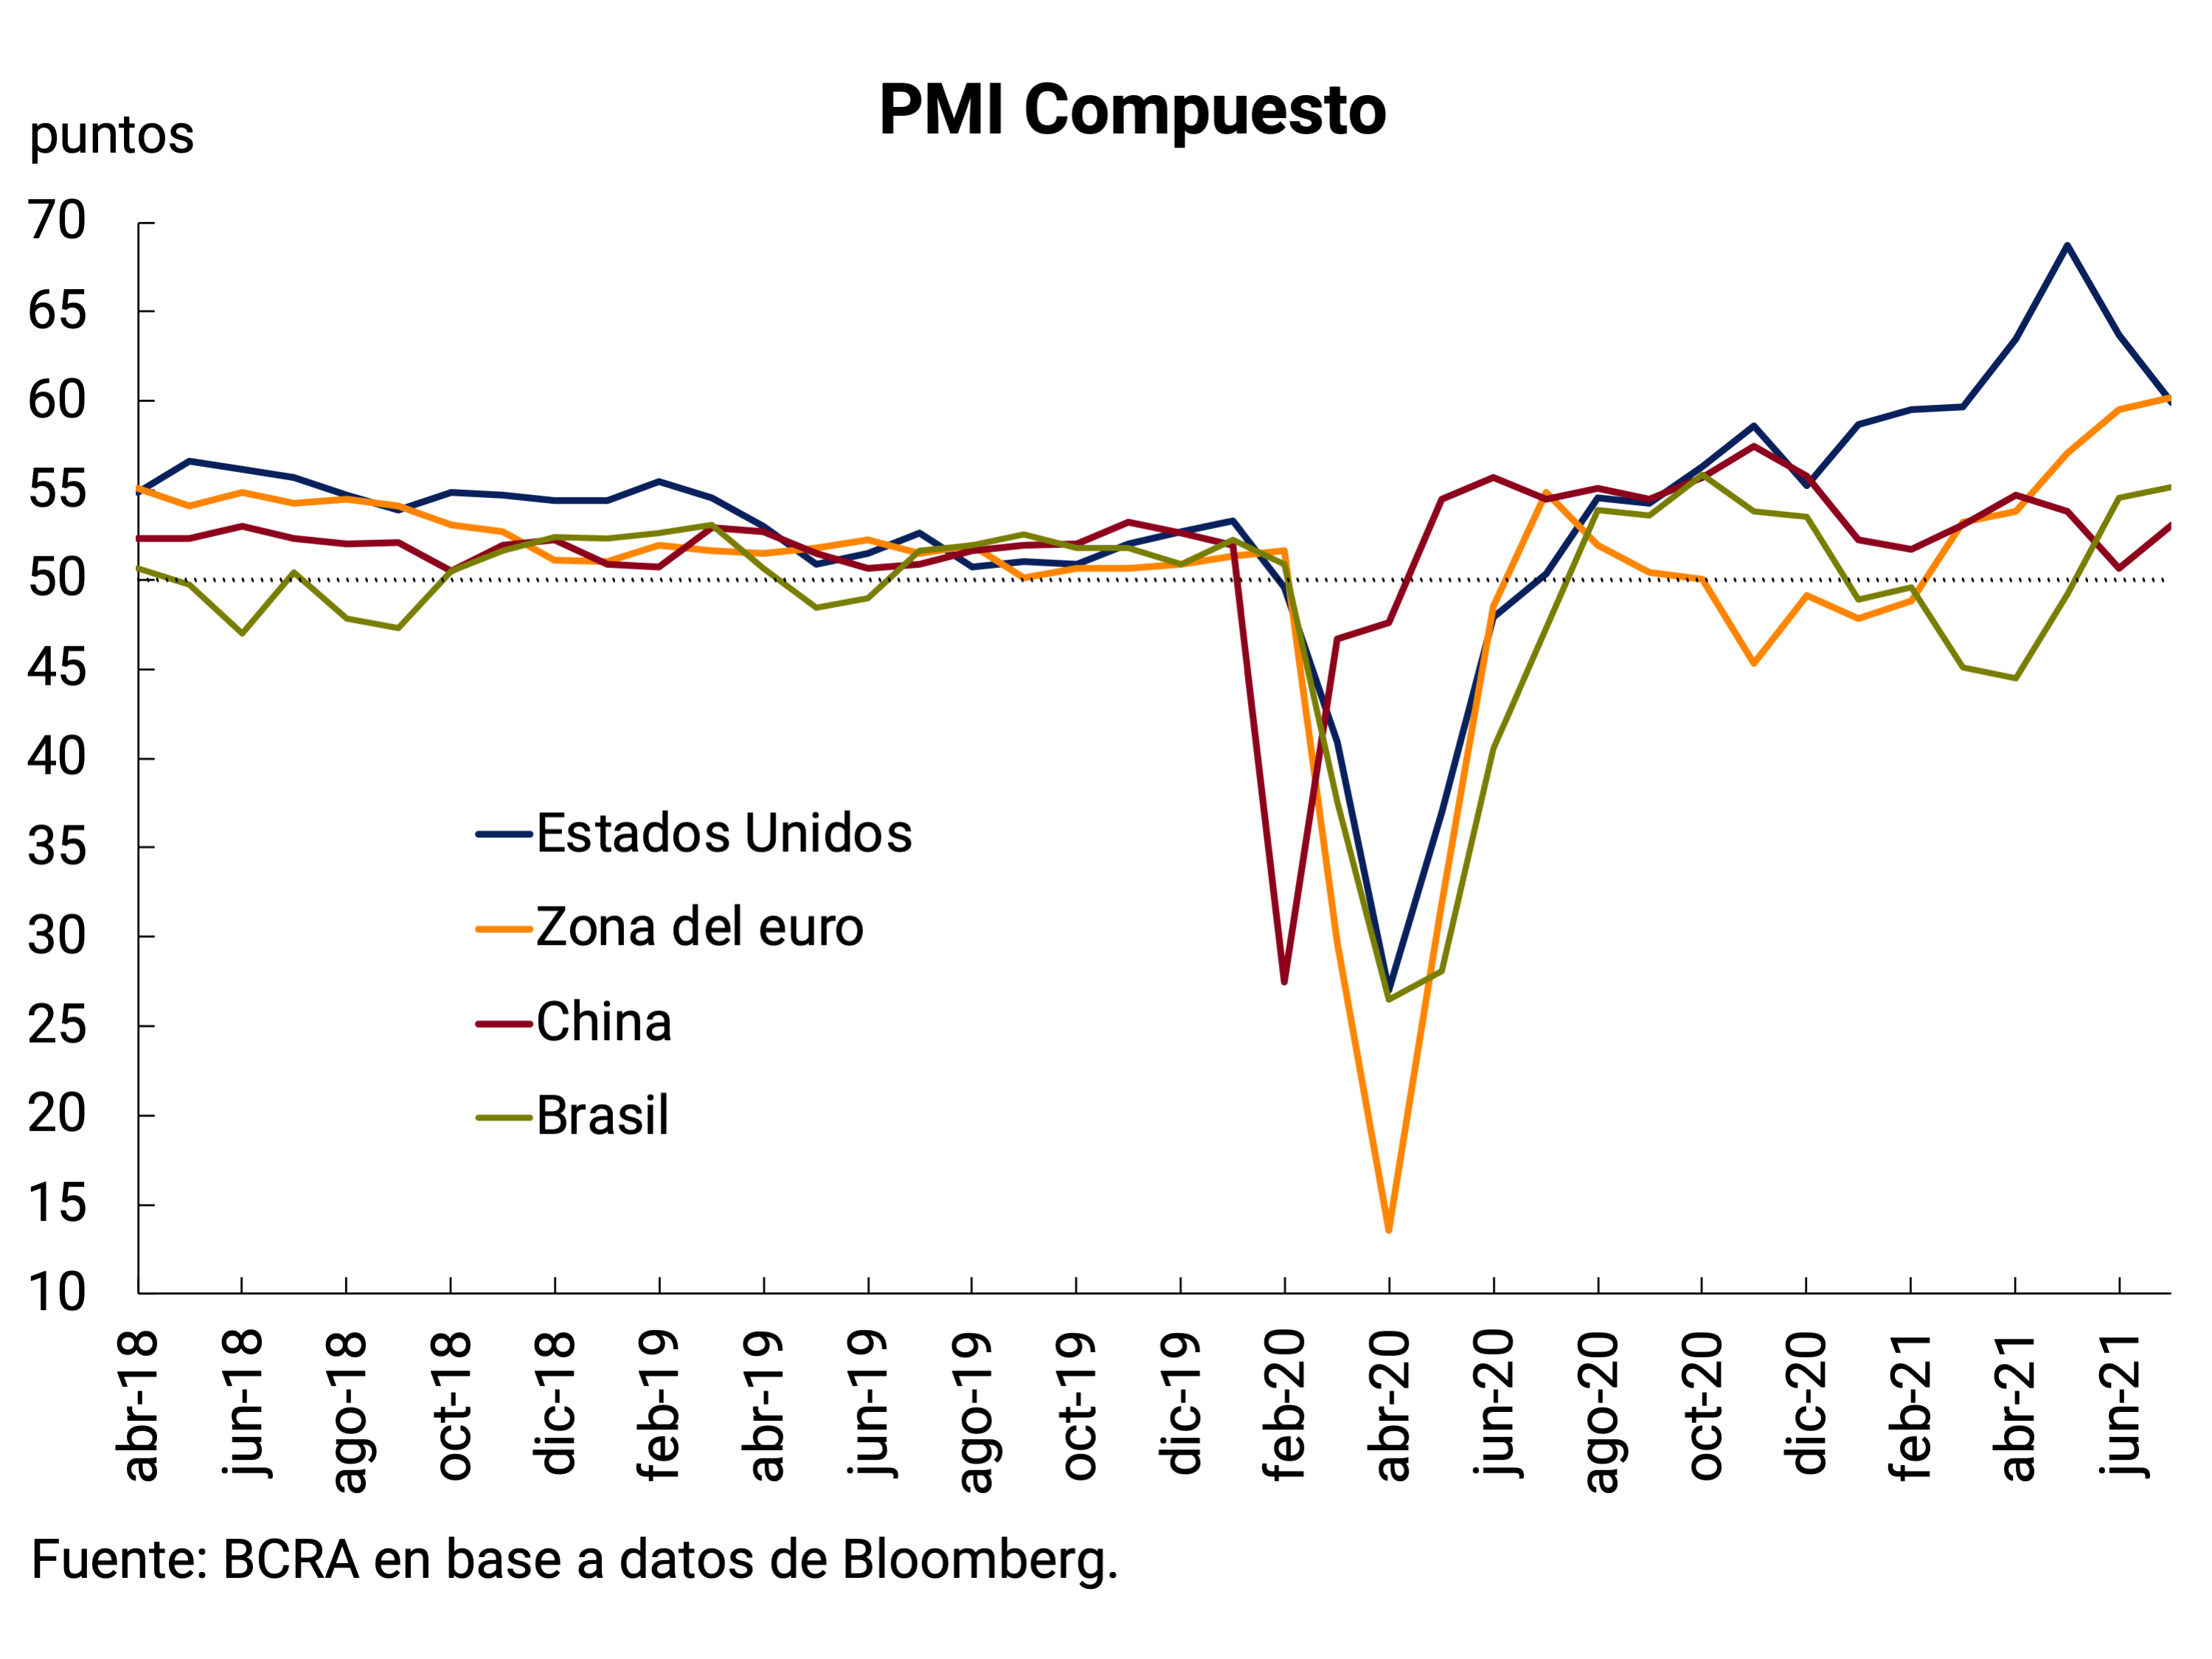
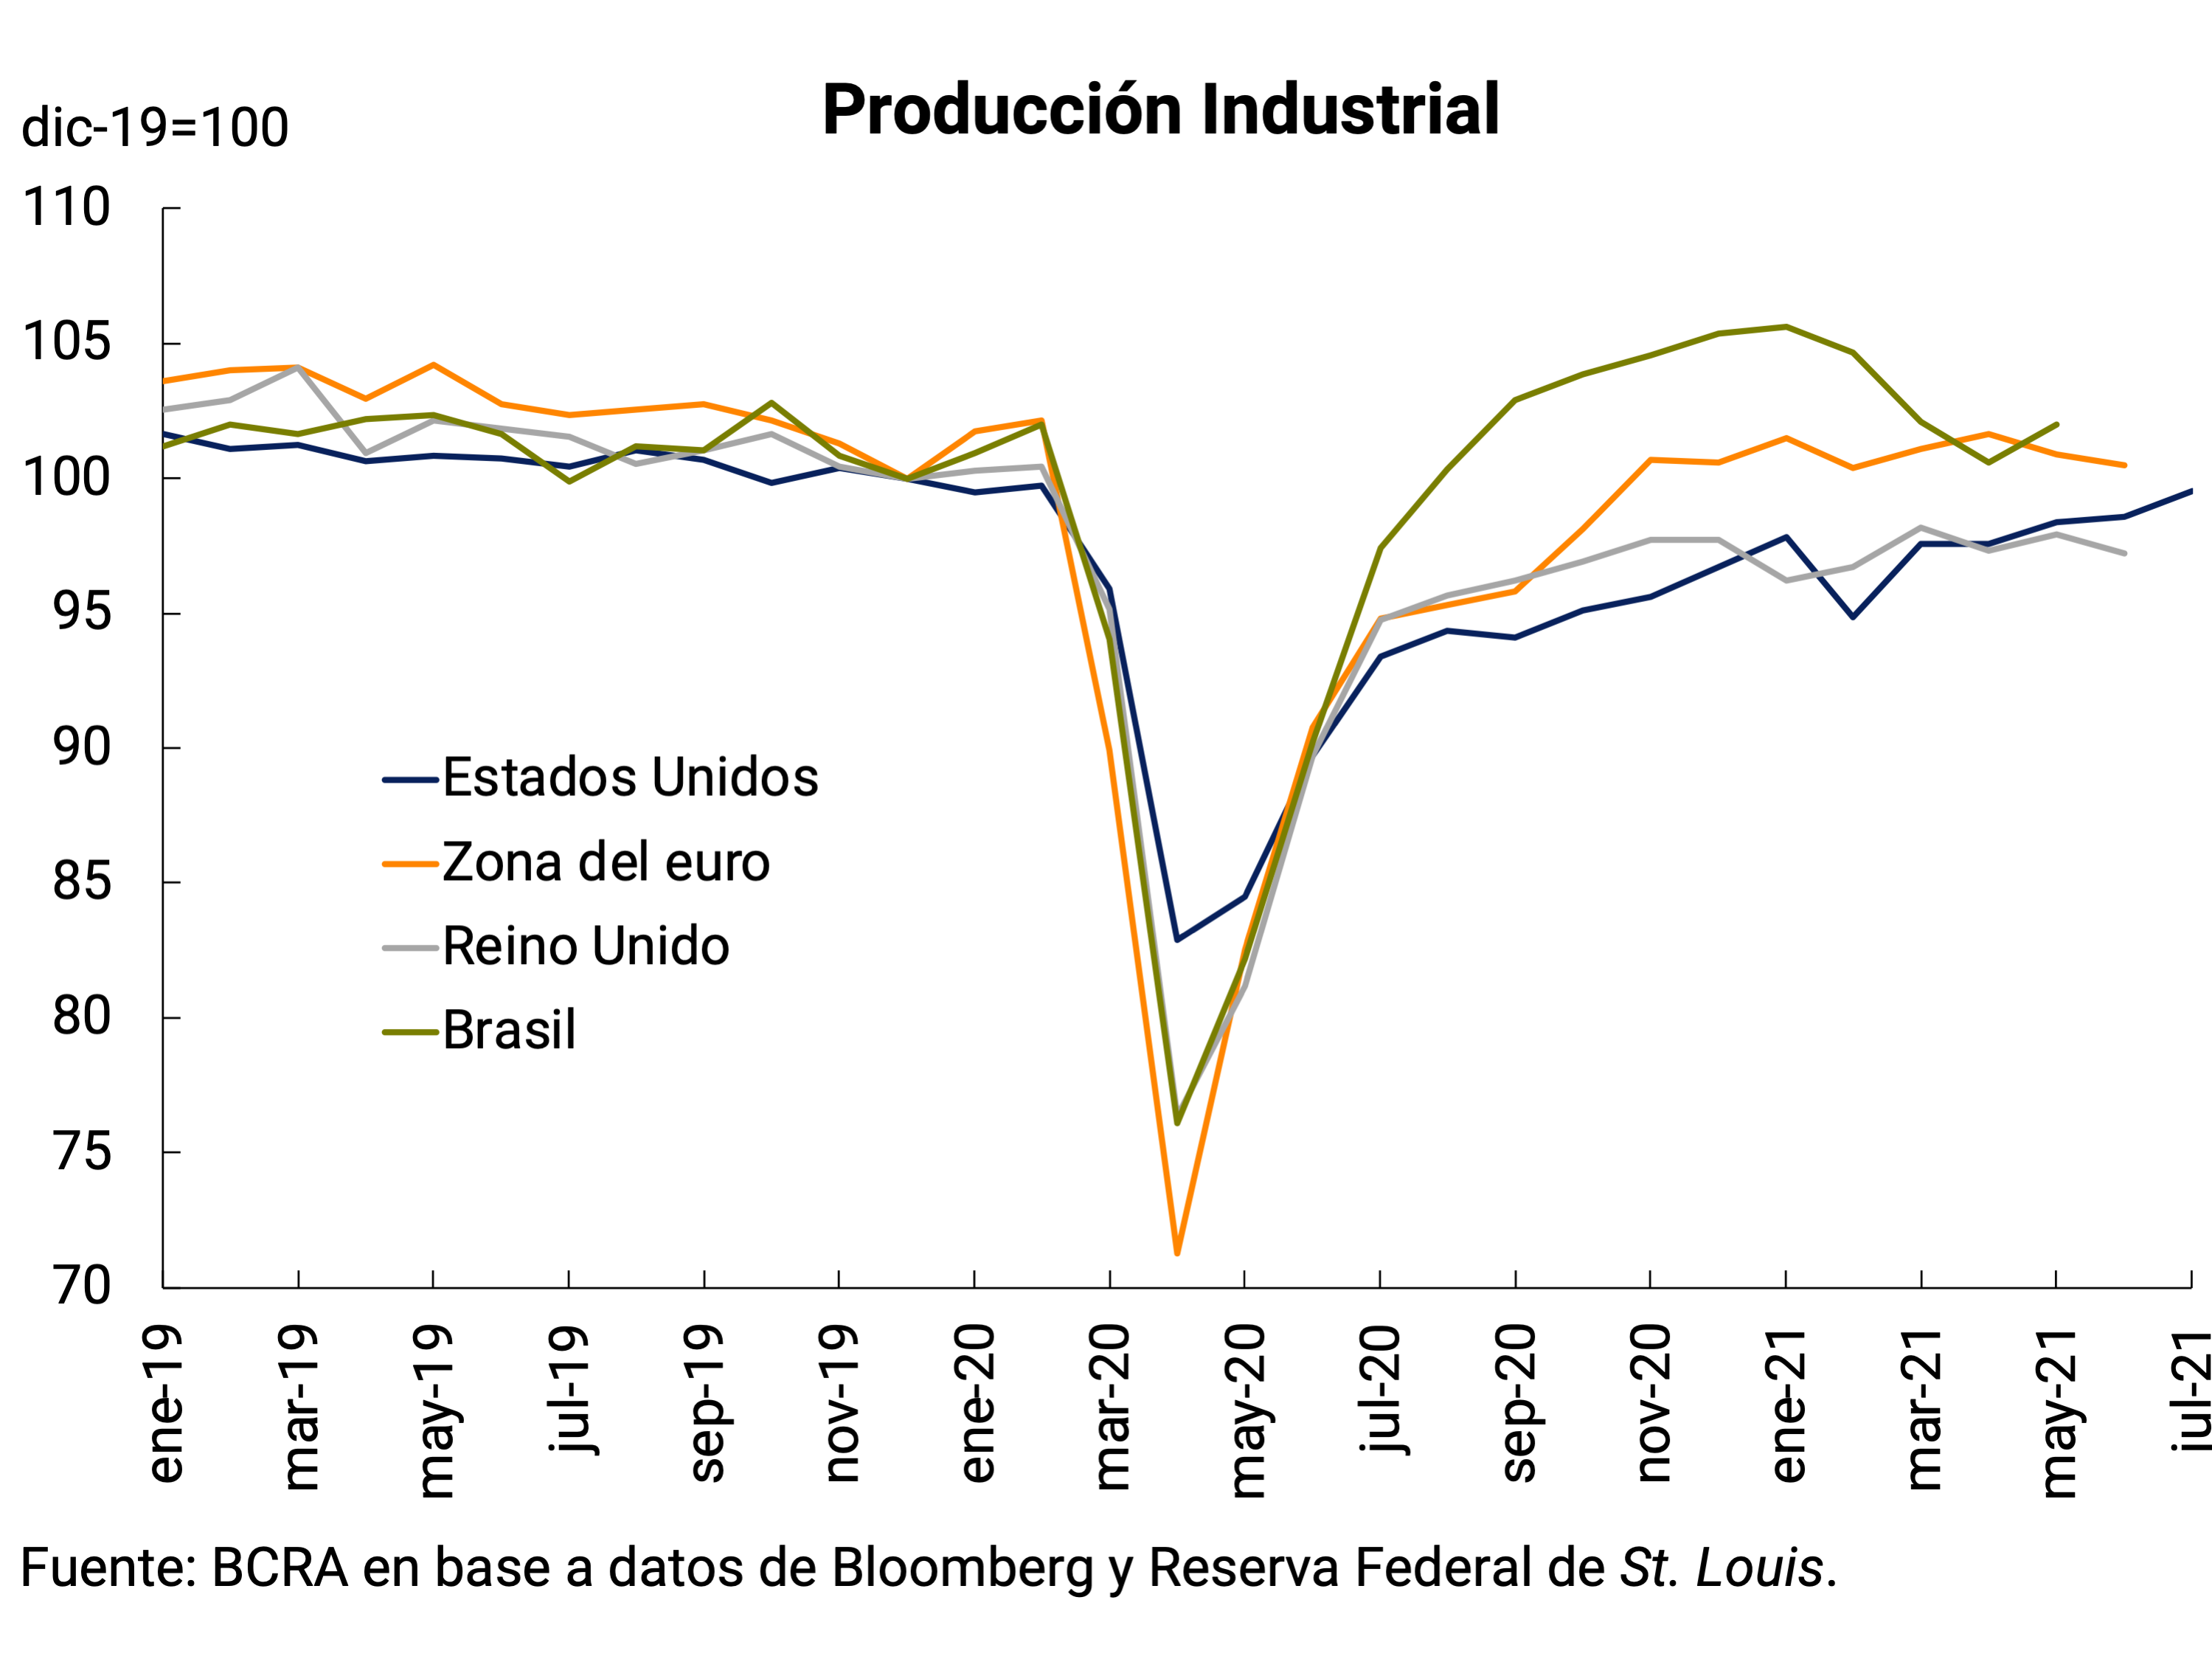
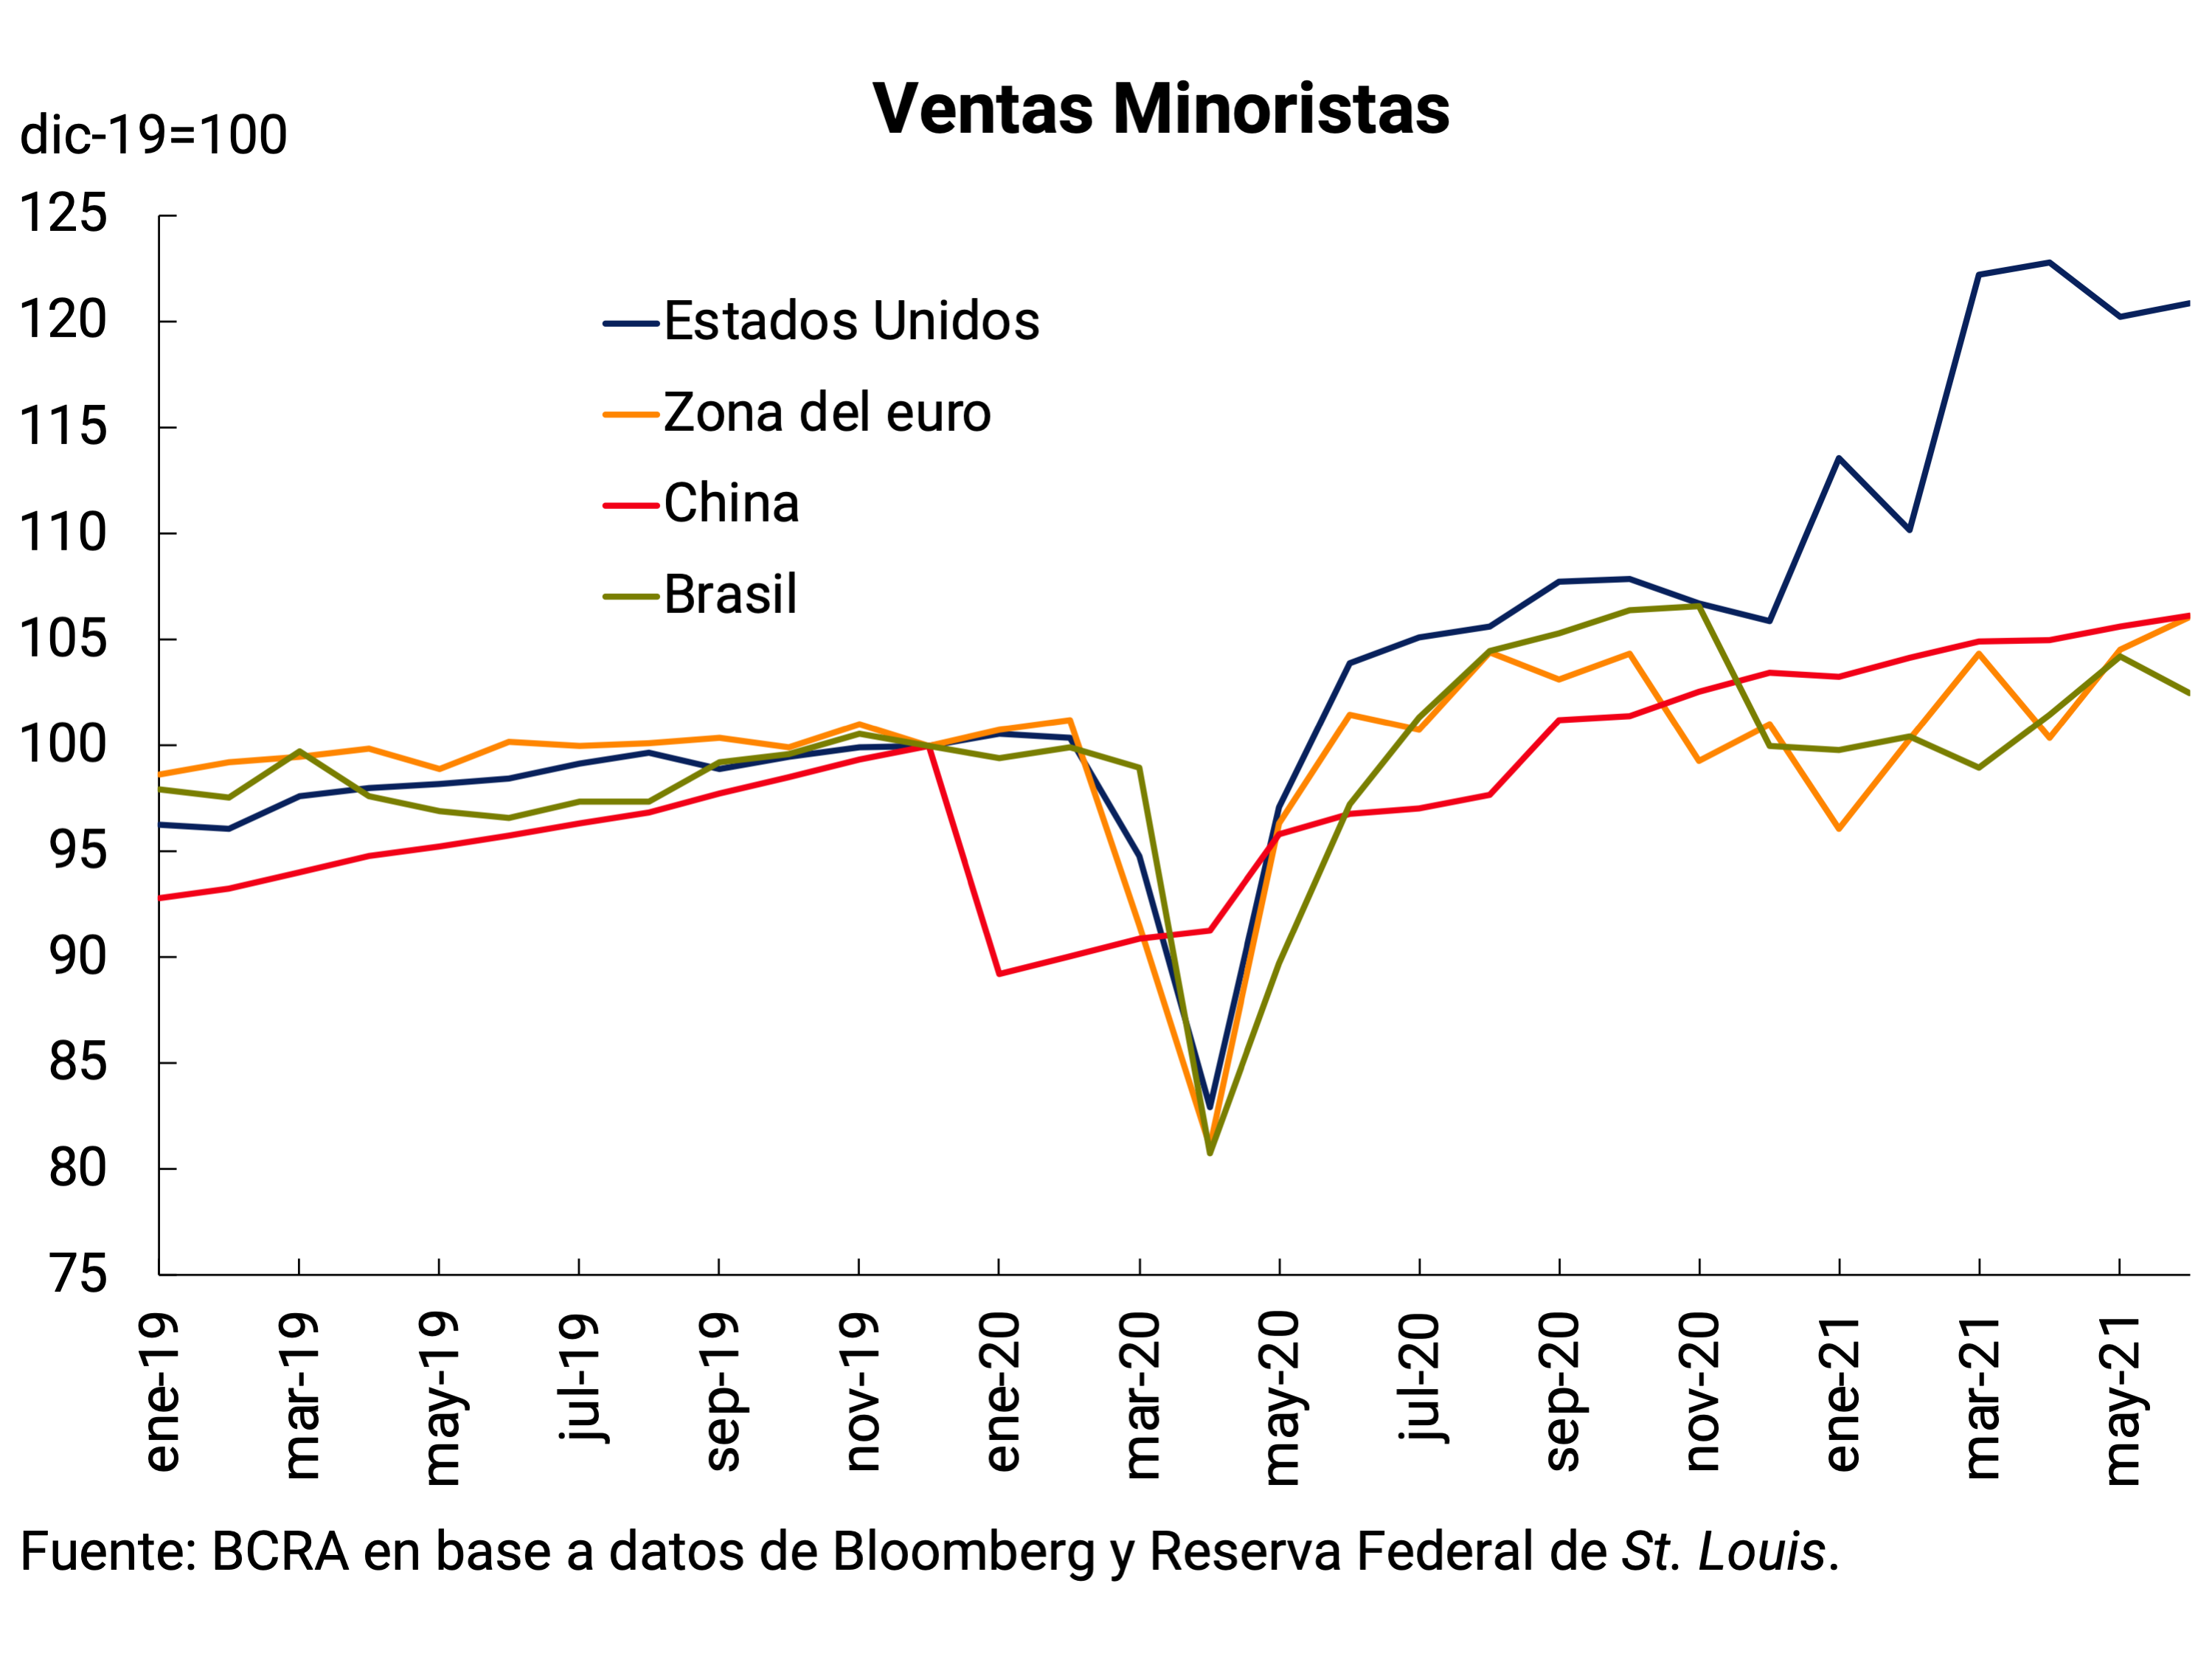
High-frequency data and some forward-looking indicators point to a continued recovery in global activity. In May and June, the global purchasing managers’ indicator (PMI) marked twelve consecutive months in expansionary territory (above 50) and was at the highest levels in the last fifteen years. The services sector showed a better performance than manufacturing in recent months in the face of the reopenings that were registered in several countries, and which allowed the recovery of close contact services (linked to tourism and leisure, for example). The United States and Europe showed greater dynamism in recent months with higher PMI levels compared to emerging economies. The continuation of the global recovery in recent months could also be seen in the indicators of industrial production and retail sales (see Figure 2.6).
Figure 2.6 | Activity indicators
The latest forecasts also agree that the recovery would continue (see Table 2.1). The International Monetary Fund expects the world economy to grow 6% in 2021 and raised growth in 2022 to 4.9%. However, the divergence in recovery between groups of countries would be accentuated. On the one hand, the GDP growth projection was increased for advanced economies (+0.5 p.p. for 2021 and +0.8 p.p. for 2022). In this group, the performance of the United States stands out, with an expected growth of 7% for this year and 4.9% for next year. The sharp upward revision (+0.6 p.p. and +1.4 p.p., respectively) responds to the new medium-term fiscal stimulus plans promoted by the U.S. government. However, for developing economies (emerging and low-income countries) the growth forecast was lowered in 2021 and revised slightly upwards in 2022 (-0.4 p.p. and +0.2 p.p., respectively), mainly due to a lower expected performance for the economies of Asia (China, India and Southeast Asia). Developing economies would generally take longer than advanced economies to reach the growth path projected before the pandemic, due to less policy space and greater difficulties in accessing vaccines, which would create wider gaps between these countries’ living standards (see Figure 2.7).
Table 2.1 | Economic projections
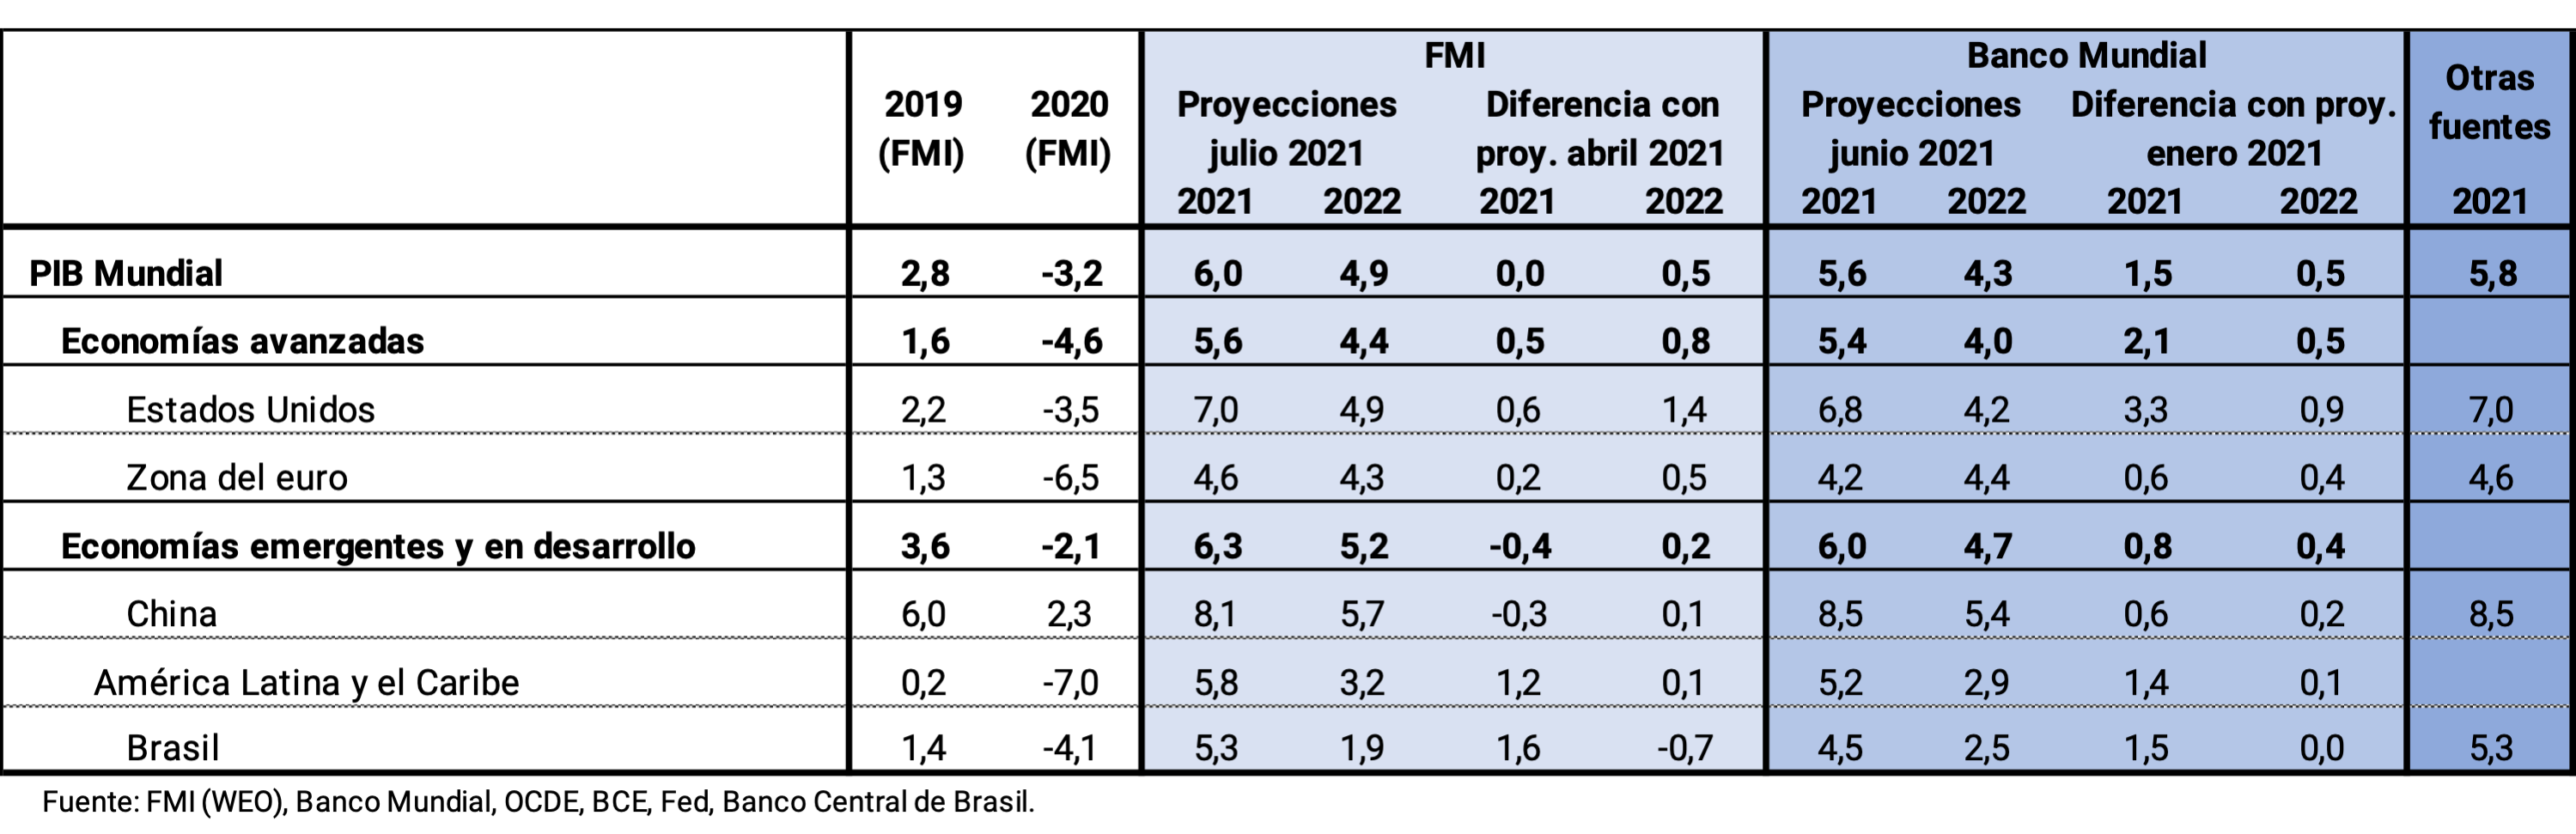
Figure 2.7 | Evolution of GDP compared to pre-pandemic trends
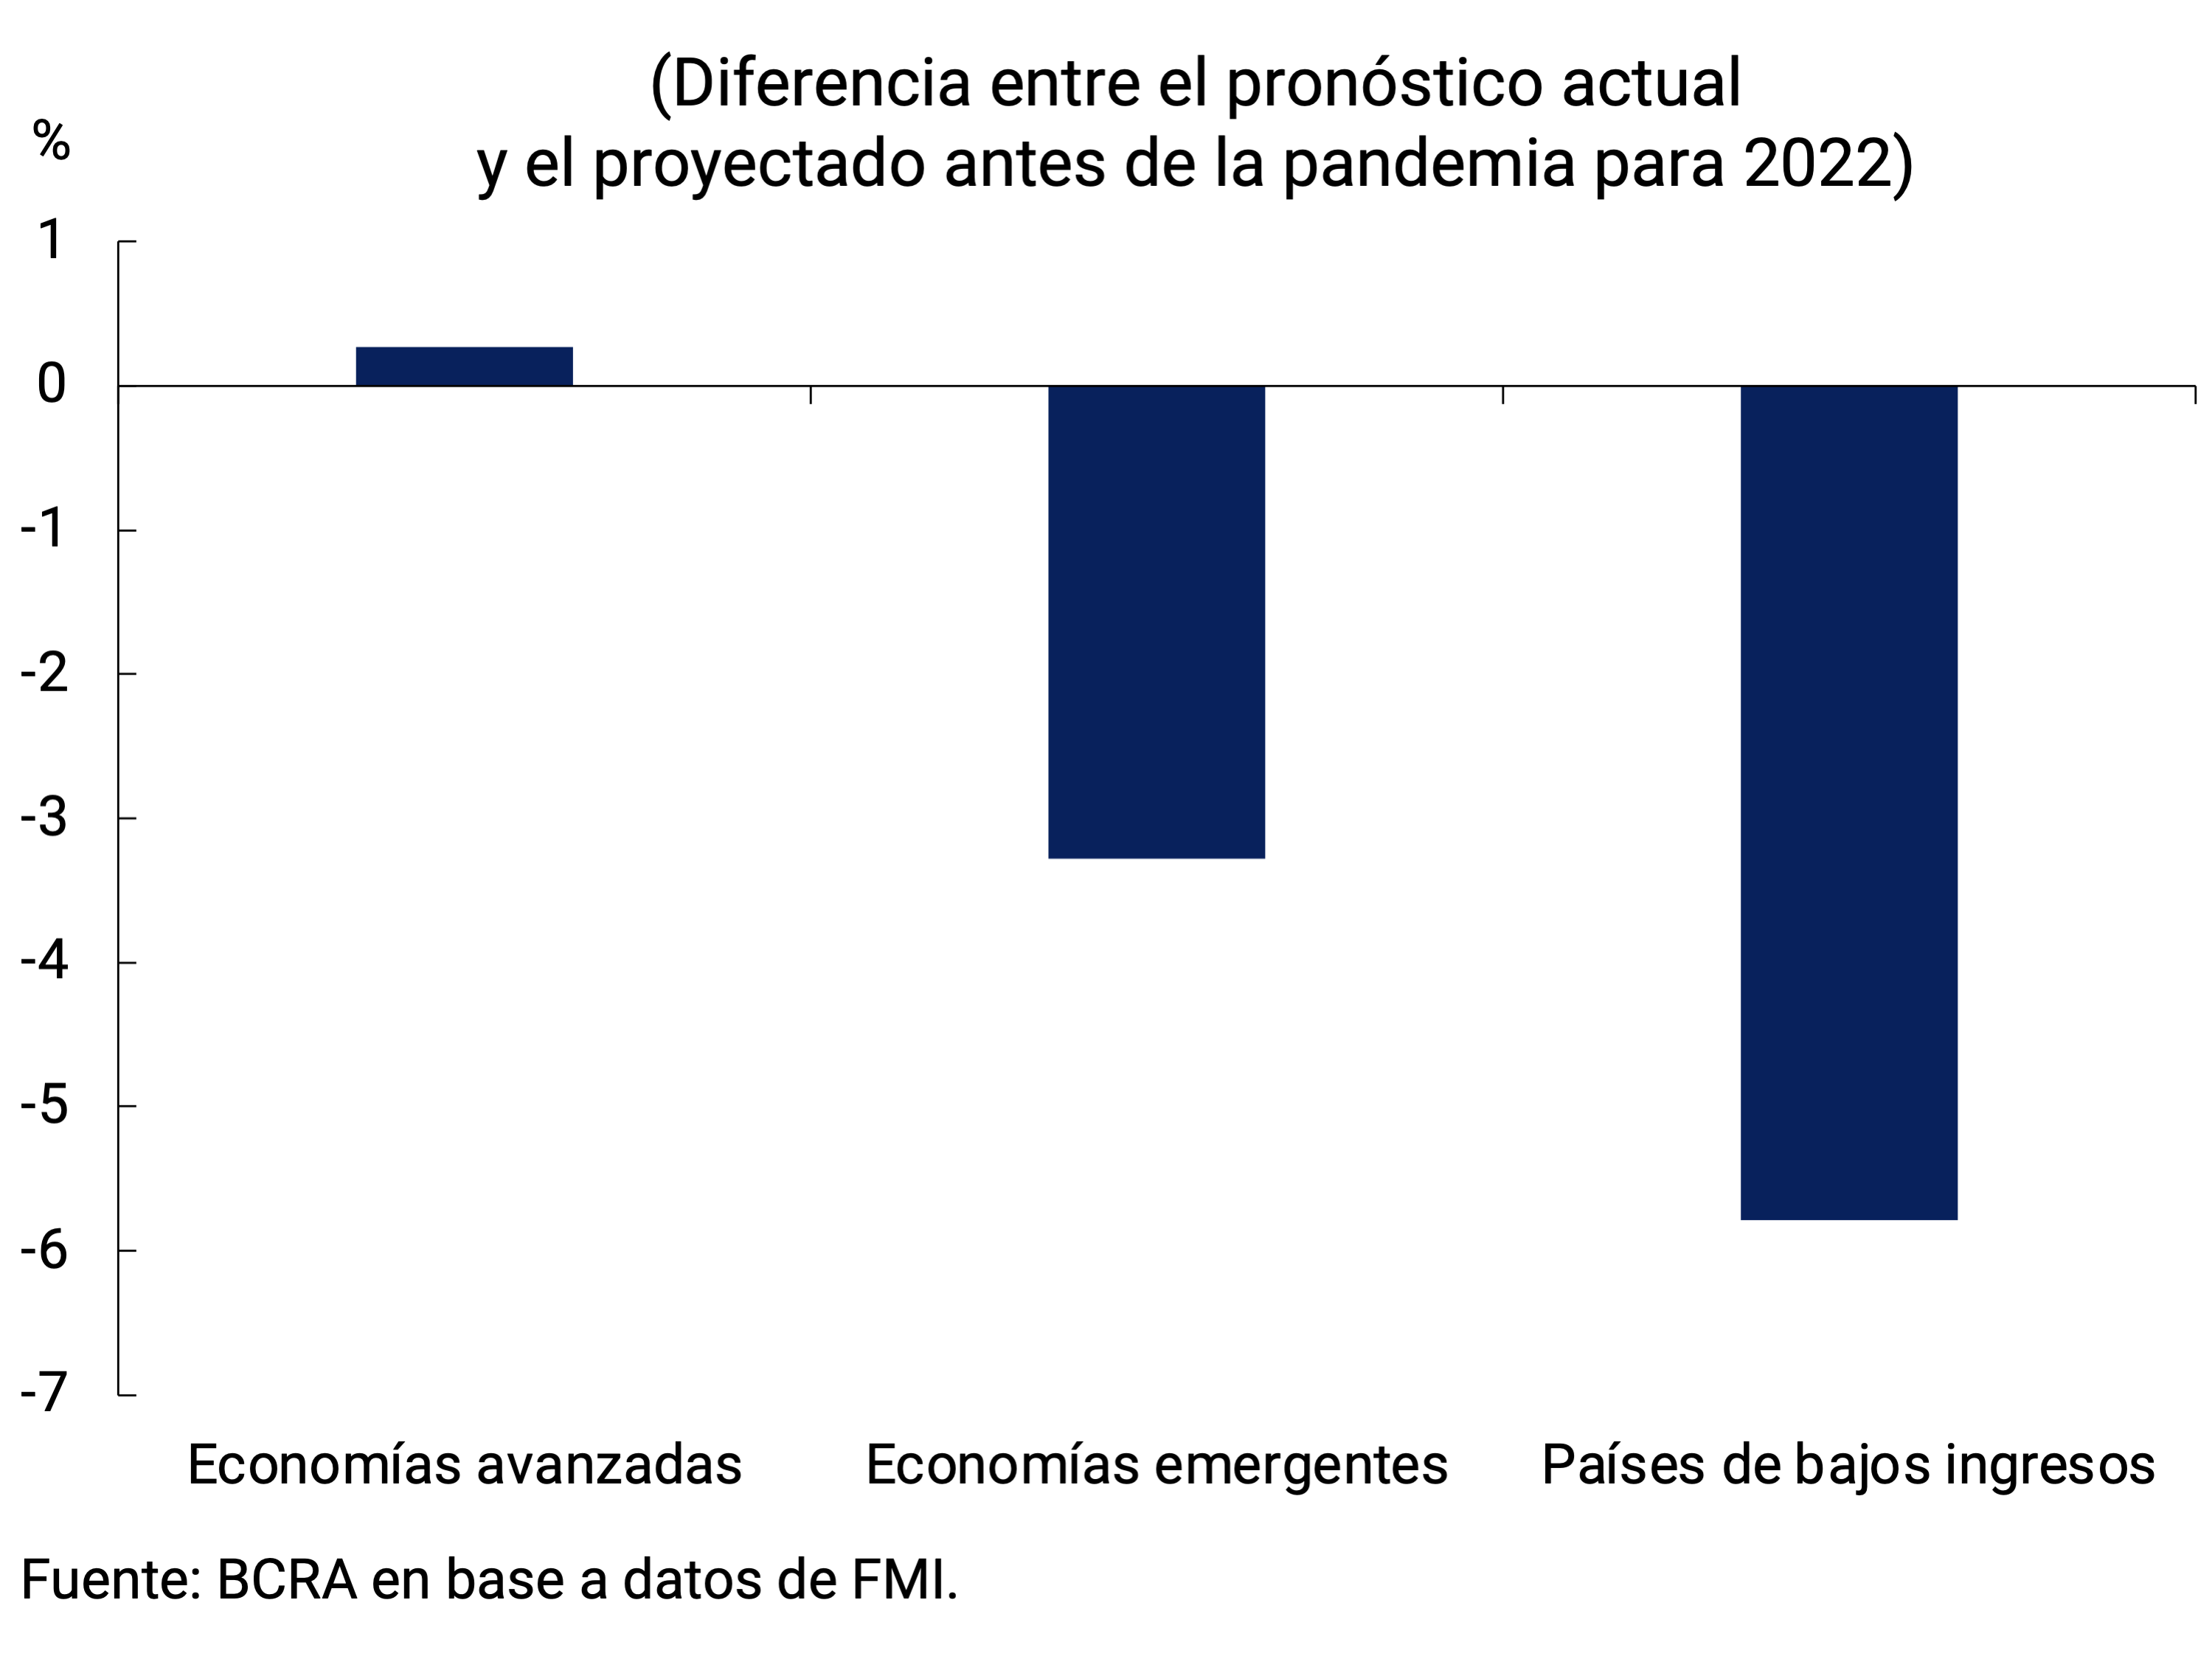
Figure 2.8 | Employment rate of selected
countries % of working-age population
The labour market shows less dynamism in the recovery. The improvement in employment is far from complete, even in places where the level of activity has returned or would be close to reaching pre-pandemic levels. Employment has increased since the peak of the second and third quarters of 2020 but generally remained below pre-pandemic rates (see Figure 2.8).
2.3. Monetary and fiscal policies: the expansionary bias continues, although stimuli are beginning to be withdrawn, especially in developing countries
Monetary policy in advanced countries continued to be expansionary in the last three months, although in some cases “unconventional” measures were reduced. As we anticipated in the previous IPOM, some emerging countries began to take contractionary monetary policy measures (see Figure 2.9). In all cases, inflation has had a clear upward trend, in some cases exceeding the inflation target. In most of the countries analyzed, the monetary authorities estimate that the rise in inflation would be transitory, as reflected in the expectations surveys.
Figure 2.9 | Monetary policy indicators
Policy Interest Rate
Policy interest
rate Var. with respect to Dec-19, in p.p.
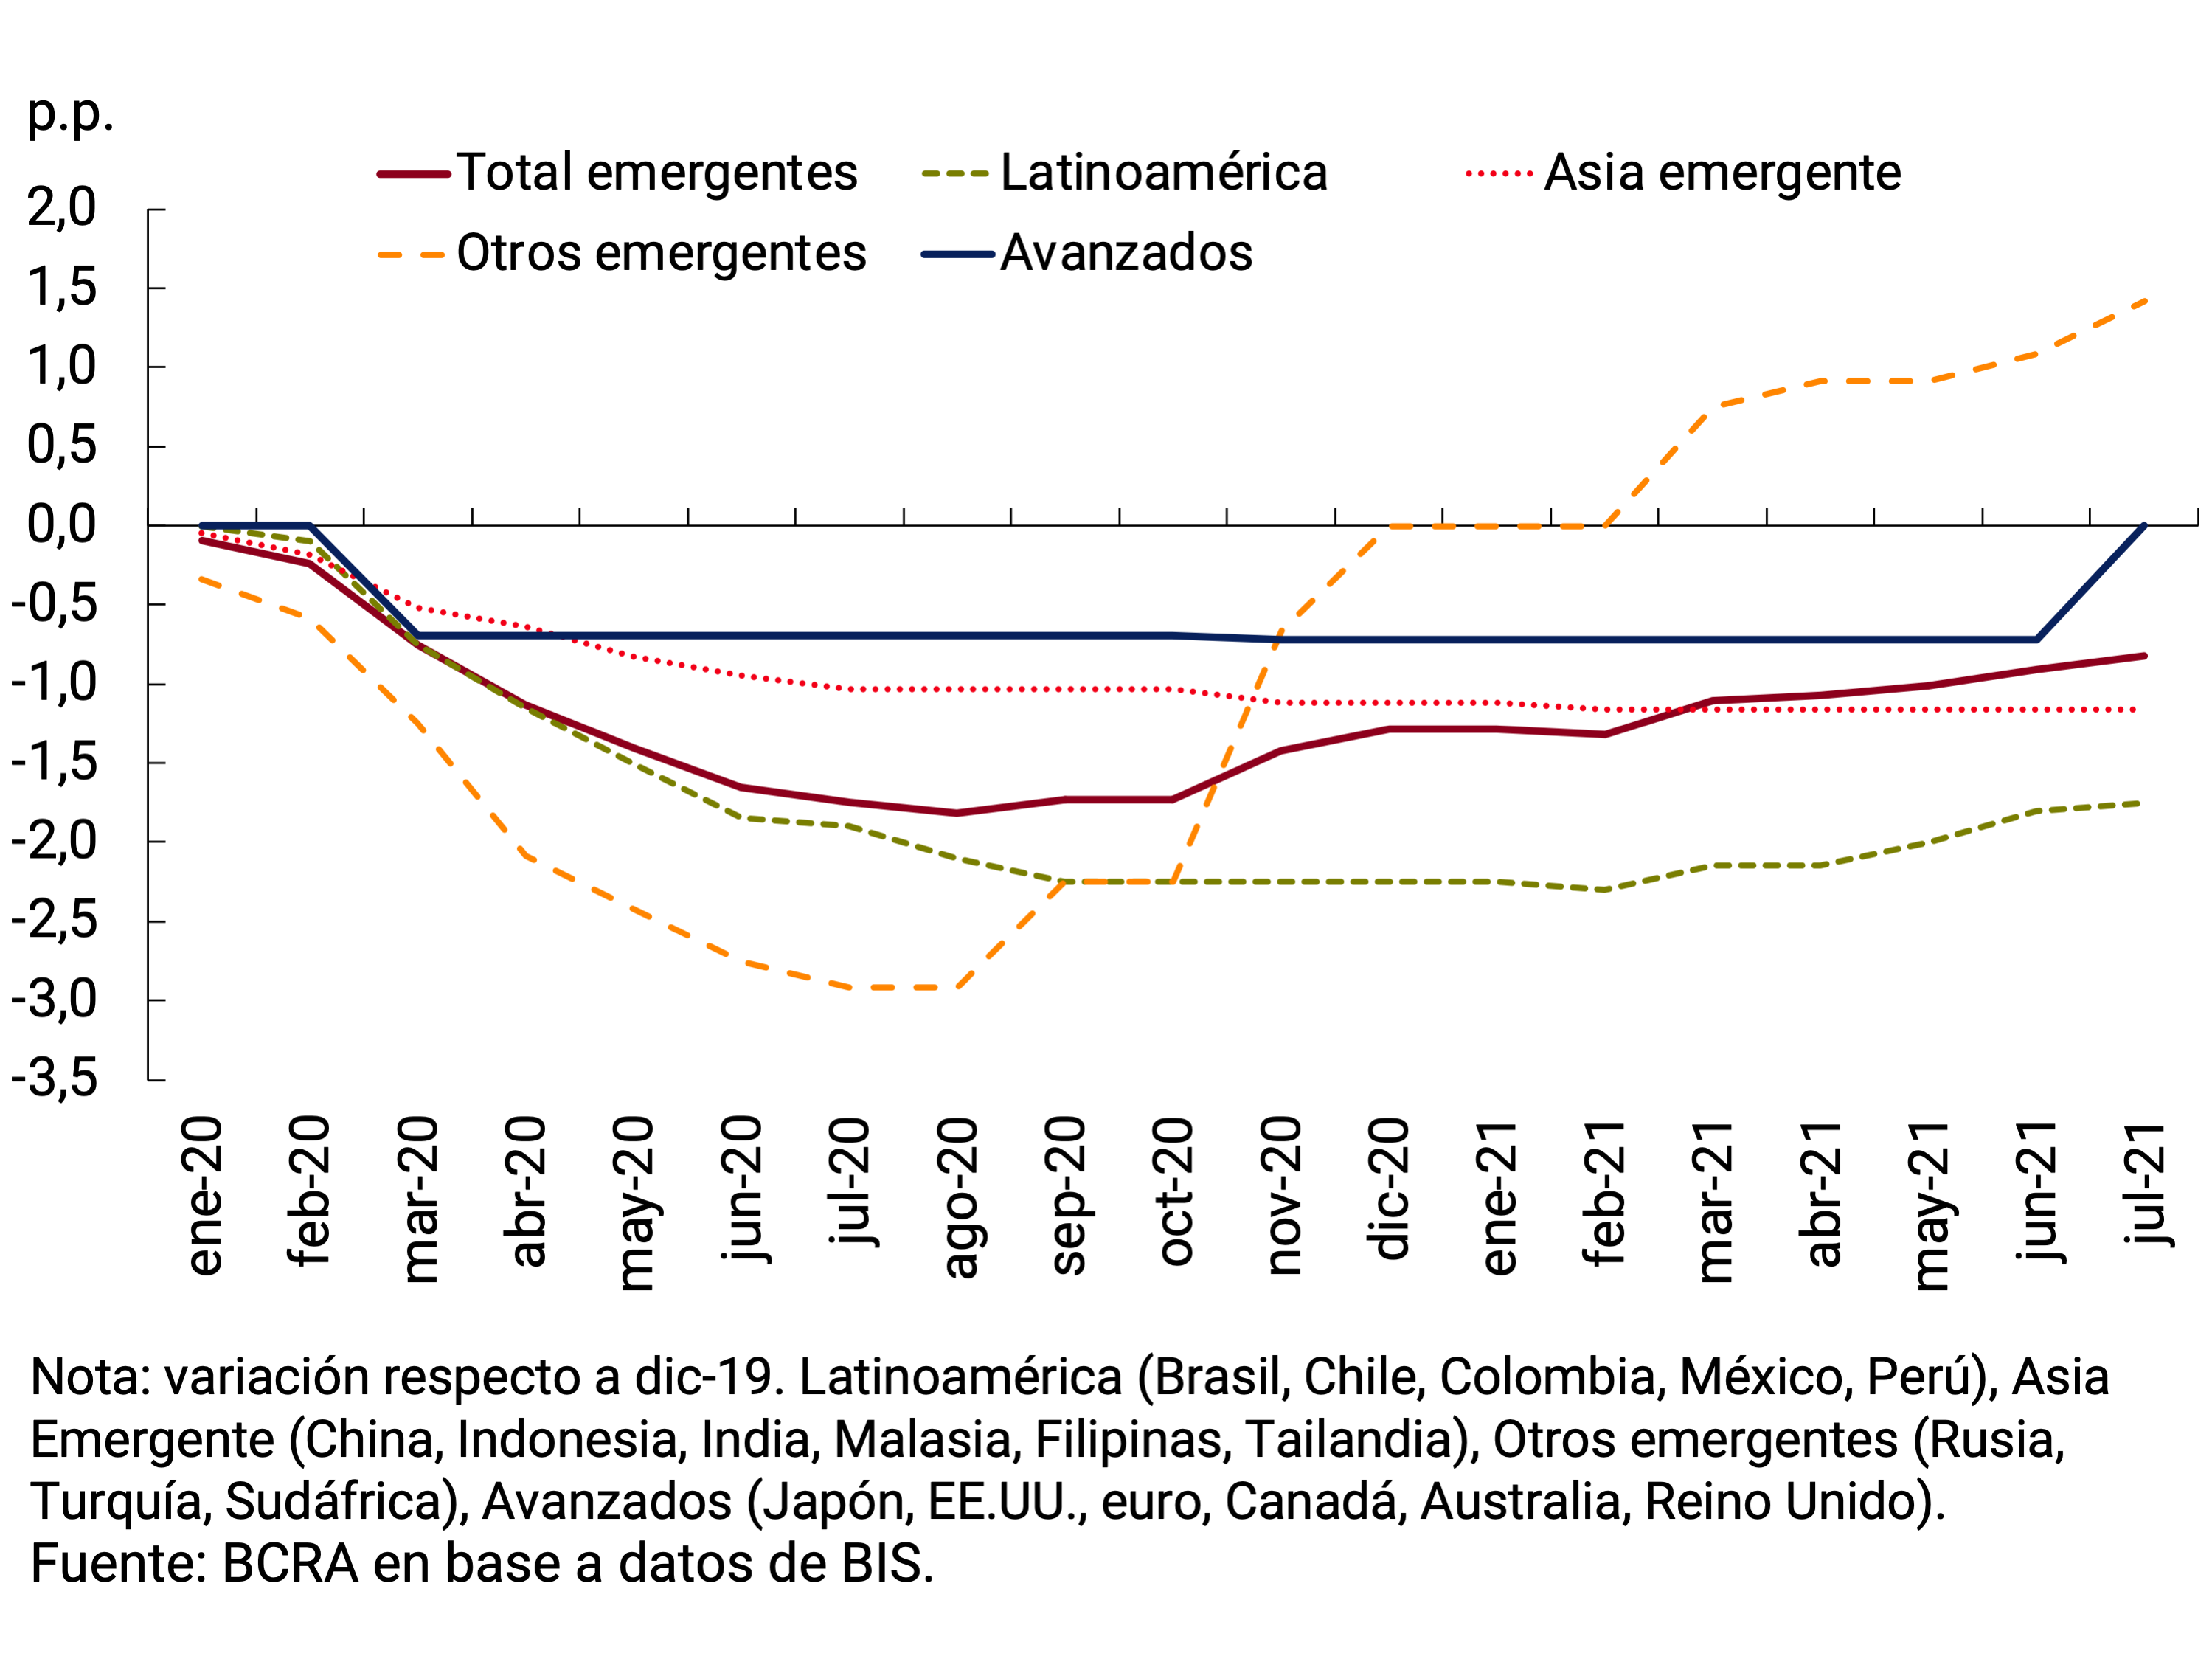
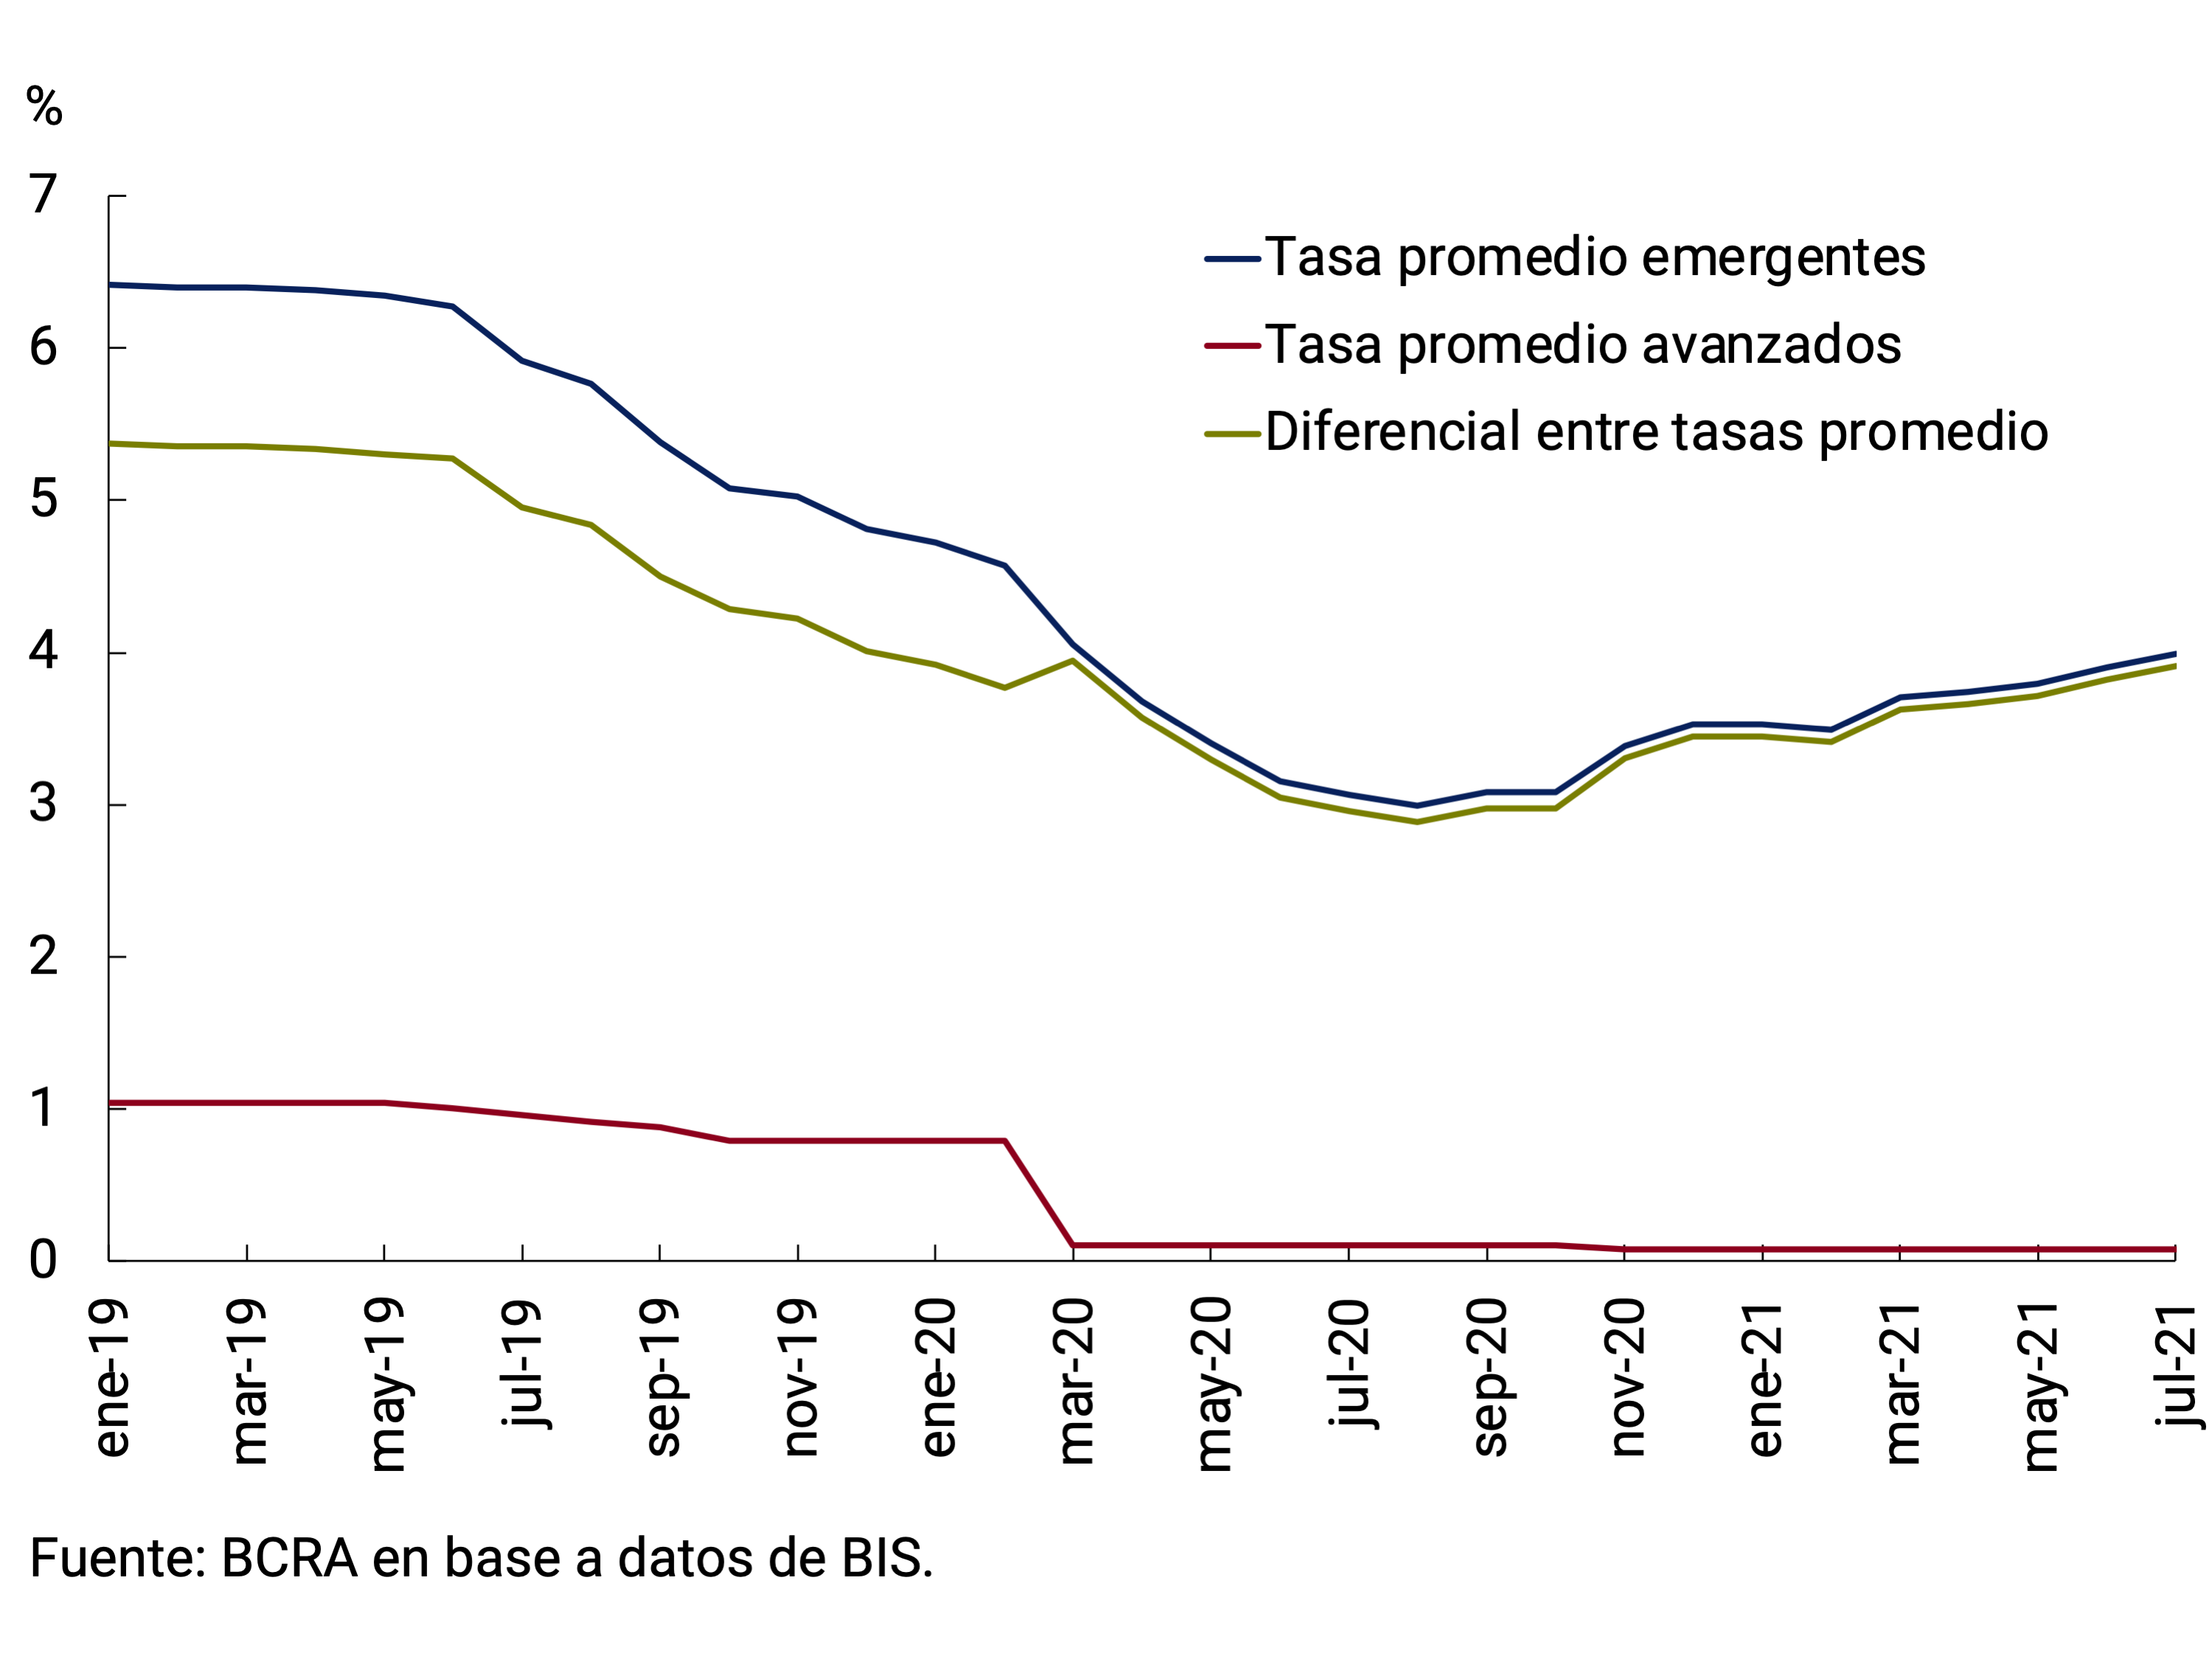
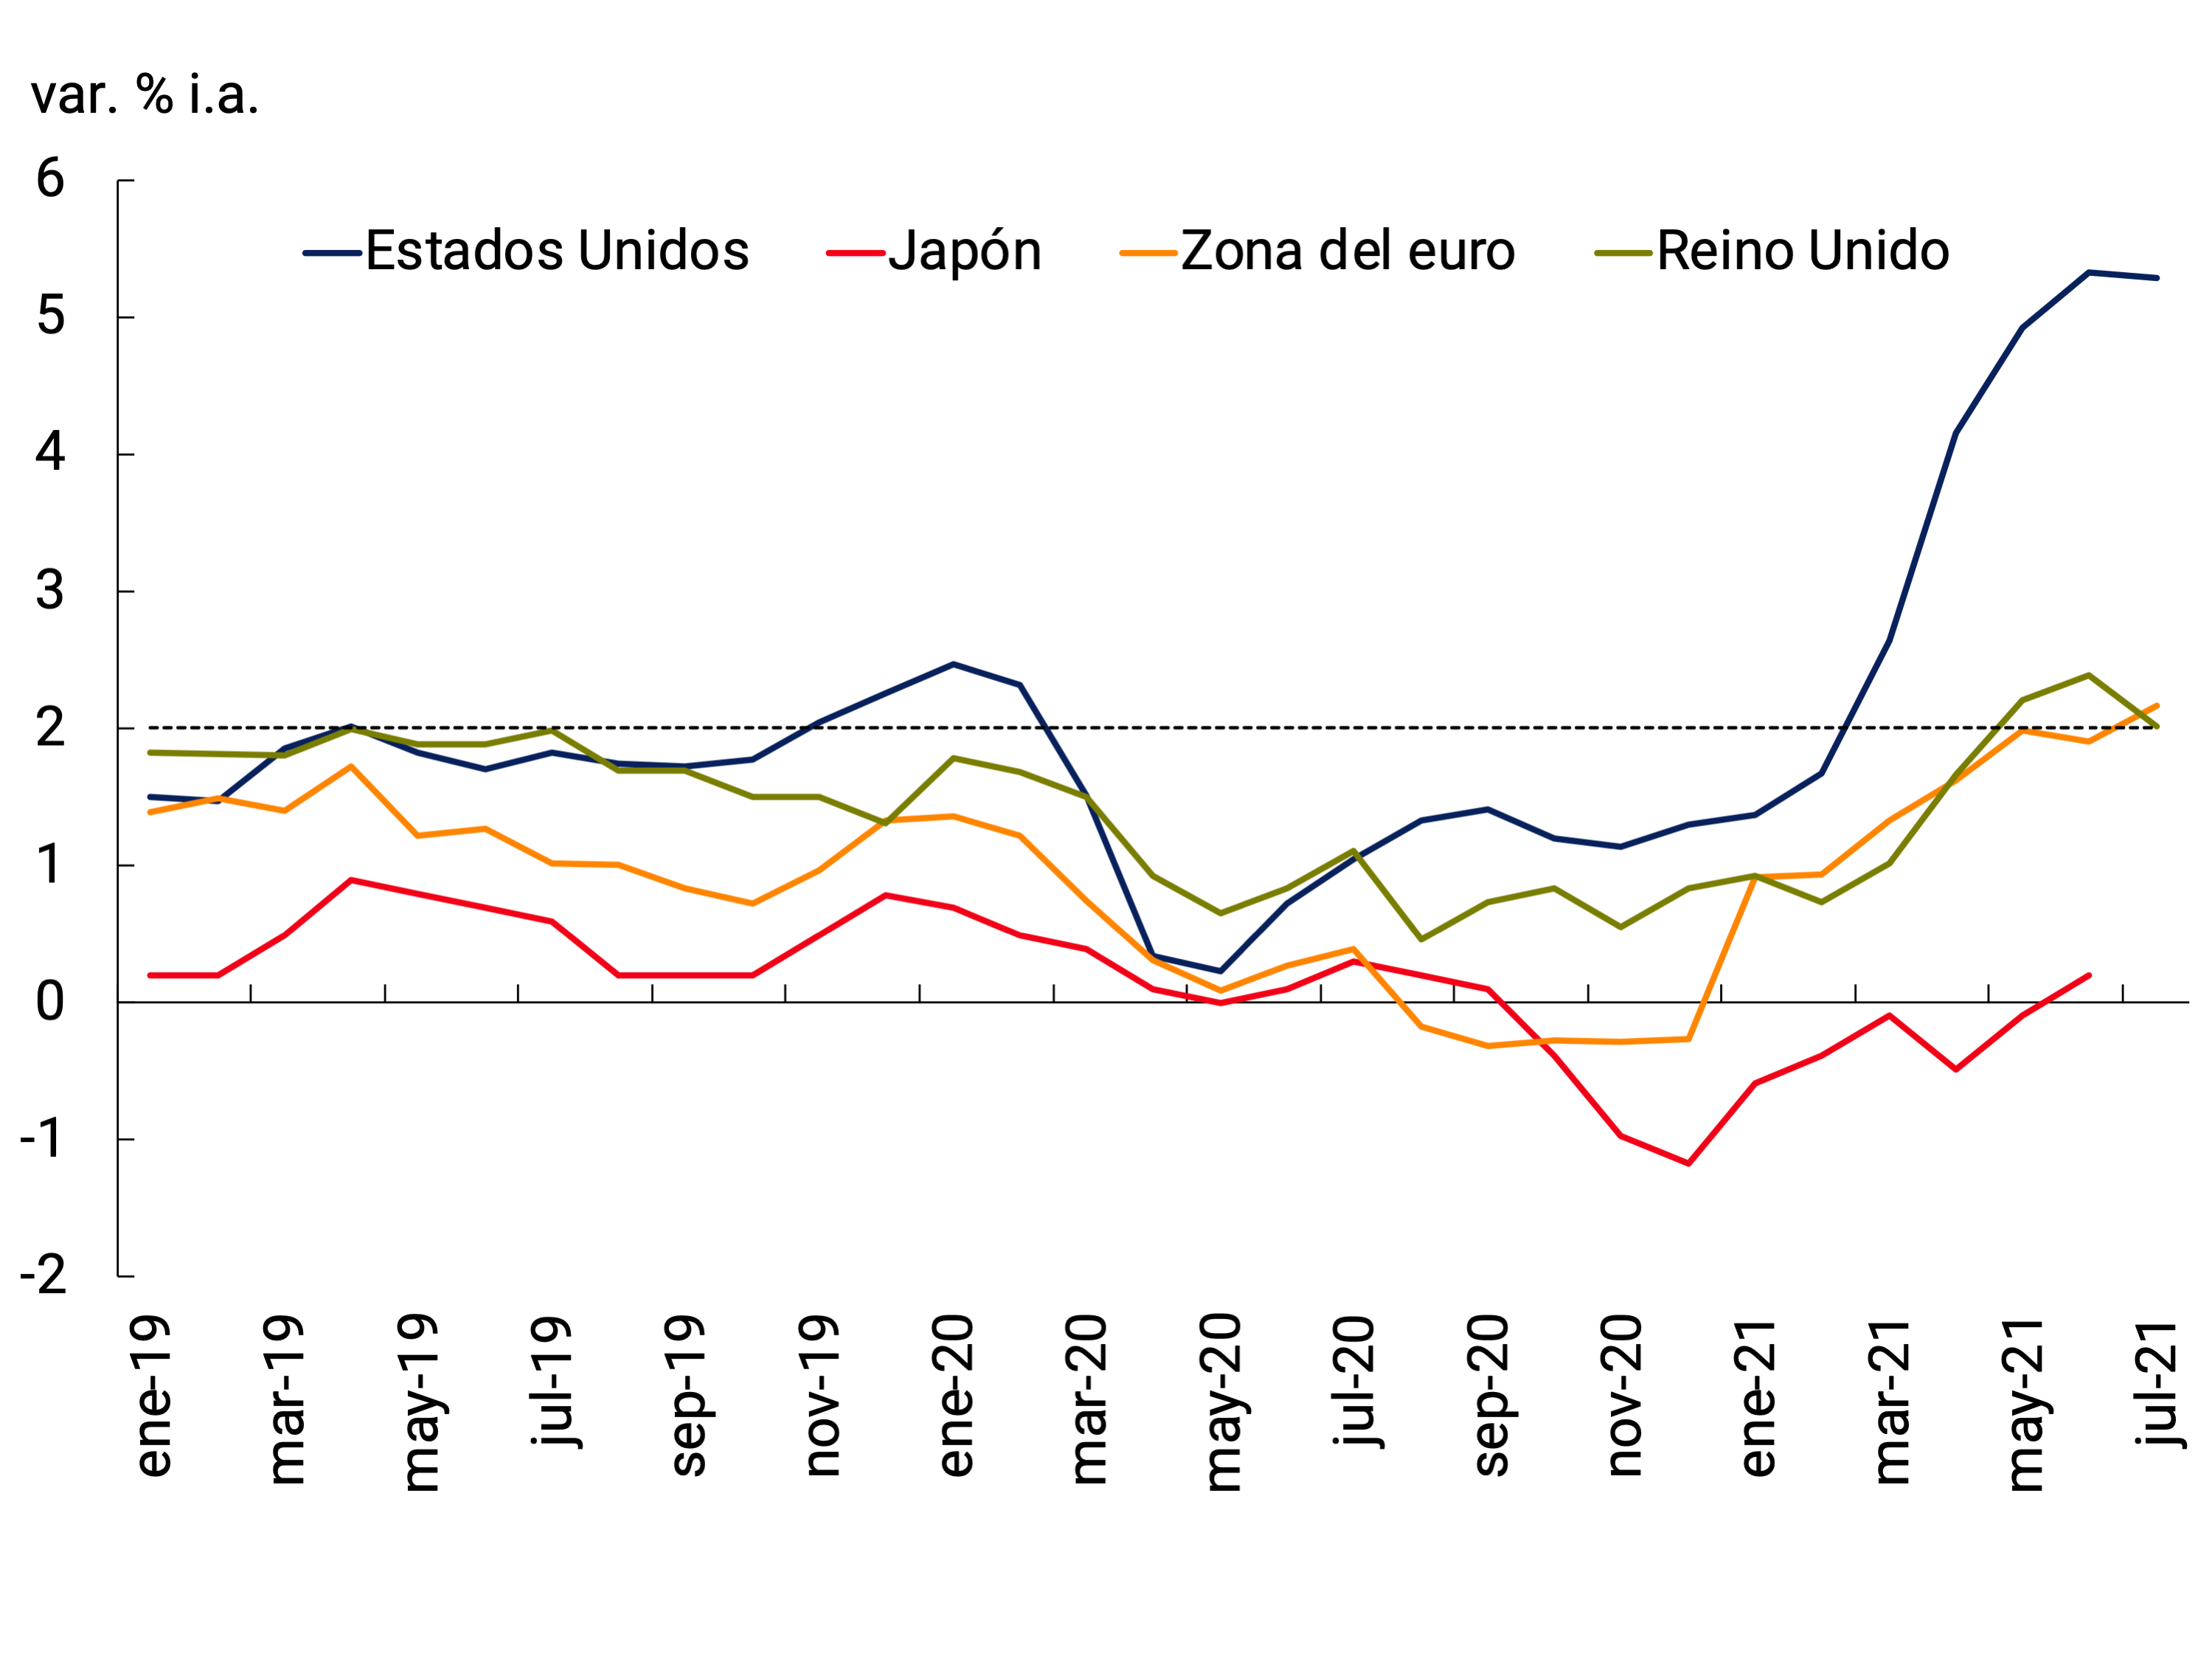
Central banks in advanced economies have kept their benchmark interest rates unchanged in recent months. The largest economies (the United States, the euro area, Japan, and the United Kingdom) also did not change their unconventional monetary policy programs, while countries such as Australia and Canada began to reduce them. In particular, the Federal Reserve of the United States (Fed) would announce in the second half of 2021 the reduction of its asset purchase program of US$120,000 thousand per month, which would become effective by the end of the year. (according to the minutes of the last meeting of the Open Market Committee, FOMC). In addition, FOMC members’ projections anticipated the likely date of its benchmark interest rate hike to 2023 (from 2024). For its part, within the framework of its new monetary policy strategy3 , the European Central Bank (ECB) would keep its quantitative easing program unchanged at least during 2021.
Figure 2.10 | Inflation rates and targets
Developed countries
Emerging countries
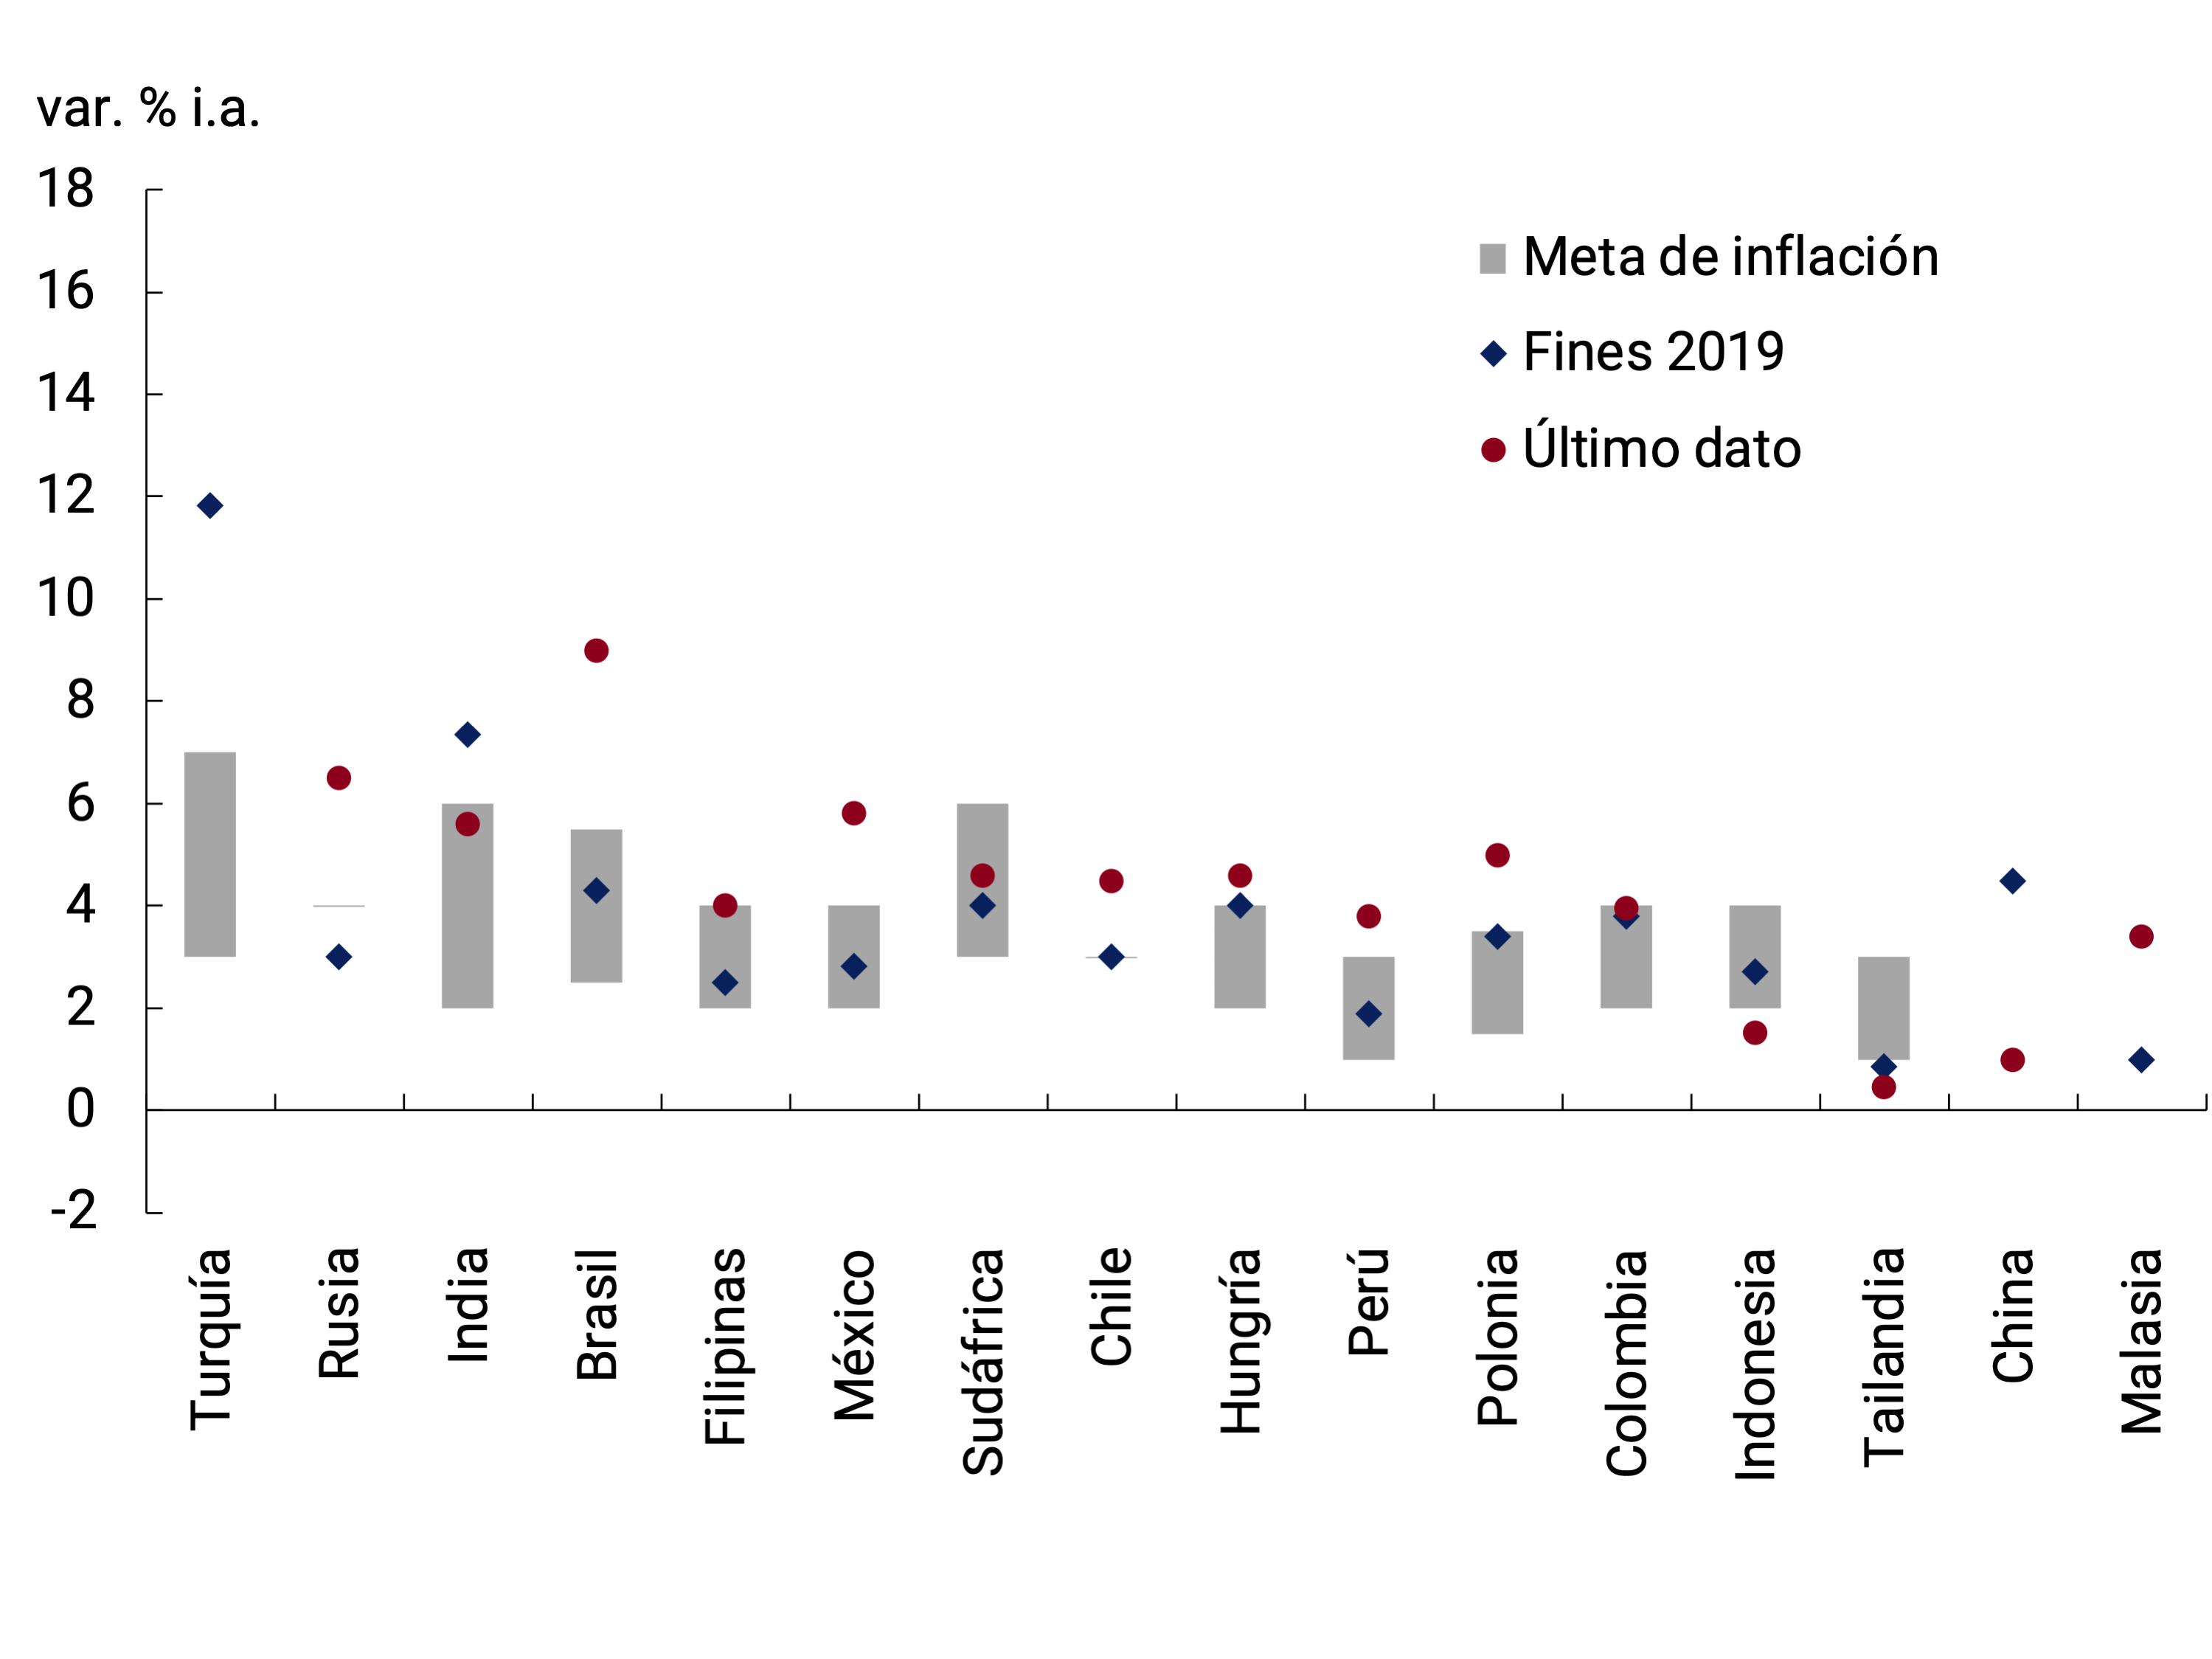
Some emerging countries began to raise their monetary policy interest rates. Brazil increased it by +1.75 p.p. since the last IPOM) due, among other factors, to the fact that inflation accelerated to 9% y.o.y. in July after several months of increase, above the target (2.25-5.25%). Chile’s monetary authority also took contractionary measures through the interest rate (+0.25 p.p. since the last IPOM), due to an inflation rate above the target (4.5% YoY in July and a target of 3%). Other central banks that increased their benchmark interest rates due to inflation above their targets were Mexico and Russia (increases of 0.25 p.p. and 1.5 p.p. since the last IPOM, respectively), while Turkey’s kept it at double-digit levels due to high inflation (see Figure 2.10).
Figure 2.11 |
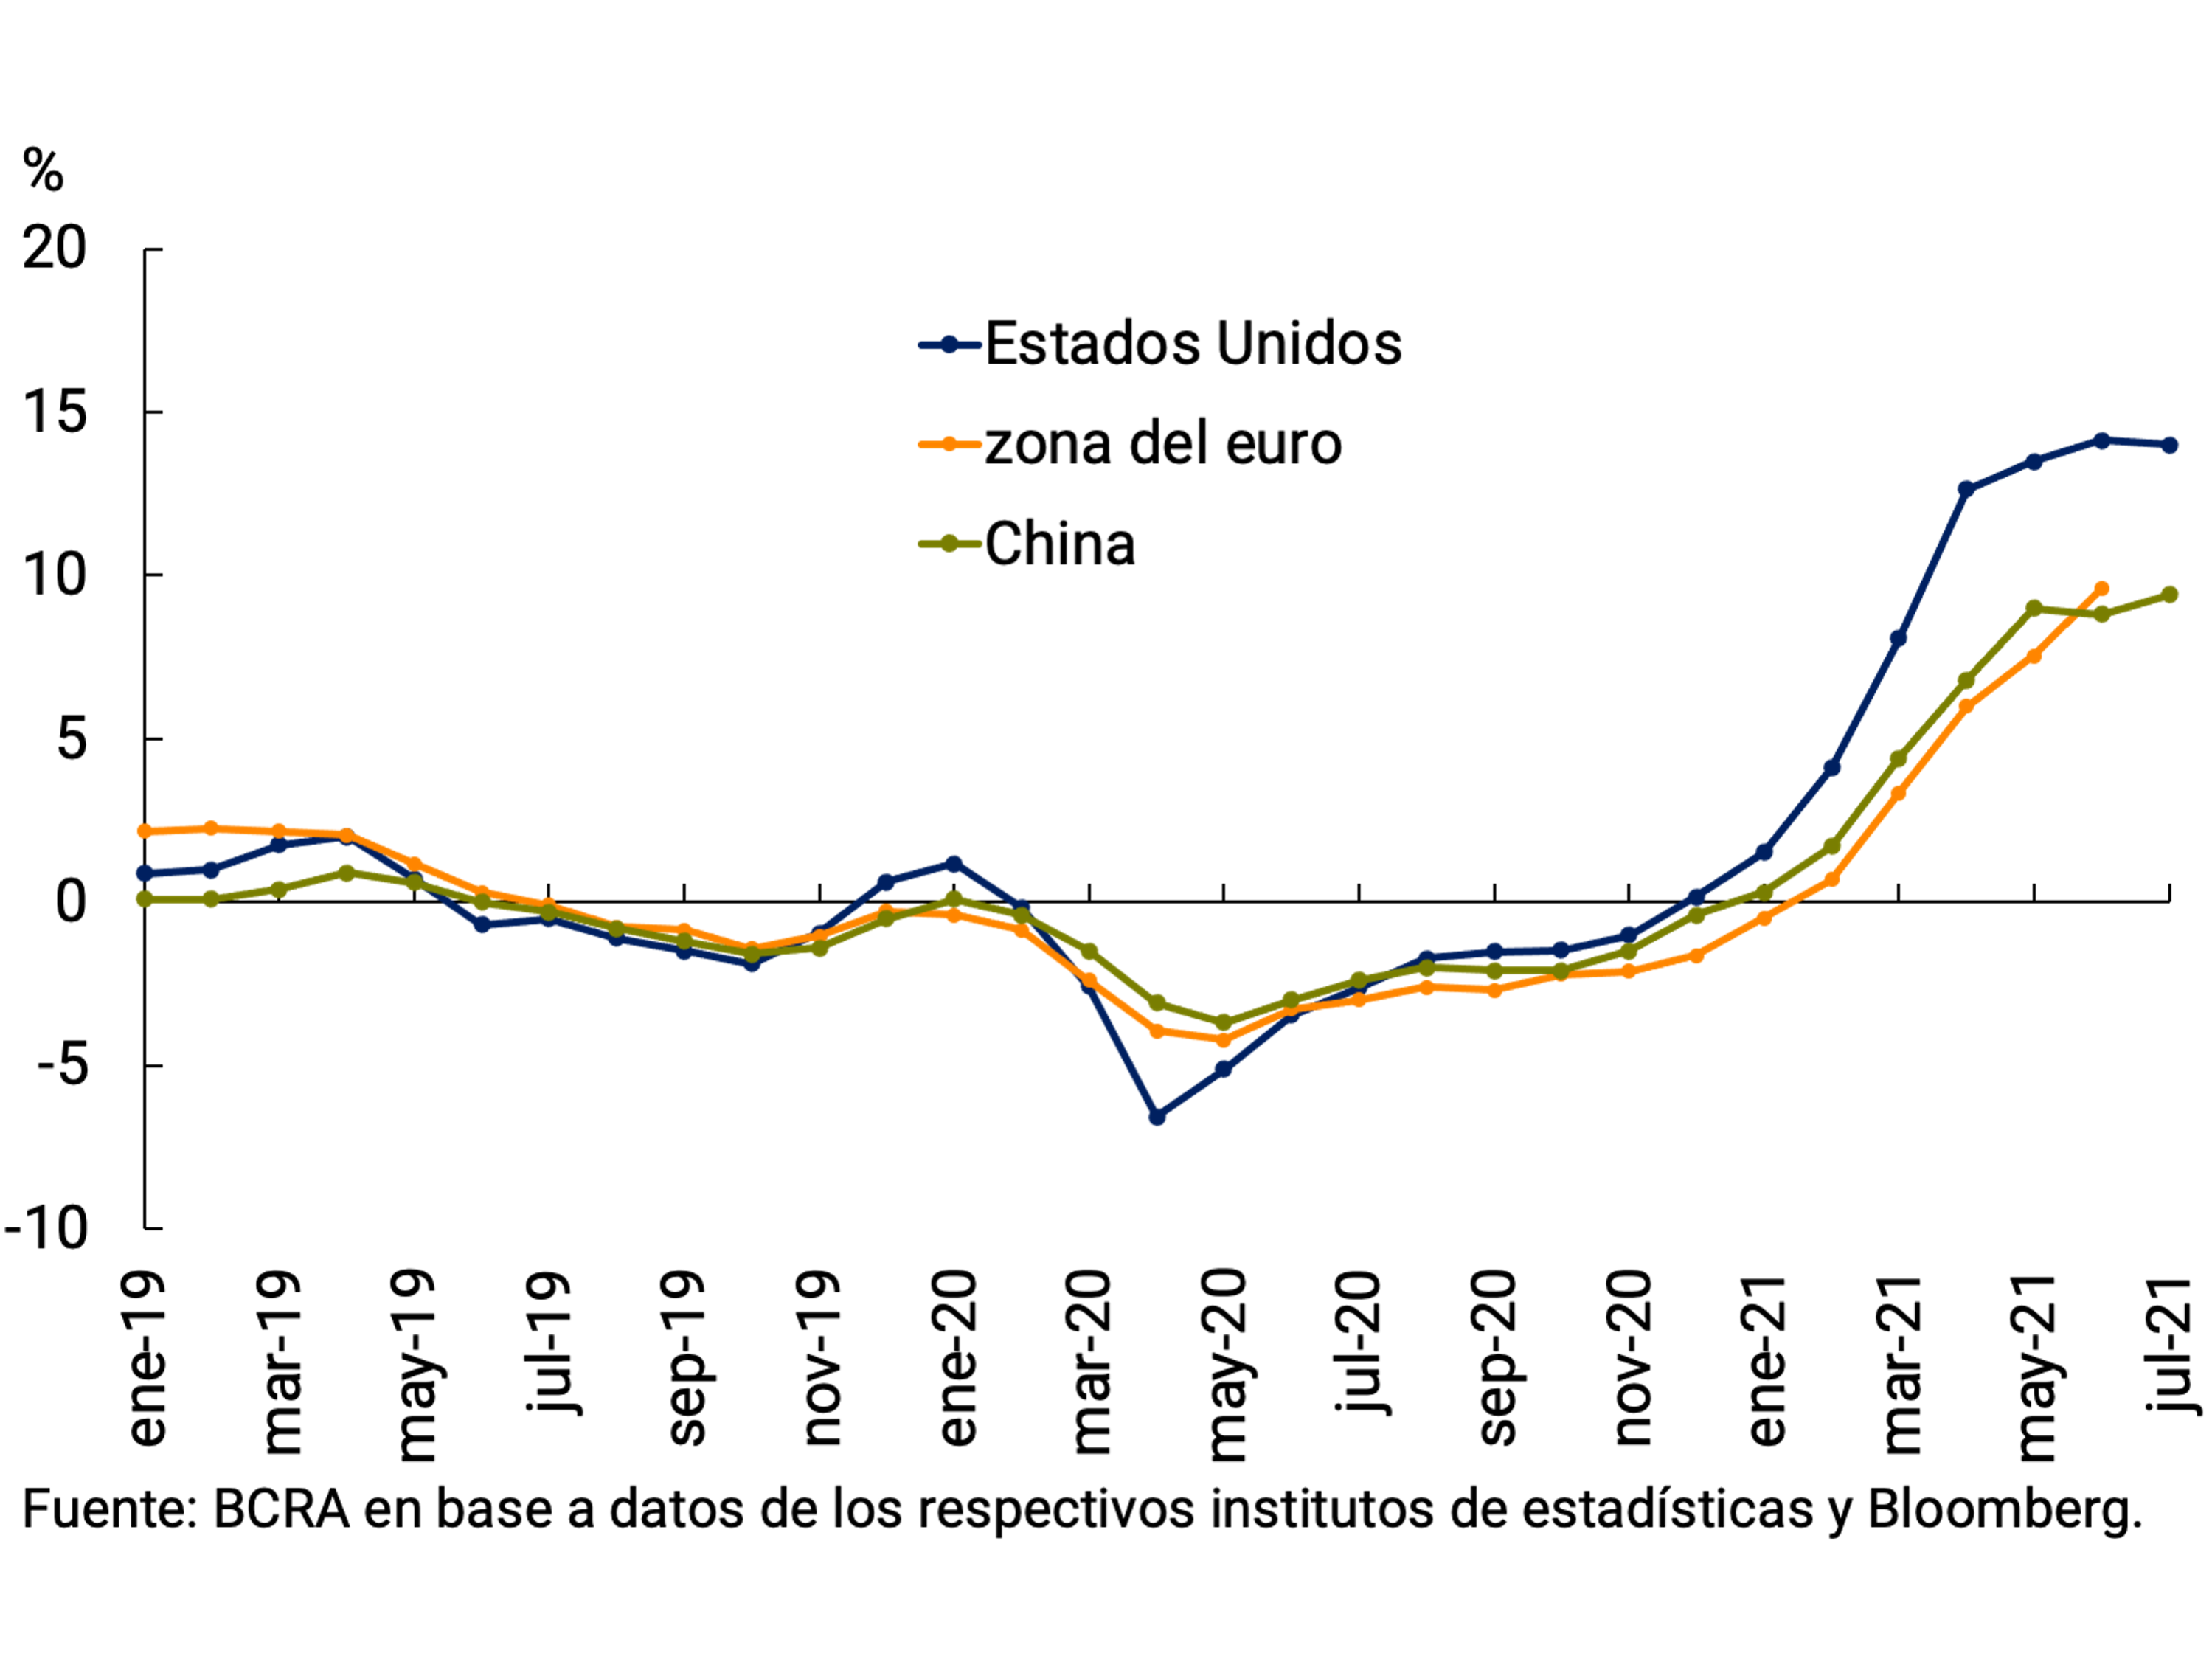
Producer Price Index of manufactured
goods Var. % year-on-year
Brent oil
price – US$ per barrel
Different factors underlie the inflationary acceleration, such as the global economic recovery and the “bottlenecks” in many sectors (shortage of microchips with an impact on different industries, including the automotive industry), together with higher energy prices, “base of comparison” effects and increases in certain goods affected by the pandemic (see, for example, a recent report by the Bank for International Settlements). Wholesale inflation has also accelerated in many countries (see Figure 2.11); this affected Argentina’s import prices (see Chapter 4. External Sector).
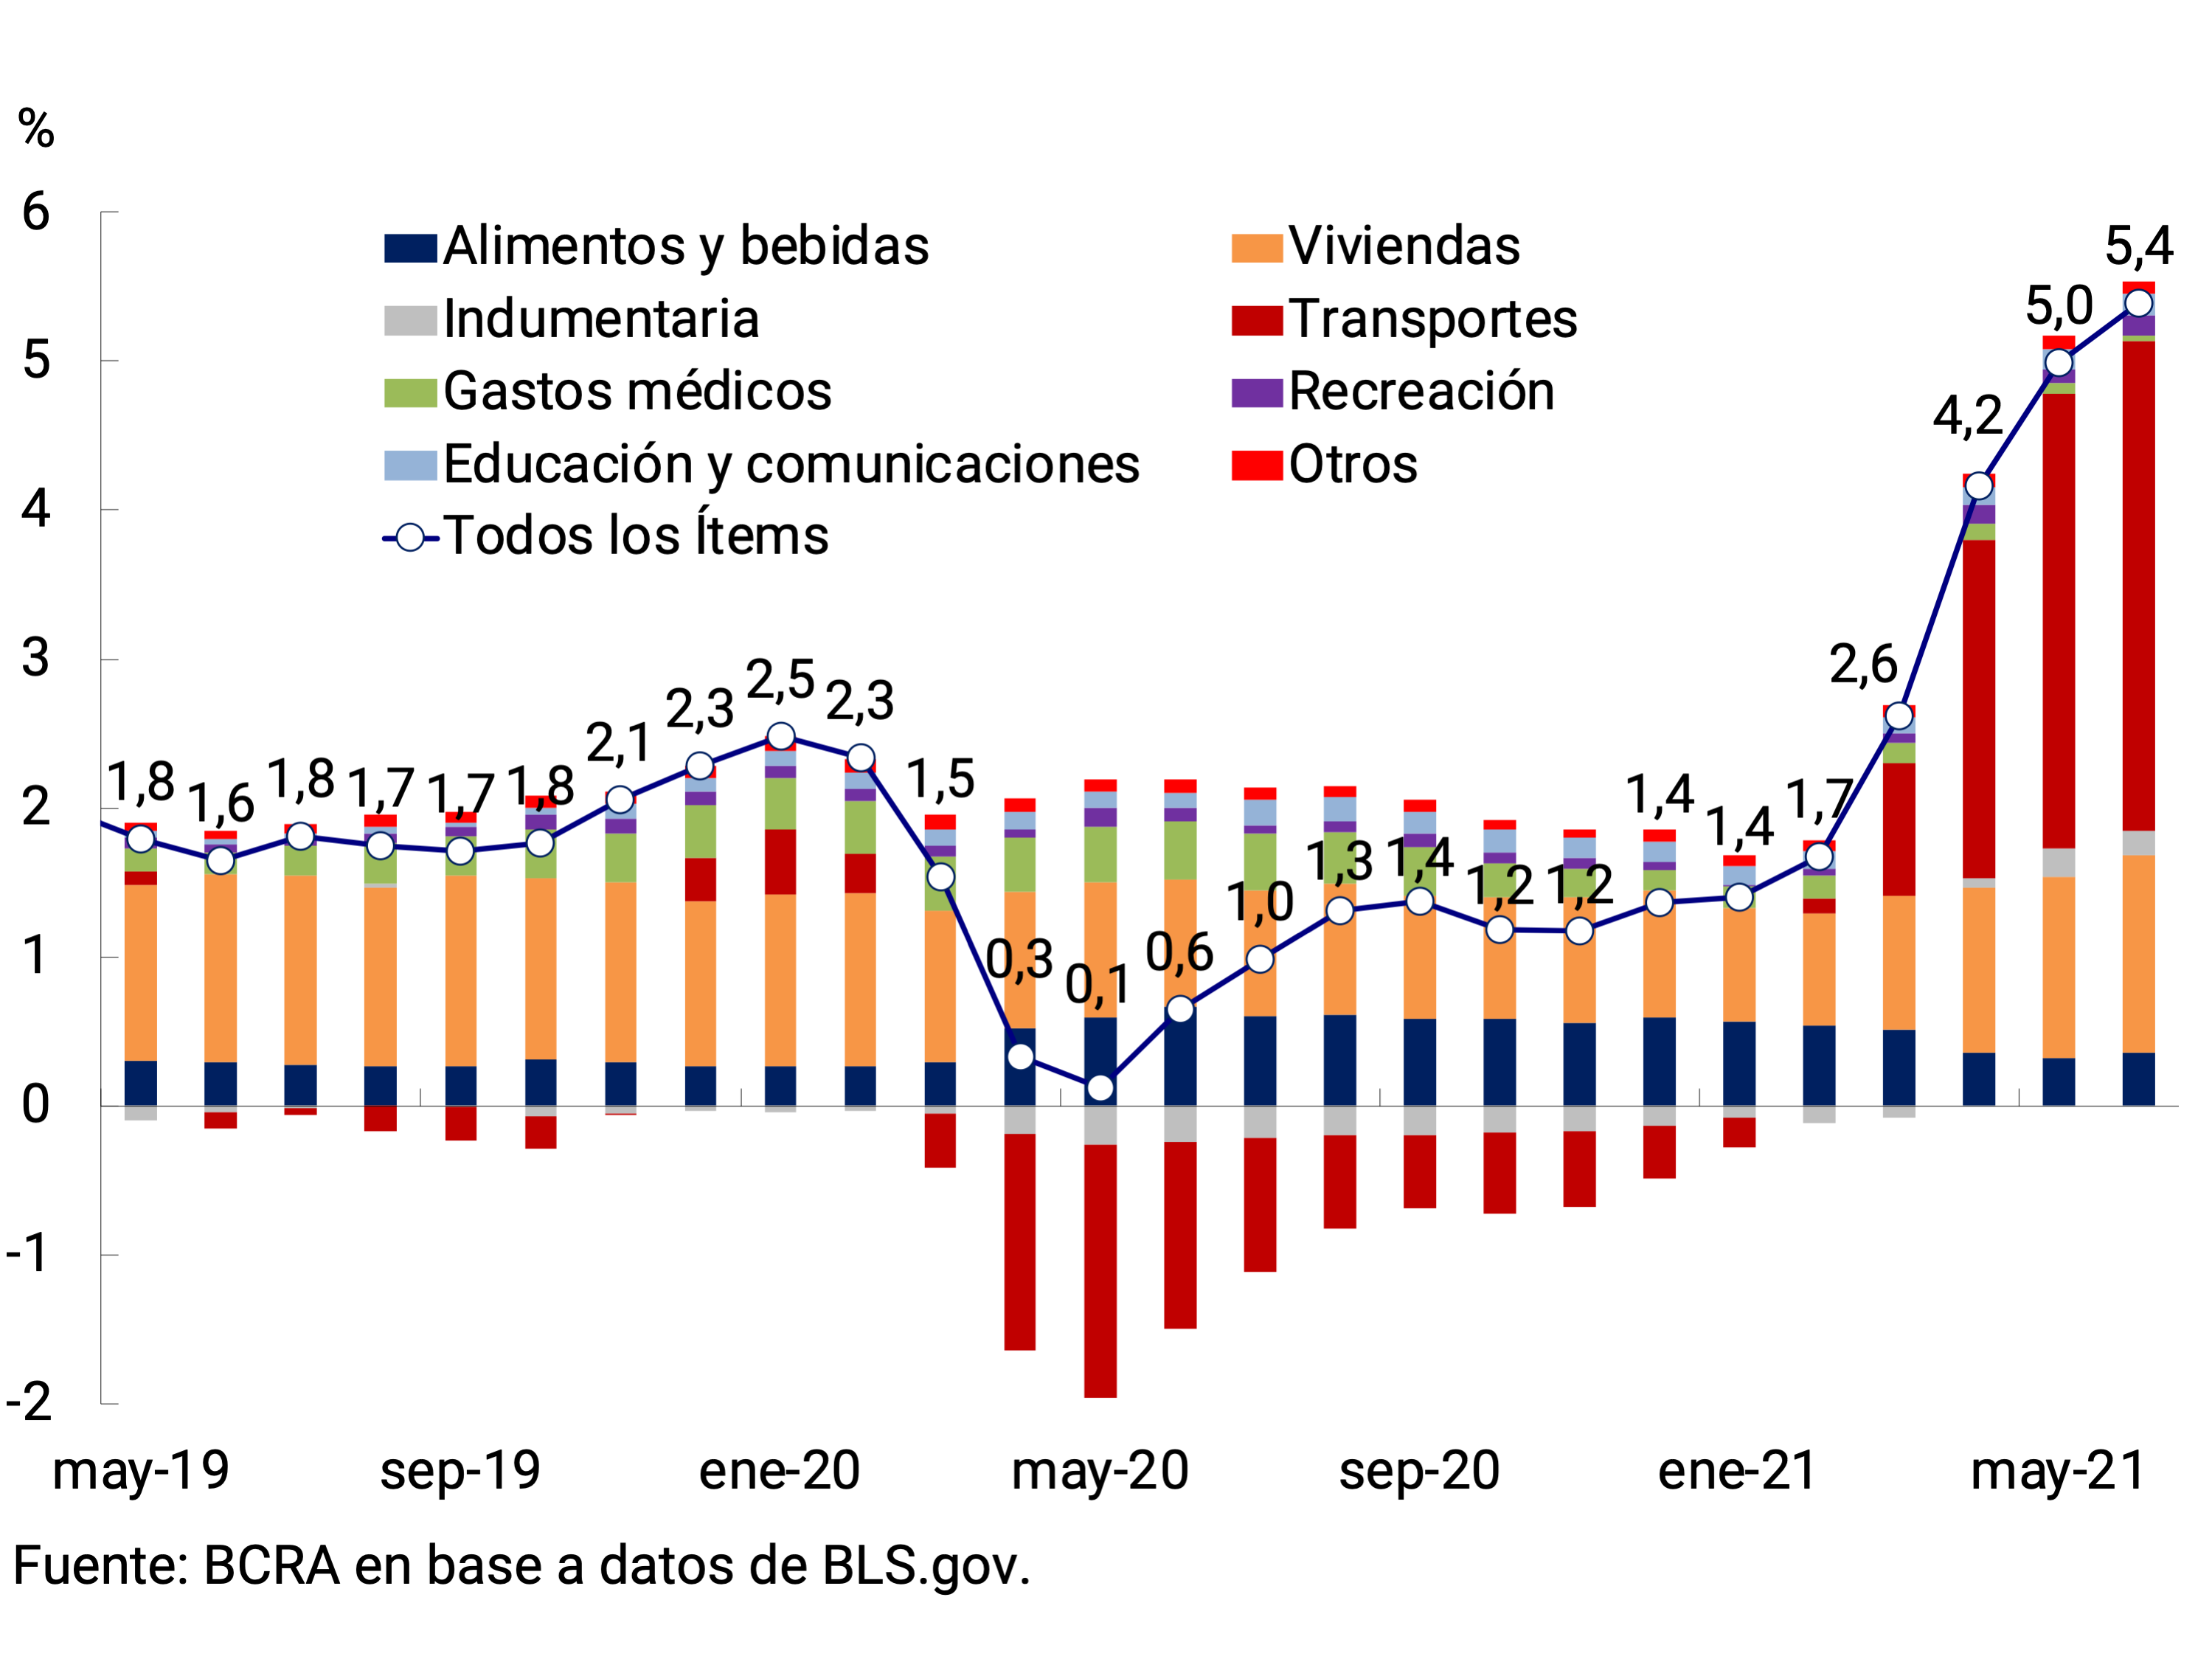
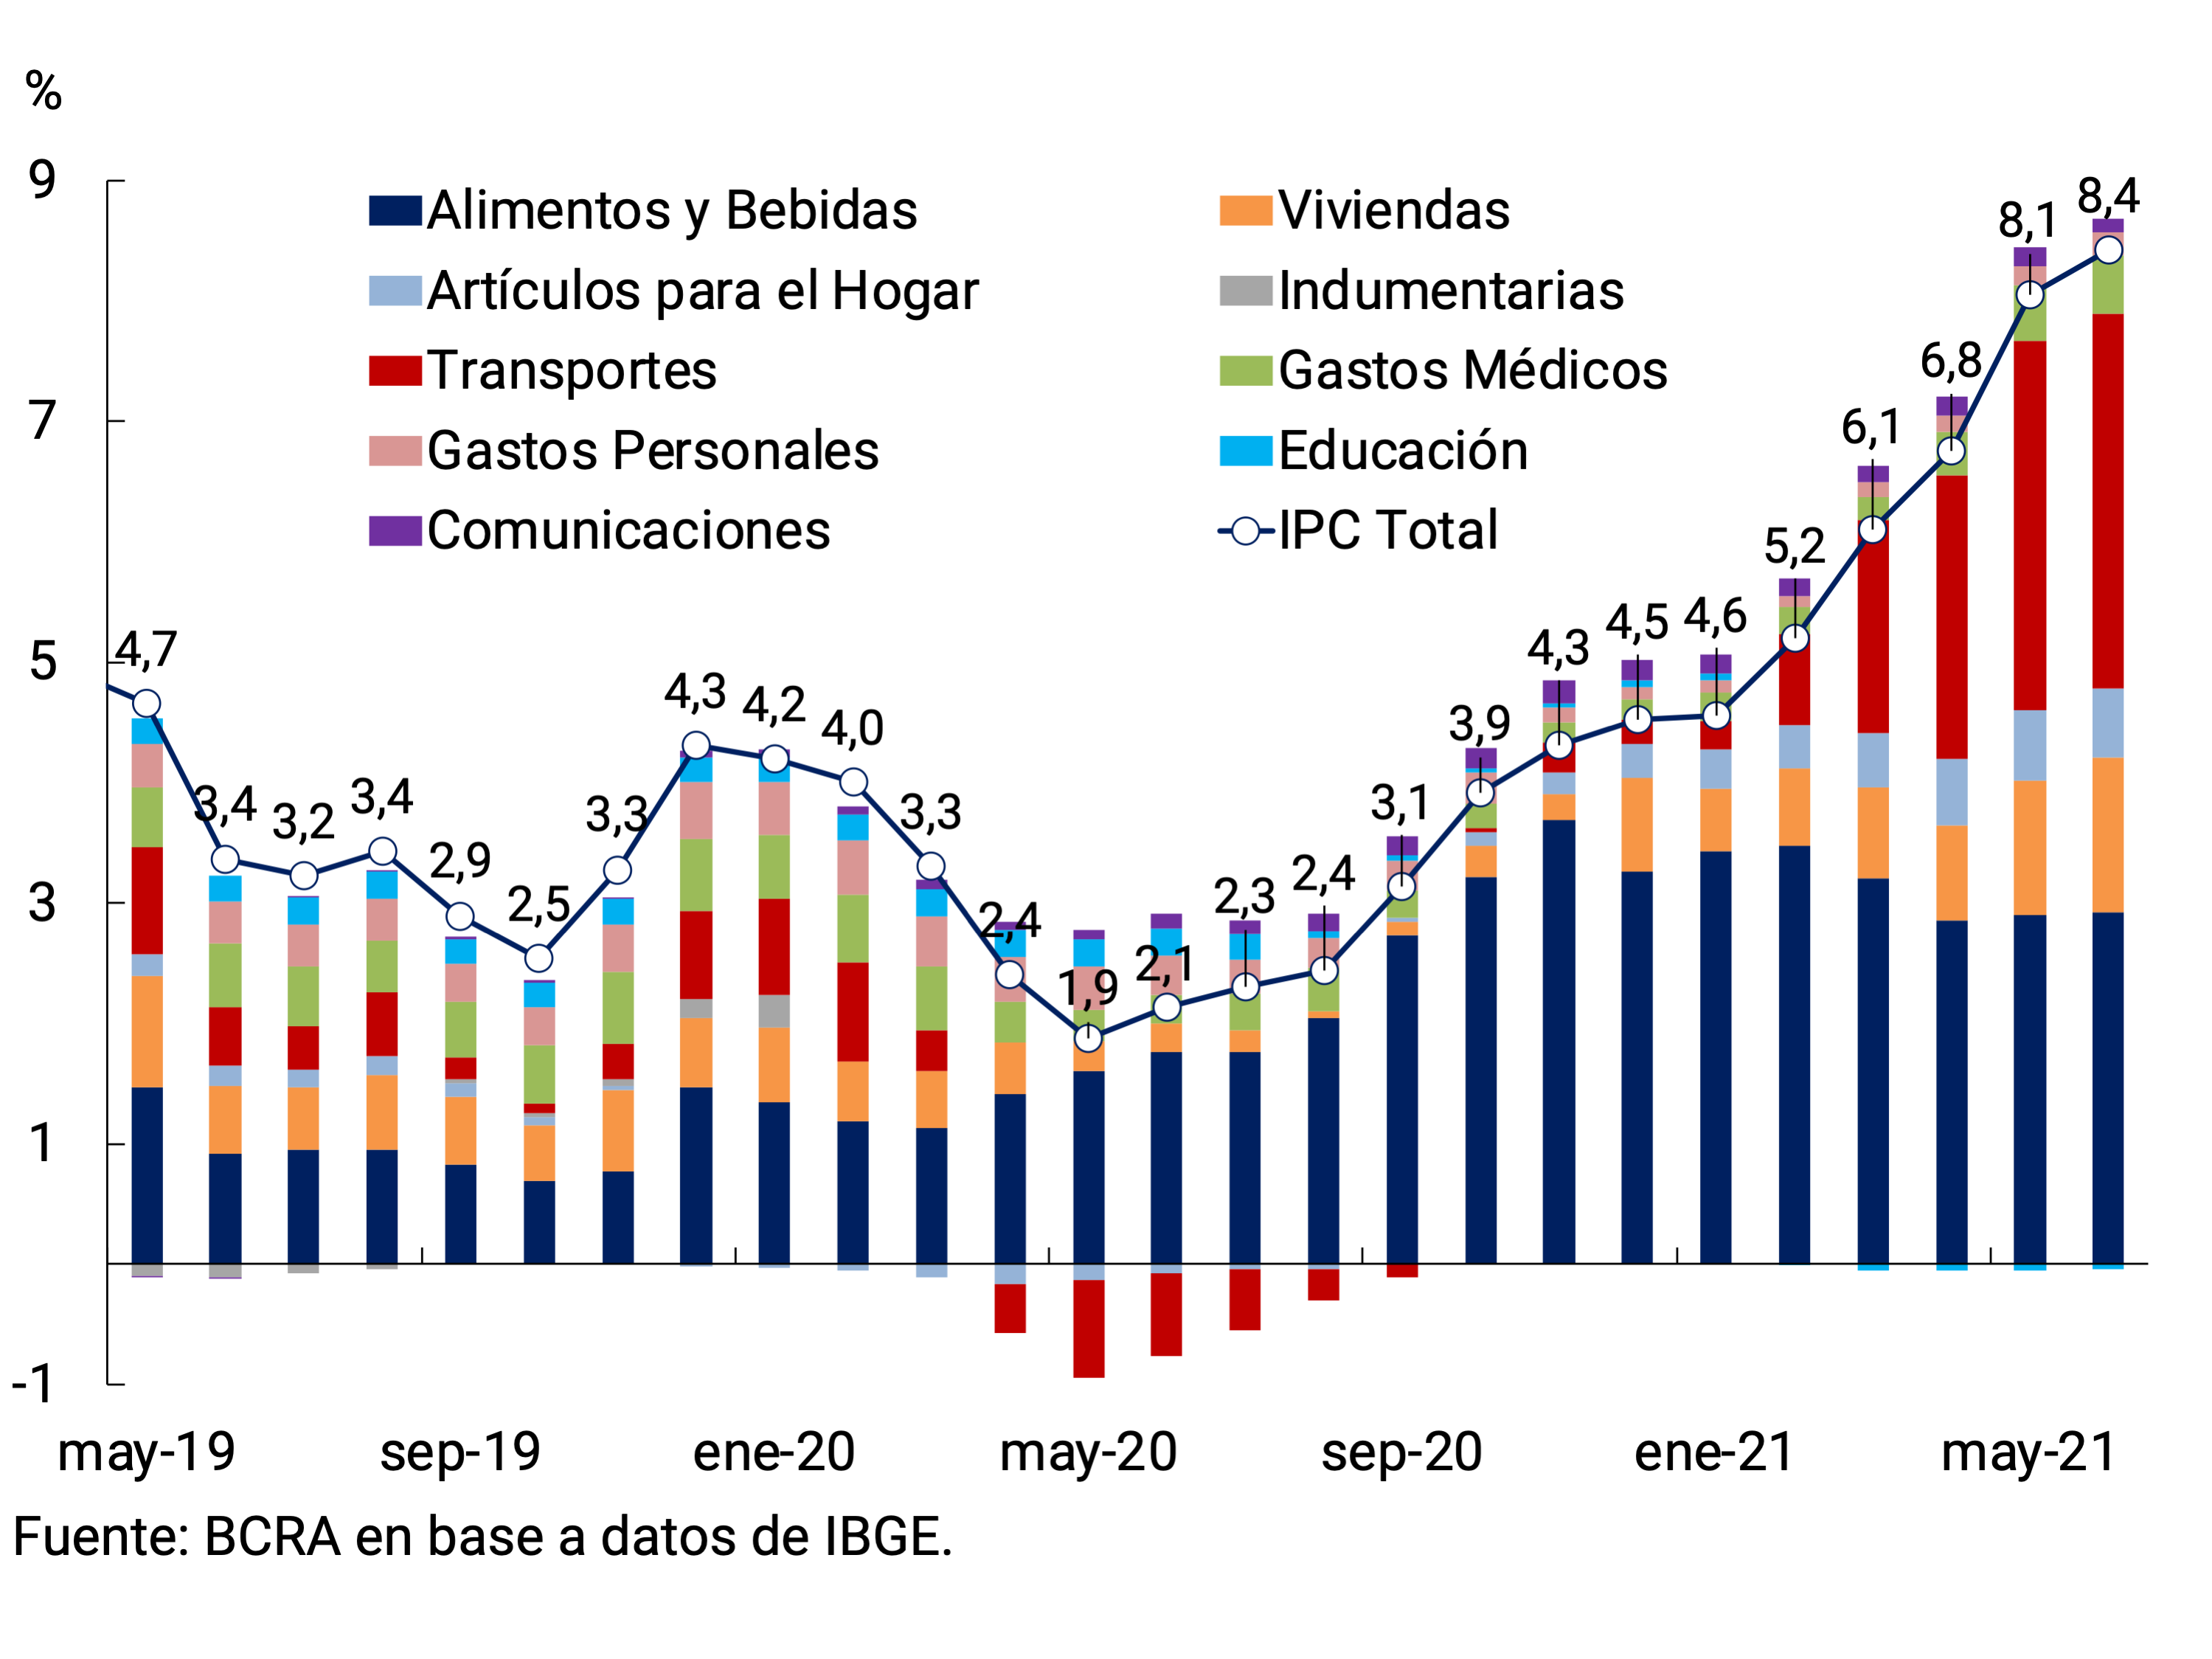
From a breakdown of the inflation rate of different countries among their main items, it emerges that those that contributed the most to the increase in prices were the items linked to the price of oil, such as transport and housing (the latter includes increases in electricity and gas). Another factor that would have been influencing part of the transport sector is the increase in the price of vehicles due to the shortage of some of their inputs. In developing countries, this dynamic has been enhanced by exchange rate depreciation in response to the crisis and higher commodity prices. For example, the two items that had the greatest impact on the increase in inflation in Brazil were food and beverages and transport, linked to the factors mentioned above (see Figure 2.12).
Figure 2.12 | CPI by category. Main trading partners
United States
Brazil
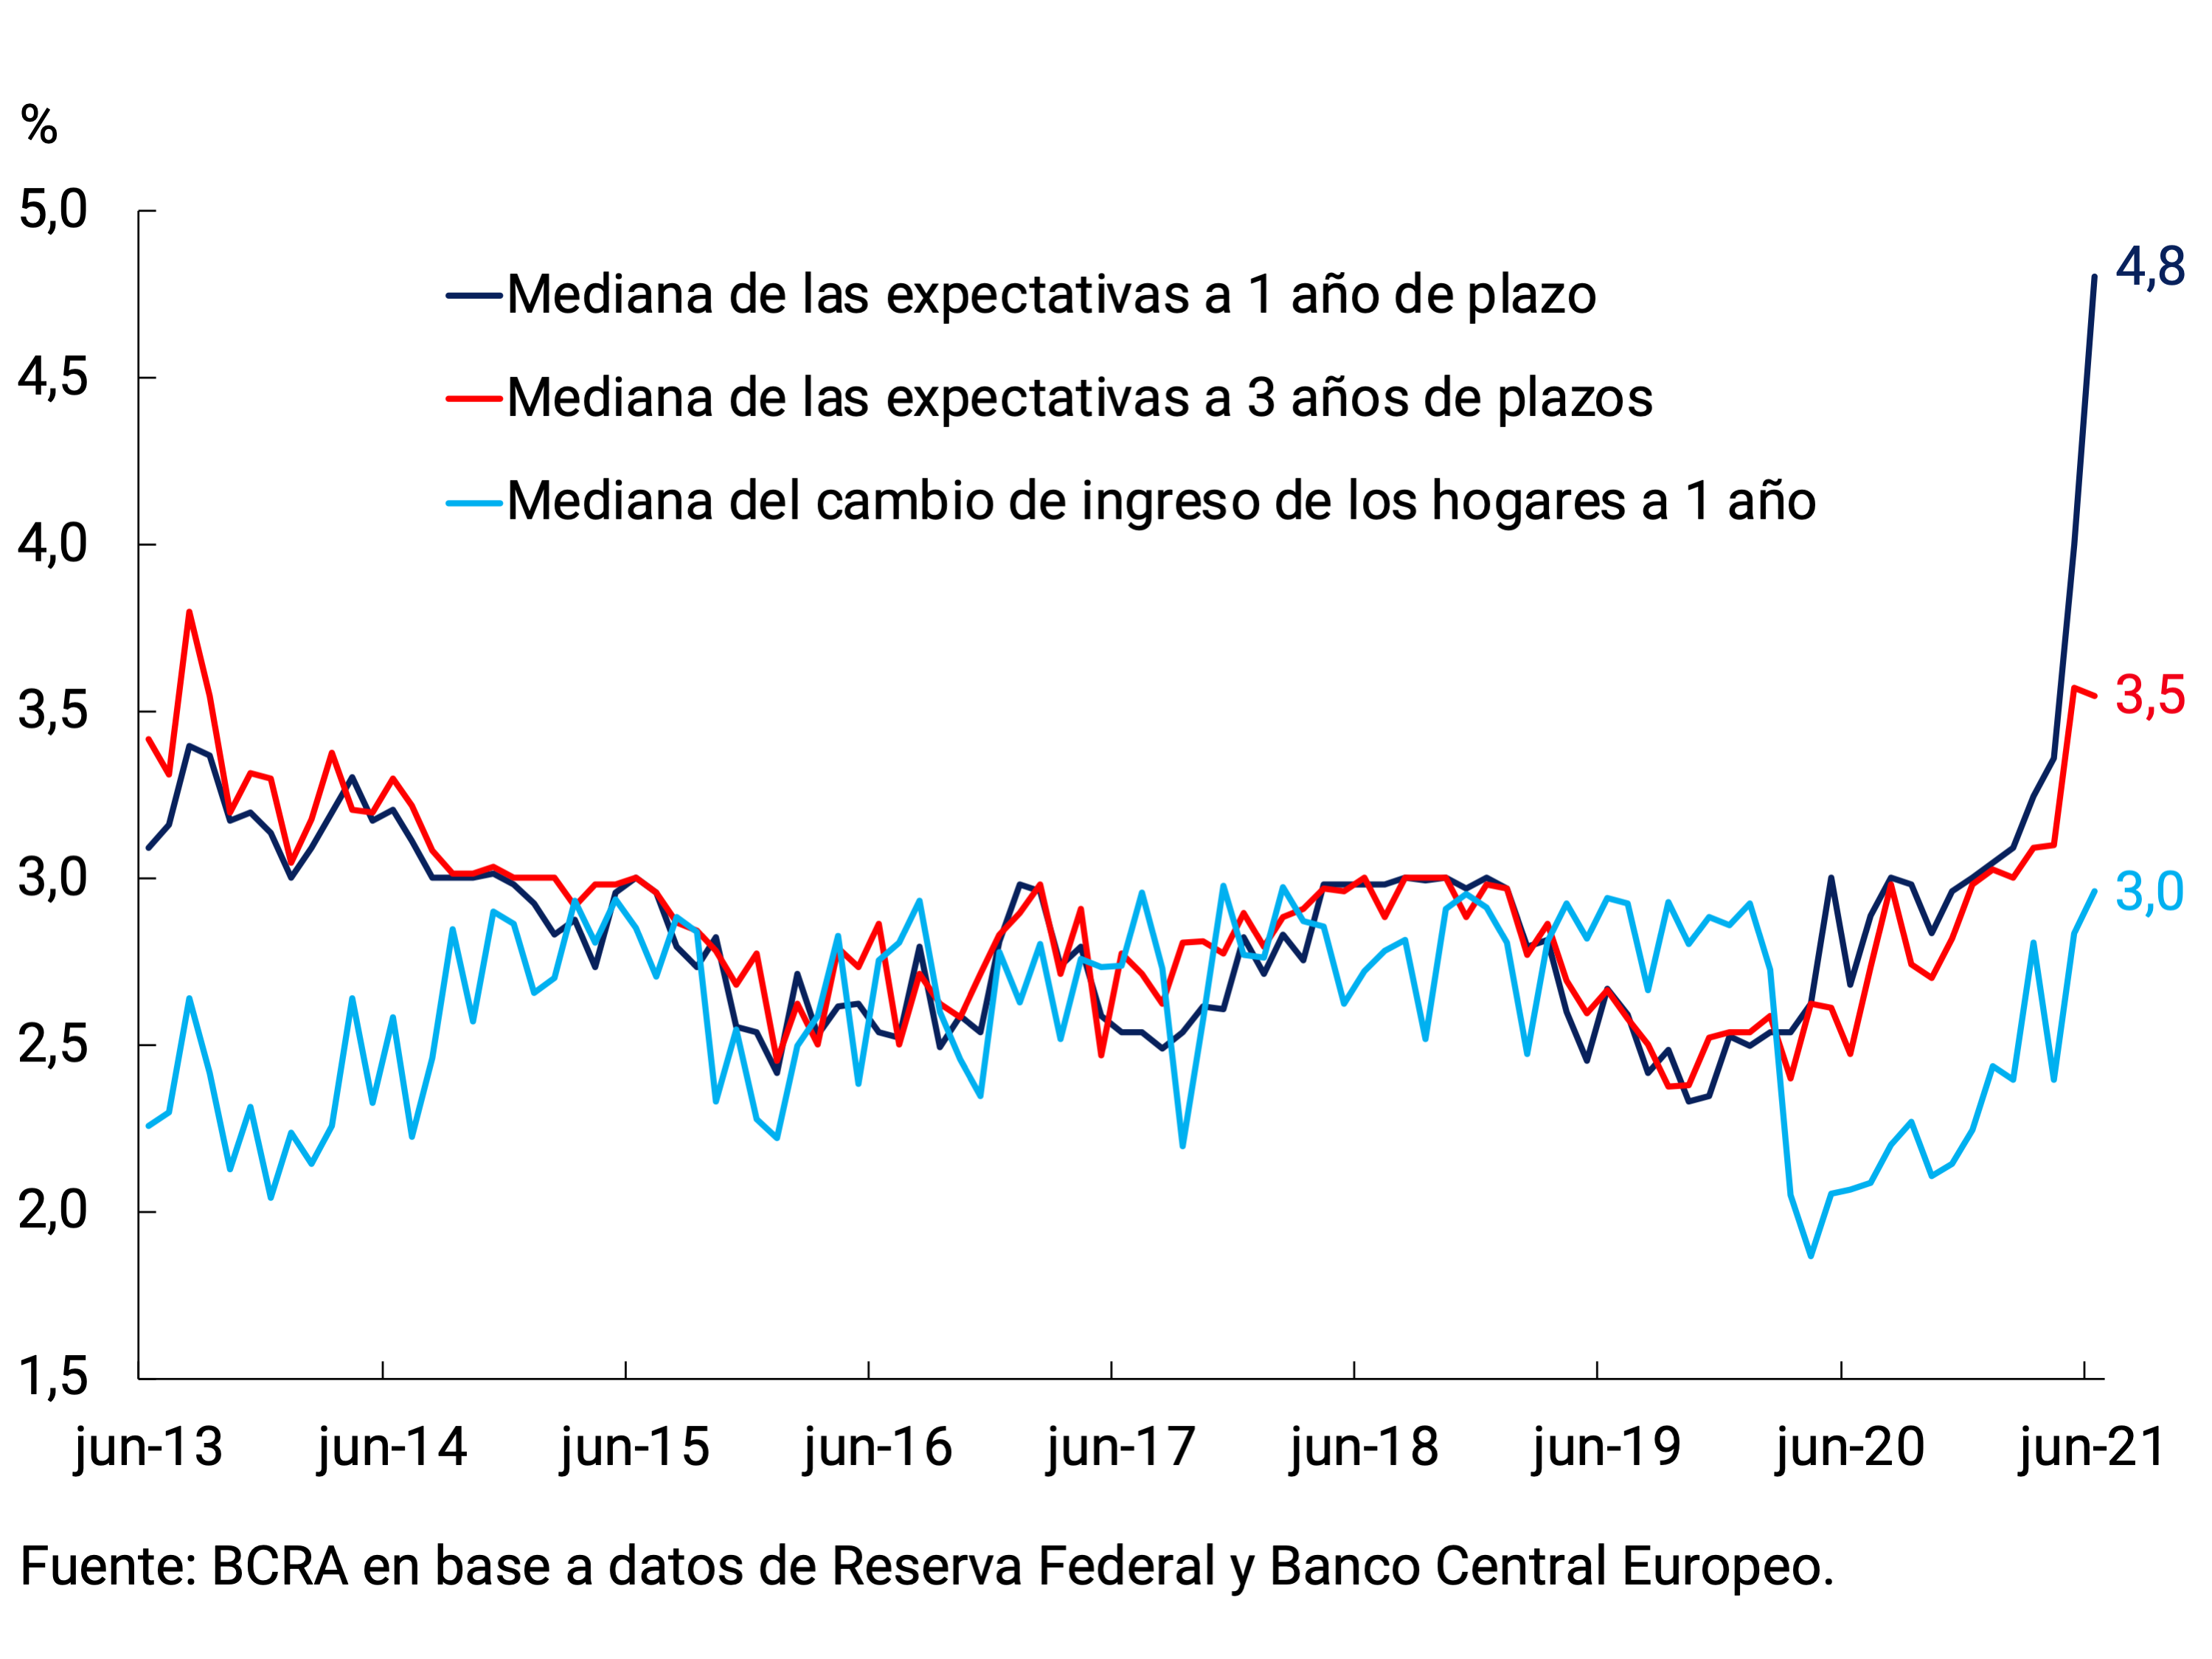
Despite higher inflation, expectations remain relatively stable over the medium term (see Figure 2.13). This is evident in advanced countries, but also in some developing economies such as Brazil. This supports the notion that the recent increase is perceived as transitory.
Figure 2.13 | Inflation expectations
United States
Euro area
In the second quarter of the year, the fiscal policy response to the pandemic increased by US$500 billion globally, reaching 16% of global GDP (+0.6% of GDP), according to IMF data. Most of this new support was provided in advanced countries (euro area, the United Kingdom, Japan, Canada and Australia) to deal with the outbreaks at the beginning of the year, while many developing economies sought to rebuild their fiscal positions. For the coming years, with the promotion of the Employment Plan and the Family Plan in the United States and the advance of the “New Generation” plan in the European Union, the differences in fiscal stimulus could remain, which would further complicate the possibilities of convergence between advanced and developing countries.
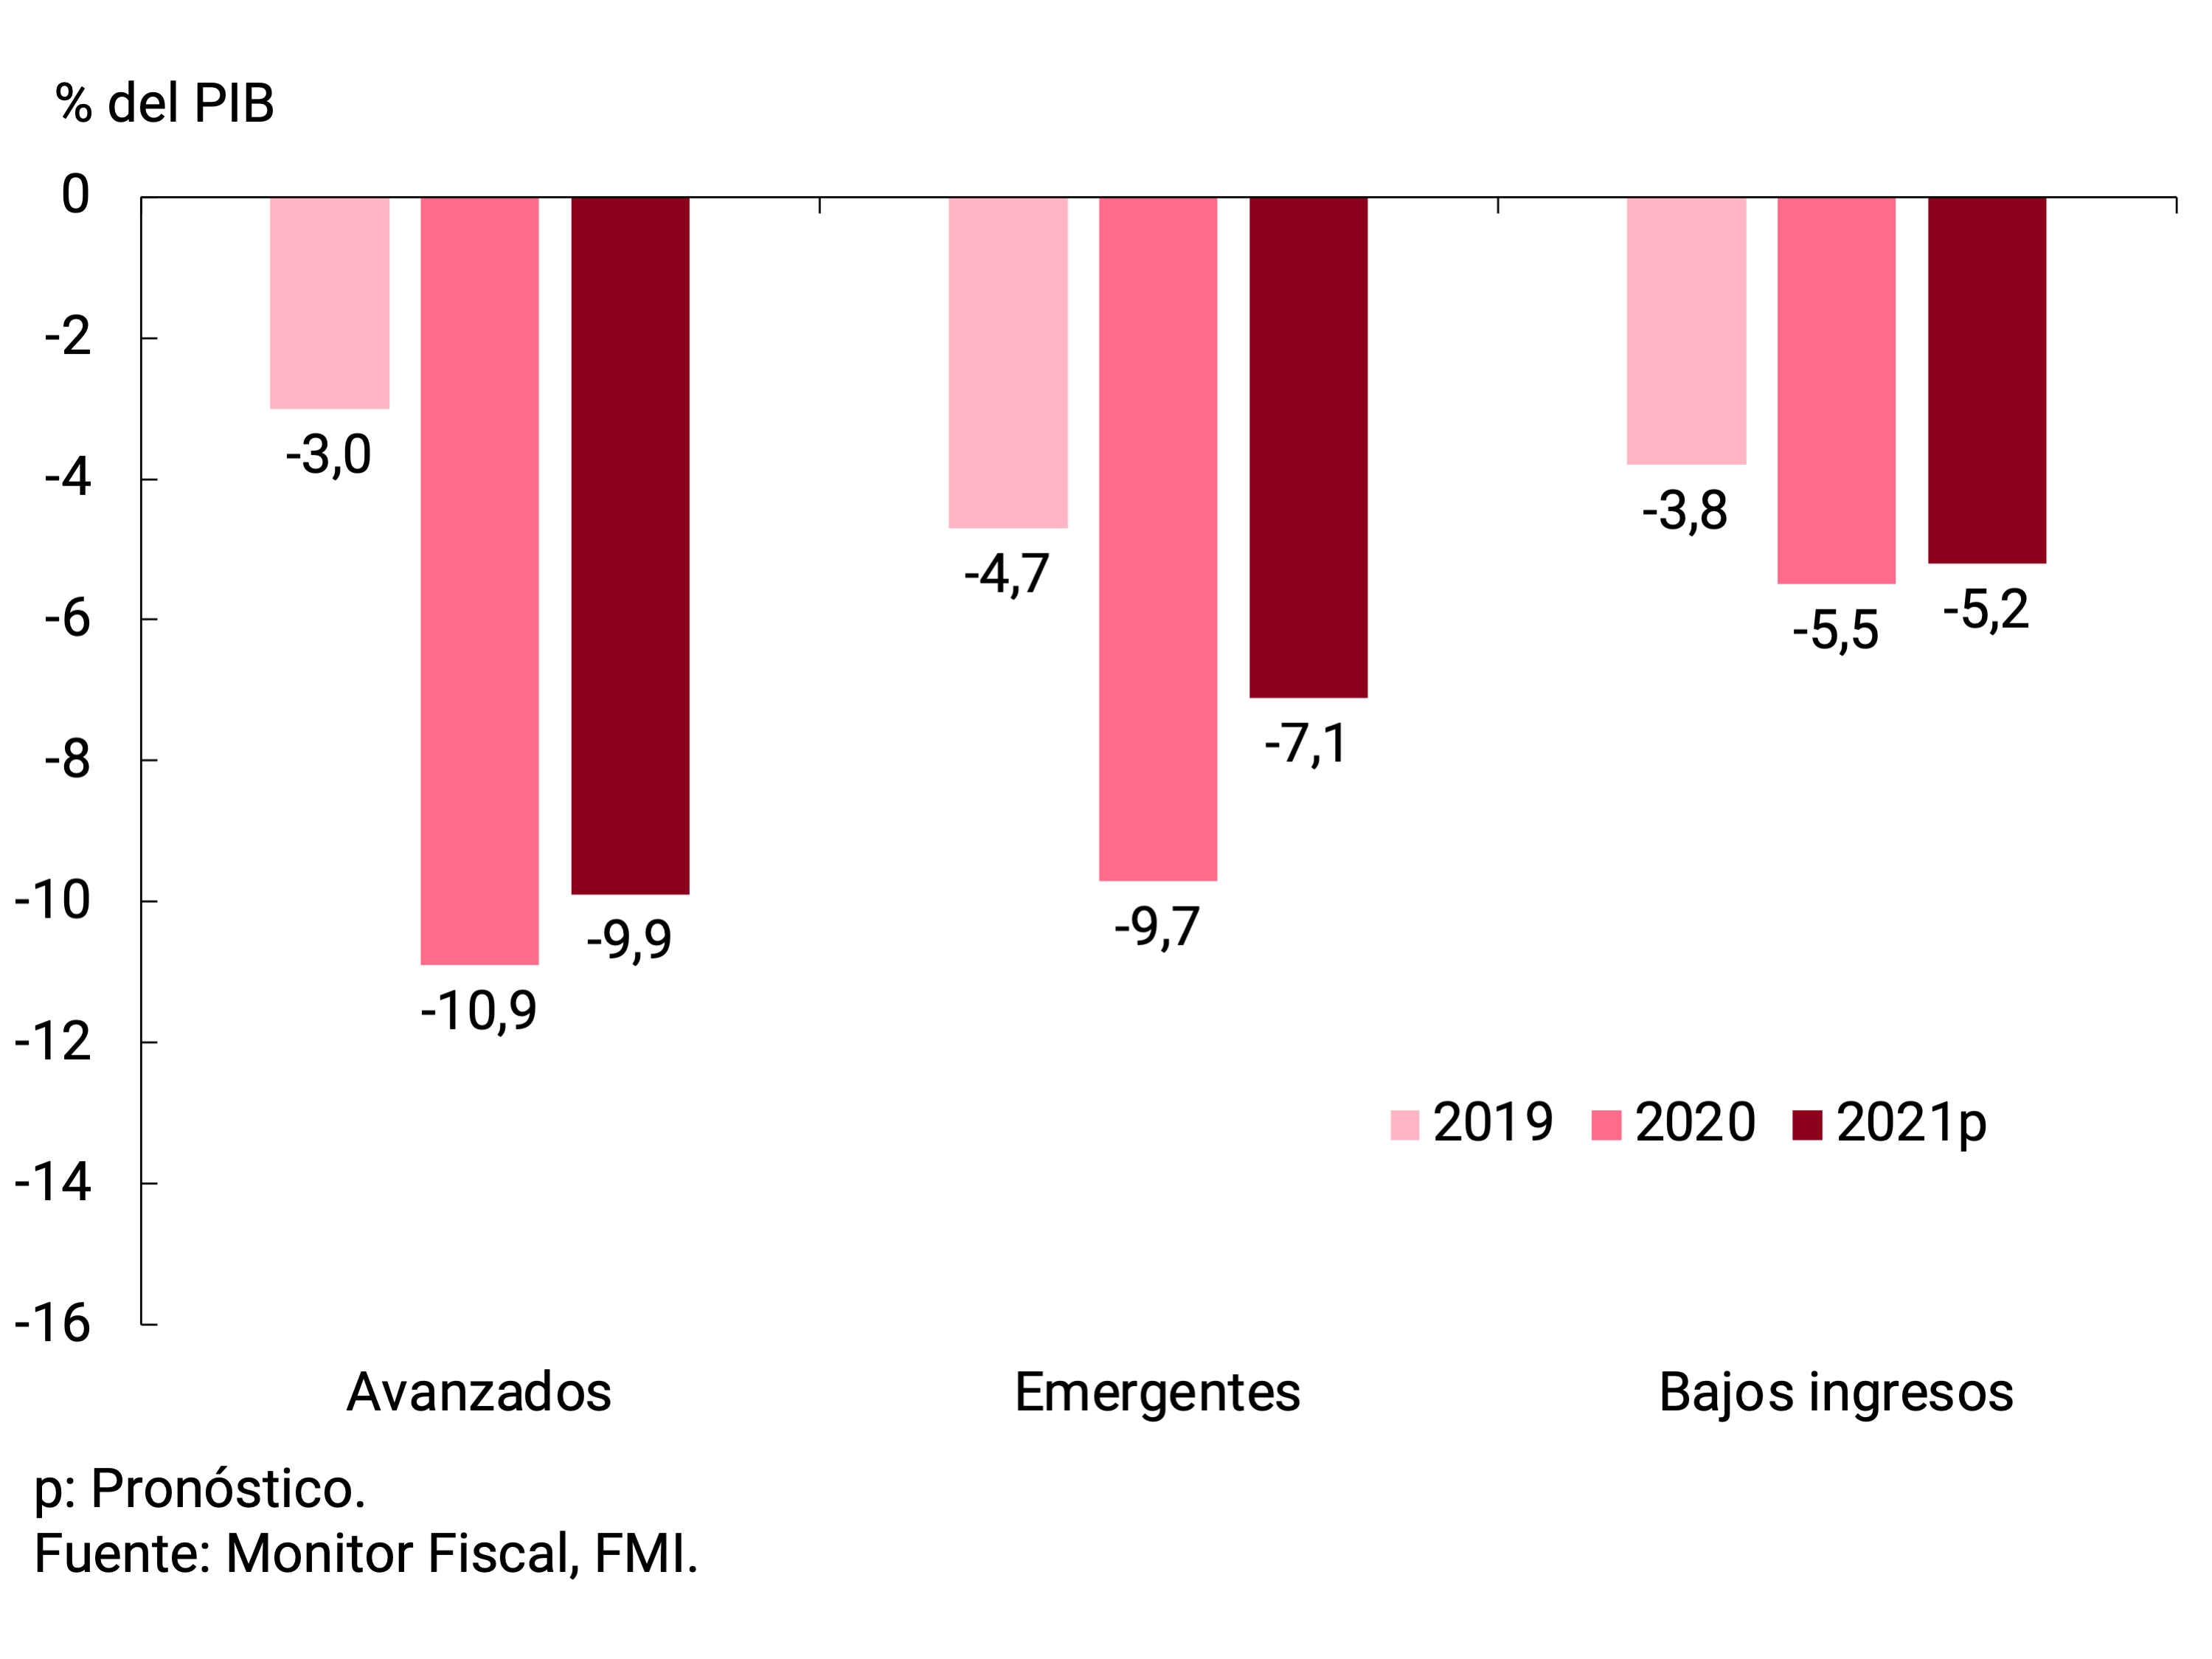
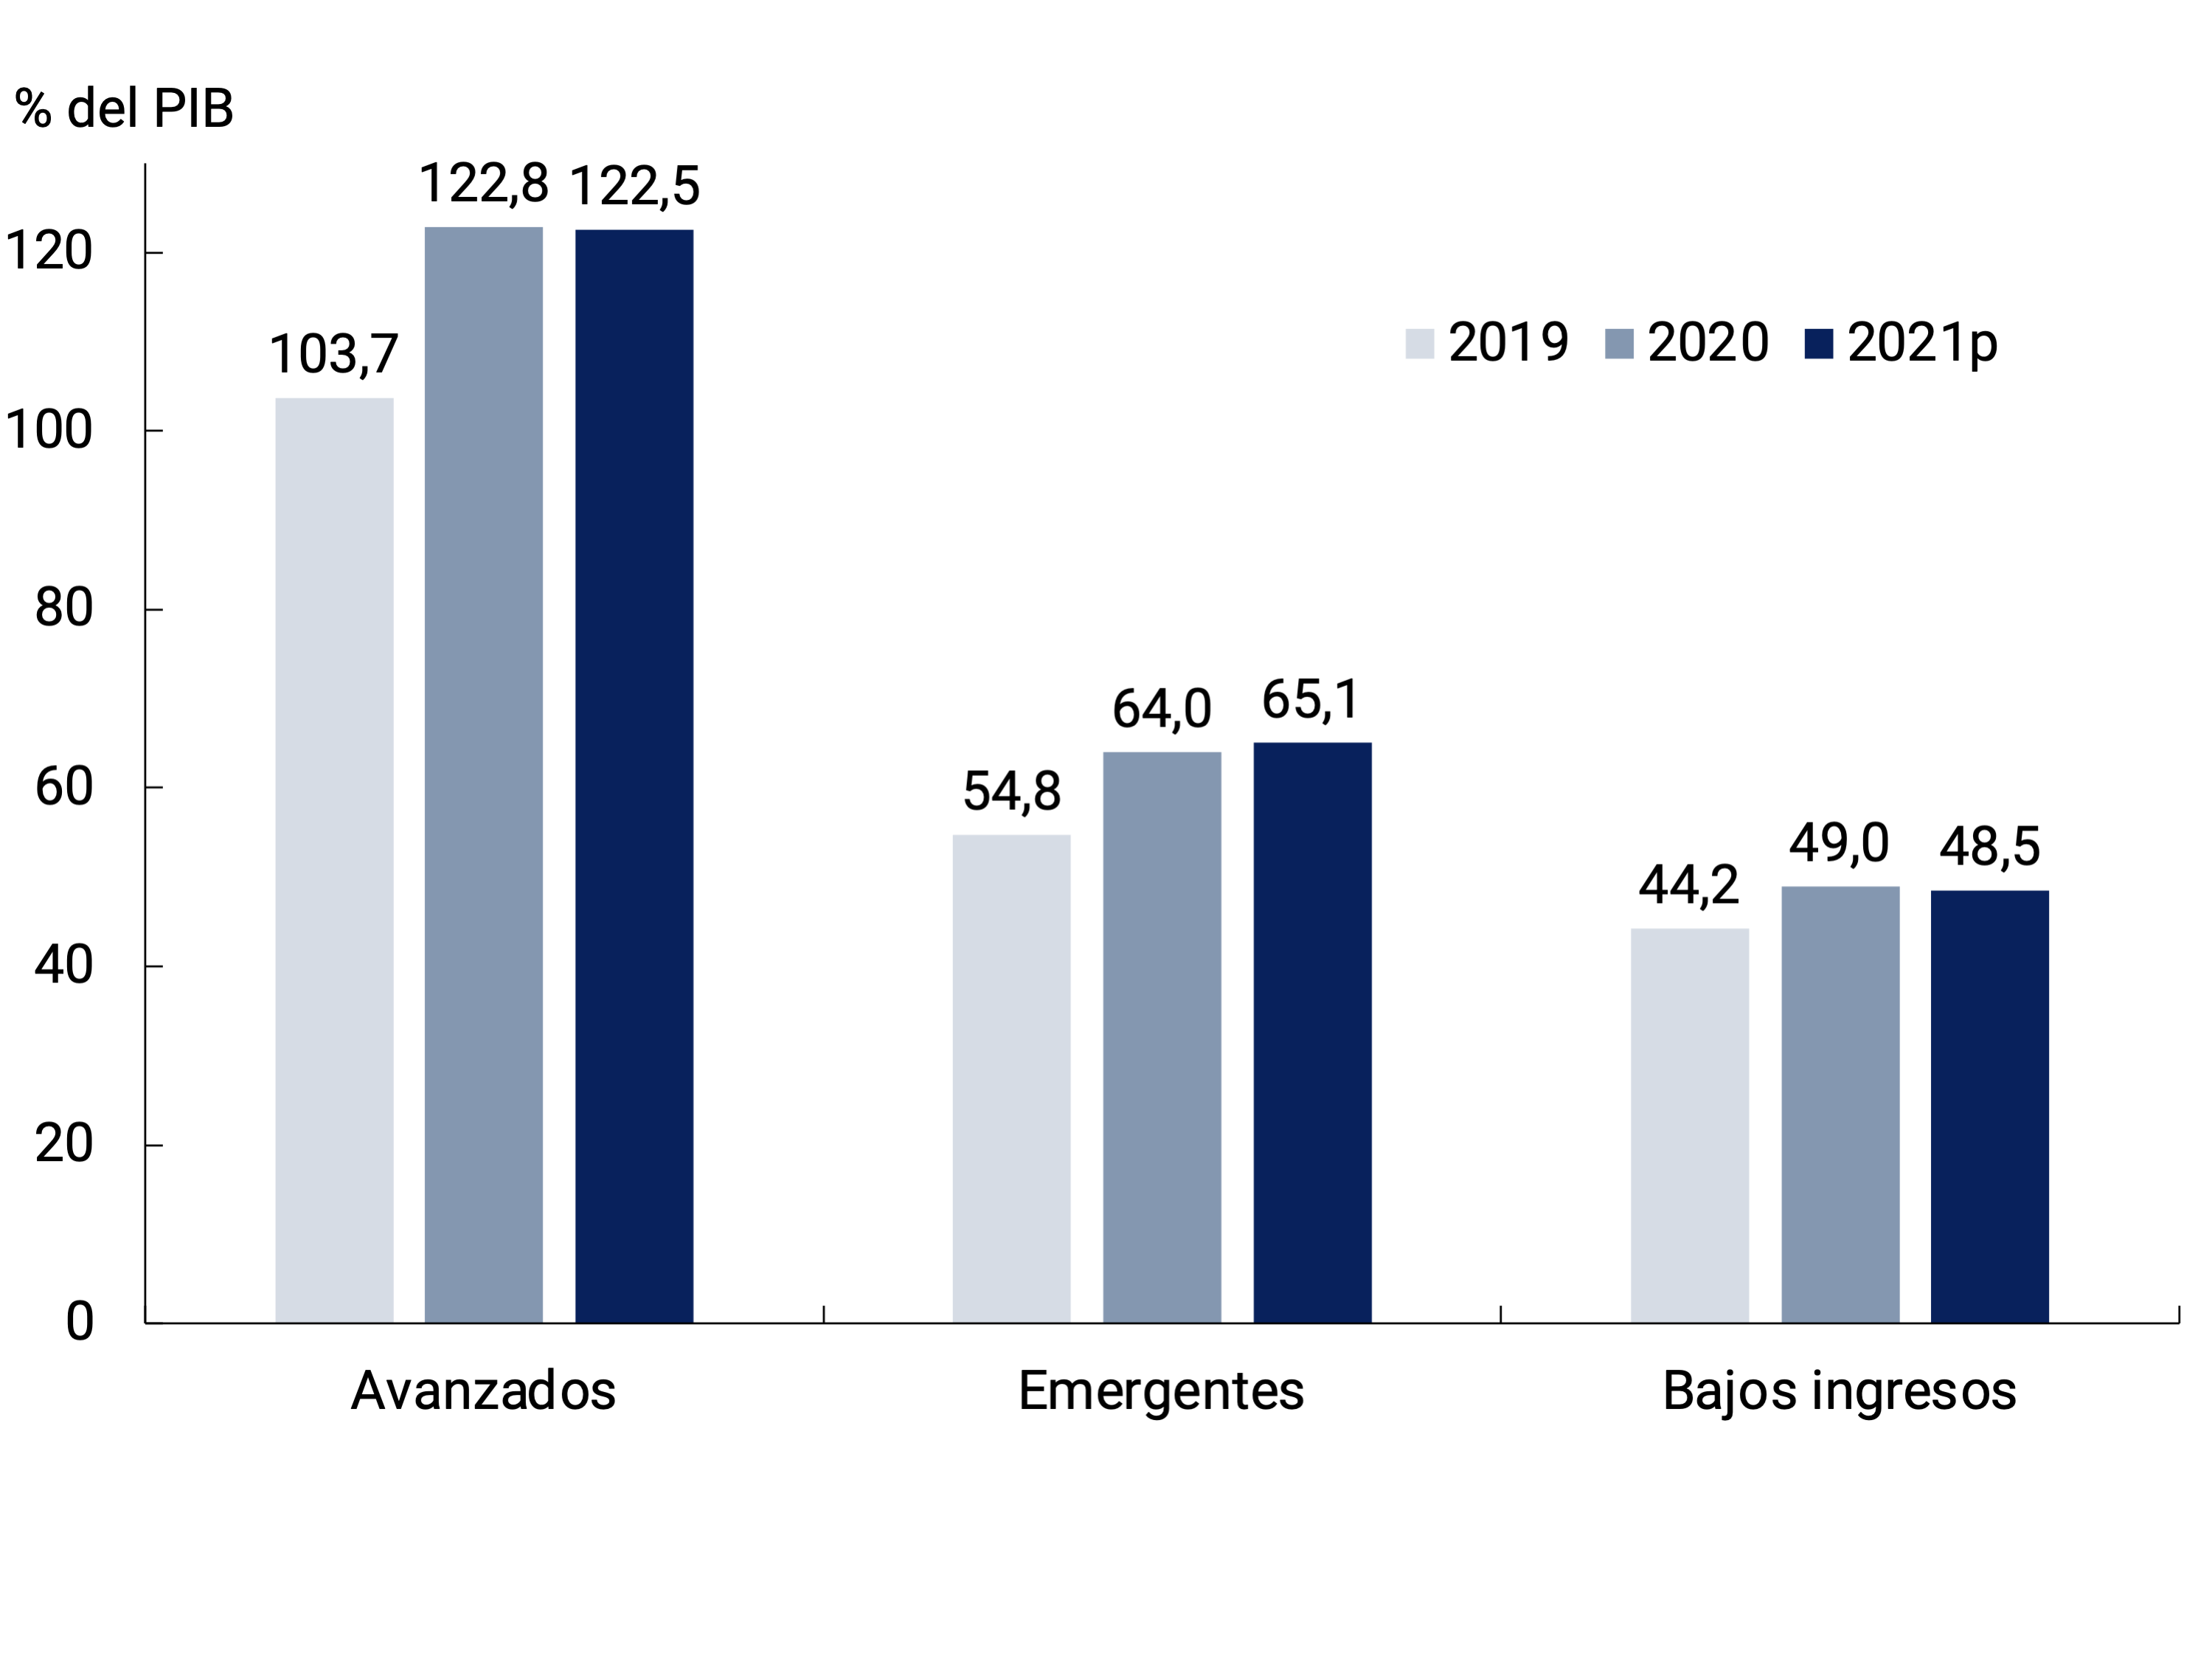
Most countries would register smaller deficits in their public accounts in the year than in 2020, although still high. The largest imbalances would be registered in advanced countries, which would close the year with an average fiscal deficit of 9.9% of GDP, while emerging economies and lower-income economies would end up with imbalances of -7.1% of GDP and -5.2% of GDP, respectively. This fiscal dynamic, together with the expected recovery in economic activity, would lead to a moderation in the evolution of debt-to-GDP ratios at the global level this year, even with slight declines in advanced and lower-income countries (see Figure 2.14). However, for some middle-income and low-income countries, financing large deficits remained a challenge, given limited market access and limited scope for tax collection in the short term.
Figure 2.14 |
Financial result
Gross public debt
In the context of multilateral economic measures to address the crisis, the progress of the new allocation of Special Drawing Rights (SDRs) for US$650 billion was highlighted, which, after being approved by the IMF Board of Governors, was implemented on August 23 (Argentina received the equivalent of about US$4,350 million)5. In addition, at the last meeting of G20 ministers and central bank governors, the agency was tasked with exploring options for the recirculation of surplus SDRs from countries with strong external positions to vulnerable economies, which could include the creation of a new multilateral fund that also serves middle-income countries6. Another relevant event of international coordination was the approval of a tax agreement proposed by the OECD by 130 countries, which seeks to implement a global minimum income tax rate for multinationals and that the profits of large multinational companies are taxed in part by the countries where they sell products and services. rather than just those that host their headquarters or intellectual property (see Section 1 / Towards the definition of a new international tax scheme).
2.4. Markets: Declines in Long-Term Interest Rates and Stock Market Rises
Since the beginning of the year, there have been a couple of events of long-term interest rate hikes in advanced countries (with peaks in early April and mid-May) that generated concern and capital outflows from emerging countries. In recent times, the panorama seemed to have changed. While global growth expectations remained elevated, long-term inflation expectations in the United States, as measured by the difference between inflation-indexed bonds (TIPS) and Treasuries, declined and appeared to stabilize.
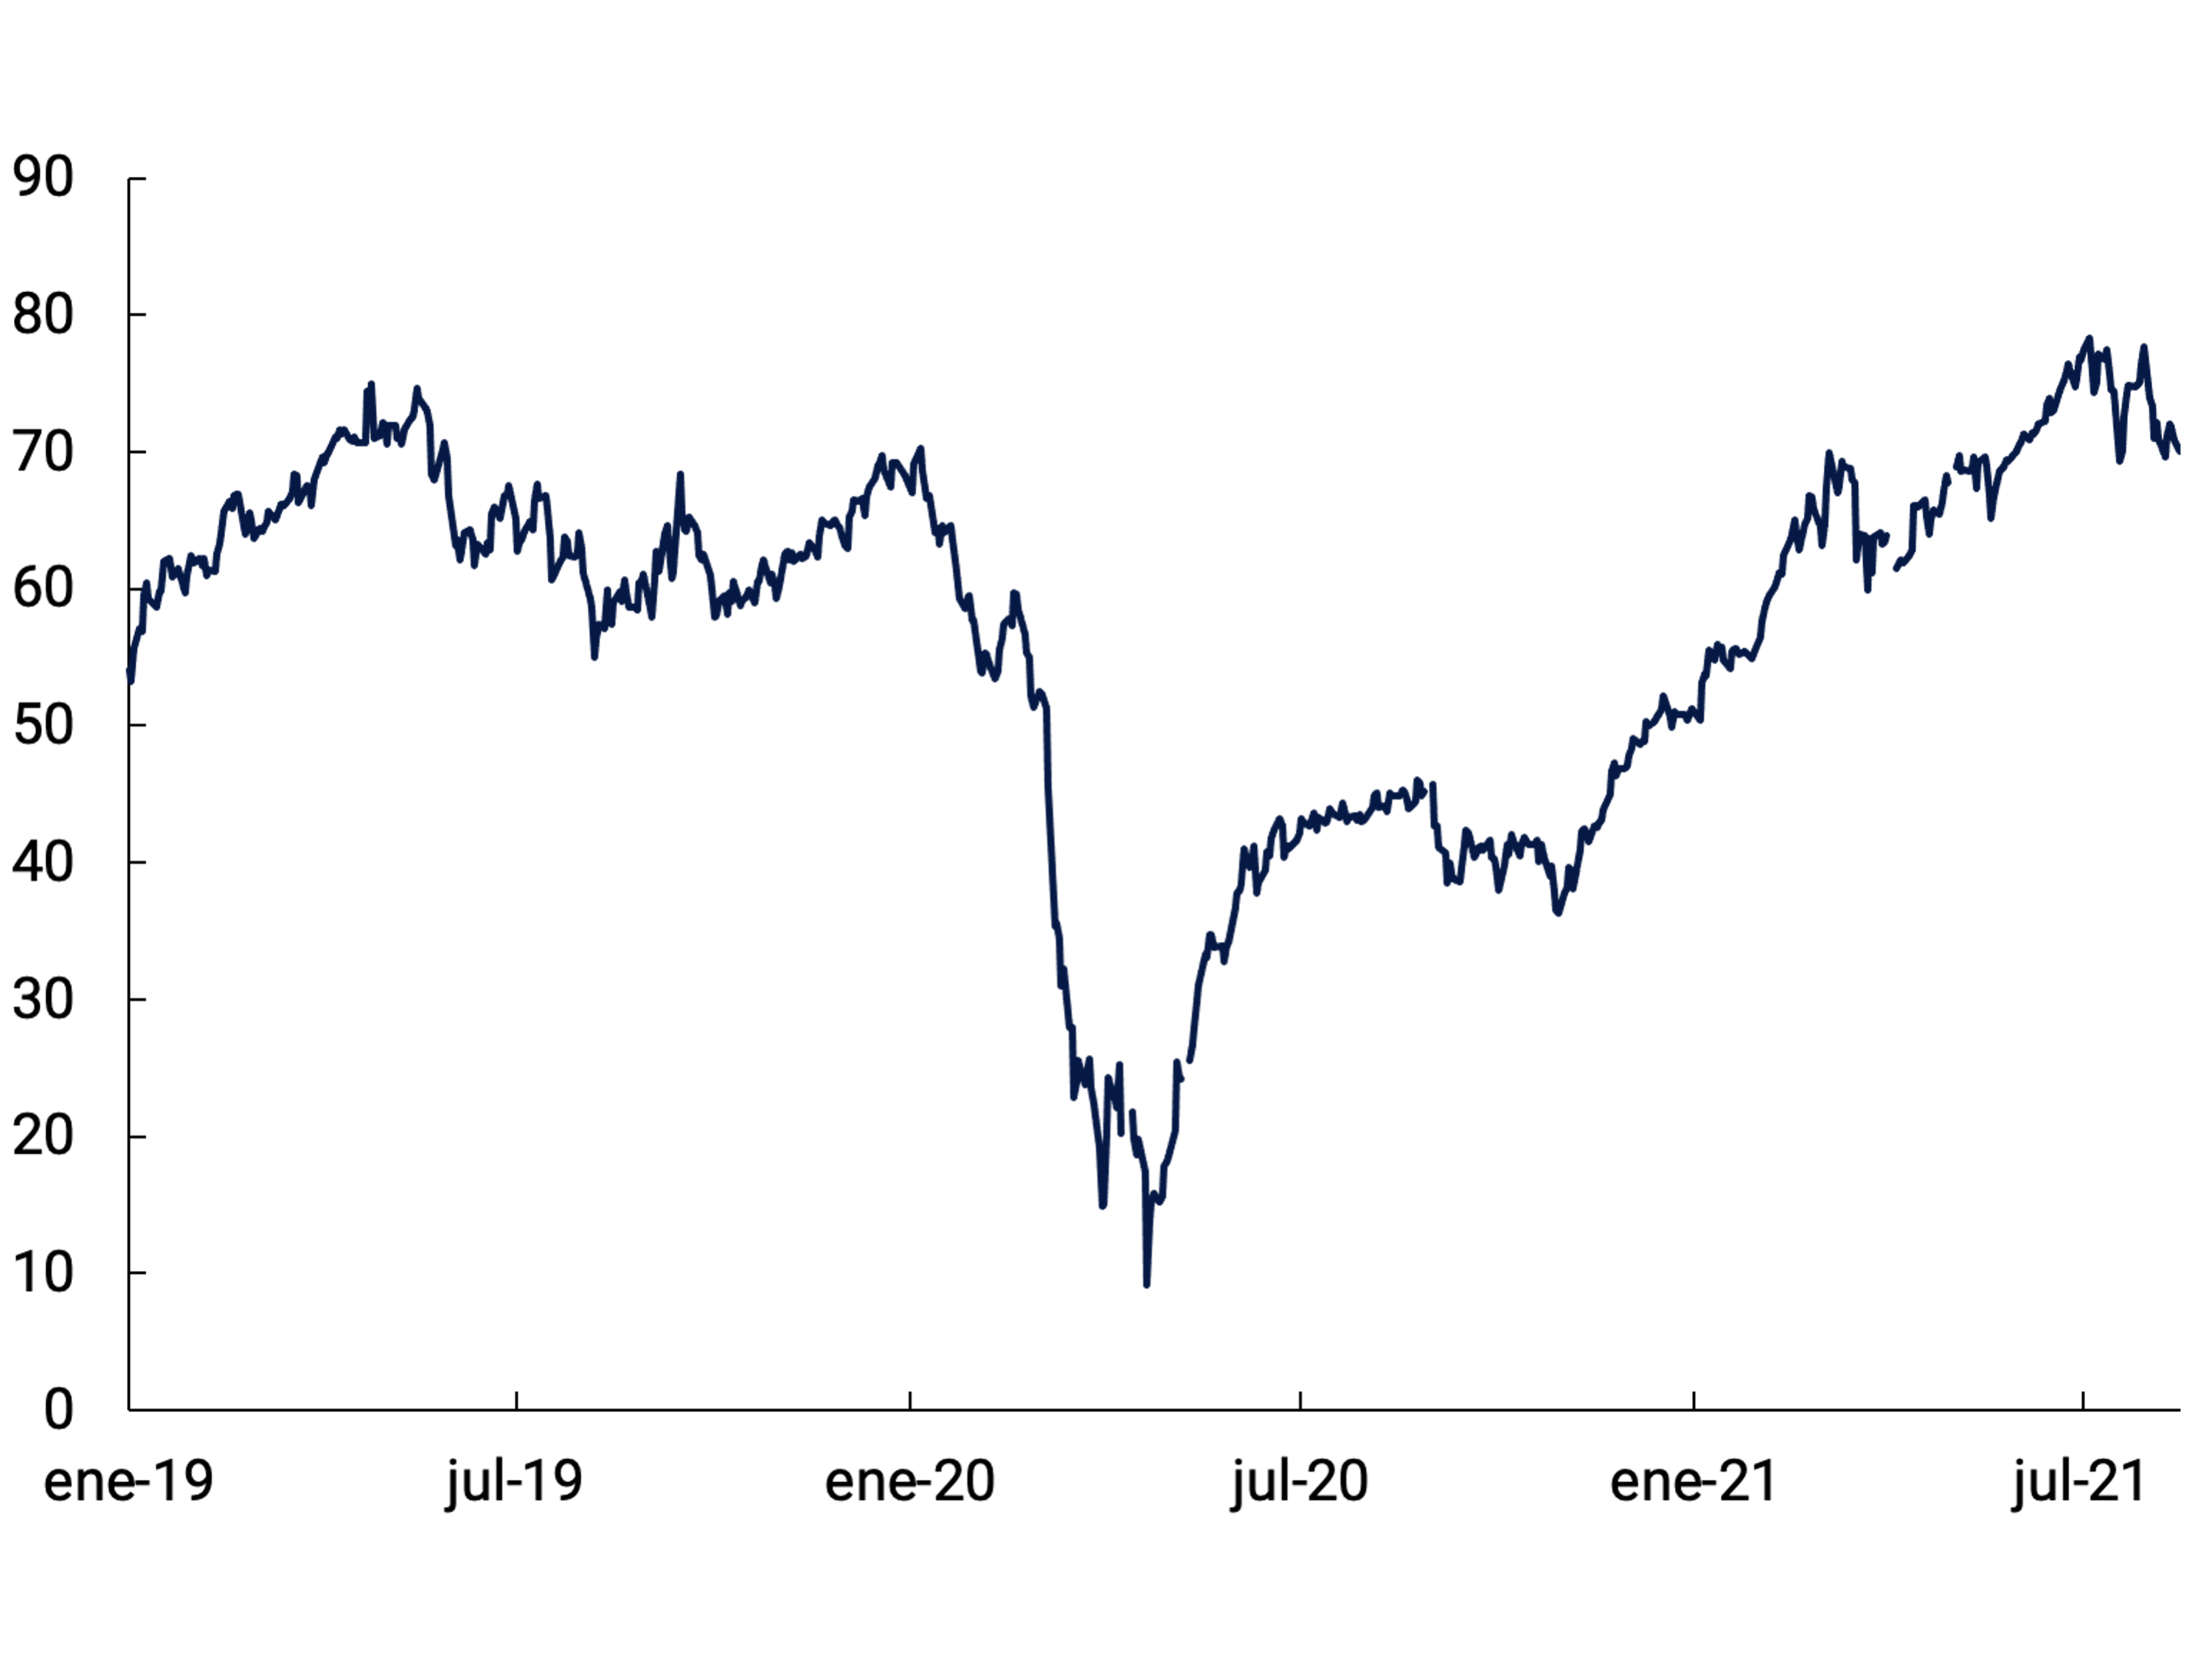
The market seemed to adhere to the thesis that the highest inflation in these months is a transitory phenomenon. Thus, despite the possibility of the Fed’s first rate hike for 2023 having been brought forward, the rate on the 10-year bond fell from the peak of 1.77 at the end of March and is already below 1.30 (see Figure 2.15). In addition, the differentials between long-term interest rates and short- and medium-term interest rates are falling, making the yield curve less steep. This is relevant because the increases in long rates and the steepening of the curve tend to be detrimental to capital flows to emerging markets. Meanwhile, the U.S. dollar hit a low in late May and from there began to appreciate against a basket of currencies. Finally, in Europe there was also a reversal of the rise at the beginning of the year, with the 10-year bond rates of the most relevant countries falling between 35 and 50 basis points since the close of the previous IPOM (see Figure 2.15).
Figure 2.15 |
U.S. government bond yields and dollar index

Yield on 10-year European government bonds

Global stocks continued to rise, although at a slower pace than in the first months of the year. The U.S. S&P 500 was up 17 percent for the year, while Europe’s Stoxx 50 rose 16 percent over the same period. Stock markets surpassed pre-pandemic levels: for example, the S&P 500 was 36% above the end of 2019. This was in addition to some indications of “irrational exuberance” or disconnection of prices from their fundamentals, such as the prices of cryptoassets, euphoria with some particular stocks or, more recently, the rise in property prices in advanced countries. The outlook raised doubts about the sustainability of the quotations.
Capital flows to emerging countries did not have large movements. Net revenues were recorded between the end of May and mid-June, and have turned negative since then, to end with a neutral accumulated balance since the close of the previous IPOM. Compared to previous months, less volatility was noted in flows.
2.5. In summary
The evolution of the pandemic continues to represent the main risk to the global economy: in the face of the spread of the Delta variant of COVID-19, fewer hospitalizations and deaths have been recorded so far in the countries with the greatest progress in vaccination. The disparities in the vaccination process are reflected in the prospects for global economic recovery, which continues but is becoming more unequal between advanced and developing countries. The latter is also due to the smaller fiscal and monetary policy space available to the latter. Faced with higher global inflation, developing countries tend to react faster by raising interest rates, limiting the use of countercyclical monetary policy.
Finally, although global interest rates reversed the increases at the beginning of the year, there is a risk that, for example, in the face of higher inflation, there will be new increases in long-term interest rates that will generate financial turbulence and capital outflows from emerging countries. The quotes of various asset groups, including cryptocurrencies, also pose a significant risk, as the real fundamentals behind their quotes are not very clear.
3. Economic Activity and Employment
Economic activity fell in the second quarter of the year as a result of the outbreak in the country of the second wave of COVID-19 infections since the end of March. This interrupted an economic recovery that had begun in the third quarter of 2020, but only temporarily. The available data from the EMAE for June allow us to infer that a level of activity similar to that of last March has already been recovered, while, according to the evolution of various leading indicators, in July activity would have sustained its recovery.
The second wave led to the implementation of new restrictions on movement until the end of May. These measures had a greater impact on the sectors most affected by the limitations on mobility and health protocols. In line with the progress made in the vaccination process and the improvements made in the health system, the restrictions applied had a much shorter duration and impact compared to the first wave of infections that had begun in March last year, which allowed activity levels to recover more quickly. At the same time, in order to limit the impact of the new context on the social and productive fabric, the National Government maintained support policies focused on the productive sectors and social assistance to the most affected families.
Going forward, the greater coverage of the population with the application of the first dose and the expected progress in the vaccination process with complete schemes would significantly reduce the possible impact of the circulation of new strains of the virus on the level of activity. In any case, as observed in other countries, it cannot be ruled out that the circulation of new variants of the virus could postpone the conclusion of the economic normalization process.
3.1. In the third quarter, activity showed signs of continuing on the path of recovery, interrupted during April and May by the second wave of COVID-19 infections
The accelerated increase in COVID-19 cases and deaths from the end of March led to the partial and temporary tightening of health restrictions7, with a negative impact on economic activity in April and May. In order to mitigate the impact of this second wave, the National Government continued to implement support policies during the second quarter focused on productive sectors8 andhouseholds 9 most affected by the pandemic and others aimed at promoting strategic sectors in order to foster a sustainable and inclusive economic recovery. For its part, the BCRA contributed to the economic recovery process by sustaining and expanding credit lines for both productive and consumer purposes (see Chapter 7. Monetary Policy).
In line with the progress made in the vaccination process, the curves of infections and deaths began to fall at an accelerated and sustained pace starting at the end of May (see Figure 3.1). As a consequence, and as anticipated in the previous IPOM, the limitations on movement and trade had a much shorter duration and impact compared to the first wave of infections in March last year, which allowed activity levels to recover more quickly.
Figure 3.1 | Vaccination process. New cases and deaths from COVID-19
Per 100 thousand inhabitants.- last moving average 7 days


The Monthly Estimator of Economic Activity (EMAE) adjusted for seasonal factors (s.e.) accumulated a contraction of 2.7% s.e. between April and May and in June it recovered 2.5% monthly s.e. Thus, after registering an increase of 2.6% s.e. in the first quarter, the Product would register a transitory fall of 1.6% quarterly s.e. in the second, lower than initially forecast by market analysts10.
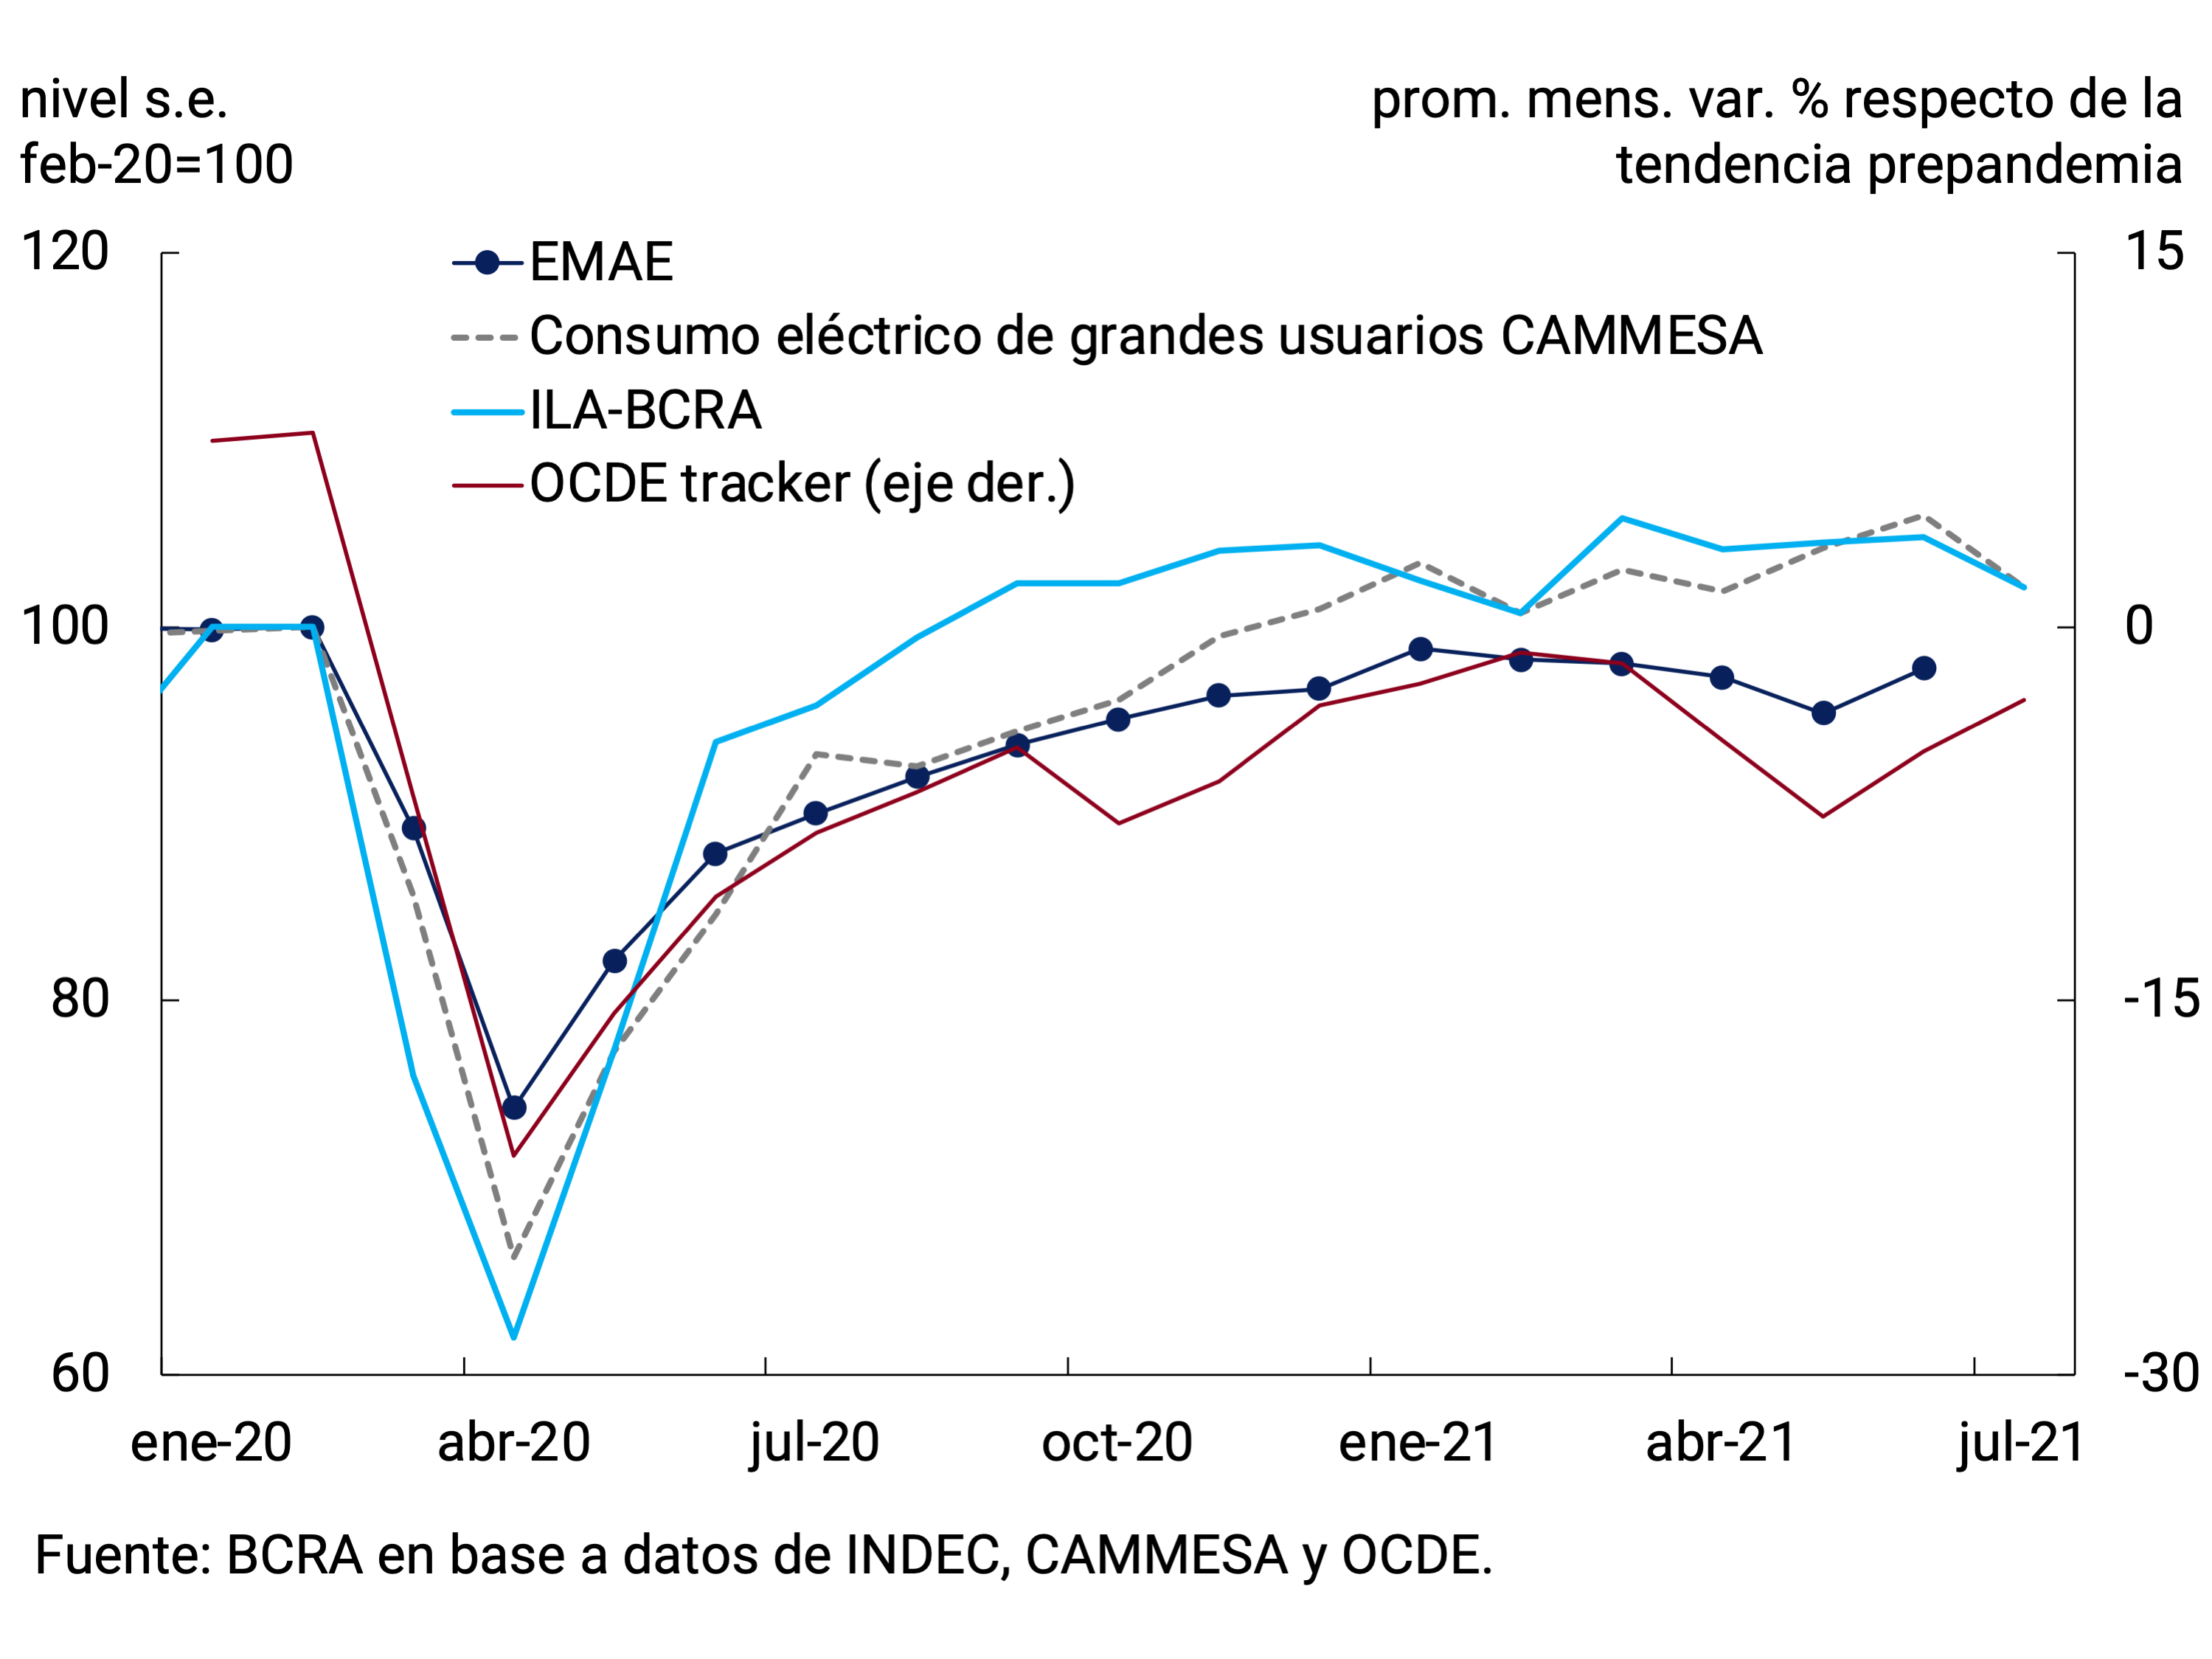
The high-frequency data available for the third quarter anticipate a recovery in economic activity linked to the decline in infections in the face of the acceleration of the vaccination process throughout the country. The Leading Indicator of Economic Activity (ILA-BCRA) remained in the recovery phase11 (see Figure 3.2). For its part, the OECD indicator registered a strong rise in June and continued to increase in July (See Section 2 / The OECD monitors economic activity on a weekly basis).
Figure 3.2 | Monthly indicators of economic activity
3.1.1. The impact of the second wave of infections on private consumption was limited
In the first quarter of 2021, GDP recovered 2.6% quarter-on-quarter and was 2.1% below its level in the last quarter of 2019. Domestic demand – total domestic expenditure on consumption and investment – recovered again at a faster pace (3.3% quarterly s.e.), bringing it closer to its pre-pandemic level (-0.4% s.e.). Private consumption grew 2.9% qoq s.e. (-0.7% y.o.y.), public consumption increased 1.4% s.e. (-0.5% y.o.y.) and investment12 by 6.1% qoq s.e. (38.4% y.o.y., see Figure 3.3). Exports of goods and services increased 19.2% qoq s.e. (1.2% y.o.y.) and imports, 13.5% qoq s.e. (18.8% y.o.y.).
Figure 3.3 | GDP and main components of demand
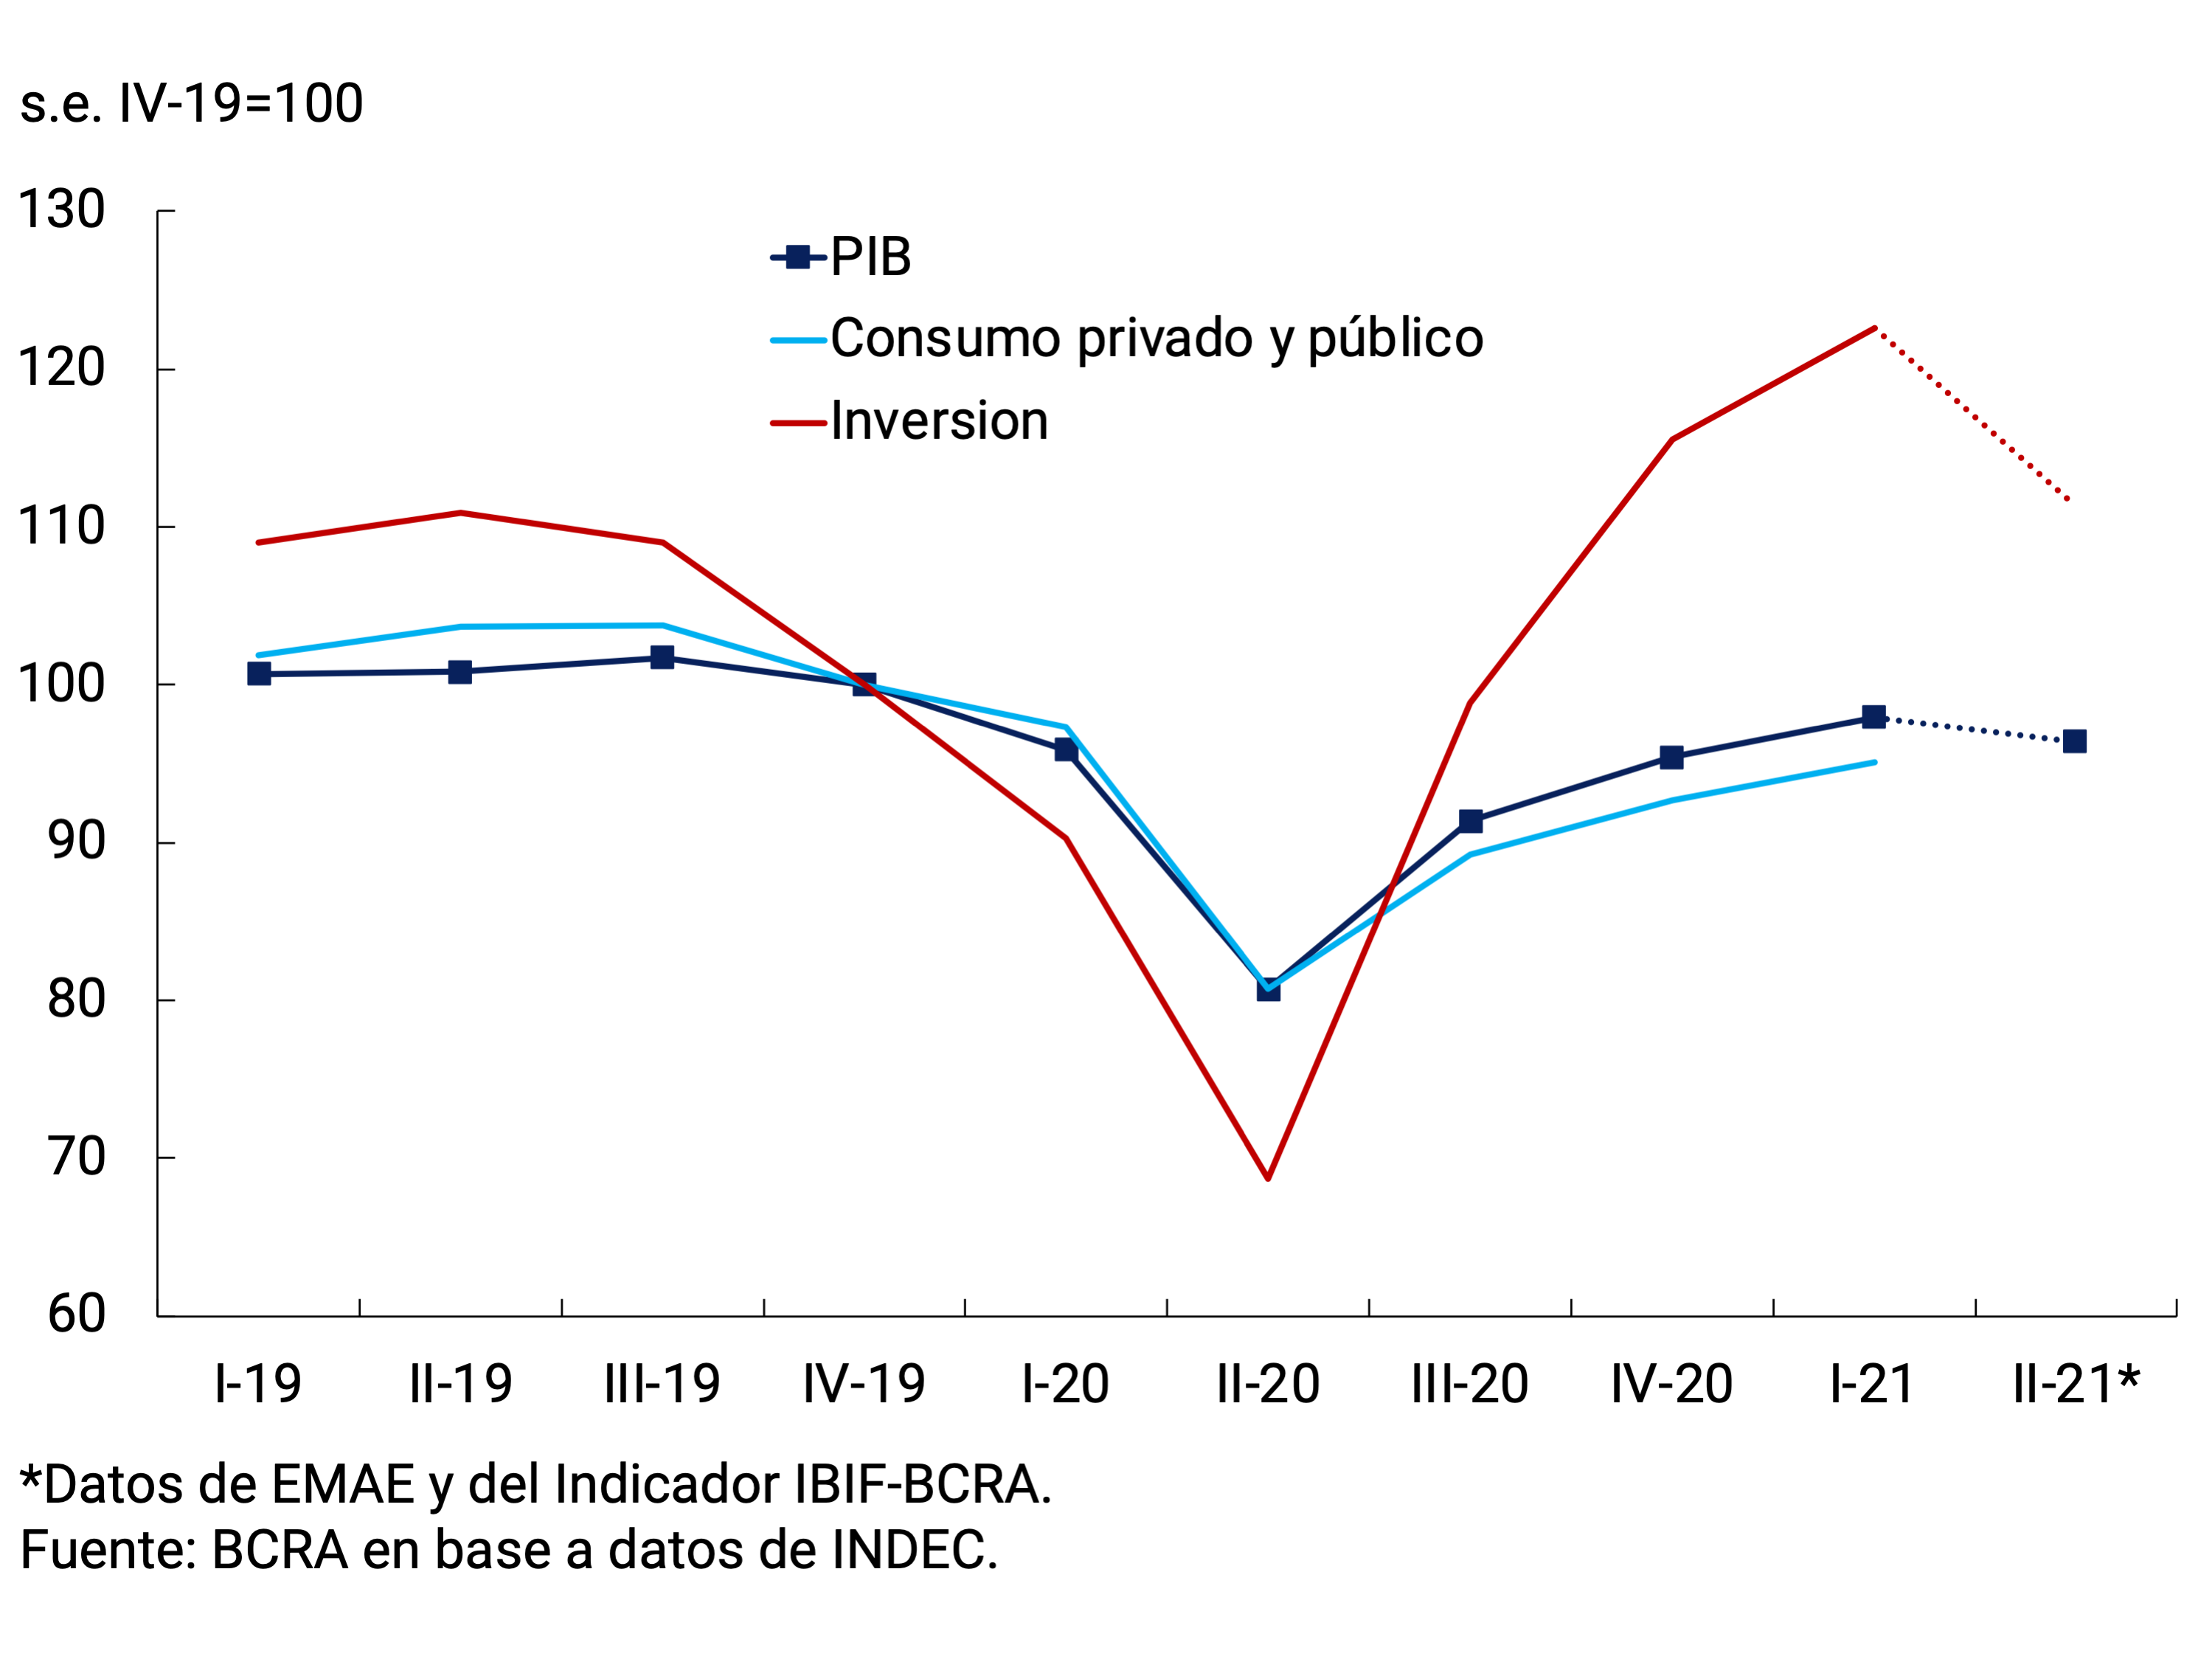
Advance data for the second quarter of 2021 indicate that the component of demand most affected by the second wave of the pandemic was investment, although the magnitude of the fall was a third of that observed in the second quarter of 2020. The IBIF-BCRA indicator showed a quarterly contraction of 9.2% s.e. with decreases in all its components13. The available statistics for the third quarter allow us to estimate a rapid recovery. Firstly, due to the high statistical drag left by the good performance of the different indicators in the month of June: cement shipments in the domestic market increased 2.4% s.e., the national production of capital goods rose 14.2% monthly s.e. according to FIEL14 and the imported quantities of capital goods grew 3.6% s.e. in the month.
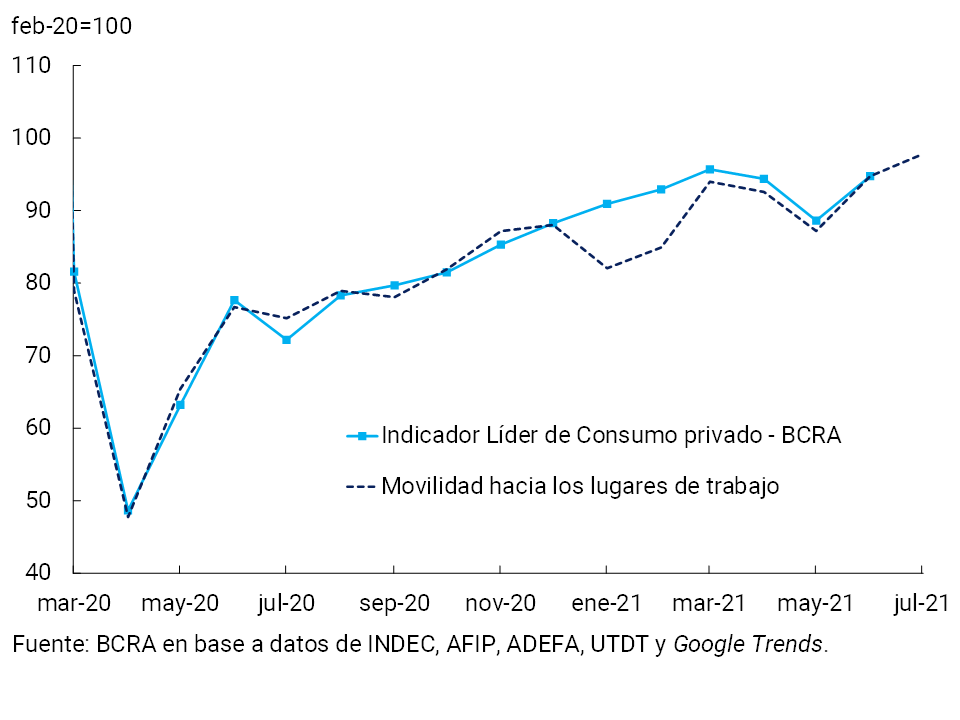
As for private consumption, the BCRA Leading Indicator15 shows two consecutive monthly falls in April-May and then a recovery in June, approaching the seasonally adjusted levels of April. The magnitude of the contraction in private consumption in May-21 is comparable to that observed in Jul-20, when social mobility had been restricted and the Buenos Aires Metropolitan Area had returned to phase 1 for fifteen days (see Figure 3.4). The gradual recovery in private consumption – although still below pre-pandemic levels – also reflected the sustained recovery in employment and the evolution of real wages.
Figure 3.4 | Evolution of private consumption and social mobility
With respect to the external sector and according to the information referring to the Commercial Exchange of Goods of INDEC, in the second quarter the contribution of net exports of goods and services to the quarterly variation of the Product would have been negative. Exported quantities of goods registered a quarterly fall of 1.1% s.e. while imports increased 1.2% s.e. in the same period (see Chapter 4. External Sector).
3.1.2. The second wave of infections temporarily accentuated the sectoral disparity in activity
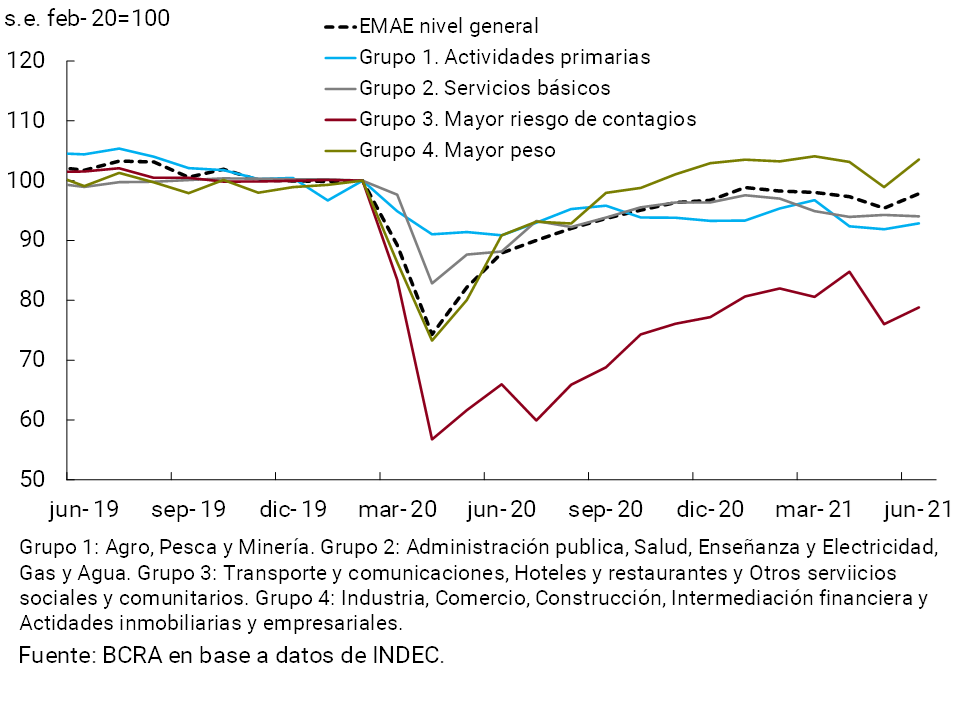
In the first quarter of 2021, the recovery in economic activity was widespread among the different productive sectors. Of the 16 blocks that make up GDP, 14 registered seasonally adjusted increases in relation to the previous quarter, highlighting the performance of those services that had been most affected by the pandemic: Hotels and restaurants (30.7% quarterly s.e.) and Other community service activities, including social and recreational activities (10.7% quarterly s.e.) and Transport and communications (4% quarterly s.e.). In any case, those sectors with the highest risk of contagion were unable to recompose their previous levels of activity16.
The group made up of the sectors with the greatest weight in GDP – due to their production chains and employmentlevels 17 – showed a joint growth of 2.6% quarterly s.e. in the first quarter, thus exceeding the level of activity recorded in the fourth quarter of 2019 by 4.6%. The rest of the sectors can be categorized as primary activities (Agriculture, Fishing and Mining and Quarrying) and basic services (Health, Education, Public Administration and Electricity, Gas and Water). The activity of these two groups also increased in the first quarter of the year (1.6% and 0.4% quarter-on-quarter s.e., respectively), standing around 5% below the pre-pandemic level.
The reestablishment of restrictions on social mobility between April and May, initially at night and then longer, had an unequal impact on the different productive groupings in the April-May two-month period. As could be anticipated, the group with the highest risk of contagion suffered the greatest impact, accumulating a 5.6% s.e. contraction in those two months. Industry, included within the group with the greatest weight in GDP that fell by 5% s.e. in the April-May two-month period, was affected in addition to health restrictions and absenteeism due to COVID-19, by the limitation of the use of oxygen, prioritized for medical use (which would also have caused shortages of supplies for construction) and also by the measure of force to cease the marketing of livestock products in the last weeks of the month.
The acceleration in the vaccination process and the strengthening of the health system made it possible to apply social isolation measures that were much lighter in intensity and duration compared to those in force in March and April 2020. Thus, in June, the health situation allowed the gradual lifting of restrictions and sectoral activity regained dynamism (see Figure 3.5).
Figure 3.5 | Sectoral economic activity by group
3.1.3. The labour market continued its recovery, approaching pre-pandemic levels
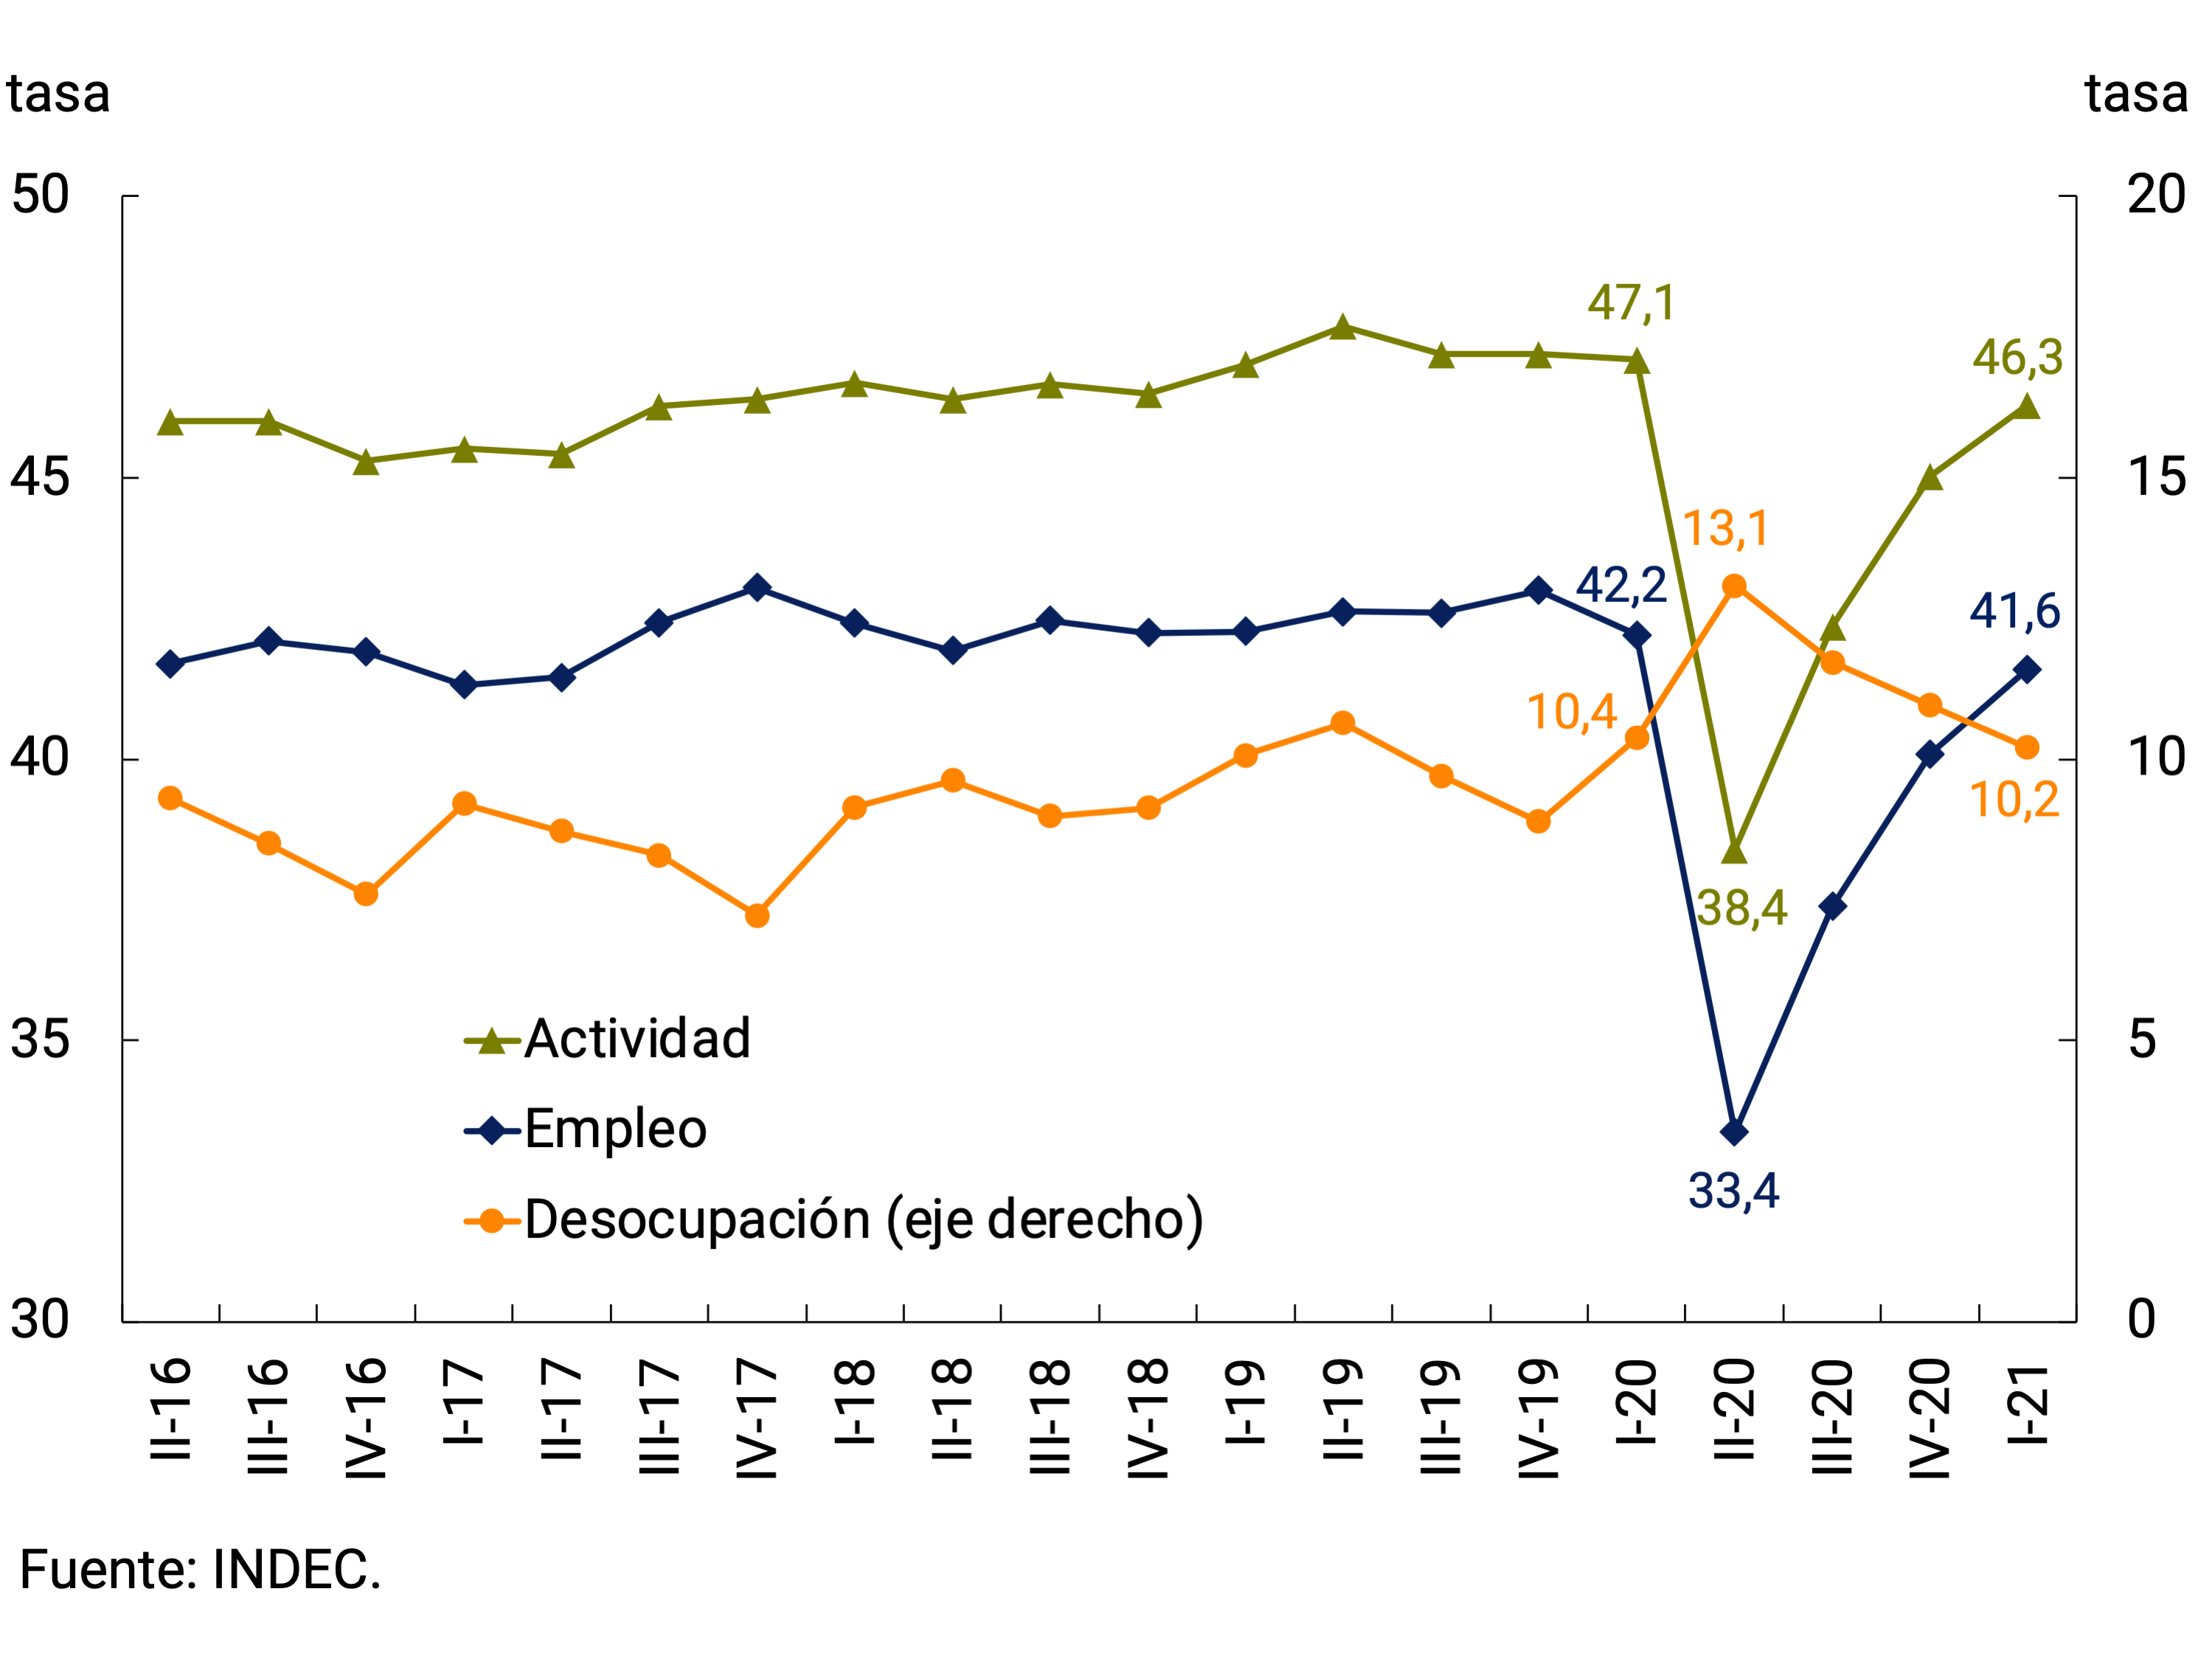
During the first quarter of 2021, the labour market extended the recovery seen in the previous two quarters. The Employment and Economically Active Population (EAP) rates were slightly below the levels in force in the first quarter of 2020 (-0.6 p.p. and -0.8 p.p. respectively). The open unemployment rate stood at 10.2% and showed a reduction of 0.2 p.p. compared to that of the first quarter of 2020 (see Figure 3.6).
Figure 3.6 | Main labour market rates
In terms of labor transitions, the labor market normalization process presented, at the beginning of 2021, the same trend observed during the fourth quarter of 2020. The increase in the number of employed people (862 thousand) was fueled by both the inactive (553 thousand) and the unemployed (309 thousand)18. Although the labor market has been normalizing, some particularities can be observed, both at the sectoral level, age range, gender and occupational categories, related to the effects of the pandemic that still persist (see Section 3 / Main characteristics of the labor market recovery).
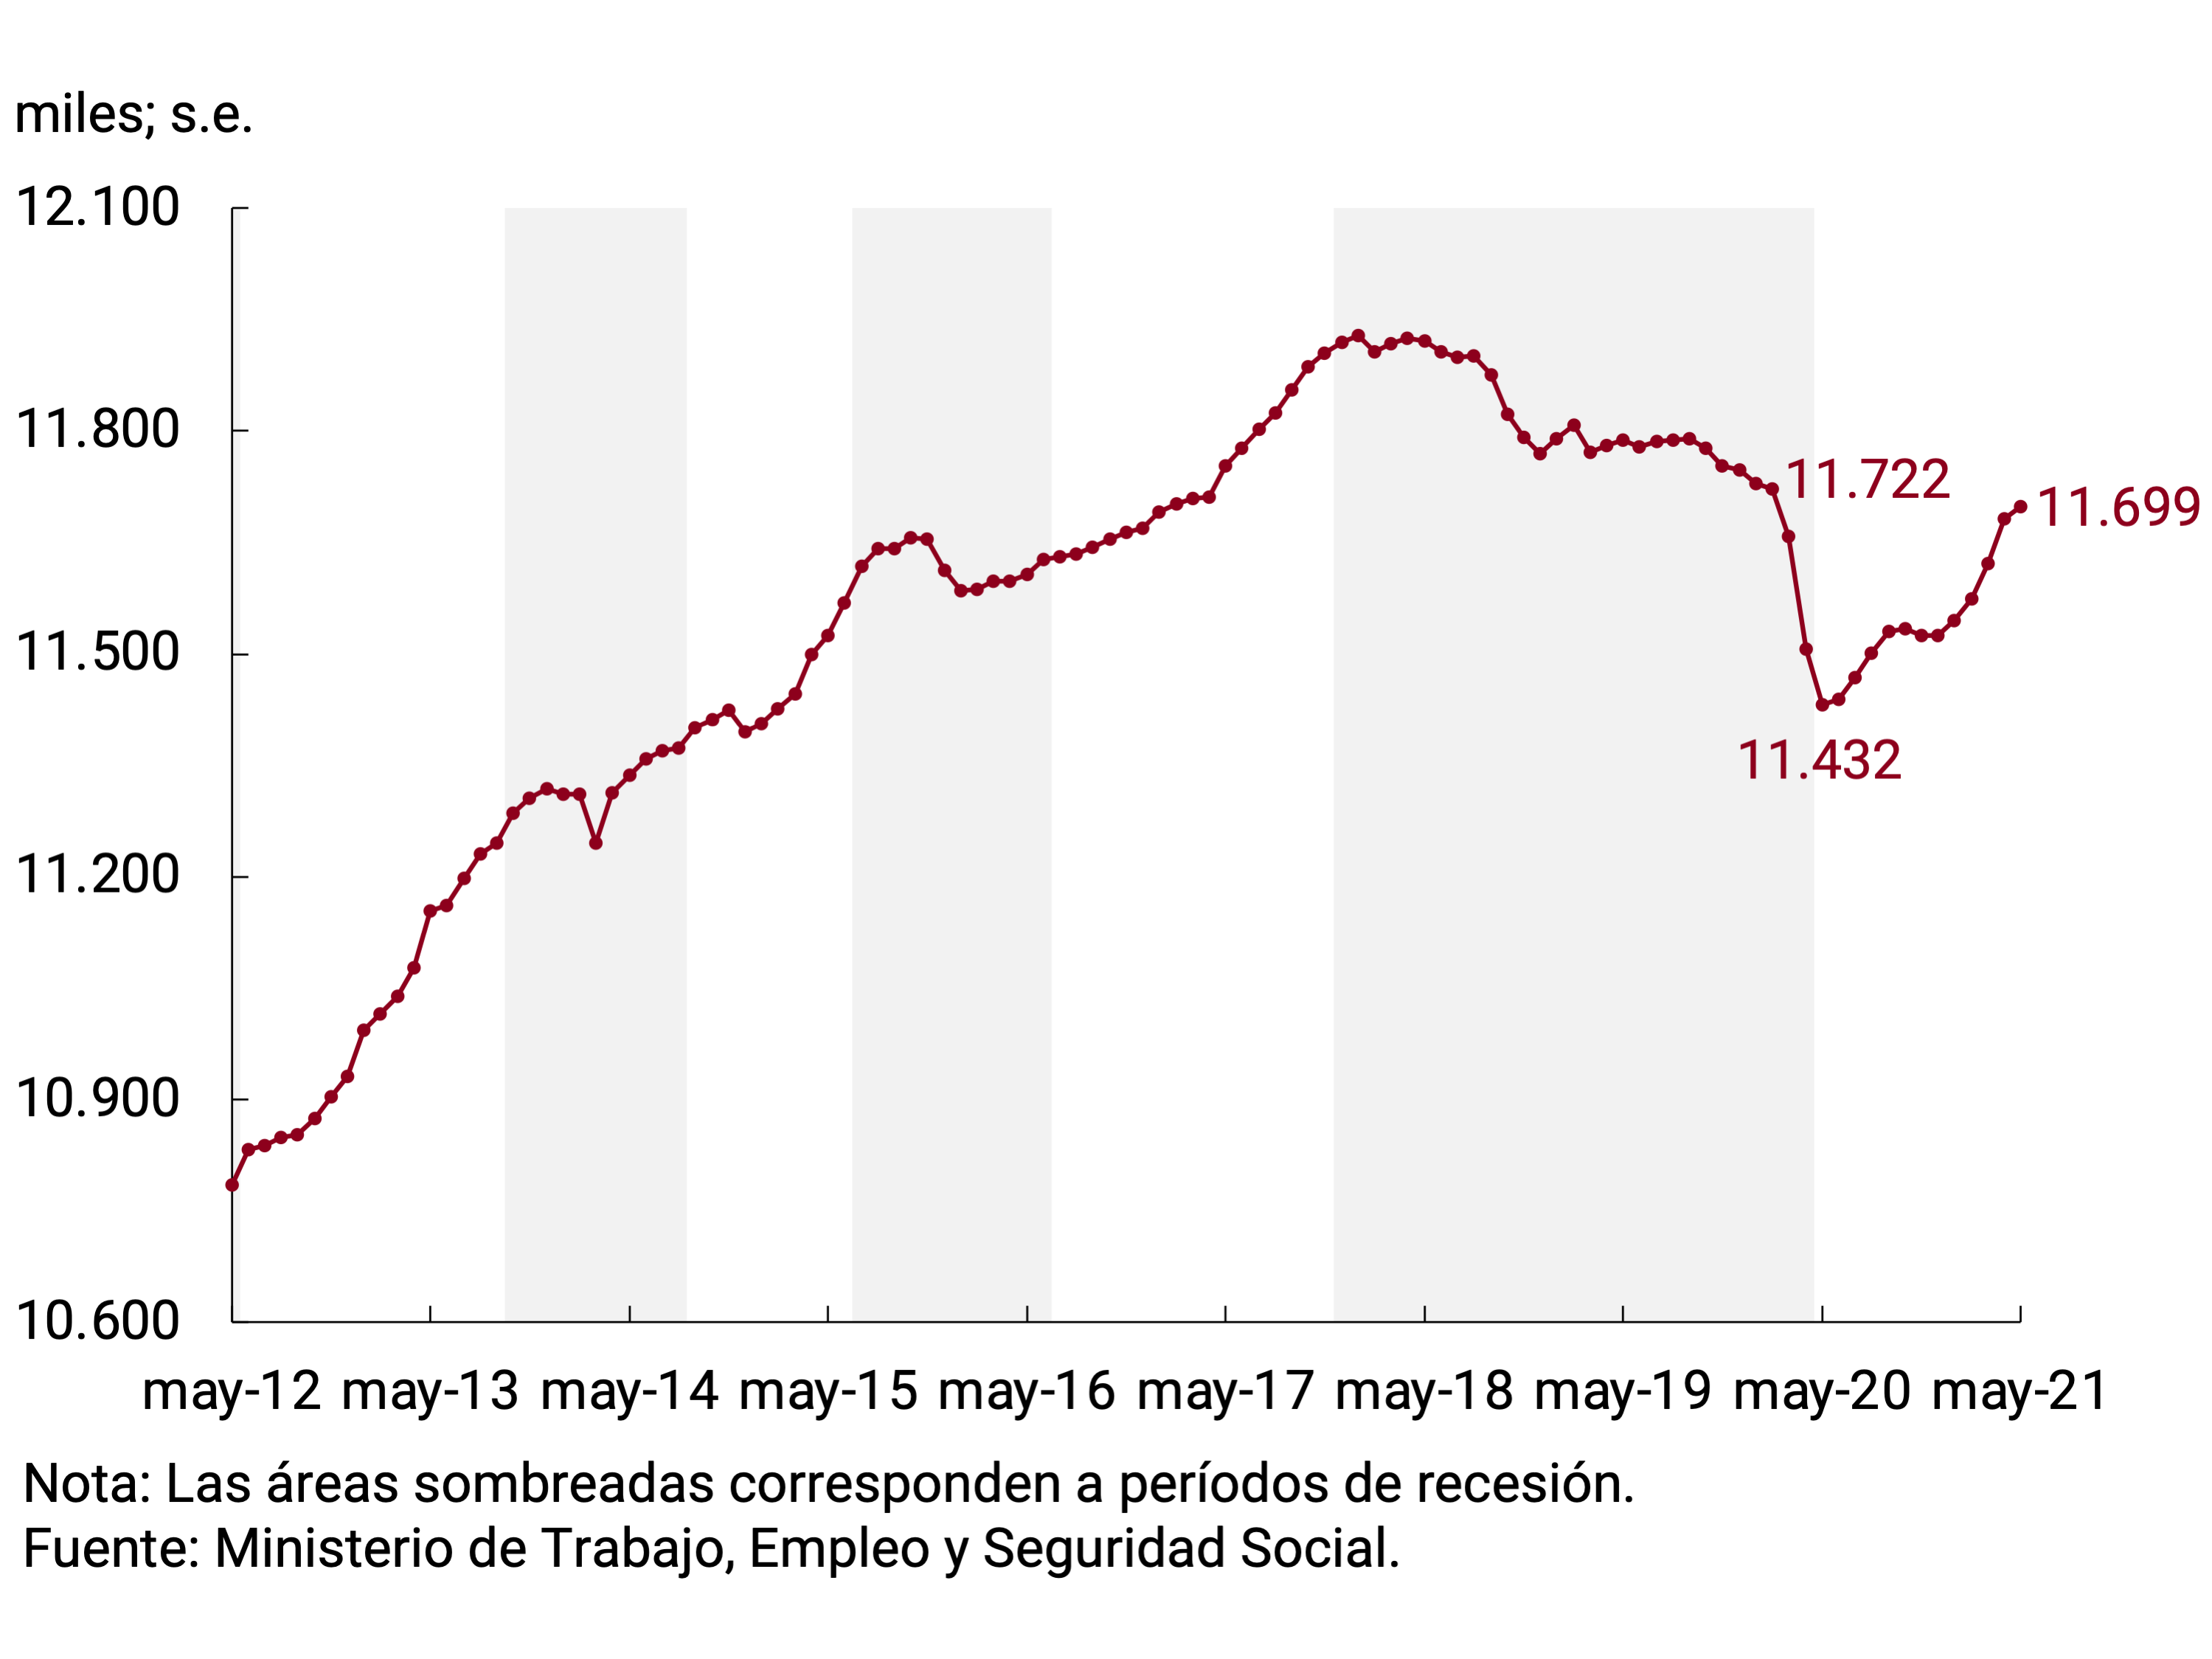
According to the Ministry of Labor, Employment and Social Security, total registered employment maintained the positive trend in April and May, accumulating a 1.5% s.e. increase in the first five months of1919 and reaching an improvement of 2.3% s.e. from the pandemic floor (May 2020; see Figure 3.7).
Figure 3.7 | Total registered employment
This recovery in total registered employment is related to a positive dynamic of registered salaried employees since the beginning of the year. In particular, public wage earners grew 1.6% s.e. since December 2020 while the private sector showed a cumulative increase of 1.5% s.e. since the same period. This growth was complemented by the sustained rise in registered self-employment (single-tax and self-employed persons; 1.8% s.e. since December 2020) despite a slight drop in the margin (see Figure 3.8).
Figure 3.8 | Public, private, private salaried and self-employed employment
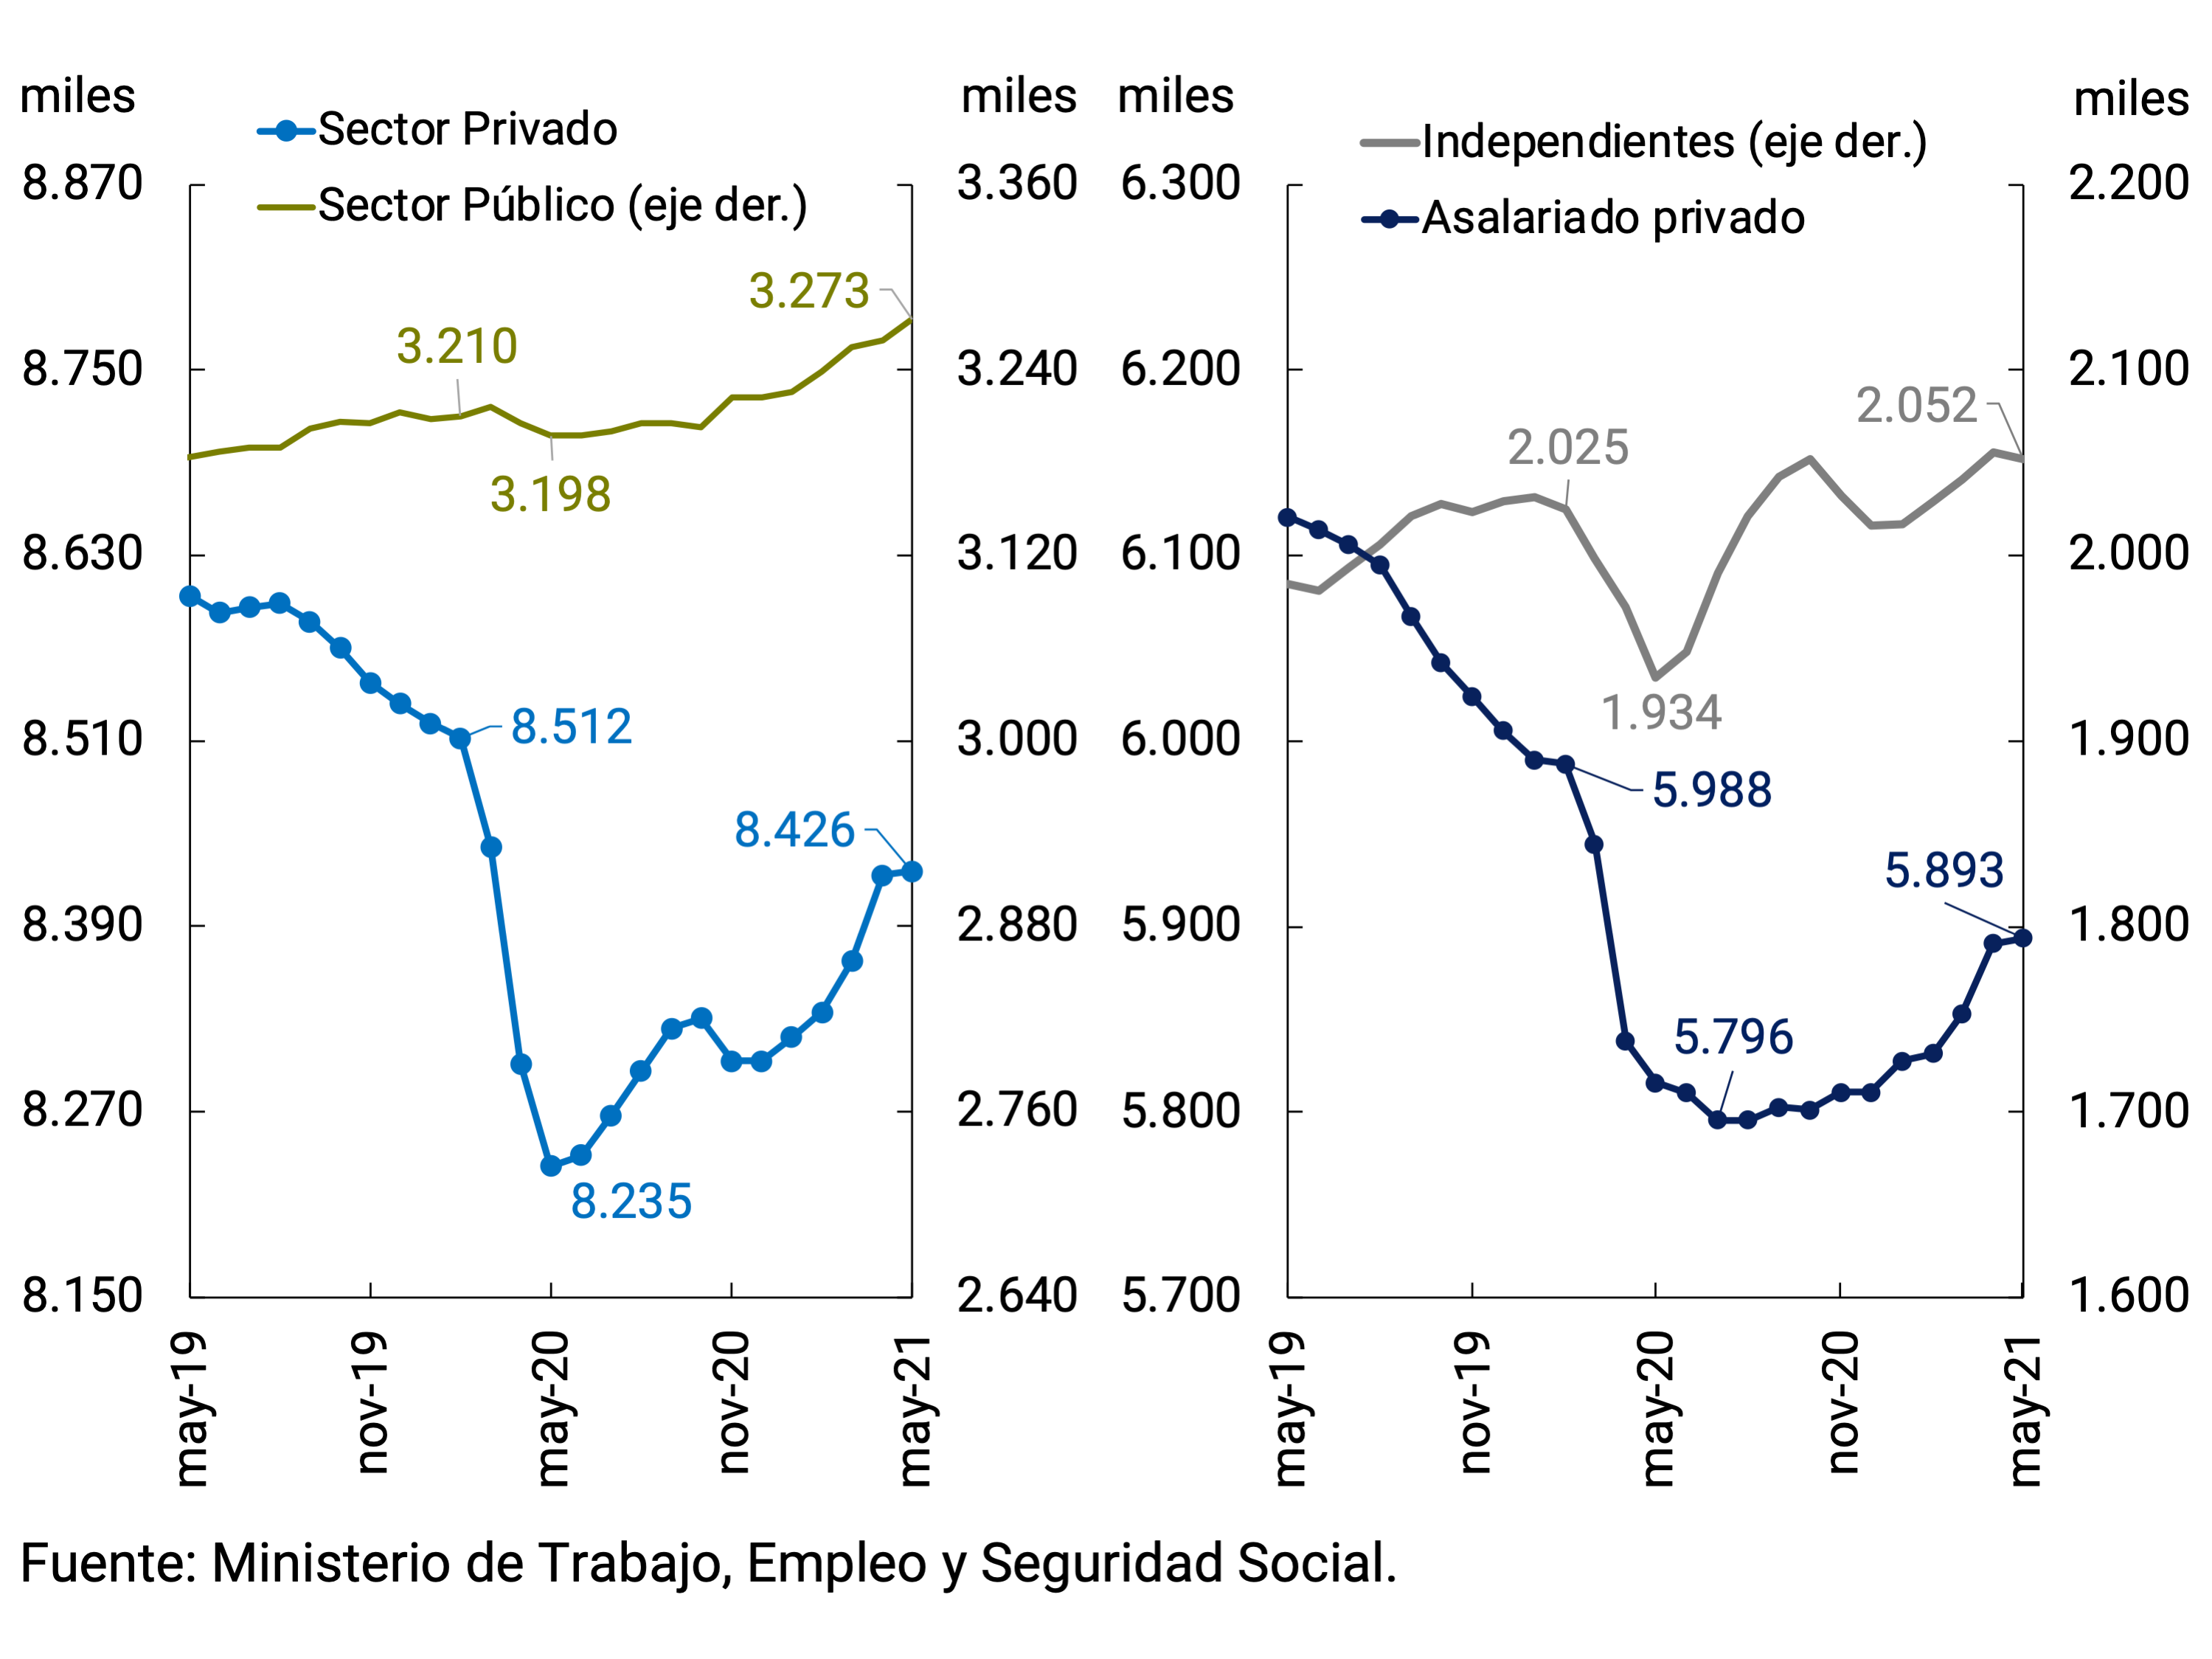
The behaviour of private salaried employment allows us to distinguish at the sectoral level a greater dynamism in sectors such as Real estate, business and rental activity, Manufacturing industry and Construction since June 2020. On the other hand, the branches economically most affected by the pandemic (Transport and Hotels and restaurants) continued with the process of falling in the level of employment in the same period.
The Labor Indicators Survey (EIL) as of June 2021 shows a positive trend in net hiring expectations, added to the stability in suspensions and in the dismissal rate. Net expectations for hiring personnel three months ahead remained in positive territory between February and June, with values ranging between 0.5 p.p. and 2.4 p.p. The suspensions, after a persistent drop from their peak in May 2020, stabilized. For its part, despite the validity of decree 413/202120 , the dismissal rate showed increases in April, May and June, approaching the historical average.
3.2. Perspectives
Based on a wide level of coverage of the population vaccinated with first doses, a large part of the at-risk population and strategic personnel inoculated with complete schemes21, and given the expected availability of vaccines from both international and local suppliers for the rest of the year, it is expected that economic activity will continue to travel the path of recovery towards a new normal. The National Government recently provided the Recovery Plan for Sustained and Progressive Activities, which includes new openings and flexibilizations of activities such as domestic group and international tourism in the coming months. The enabling of the most lagging economic activities, together with the progressive return to face-to-face work of various sectors in both the public and private sectors, would contribute to concluding the process of recovery of activity in the coming months and consolidating a new normality.
However, the activity scenario presents several risks, among which is mainly an eventual and still uncertain impact of the circulation of the Delta variant of the virus in the country, which could temporarily slow down the process of economic normalization, as is the case in other countries. It should be noted that the emergence of new strains of the virus also represents a downside risk in the global recovery scenario. Conversely, greater international cooperation on vaccines could end the health crisis sooner than expected and allow for a faster normalisation of activity in emerging and developing countries.
The upward revision of the prospects for economic growth on a global scale and the terms of trade at levels close to the maximum will continue to favor our country’s exportable balances. Thus, the international context continues to be favourable, although it is not without risks (see Chapter 2. International Context).
In the coming months, the BCRA will continue to deploy an exchange rate policy that favors monetary stability and allows for the efficient management of international reserves, while continuing to promote productive credit (see Chapter 7. Monetary policy). The National Government will continue to carry out the necessary policies to sustain the incomes of the families that need it most, assisting the strategic productive sectors or those that were left behind by the characteristics of the economic recovery22 and stimulating public and private investment, without neglecting the sustainability of the public accounts (see Chapter 5. Public Finance).
The seasonally adjusted data from the EMAE for June left a statistical drag of 1 p.p. of growth for the third quarter and 6.9 p.p. for 2021. The economic growth expectations of the main market analysts, compiled by this Central Bank through the Market Expectations Survey (REM), were successively corrected upwards and underestimated the magnitude of the economic recovery from the third quarter of 2020 onwards. This bias on the evolution of economic activity is observed even in the second quarter of 2021 (see Figure 3.9).
Figure 3.9 | Projections of economic activity of the REM
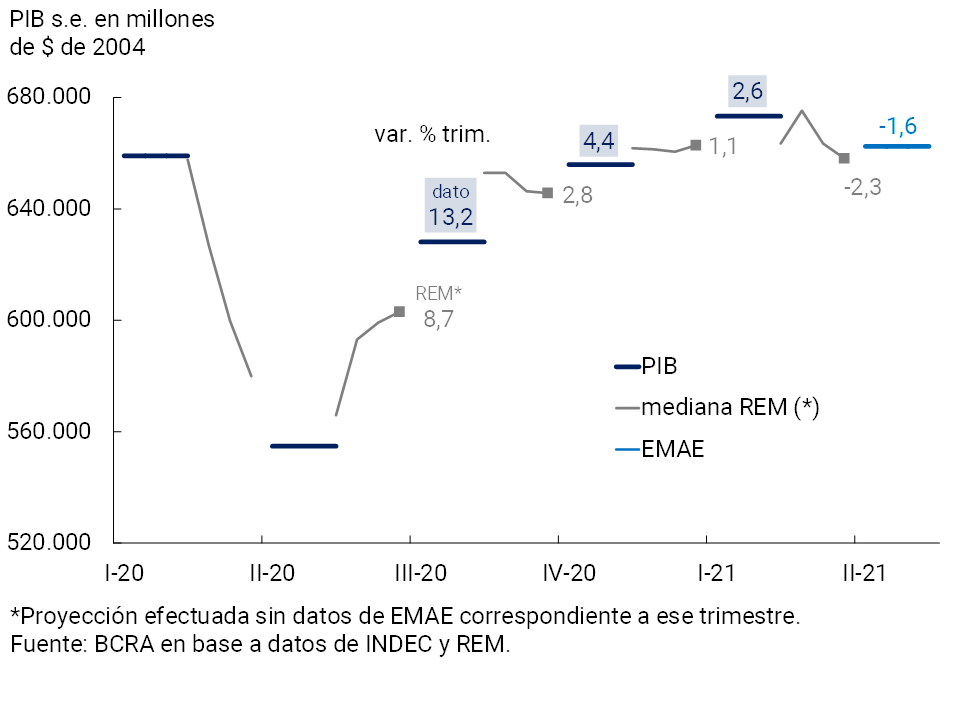
The latest available edition of the REM, corresponding to July 2021, indicates an expectation of GDP recovery of 0.5% quarterly s.e. for the third quarter and 6.8% annually in 2021 (+0.5 p.p. compared to the previous month). The International Monetary Fund (IMF) also improved our country’s growth projections for 2021 in July to 6.4% year-on-year (+0.4 p.p. compared to the world economic evolution report published in April), while the Ministry of Economy forecasts a 7% annual increase in GDP.
4. External Sector
As a result of a high trade balance of goods, the economy would have sustained the current account surplus during the second quarter of 2021. Exports of goods reached the highest quarterly record since the second quarter of 2014, driven mainly by the high prices of raw materials exported by the country. On the other hand, imports of goods grew for the fourth consecutive quarter with a notable dynamism of those directly linked to the domestic production of goods, as well as fuels. Data for July suggest that this dynamic of the trade balance of goods continues in the third quarter.
This recovery of exports, added to the evolution of the commercial debt for exports and imports of goods, resulted in a net result for goods in the foreign exchange market of US$12,041 million in the first 7 months of the year. This allowed the BCRA to accumulate net purchases in the foreign exchange market until July for US$7,165 million, a record for this period since 2012. Meanwhile, on August 23, the allocation of Special Drawing Rights by the IMF to mitigate the effects of the pandemic was accounted for around US$4,333 million, which brought the level of international reserves to US$46,306 million.
Going forward, the current account is expected to continue to exhibit balanced records, supported by the trade surplus of goods. The main risk factors for the external sector of the Argentine economy are an eventual resurgence of the pandemic due to the expansion of new strains of COVID-19 and potentially a sharp correction in global financial markets that negatively impacts commodity prices or the activity of the main trading partners.
4.1. In the second quarter of 2021, the economy would have sustained the current account surplus
In the first quarter of 2021 (latest official data available) the Argentine economy recorded a current account surplus of US$690 million – equivalent to 1.1% of GDP in seasonally adjusted and annualized terms. The normalization of shipments of grains and derivatives, after they were interrupted for most of December as a result of a union conflict in the port, favored this result.
In the second quarter of 2021, the improvement in international prices of the main agricultural commodities exported by Argentina allowed the trade balance of goods to be maintained. In this context, the current account is expected to return to a positive balance of around 1% of GDP (see Figure 4.1).
Figure 4.1 | Seasonally adjusted current account. Annualized values
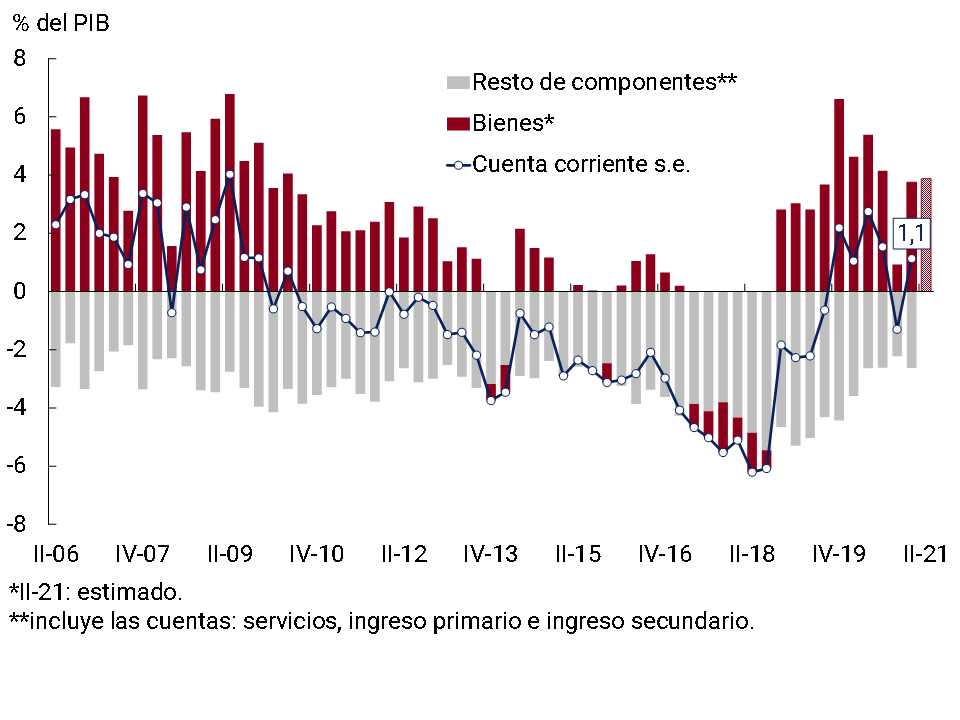
In that period, the exported values of seasonally adjusted goods reached US$18,579 million (FOB), the highest record since the second quarter of 2014. This favorable evolution of exports of goods was mainly due to the performance of export prices, which grew 6% quarter-on-quarter and were comfortably above pre-pandemic levels (see Section 4. Recent performance of agricultural exports). For their part, the exported quantities of goods had a slight drop (1% quarterly s.e.) and are still 6% below the level of 2019. In July, exports in value maintained their upward trajectory (+2% monthly s.e.) again driven by an increase in foreign sales prices.
At the disaggregated level, exported volumes continued to exhibit heterogeneous behaviors in the second quarter. Shipments of Manufactures of Industrial Origin (MOI) grew 7% QoQ. s.e. driven by higher exports of base metals, precious metals and chemicals. On the other hand, foreign sales of Primary Products registered a slight increase (1% QoQ, s.e.), which was explained by the positive drag left by the March-April two-month period. At the grouping level, the increases in cereals and fishing and the fall in oilseeds stood out. On the contrary, the exported quantities of Manufactures of Agricultural Origin (MOA) fell 10% quarter-on-quarter. s.e. negatively affected by the delay in shipments of Argentina’s main export product (soybean meal) derived from the downspout of the Paraná River. Finally, fuel exports fell by 6% quarter-on-quarter. s.e.—due to a negative carry-over effect—, although they showed signs of recovery at the margin.
For its part, between April and June 2021, seasonally adjusted imports of goods totaled US$14,899 million (CIF), 34% above the quarterly average recorded in 2020 and 21% higher than the average for 2019. In the case of external purchases, both higher prices and volumes contributed to the increase in imported values (see Figure 4.2). In July, imports registered a decrease (-3% monthly s.e.) that reflected the performance of imported quantities. In any case, the July data leaves a positive carryover of 4 p.p. of imported values for the third quarter.
Figure 4.2 | Trade in goods. Seasonally adjusted series
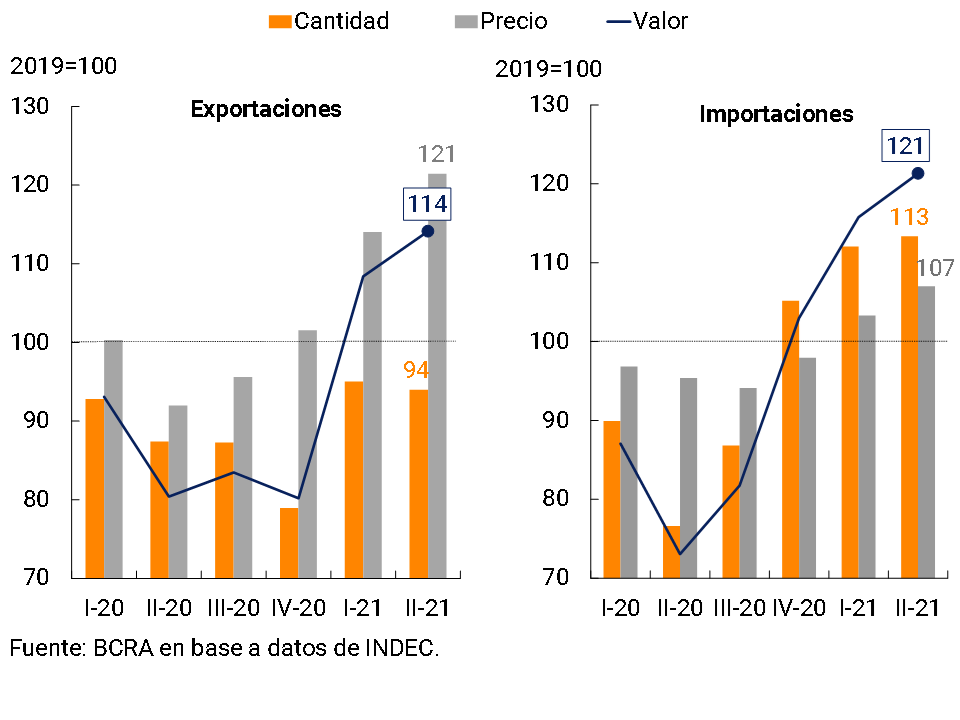
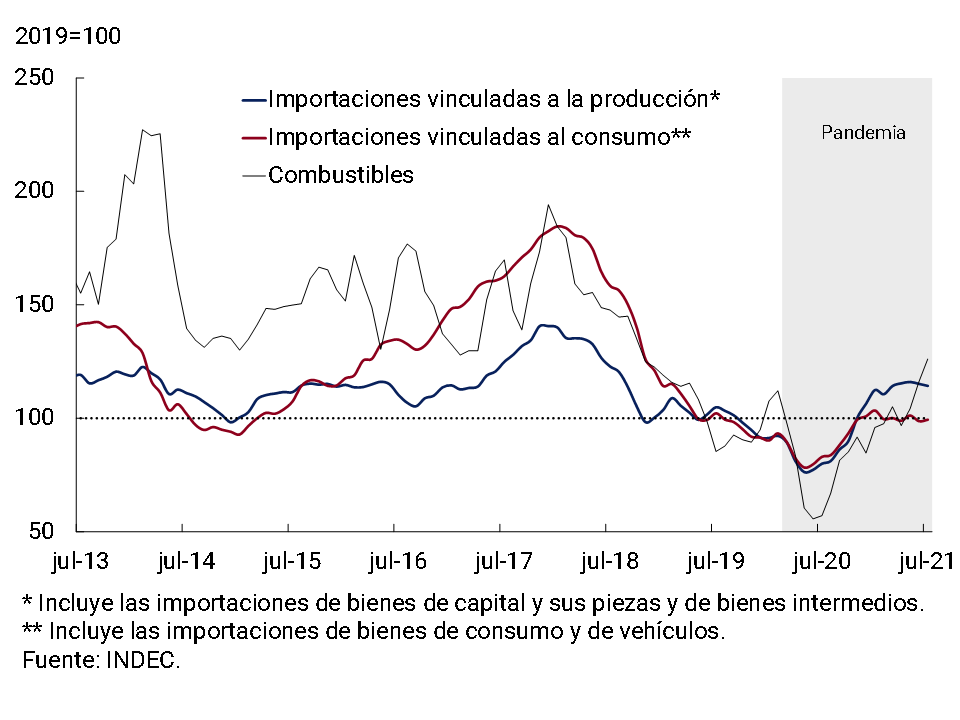
A differentiated behavior was also observed within imports of goods so far this year. In the second quarter of 2021, the quantities imported of uses directly linked to production (capital goods and their parts and intermediate goods) were 8% higher than those of the fourth quarter of 2020 and 15% higher than the average for 2019, which again suggests a good performance of the production of goods (see Chapter 3. Economic Activity and Employment). At the disaggregated level, the increases in the imported volumes of parts and accessories for capital goods (18%), parts and accessories for transport equipment (27%), chemical products – where vaccine purchases are recorded – (13%) and base metals (12%) stood out in this period.
On the other hand, imports directly linked to private consumption have been stagnant since the beginning of the year. Higher purchases of consumer durables, non-durables, and non-industrial transportation equipment were offset by a sharp drop in passenger vehicle imports.
Finally, it is worth noting the sharp increase in imported fuel volumes (+11% QoQ, s.e. in II-21 and +37% compared to IV-20), driven by higher domestic energy demand in a context of lower local gas supply.
Data for July anticipate a similar dynamic for the third quarter of the year (see Figure 4.3).
Figure 4.3 | Quantities imported. Seasonally
adjusted series Mobile Avg. 3 months
Box. Foreign trade prices of goods and terms of trade
In II-21, prices in dollars of exports of goods grew for the fourth consecutive quarter and were at the highest level since the third quarter of 2014. At the disaggregated level, the quarterly increases in the prices of cereals (+15%), oilseeds (+13%), fats and oils (+16%) and crude oil (20%) stood out.
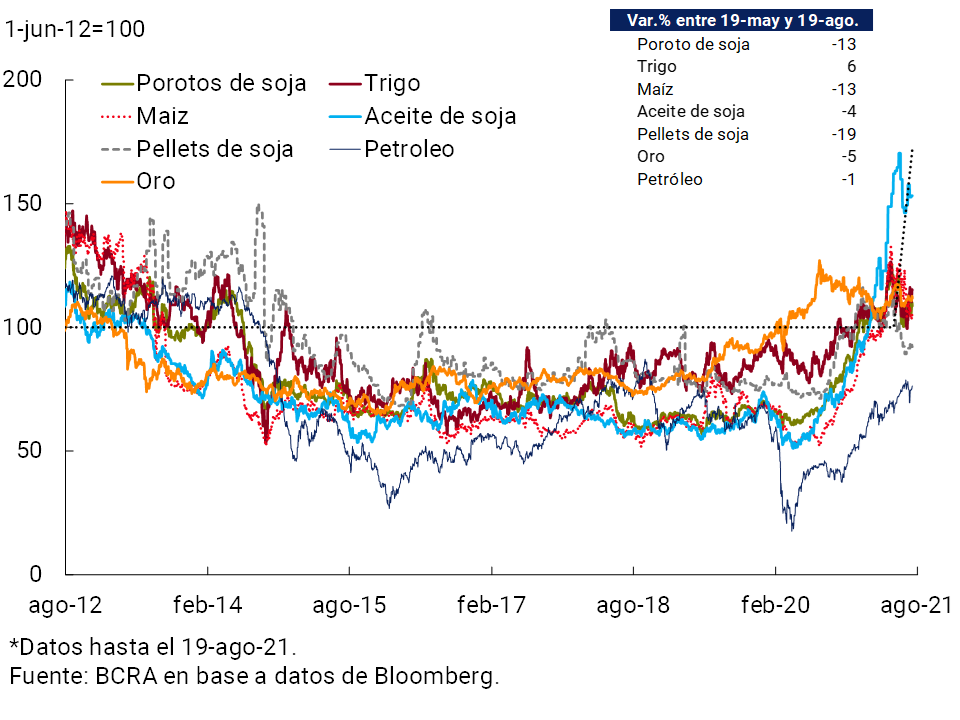
As mentioned in previous editions of IPOM, the trajectory of Argentina’s export prices is associated with the dynamics of commodity prices in the world’s reference markets. In fact, the Commodity Price Index prepared and published daily by the BCRA (IPMP), had an average quarterly growth of 11% in II-21, spread among its 3 components (agriculture, metals and oil).
In any case, it should be noted that, with the exception of oil and wheat, the international prices of the main raw materials exported by Argentina have fallen across the board since mid-May. Since the publication of the last IPOM, the products of the soybean complex have accumulated a decrease of between 4% and 19%, and corn a decrease of 13%. Despite this evolution at the margin, prices are still at historically high levels (see Figure 4.4)
Figure 4.4 | International prices of selected raw materials
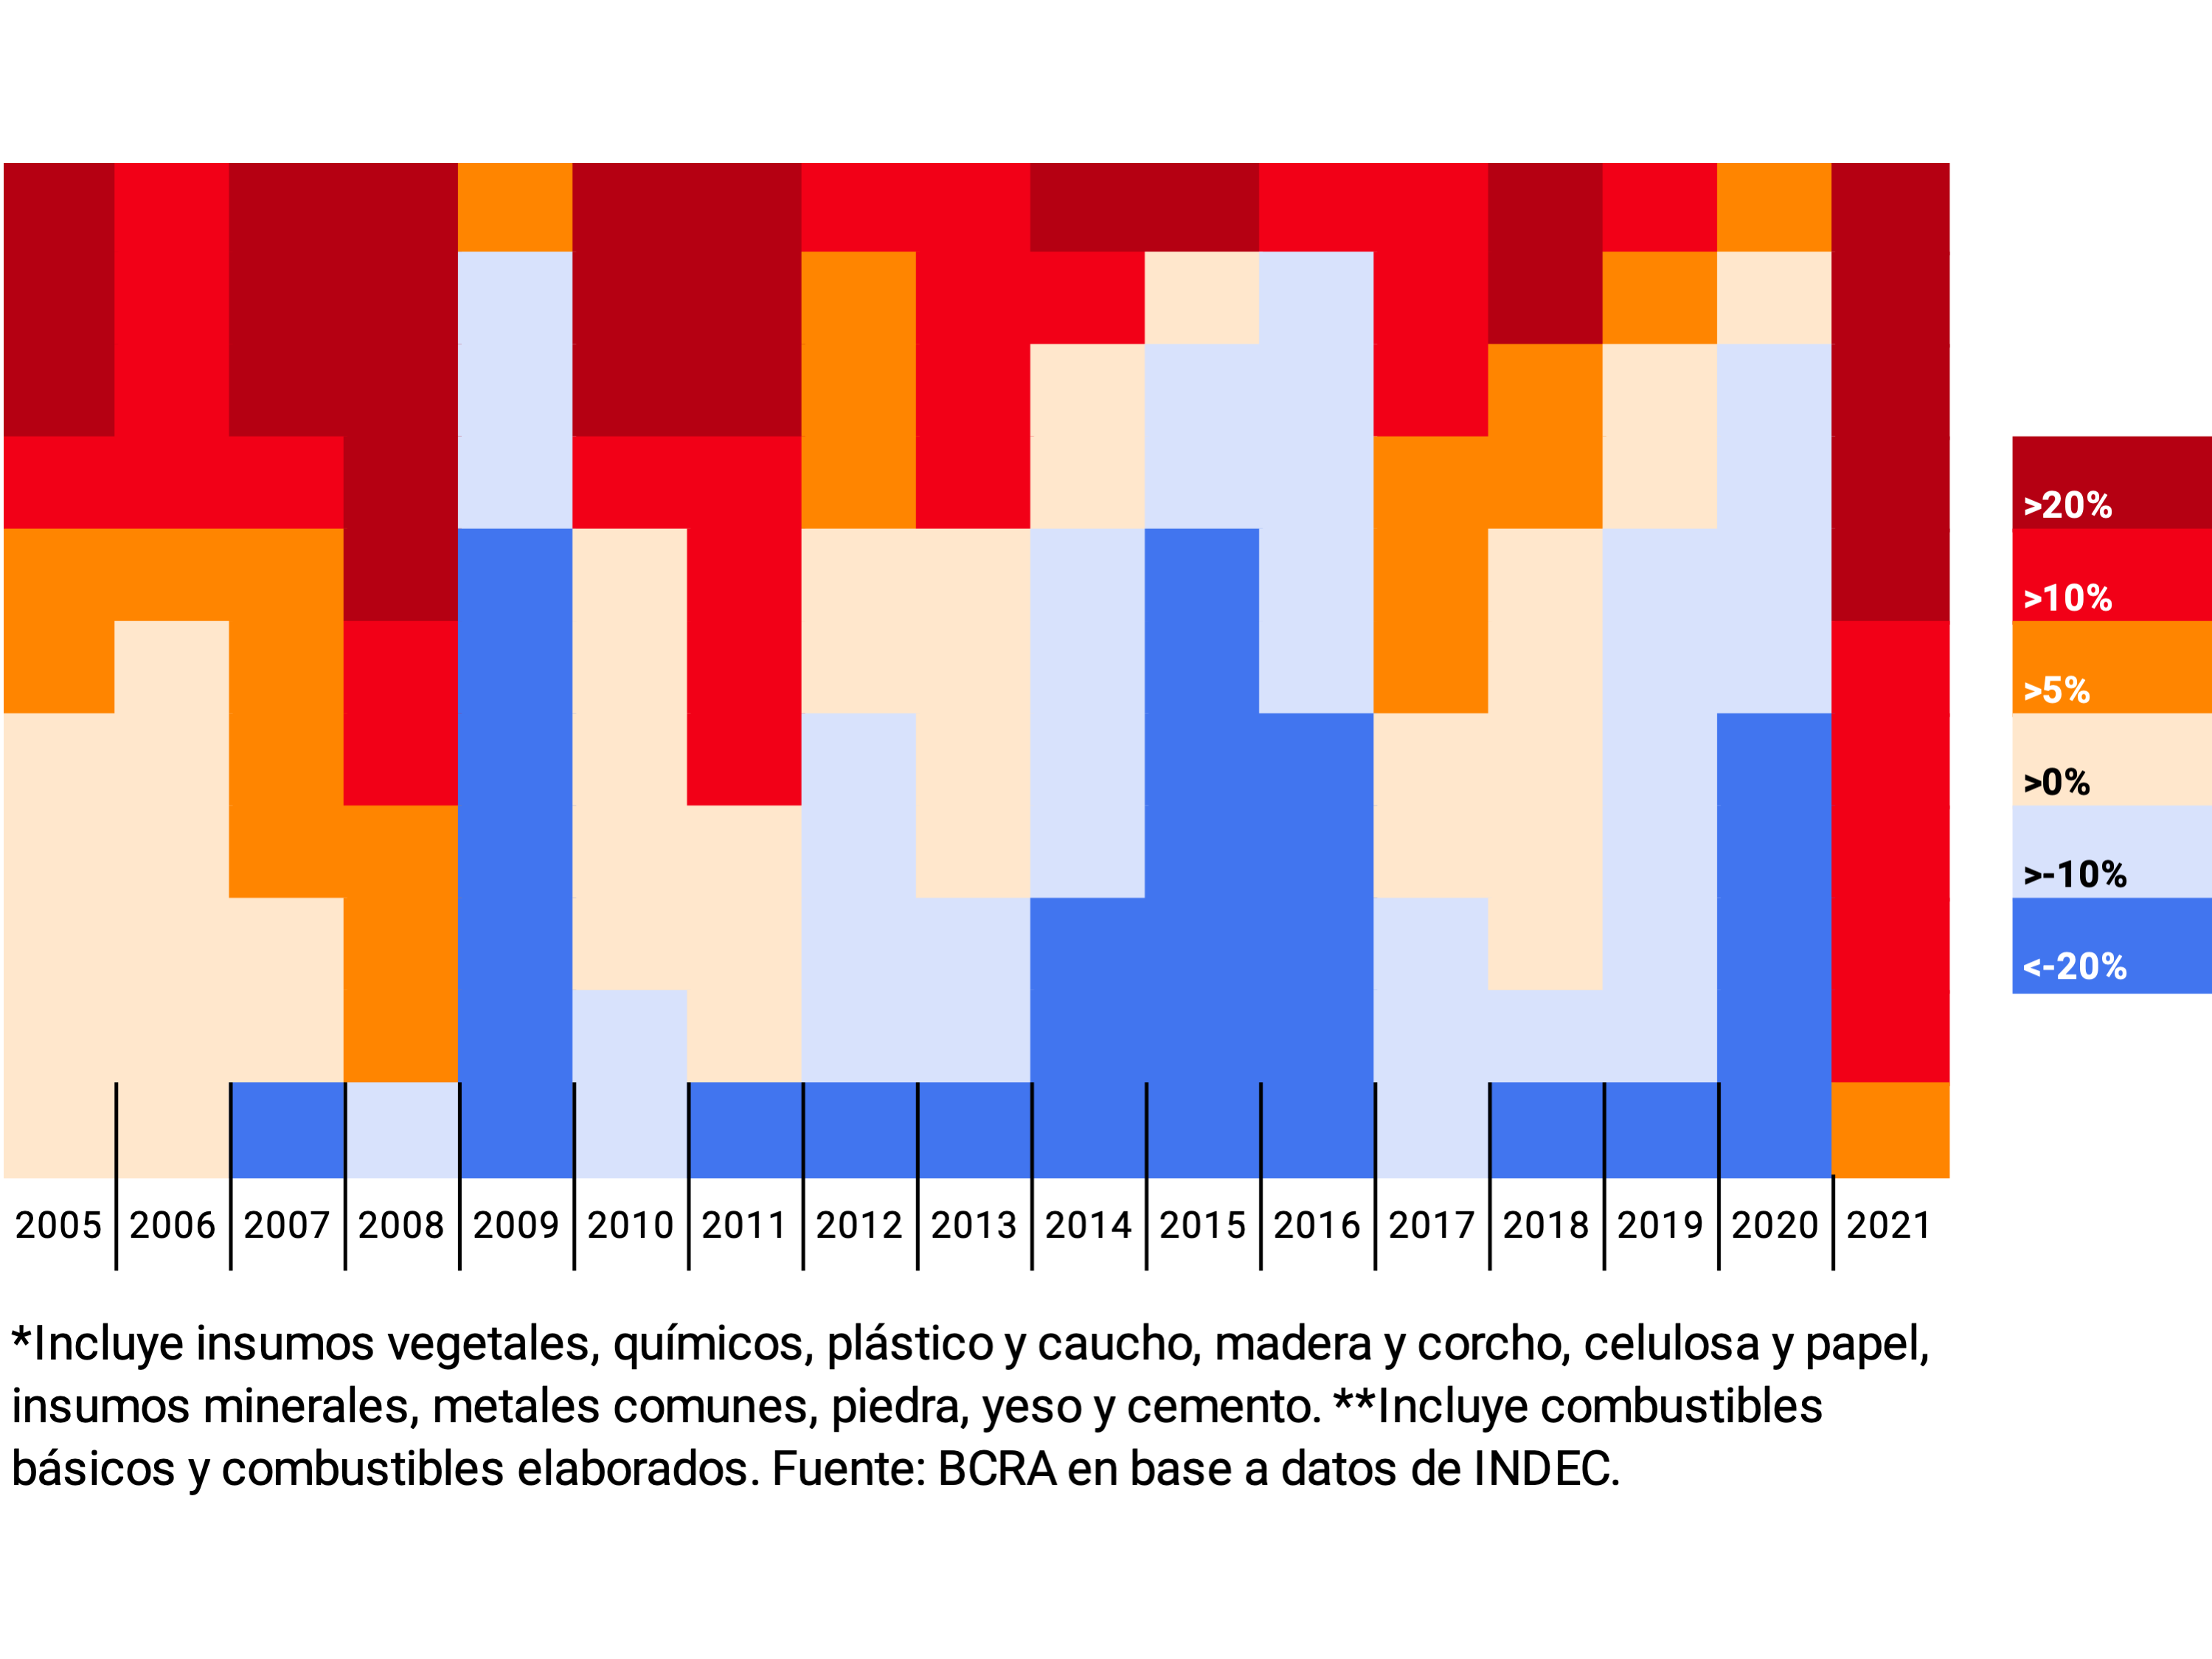
On the other hand, the prices of imports of goods measured in current dollars also showed great dynamism recently. Until July, they accumulated a 21% increase compared to the level of December 2020. This rise was particularly marked among intermediate goods and fuels. Of the 11 categories that make up both import uses – most of them being inputs disseminated for the domestic production of goods – 10 presented increases of more than 10% in current dollars in the first half of 2021, an unprecedented situation in the last 15 years. This evolution of international prices contributed, together with other factors, to partially explain the domestic price dynamics (see Chapter 6. Prices). The six-month increases in the prices of imports of processed fuels (59%), mineral inputs (33%), chemical products (28%) and plastic and rubber (28%) stood out for their magnitude; see Figure 4.5.
Figure 4.5 | Import prices of intermediate goods* and fuels**
Var. % acum. in the first half of each year
Thus, as a result of the faster growth in import prices, the terms of trade – the ratio between export and import prices – deteriorated by 2.3% in the second quarter of 2021. However, they continue to be favorable in historical terms
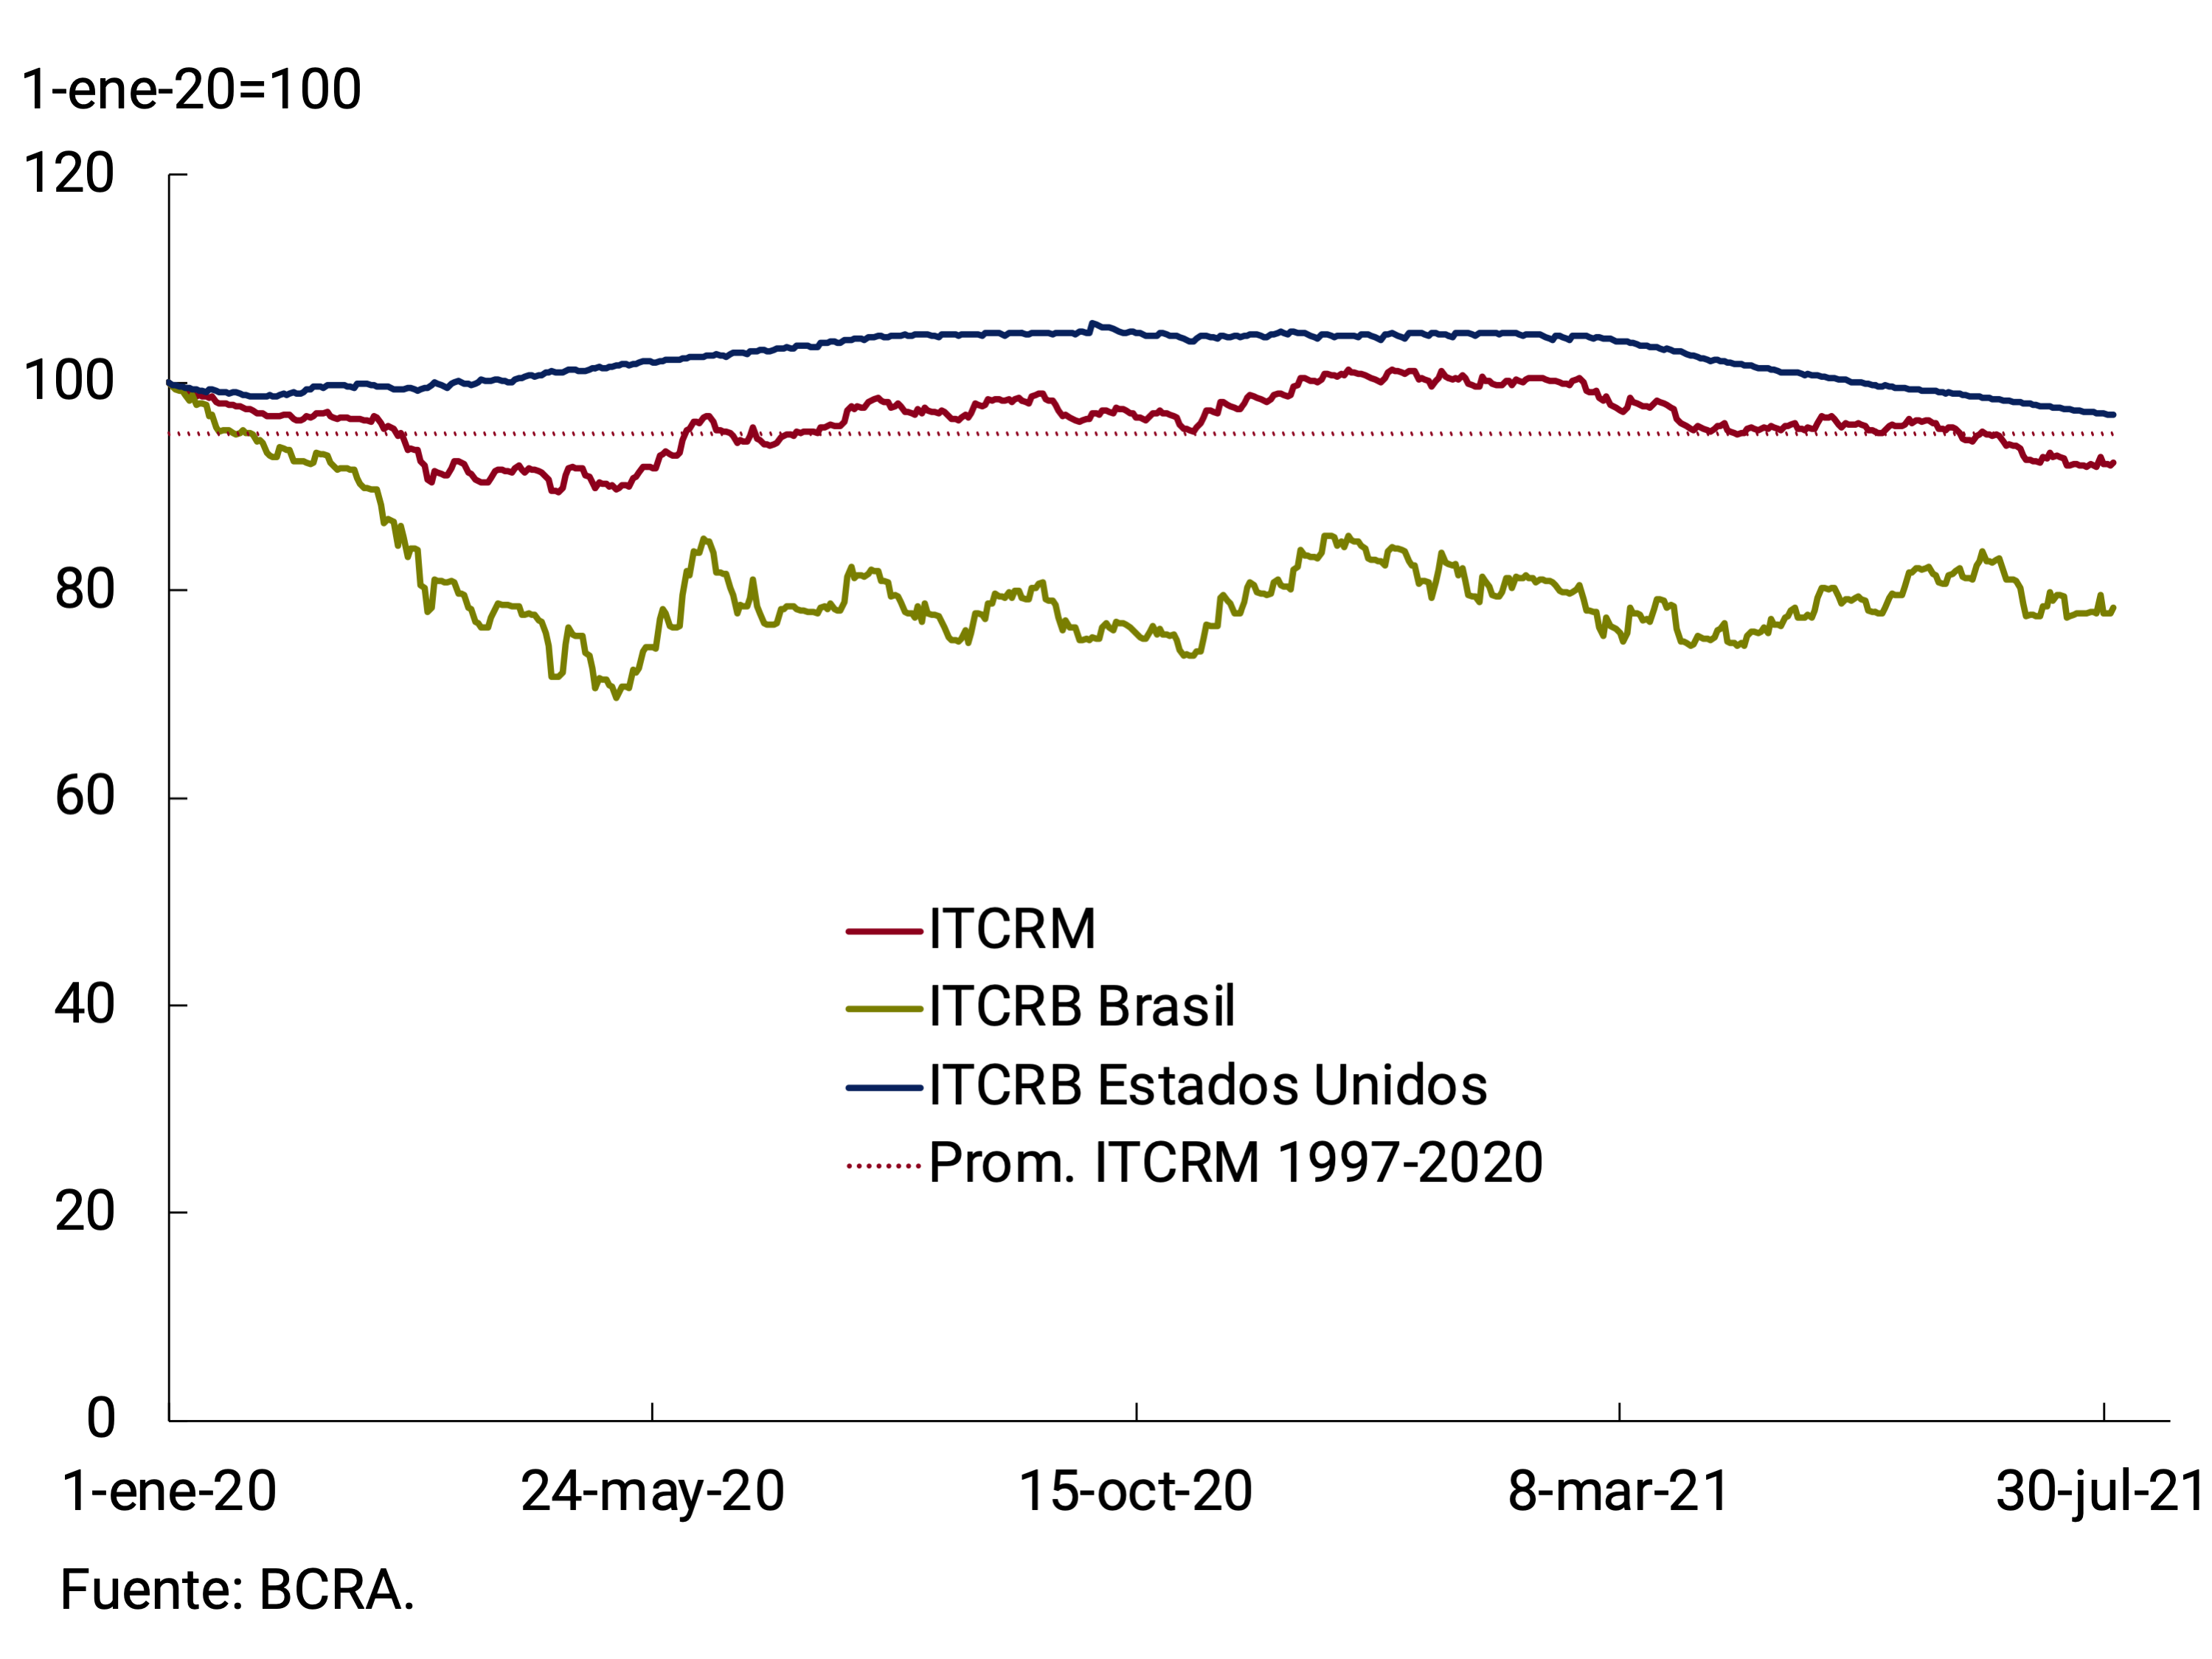
4.2. In the second quarter, the ITCRM was around the average of the last 24 years
In the second quarter, the multilateral real exchange rate index (ITCRM) fell by an average of 3.7% compared to the first quarter of the year. In real terms, the peso appreciated bilaterally against the currencies of the 13 economies that make up the index, and was generally more marked against the currencies of advanced economies (Japan, Switzerland, the euro area and the United States). In the case of the bilateral real exchange rate with Brazil (our main trading partner), the drop in the index was very slight (0.7%), as a result of the greater volatility to which the currency of the neighboring country was subjected. Despite this decline, the ITCRM was around the average of the last 24 years throughout the second quarter. In July and so far in August, the currencies of emerging economies depreciated against the dollar, accelerating the peso’s multilateral real appreciation (see Figure 4.6).
Figure 4.6 | Multilateral and bilateral real exchange rate
4.3. So far this year, the BCRA has recorded the largest net purchases of foreign currency in the foreign exchange market since 2012
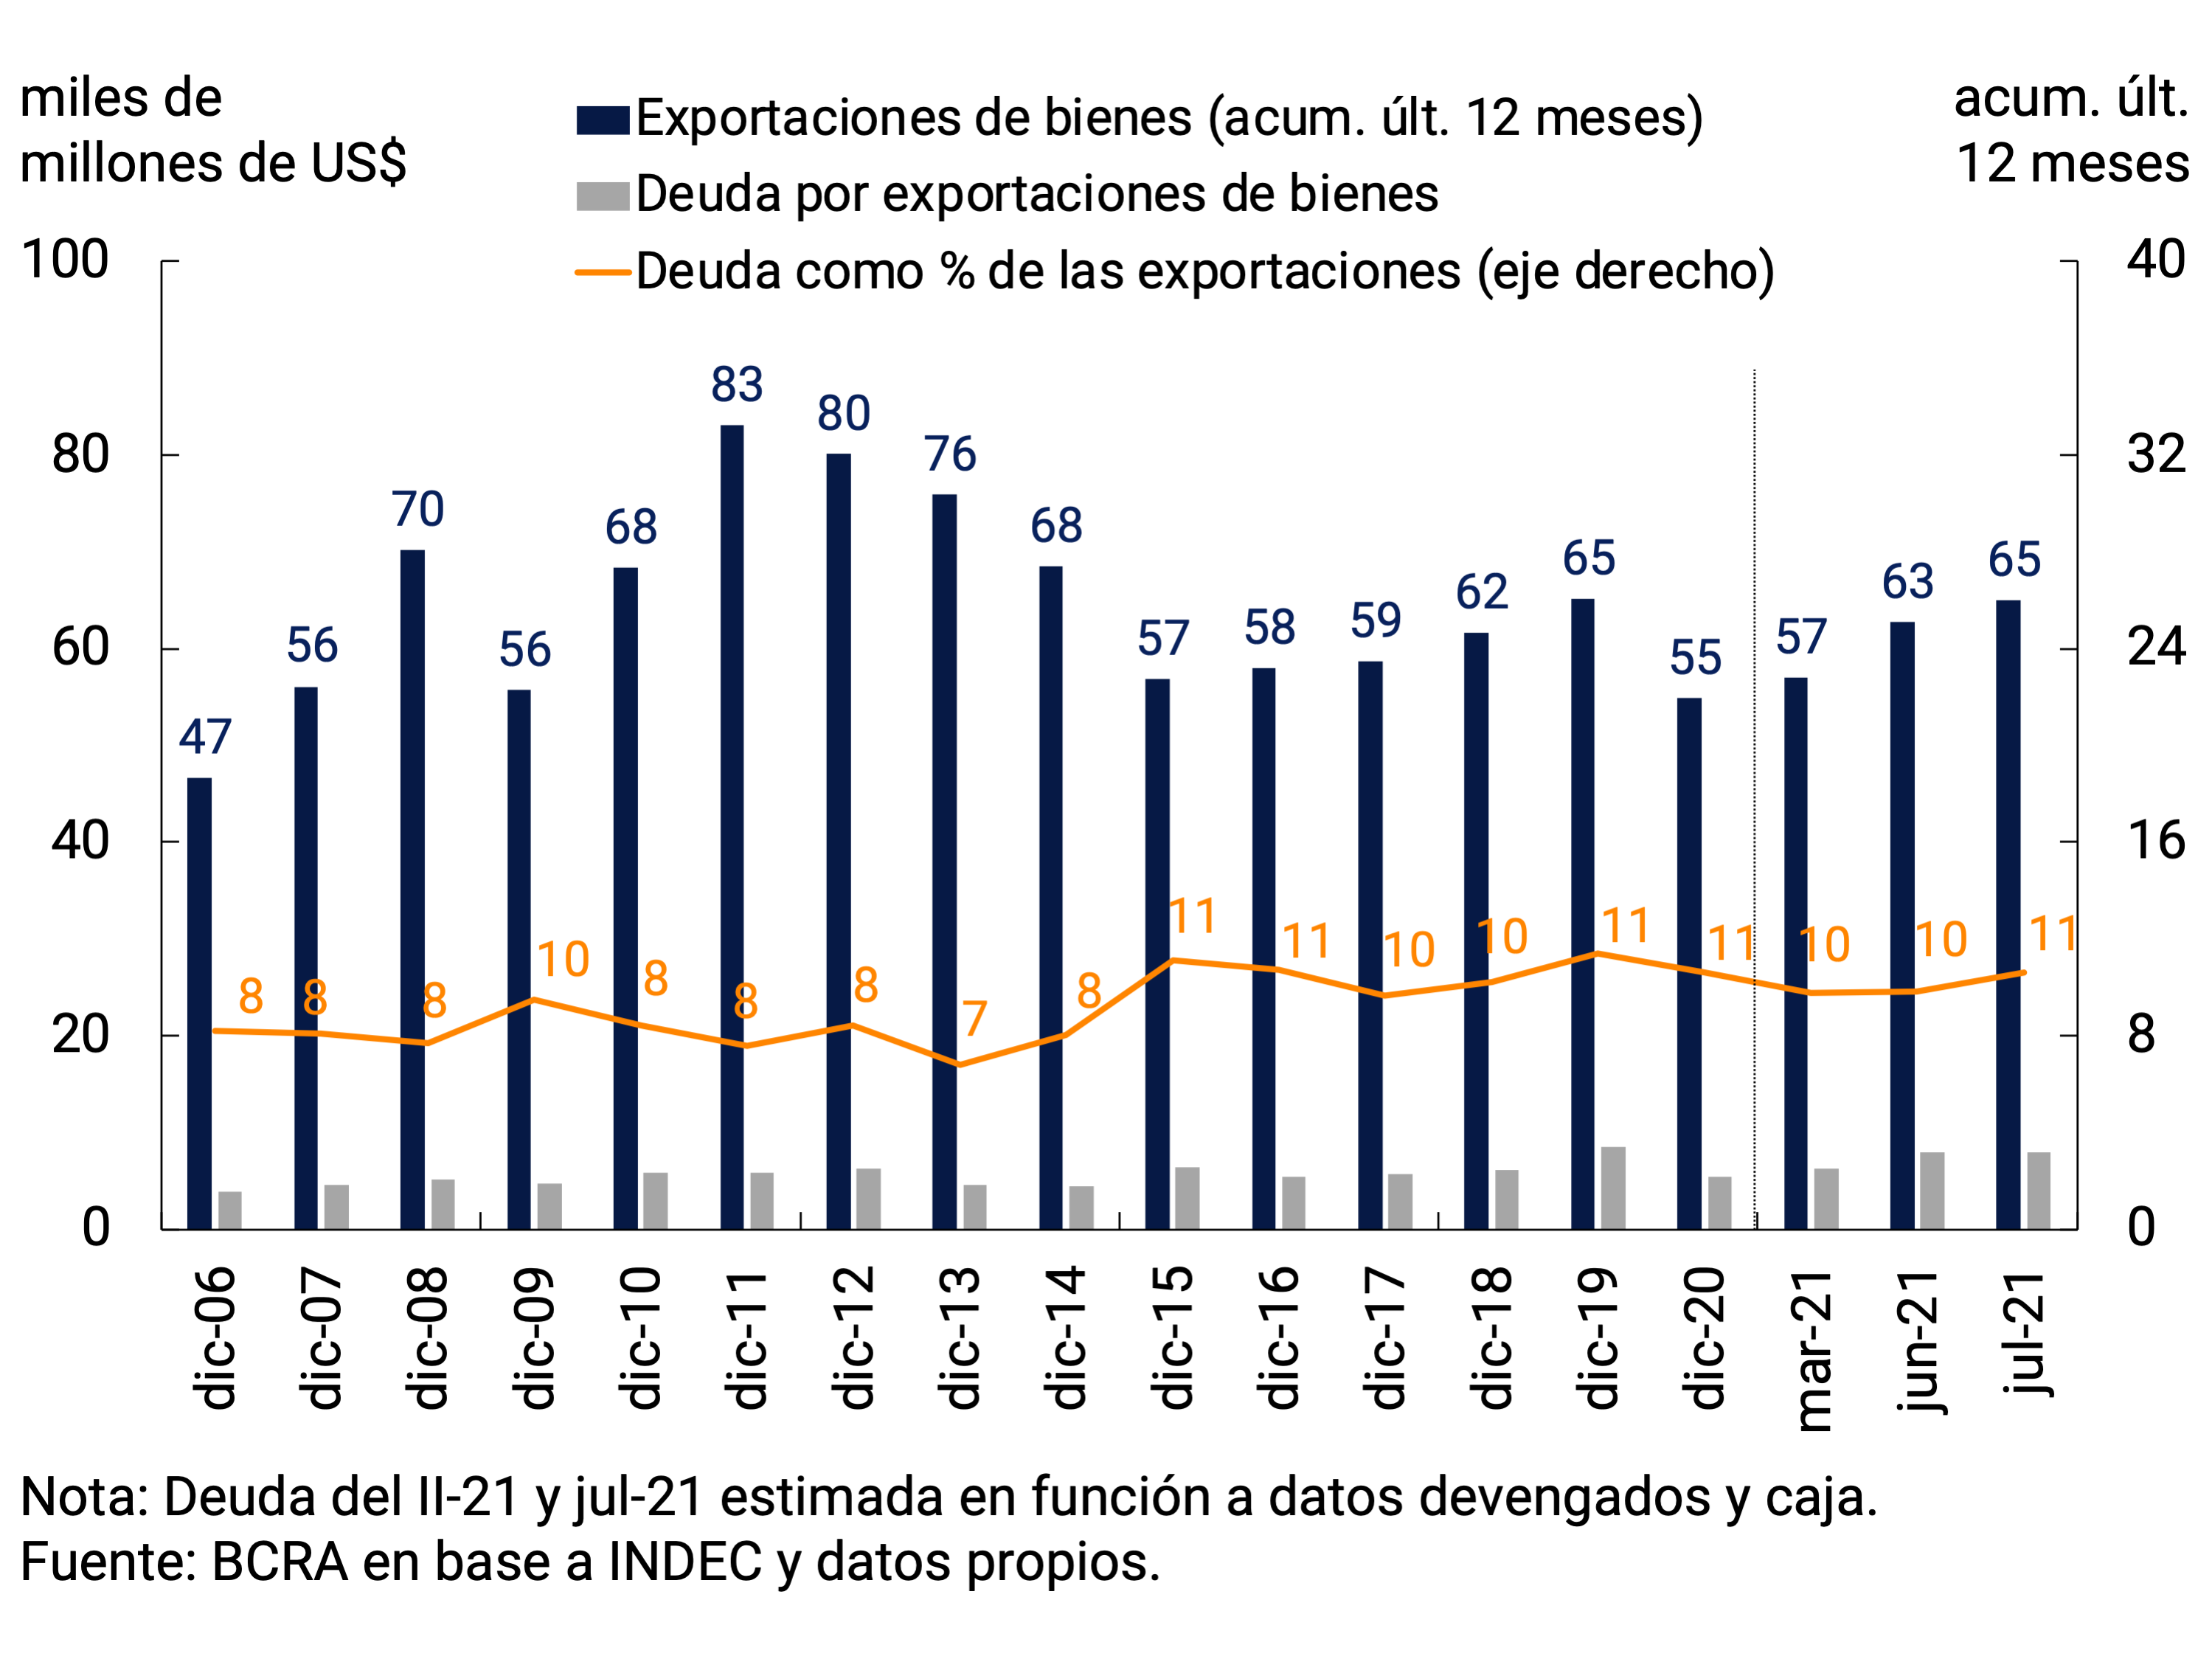
During the second quarter of 2021, exporters recorded revenues from the collection of exports of goods through the foreign exchange market for US$21,700 million. Given that exports of goods stood at about US$20,000 million, an increase in external debt for advances and pre-financing of about US$1,700 million is estimated. In July, collections for exports of goods were at a level similar to that of exports, with no variations in debt for advances and pre-financing from abroad. Thus, the ratio of this type of indebtedness to exported values stood at 11%, remaining at the levels observed in recent years (see Figure 4.7).
Figure 4.7 | Assets. Exports and related debt
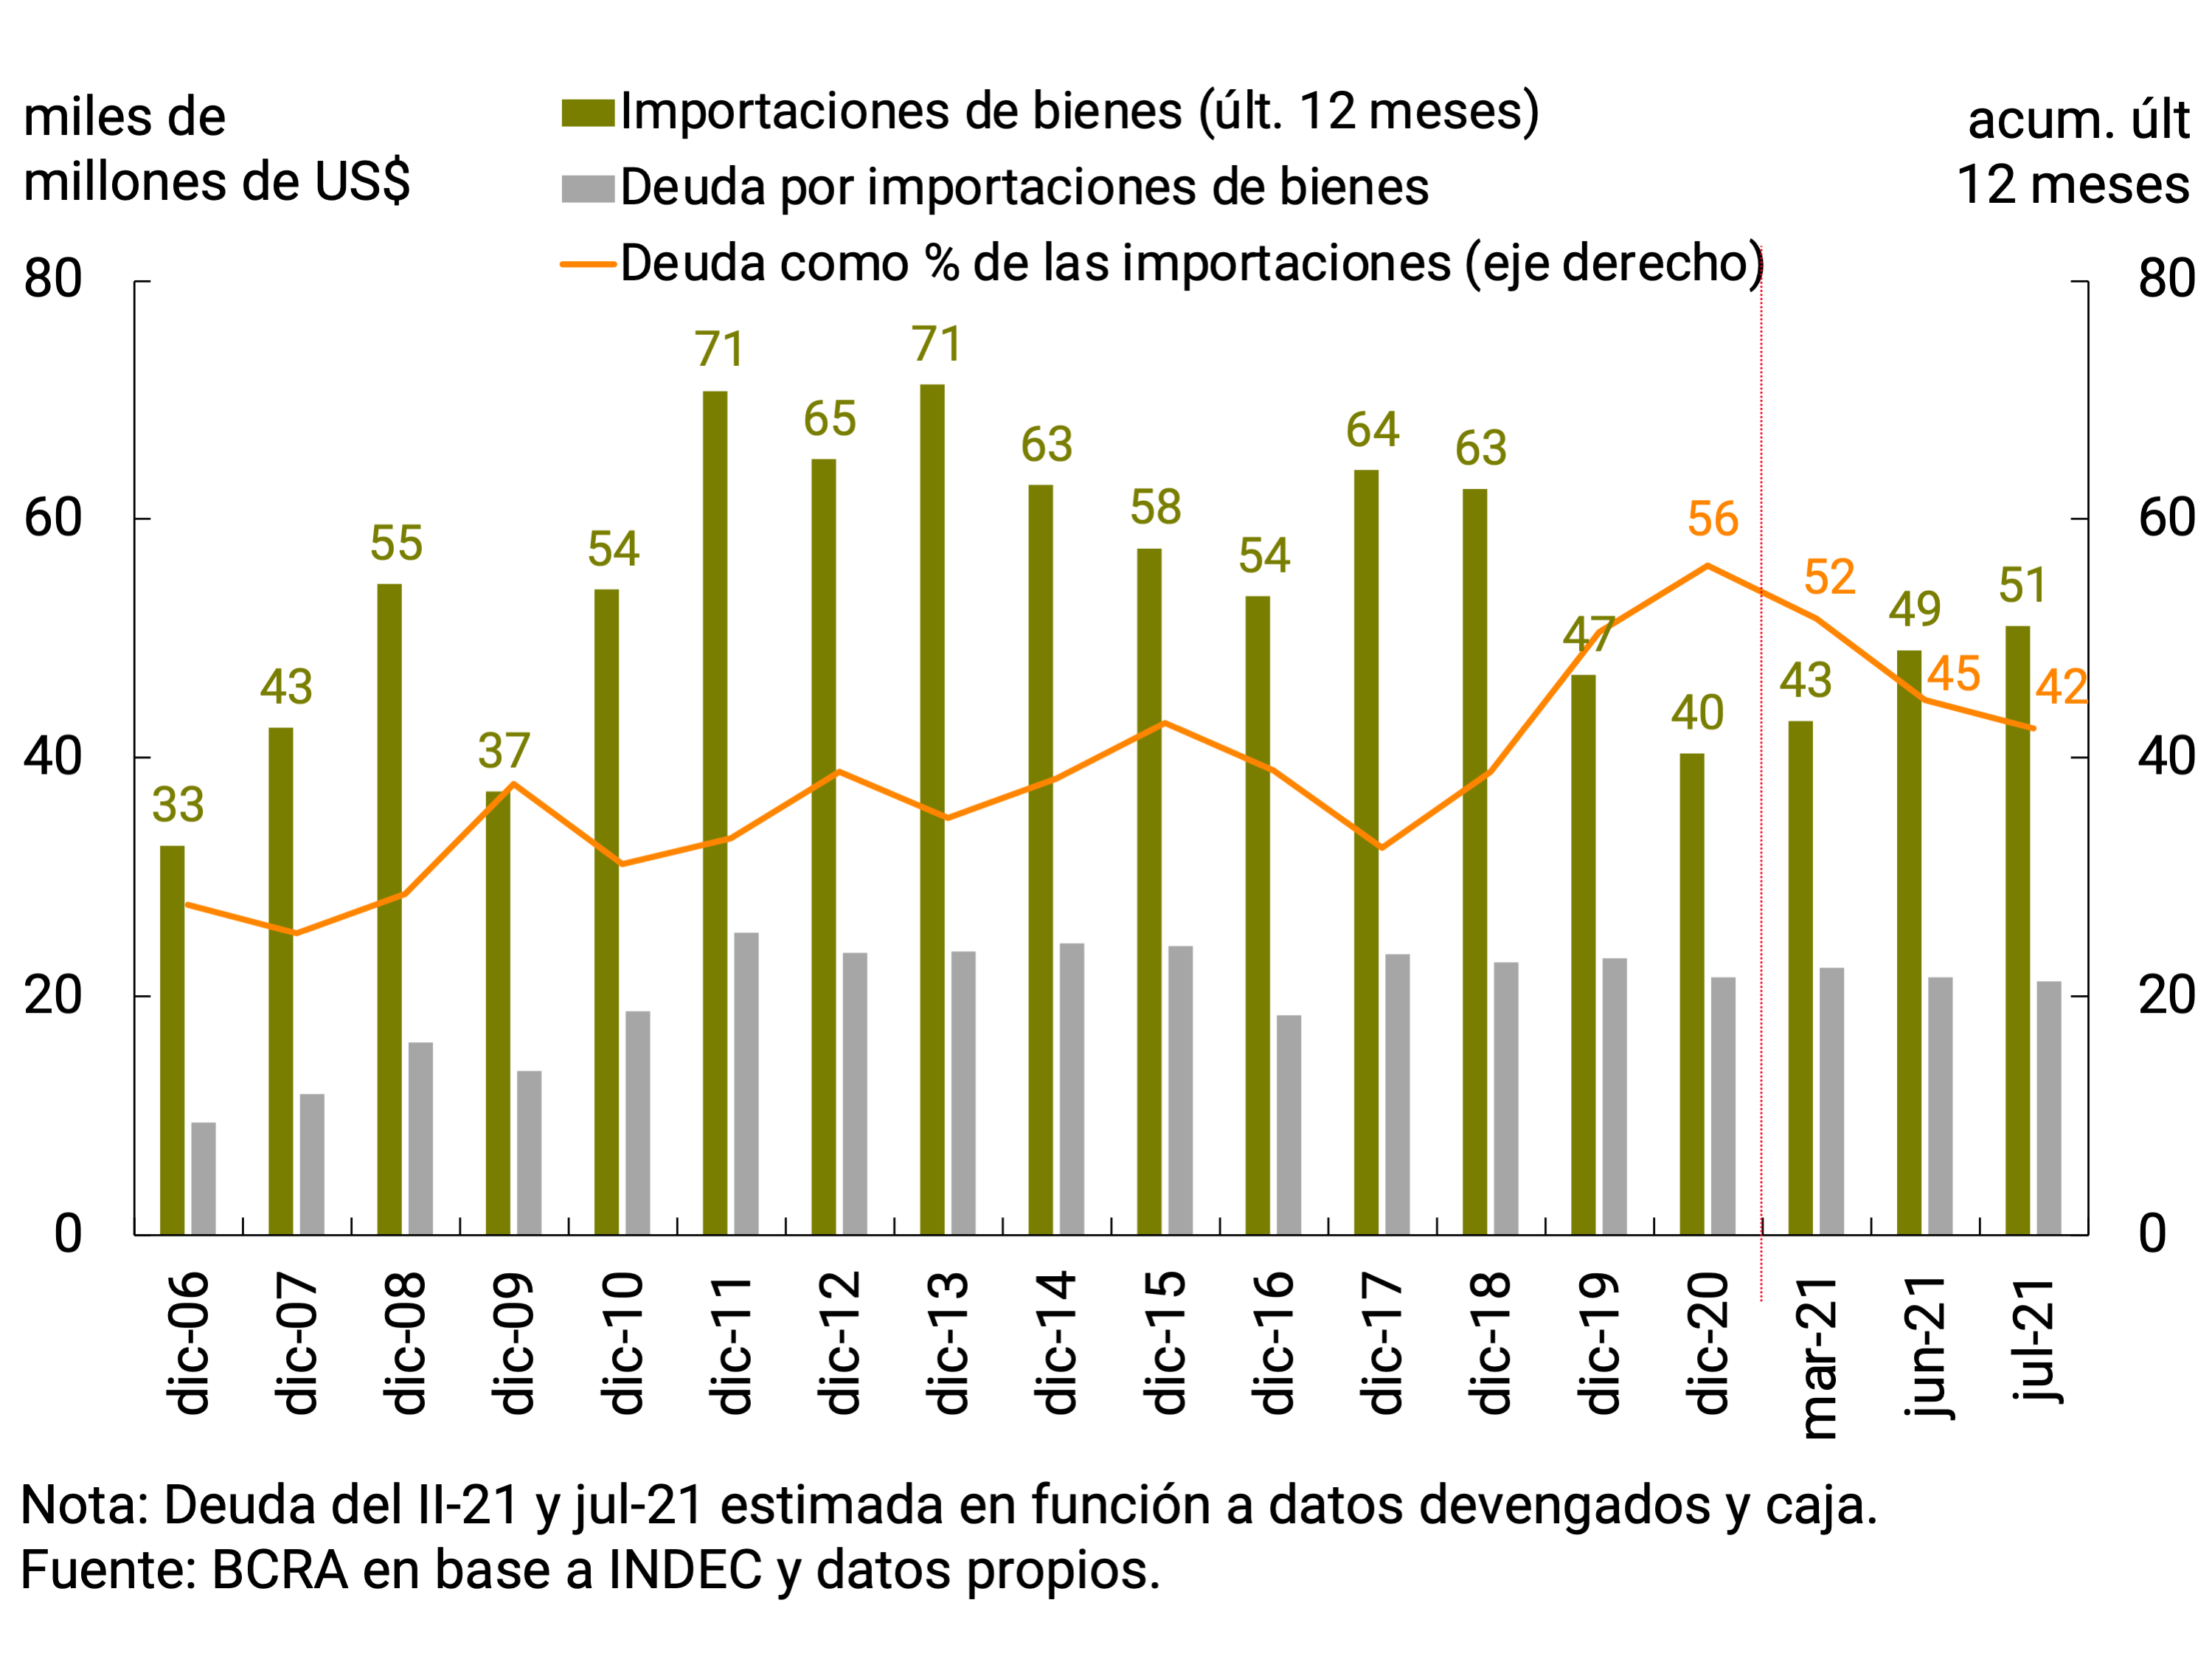
During 2020, the BCRA issued a series of regulations, aimed at promoting a more efficient allocation of foreign currency, which affected both the evolution of private commercial and financial debt, and are still in force1. In this context, during the second quarter of 2021, payments for imports of goods through the foreign exchange market for US$15,600 million were about US$780 million above FOB imports for the period, which would imply a fall in foreign indebtedness for this concept (or an increase in foreign assets due to early payments). During the month of July, this behavior was maintained, with payments for imports of goods through the foreign exchange market for US$5,740 million, surpassing FOB imports by about US$400 million. If the increase in imports in recent months is added to this situation, the ratio between external debt and the level of imports registered a fall of 10 percentage points compared to the first quarter and 14 p.p. compared to the end of 2020 (see Figure 4.8).
Figure 4.8 | Assets. Imports and related debt
Finally, with regard to financial debt, and as part of the current regulatory framework mentioned above, in September 2020 the guidelines were established under which private sector companies could initiate a process of refinancing their respective external liabilities, which would allow their maturity profile to be adapted to the guidelines required for the normal functioning of the foreign exchange market31. This regulation, which reached certain capital maturities between 15.10.2020 and 31.03.2021, was extended covering maturities from then until the end of 202132.
In this context, the renegotiations registered during the second quarter of 2021 of some 33 companies had an impact on them demanding in net terms US$900 million less in the Foreign Exchange Market compared to what the original maturities implied for that same period, accumulating lower net payments of more than US$1,300 million in the year. During the month of July, some 13 companies renegotiated debts, resulting in a lower net demand in the market of about US$100 million (of the US$160 million of maturities originally registered for that month).
The aforementioned recovery of exports, added to the evolution of the commercial debt for exports and imports of goods, resulted in a net result for goods in the foreign exchange market of US$12,040 million in the first 7 months of the year, higher by about US$1,800 million than the result of the FOB trade balance of the same period. and exhibiting a strong improvement compared to the same period of the previous year (80%).
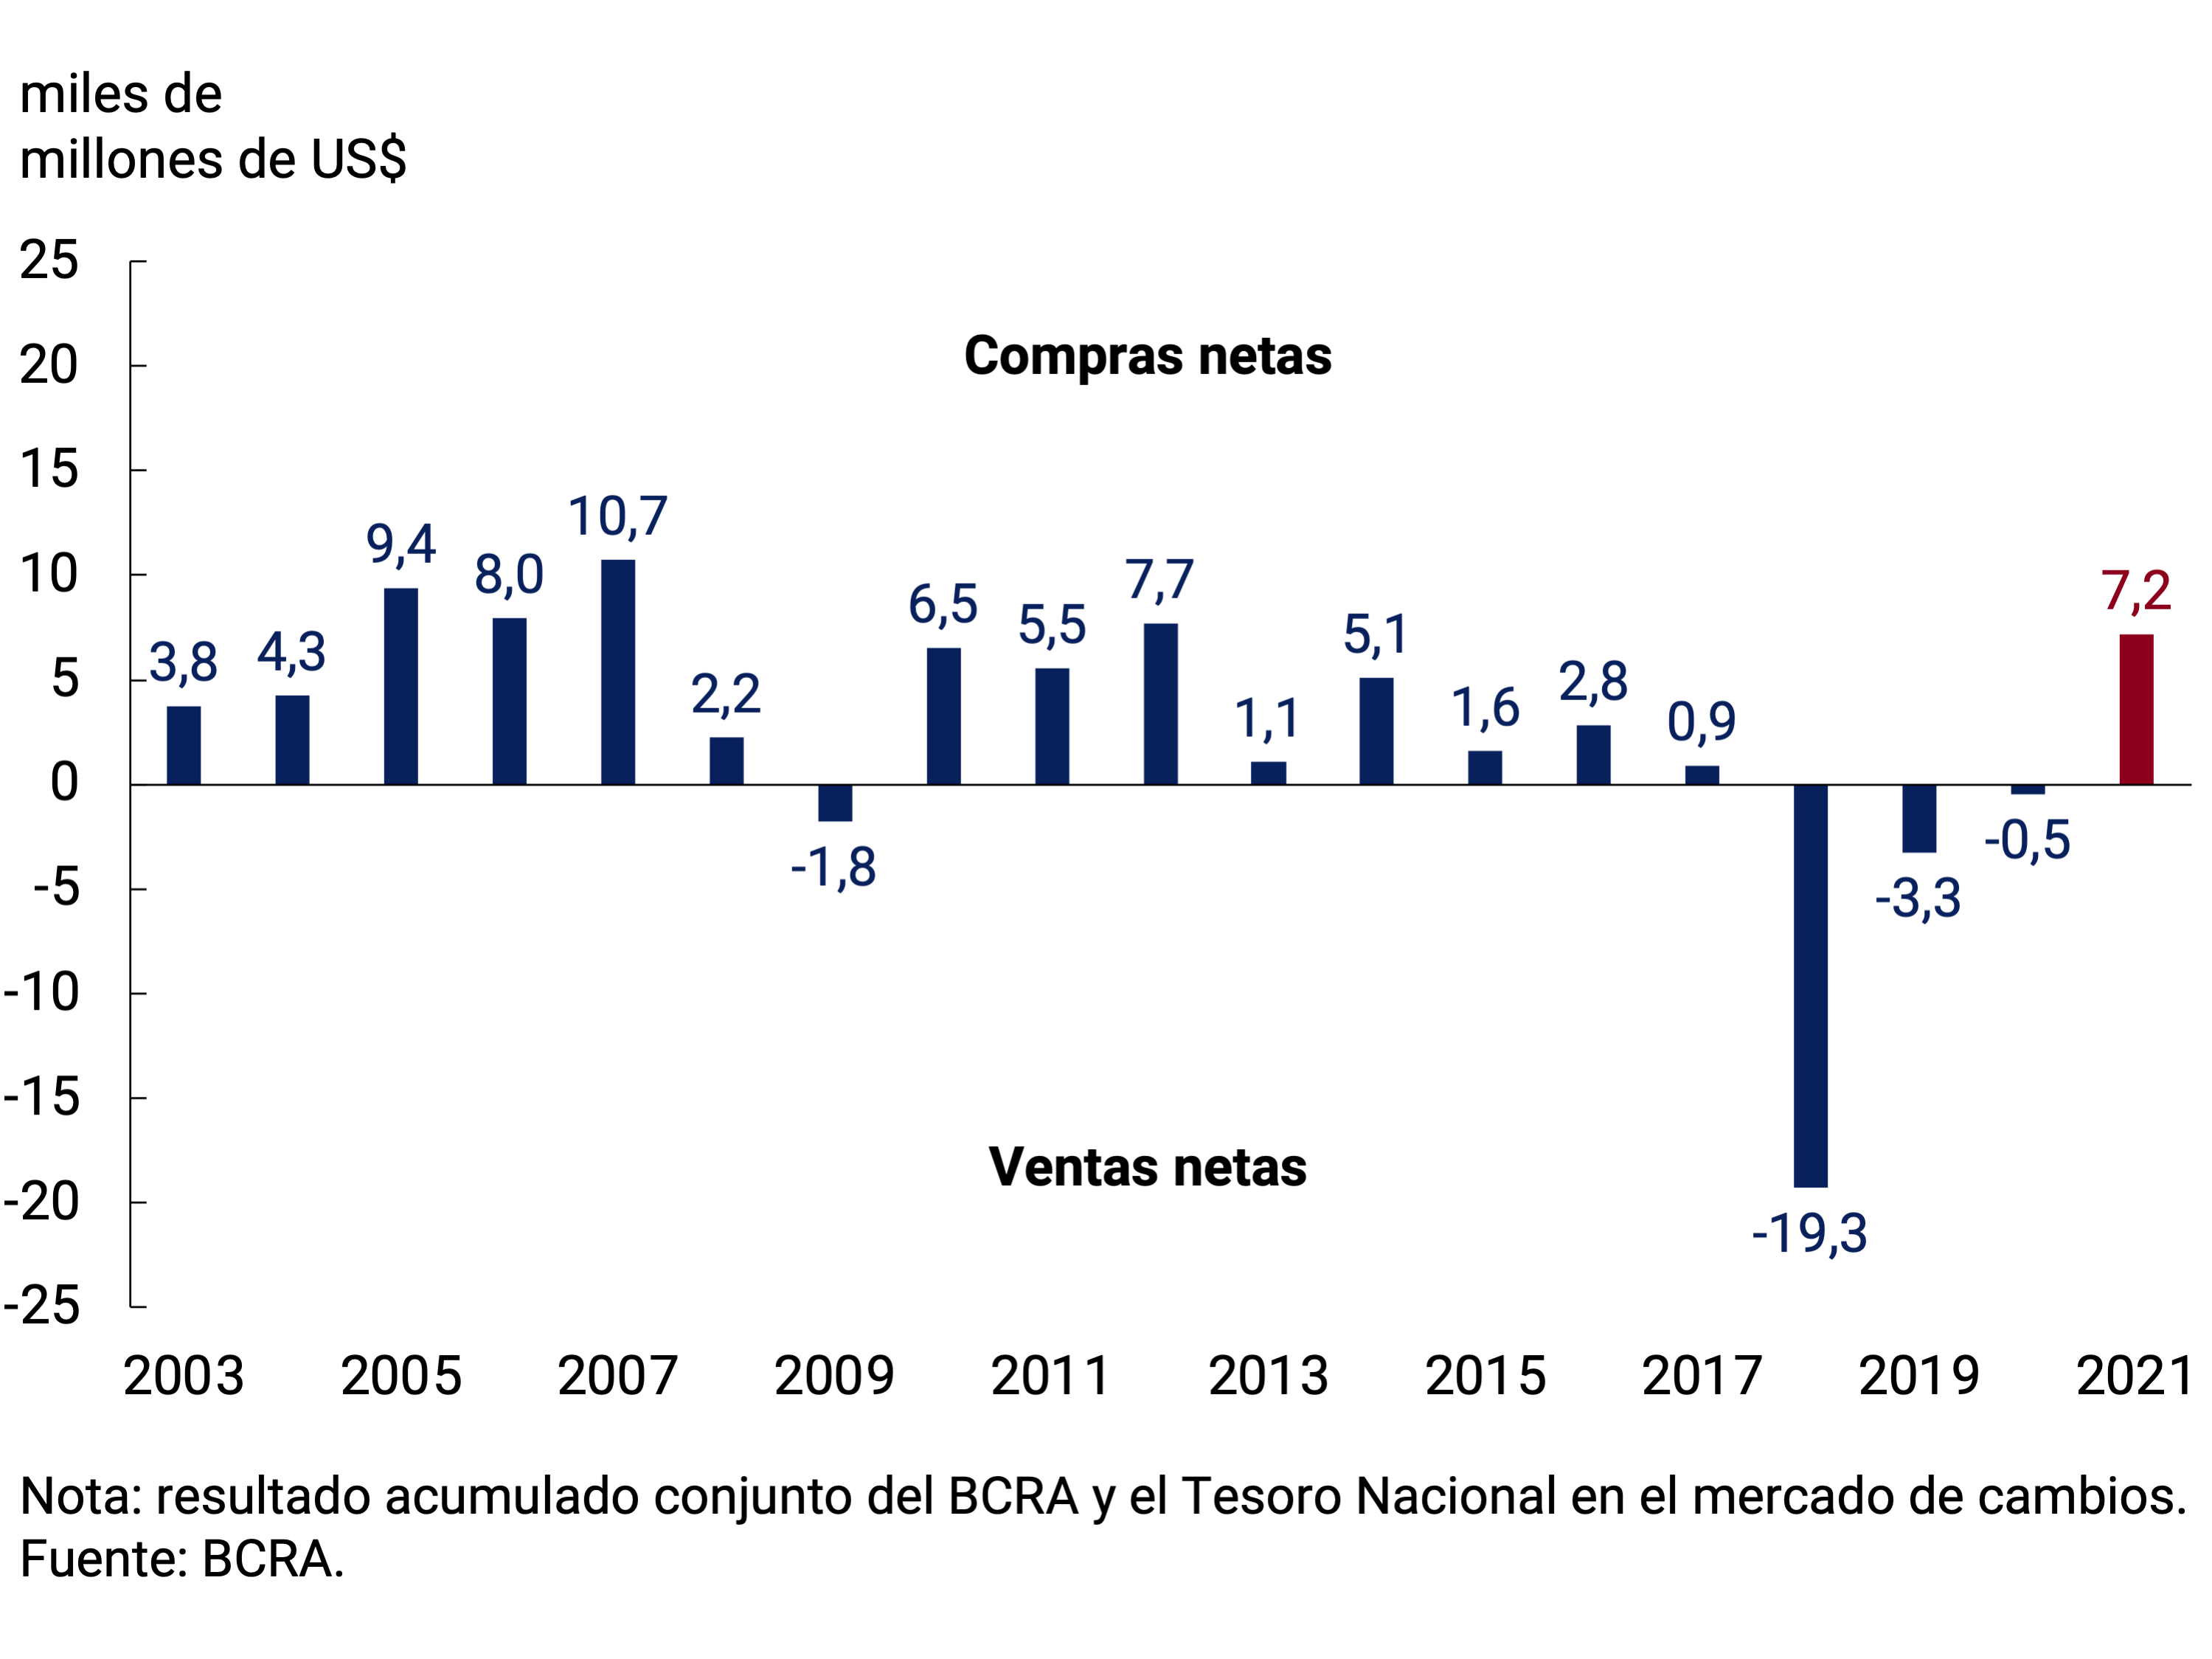
This result allowed the BCRA to accumulate net purchases in the foreign exchange market until July for US$7,165 million, a record for the first 7 months of the year since 2012 (See Chart 4.9), while international reserves increased by US$3,194 million in the same period. This difference was mainly explained by the net cancellations of principal and interest on foreign currency debt of the National Government with a direct impact on international reserves of about US$2,300 million and by payments for operations carried out through the Local Currency Systems with Brazil, Uruguay and Paraguay and ALADI for about US$400 million. Meanwhile, on August 23, the allocation of Special Drawing Rights by the IMF to mitigate the effects of the pandemic was accounted for around US$4,333 million.
Figure 4.9 | Net intervention in the Foreign Exchange Market
First 7 months of each year
4.4. Perspectives
For the remainder of the year, the current account is expected to remain balanced, oscillating in terms of output around the levels of recent quarters. Exports of goods would be boosted by the strengthening of demand from our main trading partners, in particular Brazil, while imports will accompany the performance of domestic economic activity. A resurgence of the pandemic due to the expansion of new strains of COVID-19 and/or a sharp correction in global financial markets that negatively impacts commodity prices or the activity of our main trading partners are the main risk factors for the external sector of the Argentine economy.
The regulatory framework in force in the Foreign Exchange Market will allow the BCRA to continue to efficiently manage foreign currency originating in commercial and financial transactions, in order to preserve monetary and exchange rate stability.
5. Public Finance
During the second quarter of 2021, national public finances continued to strengthen due to higher public revenues, a trend that continued during July. The recovery of domestic demand, taxes related to foreign trade – in a context of increases in international commodity prices – and non-tax revenues, associated with the Solidarity and Extraordinary Contribution, fundamentally determined its favorable evolution. Likewise, the regulatory modifications on taxes provided for in the Social Solidarity and Productive Reactivation Law of the end of 2019 and in the National Budget Law 2021 continued to have a positive impact.
The dynamism of social spending was maintained – within the framework of the social and economic emergency that has been in force since the end of 2019 – and a significant increase in capital expenditure was promoted in line with the provisions of the 2021 National Budget with the aim of supporting the recovery process of economic activity. In the opposite direction, there was a more limited trajectory of extraordinary expenditures associated with the evolution of the pandemic. Due to the high base of comparison due to the unprecedented and extensive package of mass assistance associated with alleviating the consequences of COVID-19 during the same period in 2020, year-on-year primary expenditure fell in real terms.
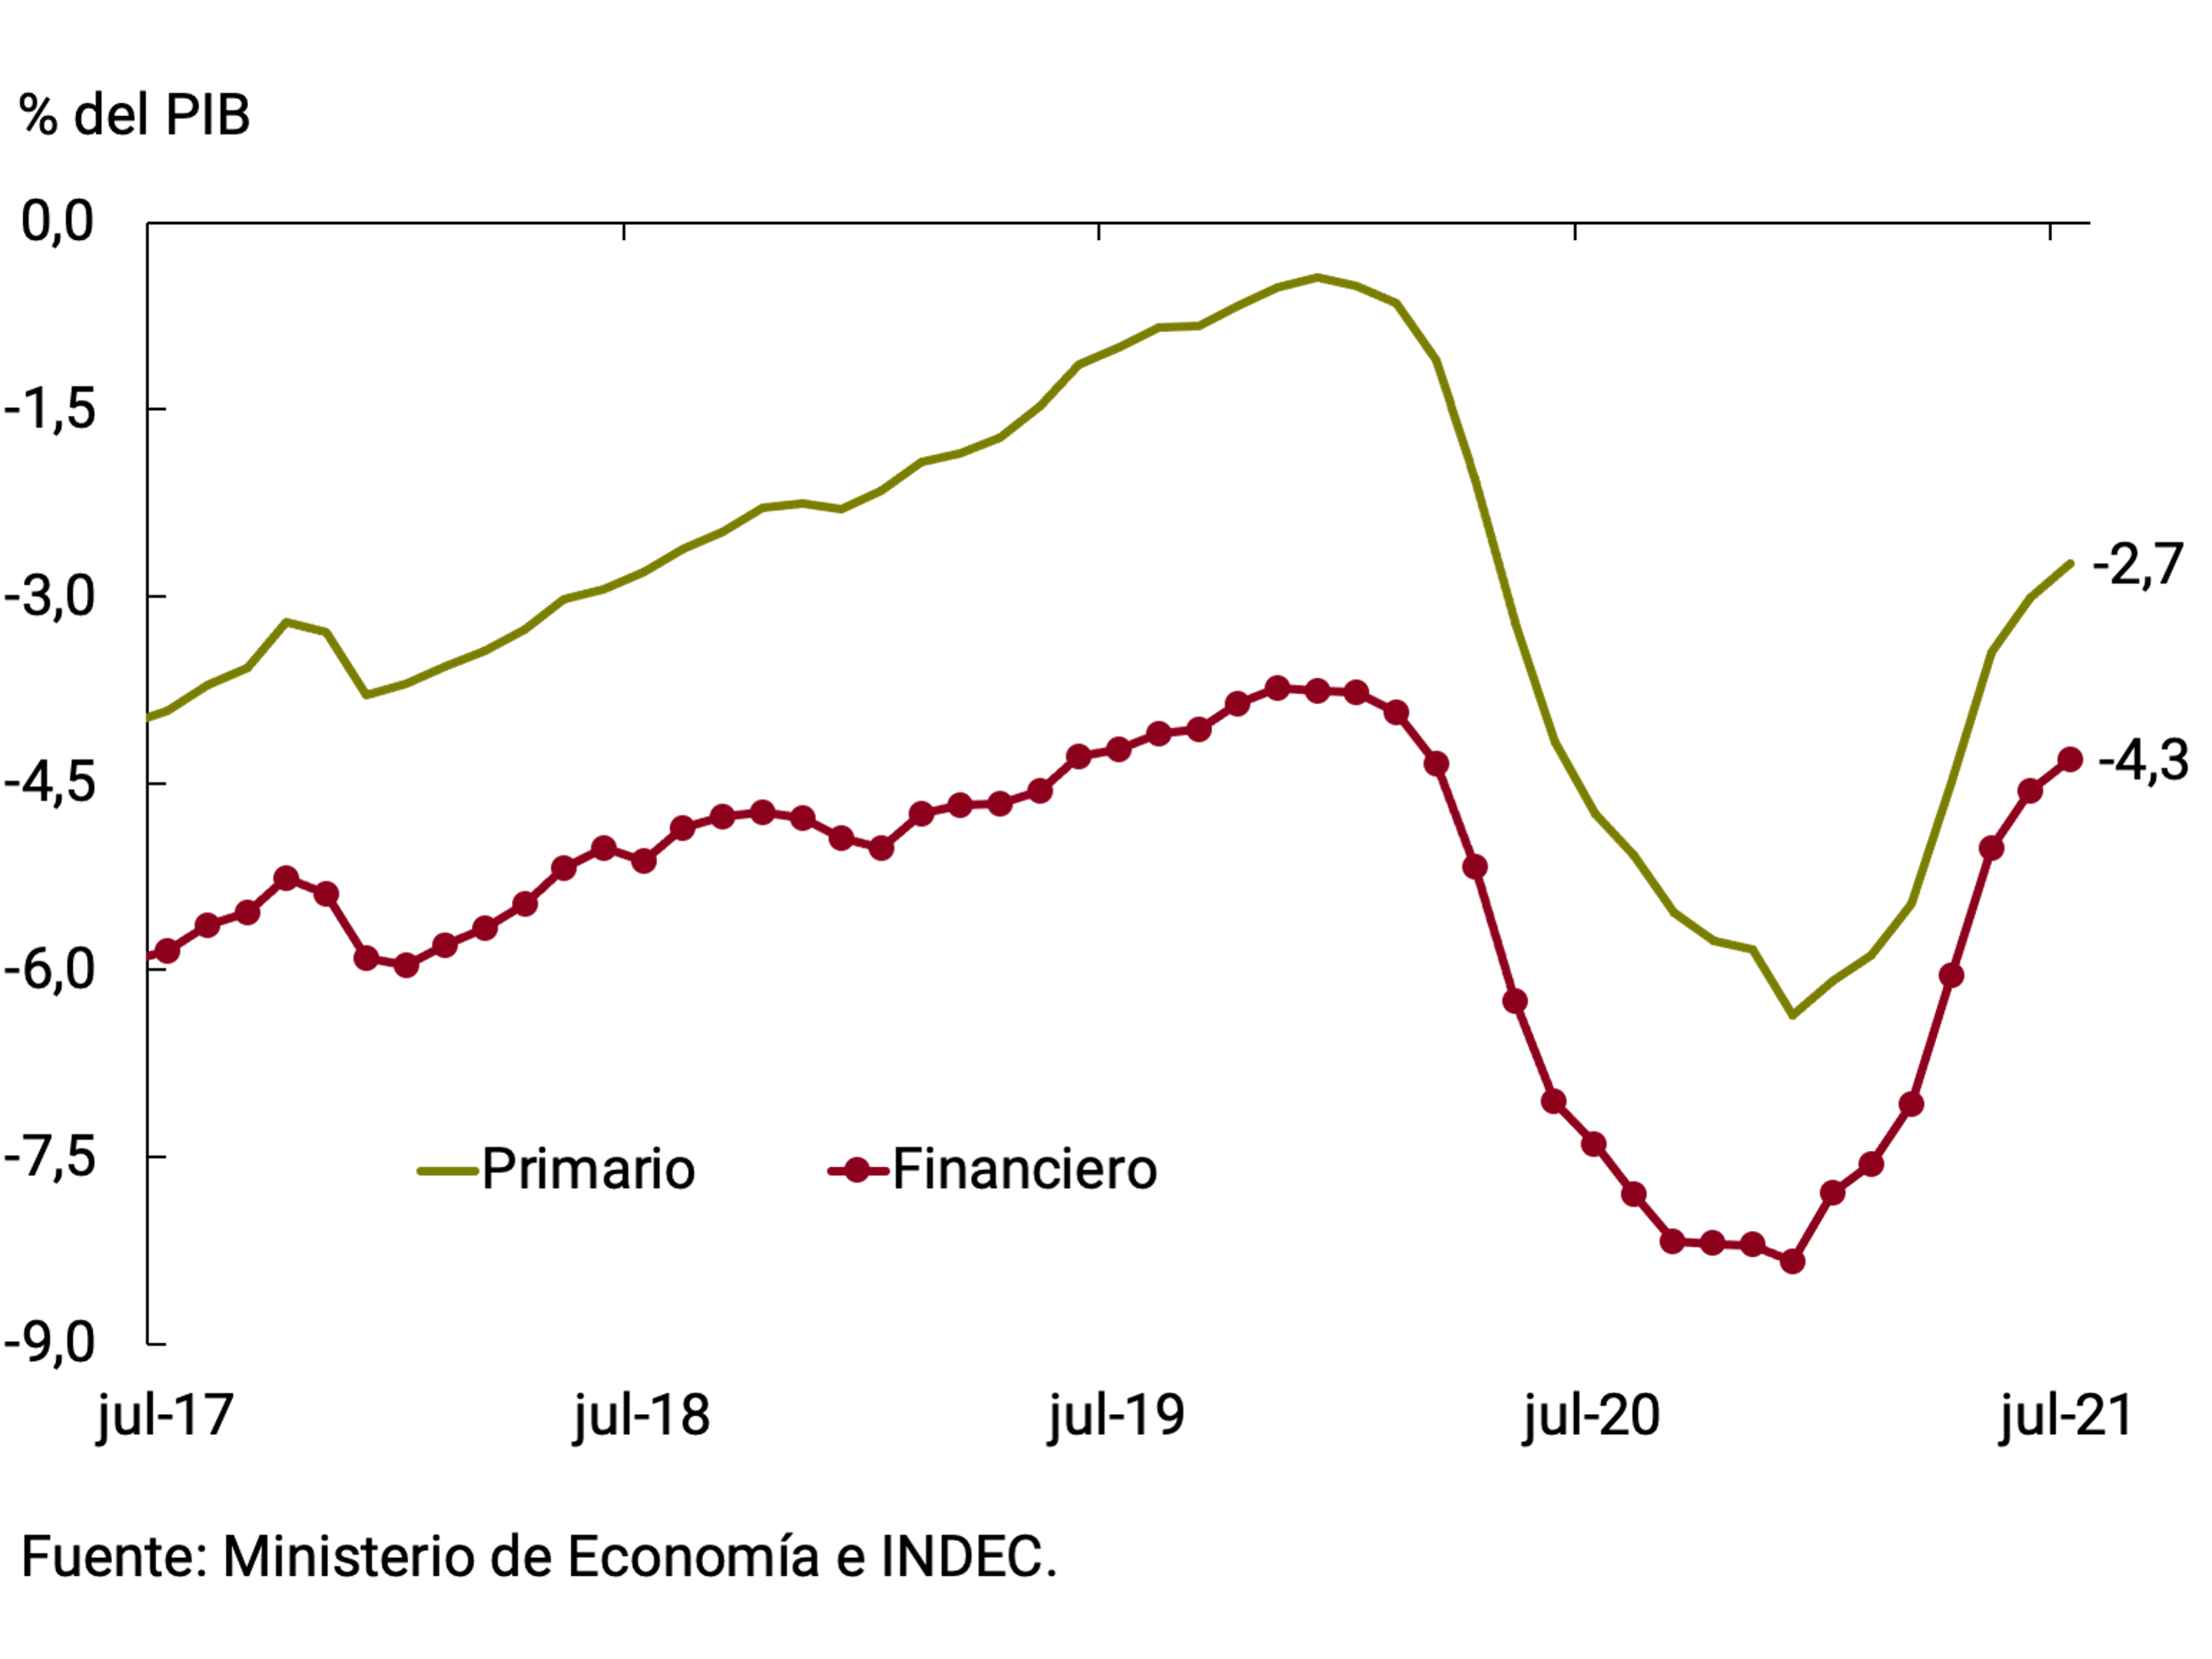
Given the trajectory of revenues and expenditures, a reduction in the fiscal deficit continued to be observed. In the last 12 months to July 2021, the primary deficit on a cash basis accumulated a balance equivalent to 2.7% of GDP, significantly lower than that observed during 2020 (-6.4% of GDP). This trajectory is consistent with what was established in the 2021 National Budget, which foresees a primary deficit of NFPS of 4.2% of GDP during this year.
Regarding financing from the National Treasury, during the second quarter the local market continued to play a greater role, allowing less financial assistance from the BCRA. The National Government continues negotiations with the International Monetary Fund (IMF) and reached a bridge agreement with the creditor countries grouped in the Paris Club to extend the debt repayment terms by around US$2,500 million. For its part, the extraordinary allocation of Special Drawing Rights (SDRs) by the IMF was effective, benefiting Argentina by approximately US$4,333 million. Among the risks faced in the fiscal scenario, an eventual resurgence of the pandemic stands out, which could require intensifying assistance policies and negatively affecting tax revenues. Likewise, challenges persist to continue developing a financing policy with greater prominence of the local debt market.
5.1. Tax revenues showed a marked dynamism and strengthened the public accounts
National tax collection increased 80.3% YoY in the second quarter of 2021 (see Figure 5.1). This behavior was explained by the consolidation of the economic recovery, the low base of comparison due to the full impact of the pandemic during the second quarter of 2020 and the higher values exported. In real terms, this performance implied an increase of 22% YoY (11 p.p. higher than the real year-on-year variation recorded during the first quarter). In July, the nominal increase was 66.9% YoY (+10% YoY in real terms).
Figure 5.1 | Contribution to the nominal growth of national tax collection by tax
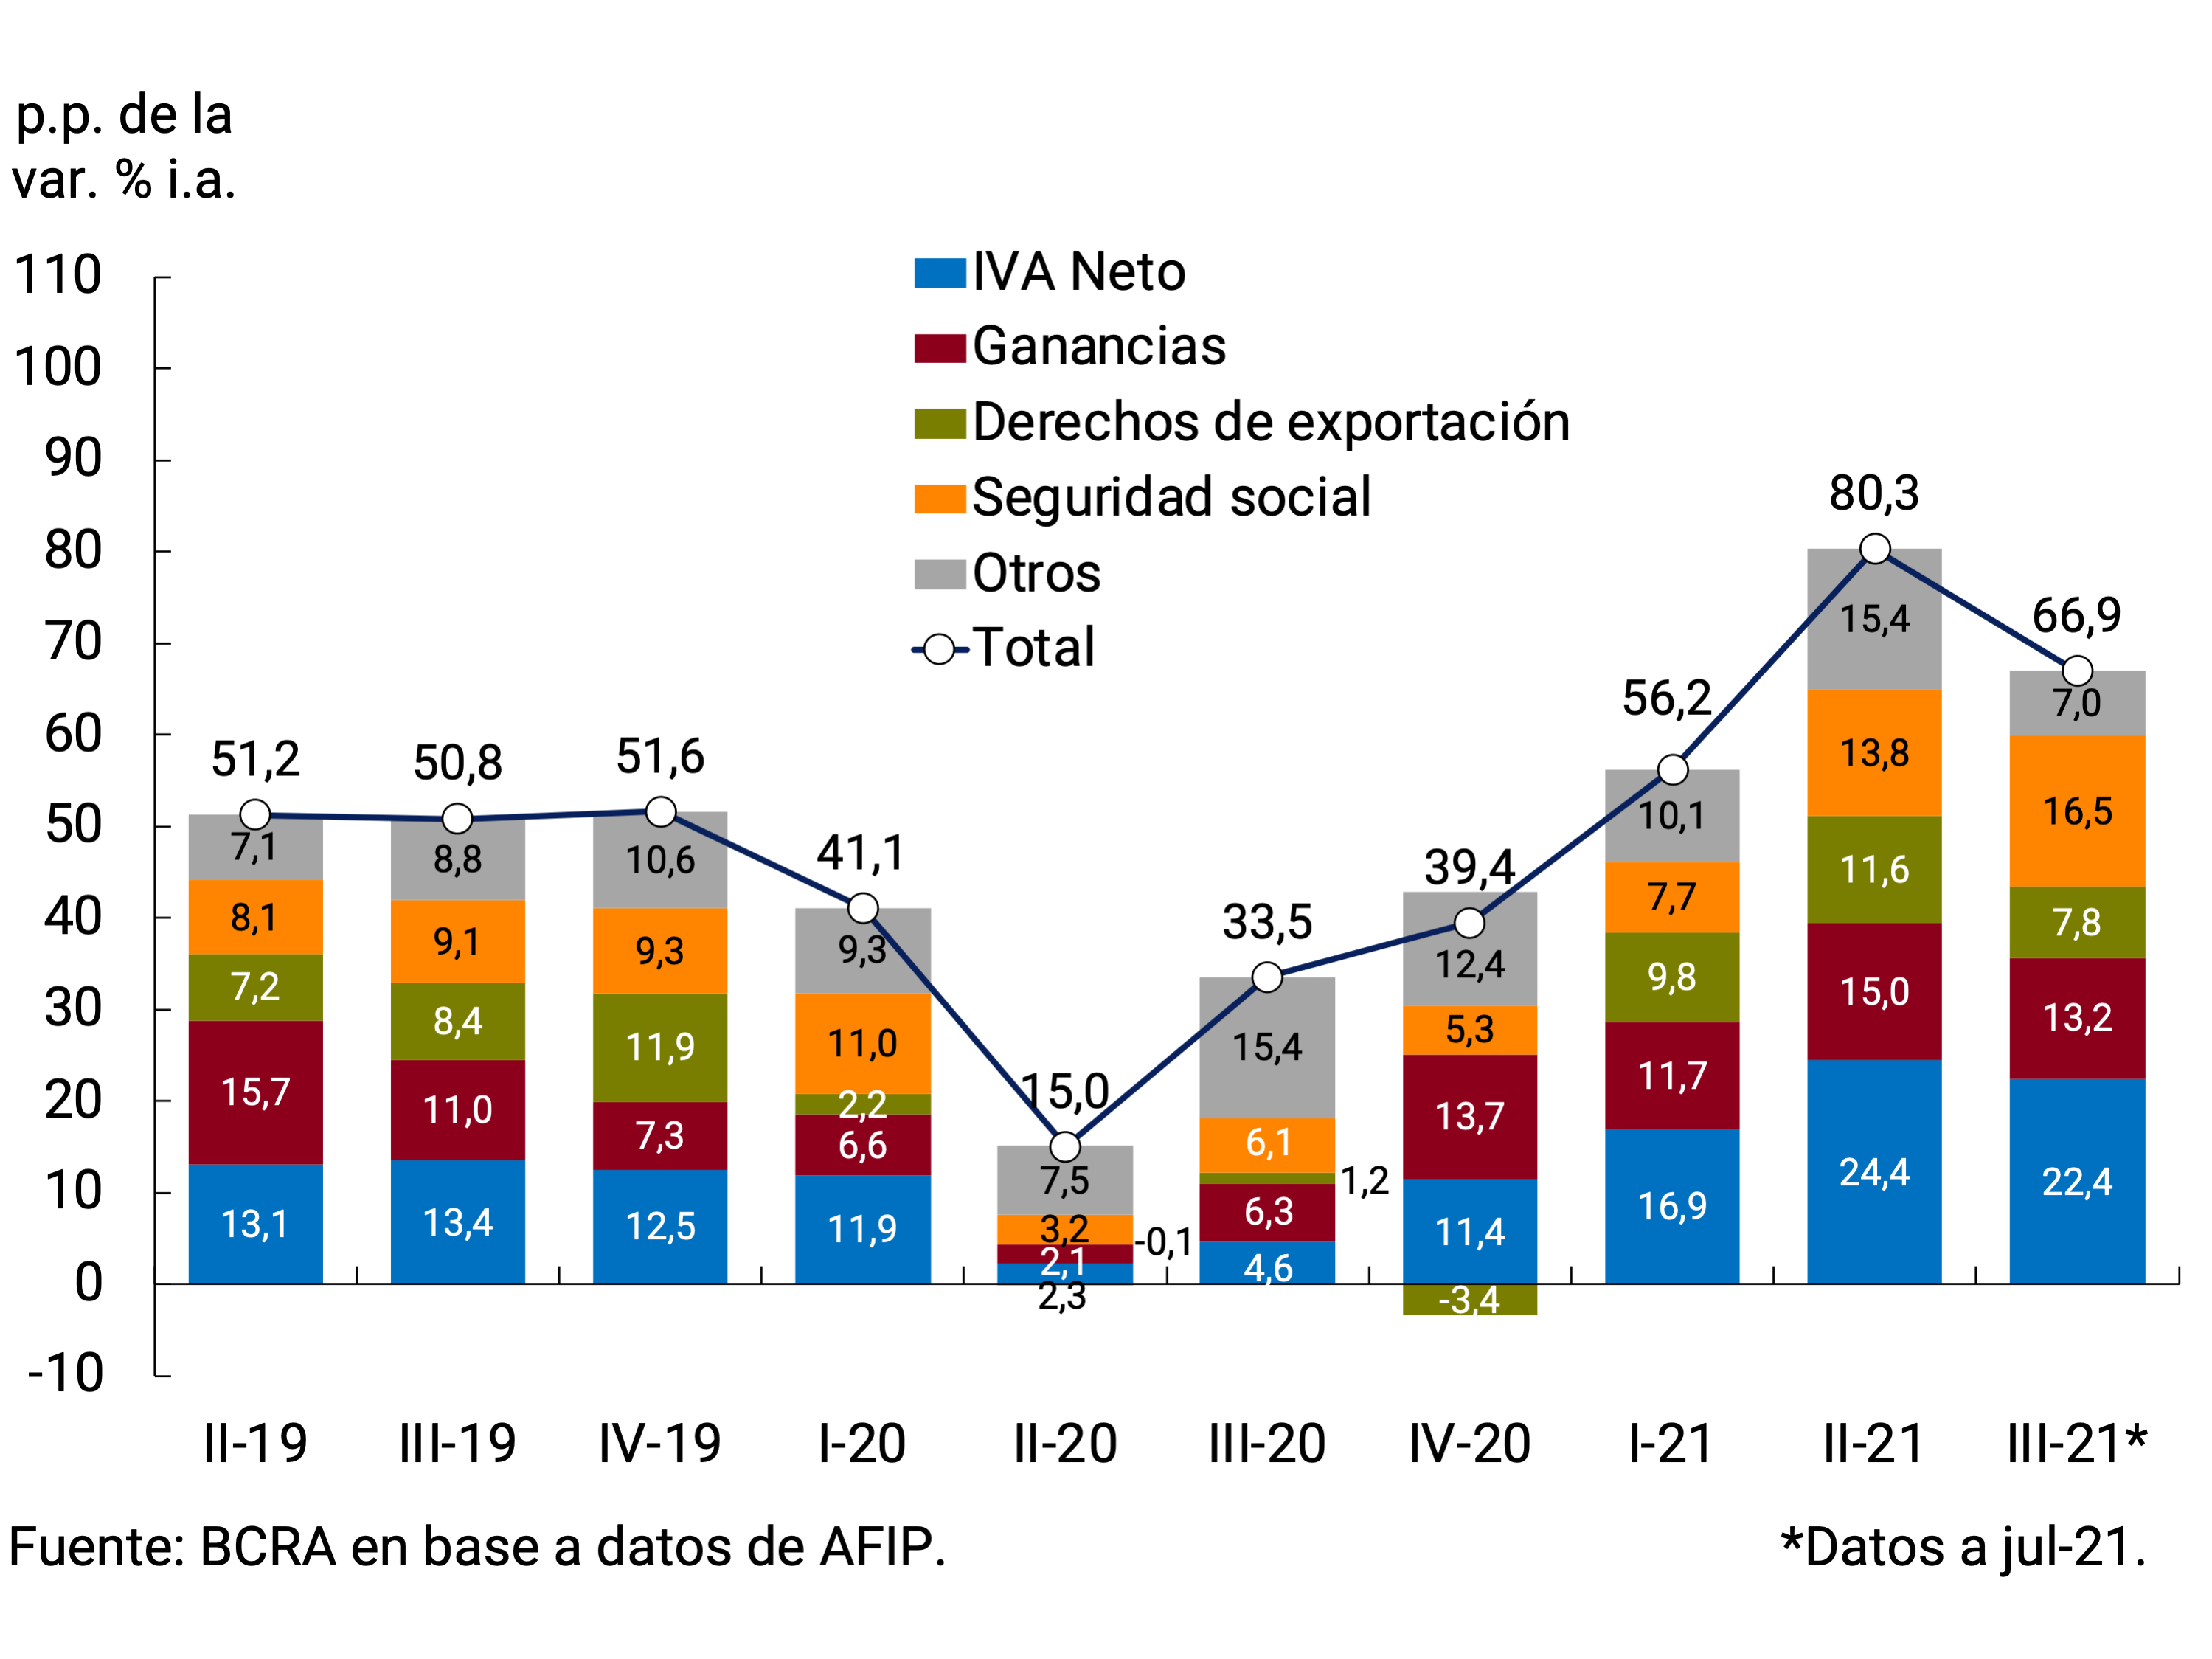
Taxes associated with foreign trade continued to show high dynamism. In a context of high international commodity prices, export duties registered a year-on-year growth of 139% in July, after expanding 189% YoY between April and June, maintaining an advance similar to that of the first quarter (190.4% YoY between January and March). Taxes linked to foreign purchases36 also showed a strong increase during the period: 100.6% YoY in July and 113.4% YoY in the second quarter. This behavior was basically explained by the high dynamism of imports (see Chapter 4. External Sector).
Taxes related to the domestic market (Value Added Tax (VAT), Profits, Fuels, among others) showed a better year-on-year performance between April and June in relation to previous quarters, due to the recovery of economic activity and the low base of comparison —the period of greatest intensity of the harmful impact of the pandemic—. Income Tax rose 68.5% YoY in July and 59.4% between April and June 63% YoY, in line with what was observed in the first quarter of the year. This tax is still affected upwards by the regulatory change of September 2020 on the withholding on purchases of dollars and expenses in foreign currency through credit cards. In addition, it is negatively impacted by the increase in personal deductions on the income of employees and by refunds for differences owed to these taxpayers in past months37. Net VAT grew 88.5% YoY in the second quarter of 2021 compared to the 54.2% YoY increase recorded in the previous quarter. For its part, the set of taxes modified by the Law of Social Solidarity and Productive Reactivation (such as Personal Property, Internal, PAIS) and by the National Budget Law 2021, maintained a good performance. In the opposite direction, the extensions of the payment dates of the balances of the Income Tax, Personal Property Tax and Cedular Tax affidavits operated.
Finally, social security resources showed a sustained recovery, mainly explained by the evolution of wages and employment: they grew 63.3% YoY between April and June (influenced by the low base of comparison due to the impact of the pandemic in 2020), 35 p.p. above the increase observed between January and March and maintained the year-on-year dynamism in July (+62.6% YoY). This set of taxes is still negatively impacted by the measures taken by the National Government to address situations in sectors critically affected by COVID-19, also reducing employer contributions in the health sector, the critical sectors contemplated in the REPRO II program and in the provinces of the Norte Grande.
The evolution of tax revenues allowed the total revenues of the National Non-Financial Public Sector (NFPS) to increase in nominal terms by 73.7% YoY in July and 99% YoY (34% real) between April and June, after having increased by 61% YoY during the first quarter of the year. Non-tax revenues increased by 202% YoY in July and 493% YoY in the second quarter due to the allocation of resources associated with the Solidarity and Extraordinary Contribution to Help Mitigate the Impact of the pandemic (between May and June, almost $170,000 million were recorded for this concept; Law 27605). Property rents increased 269% y.o.y. between April and June, explained by the collection of services of loans granted by the National Social Security Administration (ANSeS) – which was suspended in the same period last year – a trend that continued into the seventh month. Meanwhile, capital resources decreased in year-on-year terms in July and in the second quarter, affected by the provisions of Law No. 27574 on the defense of the assets of the Sustainability Guarantee Fund (FGS), which stipulates the suspension of financing to the ANSES by the FGS to meet the disbursements of the Historical Reparation program.
Meanwhile, the tax collection of the provinces as a whole exhibited a behavior consistent with what was observed at the national level. According to the partial information available for the main districts, in the second quarter of the year the nominal advance of own tax resources would have accelerated compared to the first quarter, with variations of around 80% y.o.y. due to the low base of comparison of the same quarter of 2020.
5.2. Within public spending, capital spending was prioritized to contribute to economic recovery
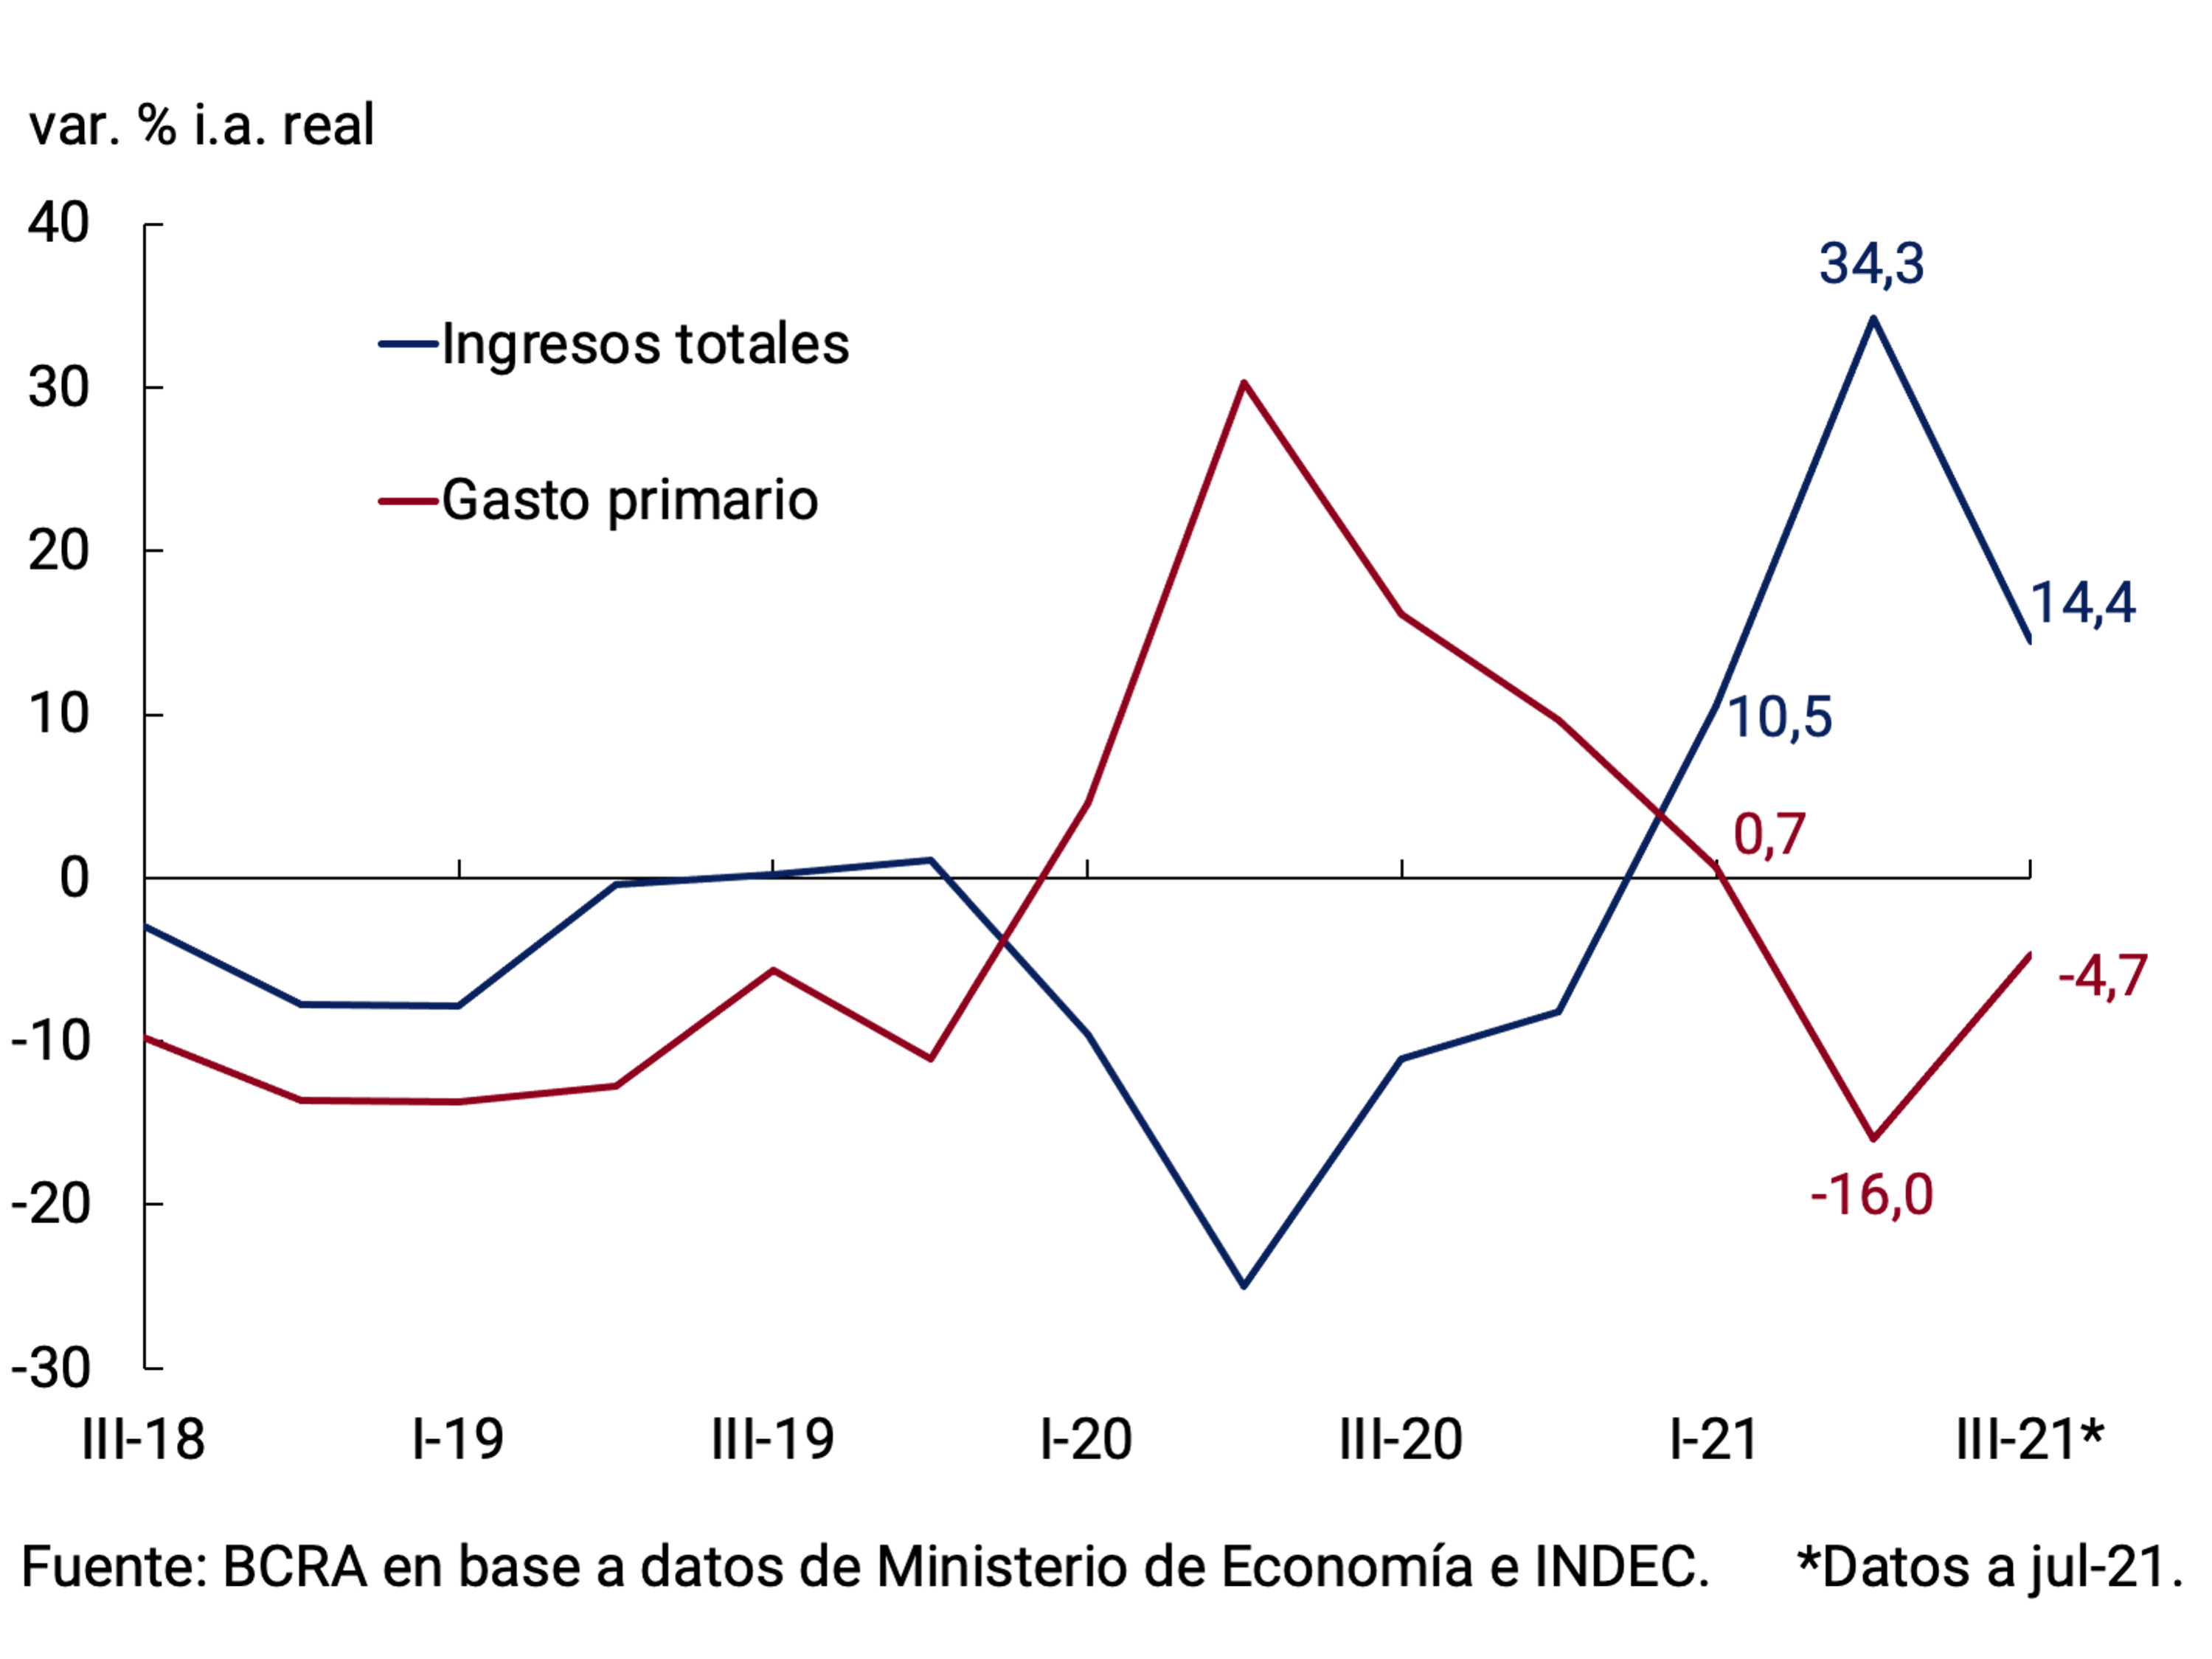
NFPS primary expenditure showed a nominal increase of 44.7% YoY in July and 25% YoY in the second quarter of the year, 74 p.p. below the nominal increase in revenues. In real terms, expenditures decreased by 4.7% YoY in July and by 16% YoY between April and June, while revenues increased by 14.4% and 34.3% YoY, respectively (see Figure 5.2).
Figure 5.2 | NFPS Primary Revenue and Expenditure
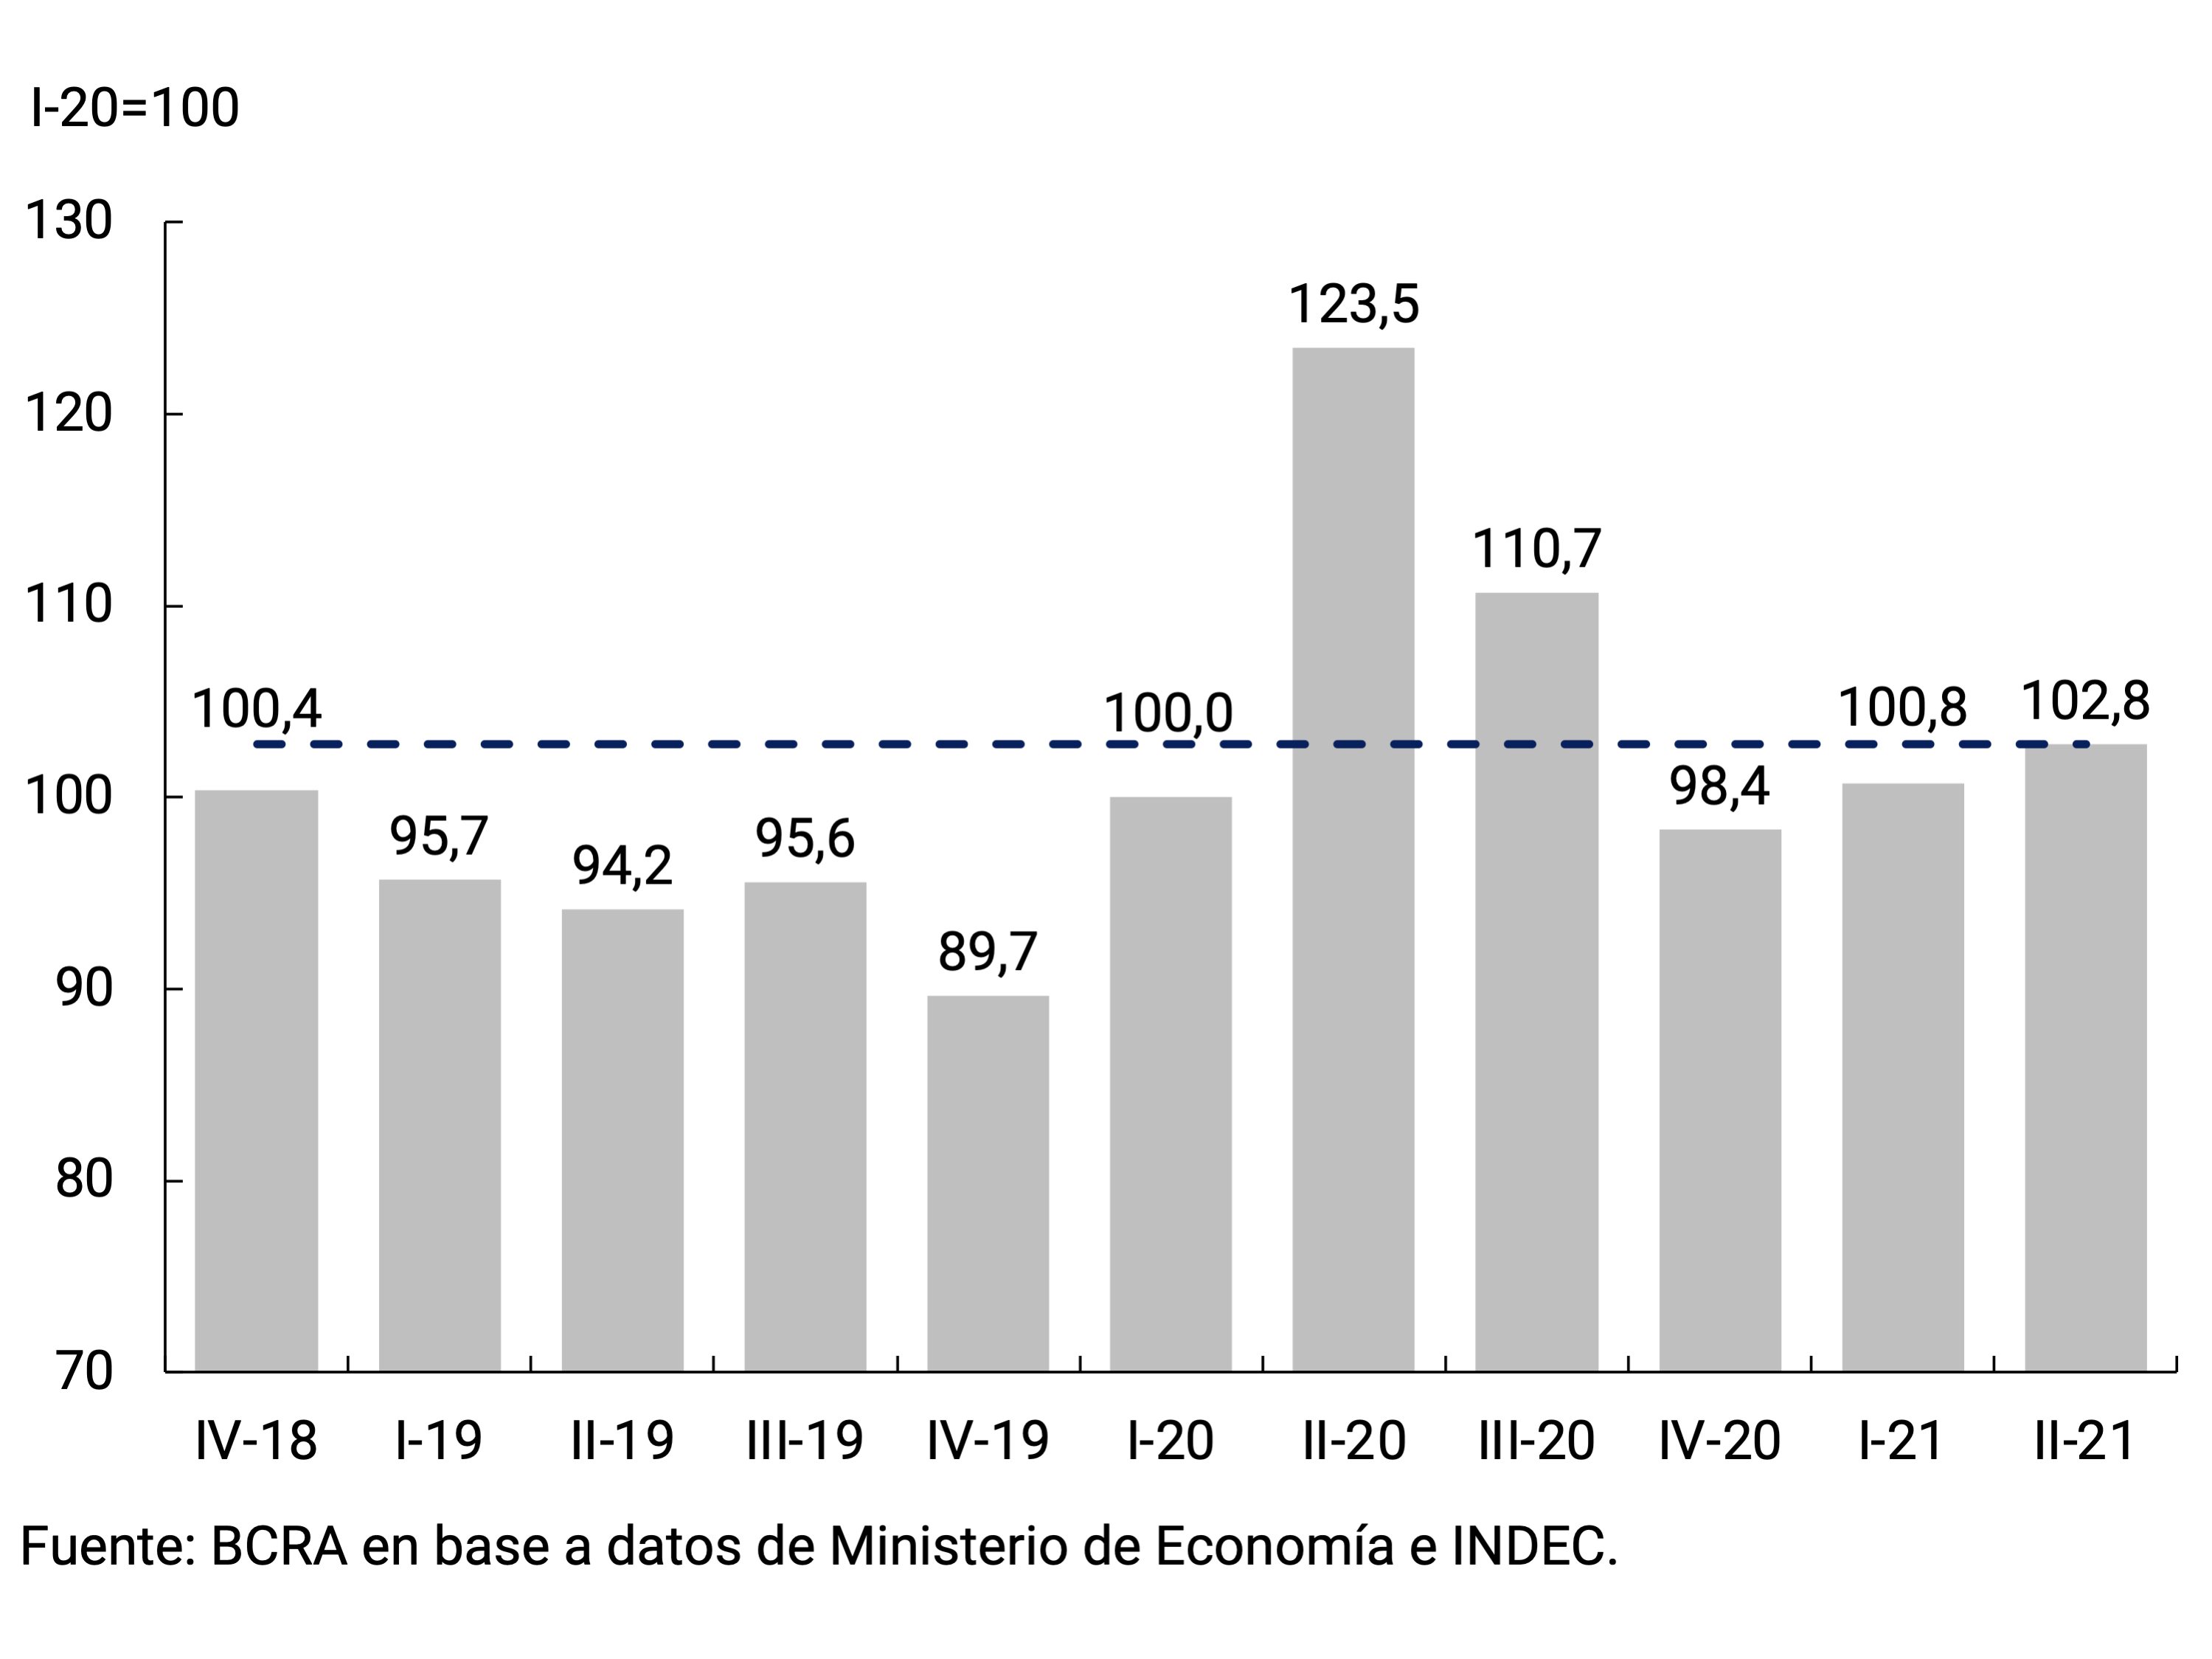
It should be borne in mind that for most of the current year, the public accounts will be affected by a basis of comparison that includes the effects of the pandemic, the greatest deployment of which was concentrated in the second quarter of 2020. In this sense, if real seasonally adjusted primary expenditure is observed, it was 2.8% above the pre-pandemic level (I-20; see Figure 5.3) in the second quarter of 2021 and even higher than in 2019.
Figure 5.3 | NFPS-adjusted real seasonally adjusted primary expenditure
During the second quarter of 2021, social security benefits accounted for most of the increase in primary spending: they grew by 35% YoY (vs. +29% YoY in the first quarter)38, within the framework of the provisions of the new Social Security Mobility Law39. Regarding social programs, the expenditures of the Food Policies program were highlighted due to the increase in the allocation of 50% as of February 2021 and the expansion of the universe of beneficiaries up to 14 years of age, inclusive, and the Empower Work program due to the increase in both the number of people and the Minimum Living and Mobile Wage. In turn, payments from the Employment Actions program – mainly REPRO II – registered a significant increase in order to assist the productive sectors critically affected by the pandemic40. For its part, the ANSES paid a one-time reinforcement of $15,000 in April to holders of Universal Child Allowances for Social Protection (AUH) and Universal Pregnancy Allowance (AUE), and to the lowest category single-payers residing in the Metropolitan Area of Buenos Aires (AMBA)41. In order to sustain the purchasing power of the most vulnerable older adults, ANSES also ordered the payment in April and May of an extraordinary sum of $1,500 to more than 4 million retirees and pensioners with assets of up to 1.5 minimum salaries, while promoting in August the payment of a bonus of $5,000 for beneficiaries who receive up to two minimum salaries.
In a context in which the national government promoted a policy of containing the rates of public services – electricity, gas, water and transport – economic subsidies accounted for a significant portion of the year-on-year increase in spending: they grew 125.3% YoY in July and 65% YoY during the second quarter compared to 77% YoY in the first three months of the year. The increase was disseminated among the main destinations associated with energy and public passenger transport.
Items associated with salaries (including transfers to universities) grew 50.4% in July and 52% between April and June, while other current expenditures grew by 134.3% YoY and 99% YoY, respectively. It should be noted that in this last item the purchases of goods and services (including expenditures associated with the purchase of vaccines) and the deficit of public companies, among others, are recorded. For their part, current transfers to the provinces moderated significantly compared to the same period in 2020, when the National Government had extraordinarily assisted the districts in the face of the abrupt decrease in collection. This performance was verified despite the fact that since the beginning of 2021, the transfers associated with the creation of the Fund for the Fiscal Strengthening of the Province of Buenos Aires42 began to be recorded in the budget.
Capital expenditure continued to be the most dynamic item, in line with the definition of priorities set out in the 2021 National Budget to promote the recovery of economic activity. In fact, Real Direct Investment (IRD) grew 159% YoY during the second quarter, while transfers for capital expenditures increased 68% YoY in the43rd quarter. In July, capital expenditure increased 91.6% YoY.
It is important to note that the reduction in interest payments on public debt, achieved after the successful restructuring of liabilities denominated in foreign currency last year, and the reconstruction of the local debt market generated fiscal space to sustain the dynamism of NFPS primary expenditure aimed at financing public policies that mitigated the health and economic effects of the pandemic and promoted economic recovery. Interest on public debt, net of intra-public sector payments, went from representing 3.4% of GDP in 2019 to around 2% of GDP in 2020 and around 1.6% of GDP in the accumulated of the last 12 months to July 2021.
Thus, the primary deficit of the NFPS accumulated in the last 12 months to July represented approximately 2.7% of GDP, 3.6 p.p. less than in December 2020 (see Figure 5.4). This evolution is in line with the 2021 National Budget, which forecasts that the primary deficit result will be reduced to 4.2% of GDP for the accumulated to December. For its part, the financial deficit of the NFPS accumulated in the same period stood at 4.3% of GDP, 4 p.p. below the total deficit of 2020.
Figure 5.4 | Primary outcome of NFPS (cumulative 12 months)
5.3. The National Government met its needs to a greater extent through the placement of debt instruments in the local market
During the second quarter of 2021, the National Treasury (TN) achieved a refinancing of 136% of principal and interest services (112% in July), which implied a net financing of approximately $266,000 million (about $35,000 million in July)44. The issuances of public debt instruments were made mostly with securities adjustable by CER, followed by discount instruments and finally by fixed-rate government securities. Additionally, in the first auction in August, securities adjusted to the evolution of the dollar were awarded.
Since the beginning of the National Government’s administration at the end of December 2019, a process of extending the terms of the instruments issued was consolidated, while the cost of financing in pesos remained relatively stable. For its part, during the month of June and July 2021, voluntary debt conversion operations were carried out, which made it possible to significantly decompress the maturity profile. Going forward, a continuity of the TN financing strategy is expected with the aim of developing the local peso debt market. In this sense, in mid-July, the new guidelines for the implementation of the Market Makers Program 2021 were established, registering in August a total of 13 entities interested in the role of45 applicants. In addition, in order to deepen liquidity in the capital market, the Central Bank began to operate in the public securities futures market.
So far in 2021, and in contrast to the same period last year, the greater role of the market in financing the needs of the NT stands out, which led to a reduction in the BCRA’s financial assistance, which was consolidated in the second quarter, remaining in line with the budget. So far this year, $520,000 million have been transferred as a transfer of profits from the BCRA to the TN and $190,000 million in net transitory advances46.
A bridge agreement was negotiated with the creditor countries grouped in the Paris Club on the maturity of around US$2,500 million, achieving an extension of negotiation terms with a maturity of March 31, 2022. In return, in the period between May 2021 and March 2022, around US$430 million will have been paid in capital payments47.
Finally, the National Government continues with negotiations with the IMF, having as next capital maturities with it, those scheduled for September and December. Meanwhile, the extraordinary general allocation of Special Drawing Rights (SDRs) by the agency was confirmed, which represented for Argentina a financial source of around US$4,333 million to meet its needs in foreign currency.
6. Pricing
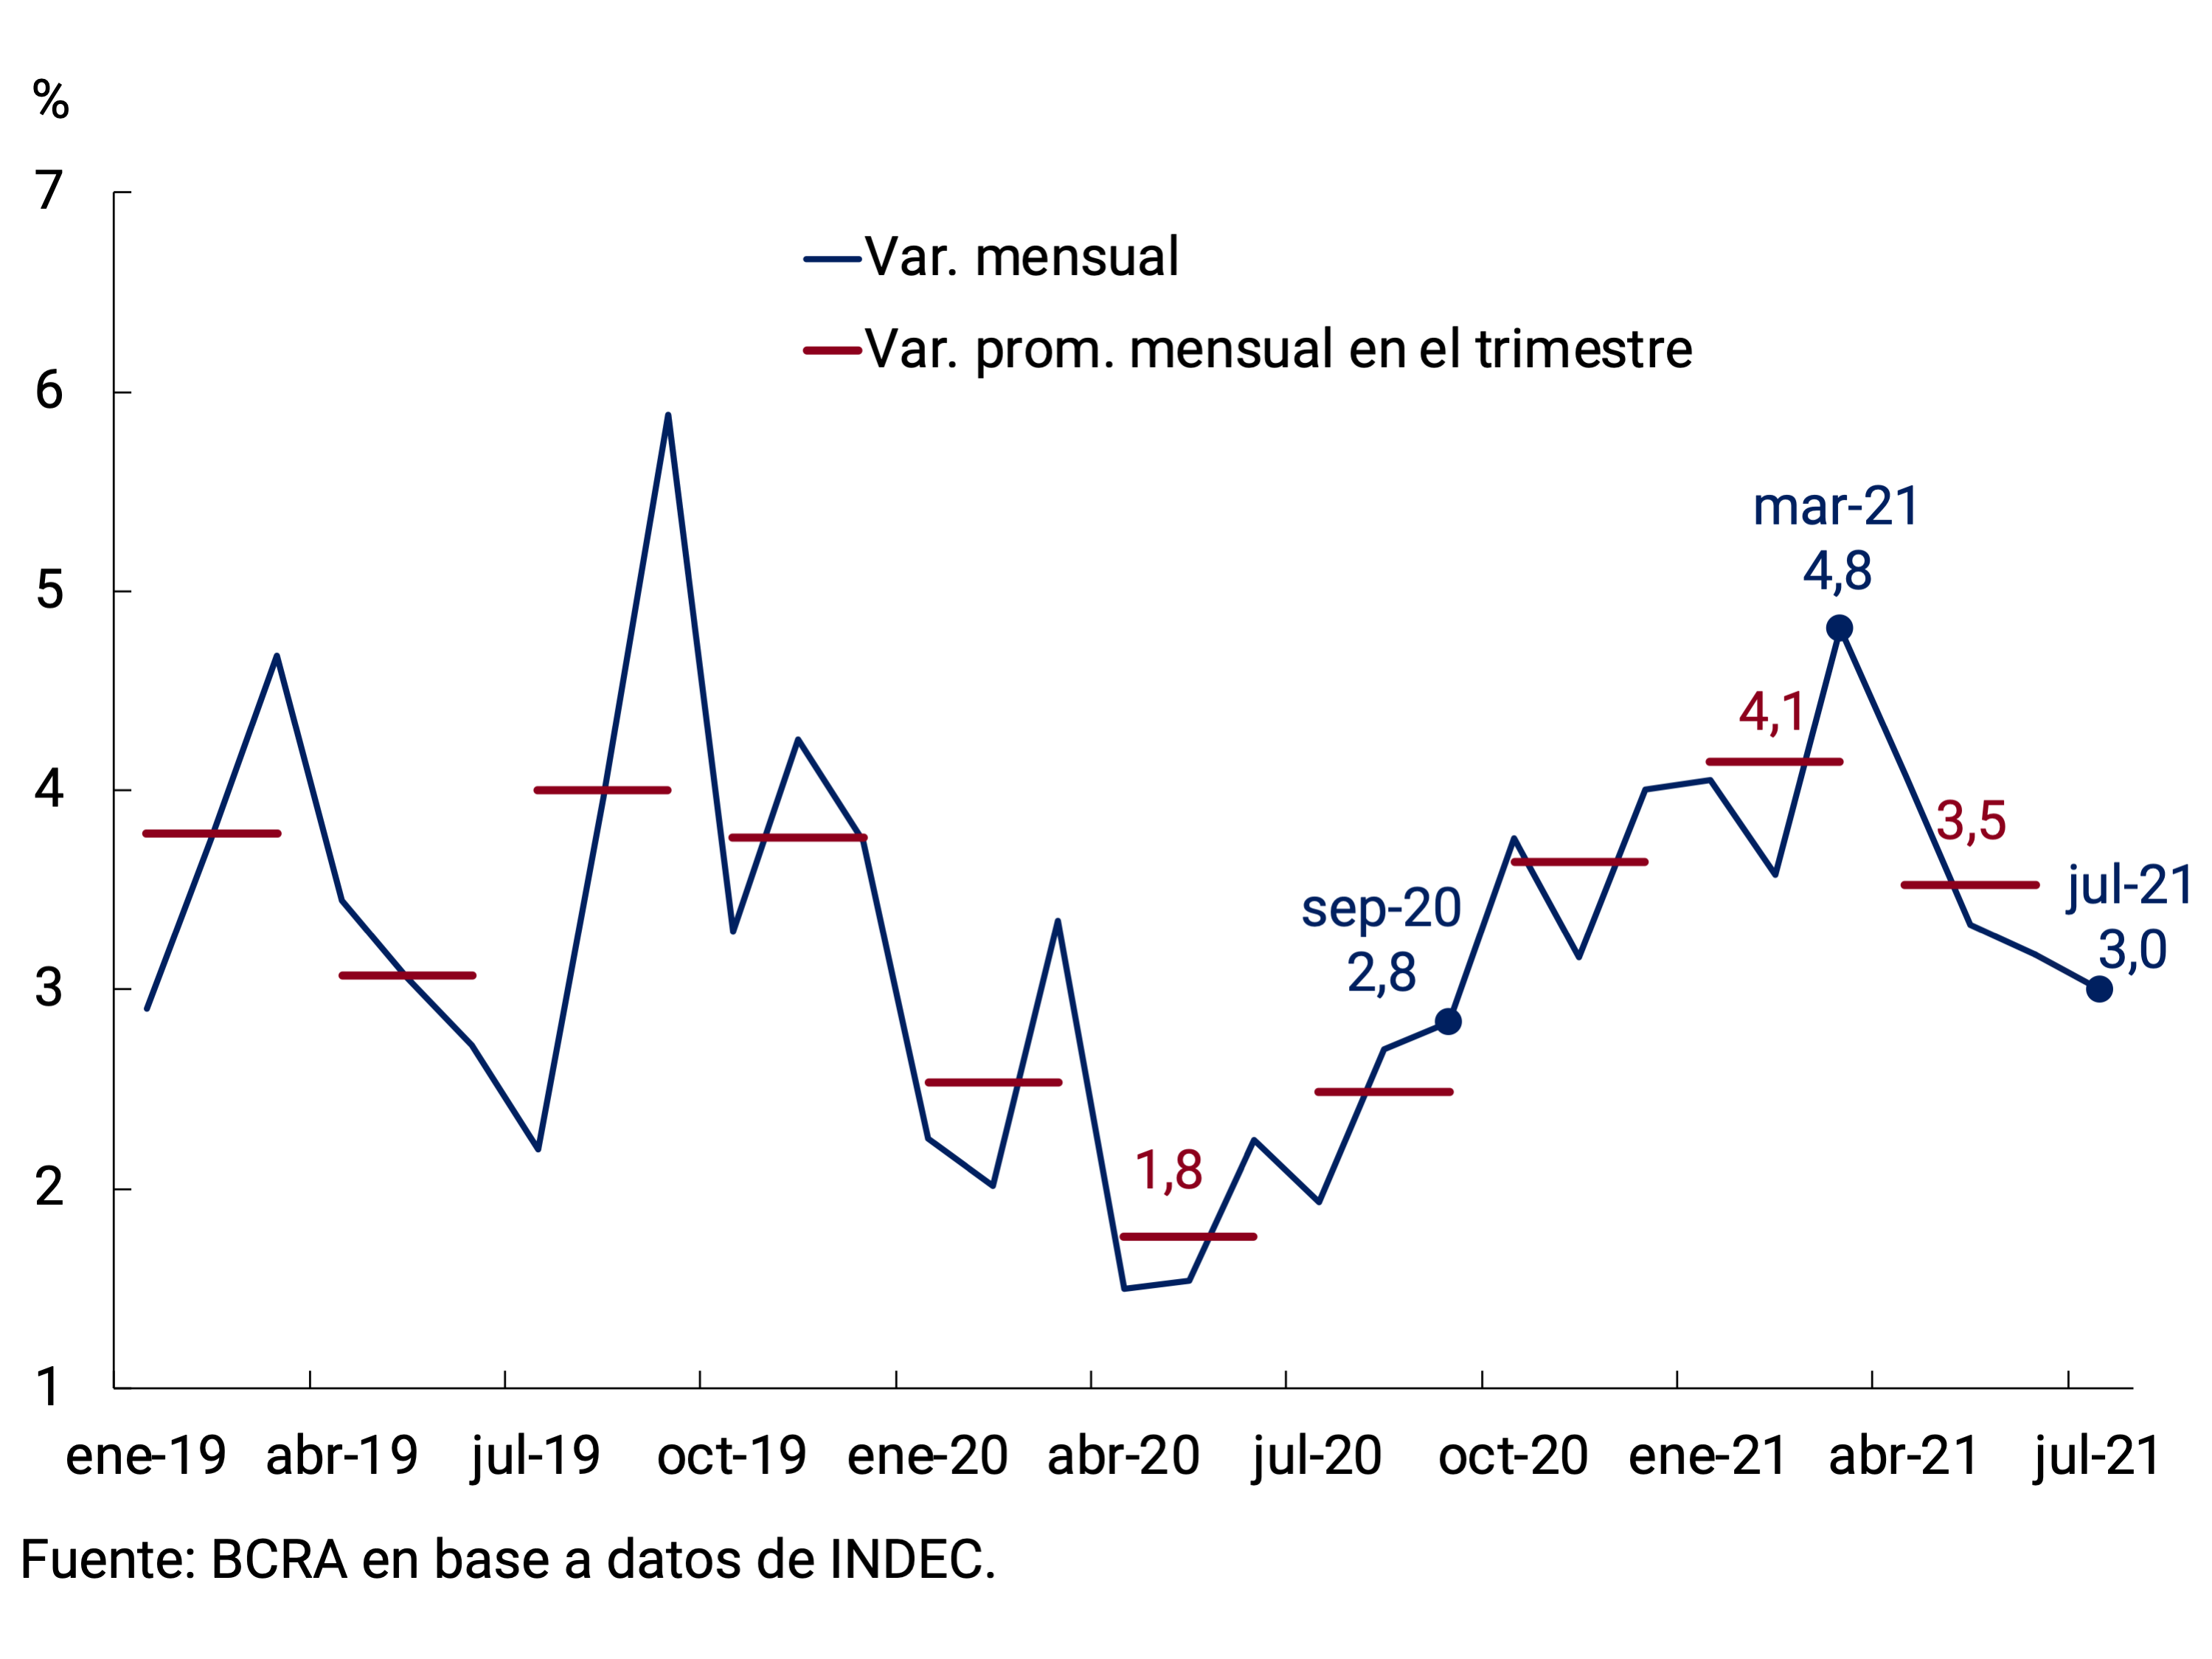
Average monthly inflation in the second quarter was down from the previous quarter. This gradual deceleration in prices was widespread among categories, being more pronounced in seasonal ones. This trend continued in July, with the lowest monthly increase in the General Level since September 2020 (3.0%).
Prices of goods continued to grow at a faster rate than services during the second quarter of the year. In a period with limited variations in the nominal exchange rate, this dynamic was partially explained by the sharp increase in international prices that has been verified since mid-2020. The moderation of services with respect to goods is associated with their lower relative demand since the pandemic began and the national government’s policy of containing public service rates.
Year-on-year inflation continued to rise to 48.5% in the second quarter and to 51.8% in July, despite the monthly slowdown in prices. This divergence is explained by the low base of comparison of the same period in 2020 when, in the context of the greatest impact of the pandemic on the economy, monthly records were on average 1.9%.
The slowdown during the second quarter was more pronounced in wholesale prices, a trend that continued in July. The domestic wholesale price index (IPIM) rose during the quarter at a higher rate than the exchange rate, influenced by international prices, but lower than that recorded by retail goods.
The gradual decline in monthly inflation rates is expected to continue for the remainder of the year from a reduction in the pace of growth in regulated services and goods. For their part, the updates of the wage parity and the gradual recovery of demand would generate a recomposition of the relative prices of private services. As a result of the low base of comparison, the monthly deceleration of prices would be reflected in a stabilization of the year-on-year inflation rate in the coming months that would begin to fall only towards the end of the year. In this context, the BCRA will continue to guide its monetary and exchange rate policy to help consolidate the process of gradual reduction of inflation.
6.1. Retail prices slowed during the second quarter
During the second quarter of 2021, retail prices registered an average monthly increase of 3.5%, slowing down 0.6 p.p. compared to the previous quarter (see Figure 6.1). The reduction in monthly registrations, which began in April, continued in July with a price increase of 3.0%, the lowest since September 2020.
Figure 6.1 | CPI. Monthly and quarterly evolution of the General Level
The slower pace of increase in the second quarter was generalized for all categories of the Consumer Price Index (CPI). Seasonal products averaged a monthly increase of 1.4% (-3.0 p.p. compared to the first quarter), being the category that contributed the most to the slowdown in the general level. The Core category expanded at an average monthly rate of 3.9% (-0.3 p.p. compared to the previous quarter), with a marked decrease in monthly registrations starting in May. For their part, the prices of Regulated items also slowed the pace of increase, averaging a monthly increase of 3.5% in the first quarter (0.4 p.p. below the first quarter of 2021; see Chart 6.2).
Figure 6.2 | CPI. Contributions of Seasonal, Regulated and Core Goods and Services in the Quarter
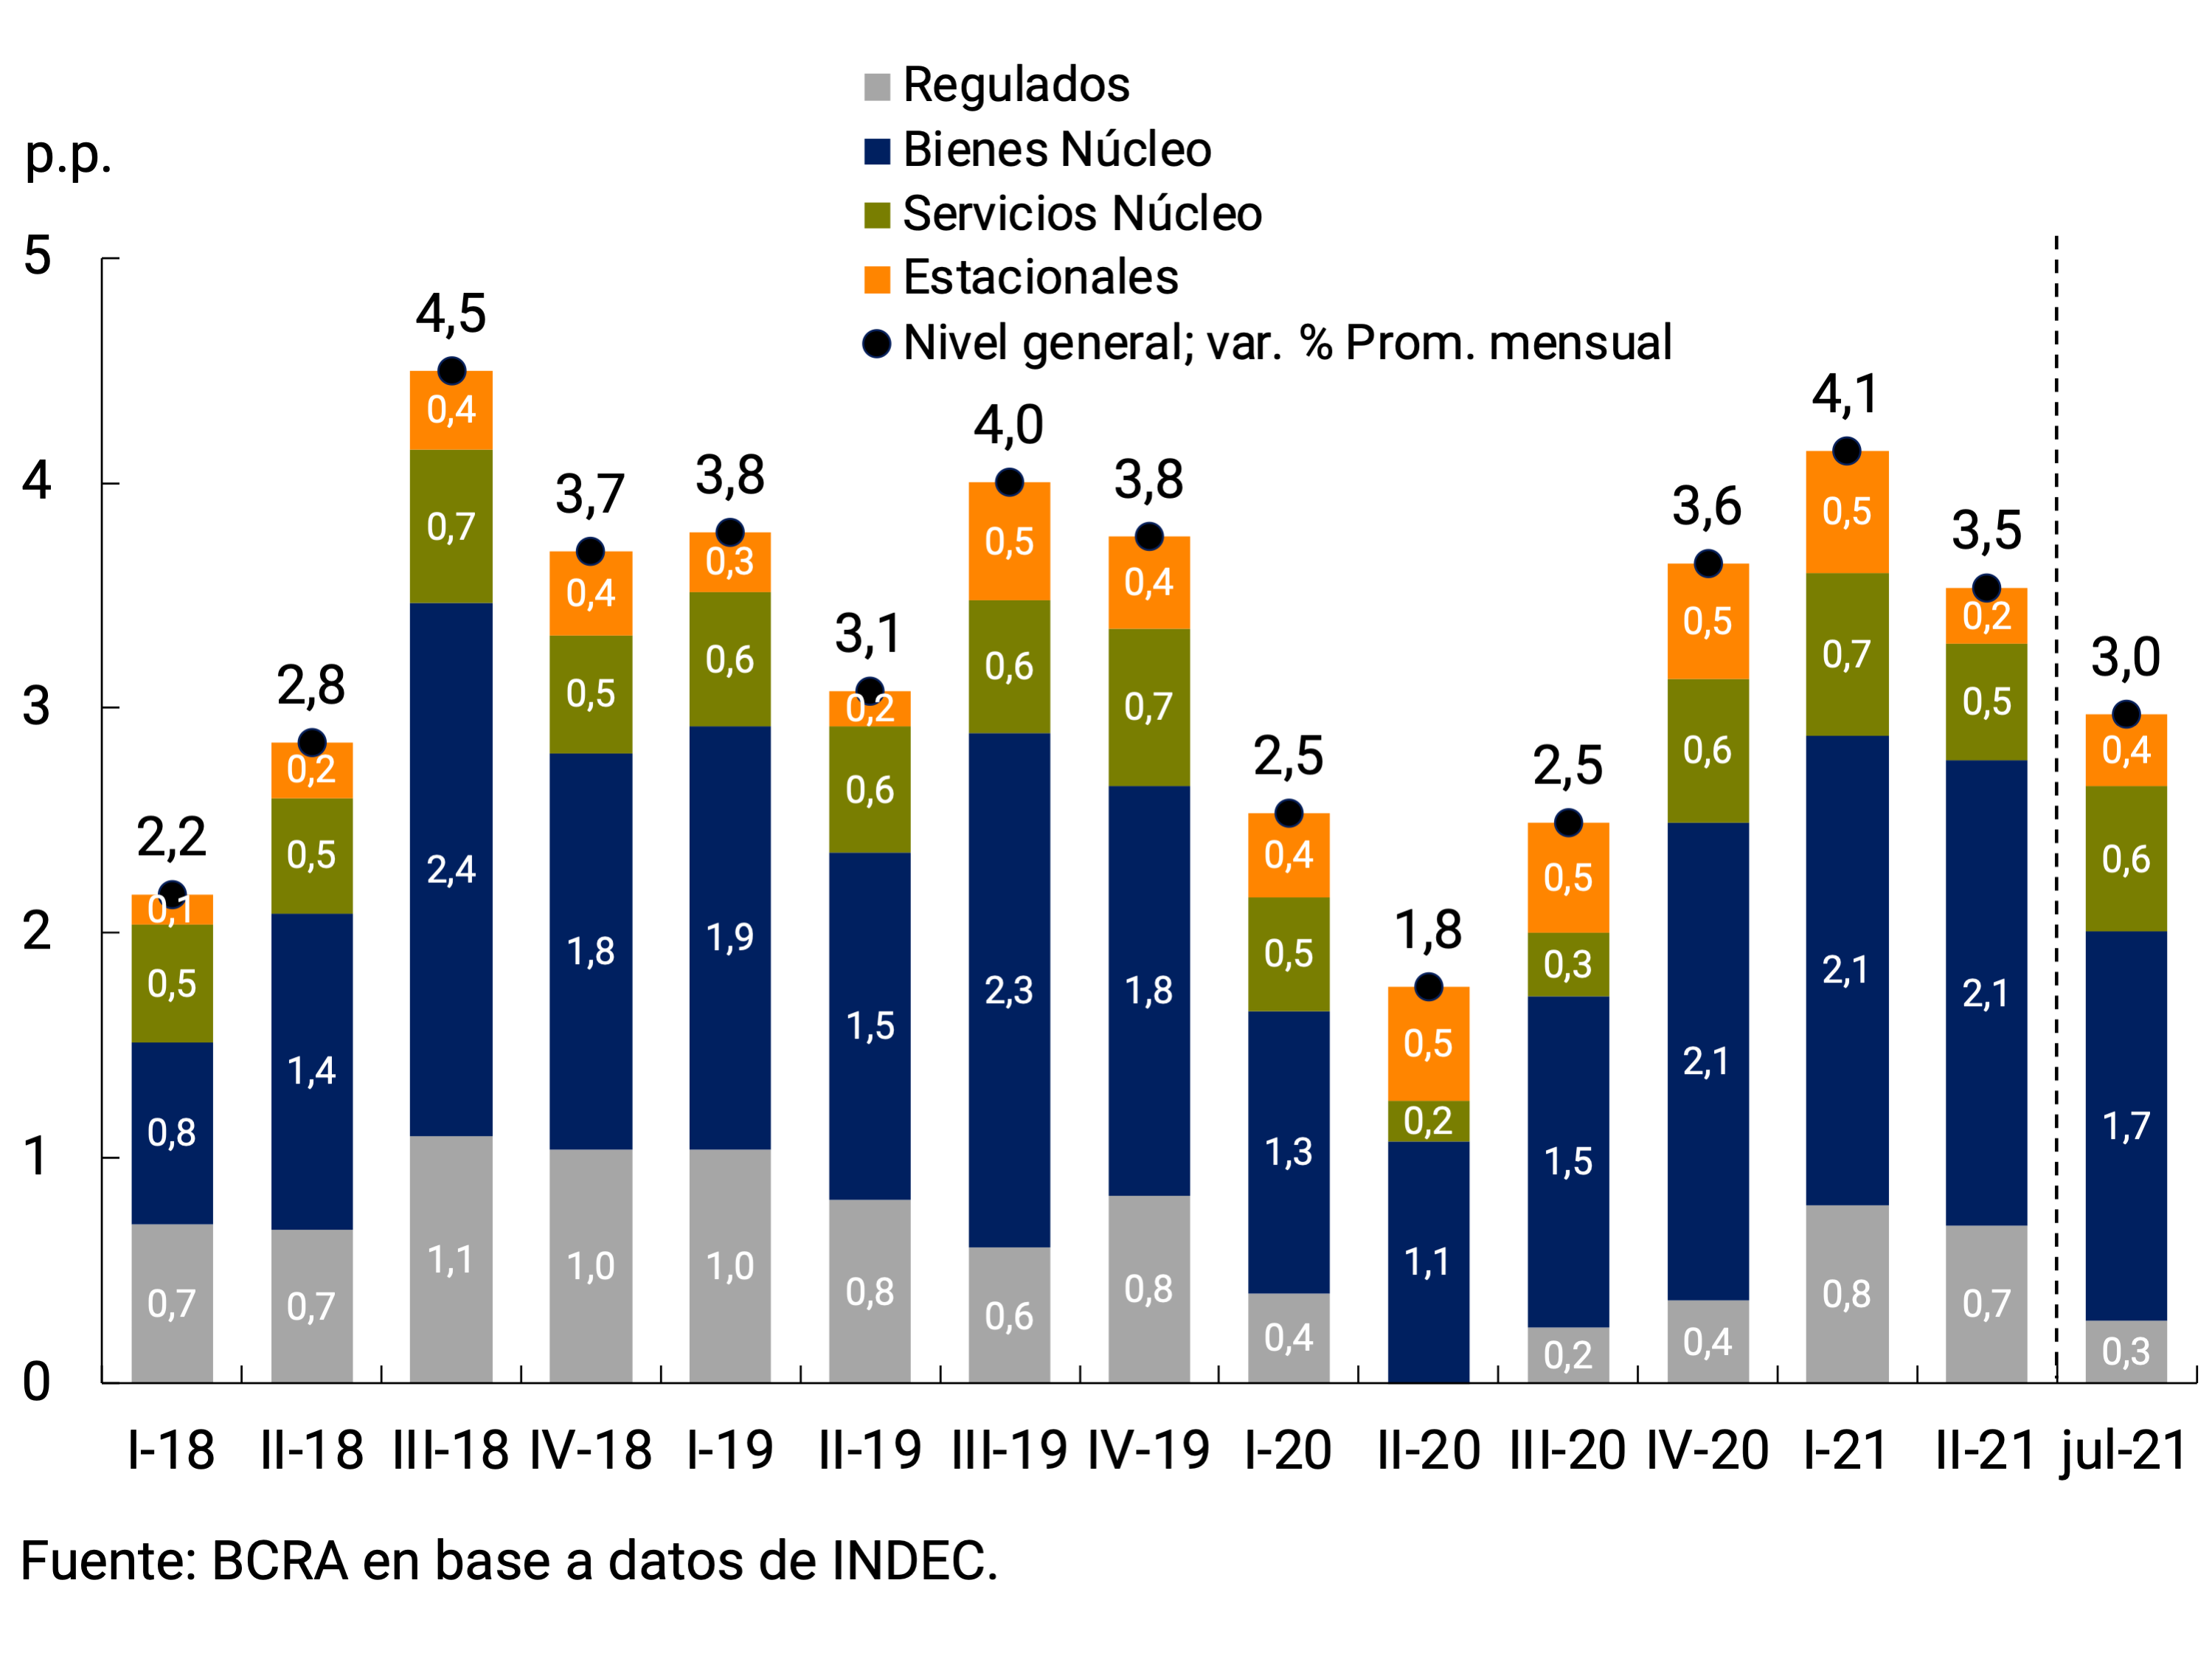
In the second quarter of the year, goods continued to grow at a faster rate than services, accentuating the pattern observed since the beginning of the pandemic, although both slowed down, averaging increases of 3.9% and 2.7% respectively (-0.6 p.p. and -0.9 p.p. compared to I-21, in each case). In July, the monthly variation of services (3.1%) exceeded that of goods (2.9%), which meant an incipient recomposition of their relative prices.
In a period with limited variations in the nominal exchange rate, the higher rate of increase in the prices of goods compared to that of services was partially explained by the sharp increase in international prices that began in mid-2020. Regarding the slowdown in goods during the second quarter compared to the first, it was mainly explained by the lower dynamism in the Food and non-alcoholic beverages division (3.6% monthly average, -0.9 p.p. compared to I-21). The slowdown in Clothing and footwear also had an impact, explained by seasonal effects linked to the change in the autumn/winter season, present in the previous quarter (3.8% monthly average, -1.1 p.p. compared to I-21). To a lesser extent, the reduction in the average monthly increase of the Alcoholic Beverages and Tobacco division (3.6%, -1.3 p.p. compared to I-21) also contributed, mainly due to the evolution of tobacco (2.2% monthly average, -2.7 p.p. compared to I-21). On the other hand, with a higher level of disaggregation, certain goods, such as fuels and lubricants for home vehicles and medicines, increased the rate of increase compared to the first quarter of the year.
The Food and beverages division of the CPI slowed down compared to the first quarter, although it showed a heterogeneous behavior at a more disaggregated level. Processed foods registered higher increases than fresh foods due to updates in government price programs, after having maintained a lower rate of expansion during 202054. The recent increases in bakery, dairy, infusions, oils and fats were especially noteworthy, which continued to recover relative share. The skeeziest rate of increase in fresh foods was evident in meats, vegetables and fruits. Retail prices of beef slowed their rate of increase for the second consecutive quarter, although they continued to show very significant increases until June. These increases continued to be influenced by high international prices of agricultural raw materials, particularly corn, which affected the cost of fodder. However, at the margin, there were significant falls in domestic wholesale prices of beef, which resulted in a sharp slowdown in July in the Meat and CPI derivatives group, with a great impact on the reduction of core inflation during month55 (see Figure 6.3).
Figure 6.3 | CPI Total core and excluding Meat and derivatives
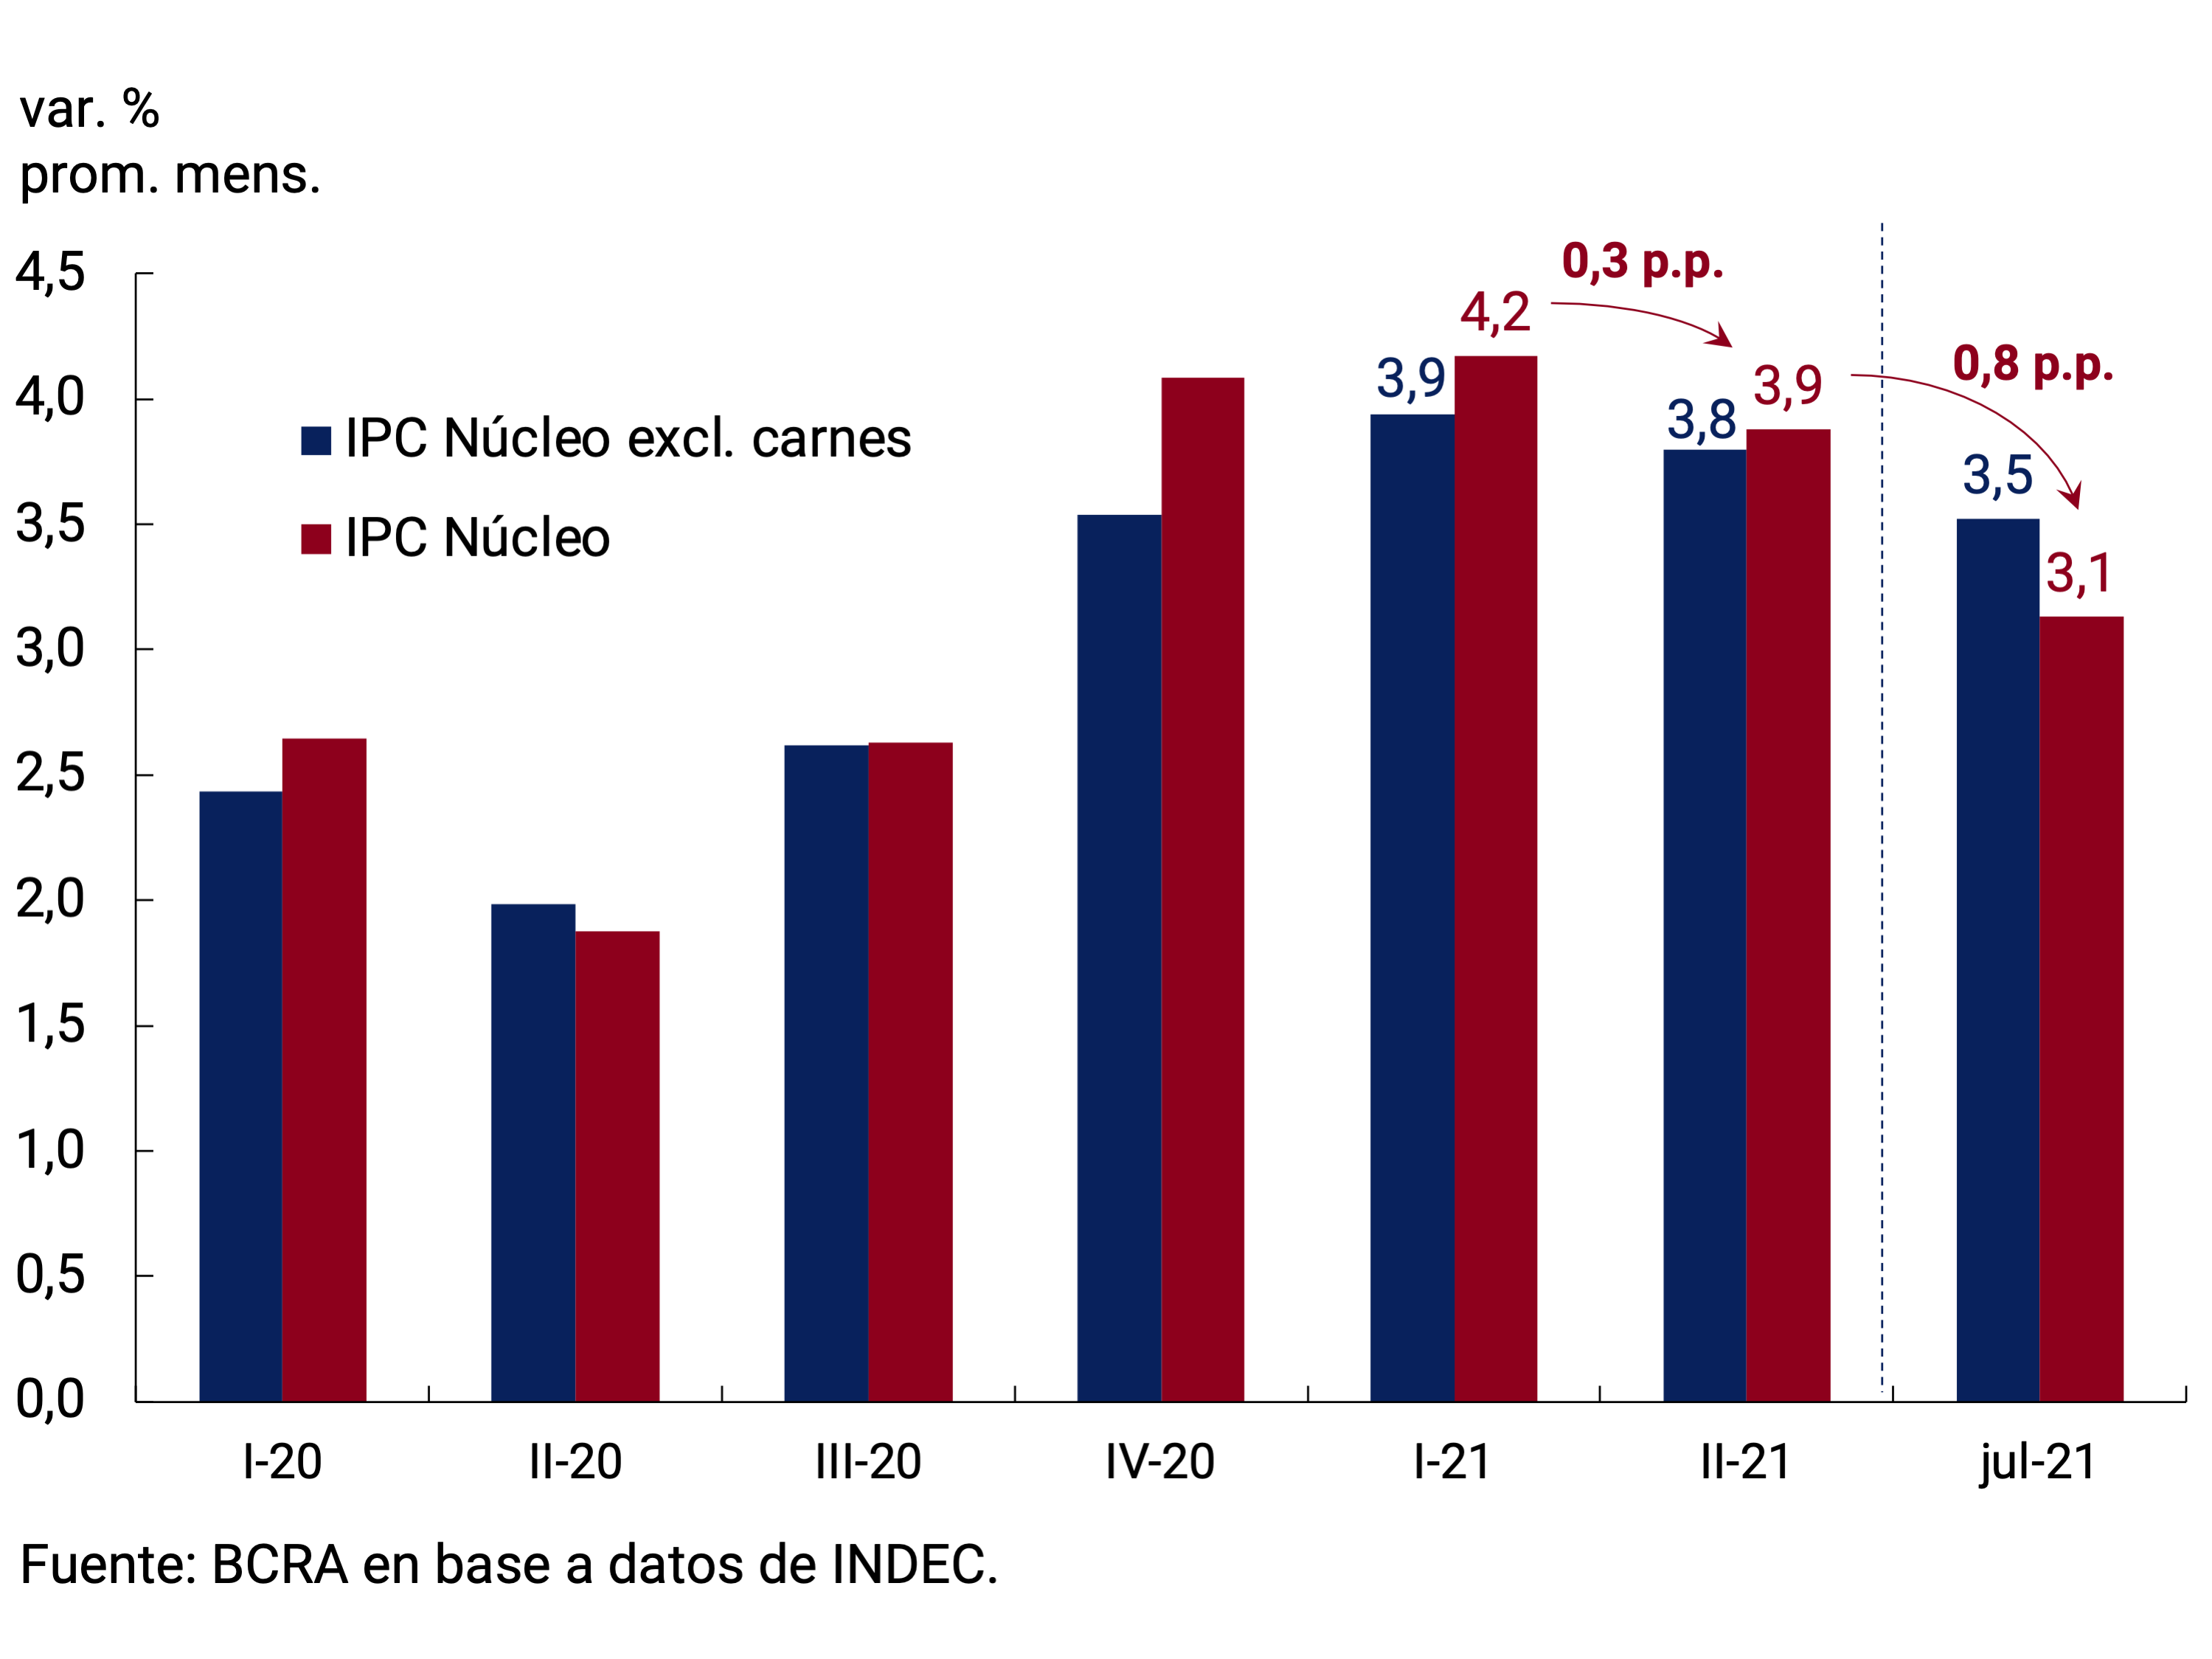
The slowdown in services in the second quarter was mainly due to the behavior of those that make up the core category, which verified a pronounced decrease in their monthly rate of increase56. After having registered significant increases during the first quarter of the year, in a context of reopenings and incipient recovery in demand, in the second quarter the slowdowns in restaurants, bars, food houses, recreational and cultural services stood out.
Seasonal tourism services such as accommodation, packages and excursions and transport also showed, as expected, less dynamism during the second quarter, once the summer season was over. In July, these services showed the usual strong increases associated with the winter holidays.
The policy of containing the rates of public services – electricity, gas, water and transport – by the National Government was another factor that helped to explain the more limited evolution of services with respect to goods. In the second quarter, some rates accelerated compared to the first, but continued to rise at a lower rate than core inflation. In particular, the updates in the residential gas tariff by network in June57 and in the electricity tariff tables for the GBA region since April58 were highlighted. In the case of public transport, during April the update of taxi, subway and premetro fares continued, adding to the drag left by the entry into force of the March updates, and additionally increases in tolls were verified both in April and July.
Regarding the rest of the regulated services, in the second quarter the acceleration in prepaid medicine stood out, which registered increases in April and May. This relative recovery, which will deepen as a result of the increases authorized for August, September and October59, occurs after a period in which the increases were lower than those of the general price level. On the other hand, the price of telephony and internet slowed down during the second quarter after the significant increase recorded in January, as did education, which remained practically constant in the second quarter after the increase in private school fees that occurred in March, as usually happens at the beginning of each school year.
6.2. The slowdown in monthly increases was more pronounced in wholesale prices
The Domestic Wholesale Price Index (IPIM) grew below retail goods in the second quarter, cutting its average monthly expansion rate to 3.7% (-1.5 p.p. compared to the first quarter). The slowdown deepened in July with an increase of 2.2% compared to June. In recent months, wholesale prices, as well as retail prices, continued to grow at a faster rate than the nominal exchange rate, a dynamic that has been verified since mid-2020 and would be partially explained by the dynamics of international commodity prices (see Figure 6.4).
Figure 6.4 | IPIM, nominal exchange rate and international commodity prices (IPMP)
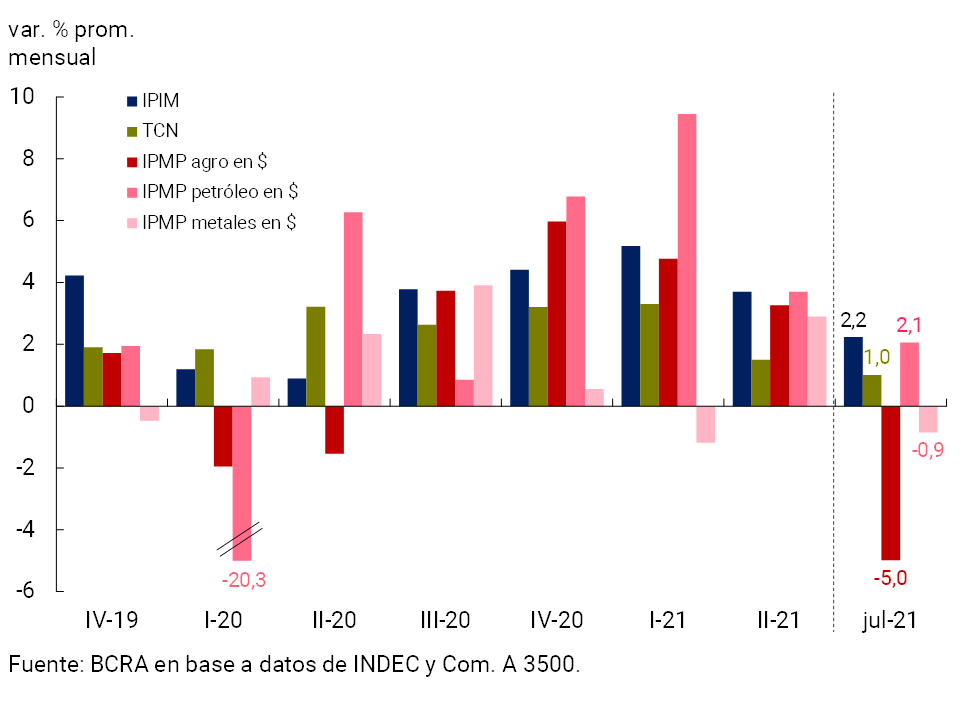
The three main grouped IPIM moderated their growth rate compared to the previous quarter: Primary Products (2% monthly average, -3.9 p.p. compared to I-21), Imported Products (2.5% monthly average, -3.1 p.p.) and Manufactured Products (4.4%, -0.5 p.p.). The evolution of Primary Products was the one with the greatest impact on the slowdown in the IPIM, reflecting both the moderation of Crude Oil and Gas (2.9% monthly average, -5.6 p.p.) and that of Agricultural Products (1.3%, -2.9 p.p.), with a generalized moderation observed within the latter grouped (see Chart 6.5).
Figure 6.5 | Evolution and contributions of the IPIM and the nominal exchange rate
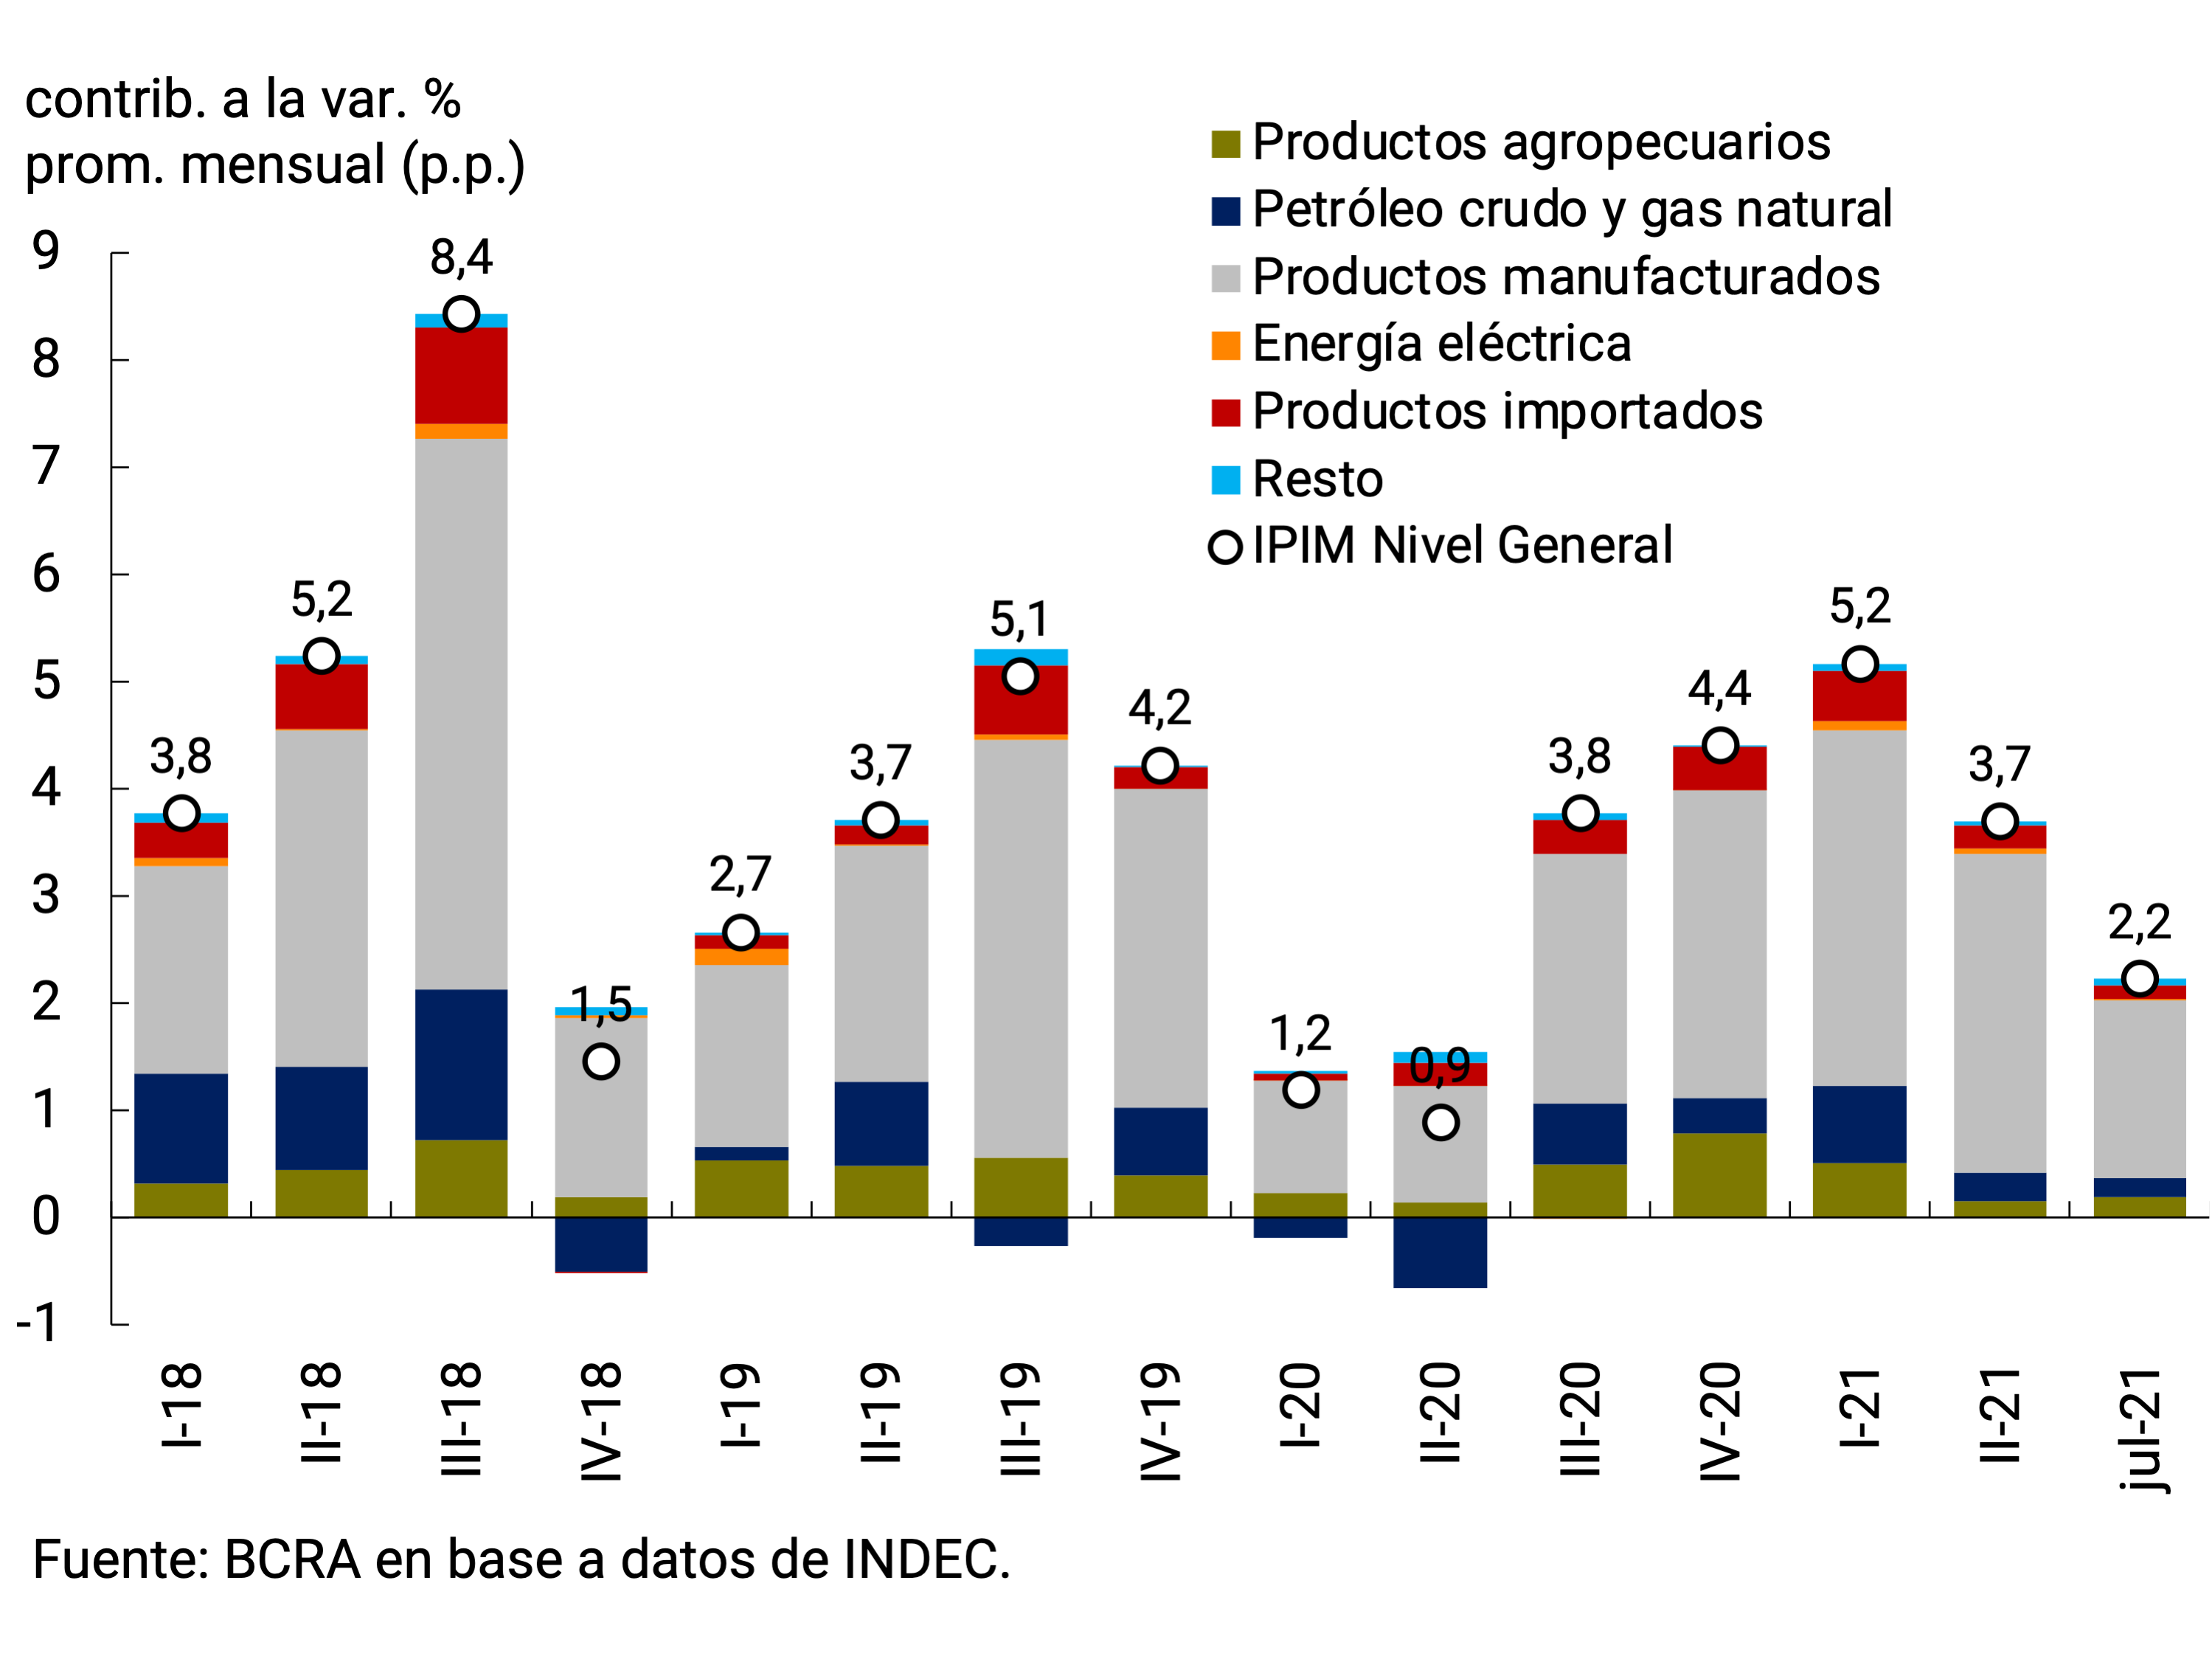
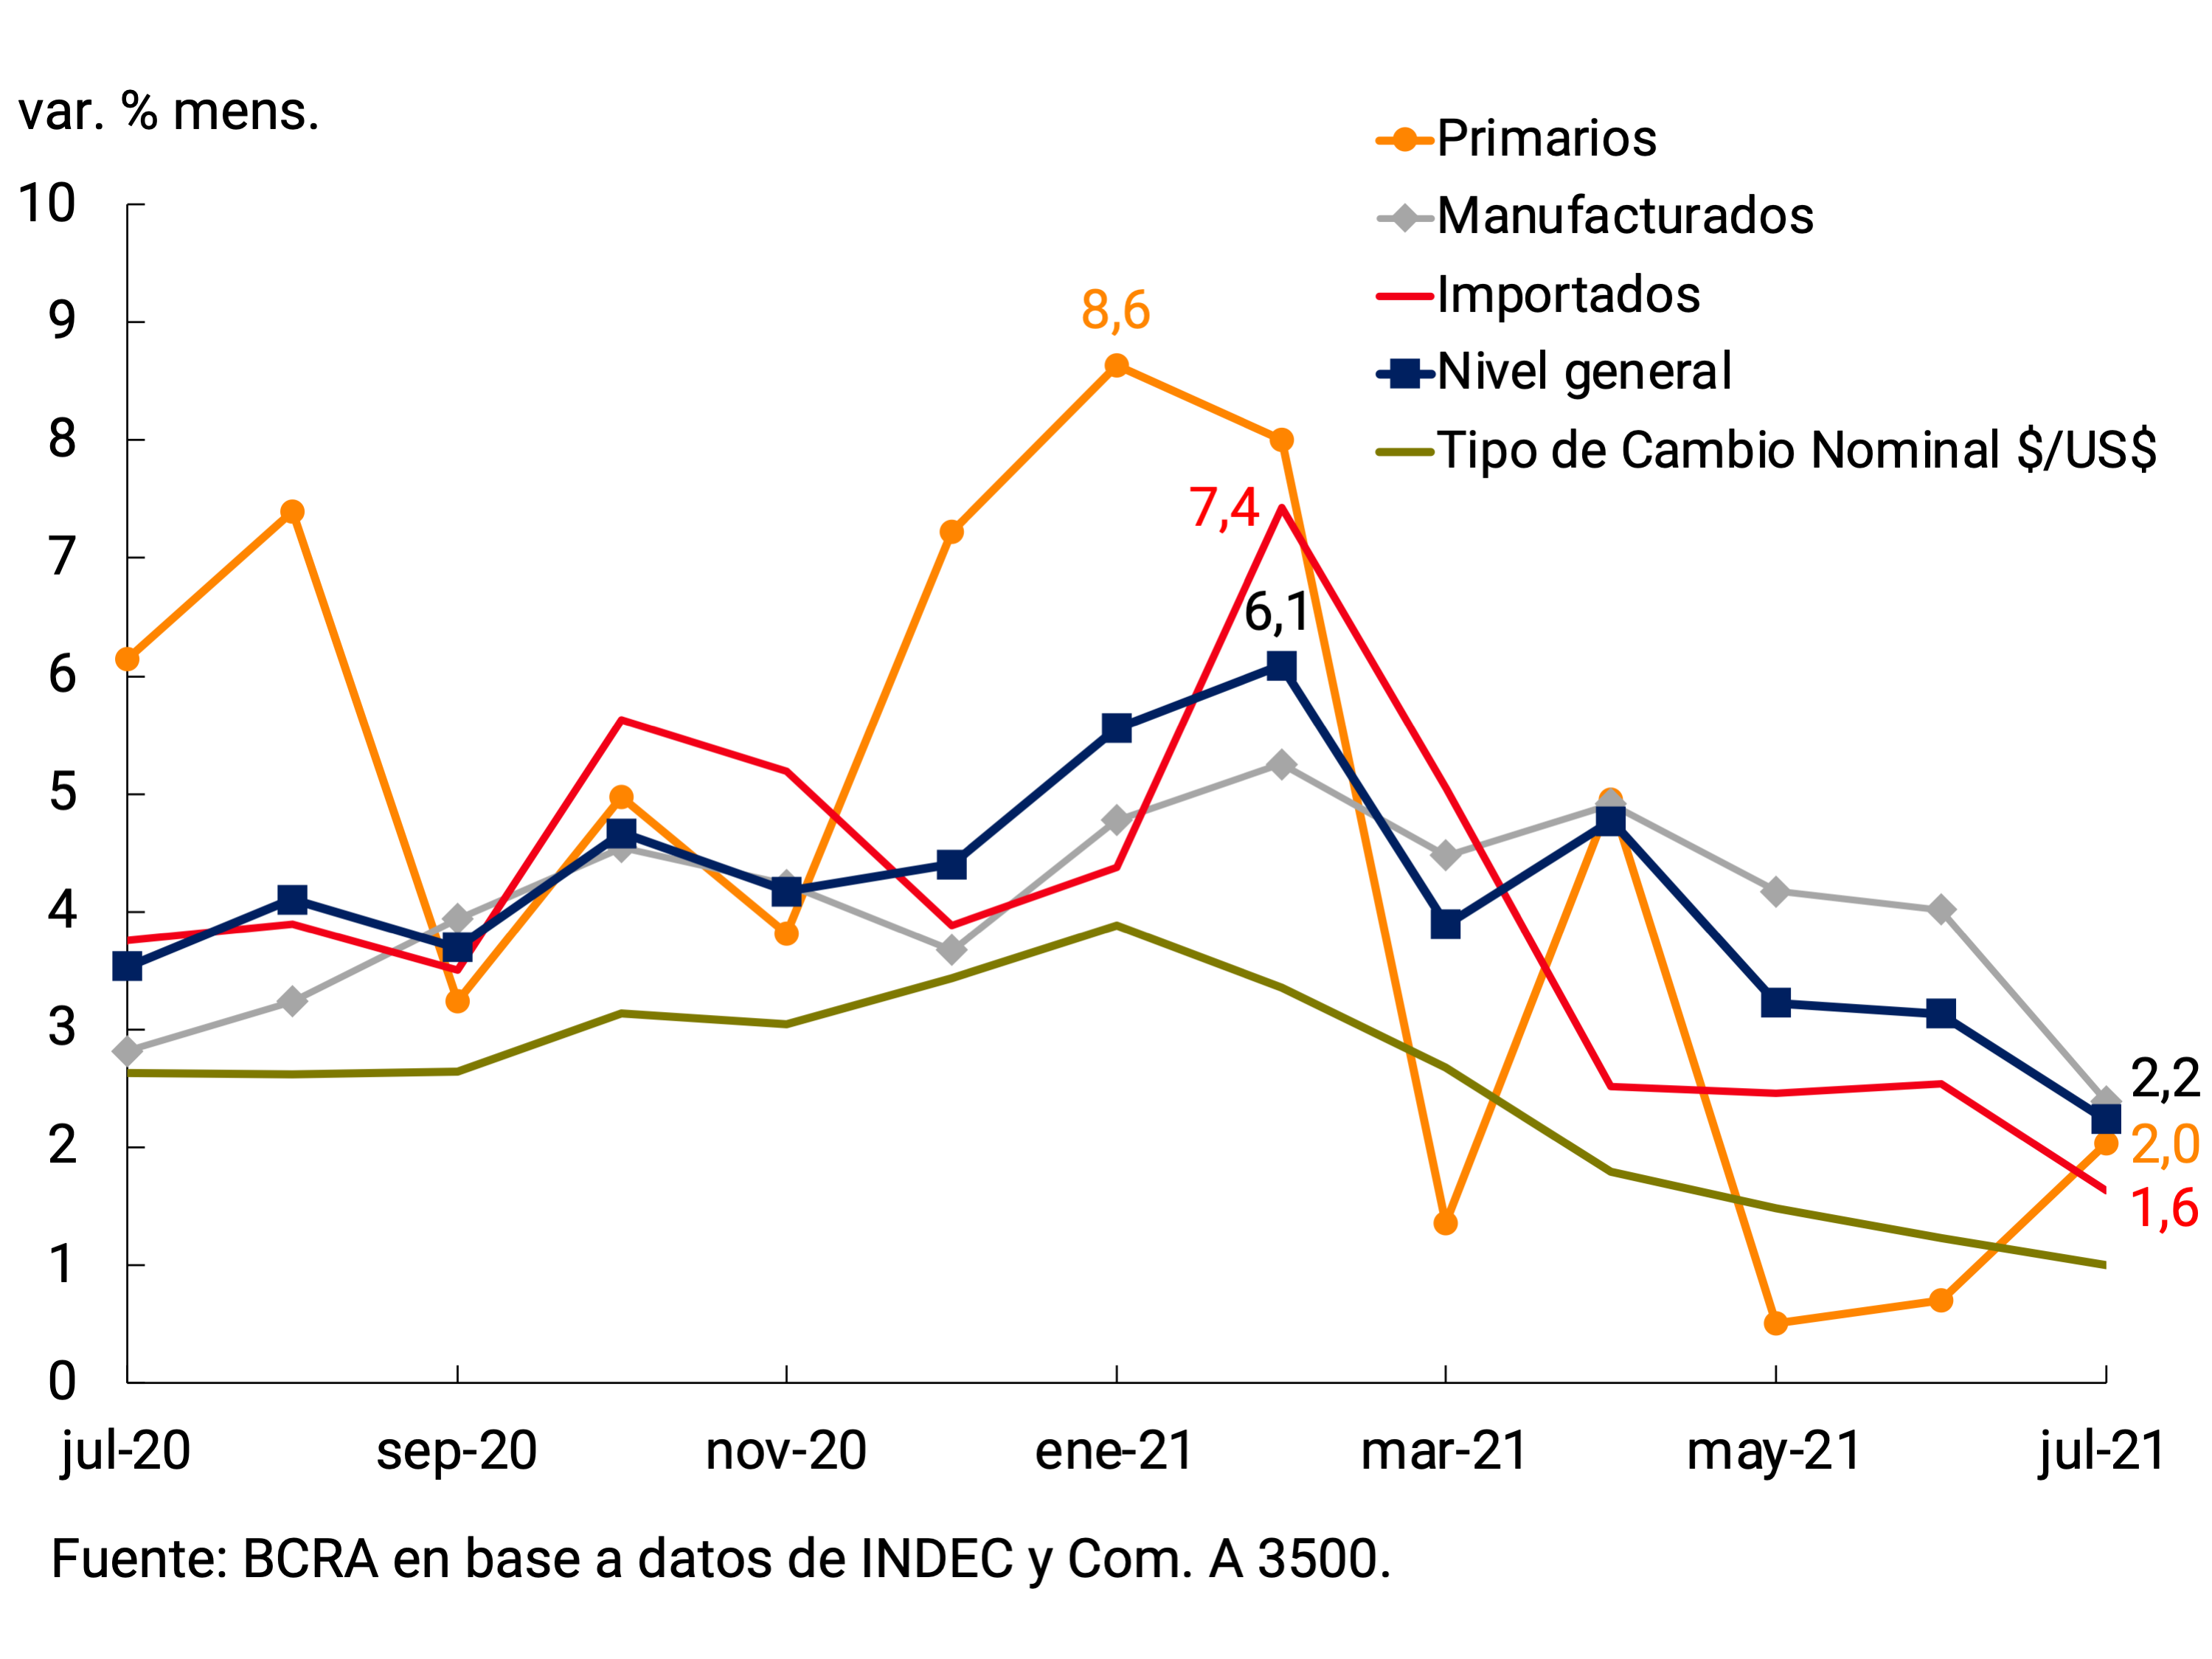
Construction costs registered a similar rate of expansion during the second quarter to that of wholesale prices, growing 3.9% monthly average, 0.4 p.p. more than in the first quarter of the year. The acceleration of the increase in costs was explained by the Labor chapter (3.8% monthly average, +1.7p.p. compared to I-21), which reflected the entry into force of the first parity tranche of the sector’s wage agreement signed in April. Materials prices slowed their pace of expansion by growing 3.9% monthly average in the second quarter (-0.9 p.p. compared to I-21) and continued to be partially affected by the increase in international metal prices (see Figure 6.6). In July, both the slowdown in the increases in Materials (2.8% compared to June) and the higher rate of increase in Labor (7.2%) continued, resulting in an acceleration of Construction costs (5.0%). It should be noted that in year-on-year terms, a marked disparity continued to be observed between the evolution of Materials and Labor costs (82.2% YoY and 54.7% YoY in July, respectively).
Figure 6.6 | Construction costs
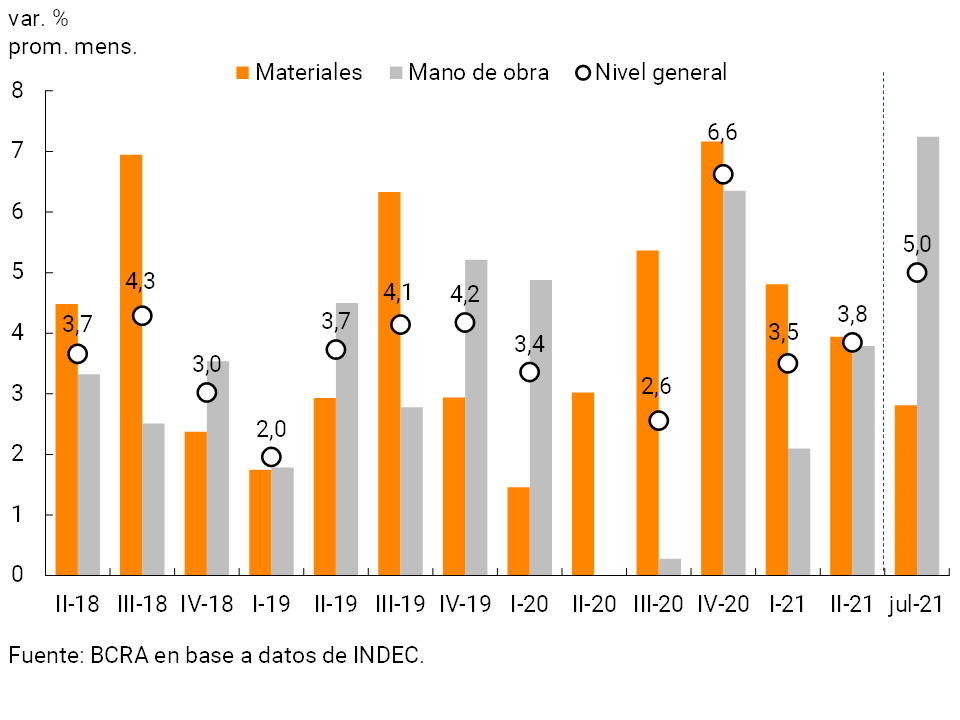
6.3. Year-on-year inflation increased with great heterogeneity at the disaggregated level
The year-on-year inflation rate continued to increase despite the monthly deceleration in prices (48.5% in II-21 and 51.8% in July). This divergence is explained by the low base of comparison of the same period in 2020 when, in the context of the greatest impact of the pandemic on the economy, monthly records were on average less than 1.9%. In the second quarter of 2021, the differences between the year-on-year variations of the main CPI aggregates were reduced, based on the slowdown in the Seasonal category and the higher rate of increase in the Regulated category. The year-on-year change of wholesalers, mostly goods, also increased (II-21 64.1% and 63% in July) and continued to outpace retail inflation (see Figure 6.7).
Figure 6.7 | Retail (CPI) and wholesale (IPIM) prices, year-on-year changes
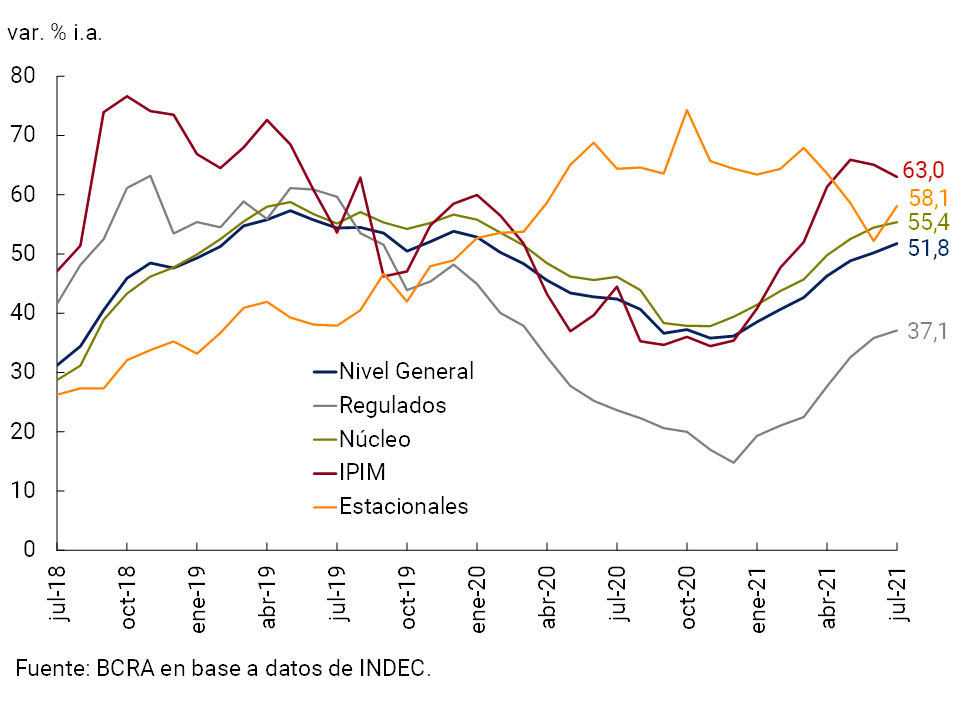
Using information from the CPI of the City of Buenos Aires with a higher level of openness, it can be seen that the great heterogeneity between the year-on-year rates of change of different groups of goods and services, which has been observed since the beginning of the pandemic, has narrowed slightly in recent months (see Figure 6.8).
Fresh food has been one of the groups whose prices maintained the highest year-on-year rates of change since the beginning of the pandemic, driven by fruit and vegetables and since the last quarter of 2020 also by meat. A second set of goods60, which includes those that are not regulated or incorporated into reference price programs, also continued to grow the most in year-on-year terms, highlighting the evolution of automobiles. In this case, the high year-on-year rates of change were explained by various factors, mainly higher domestic demand, local and global supply restrictions (due to a shortage of semiconductors), increased international production costs due to the rise in metal prices and the update of the taxable base of internal taxes on the marketing of new vehicles. In recent months, the year-on-year variation of both groups of goods has stabilized, remaining at around 60%.
Figure 6.8 | Heterogeneous dynamics within the CPI BA
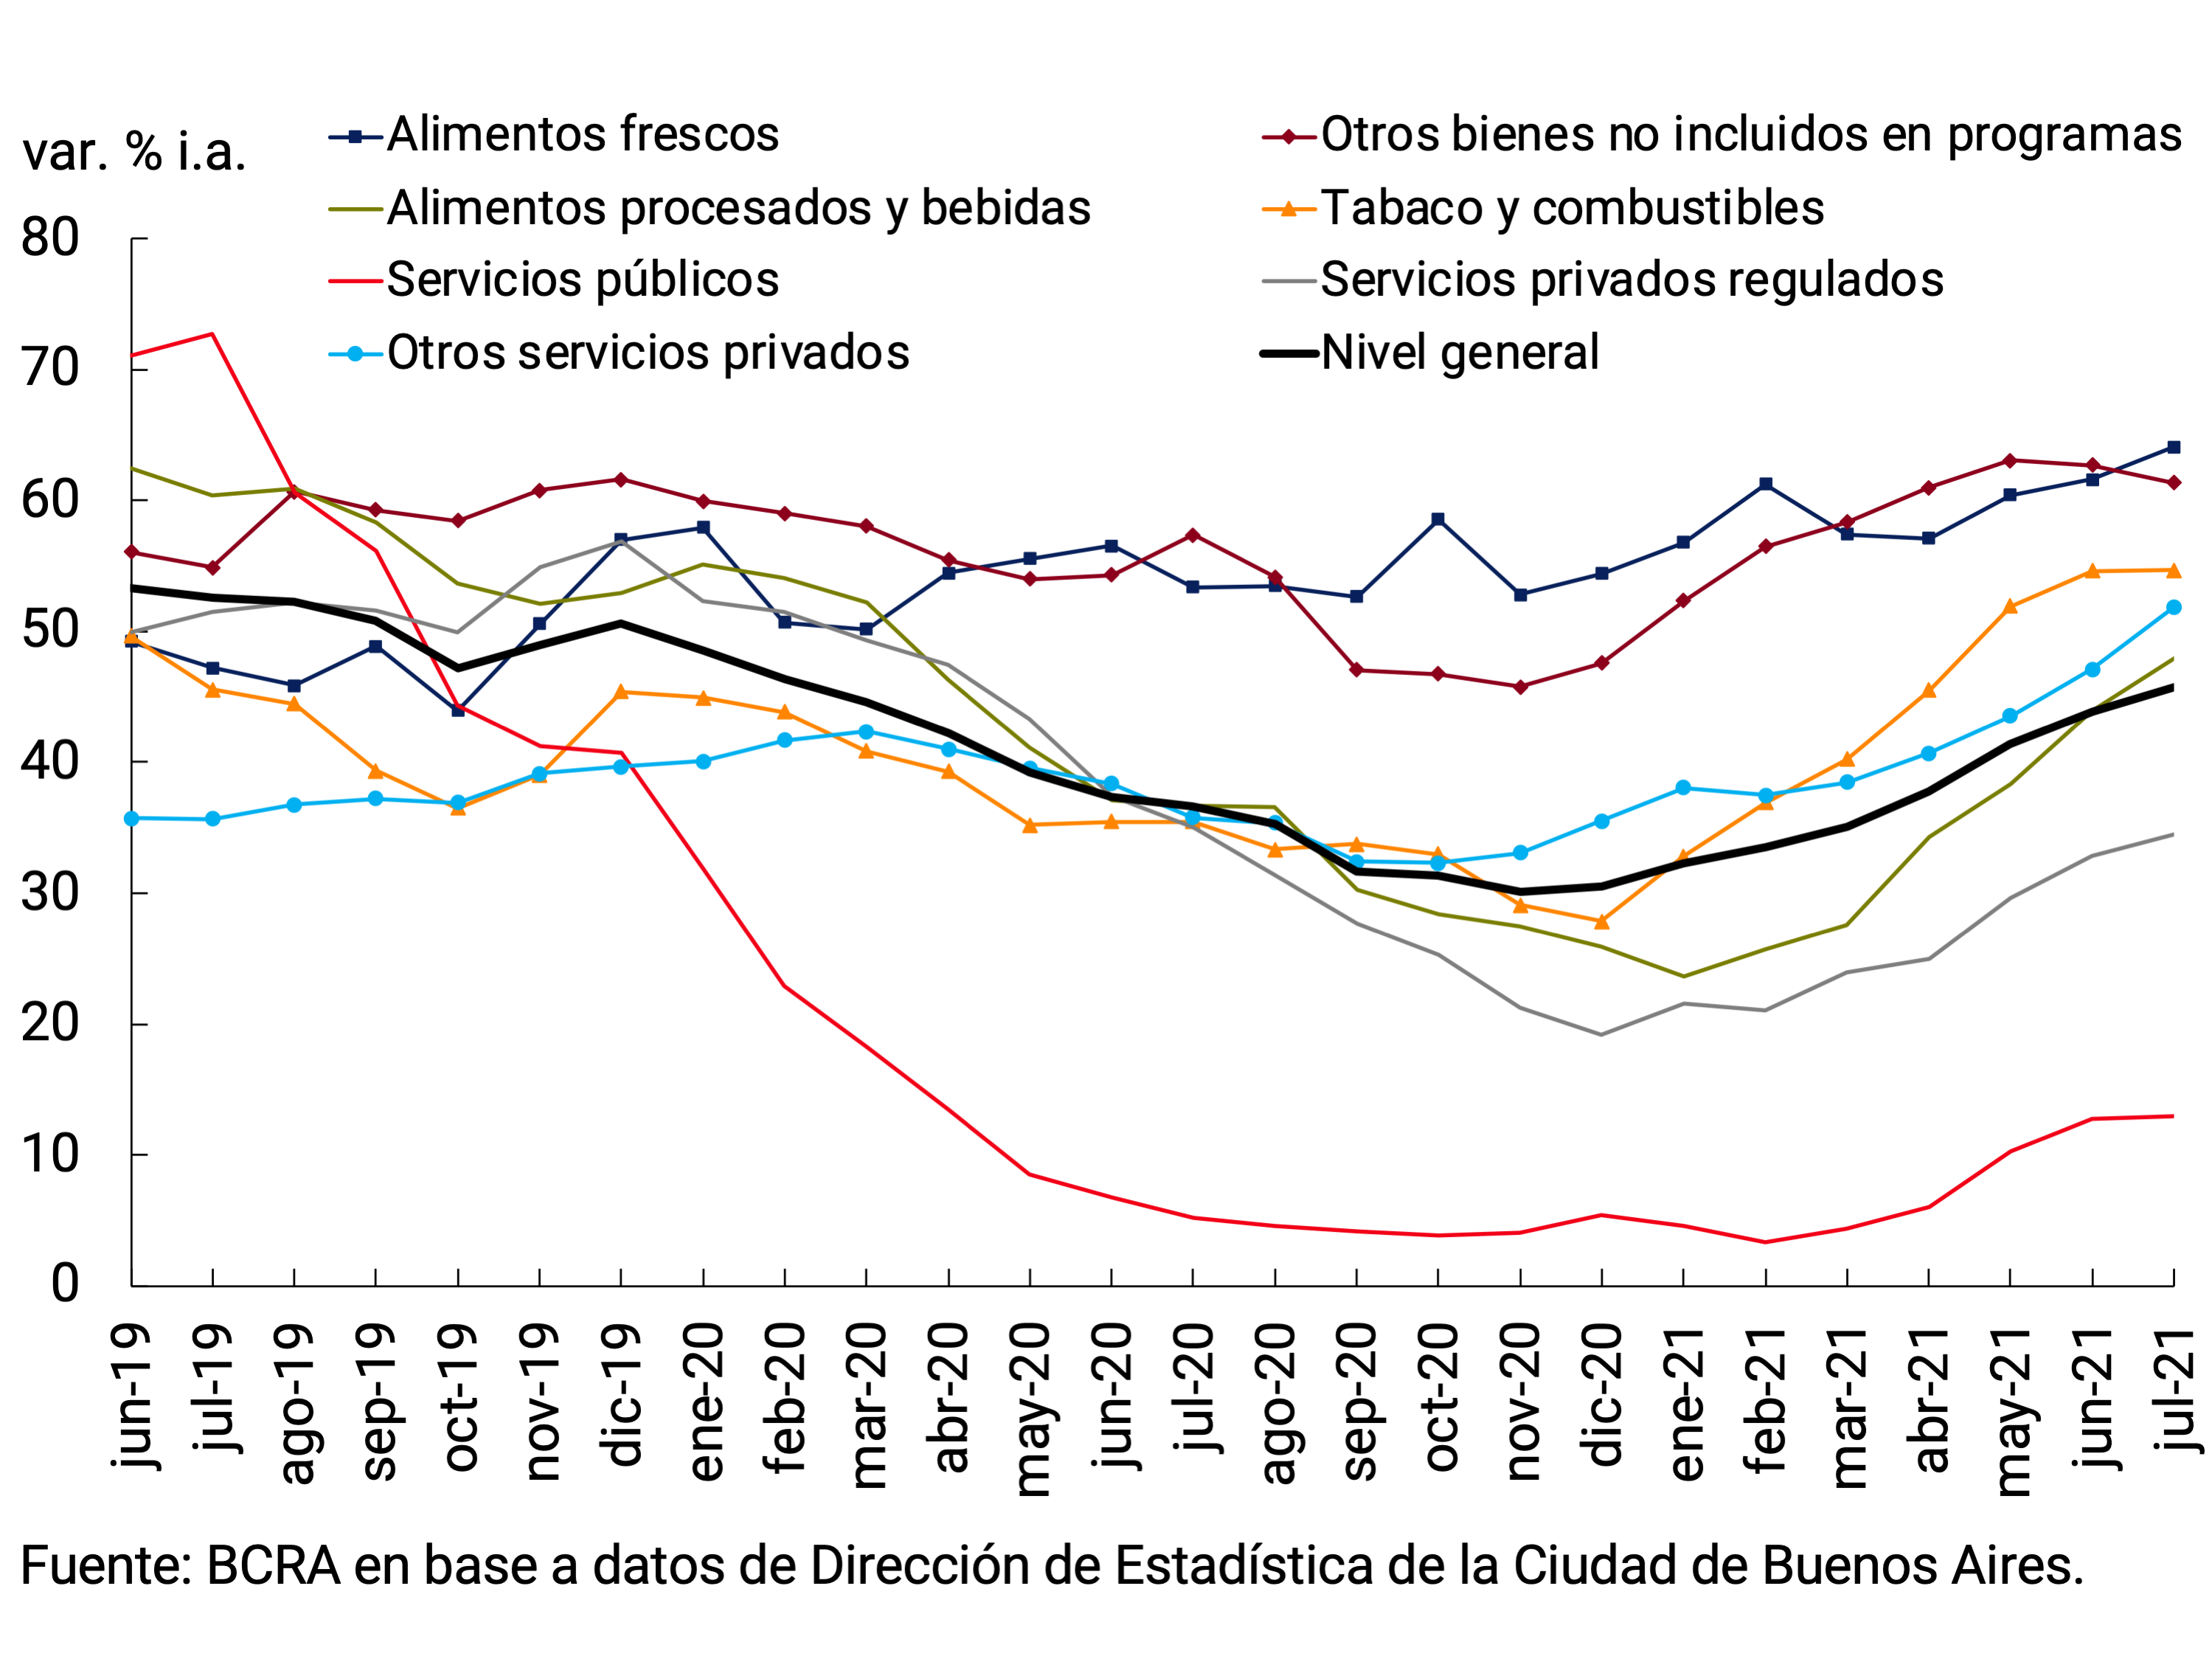
A third group of goods is made up of regulated goods – fuels and tobacco – whose year-on-year variation was similar to that of the General Level at the beginning of 2021, although in recent months it was higher, standing at around 52%. This relative increase is mainly explained by the increase in gasoline, highlighting the authorized increase of 15% to the oil company YPF between March and May, in a context of international oil prices (expressed in pesos) much higher than those of the same period in 2020 (see Figure 6.4).
Services grew below the general level, although in more disaggregated terms different trends were observed. Public services were the ones that had the most limited rate of expansion, containing the increase in the general price level. Regulated private services61 rose above public services, although well below the general level. Finally, those private services62 that are not regulated had a slightly higher rate of increase than the general level. This set of services includes those that were most affected by mobility restrictions during the previous year and gained momentum with the reopening of activities since the end of 2020.
6.3. Perspectives
For the remainder of the year, the gradual decline in monthly inflation rates is expected to continue from a reduction in the pace of increase in regulated services and goods, while increases in the relative prices of private services are expected, as happened in July. As a result of the low bases of comparison, the monthly deceleration of the general price level would be reflected in a stabilization of the year-on-year inflation rate since July, while it would fall only in the last months of the year.
In a context of improved terms of trade, increased export settlement and accumulation of international reserves, the BCRA decided to limit the rise in the nominal exchange rate since February, inducing a gradual slowdown in the rate of growth in the prices of goods. This policy is expected to continue contributing to the process of gradual moderation in the increase in the prices of goods in the remainder of the year, especially in those that accumulated strong increases since mid-2020.
Regarding public service rates, after the updates authorized during the first half of the year, the National Government would deepen its containment policy in the coming months, being a second explanatory factor for the reduction in monthly inflation expected for the rest of the year. For their part, the updates of the wage parity and the gradual recovery of demand, as the vaccination process progresses, would generate a recomposition of the relative prices of private services.
The future evolution of international prices is a factor that could have an adverse impact in the event that they resume the growth rate they have recorded since mid-2020 or, on the contrary, if this trend is reversed, it would contribute to the disinflation process.
In this context, the BCRA will continue to manage its monetary and exchange rate policy in a prudent manner to reduce risks and contribute to consolidating the process of gradual reduction of inflation (see Chapter 7. Monetary Policy).
7. Monetary Policy
The arrival of the second wave of COVID-19 in mid-March led the National Government, in coordination with provincial authorities, to adopt sanitary measures to contain infections. However, the economic impact of this outbreak was considerably less than in 2020, given advances in the vaccination process and a better prepared health infrastructure. Unlike what happened in the first wave, this time the sanitary measures were specific to each region of the country depending on its epidemiological situation.
In this context, the Central Bank and the National Government maintained the focus of assistance measures on the vulnerable sectors and population of the most affected areas. Thus, while the economic recovery progressed, there was a lower growth in assistance programs for the private sector. With a more limited fiscal deficit and financed in a greater proportion by the market, the primary monetary expansion linked to the public sector was at levels similar to those of previous years, excluding 2020. In fact, the main factor in the expansion of the monetary base during the first half of the year was the purchase of foreign currency by the BCRA in the foreign exchange market, framed within the structural objective of accumulating International Reserves. The greater external slack simultaneously made it possible to adjust the pace of adjustment of the exchange rate with the aim of contributing to the slowdown in domestic prices.
Towards the end of the second quarter of the year, the means of payment expanded again in real terms. This dynamic was influenced by transfers from the public sector to vulnerable sectors and the dismantling of investment positions in pesos of legal entities to meet the payment of salaries and tax obligations. This increased need for liquidity by companies also resulted in a growth in commercial lending.
The lower fiscal deficit and the progress made in the reconstruction of the domestic debt market will allow the year to end with a lower level of financial assistance to the National Treasury than the previous year. However, the BCRA will continue to calibrate the liquidity of the economy and sterilize any monetary surpluses that may be observed in the short term. With a medium-term vision, the BCRA will carry out a monetary policy that, in addition to preserving monetary and financial stability, will lay the foundations for a path of economic development with social equity.
7.1. The evolution of the pandemic continued to define the approach to monetary policy
The arrival of the second wave of COVID-19, in mid-March, led the National Government, in coordination with the provincial authorities, to adopt measures to contain infections. Specifically, new restrictions on mobility were implemented, although of less intensity than those implemented a year ago. These new provisions, which were in force mainly during the second quarter, were specific to each jurisdiction and calibrated taking into account the progress of vaccination and the strengthening achieved in the health system.
To contain the economic and social effects of this second wave, the Central Bank and the National Government focused their stimulus measures on the most vulnerable social strata and on assistance to companies, in both cases in the affected jurisdictions. These programs were considerably smaller than those proposed at the beginning of the pandemic, given the lower impact of mobility restrictions on activity and employment. The results of these policies were reflected in the evolution during the second quarter of the monetary aggregates, credit and the foreign exchange market. In the following sections, an analysis of the evolution of these variables is carried out.
7.1.1. The monetary expansion in the second quarter was mainly associated with the BCRA’s purchases of foreign currency from the private sector
The second wave of COVID found the economy going through a process of recovery in activity and employment levels, with an improvement in private sector revenues and, therefore, with greater dynamism in public accounts (see Chapter on Public Finances). On this occasion, the targeting of assistance measures required a smaller expansion in spending than in 2020.
The efforts deployed by the National Government to rebuild the peso debt market made it possible to channel a significant proportion of the financing needs through it and reduce the financial assistance of the Central Bank to the National Treasury. In this sense, the National Treasury achieved positive net financing of $356,000 million in the first half of the year, of which $266,000 million correspond to the second quarter. Thus, primary issuance by the public sector was practically zero in the second quarter and so far this year stood at 0.6% of GDP, markedly below the record of the first year of the pandemic and similar to the levels of 2018 and 2019 (see Figure 7.1).
Between April and July, as in the first three months of the year, the main factor in the expansion of the monetary base was foreign exchange purchases from the private sector. These operations are part of the BCRA’s structural objective of accumulating international reserves. In the first part of the quarter, the expansion of liquidity for the aforementioned reasons was offset by the BCRA’s sterilization instruments. In June, the dynamics of these instruments were partially reversed, due to the possibility for financial institutions to integrate the fraction of reserve requirements that until May were remunerated with LELIQ using Treasury bonds inpesos 63.
This change in the regulations brought about a change in the composition of bank liquidity. Integration with these public securities came to represent 2.1% of deposits in July, to the detriment of integration with LELIQ, which fell from 10.4% in May to 8.1% in July. In other words, approximately 20% of the requirement previously integrated into LELIQ was integrated into National Treasury Bonds. It is worth mentioning that, among the eligible securities, the entities subscribed to 78% of CER adjustable bills and the remaining 22% corresponded to discount bills.
All in all, the growth of the Monetary Base between April and July was 12.9% ($325,900 million). However, in year-on-year terms and at constant prices, the Monetary Base continued to contract, this time at a rate of around 20% in July. In terms of GDP, it stood at 6.6% in the seventh month of the year, 3.4 p.p. below the maximum record of 2020 and 1.8 p.p. below the average value verified between 2010 and 2019.
Figure 7.1 |
Factors of expansion of the monetary base
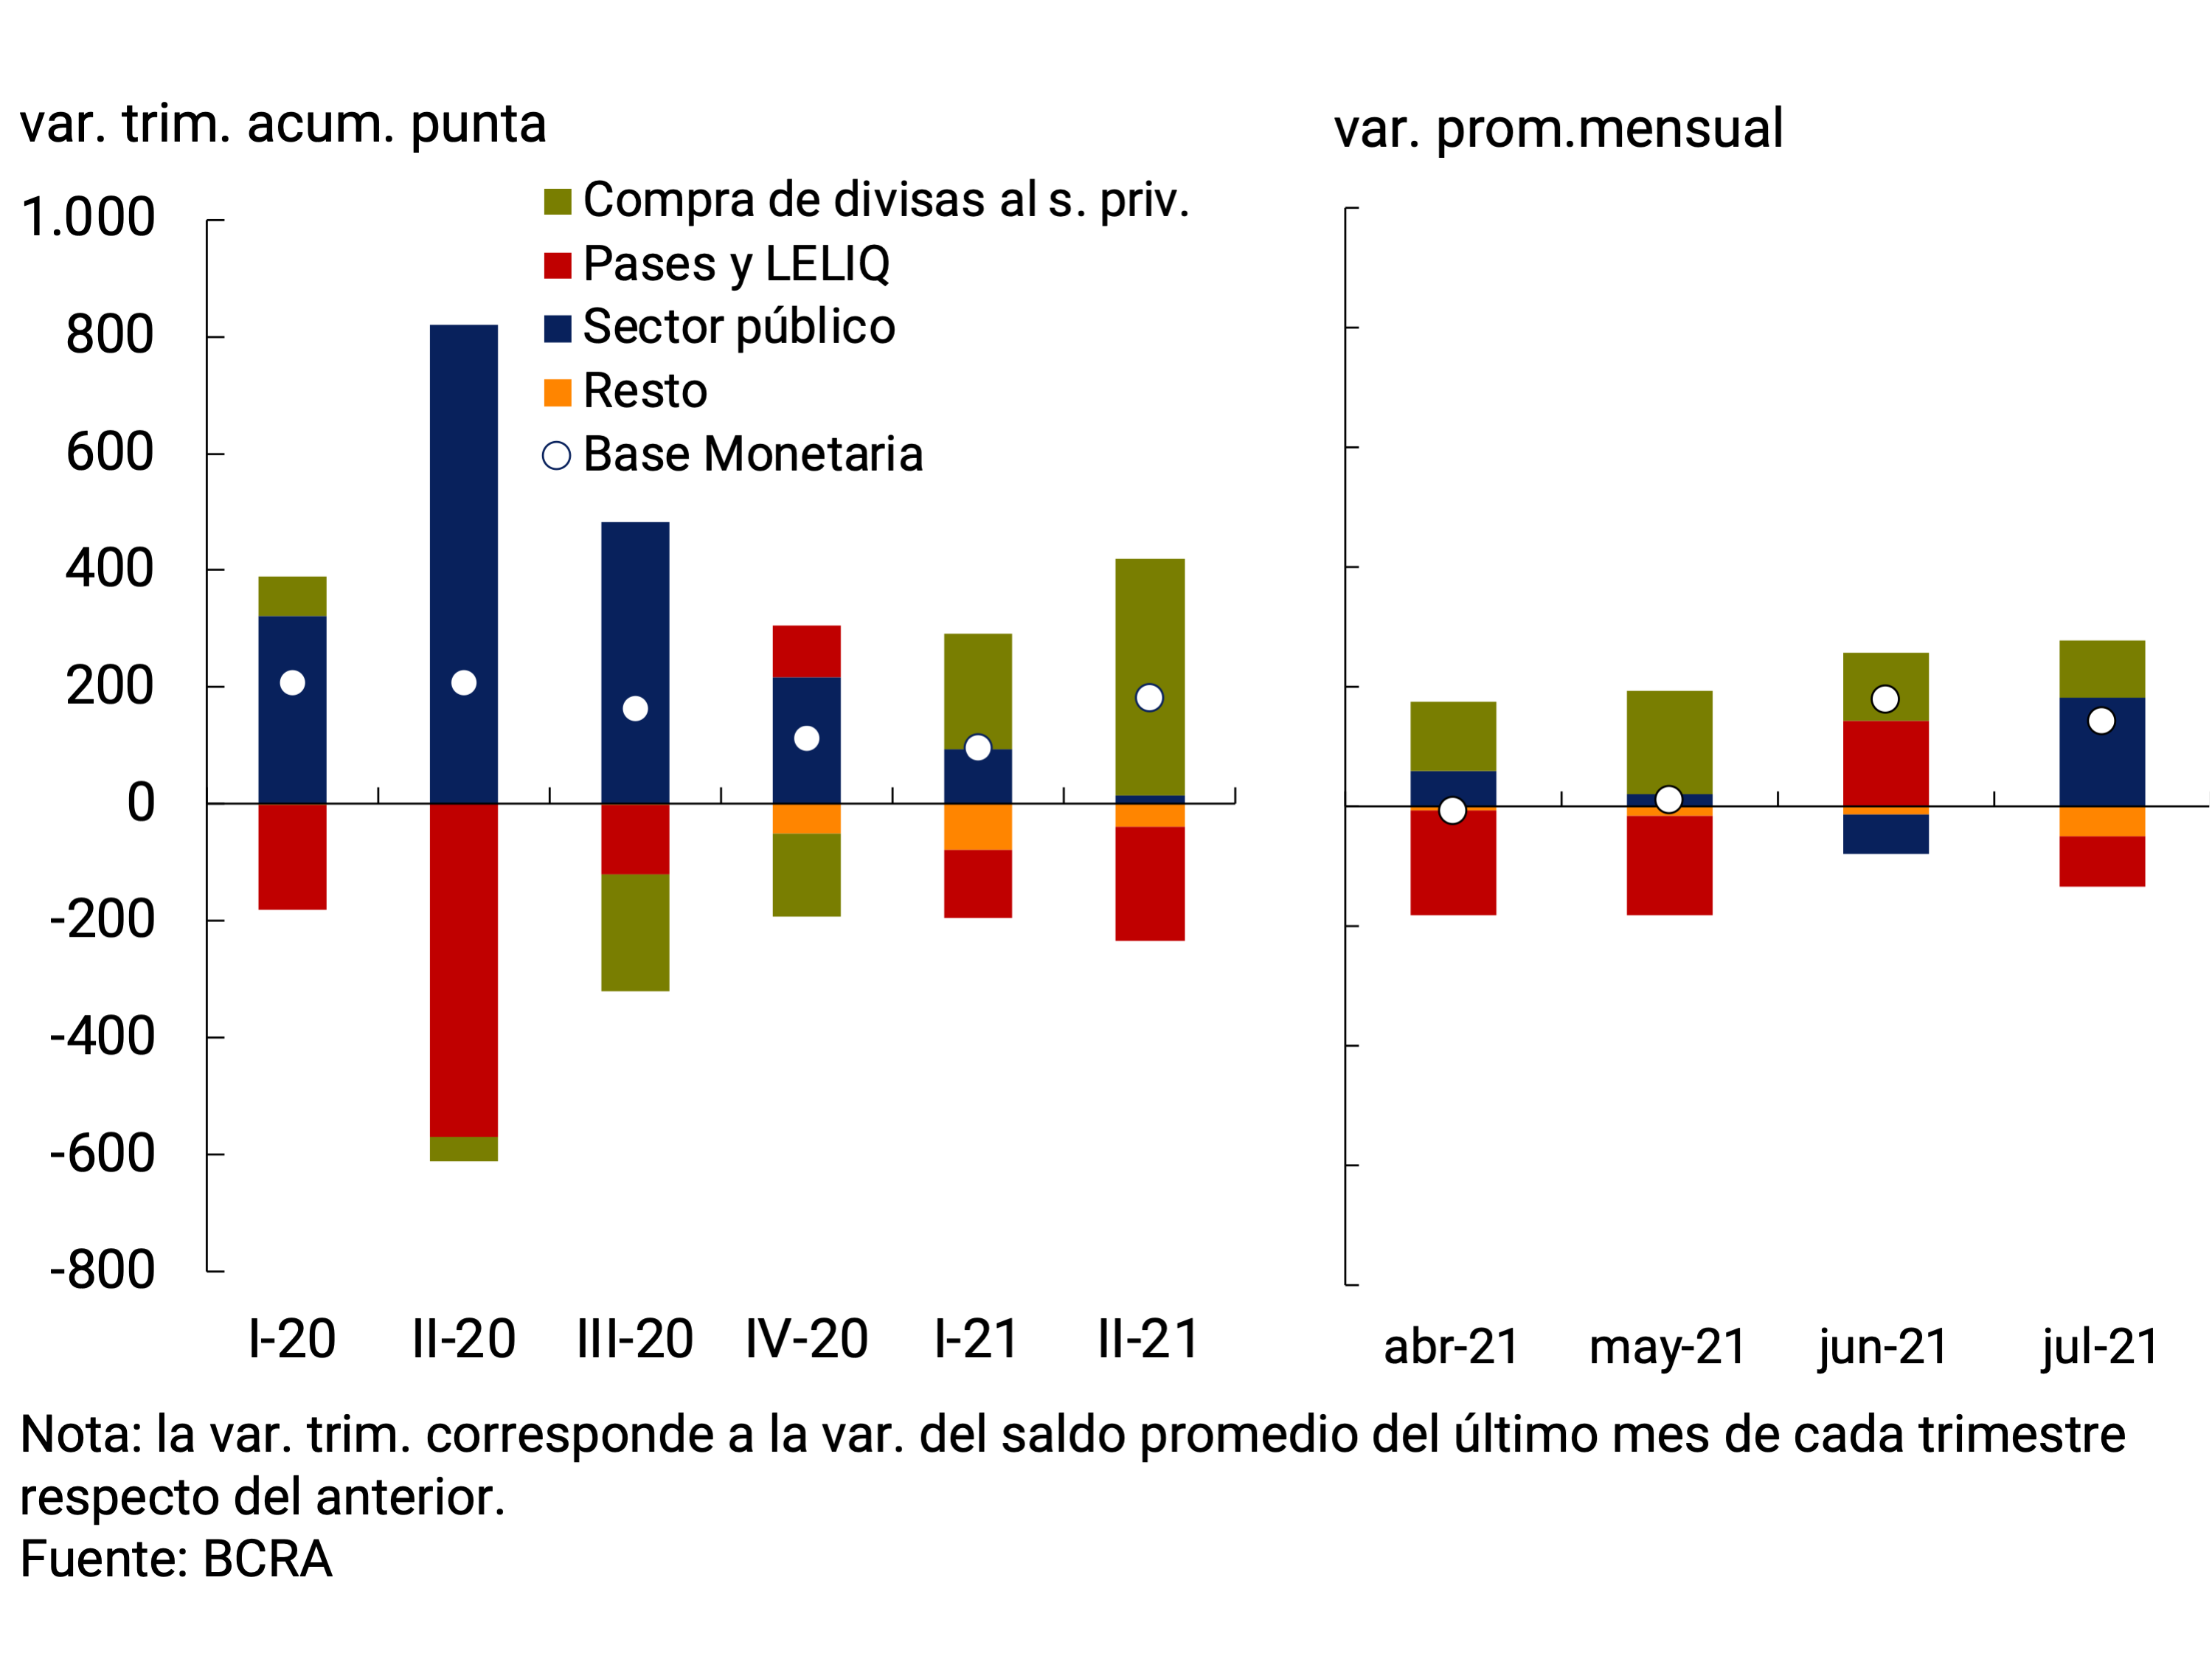
Primary issuance of the public sector*
Acum. July of each year
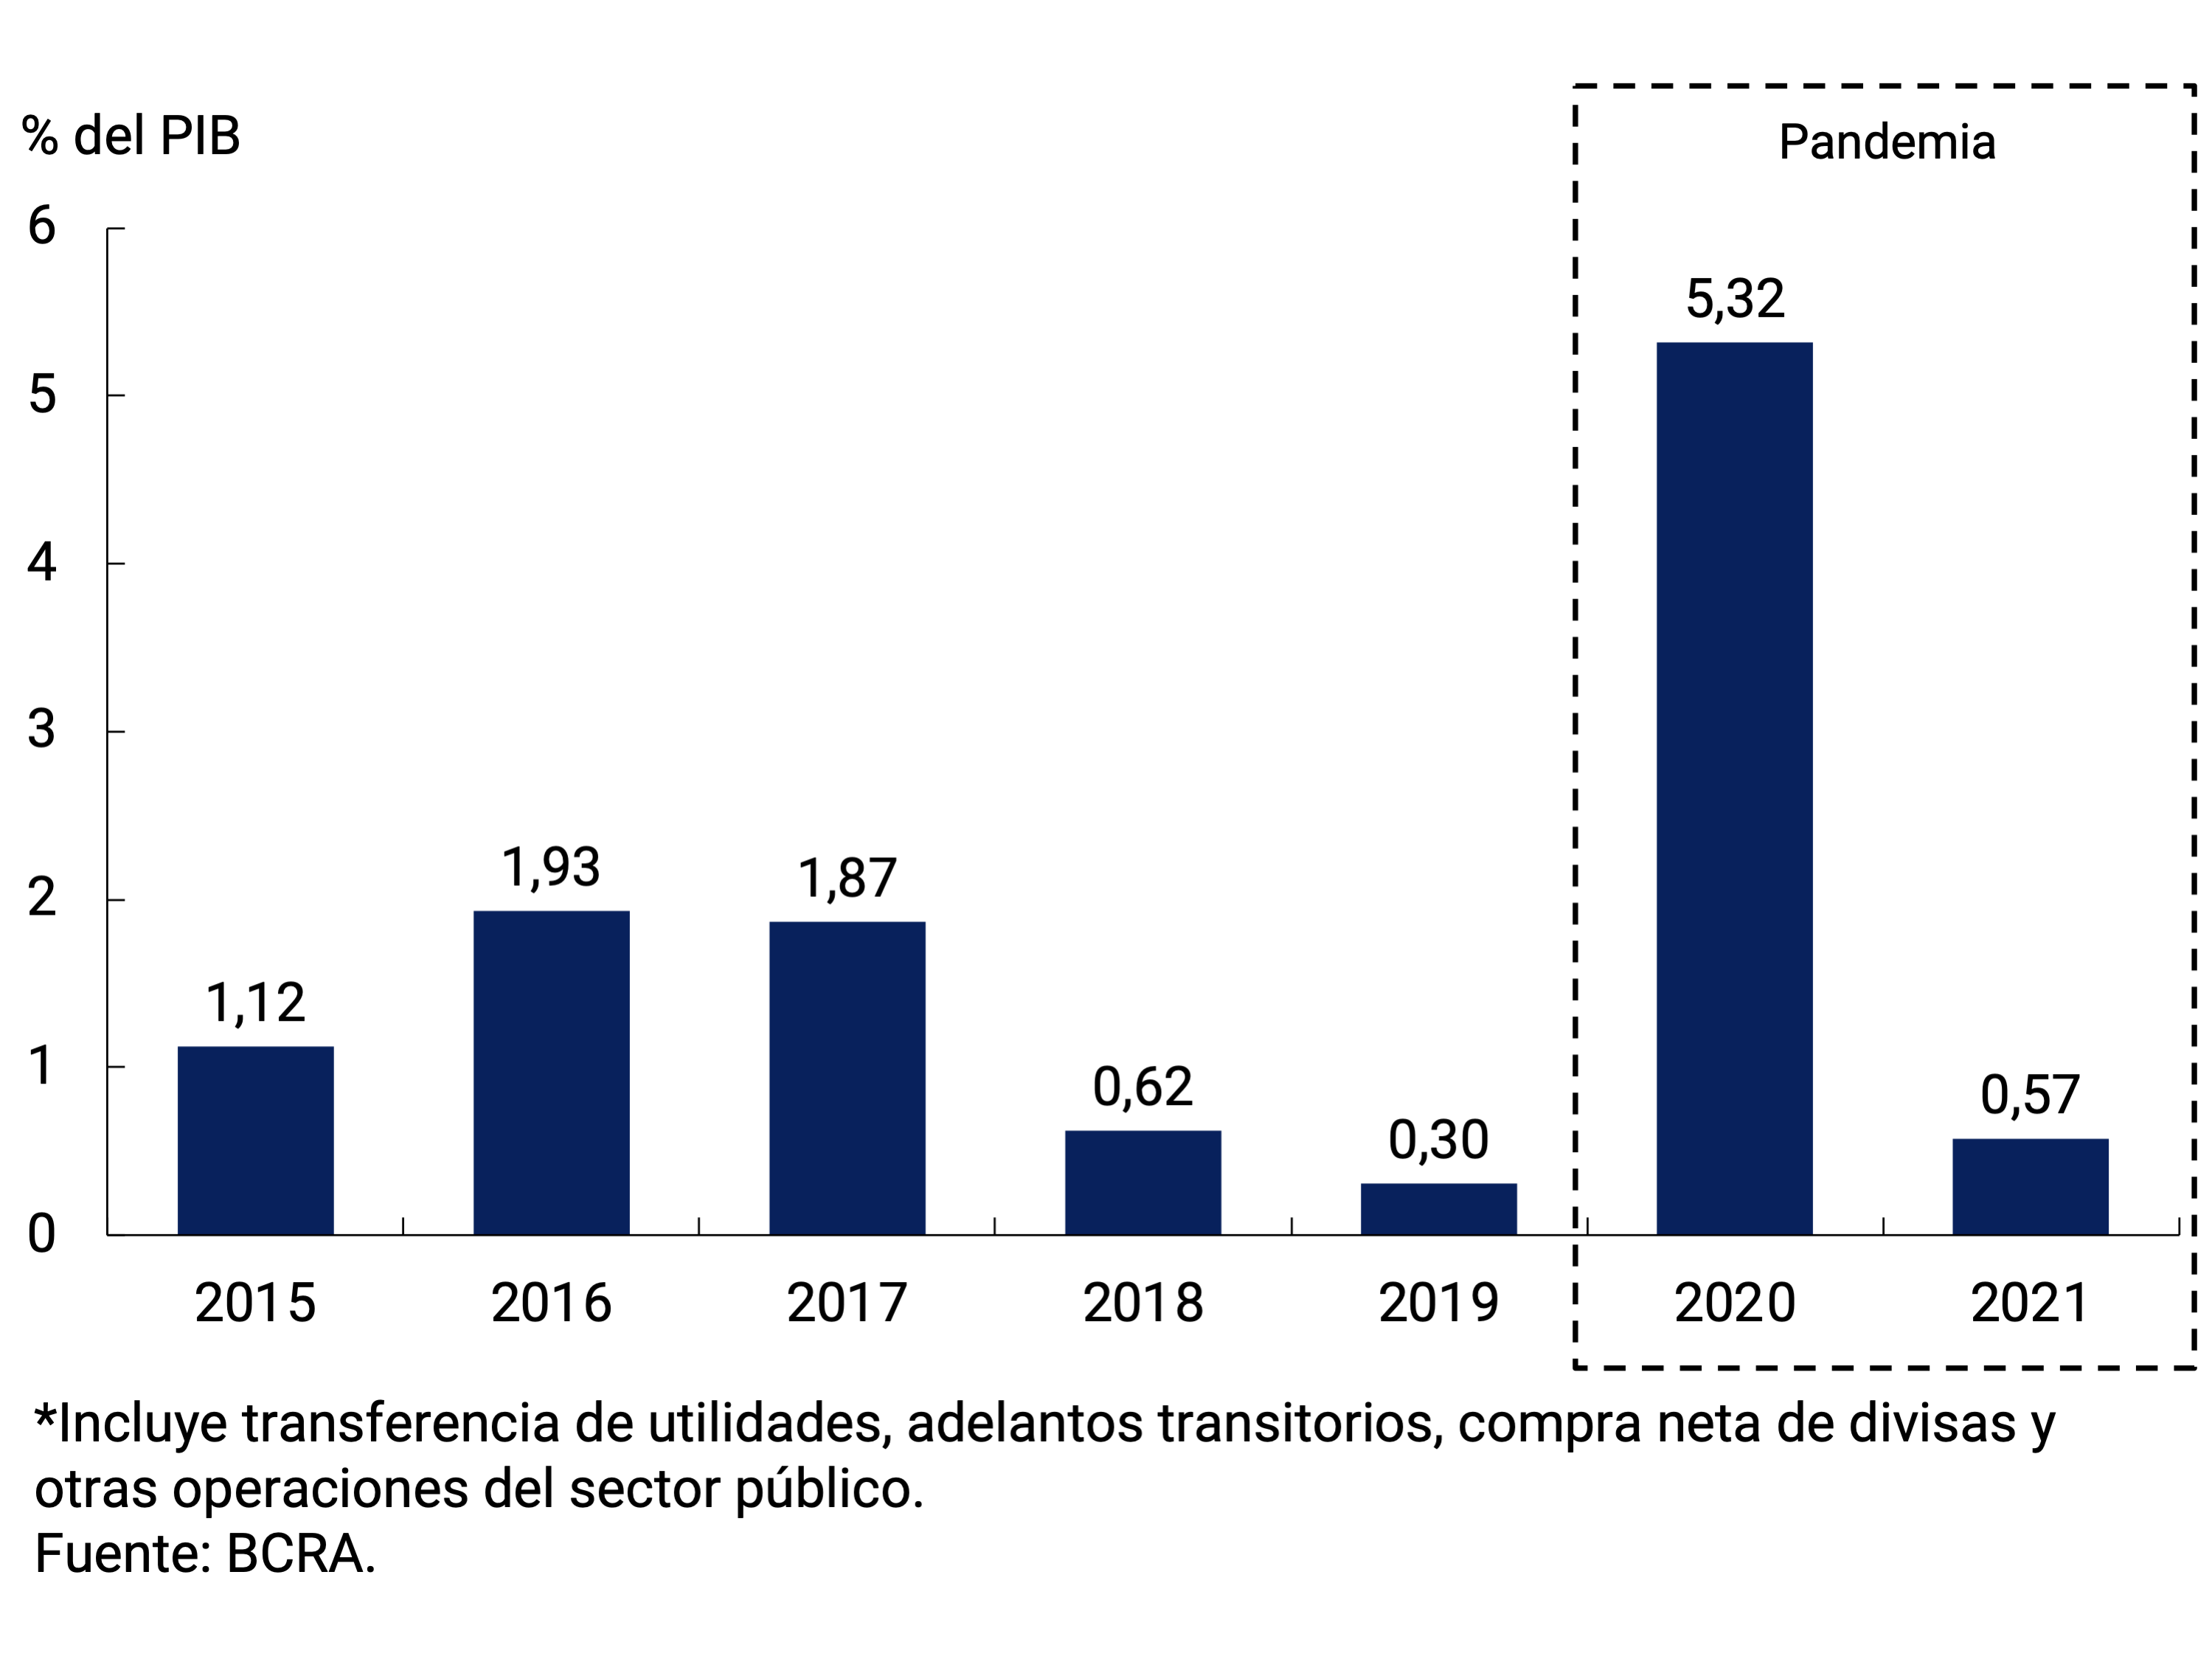
In this context, payment methods registered a fall in real terms in the second quarter of the year. However, the evolution was not homogeneous throughout the period. Towards the middle of the quarter, payment methods broke with the downward trend that began at the end of 2020 and once again registered positive monthly growth rates in real and seasonally adjusted terms. This dynamic was influenced by the recomposition of real wages, as a result of the parity negotiations that took place in the period and the fiscal stimulus measures to sustain the incomes of the most vulnerable sectors of the population during the second wave of the pandemic. Among these last measures, the $15,000 bonus for low-income agents in the jurisdictions affected by the health measures and the advance payment of the AUH supplement, which is usually integrated in December, were highlighted. Thus, the transactional private M264, at constant prices, presented an average monthly expansion rate of 1.1% s.e. between May and July. Within the same period, private sector transactional demand deposits and public working capital deposits registered an average monthly growth at constant prices of 1.2% s.e. and 0.9% s.e., respectively (see Figure 7.2).
Figure 7.2 |
Evolution of payment methods
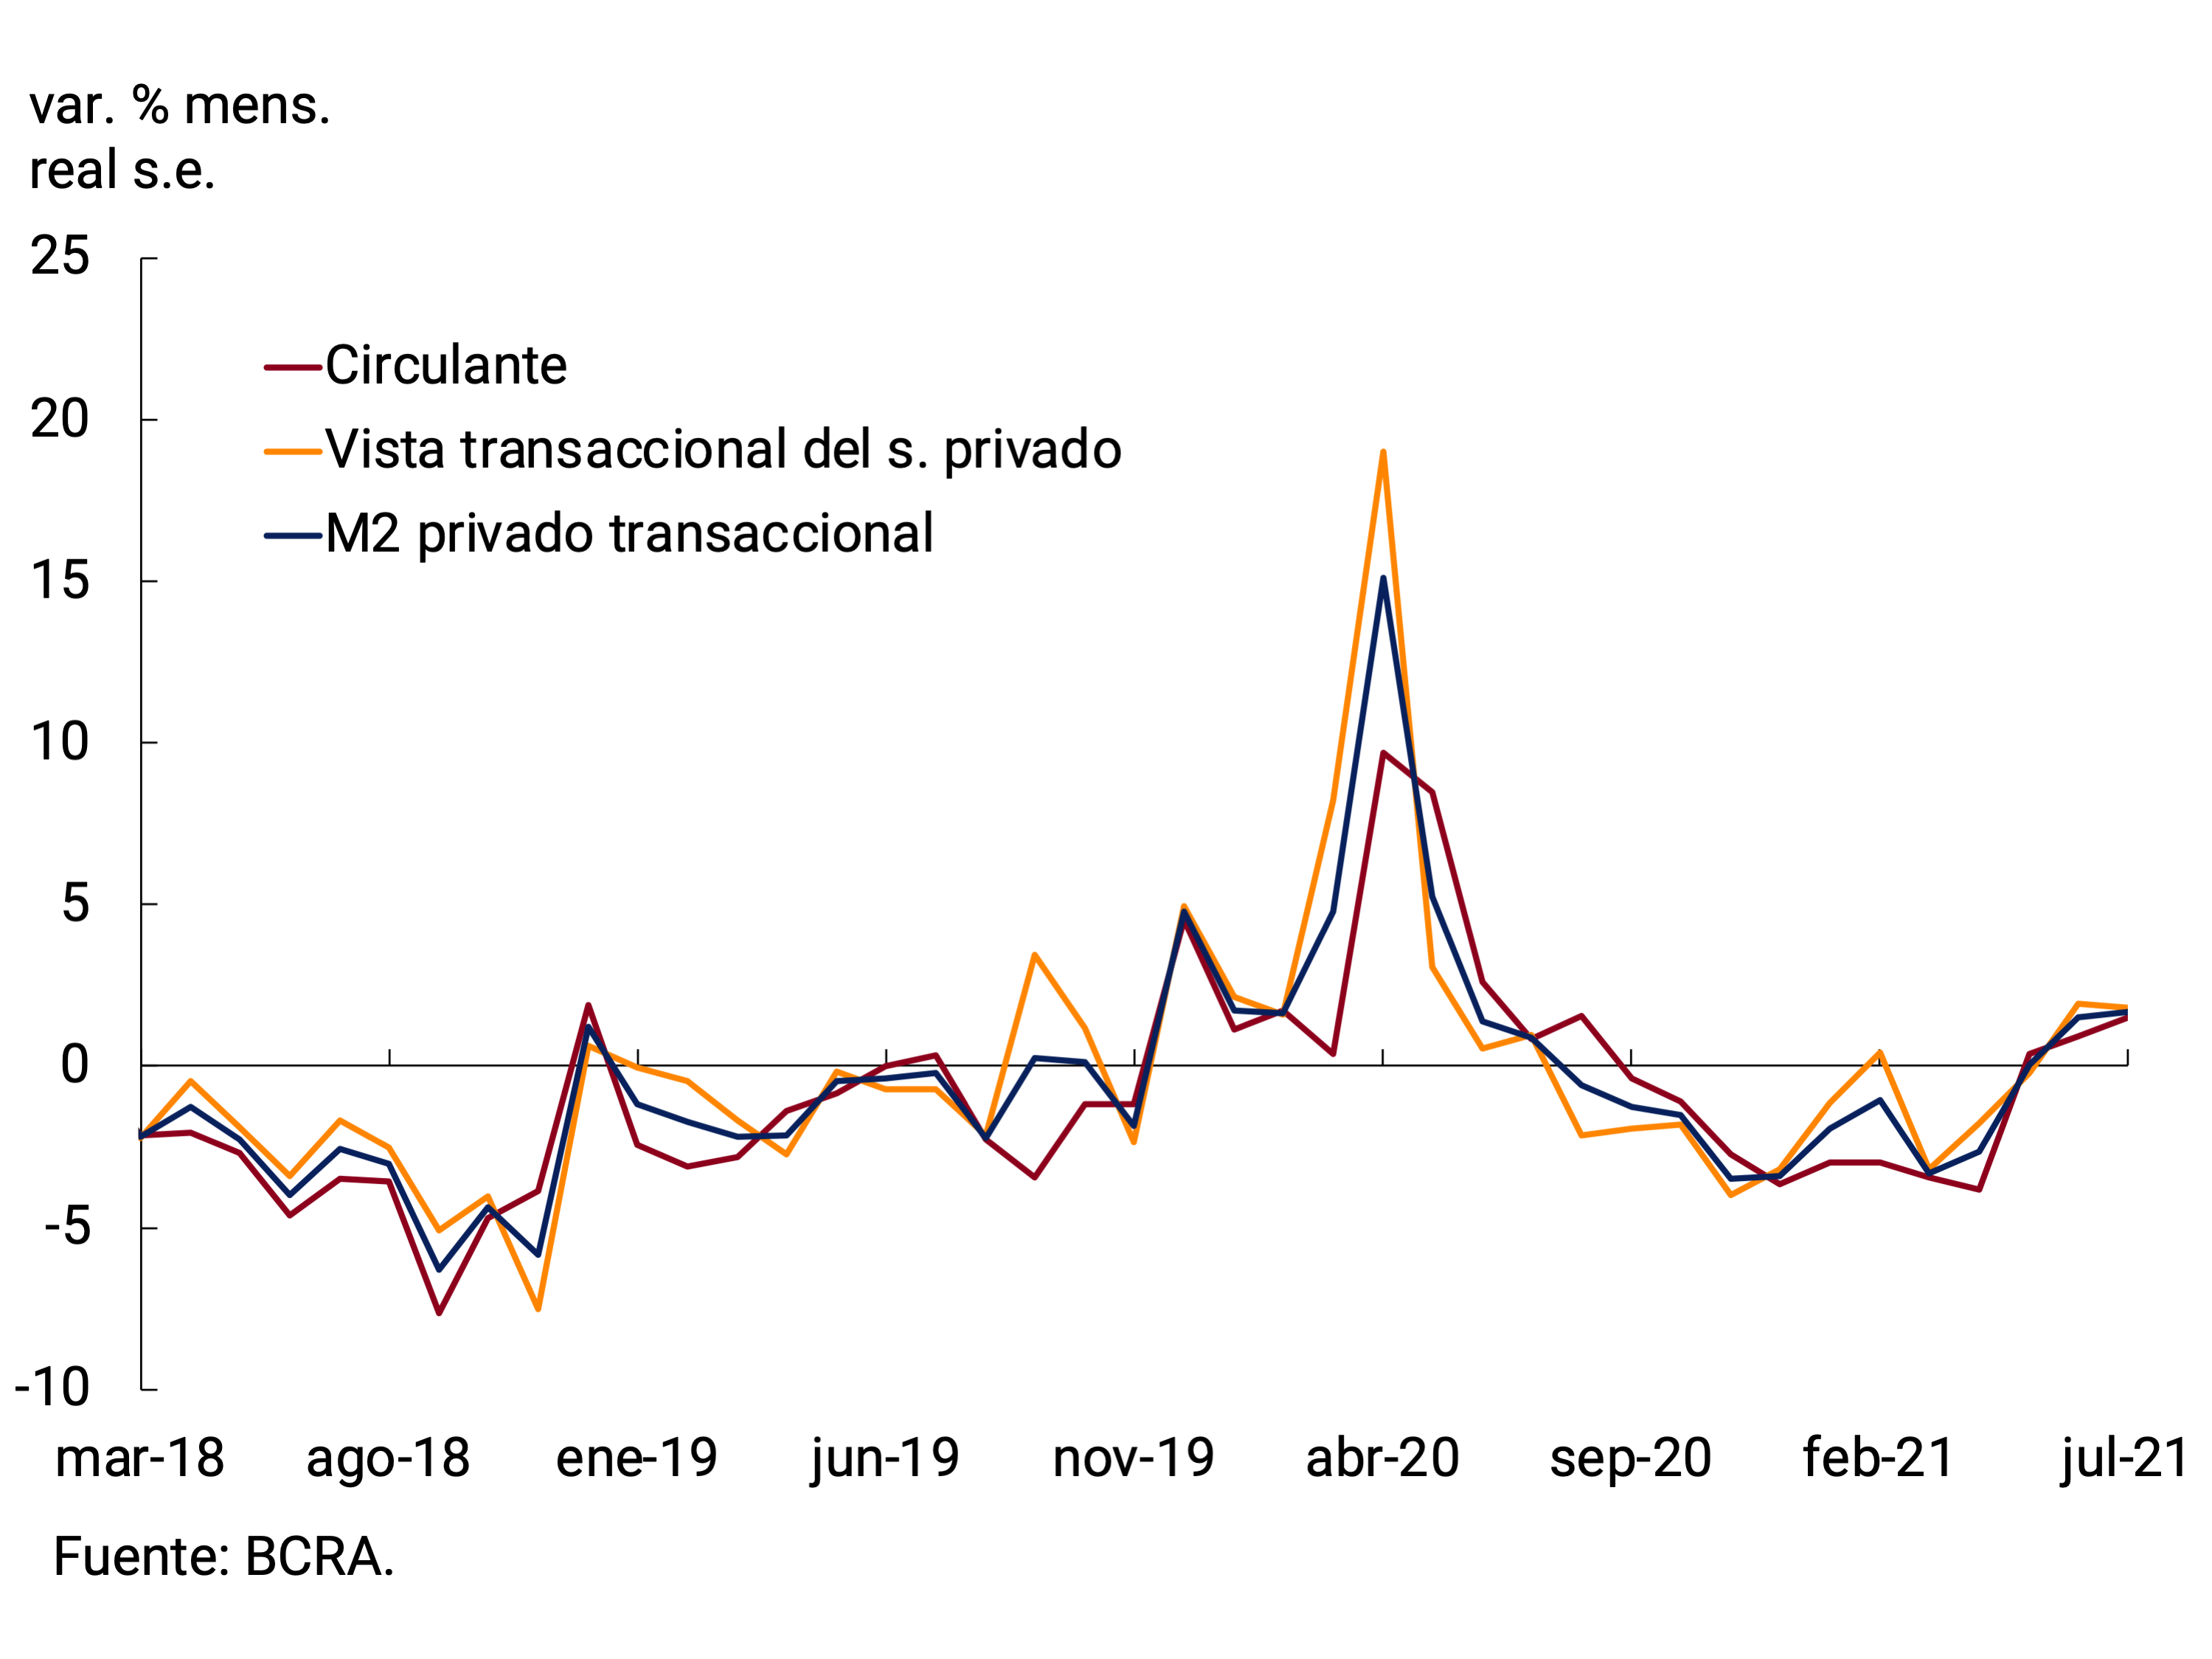
Means of payment and household income at current prices
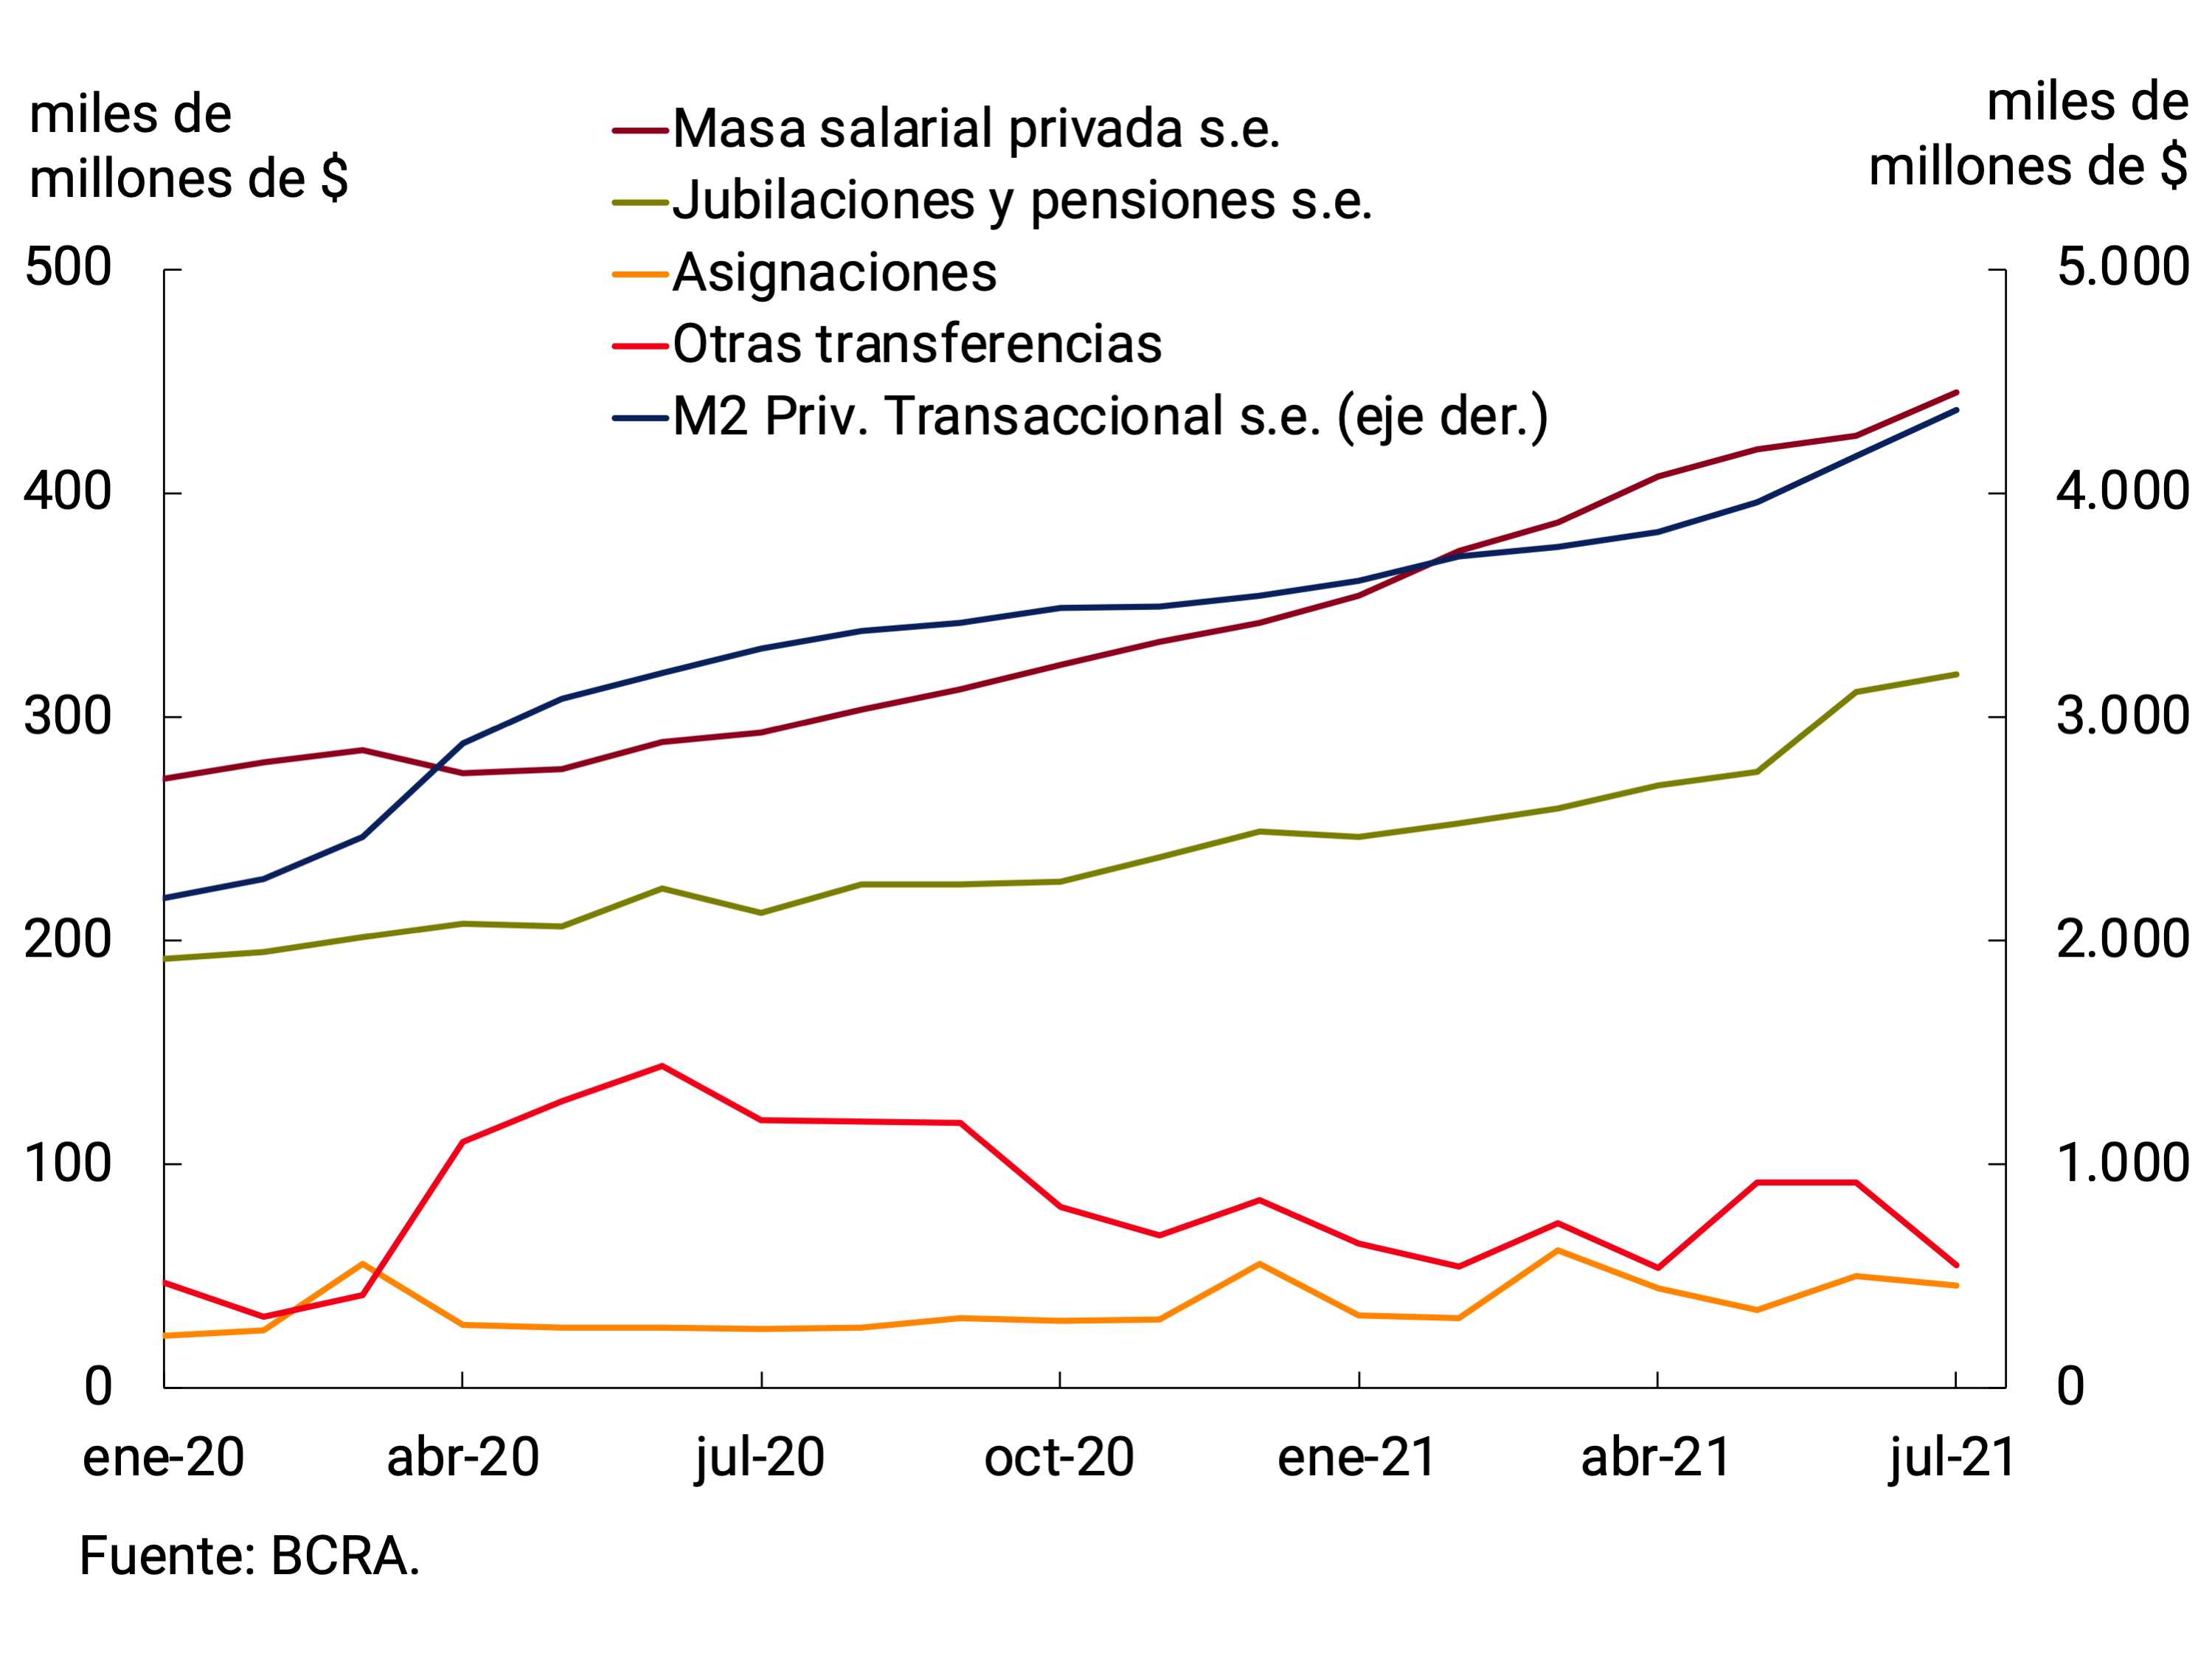
Recently, the BCRA ordered the creation of a QR code for the identification of commercial accounts in financial institutions and payment system providers. This QR code will complement the CBU and the alias and will allow users of virtual wallets to read the QR from their application and make transfers or payments virtually, which are part of the Transfers 3.0 system. This new QR differs from the existing ones because it directly identifies the merchant’s account, allowing immediate accreditation via transfer, with the lowest commission in the system. The continued advance of these new means of payment will deepen the relative demand for transactional demand deposits to the detriment of banknotes and coins.
7.1.2. Demand for local currency savings instruments was concentrated in UVA-denominated time deposits
Another factor that contributed to the greater dynamism of the means of payment between May and July was the lower demand for savings instruments denominated in pesos. In fact, the average monthly variation of term placements during the second quarter was -0.4% s.e. at constant prices. In July, a reversal in their behavior was observed, as they managed to achieve an expansion at constant prices of 0.6% s.e. However, this dynamic was not homogeneous in terms of depositors and the instruments used.
The fall in real terms in time deposits between May and June was mainly explained by the evolution of wholesale deposits (more than $20 million), which presented an average monthly contraction of 3.6% s.e. (see Chart 7.3). This dynamic was linked, on the one hand, to the behavior of Financial Services Providers (FSPs), among which the Mutual Funds for Money Market Investments (FCI MM) stand out. The assets of the FCI MMs remained relatively stable in nominal terms throughout the quarter and, given the relative stability in interest rates, there were no major variations in their portfolio composition at current prices. Meanwhile, companies, another type of depositors that intervene in this market, presented a slight nominal growth in their holdings of time deposits. The low dynamism at current prices of both types of agents resulted in a contraction of placements at constant prices.
Figure 7.3 |
S. priv fixed-term deposits. by amount stratum at constant prices
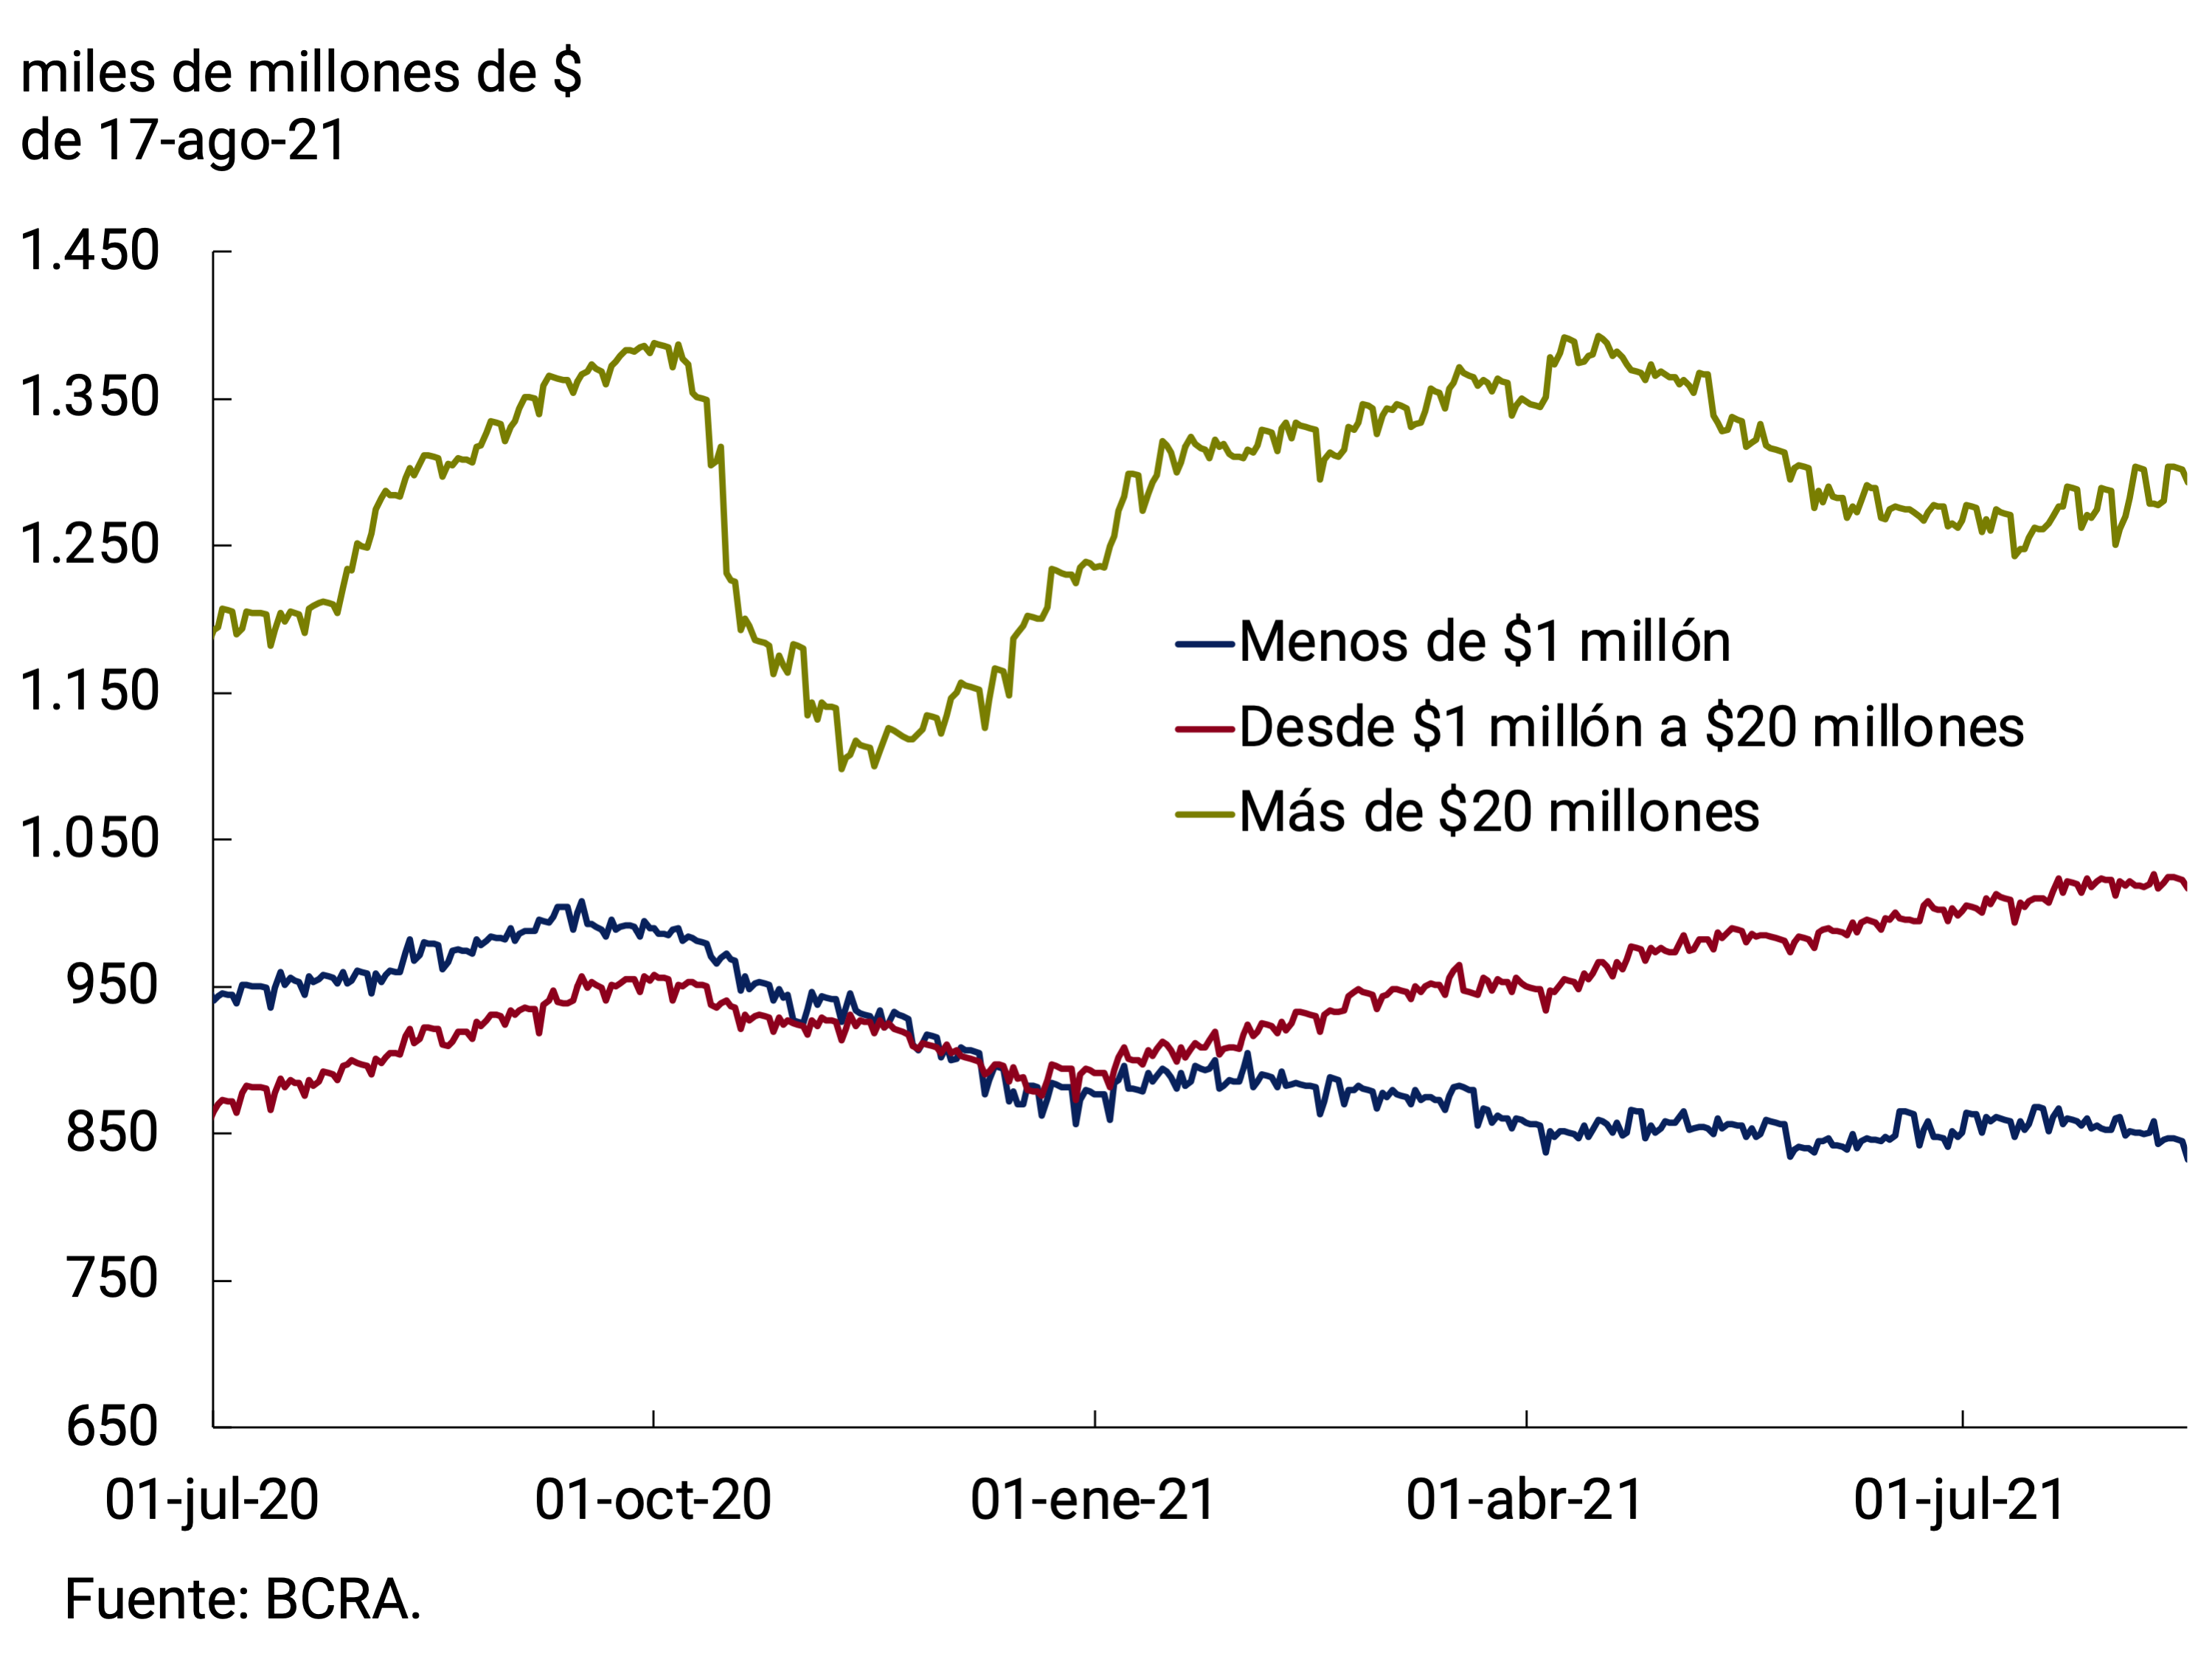
S. priv fixed-term deposits. No seasonality by instrument type at constant prices
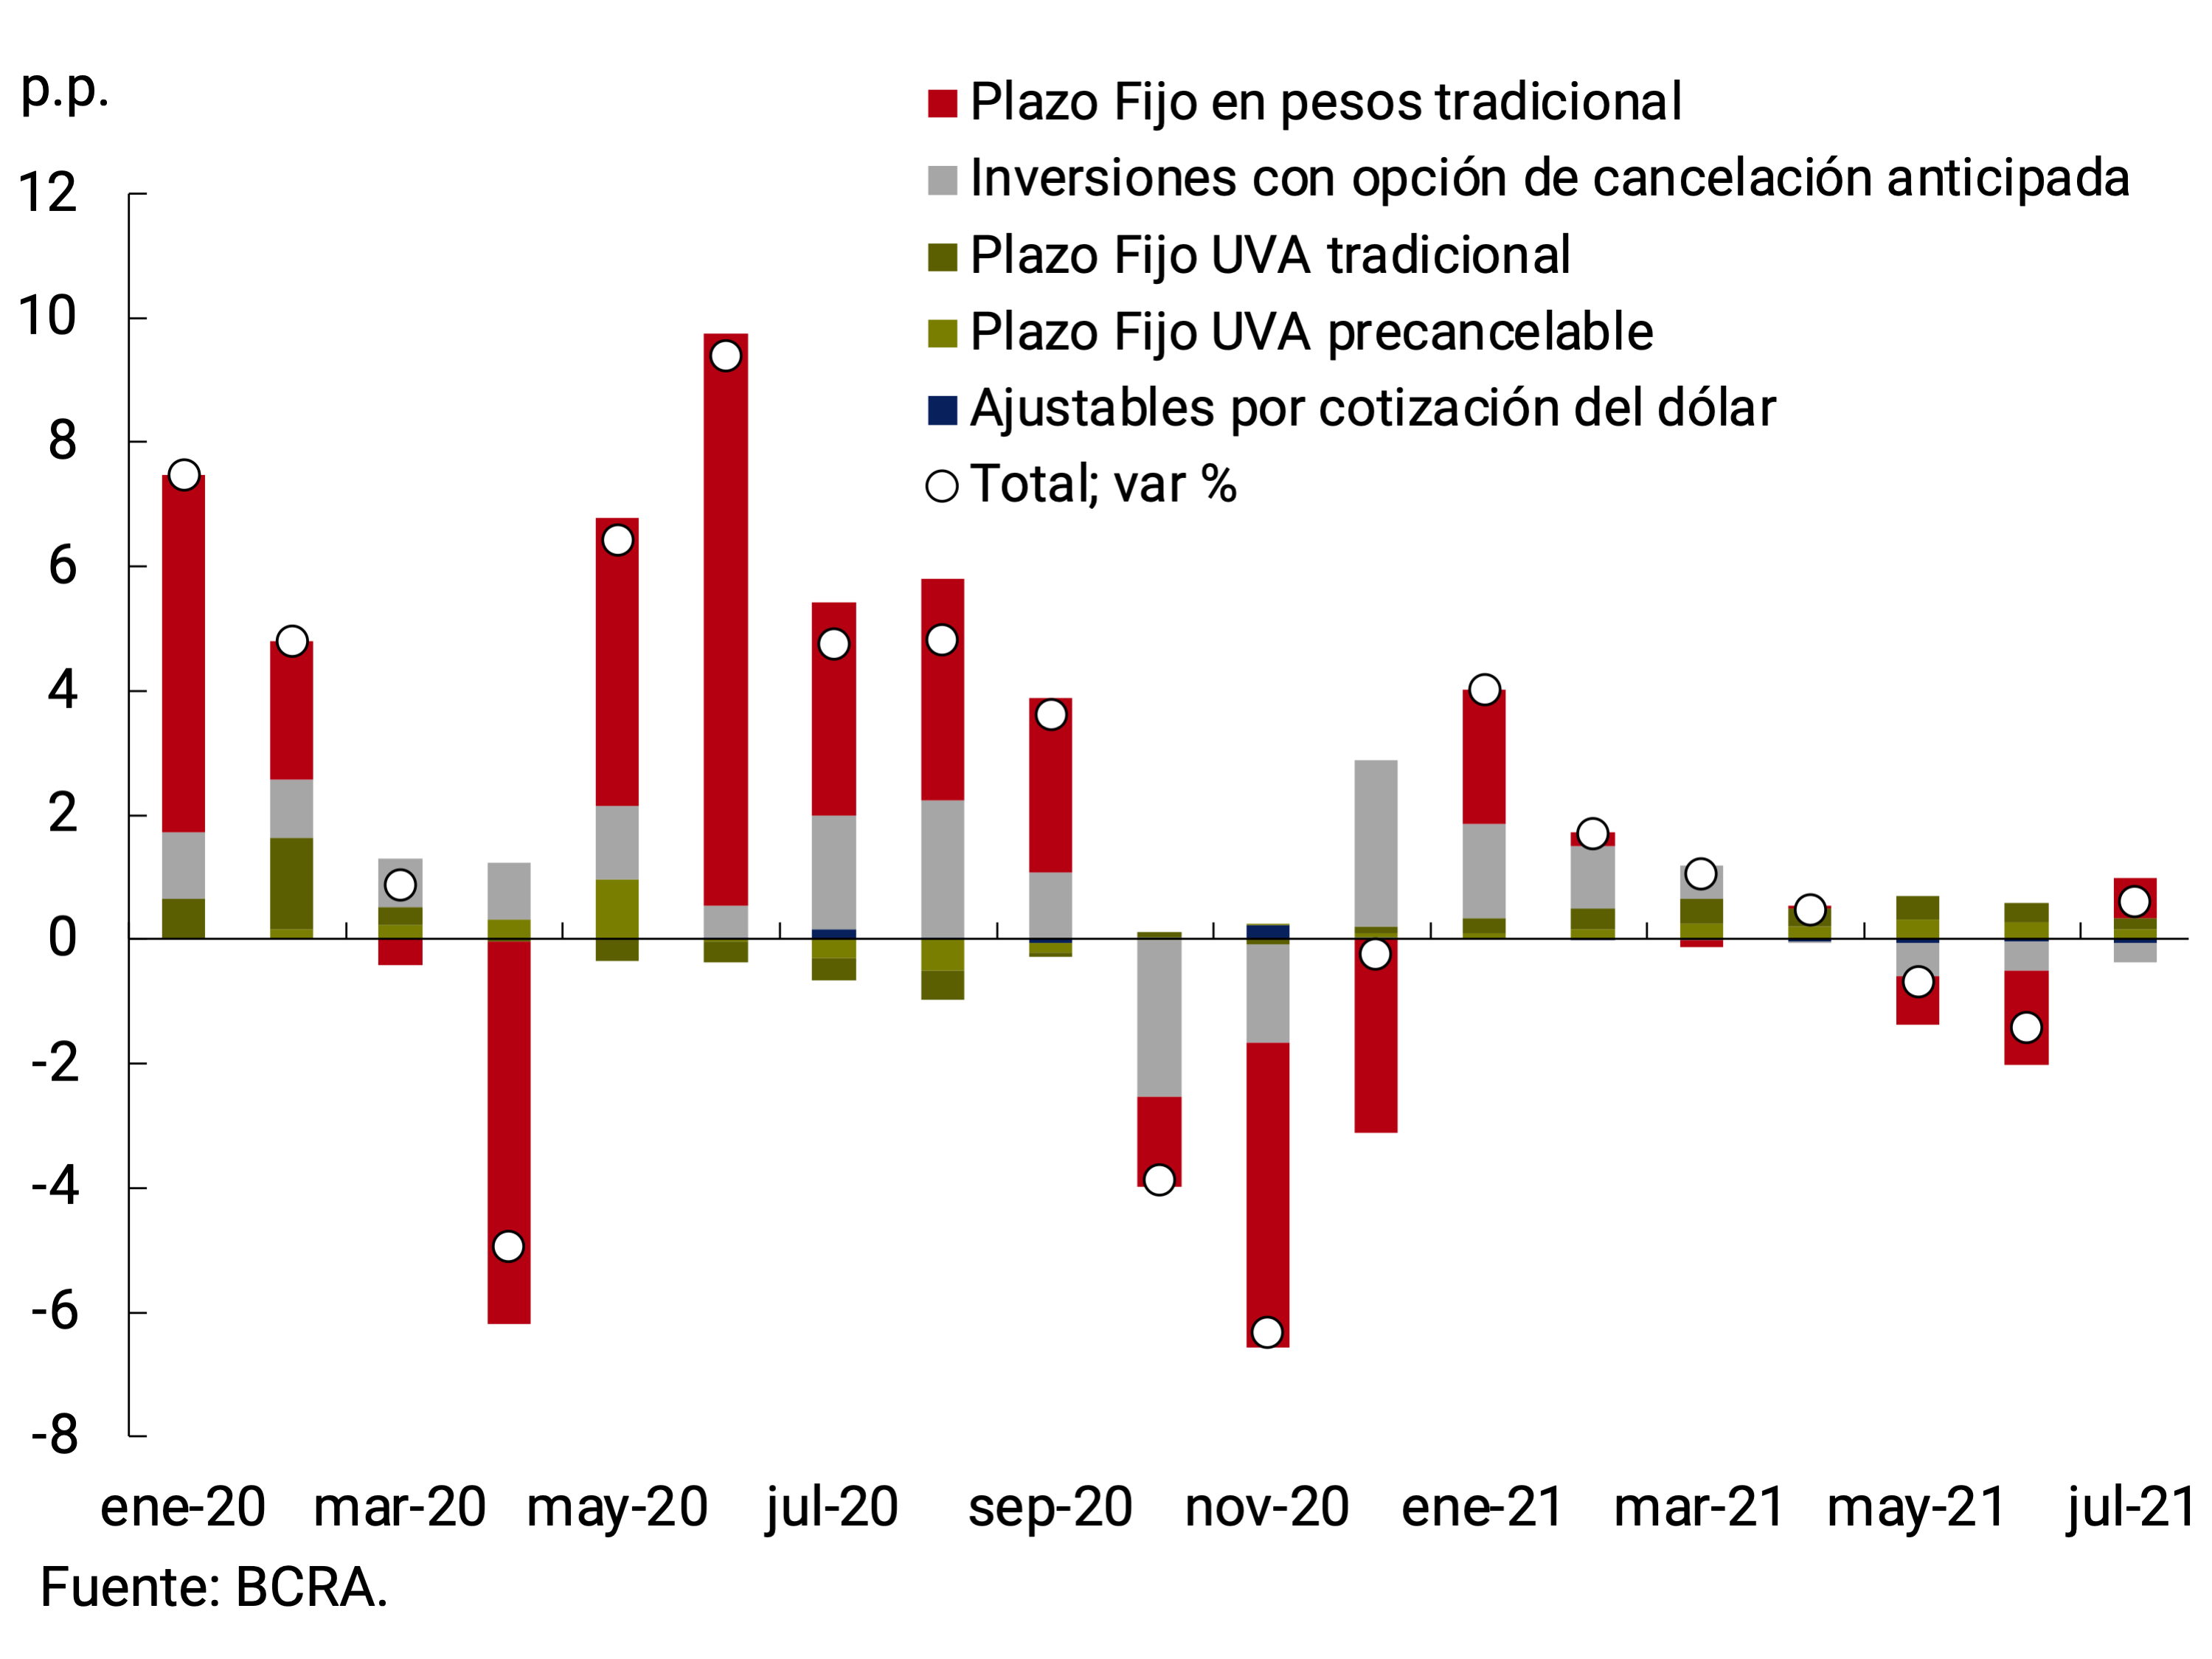
Between May and June, companies experienced a growth in their expenditures, linked to the closing of parity negotiations, the integration of the half bonus for June and the payment of taxes (which tend to be concentrated in these months). These higher expenses limited the surpluses that legal entities can allocate to constitute new fixed-term investments. In July, once these factors had passed, there was again an expansion of savings instruments in pesos. Meanwhile, the relevant interest rate for this segment (TM20 of private banks) stood at around 34% n.a. (39.9% y.a.) in mid-August, relatively unchanged compared to previous months.
Placements of between $1 and $20 million continued the upward trend observed since the beginning of the year, driven mainly by individuals. Meanwhile, retail deposits (less than $1 million) remained stable in real terms so far this year, with a guaranteed minimum rate for individuals that remained at 37% throughout the period (43.98% y.a.).
The dynamics of time deposits were also heterogeneous by type of instrument. The fall in real terms in the last months of the quarter was concentrated in the peso segment and was partially offset by UVA placements (see Section 6 / The importance of variety in savings instruments). Indeed, deposits adjusted by CER continued to show dynamism, in a context in which the BCRA kept the reference interest rates unchanged. This led to the differential between interest rates in pesos and UVA temporarily remaining in favor of the latter during the second quarter. However, with the moderation in inflation, in July the interest rate spread was significantly reduced, leading to a moderation in the growth rate of this type of placement.
Between April and July, UVA placements without a pre-cancellation option grew at an average monthly rate of 9.2% in real terms, while pre-cancelable placements grew at 19.0%. Distinguishing by type of depositor, the greatest boost came again from individuals, whose time deposits in UVA continued to grow at a good pace, registering an average monthly increase of 18.3% at constant prices during the period. Meanwhile, the holdings of legal entities showed less dynamism than in the first part of the year (the average monthly expansion rate was 5.8% in real terms in the second quarter), due to the higher expenditures they faced in the period, as mentioned above (see Figure 7.4).
Figure 7.4 |
Balance of fixed-term placements in UVA by type of deposit
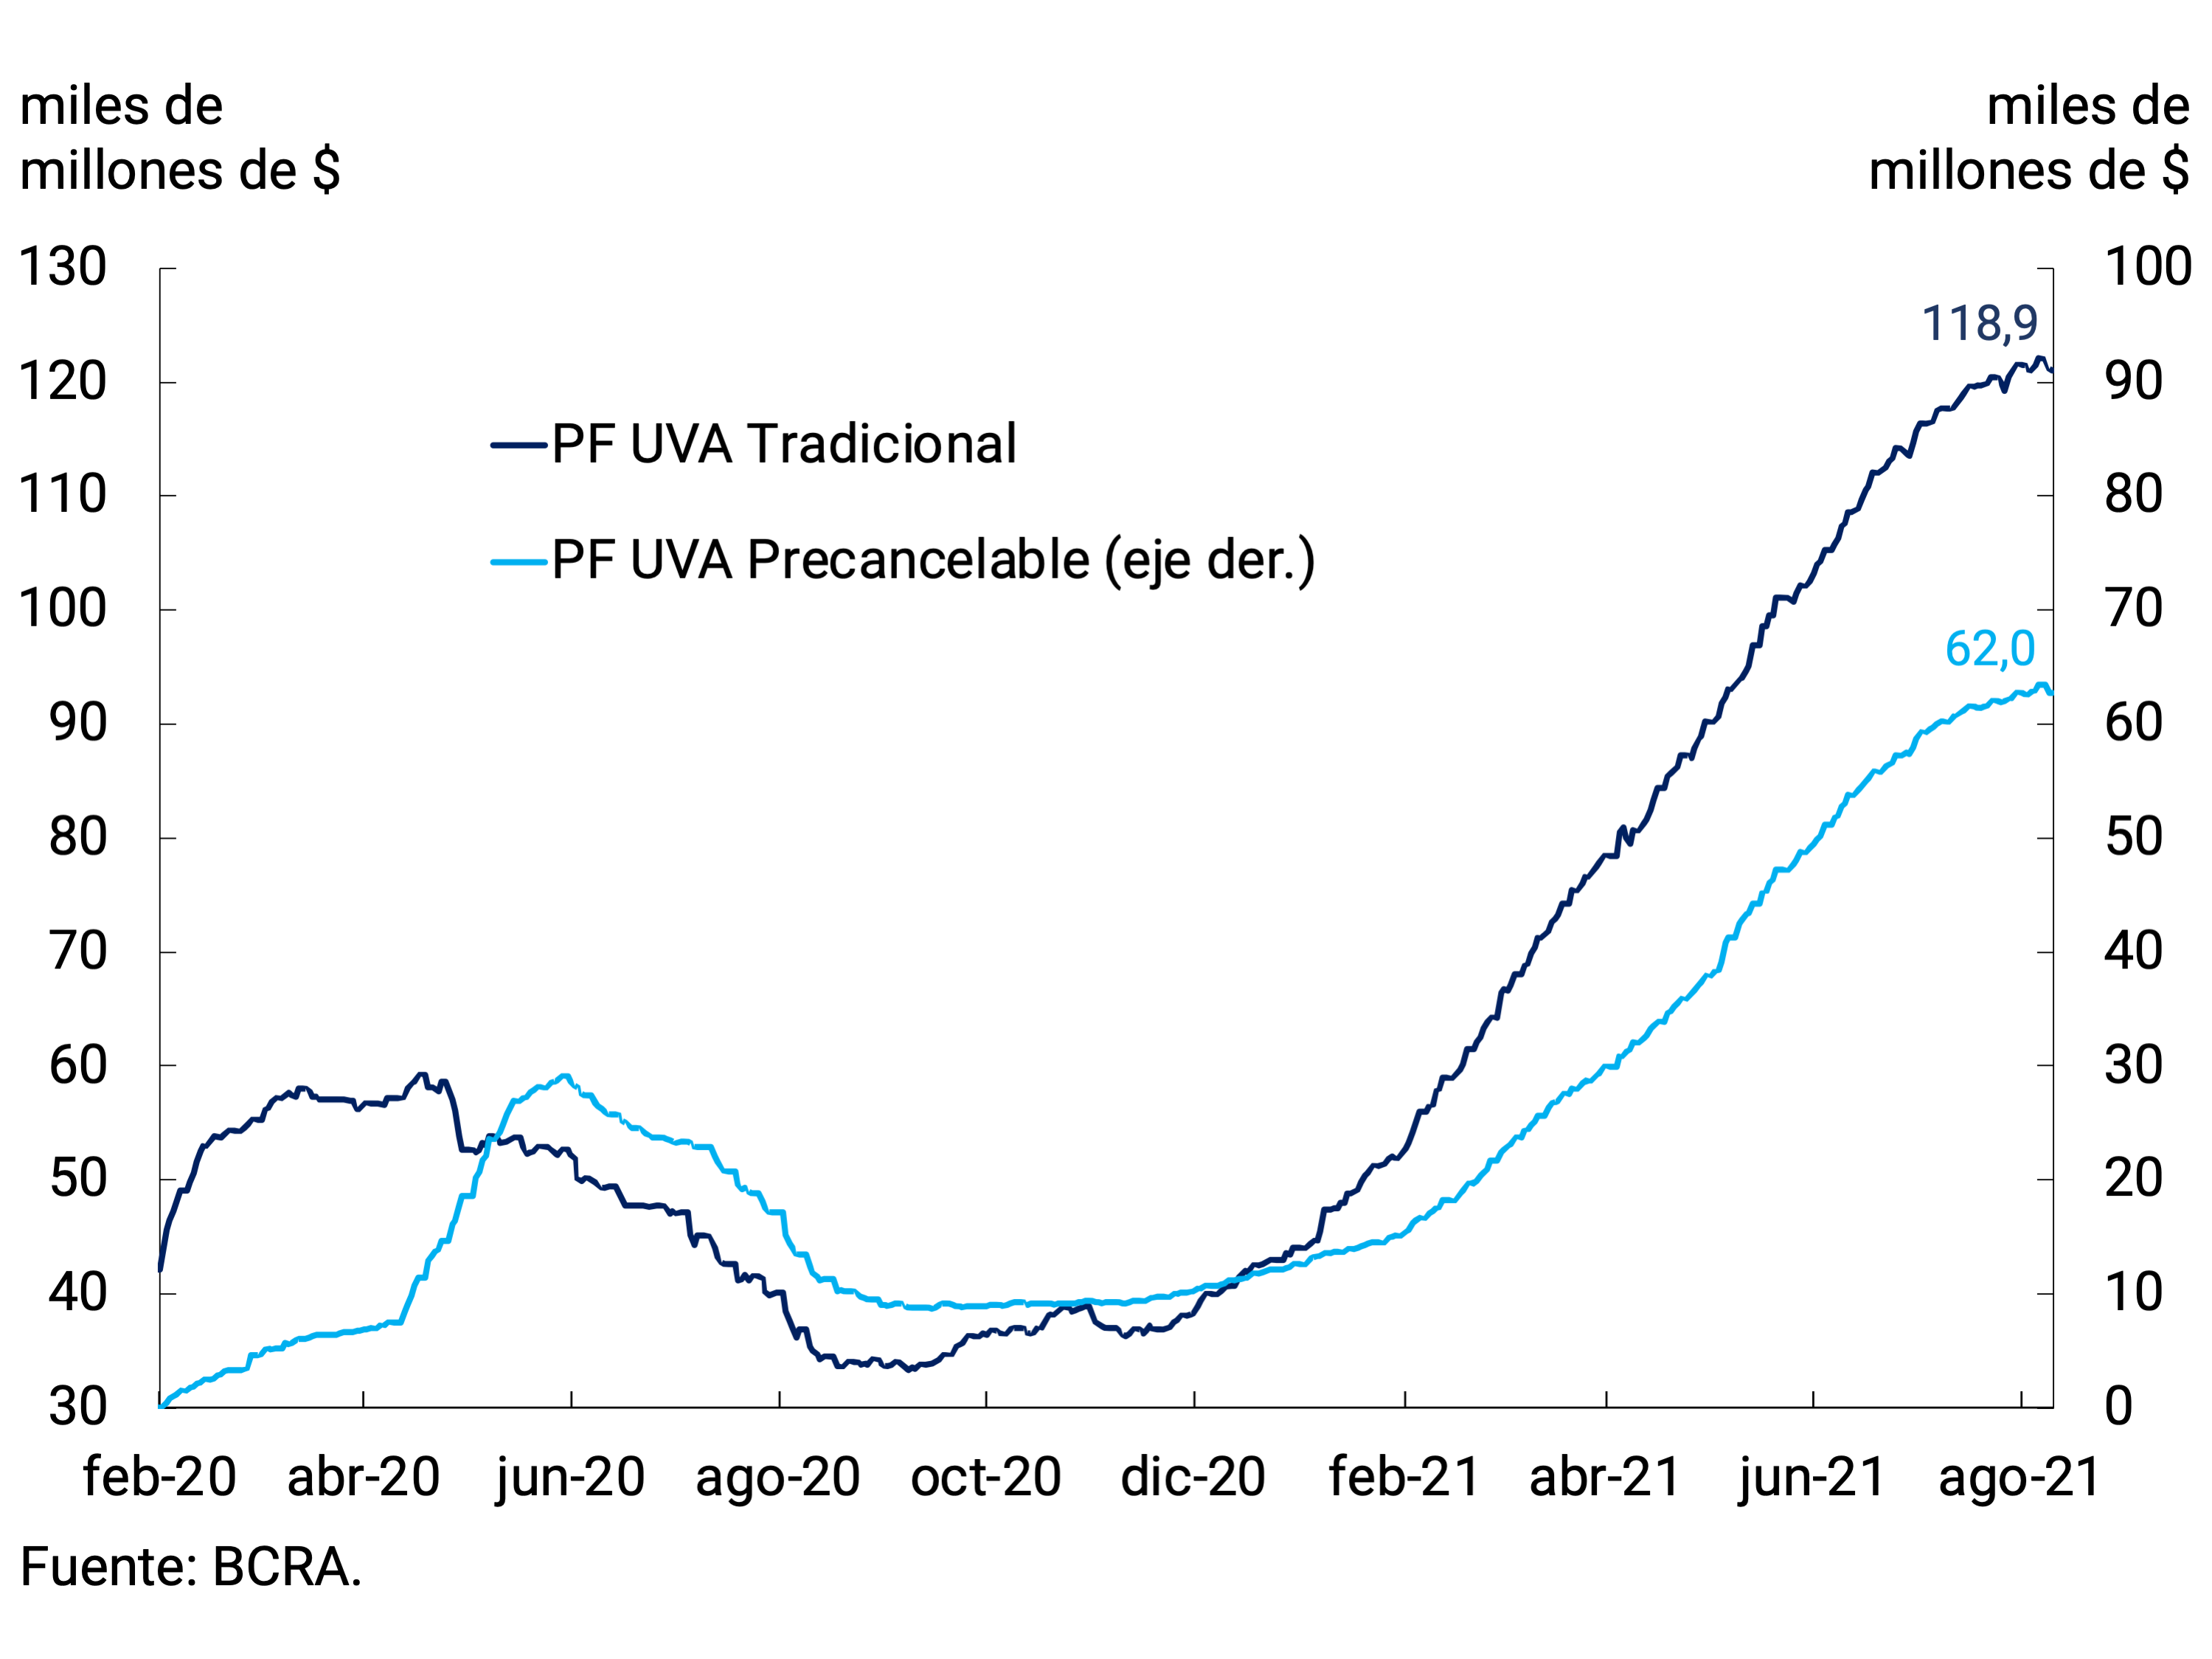
Balance of fixed-term placements in UVA by type of depositor
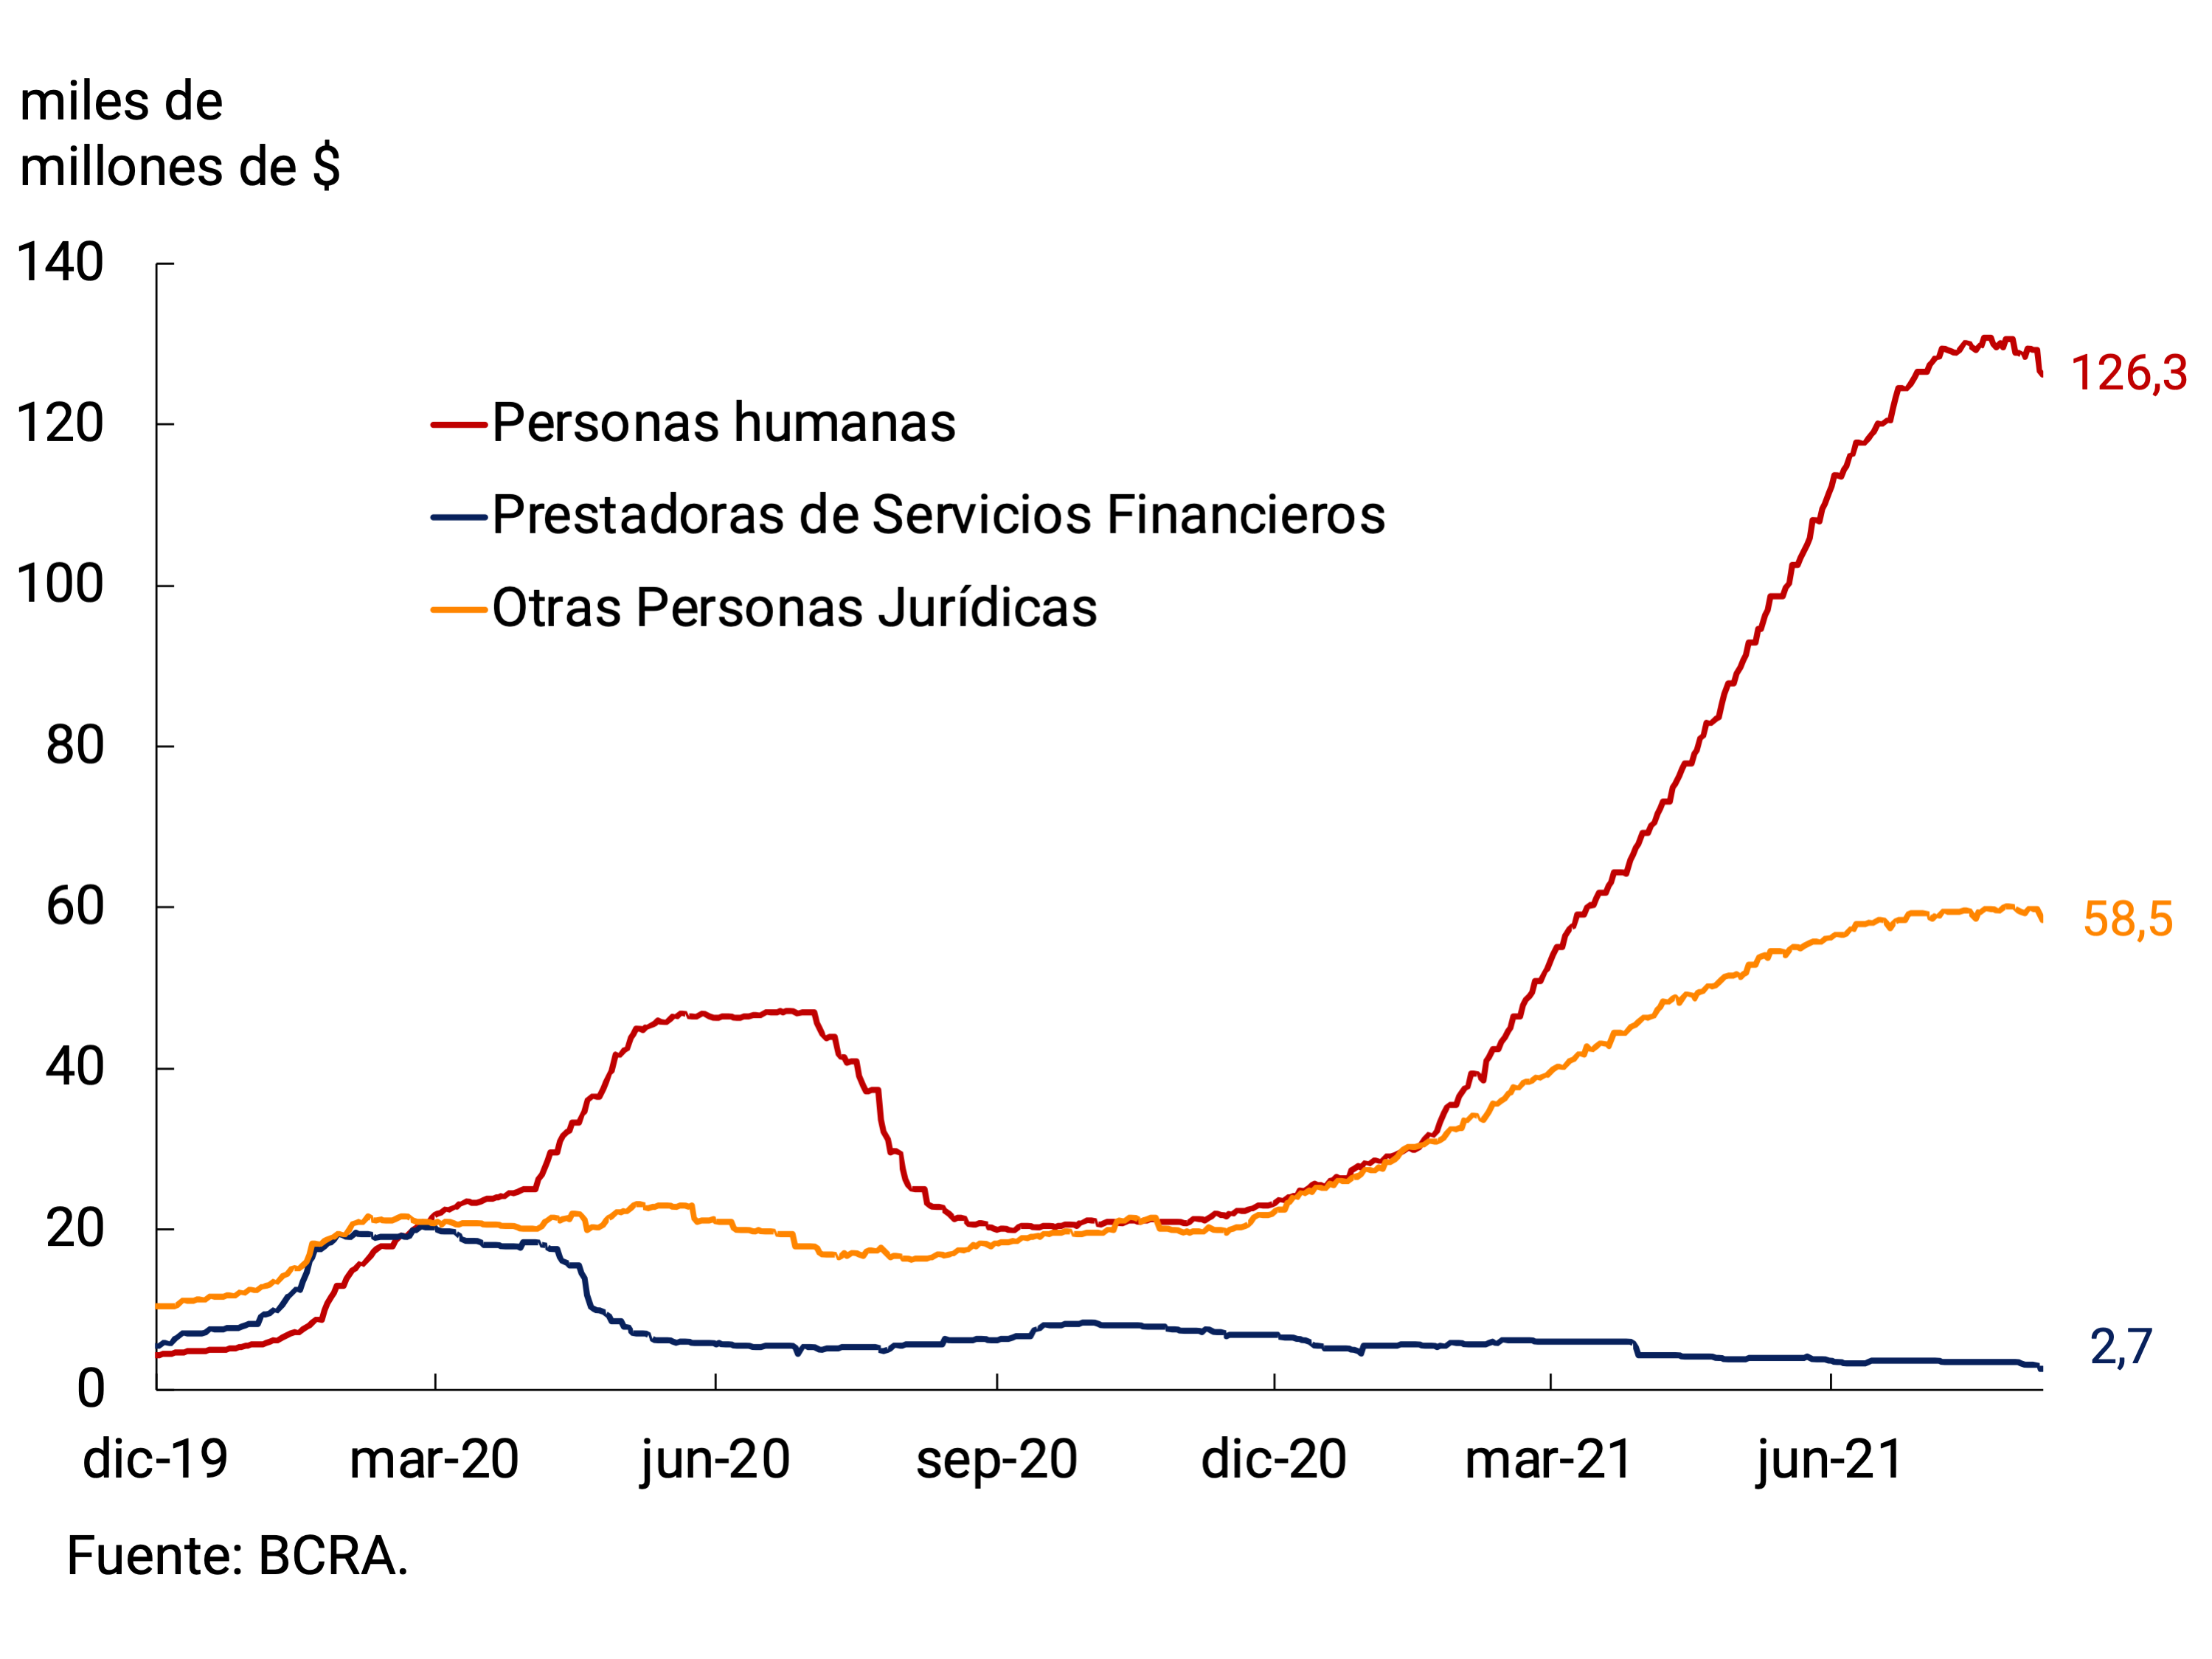
However, private M3, a broad monetary aggregate, registered an average monthly contraction of 1.1% s.e. at constant prices during the second quarter, a behavior that was partially reversed in July as it registered an expansion of 0.6% s.e. In terms of GDP, this monetary aggregate stood at 18.4%, remaining 5.5 p.p. below the maximum record reached in June 2020 and only 1 p.p. above the average record verified between 2010 and 2019.
7.1.3. Credit policy continued to focus on the lagging sectors
The lower economic impact of the second wave of COVID allowed the BCRA to maintain the scheme of focusing credit policy on the most lagging sectors, with a special emphasis on productive development. The Productive Investment Financing Line (LFIP) continued to be the main tool used to channel productive credit to MSMEs under favorable conditions.
Since its implementation, and with data as of July 31, the accumulated disbursements through the LFIP totaled $801,000 million. Thus, in the second quarter of the year, the average monthly nominal growth of these placements was 19%. About 84% of the total disbursed in the period was allocated to finance working capital, while the rest was allocated to the line that finances investment projects. Considering that most of these loans were channeled through discounted documents with an average life of close to 2 months, it is expected that a part of the amounts disbursed will have been amortized, which would balance the participation of investment projects at a value closer to the 30% quota established by the standard. Recently, the BCRA decided to extend the line “Financing of investment projects” that contemplates an interest rate of 30% n.a. to all companies, regardless of their size, that make investments aimed at increasing the productive capacity of poultry and pork. These sectors have a potential margin to increase their production and contribute both to the diversification of the meat consumption basket and to the increase in net exports65.
The balance of credit to MSMEs continued to be boosted mainly by documents. So far this year, these types of companies have opted to a greater extent for the discount of documents, whose average life is shorter than that of single-signature documents. Thus, the balance of loans to MSMEs at constant prices remains above the pre-pandemic record, although with a drop in recent months due to the concentration of maturities of the lines granted at the beginning of the pandemic.
The credit segment to large companies continued to contract during the second quarter of the year, this time at an average monthly rate of 3.5% at constant prices. In July, the trend was reversed, registering a real monthly expansion of 4.2% s.e. (see Figure 7.5). This greater dynamism in the seventh month of the year was mainly explained by the evolution of current account advances, in a period in which companies had greater liquidity needs. All in all, commercial financing lines registered an average monthly variation of -0.4% nominal s.e. during the second quarter (-4.1% s.e. real) and a growth of 4.6% s.e. in July (1.5% s.e. real).
Regarding the measures aimed at assisting the productive sectors most affected by the pandemic, the deferral of unpaid installments (with the exception of credit card financing) for beneficiaries of the Productive Recovery Program II stands out. Thus, financial institutions must incorporate at the end of the life of the credit the unpaid installments of credit assistance corresponding to maturities that have operated since May 17 and corresponding to customers who are employers included in this program, considering only the accrual of compensatory interest at the rate contractually provided66.
Figure 7.5 |
Estimated balance of commercial loans to the private sector by line and type of obligor
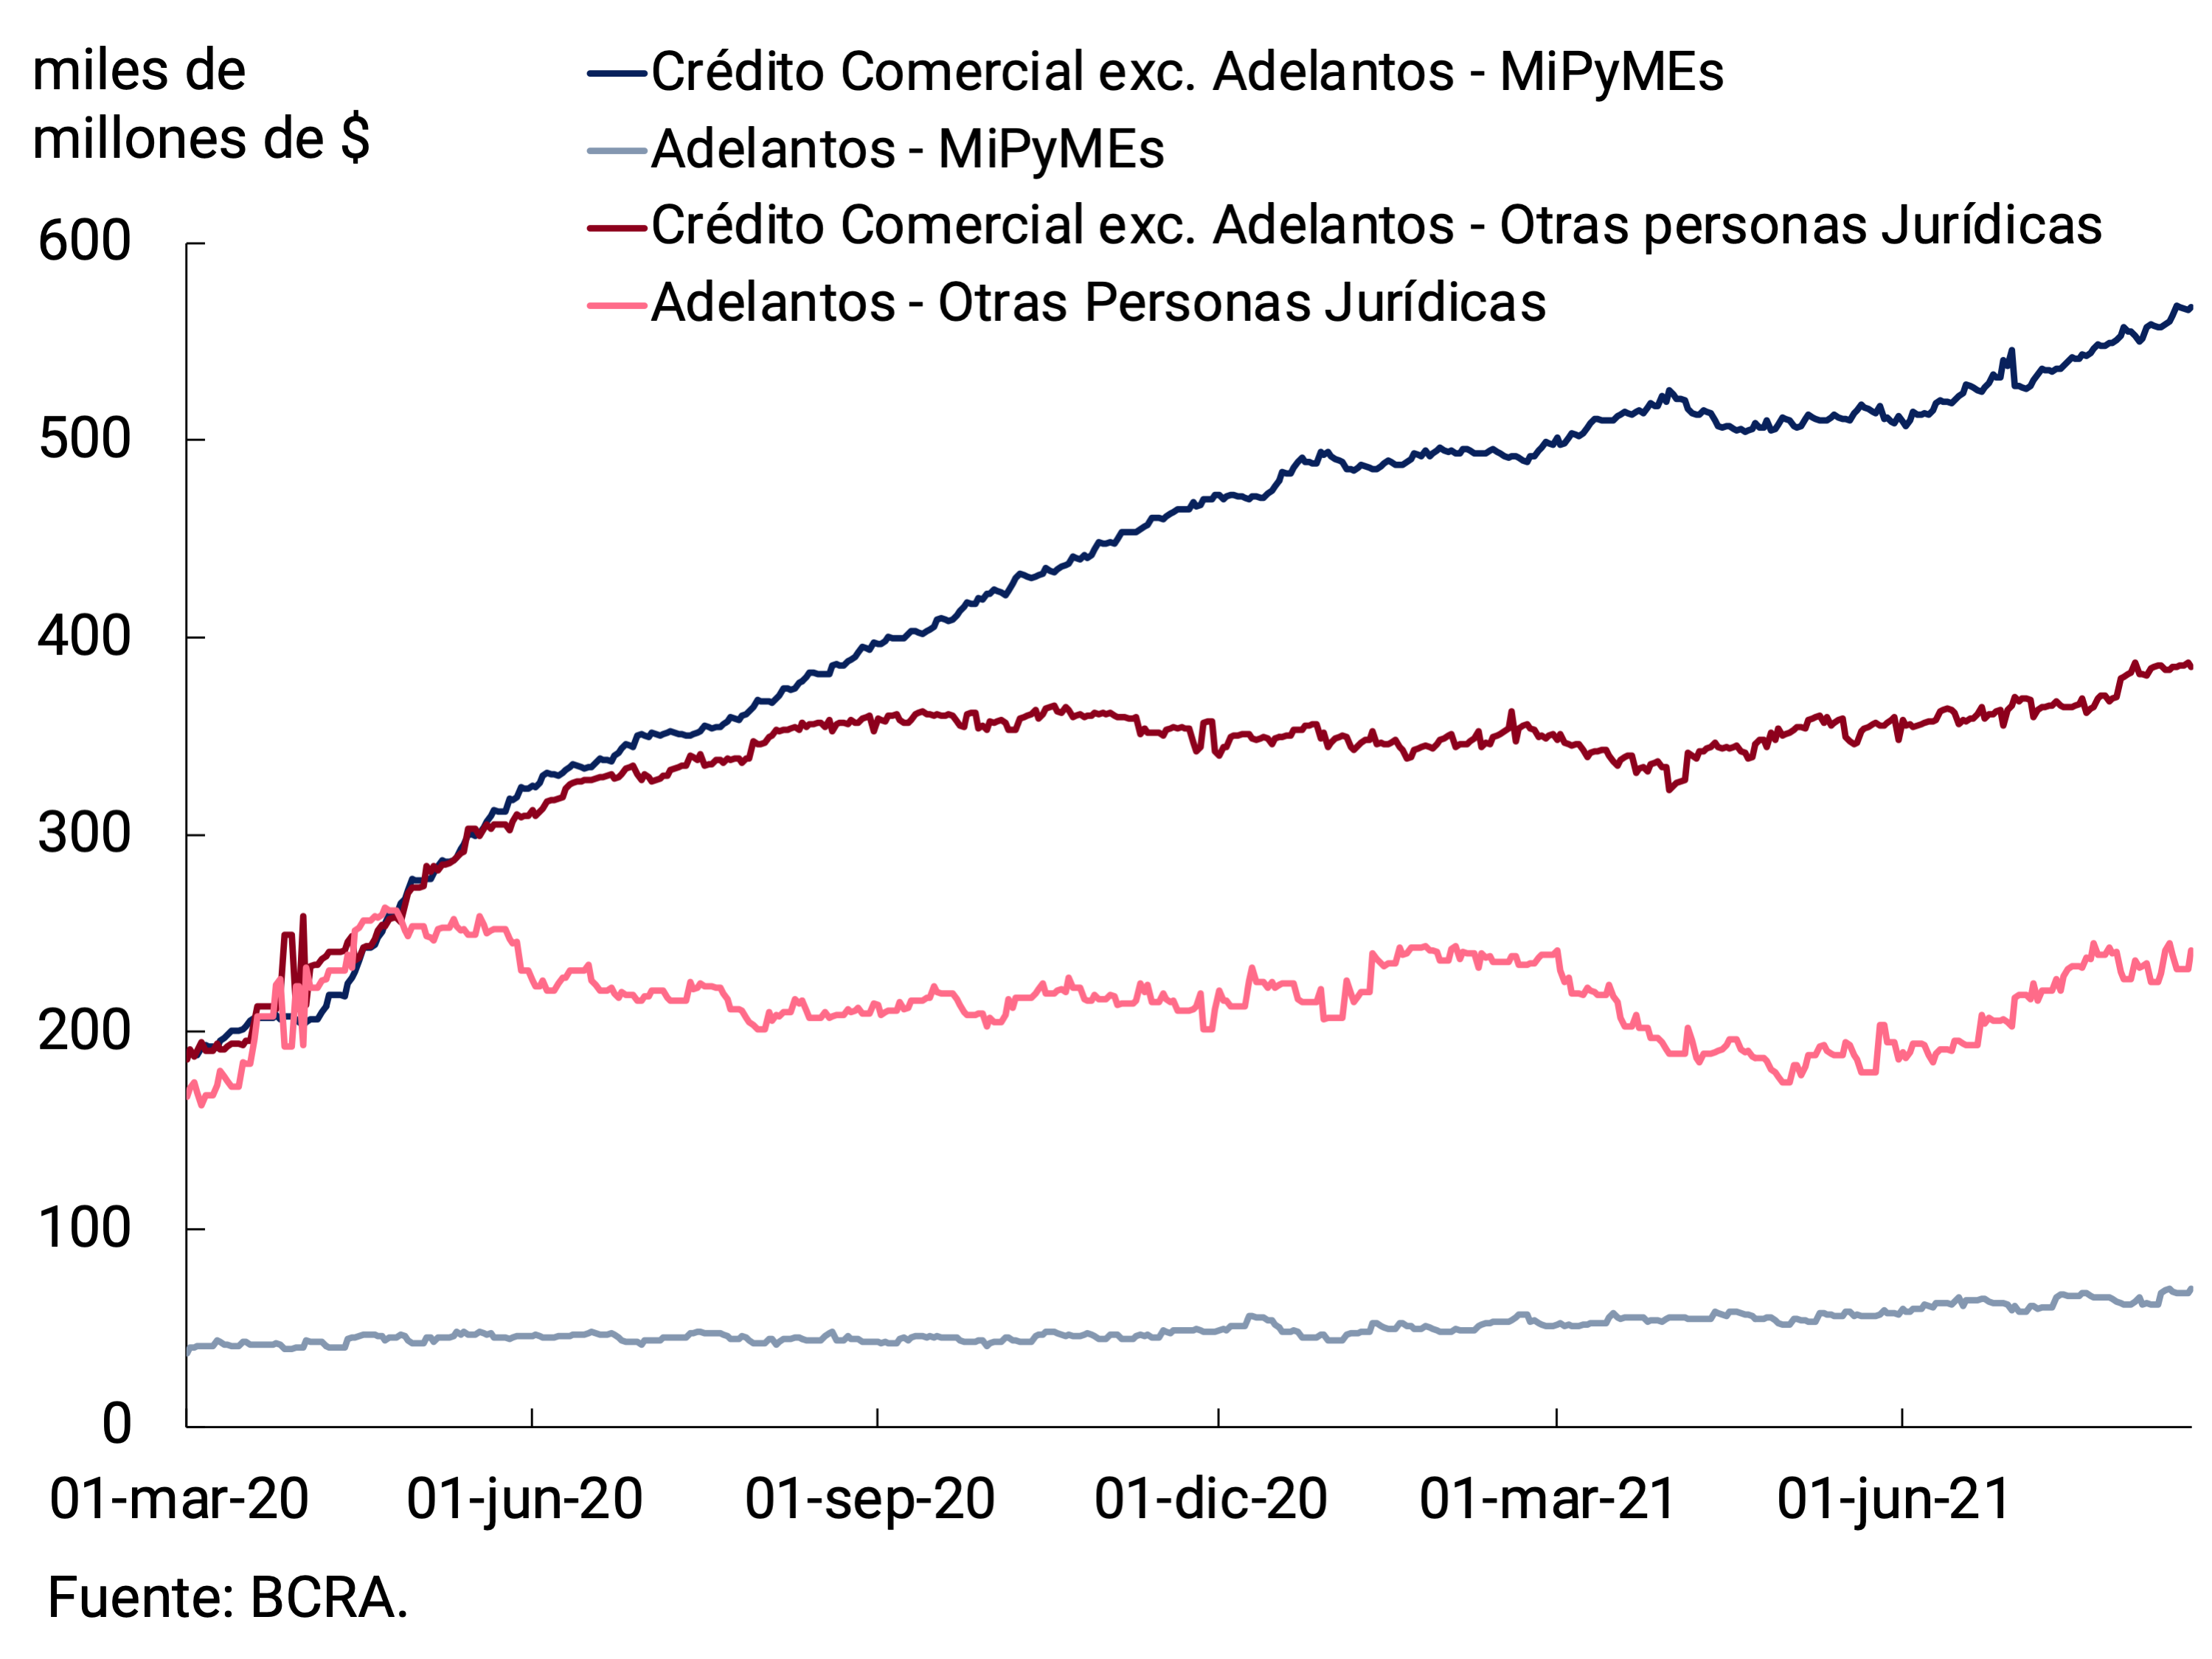
Estimated balance of commercial loans to the private sector by type of debtor at constant prices
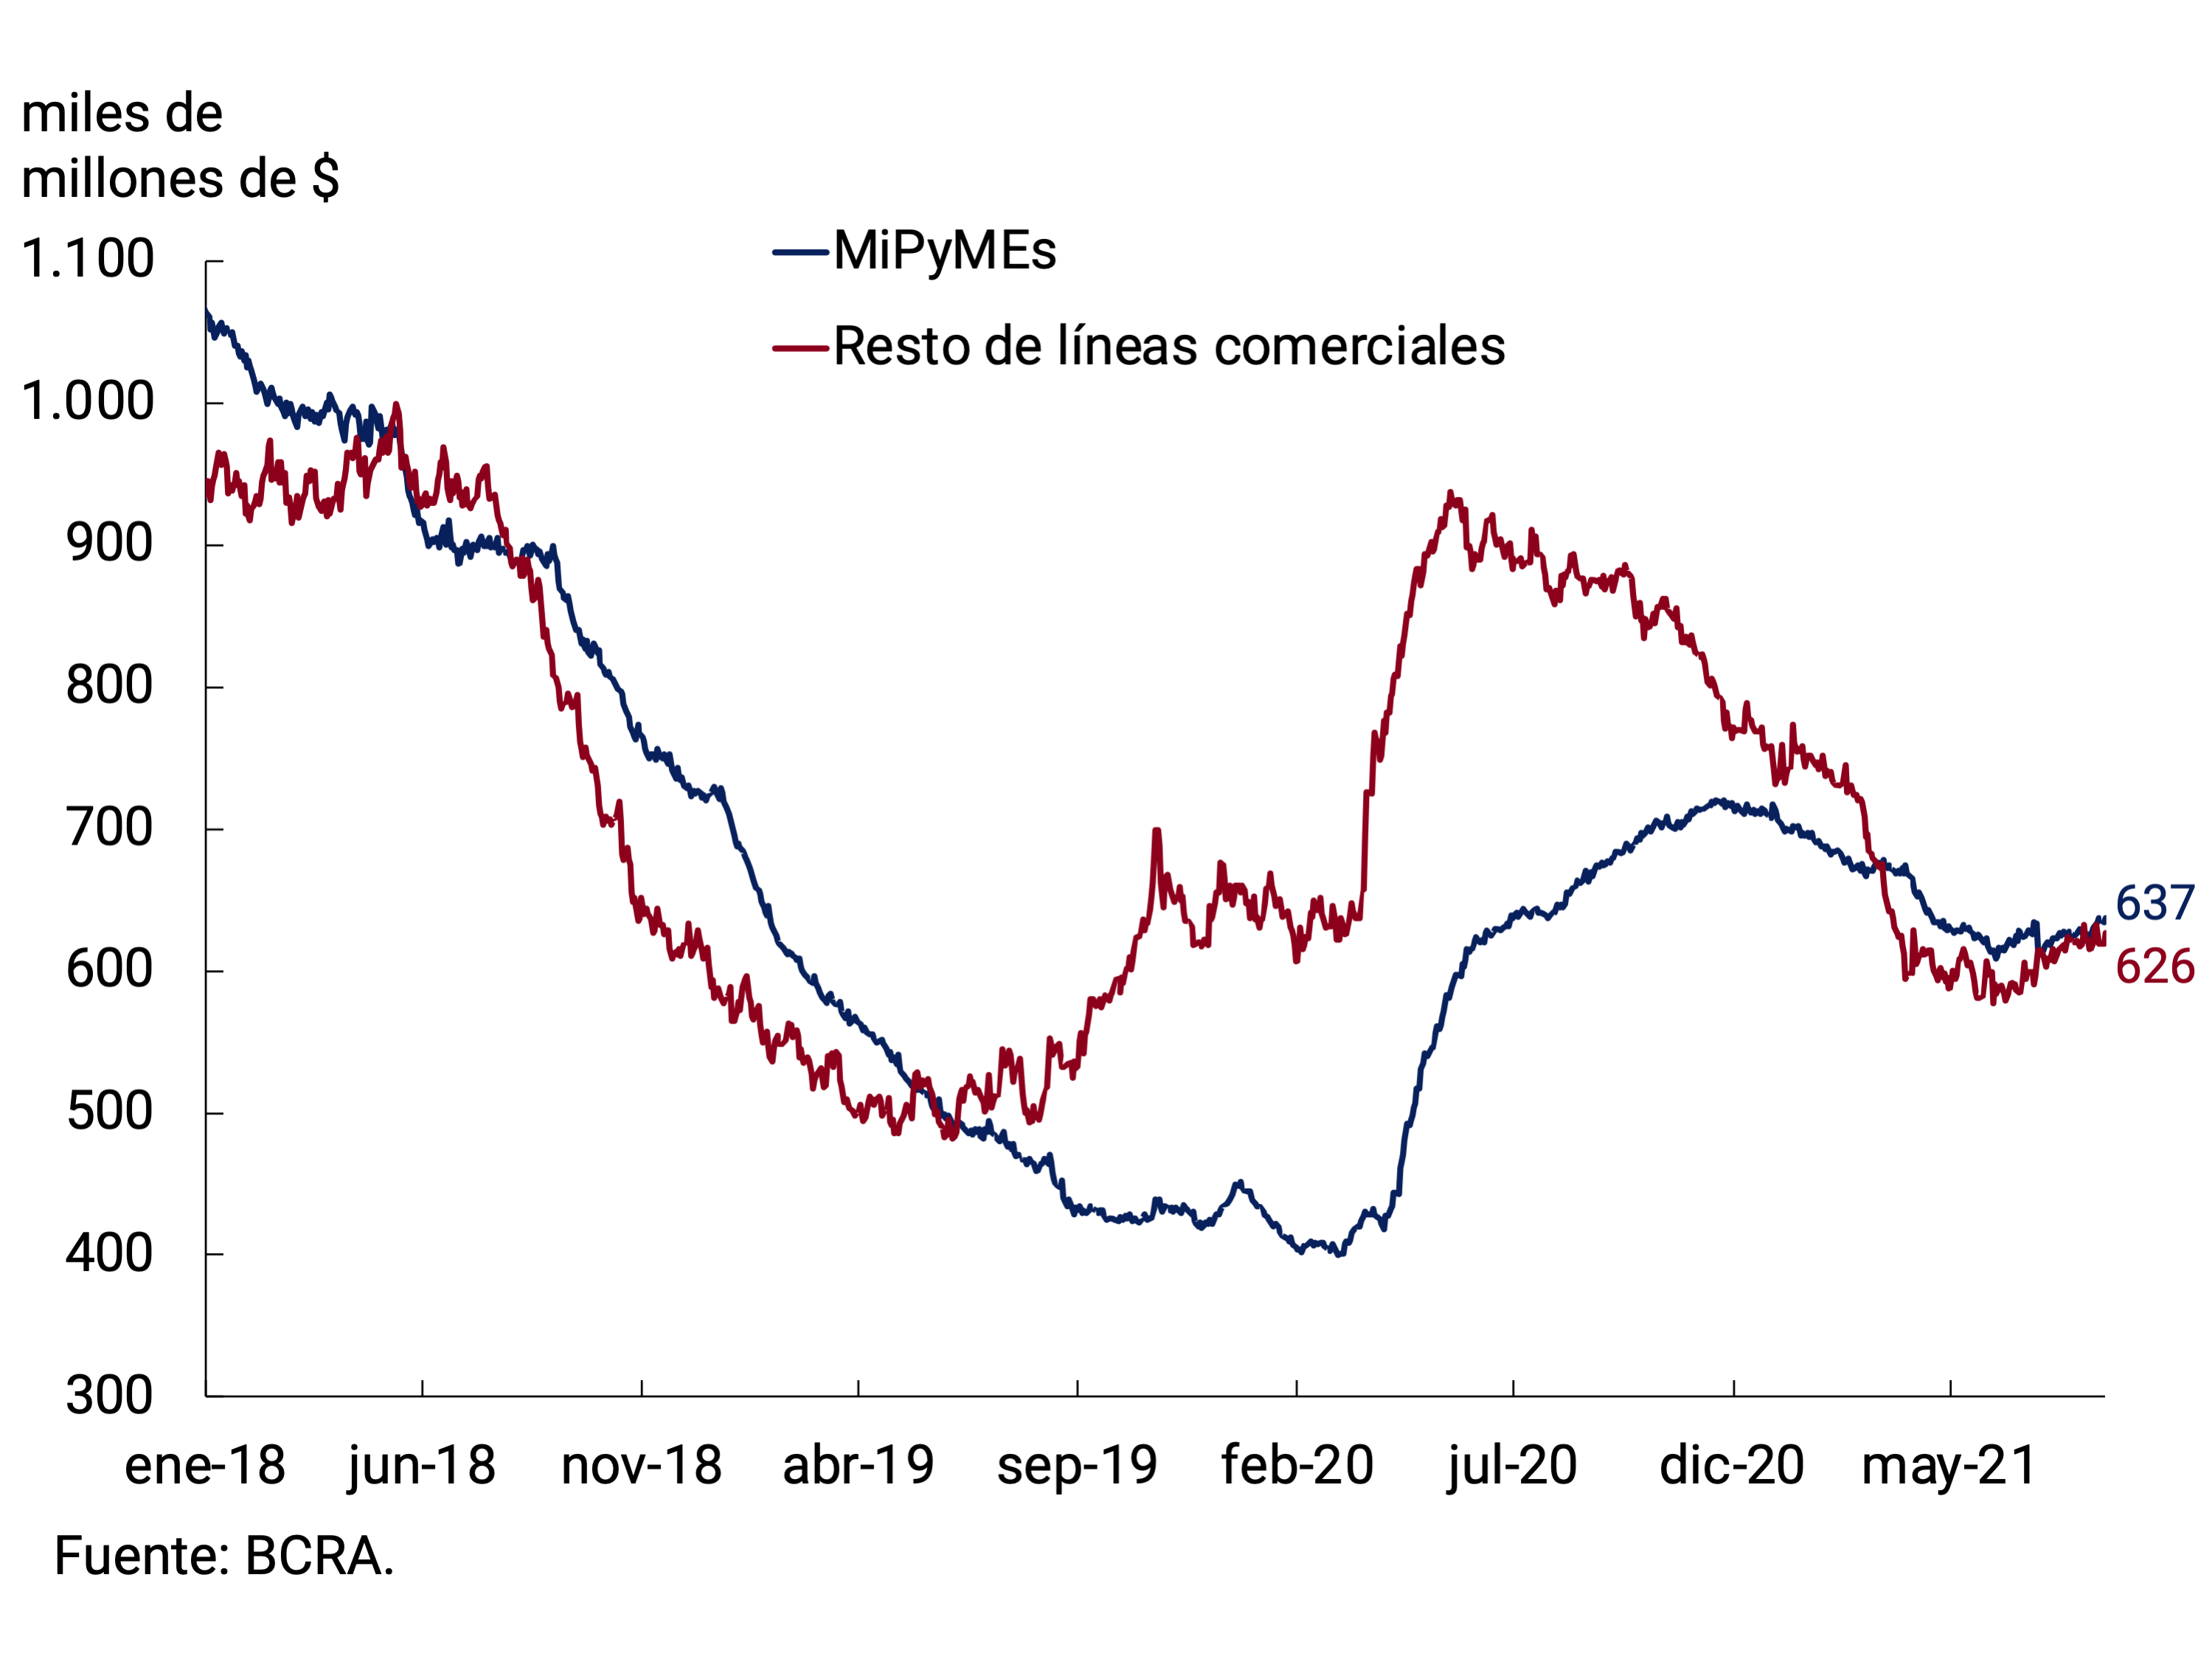
Within consumer loans, personal loans stood out, which presented a continuous increase in the amounts granted and, in this way, managed to cut the monthly contraction rate e.g. at constant prices. On the other hand, credit card financing moderated its pace of expansion throughout the year. Recently, the National Government decided to extend the “Ahora 12” program until January 31, 2022, with some modifications that seek to encourage consumption and boost credit card financing. Thus, the possibility of buying in 24 and 30 fixed monthly installments was included. The maximum term of 30 installments operates exclusively for “white goods” products, such as refrigerators and washing machines, while the term of 24 installments also includes small appliances, computers, notebooks and tablets. It should be noted that all products must be domestically produced67. Finally, it was also announced that as of the end of August, credits will be available for more than one million single-tax people, which will be credited to credit cards in one installment and whose maximum amount will be up to $150,000 (depending on their category). This line of financing will have a grace period of 6 months and will be repaid in 12 consecutive installments and without interest68.
In order to guarantee the fluidity of the payment system, the BCRA decided to reduce the maximum settlement period for payments made by financial institutions to businesses for sales made with credit cards in a single payment. The measure, which came into force in July, reduces collection times for 1.5 million micro and small enterprises69. Prior to this measure, the maximum settlement period was 10 business days. As of the new provision, micro or small enterprises and individuals receive the collection of sales made by credit card 8 business days after they have been made. In the case of medium-sized companies, the deadline was maintained at 10 business days and for large companies the term was extended to 18 business days. For health, gastronomic and hotel companies, the reduction to 8 days in the case of micro or small businesses also applied and remained at 10 business days for the rest.
Finally, with regard to loans with real collateral, collateral loans stand out, accumulating 13 consecutive months of positive variations at constant prices. All in all, total credit to the private sector registered an average monthly fall of 2.3% at constant prices in the second quarter and an expansion of 0.4% in July.
7.1.4. Exchange rate policy continued to adapt to the needs of the situation
With regard to exchange rate policy, the BCRA has complemented its structural objective of accumulating international reserves with a short-term strategy consisting of promoting a more efficient allocation of foreign currency through exchange rate regulation and adapting the volatility of the nominal exchange rate to the anti-inflationary strategy.
To meet these objectives, a series of exchange rate measures have been taken that complement or extend those taken during previous quarters. The requirement of prior conformity to access the foreign exchange market for the payment of imports of goods (in the case of operations for which this requirement is contemplated) and to make payments of financial debts abroad for those companies with scheduled capital maturities that operate between April 1, 2021 and December 31, 2021 and that operate between April 1, 2021 and December 31, 2021 and that are not subject to the foreign exchange was extended until the end of the year. exceed US$2 million per month70. For their part, companies that have a “Certification of increase in exports of goods in 2021” were exempted from the BCRA’s prior conformity requirement to access the foreign exchange market71.
As of July 12, it was established that in order to access the foreign exchange market, it must be recorded that neither in the previous or subsequent 90 days were or will be sales in the country of securities with settlement in foreign currency or exchanges of securities for other foreign assets or transfers to depository entities abroad. It should be noted that, if the client is a legal entity, the controlled and controlling parties are considered as the same unit72. It was also established that transactions for the purchase and sale of securities that are carried out with settlement in foreign currency must be paid by transfer of funds to and from accounts in the name of the client73, as the case may be in local or foreign financial institutions74. This provision is in line with international standards for the prevention of money laundering and tax avoidance and evasion, granting greater transparency to operations and improving their oversight by regulators of the payment system, the capital market, prevention of money laundering and taxation, being aligned with the recommendations of international organizations such as the Financial Action Task Force (FATF).
Finally, the BCRA and the Central Bank of Paraguay (BCP) agreed to enable the Local Currency System (SML) as a bilateral payment system between Argentina and the Republic of Paraguay, with the aim of facilitating transactions between the two countries in local currencies75.
With regard to the nominal exchange rate, the BCRA maintained a relatively limited rate of depreciation, with the aim of contributing to the disinflationary process. The lower dynamism of the exchange rate led to an appreciation of the Multilateral Real Exchange Rate Index (ITCRM) in the second quarter. In July, the evolution of emerging currencies against the dollar also helped to accelerate the real appreciation of the peso. Beyond this, the ITCRM remains at competitive levels and around the average of the last 24 years.
This set of exchange rate measures, together with those taken previously, have made it possible to strengthen the balance of International Reserves, whose main factor of expansion was the net purchase of foreign currency from the private sector and which so far this year has reached a value of close to US$7,400 million (See Figure 7.6). Additionally, at the close of this edition, the income of the allocation of Special Drawing Rights (SDRs), by the IMF to mitigate the effects of the pandemic, for a total of US$4,333 million was accounted for, with full impact on the balance of International Reserves, which stood at US$46,306 million as of August 23.
Figure 7.6 |
Nominal Exchange Rate Change
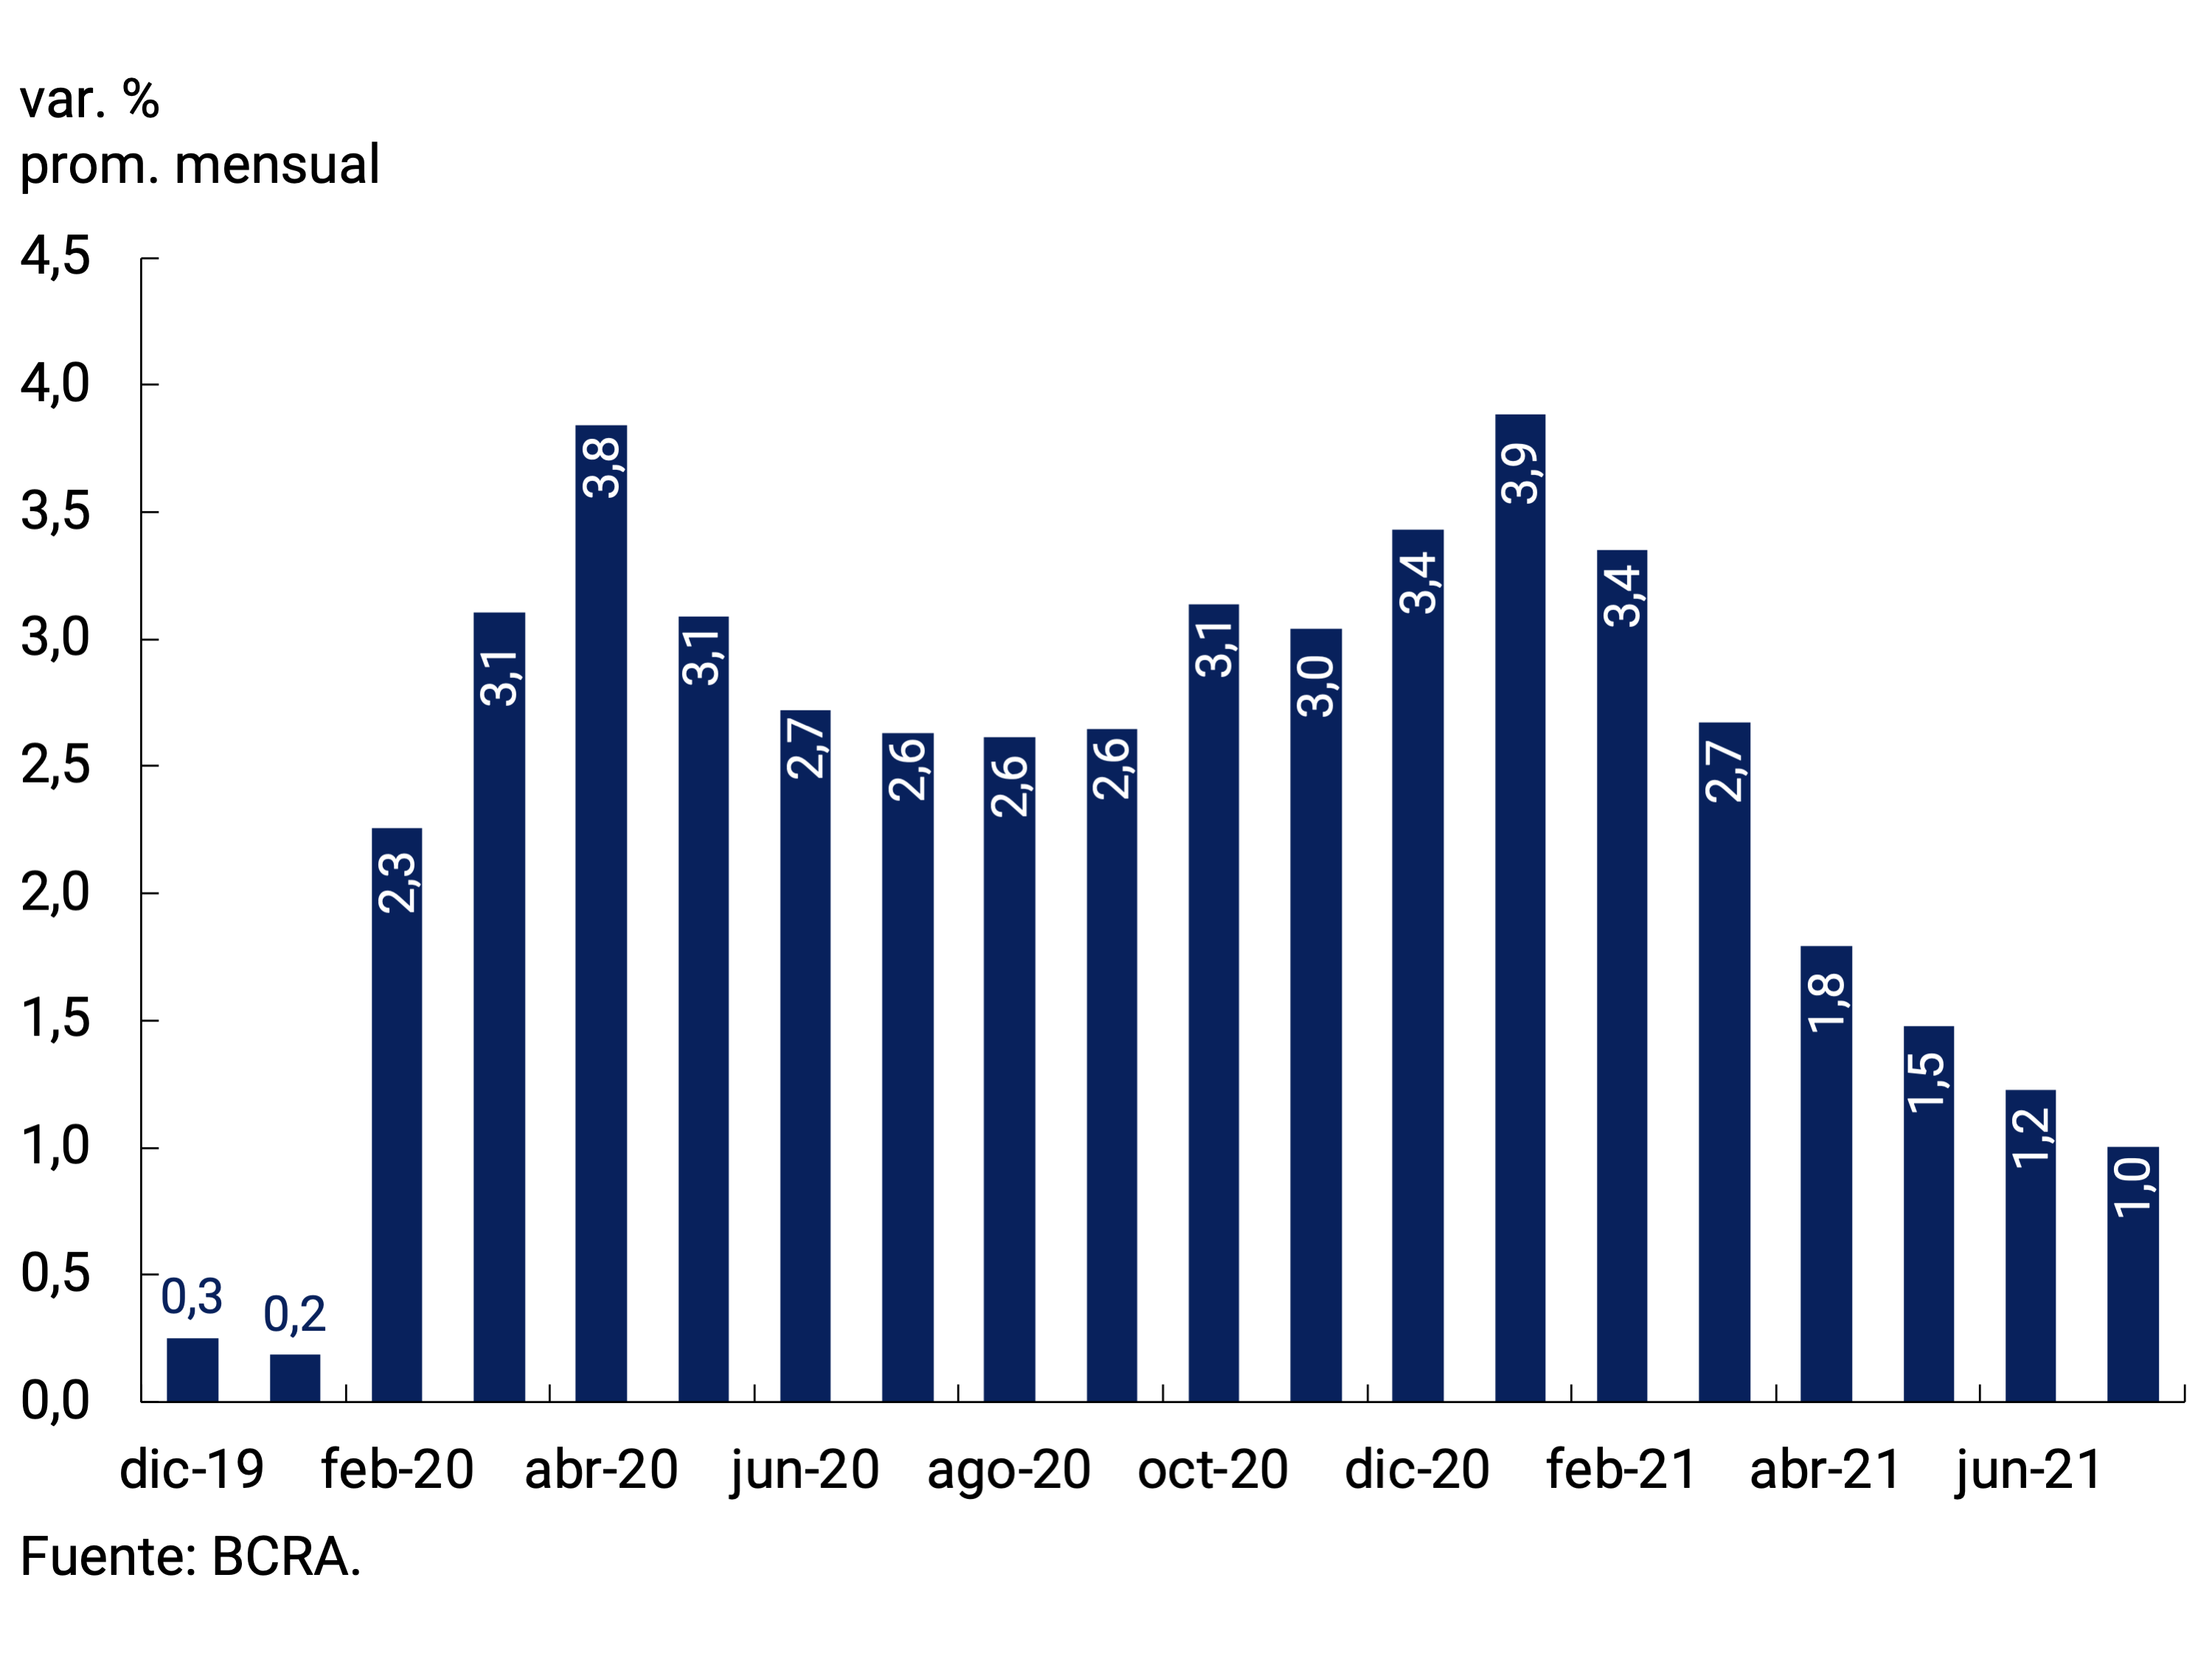
Variation of International Reserves Var. at the end of each quarter
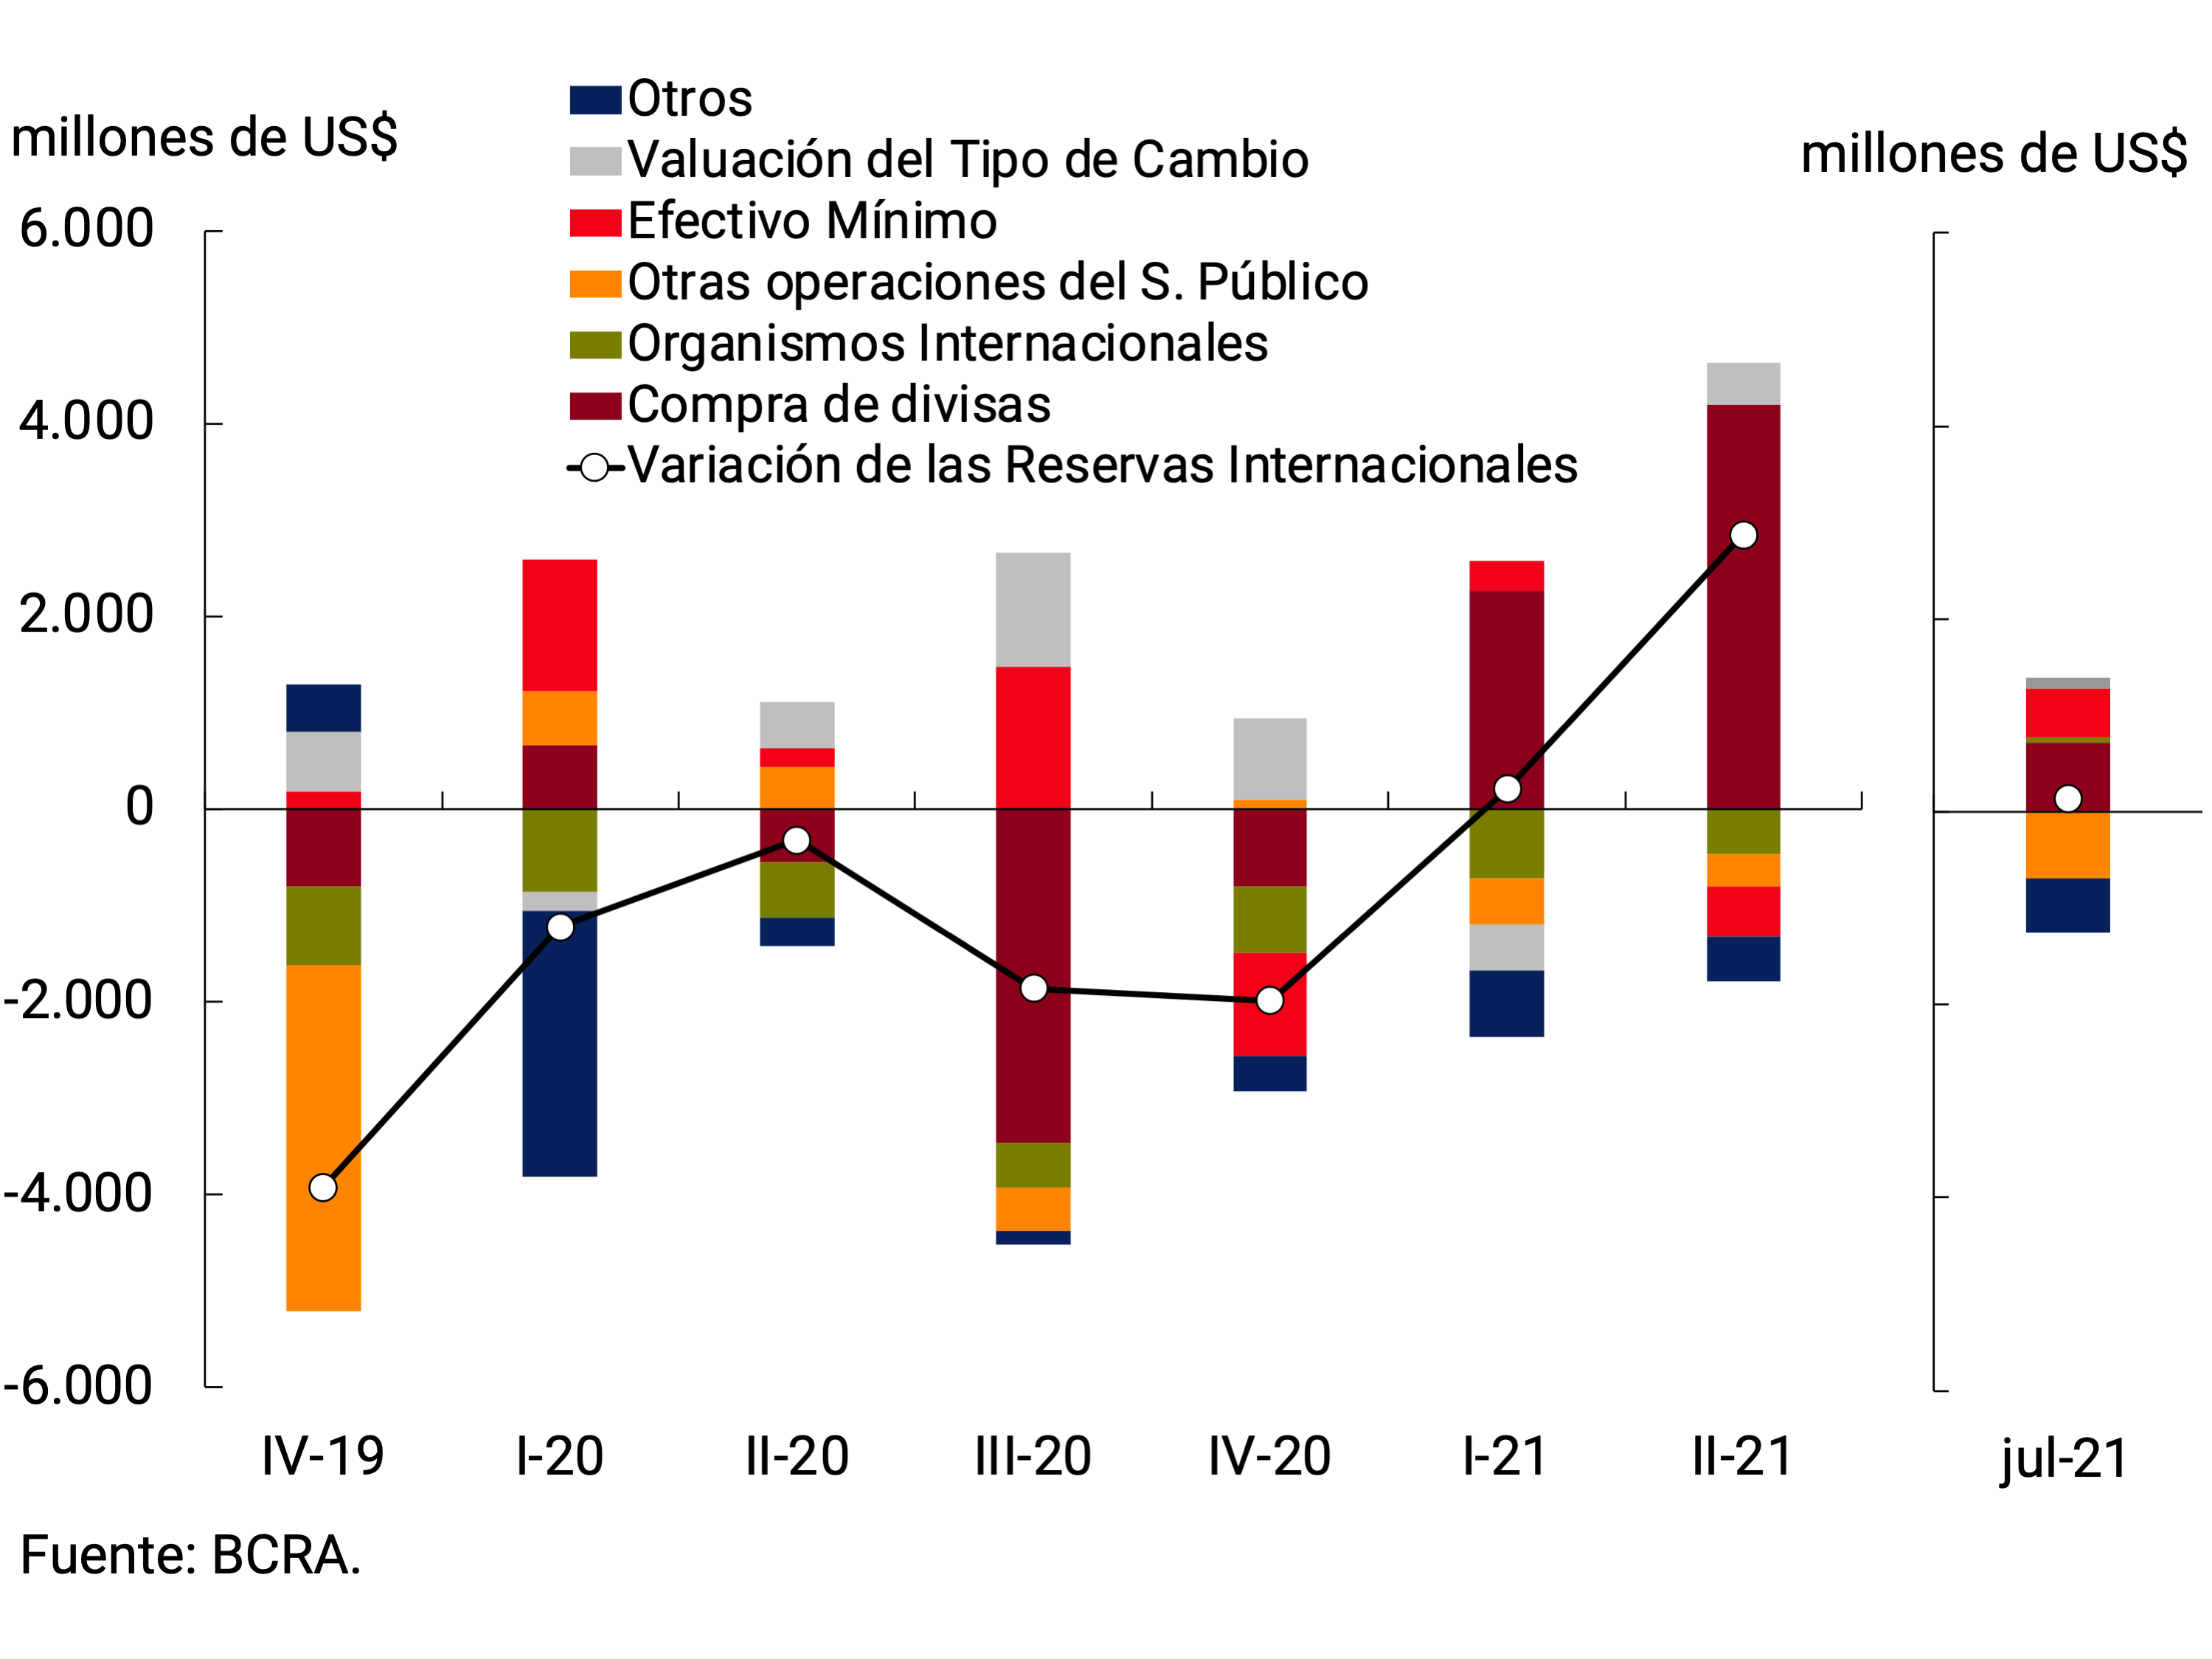
7.2. Monetary outlook for the remainder of the year
The resurgence of COVID-19 cases had a limited impact on the progress of the economy in the second quarter of the year. The increased availability of doses boosted the vaccination plan which, together with a more prepared health infrastructure, allowed the return to normality of a growing number of economic activities. This trend would continue to gain strength over the next few months.
On the other hand, after the successful restructuring of the debt in foreign currency, the National Government continues to move forward with the necessary actions to reestablish the sustainability of the public debt. To deepen liquidity in the capital market, the Central Bank began to operate in the public securities futures market. Meanwhile, at the end of June, an understanding was reached with the official creditors grouped in the Paris Club, through which the payment of some US$2,000 million was postponed until March 31, 2022. Specifically, in the eight-month period, a set of payments will be made that will total around US$430 million, and after this period aim at a more permanent restructuring of liabilities. The debt renegotiation agreement with the International Monetary Fund (IMF) still needs to be finalized, in order to set a more reasonable maturity schedule in accordance with the economy’s ability to pay.
The progress made in the reconstruction of the domestic debt market will allow the year to end with a lower level of financial assistance to the National Treasury than the previous year, as reflected in the 2021 National Budget. However, the BCRA will continue to calibrate the liquidity of the economy, sterilizing any monetary surpluses that may be observed in the short term. On the other hand, the policy of managed floating of the exchange rate will continue, encouraging the exchange rate dynamics to contribute to a gradual process of lowering the inflation rate.
With a medium-term vision, while the negative effects of the pandemic period dissipate and accompanying the recovery of the economy, monetary aggregates will continue to normalize their dynamics. In this new stage, it is expected that both the extraordinary financing needs of the National Treasury and the consequent sterilization effort will subside. This would favor the demand for the monetary base to be provided by the interest associated with the BCRA’s interest-bearing liabilities and, potentially, by a dismantling of the balance thereof. This process, together with economic growth, would contribute to reducing the relative weight of the BCRA’s Bills and Passes on its balance sheet and also with respect to the size of the economy, a trend that would be underpinned by a growing credit dynamic.
Section 1 / Towards the definition of a new international tax scheme
On 1 July 2021, 130 countries representing more than 90% of global GDP agreed to establish a plan to reform the international tax scheme and ensure that multinational companies pay the right taxes, regardless of where they operate. That agreement is the result of intense discussions over the past few years, and a great commitment by all parties to reach a consensual global solution.
To address the problem of tax avoidance by multinational companies, the international community had promoted the launch of the OECD/G20 Inclusive Framework on Base Erosion and Profit Shifting (BEPS) in 2013, which currently has 139 member countries or jurisdictions (see Figure 1). Having made significant progress in bringing more coherence and transparency to the international tax system, in 2018 the G20 tasked it with seeking a global solution to the challenges posed by the digitalisation of the economy.
Graph 1 | Geographical distribution of the 139 members of the Inclusive Framework
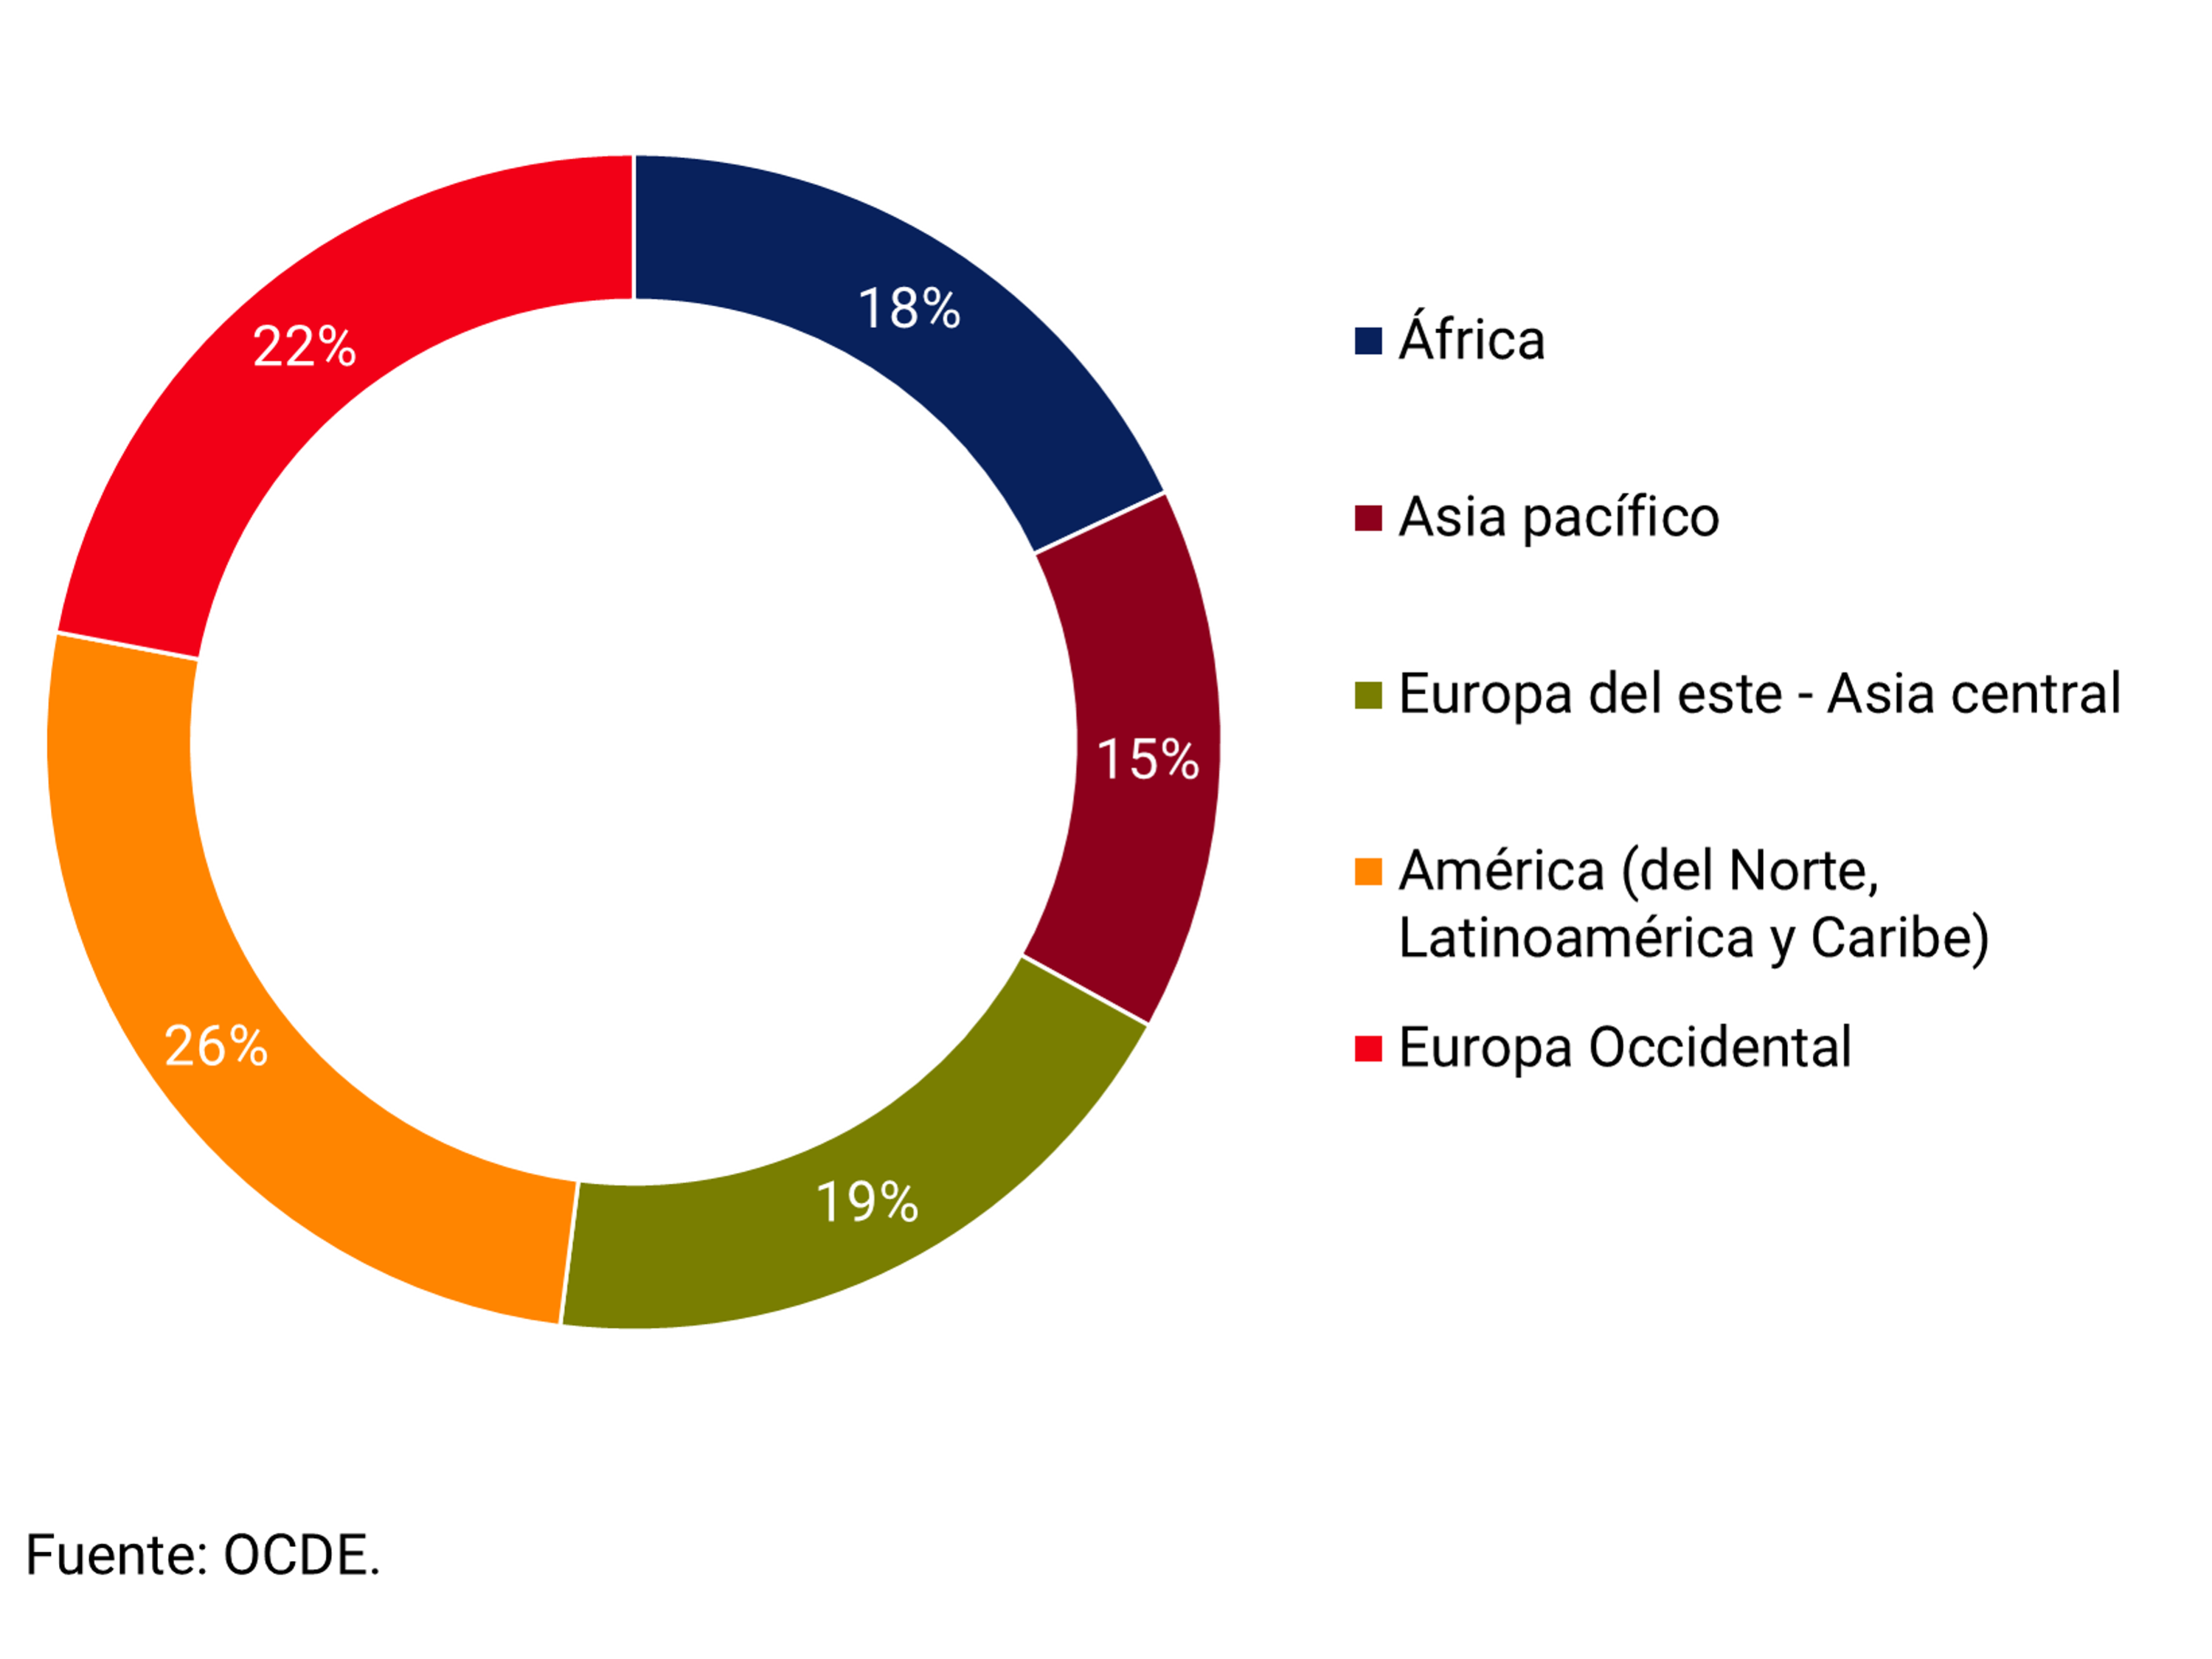
The plan that was agreed upon consists of two pillars. The first pillar aims to ensure a fairer distribution of the profits of the largest multinational companies, which are the winners of globalization, and the tax rights of countries. The second pillar seeks to put a floor on tax competition by introducing a minimum rate for corporate income tax at the global level.
While there are still a number of points and details on which the members of the Inclusive Framework need to agree, and there are still a small number of countries that have not yet acceded, the agreement is scheduled to be finalized in October 2021. During 2022, an implementation plan, model legislation, guidelines and the signing of a multilateral treaty is expected, which will finally enter into force only in 2023.
Map 1 | Countries that adhered to the two-pillar tax plan
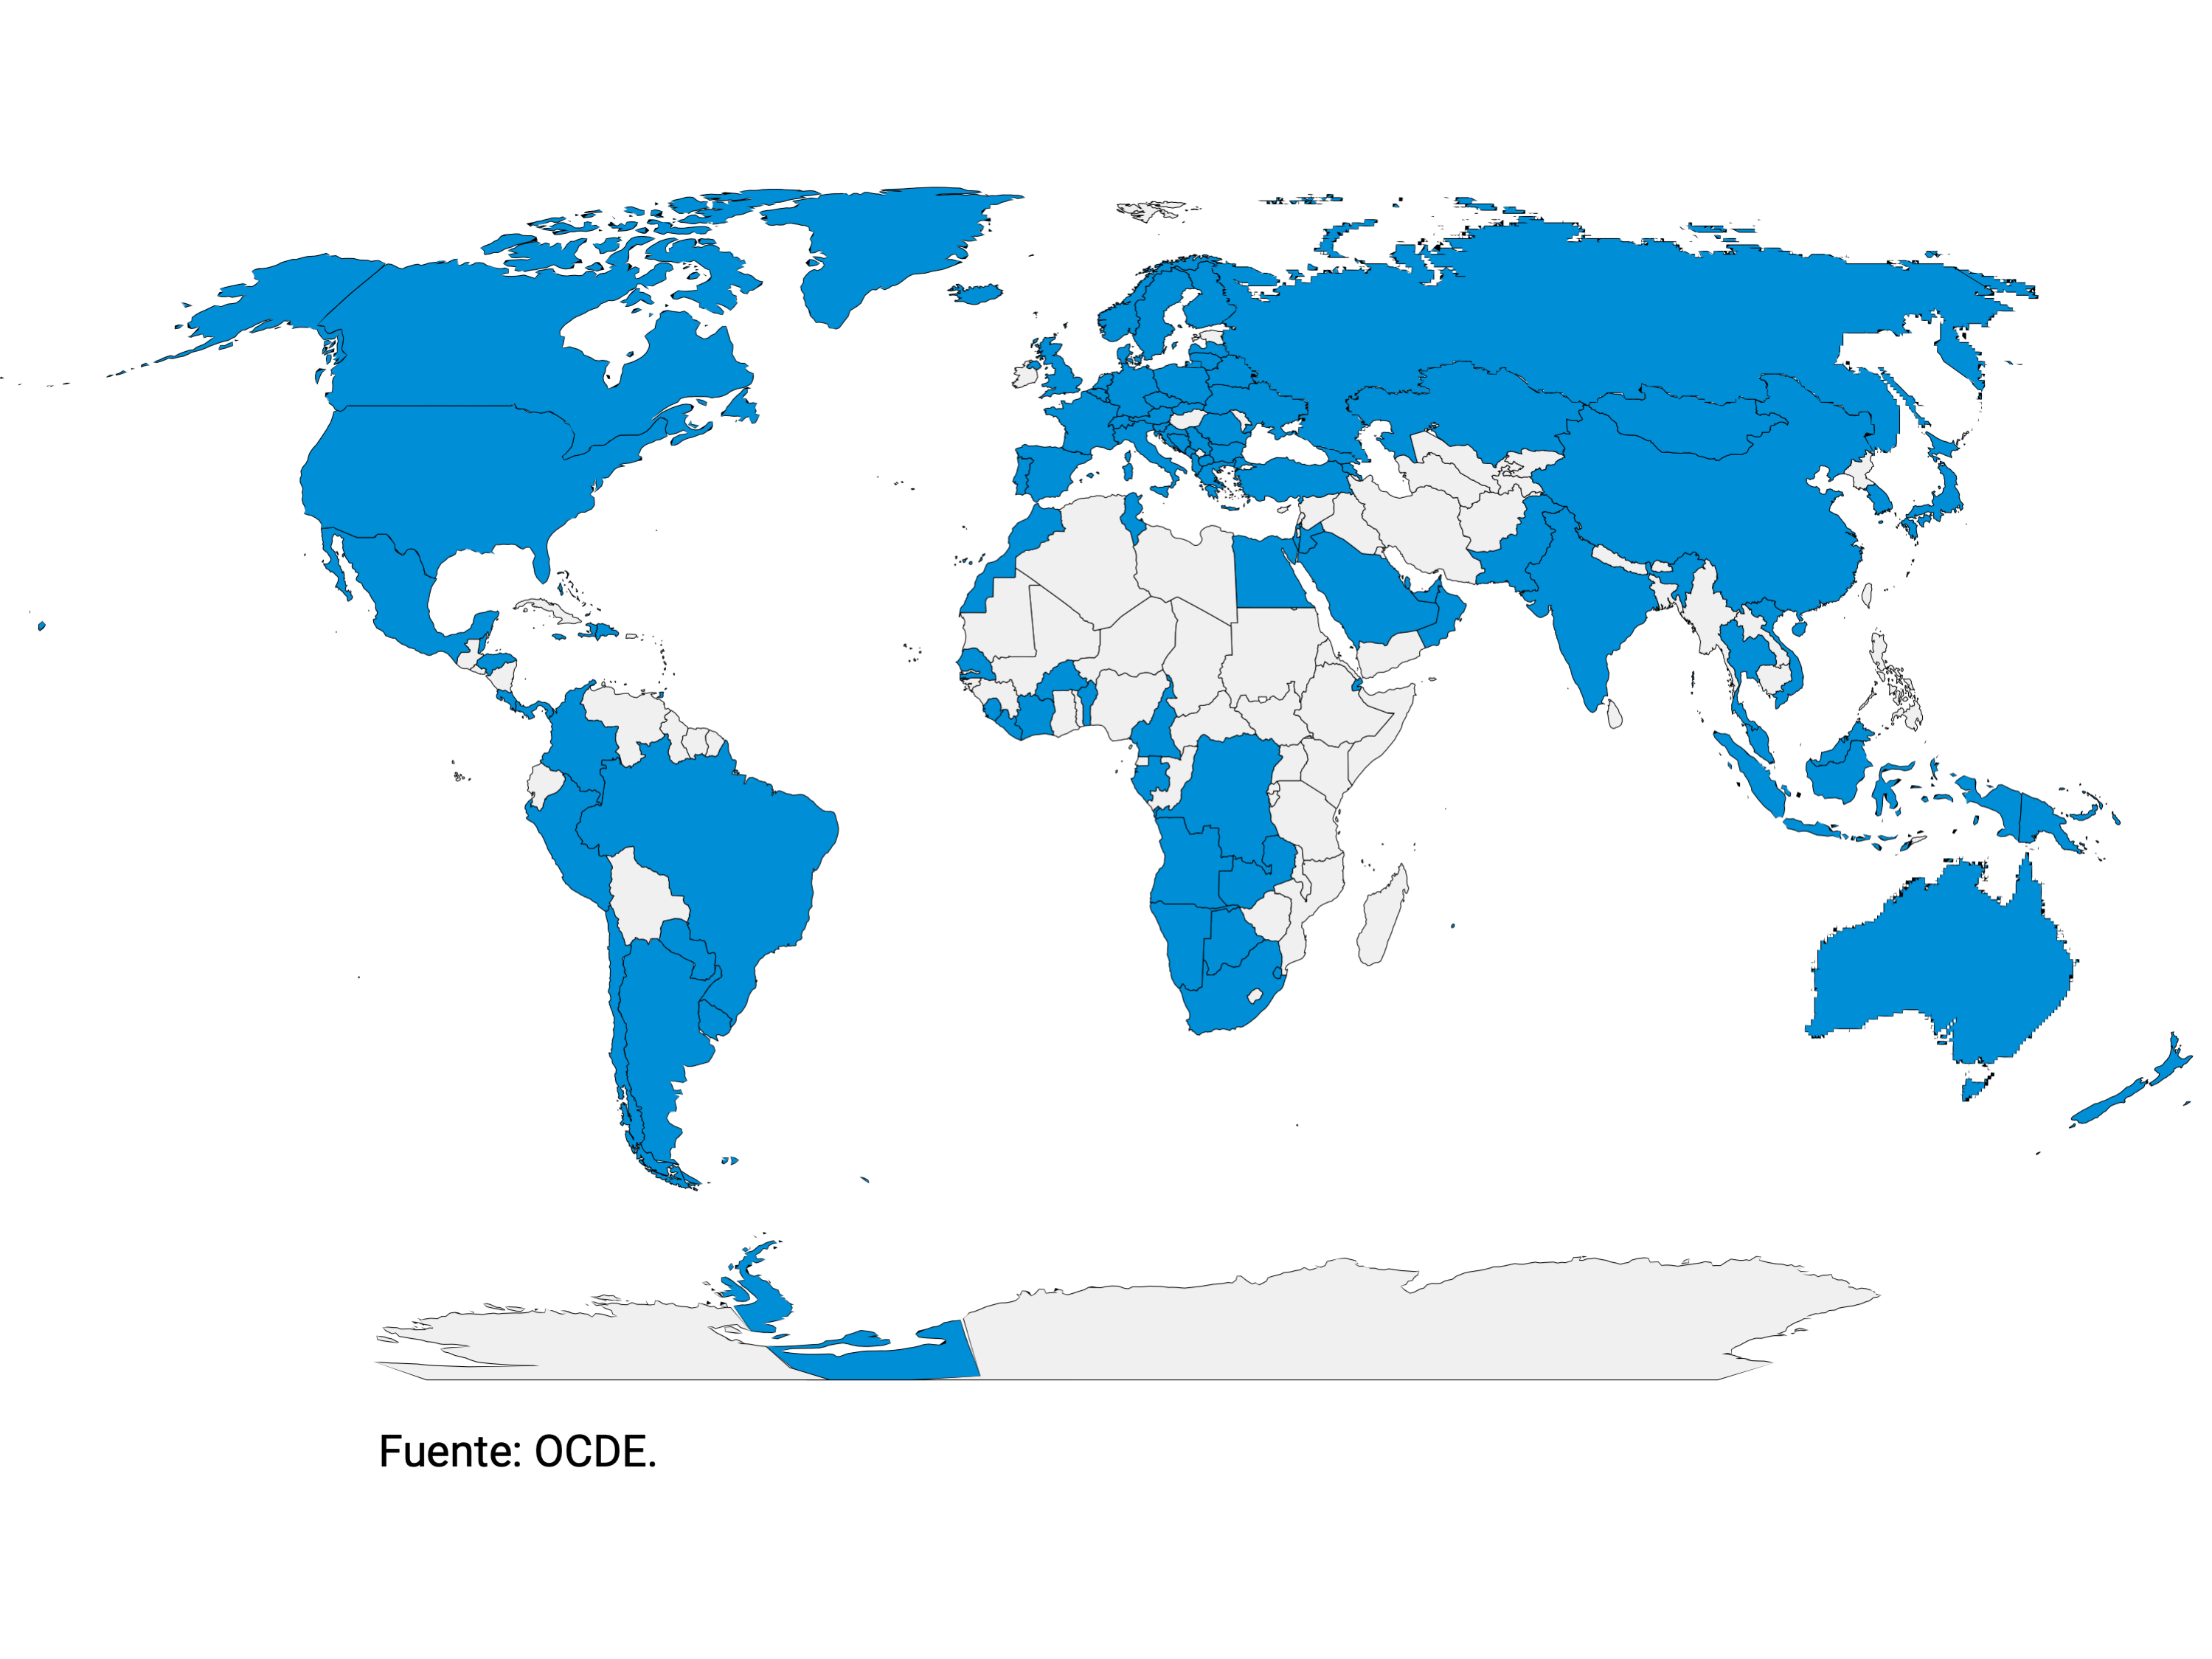
The need to have the tax scheme updated, according to the challenges of the digitalization and globalization of the economy
“Taxes are as old as civilization, and so are efforts to escape them,” International Monetary Fund Managing Director Kristalina Georgieva said recently. She gave as an example the historic window taxes, established in Britain in the eighteenth century as a non-intrusive mechanism for taxing income, but which encouraged many windows to be boarded up, which resulted in many families living with worse ventilation and without natural light (see Georgieva (2021)). To avoid taxes on global corporations, companies move profits between jurisdictions or look for some other mechanism to avoid paying. Well-designed taxes should minimize this type of behavior.
International tax arrangements were based on century-old agreements and a global network of bilateral treaties. These established that the profits of a foreign company could only be taxed in another country where the company had a physical presence, which made sense when the business model was based on the production and distribution of physical goods, with factories and warehouses. But in today’s digital world, many multinational companies do business in jurisdictions where they don’t have any physical presence. This has allowed internet giants, and many other companies, to avoid taxes by filing the most valuable intangible assets and transferring their profits to lower-tax countries.
In addition, many countries, especially developing countries, have been inclined to enter into a tax competition, trying to offer the lowest taxes to attract more foreign direct investment. In this context, the plan aims to put an end to what Janet Yellen, the US Secretary of the Treasury, recently referred to as a race to the bottom (see Yellen (2021)).
A two-pillar solution to address the challenges of the digitalisation of the economy
Pillar One
Pillar One seeks to update outdated international tax rules by establishing that countries will have tax rights on multinational companies, even if they do not have a physical presence in their jurisdictions.
It states that between 20% and 30% of the profits of the 100 largest and most profitable multinational companies that exceed a pre-set margin (10% of the companies’ revenues) will be reallocated to the jurisdictions where the users and customers of those companies are located.
It also seeks to ensure the prevention and resolution of disputes that may arise for any double taxation conflict.
Finally, it implies a high withdrawal of unilateral measures, which avoids trade disputes that end up being harmful.
According to an OECD study (see OECD (2020)), Pillar One is estimated to lead to an increase in corporate income tax collection of around 1% on average in developing countries.
Pillar Two
Pillar Two establishes a minimum tax on corporate profits, putting a floor on tax competition.
It was agreed to establish a tax on the profits of multinational companies based in its jurisdiction with an aliquot of at least 15%.
This would mean that tax competition would now be limited by a minimum level of taxation wherever a multinational operates.
It is estimated that with a minimum rate of 15% the global minimum tax will generate around US$150 billion of tax revenue per year (see OECD (2020)).
A more predictable environment is beneficial for investment and growth
The agreed two-pillar package, by providing tax certainty, contributes to creating a more favorable environment for investment and growth. Otherwise, it would lead to a proliferation of unilateral and uncoordinated fiscal measures, and an increase in tax and trade disputes that would end up being harmful.
On the other hand, it is possible to establish a global level playing field, stopping the race to the back. From now on, countries, instead of competing for who offers the lowest tax rate, will be able to concentrate their efforts on competing on the basis of their economic fundamentals: the ability of their workforce, the ability to innovate, and the strength of legal and economic institutions (see Yellen (2021)). In addition, this agreement will provide countries with the capacity to raise the necessary funds to be able to provide such important public goods as infrastructure, research and development, and education.
References
Aslam, A. and Coelho, M. (2021) The Benefits of Setting a Lower Limit on Corporate Taxation, IMF Blog, International Monetary Fund, Washington DC.
Georgieva, K. (2021) Opening Remarks on the Virtual Book Launch: Corporate Income Taxes Under Pressure, International Monetary Fund, Washington DC.
OECD (2020), Tax Challenges Arising from Digitalisation – Economic Impact Assessment: Inclusive Framework on BEPS, OECD/G20 Base Erosion and Profit Shifting Project, OECD Publishing, Paris.
OECD (2021) Addressing the tax challenges arising from the digitalisation of the economy, OECD/G20 Base Erosion and Profit Shifting Project, OECD Publishing, Paris.
Yellen, J. (2021) Transcript of the Press Conference following the close of the G20 Finance Ministers and Central Bank Governors Meetings, Venice.
Section 2 / OECD monitors economic activity on a weekly basis
The Organization for Economic Cooperation and Development (OECD) developed a new indicator to monitor the evolution of economic activity in real time, whose particularity is that it is based on searches made through the Internet, through the Google Trends application. The calculation is made for the 46 countries that make up the OECD and the G-20, including Argentina, and is available weekly23.
In addition to the mobility of people, which was a widely disseminated indicator on a global scale to quantify the impact of the pandemic, the OECD tracks a wide list of items that together have a great predictive power of the evolution of activity. Of the 1,200 search categories available on Google Trends, about 250 very relevant ones were selected for economic analysis and country-specific topics were introduced. For example, within consumption, in reference to the demand for new cars, the brand of the best-selling vehicle in each country was incorporated. Topics related to the labor market, real estate activity, financial services, leisure and recreation, poverty, confidence and new consumer habits, among others, were included.
The massive and high-frequency data provided by the widespread and daily use of technology, better known as big data, requires an adequate selection and processing process prior to its processing and non-traditional computer applications since, by definition, it is a huge scale of information in terms of volume, variety and speed.
In the case of this OECD activity indicator, each Internet search variable is treated before being incorporated into the GDP estimation model, which basically consists of extracting a common long-term trend, adjusting the series for seasonal factors and correcting for interruptions in the information. The selected variables are then transformed into year-on-year rates of change. From this broad set of information, signals are extracted about the performance of the different facets of macroeconomics by means of a machine learning algorithm (specifically neural networks24). This algorithm allows capturing non-linear relationships between variables and changes in GDP in each country, which are difficult to estimate using traditional econometric approaches.
The weekly indicator is obtained in two steps. First, a quarterly frequency model is estimated to adjust the variations in the intensities of Google searches with the variations in GDP. Secondly, using the same elasticities estimated in the quarterly model, the weekly frequency indicator25 is generated.
The results of the OECD indicator can be interpreted as the change in GDP in the week of publication compared to the same week last year. Given the magnitude of the massive shock caused by the pandemic between February and April 2020, the year-on-year changes a year later became difficult to interpret, so the year-on-year change in weekly GDP in relation to two previous years also began to be published. A counterfactual result is also published, calculated as the percentage deviation of weekly GDP from its previous trend based on the OECD’s two-year economic outlook in November 201926.
Graph 1 | Selected countries in Latin America. OECD tracker and monthly indicators of economic activity
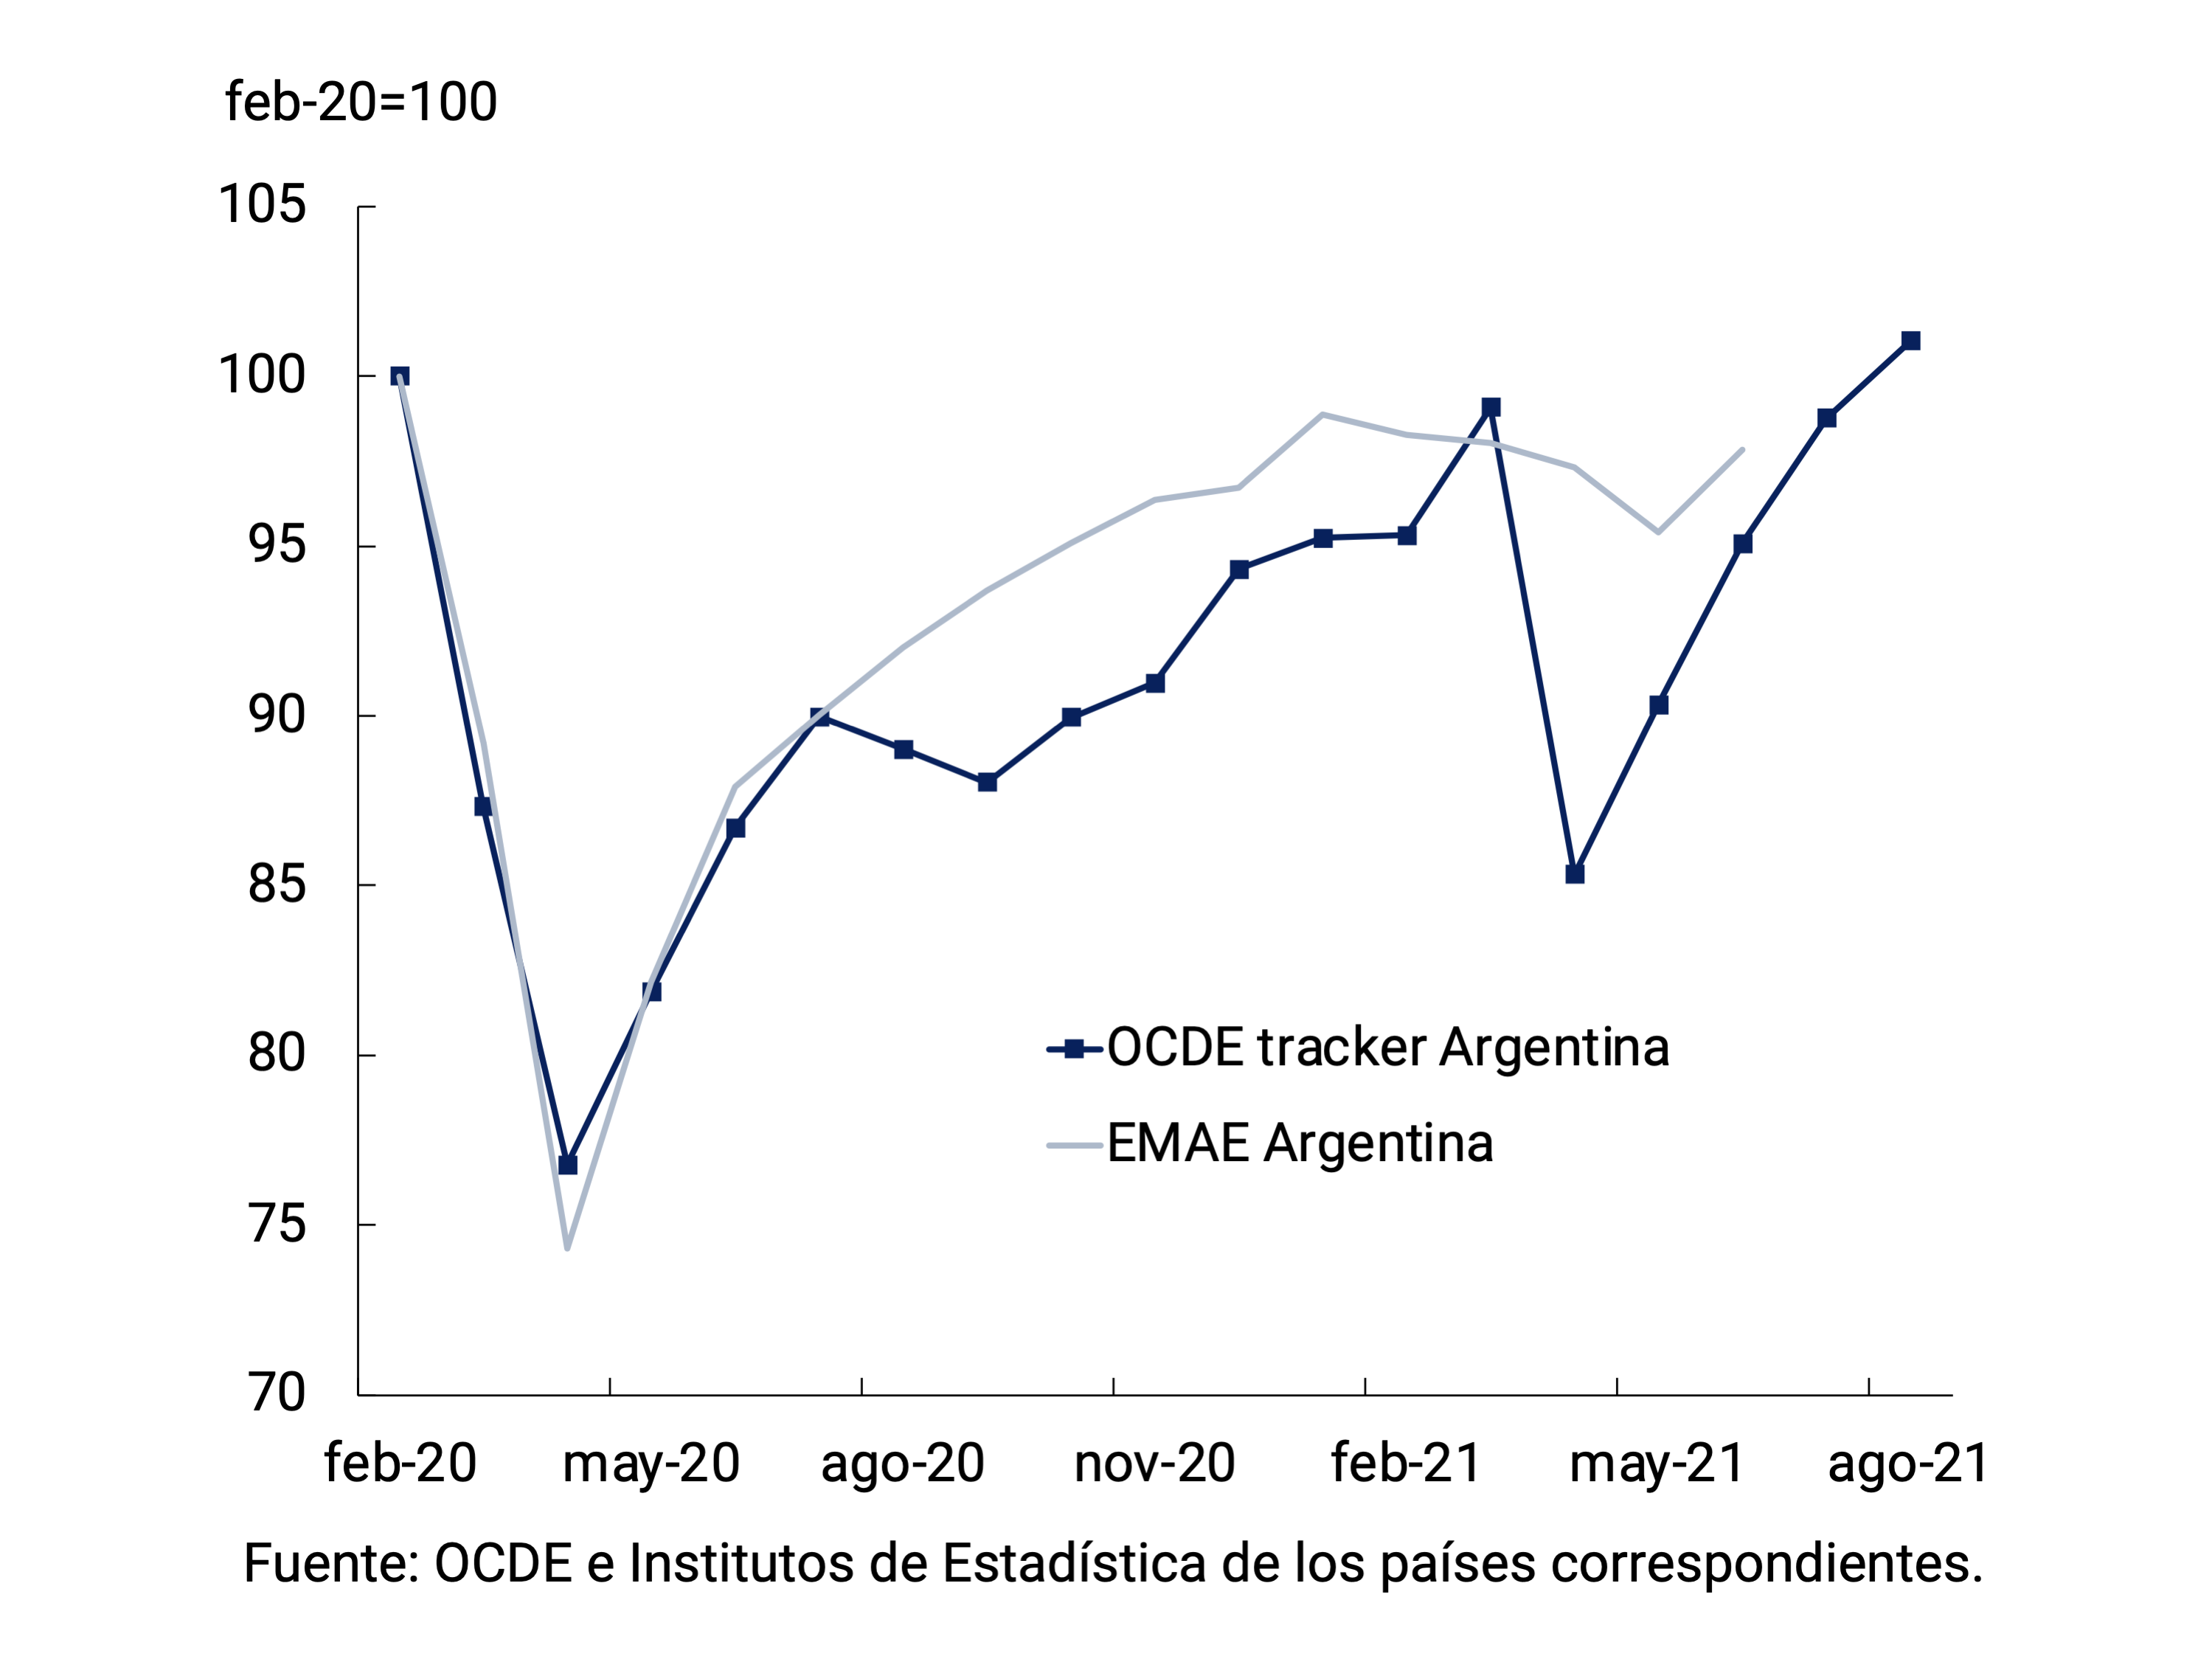
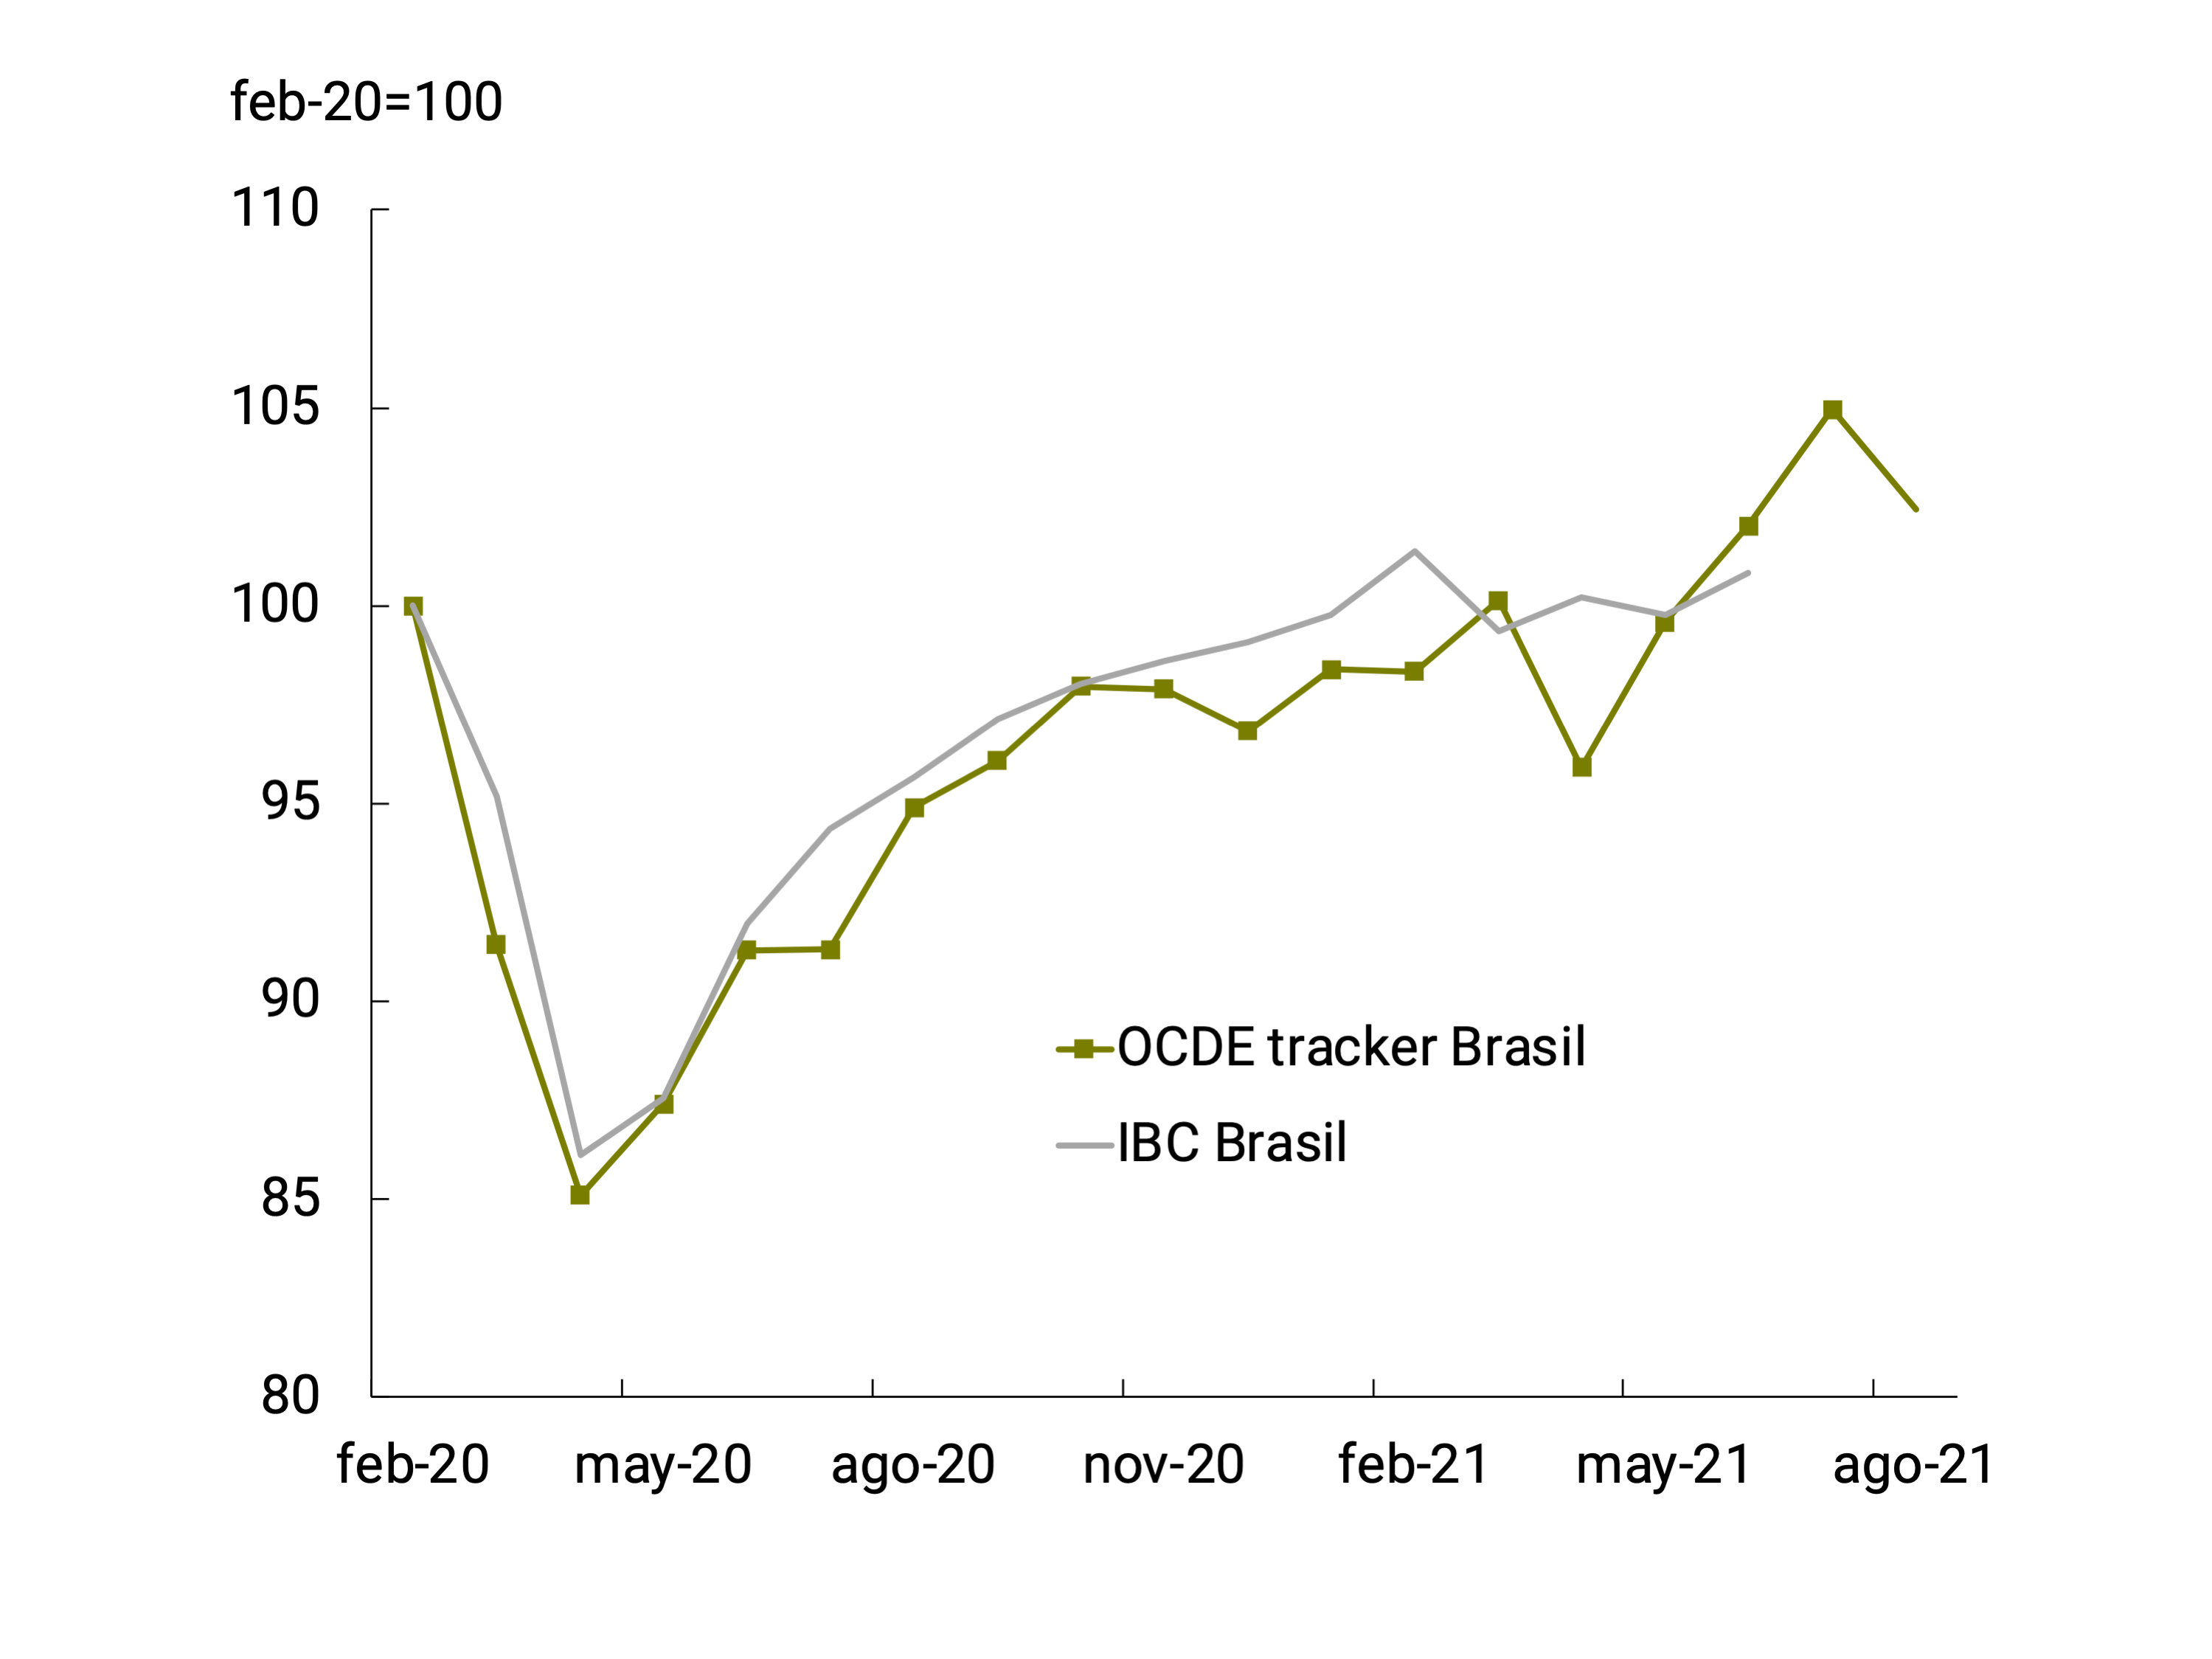
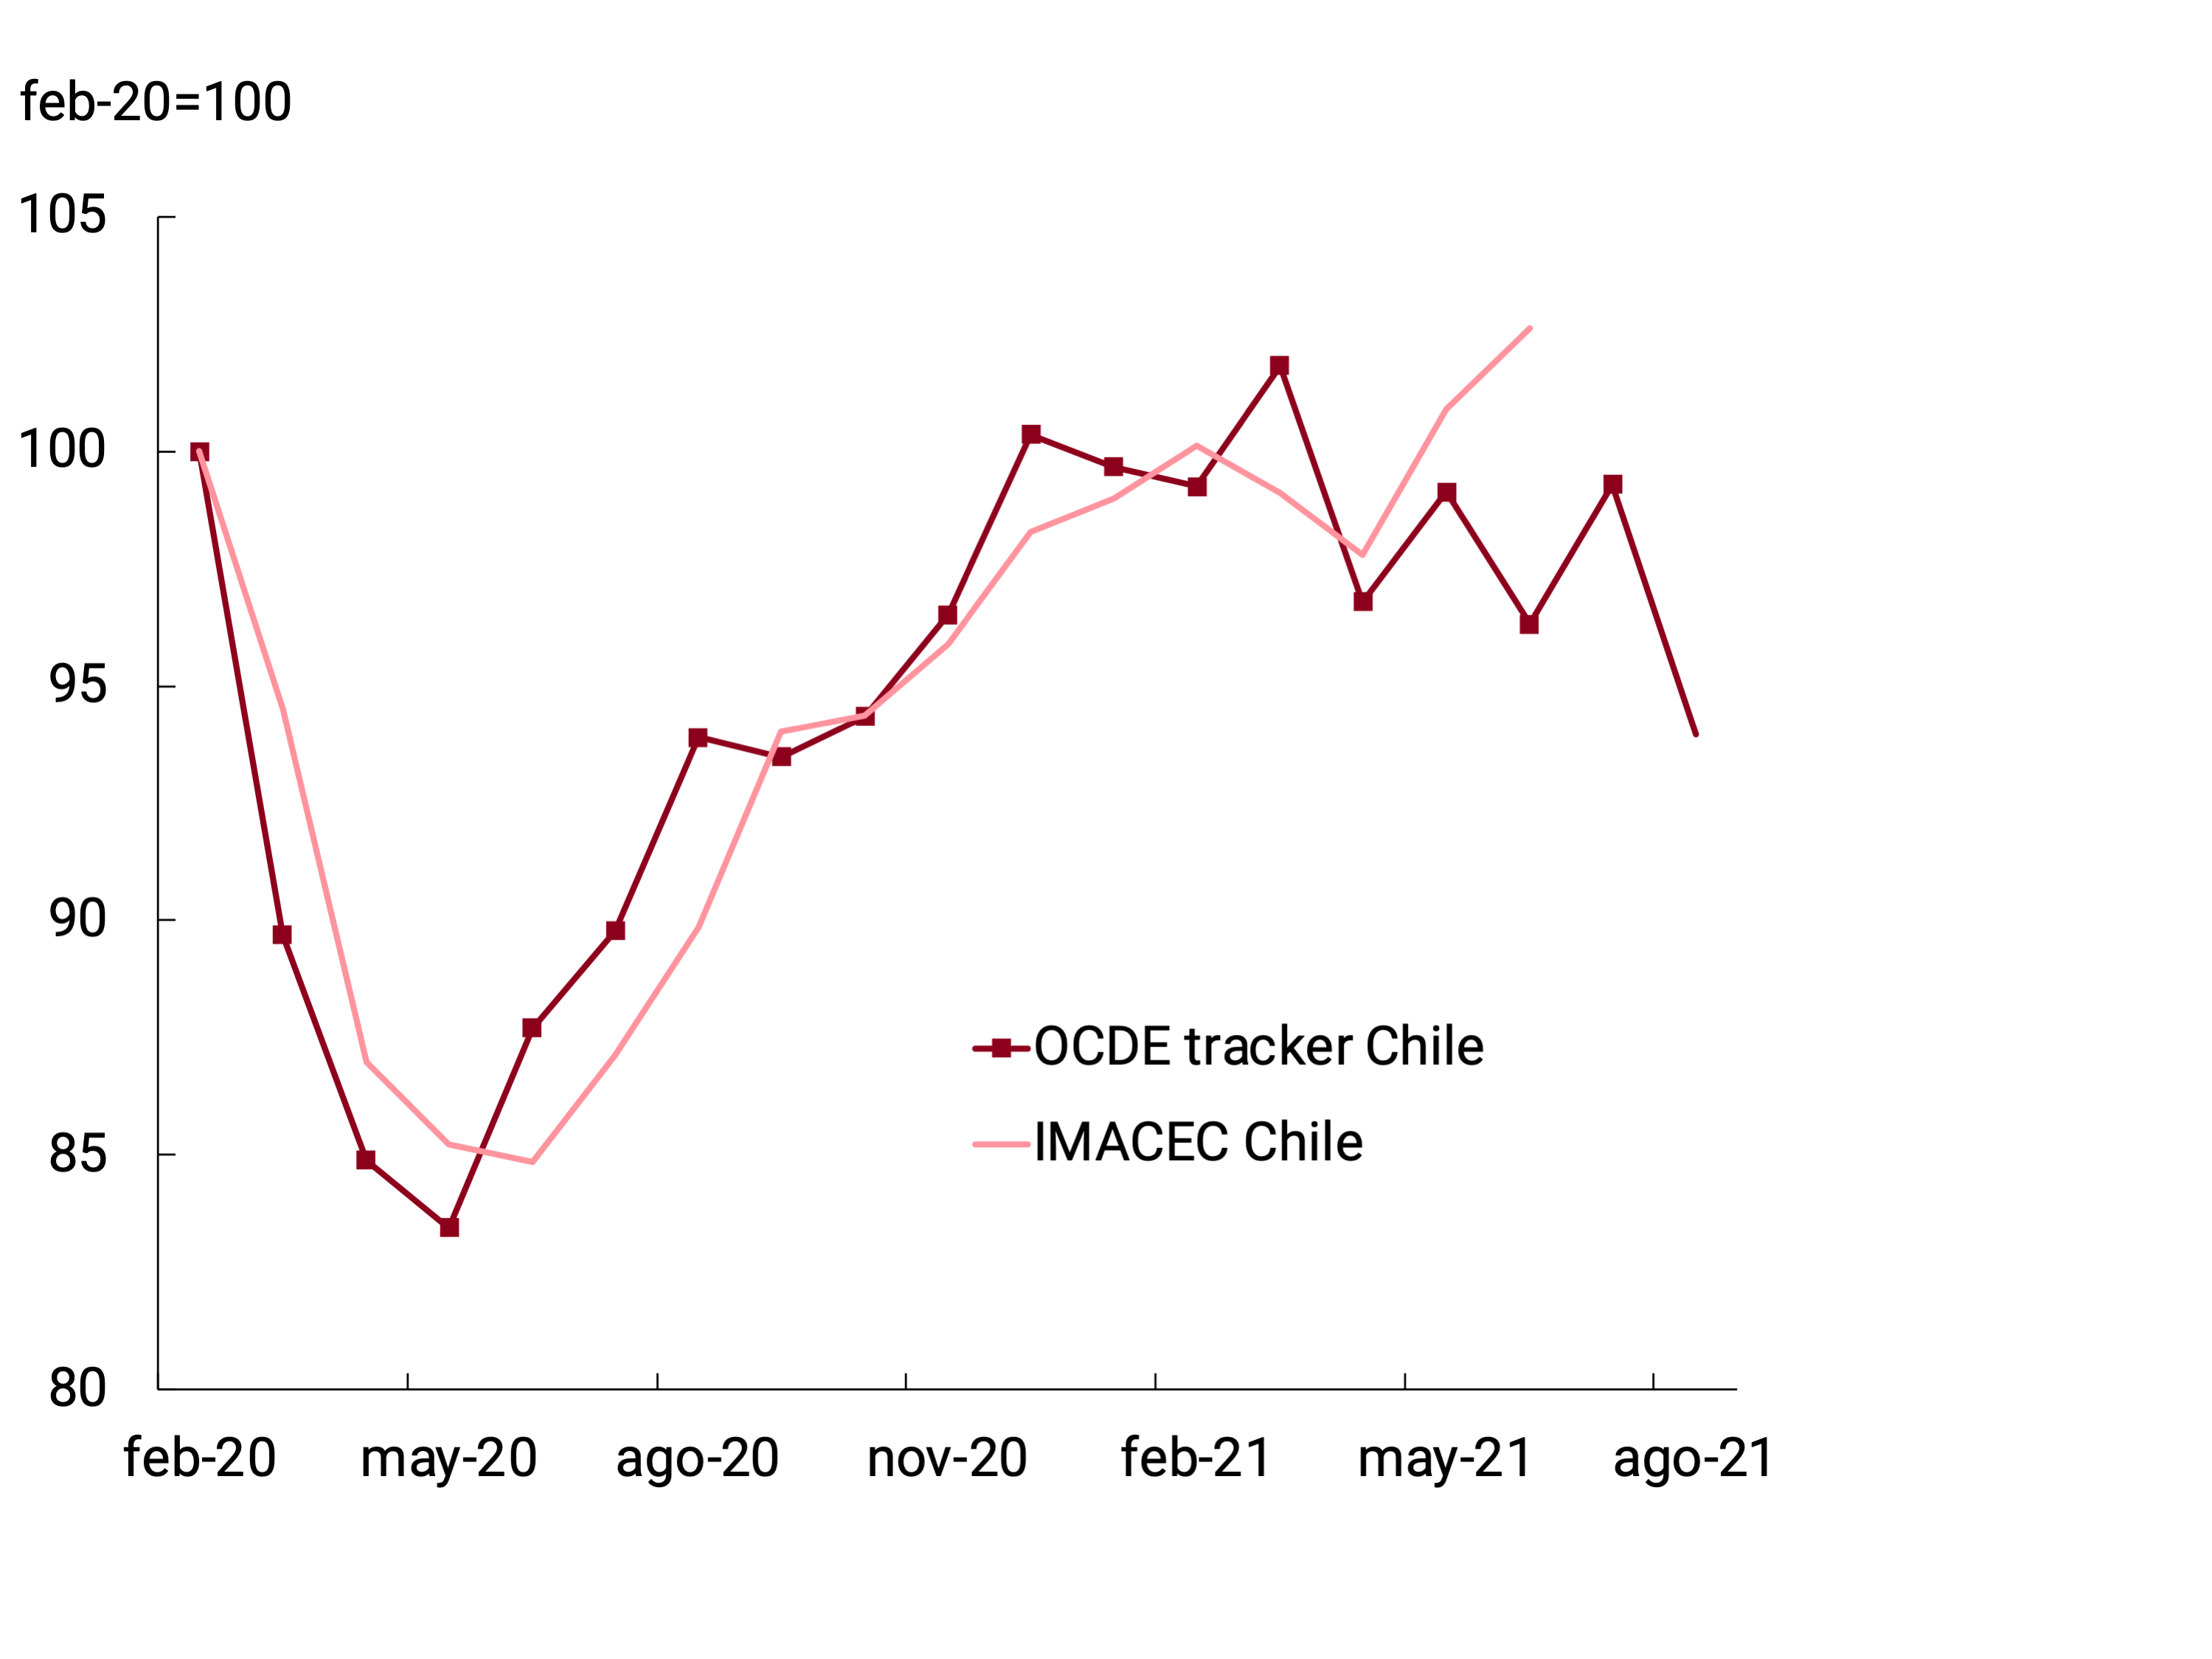
A common feature across countries is that the drop in activity was so abrupt at the beginning of the COVID-19 crisis that it cannot be adequately captured by monthly frequency indicators. The OECD’s Weekly Indicator, as well as the mobility indicators released by Google, show the impact and intensity of restrictions. Although the variations that can be deduced from the indicator do not anticipate with absolute precision the evolution of economic activity, they provide information that can be valuable to incorporate into a comprehensive analysis (see Graph 1).
The OECD indicator – which according to the organization does not constitute an official projection – has performed as a good predictor of the sign of the variation in Argentina’s economic activity, having anticipated with significant precision its bottom in April 2020 and its subsequent recovery as of May last year27. In June 2021, the average of this high-frequency indicator showed a considerable improvement compared to the previous month, recovering the level of last April, and sustained the recovery in July and August, suggesting a possible auspicious dynamic of economic activity at the margin (see Graph 2).
Graph 2 | Argentina. OECD tracker and EMAE

As with other high-frequency leading and partial indicators, the OECD indicator adds a tool for the analysis of the situation in pseudo-real time (nowcasting)28 . The use, with proper processing, of the traces of digital information left by Google searches, adds an extraordinary possibility of expanding the diversity of facets of economic activity that can be analyzed, by making information available in a more timely manner than the – in any case valuable and more accurate – traditional statistics. It is advisable that the analysis be complemented with a perspective that contemplates a broader set of information, always subject to the formed judgment and experience of specialized analysts.
Section 3 / Main features of the labour market recovery
The outbreak of the COVID-19 pandemic and the implementation of health measures to mitigate it during 2020 generated a strong imbalance in the labor market, the most profound effect of which was observed in the second quarter of 202029. From that moment on, the labour market began to normalise, subject to epidemiological evolution and health protocols, and driven by monetary and fiscal stimulus policies. This section presents some of the unprecedented characteristics of this recovery process.
The increase in the activity rate, employment and the decrease in the unemployment rate referred to in Chapter 3. Economic Activity and Employment results from dissimilar behaviors in the different segments of the labor market. Among the occupational categories, self-employment was the most dynamic (see Graph 1). A plausible explanation for this phenomenon could lie in the fact that the disaffection of informal wage earners by their employers has led the former to venture into self-employment and in turn the latter also move into this category because they no longer have their employees. The fall in self-employment and the increase in informal employers and wage earners observed during the first quarter of 2021 could also be an indication of the transitory nature of this effect. On the other hand, formal wage earners, favored by the policies of the National Government and the BCRA in the emergency (Emergency Assistance to Work and Production and soft loans, among others), were the least affected and during the first quarter of 2021 their level of employment recovered, exceeding pre-pandemic records30.
Graph 1 | Employment trends by occupational category, gender and age
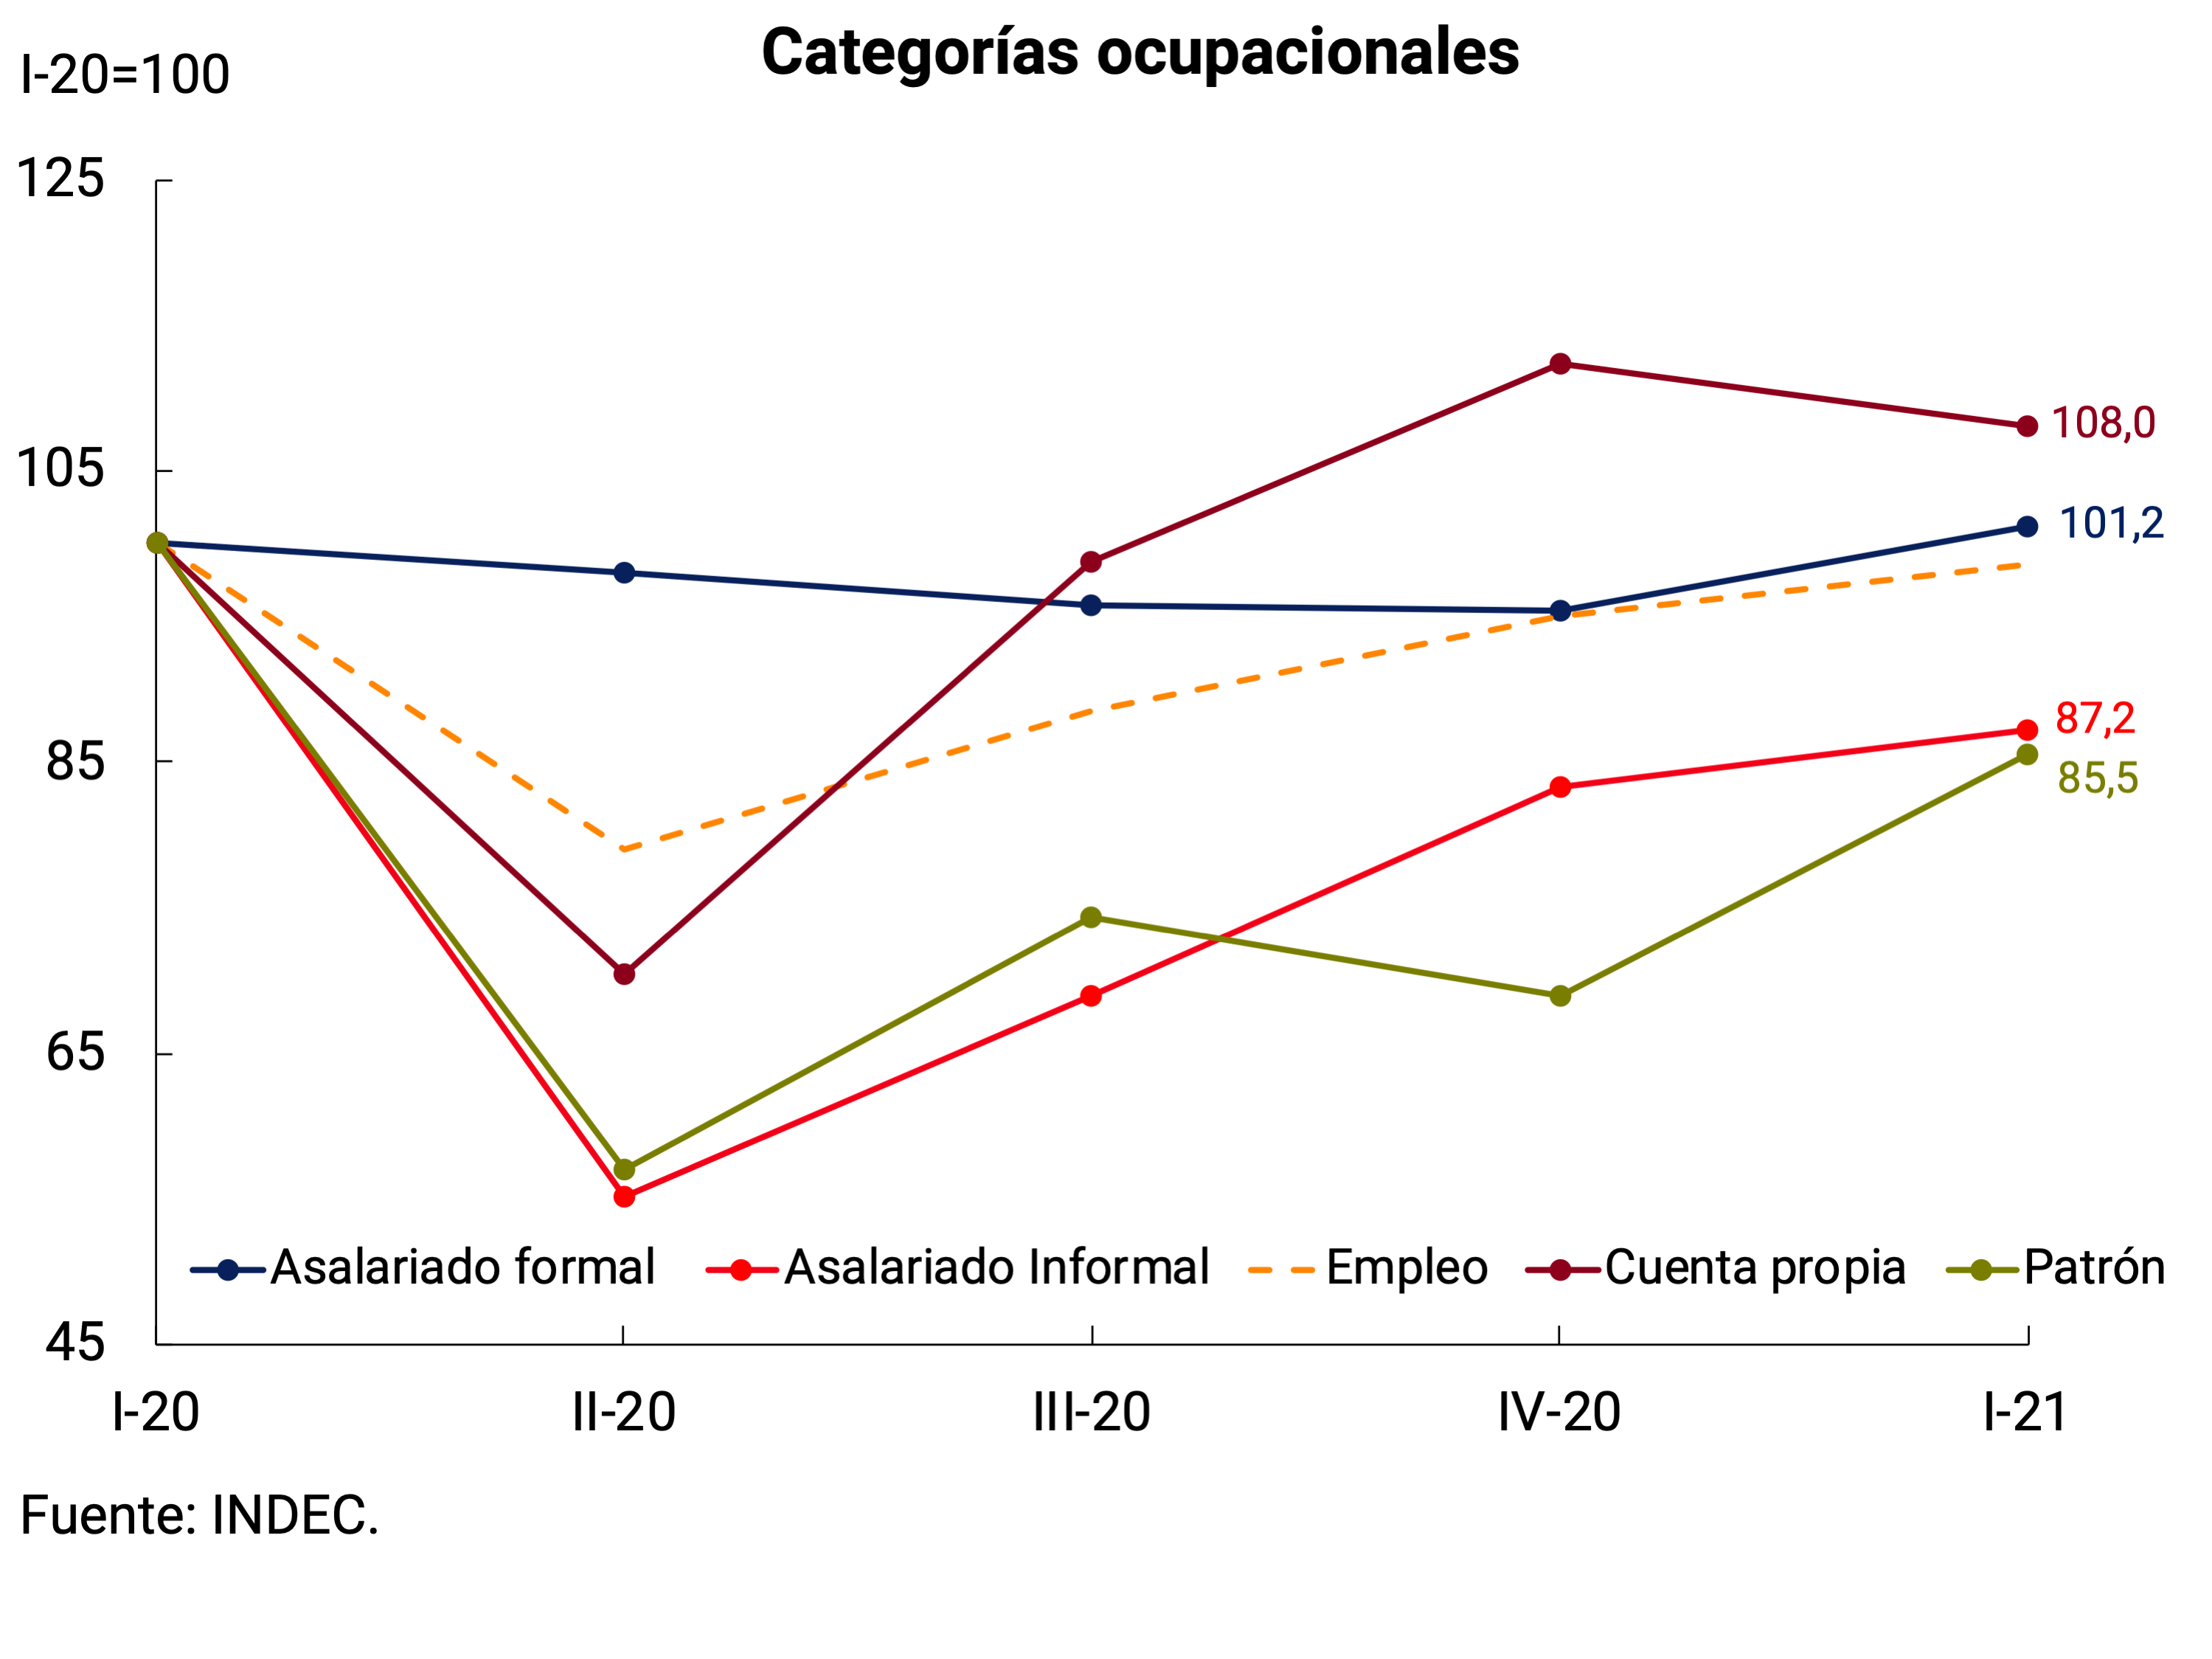
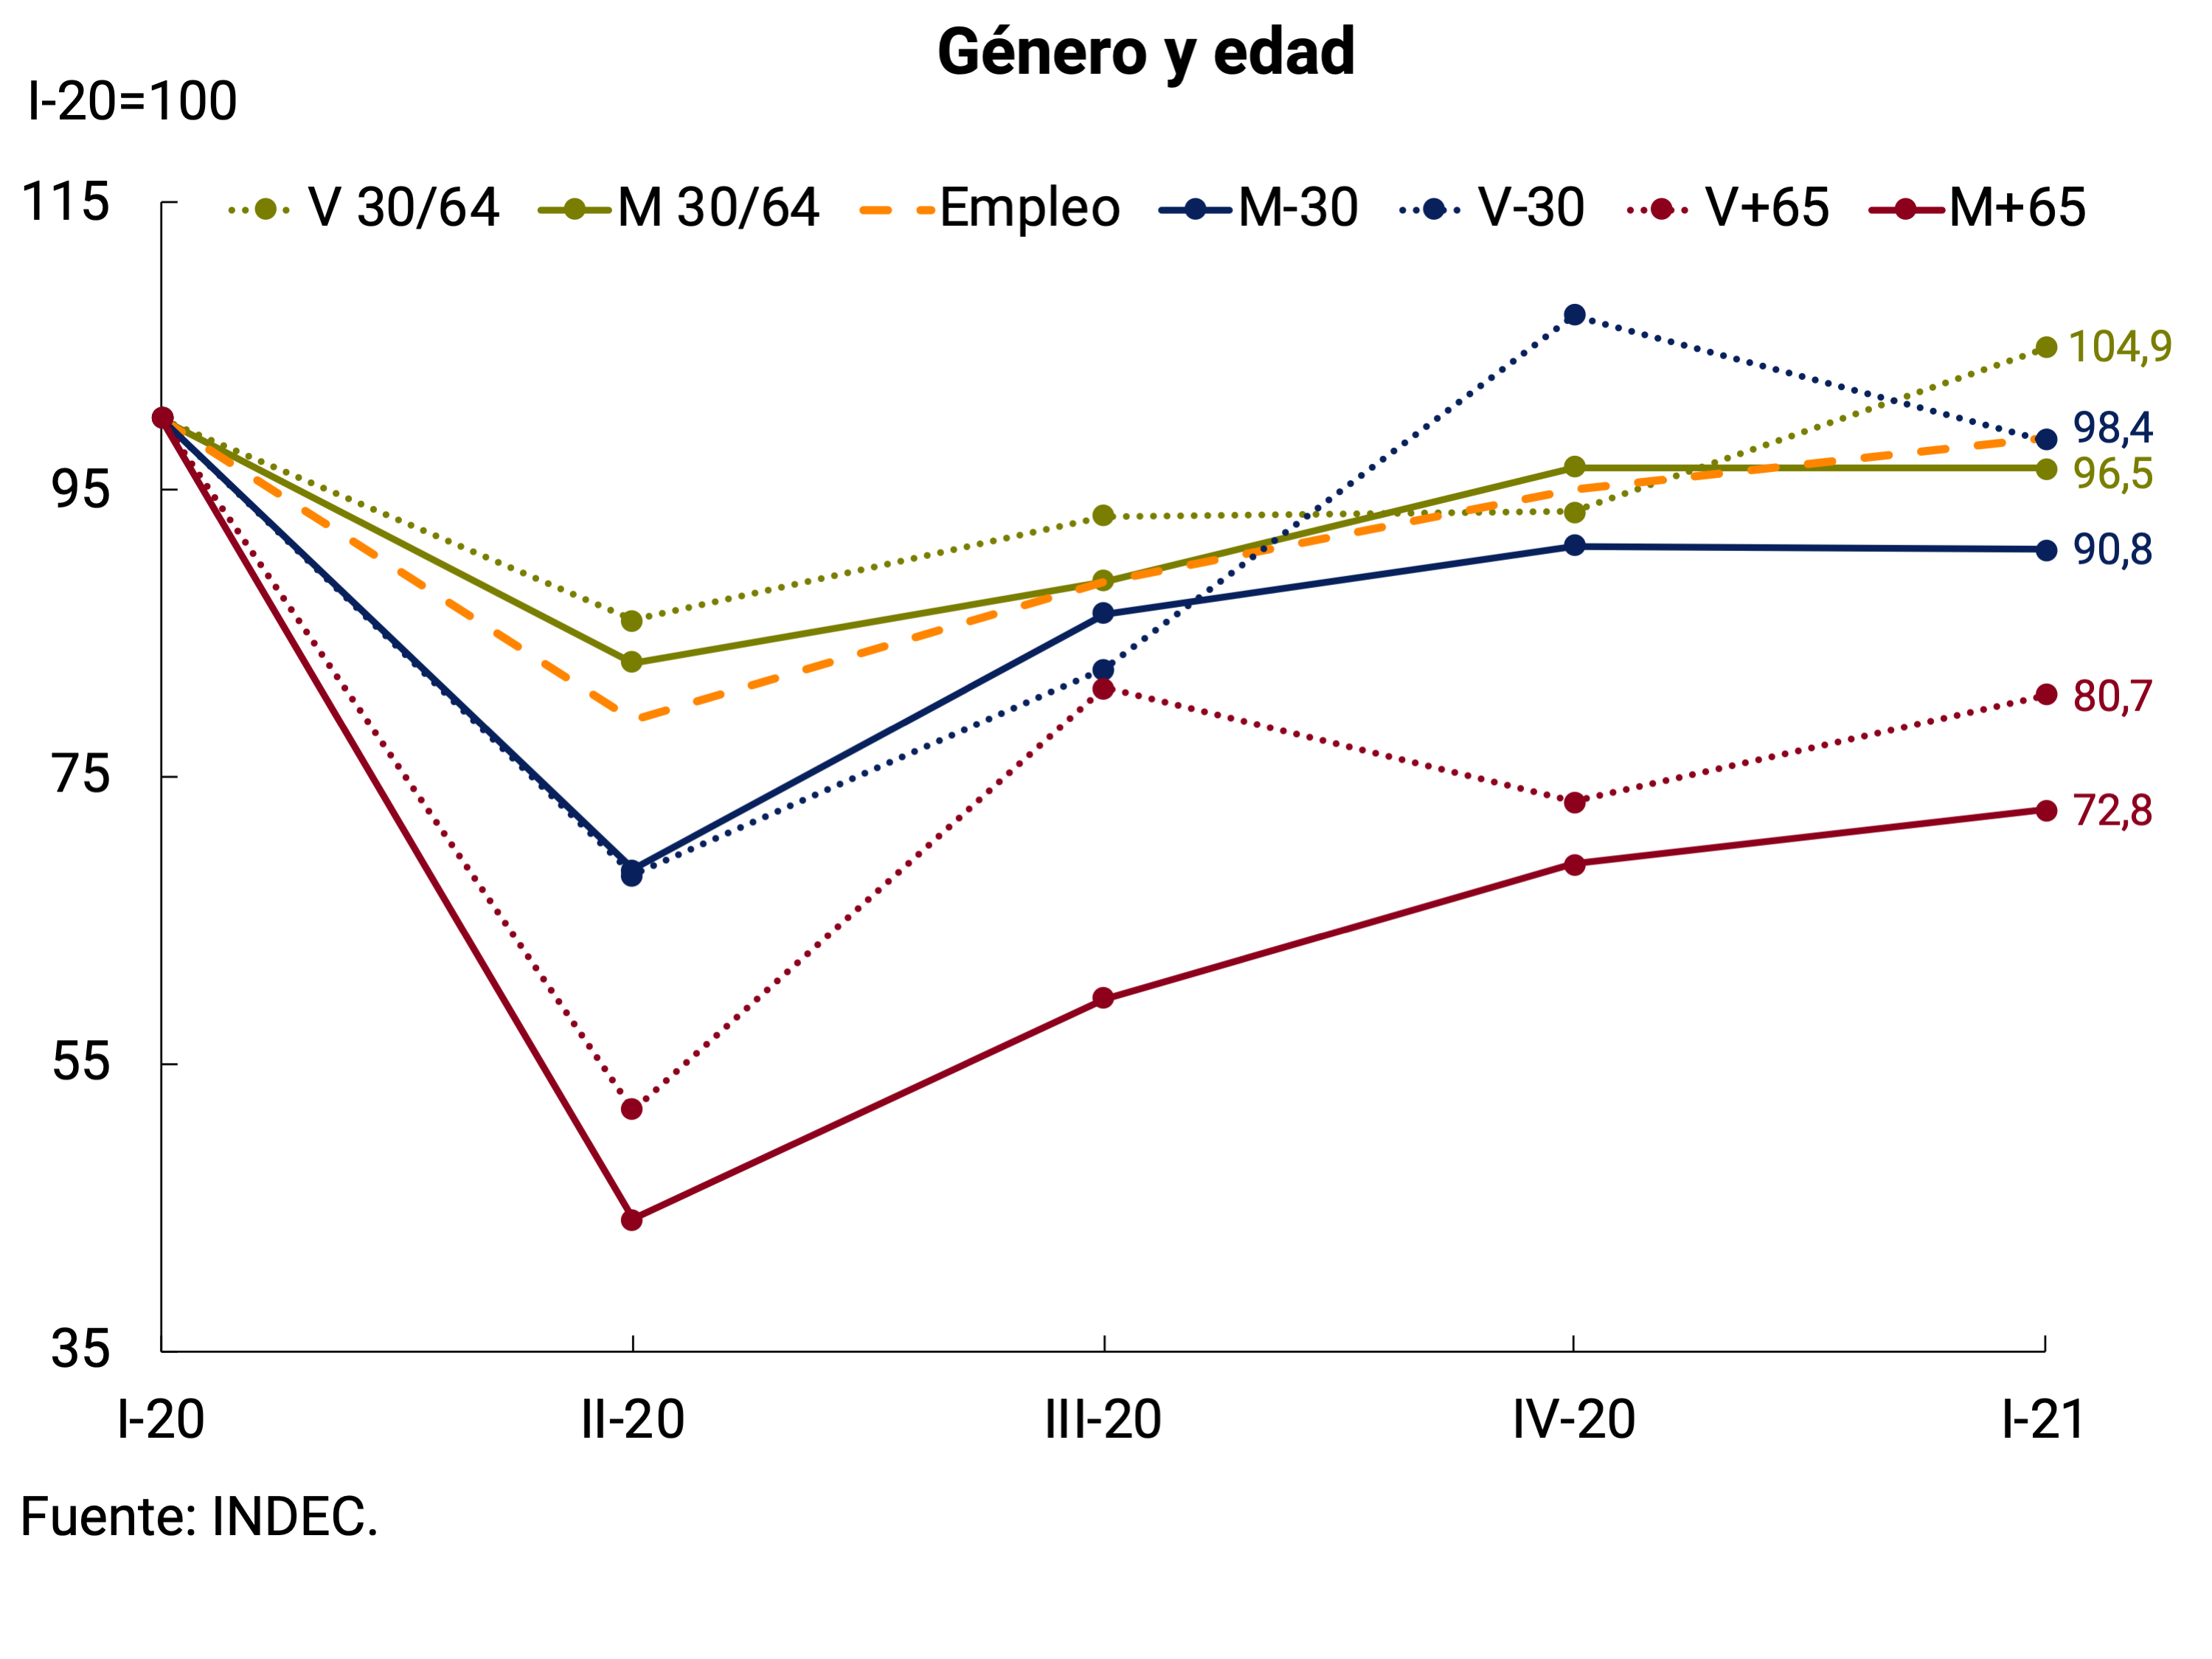
As for the age range, it is observed that the most affected category (over 65 years of age), despite showing a recovery (somewhat more important in men than in women) is still far from reaching the levels of the first quarter of 2020. This situation was to be expected, taking into account the greater health risk of this cohort and the fact that in the first quarter of 2021 the vaccination campaign was not so advanced. Among young people (under 30 years of age), the recovery was uneven between men and women. Child care tasks and the sharp decline within the domestic service sector, unlike a more dynamic sector such as construction, may be some of the determinants of this phenomenon. The age group ranging from 30 to 64 years old was the least affected and has had a similar evolution for men and women until the fourth quarter of 2020. Greater growth is observed among men during the first quarter of 2021, which has led them to exceed the pre-pandemic level.
Among the sectors of activity most affected initially, Construction managed to recover, exceeding the pre-pandemic level during the fourth quarter of 2020. Domestic Service continued to be the most affected activity. Finally, Hotels and Restaurants showed a very volatile behavior, mainly affected by health protocols, and is still far from recovering lost ground. Trade shows a growth pattern quite similar to that of general employment with three consecutive quarters on the rise. In contrast, employment in sectors such as Industry and Health were the least affected during the pandemic (see Graph 2).
Graph 2 | Evolution of sectoral employment and hours worked
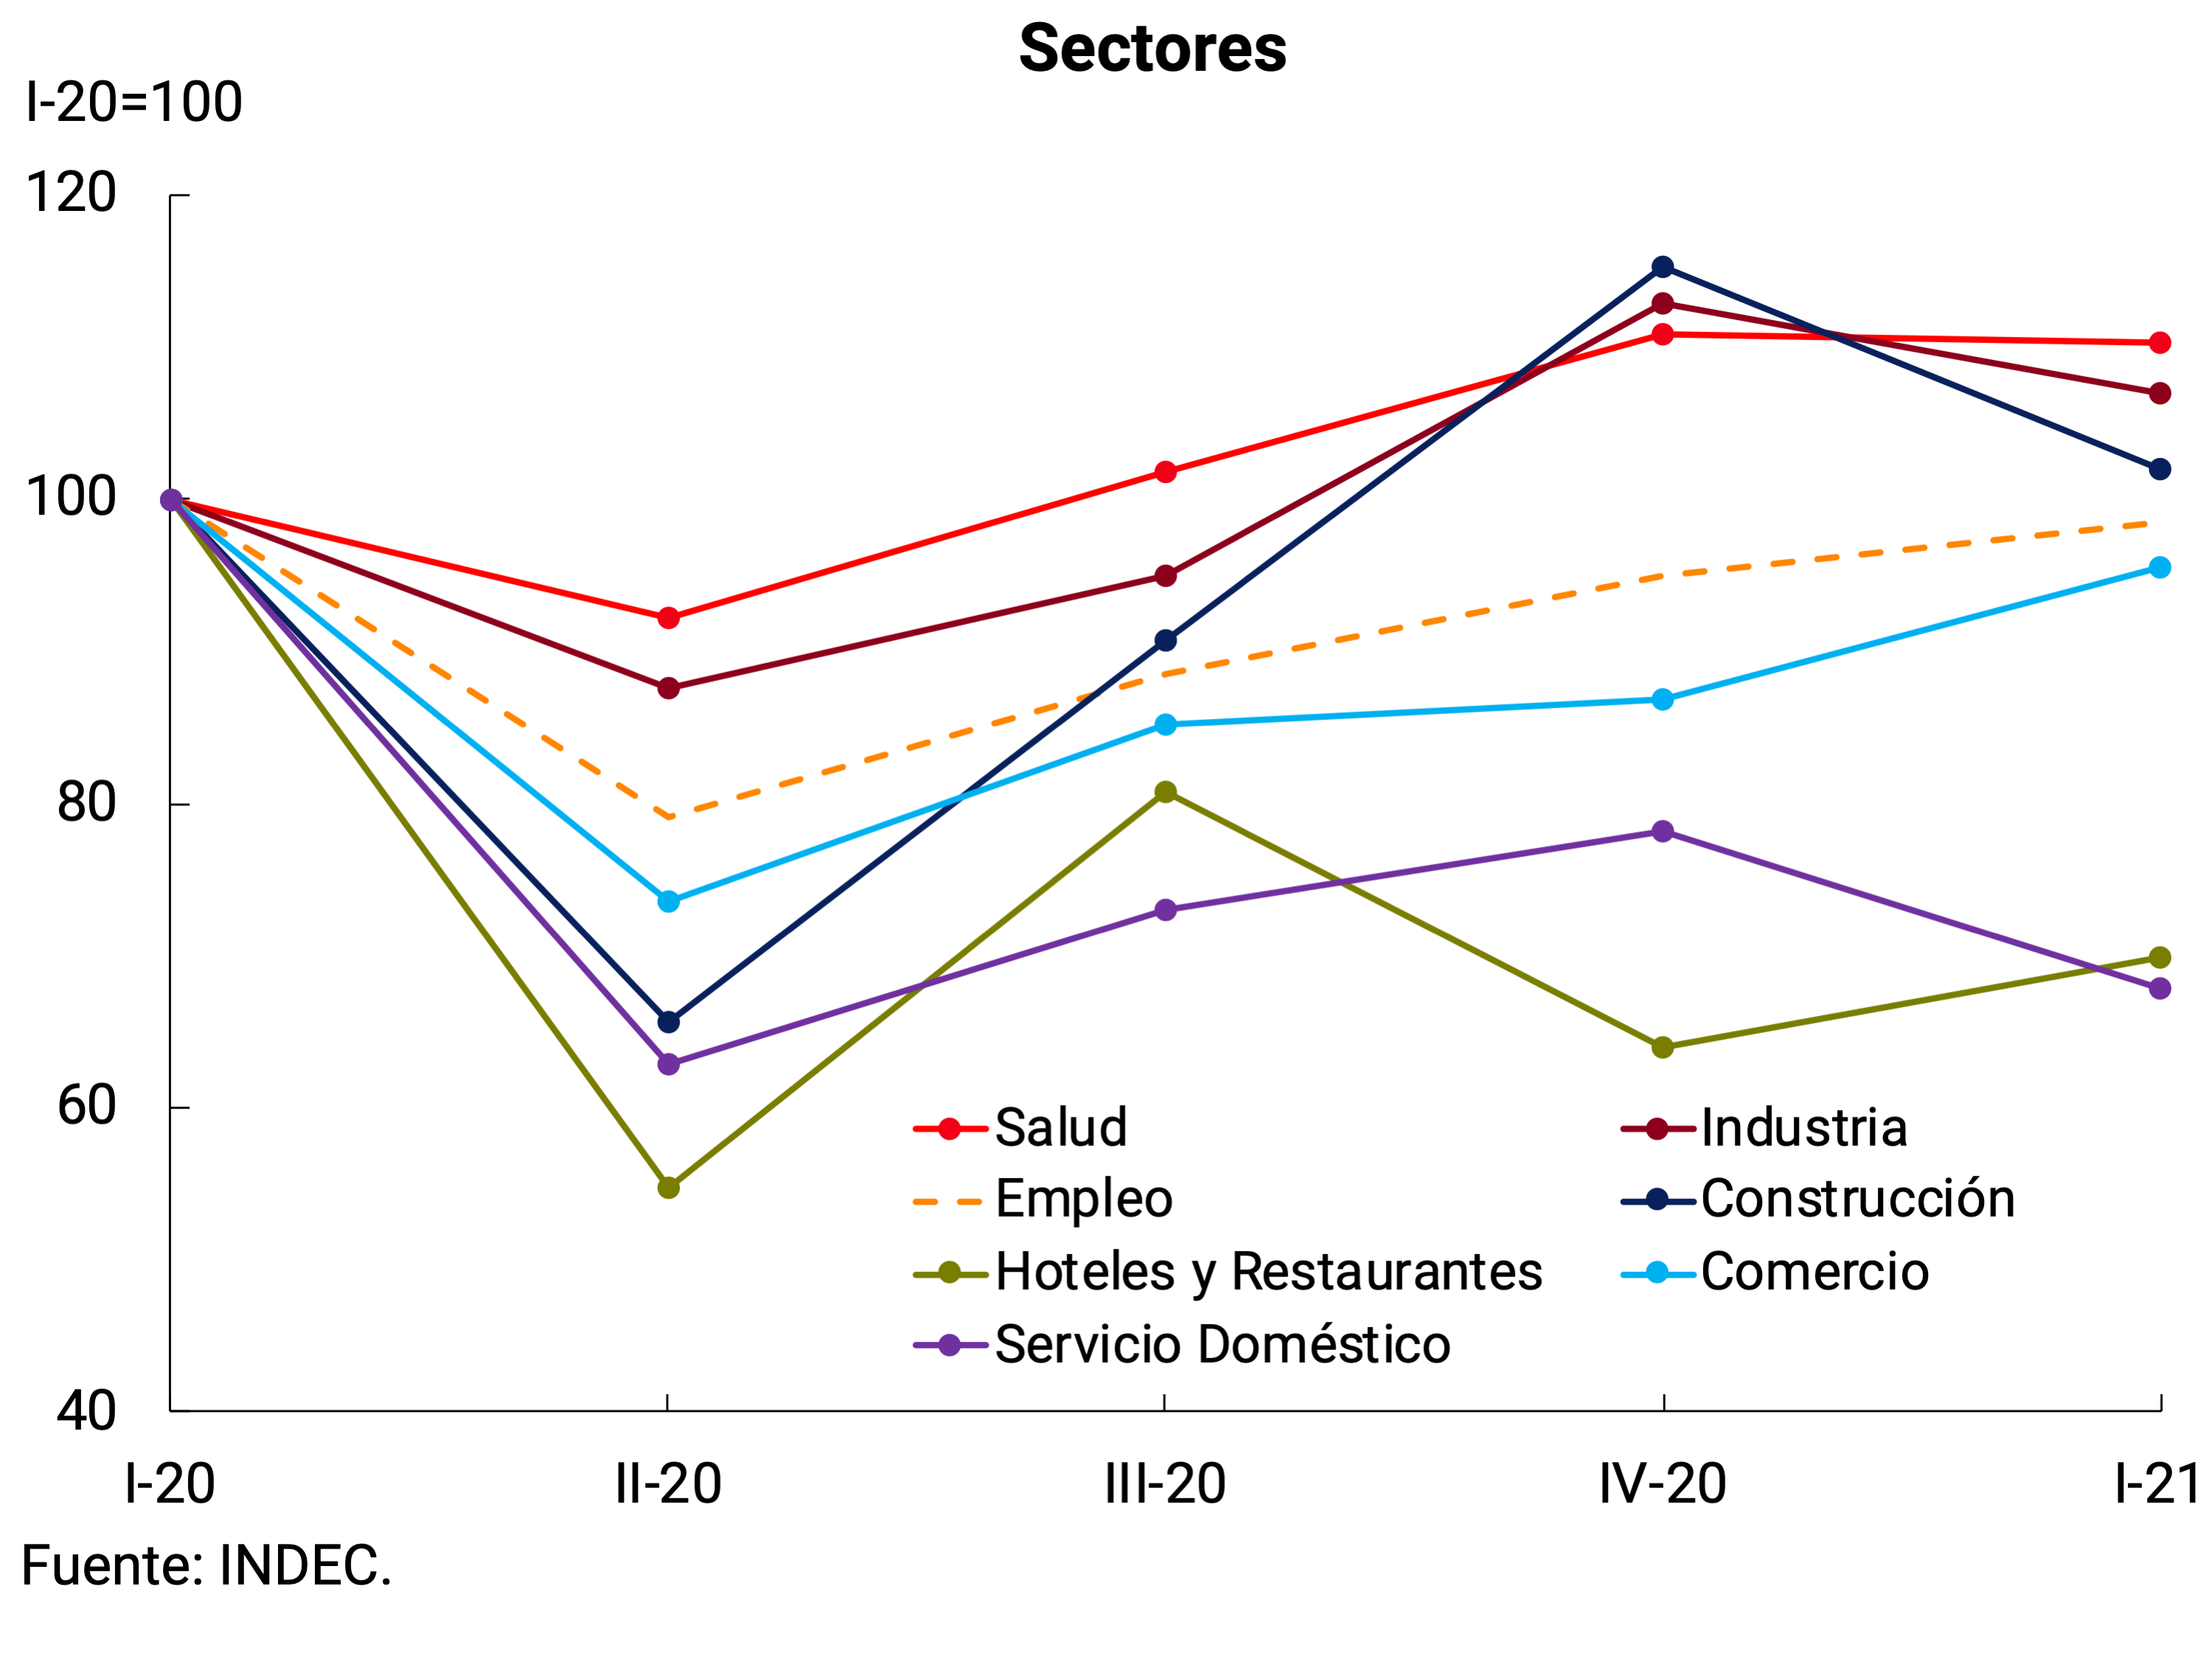
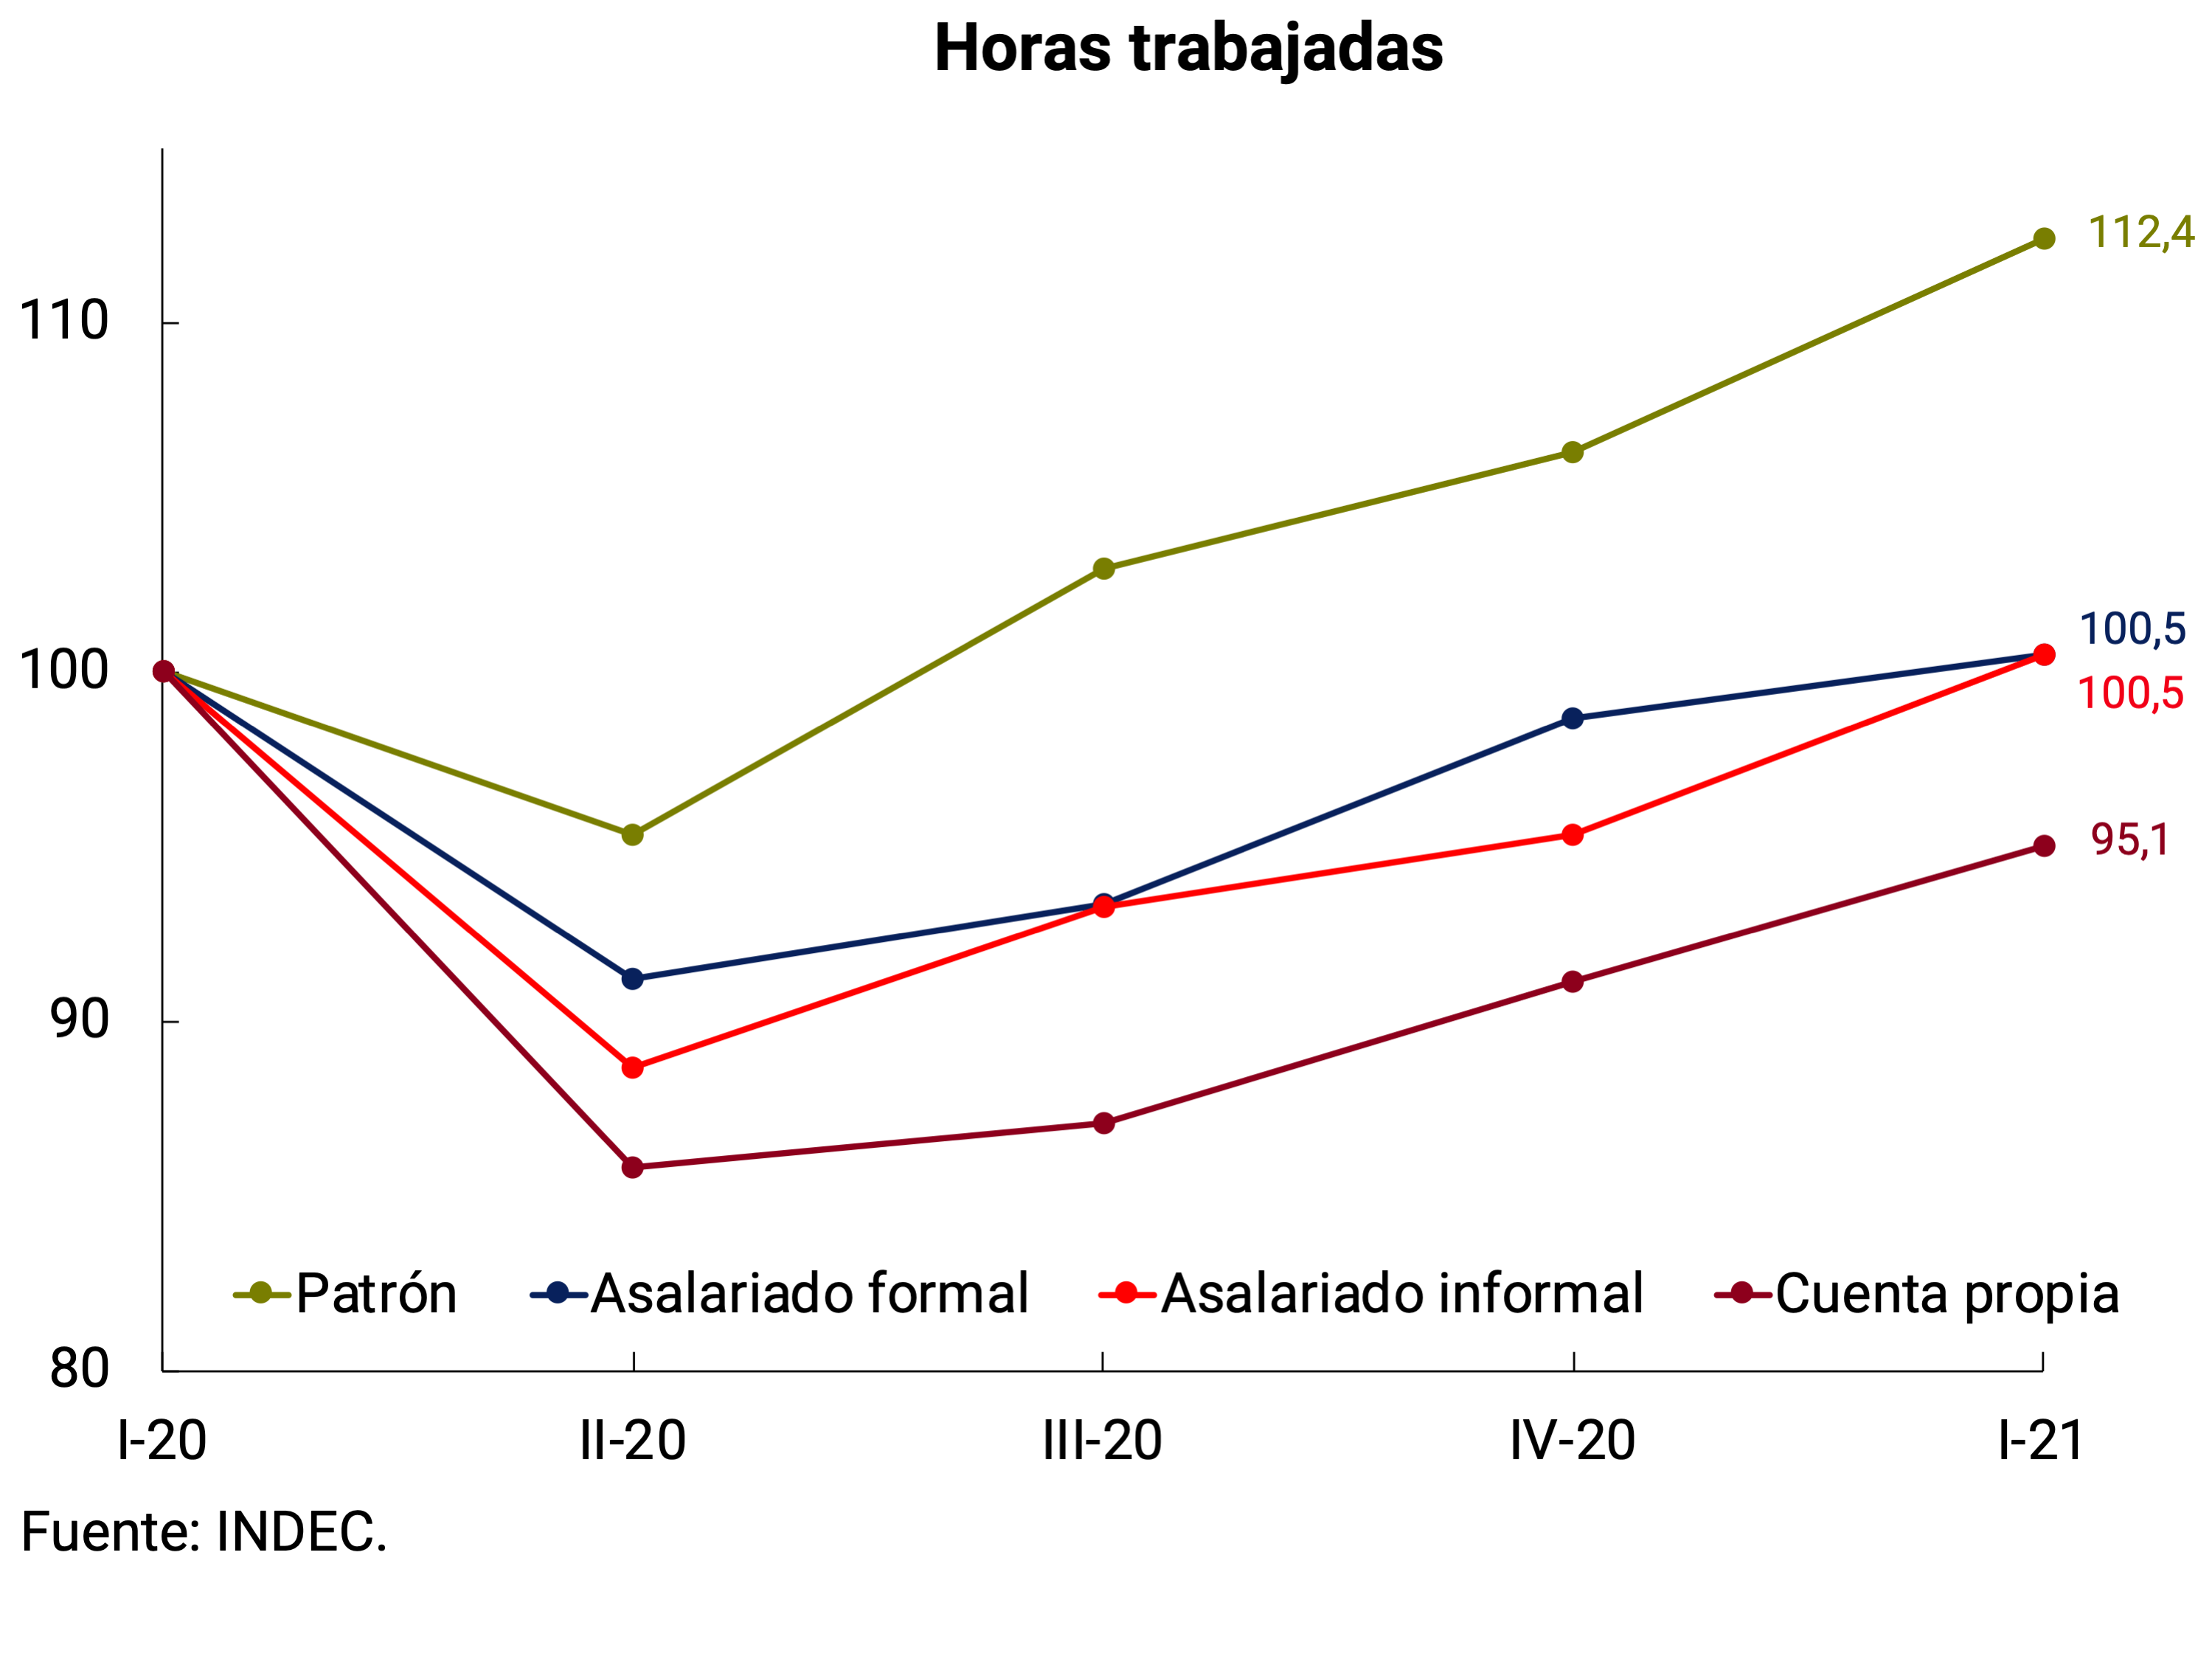
From the point of view of work intensity, after the fall in average hours worked for all job categories during the second quarter of 2020, a gradual and fairly homogeneous recovery was observed. Employers were the least affected category initially and as of the first quarter of 2021 they show an hourly overload if compared on a year-on-year basis. This could be an indication of the need for new recruitment. Both formal and informal wage earners returned, after three quarters, to the level of hours worked in the pre-pandemic. Finally, it is the self-employed who still have to recover working hours to return to the levels of the first quarter of 2020.
Within the real labour income of employed people, heterogeneous trends can be observed according to the labour category (see Graph 3). The real incomes of wage earners (formal and informal) continued to fall for two quarters after the initial impact of the pandemic. However, during the first quarter of 2021 they recovered to close to the levels of the first quarter of 2020. In the case of the self-employed, after a sharp drop during the second quarter of 2020 (probably associated with the fall in hours worked) there were three consecutive quarters of increases, although they continue to be the lagging category in this regard. The real labor income of employers registered significant growth during the quarter with the greatest impact of the pandemic. As it is a very heterogeneous occupational category (in terms of income levels) and has suffered a large drop in jobs, it is possible that it has been concentrated in the lowest income patterns, causing an average increase in the real income of the category.
Graph 3 | Evolution of income and labour force
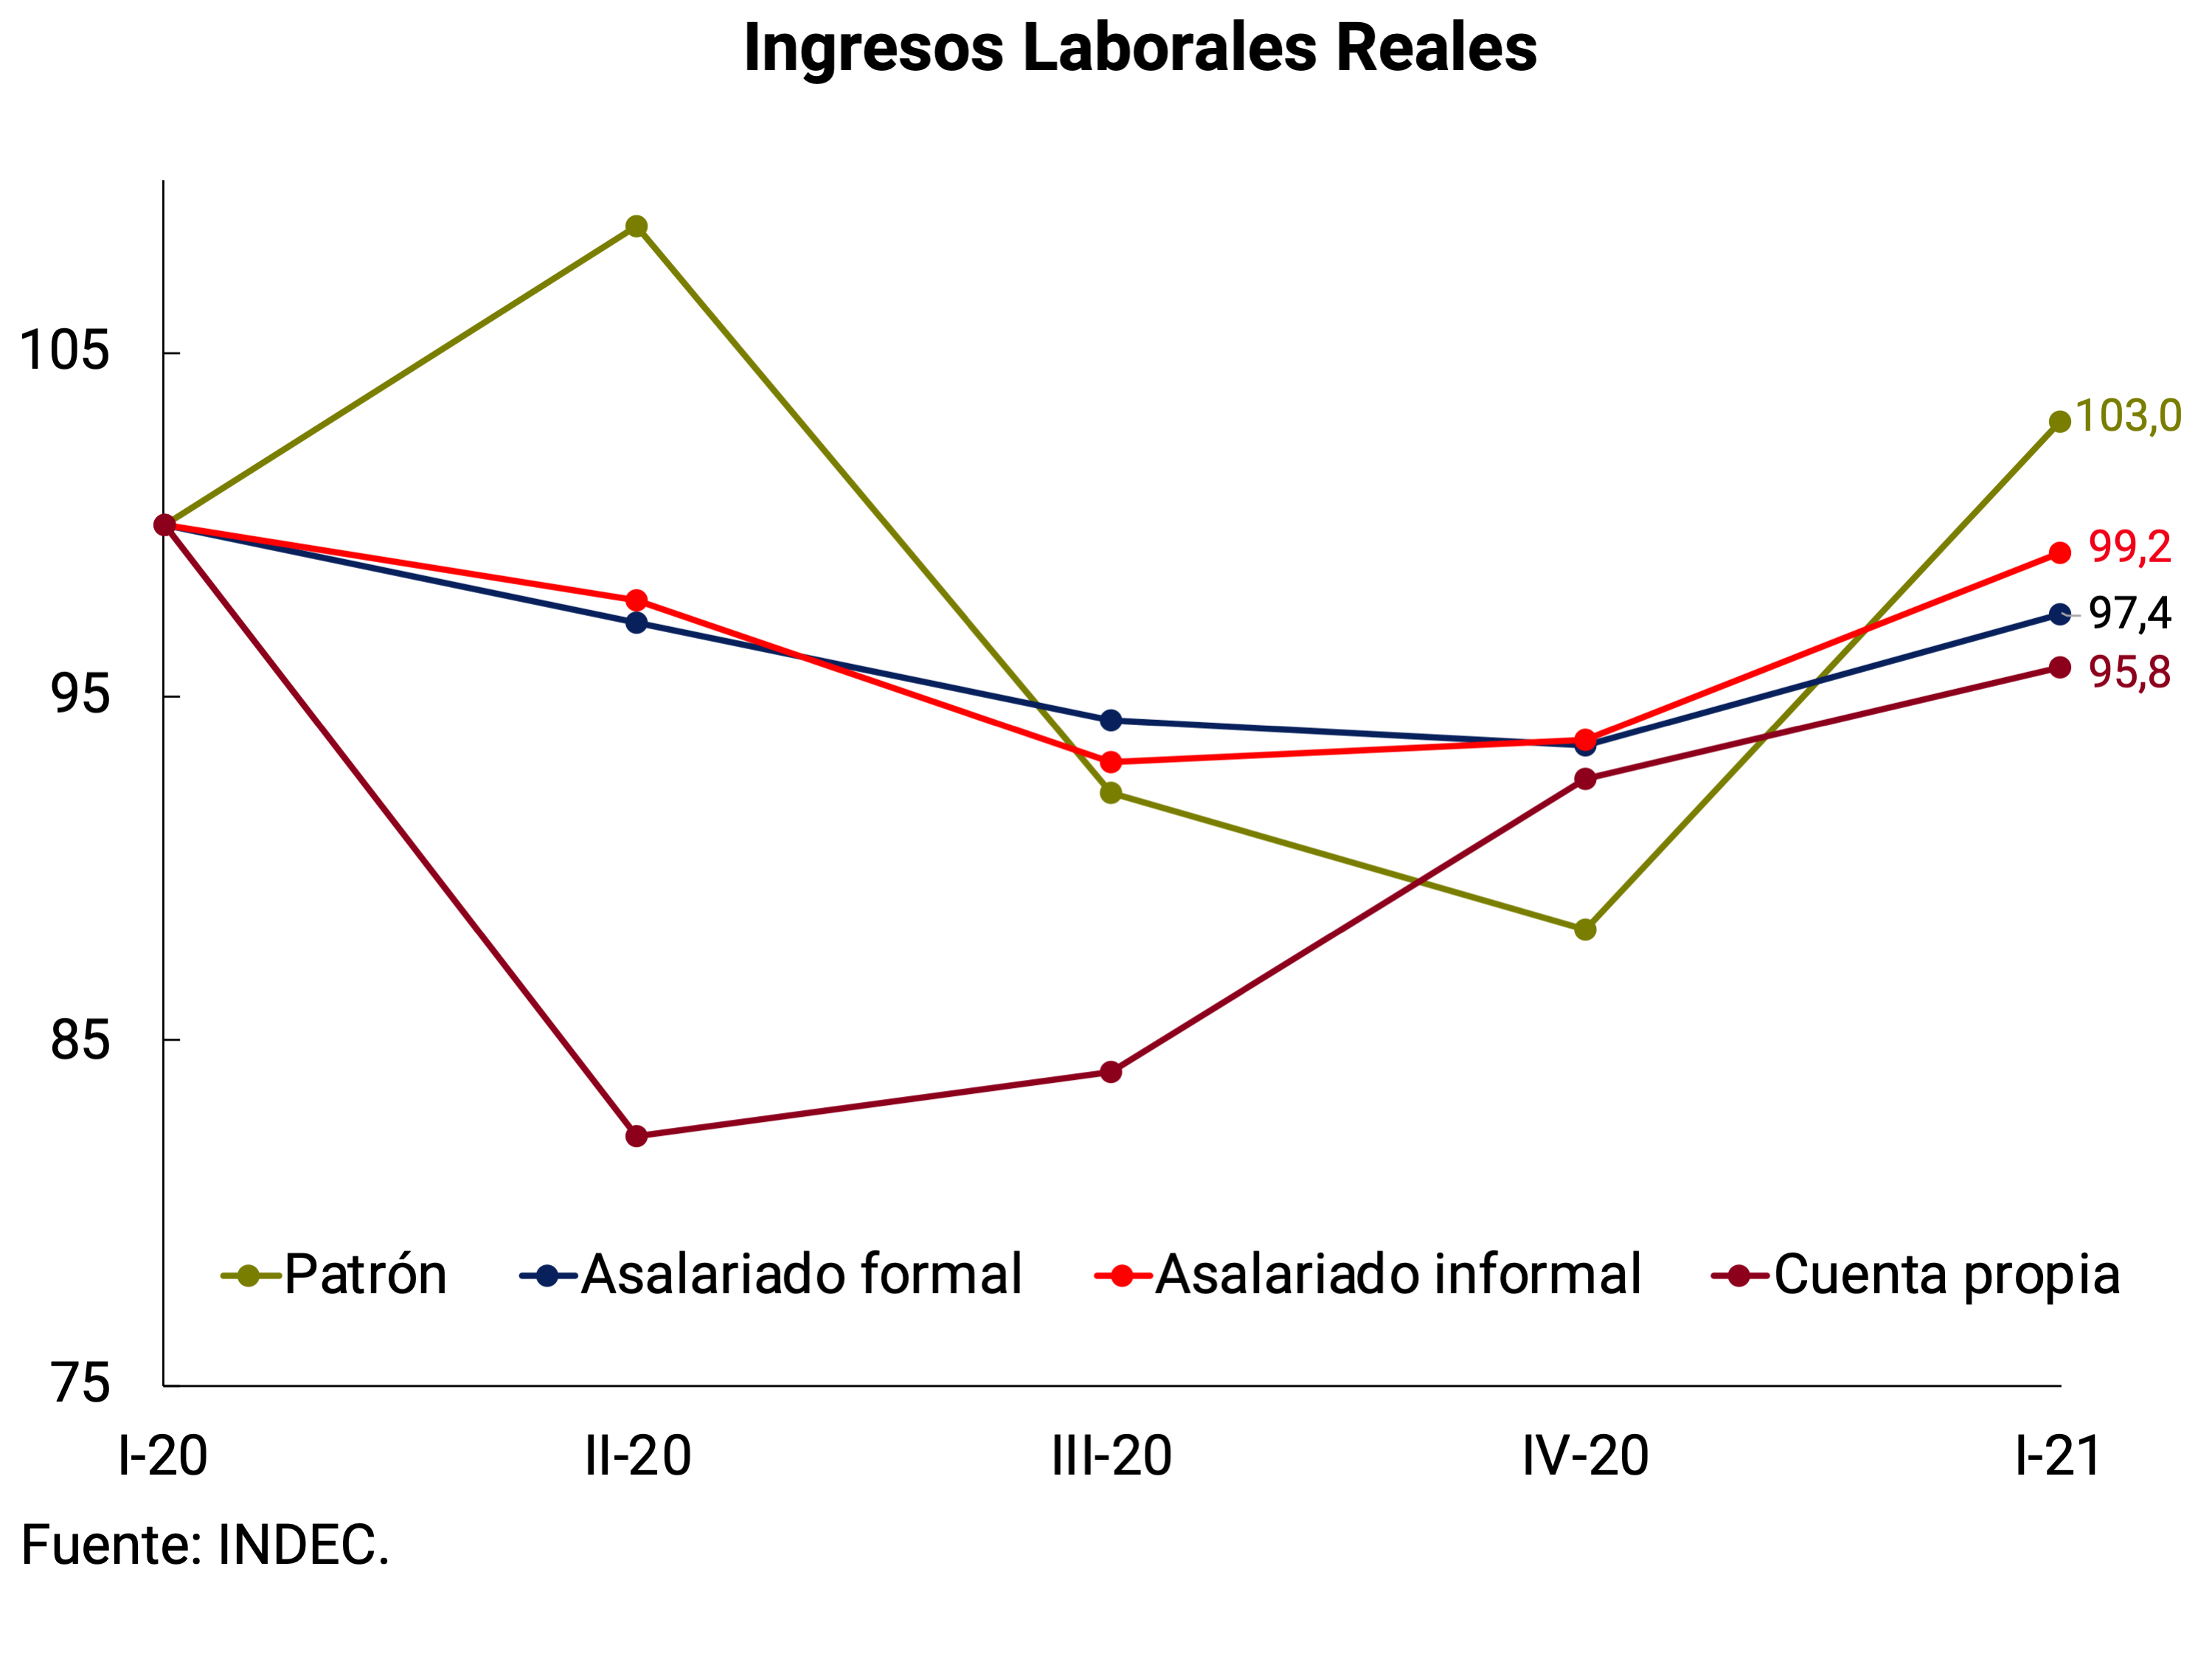
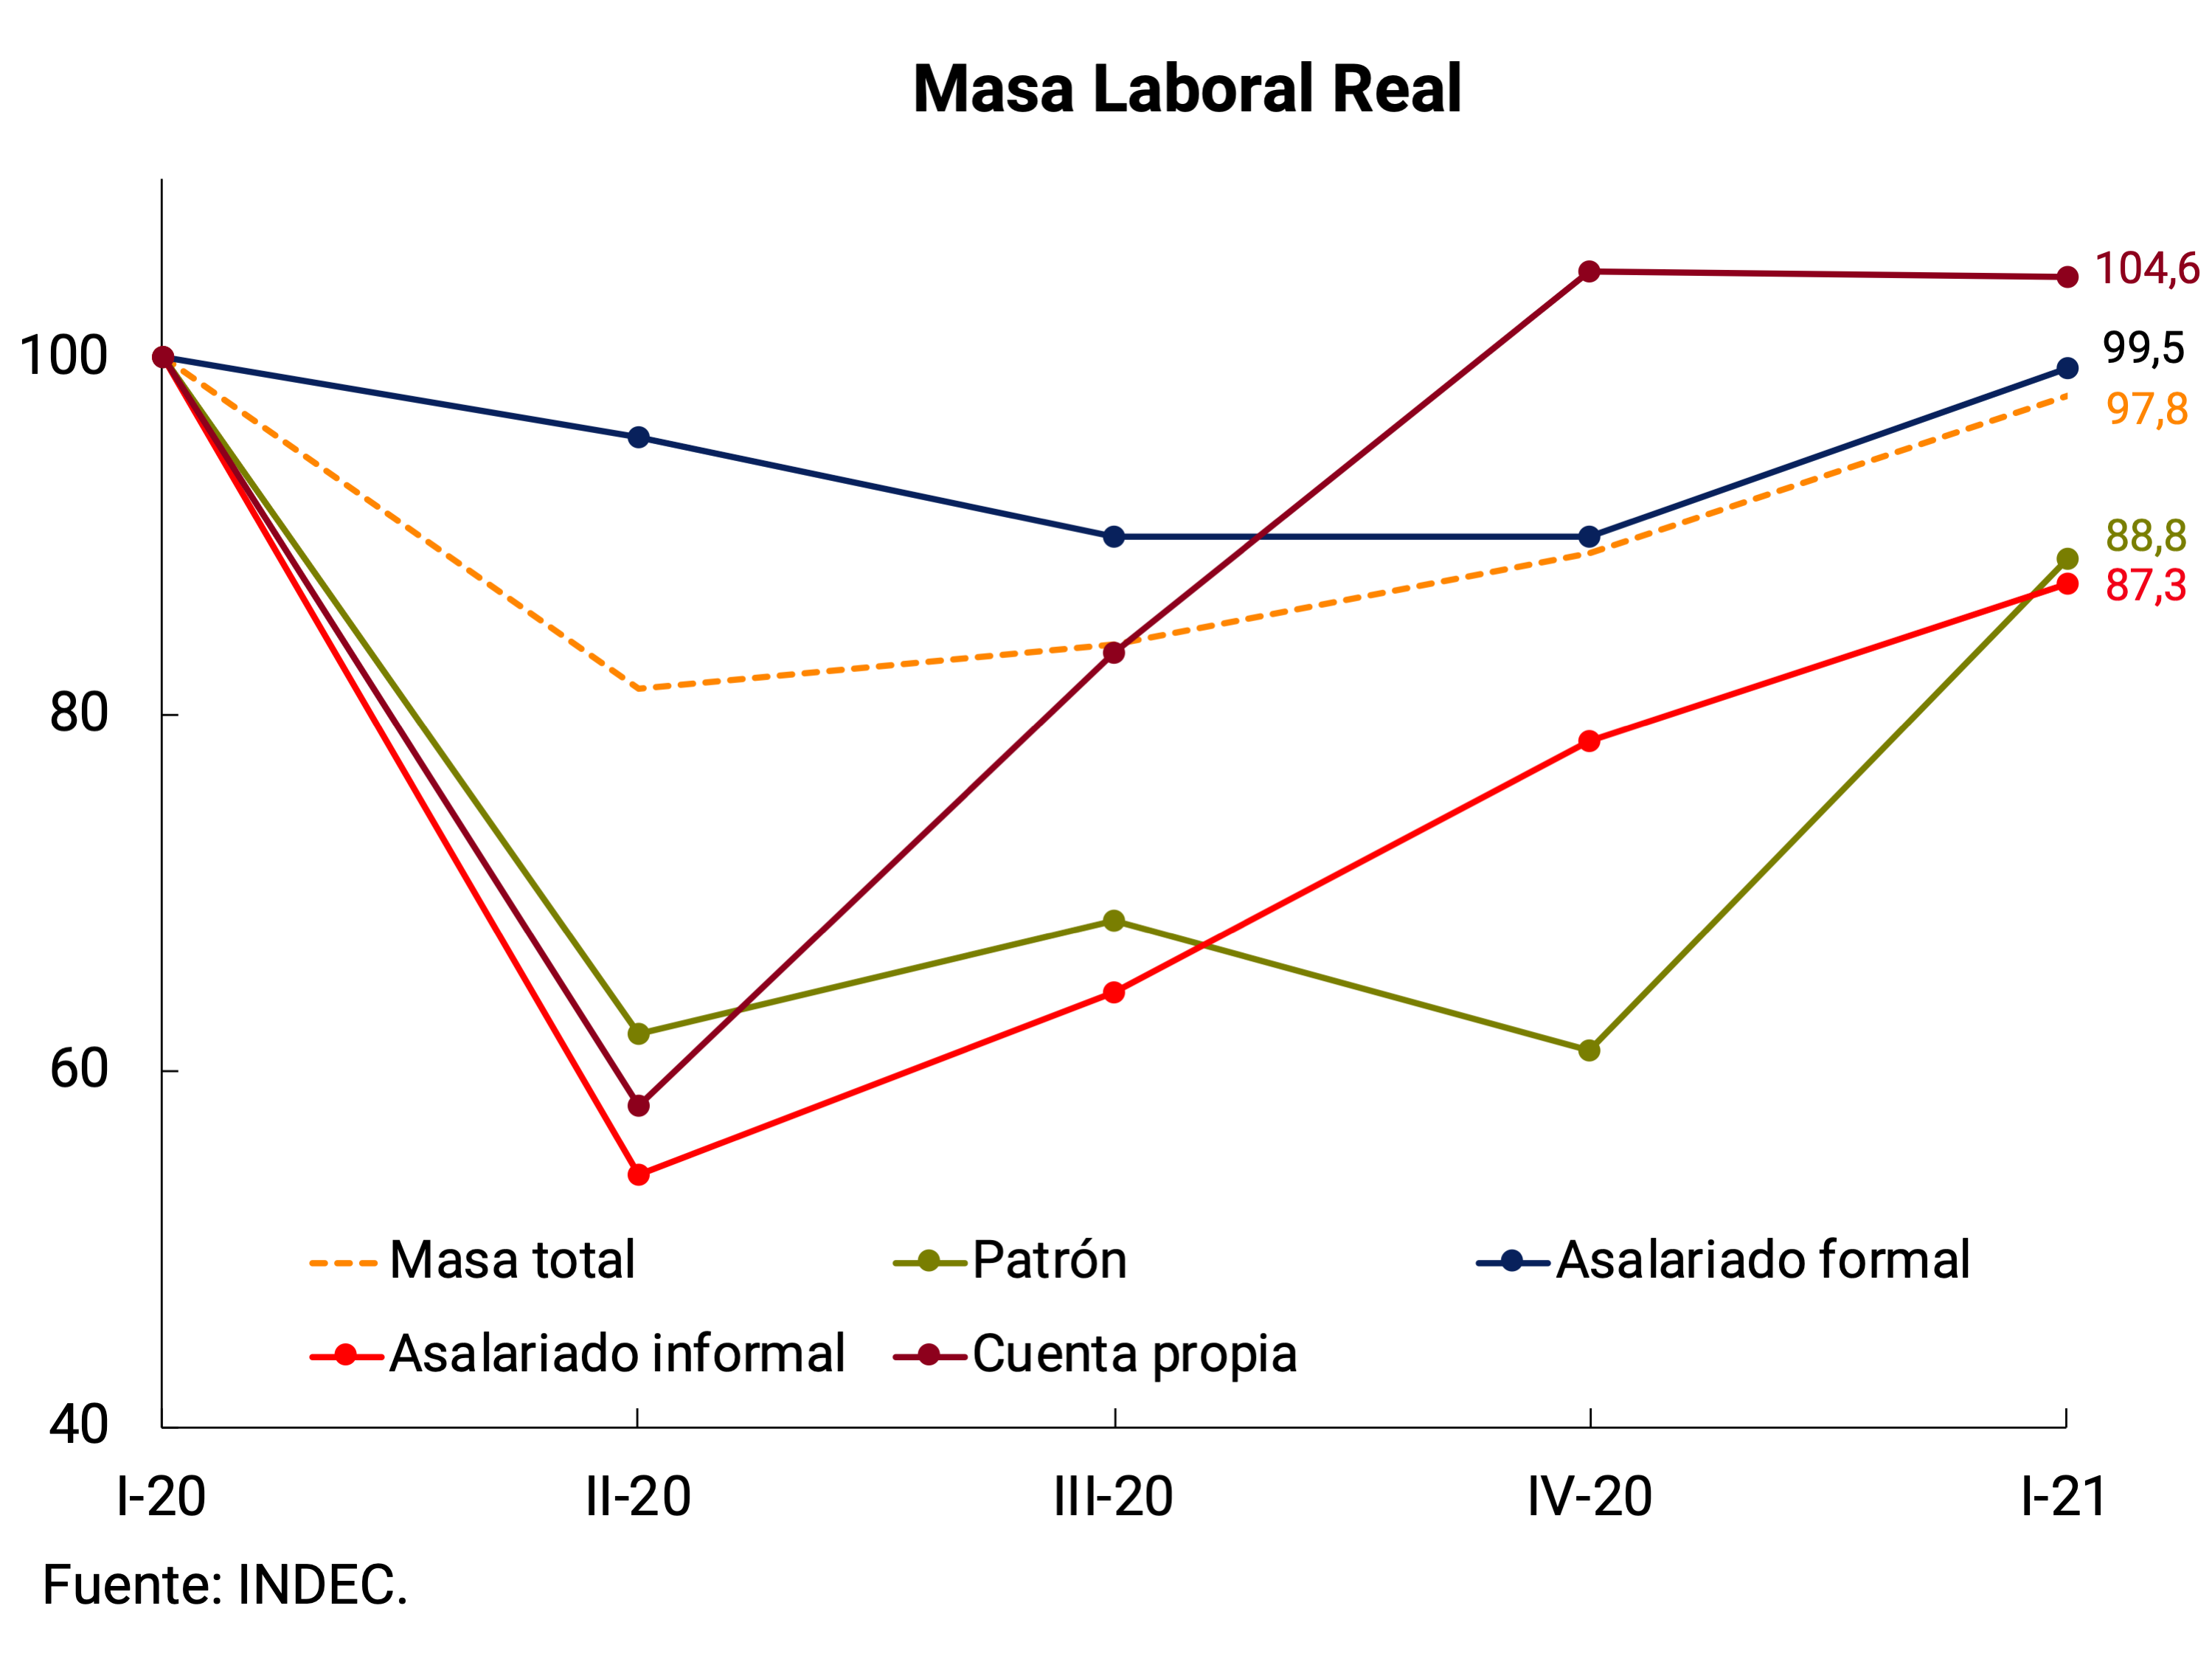
The evolution of the labour force is associated with the combination of employment dynamics and the income generated by it. In the case of formal wage earners, the behavior of both variables, as well as that of the masses, was similar: a fall during the first three quarters of the pandemic, cushioned by the policies of the National Government and the BCRA, and a recovery during the first quarter of 2021 (see Graph 3). In the rest of the categories, the evolution of the mass was mainly influenced by the dynamics of employment, whose variations were much more pronounced in relation to those of income. In the case of these categories, the National Government provided containment with instruments, such as the Emergency Family Income (IFE) and the reinforcements of the Universal Child Allowance (AUH) and the Alimentar card, which, being non-labor income, are not observed in the evolution of the labor force.
Finally, with regard to the new work methodologies, the recovery in employment, which occurred from the third quarter of 2020 onwards, has had an impact on the fall in the percentage of employed people who work from home and who use their own equipment. However, in the year-on-year comparison, both situations are at very high levels (see Graph 4). In the first quarter of 2021, the proportion of employed people who work from home almost triples that of the first quarter of 2020 and, in the case of employed people who use their own equipment, almost fivefold.
Figure 4 | New ways of working
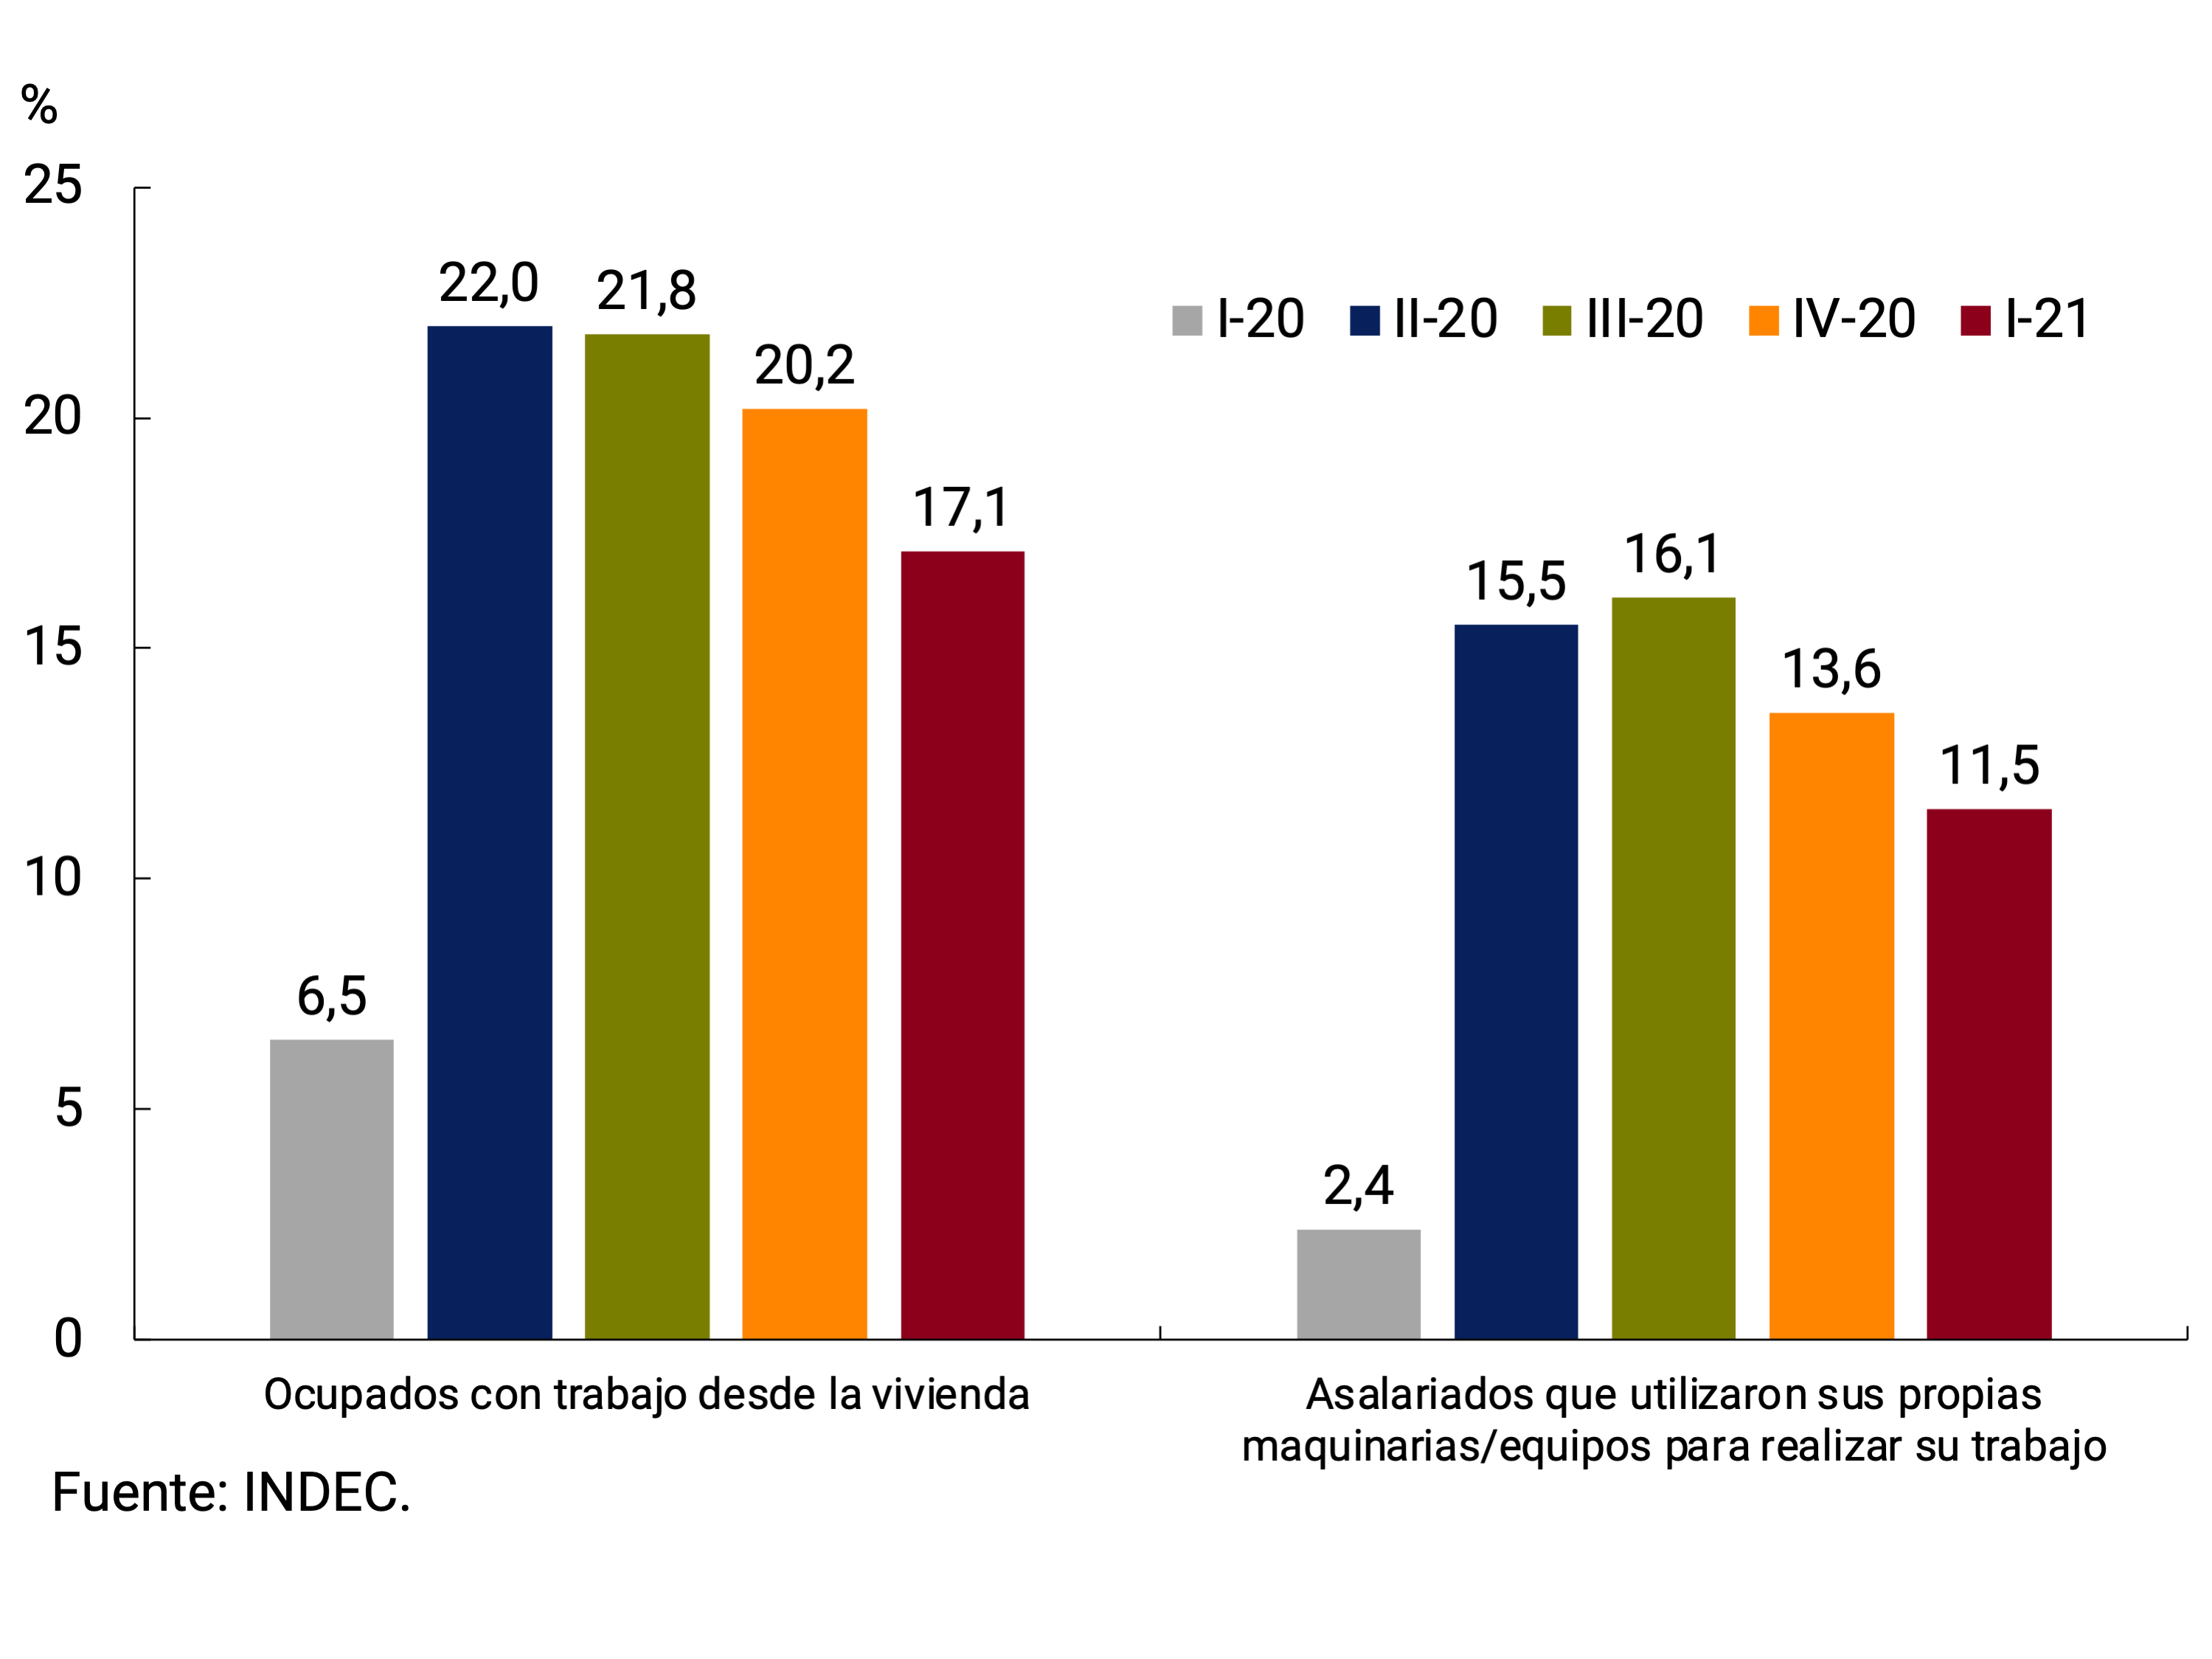
In short, the recovery of the labour market was conditioned by the evolution of the pandemic. Some of the effects that still persist are likely to be transitory and will be corrected as the health crisis is behind us. Other effects may be here to stay and make up a “new normal”.
Section 4 / Recent performance of agricultural exports
In the first half of 2021, exports from the agricultural sector of Argentina33 totaled US$18,947 million, a historical record for this period. At current prices, they were US$4,807 million higher than the record for the same period in 2020, in a context in which the agricultural harvest was not exceptional (it was -0.6% below the 19/20 campaign and -4.5% below the record harvest of 18/19). This record performance of the sector’s exports resulted in a growth in the trade balance of goods, in greater net purchases of foreign currency by the BCRA in the foreign exchange market based on higher income from export collections, and in an increase in the National Treasury’s collection of export duties (see Chapter 4. External Sector and 5. Public Finance).
This notable dynamism in the sector’s external sales was due to a very strong increase in export prices, driven by the rise in the prices of agricultural raw materials in the world reference markets. In fact, if export prices had been the same as those of the first half of 2020, the total exported would have totaled US$13,893 million, approx. US$5,000 million less than what was actually achieved (see Graph 1)34.
Graph 1 | Exports of agricultural
products First half of each year
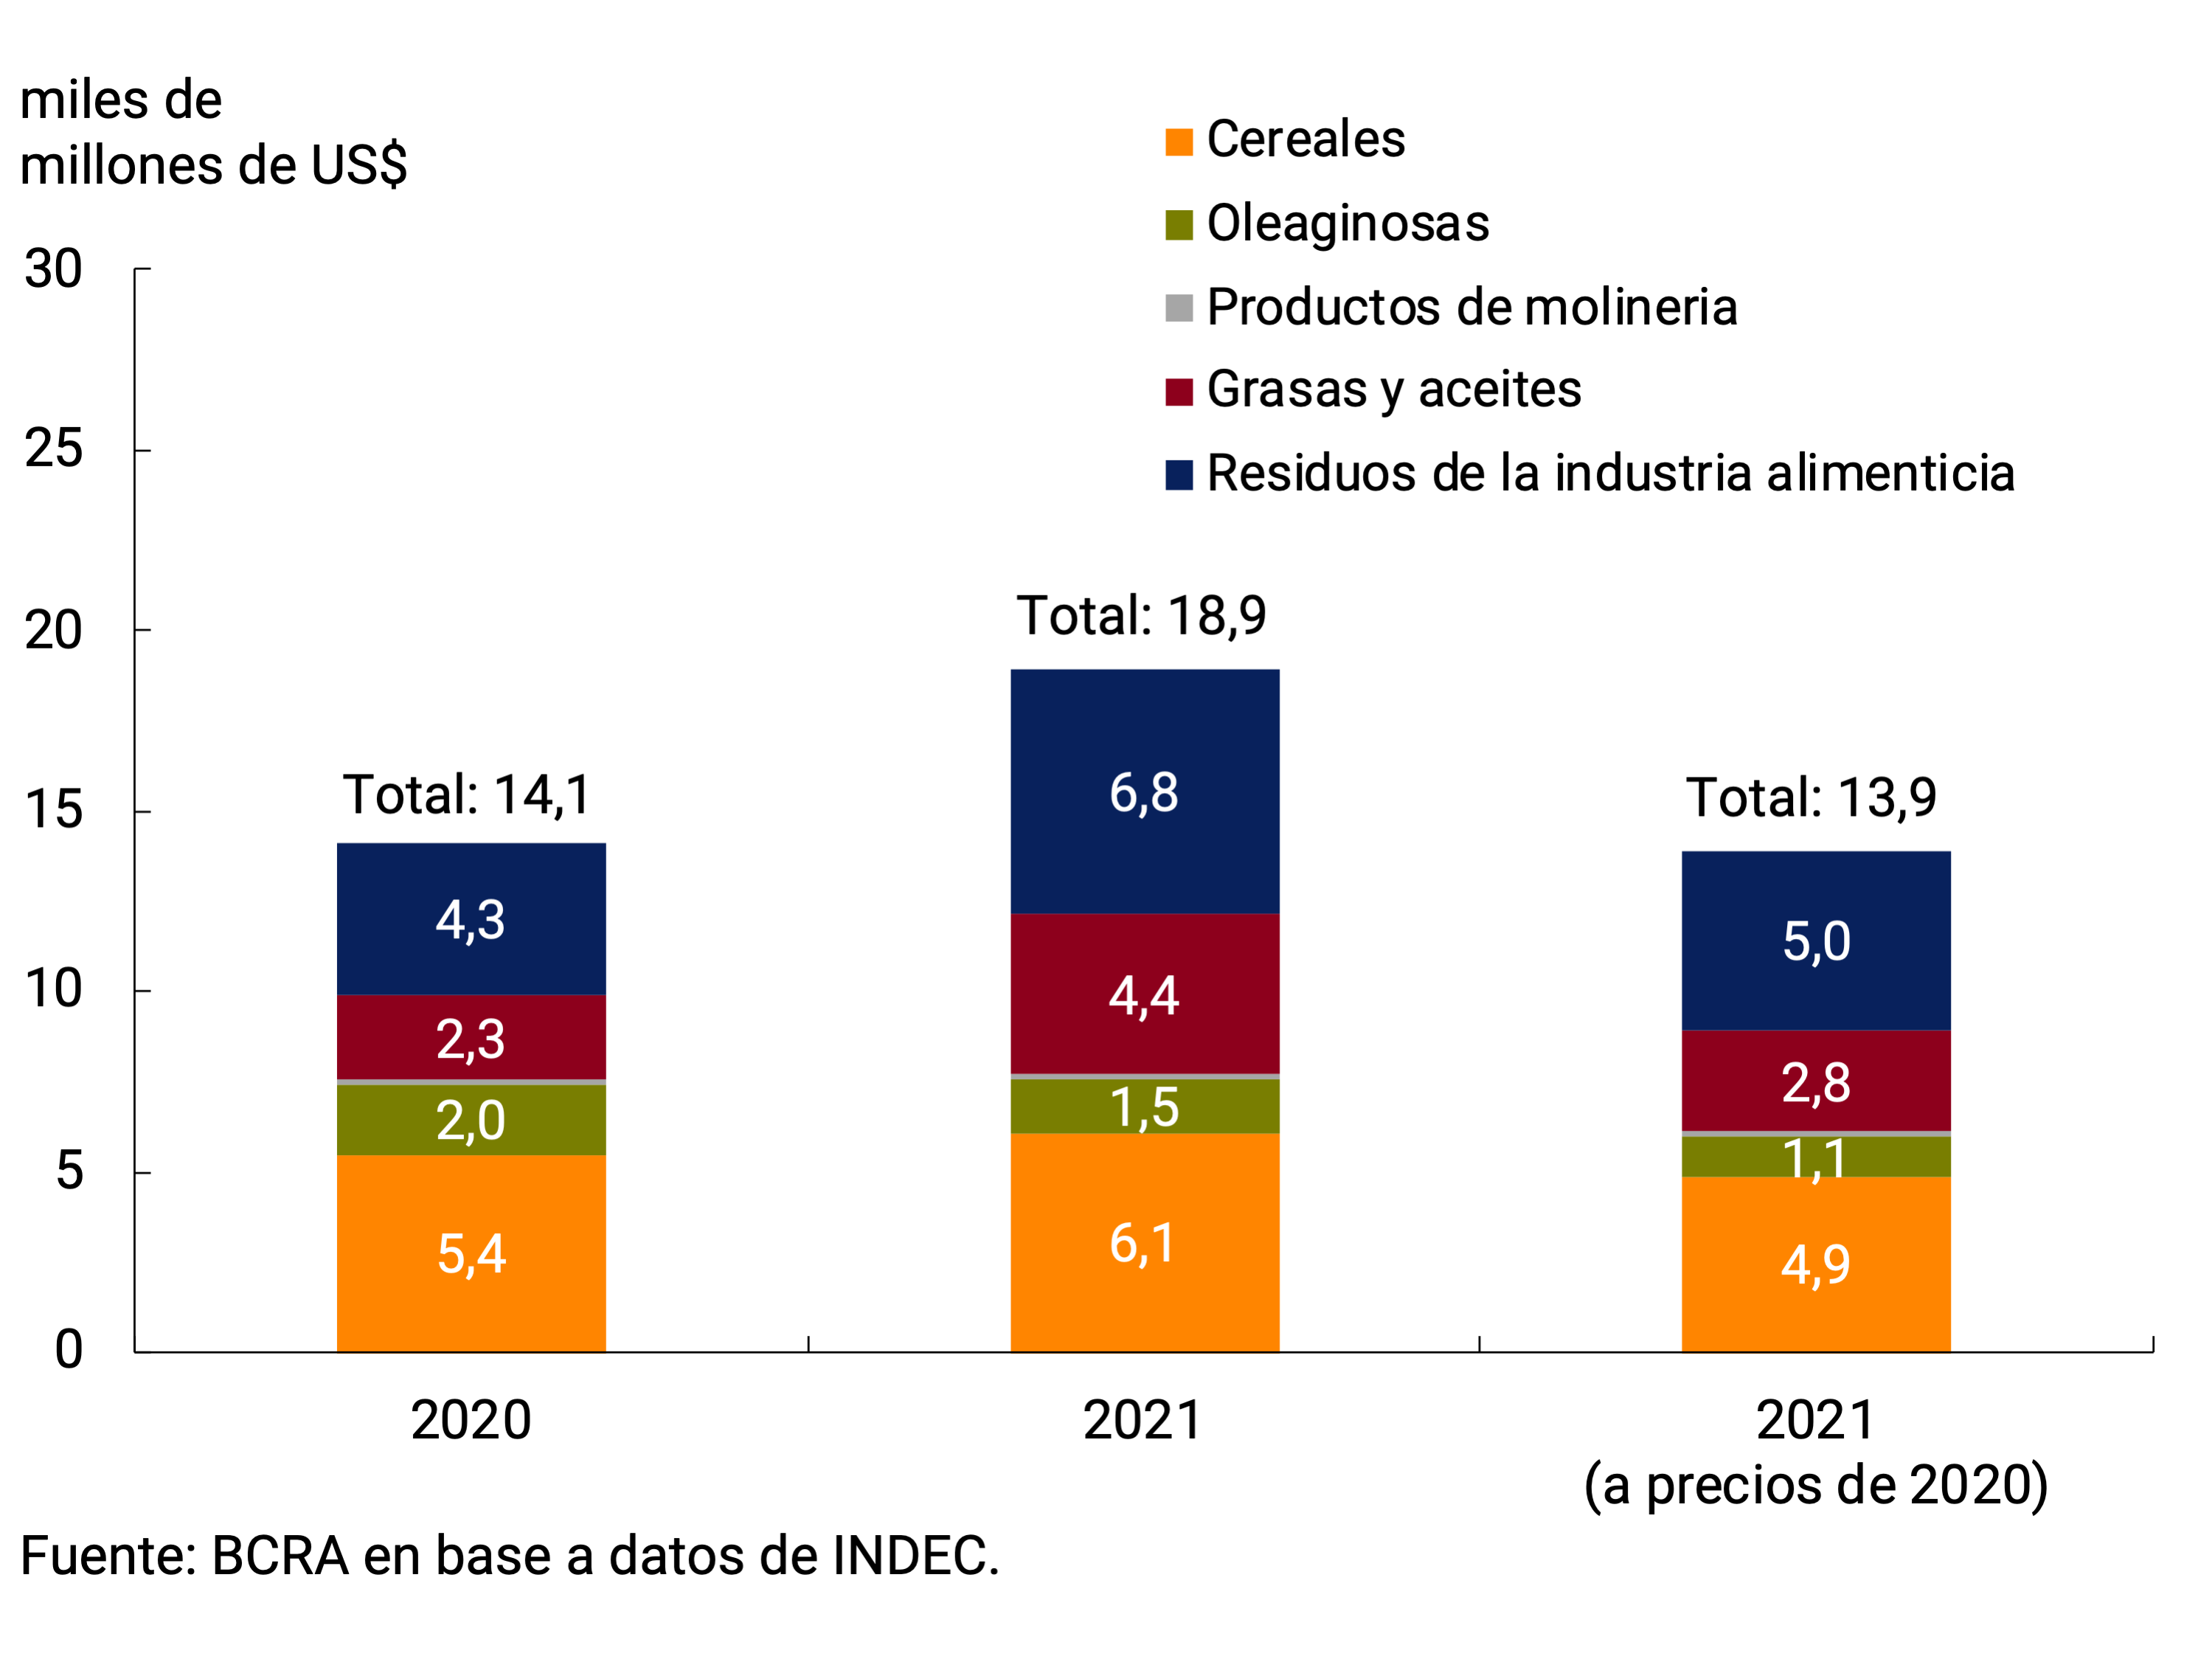
At the product level, the most significant increases in current values occurred in soybean oil and soybean pellets. In both cases, the sharp rise in prices was compounded by an increase in the volumes shipped, as a result of the higher global demand for vegetable oils verified in 2021. In the case of grains, the performance of the quantities was negative, but significant price increases were also observed linked to the quotations of these raw materials in the world reference markets (see chapter 4. External Sector; see Table 1). It should be noted that one of the factors that influenced the performance of the quantities of grains and by-products exported in the second half of 2021 was the delay in shipments as a result of the downspout of the Paraná River (See chapter 4. External Sector).
Table 1 | Exports of selected
agricultural products First half 2021 vs. first half 2020
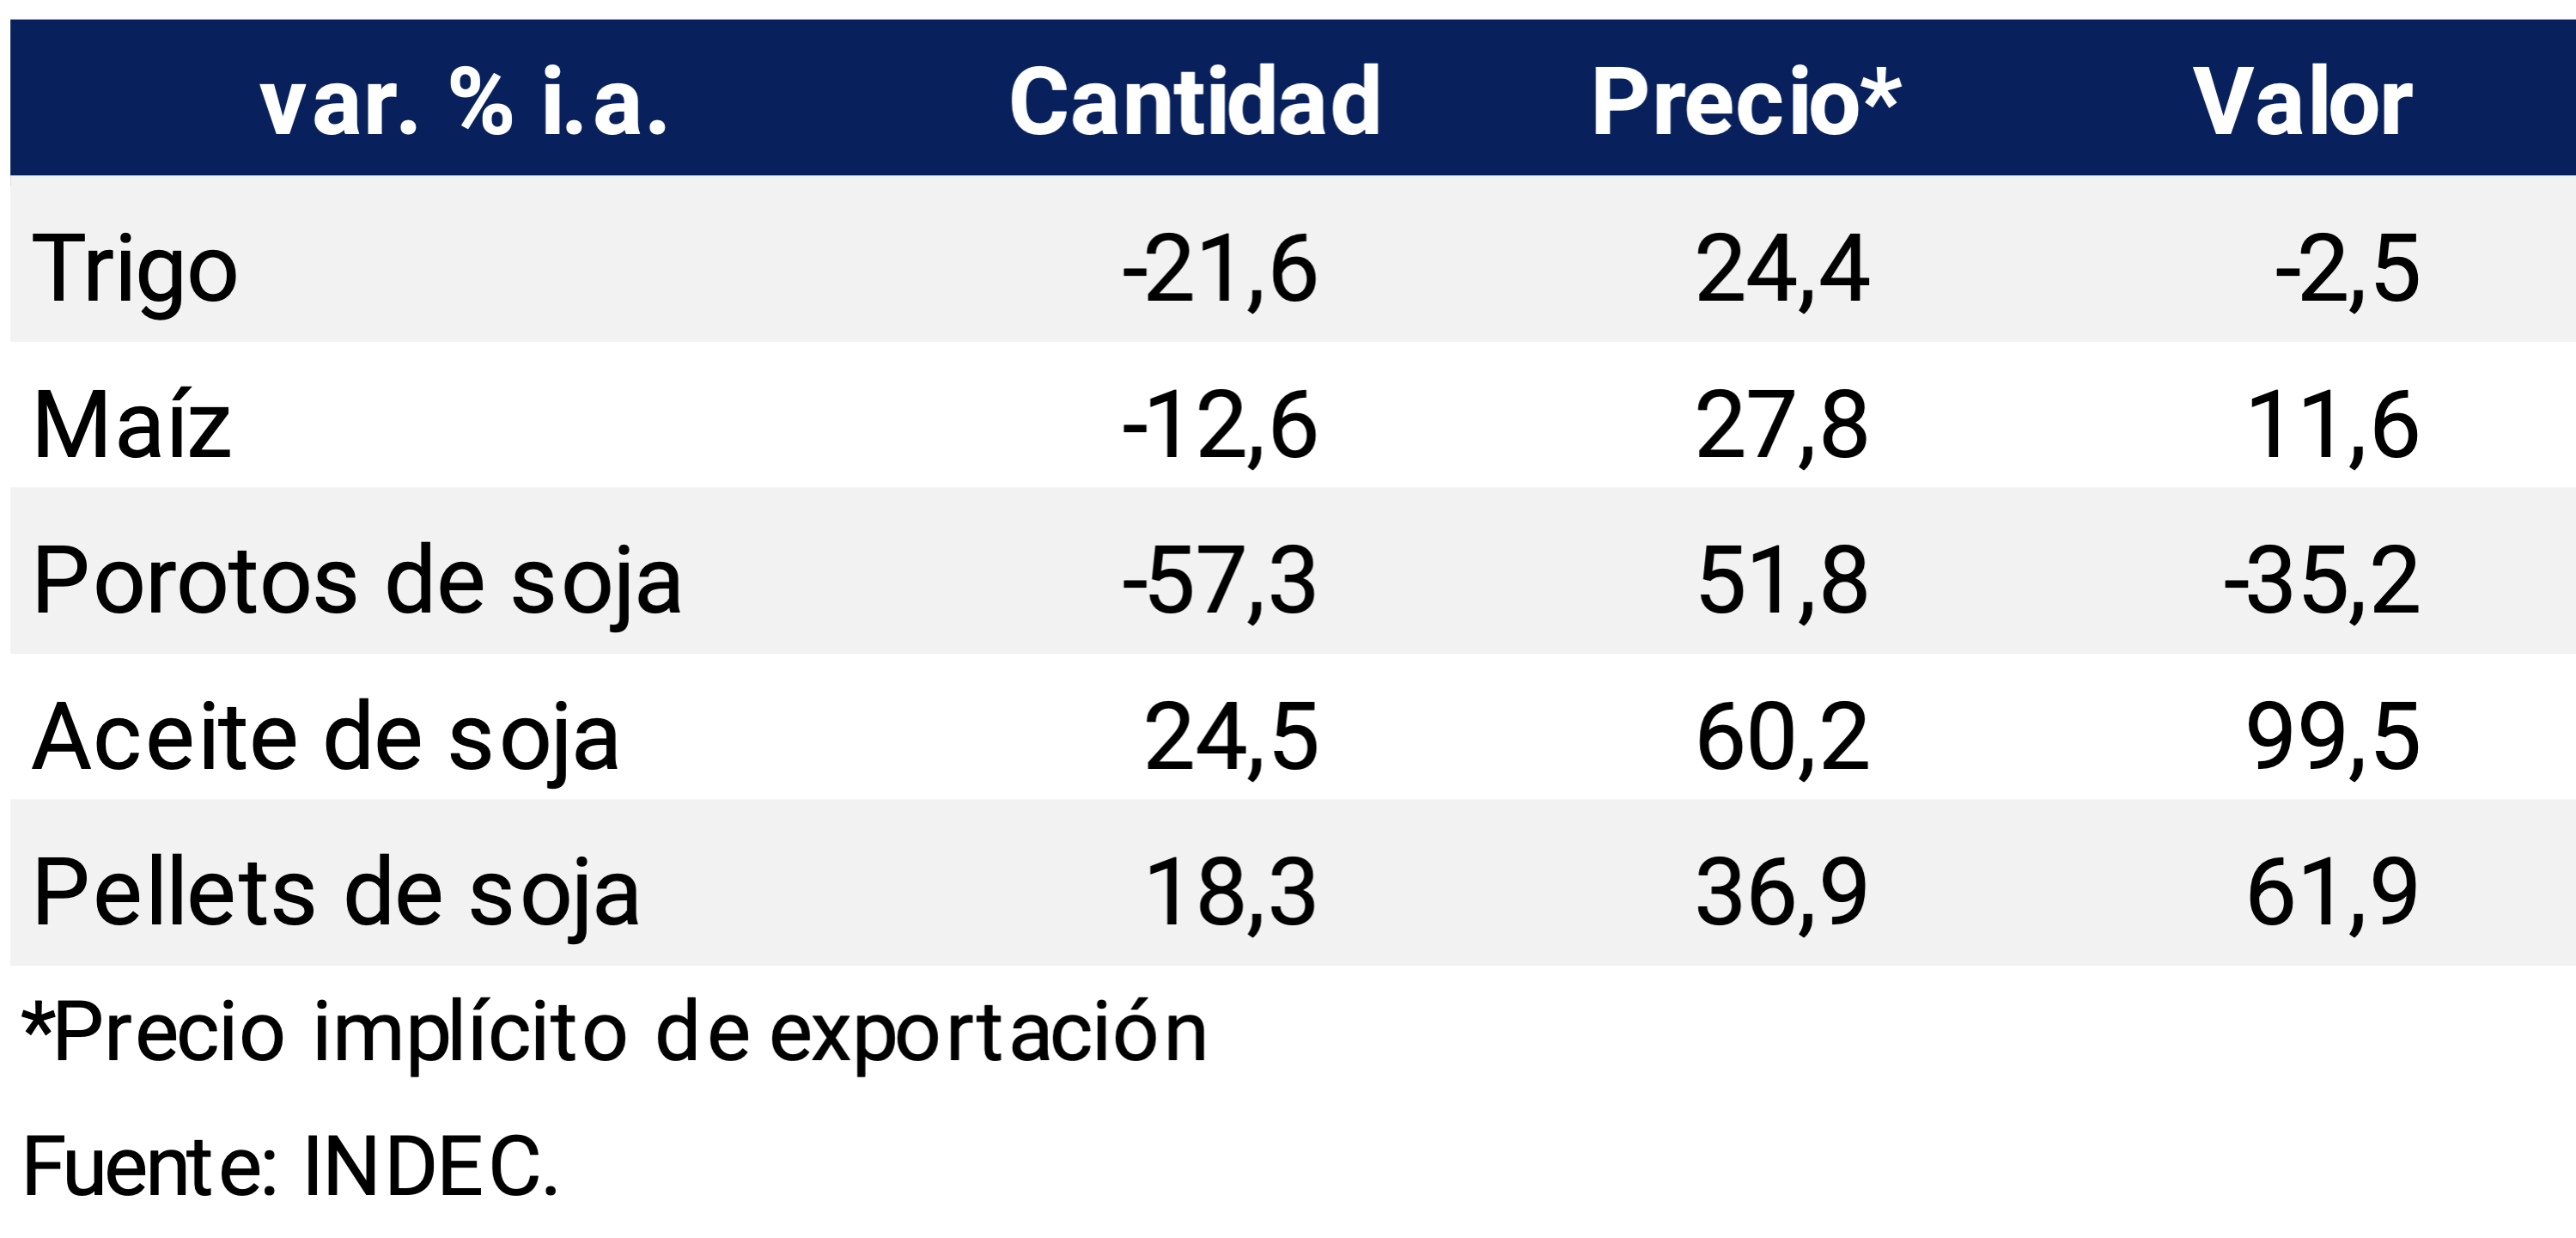
This increase in the export values of the main agricultural products was reflected in the result of the “Oilseeds and Cereals” sector in the foreign exchange market. In the accumulated for the period January to July, both income from the collection of exports of goods in the foreign exchange market, and net sales35 set an all-time record, totaling US$24,153 million and US$21,380 million, respectively. Compared to 2012, the year with the highest net sales for the sector prior to this campaign, export collections showed an increase of 20%, while net sales increased by 13%. Likewise, the relative importance of the sector over total income from exports of goods also marked the highest record in the series, standing at over 50% (see Graph 2).
Graph 2 | Exchange market. Net sales and receipts from exports of goods in the Oilseeds and Cereals sector. Cumulative January to July of each year
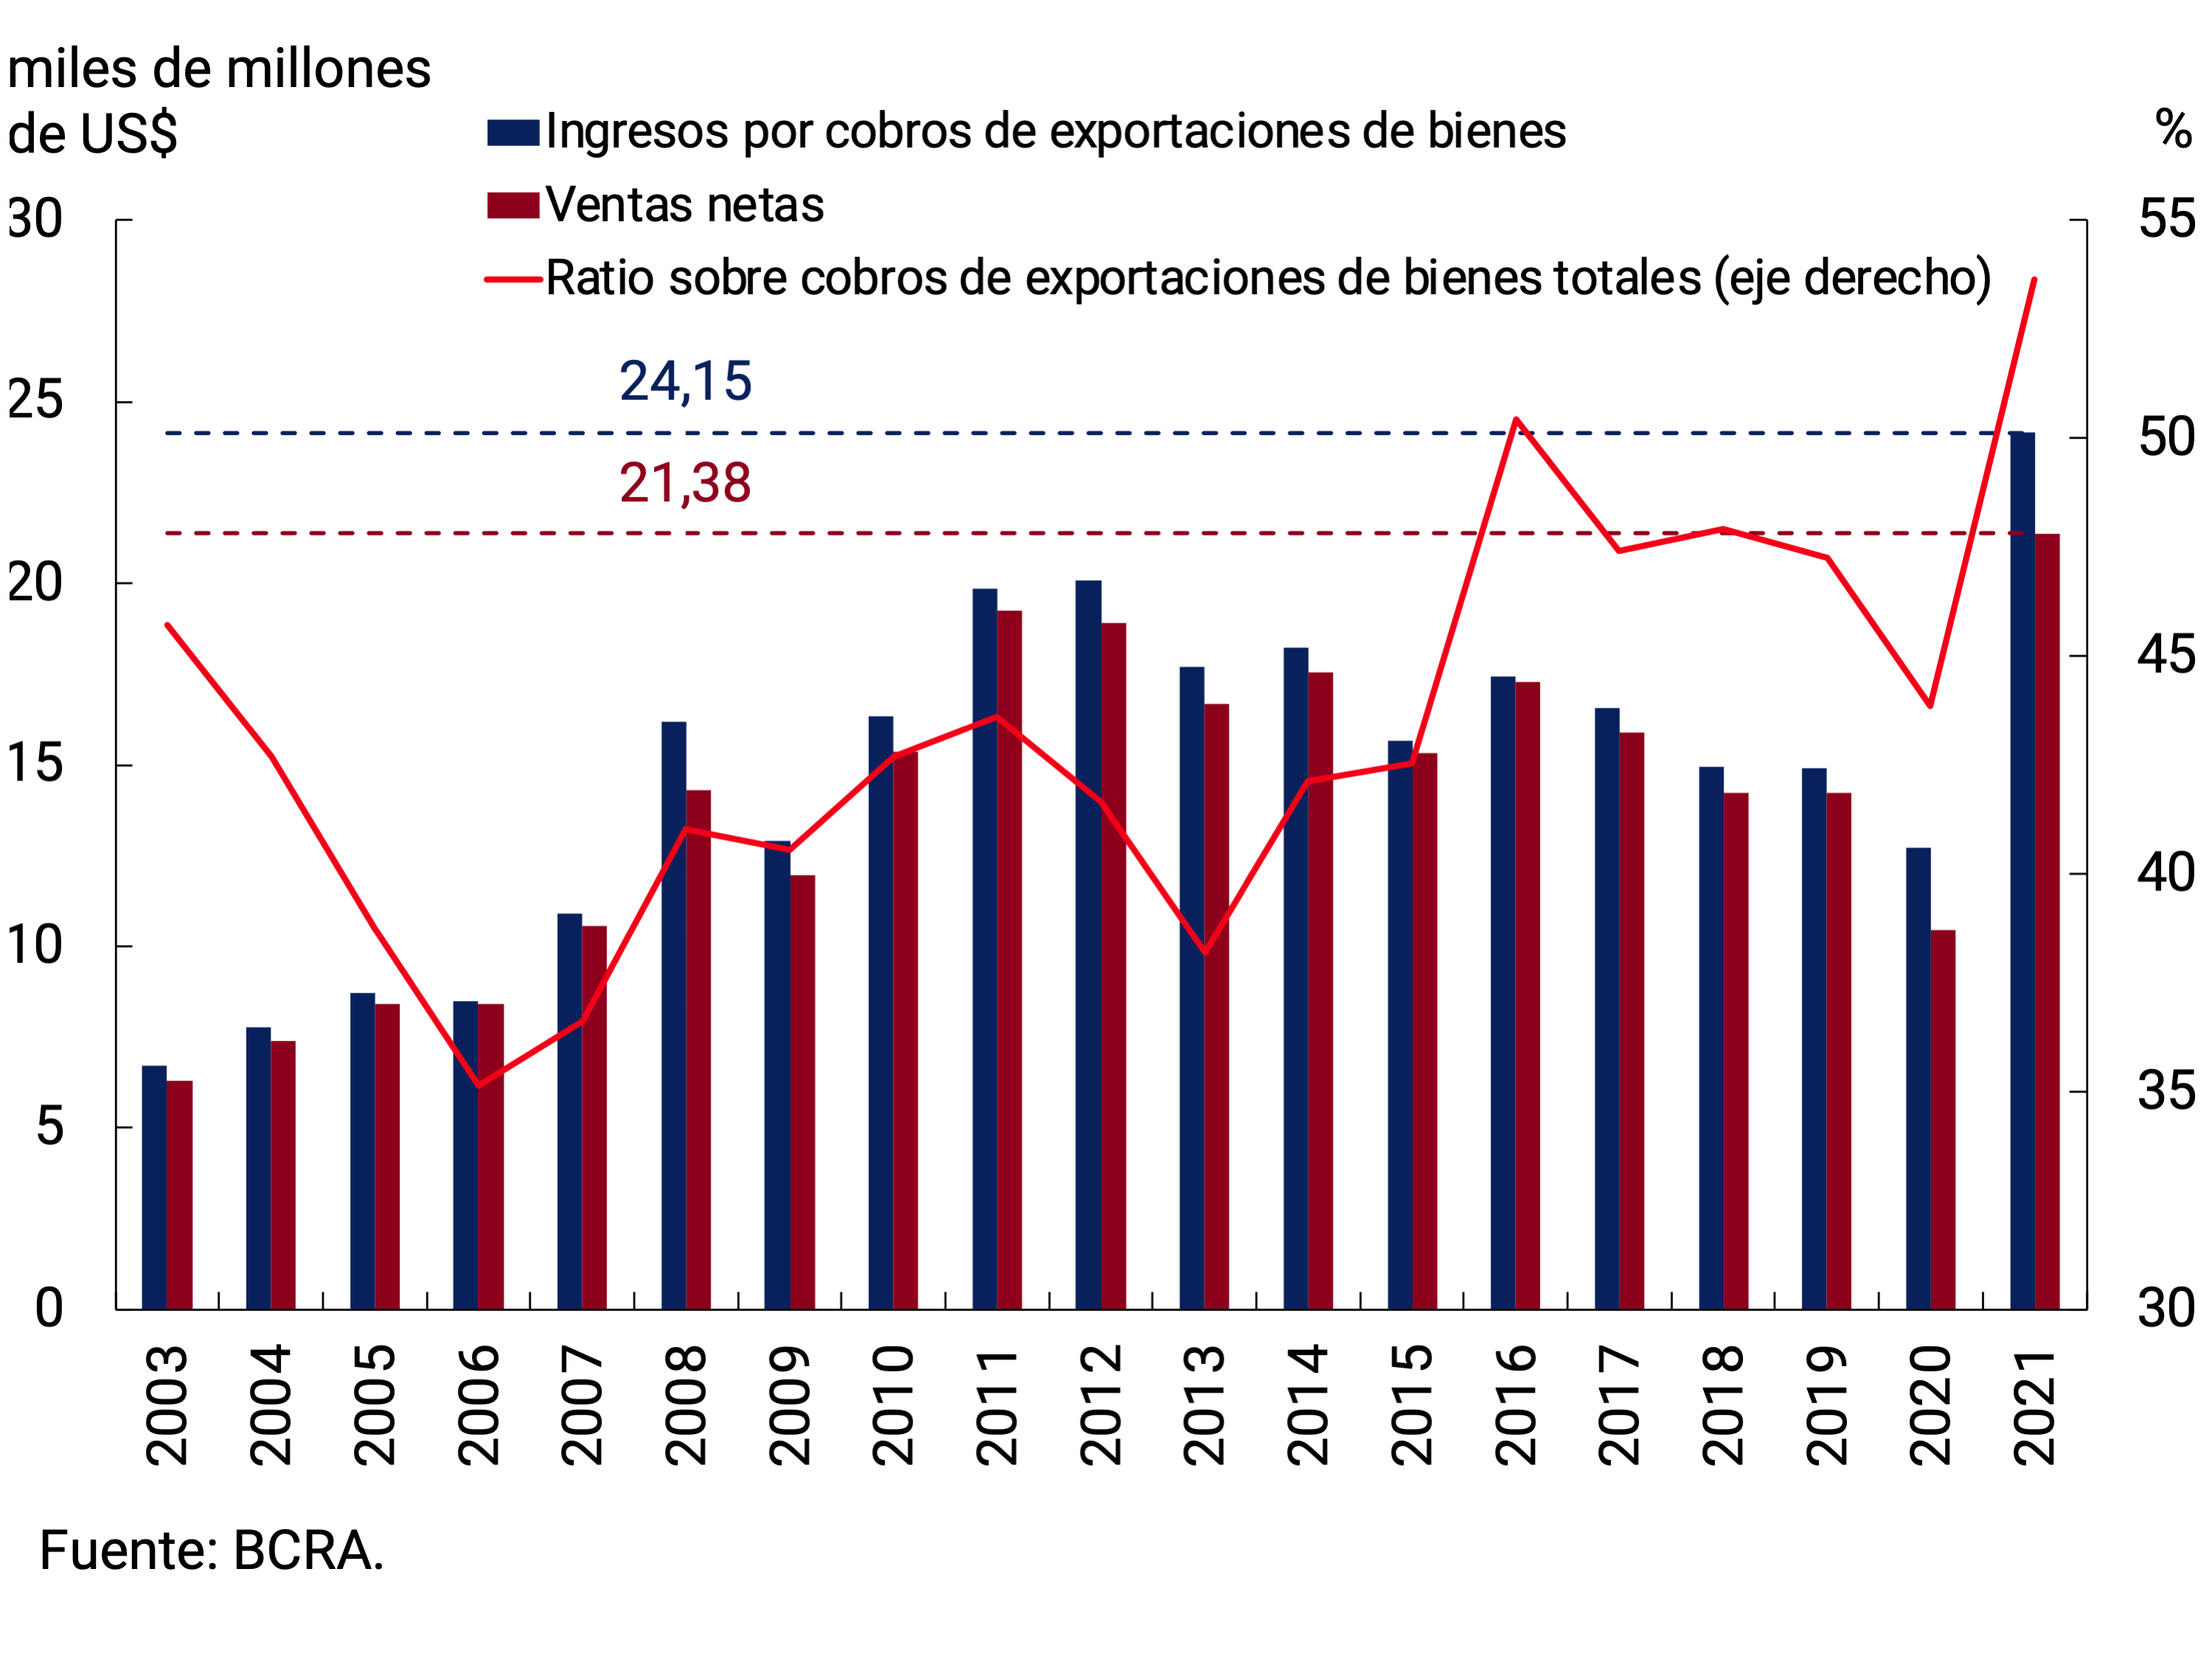
For their part, the Affidavits of Foreign Sales (DJVE) of agricultural products, through which the sale price is set and the amounts to be paid for export withholdings are defined, also showed a high level in the accumulated of the year by accounting for US$25 billion until July. It is estimated that DJVE has already been registered for all the quantities that are projected to be exported in 2021 in the case of soybeans, for 91% in the case of corn and 87% of wheat, while for soybean oil and soybean pellets it would remain to register 35% and 26%. respectively.
Unlike what happened in 2020, in the accumulated January to July, the revenues from export collections of the oilseeds and cereals sector were above FOB exports by about US$1.9 billion, so the sector increased its level of commercial indebtedness, either through the entry of pre-financing or advance export collections (see Graph 3).
Graph 3 | Oilseeds and cereals sector. DJVE, exports and export collections. Cumulative January to July of each year
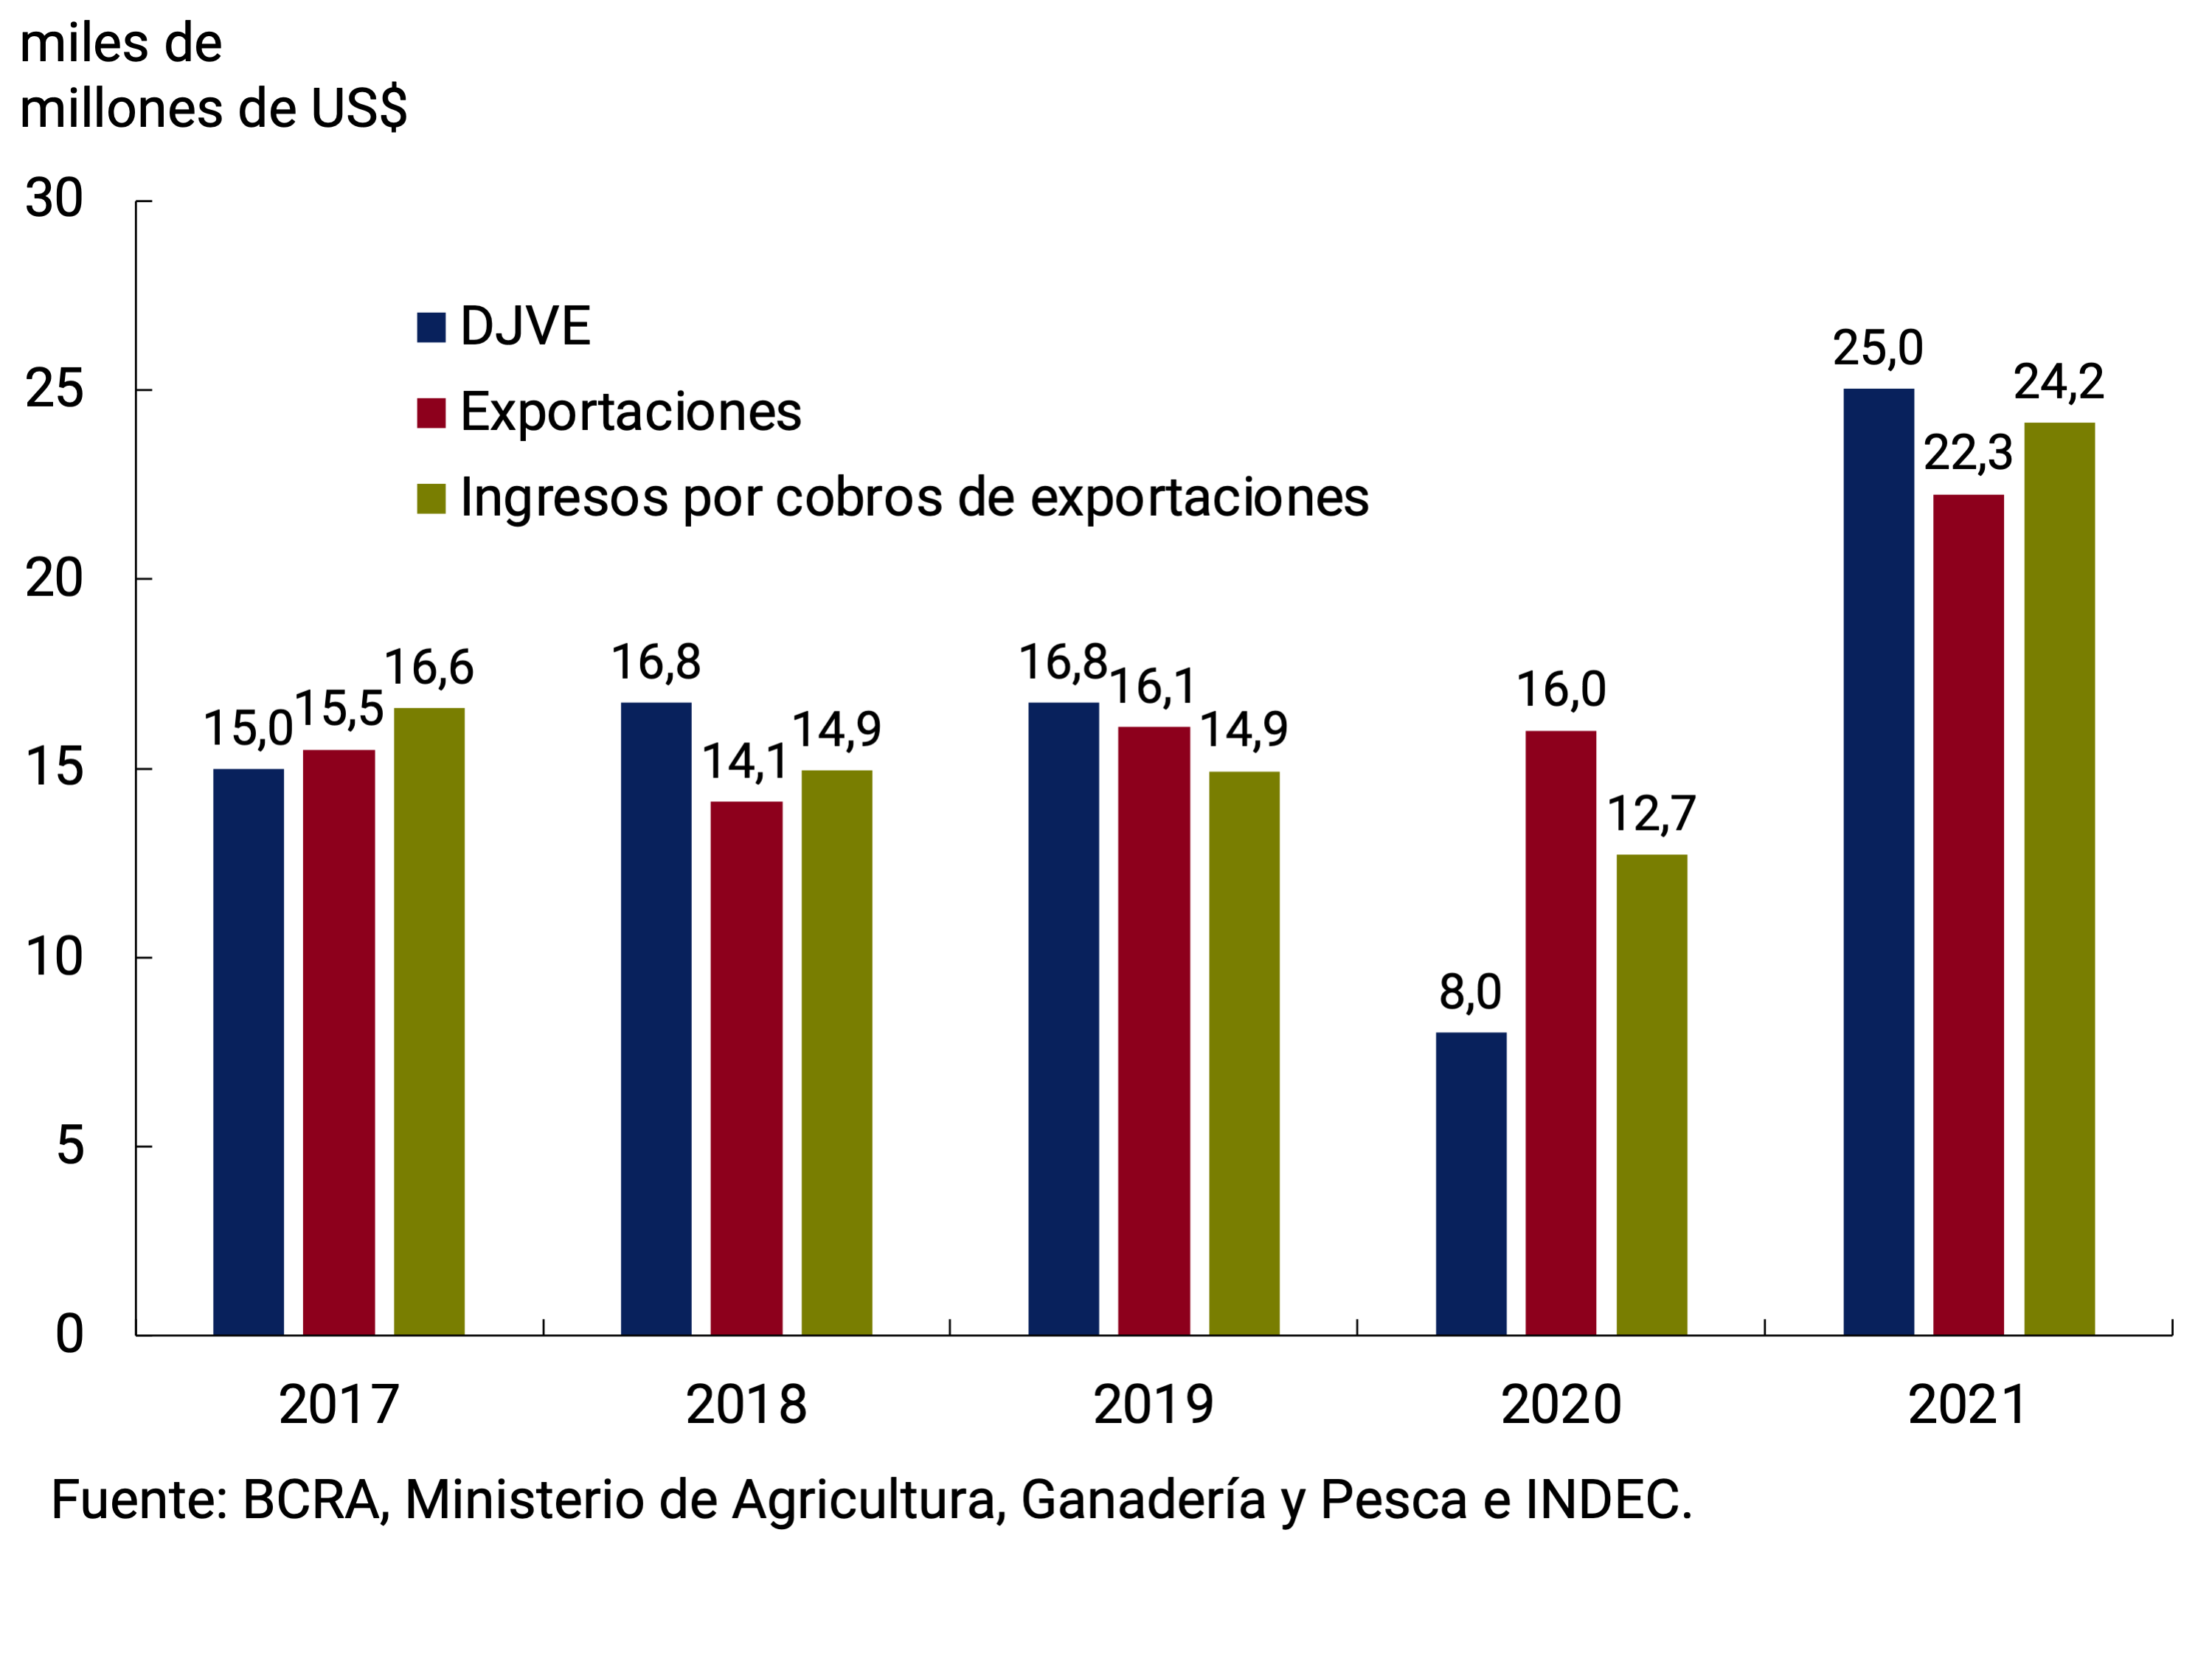
After a process of cancellation of external debt for exports during 2020, an increase in the level of commercial debt in the sector was observed since the beginning of this year, increasing 91% to reach US$5,000 million by July 2021. Although in nominal terms this is a high level, when measured in relation to exports, it can be seen that, due to the strong increase in exports, the values are among the lowest in the series (see Graph 4).
Figure 4 | Exports and External Debt for exports
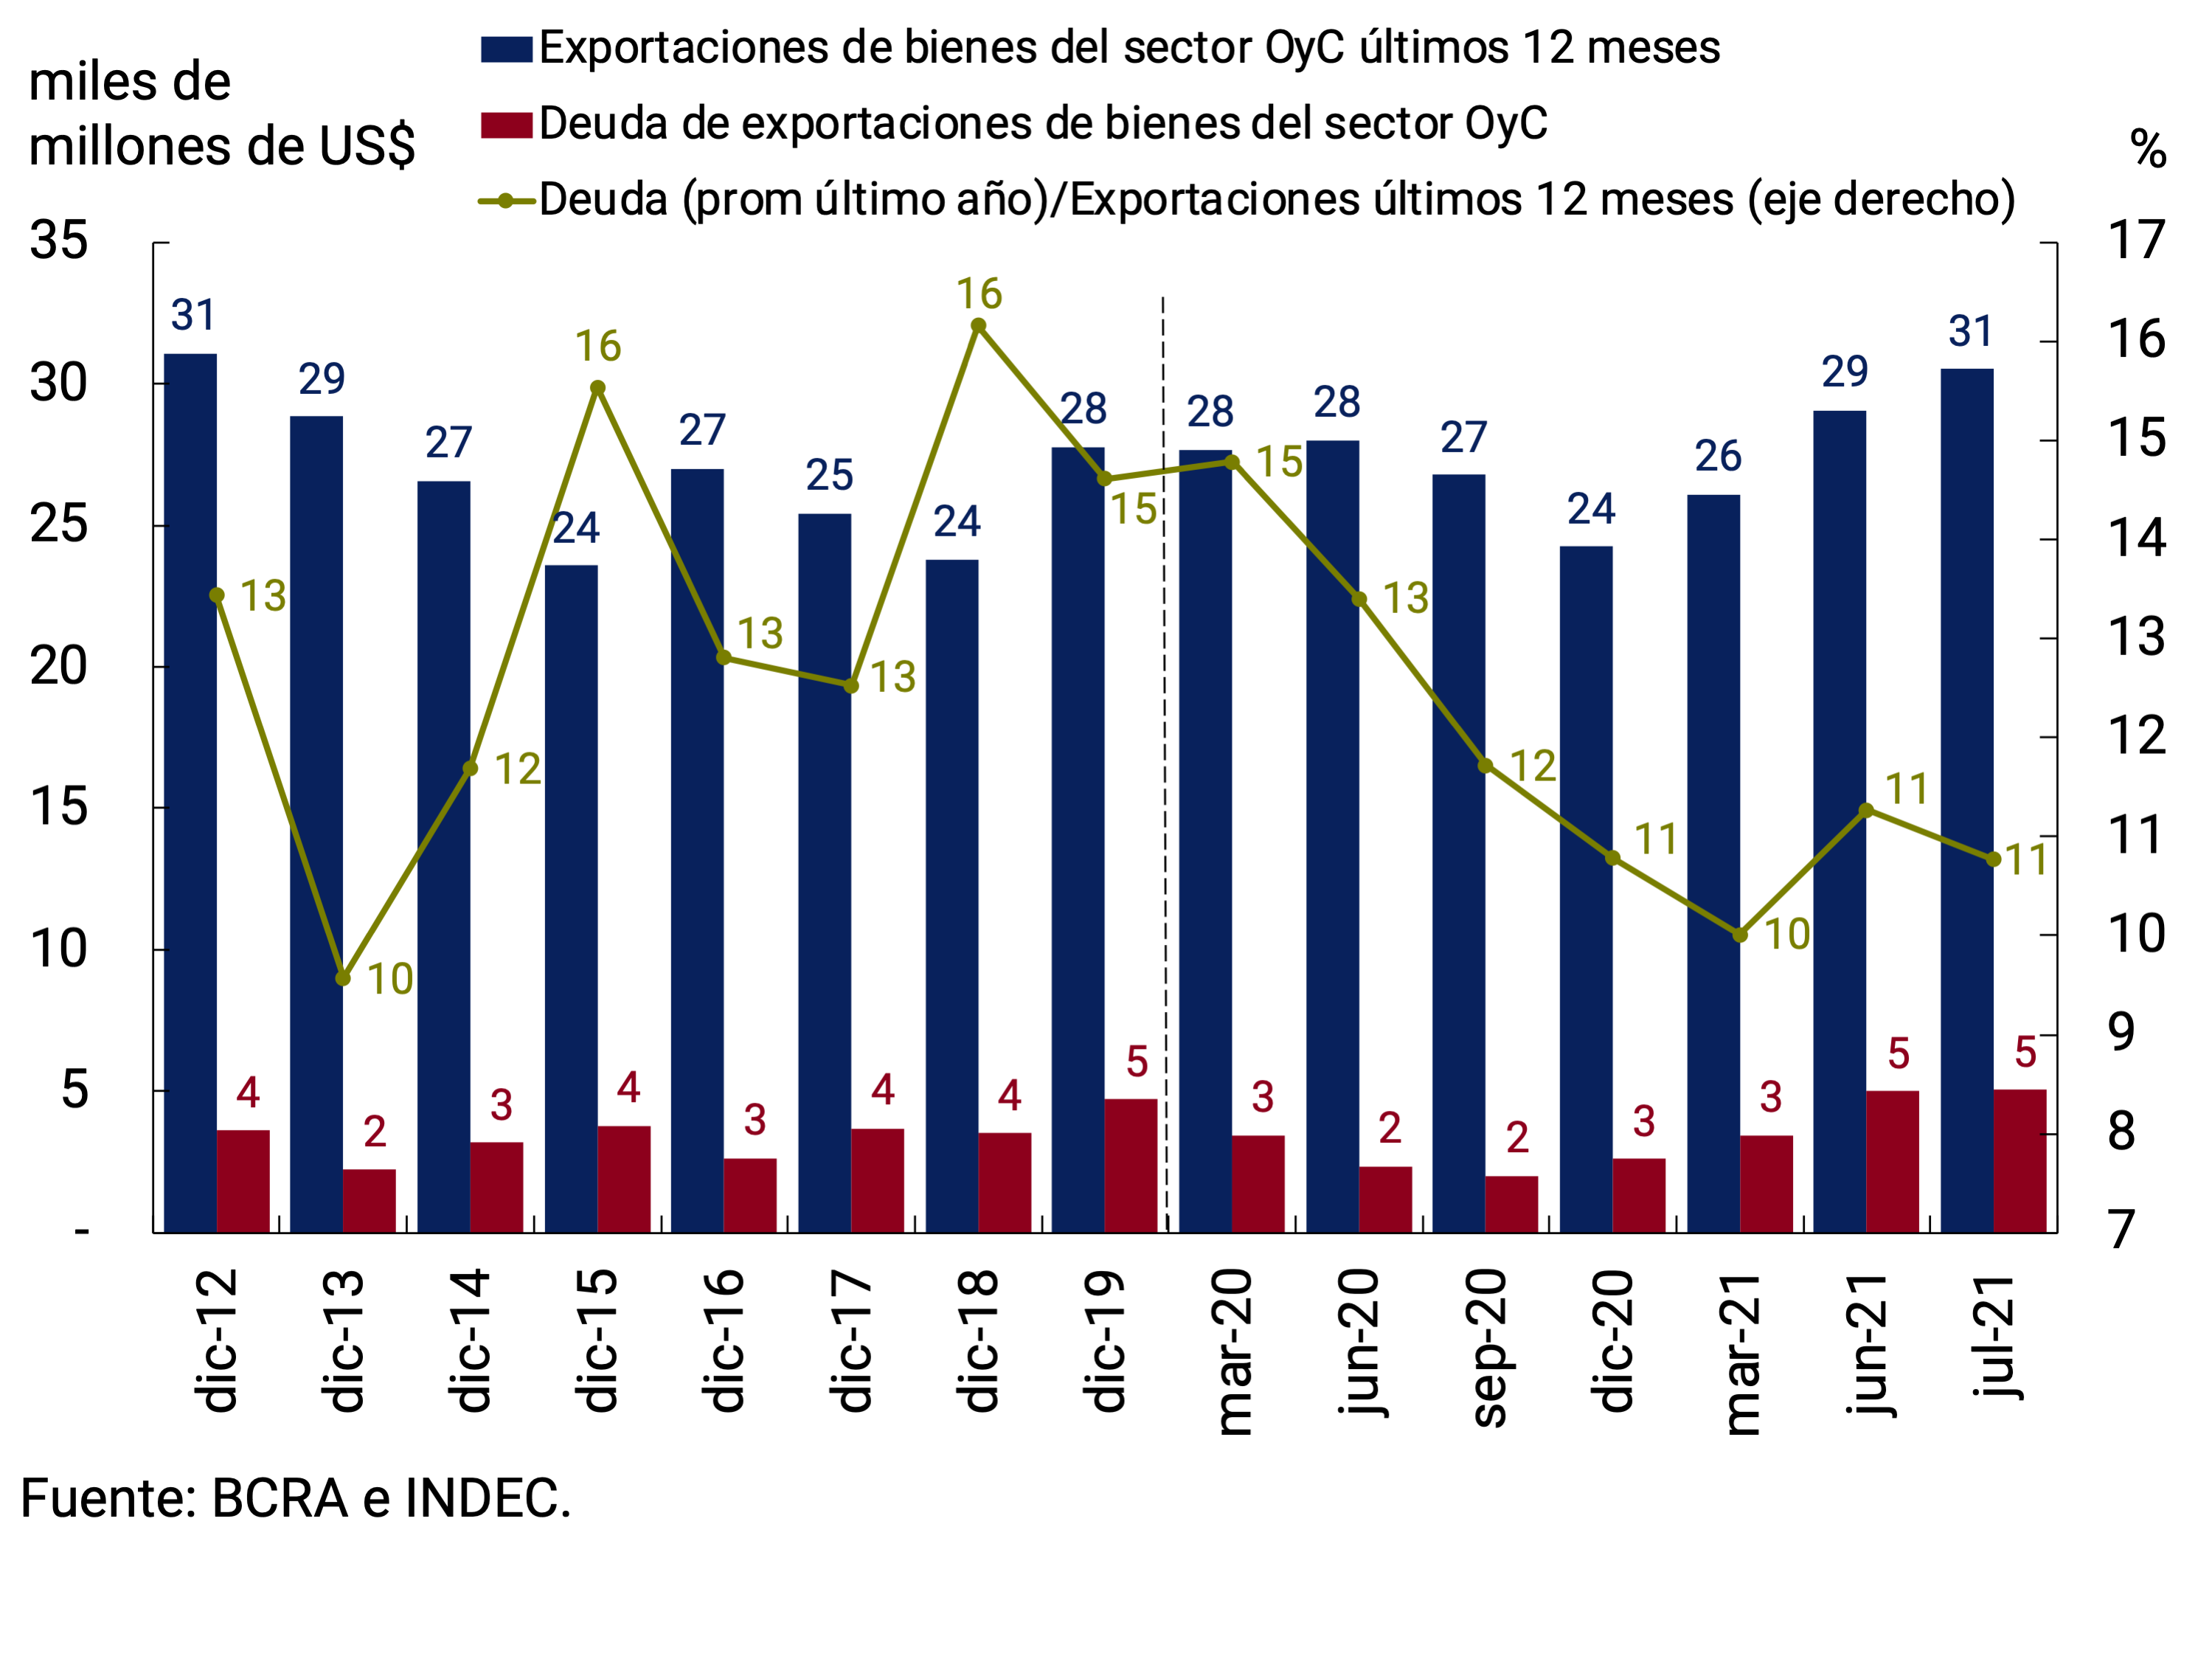
Section 5 / Solidarity and Extraordinary Contribution to help mitigate the effects of the pandemic
The impact of the COVID-19 pandemic generated the need to adopt emergency measures to provide protection to the most vulnerable sectors48. In turn, traditional resources were severely affected by the fall in activity. Based on a very compromised initial situation of the public accounts as a result of the macroeconomic crisis of 2018-2019, the National Government deployed measures to generate additional fiscal resources that would partially offset the growth in public spending that had to be faced extraordinarily to mitigate the effects of the pandemic.
Given the dimension of the current crisis, in various countries around the world there has been debate about the need to expand fiscal space based on taxes especially focused on large personal fortunes. As ECLAC Director Alicia Bárcena pointed out, “an exceptional situation requires exceptional responses”49. Similar considerations on the exceptional nature of the current moment were made by the IMF staff to ensure collection and promote solidarity: “consider increases in rates in the upper brackets of income tax, property tax and wealth tax, perhaps as a solidarity surcharge”50.
The Solidarity and Extraordinary Contribution to help mitigate the effects of the pandemic (Aporte), established by Law 27605, was one of the main instruments implemented by the National Government to expand and strengthen public resources in the framework of the COVID-19 pandemic.
The Contribution was sanctioned by the Congress of the Nation as an extraordinary and one-time tax, seeking to tax the large fortunes of individuals. Its primary objectives are equity and solidarity, reaching on the one hand individuals and undivided estates resident in the country for all their assets in the country and abroad and on the other hand non-resident individuals and undivided estates, for all their assets in the country. The date to consider the valuation of the assets was the date of entry into force of the law, that is, December 18, 2020.
The assets covered by the Contribution are those included and valued in accordance with the rules established by the Personal Assets Tax, regardless of the treatment they have in said tax and without deduction of any non-taxable minimum. In the case of subjects resident in the country, contributions to trusts, trusts or foundations of private interest and other similar structures, participation in companies or other entities of any type without tax personality and direct or indirect participation in companies or other entities of any type, existing on the date of entry into force of this law, are included in the taxable base.
Only those who had a declared wealth of more than $200 millionwere reached 51 with an aliquot of 2.0%, and with incremental rates starting at $300 million. In the case of assets abroad, the rates are increased by 50%, following the guidelines and legislative policy outlined in December 2019 with the enactment of Law 27541 (see Table 1).
Table 1 | Contribution rates
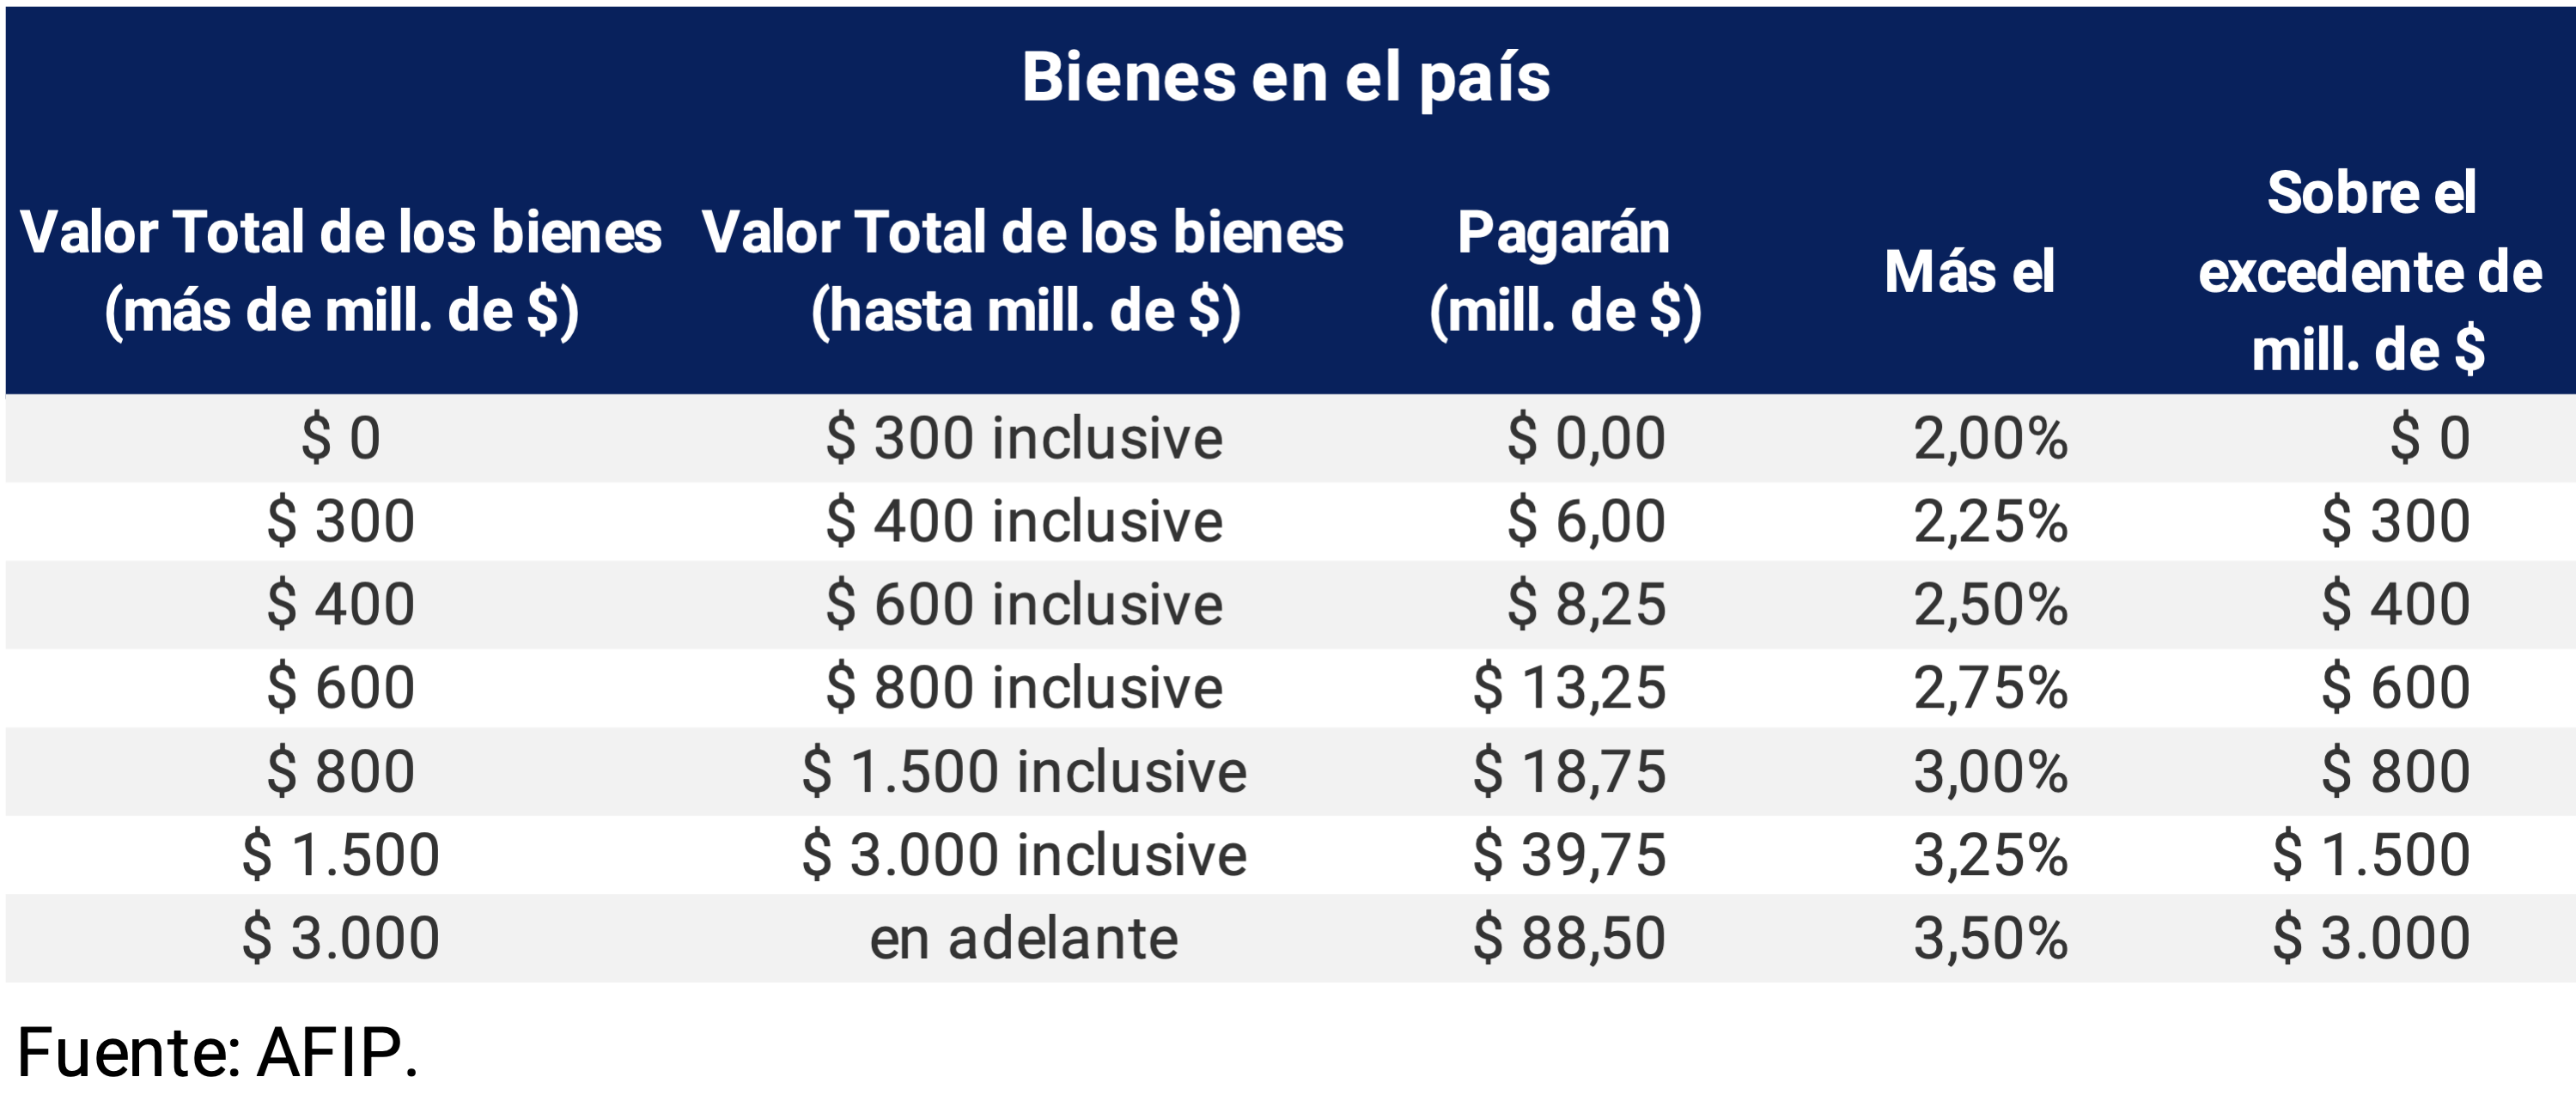
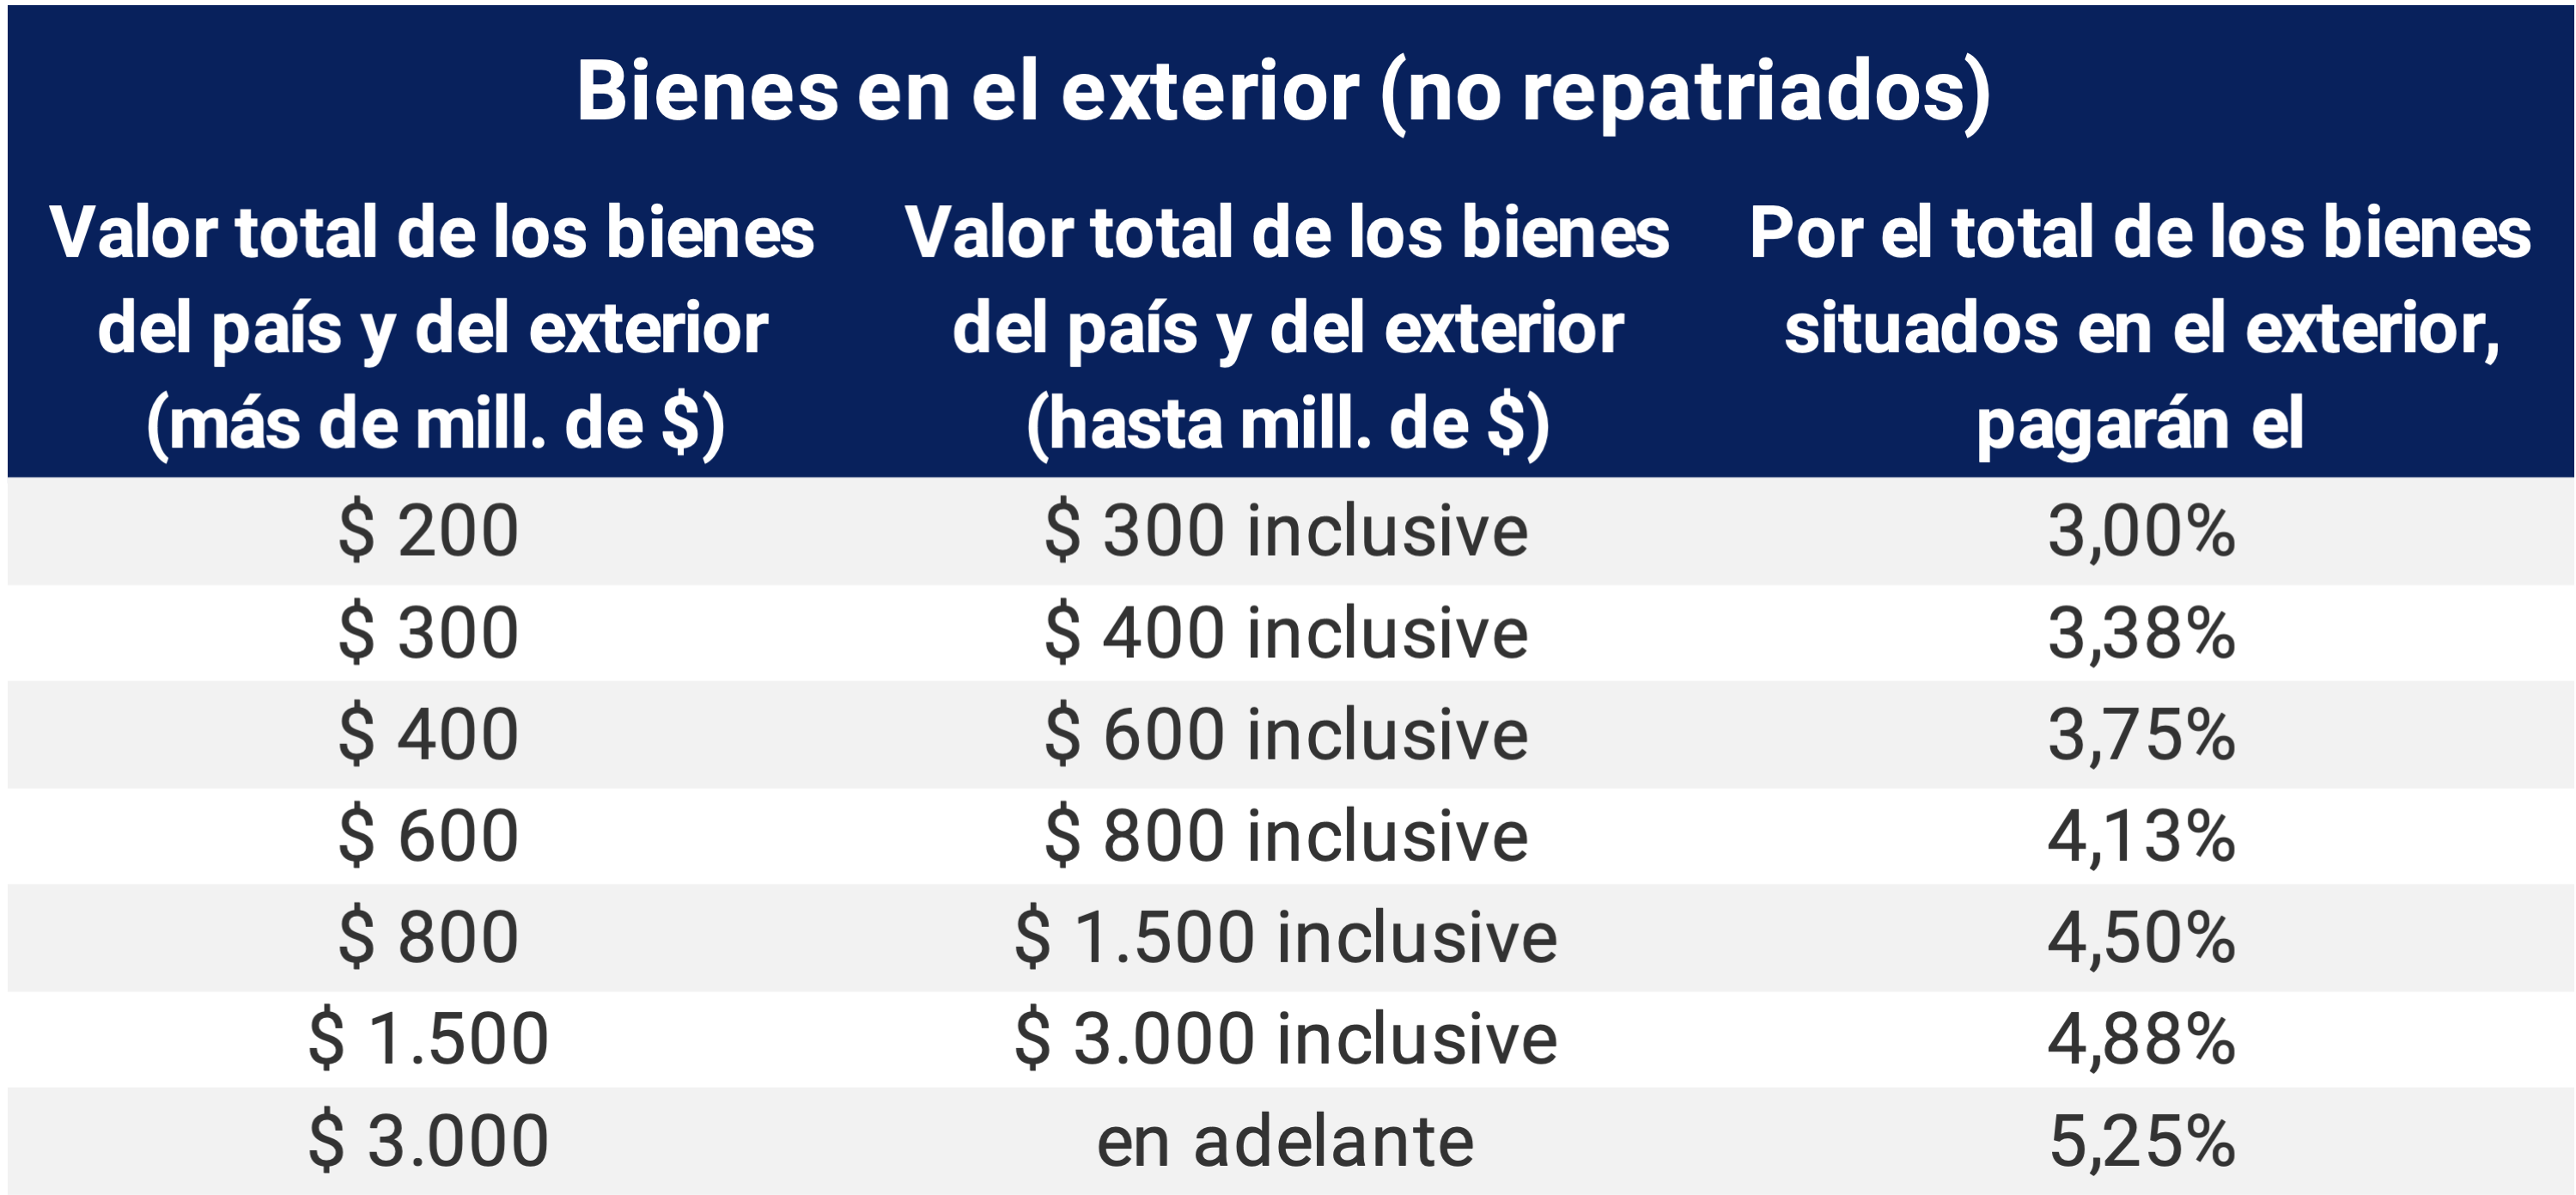
As for the rates on holdings abroad, they are reduced to the same level that applies to assets in the country, as long as at least 30% of the financial holdings abroad are repatriated within a certain period. This was a benefit for the holders of assets abroad, to the extent that foreign currency entered the country, and that they contributed to expanding financing for domestic productive activity and improving the main macroeconomic balances.
The affidavit was filed until April 30, 2021. In order to contribute to the fulfillment of taxpayers’ obligations, the possibility of canceling the Solidarity and Extraordinary Contribution through a regime of payment facilities was enabled. The individuals and undivided estates reached could choose to make an advance of 20% of the consolidated debt and pay the resulting balance in up to 5 consecutive monthly payments, financed at the compensatory interest rate used for tax purposes.
The estimated universe of contributors was approximately 10,000 taxpayers, who paid in cash or accessed the payment plan to meet the payment of the Contribution. Of these ten thousand taxpayers, only 26% were women, while the remaining 74% were by men52. If the funds collected are taken into account, both in cash and in installment payment plans, 24% were contributed by women, while men paid 76%.
About half of the individuals reached by this extraordinary contribution belong to the first two tranches, between $200 and $400 million. It is estimated that those who are reached with the highest rate were less than 400 human persons. It was estimated that only about 253 contributors would have contributed half of the total collection with average contributions close to $608 million (see Graph 1).
Graph 1 | Contribution to estimated
revenue Percentage of total
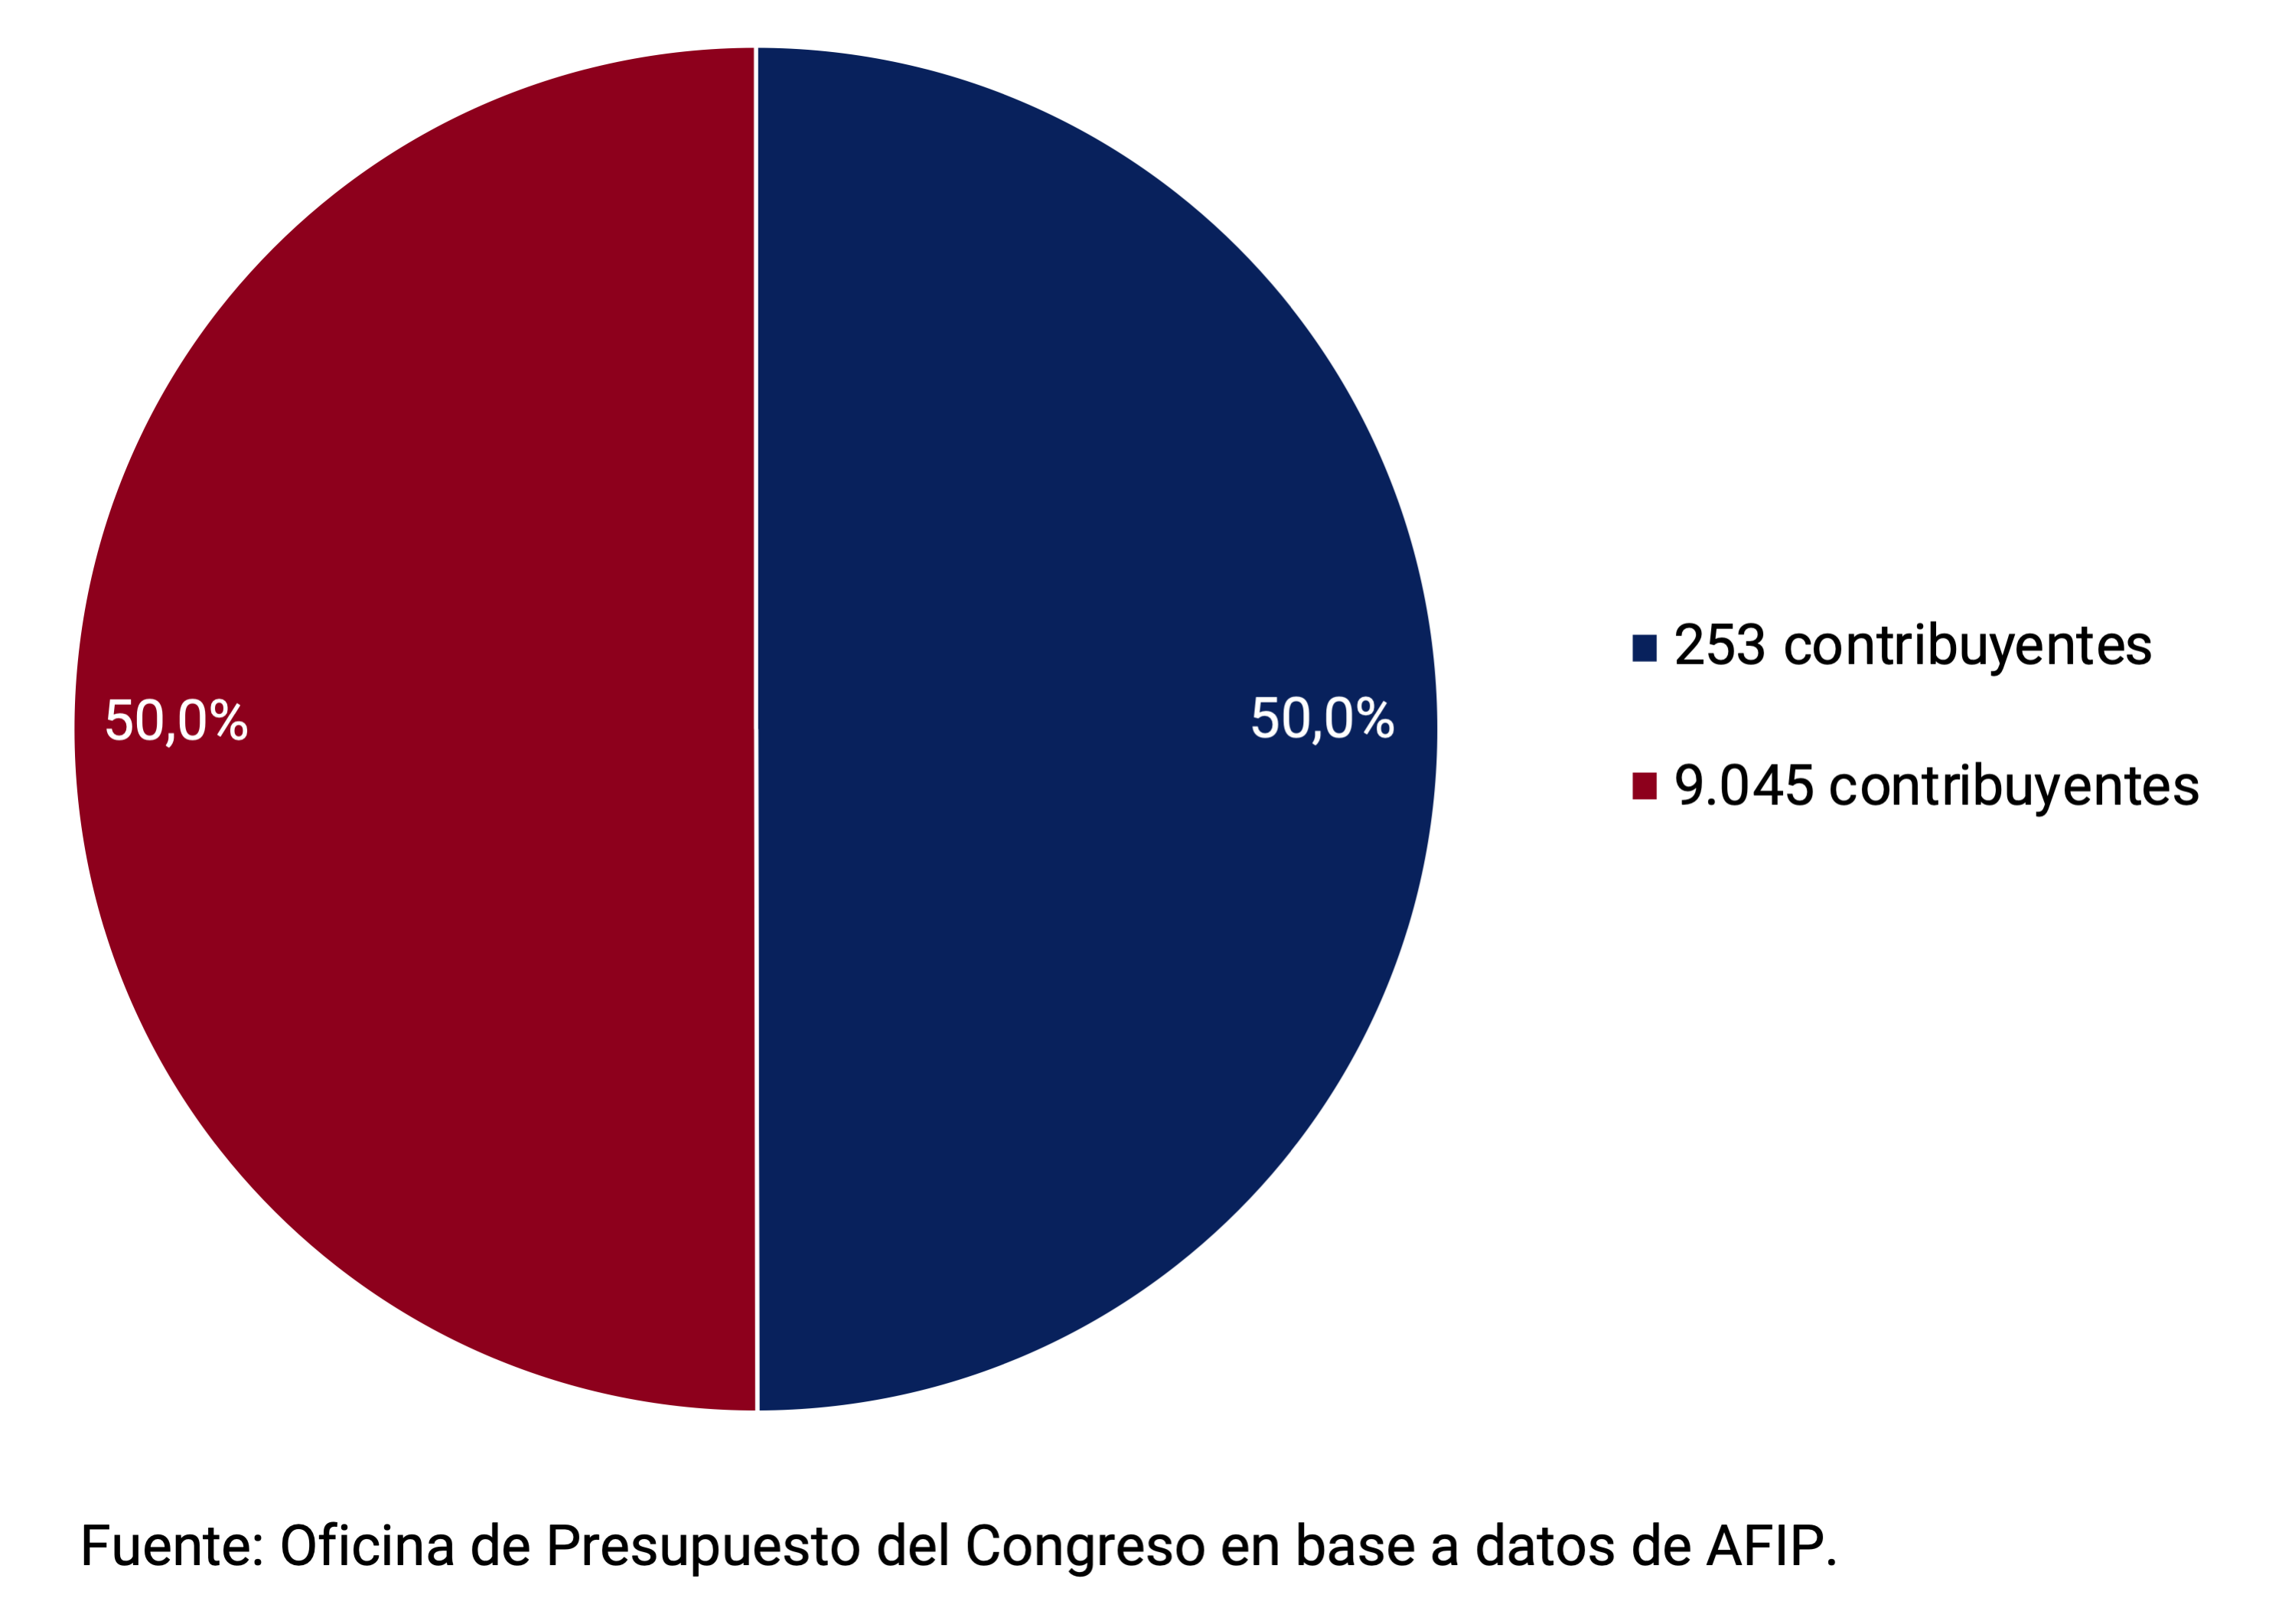
The revenues received until July 2021 from this contribution – which is considered as a non-tax income of the National Non-Financial Public Sector, but not as part of the national tax collection – totaled about $197,000 million, while it is estimated that the annual collection will reach about $250,000 million (approximately 0.6% of GDP). The annual figure would be between 8% and 19% below the maximum values originally estimated by the AFIP, which assumed for this calculation that no repatriations of assets would be carried out to reduce the rates (between $272,490 million and $307,898 million)53. The average payment of the tax was estimated at around $33 million per taxpayer. The tax base estimated by AFIP amounted to $8,856,961 million.
The law establishing the specific destinations of the funds was established. Thus, the proceeds were allocated to the provision of supplies, equipment and medicines to combat the pandemic, to subsidies to micro, small and medium-sized enterprises (MSMEs), to Progresar scholarships managed by the Ministry of Education, to the improvement of health and housing conditions of the inhabitants of popular neighborhoods (Socio-Urban Integration Fund (FISU). and the exploration, development and production of natural gas through Integración Energética Argentina S.A. jointly with YPF S.A.
Section 6 / The importance of variety in savings instruments
One of the pillars of monetary policy since the beginning of the BCRA’s current administration has been to promote savings and credit in domestic currency for households and companies. This monetary policy objective was intensified during the pandemic. On the one hand, the BCRA accompanied the process of recovery of economic activity that began in May 2020 by keeping the reference interest rates unchanged. On the other hand, the determination of minimum interest rates for fixed-term placements and the existence of various savings instruments in pesos, which make it possible to safeguard the value of capital and ensure a positive return with respect to the evolution of prices and the exchange rate, contributed to promoting savings even in a context of crisis. Regarding the latter, the current management generated a series of new instruments that complemented the existing ones and that presented great dynamism so far this year.
The following is a breakdown of the main savings instruments in pesos that safeguard the purchasing power of agents76.
Traditional UVA time deposits: these deposits are instrumented in pesos and converted into Purchasing Value Units (UVA) at the time of placement. At the end of the immobilization period, the accrued interest is calculated and the updated capital is converted according to the value of the UVA at the time. It should be noted that the price of UVA is continuously updated based on the Reference Stabilization Coefficient (CER). The minimum placement term of this instrument is 90 days.
Pre-cancellable UVA time deposits: since February 2020, the option of making UVA time deposits with an early cancellation option has been available. Although these deposits have a term of 90 days, the saver can only make use of the pre-cancellation option from the 30th. The rate paid by these instruments is different if it is pre-canceled or if it is maintained until maturity. In the first case, the interest rate is fixed in pesos and currently stands at 30.5% n.a. (equivalent to 80.26% of the monetary policy rate). In the second case, and in the case of individuals, a minimum guaranteed interest rate of 1% n.a. + UVA77 is paid.
UVA piggy bank: consists of a savings account in UVA whose funds are immobilized for a minimum period of 90 days. From that period, people have the money deposited as if it were a traditional savings bank, being able to make cash withdrawals. The amount of the withdrawal in pesos is converted into UVA at the time of withdrawal and deducted from the account balance.
Among these instruments, UVA fixed-term deposits (traditional and pre-cancelable) were the ones that showed the greatest expansion in the year. In fact, until mid-August, fixed-term placements in UVA expanded 220%, highlighting in particular those with an early cancellation option, which achieved a growth of 390%. Thus, this type of placement recently reached an all-time high of $185,466 million. These growth rates allowed them to gain share in the total number of term loans, although they still represent a limited proportion of them (see Graph 1).
Graph 1 | Fixed-term deposits in UVA
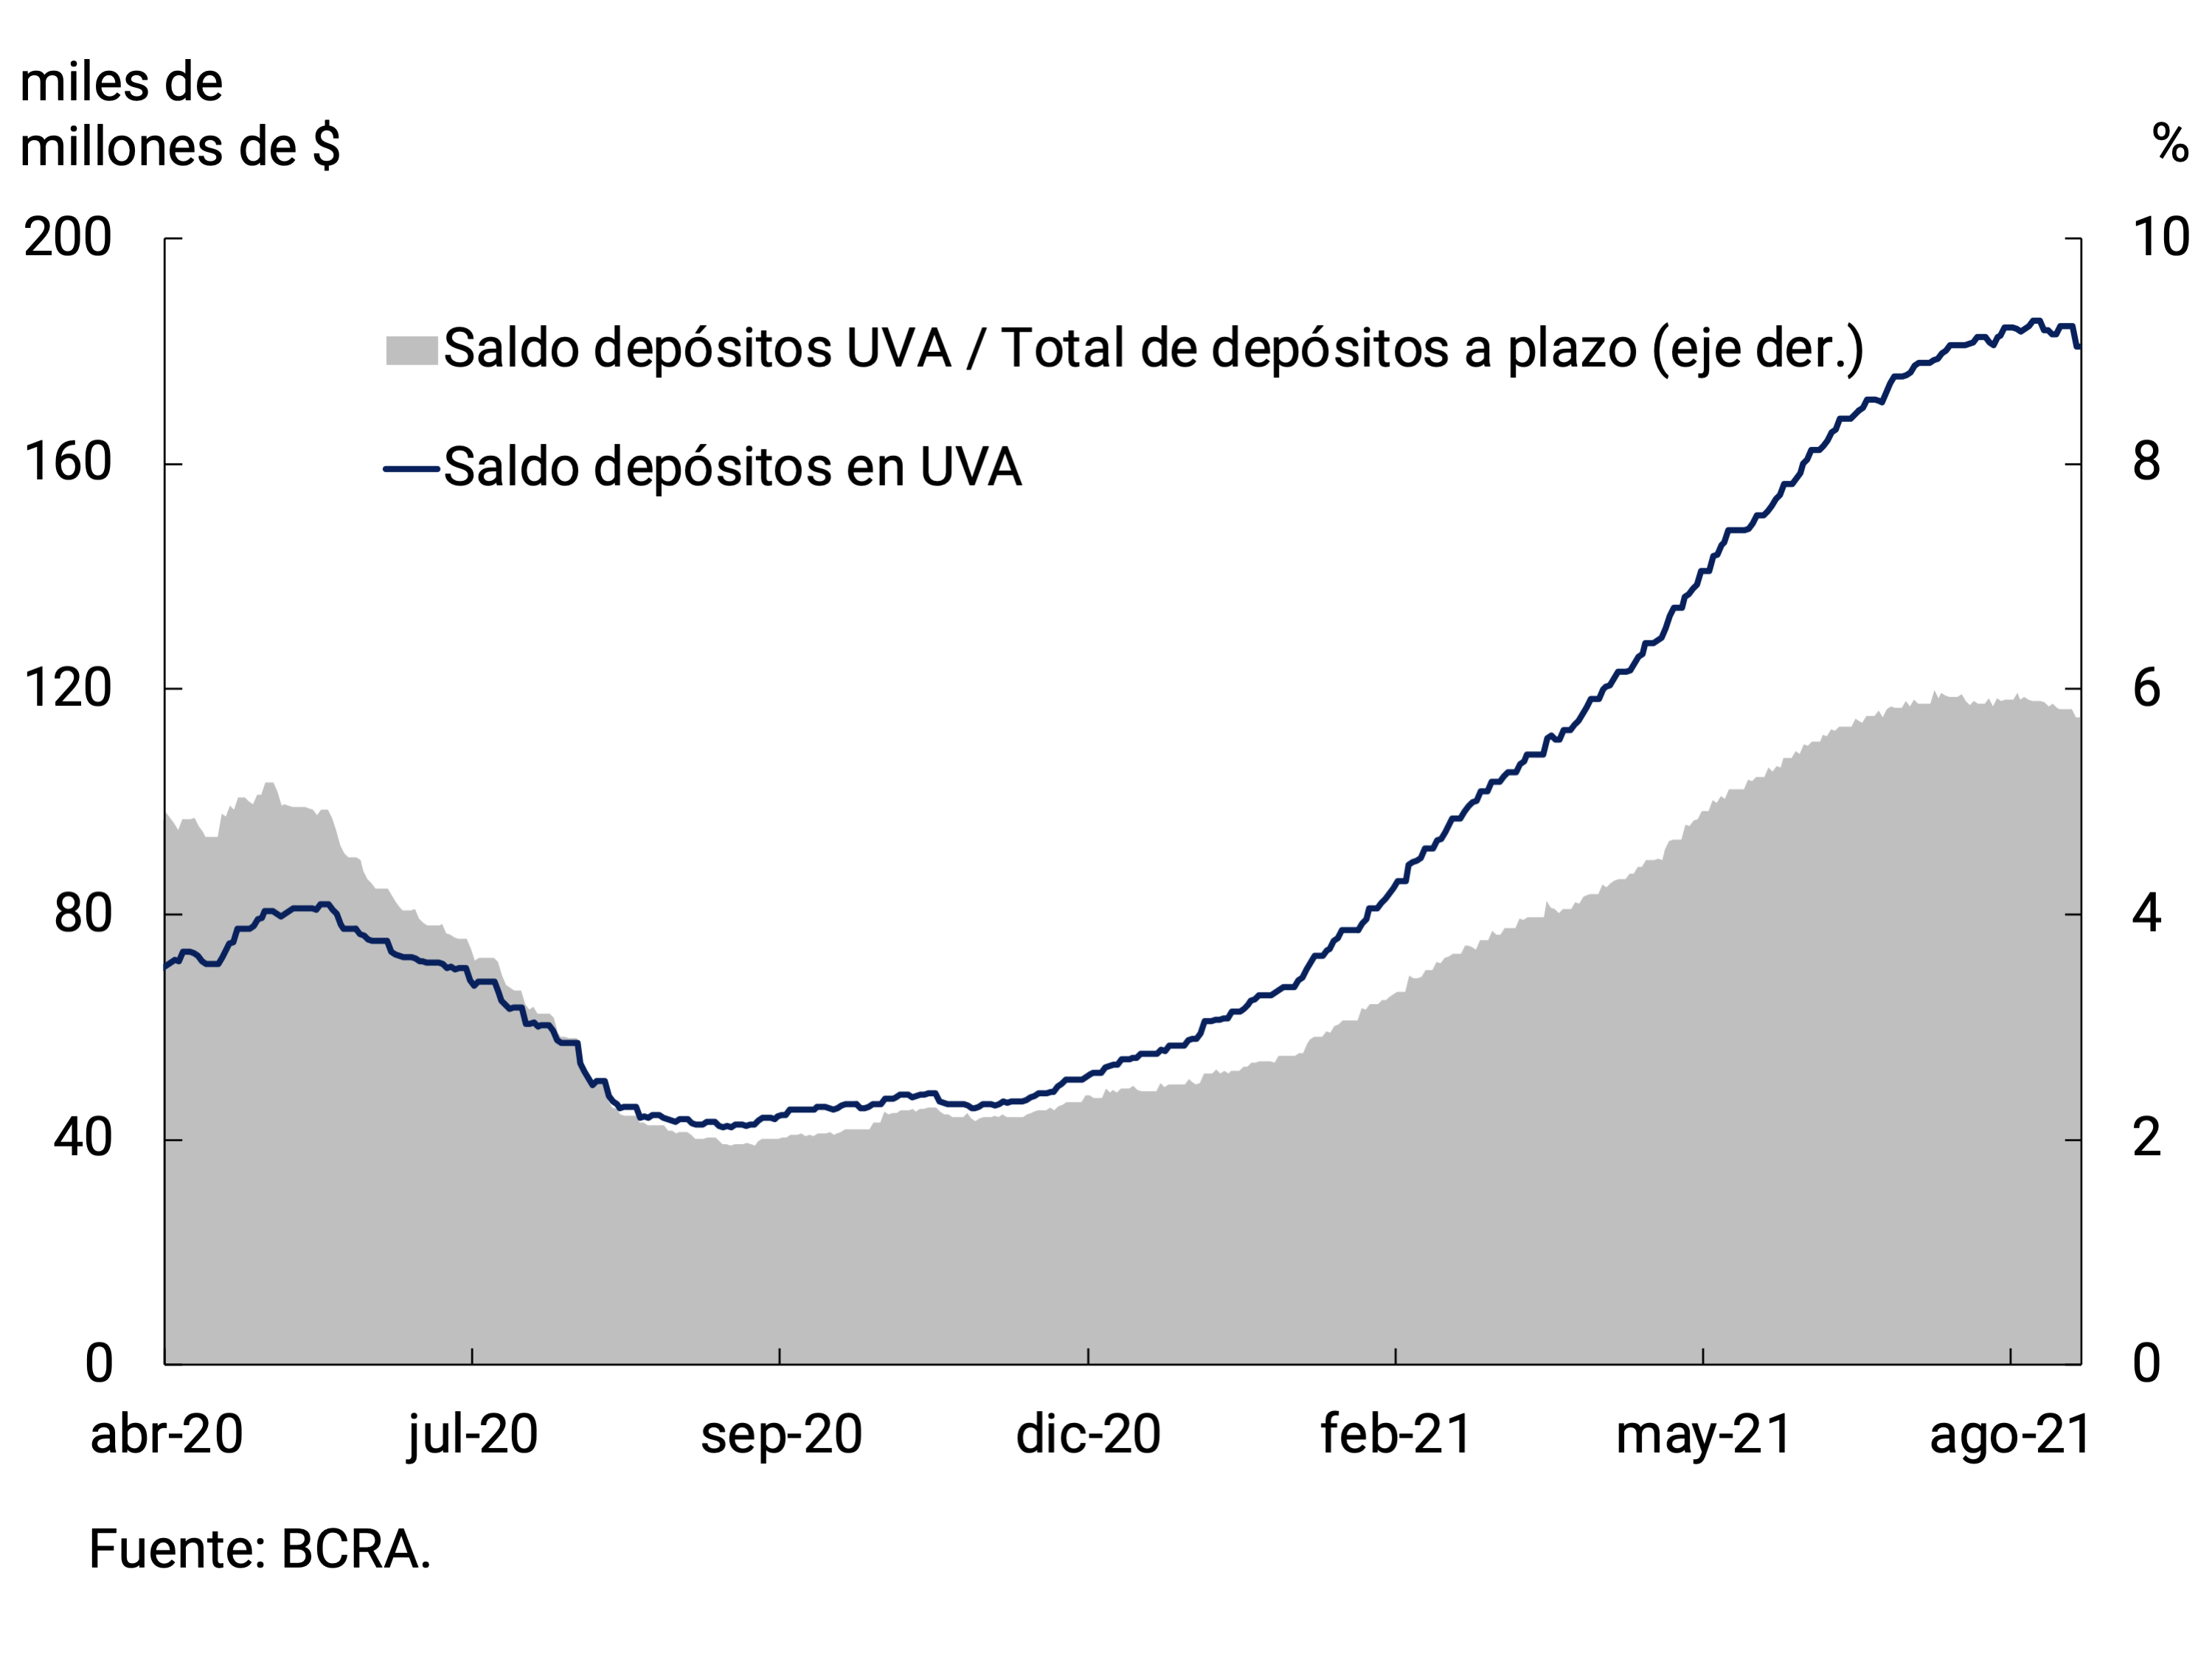
Graph 2 | Spread between UVA fixed term and pesos, and evolution of the UVA fixed term balance
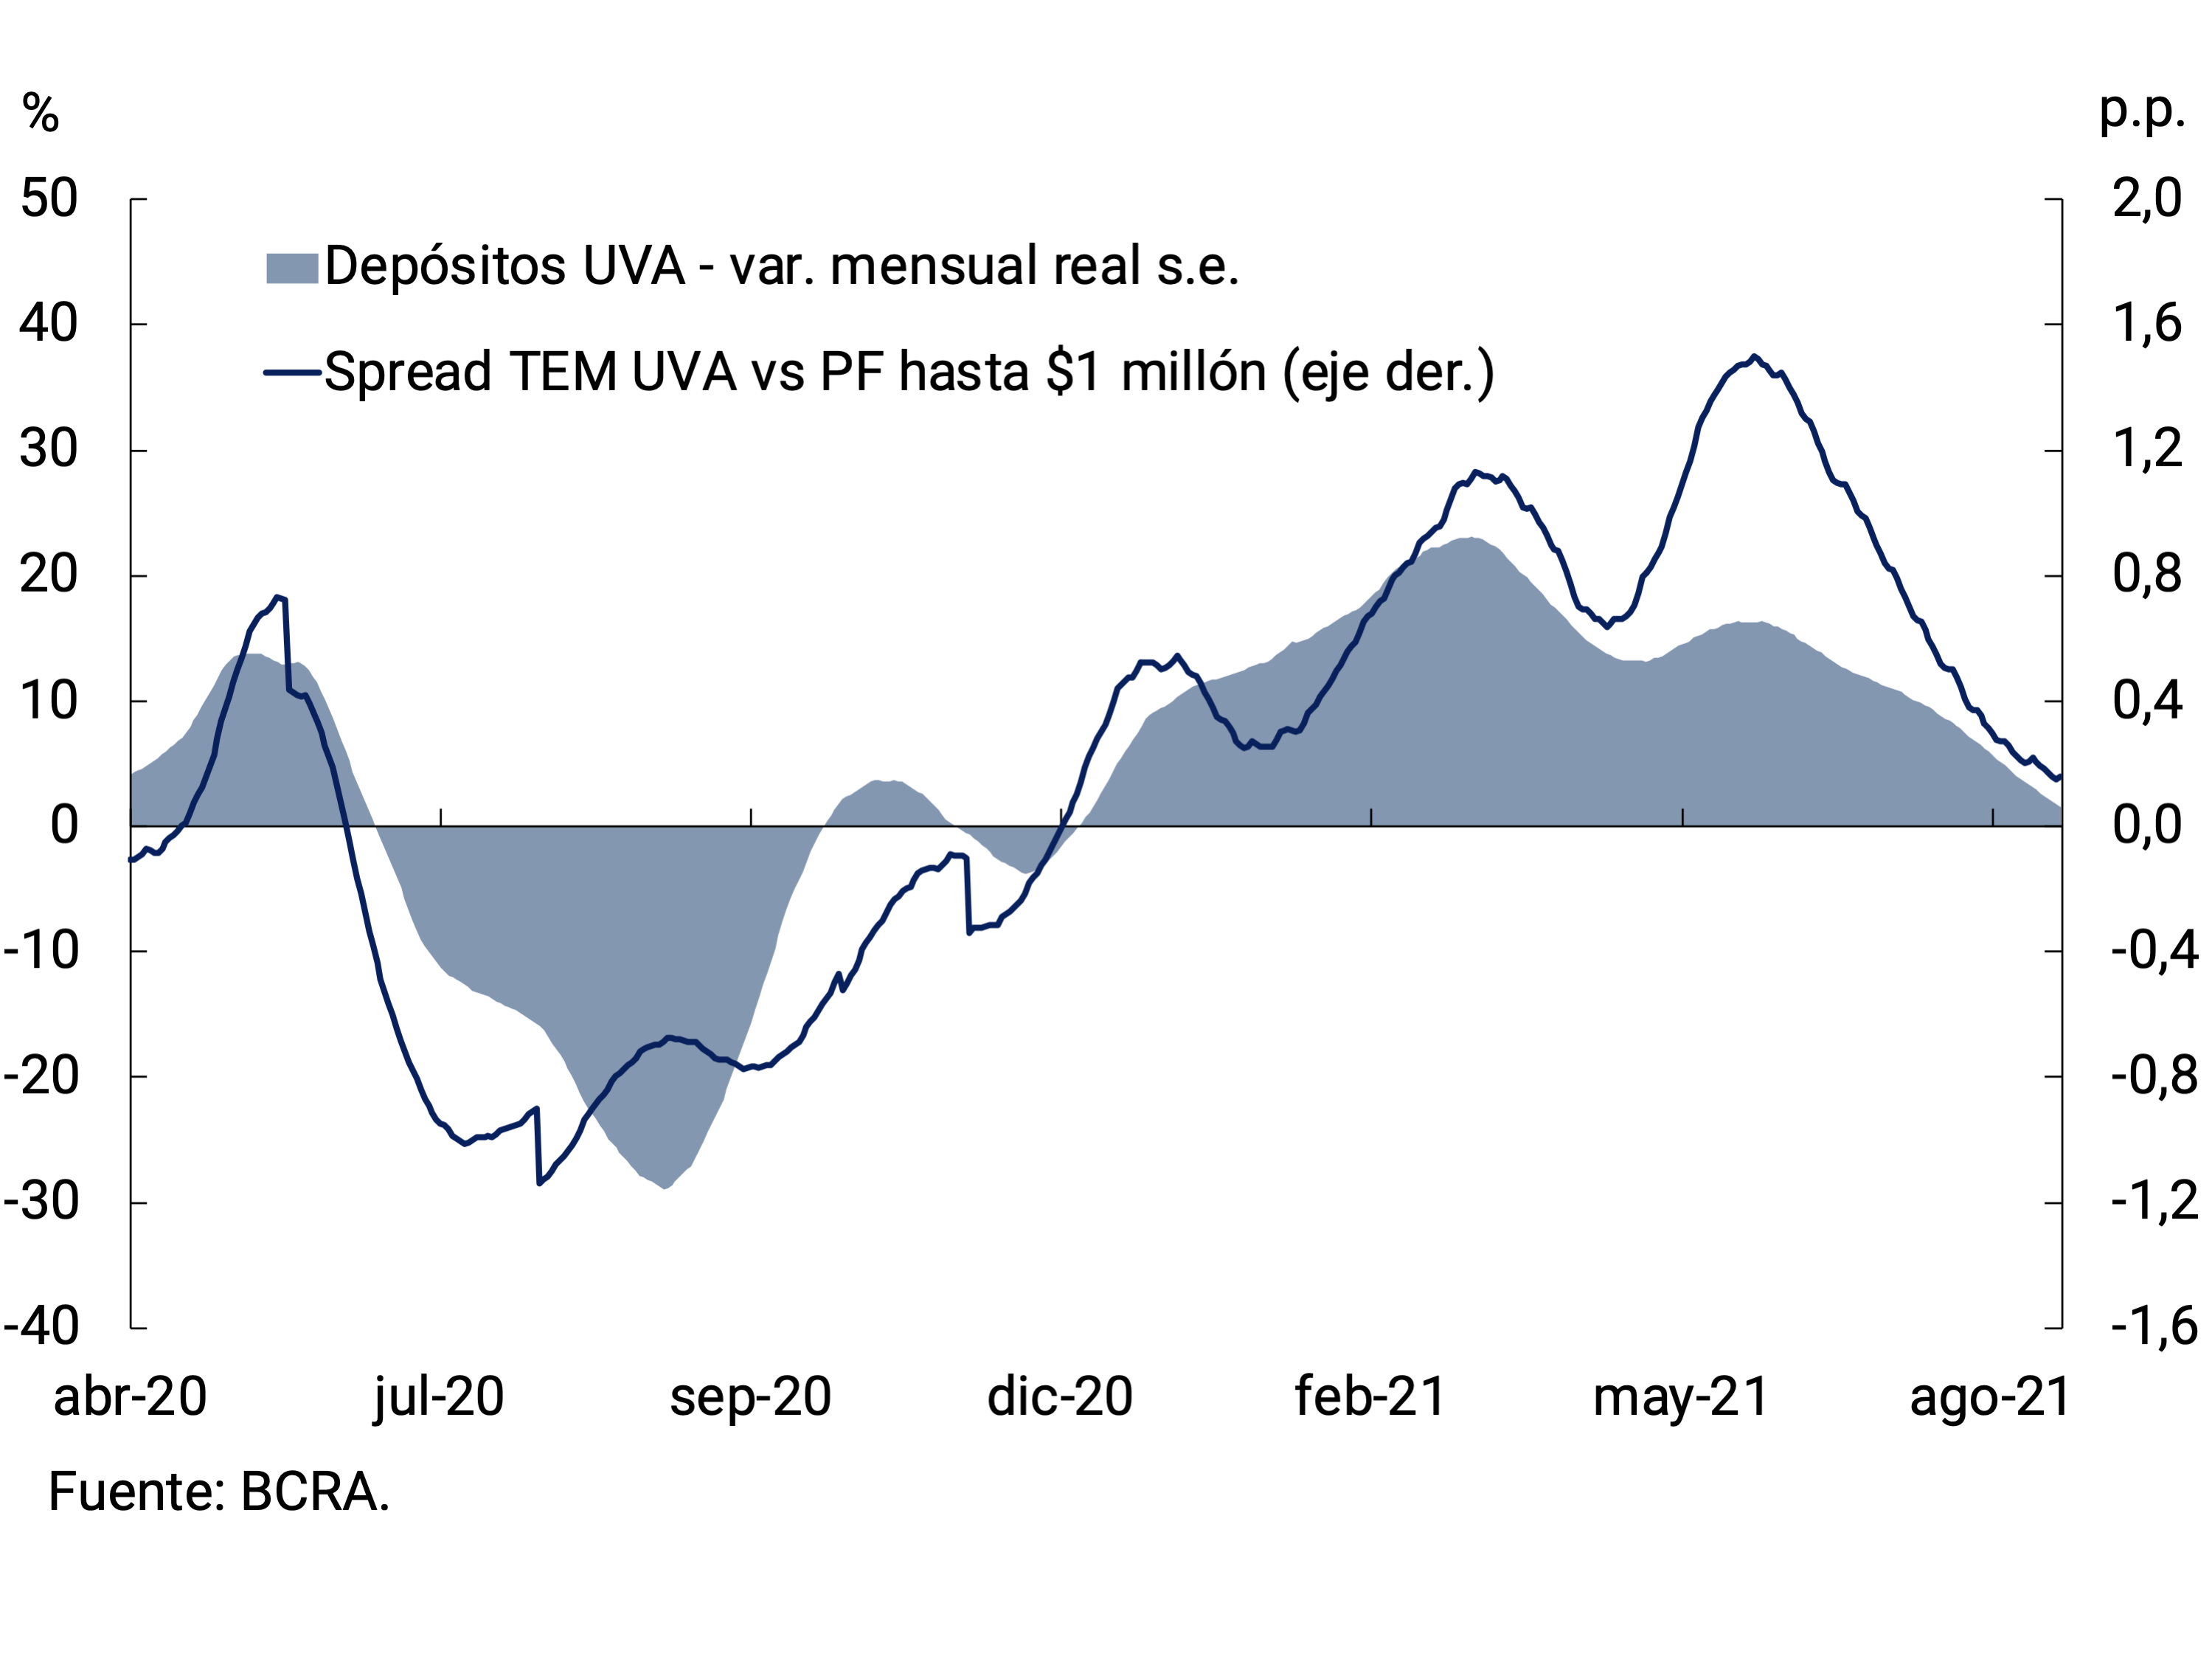
The growing demand for UVA-denominated placements has taken place in a context where the differential between the yield of these placements and those denominated in pesos remains in positive territory. The evolution of the spread between the two interest rates had two different trends so far this year. Since the end of last year, it has turned positive and reached a maximum of 1.5 p.p. at the beginning of June (although with a transitory drop in March). In this period, UVA placements grew at an average monthly rate of 16.1% s.e. in real terms. Subsequently, in a context of expectations of moderation in the inflation rate, the spread began to fall to 0.16 p.p. in mid-August, while UVA placements reduced their rate of expansion. In fact, July’s monthly growth was 6.3% s.e. at constant prices, about 10 p.p. less than the average growth rate of the first six months of the year (see Chart 2). Thus, contrary to what happened in the third quarter of 2020, when the differential between these interest rates became negative and agents tended to dismantle UVA deposits, since the beginning of this year it has been observed that the higher yield on these placements compared to a traditional fixed-term spurred demand for CER adjustable assets.
Although a marked growth of this type of instrument was observed so far this year, the dynamics were not homogeneous at the level of depositors and strata. Individuals have been the main drivers of the growth of this type of deposit in 2021. In fact, at the end of July, the deposits of this type of agents reached a record level of $130,000 million, representing just over 70% of the total of these instruments. Discriminating them by amount stratum, it is verified that the greatest boost came from placements of up to $20 million. This segment of the amount accounted for more than 75% of the accumulated increase in the year. In particular, deposits of up to $1 million registered an average monthly expansion rate of 20.2% at constant prices in the first seven months of the year. Meanwhile, the segment between $1 million and $20 million grew in real terms at an average monthly rate of 22.7%. Finally, wholesale deposits of individuals substantially accelerated their rate of expansion between February and May, although starting from low levels, and from June onwards they showed a slight downward trend (see Chart 3).
Graph 3 | UVA deposits of individuals by amount
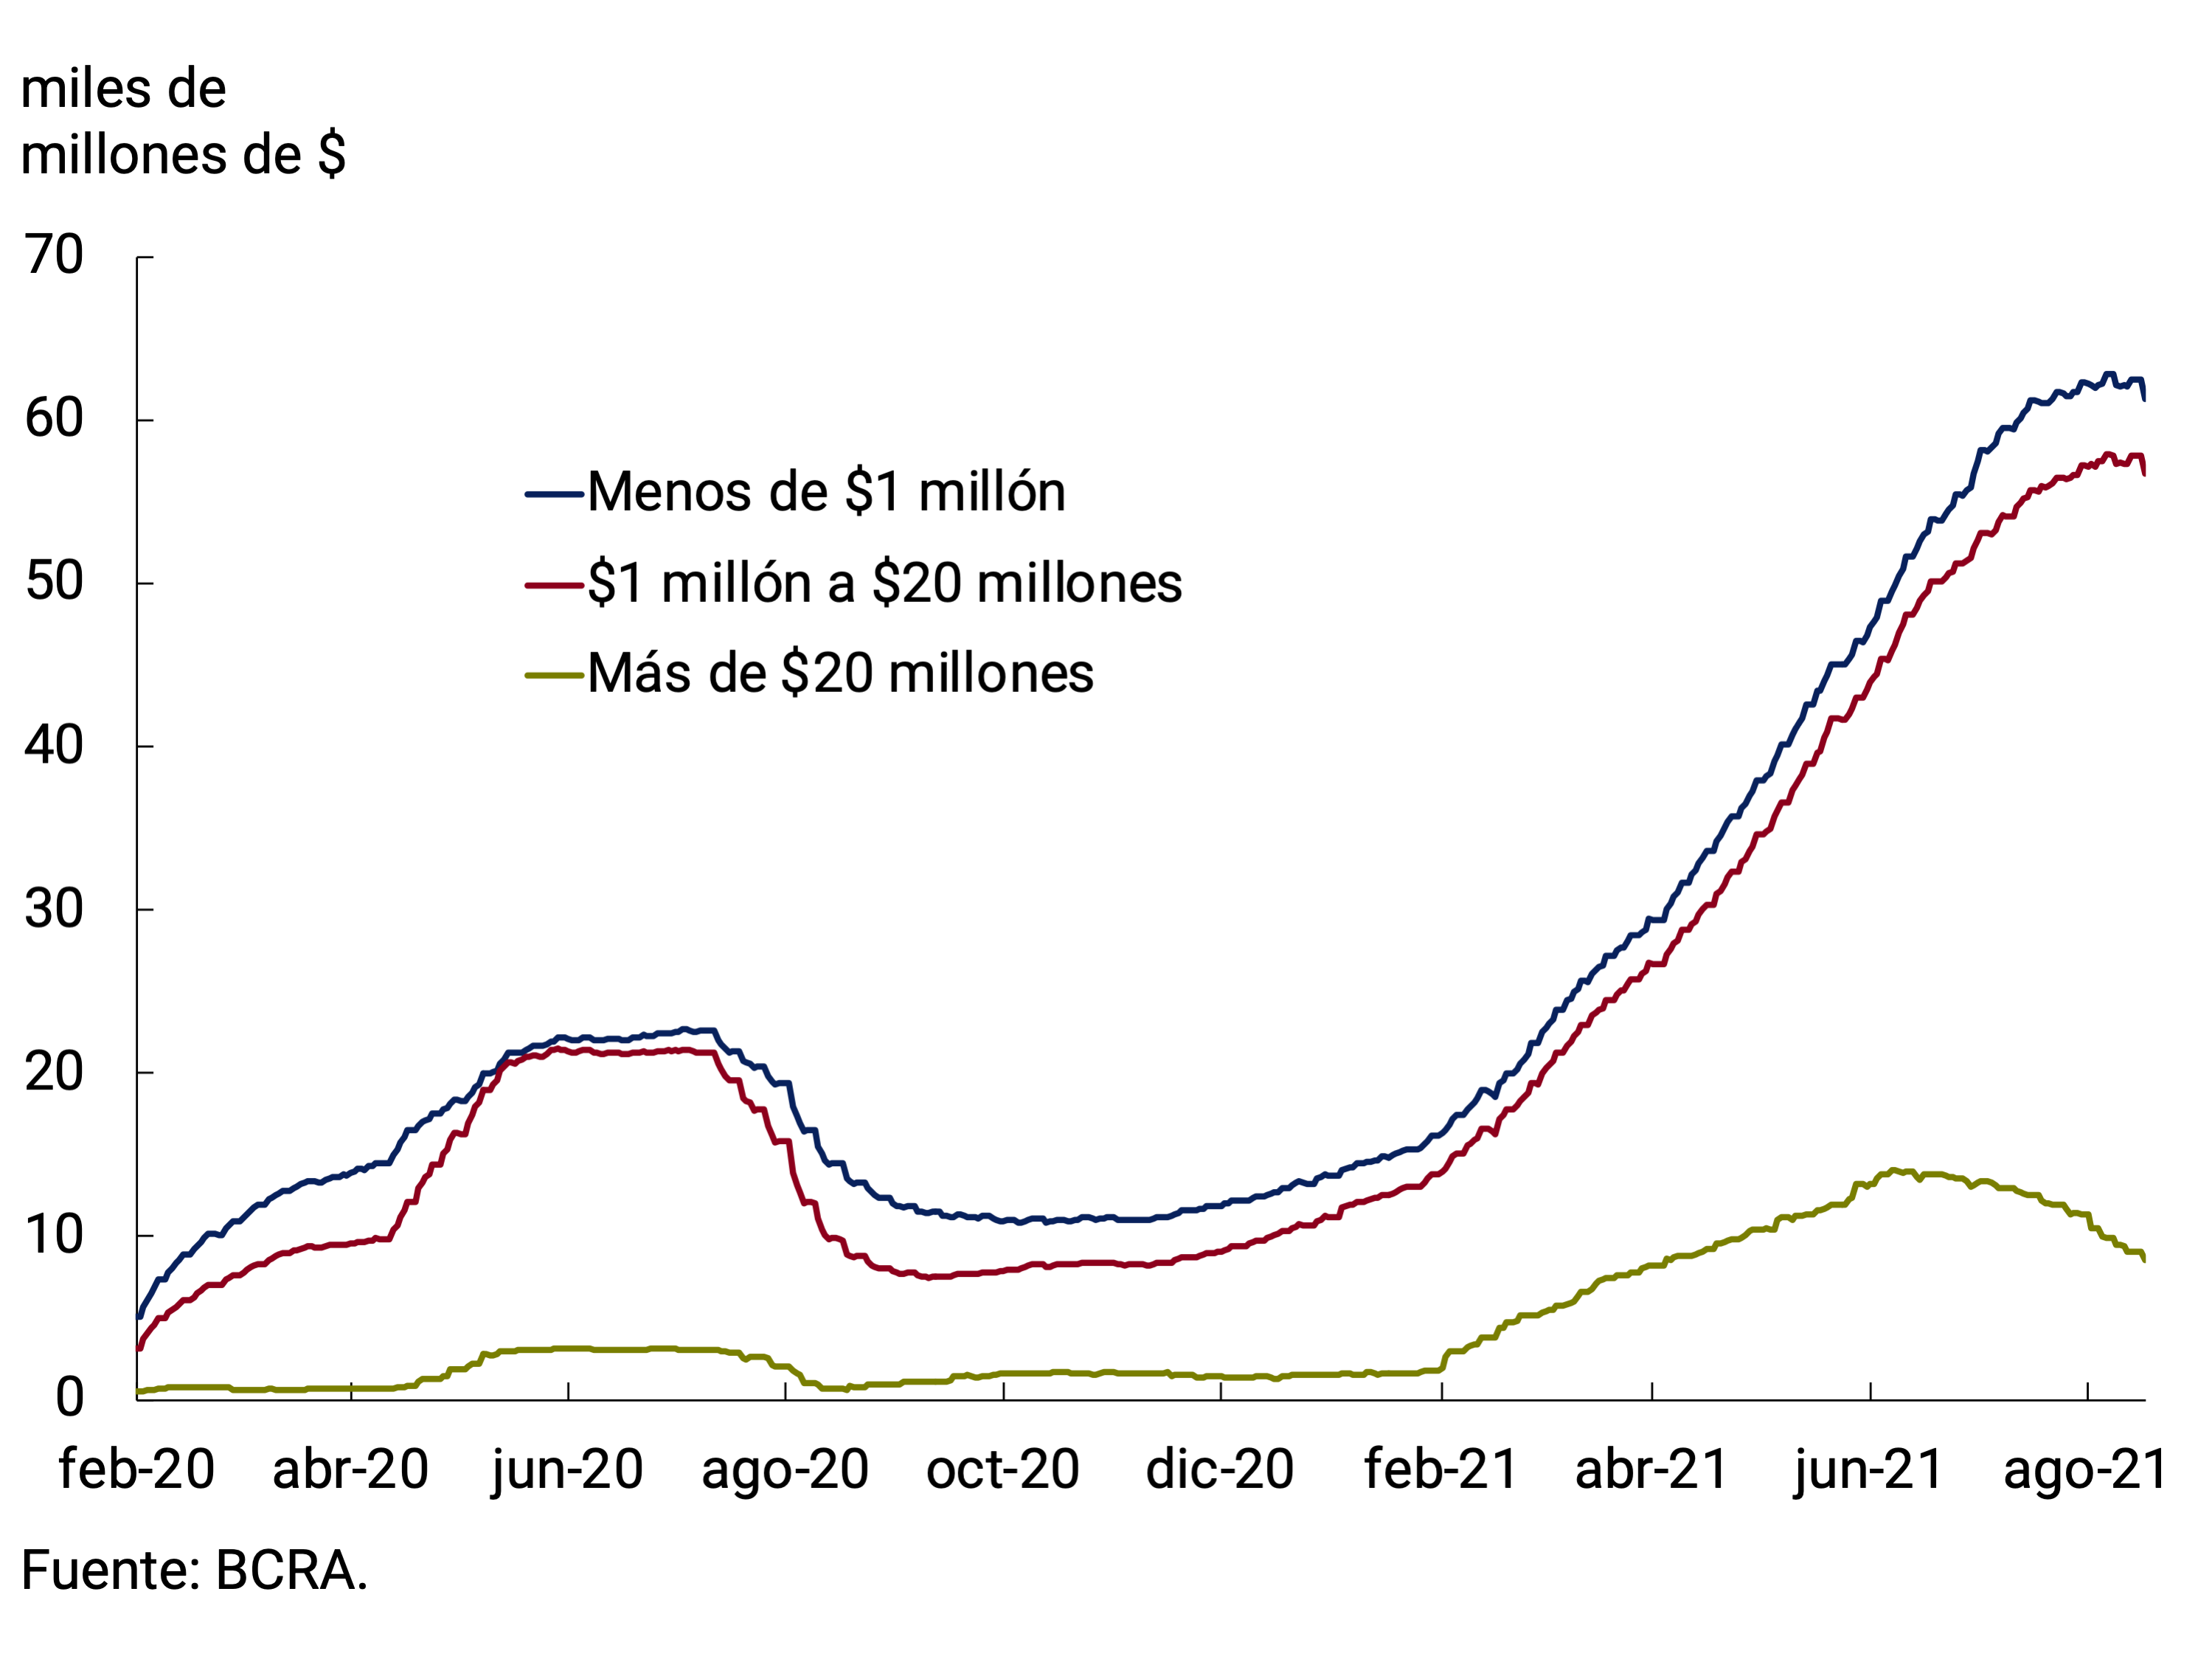
Figure 4 | Time deposits in pesos vs. UVA of individuals. At current prices; accumulated since Dec 31, 20
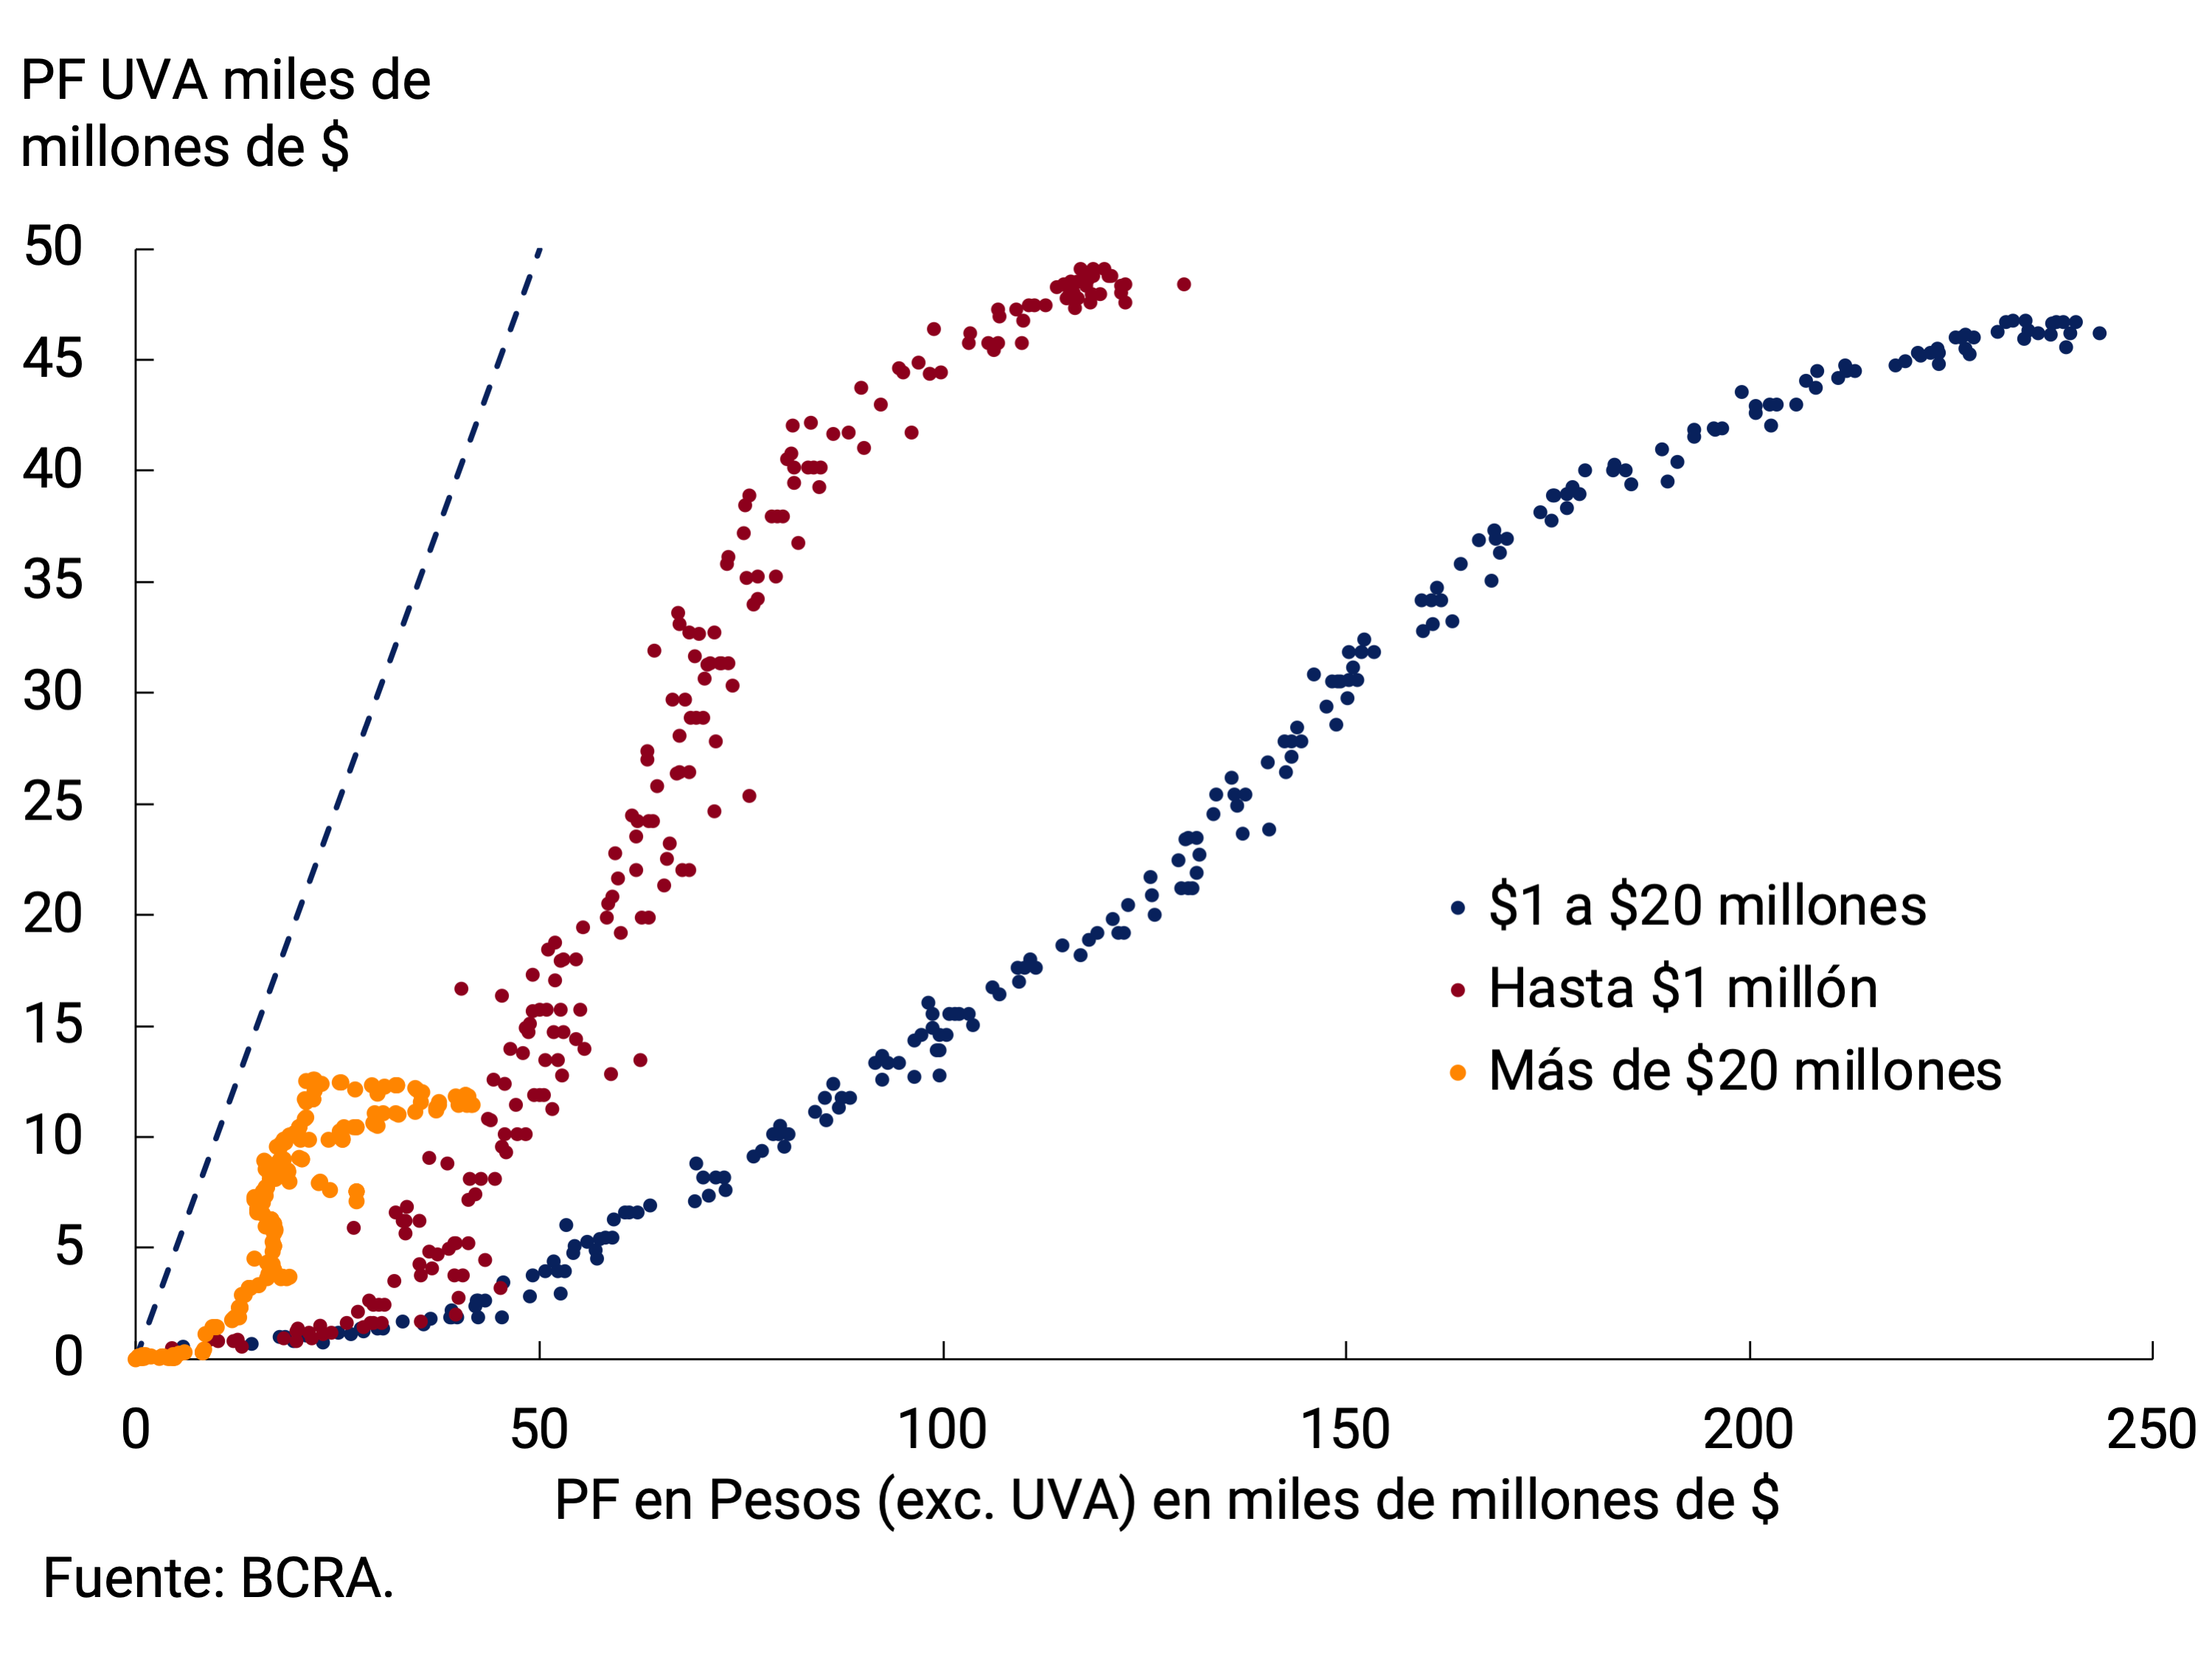
The preference for this type of asset, given the larger spread of rates, was not homogeneous either. The growth of UVA deposits, in the wholesale segment, was at the expense of relative stability in placements in pesos (excluding UVA). This behavior was maintained in recent months when holdings fell, with the largest falls accumulating the segment not adjustable by CER. The stratum of between $1 million and $20 million saw increases in both types of instruments, although greater in those that were not adjustable. Meanwhile, the retail stratum began the year by fundamentally increasing its holdings in pesos, while as of February they began to register increases of the same magnitude in the two types of lines. The recent reduction in the rate spread once again boosted the fixed-rate holdings of depositors with investments of less than one million pesos (see Chart 4). Within this last set, it is found that the lower the amount stratum, the greater the demand for indexed assets. Even within the lowest segment (up to $100,000) there was a dismantling of positions in pesos to convert them into UVA. With the fall in the rate differential, there was an acceleration in peso holdings (see Charts 5 and 6).
Graph 5 | Deposits of up to $1 million from individuals
At current prices
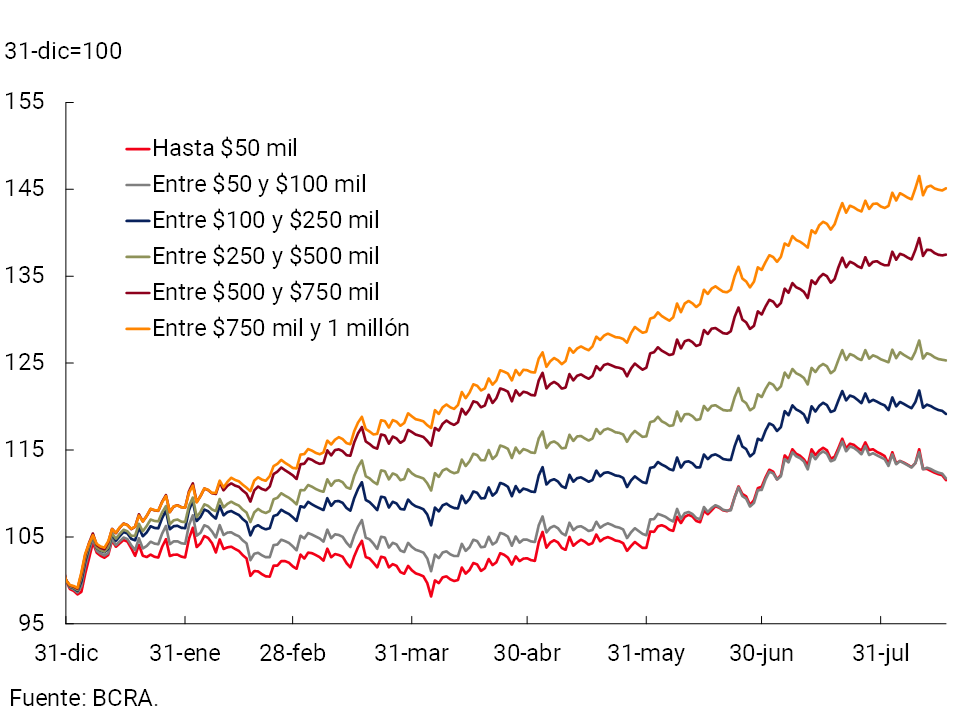
Graph 6 | Time deposits of individuals in pesos vs. UVA
At current prices; accumulated since Dec 31, 20
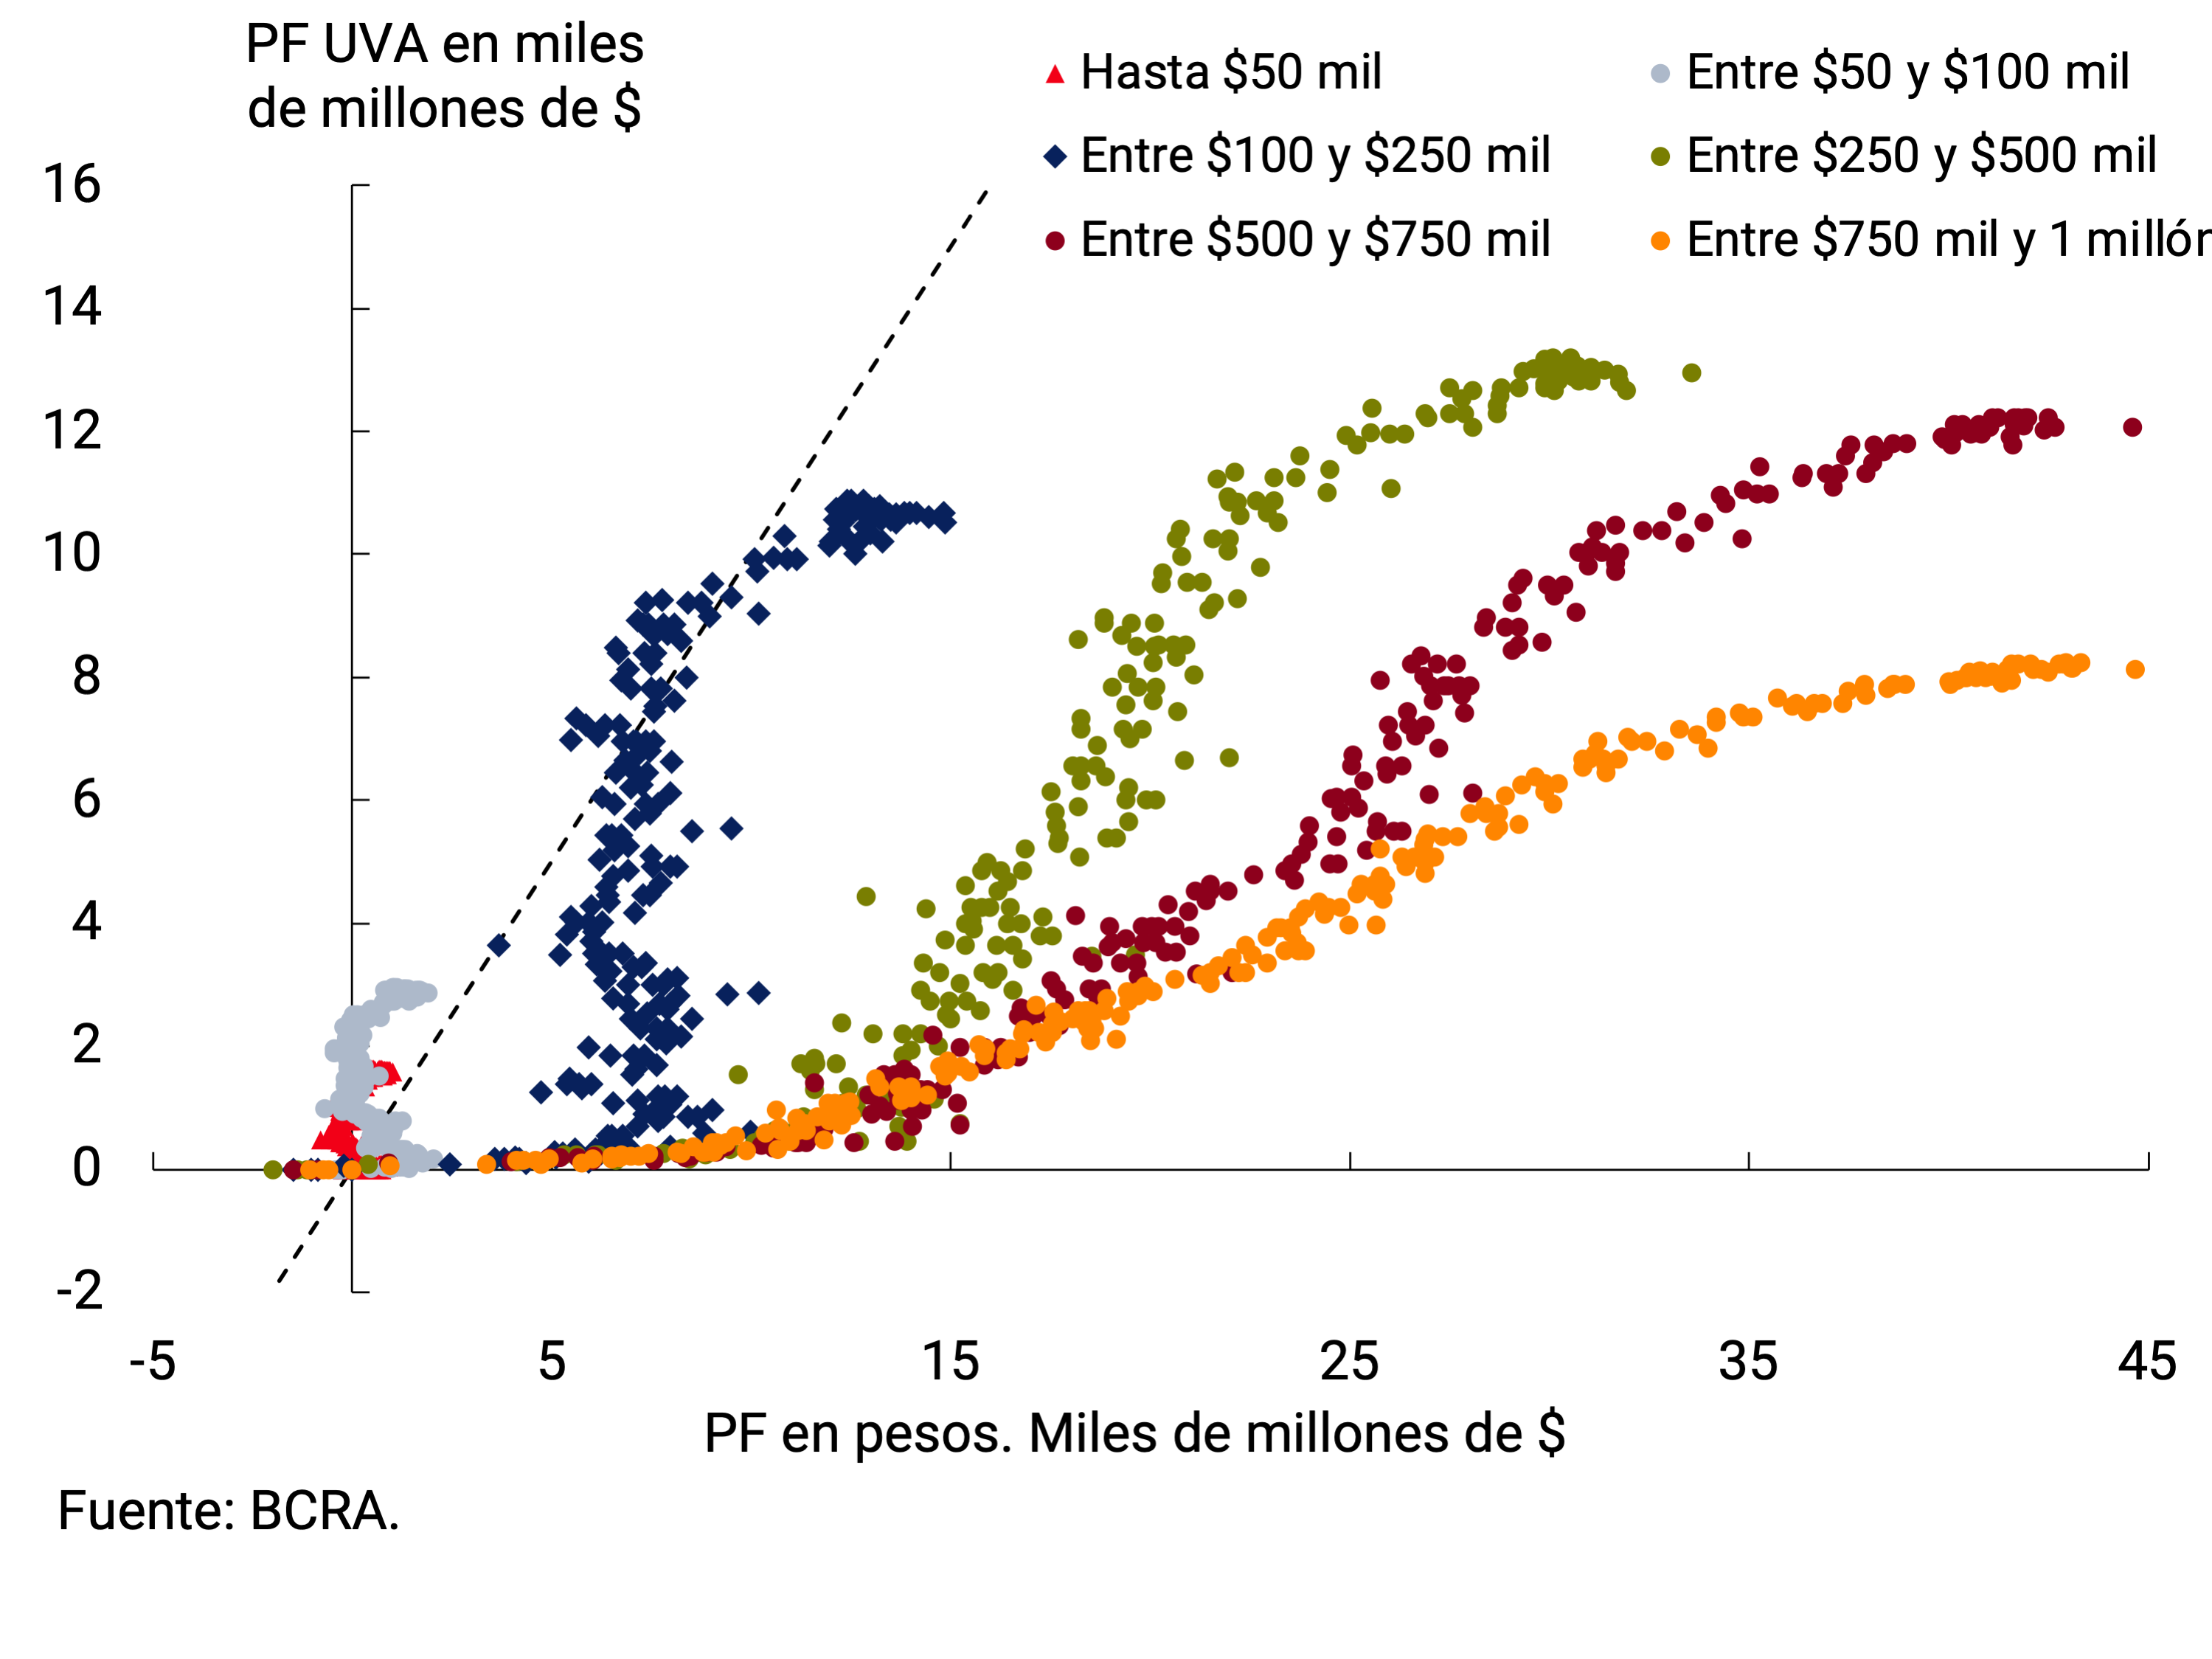
The existence of instruments that ensure a positive real return allowed the BCRA to simultaneously maintain a reference interest rate in line with the need to accompany the recovery process of the economy and protect savings in domestic currency. During the first part of the year, there was a transitory rise in the inflation rate, which boosted the growth of assets adjustable by CER. More recently, the prospects of a moderation in the inflation rate for the coming months reduced the attractiveness of UVA assets and, therefore, peso-denominated placements gained momentum again. The evolution of this type of instrument highlights the importance of having a wide variety of tools that can channel savings and safeguard their value.
References
1 For more information on studies on vaccine effectiveness against the Delta variant, go to the following sites: link 1, link 2, link 3, link 4, link 5, link 6, link 7.
2 A preliminary exercise suggests that the higher the doses applied per inhabitant, the stiffness of isolation measures is significantly reduced, considering the relationship between the index of rigidity of isolation measures produced by the University of Oxford and the doses per inhabitant applied 14 days ago, with fixed effects by date and country. in all the countries that have vaccinated so far.
3 In July, the ECB completed the second historic review of its monetary strategy, which began in 1998. In it, it acknowledged that structural changes (reduced productivity growth, demographic factors, and persistent demand for liquid and safe assets) lead to a low equilibrium real interest rate. To counteract this effect, generating an “inflation buffer” in the medium term, the ECB is moving to: a) contemplate a symmetrical inflation target of 2%, tolerating transitory increases from now on; b) abandoning the monitoring of monetary aggregates; c) use a consumer price index that includes the value of homes in the future; d) definitively incorporate “unconventional” instruments into the policy tool, and e) include climate change objectives and transition to “cleaner” energy sources.
4 The price of oil increased more than 700% from the lows of the pandemic; While part of the increase only reflects a “base effect,” the current price exceeds pre-pandemic records.
5 For more details see Section 1. The new allocation of Special Drawing Rights (SDRs): what it is and what it means for developing countries, from the May 2021 Monetary Policy Report.
6 This fund would be in addition to the Poverty Reduction and Growth Facility (PRGT), which is intended to provide financing at subsidized rates to low-income countries. Options to be explored also include increasing the funding available for this fund.
7 By means of DECNU 241/21 of April 15, 2021, the National Government ordered, in accordance with the epidemiological risk of each jurisdiction, specific restrictions in the AMBA that included the suspension of activities in shopping centers, shopping malls and all sports, recreational, social, cultural and religious activities that take place in closed areas. It also suspended face-to-face schooling, imposed new restrictions on the normal operation of commercial premises and restrictions on circulation. Through DECNU 287/21, such measures were extended to the regions considered in a situation of Epidemiological and Health Alarm in the rest of the country, while at the same time it left without effect the activity associated with student, recreational and social tourism in closed places.
8 Among the main measures are the expansion of the amount of REPRO II and the incorporation of new activities considered critical (the program established a 100% reduction in employer contributions for productive units, single-payers and self-employed workers who were in a critical economic and financial situation, along with an increase in the benefit for employment relationship, which reached $22,000). Likewise, the National Government ordered the extension of zero-rate credit lines for SMEs, single-payers and self-employed workers in the tourism and gastronomic sector, and the extension of the prohibition of dismissals and suspensions until 12/31/21. An economic aid of $11,000 was also established for workers of self-managed productive units participating in the “Self-Managed Work” Program, the “Impulse” Program was launched with the aim of supporting the Culture sector, and new editions of the Assistance Program for Tourism Providers (APTur) were available.
9 See Chapter 5. Public Finances.
10 The median of the REM for the month of May (without the EMAE data for April being known yet), indicated a quarterly fall in GDP of 2.3% s.e. in the second quarter.
11 The purpose of this indicator is to anticipate the EMAE pivot points. On Sep-20, the ILA-BCRA met the 3 criteria (duration, diffusion and depth) that indicated the beginning of a recovery phase. The increase was disseminated among its components, exceeding the required threshold of 52.5% on average of the last 4 months and the variation accumulated by the ILA in 6 months (depth of the increase) far exceeded the minimum required of 2.3%. From Dec-20 onwards, the ILA showed oscillations, but it did not meet all the necessary criteria to indicate a turning point in economic activity. For more methodological details of the ILA, see Section 3 / BCRA’s Leading Index of Economic Activity published in the IPOM corresponding to January 2017.
12 Gross fixed capital formation, composed of Construction and Durable Production Equipment (which includes Machinery and Transportation Equipment and Equipment, domestic and imported).
13 Construction fell 4.9% quarter-on-quarter s.e., while expenditure on durable production equipment (domestic and imported) fell 12.3% s.e. during the quarter.
14 Own deseasonalization.
15 The Leading Indicator of Private Consumption is its own index, which includes traditional and non-traditional indicators of the consumption of goods and services, including quantities sold in supermarkets, credit card consumption (deflated by CPI), units sold of automobiles, imported volumes of consumer goods, VAT collection in real terms, and the Consumer Confidence Index. For more details see Section 1/ Private consumption, a variable difficult to follow in real time, IPOM July 2017.
16 The Gross Value Added (GVA) of Hotels and restaurants, at 2004 prices and seasonally adjusted, was 42.9% below that observed in the fourth quarter of 2019 in the first quarter of 2021, Other social and community services 12% below and Transport and communications 15.2%.
17 Industry, Commerce, Construction, Financial Intermediation, and Real Estate and Business Activities, accounted for nearly 60% of GDP excluding taxes in the first quarter of 2021.
18 The amounts referred to were calculated by expanding the EPH microdata to the total population of Argentina using the activity and employment rates of agglomerations of less than 500 thousand inhabitants.
19 Latest information available at the time of publication of this report.
20 The regulation provided for the extension of the prohibition of dismissals and extended the obligation of double severance until December 2021.
21 More than 90% of those over 50 years of age are vaccinated with one dose, while with the complete scheme the figure rises to 63%. For its part, 60% of the population received at least one dose.
22 Among the main measures to support families that remained in force are an extraordinary bonus of $5,000 for retirees and pensioners who receive up to two minimum salaries and the recognition of one year of contributions for each child for women who do not meet the requirements to retire. A bonus of $6,000 was also established for the holders of the Empower Work Program that will reach about one million people. For its part, the AFIP established the extension of the 15% refund for purchases for retirees and pensioners who receive the minimum wage, holders of the Universal Child Allowance (AUH) and the pregnancy allowance (AUE), while extending the suspension of exclusions and ex officio cancellations of monotributistas and small taxpayers.
Among the measures to support strategic sectors are the Green Productive Development Plan (a set of initiatives to be implemented in production systems with a new sustainable, inclusive and environmentally responsible paradigm), the “Te sumo” Program, which aims to promote labor inclusion and professional training of young people in SMEs, the “Argentina Program” plan that includes training and financing for the development of professionals in the industry of Software, and the second edition of the “Previaje” Plan, in order to encourage domestic tourism.
23 Available since January 2020 on the official site.
24 In recent years, many tools have been developed for the management of big data for countless fields of science. Among them is machine learning, which is a branch of artificial intelligence whose purpose is to develop techniques for machines to “learn” from information and extract, for example, common patterns. Among these learning techniques or algorithms is the neural network, which consists of building a set of interconnected analytical units where each one receives classified information, processes it and emits a signal that may or may not be an input of another unit.
25 Woloszko, Nicolas (2020), “Tracking activity in real time with Google Trends”, OECD Economics Department Working Papers, No. 1634, OECD Publishing, Paris, read here.
26 The OECD projections to November 2019 are available at the following link.
27 Like the EMAE s.e., the historical series of the OECD tracker is constantly revised. Even so, the variations are extremely stable.
28 The Central Bank has within its analysis tools its own indicator of contemporary prediction of the level of activity. For more information, see Section 3 / Nowcast of the BCRA of the IPOM of July 2016, Section 2 / Contemporary Prediction of the BCRA of the IPOM of July 2017 and Section 2 / Evaluation of the performance of the Contemporary Prediction of the BCRA of April 2018.
29 See Section 3: Labour market in a pandemic” of the Monetary Policy Report published in November 2020.
30 Data from the Argentine Integrated Pension System (SIPA) show a marked recovery in salaried employment registered only from March and with data to May they have not yet recovered pre-pandemic values (February 2020).
33 Includes foreign sales of cereals, oilseeds and fruits, milling of cereals, fats and oils and residues for the food industry.
34 In this calculation, it is assumed that the quantities exported would have been identical under different price scenarios. It should be noted that in the case of soybean derivatives there are indications that high international soybean oil prices, and even so, their unusual competitiveness with respect to substitute vegetable oils, stimulated domestic milling. This implies that the effect of the rise in prices on the values exported from agriculture probably “transcends” the mere accounting effect.
35 Net sales are defined as the difference between gross sales and gross purchases of foreign currency for all purposes through the foreign exchange market.
36 VAT-DGA, DGA Profits, Import Duties and Statistical Tax.
37 Law 27617 increased the non-taxable minimum and the special deduction for retirees and employees in a relationship of dependency, relieving the low and middle income brackets that were reached by the tax, while implementing a schedule for the refund of what was withheld until the time of entry into force of the rule.
38 In July, social security benefits increased by 41.3% YoY.
39 The second quarterly increase granted through Mobility Law No. 27,609 for retirements, pensions and allowances was 12.12% in June 2021, while for September the increase will amount to 12.39%.
40 In April, the expansion of the stimulus allowance for workers in health facilities was announced ($6,500 per month, reaching more than 700,000 people in the months of May, June and July). An extraordinary aid of $15,000 for two months (April and May) was also provided for 50,000 cultural workers within the framework of the Solidarity Culture program, as well as an emergency aid of $11,000 in May to beneficiaries of the Self-Managed Work employment program.
41 It should be noted that these reinforcements are in addition to the extension of the AUH, the AUE and the Family Allowances through various measures, including the elimination of the maximum limit of children per family; the reduction to 2 years of the requirement of legal residence in the country for foreign family groups; the reinstatement to the Universal Allowance of children and adolescents suspended for not having presented the school or health booklet, the elimination of the minimum income for the collection of family allowances; the determination to maintain the payment of allowances to those single-payers with delays in the payment of fees and the extension to 9 months of the collection of the Universal Pregnancy Allowance, among others.
42 Decree 735/2020.
43 Part of the increase in capital expenditures is due to a low base of comparison due to the negative impact of COVID-19 and, at the same time, to a low level of execution associated with the start of the administration in 2020.
44 It is worth mentioning the regulatory modification of the BCRA (Communication “A” 7290) that allowed banks to choose to integrate the fraction of reserve requirements that, until May, was remunerated through LELIQ with instruments issued by the National Treasury in pesos, whose residual term is greater than 180 days (excluding tied to the evolution of the dollar).
45 Joint Resolution 1/2021.
46 Information as of August 20, 2021. In the same period of the previous year, $1,040,000 million of profits had been transferred from the BCRA to the TN, while net Transitory Advances had been granted for $472,000 million.
51 The determination of the start of the scale at $200 million had the objective of achieving the best achievable balance, combining the fewest number of people reached.
54In addition to the April update in the Careful Prices Program, on June 8 the Maximum Prices Program that had come into force on March 19 of last year ended. Instead, the Super Cerca Program was implemented with a more limited variety of 70 items with fixed prices for 180 days, available in stores and nearby stores.
55 On 05/19/2021, the approval of applications for the Sworn Declaration of Meat Export Operations (DJEC) of ten tariff items (Res. MAGYP 75/2021) was suspended for 30 days. Although the first impact was an increase in the wholesale price of beef in the Liniers Market, it was reversed in June and July, returning to average values similar to those of March. The measure was partially relaxed in June by setting quotas for shipments abroad for certain cuts (Decree 408/2021).
56 Some of the increases in core services verified in the quarter were directly linked to the sectoral parity agreements. This is the case of expenses, which rose in April and July due to increases in the salaries of personnel in charge of buildings, and that of the services provided by the staff of private homes, which increased in April and June.
58 From April for large users (Res. ENRE 78/2021 and 79/2021) and from May for the rest (Res. ENRE 106/2021 and 107/2021).
59 Resolution 2125/2021.
60 The most important goods within this group are clothing and footwear, automobiles, medicines, electronic goods and computer equipment, furniture and household items, jewelry and watches, and photographic, audio, and video equipment.
61 It includes education, private medicine, communications, postal services and tolls.
62 The services with the greatest weight within this group are restaurants, hotels, cinemas, theaters, sporting events, gyms, party halls, tourist packages and excursions, financial services, among others.
63 These bonds must have a residual term of between 180 and 450 days at the time of being subscribed, and those linked to the evolution of the dollar (dollar-linked) are excluded. For more details see Communication A7290.
64 Means of payment, includes working capital held by the public, cancelling cheques in pesos and non-remunerated demand deposits in pesos from the non-financial private sector.
67 Resolution 753/2021 of the Ministry of Productive Development. Secretariat of Domestic Trade.
74 In the latter case, it must be an account that is not incorporated in countries or territories where the FATF Recommendations are not or are not sufficiently applied.


