Summary
1. Monetary policy: assessment and outlook
The international scenario has become more uncertain in recent weeks. Although the global economy closed 2021 with an annual expansion of GDP of 5.7%, in the first months of 2022 a new wave of the pandemic and, more recently, the war between Russia and Ukraine had an impact on the dynamism of activity. This last event increased uncertainty regarding the future prospects of the prices of raw materials that our country exports and imports. So far, higher energy and other commodity prices have driven an acceleration in inflation in advanced economies, prompting central banks in these economies to consider a more contractionary bias in their monetary policy. A steeper monetary contraction would impact developing countries in the form of tighter financial conditions, capital outflows, and eventually lower growth.
In Argentina, in a more favorable health context based on greater coverage of the population with complete vaccination schedules, economic activity continued to improve in the fourth quarter of 2021 and continued to operate at levels higher than pre-pandemic levels. Thus, the year ended with a growth of 10.3%, significantly above that initially expected. The advance data on economic activity showed a progressive reduction in sectoral heterogeneity. For 2022, a continuity in the process of recovery of economic activity is expected, driven by greater dynamism in sectors that have not yet managed to operate at pre-pandemic levels, especially services.
In this more dynamic macroeconomic environment, during the first two months of the year, inflation accelerated again and averaged 4.3% per month, above the 3.3% monthly average observed during the fourth quarter of 2021. The greater dynamism of prices since September 2021 was verified in a context of recomposition of the marketing margins of certain sectors, reopening of wage parity and higher inflation expectations as a result of the greater exchange rate pressures typically associated with electoral processes, where the private sector tends to accentuate its pattern of financial dollarization. to which was added the financial uncertainty generated by entering a stage of definition of the negotiation with the IMF for a new debt agreement with the organization. In addition to the scenario of high inflationary inertia, unfavorable domestic weather conditions and the significant increase in international prices of agricultural raw materials, energy and global manufactures have accelerated since January, which accelerated in the face of the conflict between Russia and Ukraine, which poses a challenging scenario, especially for the next two months.
Having reached pre-pandemic levels of activity and without neglecting the growth process underway, the BCRA proposed to resume the policy guidelines enunciated at the beginning of 2020, which combine the consolidation of domestic market growth and exports with monetary and macro-financial stability. In this scenario, the BCRA defined and published in December 2021 its Objectives and Plans1 for the year 2022.
A necessary condition for reducing levels of inflationary inertia is to maintain a process of accumulation of reserves that dissipates the risks of balance of payments crises and abrupt jumps in the exchange rate, thus anchoring exchange rate expectations. Thus, with the aim of strengthening the position of international reserves, the rate of depreciation was modified to gradually bring it to levels more compatible with the domestic inflation rate. Thus, so far in 2022, a stabilization was observed in the Multilateral Real Exchange Rate Index (ITCRM), which is at levels that preserve external competitiveness and around the average of the last 24 years.
Likewise, since the first week of January, the BCRA has reconfigured its monetary policy instruments to accompany the economic recovery process and reinforce monetary, exchange rate and financial stability. Thus, the reference interest rate was raised on two occasions, taking it from 38.0% n.a. (45.4% e.a.) to 42.5% n.a. (51.9% e.a.), the limit on LELIQ holdings to 28 days was readjusted (focusing the policy interest rate signal on this instrument), new instruments were created in order to increase the average term of sterilization and the minimum interest rates for deposits were raised fixed-term. The increase in the monetary policy interest rate seeks to tend towards positive real returns on investments in local currency, in order to boost the demand for pesos. That is why, looking ahead, the developments in inflationary matters will be reflected in the calibration of interest rates by the monetary authority.
In turn, the BCRA will continue to calibrate the liquidity of the economy, sterilizing any surpluses, to help preserve monetary balance. In this regard, in 2021 primary expansion linked to the public sector was at levels significantly lower than those of 2020, reflecting values with respect to GDP similar to those of previous years, and so far this year it helped to contract liquidity in the market. The purchase of foreign currency from the private sector also contributed positively to the expansion of the Monetary Base during 2021 and in the first months of the current year. These factors were partially sterilized through monetary regulation instruments (passive passes and LELIQ). All in all, the Monetary Base ended the year with an expansion of 40.0%, which implied a contraction in real terms, and the balance of interest-bearing liabilities stood at around 9.7% of GDP. Given the projected growth in the demand for the monetary base, it is estimated that, for every 1 p.p. increase in monetary policy interest rates, interest-bearing liabilities would increase by 0.07 p.p. of GDP. Even considering this effect, in a context of lower sterilization needs, during 2022 interest-bearing liabilities will be reduced in relation to GDP.
The continuity of the process of normalization of the activities of the productive sectors allowed the BCRA to continue with its credit policy focused on the most backward sectors and on the promotion of productive development. During 2022, the Central Bank will continue to stimulate the supply of credit to the private sector. The Productive Investment Financing Line (LFIP) will continue to be the main vehicle for channeling productive credit to MSMEs under favorable financial conditions.
Within this monetary policy framework, the National Government recently reached an agreement with the International Monetary Fund (IMF) to implement an Extended Facilities Program (EFF), which will cover the maturities of the Stand-By Agreement (SBA) signed in 2018, obtain budgetary support to partially finance the needs of the National Treasury and strengthen the Central Bank’s reserves.
Under this agreement, repayments will be made from the middle of the fourth year after signing and will extend until the tenth year of the last disbursement, i.e. between 2026 and 2034. The agreed macroeconomic policy scheme stipulates a gradual reduction in the primary deficit of the Federal Government, without contracting public spending in real terms in order not to negatively affect the process of recovery of GDP underway. Likewise, monetary assistance to the Treasury in terms of GDP will be reduced from 1% in 2022 to zero by 2024. With regard to the rest of the policies implemented by the BCRA, the guidelines incorporated in the agreement are in line with the Objectives and Plans that were presented for the year. Mainly, it will seek to maintain the reference interest rate at a level that allows safeguarding the real value of Argentines’ savings and contributing to the depth of the domestic public debt market. On the external front, it was agreed to maintain the rate of depreciation of the domestic currency at a level that would allow progress in the process of accumulating International Reserves.
This macroeconomic policy scheme is projected to help sustain the ongoing economic recovery in an environment of lower inflation levels that will deepen the improvements in social and employment conditions. To this end, the policies of the National Government and the Central Bank will seek: to improve the sustainability of public finances and debt, without compromising growth or the reduction of social and infrastructure gaps; strengthening external sustainability through the accumulation of international reserves through policies that boost the trade surplus, promote exports and long-term capital inflows, and enable Argentina’s eventual access to international financial markets in the medium term; gradually and persistently reduce the rate of inflation through the coordination of monetary, fiscal, and income and price policies; and, finally, to create conditions to make the growth process sustainable while protecting the environment, by mobilizing domestic savings, strengthening investment in infrastructure and innovation, and promoting strategic tradable sectors.
2. International context
Since the previous IPOM, two issues dominated the international scene. First, the Omicron variant of COVID-19 affected mobility and activity level. More recently, the armed conflict between Ukraine and Russia impacted the financial and commodity markets.
The spread of Omicron generated a global record number of cases, while deaths increased to a much lesser extent and were below the highs of previous waves. Vaccination has been intensified with booster doses, but the strong inequality between countries remains. This wave of infections has been shorter than previous ones; and it has implied an increase in restrictions and a drop in mobility comparable to those of the former, despite the fact that the increase in cases has been much greater.
The global economy continued to recover, but moderating its pace of expansion due to the impact of the new pandemic wave. Its estimated growth for this year has been reduced since the previous IPOM, which also considers the effect of a more contractionary monetary policy, the progressive withdrawal of fiscal expansion and the persistence of problems in global supply chains. The latter, together with higher prices for energy and other raw materials, has been behind much of the higher-than-expected global rise in inflation. Central banks in advanced economies have begun to reverse the expansionary bias of their policy; while those in developing countries, which had reacted earlier, continued to raise interest rates.
The armed conflict intensified two previous trends: higher energy and food prices and transportation costs, implying greater global inflationary pressures and lower levels of activity. Going forward, the dynamics of the conflict will determine the magnitude of that impact. Likewise, the evolution of the pandemic and the inequality in the pace of vaccination will continue to be decisive. The speed and amount of the withdrawal of monetary and fiscal stimuli in advanced countries and their potential “spillover” on the international economy will be risk factors of the first order; They would have an impact, at the very least, through global interest rates, the appreciation of the dollar and the reversal of capital flows to emerging countries (also affected by the conflict). High debt levels and the possible overvaluation of many assets would enhance the impact of a sudden “correction” in their prices on global financial conditions.
2.1. The Omicron variant caused a record number of global cases; lethality continued to be reduced
Since the end of November 2021, the Omicron variant has spread around the world: daily infections reached a record 24 million per week at the end of January 2022, quadrupling the previous high, and fell to 11 million per week in early March. After first manifesting itself in South Africa, cases of Omicron began to rise rapidly and reached peaks first in Europe and North America, and towards the end of December there were accelerated rises on all continents. The waves generated by this variant were generally shorter. At the close of this IPOM, there was a rise in cases in Asia (China, South Korea) and some European countries (such as Germany).
Despite the records in cases, deaths increased to a lesser extent: they reached about 75 thousand weekly, below the historical maximum of 103 thousand in January 2021. As a result, the death rate for cases 10 days ago reached a low of 0.45% (up from more than 2.5% in March 2021). Along with the increase in cases, global mobility was reduced on average to 70% of its pre-pandemic level (see Figure 2.1a).
Figure 2.1a | New Global Confirmed Cases and Deaths from COVID-19 (Last 7-Day Moving Average) and Mobility Normality Index
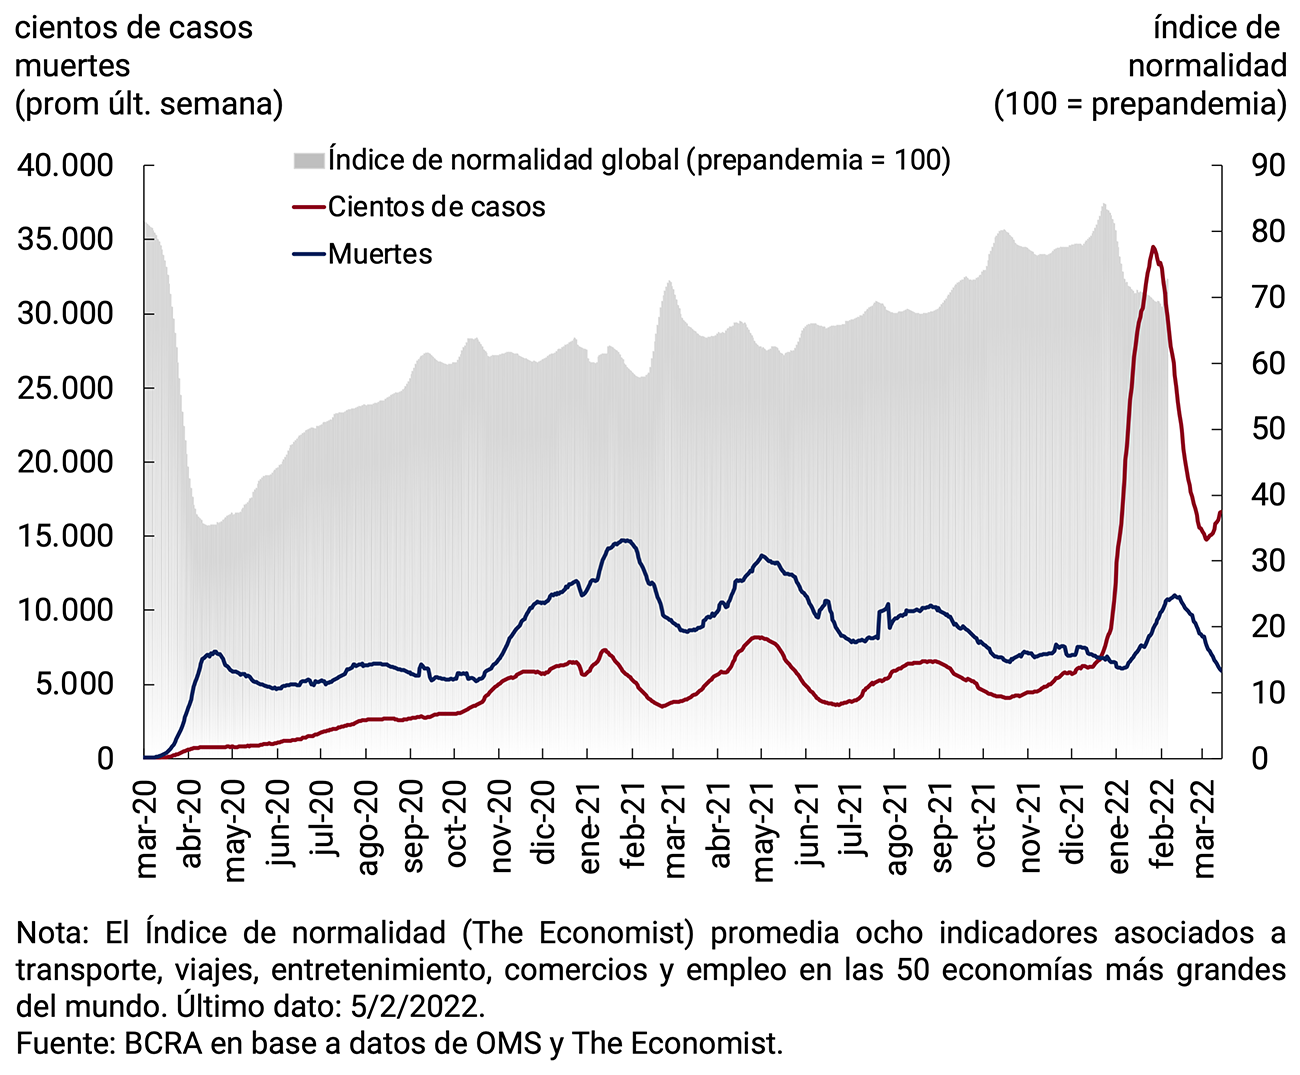
Figure 2.1b | New confirmed cases and deaths from COVID-19, in selected
countries Moving average last 7 days

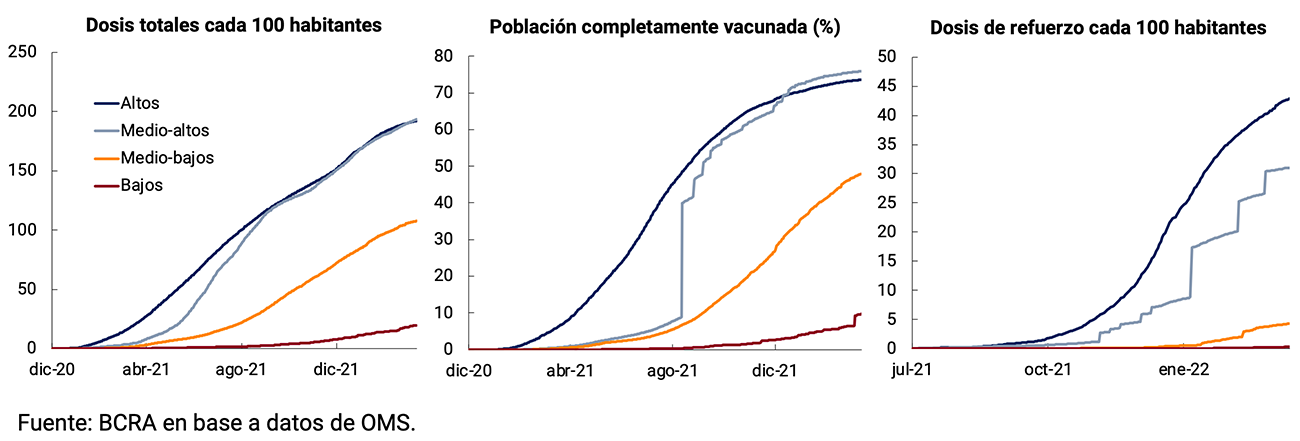
The lower lethality would be due to the characteristics of Omicron and the greater acquired immunity. The variant is more contagious and has a greater capacity for reinfection (infecting previously vaccinated or infected people), but it usually causes milder disease. The effectiveness of vaccines is lower in terms of antibodies, but a booster dose helps increase antibodies and maintain protection against severe disease. In fact, the main strategy of governments in the face of the increase in cases has been to reinforce vaccination campaigns, although the gap between higher- and lower-income countries remains. The percentage of the population fully vaccinated in low-income countries is more than 7 times lower than in high-income countries; and while high-income countries have more than 42 booster doses per 100 inhabitants, low-income countries have applied less than 0.3 (see Figure 2.2).
Figure 2.2 | Evolution of vaccination campaigns by country group
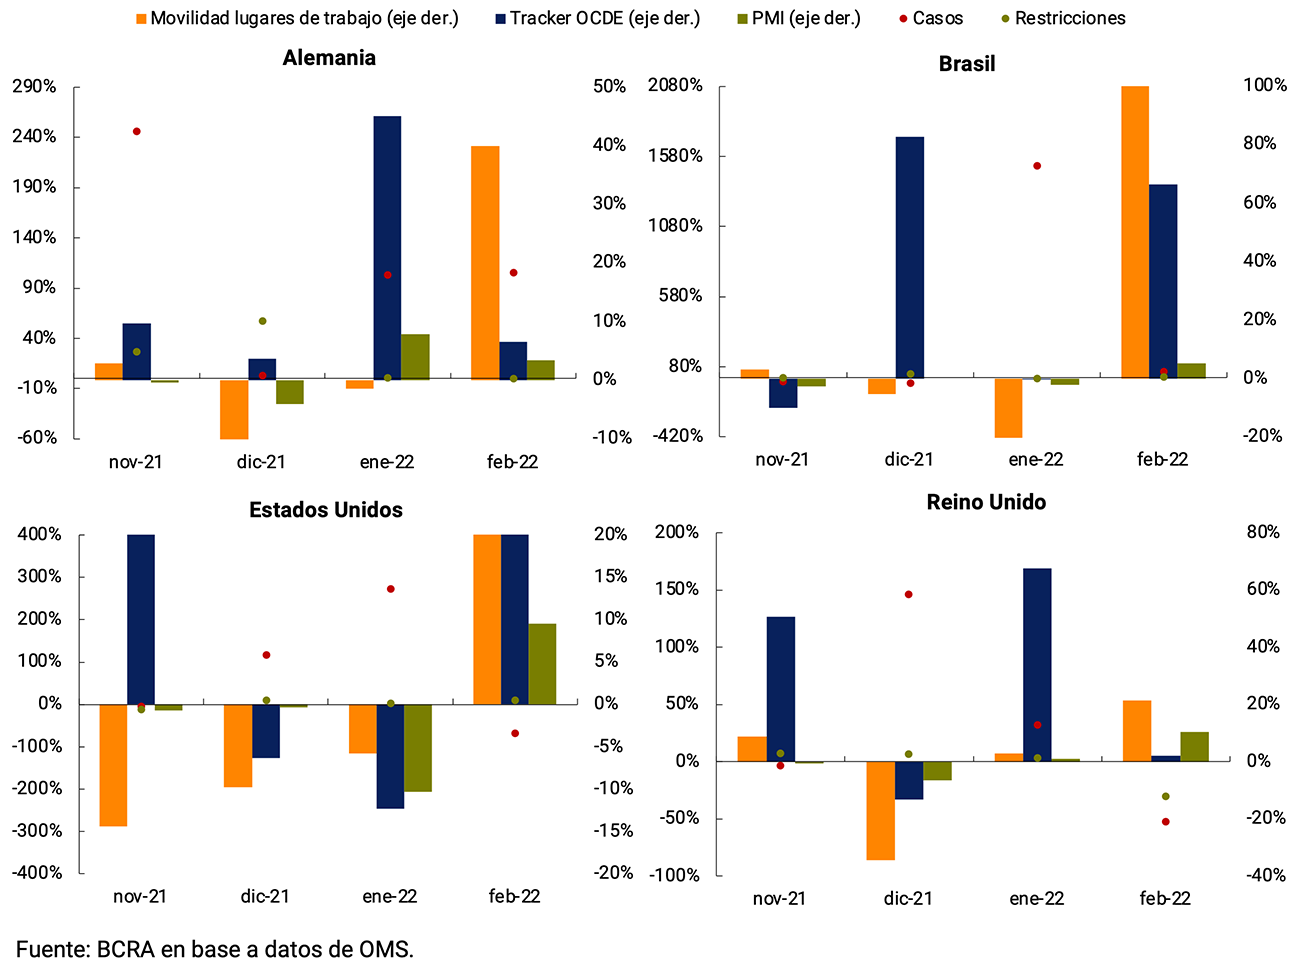
Several countries reintroduced restrictions, albeit with varying levels of rigidity, and there was a drop in mobility, with the consequent impact on the slowdown in the recovery, as detailed in the next section. With the drop in cases during February, mobility increased again and many restrictions began to be lifted (see Figure 2.3).
Figure 2.3 | Monthly change in cases, deaths, tightening of restrictions, mobility, OECD economic activity and PMI indices during the latest wave of Coronavirus
2.2. Due to the conflict, commodity prices rise and global financial conditions tighten
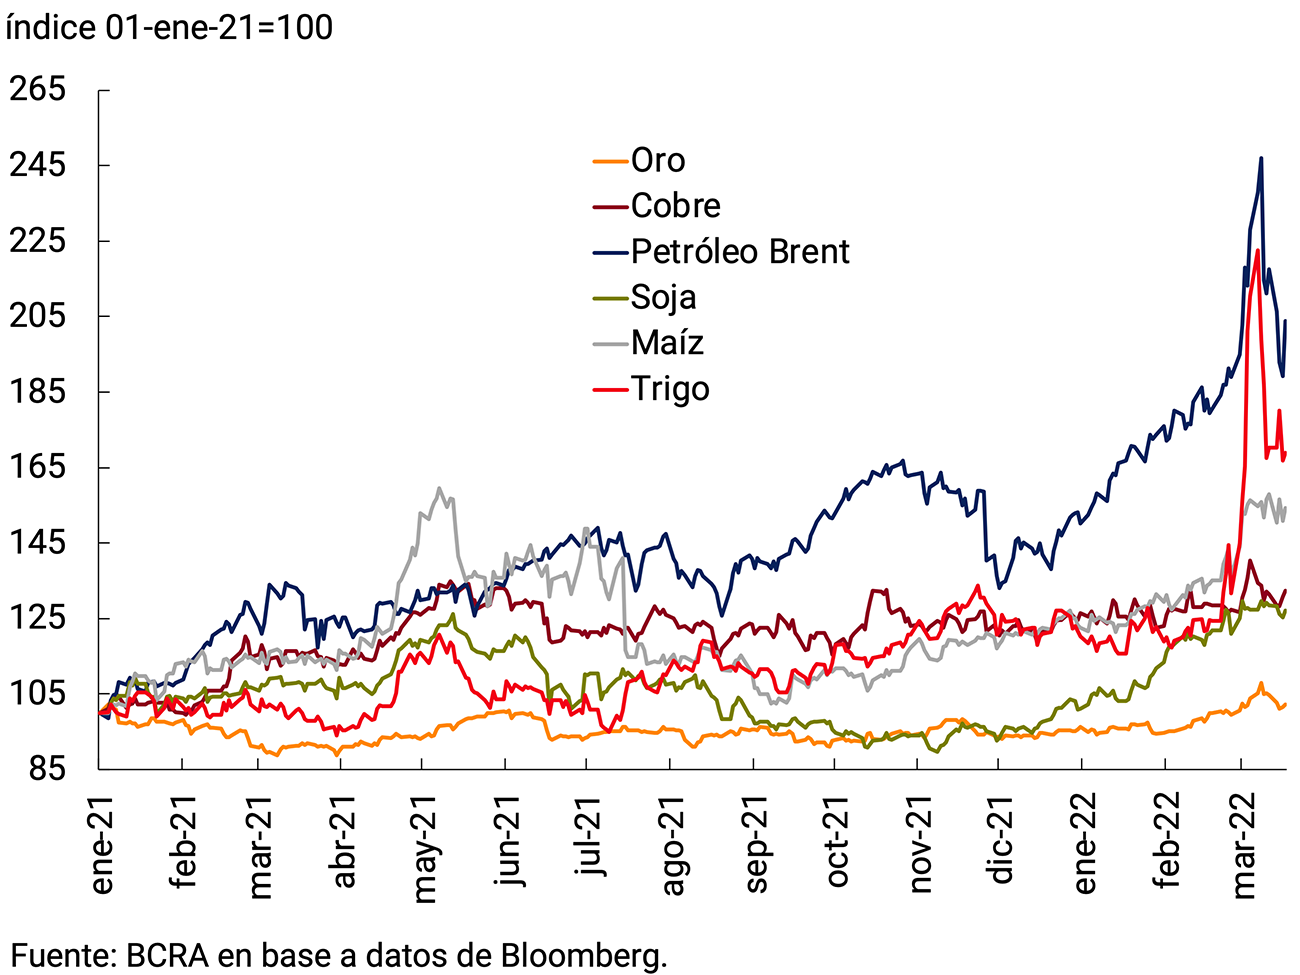
The price of oil had been rising since December due to the recovery in fuel demand and a supply that has been slow to respond. The sanctions imposed on Russia and the problems of oil transport had a strong impact on Brent, which reached US$139 per barrel on March 8, the highest since 2008; and fell to values close to US$100 a barrel during the following week (see Figure 2.4). In addition, Russia is the world’s leading exporter of natural gas, and Europe is heavily dependent on energy imports from that country. At the beginning of the crisis, gas was trading at 116 euros per MWh; and reached 212 euros per MWh on March 7, representing an increase of 83% in the reference market of the Netherlands.
At the same time, the prices of various food commodities rose because Russia and Ukraine are among the main global producers: among them, wheat and sunflower and, to a lesser extent, corn. Together, Ukraine and Russia account for approximately 25% of world wheat exports, 56% of sunflower oil and 10% of corn. The price of wheat hit a record high of US$523 per ton on March 7 before falling, accumulating an increase of 23% since the conflict began and 40% for the year at the time of writing (see Figure 2.4).
Prices of raw materials used as inputs for manufacturing production, in which Russia leads as a producer or exporter, also rose. The impact on palladium (it reached a record of US$2,994 per ounce), where Russia concentrates 40% of world production and is used in the manufacture of automobiles, was highlighted; but the prices of metals such as nickel also rose (after rising 92% since the beginning of the conflict, trading on the London market was suspended) and copper, which reached US$477 per pound. Gold, which is used as a store of value in situations of international stress, reached US$2,070 per ounce, partially reflecting geopolitical tensions (see Figure 2.4).
Figure 2.4 |
Commodity prices
Yield on government bonds and dollar index

Box. Energy consumption and imports in Europe
Between 2010 and 2020, more than half of the gross energy available in the European Union (EU) was covered by net imports: they ranged from 55.7% to 57.5%. In 2020, the highest rates of energy dependence were recorded for oil (97%) and natural gas (83.6%), while for solid fossil fuels it was 35.8% (see Figure 2.5).
Figure 2.5 | Energy dependency ratio, EU-27, 2010-2020
Net imports of gross available energy, as % of total energy consumption

Among the different energy sources, the strong growth in gas consumption stands out. Between 2010 and 2020, the EU’s dependence on third countries for natural gas supplies increased by 15.8 p.p., much faster than dependence on crude oil during that decade (it increased by 3 p.p.). Much of the EU’s imported energy comes from Russia, which stands out as the main supplier of gas (48%) and oil (25%), as can be seen in Figure 2.6.
Figure 2.6 | Imports from the European Union by origin, gas and oil in (%)

The war between Russia and Ukraine accentuated the tightening of global financial conditions that had been observed in recent months, also increasing volatility. As a result of the conflict, the interest rate on 10-year U.S. government bonds reversed part of the rise it registered. But in recent days and with the tightening of the monetary policy of the US Federal Reserve (Fed), it increased again, and as of March 16 it was 65 bps above its level at the close of the previous IPOM, reaching 2.17% (see Figure 2.4). Meanwhile, the 30-year rate rose 52 basis points in the same period, so the yield curve continued to flatten. In Germany, the 10-year government bond rate rose 65 basis points and turned positive again.
The U.S. dollar — measured against a basket of currencies — has appreciated since last May, a trend that has accelerated since the beginning of the war. For its part, the VIX indicator (which reflects the implied volatility on a set of market options) also rose, reaching more than 35 points at the beginning of March.
Figure 2.7 |
Capital flows to emerging countries since the beginning of the pandemic
Stock indices
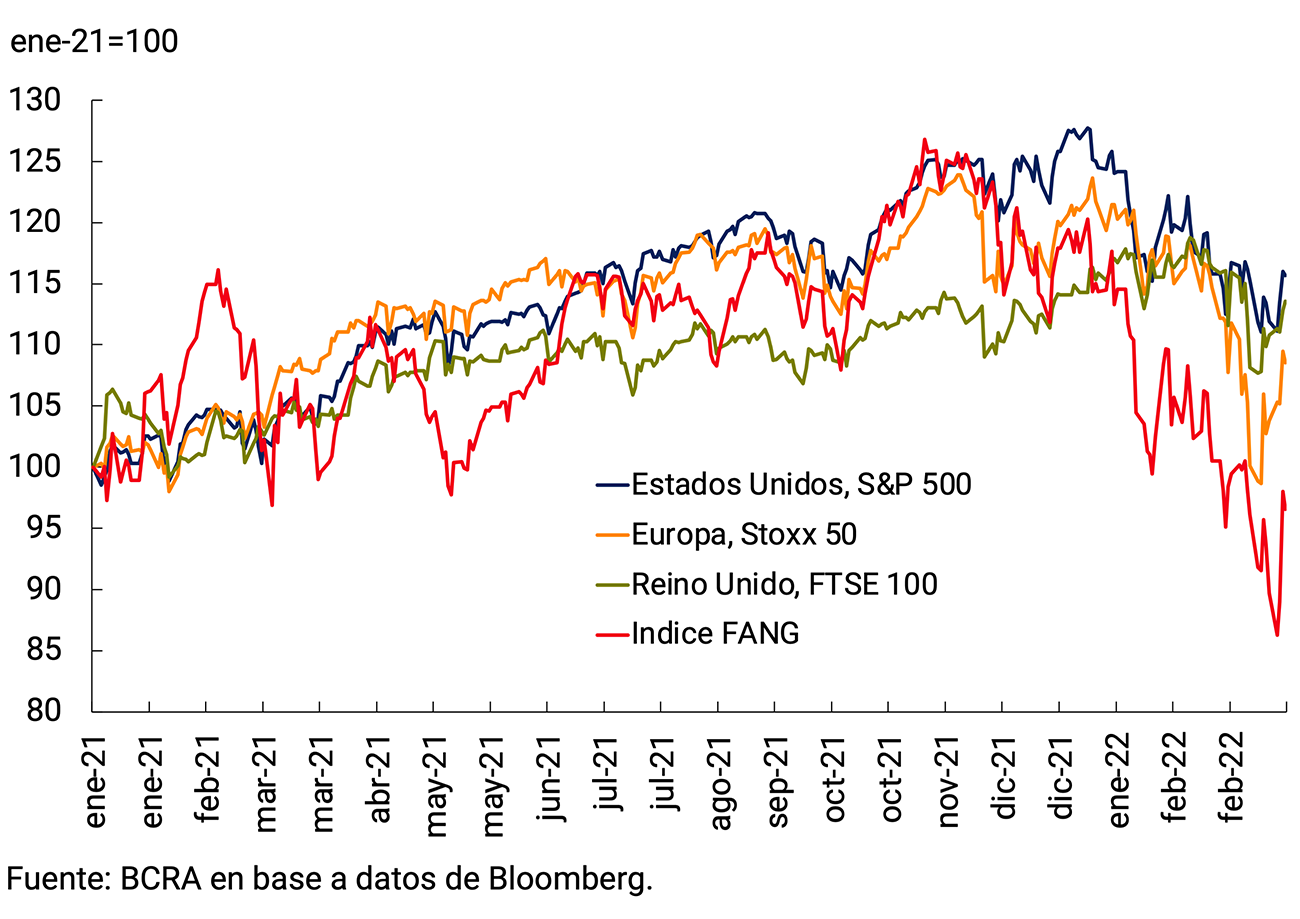
The rise in market interest rates and the war in Ukraine impacted stock prices; the most risky assets were the most affected, as warned in previous reports. While the S&P 500 fell 9% and the European Stoxx 50 fell 10% so far this year, the FANG index, with the largest share of technology companies, was down 17% over the same period and 22% since the previous IPOM close (see Figure 2.7). This dynamic has been accentuated since the beginning of February and if it continues, it would put at risk the performance of the digital “winners” of the last couple of years and the “support” they have meant for the market. Cryptoassets have also fallen substantially in price, and a further fall could have consequences that are not entirely foreseen in the global financial system. Bitcoin, which was once worth more than US$67,000, is now trading around US$40,800, depreciating by more than 40%.
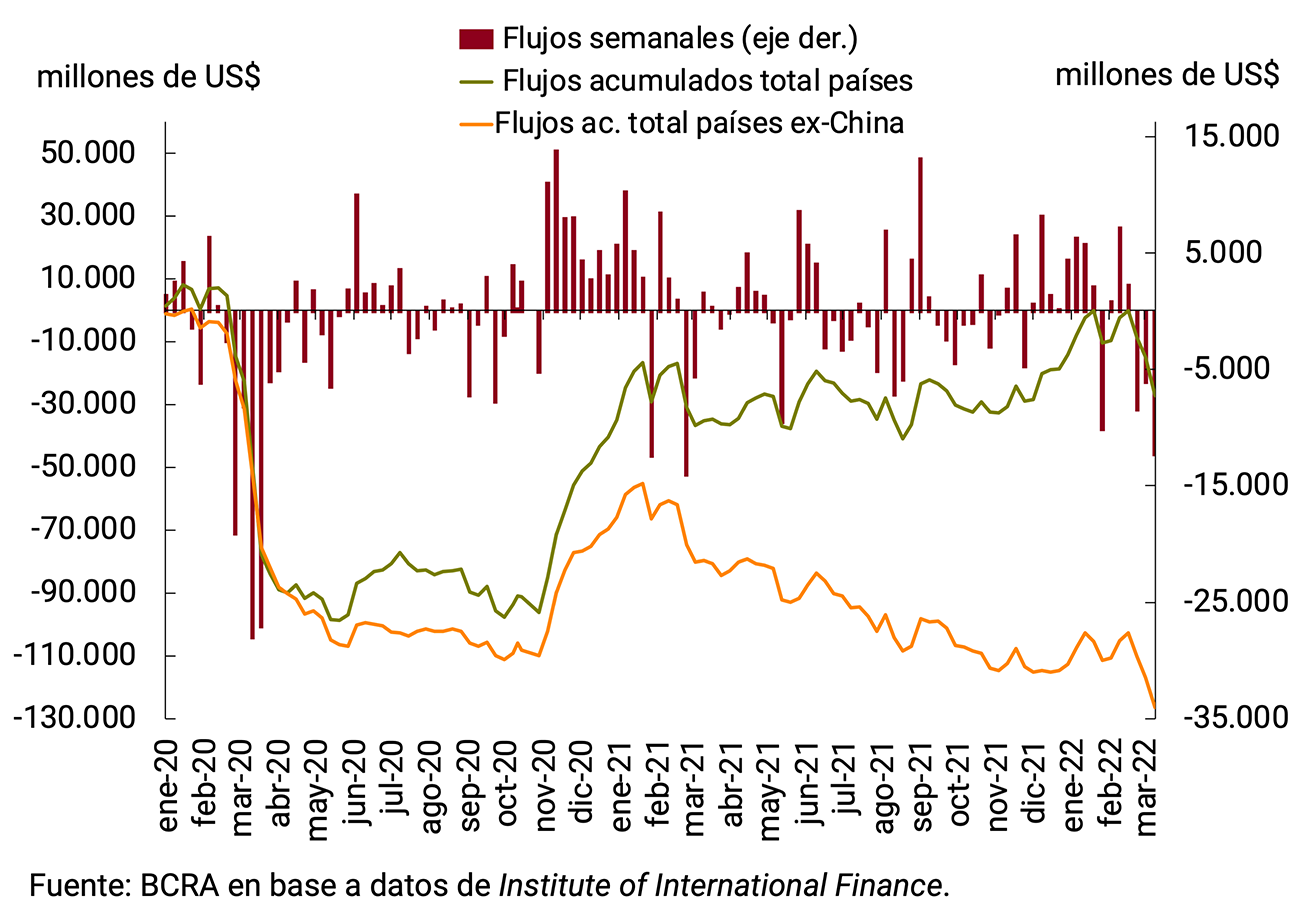
Capital flows to emerging countries, which had been positive and with low volatility, began to show outflows in recent weeks. Although the accumulated flows since the previous IPOM were slightly positive, since the beginning of the year they were negative by US$13 billion. However, its composition was very concentrated. Of a cumulative total of US$3.5 billion since the close of the previous IPOM, US$17.5 billion were flows to China, so flows to the rest of the emerging countries were negative. Since the recovery began, China has been absorbing a growing share of flows to emerging markets (see Figure 2.7).
2.3 The global economy is expected to expand in 2022, albeit at a slower pace and with the conflict in Ukraine as a new source of uncertainty
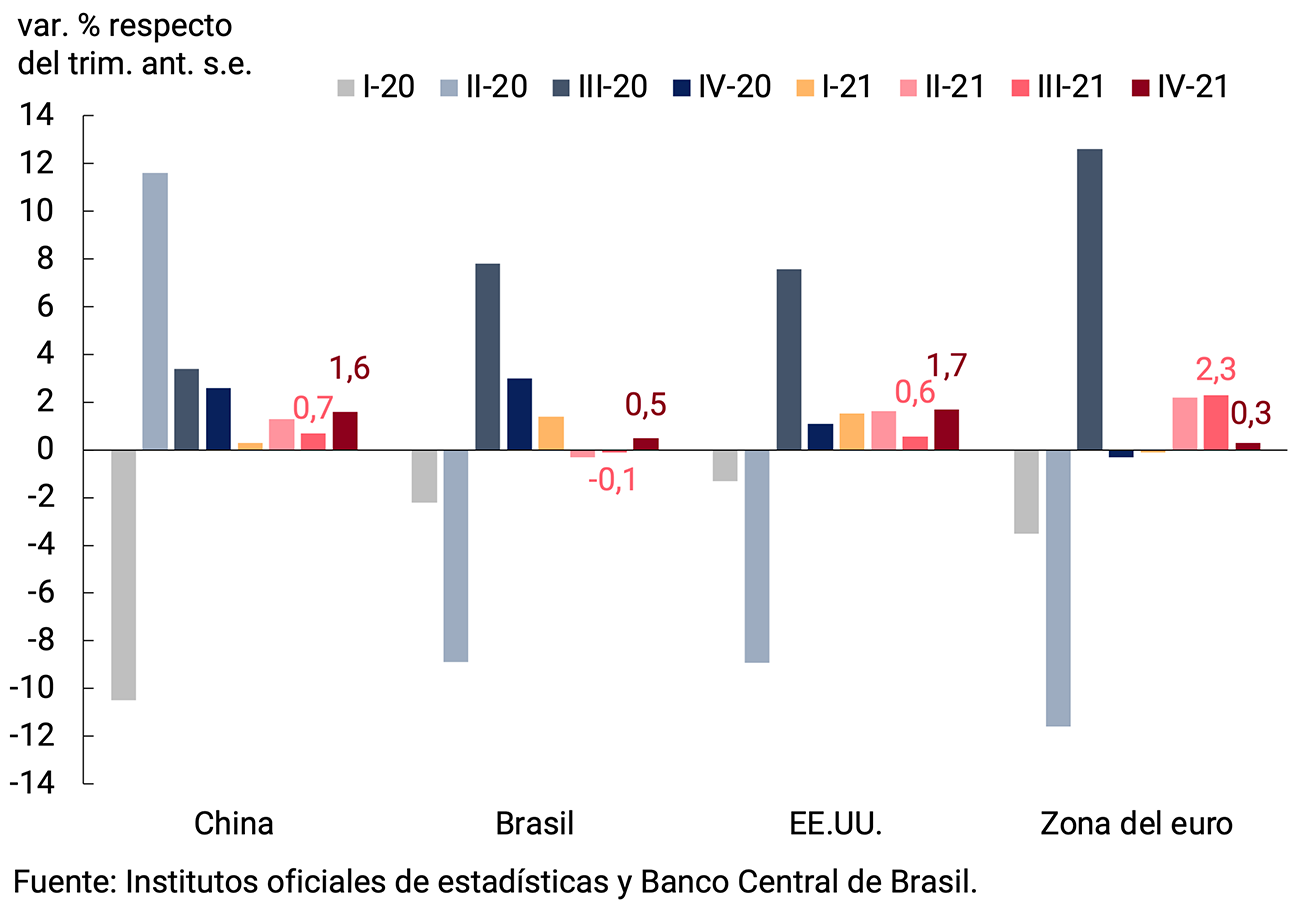
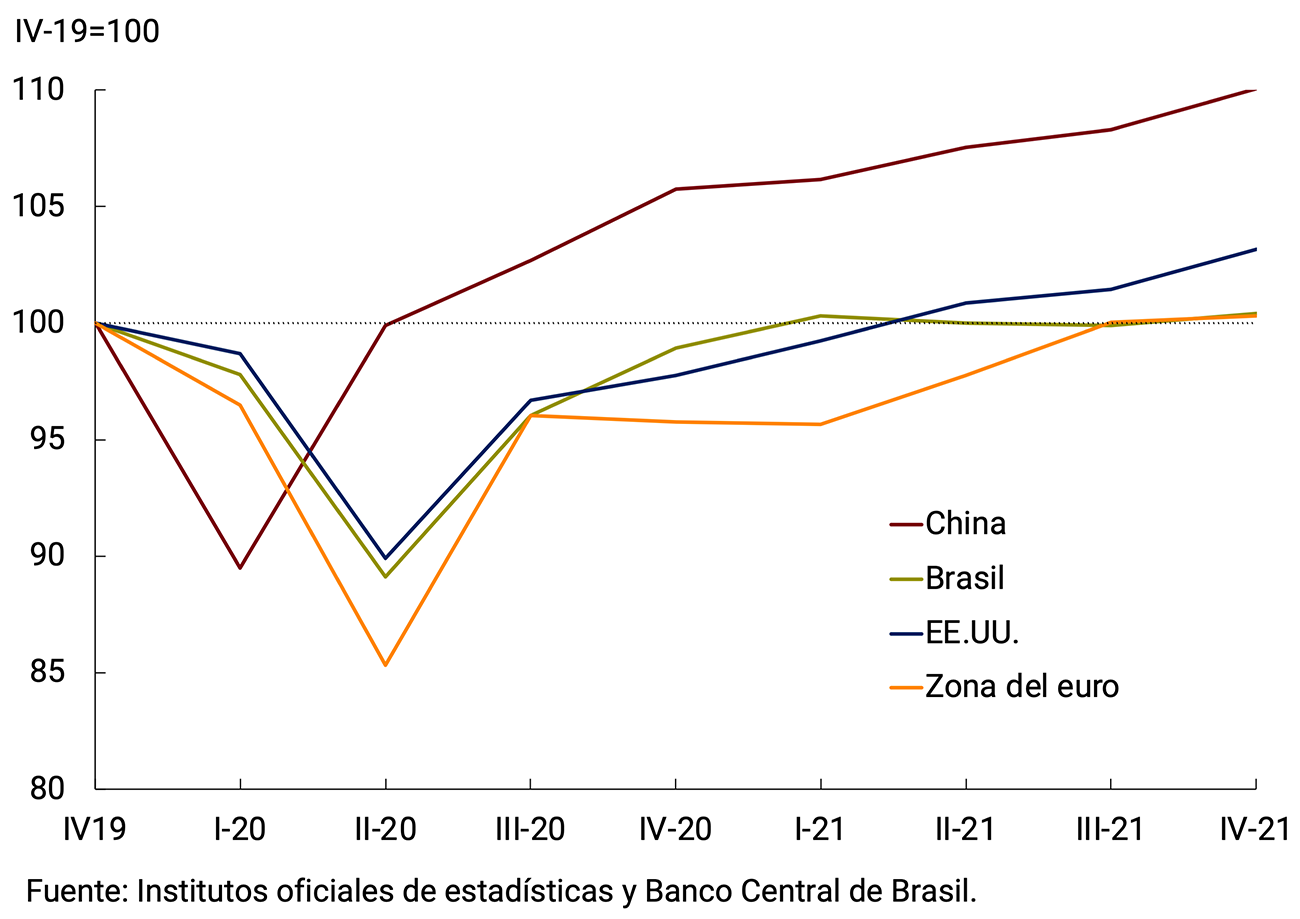
The global economy continued to grow in the fourth quarter of 2021, with heterogeneous dynamics among Argentina’s main trading partners (see Figure 2.8). The United States, China and Brazil accelerated their quarterly growth in that period, while the euro area grew less than in previous quarters, due to the impact of mobility restrictions due to COVID-19 outbreaks and bottlenecks. Thus, at the end of last year, activity levels in the United States and China were clearly above pre-pandemic levels, while the euro area and Brazil showed greater difficulties in overcoming them (see Figure 2.8).
Figure 2.8 | Evolution of the GDP of Argentina’s main trading partners (real GDP without seasonality)
Quarterly % changes
In levels (Q4 2019=100)
High-frequency data from December 2021 and January 2022 reflected the impact of the spread of the Omicron variant and reduced mobility on economic activity, particularly in advanced countries (see Figure 2.9). Purchasing managers’ surveys (PMIs) showed lower global economic activity, with composite indices falling in the United States, the euro area, the United Kingdom, and China in January (although still in the expansion zone, above 50). The services sector was the main affected. Retail sales also felt the impact, with declines in the United States, the euro area and the United Kingdom in December. In the same vein, the OECD’s economic activity indicator reflected lower activity in the United States and Europe in November, December and January.
From February onwards, the reduction in cases and fewer restrictions on mobility were reflected in a recovery in economic activity, with improvements in PMIs, the OECD economic activity indicator and retail sales (see Figure 2.9). For its part, the manufacturing industry showed a better performance with an increase in industrial production in January in the United States and the United Kingdom and the global manufacturing PMI in February; and some improvement in delay times and supply chain problems in the United Kingdom, the euro area and the United States. Activity indicators are expected to begin to reflect the impact of the war in Ukraine and the economic sanctions on Russia from March.
Figure 2.9 | Activity indicators
Before the outbreak of the war, forecasts for the global economy indicated that the world would grow again in 2022, although at a slower rate than the 5.7% recorded in 2021 (average of the IMF, World Bank and OECD). At the beginning of this year, the expected global expansion had been reduced due to the continuity of the pandemic and problems in global supply chains, increasingly contractionary monetary policy and a lower fiscal stimulus. Thus, in January of this year, the average growth forecasts for 2022 of the three aforementioned agencies was 4.3%, 0.3 p.p. below the previous projection (see Table 2.1).
The armed conflict implies lower projections of global growth. Its initial impact has reinforced previous trends of tightening global financial conditions and rising commodity prices. According to the European Central Bank, the expansion of the world economy would fall from 4.5% to 4.1% in 2022 and from 3.9% to 3.6% in 2023 and, in the euro area, from 4.3% to 3.7% in 2022 and from 2.9% to 2.8% in 2023. For its part, the Fed’s board also lowered its growth forecasts for this year, from 4.0% to 2.8%, but maintained next year’s at 2.2% (see Table 2.1).
Table 2.1 | Economic projections

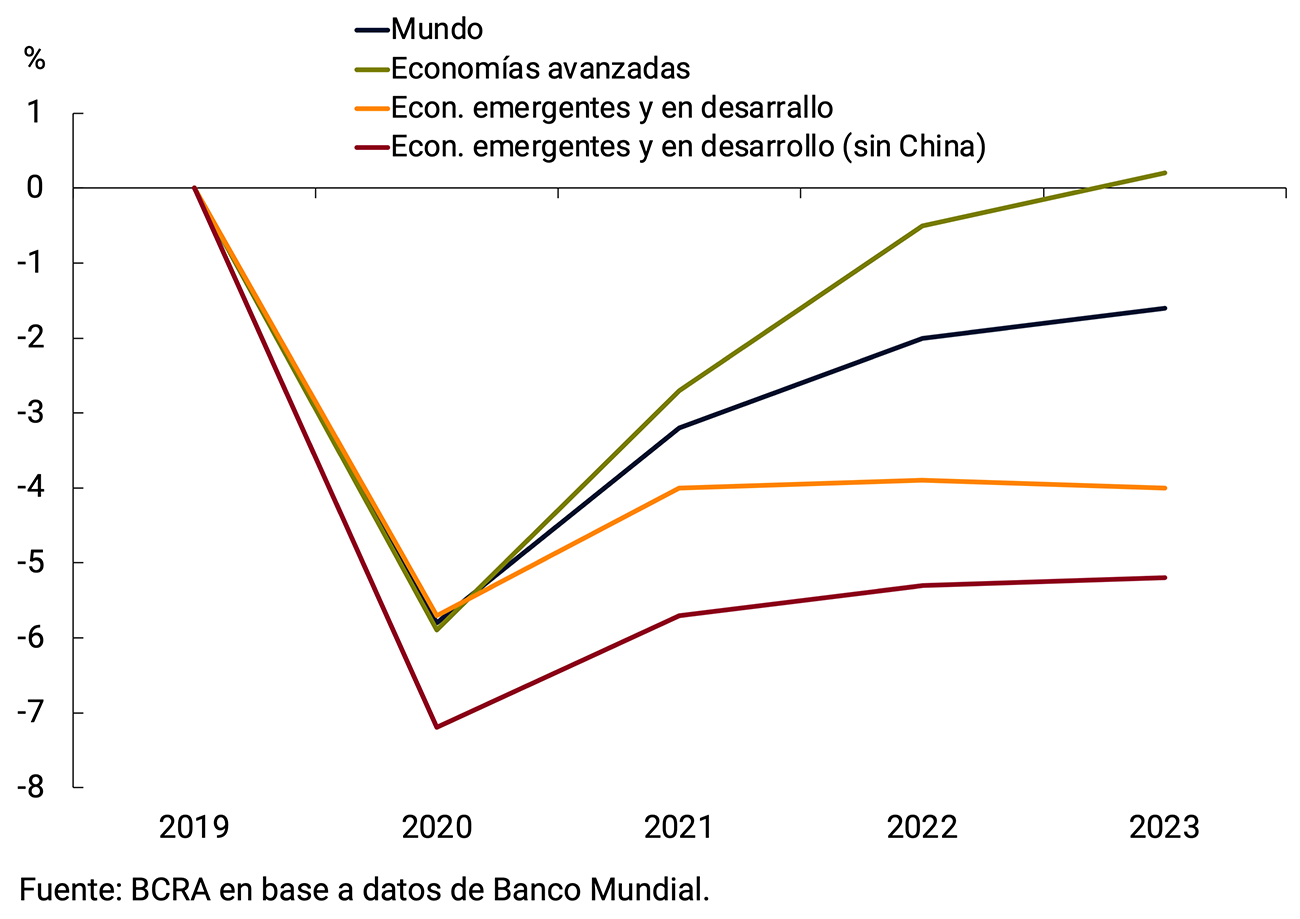
The recovery would continue to diverge between advanced and developing countries given differences in access to vaccines and policy space and the impact of the monetary cycle on both groups of countries. According to the World Bank, and considering pre-conflict forecasts, economic activity in advanced economies would exceed the trajectory forecast before the pandemic in 2023; while that of emerging and developing economies would remain 4 p.p. below the pre-pandemic trend, a difference that widens to 5.2 p.p. if China is excluded from the latter group (see Figure 2.10).
Figure 2.10 | Evolution of GDP compared to pre-pandemic trends
Unemployment rates have recovered from the highs recorded in the second and third quarters of 2020. In several cases, they have returned to their pre-pandemic levels or are close to reaching them, while labor participation rates are slowly returning to pre-COVID-19 levels (see Figure 2.11).
Figure 2.11 Unemployment and labour force participation rates in selected countries
Unemployment
rateDifference in p.p. between the last available month and comparable pre-pandemic month
Workforce
ParticipationDifference in p.p. between the last available month and comparable pre-pandemic month
2.4. Central banks accelerate the reduction of monetary stimulus in the face of rising inflation, facing new dilemmas due to the conflict
In the face of higher global inflation, a risk highlighted in the previous IPOM materialized: central banks in developed countries began to withdraw monetary stimulus in recent months. Their peers in emerging countries continued to take contractionary measures and, in some cases, accelerated their pace. The conflict in Ukraine adds a supply shock (energy and other raw materials) to a scenario that had previous impacts in this regard. This accentuates the dilemma for central banks: let these relative price changes (which would be temporary) pass them by, or raise interest rates more aggressively.
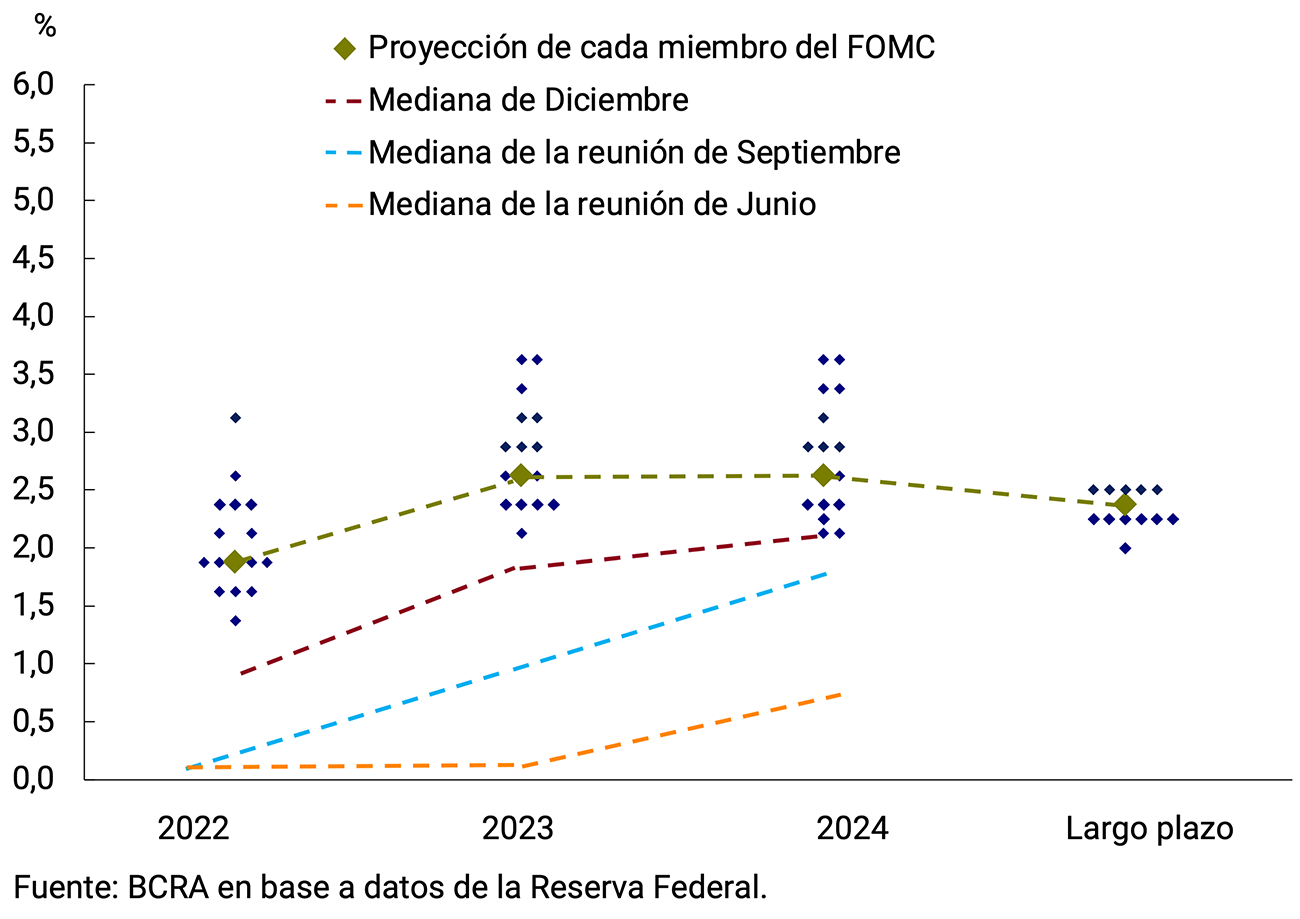
On March 16, the Fed announced the first increase in its benchmark interest rate since 2018 (TFF, +0.25 p.p.). In addition, it has ended the asset purchase program and at the next meeting in May it will announce how it plans to reduce its bond holdings. In just a few months, the Fed markedly accelerated the expected trajectory of TFF hikes: at its meeting in March of this year it revealed a forecast of seven TFF increases in 2022 (the first has already occurred); while in December 2021 it foresaw three increases in the TFF; in the previous meeting only two increases; in June 2021, none; and in the March 2021 census, it did not foresee increases until 2024 (see Figure 2.12).
Figure 2.12 | Projected Fed Funds Rate Target
The European Central Bank (ECB) will end its pandemic emergency asset purchase program (PEPP) in March 2022. In addition, the ECB decided to accelerate the withdrawal of the asset purchase program (APP); however, it gave mixed signals regarding when it will make the first increase in its benchmark interest rate. The Bank of Japan also announced the end of additional purchases of commercial paper and corporate bonds in March 2022. The Bank of England made similar announcements, while raising its interest rate for the third time in a row in March (to 0.75%).
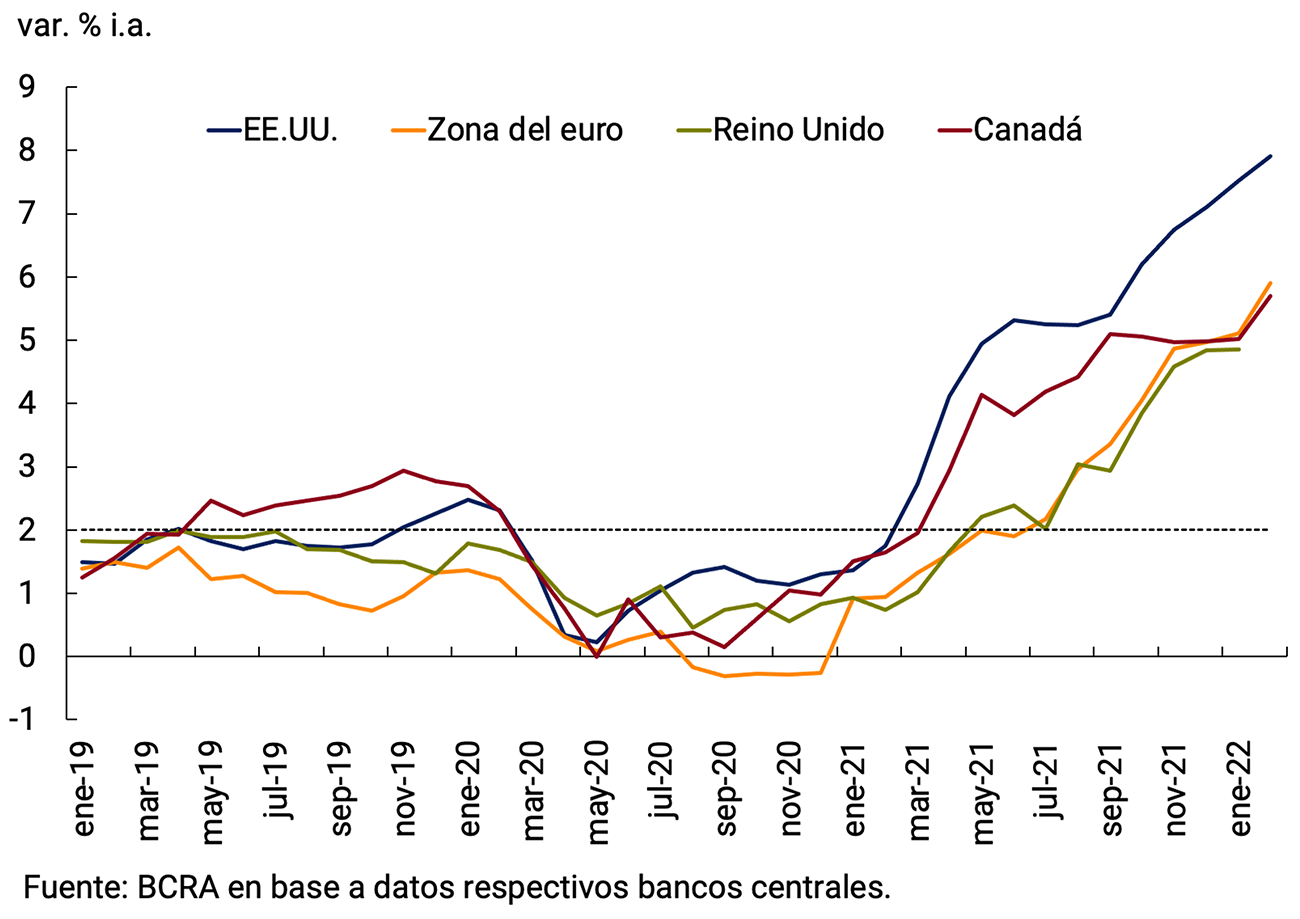
These decisions are due to the fact that inflation in developed countries reached record levels in recent decades, more than doubling the targets of their central banks (see Figure 2.13). In February, retail inflation was 7.9% YoY in the United States (highest since 1982), 5.9% YoY in the Euro Area (highest since 1991), 5.7% YoY in Canada (highest since 1991), while in January it reached 4.9% YoY in the United Kingdom (highest since 1992).
Figure 2.13 | Inflation rates of selected developed countries
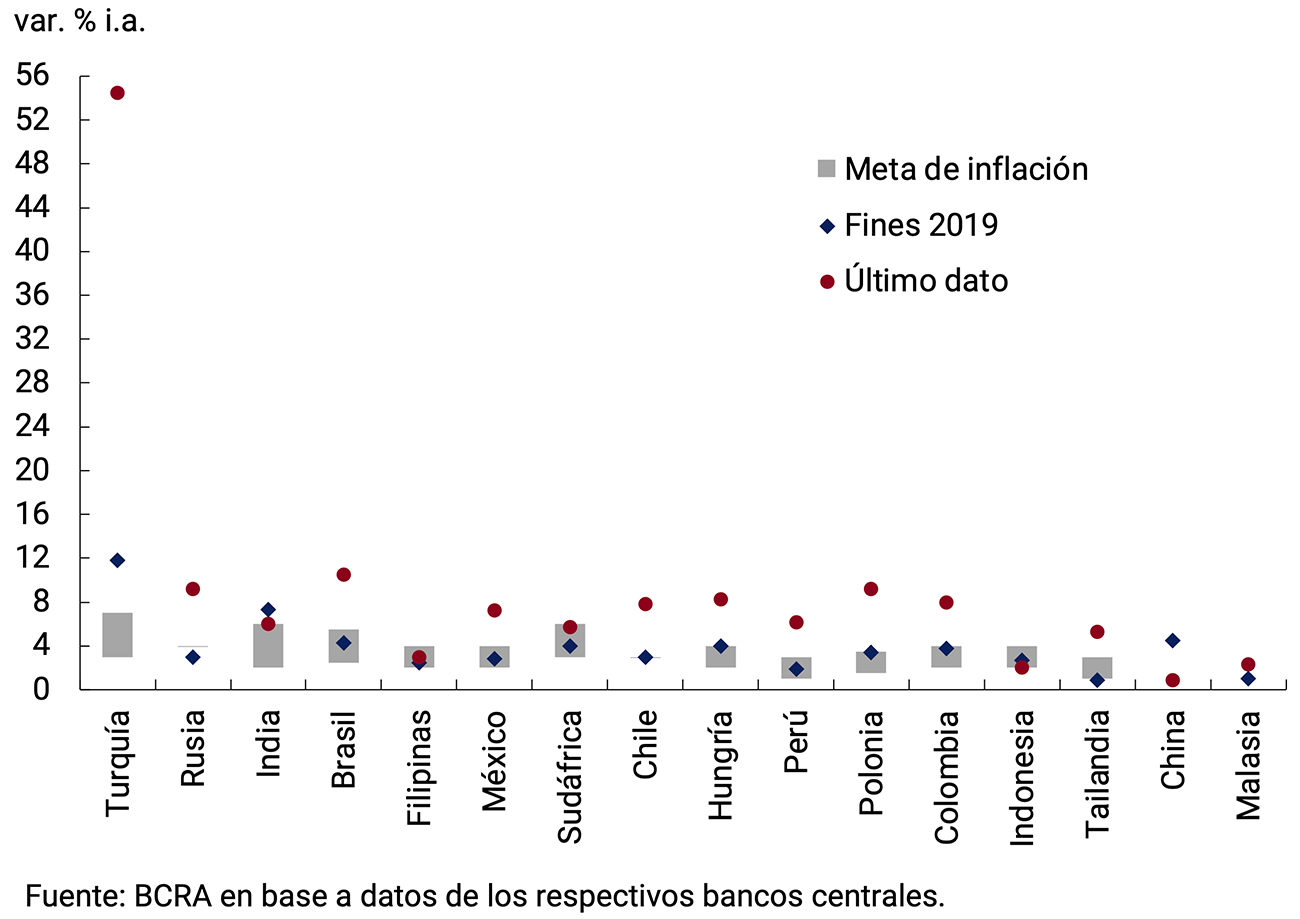
Meanwhile, the central banks of emerging countries continued to take contractionary measures in the face of inflationary pressures that manifested themselves earlier than in advanced countries and in greater amounts. The average interest rate of the group of countries surveyed touched a minimum of 2.98% in August 2020 and now stands at 6.1% (see Figure 2.14). In Latin America, there were record interest rate increases in two decades: 1.5 p.p. in Brazil (on three occasions) and 1.5 p.p. in Chile. Other emerging economies that raised their rates were South Africa and Russia (in the latter case also due to the recent impact of economic sanctions on their foreign exchange market). Central banks in Asia, where inflation has risen much less, kept them unchanged. The exception was Turkey, which reduced its rate, only to suffer a sharp depreciation and the consequent transfer to inflation (almost 11.1% monthly in January). The recent rise in energy and agricultural commodities is expected to reinforce the trend in inflation during March, in both advanced and emerging countries.
Figure 2.14 | Monetary Policy Rate and Inflation in Developing Countries

Box. Contractionary monetary policy in Brazil
Brazil’s central bank (BCB) has raised its benchmark interest rate (Selic) nine consecutive times since March 2021, from record lows of 2% that month (see Figure 2.15).
Figure 2.15 | Brazil. Interest Rate, Inflation (left) and growth expectations (right)
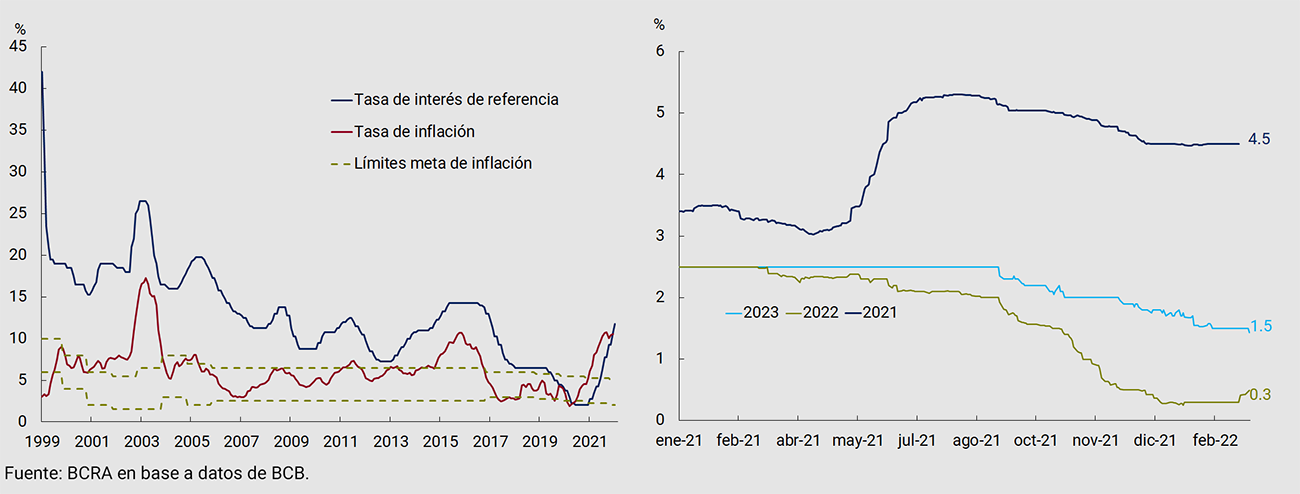
Inflation rose to 10.5% YoY in February, more than 5 p.p. above the upper limit of the target, with expectations rising and with the BCB projecting it above the target this year. Part of the inflationary increase was driven by the depreciation of the real, which was reinforced by higher commodity prices.
The increases in the Selic have had a negative impact on growth expectations for 2022 and 2023 (see Figure 2.15). In addition, they will weigh on fiscal results since almost half of Brazil’s public debt is indexed to this rate. Each 1 p.p. increase in the target on the Selic rate implies an increase of approximately 0.5 p.p. in fiscal deficit. The BCB pointed out, after its latest decision, that Selic’s rate of hikes would be slower this year.
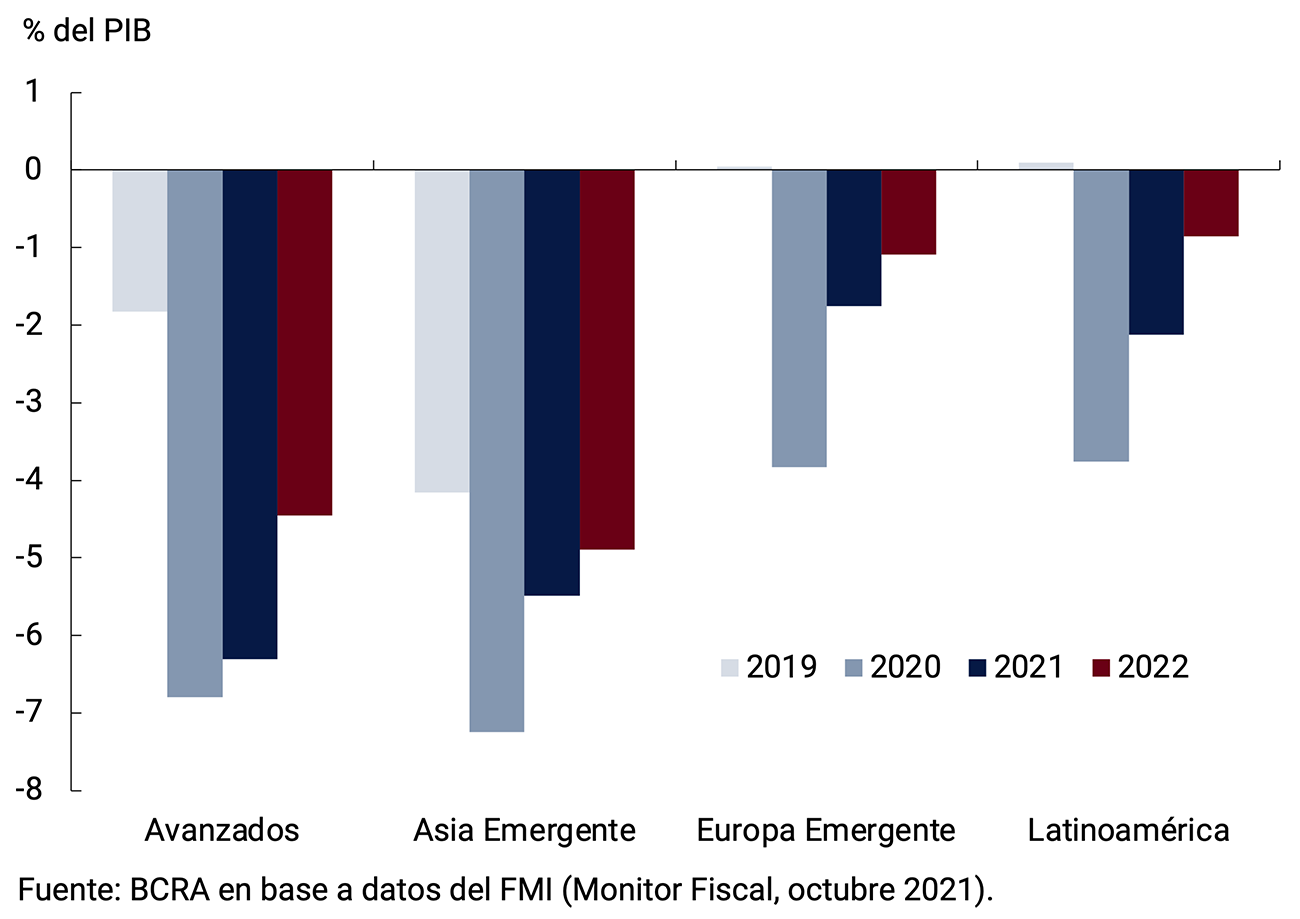
For its part, the fiscal stimulus tended to be withdrawn during 2021 as governments reduced spending to alleviate the effects of the pandemic, as shown by structural fiscal outcome measures. This contraction was more marked in emerging countries than in advanced ones, given the former’s lower capacity to finance large deficits. The withdrawal of the fiscal stimulus is expected to continue this year, with a larger reduction in advanced economies (see Figure 2.16).
Figure 2.16 | Government primary result adjusted by business cycle
2.5. In summary
The global recovery continues in a divergent manner (due to the unequal policy space and gaps in vaccination campaigns) and has slowed down (due to the expansion of Omicron and the withdrawal of monetary and fiscal stimulus). Rising inflation in advanced economies creates the risk of a steeper monetary contraction, which would “trickle down” to developing countries under higher international interest rates, dollar appreciation, capital outflows and, eventually, lower growth. A possible “correction” of high global asset valuations would enhance that risk. The armed conflict in Ukraine opened a new source of uncertainty for the global economy. It affected financial markets and intensified two previous trends: higher commodity prices and transportation costs, implying greater global inflationary pressures and lower levels of activity. Going forward, the dynamics of the conflict will determine the magnitude of that impact.
3. Economic Activity and Employment
Economic activity continued to improve in the fourth quarter of 2021 and continued to operate at levels above pre-pandemic levels, closing the year with greater dynamism than initially expected. The data available from the EMAE for December showed a progressive reduction in sectoral heterogeneity – with a recovery that had initially been led by industry, trade and construction. The sectors with the highest health risk began to operate at levels closer to those of pre-pandemic after the progressive normalization of social mobility.
The recovery of activity took place in a context of broad coverage of the population with complete vaccination schemes and the progressive progress in the application of booster doses that, in a context of circulation of a new strain of the virus with less lethality, made it possible to limit the impact of the third wave of COVID-19 cases at the beginning of the year. with fewer critical hospitalizations and deaths compared to previous outbreaks of the disease.
In this context, the National Government continued to implement policies aimed at sustainable and inclusive economic growth, while making progress in the promotion of strategic sectors, the promotion of the development of local suppliers, regional economies and the recovery of employment. It also temporarily extended targeted support measures on sectors severely affected by the pandemic. For its part, the BCRA continued to contribute to the recovery process through lines of credit linked to productive development, the continuity of measures to promote private consumption and benefits for investments aimed at expanding export capacity.
After recovering 10.3% during 2021 and with a very good performance in the last quarter, GDP has a statistical drag of 4.1 percentage points of growth for this year. With a greater degree of immunity of the population, the rapid progress of the application of booster doses of vaccines against COVID-19, the BCRA expects that the services that are still lagging behind will be able to recompose the levels of pre-pandemic activity, in an environment of great adaptation of households and firms to preventive care and a greater flow of international tourism. In the same sense, the stimulus policies implemented by the National Government and the BCRA will contribute. However, the evolution of activity in the short term is conditioned by the risks associated with a less favourable international scenario, with the deterioration of the financial context and tensions in the energy market, weather conditions and the circulation of new variants of the virus at a global level.
3.1. With greater dynamism than initially expected, economic activity registered an average increase of 10.3% in 2021
In a context of high social mobility with the gradual recomposition of sectoral activity, the seasonally adjusted Monthly Estimator of Economic Activity (EMAE) (s.e.) registered a 1.7% quarterly increase s.e. in the fourth quarter and a year-on-year variation (y.o.y.) of 10.3% on average for 2021.
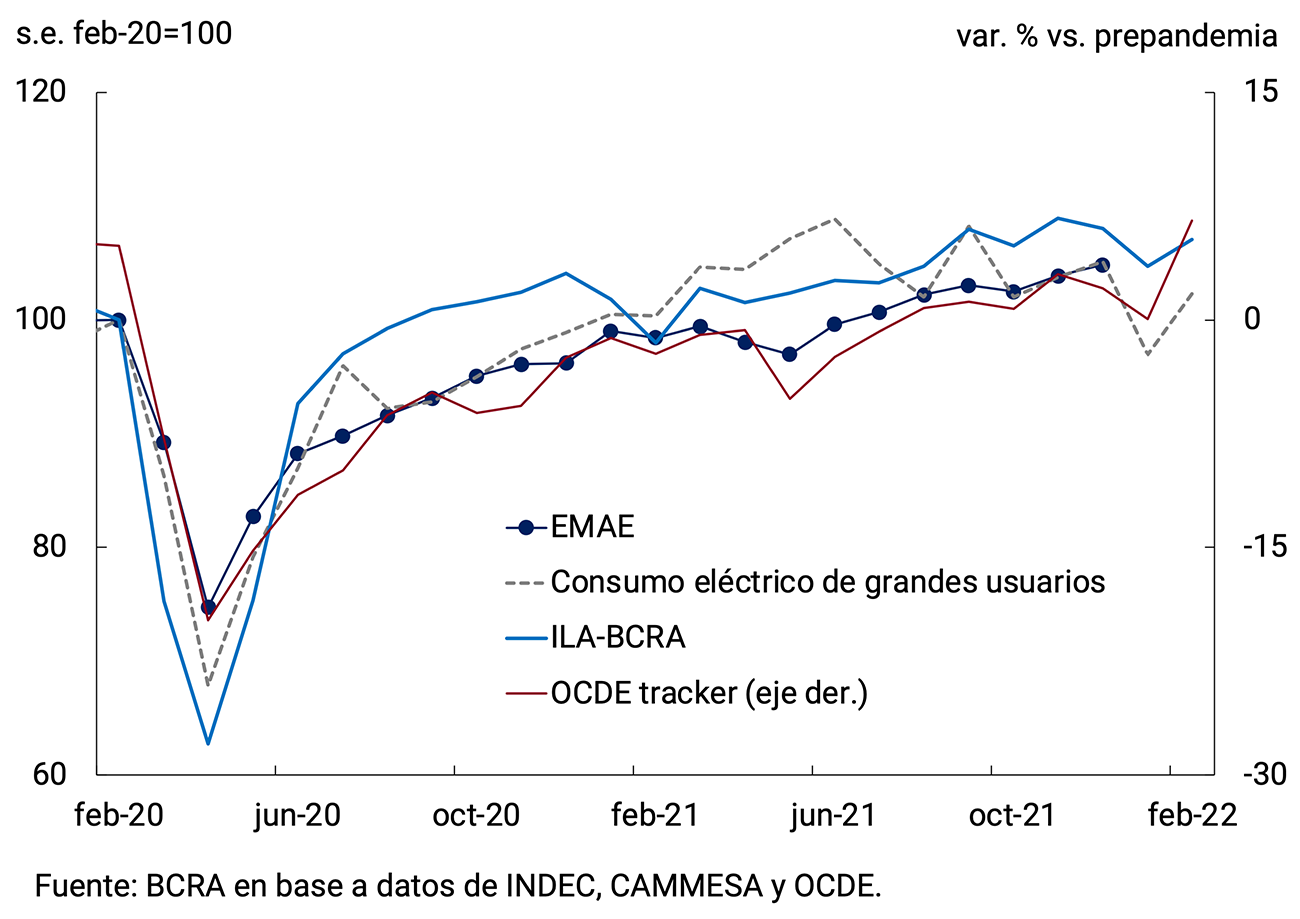
The data available for January and February 2022 show heterogeneous performances. In January 2022, industrial production registered a monthly drop of 5.5% s.e., while the quantities sold of construction inputs (measured from the Synthetic Indicator of Construction Activity (ISAC)) fell by 3.9% s.e. in a context of abundant rainfall. The normalized and seasonally adjusted electricity consumption of CAMMESA’s large users fell in January and partially recovered in February, as did the OECD indicator based on Google searches and the ILA-BCRA4, after two consecutive months of declines (see Figure 3.1). All this shows that the impact of the resurgence of COVID-19 infections on economic activity was transitory, with a large number of companies that had difficulties operating normally due to the high absenteeism of their staff and some power cuts due to the record temperatures recorded in mid-January. On the other hand, during the month of January, some financial tensions were evident that moderated after the agreement in principle with the IMF staff was announced at the end of the month.
Figure 3.1 | Monthly indicators of economic activity
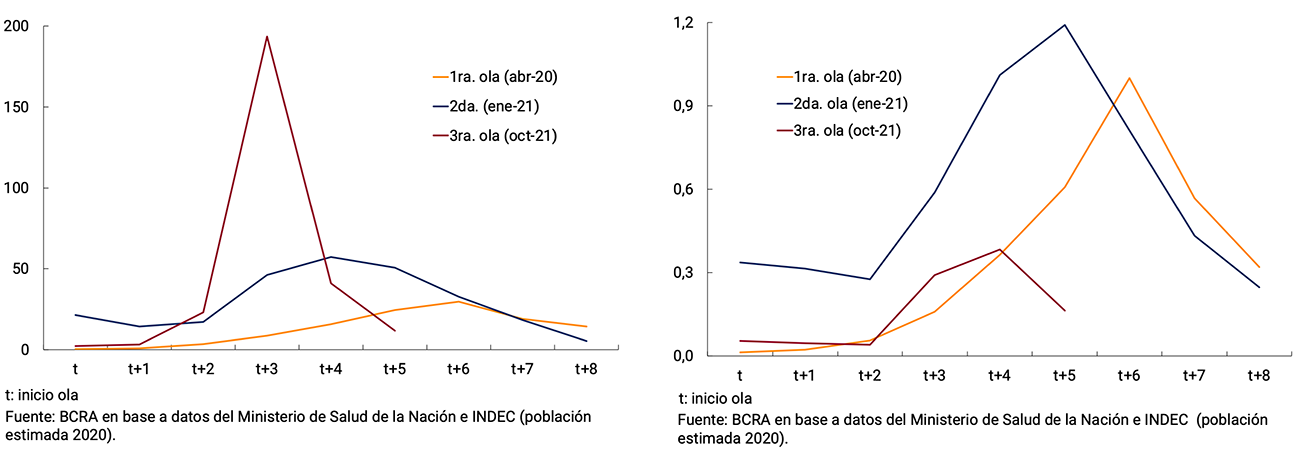
The exponential increase in COVID-19 infections at the end of 2021 and the beginning of this year — when the number of cases more than doubled last May’s peak with a strong prevalence of the strain called Omicron — revived uncertainty about the economic impact that this third wave of the pandemic could cause. Statistics from the Ministry of Health show that vaccination has been very effective in mitigating the severity of the disease in the face of the development of new variants of the coronavirus and, in line with international experience, the number of infections showed a rapid decline (see Chapter 2. International Context). The wide vaccination coverage with complete schedules of the total population and the highest risk with a booster dose5, resulted in a lower rate of hospitalization and deaths compared to previous peaks of infections (April 2020 and early 2021; see Figure 3.2). According to local health authorities, unprotected (unvaccinated) people, those who had only one dose and people at higher risk due to comorbidities, have accounted for a significant proportion of the most recent hospitalizations for COVID-19.
Figure 3.2 | Population vaccinated with second (left) and third dose (booster/additional; right)
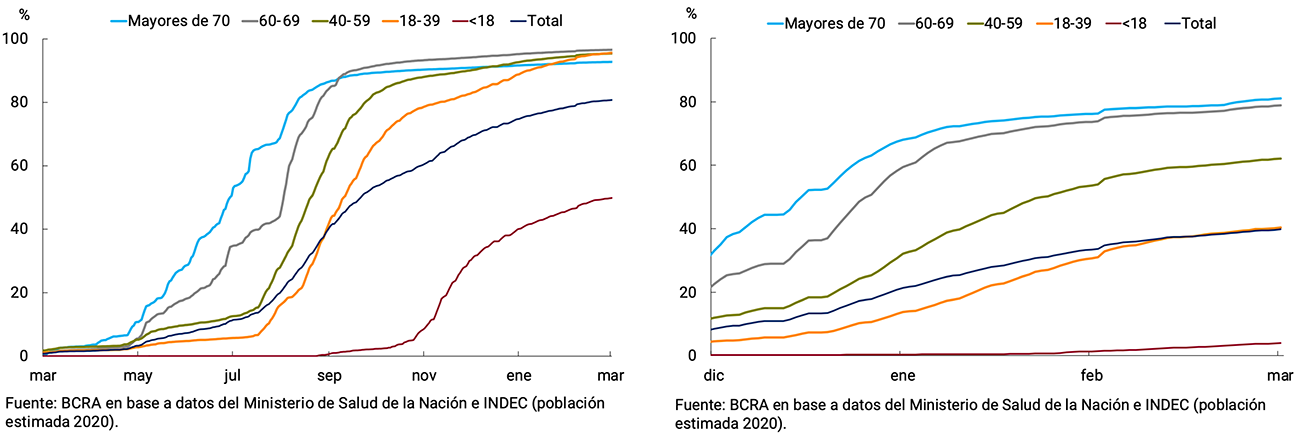
New infections with COVID-19 (left) and deaths (right) per 100 thousand inhabitants
3.1.1. Private consumption would have recovered significantly towards the end of 2021
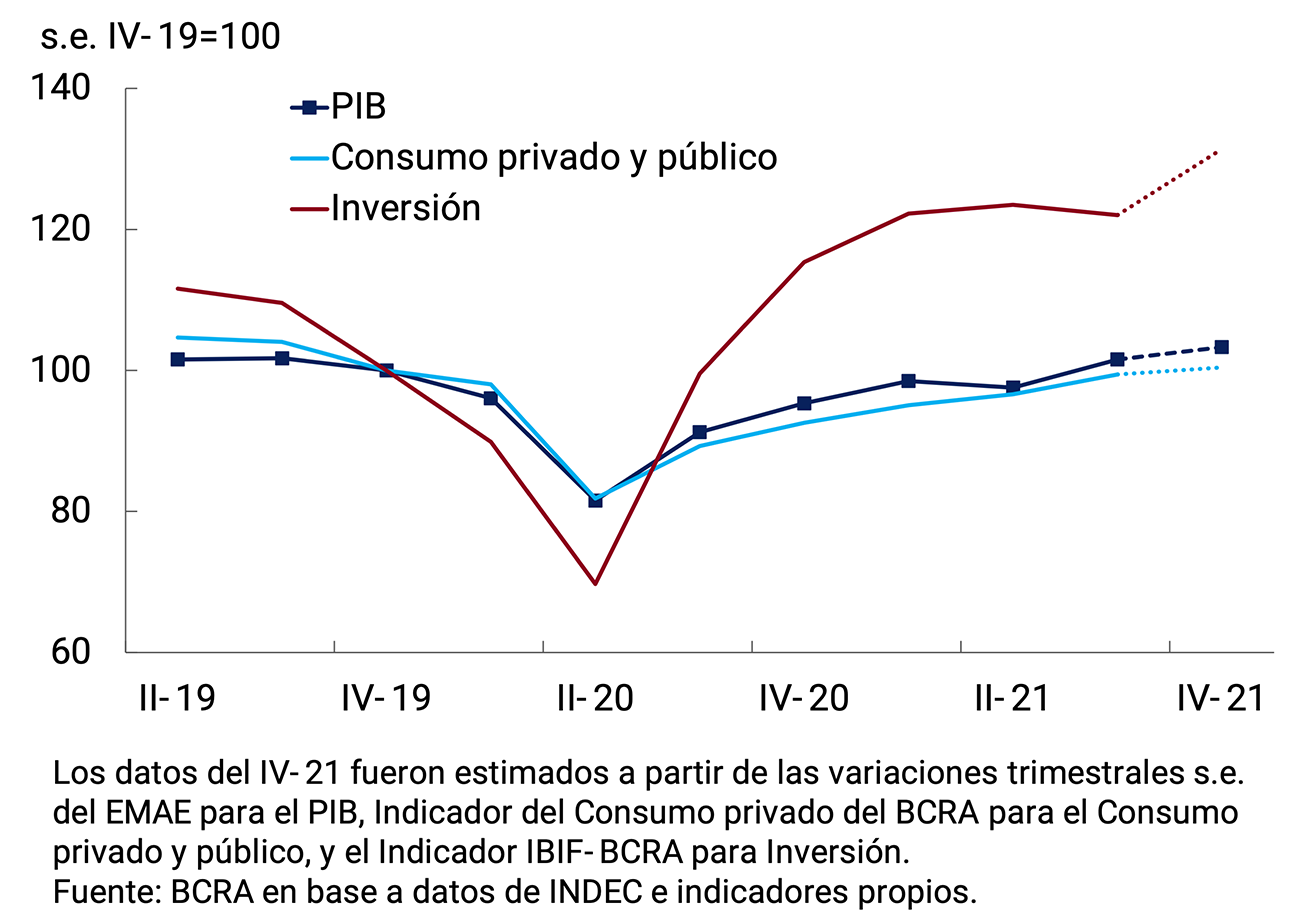
In the third quarter of 2021, GDP increased 4.1% quarter-on-quarter (11.9% y.o.y.) and was 1.6% s.e. above its level in the last quarter of 2019. Domestic demand – total domestic expenditure on consumption and investment – exceeded its pre-pandemic level by 3.1% s.e. and recovered 2.1% quarter-on-quarter s.e. basically due to the performance of consumption: private consumption recovered 2.8% quarter-on-quarter (12.1% y.o.y.) and public consumption increased 3.4% s.e. (11.5% y.o.y.). Investment6 was the only component of aggregate demand that contracted in relation to the previous quarter (-1.2% s.e.; 21.2% y.o.y.). External demand for goods and services increased 7.3% qoq s.e. (18.8% y.o.y.) and imports, 1.7% qoq s.e. (26.2% y.o.y.)7. The EMAE data for the fourth quarter anticipate a new rise in GDP, with increases in both consumption and investment.
For the fourth quarter, the BCRA Private Consumption Indicator8 anticipates a new recovery (see Figure 3.3). The rise in private consumption is explained by the evolution of the mass of household income. This includes improvements in employment levels, both formal and informal, in a context of progressive normalization of service activities, mainly those associated with tourism and leisure.
Figure 3.3 | GDP and main components of demand
It should be noted that one of the characteristic features of the COVID-19 crisis in Argentina was the asymmetric recovery of activity in relation to quality jobs (formal and full-time), with greater job insecurity observed in relation to the pre-pandemic (see point 3.1.3 on the Labor Market). This slow recovery in registered private salaried employment mainly affected the population as a whole in the lower-income strata – with less qualified jobs – whose propensity to consume is relatively higher than the average. Labour-intensive sectors, such as services, were severely affected in 2020 and were unable to fully recover in 2021, with still high uncertainty regarding the end of the pandemic that slows down staff hiring decisions.
For its part, the IBIF-BCRA9 indicator recovered significantly and showed a quarterly improvement of 7.7% s.e. in the fourth quarter of 2021. This increase was due to an increase in investment in durable equipment of both imported and national origin and, to a lesser extent, in construction.
With respect to the external sector and in line with the information referring to the Commercial Exchange of Goods of INDEC, in the fourth quarter the contribution of net exports of goods and services to the quarterly variation of the Product would have been negative. Exported quantities of goods registered a quarterly fall (-9% s.e.), while imported volumes of goods increased 9.7% in seasonally adjusted terms (see Chapter 4. External Sector).
3.1.2. Among the productive sectors, services were the ones with the greatest contribution to the recovery in 2021
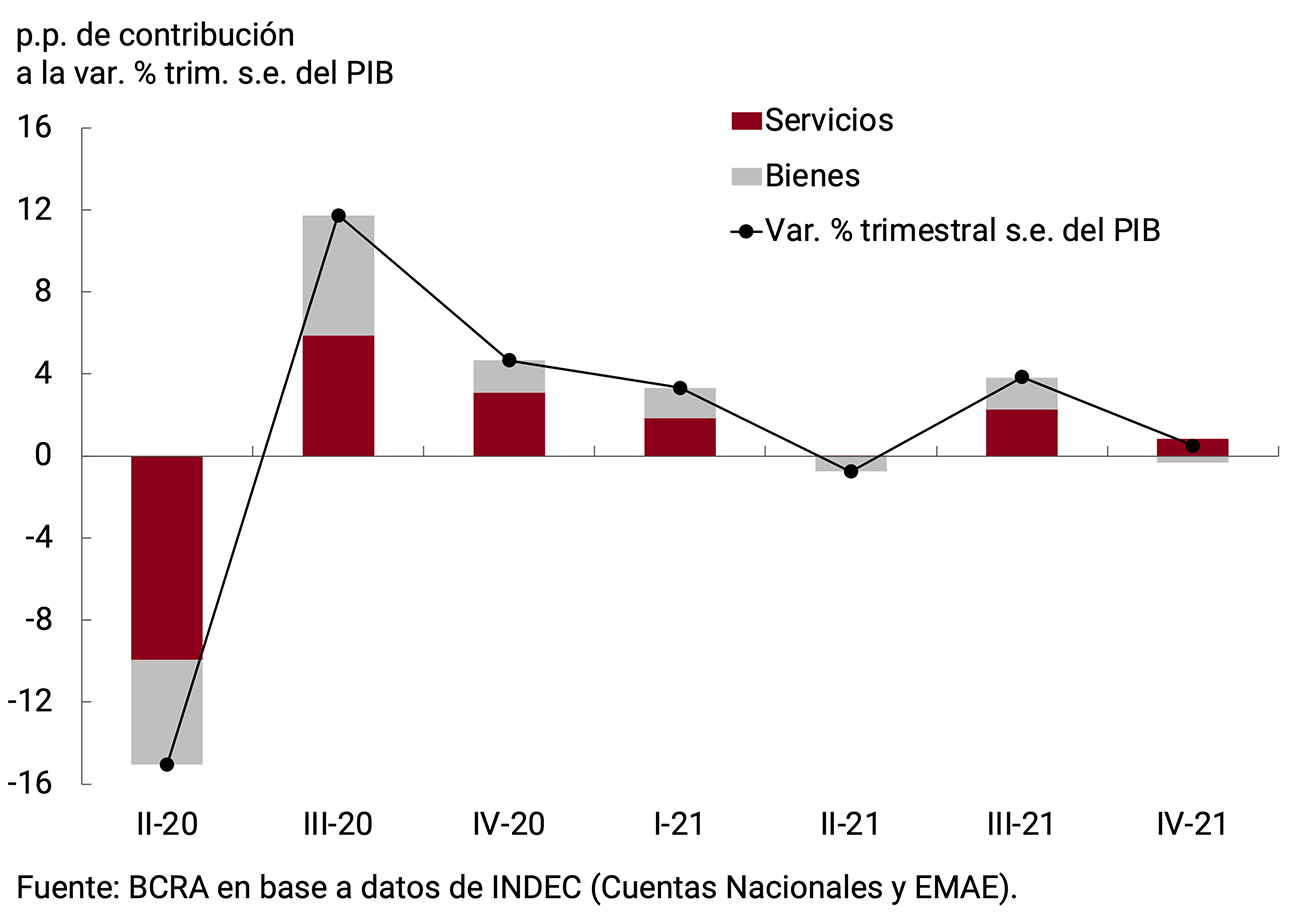
In line with what was anticipated in the previous IPOM, during the third quarter of 2021 services were the ones with the greatest contribution to the quarterly variation of GDP of 4.1% s.e., with which it was possible to recompose the level of economic activity observed before the outbreak of the pandemic in the country (see Figure 3.4). Among the services, those whose activity is closely linked to the increase in social mobility stand out, such as Commerce and Other social and community services, an area in which social, cultural, sports, personal and recreational activities are counted. In the fourth quarter, EMAE data indicate that services once again contributed to the growth of activity, highlighting the recovery of Transport.
Figure 3.4 | Goods and services. Contributions to quarterly change in GDP
The control of the health situation made it possible to implement new flexibilizations and measures to promote tourism in the last quarter of 2021, with the authorizations of group trips for tourism purposes, the opening of borders and foreign tourism without quota and the elimination of capacity for recreational activities and social events, among others. These measures were reflected in the first available indicators of tourist activity10 , anticipating a strong dynamism during the rest of the summer season.
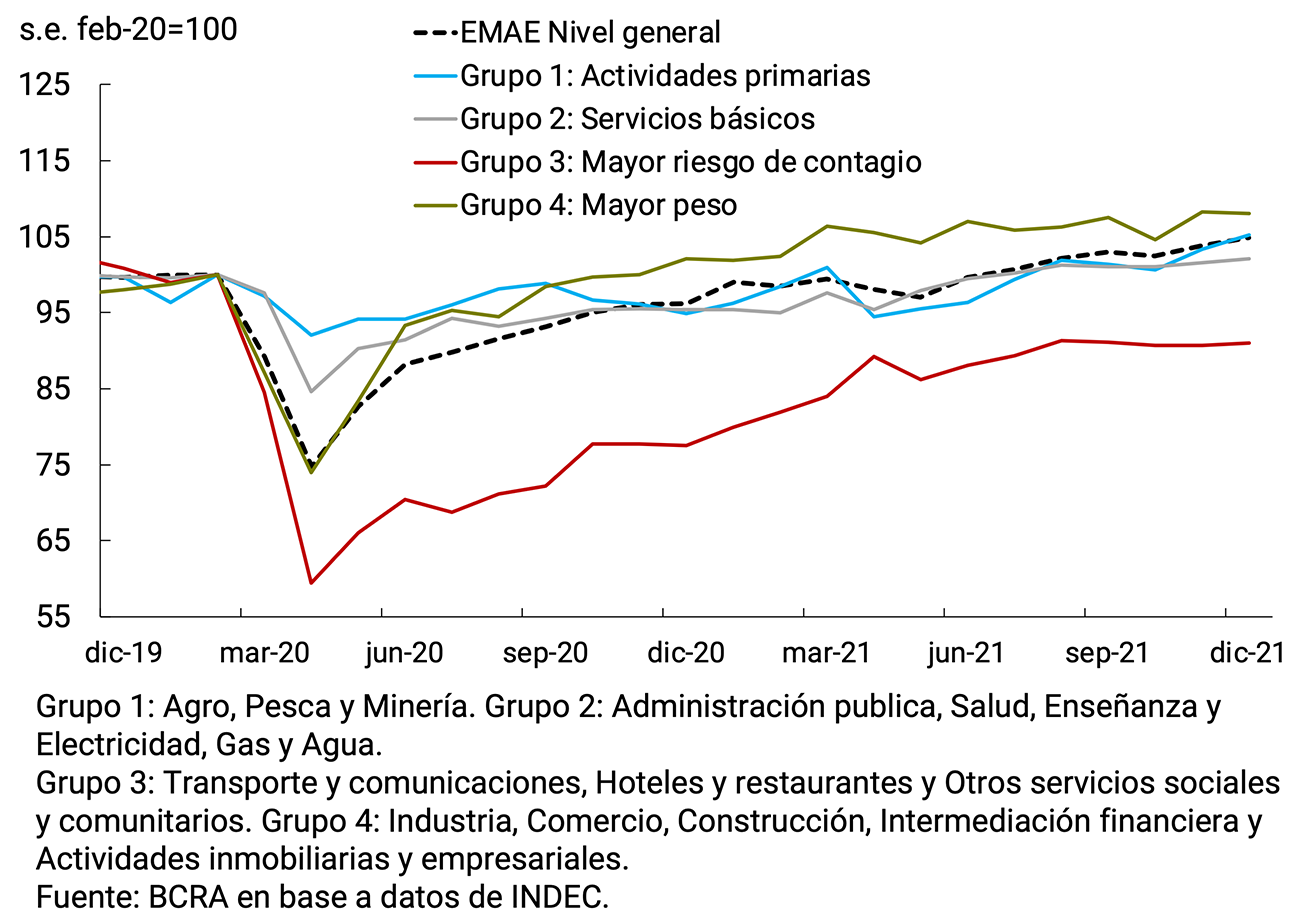
This performance is expected to be reflected in the EMAE for the coming months, mainly in the activity of the group of services with “Most risk of contagion” – made up of Hotels and restaurants, Transport and communications and Other community services – which continued to lag behind the rest of the sectors that make up the EMAE. In December, the value added by this set of services – which account for 13% of GDP – was still 9% s.e. below its pre-pandemic level. Once these most affected sectors manage to fully recover from the COVID-19 crisis, they will have contributed more than 1 percentage point to the variation in Output (see Figure 3.5).
Figure 3.5 | Economic activity by sector groups
In the average of 2021, the EMAE recovered 10.3% compared to a year ago, with a very heterogeneous performance in terms of the dynamism of the productive sectors. Services were the ones with the greatest contribution to the annual recovery of the Product at basic prices (5.6 percentage points), with Trade standing out, which increased by an average of 13% and contributed 2 p.p., and Services most affected by the pandemic – led by Other Community Services – which contributed 1.6 p.p., recovering by 12.9% as a whole. Among the goods-producing sectors, Construction and Industry were the most dynamic, increasing 27.5% YoY and 15.7% YoY in that period, respectively, and jointly contributing 4.2 p.p. to the economic recovery of 2021 (see Figure 3.6)11.
Figure 3.6 | Recovery of sectoral activity in 2021

3.1.3. The labour market, in line with economic activity, regained dynamism at the end of 2021
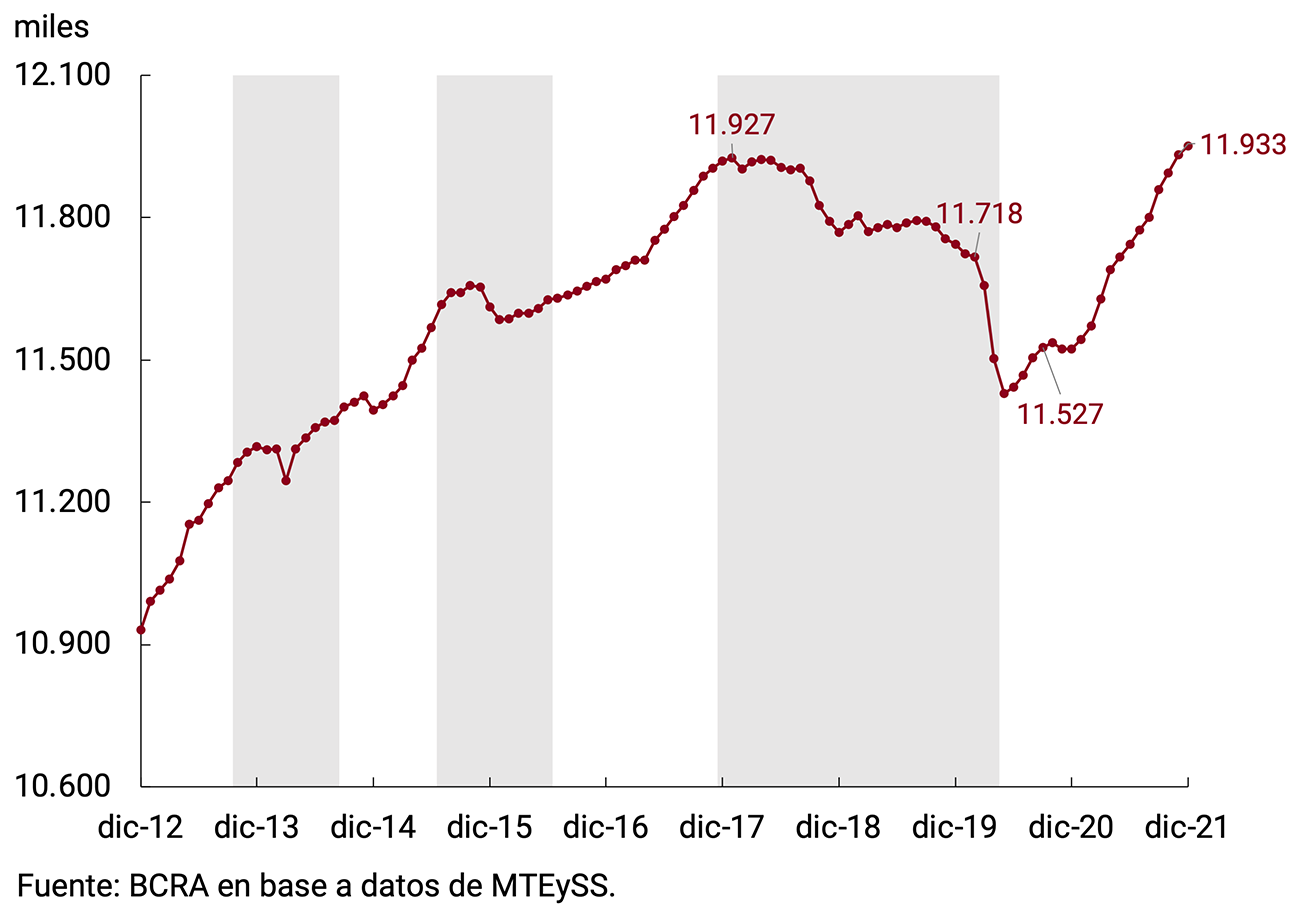
With data as of December 2021, according to the Ministry of Labor, Employment and Social Security (MTEySS), registered employment reached historic high levels of employment in seasonally adjusted terms, surpassing the previous maximum of January 2018 (see Figure 3.7). The pace of expansion during the fourth quarter maintained the dynamics evidenced since the beginning of 2021, growing at 0.3% per month on average.
Figure 3.7 | Total registered employment
Since June 2020, the recovery of total registered employment has been driven by a positive dynamic of self-employment and registered salaried workers in both the private and public sectors. In the months of September to December 2021, an increase in registered self-employment (1.6% s.e.), public employment (1.3% s.e.) and private salaried employment (1.3% s.e.) was observed. It should be noted that the latter category of employment had a pronounced acceleration (+0.3% in the period vs. +0.1% in the previous period), which allowed it to exceed pre-pandemic levels (see Figure 3.8).
Figure 3.8 | Public, private, private and self-employed employment

The behavior of private salaried employment between September and December 2021 allows us to distinguish at the sectoral level a strong dynamism in branches such as Hotels and restaurants (6.7% s.e.), Construction (3.8% s.e.) and Mining (1.8% s.e.). However, taking into account pre-pandemic levels, the Hotels and Restaurants sector, as well as Community, Social and Personal Services and Transport, still have potential for recovery both in terms of activity and hiring (see Figure 3.9). On the other hand, it is observed that in the sectors that experienced the greatest recovery in activity, Trade and Construction, the growth of registered salaried employment has occurred in a lower proportion, moving away from the 45° line.
The Survey of Labor Indicators (EIL) as of January 2022 ratified the positive trend in net hiring expectations that began in February 2021, chaining 12 consecutive months of positive values. On the other hand, suspensions continued to reduce, reaching levels within the historical average and the rate of layoffs remains in a limited range.
Figure 3.9 | Activity and Registered Employment. Percentage changes

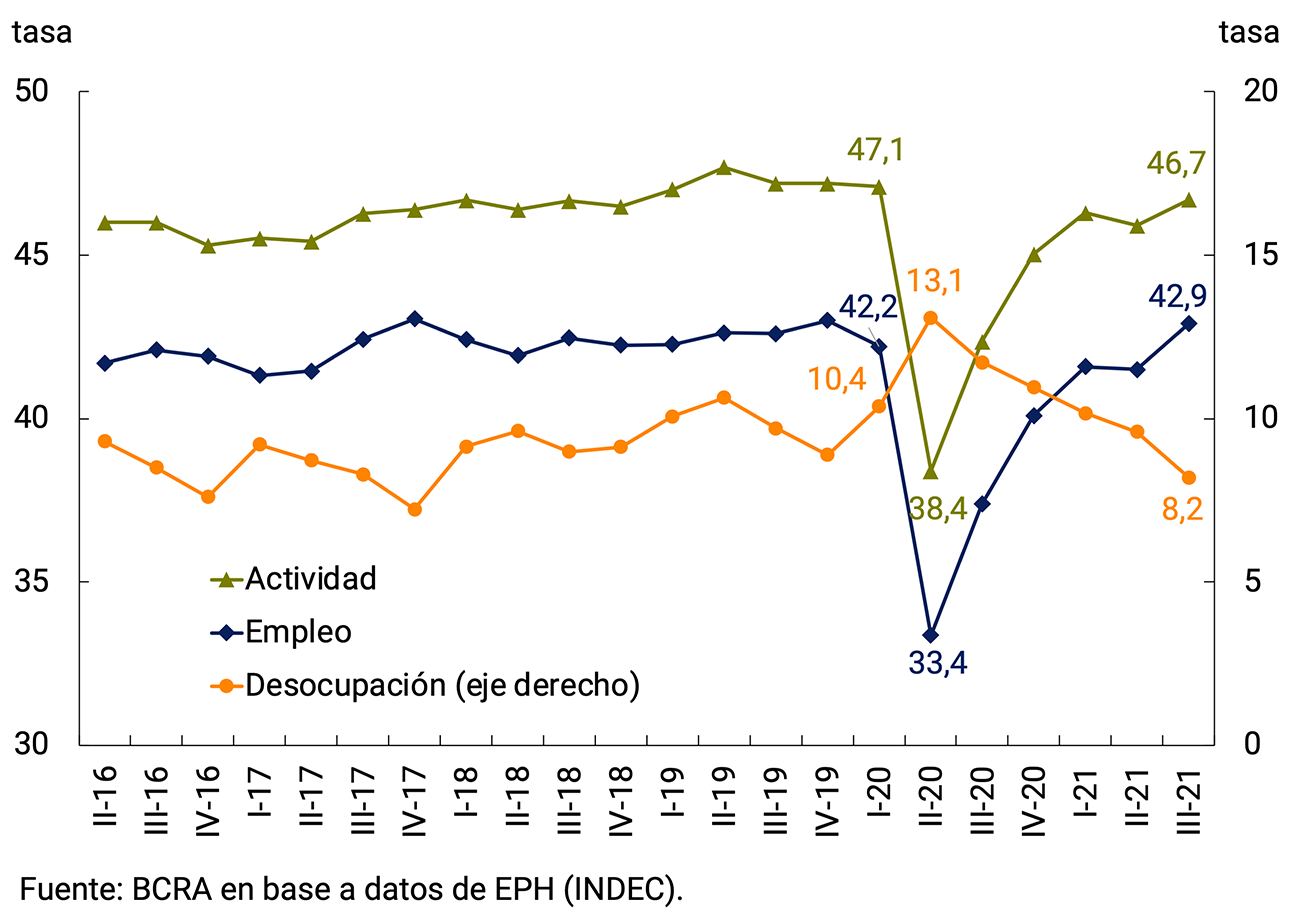
According to data from the Permanent Household Survey (EPH), in the third quarter of 2021 employment resumed its growth, registering a year-on-year increase of 5.5 p.p. in line with the improvement in economic activity. PEA12 also showed an increase compared to the previous quarter and stood at 46.7% (+4.4 p.p. y.o.y.). This effect was probably associated with the normalization of economic activities in the face of the easing of restrictions related to the second wave of the pandemic. Thus, it was job creation that drove this increase in the EAP, generating a drop in the unemployment rate, which stood at 8.2% (-3.5 p.p. y.a.; see Figure 3.10).
Figure 3.10 | Main labour market rates
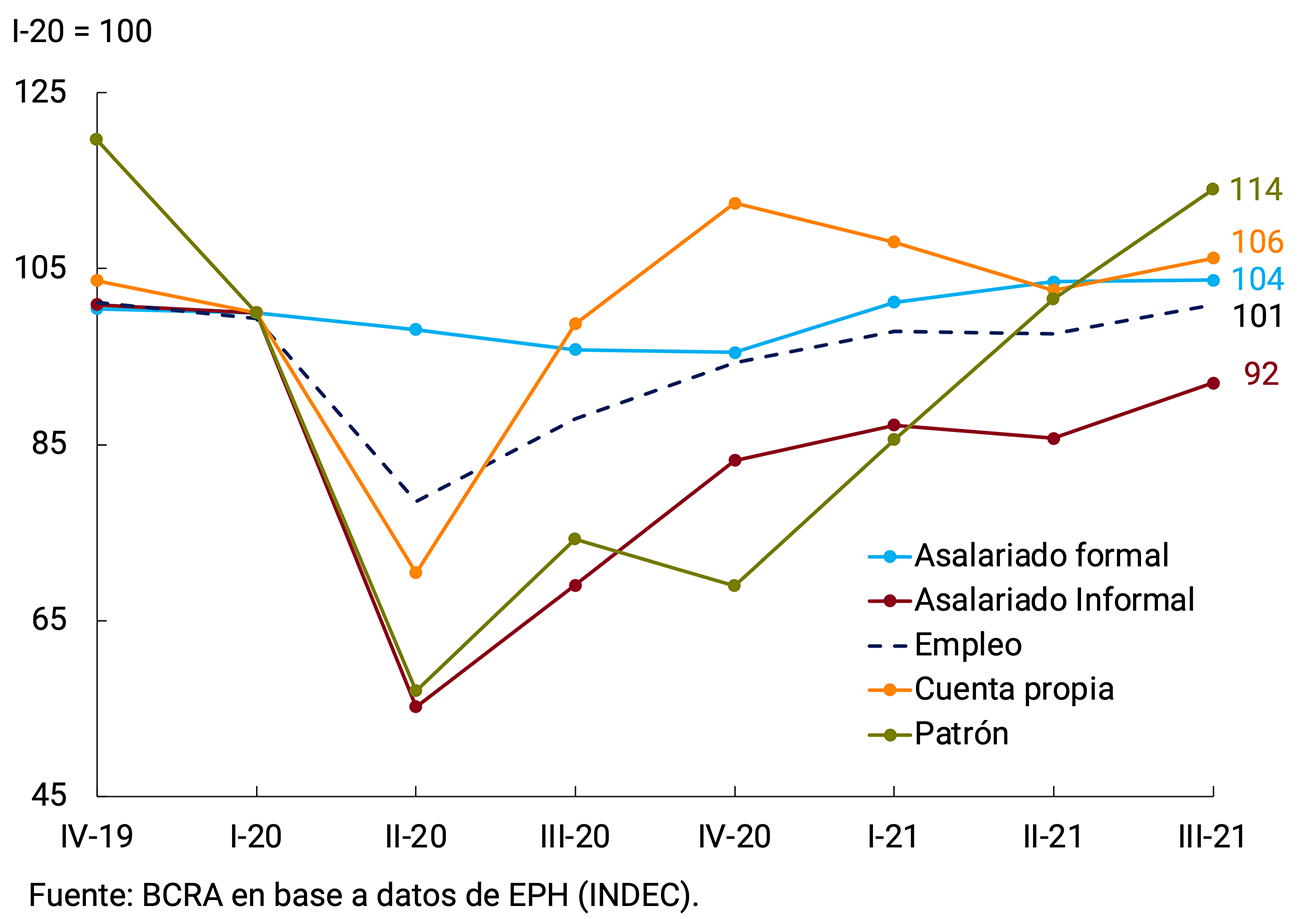
With regard to the evolution of the different occupational categories, it is observed that during the third quarter of 2021 self-employment presented a slight increase compared to the previous quarter and employers maintained sustained growth since IV-20. On the other hand, informal wage earners recovered, although they remain below pre-pandemic levels. Finally, the growth of salaried workers with a retirement discount lost dynamism, but, unlike what the registration data reflects, according to the survey they are above the pre-pandemic level.
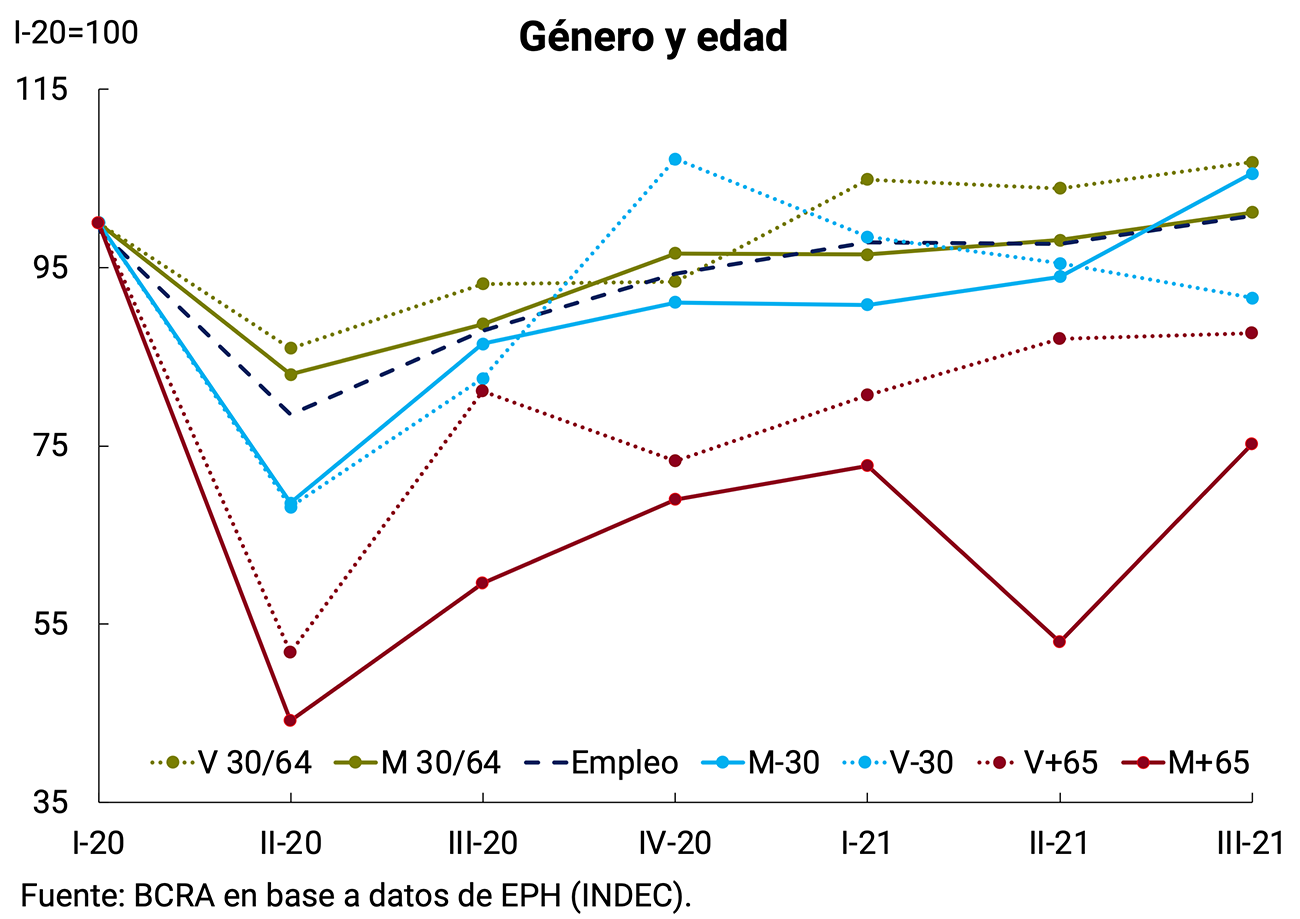
By age range and gender, it is worth highlighting the dynamics of employment among women under 30 years of age (see Figure 3.11 and Section 2 / Asynchronicities in the Labour Market) and women over 65 years of age. Both groups, which for different reasons had a moderate recovery after the initial impact of the pandemic, showed a strong increase in the third quarter of 2021.
Figure 3.11 | Employment rates by category, gender and age
3.2. Perspectives
In a context of progress in the application of vaccine boosters13 together with the progressive immunization of the lowest age ranges and in an environment of strong adaptation of the economy to operate in a pandemic, the BCRA expects that in the coming months activity will continue to strengthen the process of growth and economic recovery. The broad vaccination coverage achieved at the beginning of 2022 with complete schemes of the total population and the population at highest risk with a booster dose made it possible to transit, at the beginning of this year, a significant third wave of COVID-19 associated with the Omicron variant – more transmissible, although less lethal – with limited and transitory effects on the level of activity.
The BCRA expects an additional recovery of the sectors that have not yet managed to operate at pre-pandemic levels, through the extension of the targeted stimulus policies implemented by the National Government14 and the BCRA, and the continuity of the growth process of the rest of the sectors within the framework of policies aimed at the recovery of the domestic market and the productive transformation necessary for sustainable and inclusive growth.
This base scenario is not without risks. Among the main threats to the consolidation of the recovery in activity are the recent deterioration of the international financial context in the face of the sharp escalation of the war between Russia and Ukraine (see Chapter 2. International Context), the tensions in the international energy market and the lack of moisture in the soils in a large part of the productive areas of our country and its potential impact on the yields of the coarse harvest. In addition, there is still uncertainty associated with the circulation of new variants of the Coronavirus that could emerge and compromise the efficacy of the vaccines, truncating the health advances achieved so far.
The outlook for global growth contemplates a slowdown in the coming months, associated with the reduction of monetary stimuli by advanced economies in the face of high and more persistent levels of inflation, in addition to the continuity and deepening of bottlenecks in some supply chains due to geopolitical conflicts. This scenario poses a slowdown in global growth, including for our main trading partners, and higher external financing costs for emerging countries, with international commodity prices at historically high levels.
Argentina’s economic activity closed 2021 with an average recovery of 10.3% per year. The seasonally adjusted data from the EMAE for December left a statistical drag of 4.1 p.p. for this year’s average. The market outlook is below this level: according to the estimates of the Market Expectations Survey (REM) at the end of February 2022, specialized analysts expect a growth of 3.0% for economic activity during this year. The economic growth forecast contemplated in the agreement with the IMF contemplates a growth in economic activity between 3.5 and 4.5% for 2022.
In the medium term, the fulfillment of the goals set out in the agreement with the IMF, consistent with the ongoing economic growth process, together with a gradual but permanent reduction in inflation and an increase in exports and international reserves, will strengthen macroeconomic stability and improve the perception of risk of public debt and the economic expectations of domestic and external agents. This will contribute to the gradual recovery of access to external financing for both the public and private sectors.
4. External Sector
In the fourth quarter of 2021, the trade surplus of goods was reduced, both due to an increase in imported volumes (mainly fuels, capital goods and their parts) and a widespread fall in the quantities exported. In this context, the seasonally adjusted current account is expected to have shown a slight transitory deficit. In 2021, the annual trade surplus was around 1.2% of GDP.
In the foreign exchange market, the evolution of exports and imports of goods, added to the dynamics of commercial debt for exports and imports of goods, resulted in a net result in the exchange market for goods of US$2,318 million in the last quarter of 2021, remaining practically stable compared to the previous quarter. Additionally, net outflows were recorded through the foreign exchange market for services, interest and other financial transactions for US$4,028 million, while entities made sales for US$426 million. For its part, the BCRA made sales through the Local Currency System (SML) for US$227 million and directly in the foreign exchange market for US$1,057 million.
These net sales by the BCRA, together with the net outflows of financial debt from the general government and the BCRA for about US$900 million, brought the level of international reserves to US$39,663 million at the end of the year, slightly above its value at the end of 2020.
In the first month of 2022, customers made purchases in the foreign exchange market for US$289 million, while the BCRA and the entities sold US$161 and US$77 million, respectively.
For the year 2022, the economy is expected to register a trade surplus in goods for the fourth consecutive year, in a context of stability of the real exchange rate within the framework of a managed floating exchange rate policy. Total agricultural production, the economic activity of our trading partners and the evolution of the international price of fuels (in particular liquefied petroleum gas) will define the slack of the trade surplus, while the agreement reached with the IMF for the rescheduling of the maturities inherited from the Stand-by agreement signed in 2018 will have a positive impact on the dynamics of financial flows. The BCRA will prudently manage foreign exchange regulations in order to adapt them to the needs of the situation, favoring monetary and exchange rate stability.
4.1. In the fourth quarter of 2021, the economy would have operated with a transitory current account deficit
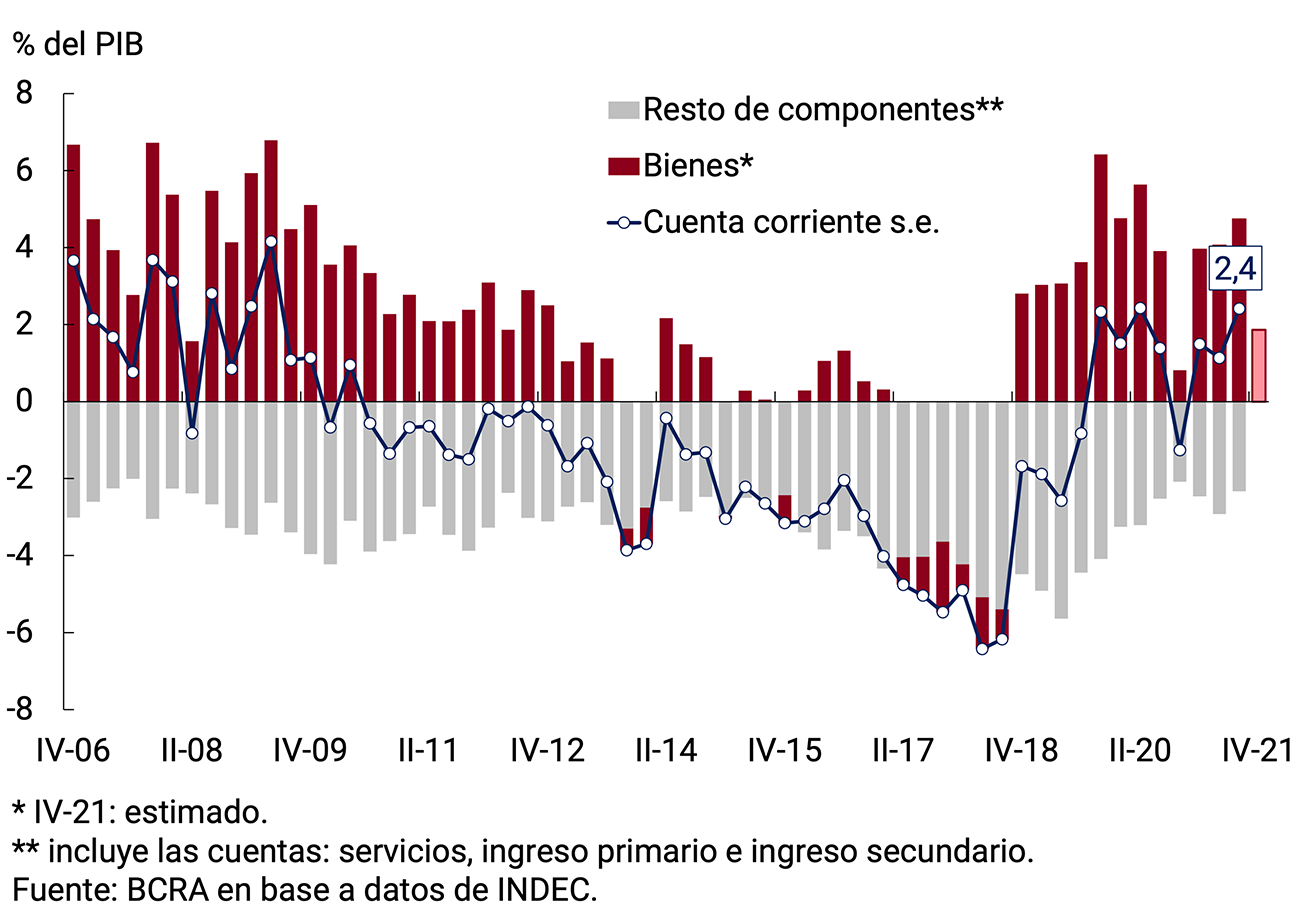
In the third quarter of 2021 (latest official data available) the Argentine economy recorded a current account surplus of US$3,287 million – equivalent to 2.4% of GDP in seasonally adjusted and annualized terms. The sharp increase in exported volumes of goods was the main factor behind this result.
In the fourth quarter of 2021, the trade surplus for goods was reduced, both due to an increase in imported volumes and a fall in exported quantities. In this context, the seasonally adjusted current account is expected to exhibit a slight transitory deficit (see Figure 4.1).
Figure 4.1 | Seasonally adjusted current account. Annualized values
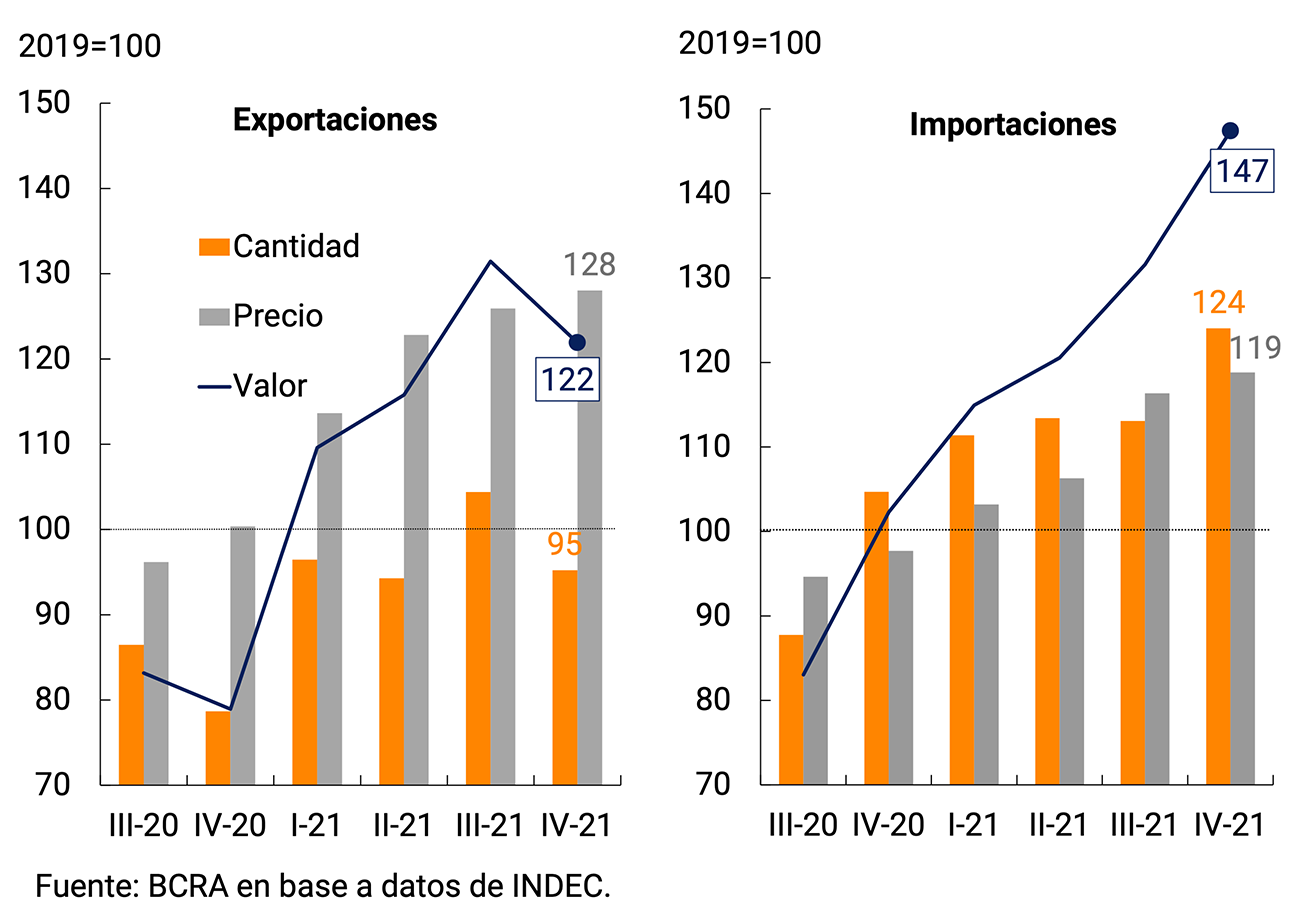
In that period, the exported values of seasonally adjusted goods reached US$19,846 million (Free on Board —FOB—) at current prices, which represented a drop of 7.2% compared to the high level recorded in the third quarter of 2021. This evolution was mainly due to the performance of the quantities exported, which decreased 9% quarter-on-quarter s.e. and fell back to the levels of the first half of 2021. Export prices grew for the sixth consecutive quarter and partially mitigated the effect of quantities.
On the other hand, between October and December 2021, seasonally adjusted imports of goods totaled US$18,108 million (CIF) at current prices, almost 50% above the 2019 average, close to the levels of the first quarter of 2018. This performance of imported values was explained to a greater extent by the rise in volumes, which grew 10% quarter. s.e. (see Figure 4.2).
Figure 4.2 | Trade in goods. Seasonally adjusted series
The four main export items had falls in exported volumes in the last quarter of 2021. In the case of Primary Products (PP, -9% qq. s.e.), although the decrease was widespread, the lower shipments of oilseeds and fishery products stood out for their incidence. The fall in Manufactures of Agricultural Origin (MOA, -5% qq. s,e,) was concentrated in three of its main categories: meat, fats and oils and residues from the food industry21. The exported quantities of Manufactures of Agricultural Origin (MOI) also decreased, although with mixed behaviors within the category. Shipments of land transport material continued with the upward trend they have exhibited since the third quarter of 2020 and reached levels not recorded since the end of 2018, mainly due to vehicle exports to Brazil. The performance of foreign sales of precious metals22 also contributed positively, gradually approaching pre-pandemic levels. On the contrary, decreases were recorded in the other two categories with the highest incidence of the item, chemical products and base metals. Finally, the exported volumes of Fuels and Energy (S) fell 34% s.e. compared to the third quarter of 2021, mainly due to the high base of comparison left by electricity shipments to Brazil in that period (see Figure 4.3).
Figure 4.3 | Quantities exported. Seasonally
adjusted series Mobile Avg. 3 months

Source: BCRA based on INDEC data.
In the case of imported quantities of goods at the functional category level, increases predominated in the fourth quarter (12 increases and 7 falls). Notable for their impact were the increases in the imported volumes of processed fuels (+69% QoQ), final capital goods (+11% QoQ), parts and accessories for capital goods (+14% QoQ) and parts and accessories for transport equipment (+11% QoQ). Together, these four categories accounted for more than 90% of the increase in the overall level.
In January 2022, the seasonally adjusted trade surplus rose compared to December due to the fact that imported values fell at a higher rate than exports (-13% monthly and -1% monthly respectively). Declines were associated with widespread falls in traded volumes, with a sharp decrease in MOAs in exports and, in the case of imports, a decline in fuels (which had shown great dynamism in the last quarter of 2021).
Box. Rising freight transportation cost and import prices
In the November 2021 IPOM, it had been commented that the rise in global manufacturing prices measured in dollars was behind the sharp increase in Argentina’s import prices since the beginning of 2021. Another factor that influenced this performance was the increase in the cost of cargo transport worldwide.
In the statement of Argentine Commercial Exchange prepared monthly by INDEC, data on imports of goods are reported at CIF (cost, freight and insurance) valuation. This means that the unit price reported for each imported good includes not only the “factory departure” price at origin, the costs of hauling, handling and shipping to the port of departure, but also the cost of international freight and insurance to the final destination port in Argentina. For this reason, the import price index (which represents the rolling basket of imported goods) is necessarily affected by the evolution of the cost of international freight.
From the second half of 2020, with the recovery of world trade, but, above all, during 2021, the logistics of international trade in goods at a global level was crossed by the existence of bottlenecks that notoriously limited cargo capacity. This transitory inability of the supply of logistics services to meet demand was reflected in a sharp increase in the cost of international freight, which more than quintupled in nominal terms in July 2021 compared to July 2020, as measured by the global benchmark index for containerized transport. the Freightos Baltic Index (FBX). This situation was reflected in Argentina’s foreign trade statistics as a widening gap between imports valued in CIF terms and those valued in terms (FOB23), which reached 7.8% in December 2021, when for almost the entire previous decade it was around 4.5%. According to a recent study prepared and published by INDEC24 , the incidence of freight costs on the import price index was increasing throughout 2021 and so far in 2022. In January 2022, more than half of the year-on-year increase in import prices in dollar terms was due exclusively to the direct impact of freight transport costs25 (see Figure 4.4).
Figure 4.4 | Freight Transportation Cost and Import Prices

4.2. In 2021, the BCRA recorded the largest net purchases of foreign currency in the foreign exchange market since 2014
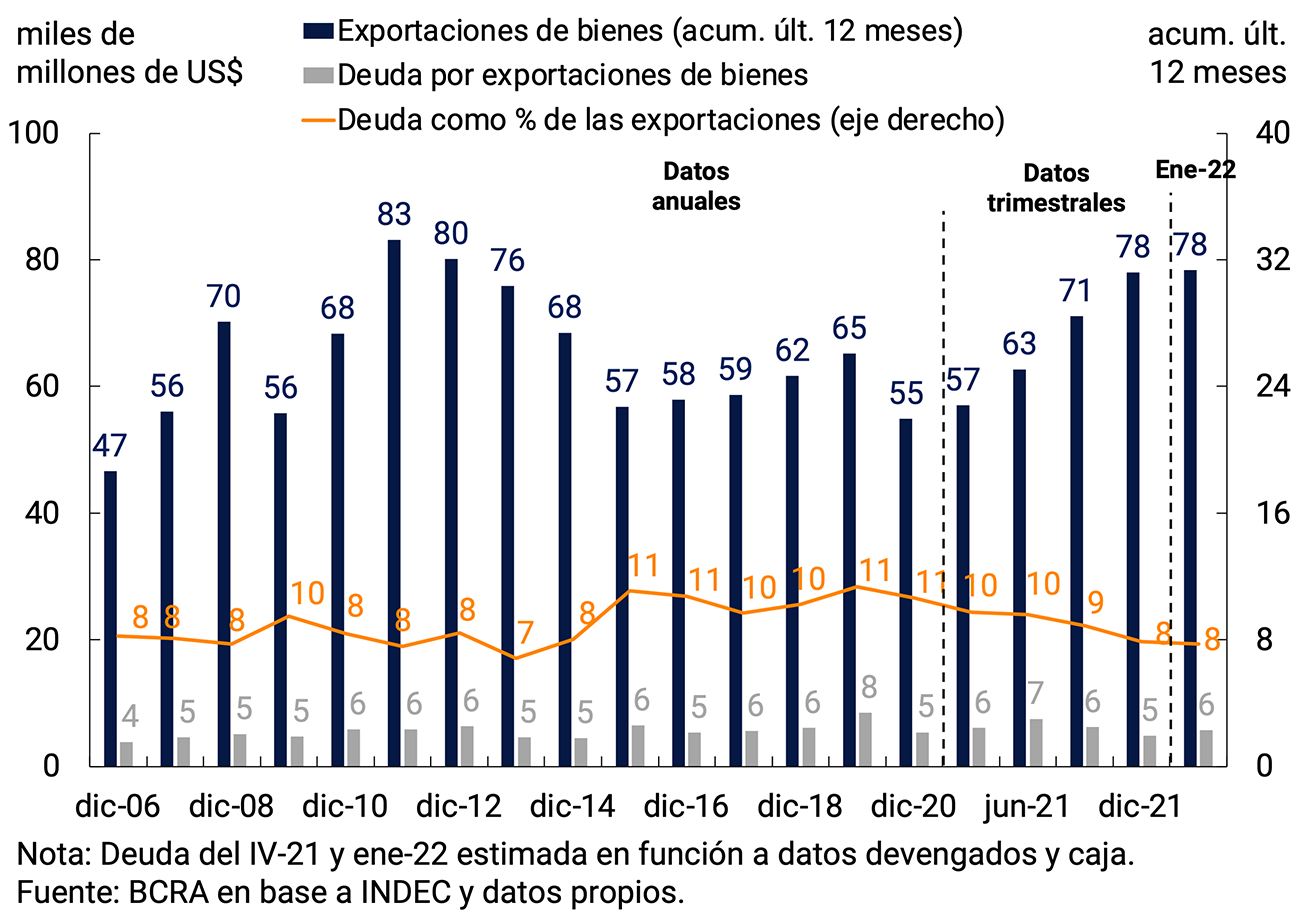
During the fourth quarter of 2021, exporters recorded receipts from exports of goods of about US$18,292 million. Given that exports of goods stood at about US$19,641 million, it is estimated that the external debt will be reduced by advances and pre-financing of about US$1,350 million. In this way, the ratio of this type of indebtedness with respect to the values exported is reduced to 8%. In January 2022, the same trend of this ratio continued to be verified, with an estimated debt of advances and pre-financing of about US$5,685 million. This level of the ratio represents the lowest level verified since December 2013 (see Figure 4.5).
Figure 4.5 | Assets. Exports and external debt for exports
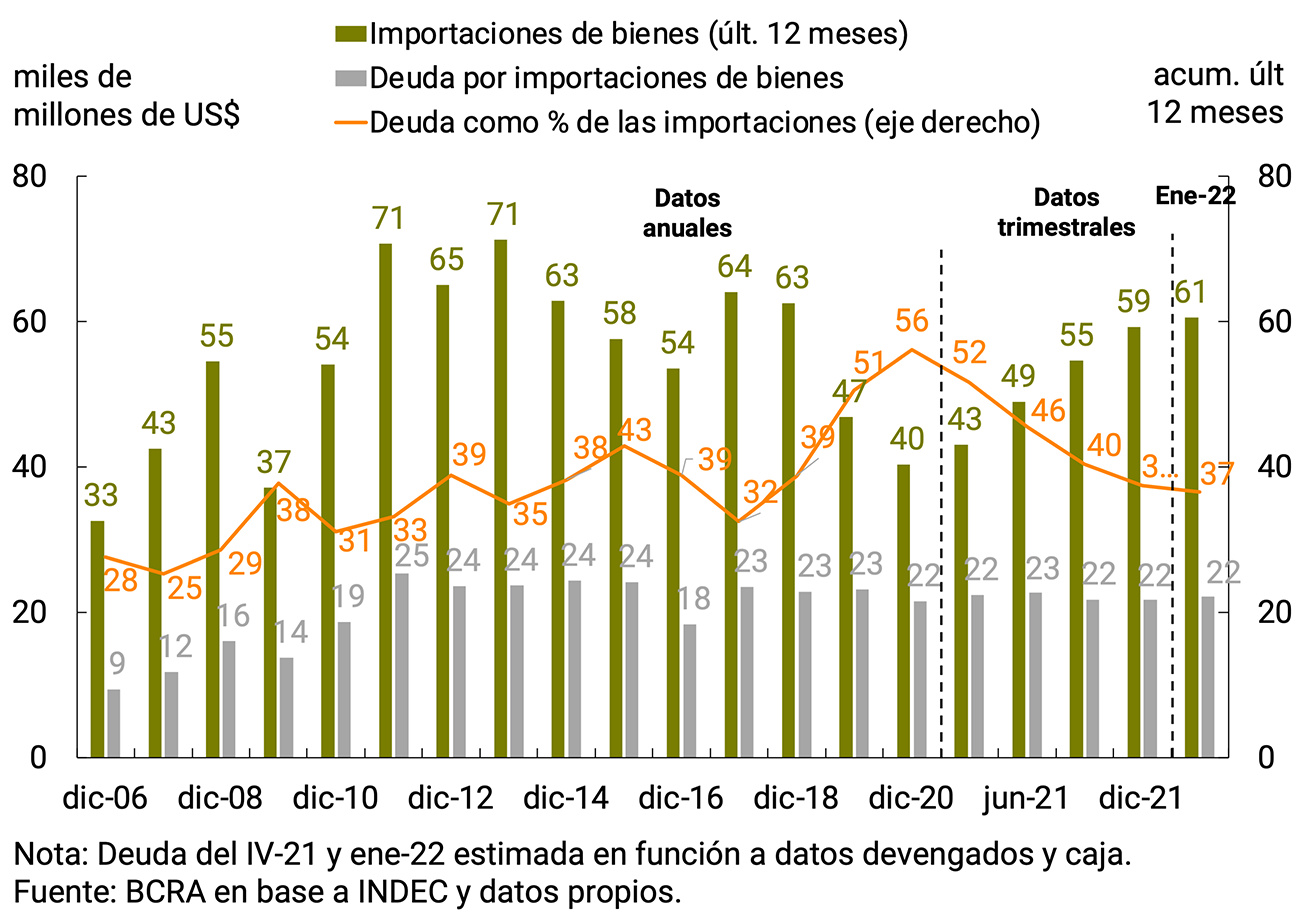
During 2020, the BCRA established a series of regulations that aim to promote the allocation of foreign currency more efficiently, with an impact on both the evolution of private commercial and financial debt. These rules were maintained throughout 2021 and remain in force for the year 202226. In this context, during the fourth quarter of 2021, payments for imports of goods through the foreign exchange market reached US$16,000 million, a value similar to that of FOB imports for the period, which would imply that the stock of foreign debt for this concept was maintained during the quarter, a trend that is estimated to continue in January 2022. In addition, due to the increase in shipments to the market in recent months, the relationship between external debt and the level of imports registered a new fall, which would imply almost 20 p.p. compared to the end of 2020 (see Chart 4.6).
Figure 4.6 | Assets. Imports and external debt for imports
Finally, with regard to financial debt, and as part of the current regulatory framework mentioned above, in September 2020, through Communication “A” 7106, the guidelines were established under which private sector companies could initiate a process of refinancing their respective external liabilities, which would allow their maturity profile to be adapted to the guidelines required for the normal functioning of the foreign exchange market. This communication, which reached certain capital maturities between 15-Jan-20 and 31-Mar-21, was extended by Communication “A” 7230, covering maturities from then until the end of 2021. Likewise, Communication “A” 7422 extended the term of the maturities until 30.06.22 and Communication “A”7466 did so until 31.12.22.
In this context, the renegotiations recorded during the fourth quarter of 2021 and January 2022 had an impact on lower net purchases in the foreign exchange market of about US$390 million compared to the original maturities for the same period, accumulating since December 2020 lower net payments of about US$2,160 million.
The aforementioned recovery of exports, added to the evolution of the commercial debt for exports and imports of goods, resulted in a net result for goods in the foreign exchange market of US$15,282 million in the year, about US$3,300 million lower than the result of the FOB trade balance for the same period, and exhibiting a strong improvement compared to the previous year (80% y.o.y.).
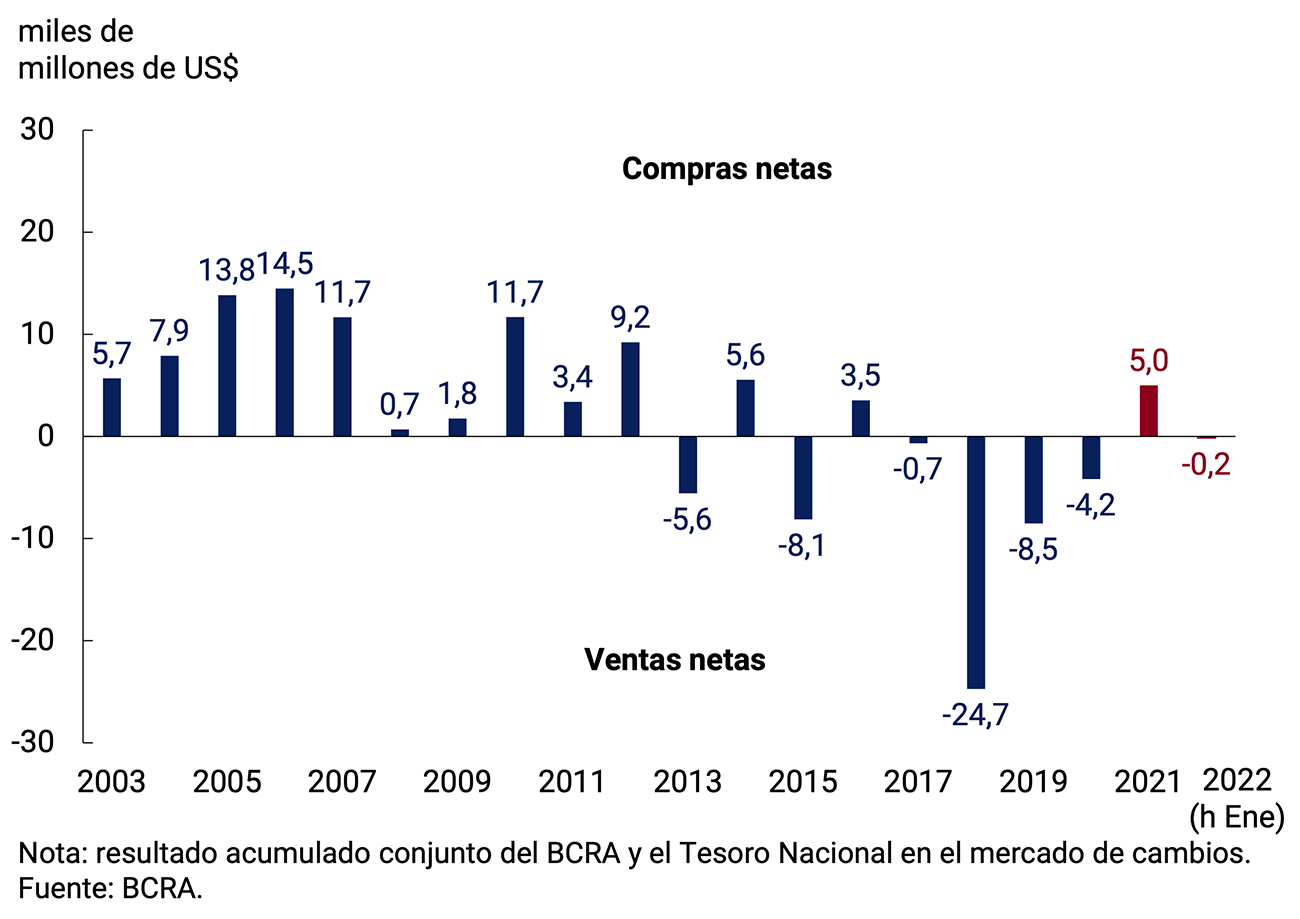
This result allowed the BCRA to accumulate net purchases in the foreign exchange market for US$5,000 million in the year, a record since 2014 (see Figure 4.7), while international reserves increased by US$275 million in the same period. This difference was mainly explained by the net cancellations of principal and interest on foreign currency debt of the National Government with a direct impact on international reserves of about US$5,500 million -of which around US$5,000 million corresponded to principal and interest payments to the International Monetary Fund-, due to the increase in payments for operations carried out through the Local Currency Systems with Brazil. Uruguay and Paraguay and ALADI for about US$800 million and for the increase in the balances held by the entities in BCRA current accounts for US$1,200 million and in the prices of the assets that make up the international reserves in relation to the currency of account (US dollar), which resulted in an increase in them by about US$400 million.
Figure 4.7 | Exchange market. Result
For its part, in January the BCRA made net sales in the foreign exchange market for US$161 million, in addition to the net payments through SML and ALADI for US$73 million. International Reserves decreased by US$2,074 million, mainly due to net payments of principal and interest on debt in foreign currency of the National Government for about US$1,600 million.
4.3. Perspectives
For the year 2022, the economy is expected to register a trade surplus in goods for the fourth consecutive year, in a context of stability of the real exchange rate within the framework of a managed floating exchange rate policy.
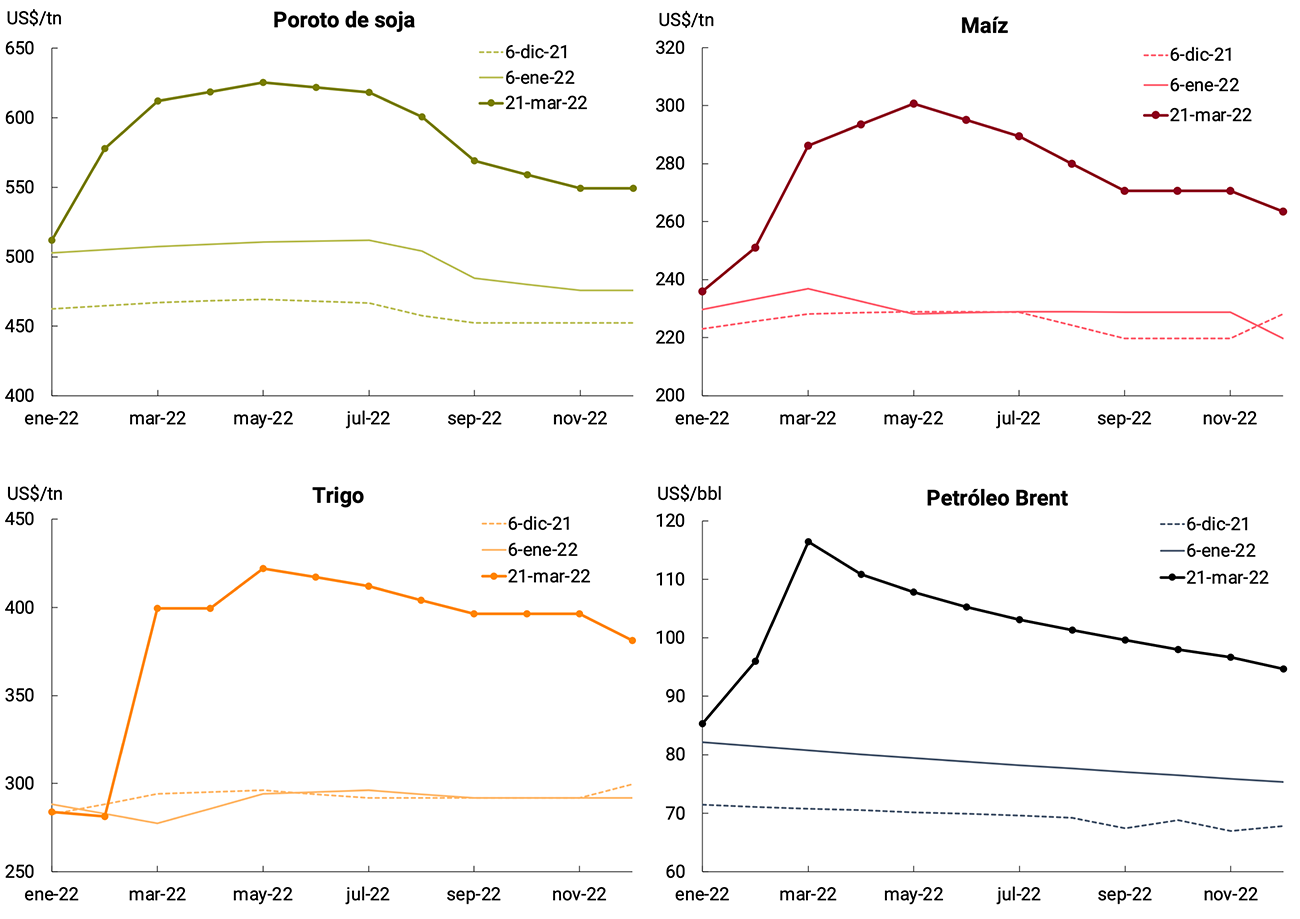
The slack in the trade balance will depend to a large extent on four factors about which there is a high level of uncertainty. First, the production of grains from the coarse harvest (soybeans and corn) on which there are forecasts of cuts compared to what was expected at the end of 2021, as a result of low rainfall in the main producing areas (see Chapter 3. Economic Activity and Employment). Second, the evolution of the economic activity of our trading partners, in particular Brazil, whose growth prospects have deteriorated since the publication of the Nov-21 IPOM and may be affected by the effects of the conflict between Russia and Ukraine (see Chapter 2. International Context). These two downside risks to exports could be offset by the recent rise in international prices of Argentina’s export commodities (see Figure 4.8). Finally, on the side of imports of goods, the main source of uncertainty is currently the import price of the fuels that the country will have to acquire during the winter, mainly liquefied natural gas, which, in the context of the conflict between Russia and Ukraine, has risen significantly in recent months.
Figure 4.8 | Futures curves
On the financial account side, the determining factor for 2022 and the years that follow will be the rescheduling of the contractual capital maturities assumed under the Stand-by Agreement signed in 2018. The agreement reached with the IMF will strengthen the external position of the Argentine economy, by providing for a significant accumulation of international reserves, which will contribute to the nominal stability of the economy. An improvement in the risk perception of external debt is expected, helping Argentina to gradually regain access to financing in international financial markets under more favorable conditions (lower interest rates and longer maturities), both for the public and private sectors.
The BCRA will prudently manage foreign exchange regulations in order to adapt them to the needs of the situation, favoring monetary and exchange rate stability. To the extent that macroeconomic conditions allow, regulations will be relaxed, with the aim of maintaining in the medium and long term a set of macroprudential regulations compatible with the dynamization of capital flows oriented to the real economy.
5. Public Finance
National public finances continued to strengthen in the fourth quarter of 2021 mainly on the basis of the improvement in government revenues. National tax collection increased by 66% during 2021 compared to the previous year, which meant a real growth of 11.9%. This increase was explained both by the consolidation of the economic recovery and by the low base of comparison due to the impact of the pandemic during 2020. In addition, the greater flow of foreign trade contributed positively to collection through withholdings and tariffs. In real terms, seasonally adjusted revenue grew 3% in the fourth quarter of 2021 and was 15.7% above the pre-pandemic level (first quarter of 2020).
During 2021, the level of real primary expenditure was maintained. In particular, capital expenditure aimed at strengthening the recovery of economic activity was boosted. In the opposite direction, there was a more limited trajectory of extraordinary expenditures associated with the evolution of the pandemic. However, excluding extraordinary expenditures in 2020 and 2021 aimed at mitigating the effects of the pandemic and accompanying the most affected sectors, real primary expenditure expanded by 15% YoY in the fourth quarter of 2021.
In 2021, primary expenditures grew below the increase in revenues, contributing to reducing the fiscal deficit. The primary deficit on a cash basis of the National Non-Financial Public Sector (NFPS) accumulated a balance equivalent to approximately 2.1% of GDP (which rises to 3% of GDP if it is not included among the transfer revenues from the extraordinary allocation of Special Drawing Rights (SDRs) that the International Monetary Fund (IMF) distributed among member countries to deal with the impact of the COVID-19 crisis). This level of deficit was significantly lower than that observed during 2020 (6.4% of GDP).
The agreement between the National Government and the IMF (See Section 4 / The Extended Facilities Agreement with the IMF) contemplates a path to reduce the primary deficit in terms of GDP for the coming years: in 2022 it would stand at 2.5%, and then be reduced to 1.9% in 2023 and 0.9% in 2024. Likewise, less monetary financing of the needs of the National Treasury (NT) is expected, with a cap of 1% of GDP in 2022, 0.6% in 2023 and zero in 2024. These paths are consistent with the guidelines that had been proposed in mid-September 2021 with the 2022 National Budget Bill (despite the fact that it did not have the approval of the National Congress, having to resort to what the legislation establishes in this case: an extension of the 2021 Budget for 2022, with certain adaptations). This project highlighted a reduction of a similar magnitude in the Product of the primary deficit of the NFPS for 2022 and a lower monetary financing of the needs of the National Treasury (TN).
Finally, although significant progress has been made, challenges remain to deepen the development of the local public debt market.
5.1. Tax revenues strengthened public accounts by growing above inflation during 2021
National tax collection increased 64% YoY in the third quarter of 2021 (see Figure 5.1). This increase is explained by the consolidation of the economic recovery and the low base of comparison due to the impact of the pandemic during the third quarter of 2020. In addition, the higher values of international trade flows that are taxed continued to contribute positively. In real terms, tax collection expanded 8% YoY between July and September. In October, the nominal increase was 58.7% YoY (+4.7% YoY in real terms).
During 2021, national tax collection represented 23.7% of GDP, which was 0.4 percentage points (p.p.) less than in 2020 (see Figure 5.1). Among the taxes that explained this drop are social security resources (-0.4 p.p.), the PAIS tax (for lower taxed transactions; -0.3 p.p. of the Product), the Income Tax (-0.2 p.p.) and the tax on personal assets (-0.2 p.p.). On the other hand, there was a significant increase in duties on foreign trade.
Figure 5.1 | National tax collection
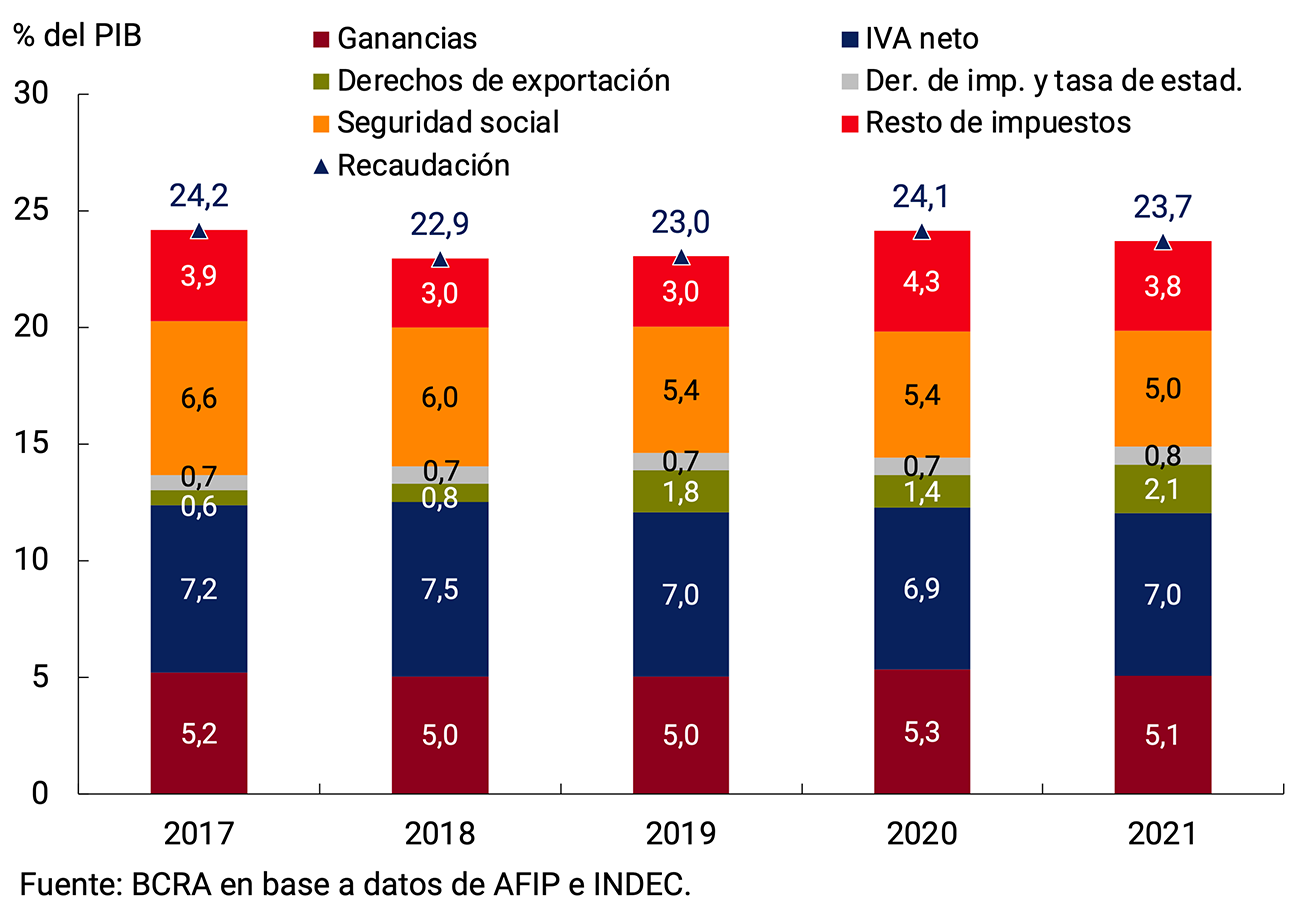
In fact, export duties grew 148.5% yoy in 2021. The rise responded both to the favorable international context for the international prices of the main export products and to the recovery of external demand. In this way, export duties came to represent 2.1% of GDP in 2021 (+0.7 p.p. compared to 2020). Import Duties and Statistical Tax also showed a strong increase during the period, although a little more moderate: +85.4%. This behavior was explained by higher imported values (see Chapter 4. External Sector). Thus, revenues from tariffs and import taxes accumulated an amount equivalent to approximately 0.8% of GDP (+0.1 p.p. vs. 2020).
Taxes related to the domestic market (Value Added Tax (VAT), Profits, Fuels, among others) performed well throughout 2021 due to the recovery of economic activity. Net VAT remained highly dynamic throughout last year, growing by 70.2%, mainly due to the recovery in economic activity and household consumption. Net VAT accounted for 7% of GDP (+0.1 p.p. vs. 2020), remaining at a figure similar to that prior to the pandemic.
Income Tax rose 59.9% YoY in 2021. The performance of this tax was impacted by various factors throughout the year. The regulatory change of September 2020 associated with the withholding on purchases of dollars and expenses in foreign currency through credit cards had an upward effect. On the other hand, it was impacted by the increase in personal deductions on the income of workers in a relationship of dependency29. Towards the end of the year, the modification that incorporates new rates in a staggered manner for companies, setting the maximum rate at 35% and maintaining the tax on dividends at 7%30, had an upward impact. Thus, income tax contributed 5.1% of GDP in 2021 (-0.2 p.p. vs. 2020).
Social security resources increased by 55.1% in 2021. They were negatively impacted by the measures taken by the National Government, with reductions in employer contributions in the health sector, to the critical sectors contemplated in the REPRO program and to companies located in the provinces of the Norte Grande. However, in the last quarter of 2021 they showed a better performance: they grew 67.5% YoY vs. 63.2% YoY in the third. Thus, social security represented 5% of GDP during 2021, which implied a decrease of 0.4 p.p. compared to the previous year. Going forward, it is expected that the collection linked to social security will recover its share in line with the forecast of an increase in formal employment and real wages.
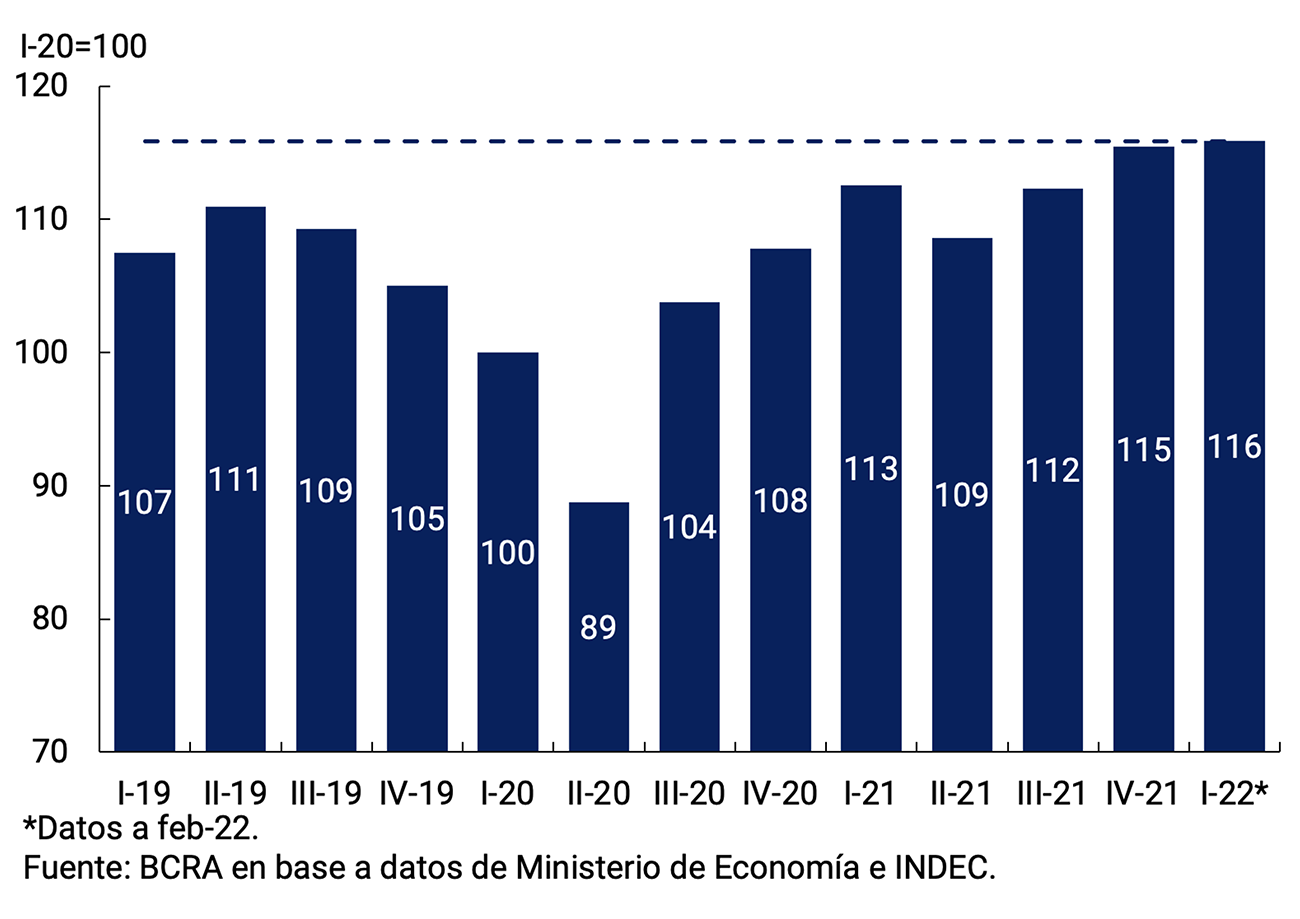
In real terms, seasonally adjusted national tax collection grew 3% in the fourth quarter of 2021 and was 15.4% above the pre-pandemic level (see Figure 5.2). This performance reflects the consolidation of the recovery in tax revenues after the harmful effects of the COVID-19 pandemic. With partial data as of February 2022, real revenue would have grown 0.4% s.e. in the first quarter of the current year. Thus, real seasonally adjusted revenue would still be 16.1% above the pre-pandemic level (I-20).
Figure 5.2 | Seasonally adjusted real national
tax collection
The evolution of tax revenues allowed total revenues of the National Non-Financial Public Sector (NFPS) to increase in nominal terms by 83.4% in 2021 (+23% in real terms). The annual comparison was impacted by the calculation in current transfers of the extraordinary allocation of Special Drawing Rights (SDRs) that the IMF made in the context of the global crisis due to the COVID-19 pandemic. Net of this effect, funds would have shown a nominal increase of 74.6% in the year. Non-tax revenues were also affected upwards during 2021 by the imputation of resources associated with Law 27605 on Solidarity and Extraordinary Contribution to Help Mitigate the Impact of the pandemic (between May and December 2021, $243,463 million were recorded for this concept; approximately 0.5% of GDP). Property rents advanced 118% in the year due to the collection of interest on loans granted by the National Social Security Administration (ANSeS) – which had been suspended for most of 2020. On the other hand, capital resources decreased throughout 2021 affected by the provisions of Law 27574 on the Defense of the Assets of the Sustainability Guarantee Fund (FGS), which stipulates the suspension of financing to the ANSES by the FGS to meet the disbursements of the Historical Reparation program.
Meanwhile, the tax collection of the provinces as a whole exhibited a behavior consistent with what was observed at the national level. According to the partial information available for the main districts, in the fourth quarter of the year the nominal advance of own tax resources would have shown an increase of close to 66% y.a., still impacted by the low base of comparison of the same quarter of 2020.
5.2. NFPS primary expenditure ended the year at values similar – in real terms – to the level shown during 2020
NFPS primary expenditure exhibited a nominal increase of 49.6% YoY in 2021, below the nominal increase in revenues. During 2021, real primary expenditures remained practically constant compared to 2020 (see Figure 5.3). It should be borne in mind that during the last two years the public accounts were affected by expenses associated with the effects of the pandemic, the greatest deployment of which was concentrated in the second and fourth quarters of 2020.
Figure 5.3 | NFPS primary income and expenditure

Indeed, excluding in 2020 and 2021 the extraordinary expenditures aimed at mitigating the effects of the pandemic and accompanying the most affected sectors, since March 2020, primary expenditure would have expanded at a nominal rate approximately 15 p.p. higher than that of primary expenditure without deductions for COVID-19 expenditure. This implies that net of the effect of the greater comparison base of 2020, due to COVID-19 spending, primary expenditures would have exhibited growth in real terms in 2021.
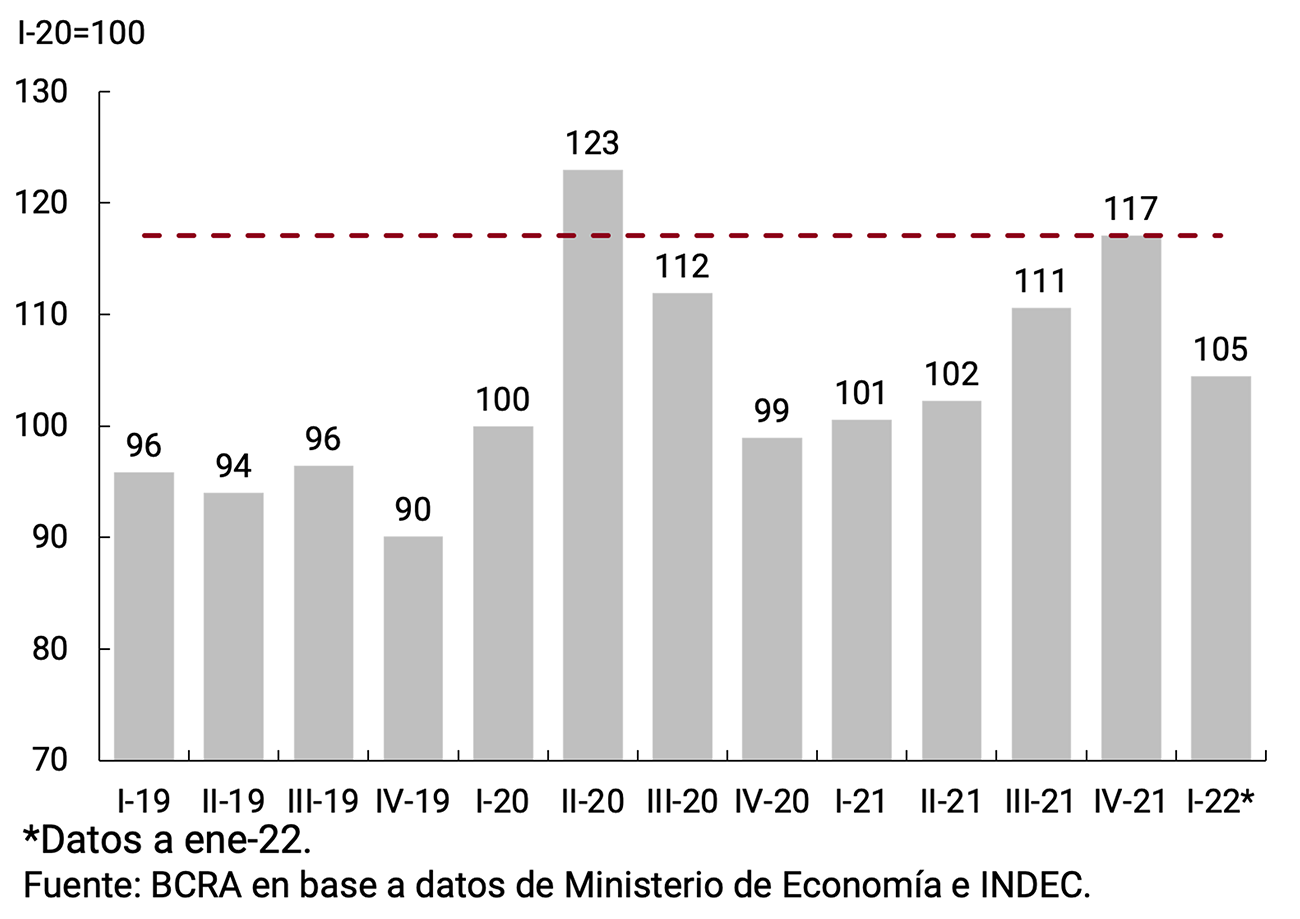
In this sense, if real seasonally adjusted primary expenditure is observed, it was 17.1% above the pre-pandemic level in the fourth quarter of 2021 (I-20; see Figure 5.4). Between October and December 2021, spending grew 5.8% s.e. compared to the previous quarter. With partial data from the first quarter (as of January), it can be seen that real seasonally adjusted primary expenditure fell 10.7% s.e. compared to the last quarter of 2021.
Figure 5.4 | NFPS-adjusted real seasonally adjusted primary expenditure
However, measured in relation to Output, primary expenditure reduced its participation, explained by economic growth. NFPS primary expenditure accounted for 21.3% of GDP in 2021 (-2.7 p.p. compared to the previous year). Expenditure on pension benefits (retirements and pensions) increased 41.9% in 2021 in accordance with the provisions of the Pension Mobility Law31. Thus, they reported an amount equivalent to approximately 8% of GDP in 2021 (-1.5 p.p. compared to the previous year). As of March 2022, the expected mobility of 12.28% has an impact, implying a variation of 58.62% y.o.y. in the salaries. This improvement will also include family allowances, including the Universal Child Allowance (AUH) and Pregnancy Allowance, impacting the income received by almost 9 million children and adolescents.
As for social benefits, these expenses had a nominal increase of only 16.1% during 2021 because this item had incorporated during 2020 a large part of the programs to sustain income during the most intense months of the pandemic (such as the Emergency Family Income (IFE) and the Emergency Assistance Program for Work and Production (ATP). In this way, they decreased their share in terms of GDP in primary spending: during 2021 they represented 3.7% of GDP, which implied a decrease of 1.7 p.p. compared to the previous year. In 2021, the expenditures of the Food Policy program were highlighted: since February, the allocation was increased by 50% while the universe of beneficiaries was expanded to 14 years of age. In turn, payments from the Employment Actions program – mainly REPRO II – as well as the Empower Work program, registered a significant increase aimed at assisting the productive sectors critically affected by the pandemic. For its part, the set of family allowances grew 49.4% in 2021.
In a context in which the National Government promoted a policy of containing the rates of public services – electricity, gas, water and public transport – economic subsidies accounted for a growing portion of primary spending: they grew 118.8% YoY in the year and came to represent 3% of GDP (+0.5 p.p. of GDP, see Figure 5.5). This increase in participation is mainly due to the increase in spending associated with energy subsidies in a context in which there were also significant increases in international fuel and energy prices and higher domestic costs of electricity production due to the lower contribution of hydroelectric generation (in a context of low water in rivers due to drought). On the other hand, subsidies for public passenger transport remained practically unchanged in relation to the Product.
Items associated with salaries and operating expenses grew 68.6% last year compared to 2020 and maintained their share at 3.3% of GDP. It should be noted that the latter item includes purchases of goods and services (including expenditures associated with the purchase of vaccines against COVID-19 and expenses associated with the organization of the national election). On the other hand, current transfers to the provinces moderated significantly (+15.2% nominal y.o.y. in 2021) compared to 2020, when the National Government had extraordinarily assisted the districts in the face of the abrupt decline in subnational collection. This performance was verified despite the fact that since the beginning of 2021, the transfers associated with the creation of the Fund for the Fiscal Strengthening of the Province of Buenos Aires32 began to be recorded in the budget. In this way, transfers to provinces reduced their share of expenditure in relation to GDP by 0.4 p.p., to stand at 0.8% of GDP in 2021 (see Figure 5.5.).
Figure 5.5 | NFPS primary expenditure
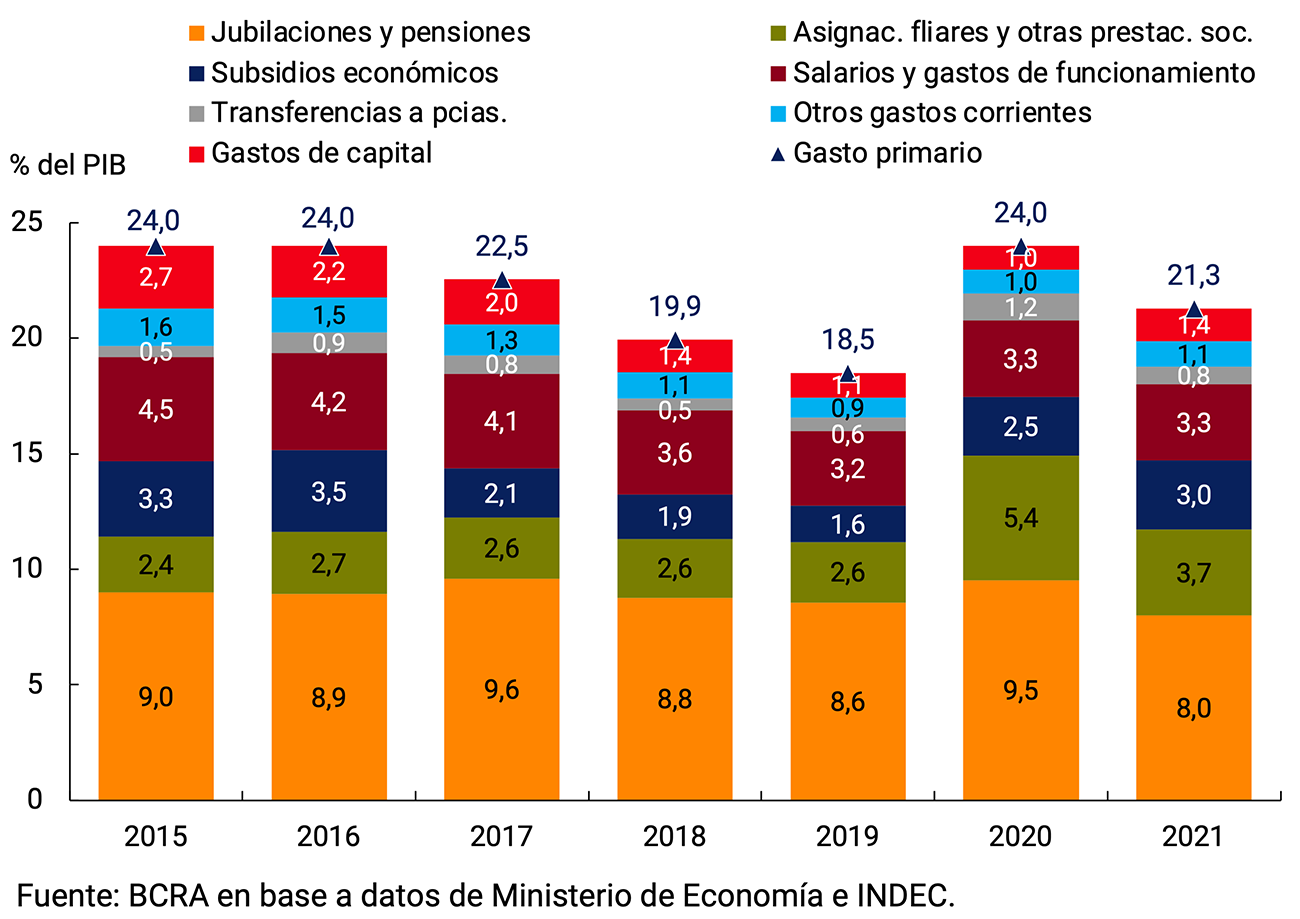
Capital expenditure showed great dynamism throughout last year, in line with the definition of priorities set out in the 2021 National Budget to promote the recovery of economic activity. In fact, this item grew 132.8%, with Real Direct Investment (IRD) being the sub-item that had the best performance (+177.5%)33. Thus, NFPS capital expenditure stood at 1.4% of GDP in 2021 (+0.4 p.p. vs. 2020).
In the first month of 2022, revenues grew 47.8% YoY (-1.9% YoY in real terms), in line with the behavior observed in national tax collection. Primary expenditures advanced 56.8% YoY (+4.1% YoY in real terms) in that period. This expansion in expenditure was driven by both capital expenditure (+83.2% YoY) and pension benefits (+63.5% YoY).Question 34.
The primary deficit of the NFPS accumulated during 2021 was reduced compared to that recorded during 2020. Thus, in 2021, it represented approximately 2.1% of GDP. Net of the $427.4 billion from the extraordinary allocation of Special Drawing Rights (SDRs) that the IMF made in the context of the global crisis caused by the COVID-19 pandemic, the primary deficit represented approximately 3% of GDP in 2021 (see Figure 5.6). For its part, the financial deficit of the NFPS accumulated in the same period stood at 3.6% of GDP (4.5% net of income from IMF allocation).
Figure 5.6 | Cumulative NFPS
Result 12 months
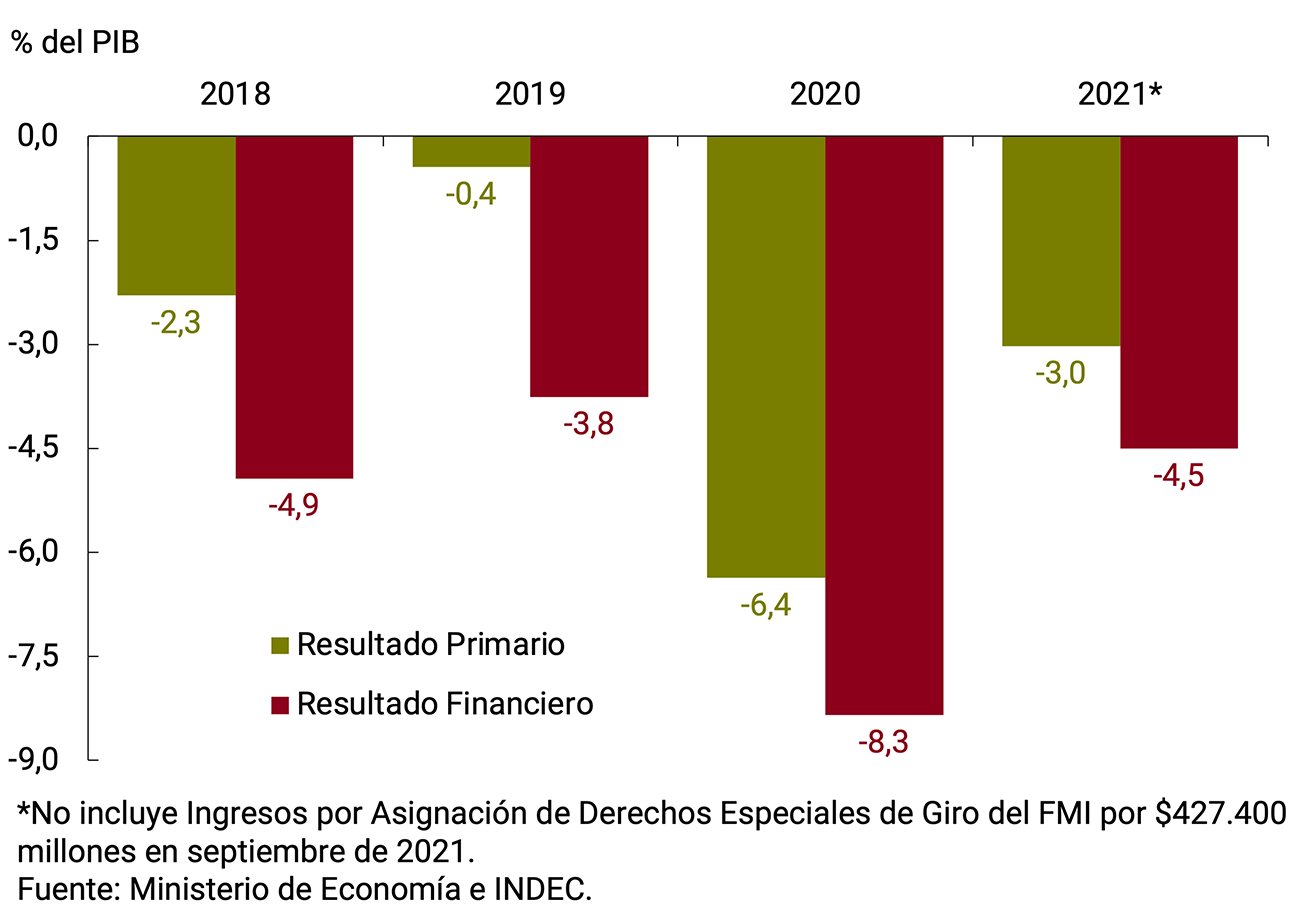
5.3. In contrast to the previous year, during 2021 the National Government met its needs with less monetary financing
During the fourth quarter of 2021, the TN achieved a refinancing of 135.7% of principal and interest services, which implied a net financing of approximately $332,868 million35, accumulating a net financing in the year of about $746,470 million (122% refinancing rate for the auctions of market instruments carried out throughout 2021). In turn, in the accumulated of the first two months of 2022, the TN obtained a refinancing of 165.6% of the principal and interest services, which implied a net financing of approximately $372,326 million. Issuances of public debt instruments during the quarter were mainly with fixed-rate securities and adjustable by CER, and to a lesser extent with securities adjusted to the evolution of the dollar and at a variable rate.
The extension of the terms of the instruments issued remained relatively stable during the quarter, while there was an increase in the nominal cost of financing in pesos. On the other hand, during the months of October and November 2021 and during February and March 2022, voluntary debt conversion operations were carried out, which made it possible to significantly decompress the profile of short-term maturities, with a continuation of this type of operation expected. With the aim of developing the local peso debt market, the participation of the 2021 Aspiring Market Makers continued to be strengthened, and short-term investments continued to be offered to the Mutual Funds (FCI) from the auctions of Treasury Liquidity Bills (LELITES; very short-term and highly liquid instruments intended exclusively for subscription by FCI).
In 2021 and in line with budget forecasts, $787,700 million were transferred as a transfer of profits from the BCRA to the TN. Likewise, it was verified that in the year the net granting of net Transitory Advances from the BCRA to the TN for $912,599 million. It is worth highlighting the decision of the National Treasury to cancel Transitory Advances with the $427,400 million received as a counterpart to the sale to the BCRA of the SDRs allocated by the IMF36.
5.4. The new agreement with the IMF will provide certainty, predictability and sustainability to public policies in a framework of sustained economic growth
The path of reducing the deficit of the National Non-Financial Public Sector and the monetary financing of the BCRA to the National Treasury, will provide certainty, predictability and sustainability to public policies within the framework of the recovery of economic growth, financial stability and the balance of the money market. The improvement in public finances will be based on a balanced set of revenue and expenditure measures. On the one hand, an improvement in tax revenues is expected due to greater efficiency in tax collection and improvements in the progressivity of taxation. On the other hand, the agreement provides for a real growth in primary public expenditure while contemplating improvements in its targeting, efficiency and progressivity. In particular, a better targeting of spending in the areas of social assistance and subsidies for energy consumption is foreseen, while protecting the allocations for science and technology and public investment, seeking to sustain the recovery and boost future growth (see Section 4 / The Extended Facilities Agreement with the IMF).
The agreement will allow financing the large capital maturities committed by the National State to the IMF for more than US$41,000 million during 2022, 2023 and 2024, recovering the amount of external financing equivalent to the value of the capital services of the debt with the IMF canceled during 2021, for an amount close to US$3,800 million and will provide the necessary conditions to restructure the debt with more favorable terms for Argentina debt with the bilateral official creditors grouped in the so-called “Paris Club”. The agreement foresees, for 2022, net financing with the IMF of 0.7% of GDP and additional net financing from other multilateral and bilateral official creditors of 0.4% of GDP. It will also contribute to the development of the domestic financial market, by providing certainty about the solvency of the public sector and ensuring savings instruments with positive real returns in local currency.
6. Pricing
During the first two months of the year, inflation accelerated again and registered an increase of 4.3% monthly average, disseminated among the categories, above the 3.3% monthly average observed during the fourth quarter of 2021. The greater dynamism of prices since the previous publication of the IPOM was verified in a context of the reopening of wage parity agreements, greater demand generated by the economic recovery and higher inflation expectations under greater financial and exchange rate uncertainty in the framework of negotiations with the IMF. Likewise, adverse weather conditions in the producing regions negatively influenced the price of vegetables, generating extraordinary increases. Finally, starting in February, the war between Russia and Ukraine once again pushed up international prices of agricultural commodities and energy, which once again exerted pressure on domestic inflation and poses a challenging scenario, especially for the next two months.
Core inflation increased to 3.9% per month on average in the first two months of 2022, with an acceleration in packaged foods and a high rate of increase in meat and its derivatives. The prices of regulated products began to accelerate, growing 2.9% monthly average in the first two months of 2022, with greater increases in fuels and telephony and internet. On the other hand, the prices of seasonal goods and services averaged greater increases during the beginning of the year (5.2% monthly average in the first two months), with extraordinary increases in the prices of vegetables and fruits. Thus, inflation stood at 52.3% year-on-year in February, after ending 2021 with year-on-year inflation of 50.9% (+14.8 p.p. compared to 2020 and -2.9 p.p. compared to 2019).
Going forward, the combination of monetary, fiscal, and price-income policies will aim to gradually and persistently reduce high levels of inflation. In this sense, the BCRA will conduct its monetary and exchange rate policy, managing liquidity, in a context of less financing from the BCRA to the National Treasury, and maintaining the level of external competitiveness, so as not to damage the economic recovery underway. In this sense, the signing of the agreement with the IMF will reduce exchange rate uncertainty and anchor depreciation expectations, contributing to the decline in inflation during the remainder of 2022.
6.1. Average monthly inflation accelerated in recent months
In the first two months of 2022, average monthly inflation stood at 4.3%, above the monthly average of 3.3% in the fourth quarter of 2021 (see Figure 6.1). Regarding the monthly evolution, in November 2021 there had been a transitory decrease to 2.5% per month as a result of the implementation of the “+Precios cuidados” freezing program41, together with a sharp slowdown in the Seasonal category. At the beginning of 2022, however, there was a widespread increase in inflation among the main CPI categories (see Figure 6.2).
Figure 6.1 | CPI. Monthly and quarterly evolution of the General Level
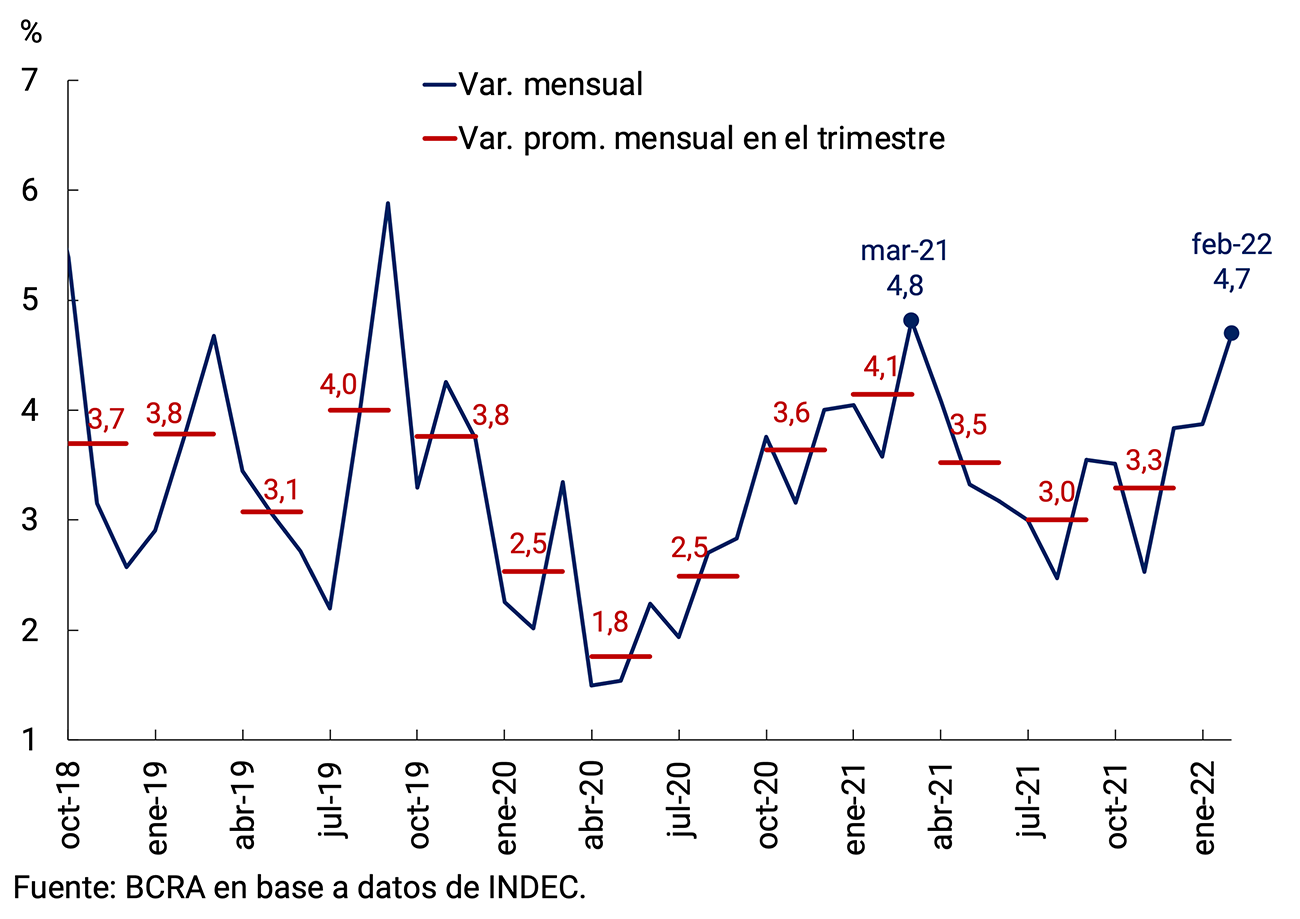
Core inflation showed high volatility since September associated with the evolution of the price of Meat and derivatives. The authorized increases in consumer goods that were part of the administered price program also imprinted some volatility in the evolution of this category. The pace of core inflation excluding meat remained relatively more stable, albeit at elevated levels, and accelerated at the margin (see Figure 6.3).
Figure 6.2 | CPI. Contributions of Seasonal, Regulated and Core Goods and Services in the Quarter
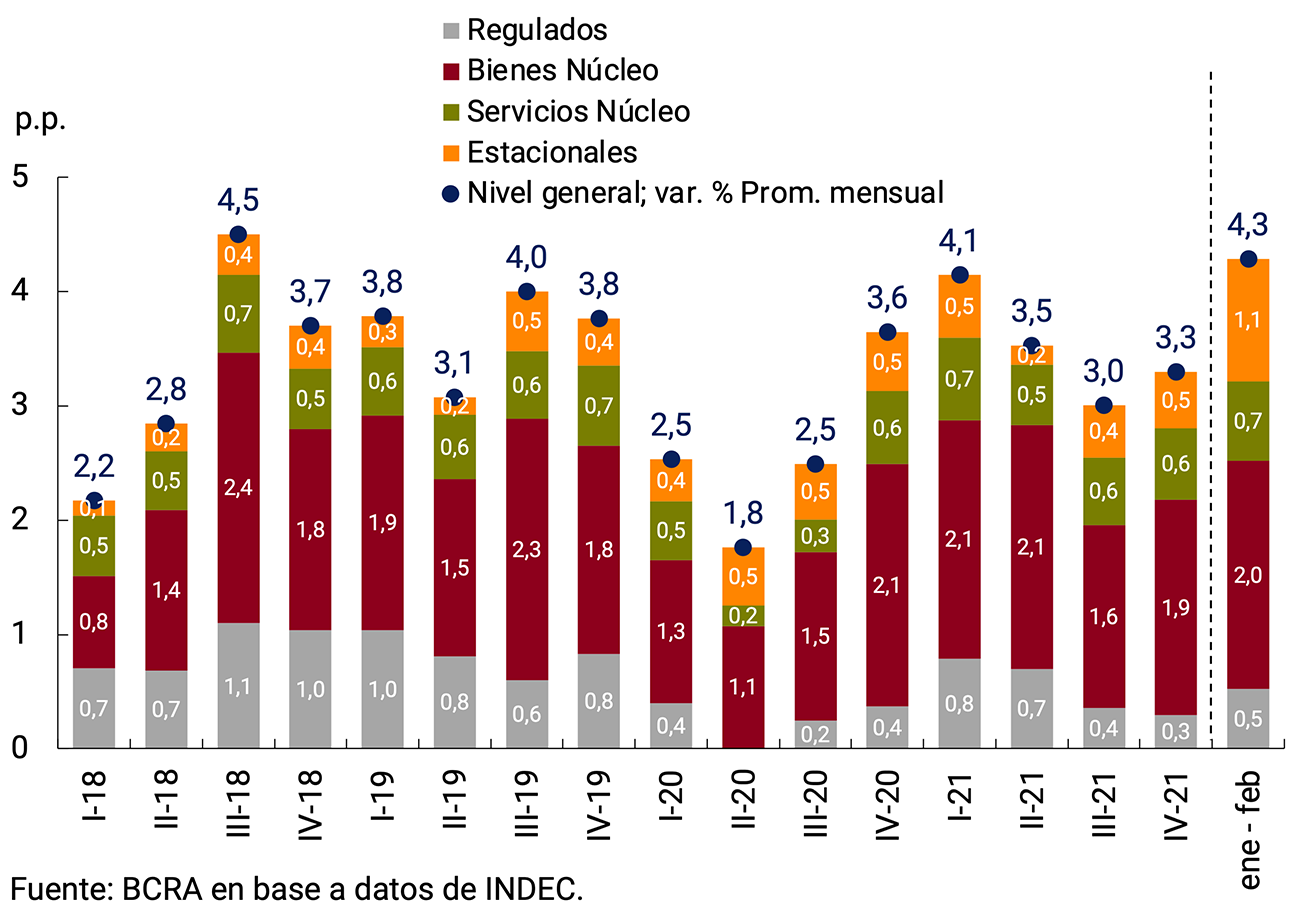
The acceleration of the general price level in the first two months of 2022 was mainly the result of the higher rate of increase in goods. The higher rate of increase in the prices of food and non-alcoholic beverages was highlighted. The prices of regulated products began to show greater dynamism and grew 2.9% monthly average in the first two months of 2022, with higher increases in fuels. On the other hand, the prices of seasonal goods accelerated during the beginning of the year, reflecting the extraordinary increases in the prices of vegetables and fruits, after months of an adverse weather environment.
Figure 6.3 | CPI Core and meat. Average monthly variation by quarter

The higher rate of increase in food and non-alcoholic beverages during the first months of 2022 was mainly explained by the evolution of vegetables which, after an average monthly drop of 1.4% in IV-21, rose at a monthly rate of 25.8% and 26.5% in January and February respectively, affected by climatic factors in the producing regions. Packaged foods also accelerated (4.3% monthly average in the first two months of 2022, +1.9 p.p. compared to IV-21) after the end of the “+Precios Cuidados” freeze program that was in force during the last quarter of 2021, replaced as of January by a scheme of voluntary price agreements42. The Meat and derivatives group, although it slowed down in the first two months of 2022 compared to IV-21, maintained a high rate of increase, especially in February with a 5% increase (see Figure 6.4).
Figure 6.4 | Monthly evolution of fresh and packaged food prices
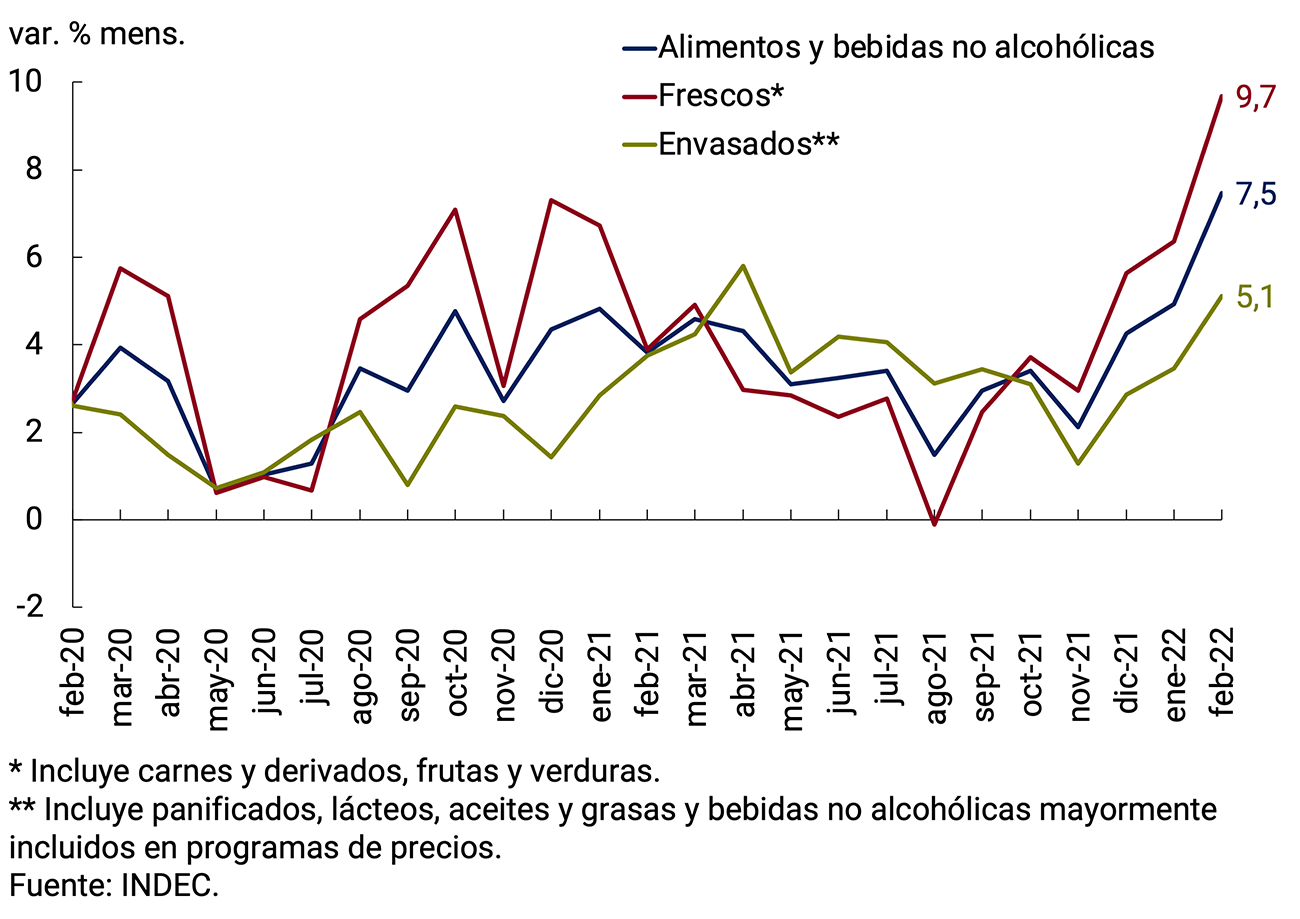
The pace of increase in services accelerated moderately in the first two months of 2022 (up to 3.4% monthly average compared to 3.1% verified in the fourth quarter of 2021). The evolution within services was heterogeneous (see Section 5 / of Recent evolution of the relative price structure of the CPI).
The acceleration of services was mainly due to the performance of regulated services, which had been maintaining limited rates of increase in their prices during 2021, as a result of the policy of containing the rates of public services – electricity, gas, water and transport – by the National Government. At the beginning of 2022, the increases in Communication, associated with telephony and internet, and new updates to the prices of prepaid medicine stood out. It should be noted that the authorized increases in electricity and gas rates will mainly impact March.
At the beginning of 2022, unregulated private services maintained a similar rate of increase to that seen in the fourth quarter of 2021, driven by the recovery in demand in a context of improving the epidemiological situation. Those linked to tourism – accommodation, transportation, packages and excursions – continued to register high increases, both due to seasonal factors before the beginning of the summer season, and due to the increase in demand boosted by the program to boost the sector launched by the National Government (PreViaje). For its part, housing rents showed a significant acceleration in the first two months of 2022 (4.5% monthly average, +1.6 p.p. compared to IV-21).
6.2. Wholesale prices maintained a more moderate pace than retail prices in the fourth quarter
At the beginning of 2022, wholesale prices captured by the Domestic Wholesale Price Index (IPIM) continued to grow at an average monthly rate lower than that of retail goods, although they verified a slight acceleration compared to the fourth quarter, explained by higher wholesale prices of vegetables and a slight increase in the rate of increase in the nominal exchange rate. Meanwhile, the persistence of high international commodity prices exerted upward pressure on this set of goods (see Figure 6.5).
Figure 6.5 | IPIM, nominal exchange rate, import prices in pesos and international prices of raw materials (IPMP) in pesos
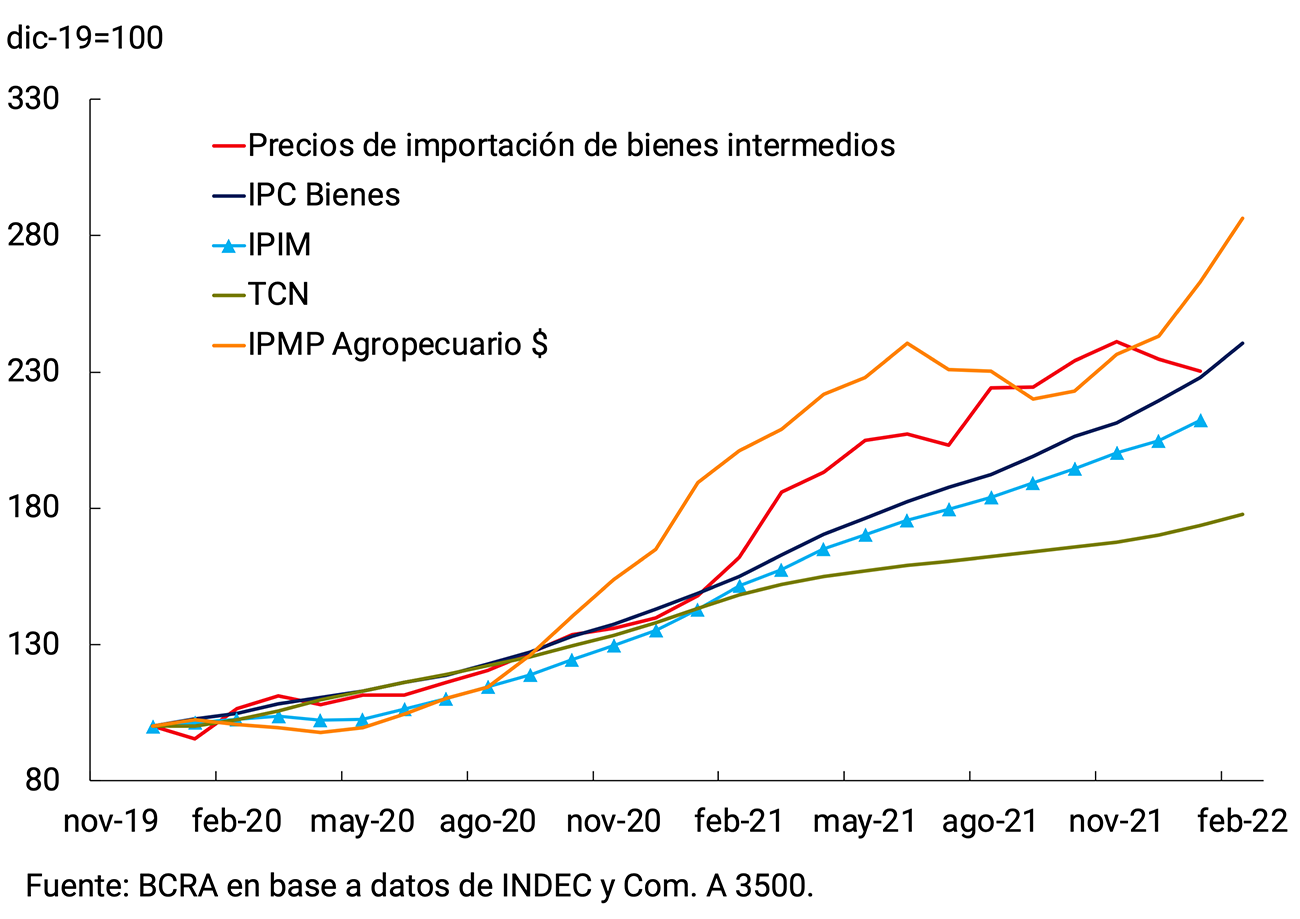
Within the IPIM, Manufactured Products maintained their rate of expansion compared to the last quarter of 2021, while Primary Products accelerated in January 2022 to 7.4%, where the rise in vegetables after the heat wave at the beginning of 2022 was particularly influential.
Figure 6.6 | Evolution of the main components of the IPIM and the nominal exchange rate
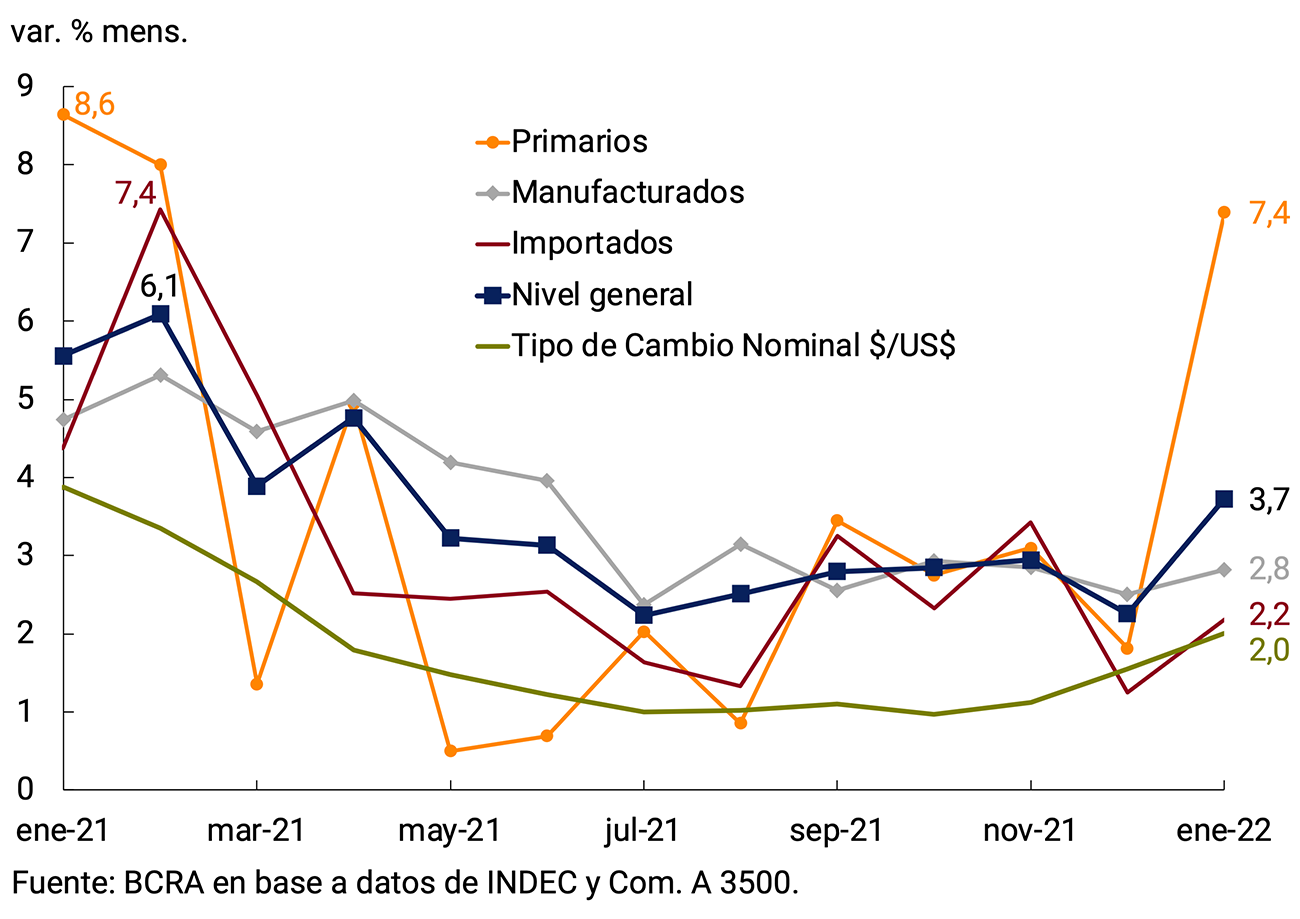
On the other hand, Construction costs (CCI) maintained a somewhat higher rate of expansion than in the last quarter of 2021 during the beginning of 2022, with an acceleration in both materials and labor, which reflected the parity brackets (see Figure 6.7).
Figure 6.7 | Construction costs
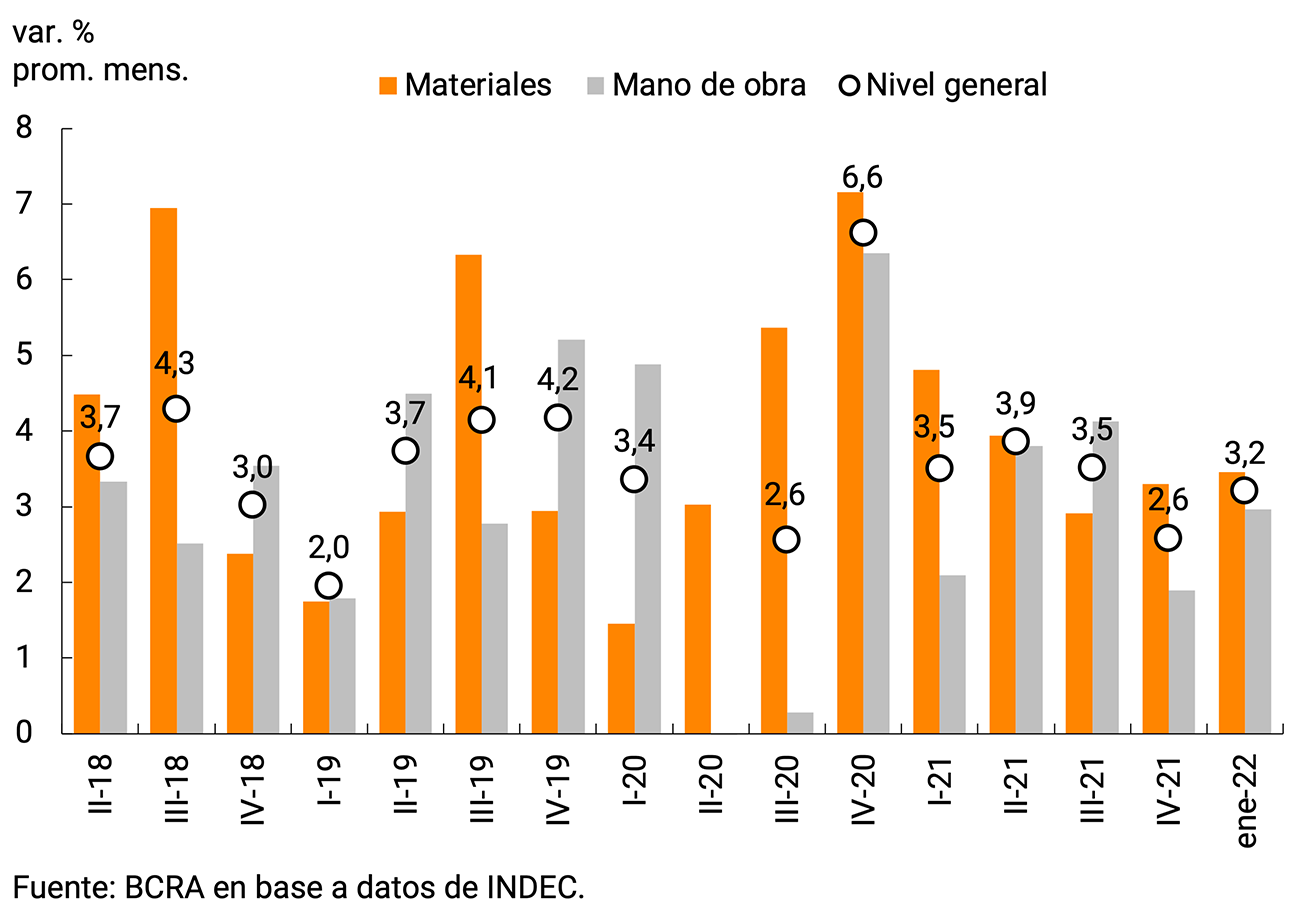
6.3. Year-on-year inflation remained relatively stable and heterogeneity between wholesalers and retailers was reduced
The year 2021 ended with retail inflation of 50.9% YoY, 14.8 p.p. above the December 2020 record, although lower than that of December 2019 (53.8%, -2.9 p.p.), while it accelerated to 52.3% YoY in February 2022. For its part, year-on-year wholesale inflation, which during 2021 had grown above retail inflation, fell significantly and was below in January 2022 (see Figure 6.8).
Figure 6.8 | Retail (CPI) and wholesale (IPIM) prices
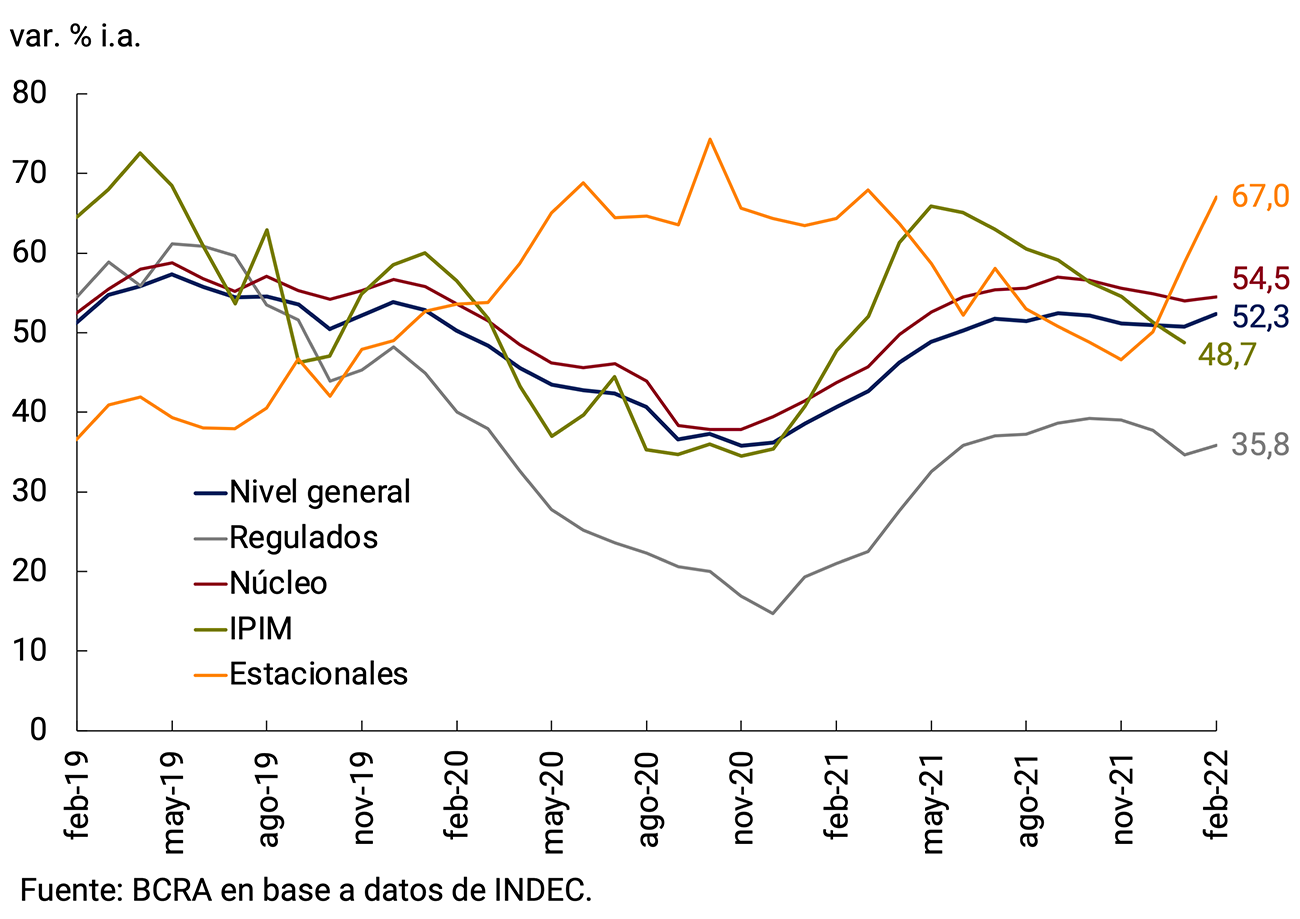
As a result of the extraordinary rise in vegetables and fruits, the Seasonal category of the CPI showed an acceleration in recent months and reached a year-on-year increase of 67.0% in February, higher than that of the Core category (54.5%). The prices of regulated goods and services continued to grow on average at lower rates (35.8% in Feb-22).
During 2021, at a more disaggregated level, a reduction in the heterogeneity of year-on-year variations was also observed compared to 2020. Using information from the CPI of the Autonomous City of Buenos Aires, due to its higher level of openness compared to the National CPI, it can be observed that the dispersion of the year-on-year growth rates of a set of relevant groups of goods and services was reduced (see Figure 6.9). However, relative price levels continued to show significant differences compared to the pre-pandemic period (see Section 5 / Recent developments in the CPI relative price structure).
Figure 6.9 | Dynamics within the CPI BA
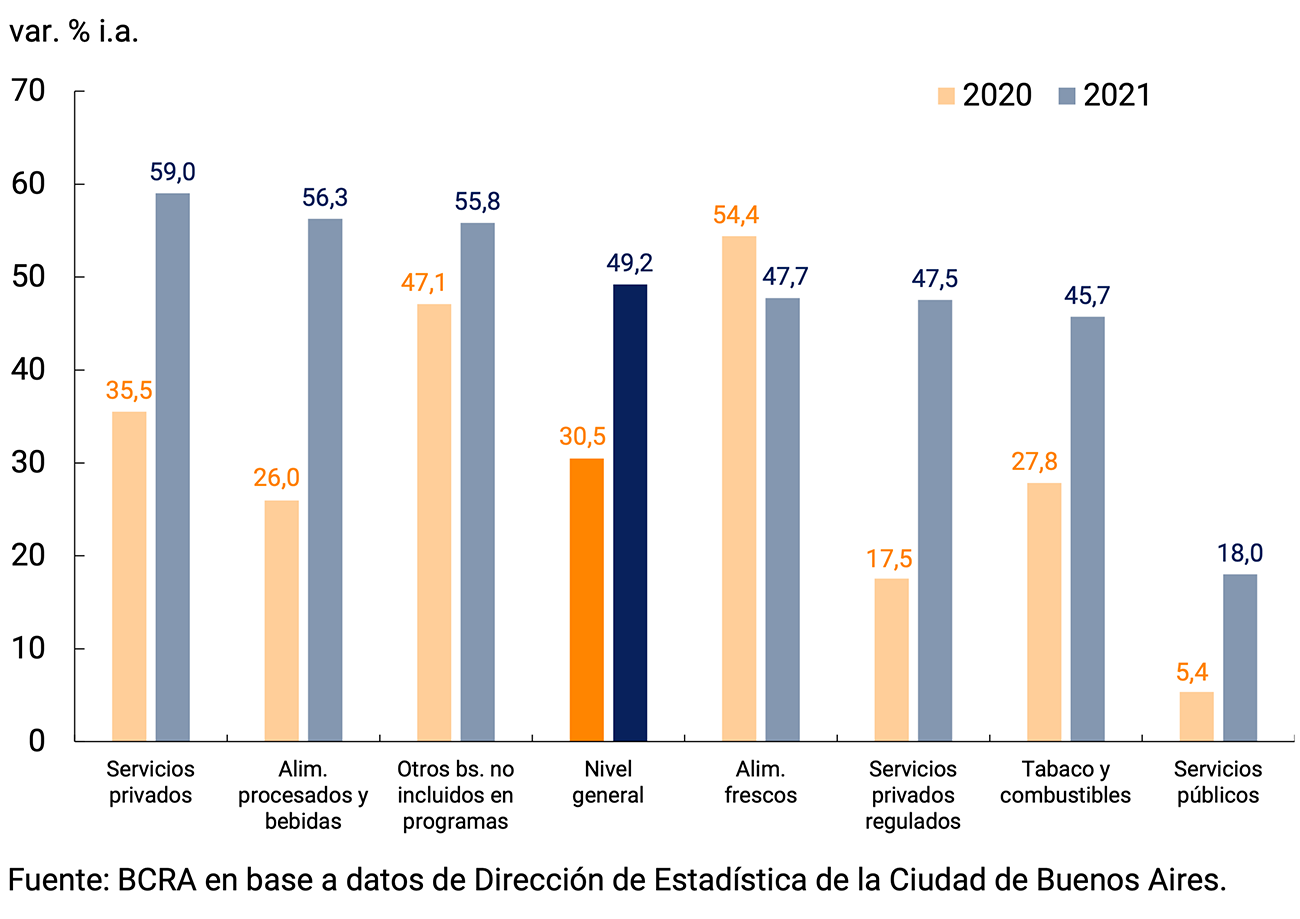
Despite the reduction in heterogeneity in the year-on-year rate of increase, three differentiated ranges of increase can be identified among the previously highlighted groupings.
In first place, unregulated private services, processed foods and beverages and other goods not included in programs stand out, whose average increases (between 55% and 59% y.a. in CABA) exceeded that of the general level. Unregulated private services, among which the Restaurants and hotels category stood out, were boosted by the recomposition of demand allowed by the improvement of the epidemiological situation and by the stimulus plan for the sector (PreViaje). Processed foods and beverages accelerated in 2021, after a year in which they had been contained by the Reference Price Programs as a way to shore up families’ real incomes during the pandemic. Finally, the set of goods not regulated or covered by programs (also excluding fresh food) was once again one of the groups that increased the most in the year, highlighting the significant increases in clothing and footwear and automobiles, both affected by supply restrictions.
In second place are Fresh Food, Regulated Private Services and Tobacco and Fuels (Regulated Goods), which verified increases on average slightly lower than those of the General Level (between 45% and 48% y.o.y. in CABA).
Thirdly, Public Services again registered expansion rates in 2021 well below those of the rest of the categories (18% y.o.y. in CABA), within the framework of the tariff containment policy by the National Government during the pandemic.
6.4. Perspectives
The increase in core inflation in recent months occurred in the context of the recomposition of the marketing margins of certain sectors, the reopening of wage parity agreements and higher inflation expectations as a result of the greater exchange rate pressures registered in a framework of financial uncertainty, generated by entering a stage of definition of the negotiation with the IMF for a new debt agreement with the organization. The scenario of high inflationary inertia was compounded by unfavorable domestic weather conditions and the significant increase in international prices of agricultural raw materials, energy, and global manufacturing, which accelerated in the face of the Russia-Ukraine conflict. This poses a challenging scenario in terms of prices, especially for the next two months.
The BCRA hopes that the agreement with the IMF, by clearing the horizon of maturities in the short term and not contemplating an abrupt exchange rate correction, will contribute to reducing inflation expectations. The program includes a recomposition of international reserves and gradual reductions in the fiscal deficit and monetary financing from the BCRA to the National Treasury. These characteristics of the agreement will reduce financial and exchange rate uncertainty in the coming months, favoring the disinflation process in the medium term and promoting a scenario of continuity of the economic recovery underway.
March’s inflation will be impacted by updates in the prices of some regulated goods and services such as fuels, gas and electricity, among others, which will exert upward pressure. Likewise, as of June, the gas and electricity rate increases that derive from the public hearing regarding the treatment of rates that will be convened in April will be implemented. The expected rise in regulated prices will allow their relative price to be gradually recomposed and will help ensure a sustainable supply of them in the medium and long term. The tariff update scheme will be adapted to the payment capacity of users, considering the needs of households in a situation of greater vulnerability.
Going forward, the challenge is to contain core inflation, without damaging the economic recovery underway, in order to resume a path of gradual disinflation that is consistent with the sustainability of public finances and the external sector. To this end, the BCRA will maintain a prudent administration of monetary aggregates, sterilizing any surplus liquidity, in order to avoid imbalances that directly or indirectly threaten the disinflation process. The reduction of the BCRA’s financing to the National Treasury provided for in the agreement with the IMF will contribute in this regard. Exchange rate policy will seek to preserve levels of external competitiveness, gradually readjusting the rate of change in the nominal exchange rate at a pace in line with domestic inflation. It is also proposed to establish an interest rate path that ensures the existence of savings instruments that generate positive real returns in local currency and deepens the development of the domestic public debt market. To this end, the BCRA recently increased the interest rates of its monetary policy instruments on several occasions (see Chapter 7. Monetary Policy). In the same vein, the income policy of the National Government and the reference price programs will contribute to coordinating prices and wages, favoring the reduction of inflationary inertia.
7. Monetary Policy
The BCRA continued to adapt its monetary policy to the prevailing economic conditions. In a more favorable health context, the rapid recovery of economic activity allowed the National Government and the BCRA to maintain the assistance measures focused on the most affected sectors. A contained level of expenditure and a higher level of public sector revenues resulted in a reduction in the fiscal deficit. At the same time, the reconstruction of the domestic debt market made it possible to channel a growing part of the Treasury’s needs through this channel. However, a reduction in the share of monetary financing was achieved.
Payment methods showed growth at constant prices in the last quarter of the year, and in terms of Product they remained below the average record between 2010 and 2019. On the other hand, there was a lower demand for fixed-term instruments in the latter part of the year. However, these instruments ended 2021 with a balance at constant prices and adjusted for seasonality that was positioned around the highest levels of the last 15 years. On the other hand, loans in pesos to the private sector consolidated the recovery that they had been hinting at in the previous quarter, driven mainly by trade lines.
Having reached pre-pandemic levels of activity and without neglecting the growth process underway, the BCRA proposed to resume the policy guidelines enunciated at the beginning of 2020, which combine the consolidation of domestic market growth and exports with monetary and macro-financial stability. In this scenario, the BCRA defined its Objectives and Plans for the year 2022. In line with these objectives, in the first week of January, the BCRA reconfigured its monetary policy instruments to accompany the recovery process and reinforce monetary, exchange rate and financial stability. Thus, the limit on LELIQ holdings to 28 days was readjusted, the policy interest rate signal was focused on this instrument, the reference interest rate was raised on two occasions, new instruments were created in order to increase the average term of monetary sterilization and the minimum interest rates for fixed-term deposits and the maximum rates on certain types of deposits were raised. lines of credit.
7.1. The BCRA continued to calibrate its policies according to the macroeconomic environment
The evolution of the health situation allowed the productive sectors to continue strengthening the process of “normalization” of their activities. Thus, in recent months there has been a continuity in the recovery of economic activity. However, it remained heterogeneous at the sectoral level, although with a progressive reduction in dispersion in recent months. In this context, the National Government continued to focus assistance initiatives on the most backward sectors and on the population in the most vulnerable situation.
The following sections analyze the evolution of the monetary aggregates, credit, and the foreign exchange market during the last quarter of 2021. Based on this scenario, the BCRA recently defined its Objectives and Plans for 202246 and revised the framework of its monetary policy by returning to the guidelines proposed at the beginning of 2020, prior to the emergence of the pandemic. Based on these, the main changes produced in monetary policy are also analyzed in order to comply with the guidelines proposed for the year and the subsequent performance of the monetary variables.
7.1.1. Liquidity management and reconfiguration of monetary policy instruments
Throughout 2021, the National Government’s spending remained relatively stable in real terms, with a focus on assistance measures. This, added to a higher level of public sector revenues, as a result of the dynamism experienced by the economy, allowed the National Government to end the year with a reduction in the fiscal deficit compared to 2020 (when the greatest impact of the COVID-19 pandemic was recorded; see Chapter 5. Public Finance).
Figure 7.1 | Primary issuance of the public sector*
Accumulated in the year
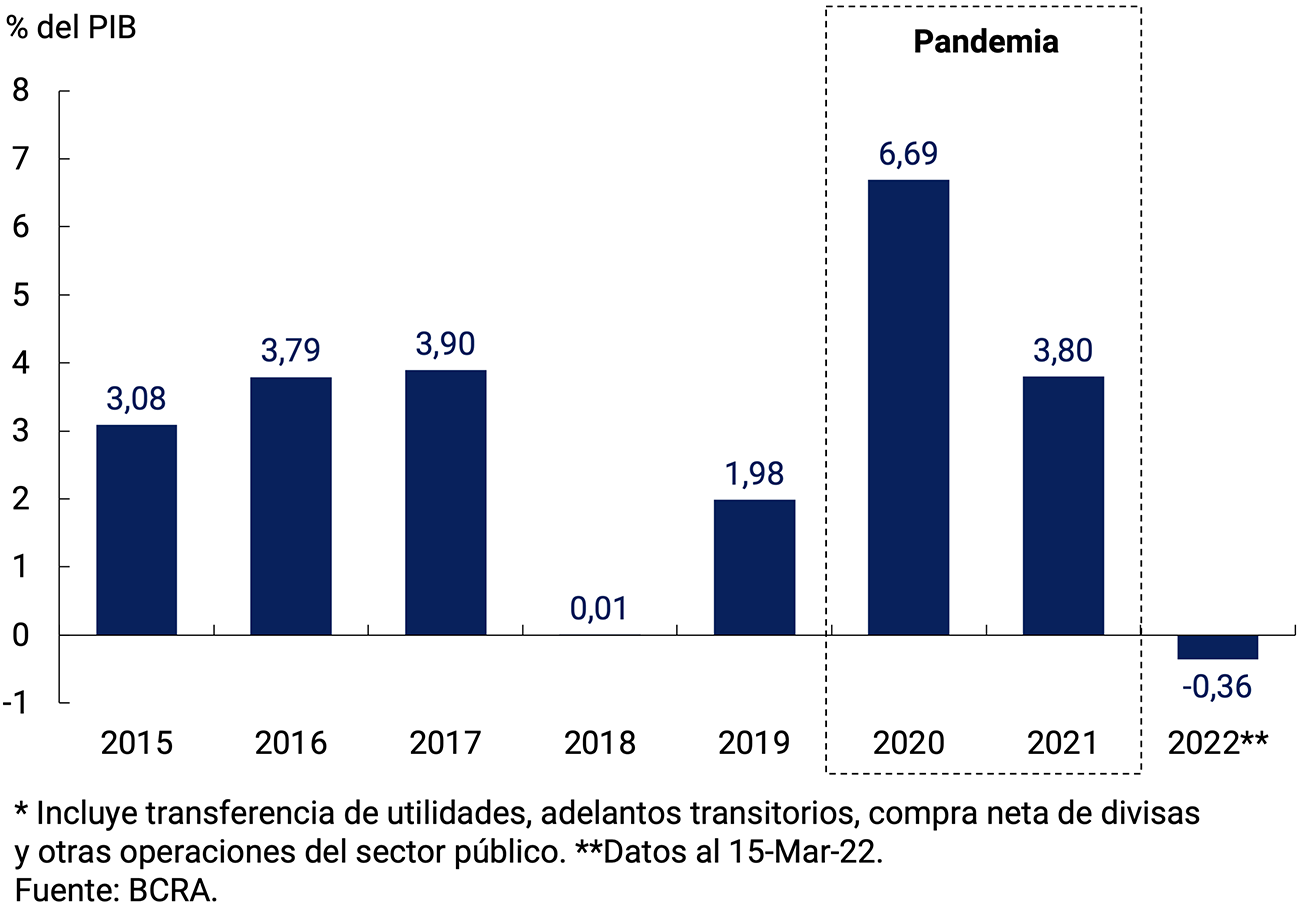
At the same time, the National Government continued to strengthen the process of rebuilding the domestic debt market. In 2021, the National Treasury (TN) achieved a positive net financing of $746,470 million, of which approximately 42% ($332,868 million) corresponds to the amount accumulated in the last quarter. Thus, the roll over rate in 2021 was approximately 122% of principal and interest maturities, a mechanism that allowed financing a greater proportion of TN’s financing needs compared to 2020. These developments resulted in 2021 ending with a level of financial assistance to the NT significantly lower than in the previous year and similar to that of the 2015-2017 period (see Figure 7.1). Meanwhile, so far in 2022, the public sector had a contractionary effect on the monetary base.
A relevant factor in the expansion of the monetary base throughout 2021 was the net purchase of foreign currency by the BCRA from the private sector. However, its incidence throughout the period was not homogeneous, with a marked expansion in the first months of the year for this concept and a contraction at the end of the period. Thus, in the last quarter of the year, a negative contribution from the external sector was observed, in a context of increasing interventions by the BCRA in a typical period of lower agricultural export settlements and growing uncertainty around the electoral process first, and with respect to the progress of negotiations with the IMF later. On the other hand, so far this year this component has had practically no impact on the variation of the monetary base.
In 2021, the expansionary factors of the monetary base were partially sterilized through monetary regulation instruments (passive passes and LELIQ). Thus, interest-bearing liabilities ended the year at 8.4% of GDP, a value 1.7 p.p. lower than that recorded at the beginning of the pandemic and 2.6 p.p. lower than the maximum reached during 2018.
Figure 7.2 | Historical evolution of the monetary base
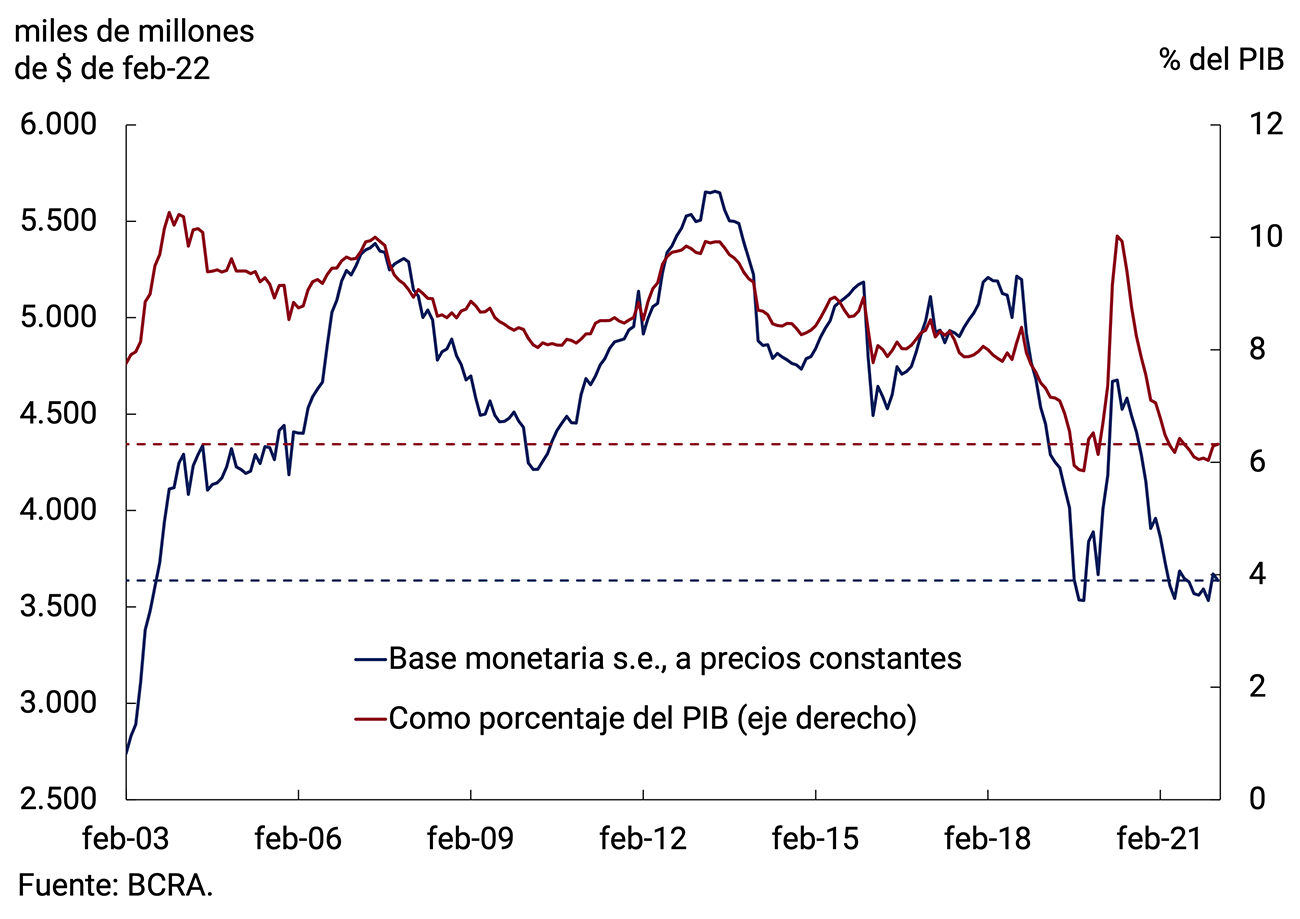
The BCRA will continue to manage liquidity to avoid imbalances that directly or indirectly threaten the disinflation process. In this regard, in the first week of January 2022, the BCRA reconfigured the monetary policy instruments47. It also decided to raise the interest rate of the LELIQ on two occasions with a 28-day term (2.0 p.p. and 2.5 p.p., respectively), which stood at 42.5% n.a. (51.93% y.a.). In addition, it extended the maximum holding limit of LELIQ to 28 days for up to an amount equivalent to the stock of private sector time deposits of each financial institution, focusing the policy interest rate signal on said instrument. Two new instruments were also created, the LELIQ with a 180-day term, whose rate was set at 47% n.a. (52.6% e.a.) and the NOTALIQ with a 190-day term, the latter will have a variable rate that will be defined as the monetary policy rate plus a spread48. The new instruments are auctioned once a week. These modifications contribute to increasing the average term of sterilization, as well as extending the BCRA’s reference rate curve. In addition, the BCRA will continue to participate in the secondary market for public securities in order to align the term structure of rates and guarantee the liquidity of these instruments. Finally, the rate of 1-day passive passes was raised from 32% n.a. to 33.5% n.a. (39.77% y.a.), and since January 17 the interest rate on 7-day passive passes has been progressively reduced to 32% n.a. These changes led to a change in the composition of interest-bearing liabilities in the first months of the year (see Section 6 / The reconfiguration of monetary policy instruments).
All in all, the monetary base ended the year with a balance of $3,394.5 billion, which implied an expansion of 15.6% ($457,251 million) in the last quarter and 40.0% ($970,455 million) in the year. In the first two months of 2022, the expansion was 10.5% ($356,463 million). However, in year-on-year terms and at constant prices, it continued to show a contraction, registering a variation of -5.8% y.o.y. in February 2022. Thus, the monetary base adjusted for price developments was at values similar to those of mid-2003. In terms of GDP, it would have stood at 6.3%, 3.7 p.p. below the maximum record of 2020 and around the value of the end of 2019 (see Figure 7.2).
7.1.2. Means of payment remained around their historical average as a percentage of GDP
Means of payment, at constant prices and adjusted for seasonality, showed a slight growth in the fourth quarter of last year. Indeed, during the last quarter of 2021, the Transactional Private M2 registered an average monthly expansion rate at constant prices of 0.8% s.e. In particular, the dynamic was linked in part to the entry of salary adjustment tranches from several unions. At the level of its components, the evolution was relatively homogeneous.
Figure 7.3 | Means of payment in terms of GDP

Means of payment ended the year with a contraction at constant prices of approximately 3% compared to the previous year. In terms of Output, Private Transactional M2 ended 2021 below the average value verified during the previous decade (2010-2019). In fact, this ratio remained around 10% for most of the year, i.e. 4.5 p.p. below the maximum reached during the first year of the pandemic and -1.6 p.p. compared to its average between 2010 and 2019. In particular, the working capital in the hands of the public ended the year at 4.1% in terms of GDP, positioning itself 1.5 p.p. below the average recorded between 2010 and 2019 and at a value close to its lowest in the last 15 years (see Figure 7.3).
The records for the first two months of 2022 showed relative stability in the demand for means of payment. In fact, at constant prices and without seasonality, Private Transactional M2 has accumulated growth of 0.9% so far this year, persisting at a ratio to GDP close to 10%.
7.1.3. The BCRA raised the interest rate on savings instruments in local currency to shore up their demand
In the last quarter of 2021, fixed-term deposits in pesos in the private sector presented a negative monthly average variation at constant prices (-1.7% s.e.). The lower demand for term instruments was partly explained by the greater dynamism of payment methods.
Figure 7.4 | Monthly change in time deposits by amount
stratum At constant prices

Placements with the lowest strata accounted for most of the fall (see Figure 7.4). In fact, retail fixed-term deposits (less than $1 million) would have continued with the downward trend in real terms that began in the previous quarter. On the other hand, placements of between $1 and $20 million at constant prices also presented a contraction in the fourth quarter, although of a smaller magnitude, after uninterrupted growth since the beginning of the year.
In the wholesale segment (more than $20 million), placements at constant prices would have remained relatively stable during the last quarter of the year, although with a heterogeneous behavior within the period. Within this layer of amount, the main actors are: companies and Financial Service Providers. In particular, within the latter, the Mutual Funds of Money Market (FCI MM) stand out, whose holdings represent more than 90% of the total. Although its assets showed growth in the quarter, a greater preference for liquid assetswas observed between October and November, a trend that was reversed in the last month of the year.
In terms of instruments, the dynamics of the last quarter of 2021 were mainly explained by the lower dynamism of traditional fixed-term placements denominated in pesos. Meanwhile, deposits in the segment adjustable by CER, after a marked drop between September and October, stabilized in the last two months of the year. Finally, instruments adjusted for exchange rate developments (DIVA dollar) gained momentum in the latter part of the year, although they still represent a small fraction of total private sector time deposits (it should be remembered that the latter are available only to the agricultural sector).
Despite the lower dynamism of fixed-term placements in the latter part of the year, these instruments ended 2021 with a balance at constant and seasonally adjusted prices that was positioned at levels close to the highest recorded since 2003 (see Figure 7.5). As a percentage of GDP, private sector time deposits closed the year with a record of 6.4%, placing them 0.9 p.p. above the average record verified between 2010 and 2019.
All in all, the broad monetary aggregate M3 private registered an average monthly increase of 0.9% s.e. at constant prices in the last quarter of the year. In terms of GDP, it ended the year at 18.1%, 6 p.p. below the maximum record reached in June 2020 and in line with its average record between 2010 and 2019.
Figure 7.5 | Fixed-term deposits in pesos of the private
sector At constant prices
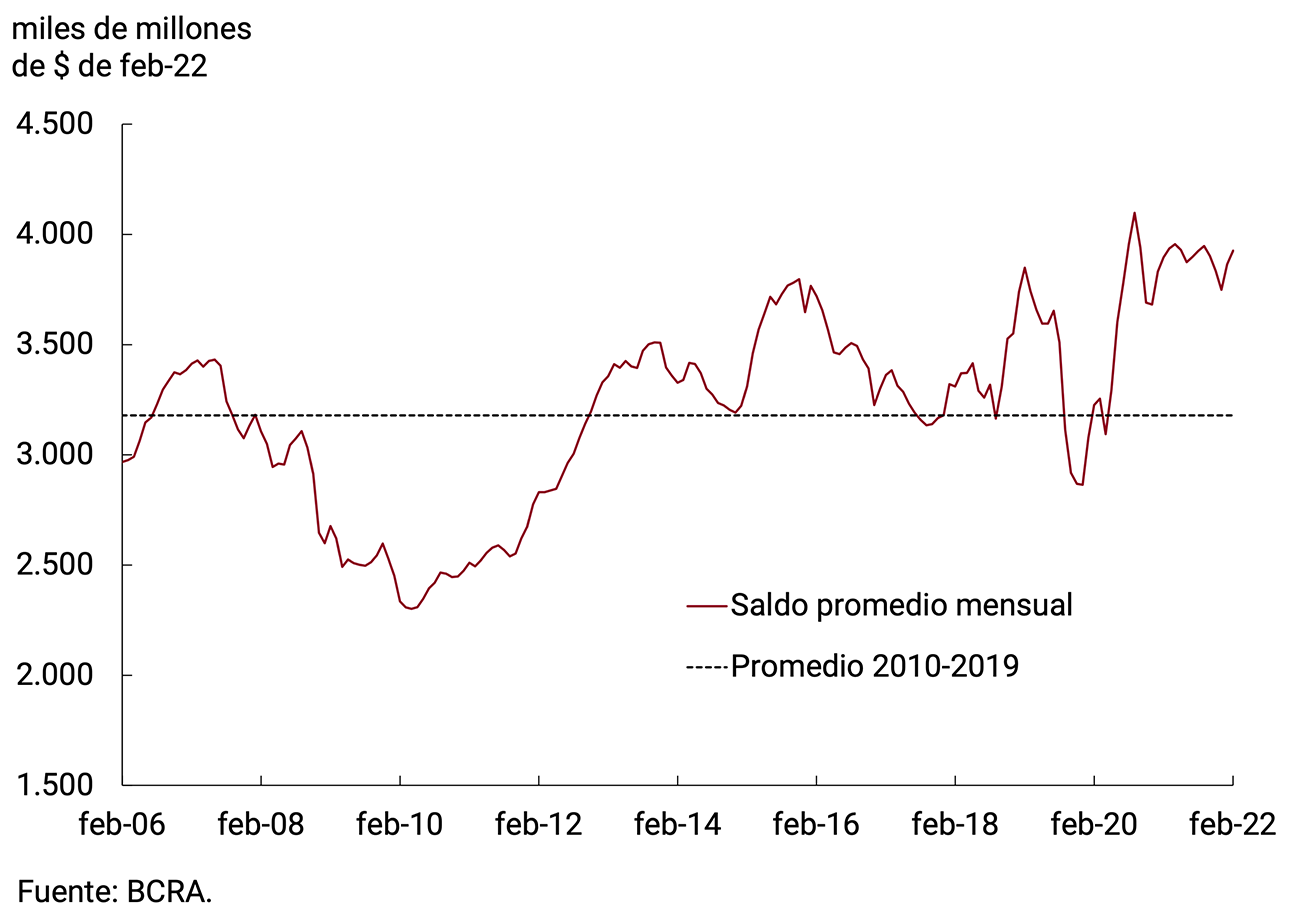
In order to underpin the demand for savings instruments in domestic currency, and in line with the objectives set for 2022, the BCRA will seek to establish a path of rates that tends towards positive real returns on investments in local currency, and preserves monetary and exchange rate stability. In this regard, in the first months of 2022, the Board of Directors of the BCRA decided to raise the minimum guaranteed interest rates on fixed-term deposits on two occasions (at the beginning of January and in mid-February). Thus, the new floor for the impositions of individuals for up to an amount of $10 million was increased by 4.5 p.p., standing at 41.5% n.a. (50.39% y.a.). For the rest of the depositors in the financial system, the minimum guaranteed interest rate rose 5.5 p.p. to 39.5% n.a. (47.51% y.a.). In this context, in the first two months of 2022, fixed-term deposits50registered an average monthly expansion rate of 2.3% at constant prices, breaking with a three-month period of negative variations (see Figure 7.4).
7.1.4. Credit policy continued to focus on the most backward sectors and on productive development
The continuity of the process of “normalization” of the activities of the productive sectors allowed the BCRA to continue with its credit policy focused on the most backward sectors and on productive development. During 2022, the Central Bank will continue to stimulate the supply of credit to the private sector, given its relevance to promote sustained economic growth and structural change. Financial assistance efforts to the sectors most affected by the pandemic will continue to be reduced as these sectors consolidate their recovery process.
Figure 7.6 | Loans in pesos to the private sector as a percentage of GDP
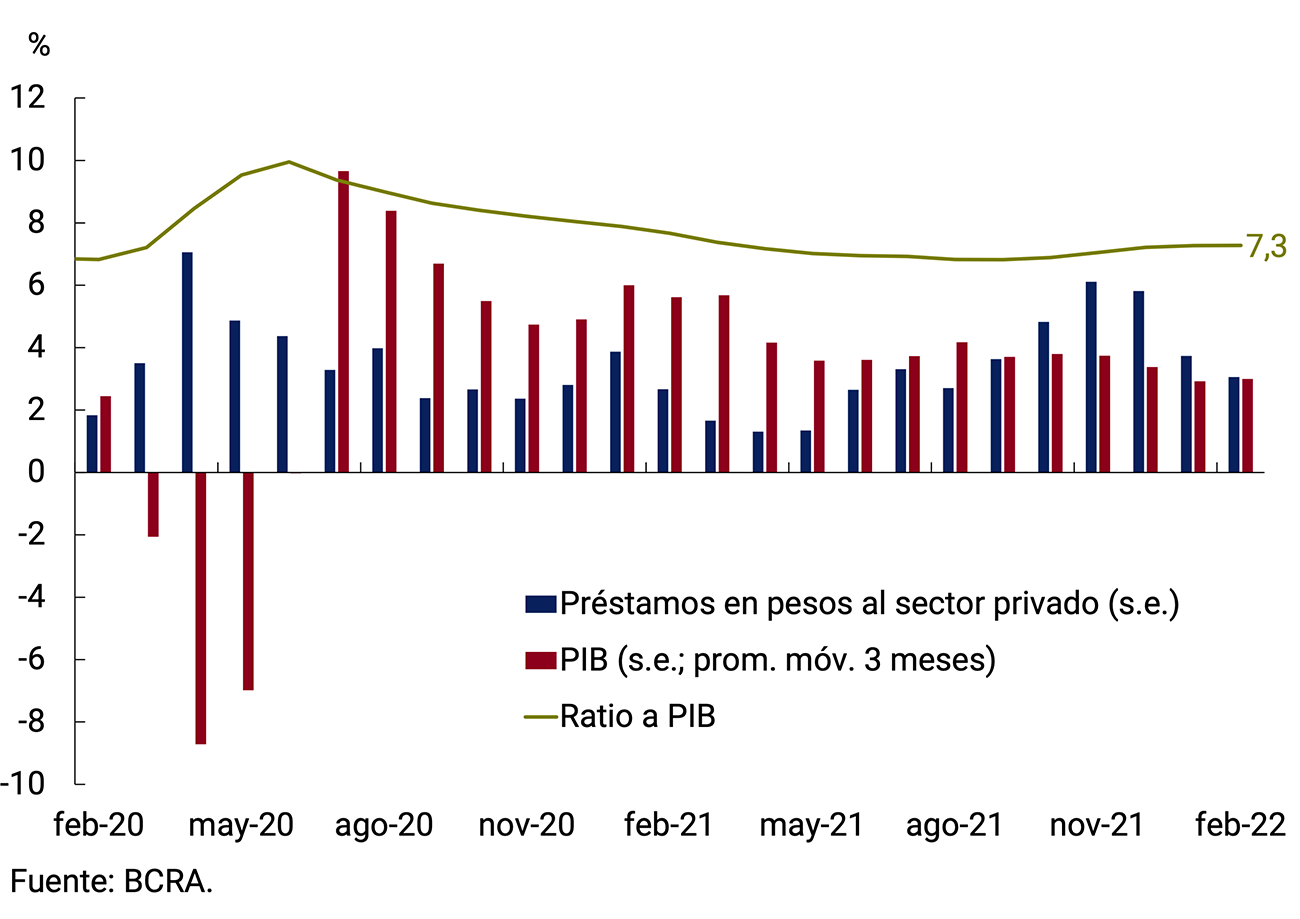
Hand in hand with the recovery of economic activity, loans in pesos to the private sector grew again in the last quarter of 2021. Measured in real terms and adjusted for seasonality, they exhibited an average monthly increase of 1.9% in the last quarter, closing the year with a 4.5% year-on-year drop in December 2021. At the component level, practically all credit lines (with the exception of credit card financing) presented positive rates of change at constant prices in the last quarter of 2021. In terms of GDP, bank financing in pesos to the private sector amounted to 7.2% in December, 0.5 p.p. above the value recorded in September and 0.5 p.p. lower than the figure recorded a year ago (see Figure 7.6). In January and February 2022, the balance of loans in pesos to the non-financial private sector, adjusted for seasonality and at constant prices, remained relatively stable, registering a slightly negative average monthly rate of change (-0.5% s.e.) and persisting at around 7.3% in GDP terms.
The greatest boost to credit came from commercial lines, in line with the higher levels of economic activity. Commercial loans grew at constant prices and without seasonality at an average monthly rate of 3.7% in the fourth quarter of 2021 and were 4.3% below the record of a year ago in December. In the first two months of 2022, the average growth rate of these lines fell to 1.3% s.e. at constant prices. Within these financings, the lines instrumented through documents were once again the most dynamic, with single-signature documents standing out in recent months (which have a longer average term than discounted documents). Indeed, the former exhibited an average monthly increase at constant prices of 4.9% s.e. in the quarter and 3.6% in the first two months of 2022. Meanwhile, the average monthly real expansion rate of discounted documents was 2.7% s.e. at the end of 2021, while in the first two months of the year they maintained their stable balance. On the other hand, current account advances also grew at a good pace, exhibiting an average monthly growth rate of 3.3% s.e. at constant prices in the quarter and closed the year 9.4% below the December 2020 record. While in the first two months of 2022 the advances remained practically unchanged. When we analyze the composition of commercial loans by type of debtor, it can be seen that both financing to MSMEs and to large companies explain the growth (see Figure 7.7).
Figure 7.7 | Estimated balance of commercial loans to the private sector by type of obligor

The demand for commercial credit was channeled largely through the Financing Line for Productive Investment (LFIP) to MSMEs. Thus, at the end of February, loans granted under the LFIP accumulated disbursements of approximately $1.5 billion since its inception (see Figure 7.8). This implied an increase of 45% compared to the record at the end of September. It is worth mentioning that during the first two months of 2022, disbursements of more than $240 million were accumulated, amounting to the total of $1,743 million in February of the current year. By the end of 2021, almost 210 thousand companies had accessed loans under the LFIP and this number rose to 220 thousand at the end of February. Regarding the destinations of these funds, approximately 84% of the total disbursed corresponds to the financing of working capital and the rest to the line that finances investment projects. It should be noted that, in line with the increase in reference interest rates that was ordered at the beginning of 2022, the BCRA decided to increase the maximum interest rate for working capital financing from 35% n.a. to 41% n.a., keeping the interest rate for financing investment projects unchanged at 30% n.a.
Figure 7.8 | Financing granted through the Productive Investment Financing Line (LFIP)
Accumulated amounts
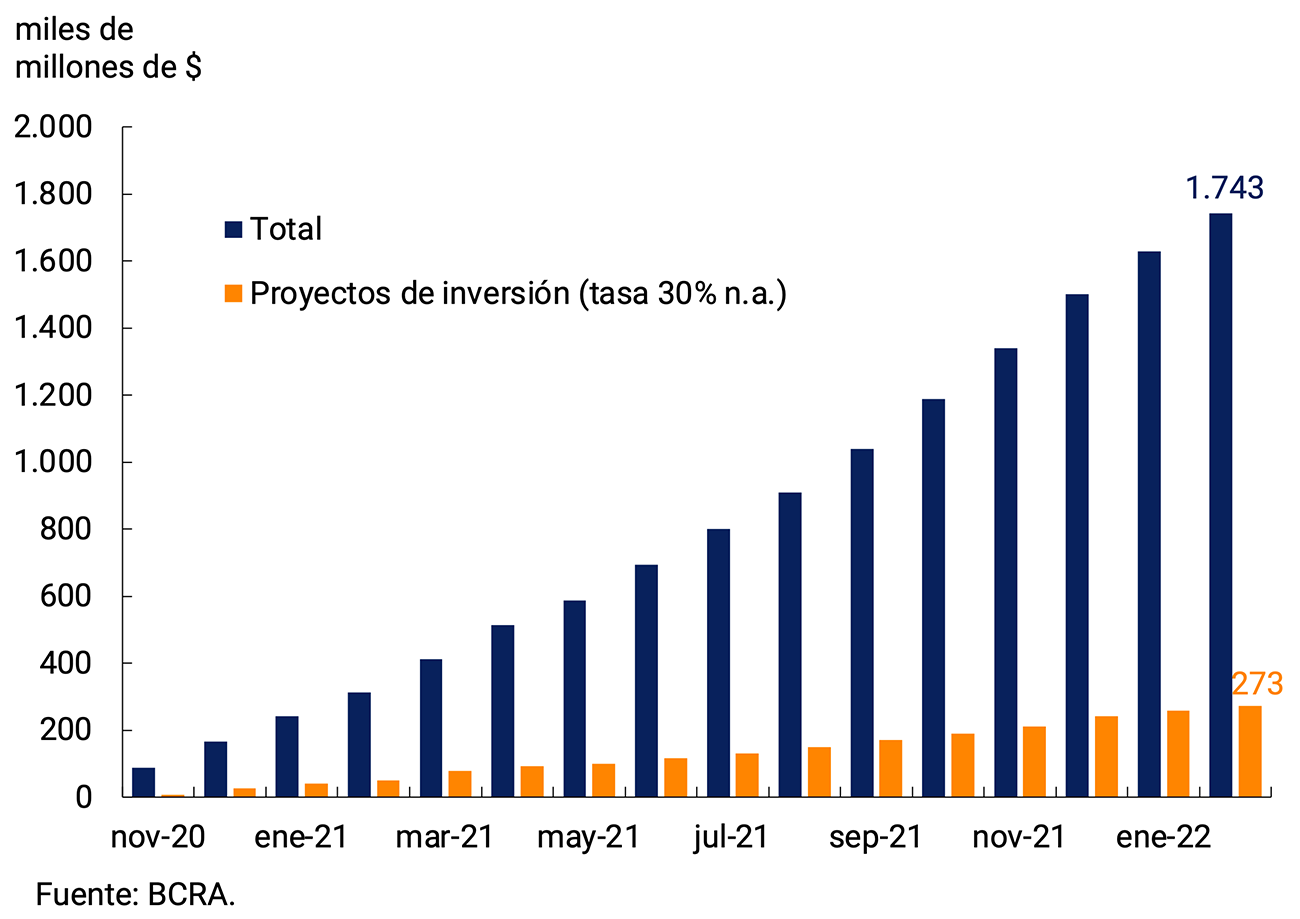
Among loans associated with consumption, financing granted through credit cards maintained its balance stable in the fourth quarter. However, its behavior was not homogeneous throughout the period, exhibiting an increase in October and a contraction in November and December. Thus, they ended 2021 with a contraction of 8.8% YoY at constant prices. Meanwhile, so far in 2022 they presented an average monthly contraction of 2% at constant prices. With regard to the interest rate charged for credit card financing, the BCRA ordered, together with the increase in the rest of the reference rates, an increase of this to 49% n.a. (+7 p.p.). On the other hand, personal loans grew in the last quarter at an average monthly rate without seasonality of 1.2% at constant prices. In this way, they continued with the recovery process that began in the third quarter and after more than three years of contraction. As a result, the balance of personal loans deflated by the evolution of retail prices closed the year at a level 3% lower than at the end of 2021. Meanwhile, so far in 2022 they remained practically unchanged at constant prices. It should be noted that the average interest rate corresponding to personal loans rose in December to 53% n.a.
As for lines with real collateral, collateral loans once again showed the highest growth, exhibiting a sustained expansion in real terms since mid-2020. In the last quarter of 2021, the average monthly rate of increase stood at 4.3% s.e. at constant prices and moderated to 2.5% in the first two months of 2022. Thus, as of February, they presented a year-on-year expansion rate of 45.7% at constant prices. For its part, the balance of mortgage loans remained unchanged in real terms and without seasonality in the last quarter of the year and with a slight drop so far this year. In year-on-year terms, they presented a contraction of 13.2% in February 2022.
7.1.5. Exchange rate policy continued to be adapted to meet the needs of the situation
The exchange rate policy carried out by the BCRA in 2021 sought to promote an efficient allocation of foreign currency and adapt the rate of depreciation of the currency according to the needs of the situation.
Within the managed floating strategy followed by the BCRA, the crawling speed of the nominal exchange rate was adapted to the anti-inflationary strategy. The last quarter of 2021 experienced weeks of greater financial volatility associated with the uncertainty related to the electoral process. In response, the monetary authority recalibrated its intervention in spot and forward exchange markets, and adapted regulation to preserve exchange rate stability and promote efficient foreign currency allocation. Once the electoral process has concluded, the BCRA has resumed an exchange rate dynamic in accordance with the medium-term guidelines proposed at the beginning of the administration in 2020. Indeed, the pace of depreciation gradually accelerated to levels more consistent with the domestic inflation rate, without losing sight of the effect of higher international inflation on the real exchange rate (see Figure 7.9).
Figure 7.9 | Monthly change in the nominal exchange rate
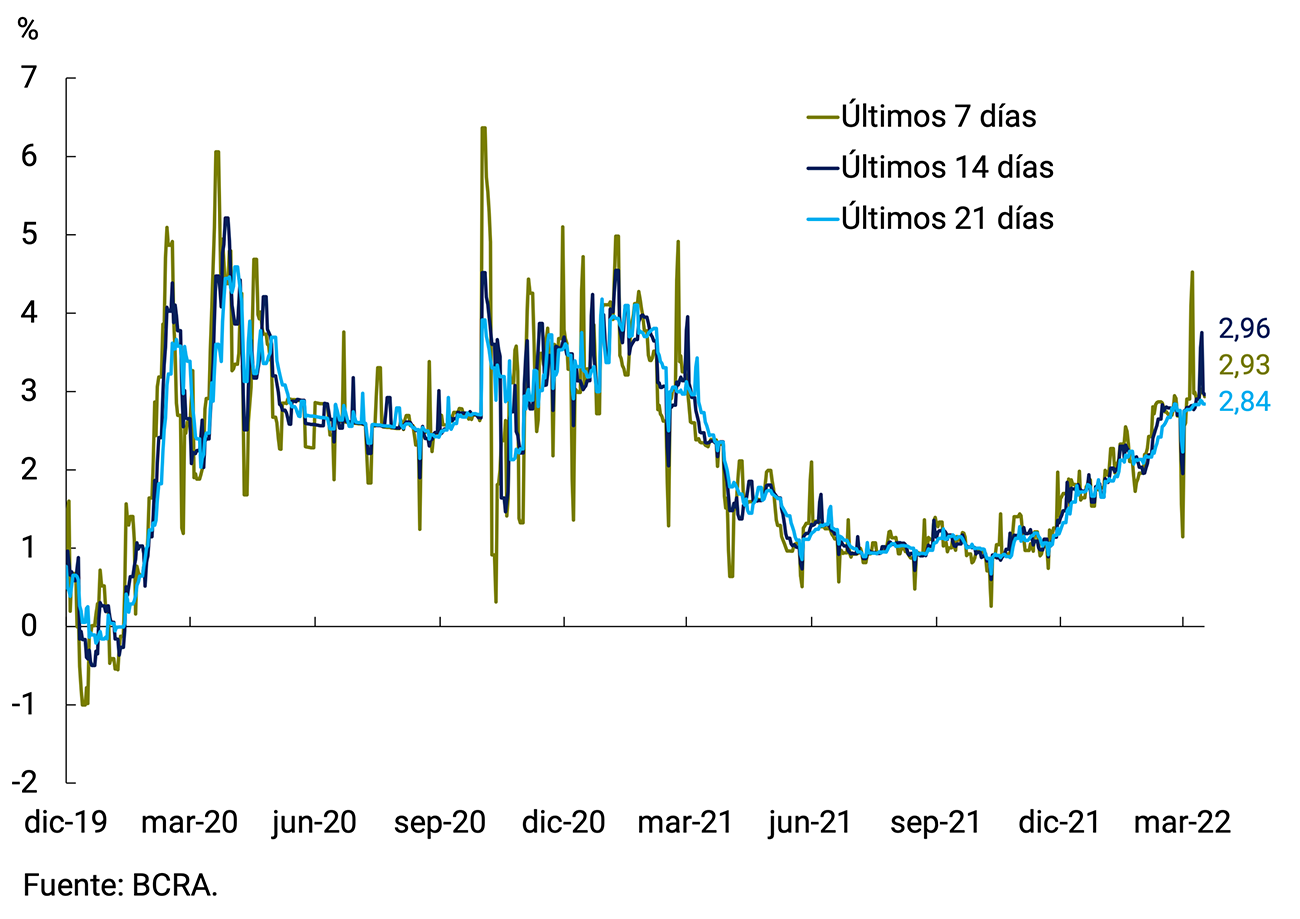
The limited dynamism of the nominal exchange rate, added to the evolution of emerging currencies against the dollar, contributed to a real appreciation of the peso. Despite this, the Multilateral Real Exchange Rate Index (ITCRM) remained at competitive levels throughout the year, compatible with the average of the last 24 years, and in a context of external sector surpluses.
Among the regulatory modifications that took place in the last quarter of the year, it was provided that financial institutions maintain until the end of November a net global position in foreign currency that does not exceed the minimum between the cash position of November 4 and the monthly average of daily balances recorded in October 2021. without considering the securities issued by residents that have been imputed there51. As of December, it was established that entities must have a neutral spot exchange position in foreign currency52. It should be noted that these regulations have no impact on dollar deposits in the financial system or on the assets that support them.
In addition, the possibility for credit card issuers to finance the purchase of tickets abroad and other tourist services abroad through installmentswas eliminated 53. In addition, with the aim of increasing the production and efficiency of various MSMEs, the conditions for automatic access to the foreign exchange market for imports of capital goods were made more flexible54. In the same vein, taking into consideration the particular characteristics of large investments, which need to have a period of maturation and financing that makes their effective implementation possible, Decree 836/2021 was regulated, which provided better conditions for access to the foreign exchange market for companies that make investments aimed at expanding the country’s export capacity55.
In December, the provisions that expired at the end of the year on the payment of imports of goods and refinancing of debt securities in foreign currency and other financial liabilities were extended for six months. Likewise, the mechanism of availability of foreign currency provided for exporters who register increases in their exports in 2022 compared to the previous year was maintained. Finally, the limit amount and the uses allowed with respect to the cancellation of commercial debts with new financial indebtedness abroad were expanded to facilitate the renegotiation of the private sector’s liabilities56.
At the beginning of 2022, new regulatory modifications took place in foreign exchange matters. On the one hand, it was exempted from requiring the prior approval of the BCRA to access the foreign exchange market for demand payments or commercial debts without a customs entry record for the importation of inputs used for the manufacture of goods in the country57. Likewise, the conditions of access to the foreign exchange market applicable to import payments, prior approval to make payments of foreign financial debts with related creditors and the rules on the refinancing of external liabilities were extended until the end of the year. On the other hand, a classification of importers was established according to certain parameters of demand for foreign currency, to determine whether they will have rapid access to the foreign exchange market or must have financing from abroad. These measures seek to continue prioritizing the use of foreign currency in order to maximize its social and economic impact, seeking to accumulate international reserves to strengthen monetary and exchange rate policy58.
International reserves ended 2021 with a balance of US$39,662 million, which implied an increase of US$275 million compared to December 31, 2020. However, the relative stability observed when comparing the year between peaks hides a dynamic throughout the year that reflected the seasonal patterns of the process of accumulation of international reserves. At the component level, in 2021 the net purchase of foreign currency in the foreign exchange market for a total of US$5,049 million stood out, a value similar to that of 2014 and among the highest since 2012. So far in 2022, international reserves have accumulated a fall of US$2,623 million, which was mainly explained by payments to the International Monetary Fund (IMF) of US$1,081 million and other debt payments (see Figure 7.10).
Figure 7.10 | Net purchase of foreign currency by the BCRA
Accumulated in the year
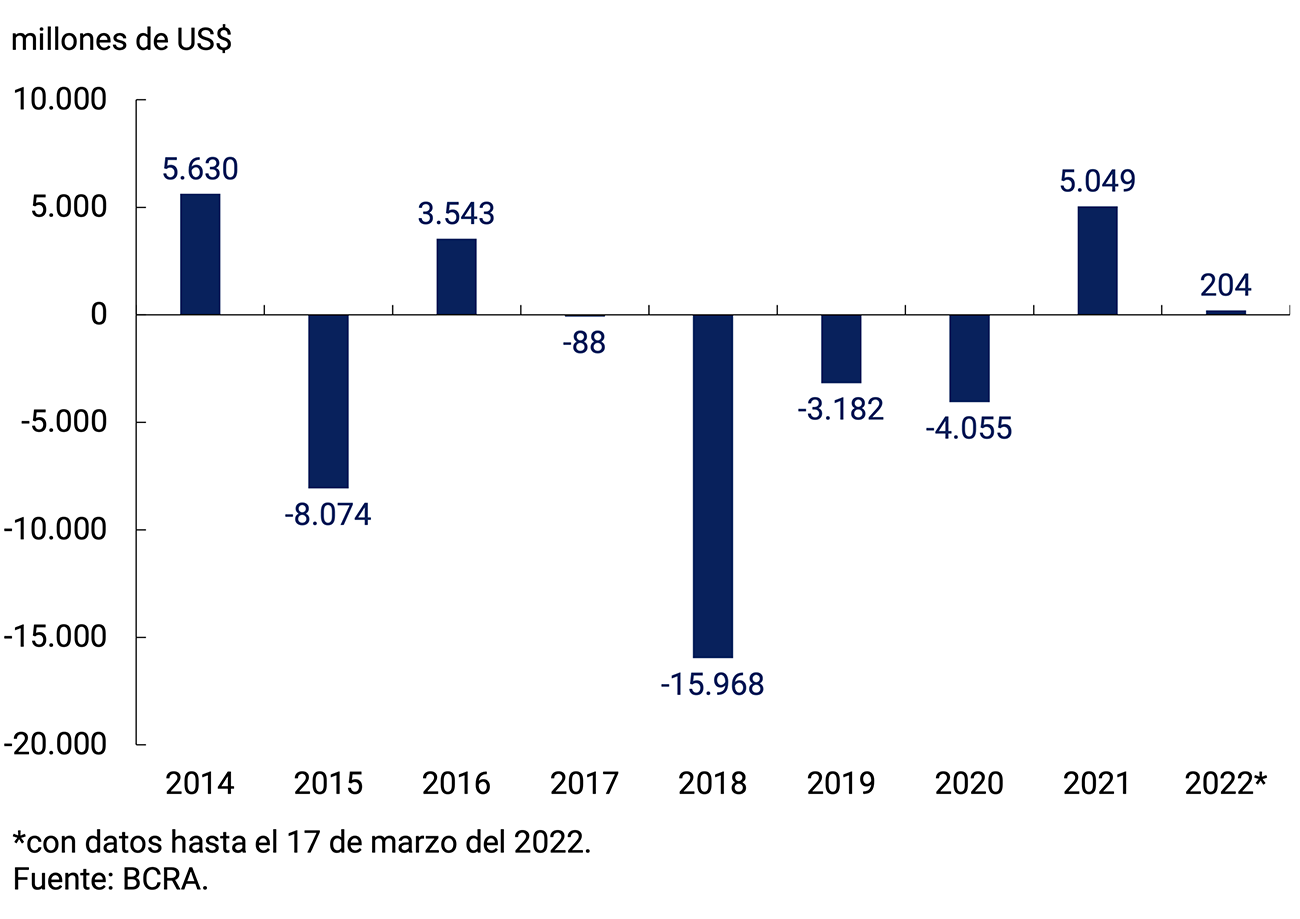
7.2. Monetary policy outlook for 2022
Throughout 2022, it is estimated that activity will continue to strengthen, supported by greater vaccination coverage with complete schemes of the population, and by the stimulus policies implemented by the National Government and the BCRA. In order to continue supporting the recovery of economic activity, the BCRA will continue to stimulate credit intermediation, particularly that linked to productive development, which continues to be at very low relative levels. Financial assistance efforts to the sectors most affected by the pandemic will continue to be reduced as these sectors consolidate their recovery process.
At the same time, the transitory factors that pressured the general price level are expected to subside and inflation is expected to resume a path of gradual and sustained deceleration. The stabilization of the real exchange rate at its current level, which preserves the external competitiveness of the economy, and the calibration of interest rates to reflect developments in inflationary matters, in order to guarantee a positive return on investments in local currency, will contribute to stabilizing expectations, favoring the disinflation process. This is in addition to the efforts of the National Government to coordinate prices and wages through income policy, in order to mitigate the high inflationary inertia.
In turn, the BCRA will continue to calibrate the liquidity of the economy, sterilizing any surpluses, to help preserve monetary balance. It should be noted that 2021 closed with an expansion of the Monetary Base of 40.0% YoY, which implied a contraction in real terms, and with a level of remunerated liabilities of around 9.7% of GDP. Although the rise in interest rates will impact the cost of sterilization, it is estimated that it will be relatively limited. Even considering this effect, in a context of lower sterilization needs, during 2022 interest-bearing liabilities will be reduced in terms of GDP.
With regard to the foreign exchange market, the BCRA will continue to prudently manage the current regulatory framework, adapting it to the needs of the situation, in order to preserve monetary and exchange rate stability. To the extent that macroeconomic conditions allow, regulations will be relaxed, with the aim of maintaining in the medium and long term a set of macroprudential regulations compatible with the dynamization of capital flows oriented to the real economy. Likewise, the rate of depreciation of the domestic currency will be adjusted in order to stabilize the real exchange rate, with the aim of maintaining the external competitiveness of the economy and promoting the accumulation of international reserves, based on the genuine income of foreign currency from the external sector.
Recently, the National Government announced an agreement with the IMF at the technical level. This includes a loan for US$44,500 million to cover the payments of the Stand-By Agreement (SBA) signed in 2018 with the IMF (see Section 4 / The Extended Facilities Agreement). The current program was set as an Extended Fund Facility (EFF) that contemplates that repayments begin to be made from the middle of the fourth year after the signing of the agreement and extend until the tenth year. Disbursements of the funds will be made under the following schedule: an initial disbursement with the signing of the agreement and quarterly disbursements with the various revisions. The macroeconomic policy scheme stipulates a gradual reduction in the primary deficit59. Despite the latter, it was agreed that public spending will maintain growth in real terms, with the aim of not negatively affecting the ongoing GDP recovery process. Monetary assistance to the Treasury will follow a downward trajectory in terms of GDP, with zero expected by 2024. With regard to interest rates, it was stated that the BCRA, in line with the Objectives and Plans presented for the year, will seek to maintain the benchmark interest rate at a level that allows safeguarding the real value of Argentines’ savings. On the external front, it was agreed to maintain the rate of depreciation of the domestic currency at a level that would preserve the value of the real exchange rate and advance in the process of accumulating International Reserves. The aforementioned policies, together with the measures to coordinate prices and wages, would gradually reduce the rate of domestic inflation. On the other hand, after the agreement, it would be expected to verify some improvement in the expectations of those actors who conditioned their vision of the sustainability of the external sector to the result of said negotiation, helping to contain exchange rate pressures and inflation expectations.
In the medium term, sustained growth in economic activity and a moderation in the inflation rate will lead to greater demand for real money balances. After two years in which the Central Bank exceptionally assisted the Treasury to face the needs arising from dealing with the pandemic, without access to external financing and with a domestic capital market in reconstruction, the progress made by the National Government in the normalization of the peso debt market and the prospects for external financing by multilateral and bilateral organizations pose a scenario with a reduction in the of financial assistance to the Treasury. In this new stage, it is expected that the monetary sterilization effort will be reduced. This will favor the demand for the monetary base to be provided by the interest associated with the BCRA’s interest-bearing liabilities and, potentially, by a reduction in its stock. However, the BCRA will maintain a prudent administration of monetary aggregates, sterilizing any surplus liquidity, in order to preserve monetary balance.
Section 1 / Decomposition of the short-term dynamics of inflation in Latin America
During 2021, inflation has once again been put in the focus of economic policymakers at the global level. Throughout history, our region has been characterized by recurrent intervals and episodes of high inflation and hyperinflation, which were treated with various stabilization instruments and programs. The objective of this section is to document a series of stylized facts that are useful for discussions on determinants and mechanisms of inflationary processes in Latin America.
Following the same methodology to decompose the observed short-term dynamics of year-on-year inflation that was presented in Section 7 of the IPOM of November 2020 for the Argentine case, the analysis is extended to Brazil, Chile, Colombia and Mexico during the period 2004-20192.
The analysis focuses on the evolution of the Consumer Price Index in its Core or Core version. It is related to variables that can be associated with different theories and analyses of inflation and that will represent the different terms of the decomposition: the nominal exchange rate, wages, activity, the quantity of money, the interest rate, and international energy and food prices. The relationship between these variables is studied from two complementary perspectives. The first captures the average behavior between the variables over long periods of time, characterizing cointegration relationships. In the second, which studies short-term relationships, the evolution of inflation over 12 months is broken down by the contribution of the various variables in the period, also studying the role of persistence and analyzing which are the variables that adjust to the deviations of long-term relationships. This section will show the results of the latter, for the aforementioned four countries and will propose general conclusions on the decomposition of inflation in these Latin American economies.
Decomposition of Year-on-Year Inflation
A methodology is postulated that allows the observed short-term dynamics of year-on-year inflation to be broken down into two types of components. The first is related to the “news” or “surprises” that each of the determinants provides during the 12-month period in question. “Surprises” are defined as the part of the observed change in the determinants that cannot be anticipated given the past behavior of the variables. On the other hand, the second component is associated with different sources of persistence (i.e. the influence of the different variables with lagging effect). This in turn is divided into three parts: one of self-persistence or autonomous (i.e., how past inflation records affect the contemporary movement of inflation); another with the contribution of the lagging values of the rest of the determinants, and finally that of the dynamics generated by the adjustments to the deviations of long-term relationships in the past3.
The exercise is based on the analysis of two graphs. The first shows a black line with the evolution of inflation observed in the sample, a red line with the inflation implied by the set of persistence components and a set of bars indicating the contribution of each of the three components. The second graph shows the contemporary component and a set of bars that represent the contribution of the “news” of the determinants: Wage, Exchange, Monetary (the sum of the influence of “news” on real balances and the interest rate), Activity, External (the influence of international prices), and Residual.
Brazil
The first graph shows the importance of the autonomous persistence component, although there is also a non-trivial contribution of the lagging components of the other determinants. In the period of rising inflation from 2013 to 2016, adjustments to deviations from long-term relationships played an important role. Finally, both in the final stage and in 2015 until mid-2016, contemporary components played a non-trivial role.
Graph 1 | Historical decomposition for Brazil: Main
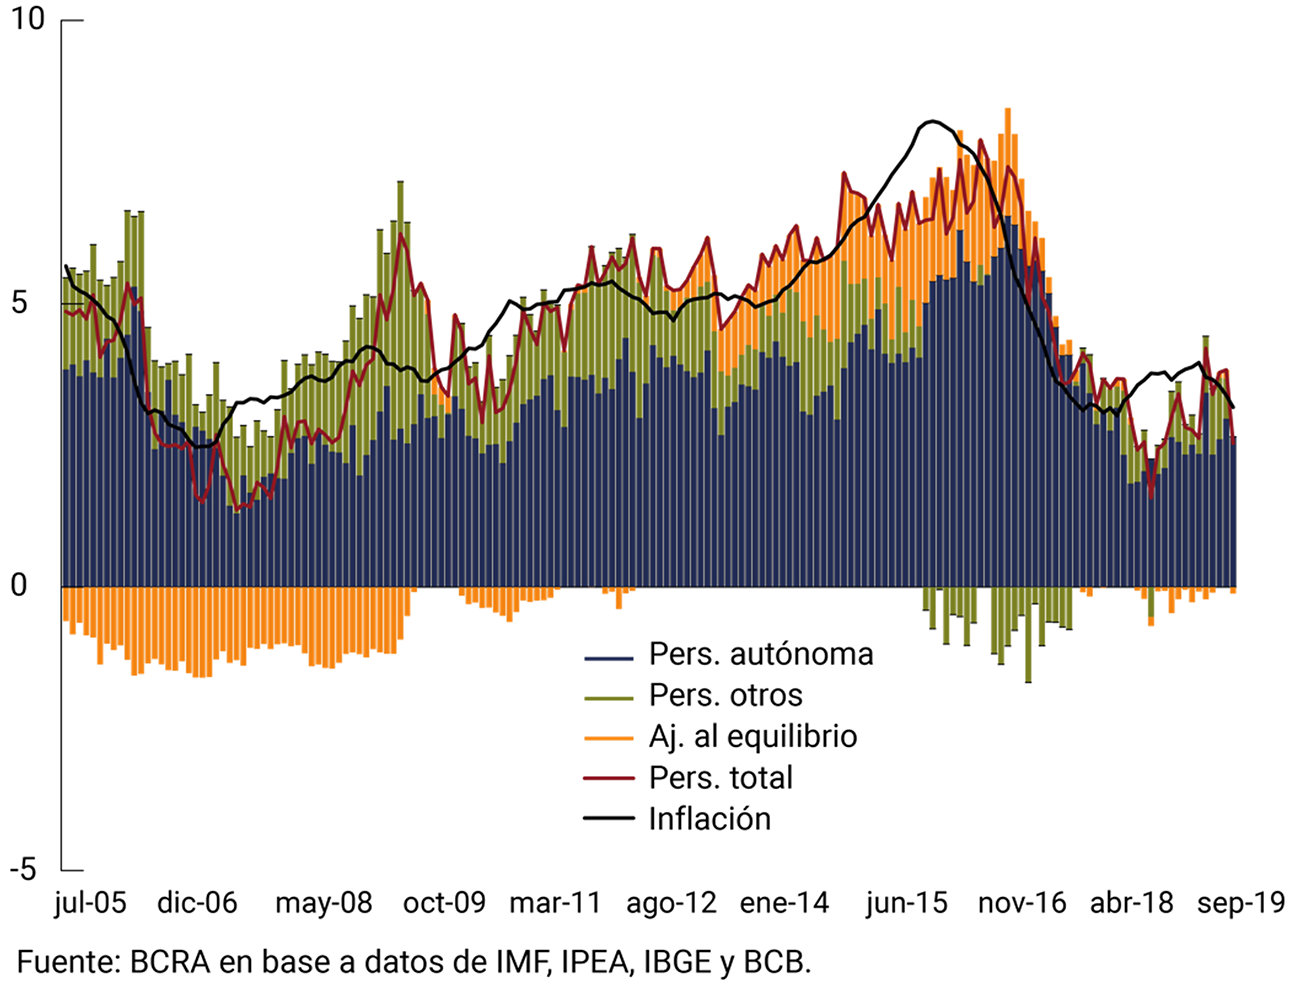
In the case of contemporary determinants, the second graph indicates that the exchange rate plays a more preponderant role in the case of Brazil. External factors also played a non-trivial role in pushing inflation higher in the first part of the sample, while helping to contain inflation during the high records of 2015 and 2016.
Graph 2 | Historical Decomposition for Brazil: Contemporary Effect
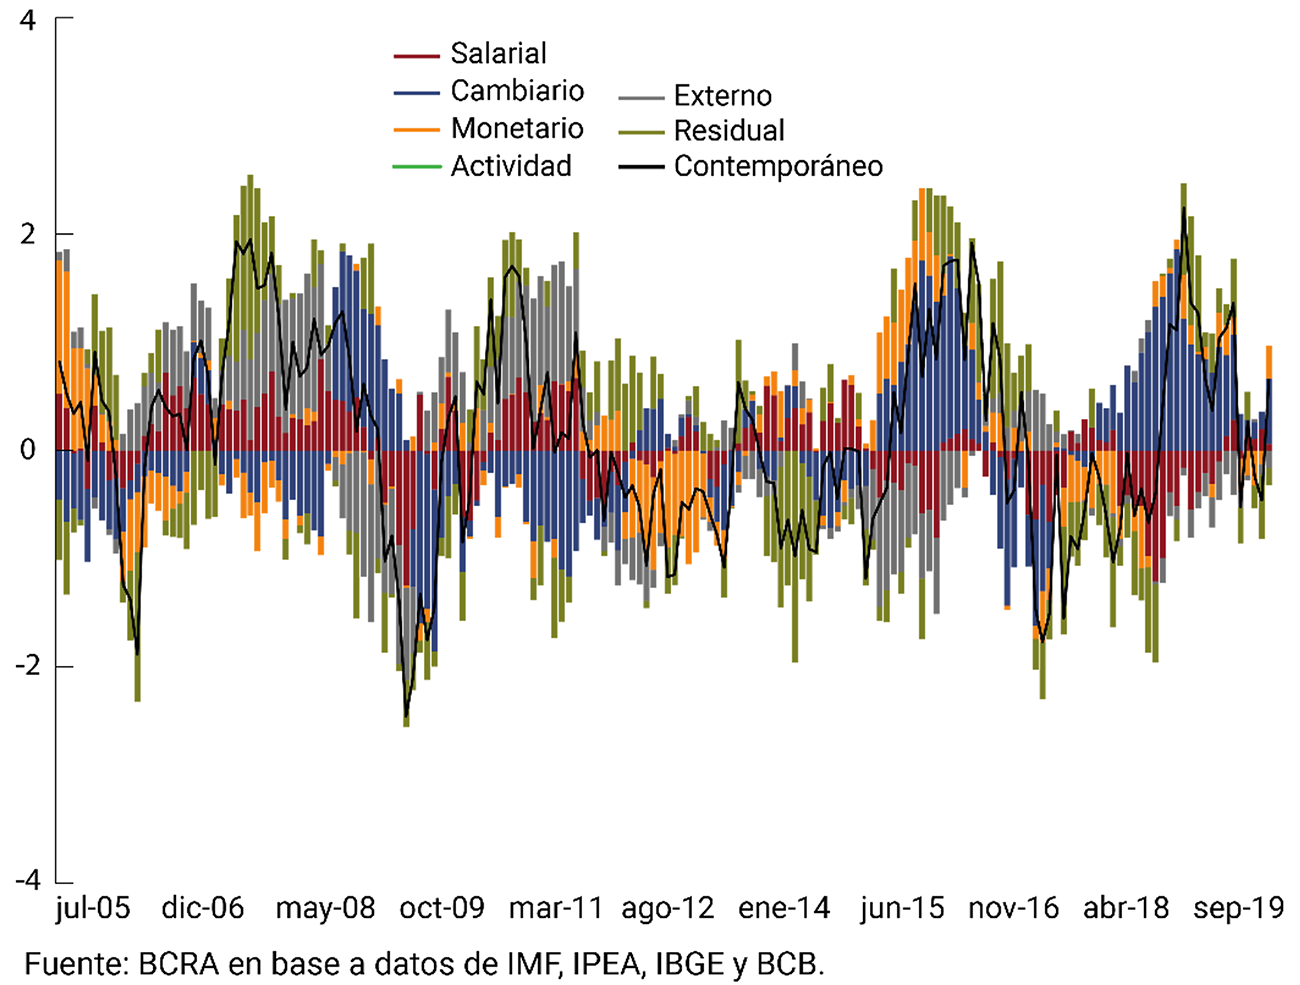
Chile
From the first figure, it emerges that the lagging influence of the different determinants largely explains the evolution of inflation. There is also an almost zero role of autonomous persistence, and a moderate contribution of adjustments to the deviations of long-term relationships.
Graph 3 | Historical decomposition for Chile: Main
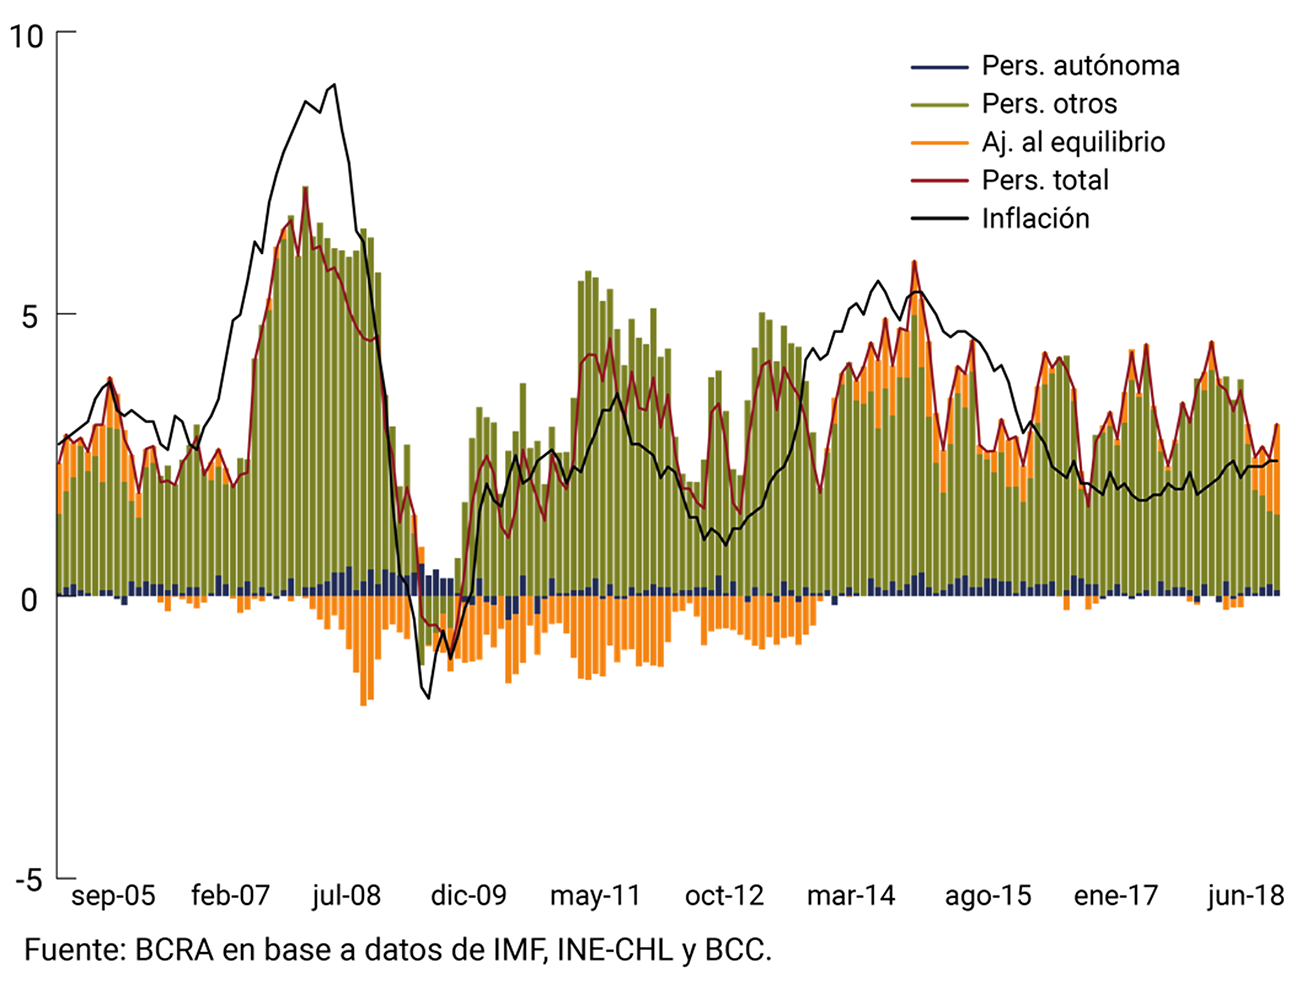
The contemporary “news” component was relevant for the period of rising inflation prior to the Global Financial Crisis, and also for 2014 and 2015, as seen in the second chart. In the first case, the pressure of external prices and wage developments pushed inflation upwards, with a positive contribution (although somewhat later) from the output gap. At the beginning of 2014, there was evidence of a positive contribution from wage dynamics, as well as a positive contribution from exchange rate “news” at the beginning of that stage, and also in the second part of 2015.
Figure 4 | Historical decomposition for Chile: Contemporary effect
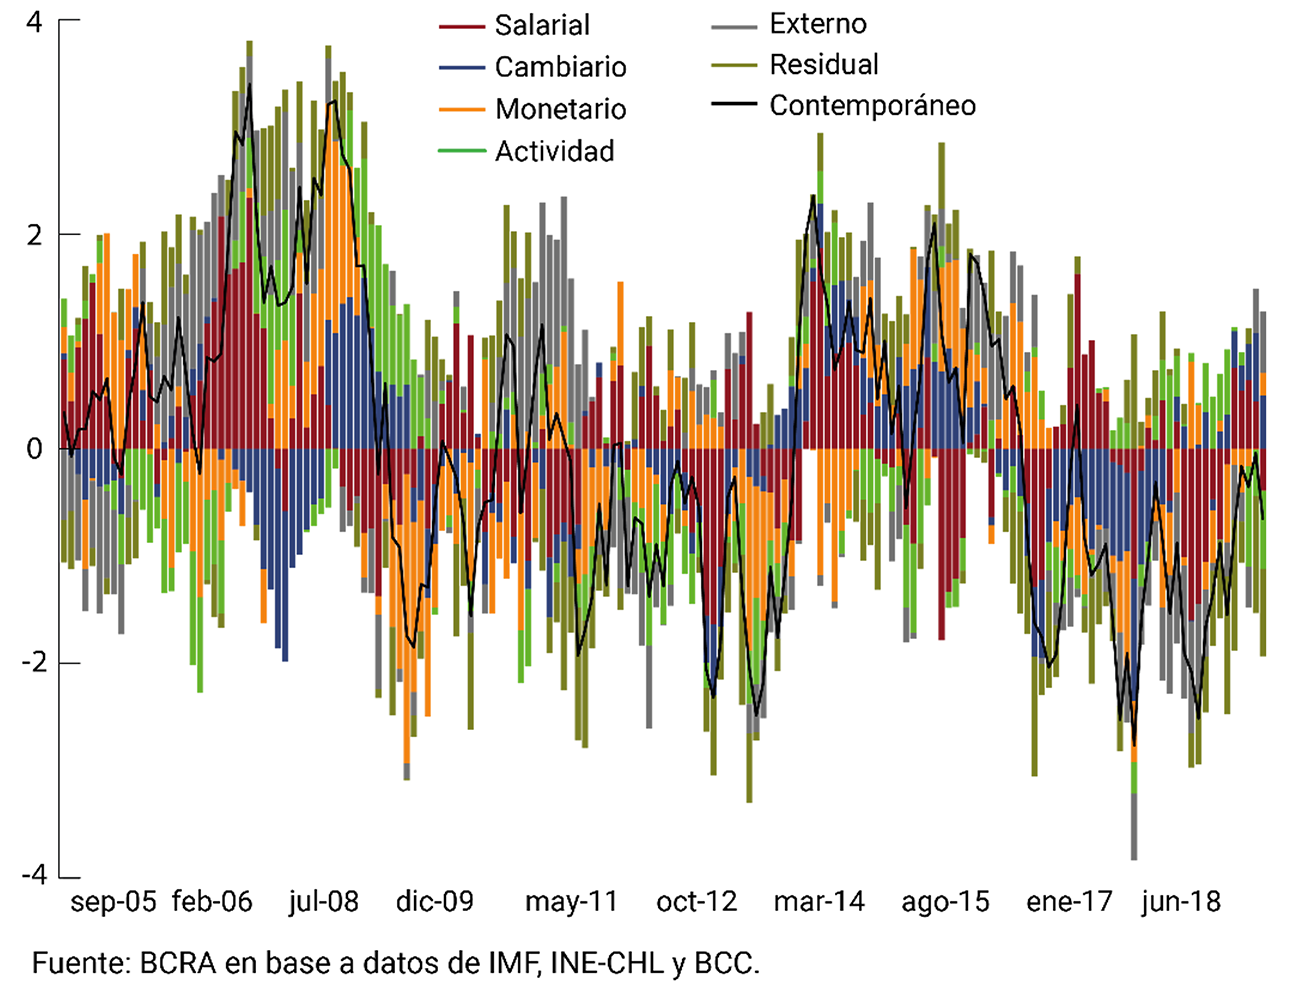
In the last three years of the sample, contemporary “surprises” have tended to reduce inflation, basically due to exchange rate dynamics until mid-2018, and then due to wage dynamics and external prices.
Colombia
For this country, autonomous persistence and the persistence of the other determinants have a more even contribution; with a somewhat greater contribution from the latter.
Graph 5 | Historical decomposition for Colombia: Main
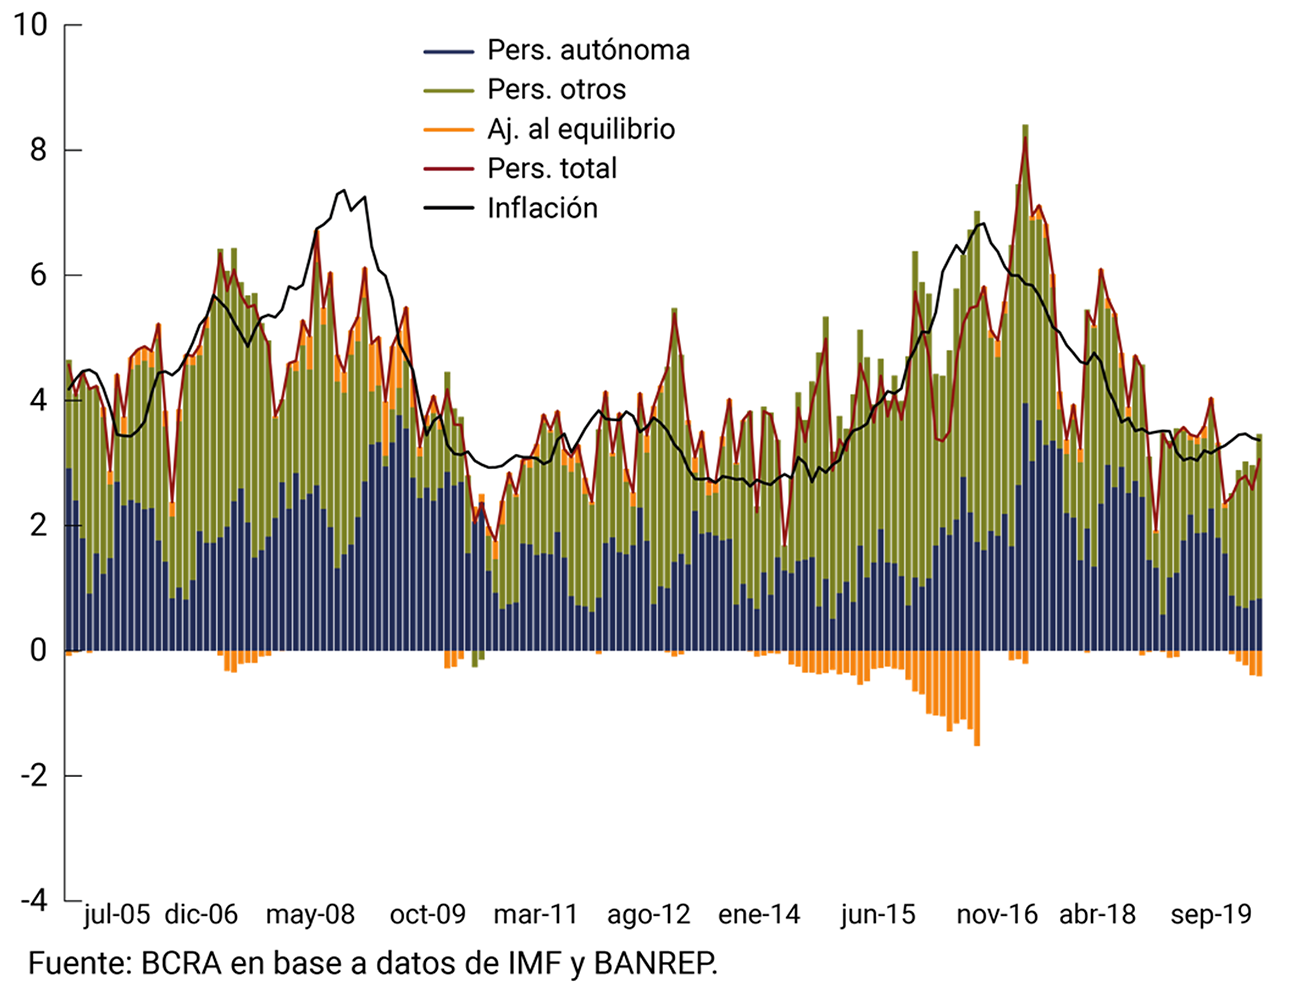
The contemporary component had a positive contribution in the high records between 2008 and 2009, and also from mid-2015 to the end of 2016. In these episodes, the “news” related to the variables of activity and monetary had the greatest contribution.
Graph 6 | Historical decomposition for Colombia: Contemporary effect
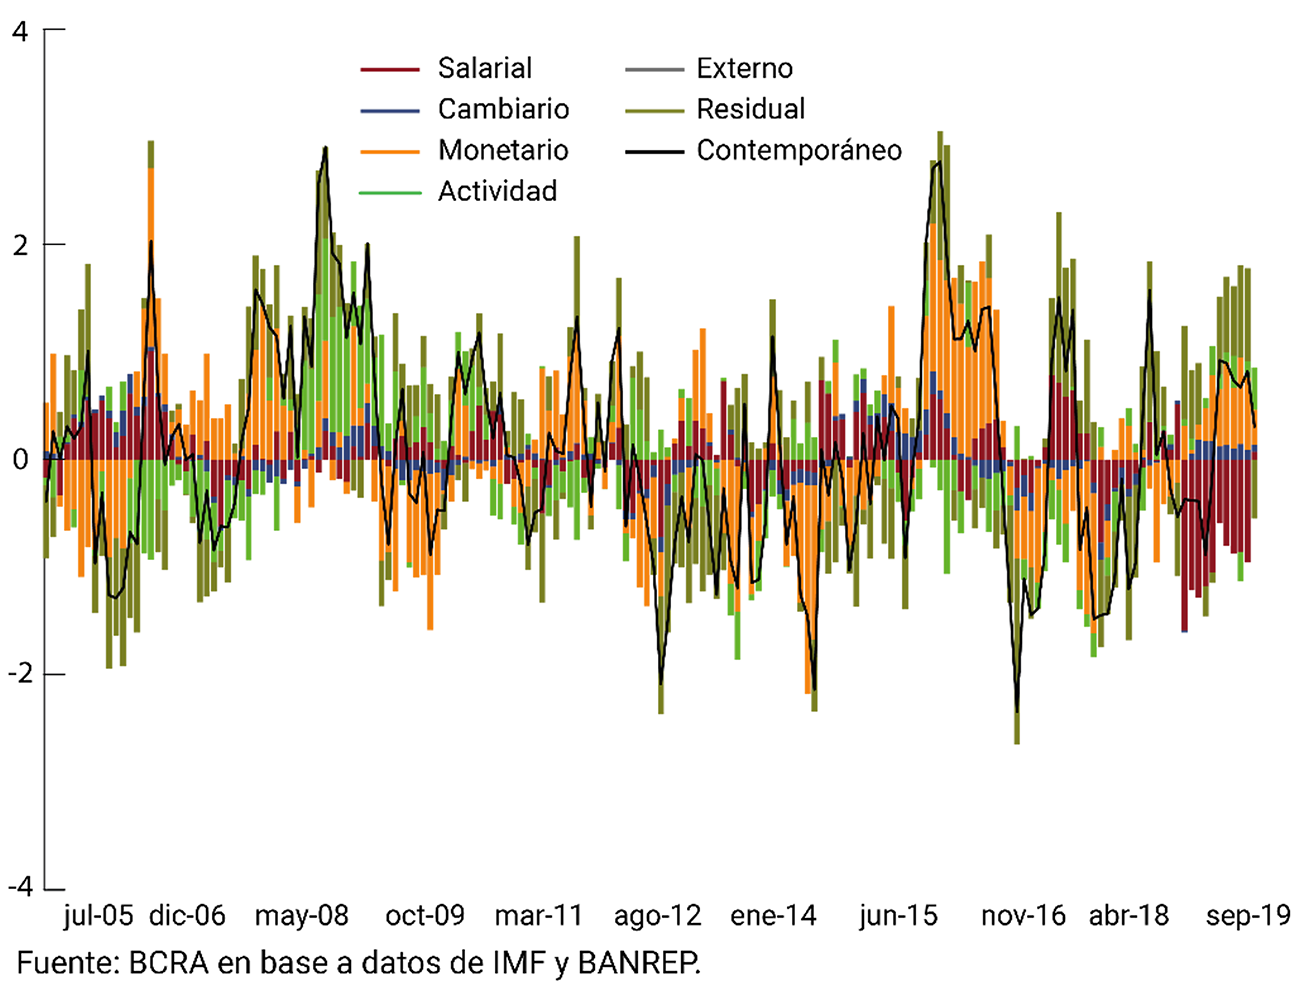
Mexico
The autonomous persistence component plays a preponderant role; although to a lesser extent than in the case of Brazil.
Figure 7 | Historical decomposition for Mexico: Main
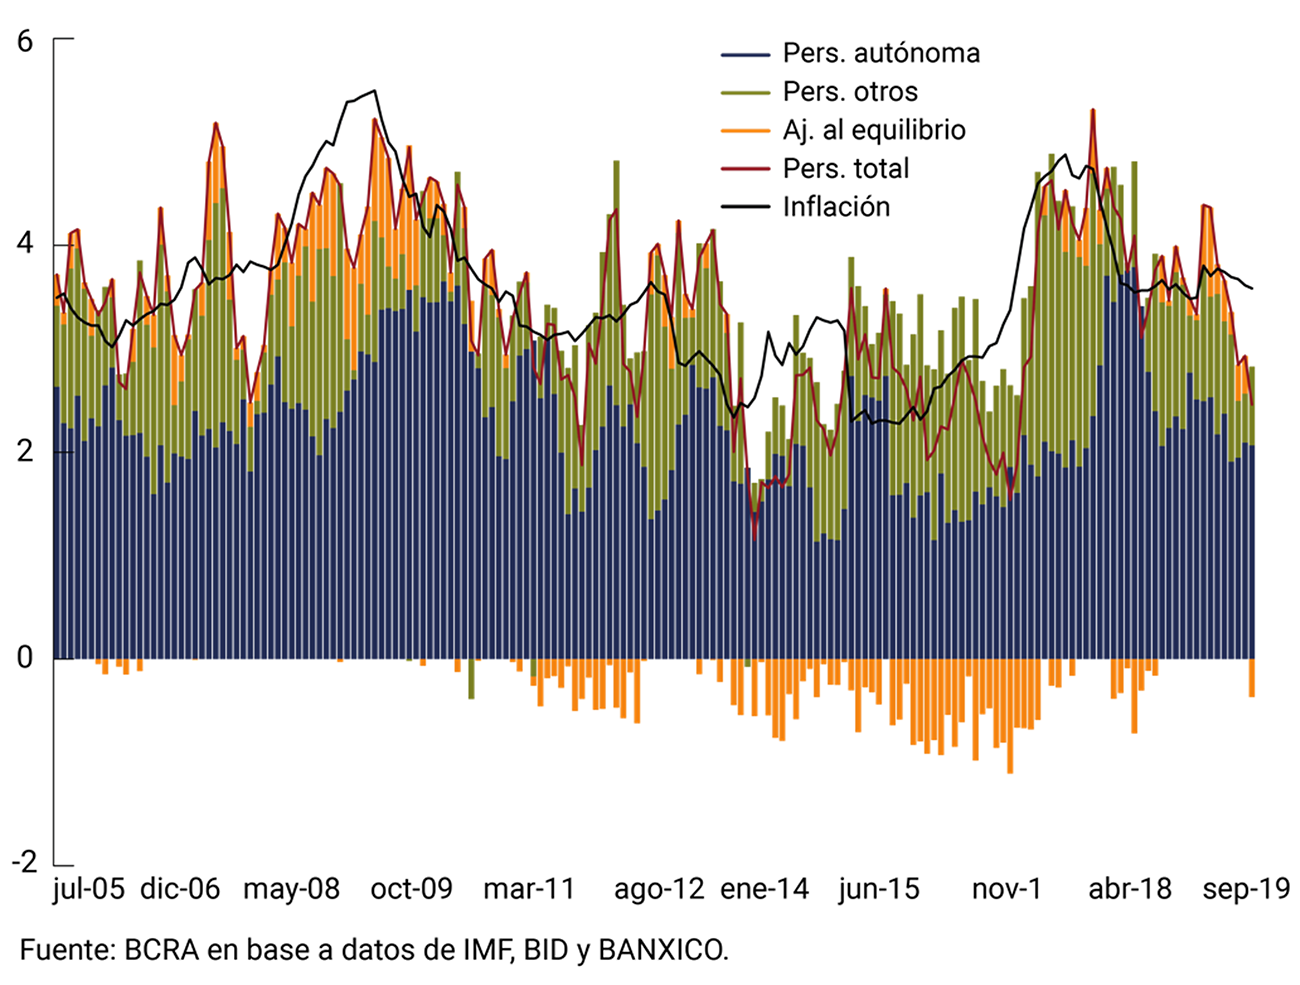
As for the contemporary “surprises”, in the first period of positive contribution (between 2008 and 2009) the main contribution was provided by the activity variables, with a positive contribution from the exchange rate and other monetary variables. At the same time, international prices had a negative contribution in 2009 and in the fall in inflation in 2015. Meanwhile, salary “surprises” had a relevant contribution in the events of 2014, as well as for the records of 2016 and at the end of the sample.
Figure 8 | Historical Decomposition for Mexico: Contemporary Effect
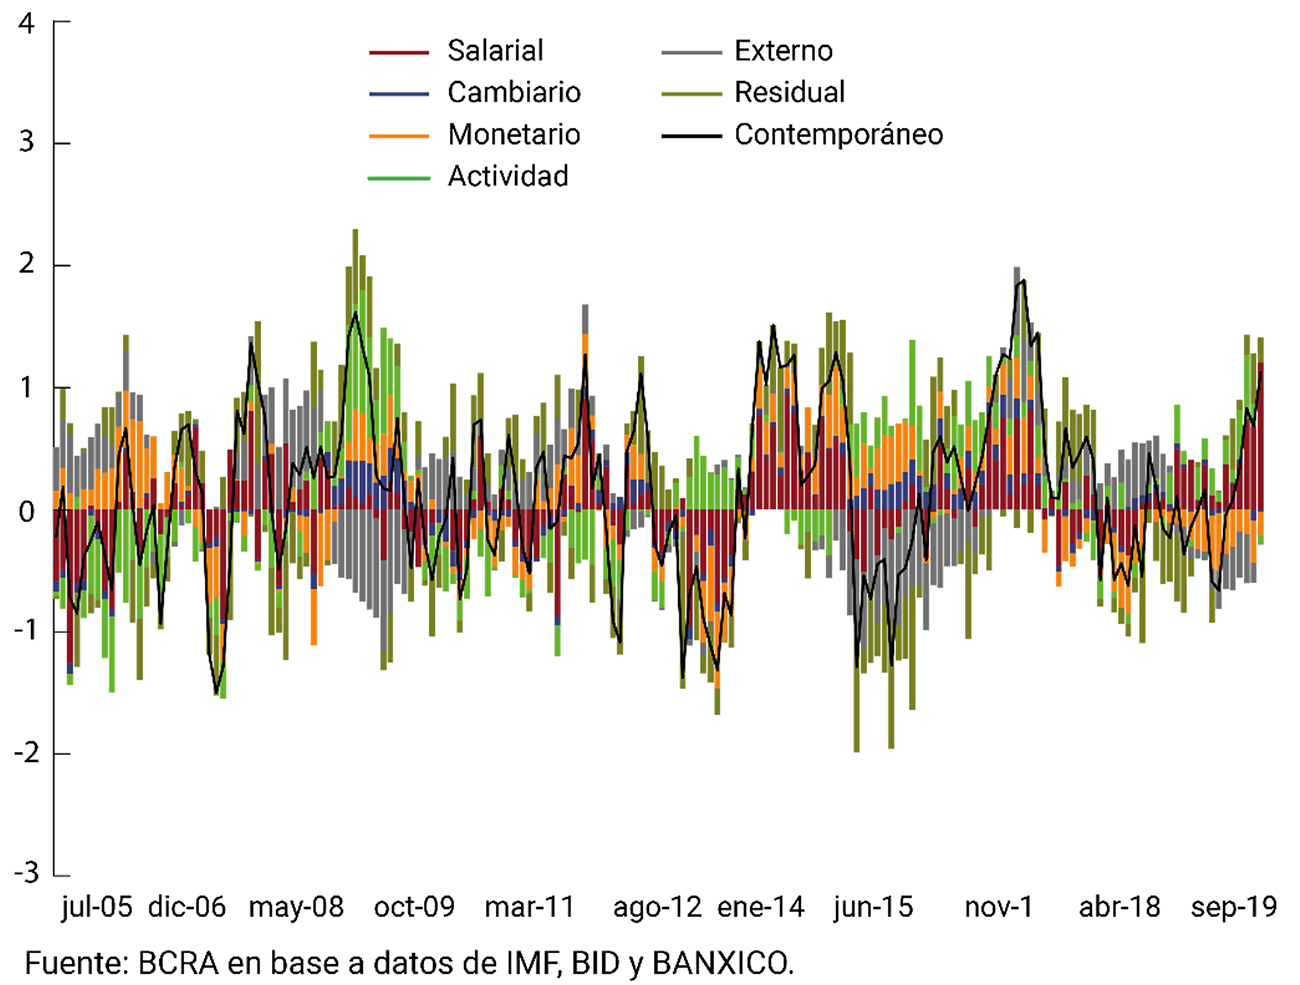
Conclusions
This section presents a variety of empirical regularities that characterize the short-term inflationary dynamics in four Latin American economies (Brazil, Chile, Colombia, and Mexico), in the period 2004 to 2019. The results indicate a preponderant role of the autonomous persistence of inflation for Brazil and, to a lesser extent, for Mexico. This implies that, for these countries, each inflationary surprise recorded feeds back into a more persistent process, influencing subsequent inflationary records. In the case of Colombia, autonomous persistence and the persistence of the other determinants have a more equal contribution. While in the case of Chile, autonomous persistence is almost nil, with the dynamics being mainly influenced by lagging values of the other determinants. Finally, the main differences between countries can be seen when studying the contemporary influence of the different determinants. The exchange rate dynamics mainly influence Brazil with contributions in Chile and Mexico. Wage dynamics are very relevant in Chile and Mexico, while the evolution of activity is very relevant in the case of Colombia. For some specific episodes, international prices have played a role in Brazil, Chile and Mexico, while monetary variables have had a mostly limited influence in all countries.
References
Central Bank of Chile, 2020. “Dynamics and determinants of inflation in Chile”. Offprint.
Capistrán, C. and M. Ramos-Francia, 2009. “Inflation Dynamics in Latin America”. Contemporary Economic Policy, 27, pp. 349-362. https://doi.org/10.1111/j.1465-7287.2008.00128.x
Cortés Espada, J. F., D. Sámano and R. T. Gutiérrez Villanueva (2019) “Dynamics of Inflation in Mexico: An Analysis of Wavelets”. Banco de México Working Papers No. 2019-17.
Da Costa Benedy, A. S., 2019. “Dissecting Inflation in Brazil”. Repository of the Universidade Nova de Lisboa, School of Business and Economics. Master Degree in Finance. DOI: http://hdl.handle.net/10362/70546
Da Gama Machado, V. and M. S. Portugal, 2013. “Measuring Inflation Persistence in Brazil Using a Multivariate Model”. Banco Central do Brasil Working Paper Series 331.
D’Amato, L., L. Garegani, J.M. Sotes Paladino, 2007. “Inflation persistence and changes in the monetary regime: The argentine case”. BCRA Working Paper 2007-23.
Domínguez, M., Lanzilotta, B., Rego, S., Regueira, P., Rodríguez, S., 2012. “Inflationary Persistence and Wage Pass-through: Diagnosis and Causality.” Working Paper, 11/2012. Center for Economic Research (CINVE).
Fariña, M. M. N., and D. Heymann, 2019. “Effects of devaluations on real wages for different levels of inflation”. University of San Andrés. Department of Economics.
Garayalde, E. G., 2012. “Persistence of inflation in Uruguay”. Working Paper 013-2012, Central Bank of Uruguay.
Graña Colella, S., 2020. “The causes of Argentine inflation: an estimate using the VECM methodology for the period 2003-2019”. FACES, 26(55), 73-86. ISSN 0328-4050.
Montes Rojas, G., 2019. “An evaluation of pass-through in Argentina using impulse response functions of multivariate quantiles”. Estudios Económicos, vol. 36, No. 73.
Pincheira, P., 2008. “The Dynamics of Inflation Persistence in Chile”. Working Papers Central Bank of Chile 505, Central Bank of Chile.
Ramalho, B. B., 2021. “Duas decades of goals for inflation in Brazil: an analysis of inflationary persistence and exchange rate pass”. Universidade Federal de Uberlândia, Instituto de Economia e Relações Internacionais. Dissertation for the Master’s degree in Economics.
Rey García, N., 2020. “The relationship between labor cost and price inflation in Colombia”. Universidad de los Andes, Faculty of Economics. Degree Reports. DOI: http://hdl.handle.net/1992/49228
Rivasplata, A. and P. Castillo, 2017. “Gloable and idiosyncratic factors in the dynamics of inflation in Latin America”. Revista Estudios Económicos (Banco Central de la Reserva del Perú), 34, pp. 9-29.
Rodríguez Pinzón, H. Y., S. Agudelo Galindo, L. Rincón, K. Montañez, 2019. “Imported inflation via exchange rates and its application to the Colombian case through the use of VEC models for the period January 2010 – December 2018”. Comunicaciones en Estadística, 12 (1), pp. 33-52.
Trajtenberg, L., S. Valdecantos, D. Vega, 2015. “The Determinants of Inflation in Latin America: An Empirical Study of the Period 1990-2013,” in Bárcena et al (eds), Productive Structure and Macroeconomic Policy: Heterodox Approaches from Latin America, ECLAC.
Zack, G., M. Montané, M. Kulfas, 2017. “An Approach to the Causes of the Recent Argentine Inflationary Process”. IIEP-UBA Working Paper Series, No. 19.
Zarzosa Valdivia, F., 2020. “Inflation Dynamics in the ABC (Argentina, Brazil and Chile) countries”. Ensayos de Política Económica, vol. III, No. 2, pp. 78-99.
Section 2 / Asynchronies in the labour market
The labor market in Latin America and the Caribbean is still recovering from pre-pandemic levels. In particular, since the second quarter of 2020, the increase in female employment in the region through the creation of informal jobs has been highlighted. In the third quarter of 2021, with dissimilar trends and asynchronies with respect to those of the region, Argentina observed a greater recovery in total employment, but with particular idiosyncratic characteristics. In this way, new trends would begin to emerge that would outline a repositioning of the workforce in terms of age and gender.
According to the International Labor Organization (ILO), in Latin America and the Caribbean there is a process of recovery of the labor market that has not yet reached pre-pandemic levels. In its annual publication, the agency points out an asymmetry between the contractionary phase of employment and the recovery phase: to regenerate the total number of jobs lost in the region during the first two quarters of 2020, more than 5 quarters would be required14. In its 2021 report15 the Economic Commission for Latin America and the Caribbean (ECLAC), shows that the sectors with the highest composition of informal workers were the most affected during the pandemic: “branches of activity with a higher proportion of informal employment, such as commerce, construction, and restaurants and hotels, contracted the most. This meant that in 2020 most countries in the region registered falls in the labor informality rate compared to 2019”16. On the flip side, the recovery of the labor market has also depended to a large extent on informal workers, representing around 70% or more of net job creation. In terms of age, it was young people who suffered the most job losses during the pandemic, but they are also the ones who returned to work more quickly than adults. This is partly explained by their strong insertion within informal employment.
The impacts generated by the health crisis in the region have been substantially greater for women. This phenomenon was verified, between IV-19 and II-20, in a more pronounced drop for female employment (20%) compared to male employment (15.8%). Consequently, during 2021 the recovery of women’s labor supply was more intense than that of men. However, the III-21 had not been able to compensate for the loss of employment recorded by women during the first half of 2020. According to the ILO, between II-20 and III-21, around 25.5 million jobs occupied by men were recovered, a figure similar to the loss of male employment recorded between IV-19 and II-20. However, of the 23.6 million female occupations lost, about 19.3 million were regenerated in the same period. In other words, it subtracts a balance of more than 4 million jobs previously occupied by women to be recovered.
ECLAC presents different reasons that explain this phenomenon. First, the sectors that lost the most jobs during the crisis were the sectors with the highest female participation (such as paid domestic work, employment in service sectors in general, and commerce). Secondly, the most informal categories were the ones that suffered the greatest impact, where women tend to have a high degree of participation. Finally, care tasks during the pandemic fell more intensely on women, within a context in which some services (educational and care) were affected by measures such as social distancing.
Regarding the trend in Argentina, and with data from the INDEC Permanent Household Survey (EPH) to III-21, the rate of employed people reached 42.9%, representing a growth of 0.4 p.p. compared to the same quarter of 2019, differentiating itself from the economies of Latin America and the Caribbean that have not yet managed to recover values similar to those prior to the pandemic17. In particular, between IV-19 and II-20 men registered a 21.5% drop in the number of employed people and women a somewhat higher figure (-22.6%), while in the recovery (II-20 vs. III-21) the opposite phenomenon occurred: women grew 30.6%, slightly above men (+29.4%).
The composition of the employment rate disaggregated by employment category shows that the categories that have expanded to a greater extent with respect to III-19 have been salaried workers with a retirement discount (+0.8 p.p.) and self-employed people (+0.4 p.p.), while employers did not register significant variations and salaried workers without a retirement discount decreased (-1.7 p.p.). without being able to recover levels similar to those of 2019. Employment has returned to pre-pandemic levels despite the fact that informal wage earners have not been able to recover the employment lost during II-20. However, it is worth pausing at the disaggregation by gender: salaried women, with and without retirement discounts, are already at similar levels compared to those prior to the pandemic. Observing the variations between III-21 and III-19, the most dynamic categories for women, as opposed to men, were concentrated in the sectors with the least protection (see Graph 1): self-employed women increased 9.4% (vs. +3.8% for men), salaried women without a discount grew 4.8% (compared to 8.9% for men), while salaried women with a retirement discount18 rose 4.9% (when men did so by 6.8%).
Graph 1 | Employment by gender and category
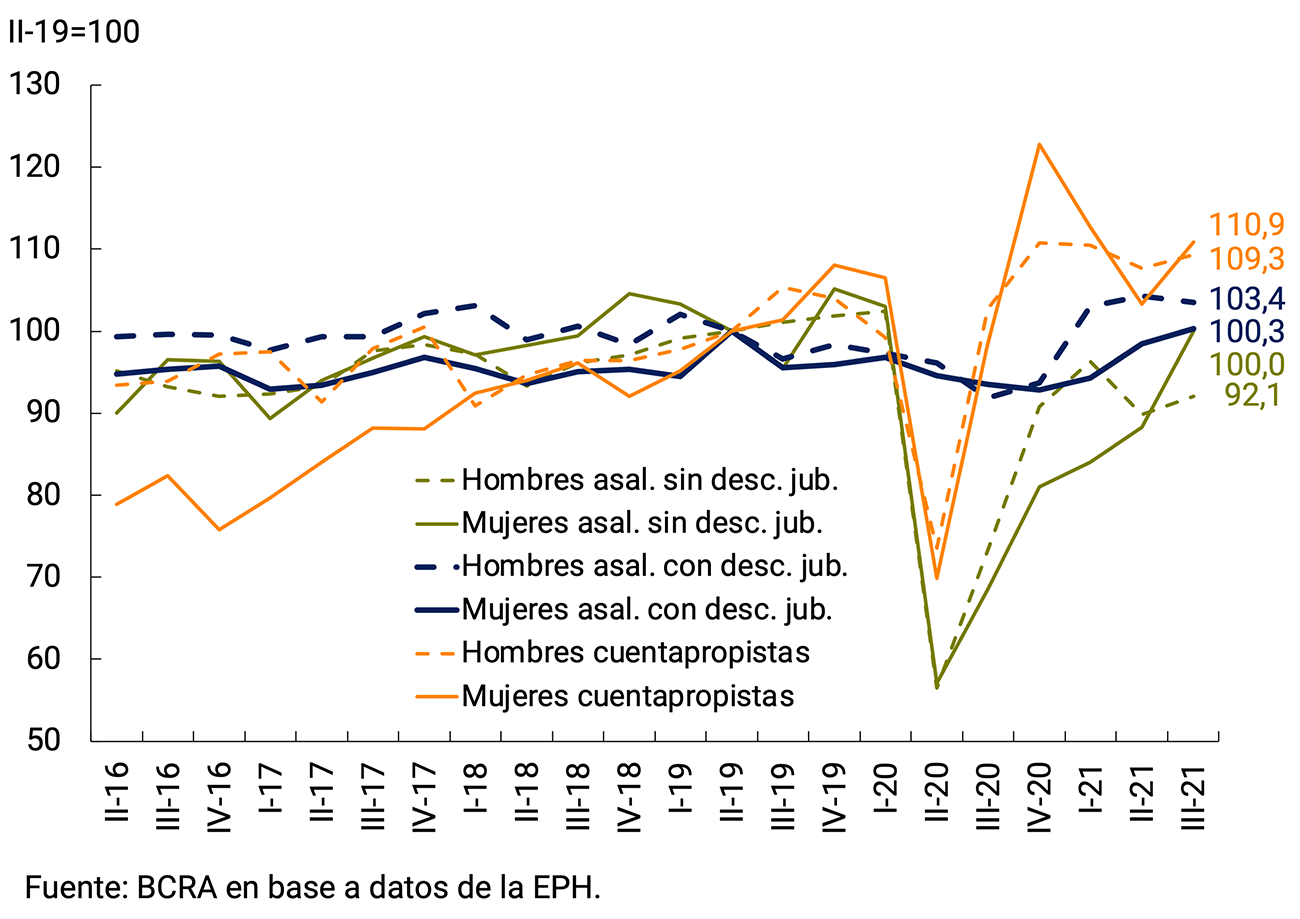
Two additional factors that allow us to study changes with respect to the pre-pandemic period have to do with age differentiation and kinship relationships. Although there is a normalization in the employment rate, there is also a change in its composition. When carrying out an age segmentation, since III-19 there has been a relative decline in employment in young men under 29 years of age (-1.3 p.p.) and in men (-0.8 p.p.) and women (-0.2 p.p.) over 65 years of age. This drop in the employment rate was made up for by men between 30 and 64 years of age (+1.1 p.p. compared to III-19); Women under 30 years of age have also shown significant insertion (+0.8 p.p. compared to the same period) and to a lesser extent women between 30 and 64 years of age have also done so (+0.1 p.p.). These changes compared to two years ago suggest a greater female presence in the labor force, replacing the older population, but also gaining ground over men under 30 years of age. Women who enter the labor market would be predominantly young and with insertion in occupations with a higher degree of informality.
Accordingly, from the perspective of kinship relations, it is evident that the rate of spouses who obtained work is higher than in the pre-pandemic period (+0.9 p.p., see Graph 2). Disaggregated by gender, the category of spouses has a majority female composition (more than 72% of the sample). The growth of this category usually supports the hypothesis of the additional worker, understood as the pressure on the household unit to recompose the household income by adding a second worker (spouse in this case) to the labor market. Thus, the decrease in household income would be one of the foundations to explain the expansion of female employment in the labor market.
Graph 2 | Employment by kinship relationship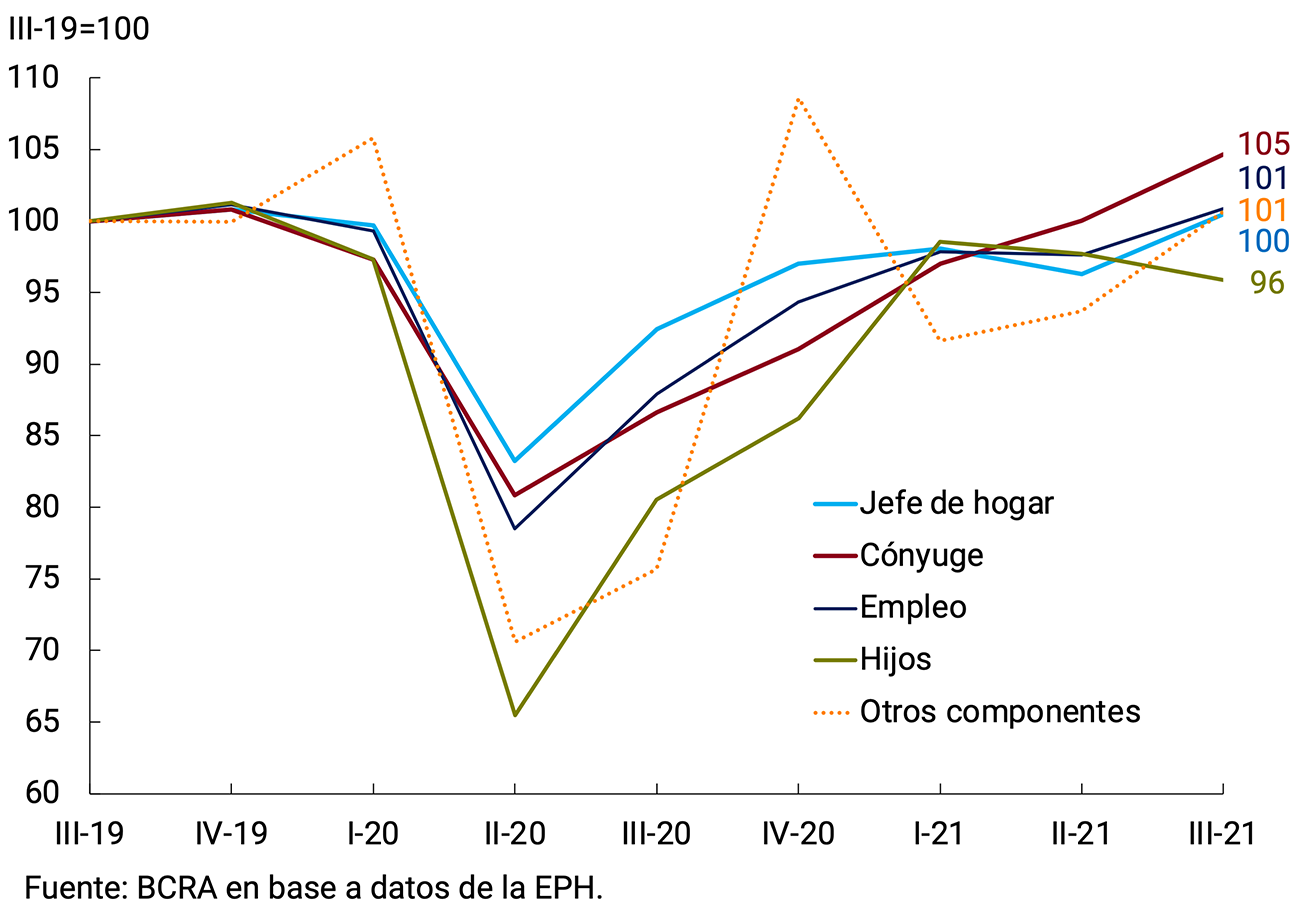
However, women participate in less dynamic and lower-paid sectors of the economy, moderating the ability to rebuild household incomes. If income by economic sector is analyzed through a femininity index19, most of the lagging categories involve a greater component of female work: Domestic Service, Hotels and Restaurants, and Community Services. There seems to be a relationship between the degree of sectoral feminization and the wage gap20 (see Graph 3).
Graph 3 | Sectoral indices of femininity and income deviation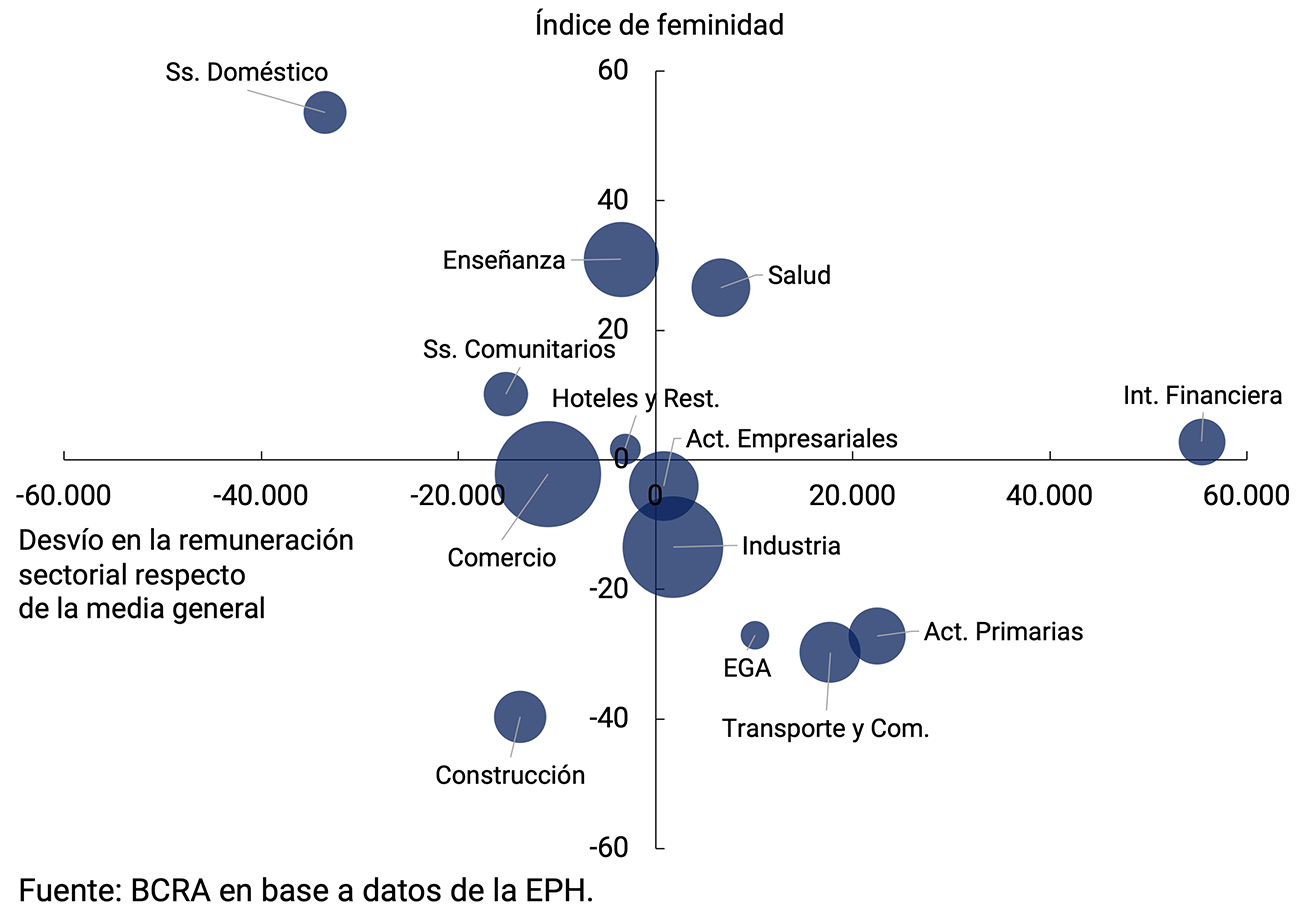
On the other hand, in line with the region, the most forceful effect on the loss of women’s jobs can be explained by the presence of women in economic sectors strongly affected by the pandemic. Among these sectors are Domestic Service, Hotels and Restaurants, Education and Activities. Business (see Graph 4). In the subsequent recovery phase (II-20 to III-21), three large groups can be highlighted: those that exceeded the pre-pandemic level (Health and Public Sector); those that reached the pre-pandemic level (Commerce and Real Estate, Business and Rental Activities); and those below (Hotels and restaurants, Domestic service and Education).
Figure 4 | Female employment. Selected sectors
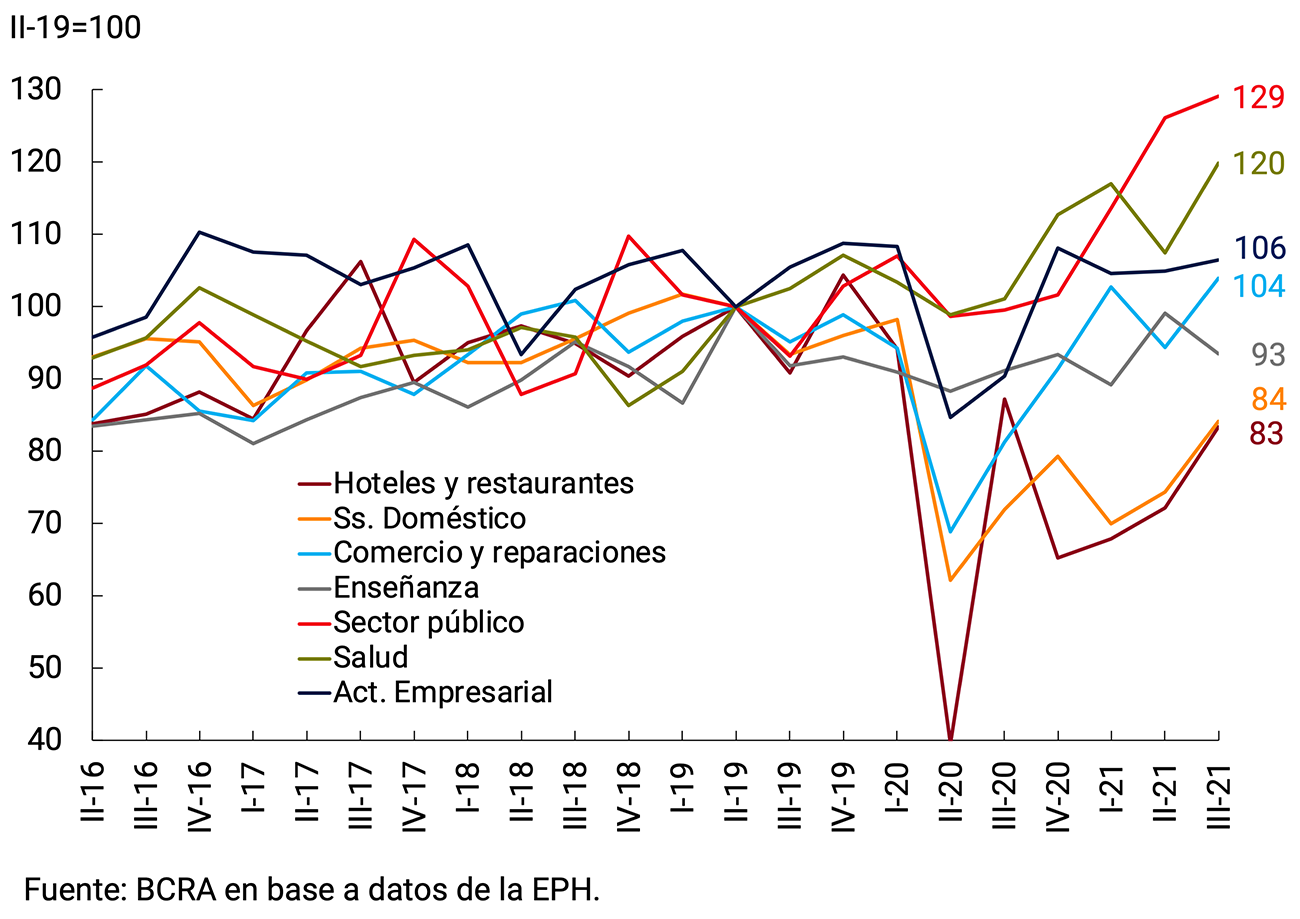
In short, in the region, labor markets registered an impact that fell largely on informal and female employment. In Argentina, there was an asynchrony with respect to regional behavior, based on the strong growth in women’s employment, which even made it possible to overcome the losses generated by the COVID-19 pandemic. However, when analyzing the characteristics of recent female labor insertion, heterogeneities are observed, including informal jobs, which contemplate a young age group, with lower relative salaries, and which have emerged as strategies for recomposing household incomes.
Section 3 / Foreign Trade Pattern in Argentina: An Analysis at the Company Level
Knowledge of the input-output relationships of foreign trade is essential for the appropriate design of economic policies and decision-making by the monetary authority. In this sense, having information on exports and imports at the firm level allows us to explore heterogeneities in the relationships between the productive specialization matrix and a country’s trade flows, which often go unnoticed in the averages of aggregate data.
Recently, the BCRA carried out a study27 on the elasticities of foreign trade in Argentina for the period 2004-2019. The conclusions indicate that, at the aggregate level, the income elasticity of imports is higher than that of exports and, in addition, that the price elasticities of foreign trade are low, i.e. they do not meet the standard Marshall-Lerner conditions.
In such circumstances, trade policies that are based exclusively on affecting the real exchange rate — a “horizontal” policy — would not be the most effective in increasing competitiveness and improving the trade balance through an export boost. But this does not exclude that there may be heterogeneities in behavior at the sector or company level. Consequently, the objective of this section is to inquire about the pattern of trade in Argentina at the firm level. The interest lies in understanding the relevant inter-industrial relations and, in particular, the role of imported inputs in those companies that export an important part of their production, classifying products according to the major categories of exports and imports.
A database (provided by INDEC, based on information from Customs) is available with monthly information at the company-country-product level (with 8 opening digits or at the tariff position level of the Mercosur Common Nomenclador (NCM)) for the period 2016-2020.
Results
Table 1 presents the aggregate percentage share of exports and imports by major items. It can be seen that Manufactures of Agricultural Origin (MOA) represent the largest percentage of exports, closely followed by Manufactures of Industrial Origin (MOI) and Primary Products (PP). On the other hand, imports are strongly concentrated in MOIs. Given the clear division between export and import sectors, when distinguishing between large sectors of activity, it may be useful to inquire, from a micro point of view, whether: (i) the companies that export are units distinct from those that import; ii) companies specialize in different areas.
Table 1 | Percentage share of exports and imports by major items
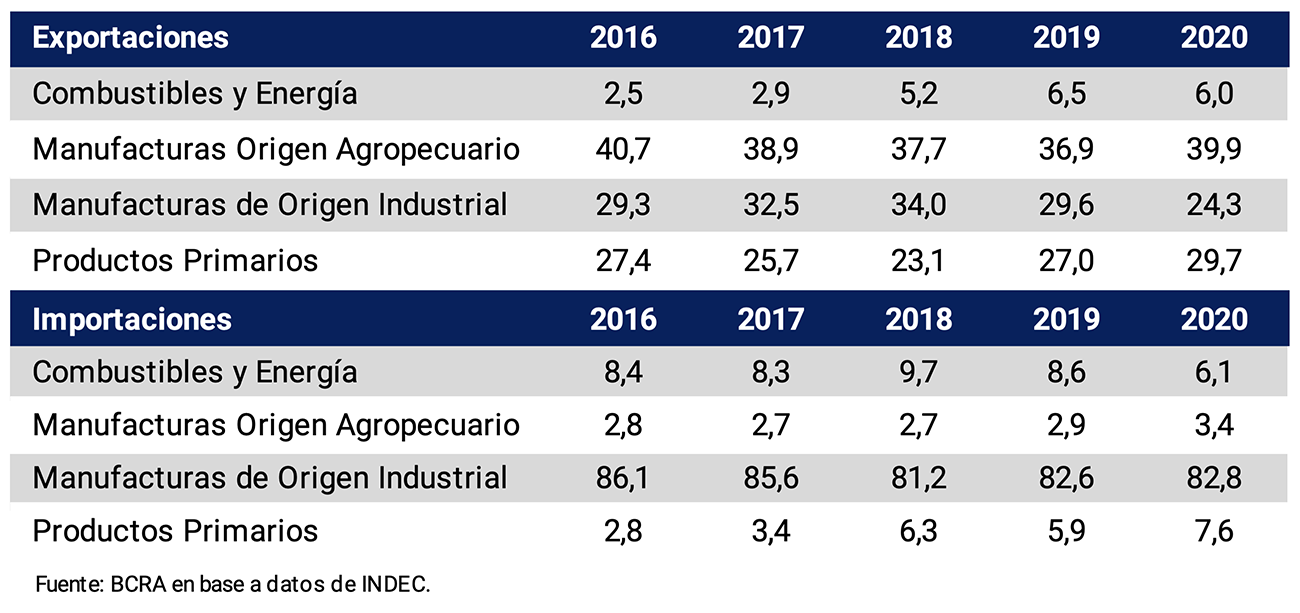
To answer the first question, Graph 1 panel (a) shows the temporal evolution of the value exported, differentiating companies that, in a given month, exported and imported simultaneously, from those that only exported. As can be seen, there is a clear dominance of the former over the latter. For its part, panel (b) shows, for each of the years analyzed, the percentage of companies (first bar), exports (second bar) and imports (third bar), classified according to their commercial activity. It can be seen that between 21% and 24% of companies export and import, accounting on average for 94% of exports and 77% of imports, that is, almost all trade. Then, there is a high fraction of companies (66% on average) that are only dedicated to imports, but with relatively low participation (23% of imports on average). Finally, 12% of companies are only dedicated to exporting, representing 6% of the total exported value.
Graph 1 | Value of exports and participation in trade
(a) Value of exports
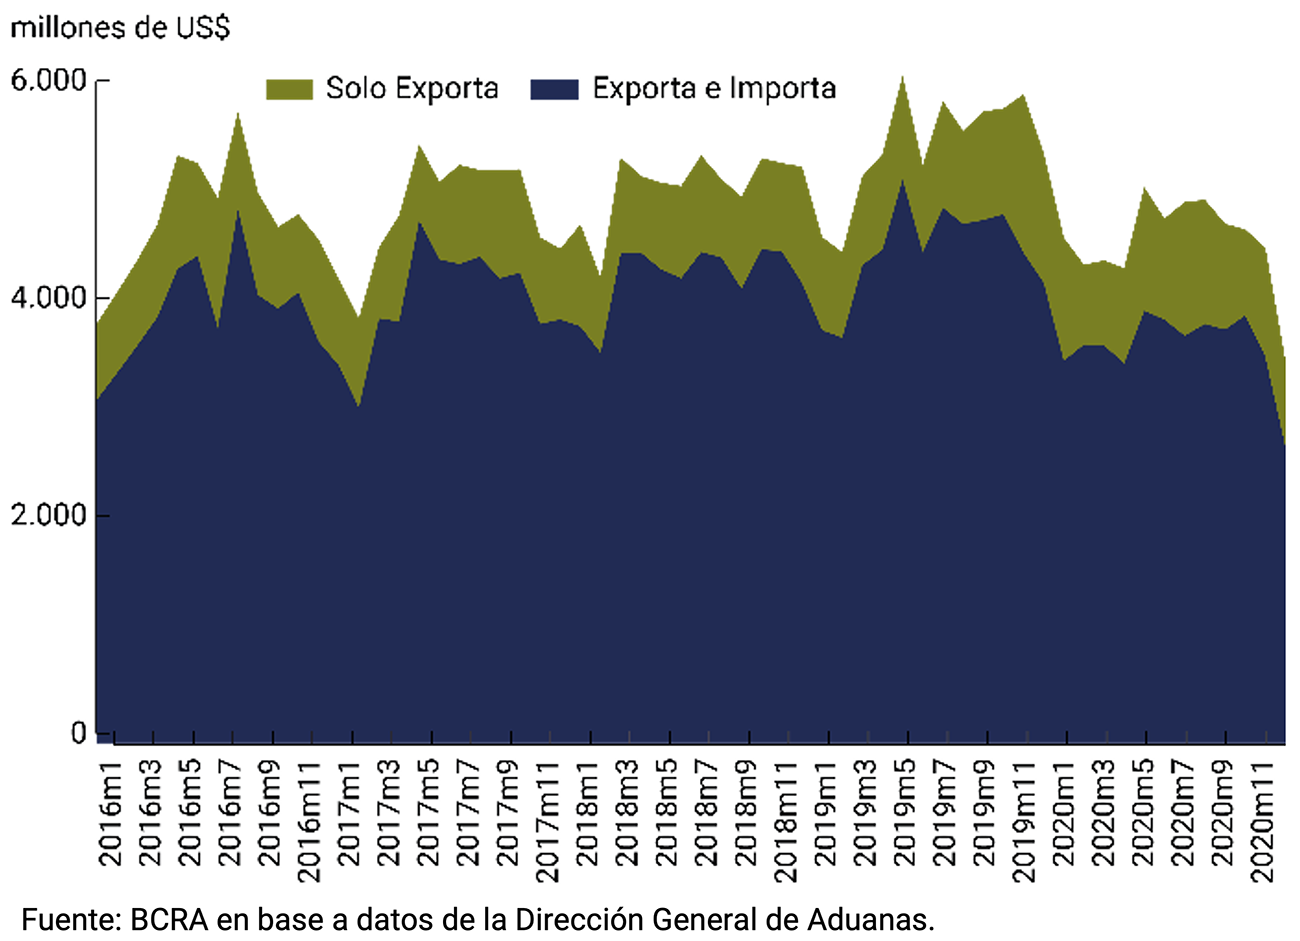
(b) Participation in trade
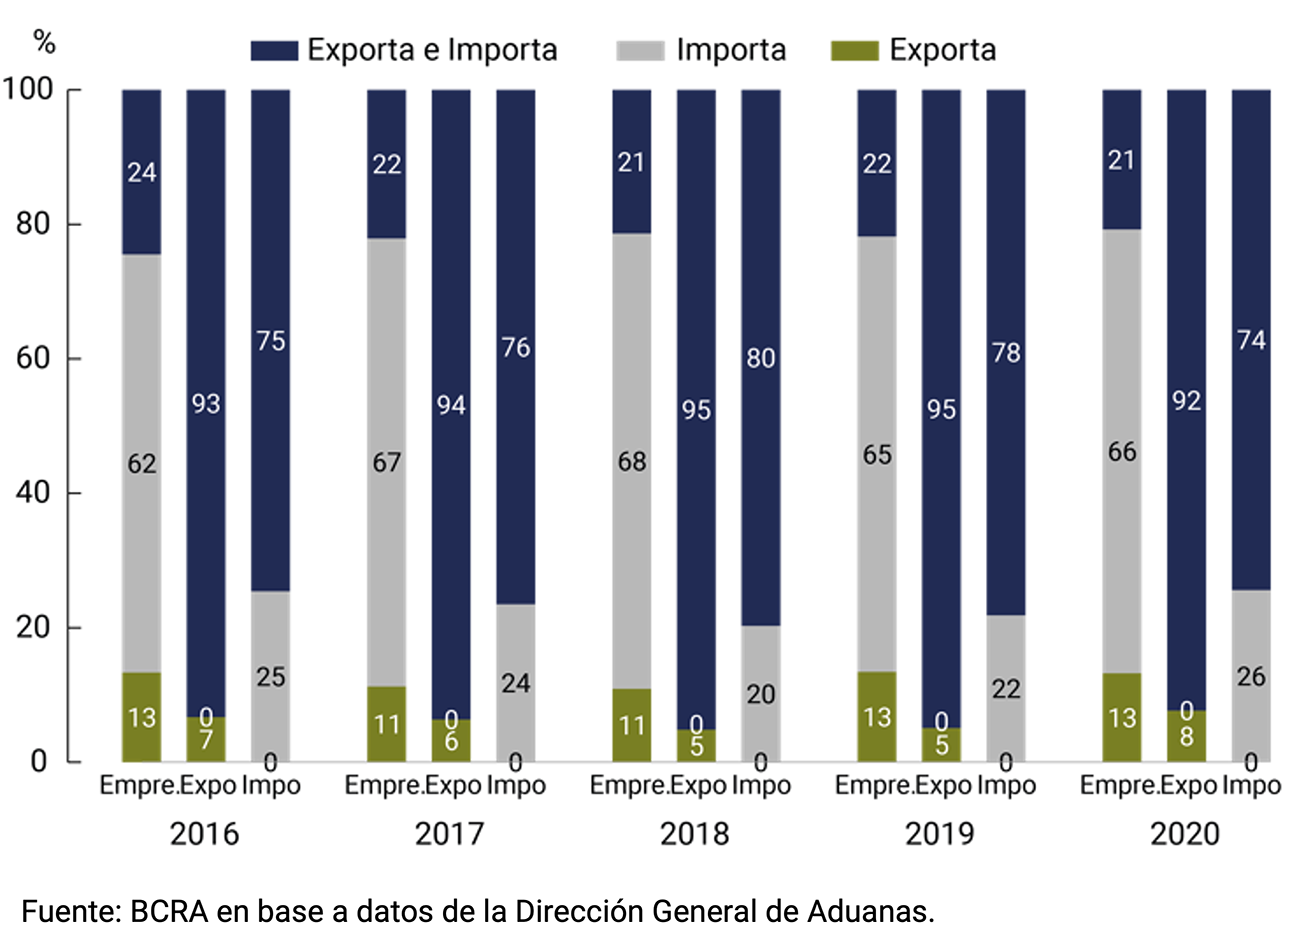
To answer the second question—whether firms specialize in different sectors of activity—Graph 2 panel (a) groups exporting and importing firms by export pattern28. A large participation in exports of firms exporting MOA, MOI and PP (group 3) is observed, with a surplus trade result. The value exported by companies engaged in MOA, PP or both (group 1) is similar to that of firms that only export MOI (group 2), but in the first case the result of group trade is in surplus, while in the second it is in deficit. Panel (b) shows the item of imports by exporting group (the 4 groups of panel (a)). Regardless of the type of product exported, when disaggregated imports by item, a significant participation of MOIs is observed, although with differences between groups.
Graph 2 | Value of exports and participation in trade
(a) Trade by exporting standard
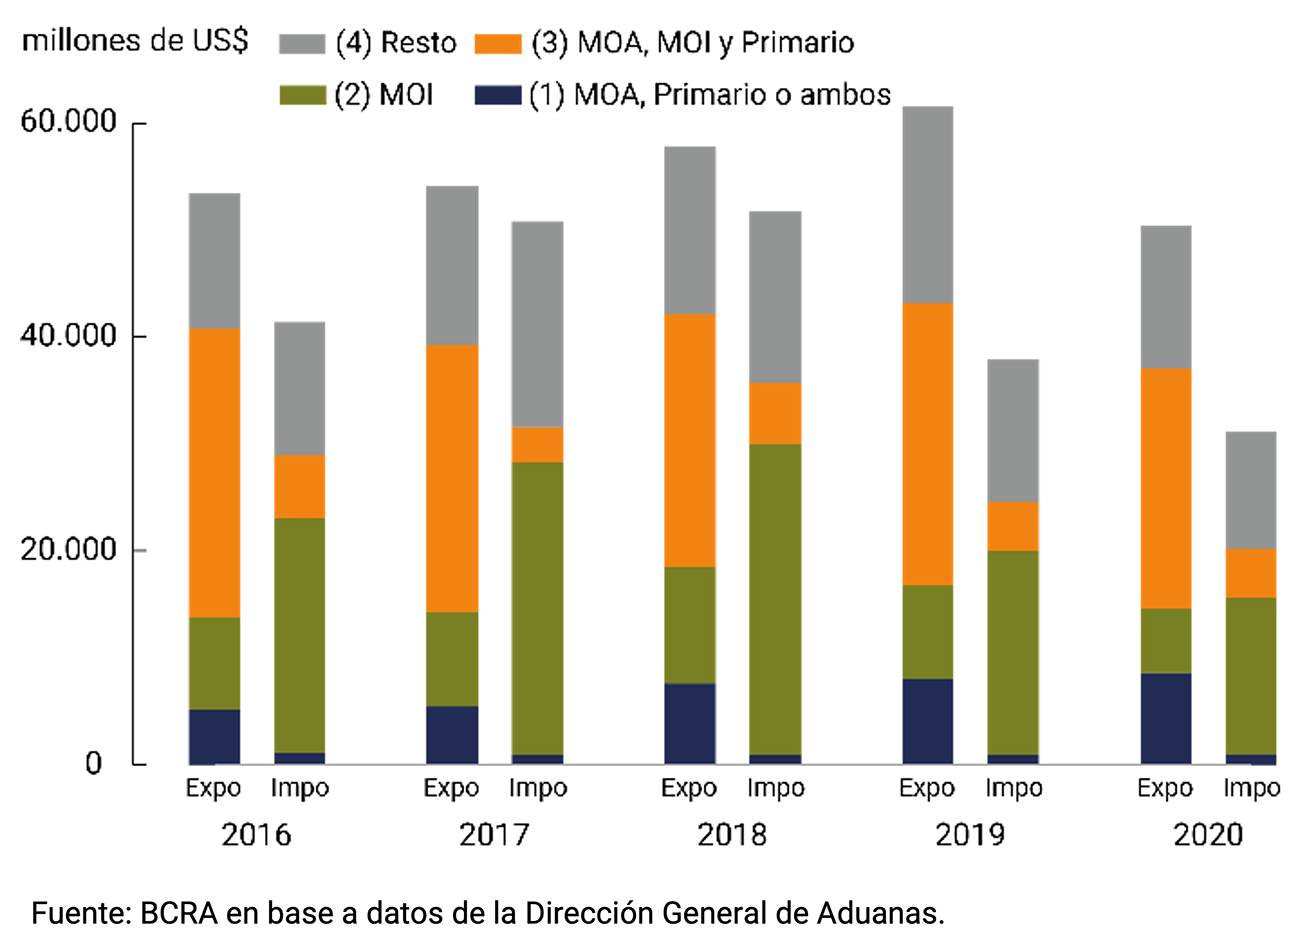
(b) Imports by group
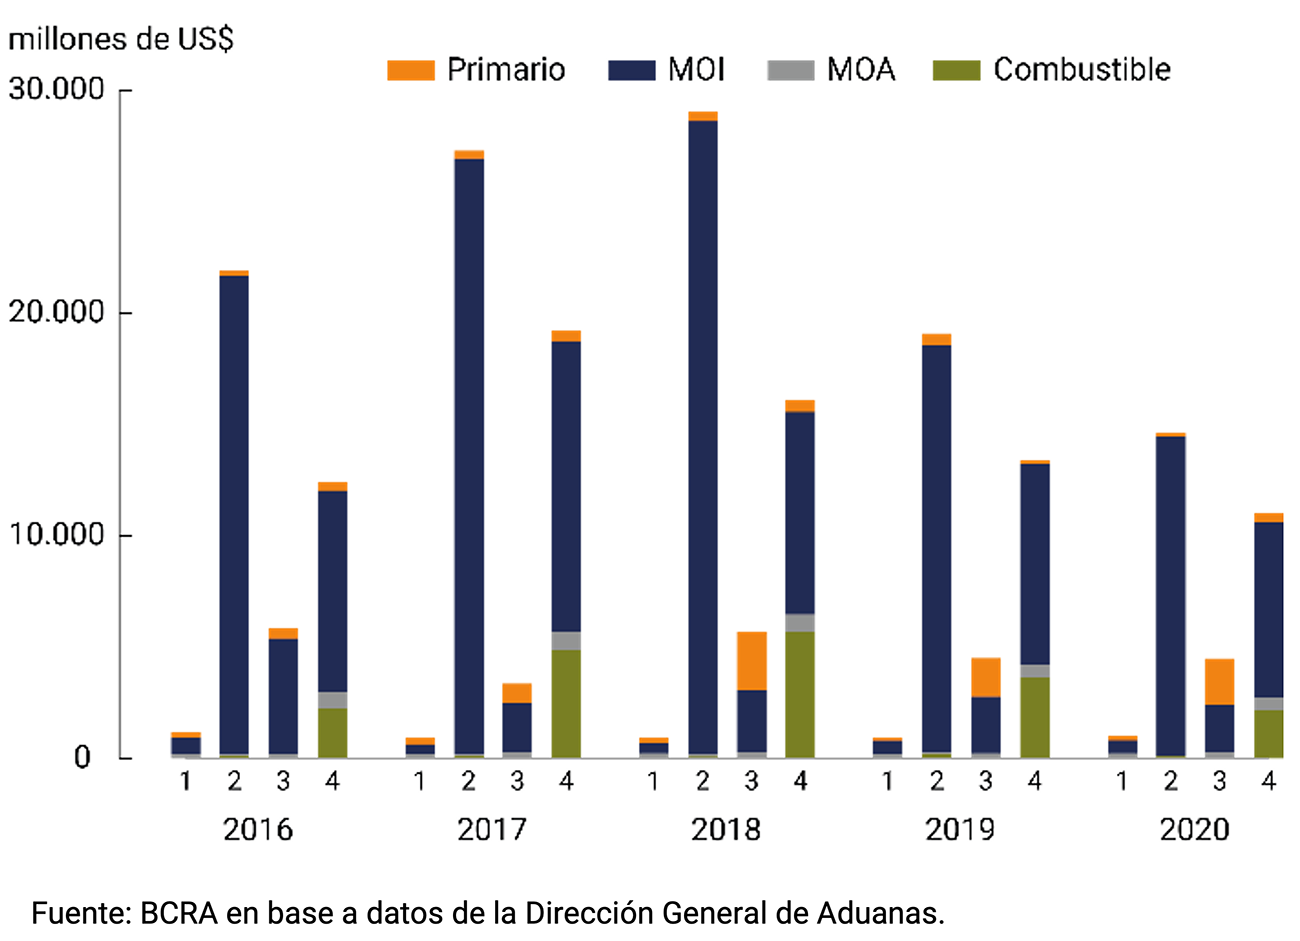
Conclusions
In this section we have used INDEC data based on information from Customs to understand the extent to which the macro relations of foreign trade in Argentina are reproduced at the firm level. Analyzing the aggregated data by large items, we have seen that exports are mostly of the MOA, MOI and PP type, while imports are mainly manufactures of industrial origin (MOI).
However, this aggregate view can be somewhat misleading, if the different companies are thought of as specialized units, which do not have links with each other. In fact, given that the analysis at the microeconomic level reproduces the previous pattern, a first conclusion of the analysis is that our country’s trade can be thought of as that of a single large company. That is, inter-industrial connections in trade do not only exist; The data also suggest that, in a large part of Argentine international trade, this connection operates directly at the firm level.
In addition, although the lack of availability of information regarding the production of goods destined for the domestic market by the firms included in this database prevents the analysis from being deepened, the deficit observed in those that export MOI could be due to the fact that these are companies that mainly allocate their production to the domestic market. In this case, then, indirect inter-industrial connections could not be excluded either, such as, for example, when company “X” imports an input “a” to produce good “b”, which it then sells to another company “Y”, which ends up exporting good “c”.
Finally, the analysis carried out can also shed light on some of the reasons that explain the limited effect of devaluations on domestic exports. A devaluation increases the international competitiveness of local firms by reducing their wage costs – and those of inputs that are entirely produced locally – in foreign currency. However, given that exporting firms are heavily dependent on the use of imported inputs (58% of the cases analyzed), the effect on domestic costs is considerably weakened when the positive effect of devaluations on the cost of this type of input is also taken into account.
Section 4 / The Extended Facilities Agreement with the IMF
The National Congress passed Law 27668, which authorizes the future agreement with the International Monetary Fund (IMF) within the framework of an Extended Facilities Program (PFE) for the purpose of refinancing the debt assumed by the Argentine Republic in the Stand By agreement signed in June 2018, in accordance with current legislation37.
The agreement reached between the National Government and the IMF sought to refinance the capital maturities assumed in the previous program, which were mainly concentrated in 2022 and 2023, implying a potential destabilizing effect on the balance of payments and the Argentine economy. Under the new financing program, which will have a 30-month extension and involve an amount identical to that of the 2018 Stand By Agreement, principal maturities will be more evenly distributed over a total of 9 years (maturities will begin to be paid in 2026 and will be extended until 2034; see Chart 1).
Graph 1 | Capital maturity profile with the IMF
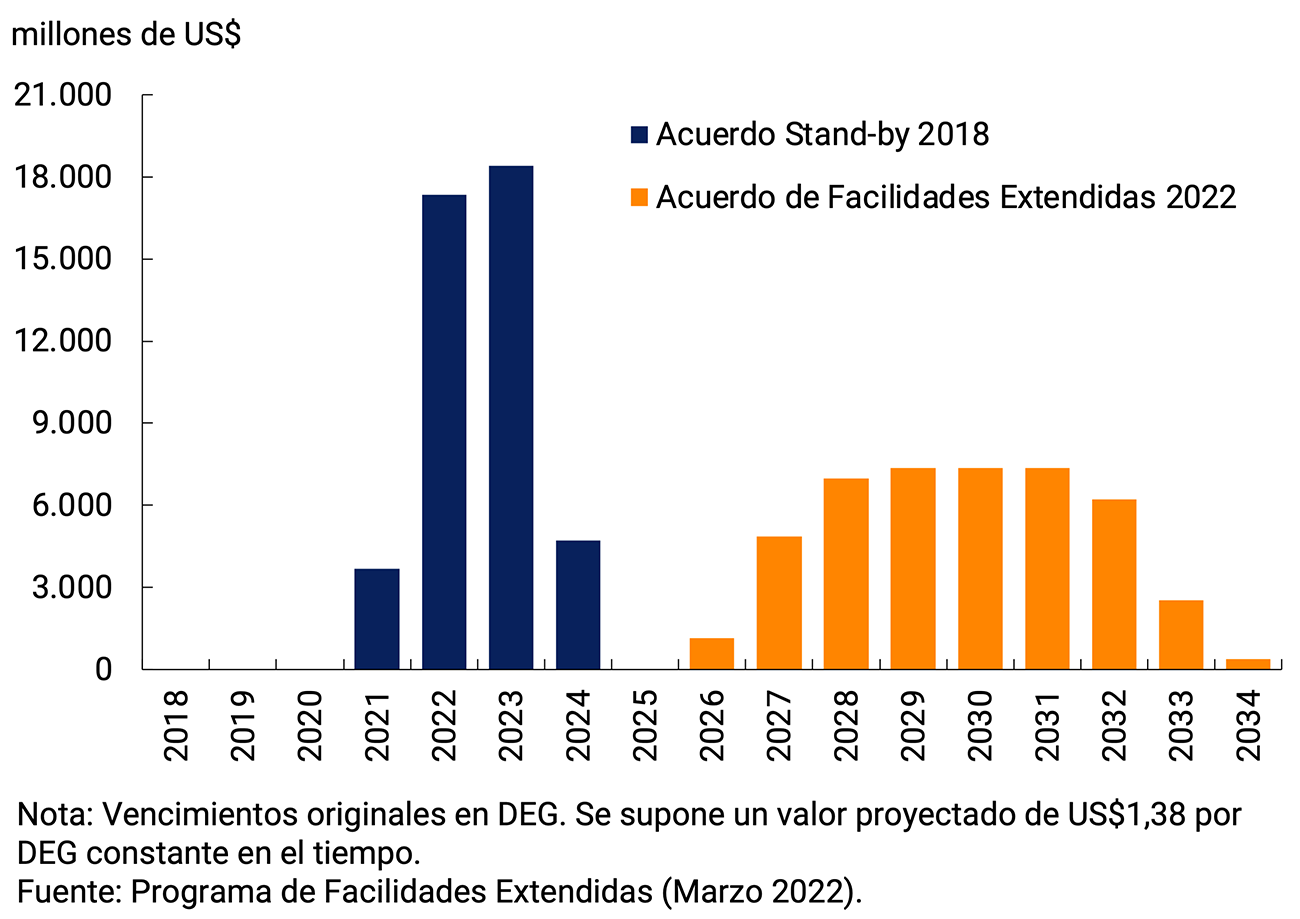
The refinancing program achieved proposes a multi-year fiscal consolidation based on a path of gradual and sustainable reduction of the primary deficit of the National Non-Financial Public Sector (NFPS) based on an economic recovery (see Table 1).
Table 1 | Macroeconomic projections in the framework of the technical agreement with the IMF staff

For 2022, the criterion for the execution of the program is to achieve a primary deficit of 2.5% of GDP. This would represent 1.9% of GDP and 0.9% of GDP in 2023 and 2024, respectively38. In line with this fiscal trajectory, a gradual reduction of the BCRA’s financing to the National Treasury was stipulated until it was completely reduced in 2024 (see Chart 2).
Graph 2 | NFPS primary deficit and monetary financing to the National Treasury
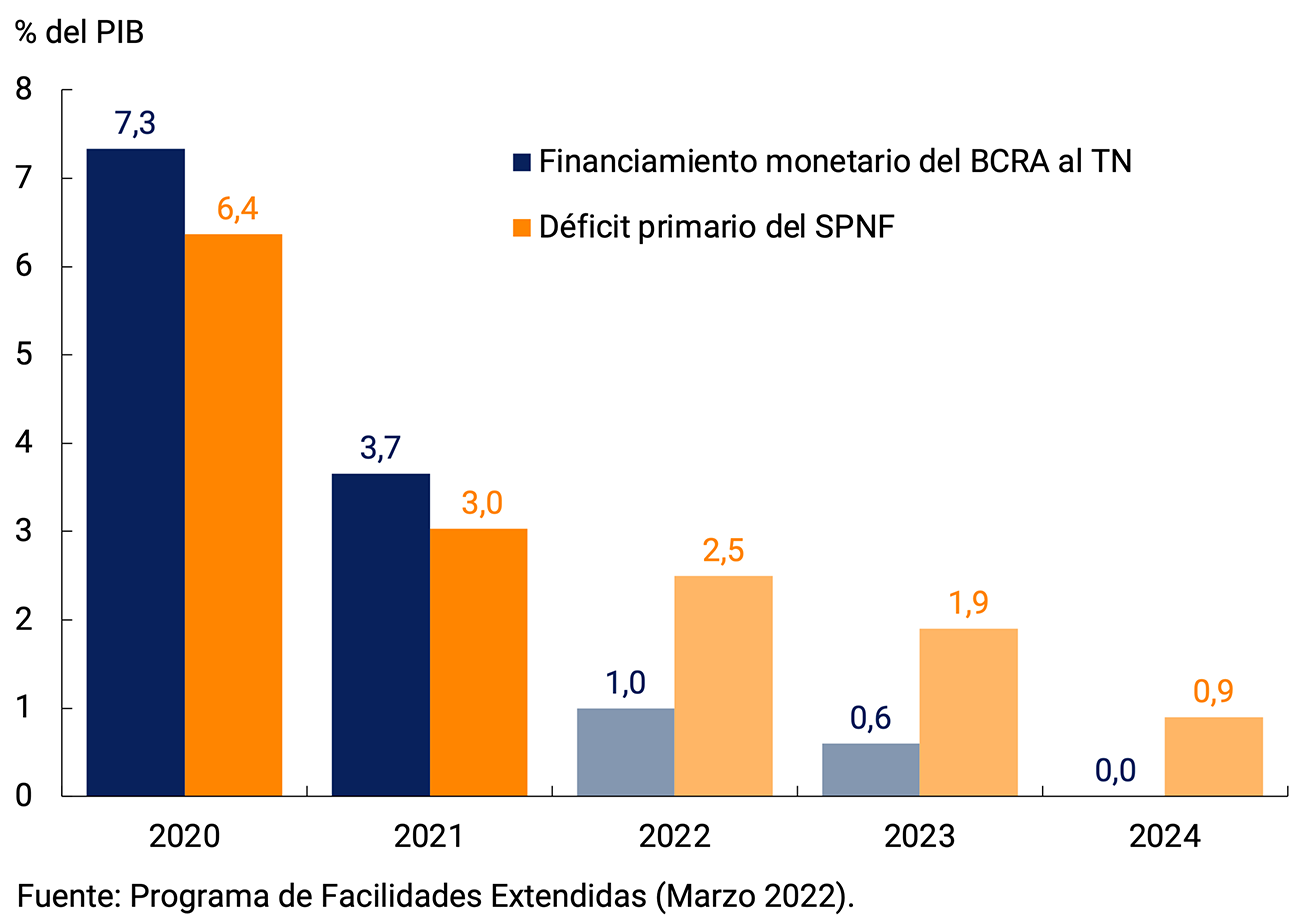
The fiscal consolidation proposed within the framework of the agreement with the multilateral organization consists of a balanced package of expenditure and revenue measures to sustain growth, employment, investment in infrastructure and social protection for the most vulnerable sectors.
Higher tax collection is expected, due to greater efficiency in tax collection and improvements in the progressivity of taxation (for example, by gradually considering real estate tax valuations closer to market values). Incomes will in turn be strengthened by the expected recovery in employment and wages.
On the other hand, the agreement provides for a real growth in primary public spending, contemplating improvements in its targeting, efficiency and progressivity, strengthening the budgetary system. Likewise, work will be done to reduce gender gaps. A better targeting of spending in the areas of social assistance and subsidies for energy consumption is expected. It is expected to maintain the application of the retirement mobility formula39 and the budget allocated to science and technology and public investment will be prioritized, safeguarding economic recovery and boosting future growth. In terms of subsidies, the program proposes the search for a more efficient and progressive scheme, so that over time energy rates better reflect cost coverage while maintaining the protection of lower-income households. Thus, actions are proposed in the short and medium term focused on this objective to reduce the weight of subsidies. Within the framework of the agreement, the National Government will promote, based on public hearings convened during April 2022, a new tariff proposal that includes a segmentation program valid for the years 2022 and 2023 and an update formula for 90% of lower-income residential users based on the advance of the Wage Variation Coefficient (CVS).
In turn, as a mechanism to strengthen exchange rate and financial stability, an accumulation of net international reserves of US$5,800 million in 2022, US$4,000 million for 2023 and US$5,200 million for 2024 will be sought, preserving the external competitiveness associated with the real exchange rate. This process will be based on more dynamic exports40, higher levels of Foreign Direct Investment and financial assistance from International Organizations. On the other hand, the agreement with the IMF will allow negotiations to be undertaken to refinance the balance owed to bilateral creditors grouped in the Paris Club and will facilitate an eventual gradual return to voluntary financing in international credit markets starting in 2025.
In relation to the monetary sphere, the agreement will seek to reduce inflation gradually through a comprehensive approach that includes the coordination of monetary, fiscal, and price and income policies.
The program agreed upon between the National Government and the IMF includes a set of six variables that will be subject to quantitative execution criteria (conditionalities):
• Evolution of the National Government’s primary result (adjusted for disbursements from international organizations for project financing).
• Accumulation of floating debt by the Federal Government.
• Not to register arrears in the payments of the foreign debt by the Federal Government.
• Accumulation of the BCRA’s net international reserves (adjusted for disbursements from multilateral international organizations and bilateral creditors, excluding those destined for project financing and for the expected payments of debt services to creditors grouped in the Paris Club).
• Limit on monetary financing from the BCRA to the Federal Government.
• Continuous Enforcement Criteria: avoid (i) imposing or intensifying foreign exchange restrictions, (ii) introducing or modifying Multi-Currency Practices (MCPs), (iii) concluding bilateral payment agreements that are inconsistent with Article VIII; and (iv) impose or intensify import restrictions for balance-of-payments reasons.
In addition, three quantitative indicative goals were contemplated:
• A floor of real income of the federal government was defined.
• A floor of spending on priority social programs was contemplated.
• A ceiling was established on the increase in the balance of forward contracts with underlying in the BCRA dollar in the local futures markets.
It is also expected that, within the framework of the authorities’ plan to reduce energy subsidies, revisions will be implemented to the energy bills of residential users, and to wholesale energy prices. Finally, other information requirements were identified in addition to the data, which are necessary to monitor the program’s conditionality, to ensure adequate monitoring of economic variables, which are detailed in the Technical Memorandum of Understanding.
On the other hand, the National Government proposed to study some additional issues to improve the performance of the Argentine economy in the medium to long term, such as:
• Strengthening tax administration, with the aim of reducing tax non-compliance.
• Develop, with the technical and financial support of our strategic partners, a medium-term plan to continue reducing energy subsidies and improving the efficiency of our energy matrix, ensuring the quality of energy services and affordable access for households in vulnerable situations.
• Improve aspects related to the management of public investment.
• Identify, together with strategic partners, options for the improvement of social support policies (comprehensive evaluation of programmes and strategies).
• Develop policies to strengthen preparedness and better address the challenges of climate change.
• Analyze options and recommendations to consolidate the equity and long-term sustainability of the pension system, focusing on certain special retirement regimes covered by Law 27546 as well as on mechanisms to facilitate the voluntary continuity of people’s working lives.
• Formulate a conditional-based strategy to gradually relax capital flow management measures.
• Design and publish a time-bound plan to simplify the reserve requirement system and improve the transmission of monetary policy.
• Propose a bill to amend the current Foreign Exchange Criminal Law, with modifications to the framework of sanctions that contribute to greater efficiency and compliance with foreign exchange regulations.
• Formulate and publish a strategy to strengthen the BCRA’s balance sheet.
In short, the agreement being reached with the IMF contemplates a macroeconomic strengthening program, excludes some of the conditionalities that in the past proved to be disruptive – and implied high social costs – and aims to consolidate a path of economic growth, productive development and social inclusion without recessionary adjustment. It promotes greater financial stability and addresses the challenges for sustainable economic development, considering the protection of the environment and strengthening the gender perspective on public policies.
Section 5 / Recent developments in the CPI relative price structure
The prices of goods and services that make up Argentina’s Consumer Price Index (CPI) basket have had heterogeneous evolutions since this indicator began to be used in December 2016, explained by various factors that affect them in a differentiated way. As a result, there have been significant changes in the relative price structure over the years. In 2020, the onset of the COVID-19 pandemic implied a break in many of the trends observed until the end of 2019, accentuating or attenuating price divergences depending on each case. In 2021, many of the disruptive factors that affected the evolution of prices in the previous year dissipated, so it is a good time to analyze the status of the most relevant relative prices within the CPI.
Before the start of the pandemic, the relative price of goods with respect to services had recovered as a result of the exchange rate jumps that occurred during 2018 and 2019, which had greatly impacted the price of goods due to their greater tradable component. In doing so, they reversed a downward trend that had reached its lowest point in March 2018 (see Chart 1). This previous deterioration was largely explained by the significant updates in the rates of public services in that period.
Graph 1 | Evolution of the relative prices of services
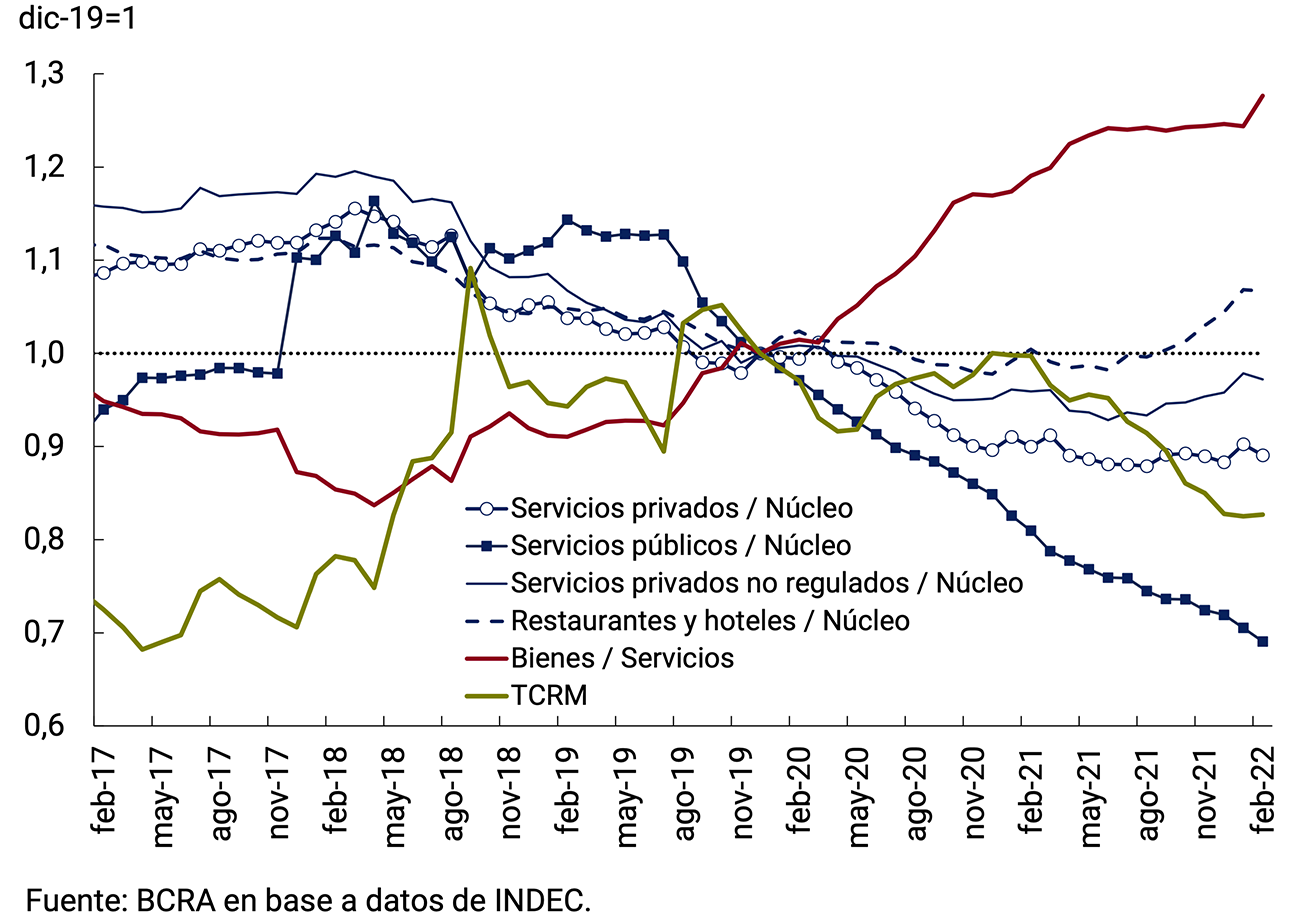
The beginning of the COVID-19 pandemic set up a scenario that deepened the trend of increasing the relative prices of goods. On the one hand, the drop in mobility as a result of the infections and the health restrictions adopted during 2020 limited demand and in some cases made it impossible for many private service activities considered “non-essential” to operate, which maintained limited variations in their prices43. On the other hand, restrictions on the supply of goods at the global level pushed their international prices upwards, driving an improvement in their domestic relative prices even in a period of real appreciation of the domestic currency.
In 2021, the recovery in demand for services that had been the most affected in 2020 contributed to interrupting the deterioration in the relative price of total services, particularly driven by price increases in the Restaurants and Hotels division. For their part, public service rates maintained very limited nominal increases in 2020 and 2021 and deepened their deterioration against the other CPI prices. This evolution took place within the framework of a tariff containment policy adopted by the National Government to strengthen the real income of families, affected by the crisis generated by the pandemic. In summary, the relative prices of total services have deepened their deterioration in the last two years and, although they stabilized in the second half of 2021, they are well below pre-pandemic levels.
Regarding the increase in the relative price of goods that has occurred in recent years, it occurred heterogeneously among different groups. Food and non-alcoholic beverages – which make up the division with the highest weighting within the CPI – gained weight compared to other goods in the first months of the pandemic and then from May 2020 they slowed down, returning to relative levels similar to those of previous years. Among the evolution of the others, goods stood out, due to their weighting, the increases verified in the Clothing and footwear division and, in terms of magnitude, the increases in the values of automobiles. In these two cases, the increases were associated, in part, with a lower supply in the domestic market verified since the end of 2019 and in the case of automobiles, restrictions in global value chains and the shortage of specific inputs (semiconductors) also played a role, which generated pressure on international prices. The set of “Other goods”, which are mostly not regulated or affected by reference price programs44, also gained relative weight within goods during the last two years. Among these, the prices of a set of durable goods are contemplated that, in addition to automobiles, received a boost to their demand as a form of value protection. For their part, regulated goods – fuels and tobacco – lost weight throughout 2020 while in the first half of 2021 they only partially reversed this deterioration due to the authorized increases in fuels. However, in the second half of the year, stability in fuel prices led to the relative prices of regulated goods resuming the downward trend, ending 2021 at levels much lower than those verified before the pandemic (see Chart 2).
Graph 2 | Relative prices of selected goods with respect to other goods in the National CPI
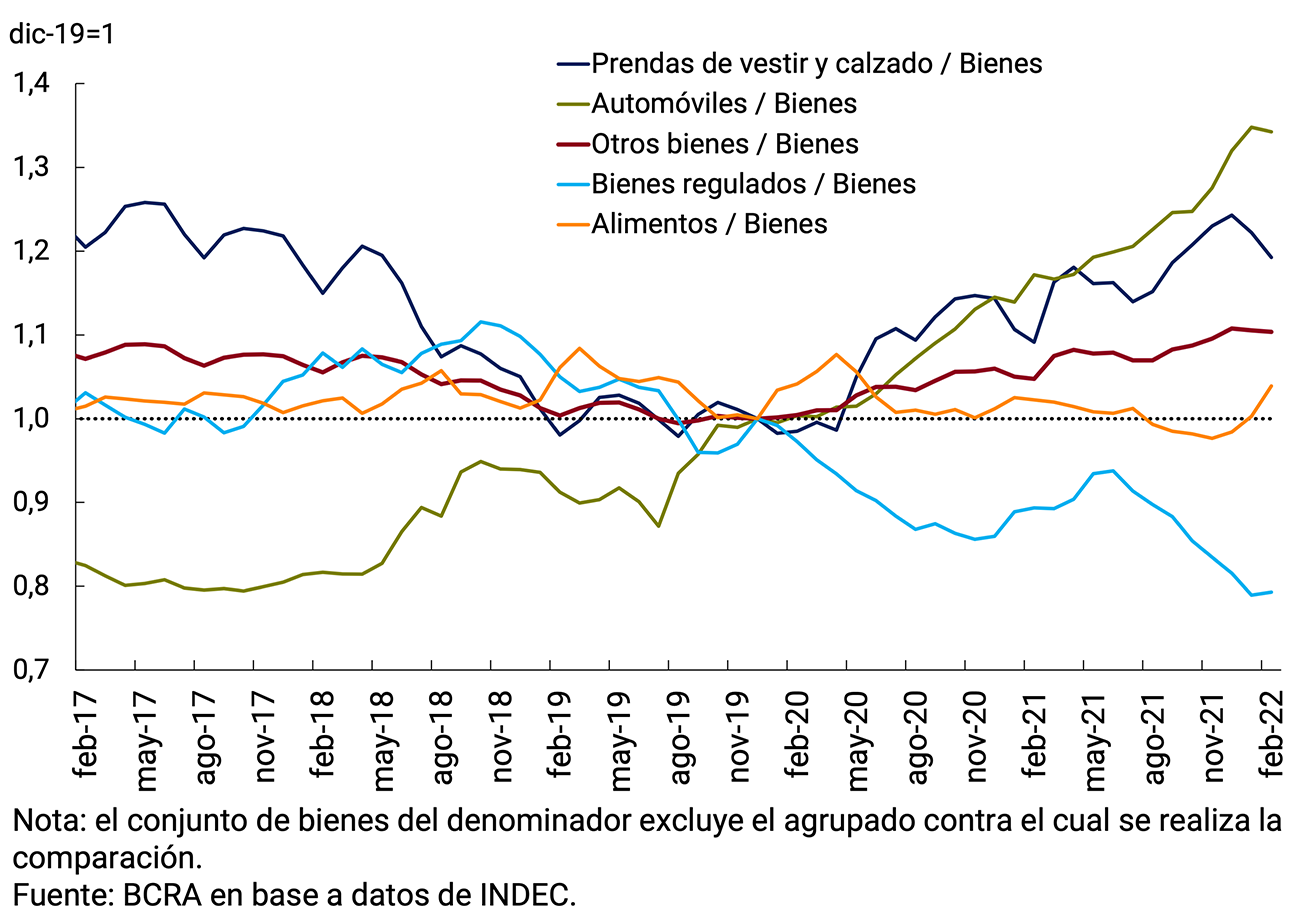
Analyzing the evolution of food in greater detail, it can be seen that, between April and July 2020 – a period of greater restrictions on movement during the pandemic – both processed foods and beverages and fresh products showed a drop in their relative prices. From then on, processed products continued to lose relative weight while fresh products registered an improvement in their relative prices.
The significant relative strengthening of fresh food prices, which peaked in the first quarter of 2021, was initially driven by sharp increases in the prices of fruits and vegetables, affected by difficulties in their transport and production, in a context of mobility restrictions. After a year with very limited increases, Meat and derivatives showed significant increases towards the end of 2020 that once again boosted the relative price of fresh food, in the context of a process of rising international commodity prices. Since the second quarter of 2021, the weight of fresh food began a downward trend that has been accentuated since June following the regulations on beef exports by the National Government45. In November and December 2021, as a result of the significant increase in beef, the relative price of fresh food recovered again and ended the year at levels well above pre-pandemic levels (see Graph 3).
Processed foods showed an opposite evolution to that of fresh foods, since since mid-2020 they began to lose relative weight, with increases contained within the framework of the reference price programs launched by the National Government to underpin the real income of families. During 2021, they showed a slight trend towards the recomposition of their relative prices, largely explained by the updates of the lists in the face of the renewals of the current price programs. In November and December 2021, the price freeze under the “+Precios Cuidados” program interrupted the recovery of processed foods, whose relative weight ended the year at a level much lower than that verified before the pandemic.
Graph 3 | Relative prices of food with respect to the rest of the goods in the National CPI
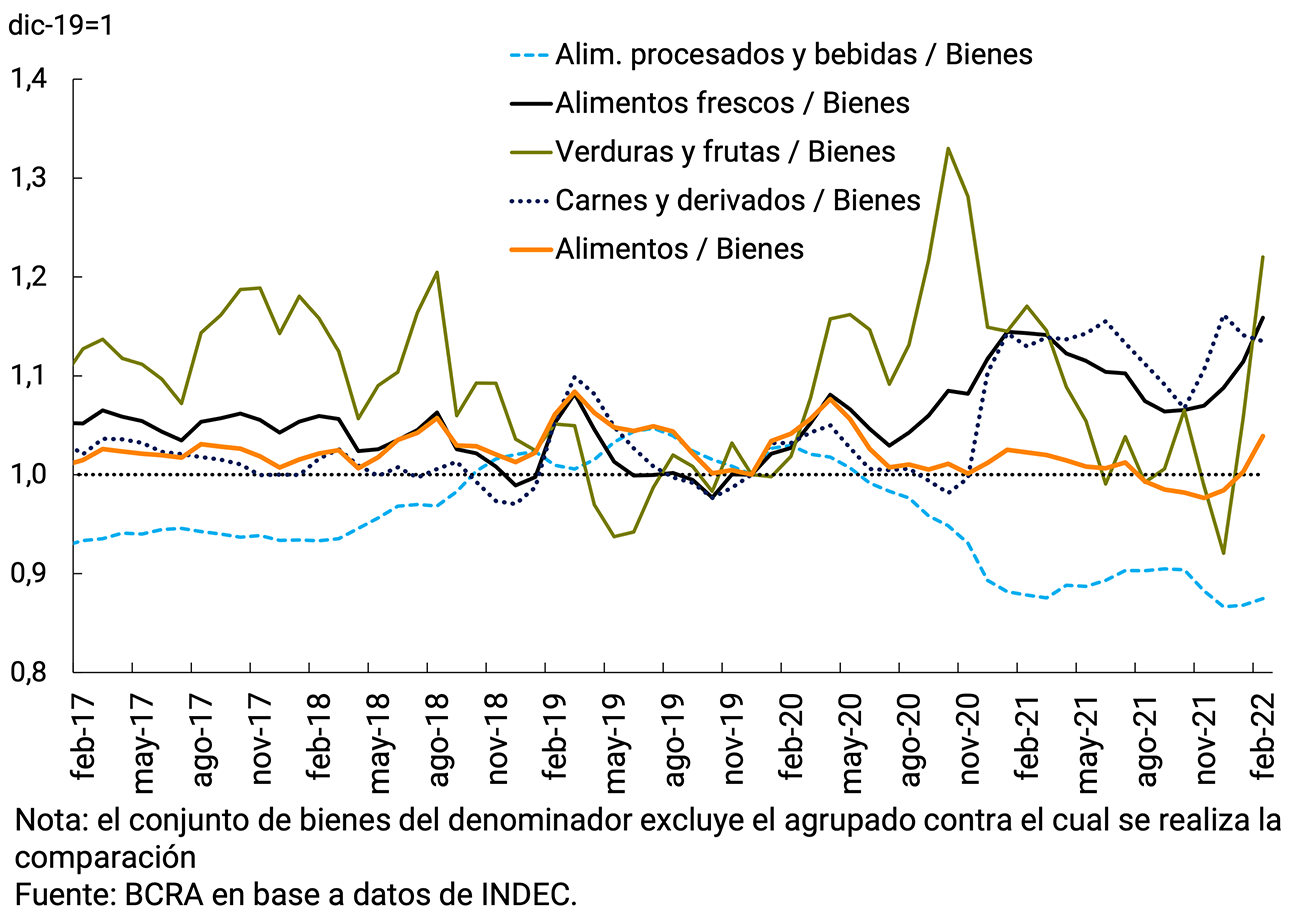
In summary, the onset of the COVID-19 pandemic had a significant impact on several sectors of the economy, generating restrictions on the supply of inputs, affecting face-to-face work, and putting pressure on international commodity prices. To mitigate these effects and preserve the real income of families, the National Government promoted reference price programs for basic consumer goods and kept public service rates practically stable in nominal terms. In this way, the deterioration of relative prices of services in relation to goods was accentuated, a trend that stabilized during the second half of 2021 due to the recovery in private services, which had been more affected during the period of greater restrictions on movement. On the other hand, the evolution of domestic food prices was differentiated, with a marked recovery in the relative prices of fresh food and a fall in processed foods. In the last two years, very significant increases were also observed in the average relative prices of certain goods that were not reached by programs and on which there were supply restrictions, especially in automobiles and clothing. In the medium term, it would be expected that the updates in the rates of public services and the recomposition of the margins of the private service provider sectors will lead to the divergences observed in recent years being attenuated and services to recover part of the relative weight lost. Meanwhile, the rise in commodity prices, driven by the recent conflict between Russia and Ukraine, could put additional pressure on the prices of some goods, slowing down the recomposition of the relative prices of services. In addition, this context could also affect the normalization of the supply of specific goods (such as automobiles), delaying the reversal of the extraordinary increases experienced in recent years. The evolution of the rest of the relative prices of the economy will depend on a set of domestic and international variables that are decisive, among which the real exchange rate, the internal and external demand for each product, international prices, local and/or global supply bottlenecks, and climatic factors stand out. among others.
Paragraph 6 / The reconfiguration of monetary policy instruments
In the last two months, the Board of Directors of the BCRA has taken a set of decisions that reconfigure the monetary policy instruments with the aim of continuing to accompany the path of economic recovery and reinforce the conditions of monetary, exchange rate and financial stability. These decisions seek a reordering of the interest rate scheme and a simplification of the organization of systemic liquidity.
Under the new liquidity management scheme, the monetary regulation instruments were reordered, which were configured as follows:
1-day passive passes: The interest rate paid on these instruments rose to 33.5% n.a. and will be used to manage the short-term liquidity of financial institutions.
7-Day Passive Passes: The interest rate on 7-day passes was reduced twice to 32% n.a., a rate lower than that of 1-day passes, thus seeking to eliminate the incentives of financial institutions to use this instrument. Prior to the modification, this instrument sought to absorb the surplus liquidity that could not be placed in LELIQ with a 28-day term.
LELIQ 28 days: With the regulatory change, the access of financial institutions to the LELIQ was extended to 28 days, which will be able to access this instrument for up to an amount equivalent to the monthly average of the daily balances of fixed-term deposits in pesos of the non-financial private sector of the previous month. Likewise, the interest rate paid on these instruments was raised on two occasions, going from 38% n.a. to 42.5% n.a.
LELIQ at 180 days: A new liquidity bill (LELIQ) was created with a term of 180 days, so that entities can dump the liquidity that cannot be channeled through the LELIQ to 28 days. The interest rate that was set for this new instrument is 44% n.a. In order to access this instrument, financial institutions must have a percentage of fixed-term deposits in pesos constituted by the non-financial private sector with respect to the total deposits in pesos of that sector equal to or greater than 20%.
NOTALIQ at 183 days: To complement the 180-day LELIQ, on February 17 the BCRA launched the Liquidity Notes (NOTALIQ), with the same access conditions. However, this instrument has a variable interest rate that is determined based on the Monetary Policy Rate (MPR; LELIQ 28 days) plus a spread. This new instrument will allow financial institutions to benefit from a hike in the benchmark interest rate, in case they are anticipating an upward path. Otherwise, if the forecast were for a downward trajectory of the monetary policy rate, demand would shift to the 180-day LELIQs that maintain the rate agreed in the subscription.
The changes introduced in the BCRA’s monetary regulation instruments sought to achieve two simultaneous objectives: to refocus the policy interest rate signal on the 28-day LELIQ rate and to create a longer-term instrument (180-day LELIQ/183-day NOTALIQ). The creation of these new instruments continues a policy initiated at the beginning of the administration with the change of the term of the shorter LELIQs from 7 to 28 days in February 2020. Thus, the average residual term of the total stock of LELIQ practically doubled, from approximately 15 to 35 days (see Figure 7.1).
Graph 1 | Average Term of Liquidity Bills and Notes
Moving Average 7 days
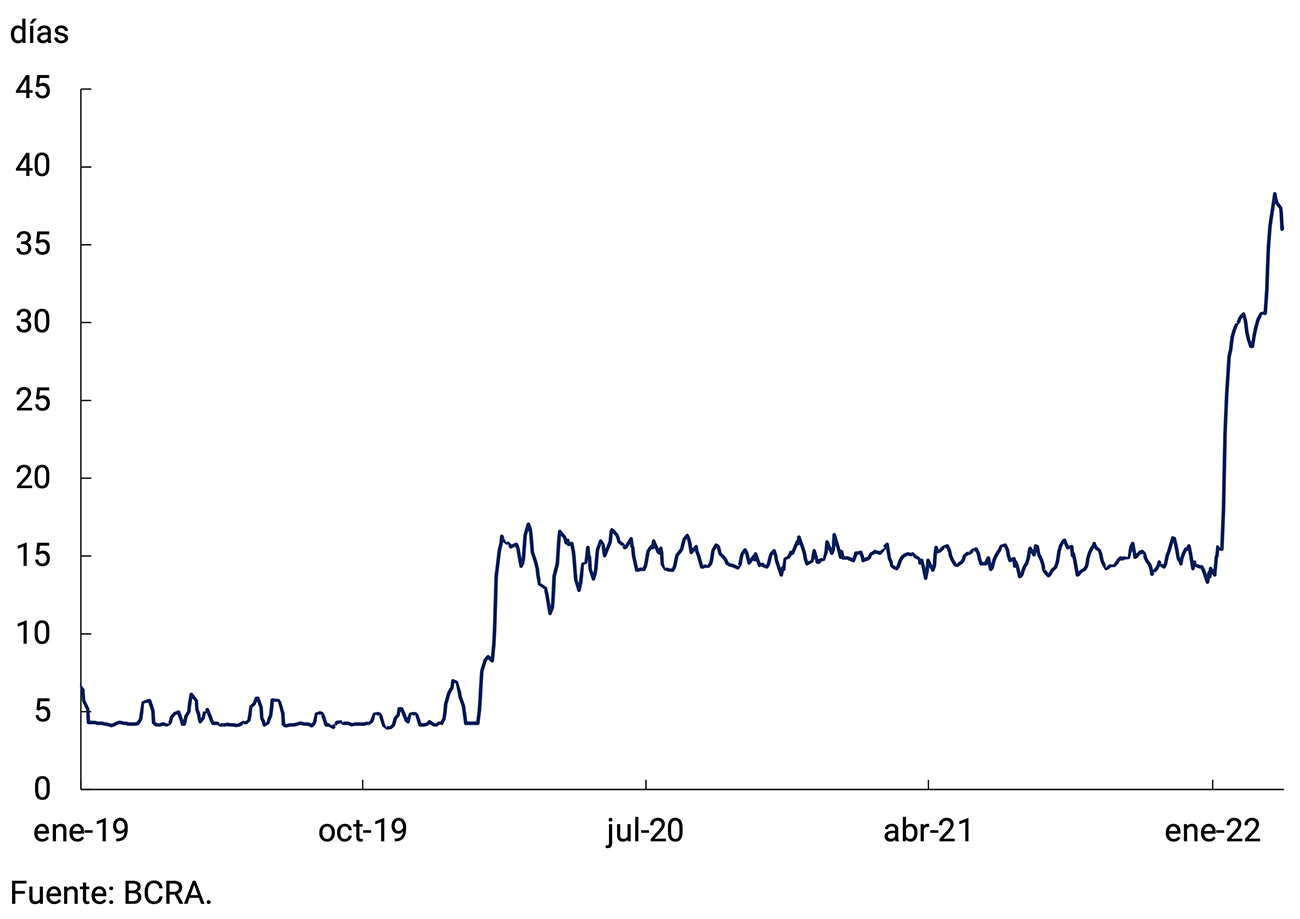
The issuance of longer-term bills has a number of advantages over the monetary policy carried out by the Central Bank. First, it provides greater predictability to the evolution of monetary aggregates, by stretching the maturities of bills that serve to cover the structural liquidity of the entities, and therefore, moderating abrupt movements in the current accounts of the entities in the BCRA (as a counterpart to the decisions to renew these bills). Second, it allows for better liquidity management by financial institutions, which now have new instruments to place their structural liquidity. Third, it enables the BCRA to give interest rate signals in terms of more than one month, allowing the bias of monetary policy and the monetary authority’s vision to be communicated more completely.
Graph 2 | BCRA’s interest-bearing liabilities in pesos
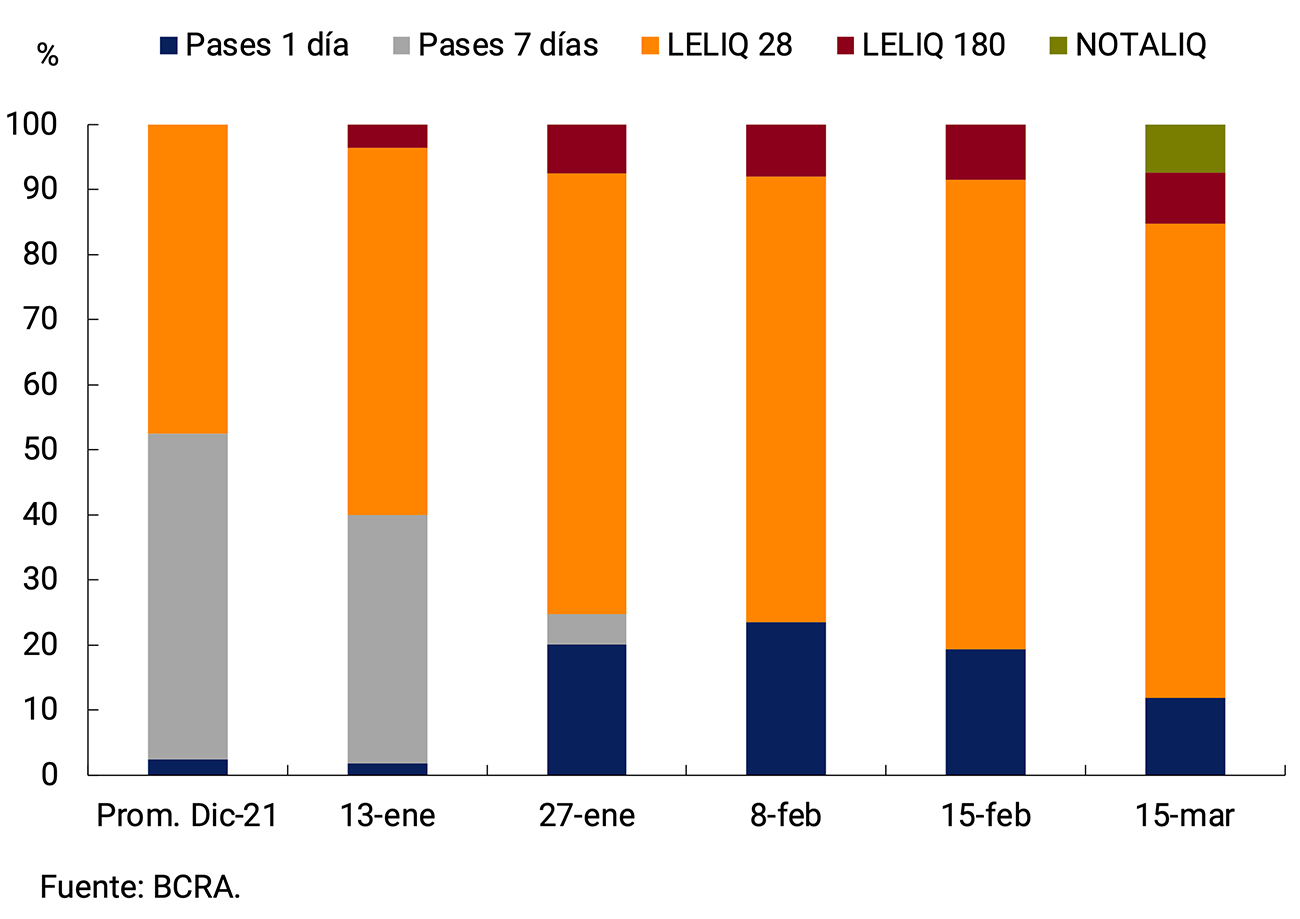
In turn, historically the BCRA has maintained a combination of short- and medium-term remunerated liabilities. Between 2003 and 2014, the entity issued NOBAC with a term of up to 3 years. Subsequently, between the end of 2015 and the end of 2018, the entity maintained LEBAC with terms ranging from 30 to 180 days. In this way, a common practice of recent decades is being resumed.
Changes in the structure and functioning of monetary regulation instruments led to a change in their composition. First, a complete dismantling of the 7-day passes was observed throughout January. It should be noted that in December these represented practically 50% of the total remunerated liabilities. The liquidity that was placed in 7-day passive passes was distributed as follows in mid-March: 25 p.p. were placed in LELIQ at 28 days and 8 p.p. in the 180-day specie, 9 p.p. were arranged in 1-day passes and the remaining 7 p.p. were channeled to NOTALIQ.
The changes in the structure of sterilization instruments were accompanied by an increase in the reference interest rate of sterilization instruments. All in all, the weighted average rate of the BCRA’s interest-bearing liabilities stood at 41.3% n.a. (50.0% y.a.). The increase is in line with the Objectives and Plans presented for the current year and seeks to tend to a level that allows safeguarding the real value of the savings of Argentines. To ensure that the increase in the monetary policy rate is transferred to the rates faced by savers, the BCRA increased, also on two occasions, the rates paid for fixed-term placements. Higher interest rates will help to underpin the demand for savings instruments in pesos, which will help preserve monetary and exchange rate stability.
References
1 http://www.bcra.gob.ar/PoliticaMonetaria/Politica_Monetaria.asp.
2 In the literature, there are several antecedents that have a similar axis of study and focus on Latin American countries (see references). The case of Uruguay is not included due to the similarity of the results with those reported for Argentina in Section 7 of the IPOM of November 2020.
3 As in the case of Argentina, there are two cointegration relationships associated with price dynamics for all countries. The first is associated with the main costs: wages, exchange rate and external prices. The second is related to a balance in the relationship between monetary and exchange variables, activity and the price level.
4 The purpose of this indicator is to anticipate the EMAE pivot points. From Jan-21 onwards, the ILA showed oscillations, but it did not meet all the necessary criteria to indicate a turning point in economic activity that, among the other conditions of diffusion and depth, requires three consecutive months of decline. For more methodological details of the ILA, see Section 3 / BCRA’s Leading Index of Economic Activity published in the IPOM corresponding to January 2017.
5 The Ministry of Health established the application of a booster dose for the population over 12 years of age who have completed a minimum interval of 4 months after completing their initial schedule, prioritizing the population at greatest risk. It also implemented as of 1/1/2022 the “Health Pass” that made it possible to advance in the vaccination of lower age ranges and reduced isolation due to close contact depending on vaccination status and activity, in order to limit the impact of absenteeism on productive and essential activities. In addition, it announced the application of a second booster dose for immunocompromised people over 3 years of age and over 50 years of age who had received the Sinopharm vaccine for the month of March 2022 and enabled the application of other vaccines for travel purposes to those who have received Sputnik V.
6 Gross fixed capital formation, is composed of Construction and Durable Production Equipment (which includes Machinery and Equipment and Transportation Equipment, national and imported).
7 It should be noted that the interference of a shock of magnitude such as the pandemic in II-20 strongly altered the analysis of the seasonally adjusted series, by making it difficult to correctly isolate the purely seasonal effects. Both INDEC and the BCRA incorporated international criteria in the deseasonalization process, which basically consist of the inclusion of outliers in the filtering models of the time series. In some cases, these atypical observations were not punctual and concentrated in a period of time, but persist, affecting seasonality factors even today. It is for this reason that seasonally adjusted variations are very volatile and unstable, so they must be interpreted with caution.
8 The Leading Indicator of Private Consumption is its own index, which includes traditional and non-traditional indicators of the consumption of goods and services, including the quantities sold in supermarkets and shopping malls, credit card consumption (deflated by CPI), units sold of automobiles, imported volumes of consumer goods, VAT collection in real terms and the Consumer Confidence Index. For more details see Section 1/ Private consumption, a variable difficult to follow in real time, IPOM July 2017.
9 With anticipated data, investment in construction would have grown 1.9% quarter-on-quarter s.e. during the fourth quarter, national production of capital goods increased 3.4% quarter-on-quarter s.e. according to FIEL (own seasonalization) while imported quantities of capital goods and industrial transport equipment rose 20.4% quarter-on-quarter s.e. after two quarters with consecutive declines.
10 Favored by the “PreViaje” program, more than 10 million people moved around the country between December 15, 2021 and January 15, 2022, reaching record occupancy figures in all regions, according to data from the Ministry of Tourism.
11 According to the IPI prepared by INDEC, industrial production registered an average increase of 15.8% in 2021 and in December it was at seasonally adjusted levels similar to those observed in March 2018, 11.6% s.e. above the pre-pandemic level. For its part, the demand for construction inputs measured by the ISAC (INDEC) grew by an average of 30.8% in 2021 and far exceeded its pre-pandemic level (26.5% s.e.).
12 Economically active population.
13 As of the date of publication of this report, 89% of the total population has at least one dose, while 81% has the complete vaccination schedule. Likewise, 41% of the population received a booster/additional dose.
14 Among other measures, the National Government established the implementation of the “Registered Program”, the exemption of employers belonging to health-related services, establishments and institutions from the payment of employer contributions and the extension of the payment of double severance pay for dismissals without just cause through a progressive reduction scheme. Likewise, within the framework of the “Extraordinary Support for Solidarity Culture” Program, it granted financial assistance of $15,000 to workers in the cultural sector (Res. 1561/2021 of the Ministry of Culture).
15 Labor Overview 2021. Latin America and the Caribbean, ILO, February 2022, p.13 (see link below).
16 Preliminary Overview of the Economies of Latin America and the Caribbean 2021, ECLAC. (see the following link).
17 Preliminary Overview of the Economies of Latin America and the Caribbean 2021, ECLAC, p.83.
18 Labor Overview 2021. Latin America and the Caribbean, ILO, February 2022, p.44.
19 In this regard, it is important to highlight the implementation, since IV-21 through the National Directorate of Economy, Equality and Gender (DNEIyG), of programs that seek to support the formal salaried private sector from a gender perspective, such as Argentinas al mundo (promotes the exports of companies led by women) or Registradas (promotes the registration of domestic workers by financing between 30% and 50% of the salary for women). 6 months) in addition to various programs in the care infrastructure (creation and improvement of Child Development centers and kindergartens).
20 Proportion of women in a given total population.
22 Soybean oil exports are recorded in fats and oils and soybean pellets are in food industry residues.
23 Gold exports are recorded in precious metals.
24 This valuation does not include the cost of freight and international insurance. It is the one used to compile the statistics of imports of goods in the balance of payments. For this reason, freight payments are posted to the services account of the current account.
25 https://www.indec.gob.ar/uploads/informesdeprensa/ipcext_02_22A4BAA5D901.pdf
26 It should be noted that only the direct impact of the increase in freight costs (international tranche of the good traded between the foreign supplier and the resident importer) is being considered, with the total impact probably being much greater (cost of freight embedded in the chain of intermediate inputs that the foreign supplier used).
27 Following the same line, as of December 2021, new adjustments to foreign regulations and changes with an effect on import payments came into force.
28 See Section 3 of the Monetary Policy Report published in February 2021.
29 Although there are 125 possible combinations of items to define the export pattern, those that are most representative in terms of exported values were chosen.
30 Law 27617 increased the non-taxable minimum and the special deduction for retirees and employees in a relationship of dependency, relieving the low and middle income brackets that were covered by the http://servicios.infoleg.gob.ar/infolegInternet/anexos/345000-349999/348965/norma.htm tax.
31 Law 27630 made modifications to the corporate income tax rates. http://servicios.infoleg.gob.ar/infolegInternet/anexos/350000-354999/350982/norma.htm.
32 The increases in the year were 8.07% in Mar-21, 12.12% in Jun-21, 12.39% in Sep-21 and 12.11% in Dec-21. In this way, they totaled an increase of 52.67% y.o.y. in Dec-21, 1.8 p.p. more than the accumulated inflation in the year.
33 Decree 735/2020.
34 Part of the increase in capital expenditures is due to a low comparison base due to the negative impact of COVID-19 and, at the same time, to a low level of execution associated with the start of the administration in 2020.
35 Starting in March, retirements, pensions and allowances will increase by 12.28%.
36 It is worth mentioning the regulatory modification of the BCRA (Communication “A” 7290) that allowed banks to choose to integrate the fraction of reserve requirements that, until May, was remunerated through LELIQ with instruments issued by the TN in pesos, whose residual term is greater than 180 days (excluding tied to the evolution of the dollar).
37 https://www.argentina.gob.ar/noticias/comunicado-aclaratorio-sobre-la-planificacion-y-decisiones-presupuestarias.
38 Article 2 of Law 27612 on strengthening the sustainability of the public debt provides that “any financing program or public credit operation carried out with the International Monetary Fund (IMF), as well as any increase in the amounts of such programs or operations, shall require a law of the Honorable Congress of the Nation that expressly approves it.”
39 The fiscal path outside the horizon of the 2.5-year extension program envisages reaching primary fiscal balance by 2025 and a primary surplus of around 1.25% of GDP over the medium term.
40 Law 27609 amending Article 32 of Law 24241.
41 Additional tax reductions are planned on certain value-added exports. In addition, legislative and regulatory adjustments are planned to encourage investment and exports in strategic sectors – such as the knowledge-based economy (already approved in 2020), hydrocarbons, mining, agribusiness, and the automotive industry. According to the document, the measures could increase exports by more than US$25,000 million by 2030, approximately.
42 Resolution 1050/2021 – Secretariat of Domestic Trade.
43 During January 2022, the freeze was replaced by a voluntary agreement with quarterly price review for a total of 1,321 products (Careful Prices). The withdrawal of some items from the program and the authorization of price increases in a large part of those that continued to be included helped to explain the significant increase in packaged foods that occurred in January (3.5%) and February (5.1%; see Figure 6.4).
44 The impossibility of operating some service activities made it necessary, when measuring the CPI, to allocate their prices using the evolution of the immediately higher groupings.
45 The set of “Other goods” includes mass consumption goods such as hygiene and personal care items and cleaning products, which are part of the reference price agreement programs.
46 Decree 408/2021.
47 https://www.bcra.gob.ar/archivos/Pdfs/Institucional/ObjetivosBCRA_2022.pdf
48 Communication “A” 7432.
49 The variable interest rate is computed as the simple daily average of the Monetary Policy Rate (MPR) from one business day prior to the issuance of the NOTALIQ to one business day before the maturity date plus a spread that is reported on the day of the auction.
50 Interest-bearing demand deposits and term investments with early cancellation option.
51 Communication “A” 7432.
52 Communication “A” 7395.
53 Communication “A” 7405.
54 Communication “A” 7407.
55 Communication “A” 7408.
56 Communication “A” 7420.
57 Communication “A” 7416.
58 Communication “A” 7433.
59 Communications “A” 7466 and “A” 7469.
60 Primary deficit: 2.5% of GDP in 2022, 1.9% of GDP in 2023 and 0.9% of GDP in 2024.
Share on


