Summary
In 2022, the Argentine financial system continuously developed its functions of providing fund intermediation and payment services. The system maintained moderate exposures to the risks faced and high coverage margins with liquid assets, forecasts and capital.
During the second half of 2022, the Argentine economy registered a variable performance. Although growth in the third quarter was better than expected, economic activity would have slowed in the last quarter of the year. A moderation in the pace of expansion is expected in 2023, based on the more uncertain external scenario due to a greater presence of recession risks at the global level and, at the local level, due to the risks associated with election years, high levels of inflation and the impact of drought, among other factors. The international context is increasingly adverse for emerging economies, mainly as a result of the process of normalization of monetary policy in developed economies after a long period of interest rates at historically low levels. This is in addition to other pre-existing risk factors, such as the persistence of the war in Ukraine (which injects volatility into commodity prices) and the aftertastes of uncertainty regarding the impact of COVID-19 on global growth (with a focus on the health situation in China).
With widespread increases in monetary policy interest rates between countries (including both advanced and emerging economies) and volatility in both currency markets and commodity prices, and in the context of a growing economy at the local level, a series of measures were adopted to contain inflation. The BCRA continued to implement increases in monetary policy interest rates until September, in line with the strategy of establishing a path of rates to tend to positive real returns for investments in local currency and preserve monetary and exchange rate stability. This is complemented by the commitment to control the evolution of monetary aggregates, as well as by interventions (both in the foreign exchange market and in the public securities market in pesos —through open market operations—) that aim to avoid excessive financial volatility. Likewise, the BCRA maintained its credit policy focused on generating stimulus for productive development, renewing the validity of the Productive Investment Financing Line (LFIP). Given the tensions in the peso debt markets and the greater exchange rate uncertainty observed at the local level towards the middle of the year, open market operations were carried out, among other measures. On the other hand, new modifications were introduced to improve the regulatory framework linked to the foreign exchange market given the current context, promoting an efficient use of foreign currency and the accumulation of international reserves. Based on the current policy scheme, in the context of the agreement with the IMF, it is expected to consolidate a framework of macroeconomic certainty, helping to limit expectations about external restrictions and inflation.
In the period under analysis, local financial markets continued to show a mixed performance. The National Treasury continued to finance itself through the local market through placements in pesos, with an improvement in refinancing ratios compared to what was observed during the first part of the year, in a context of rising nominal interest rates. Two asset conversion operations were carried out to clear maturities until the end of the year. For its part, in real terms, private sector financing through the capital market between July and November showed almost no changes in a year-on-year comparison, but shows some recovery compared to the same number of previous months.
With respect to the operations of the entities as a whole, financial intermediation activity fell slightly – a decrease in the balance of credit to the private sector in real terms – compared to the previous IEF and in a year-on-year comparison. In this context, the Argentine financial system preserved most of its features of strength. If any of the risk factors faced were to materialize, the effects that are eventually triggered would have to be very acute – a situation of low probability – to have any significant impact on the conditions of financial stability. Since the publication of the last IEF in the middle of the year, the risks associated with the external context tended to worsen both in terms of global growth prospects, the level of uncertainty and the tightening of financial conditions for emerging economies (higher interest rates in international markets and appreciation of the dollar). As has been expressed in recent IEFs, this tightening of the external context is particularly challenging, given the presence of different types of vulnerabilities and risk factors at the global level, which could eventually trigger negative dynamics with abrupt changes in international markets in terms of flows and prices. Added to this, at the local level, is the incidence of particular factors that include climatic conditions, with the impact of drought, or the potential effect of new strains of COVID-19. These eventual scenarios of greater risk could condition the evolution of the local economy or generate volatility in the financial market, depending on the type of shock faced.
When considering the potential vulnerabilities of the financial system together with its strengths, there were no significant changes with respect to the situation recorded for the previous IEF, highlighting some increase in coverage levels. It is expected that, in the event of an adverse scenario materializing, a systemic response with a high level of resilience will be maintained.
In particular, the equity exposure of all financial institutions to credit risk fell in the last six months, remaining at relatively low levels compared to the last 15 years. Total credit (to the private and public sectors) stood at 43.9% of the total assets of the financial system, falling with respect to the previous IEF mainly due to the performance of the private sector. At the same time, the irregularity ratio of financing to the private sector continued to register a downward pattern, reaching 3.1%. The eventual materialization of the aforementioned risk factors could affect the payment capacity of debtors, generating some degree of tension on the aggregate balance sheet of the financial system given their equity exposure. However, in the aggregate, financial institutions preserve ample and growing levels of forecasts and capital to face possible situations of tension.
The performance of financial intermediation activity remains another potential source of vulnerability for all entities. In this framework, the BCRA’s credit policy focused on the neediest sectors, promoting financing under conditions accessible to MSMEs through the LFIP. Looking ahead to 2023, there is room for intermediation activity with the private sector to regain momentum, based on the higher levels of savings observed in national currency, especially due to the dynamism of traditional fixed-term deposits and those denominated in UVA. However, this could be affected if any of the risk factors described above are verified. In contrast, the financial system maintained positive profitability indicators and high solvency ratios.
The indicators of the financial system’s exposure to liquidity risk presented a mixed performance with respect to the previous IEF: while the concentration of depositors rose slightly (greater exposure), the maturity of funding extended slightly (lower exposure). Looking ahead, a possible scenario of greater volatility in the financial markets or a less dynamic performance of economic activity than expected, could generate changes in the level or composition of demand for deposits and challenges for the financial system. To weigh these potential effects, the banks as a whole maintain ample liquidity coverage.
In short, the Argentine financial system begins 2023 with a significant degree of strength, underpinned by high solvency and liquidity margins, which would allow it to act with resilience in the event of a situation of tension that may arise from the materialization of the identified risk factors. The BCRA will continue to carry out its task of macroprudential monitoring of the financial system and, if necessary, to promote policy actions in order to sustain financial stability conditions.
1. International and local context
The international outlook continued to deteriorate since the publication of the last IEF, mainly due to the increasingly restrictive bias of monetary policies at the global level, in response to the greater inflationary pressures that exist. Added to this is the uncertainty generated by the continuity of both the war in Ukraine (injecting volatility into commodity prices) and the problems in international supply chains (which arose in the context of COVID-19 and are still affected, for example, by the pandemic situation in China – conditioning the level of activity). These factors have been impacting economic activity globally, with greater risks of recession1.
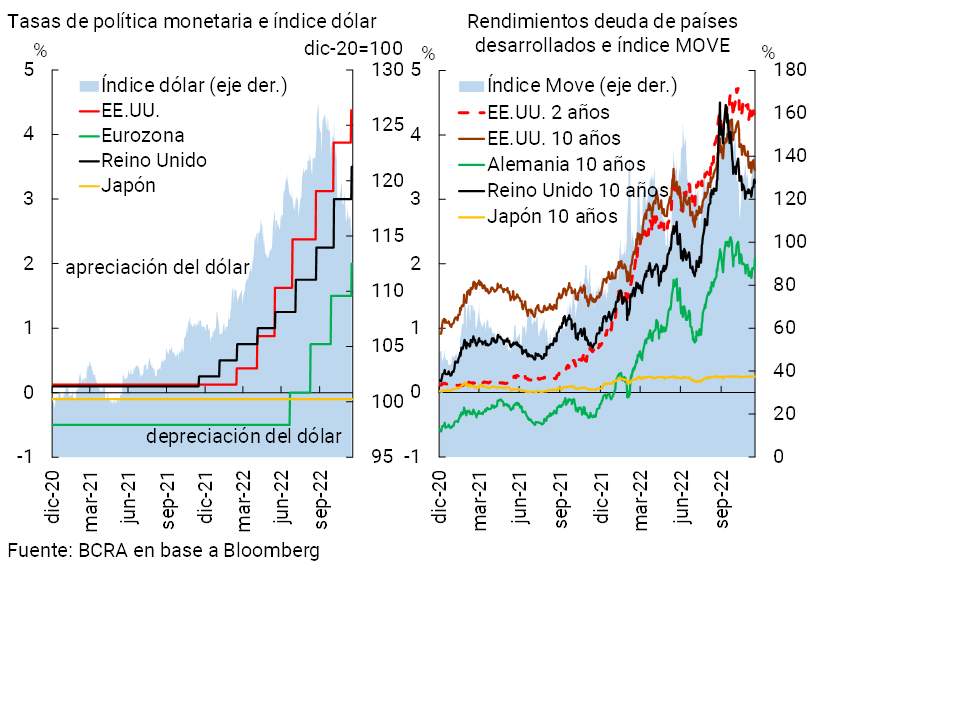
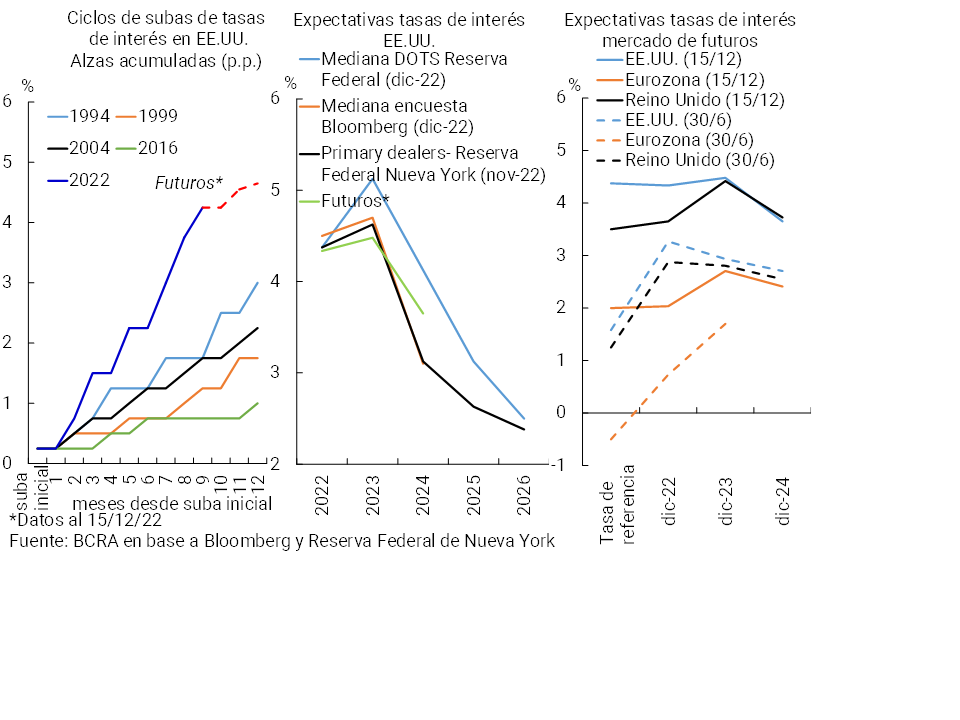
In the specific case of developed economies, the generalized rise in interest rates has accelerated in recent months (see Chart 1). With rising yields on the debt of these economies, financial markets in general show more adverse conditions, although so far this has not generated disruptive events that compromise financial stability at the global level. In terms of US Treasury debt, the rise in its yields (which serve as the basis for the pricing of emerging economies’ dollar debt) occurred until mid-November and was accompanied by expected increasing volatility for the prices of these instruments. Likewise, the US sovereign yield curve shows a certain negative slope, generally associated with recessionary contexts. For its part, given the rate differentials, the dollar appreciated 9% in the year against the rest of the main currencies (DXY dollar index), although so far in the second half of the year the accumulated variations are marginal2. With respect to the assets with the highest relative risk, the VIX index (expected volatility for US stock prices)3 remained at levels similar to the average for the first half of this year (26%), above the average computed in 2021 (20%, in line with the historical average of the index). Since the publication of the last IEF, the stock markets of developed economies have accumulated some improvement (largely due to the advance recorded since mid-October). For their part, the prices of the main cryptocurrencies show mixed changes4.
Graph 1 | Developed Country Interest Rates and the Dollar
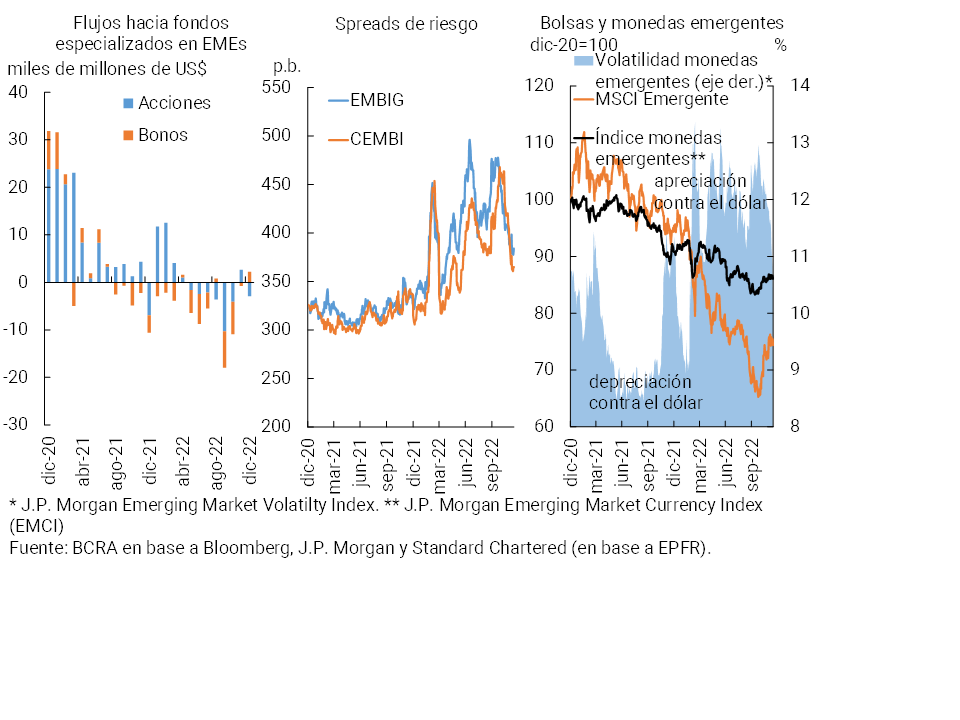
The environment of higher interest rates in international markets and appreciation of the dollar against the rest of the currencies is particularly challenging for emerging economies. Thus, in terms of risk monitoring, in the coming months the focus will remain on the evolution of expectations regarding the monetary policy bias in developed economies and its impact (see Section 1). So far in the second half of the year (until mid-December) the spread of sovereign and corporate debt in dollars (EMBI and CEMBI) registered some decrease (with yields in dollars on the rise). For its part, the equity segment retreated (the MSCI in dollars fell 4%), in a context in which emerging currencies depreciated against the dollar (almost 3% according to the EMCI index)5 and the expected volatility for these currencies (VXY index) widened (see Chart 2). These variations in prices occurred in months in which outflows from investment funds specialising in emerging markets increased.
Graph 2 | Prices linked to emerging economies
In Argentina, economic activity continued to improve in IIIT-22, with higher-than-expected growth, although some slowdown is expected in IVT-22. However, the economy would expand by more than 5% in 2022. The particular dynamism of the most affected service sectors in 2020 stands out, in addition to mining and fishing, industry, commerce and construction. In this context, the BCRA maintained its credit policy focused on stimulating productive development, renewing the validity of the Productive Investment Financing Line (LFIP) (see Box 1). Given the acceleration in the general price level (affected by the tensions in the peso debt markets and the greater exchange rate uncertainty observed at the local level towards the middle of the year) and in order to normalize monetary policy and progressively converge towards positive real interest rates, the BCRA continued to implement increases in the monetary policy interest rate until September. This was complemented by additional measures to maintain financial stability, including open market operations (see next paragraphs) and the deepening of coordination efforts with the Ministry of Economy to adjust the interest rate structure. A continuous calibration of the nominal exchange rate was maintained (to maintain external competitiveness) and new measures were introduced to improve the regulatory framework linked to the foreign exchange market given the current context, promoting the efficient use of foreign currency and the accumulation of international reserves. For example, measures were implemented to promote the liquidation of soybean exports and by-products. On the other hand, within the framework of the program with the IMF, measures continued to be implemented to consolidate the process of reducing the fiscal deficit, reducing monetary financing, and increasing net international reserves for the rest of 2022 and 2023. In this regard, the fulfillment of the IIIT-22 goals with the IMF was recently announced.
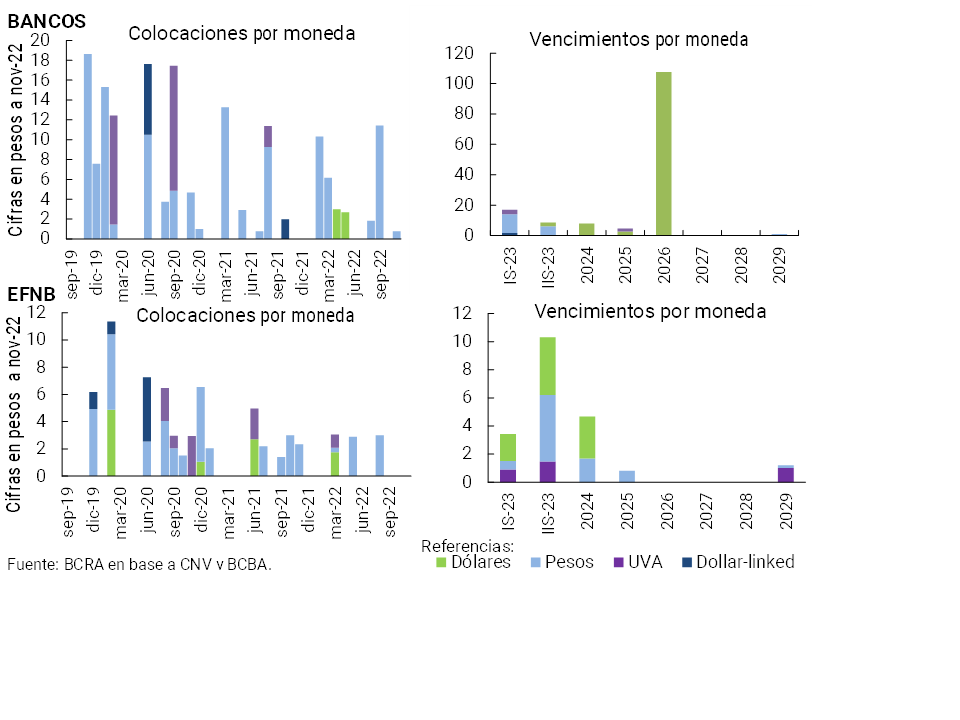
The National Treasury continued to finance itself through the local market through placements in pesos. In cash tenders, an improvement in refinancing ratios was observed compared to what was observed during the first part of year6. In addition, the Treasury carried out a major asset conversion operation in August, contemplating instruments maturing in the following 90 days (whose eligible balance was equivalent to approximately one fifth of the balance of the debt payable in pesos). About three-quarters of the payments linked to exchangeable instruments were refinanced, through the delivery of dual-currency bonds maturing between June and September 2023 (dollar-linked / CER). This was complemented by an additional swap in November (corresponding to the maturities of the last two months), delivering the same type of instruments. In ordinary tenders, the awards were concentrated in short-term bills, mainly LECER and LEDES. As a result, the average placement term contracted, while validated yields increased, in line with what happened with other reference rates (see Chart 3).
Graph 3 | Interest rates and fixed income instruments in Argentina
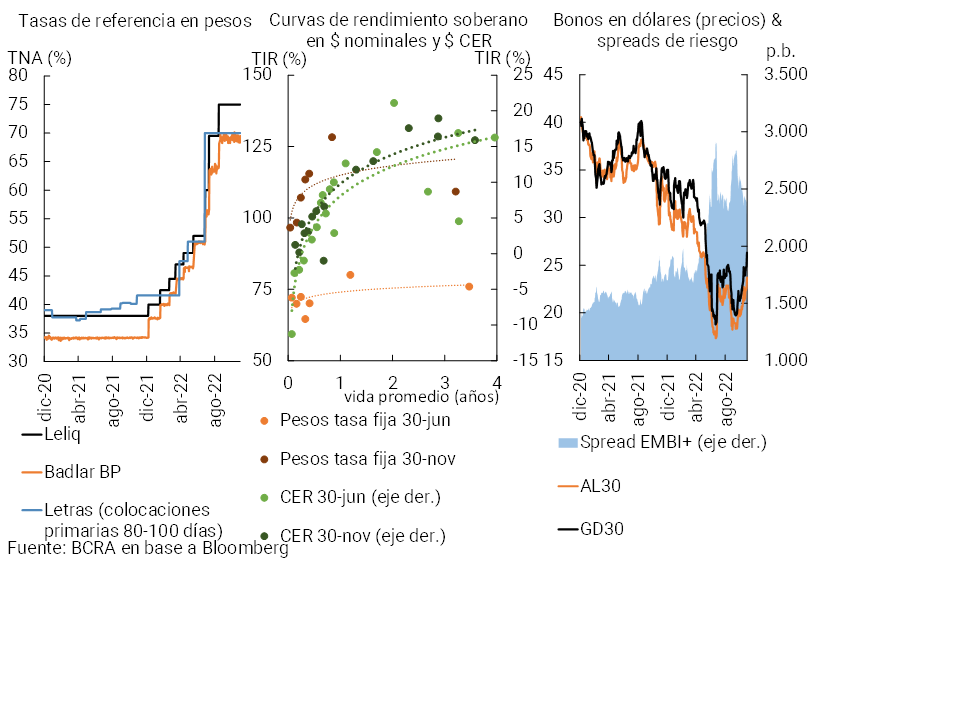
As mentioned, after the prices in the secondary market showed a deterioration in the middle of the year, the BCRA implemented a series of measures. On the one hand, the BCRA sought to reduce financial volatility through open market operations (OMA), reaffirming its commitment to operate on the yield curve of public debt in local currency and ensuring that yields in the secondary market do not excessively exceed those arising from primary auctions7. In addition (“Com. “A” 7546″), the monetary authority began to offer financial system entities, in exchange for a premium, the put option on Treasury securities awarded as of July (maturing before December 2023). In addition, the FCIs were allowed to carry out transfer operations with entity8. These measures are in line with the objective of contributing to promoting a deeper capital market and safeguarding financial balance (anticipating and addressing situations of vulnerability)9. Although in recent years progress has been made in the reconstruction of the peso debt market, it is still in the process of development and with room for growth. A more liquid, deeper, and more transparent peso debt market facilitates, among other factors, the reduction of liquidity risk faced by investors (including banks), more efficient debt management by issuers, and a better valuation of financial instruments (contributing to a more efficient channeling of funds)10.
In line with the increases in the monetary policy rate and the interest rate structure, the yields on debt in nominal pesos in the secondary market reflected increases (of up to 40 p.p.) in the second half of the year. In the case of debt with CER adjustment, after the period of tension, the yield curve tended to flatten, with yields returning to positive values again for the shorter maturities (which were trading in negative values at the end of June) while there was a decline in those in the longest section of the curve. In the case of dollar instruments, the yield curve remained inverted and with increasing yields in the shortest part of the curve.
So far in the second half of the year (July to November), the amount of private sector financing through the capital market – which involves placements in ON, deferred payment checks, promissory notes, FFs, shares and others – remained practically unchanged in year-on-year terms (see Chart 4), with annualized flows representing about 2% of GDP. On the other hand, against the same number of months immediately before, there was a 16% growth in the amounts of financing expressed in constant currency, mainly explained by the dynamism of promissory notes11 (their amount grew 162%, to account for 26% of total financing flows in the period, more than doubling their weighting). The weighting of this instrument was close to that of deferred payment checks (whose amount remained practically unchanged in real terms compared to previous months and accounted for 30% of total flows between July and November). In the case of the ONs, the main financing vehicle (it accounts for 33% of the flows in the period), the amount contracted 5% in constant currency against the same number of immediately previous months. Among the NOs, the operations of the oil and energy sector12 stood out, while in terms of currency, funding was carried out mainly through placements in pesos, followed by dollar-linked ones. In contrast, the amount of financing through financial trusts, mainly related to consumer credit13, fell 13% in constant currency compared to previous months (representing 10% of the financing flows considered in this period), a decrease that stands at 14% year-on-year.
Figure 4 | Financing the private sector through the local capital market
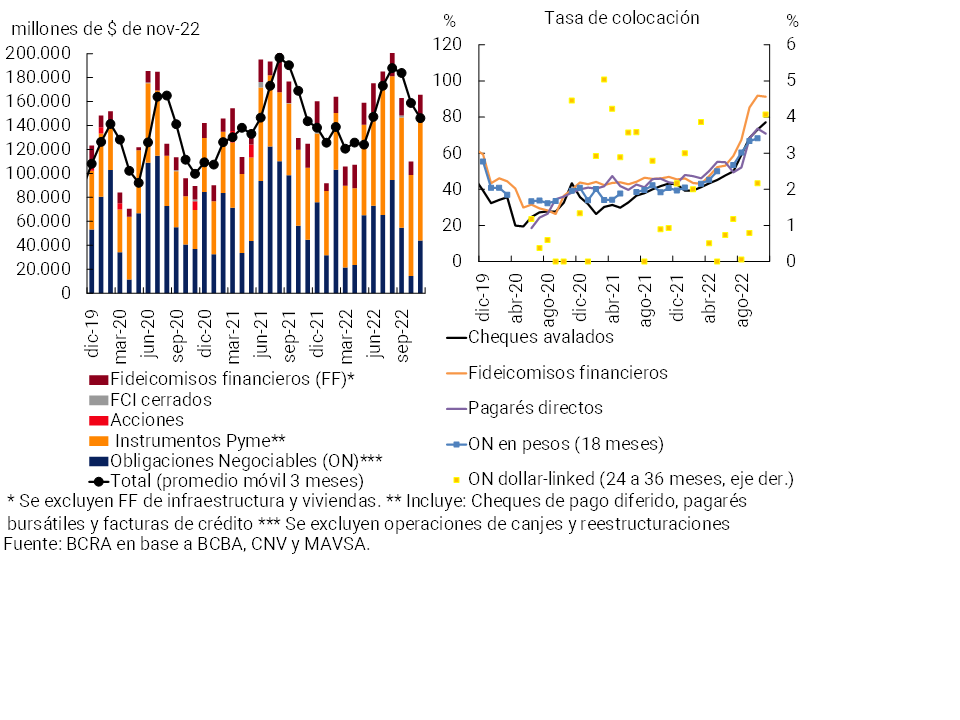
With respect to the conditions of the new financing, the placement terms for the different capital market instruments tended to be shortened in general14, while there was a rise in yields, in line with the main reference rates15.
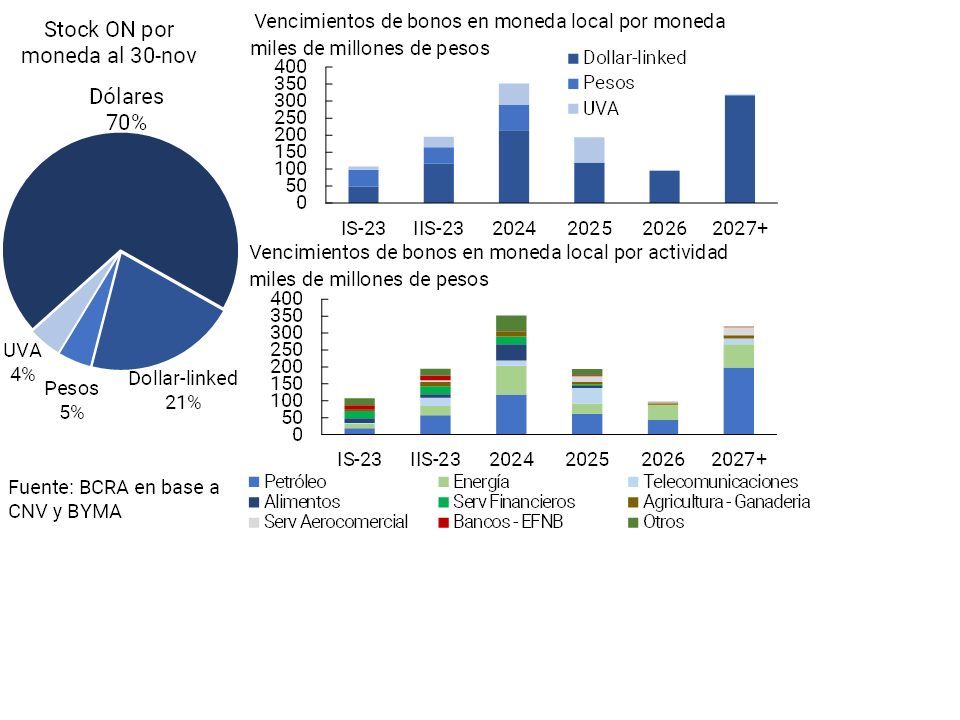
Finally, regarding the profile of ON maturities, payments for the first half of 2023 total the equivalent of about $360 billion. In this sense, given that most of the outstanding balance of ON is denominated in dollars, about 70% of payments are in that currency and the rest are payable in local currency (dollar-linked, pesos and UVA)16 (see Graph 5). However, given the recent renewal of the tool implemented by the BCRA for the refinancing of foreign currency liabilities until the end of 202317, they could be alleviated. On the other hand, the maturities of ON payable in pesos (nominal pesos, UVA and dollar-linked), correspond mostly to operations in the financial sectors (mostly non-bank financial services, in addition to banks and EFNB), oil and food.
Graph 5 | Total stock of NOTES by currency – Maturity profile (focus on those payable in pesos) by currency and economic activity
Box 1 / Credit to SMEs and Financing Line for Productive Investment
In 2022, the BCRA continued to consolidate its credit policy focused on the development of the productive sector, mainly MSMEs. Since its launch in November 2020 and until October 2022, the Financing Line for Productive Investment (LFIP) became the main instrument to boost credit to MSMEs, accumulating disbursements of almost $3.3 billion and reaching more than 327,200 companies. It is estimated that the balance of the LFIP at the end of the third quarter of 2022 totaled $932,800 million, equivalent to 12.5% of the total balance of credit to the private sector. Almost 41% of the total balance of the LFIP was channeled to financing investment projects. In order to continue facilitating financing for MSMEs, in September the BCRA extended the LFIP until March 202318. In terms of credit risk materialization, the irregularity ratio of debtors who maintain loans channeled through LFIP remained below the indicator corresponding to all companies (0.6% vs. 3.2%).
Since the last IEF, it is estimated that more than 2,800 companies that did not have previous bank financing have been incorporated into the financial system through the LFIP, reaching a total of almost 15,000 new companies since its launch. In line with what was recorded in the last IEF, almost all the companies (94%) taking the LFIP registered a staff of less than 100 employees. It is estimated that 20.7% of the total number of people with registered employment in the Argentine private sector belong to companies that take out financing with LFIP (+1.2 p.p. above the April 2022 record)19.
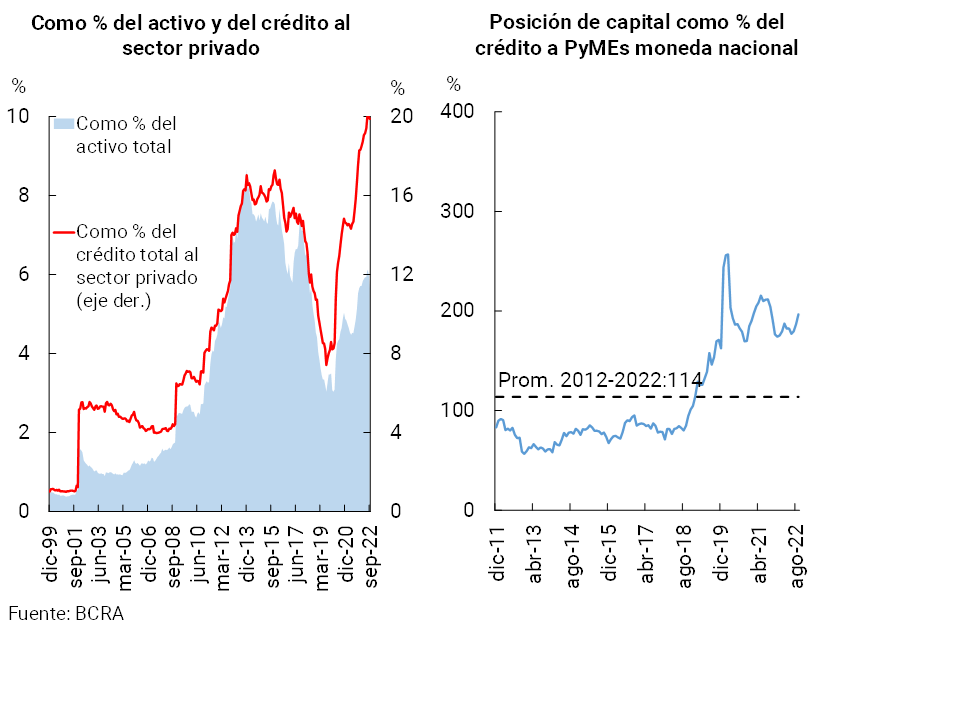
As a result of the LFIP’s impetus, at the aggregate level, the balance in pesos of bank financing to SMEs (legal entities) has been increasing since the beginning of 2020, to account for almost 20% of the total balance to the private sector as of September 2022 (+4.1 p.p. y.o.y.), 5.6% of the assets of the financial system (+0.8 p.p. y.a.) (see left panel of Graph R.1.1) and represent 1.7% of GDP (+0.3 p.p. y.o.y.). Against this backdrop of marked dynamism in lending to SMEs, it is worth highlighting the degree of resilience of the system in the event of a situation of materialisation of credit risk in this segment. In this regard, as of September, the surplus capital of the group of entities totaled 197% of credit to SMEs in national currency, 7.7 p.p. below the level observed a year ago and well above (83 p.p.) the average of the last 10 years (see right panel of Graph R.1.1).
Figure R.1.1 | Credit to SMEs in national currency
2. Main strengths of the financial system in the face of risks
Throughout 2022, the Argentine financial system carried out its functions of providing funds intermediation and payment services on an ongoing basis. During the year, moderate risk exposures and high coverage were maintained, preserving most of the strength traits identified for the sector in the previous IEF. The most important positive aspects are reviewed below, and in the following sections, these traits are considered in greater detail, along with other attributes when assessing the potential sources of vulnerability of the financial system.
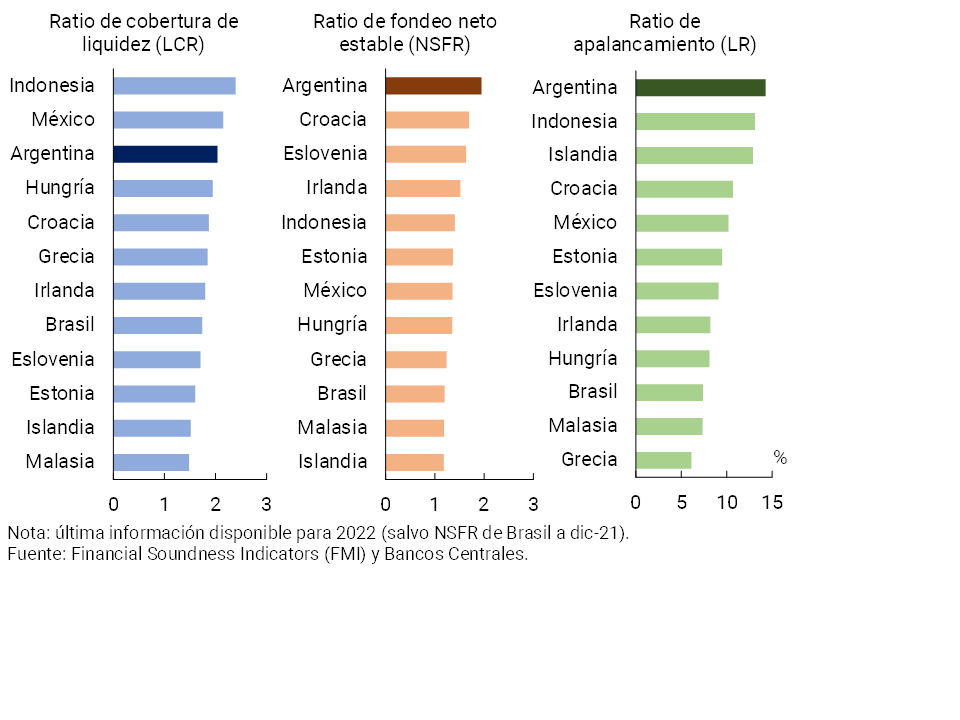
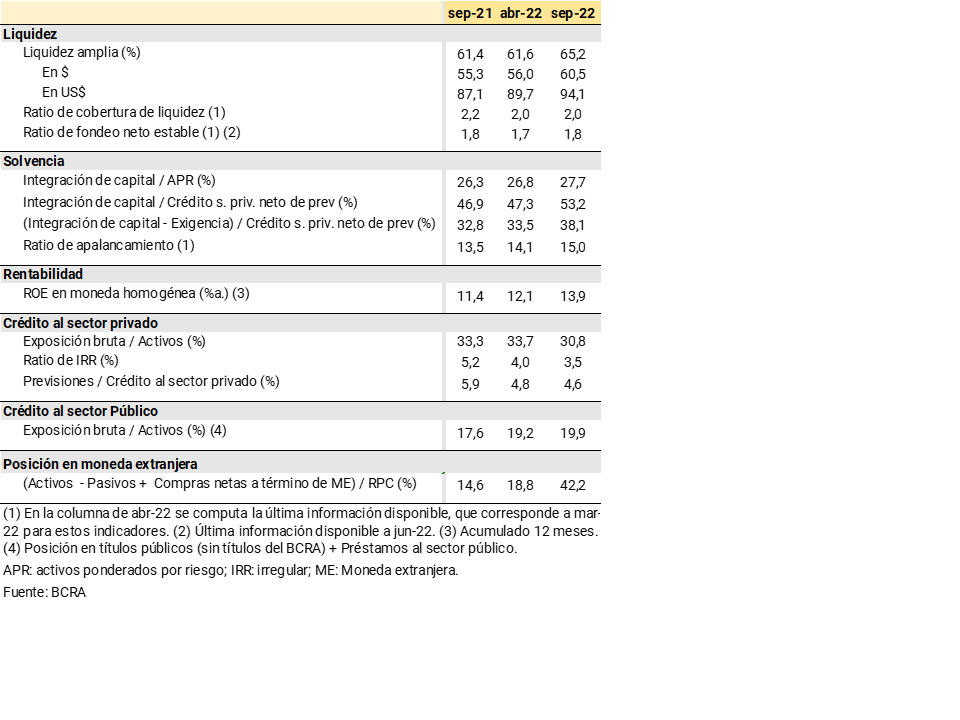
i. High liquidity indicators. Taking into account international liquidity standards, such as the liquidity coverage ratio (LCR) and stable net funding ratio (NSFR) recommended by the Basel Committee, the group of entities required to verify them (Group A)20 continued to comfortably exceed the regulatory minimums, without showing significant changes in the last year. Local levels for these indicators remain relatively high when compared to those recorded in other financial systems (see Figure 6).
Graph 6 |Basel III Ratios – International Comparison
In September 2022, the liquidity in the broad sense21 of the financial system stood at 72.3% of total deposits (68.6% in the segment in pesos and 95.7% in foreign currency), being higher than those evidenced in the previous IEF and in the same period of 2021 (for more details on liquidity coverage, see Section 3.3).
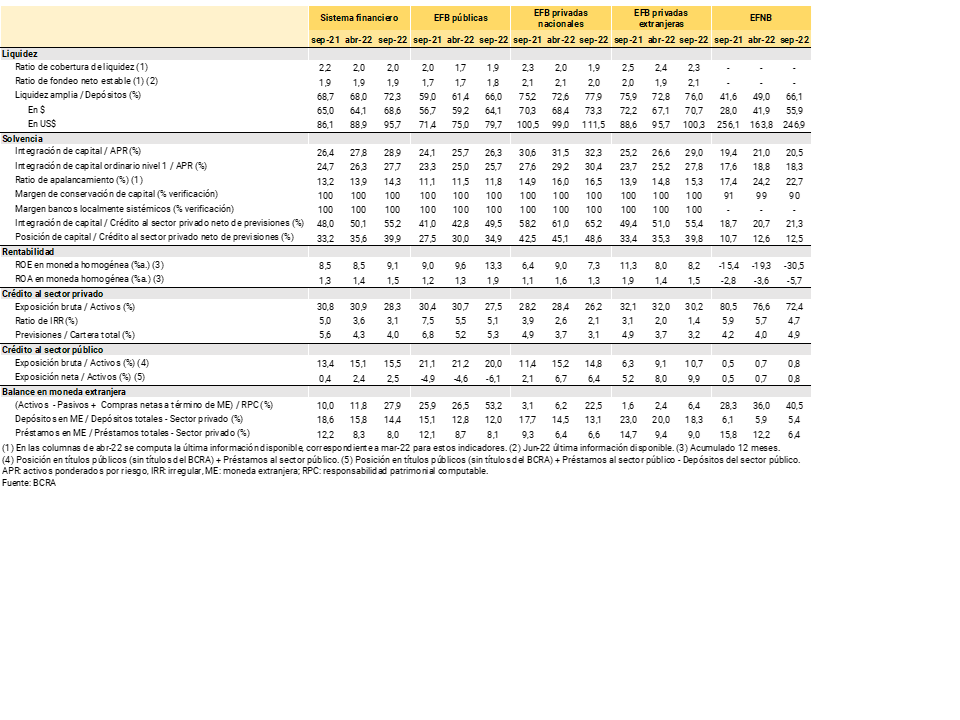
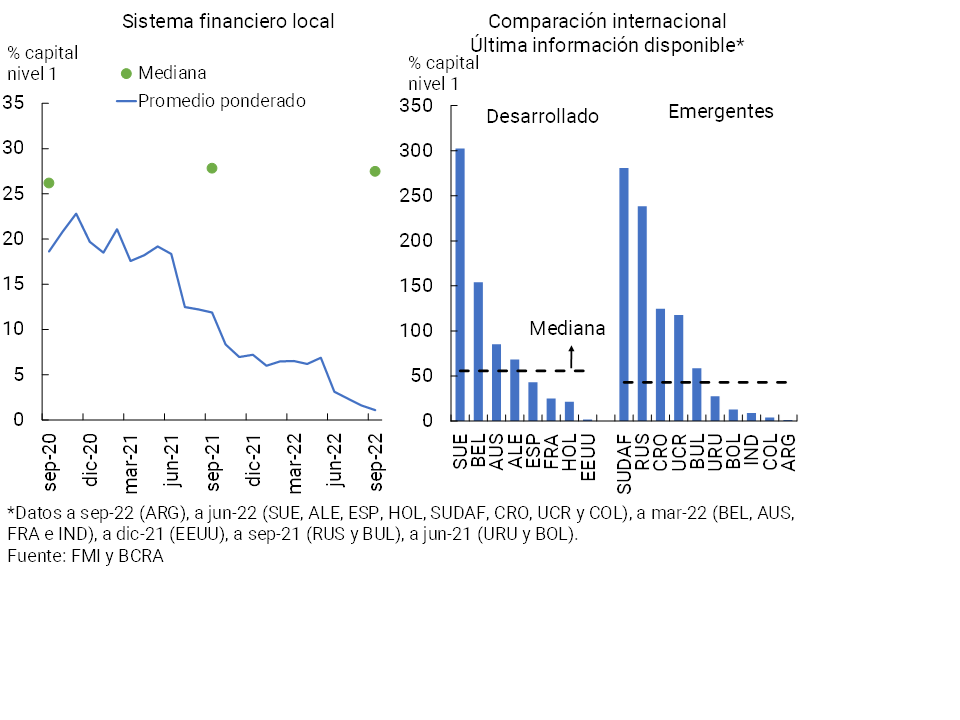
ii. High levels of solvencyCompared to the previous IEF and in a year-on-year comparison, the aggregate financial system slightly increased its level of capital integration (RPC) in terms of risk-weighted assets (RWA), standing at 28.9% in September (see Table 1). The excess capital position (PRC minus the minimum regulatory capital requirement, before considering additional capital margins (conservation and systemic importance) accounted for 260% of the regulatory requirement (see Section 3.1 for more detail).
Table 1 | Main indicators of the soundness of the financial system
In addition to the minimum capital requirements, the banks as a whole also maintained a high level of leverage ratio (defined according to the standard recommended by the Basel Committee), well above the minimum (3%) required in local prudential regulation. This indicator increased slightly compared to the previous IEF and in a year-on-year comparison and exceeds that observed in other financial systems (see Chart 6).
In recent quarters, positive levels of profitability for the aggregate financial system have been maintained (see Section 3.2), underpinning the aforementioned solvency indicators. In addition, these high levels for capital ratios were verified in a context in which a gradual (and moderate) distribution of dividendswas recorded in 2022 22 (see Section 3.1).
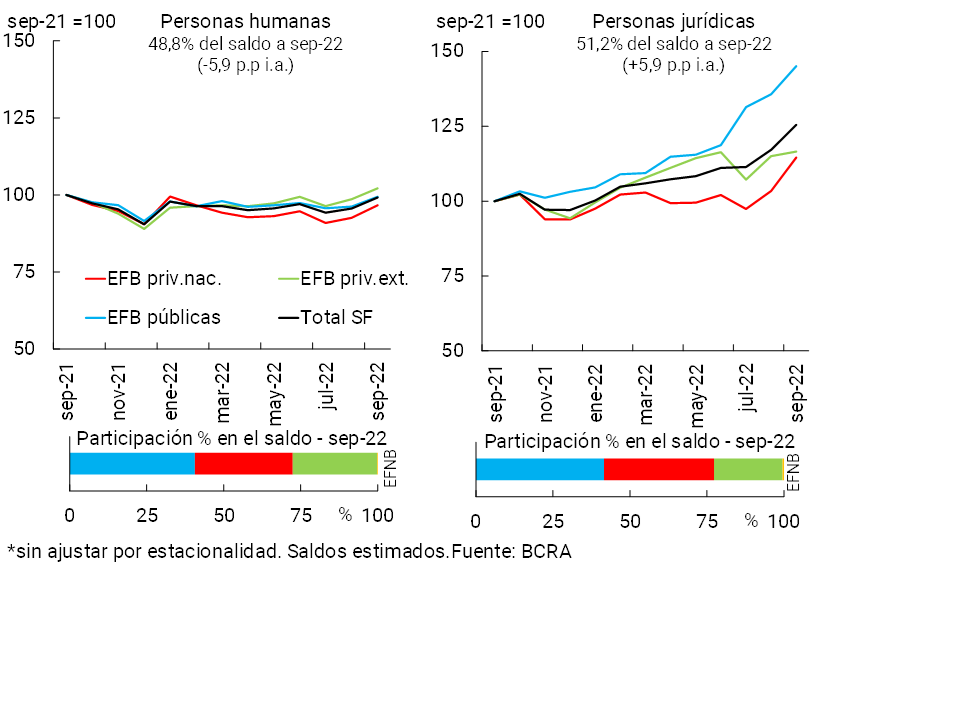
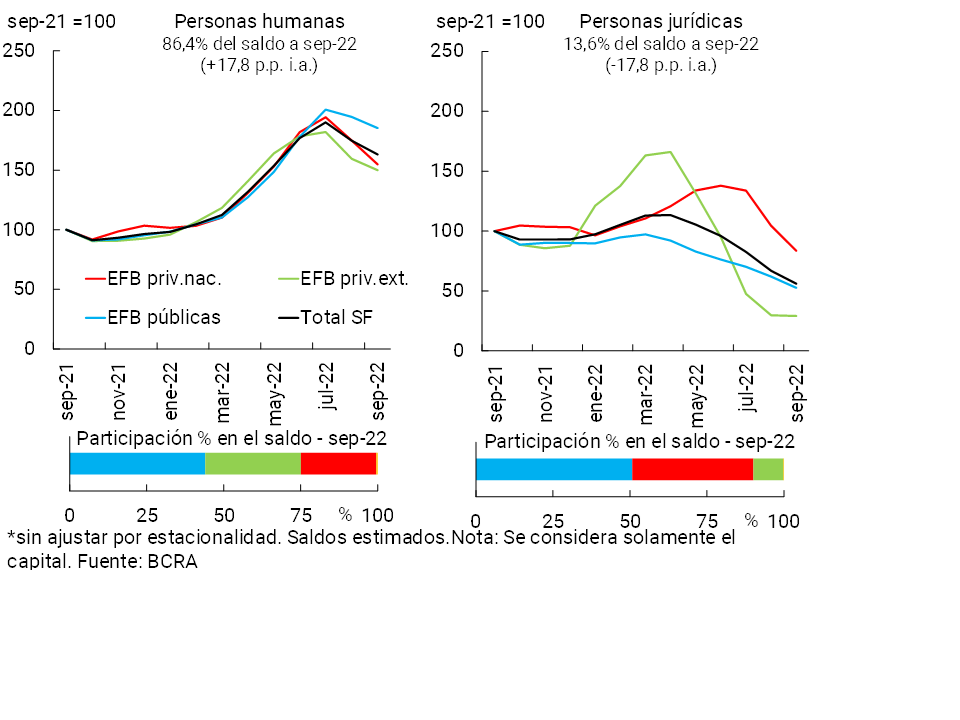
iii. Low relative importance of credit to the private sector in foreign currency and private sector deposits in foreign currency in the aggregate balance sheet of the sector. Financial intermediation in foreign currency remained at moderate and declining levels in the last year (see Section 3.2). Loans to the private sector in foreign currency (mostly channeled to companies whose revenues are correlated with the exchange rate) account for only 8% of the total credit balance to the private sector in September 2022, falling compared to the last IEF and in a year-on-year comparison (being low values compared to the average of the last 10 years, of 13.4%). Deposits in the same denomination totaled 14.4% of private sector deposits, a lower ratio than that evidenced last April and a year ago (also moderate in relation to the average of the last 10 years, of 19%).
iv. Low exposure to credit risk in the private sector with a decrease in the irregularity ratio and high forecasting. At the end of the third quarter, the exposure to the private sector of all financial institutions reached 28.3% of total assets, falling compared to the level verified in the previous IEF and compared to September 2021. This indicator is lower than the average of the last 10 years (42%).
In September, the non-performing loan ratio to the private sector stood at 3.1%, maintaining a downward pattern over the last 12 months (see Section 3.1), with lower levels of non-performing loans in longer-term financing, such as mortgage lines that received a set of state support policies to address the sectoral situation (see Section 2). The forecast for the sector totaled 4% of the total portfolio of the private sector and 129.2% of that in an irregular situation (+18.5 p.p. y.o.y.) (see Box 2).
Given the strengths mentioned above, it is expected that – if an adverse scenario materializes – the Argentine financial system will maintain a response consistent with a high degree of resilience. The main risk factors faced by the Argentine financial system (exogenous to all entities) in the short and medium term are summarized below. It is estimated that an eventual scenario where a materialization of risk factors is verified would have to be very extreme (i.e., it would be a very low probability event) to have a significant impact on financial stability conditions.
Aggravation of the deterioration of the external context, given the risk factors and vulnerabilities existing at the global level. The external context shows an increasingly complex outlook for emerging economies, based on the process of interest rate hikes in developed economies, the generalized appreciation of the dollar and the expectations of economic slowdown worldwide (with the possibility of recession and impact on commodity prices). With various sources of vulnerability present at the global level (assets still overvalued in certain segments, greater incidence of investment funds with procyclical behavior that affects portfolio flows, tendency to generalized growth of debt between companies and countries, possible contagion of further falls in the prices of cryptoassets) and given the more adverse financial conditions, The possibility remains that different factors23 will abruptly affect risk appetite at the global level, triggering new episodes of turbulence in international markets. In this sense, depending on the nature of the shock that materializes, its impact may be more linked to global economic activity (and lower international trade) or more linked to global markets and the financial channel (generalized price falls and disorderly capital movements). In the first case, the level of activity would be more directly conditioned at the local level (affecting the demand for credit and the risk of repayment of the different types of agents). In the second case, greater volatility in financial markets (including interest rates and exchange rates) would impact the conditions in which financial intermediation takes place (both in terms of funding and applications) and on the credit risk faced by banks.
Risk of a greater-than-expected slowdown in economic activity and/or greater volatility in the financial market. Although economic activity in Argentina has continued to recover, with higher-than-expected growth in IIIT-22, the dynamism would have slowed down in IVT-22 and for 2023 the expectation is of a slowdown. The performance of the activity will depend on additional factors, which include not only the evolution of the external context but also idiosyncratic issues such as the evolution of the climate and its impact on agricultural production, with a still uncertain impact of the drought on 2023. Added to this is the progress in large-scale investment projects linked to the energy sector that would affect the trade balance and the objective of accumulating international reserves and, on the other hand, the context of greater austerity of fiscal policy, in addition to the challenges involved in reducing current inflation levels and the uncertainty typically associated with election years. Economic growth will also depend on maintaining a stable context in the financial and exchange markets. The measures applied during the episodes of tension in the middle of the year and the continuous monitoring carried out by the BCRA of the evolution of the public securities markets (and the structure of interest rates) and foreign exchange would contribute to this. If growth is less robust than expected or a resurgence of certain tensions in local markets, and depending on the intensity of these eventual developments, this could condition the context in which financial intermediation is carried out and increase credit risk in the system.
Growing operational risk, in a context marked by financial innovation and greater dependence on technology. Given the emergence of new operations, financial digitalization and the rise of teleworking, the financial sector is more exposed to the materialization of shocks linked to information technologies (including fraud and/or cyber-attacks) that can imply losses or penalties and even affect the general functioning of markets, depending on their scope. In recent years, intense work has been done in order to adapt the processes to monitor and mitigate this type of risk. Although so far there have been no systemic situations linked to this type of event in the local market, awareness, prevention and supervision efforts are maintained to improve cyber-resilience.
In the medium and long term, there are additional risk factors to be aware of. These include, for example, the risks involved in the growth of the use of cryptoassets worldwide, due to the volatility of their prices and the challenges they imply for the implementation of monetary and exchange rate policy in emerging economies (such as Argentina, although their use at the local level is limited so far)24, among others. On the other hand, the risks linked to climate change have generated a work agenda at the international level, including Argentina as a member of different global forums and institutions (See Box 3), to improve the available information and the monitoring of the channels through which the financial sector would be affected. Additionally, given the progress in the normalization of the policies implemented during the COVID-19 pandemic, it remains to be seen in the medium term what structural changes will be to be faced in a post-pandemic context (for example, changes in the business models of different sectors of the economy – in addition to the financial sector – and their impact between different markets and regions).
The results of the financial stability analysis are explained in more detail in the next section. The main sources of vulnerability identified for the local financial system are considered, given their exposure to the aforementioned risk factors. These sources of vulnerability are analyzed in contrast to the strengths of the financial system, to assess under what conditions of resilience the system would face the eventual materialization of risk factors.
Box 2 / Credit Risk Sensitivity Exercises
In line with what has been shown in previous editions of the IEF, two sensitivity exercises are developed here to graph the degree of resilience of the aggregate financial system in the face of the possible materialization of adverse, extreme, and hypothetical (unlikely) credit risk situations25. The exercises seek to estimate the effect of the one-off impact (without second-round consequences, for example) on the solvency of all institutions in the face of non-payment by debtors.
Exercise 1: assumes that (i) the irregularity ratio of credit to the private sector increases to the maximum reached in the last 15 years (for each institution); that is, periods of increases in the indicator are included in 2008-2009 (mainly in the segment of credit to households) and the end of 2019 (mainly in credit to companies); (ii) non-payment of all irregular financing (net of estimated forecasts for them)26. Based on data from September 2022, it is estimated that after the shock, the median capital position (PRC – Capital Requirement; in terms of requirement) of the financial system would go from 229% (weighted average of 259.6%) to 191.6% (weighted average of 238.6%, see Chart R.2.1).
Figure R.2.1 | Capital Position Sensitivity Exercises
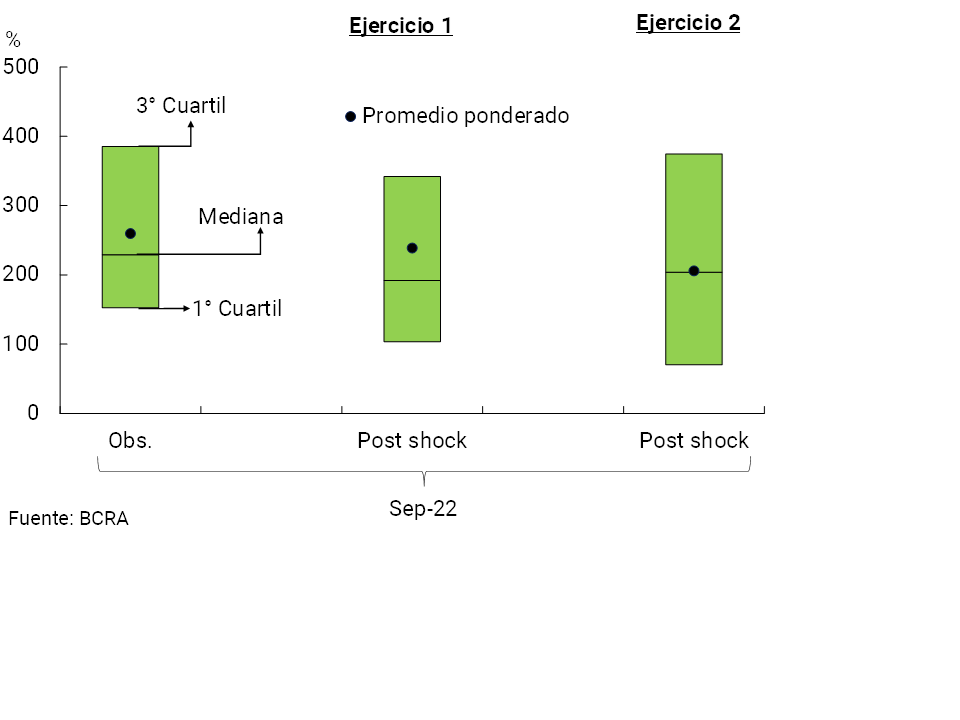
Exercise 2: assumes that (i) companies (together with their employees) that belong to the sectors of activity most affected by the pandemic27, have an impossibility of repaying the financing received from financial institutions. Based on the impact generated by the year, the median capital position of the financial system would be reduced by 25.4 p.p. from the requirement, to 203.7% (the weighted average would fall by 53.8 p.p., to 205.8%).
The estimated results from the proposed exercises highlight the significant size of the hedges constituted by the financial system.
Box 3 / Sustainable finance. Scope of international recommendations.
The effects of climate change and the transition to activities with lower levels of greenhouse gas emissions have begun to define the international economic agenda and, in this way, to influence the operations and traditional business of banking institutions at a global level28. International organizations linked to the promotion of international financial stability play a prominent role in this issue Because the comprehensive management of climate change-related risks is a relatively new element in the financial sector, these organizations have sought to make progress in identifying and standardizing best practices applied in different jurisdictions.
In June 2022, the Basel Committee on Banking Supervision (BCBS) published a document29 that includes recommendations on guidelines aimed at promoting a common treatment in the management of climate-related financial risks (which can be translated into credit, liquidity, market and operational risks), while maintaining the necessary flexibility to include the heterogeneity observed according to the situation of the jurisdictions and the practices developed on this topic. Part of the guidelines are aimed at banks and cover governance issues, internal control framework, risk assessment and management, capital and liquidity adequacy, and scenario analysis. The rest of the principles focus on the task of the supervisor/regulator and cover aspects related to prudential regulation requirements, and the responsibilities, competencies and functions of supervisors. In this way, the Committee expects banks to gradually incorporate the consideration of these risks into their strategies and business models, their governance and risk management processes.
The Financial Stability Board (FSB) developed a roadmap to address financial risks related to climate change that promotes the integration of this issue with an analysis of financial stability, considering the interrelationship between the different segments of the sector (banks and other non-bank financiers). This year it published the first30 progress report, which shows progress in disclosure, data, vulnerability analysis, as well as regulatory and supervisory practices and tools. Understanding these risks and policy approaches to address them are still at an early stage.
In this context, the BCRA is working together with the Ministry of Economy and the insurance and securities regulators31 on a survey of information in order to obtain a diagnosis of the degree of knowledge and incorporation of financial risks linked to climate change by financial institutions operating in the local market. The results of this survey will be useful to have an initial diagnosis; They will be incorporated into the analysis process and in the evaluation of the steps to be taken to gradually advance in a comprehensive implementation in the framework of management and monitoring of these risks.
3. Sources of vulnerability and specific resilience factors of the financial system
3.1 Equity exposure to credit risk
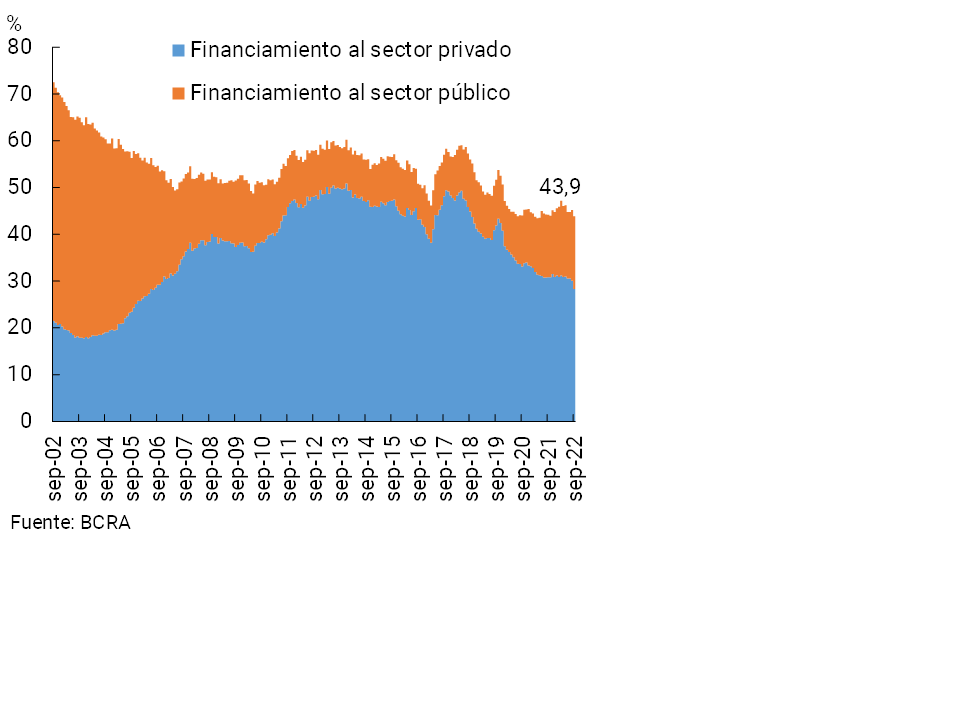
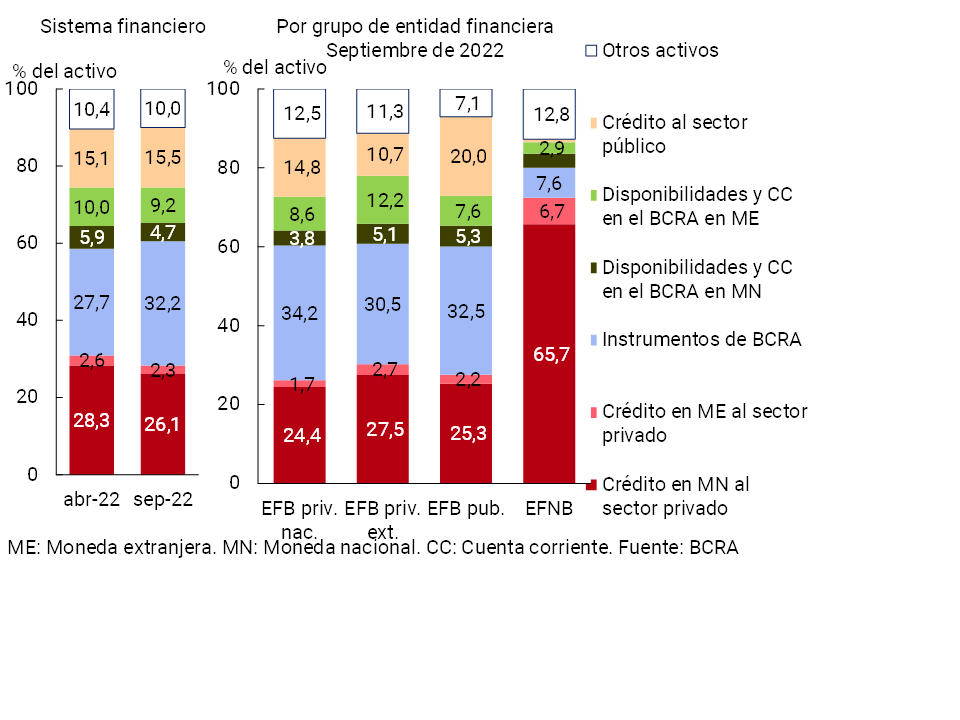
In September, the total credit exposure of the financial system (including the private and public sectors)32 stood at 43.9% of total assets (see Chart 7), remaining at moderate levels compared to the average of the last 20 years (54.3%). This indicator fell by 2.2 p.p. compared to the last IEF and 0.3 p.p. compared to the same month in 2021, a dynamic mainly explained by the private sector.
Figure 7 | Gross exposure of the financial system to the private sector and the public sector – As % of total assets
At the end of the third quarter of 2022, the financial system’s exposure to the private sector remained at low and declining levels (see Chart 8). The balance of credit to the private sector stood at 28.3% of the assets of all financial institutions in September (2.6 p.p. less than in the previous IEF and -2.5 p.p. y.o.y.), below the average of the last 2 decades (36.9%)33. The lower exposure compared to the previous IEF was mainly driven by the financing segment in local currency (-2.3 p.p., to 26.1% of assets)34.
Figure 8 | Balance of credit to the private sector in terms of assets – financial system
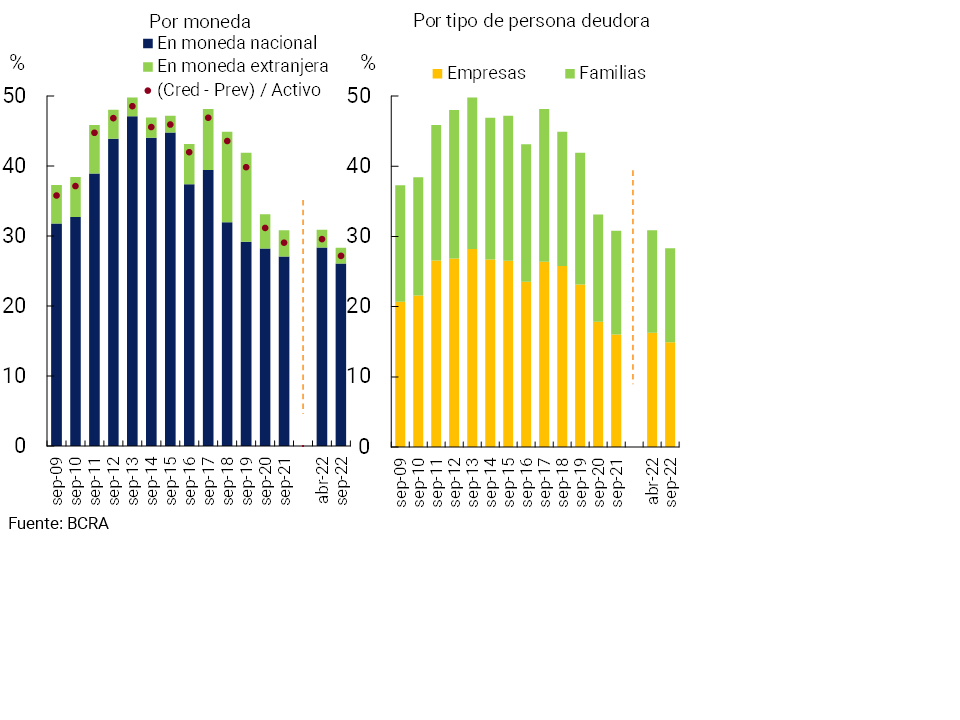
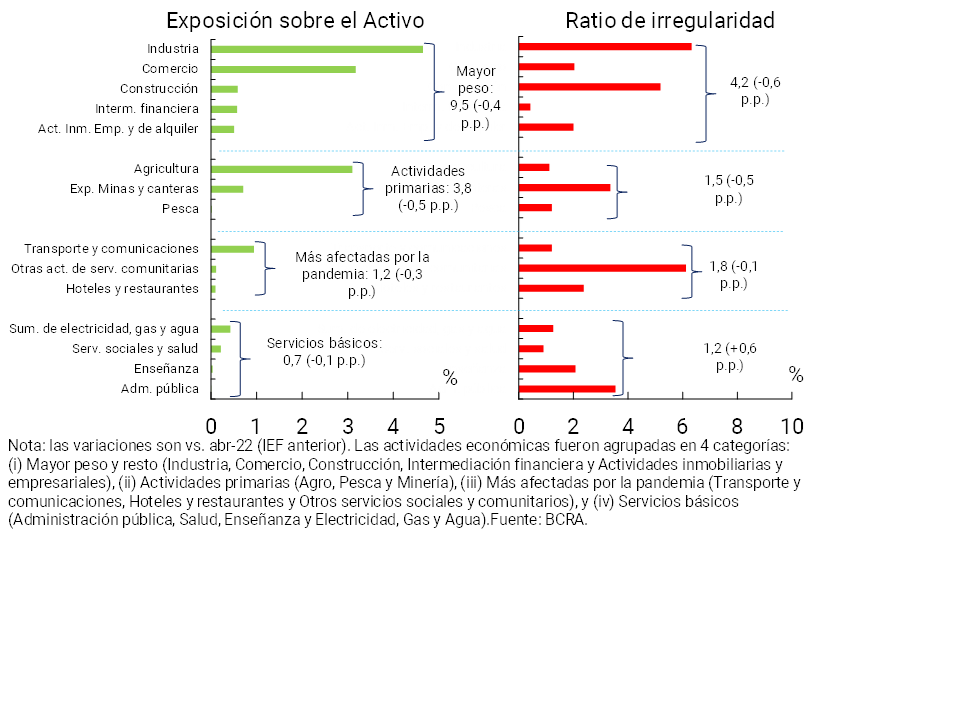
The financial system’s exposure to financing to households represented 13.4% of assets as of September (1.2 p.p. and 1.4 p.p. less than in the previous IEF and in the same period of 2021, respectively). For its part, as of September, credit to companies totaled 14.9% of the sector’s assets (-1.3 p.p. when compared to the previous IEF and -1.1 p.p. y.o.y.). As can be seen in Chart 9, compared to April 2022, the credit exposure of all entities fell for all groupings of economic sectors35, with the decrease being relatively greater in the primary sector and smaller in basic services.
Figure 9 | | Financing and irregularity of credit to companies by main activity – Information as of September 2022
In the context of a reduced exposure to the private sector, the non-performing ratio of credit to the private sector continued to show a gradual decline since the previous edition of the IEF, reaching 3.1% in September 2022 for the financial system as a whole (0.5 p.p. below the record of the last IEF and -1.9 p.p. y.o.y.). The decrease in the indicator was observed both in the segment of loans to households and in the segment of financing to companies, and in all groups of financial institutions (see Graph 10). The current levels of the indicator of irregularity of credit to the private sector are below those observed before the beginning of the pandemic (the average for this indicator was 5.4% between September 2019 and February 2020) (see Section 3), although they are still above the moment of greatest stability of the NPL ratio (1.8%, average 2011-2017).
Figure 10 | Irregularity ratio of credit to the private sector
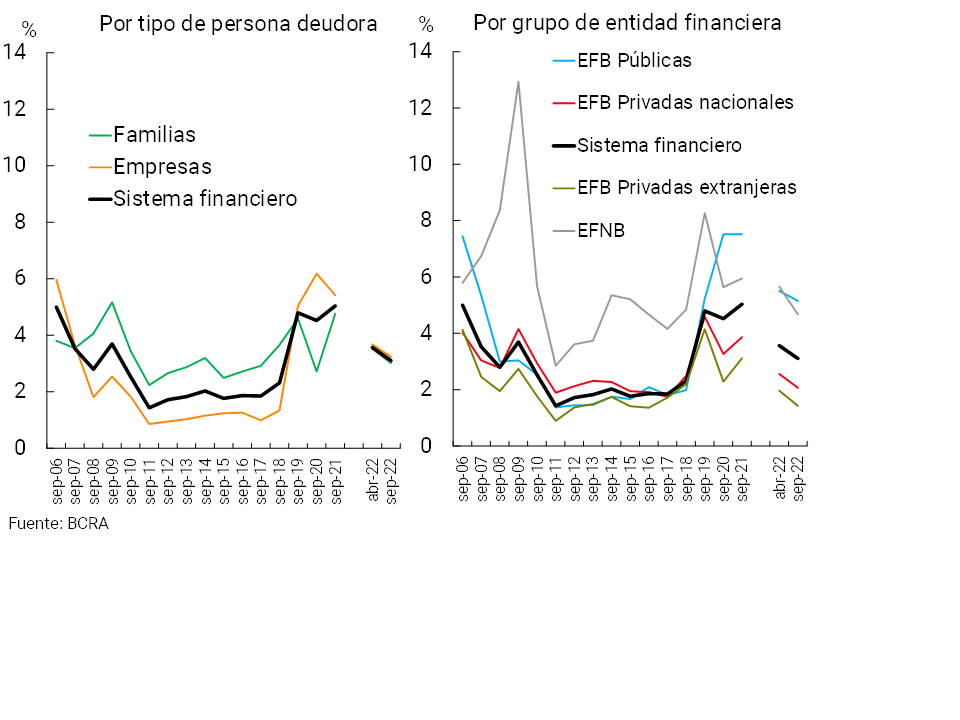
The irregularity of financing to families stood at 3% of that portfolio in September, 0.5 p.p. below the April 2022 record (-1.8 p.p. y.o.y.), a performance driven mainly by collateral and personal loans. With respect to loans to companies, the irregularity ratio fell by 0.4 p.p. in the period (-3.1 p.p. y.o.y.) to 3.2%, a variation mainly explained by the performance of companies in the construction and industrial sectors. When compared with the previous IEF, companies whose main activity corresponds to the sectors with the greatest weight within the economy36reduced their irregularity ratio, while those associated with basic services registered an increase in the non-performing loan indicator (see Graph 9).
In line with the decrease in the irregularity ratio, the estimated probability of default (EDP)—an indicator that provides information on the transition in the credit rating of debtors37—showed a decline in recent months, both in the household and business segments (see Chart 11), and in both cases the current level was below the historical average.
Figure 11 | | Estimated Probability of Default (EDP) – Credit Balance to the Private Sector
On the other hand, the exposure of the financial system to the public sector stood at 15.5% of assets in September, increasing 0.4 p.p. and 2.2 p.p. compared to the record evidenced 5 months ago and in a year-on-year comparison, respectively. Exposure to the public sector remained below the average of the last 20 years (17.4%). The level of this indicator was higher in the group of public banks (20% of assets, being 0.2 p.p. lower than the previous IEF), followed by domestic private banks (14.1% of assets with a decrease of 0.4 p.p. compared to the previous IEF) and by foreign private banks (10.7% of assets, 1.6 p.p. more than in April). When considering public sector deposits, the financial system maintained a net credit position vis-à-vis this sector, at around 2.5% of its total assets (0.3 p.p. higher than that recorded in the previous IEF).
The possible materialization of the aforementioned risk factors (especially a less dynamic performance of economic activity) could act on this relative source of vulnerability of the financial system through its impact on the payment capacity of debtors. Given the relatively low levels of exposure to credit risk and important resilience elements mentioned, it is estimated that extreme realization of the aforementioned risk factors would be required to generate conditions of tension in the financial system (see Box 2).
3.1.1 Resilience elements and mitigating measures:
The financial system maintains high levels of forecasting and capitalization. As of September, the forecasts accounted for 4% of total financing to the private sector and 128.8% of the portfolio in an irregular situation38. In the period, the excess regulatory capital of all entities (above the minimum required) was equivalent to 39.6% of credit to the private sector net of forecasts (a level that far exceeds the average of the last 10 years of 16.5%).
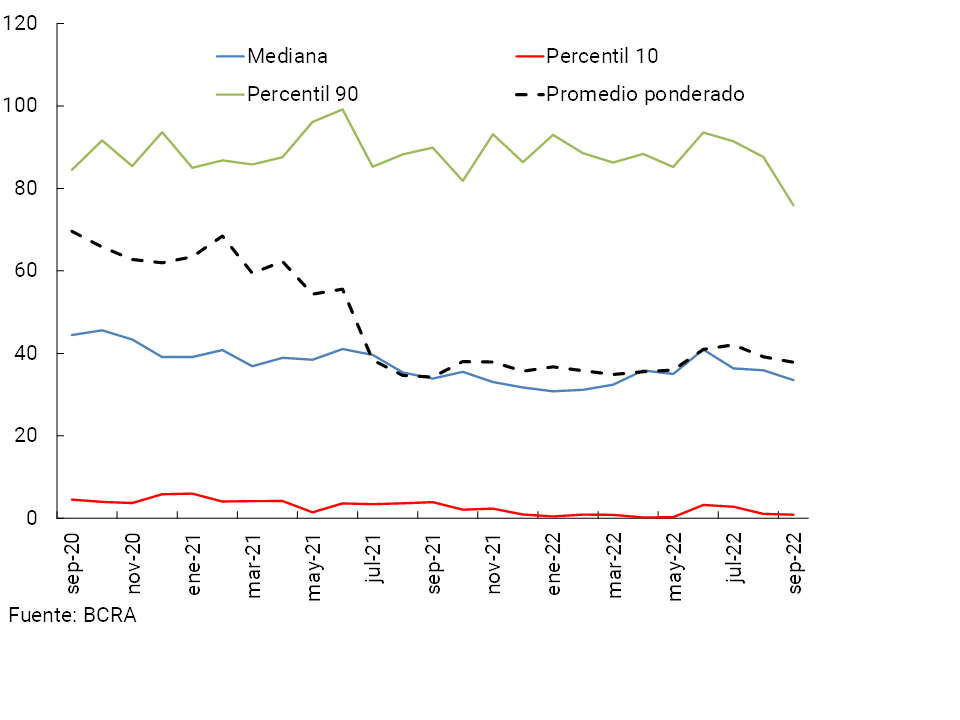
The concentration of private sector debtors in the financial system continued to fall. The top 100 and 50 debtors (taking the total debt balance in the set of financial institutions) accounted for 12.5% and 9.6% of credit to the private sector, respectively, in September 2022 (-0.8 p.p. compared to the previous IEF, in both cases), reaching the lowest records in the last 20 years (see Box 4)39.
Credit origination standards (EOC) remained without significant changes in the last 10 quarters (according to responses from the BCRA’s Credit Conditions Survey). There was only a slight restriction in the EOCs for the segment of households on credit cards in the last survey. As for the maximum amounts, there was a slight relaxation in both companies and families
Debt levels are limited (and, in perspective, mostly downward) for both households and companies. As of September, broad sense credit40 was equivalent to 5.9% of GDP for households and 10.9% for companies (see Graph 12). This implies a slight decrease in the ratio compared to the level observed six months ago for households, while for companies there was some stability (although, in perspective, in both cases the ratios are currently below their average in the last 5 years). On the other hand, the data for companies with public offerings show a certain decrease in the leverage indicator (see Box 5), although for these companies there has also been an increase in the ratio of net financial debt to liquidity against operating results in recent quarters. The evolution of the broad credit ratios as a percentage of GDP took place in a context of growth in the level of activity since the last IEF. In the case of the broad credit indicator for households, there have been decreases in balances in real terms in recent quarters, both for the main component (bank credit) and for the rest. In the case of companies, total balances fall in real terms, with mixed changes between the different components. There are decreases in real terms for bank credit and foreign financing, while they increase in the case of local bonds (among the main components).
Figure 12 | Financing in the broad sense for families and companies
% of GDP
The burden of servicing household bank debt remained limited. It is estimated that the burden of household debt services represented 10.4% of the wage bill, reducing compared to the level of six months ago and in a year-on-year comparison.
The weighting of credit to the private sector in foreign currency in the aggregate assets of the financial system continues at low and declining levels: 8% in September 2022 (average of 14.1% in the last 20 years), 0.3 p.p. less than in the previous IEF. In addition to this limited gross exposure, the credit risk faced by the sector derived from possible exchange rate fluctuations is limited by local macroprudential regulations. The BCRA limits the use of the lending capacity of foreign currency deposits to entities to prevent them from being exposed to currency mismatches by debtors41.
3.2 Performance of the financial intermediation activity
The intermediation of all financial institutions with the private sector has decreased since the last publication of the IEF. In a scenario of a certain slowdown in economic activity in the third quarter of the year, the real balance of financing in pesos to the private sector fell compared to last April, as well as in year-on-year terms. For its part, the real balance of deposits in national currency in this sector increased in both periods of time. On the foreign currency segment, the credit and deposit balances (in source currency) of the private sector decreased since the last publication of the IEF, in line with what has been observed in the last year.
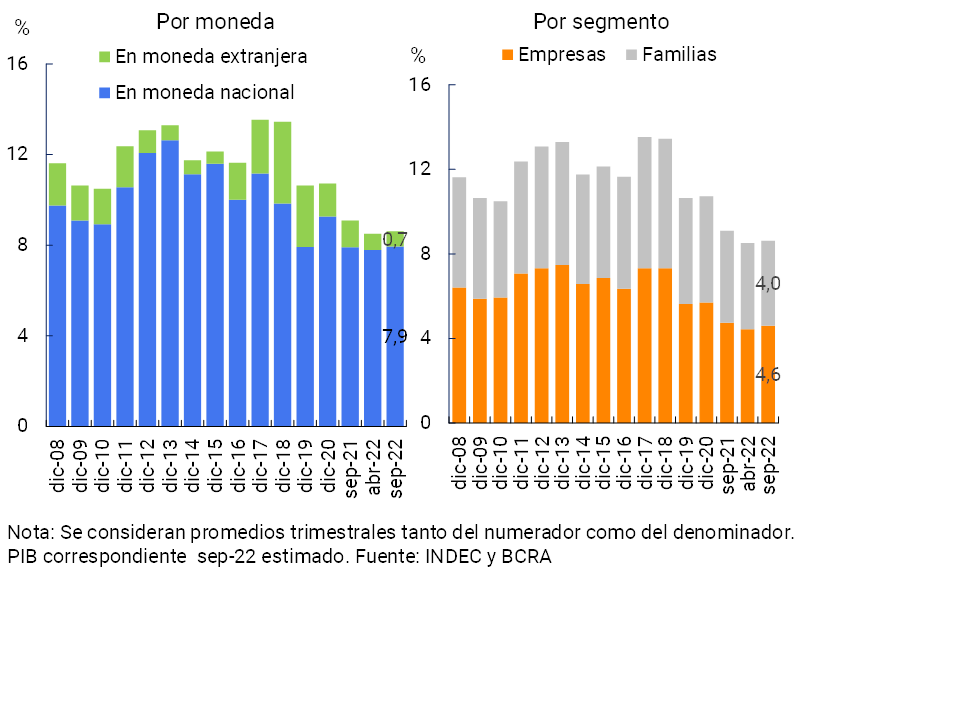
The real balance of credit in national currency to the private sector fell by 6.2% between April and September, accumulating a fall of 5.1% in real terms in year-on-year terms (see Chart 13). The decrease in financing in the last five months was disseminated among the different groups of financial institutions and in most credit lines (with the exception of assets in financial leases and collateral loans). Commercial loans continued to register greater relative dynamism in recent years, a performance partly driven by the Financing Line for Productive Investment of MSMEs (LFIP), one of the main instruments of credit stimulus for this segment of companies implemented by the BCRA. On the side of the segment in foreign currency, the balance of credit in this denomination to the private sector decreased 4.8% since the last publication of the IEF —in currency of origin—, verifying a year-on-year fall of 27.1%. Thus, the total credit balance (in domestic and foreign currency) fell both in the last five months and in a year-on-year comparison (-6.5% real and -9.4% y.o.y. real).
Figure 13 | Real balance of credit in pesos to the private sector*
The group of entities maintains a limited (and decreasing) depth of credit in the economy. It is estimated that the total credit balance to the private sector represented 8.6% of GDP (7.9% of it in national currency) (see Chart 14). When differentiating by segment, it is estimated that the balance of credit to companies in terms of output weighted 4.6% in September, 0.6 p.p. above the level of financing to households. These levels are below those observed in recent years and in other economies in the region.
Figure 14 | Total credit balance to the private sector in terms of GDP
Financial system
Considering the funding of the financial system, in September the balance of deposits in pesos of the private sector increased by 2.8% in real terms compared to April (last IEF) and by 1.1% y.o.y. in real terms. Within the framework of the process of normalization of the interest rate structure, during the period the BCRA continued to increase reference interest rates in order to tend towards a path of positive real returns. As a result, since the last IEF, both traditional private sector and UVA-denominated time deposits in pesos continued to show high increases (see Box 6). For its part, the real balance of the private sector’s demand accounts fell in the period (-3.1% compared to April and -6.9% YoY). On the side of the foreign currency segment, the balance of deposits in this denomination of the private sector fell 2.6% compared to April (-9% y.o.y.). Thus, total deposits (including all currencies) of the private sector accumulated a slight increase in the last five months (+1.1% in real terms), falling 3.9% y.o.y. in real terms.
The size of the balance sheet of the financial system (total assets in real terms) did not show any changes in magnitude with respect to the last IEF or in relation to the record of a year ago. In terms of composition, in the last five months the relevance of the holdings of BCRA instruments (see Chart 15) and the balance of financing to the public sector increased, while the balance of total credit to the private sector decreased in weight, as did the rest of liquid assets42.
Figure 15 |Breakdown of total assets by main items
In line with what is mentioned in Section 1, economic activity is expected to grow during 2023, subject to a likely scenario of some uncertainty associated with election years, as well as the challenge faced to reduce current inflation levels. In this context, there is room for the intermediation activity of the financial system with the private sector to regain momentum – mainly in those lines of financing focused on productive development – based on higher levels of savings in national currency with positive real returns and a growing supply and scope of financial services. However, this source of vulnerability would act in the event that any of the risk factors described above materialize.
3.2.1 Resilience elements and mitigating measures:
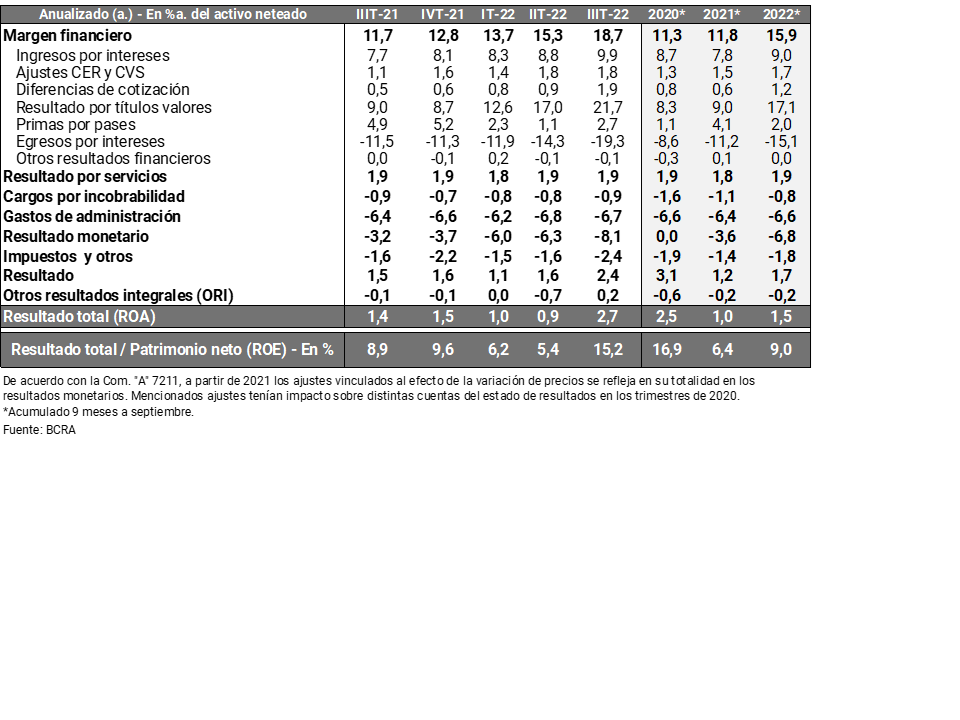
The sector’s profitability remains at positive levels, rising in the third quarter, although with heterogeneity between entities. The aggregate set of financial institutions maintained positive levels of profitability in 2022, with a slight year-on-year increase, although from levels lower than those of 2020 (see Table 2). The total comprehensive results in homogeneous currency of the financial system stood at 1.5% annualized (y.) of assets in the accumulated 9 months (+0.5 p.p. y.o.y.), and 9% y. of equity (+2.6 p.p. y.o.y.). In a year-on-year comparison, higher results were observed by securities and, to a lesser extent, an increase in interest income. These effects were partially offset by higher interest outflows (in the context of rising interest rates and a growing relevance of time deposits) and higher losses due to exposure to monetary items (due to an increase in inflation compared to 2021).
Table 2 | Financial System Profitability Table – In Homogeneous Currency
Regulation and supervision scheme. The BCRA continues to provide a regulatory and supervisory framework that is adapted to the characteristics of the local financial system and is in line with international recommendations in terms of best practices in this area.
Credit policy focused on the development of the productive system. Throughout 2022, the “Financing Line for Productive Investment in MSMEs” continued to be one of the main tools that favored access to credit for small and medium-sized enterprises (see Box 1). In addition, the BCRA continued to promote various measures aimed at benefiting this segment of companies. As of October, the Minimum Cash Regime in pesos was simplified, maintaining those deductions that favor productive credit to MSMEs43. At the same time, its aim was to consolidate Electronic Credit Invoices (FCEM) as a financing instrument for MSMEs, launching the “Central for Unpaid Electronic Invoices at Maturity (CenFIV)”. CenFIV will bring transparency to the operation and will generate a credit history, improving the traceability of this instrument. The use of the FCEM promotes simpler operations that are in line with the daily practice of MSMEs44.
3.3 Funding and liquidity of the financial system
The preponderance of funding through deposits remains a characteristic feature of the financial system. As of September, almost half of the total funding corresponded to private sector deposits in national currency (49.9%), a value that rises to 61.6% when considering public sector deposits in pesos and 71.3% when including the total of sectors and currencies (see Graph 16). The remaining funding of all entities is basically made up of capital (17.9%) and, to a lesser extent, debt instruments, such as negotiable obligations (ON), subordinated obligations (SO), external financing and other liabilities.
Figure 16 | Funding
composition
As a % of total funding
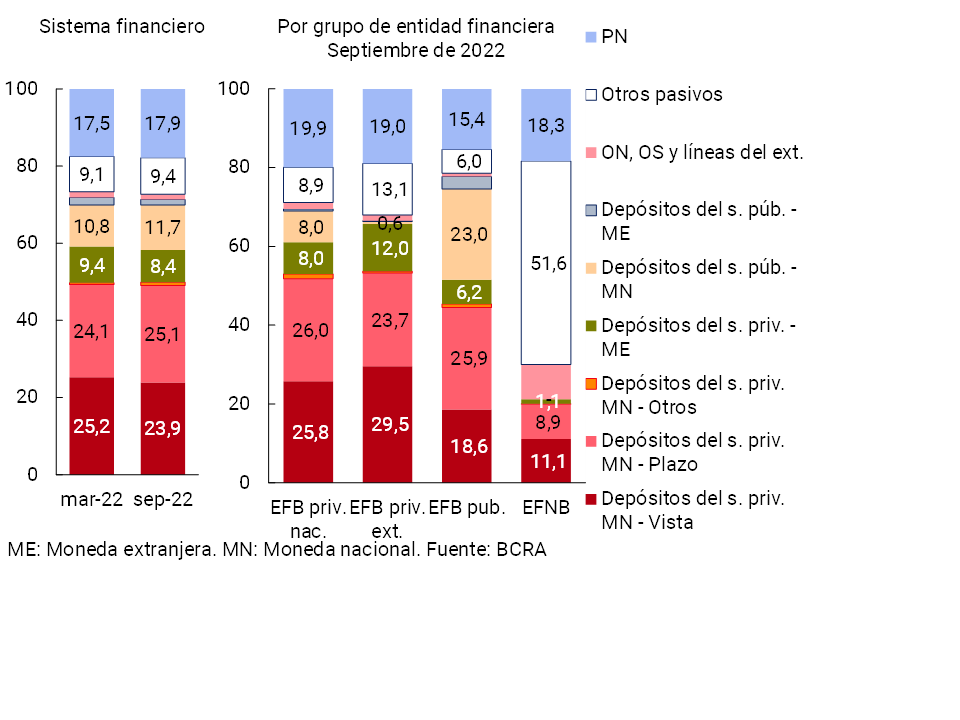
As mentioned in Section 3.2, there was a positive performance of private sector time deposits in local currency compared to the previous IEF. This translated into an increase in the share of these placements in the total funding of the financial system. To a lesser extent, public sector deposits in national currency and net worth also increased their relative weight in this temporal comparison. On the other hand, the balance of deposits in foreign currency reduced its weighting in total funding in the period.
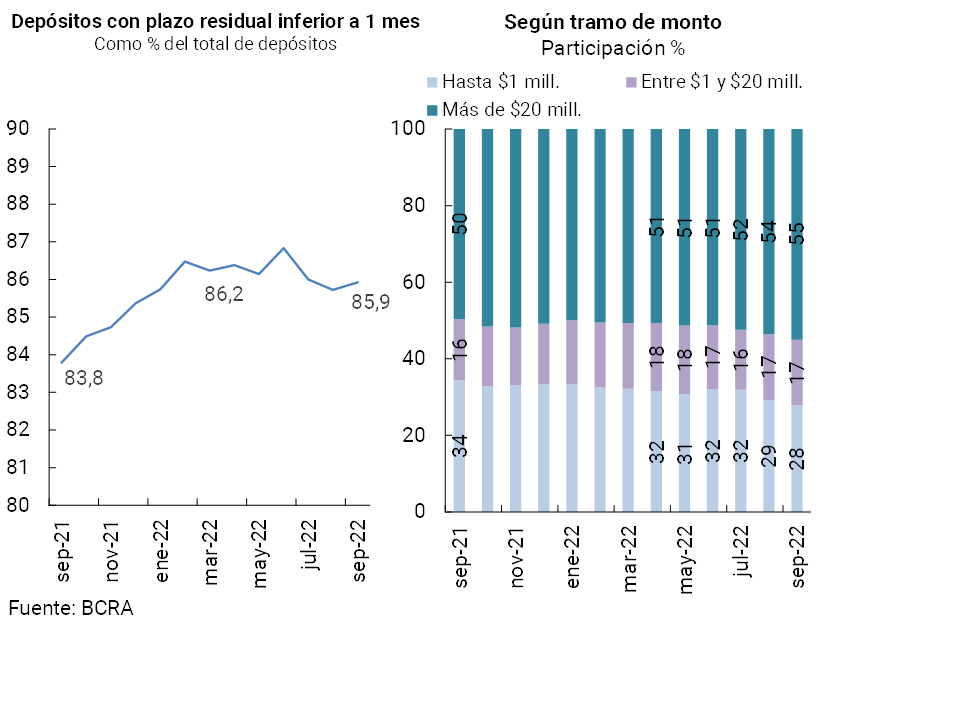
Other aspects to consider in terms of exposure to liquidity risks in the financial system are the profile or type of depositor, the degree of concentration of deposits and the relative maturity of liabilities. In the last six months, the share of deposits associated with FCI- increased slightly (see Graph 17 and right panel of Graph 18), although a predominant weighting of deposits made by individualsis maintained 45. On the other hand, the dynamism of time deposits in recent months resulted in a slight increase in the average maturity of the main liabilities (see left panel of Chart 18), reducing the exposure to liquidity risk mentionedabove 46.
Figure 17 | Private sector deposits in local currency
Participation % by type of depositor – Financial system
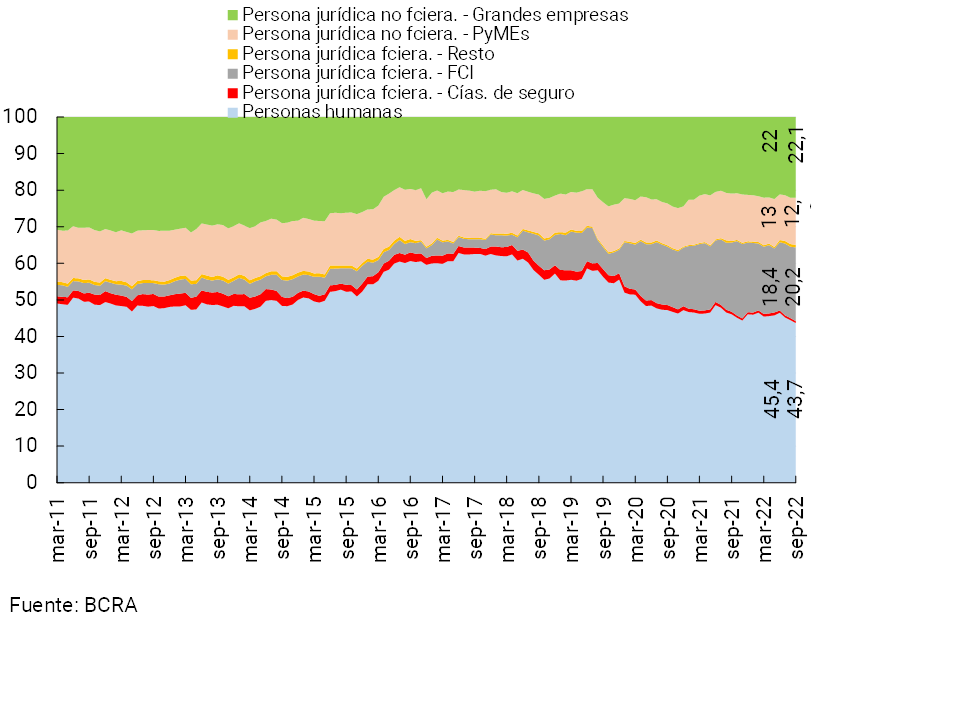
Figure 18 | Deposits in national
currency
Financial system
In this context, possible changes in the level and composition of funding in the sector could not be ruled out if any of the risk factors set out in section 2.2 materialize.
3.3.1 Resilience elements and mitigating measures:
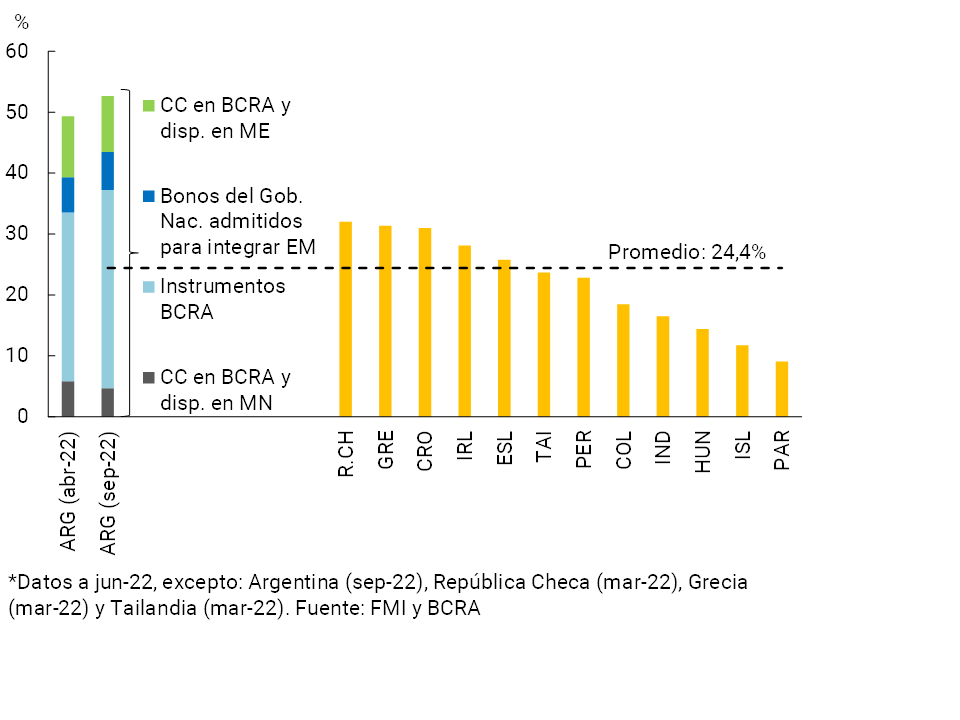
High liquidity indicators. As of September, the local financial system recorded liquid assets in the broad sense for a balance equivalent to 52.7% of total assets, which are high levels when compared to other financial systems (see Chart 19). In terms of total deposits, broad liquid assets totaled 72.3%, 4.3 p.p. above the previous IEF record. This indicator is also high when compared to the average of the last 15 years (48.5%). At the end of the third quarter, this indicator for items in local currency reached 68.6% (+4.5 p.p. compared to April) and stood at 95.7% for items denominated in foreign currency (+6.8 p.p. compared to April)47.
Figure 19 | Liquid assets as a % of total assets
International comparison
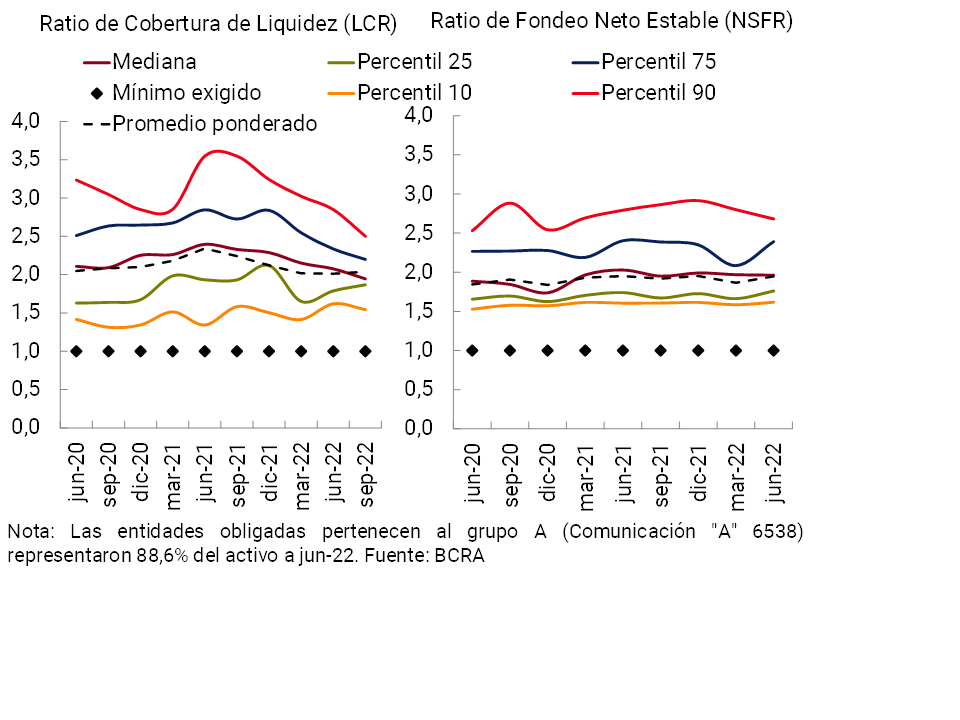
International liquidity standards. The liquidity ratios arising from the Basel Committee’s recommendations – incorporated into the local prudential regulatory system – were at comfortable levels for the aggregate of entities obliged to comply with such requirements, practically doubling the regulatory minimums (see Chart 20)48. In relation to both the LCR and the NSFR, all entities verified a level above the regulatory minimum, with no changes in magnitude when compared to the end and middle of 2021.
Figure 20 | Basel liquidity ratios
Group A entities
Low dependence on funding through negotiable obligations (ON) for the entire financial system, with maturities mostly in pesos for the next semester. As of September 2022, the ON represented 0.8% of the total funding of the financial system. Although 89% of the system’s NON balance corresponds to banks and 11% to non-bank financial institutions (NBS), this instrument has a greater weight on the funding of NBEs (8.5%) than banks (0.7%), taking into account only entities that are funded with NB49. Of the balance of outstanding bonds of the entities (equivalent to $173,715 million), 77% of the total is denominated in dollars. However, of the bond maturities estimated for the first half of 2023 (estimate as of November 2022) for $20,507 million, 91% is in local currency50. With respect to the conditions of placement in the local market, since the last IEF (July to November), operations of the financial system were carried out for $14,900 million, compared to maturities in the same period for $20,000 million. These amounts of ON placements imply a 39% decrease in real terms compared to the same immediately preceding period (see Graph 21). In the case of new bonds placed in pesos (at the BADLAR rate plus a margin), there was an increase in costs following BADLAR51 and a drop in placement terms (from 19 to 12 months) compared to the first half of the year.
Figure 21 | Genuine ONs (local and foreign leg.) of Banks and EFNBs – figures in billions of pesos
Box 4 / Large exposures to credit risk
In line with international standards in this area52, at the end of 2018 the BCRA released the local regulatory framework that regulates large exposures to credit risk in the non-financial private sector, strengthening existing regulations to address this issue53. The objective is to limit the losses that could eventually materialize, in the event that a large counterparty defaults on its payments. As a general criterion, an exposure is classified as large if it is equivalent to 10% or more of the entity’s Tier 1 capital. The regulation establishes a general maximum limit of 15% of the entity’s total capital compared to a counterparty in the non-financial private sector. From a macroprudential approach, this approach to credit risk is complemented by a set of rules54.
At the aggregate level, the relevance of large exposures in the financial system has been declining in recent years. As of September 2022, large exposures of all institutions represented only 1.1% of aggregate Tier 1 capital, 5.1 p.p. less than in the previous IEF and much lower than the records at the end of 2020 (see Chart R.4.1, left panel). This level is one of the lowest when compared to what has been verified in other financial systems (see Figure R.4.1, right panel). In general, in recent years, fewer institutions have large exposures (at the end of 2020, 35 institutions reported and 25 as of September 2022).
Figure R.4.1 | Large exposures to credit risk
In the same sense, for the aggregate of the system, the relative importance of the debt balance of the top 20 debtors (for each entity, whether or not they meet the condition of large exposure) has been falling in terms of capital (considering the median), placing itself in a limited environment and lower than that verified both in the previous IEF and in a year-on-year comparison (see Graph R.4.2).
Figure R.4.2 | Top 20 debtors in each entity – As a percentage of Tier 1 capital
In general terms, the fall in these indicators occurred in the context of a real increase in Tier 1 capital at the aggregate level (denominator) and a real decrease in the numerator: greater relevance of SME credit (as opposed to credit to large companies), added to the effect of the transfer of large debtors (who were classified as in an irregular situation) to off-balance sheet items (irrecoverable) in accordance with the regulations.
Box 5 / Financial situation of publicly offered companies55
In the first three quarters of 2022, some improvement was generally observed in the financial situation of this segment of the corporate sector. In particular, final results in terms of net worth (ROE) continued to recover – according to the group median – consolidating the trend that began towards the end of last year (see Table R.5.1). Net profit margins56 and the sales-to-assets ratio increased, while total leverage levels fell. Despite the improvement in these ratios, median liquidity fell in the first nine months of the year, while there was an increase in the ratio of financial debt to operating results and an increase in short-term financial debt in relation to total debt. However, the median interest coverage ratio with operating results improved in the period, with results covering more than double the interest paid. Likewise, the mismatch in foreign currency (difference between assets and liabilities in currencies other than the peso in relation to total assets, all measured in local currency) continued to reduce in 2022.
Table R.5.1 | Capital Position Sensitivity Exercises
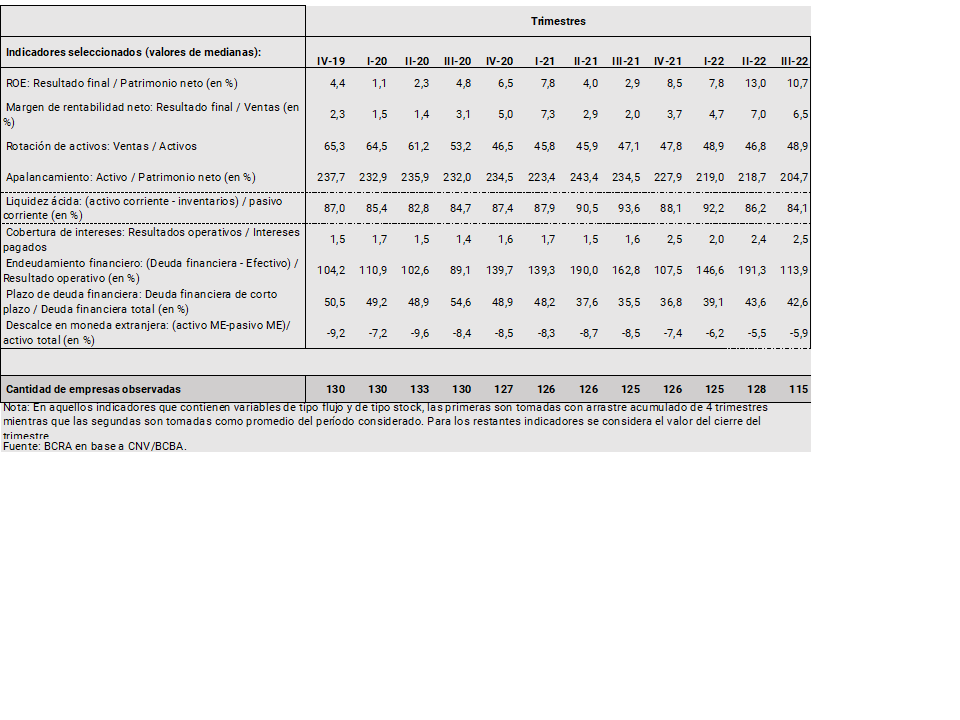
Within the framework of risk monitoring at the systemic level, the indicators of liquidity, interest coverage and leverage57 are used to make a first simple identification of companies in a potentially more vulnerable situation and their relationship with the financial system. In this sense, the exposure of the financial system to this potentially more vulnerable subset of companies is very limited: by the end of the IIIT-22 it represented less than 2% of the total portfolio of loans to companies by financial institutions, while this segment showed an irregularity of 0.24% with respect to the total volume of financing from financial institutions to companies.
Box 6 / Performance of private sector fixed-term deposits in pesos and UVA
Since the last publication of the IEF, the BCRA has raised the minimum nominal interest rates on fixed-term deposits in pesos and promoted new regulatory measures in order to encourage savings in national currency in the financial system. Among them, it was clarified in the regulations that (i) financial institutions are obliged to offer the contracting of deposits in UVA, with the option of early cancellation, through all current channels; and that (ii) the maximum amount at which it is mandatory to offer individuals the minimum interest rate for fixed term in pesos (currently $10 million), includes both fixed-rate deposits and those with an early cancellation option in UVA (when the contractual term of these is less than 120 days). In this context, the balance of traditional fixed-rate fixed-rate time deposits in pesos in the private sector increased by 10.4% in real terms since the last publication of the IEF (+11.1% y.o.y. in real terms), to represent 84.4% of the private sector’s fixed-rate time deposits in pesos in September and 42.5% of the sector’s total deposits in pesos (+2.9 p.p. and +3.8 p.p. compared to April and y.o.y., respectively). This performance was mainly driven by legal entities (they accounted for more than 78% of the increase between April and September, growing 10.4% in real terms) and by public financial institutions (see Figure R.6.1). Fixed-rate deposits in pesos of individuals also grew in the period (4.3% in real terms), with greater relative dynamism in foreign private financial institutions
Figure R.6.1 |Private Sector Fixed Interest Rate Time Deposits in Pesos – In Real Terms*
Financial system
Private sector UVA time deposits also performed well, although with some moderation at the margin, growing 9.1% in real terms over the last five months (36.5% y.o.y. in real terms) (see Chart R.6.2). The dynamics of these deposits have been explained mainly by individuals (they represent more than 86% of these deposits), and by public financial institutions (they account for 44% of the total balance). On the side of legal entities, UVA deposits in national private entities showed a higher relative growth in recent months, although public financial institutions continued to represent more than half of the balance of total UVA deposits.
Figure R.6.2 | Private Sector UVA Time Deposits – In Real Terms*
Financial system
4. Other topics of stability of the financial system
4.1 Systemically Important Financial Institutions at Local Level (DSIBS)
As detailed in previous editions of the IEF, the BCRA carries out special monitoring of a group of entities that are of greater relative importance in the local market following a systemic risk approach. Such institutions are subject to the verification of a higher capital conservation margin than for the rest (1% of the RWAs above that verified by the rest of the institutions, which is 2.5% of the RWA). To determine the set of DSIBs, a series of indicators were used to establish an order on different features (such as size, degree of interconnection, complexity and degree of substitution of their activities)58.
In terms of size, the total assets of the DSIB group slightly exceeded half of the total assets of the financial system as of September, a share that increased slightly compared to the previous IEF. The liquidity indicators of the DSIBs as a whole increased compared to the previous IEF, from levels lower than those recorded in the rest of the financial system.
Solvency ratios for all DSIBs remained at high levels and increased compared to last April (see Table 3). This increase was more moderate than that verified in the rest of the system. The DSIBs continued to fully verify the capital conservation margin (including the above-mentioned additional component specific to them). The profitability ratios (ROE for the accumulated in the last 12 months) of the DSBIs group were positive and slightly higher than those of the rest of the financial system. Cumulative ROE increased for this group of entities compared to the previous IEF and in a year-on-year comparison, while it decreased in the rest of the financial system.
Table 3 | Main indicators of soundness for D-SIBs
On the other hand, compared to the previous IEF, the indicator of exposure to the private sector fell in the DSIBs group (starting from levels slightly higher than the rest of the system), while it increased for the rest of the entities. The irregularity ratio was reduced compared to April, reaching levels slightly higher than those of the rest of the system.
4.2 Interconnection in the financial system
With regard to the interconnection of institutional investors59 with the financial system, as has been characteristic in recent years, the main source of direct interconnection is deposits (demand and fixed-term). In recent months, there has been a new increase in the weighting of these placements by institutional investors in the financial system, representing 14.5% of total deposits as of September 2022 (with an increase of 0.8 p.p. compared to the value of 6 months ago) (see Chart 22). This occurred in a context of an increase in portfolios managed by institutional investors. In perspective, their current participation in the funding of the financial system through deposits is almost double the average of the previous 10 years, with a growing preponderance of Mutual Funds (FCIs), especially from the dynamism in the growth of those in the money market60.
Figure 22 | Share of institutional investors’ deposits in the funding of the financial system
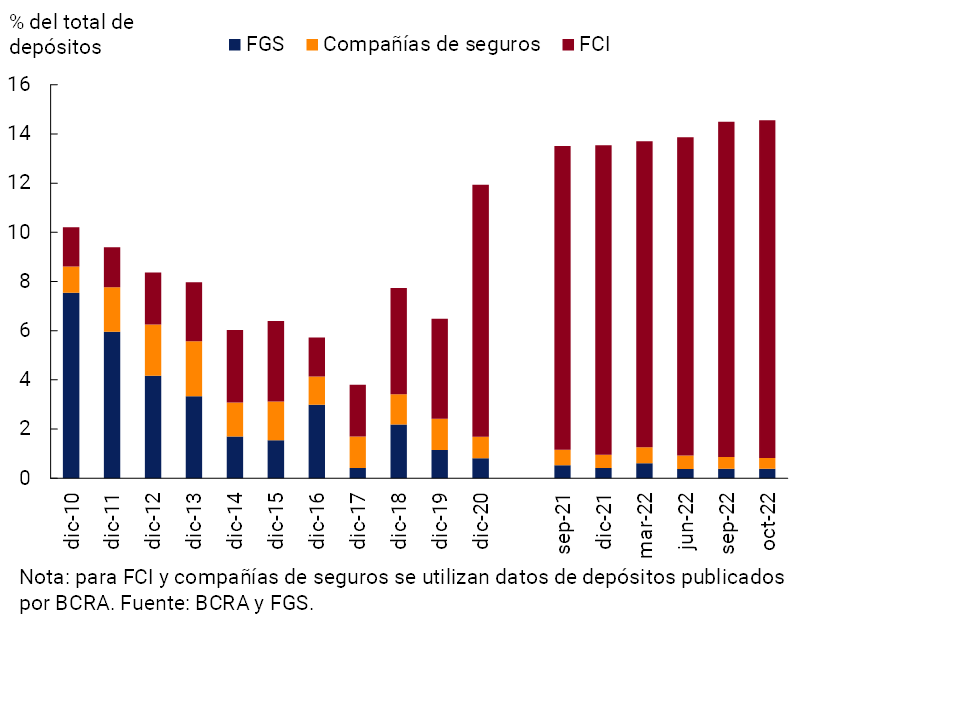
The performance of the FCI industry since the publication of the last IEF was volatile. Months were recorded with declines in real terms in assets under management, mainly from (net) withdrawals of funds during periods of mid-year stress in the financial markets, partially offset by months with strong net subscriptions (and valuation growth). Although assets under management increased 1.5% from June to October 2022, there has been a fall of 5.6% since the end of 2021 – in both cases, in real terms. Thus, the increase in direct interconnection is mainly related to the reallocation of portfolios in favour of money market FCIs61, given the significant weighting of bank deposits in this type of fund, and mainly to the detriment of fixed income FCIs (see Section 4).
In terms of the degree of direct interconnection between entities participating in the financial system, based on the monitoring of the dynamics of the market for unsecured interfinancial loans (call market)62, in recent months there has been a decrease in the amounts traded and a contraction in the average interest rate differential agreed over the BADLAR rate. in a context of increased monetary policy rates and the BADLAR. In this context, the evolution of the indicators estimated with the network analysis methodology also reinforces the assessment of a lower degree of direct interconnection in relation to the previous period, although in the year-on-year comparison some increase is observed63.
5. Main macroprudential measures
As presented throughout the Report, in the second part of 2022 the BCRA continued to strengthen its macroprudential policy, seeking to mitigate potential vulnerabilities in the financial system while strengthening the sector’s coverage against possible situations of stress.
The BCRA’s macroprudential policy continued to have the following main axes:
i. Sustain the stimulus to financing the private sector, mainly that channeled to MSMEs. In order to continue promoting access to credit lines with subsidized rates for MSMEs, in October 2022 a new quota of the Financing Line for Productive Investment (LFIP) was established for the 2022/2023 period, maintaining similar conditions in force (See Box Bank Credit to SMEs and LFIPs). In addition, in November the BCRA launched the “Central of Unpaid Electronic Invoices at Maturity (CenFIV)“, to consolidate Electronic Credit Invoices (FCEM) as a financing instrument for MSMEs (see Regulatory Annex);
ii. Calibrate the interest rates of monetary policy (and time deposits) in such a way as to tend towards positive real returns on investments in pesos. Since the last publication of the IEF, the minimum guaranteed interest rates on fixed-term deposits have been raised on several occasions. In addition, in order to stimulate the collection of time deposits, the BCRA adopted regulatory measures clarifying that (i) financial institutions are obliged to offer the contracting of UVA deposits with an early cancellation option through all current channels; and that (ii) the maximum amount at which it is mandatory to offer individuals the minimum interest rate for fixed term in pesos (currently $10 million), includes —jointly— both fixed-rate deposits and those with an early cancellation option in UVA (when the contractual term of these is less than 120 days).
iii. Encourage financial institutions to maintain adequate levels of solvency. Within this framework, for 2023, the possibility of distributing dividends to financial institutions was reviewed, in line with the provisions for 2020 and 2021.
iv. Maintain unchanged (at 0%) the required level of the Countercyclical Capital Margin for financial institutions, in a scenario of weak performance of financial intermediation (see Section 3.2).
v. Manage foreign exchange regulations and regulations on financial institutions in order to adapt them to the needs of the situation and to make efficient use of international reserves, avoiding potential transitory imbalances between supply and demand in the foreign exchange market.
Section 1 / Monetary Policy Interest Rate Hikes in Developed Economies and Impact on Financial Markets in Emerging Economies
As a result of the increase in inflationary pressures worldwide (accelerated by the impact of the war in Ukraine on commodity prices), there has been a general trend towards raising monetary policy interest rates. Among the developed economies, the case of the US stands out, given the intensity of the change in its policy bias and the relevance of the dollar in international financial markets. The Federal Reserve began raising interest rates in March 2022 and has already accumulated 7 increases in nominal terms (from 0%-0.25%% to 4.25%-4.50%)64, more marked than in previous cycles of rate increases (given the current context in terms of observed inflation and the expectations around it) and than originally expected (see Figure A.1.1). Thus, based on the increases in interest rates and the prospects communicated by the Federal Reserve, added to measures to reduce its balance sheet65, the market was readjusting expectations regarding the path of rates. Additional increases are currently expected for 2023 (to levels of around 5%) and progressive reductions thereafter. In practice, the peak in the rate hike will depend on how persistent inflation turns out to be. In this context, from the end of February to mid-December there were widespread increases in the yields of US Treasury instruments (with increases close to 280 and 170 bps for 2-year and 10-year instruments, respectively, and expected volatility for these instruments at levels not seen since the COVID-19 shock) and acceleration of the appreciation of the dollar against a basket of major currencies. which reached – at the end of September – the highest since 2002.
Figure A.1.1 | Interest rates in the U.S. and other developed countries
The most adverse financial conditions at the global level affected portfolio flows and the prices of both emerging economies’ financial assets and their currencies, although so far this has not generated disruptive situations67. Since April, funds specializing in emerging market assets have registered outflows estimated at US$49 billion, still well below those observed in other episodes of disarmament that impacted emerging economies in recent years (see Chart A.1.2)68, 69. In this context, emerging currencies have depreciated more than 6% since the end of March according to the EMCI index, although with heterogeneity between countries.
Figure A.1.2 | U.S. and Emerging Markets Interest Rates
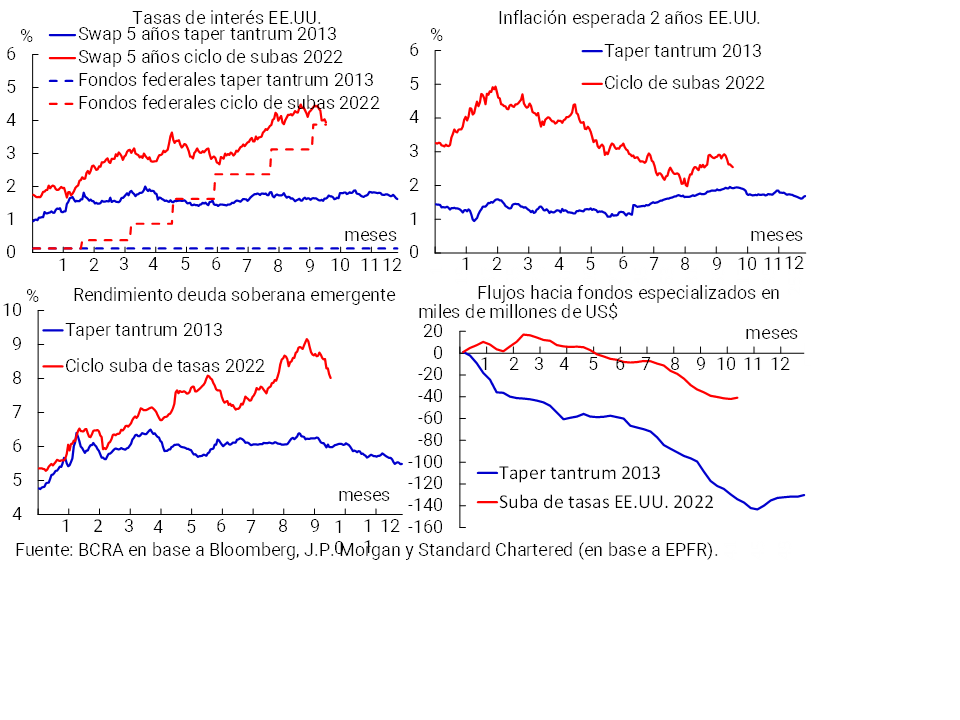
For its part, the surcharge required for sovereign and corporate bonds in emerging markets in dollars has widened by about 10bp and 30bp (according to the EMBI and CEMBI, respectively) since the end of March, but remains at levels not so far from their historical averages. With yields on U.S. Treasury instruments rising and debt spreads rising, during the IIT-22 and IIIT-22 the placements of emerging market bonds – sovereign and corporate debt – in international markets showed year-on-year declines in a range of 60% and 75% (starting from historically high levels). In these quarters, sovereign debt operations from countries that do not have investment grade have been very rare. In turn, the yield on emerging bonds in local currency (GBI index) increased from 6.2% at the end of March to 6.8% by mid-December, having reached in October the highest values since the international financial crisis with a peak in 2008-2009.
Episodes of rate hikes in international markets pose a challenge to financial stability in emerging economies (with a differential impact depending on the context in which they occur)70. From a financial point of view, this is linked to the fact that part of the financing of emerging economies is external and in foreign currency. The impact on the cost of financing and the quotations of securities in that currency usually occurs in a context of pressure on capital flows71 and, consequently, on the foreign exchange markets (additionally increasing the burden of foreign currency credits), with a potential impact on local debt markets in general. In the current situation, the resulting uncertainty is greater, due to the context of lower global growth expectations (with widespread and marked increases in monetary policy interest rates and without it being clear when the peak of this cycle of increases will materialize) and volatility in commodity prices.
In addition, the risks faced are intensified by vulnerabilities that deepened after a prolonged period of low interest rates. On the one hand, the increase in non-bank financial intermediation (NBFI) worldwide, led by investment funds, makes portfolio flows more vulnerable to changes in international market conditions, enhancing eventual spillover effects – with a greater impact on shallower markets – and amplifying the international financial cycle. The greater prominence of investment funds increases the interconnection between markets and jurisdictions, while their liquidity mismatches (and, in some cases, their leverage) mean that liquidity conditions in the main financial markets play a decisive role72. Likewise, the significant appreciation observed in the prices of various markets makes them more sensitive to possible price corrections (linked to factors in some cases external to the markets in question), even after the declines observed in recent months. On the other hand, the generalized increase in indebtedness for both companies and governments in recent years makes them more vulnerable to interest rate hikes. This may eventually trigger widespread concern about the sustainability of corporate or government debt (with downgrades) or specific default cases that generate greater risk aversion, precipitating a dismantling of positions in emerging market instruments, in addition to having potential effects on banks. Finally, it is highlighted that, after the COVID-19 shock, emerging economies have less room for maneuver to use fiscal policy in a counter-cyclical manner.
In this context, it is crucial to monitor both the evolution of monetary policies in developed economies (and their impact) and the expectations around them. Problems in the calibration of these policies and/or in their communication could generate abrupt changes in the outlook for how intense this cycle of interest rate hikes will be and how long it will last, with eventual disorderly responses in the financial markets and potential spillover effects on emerging economies.
Section 2 / Policies to address the situation of families with UVA mortgage financing
In a scenario characterized by increasing levels of financial volatility and a fall in the economy’s output, in mid-2019 the National State, together with the Central Bank, began to implement a set of measures aimed at debtors of mortgage financing denominated in Purchasing Value Units (UVA)73. Although this type of financing allowed greater access to housing between 2017 and 2018, it led to greater exposure of families to possible adverse macroeconomic contexts. Scenarios of these characteristics materialized in the second half of 2018 and in 2019, exacerbated by the impact of the COVID-19 pandemic on the local economy.
The policy actions carried out sought to temper an excessive growth in the financial burden arising from the aforementioned financing. In this context, of the currently 95,270 families with UVA mortgage debts in force (September 2022), only 1.6% of them show some degree of irregularity (1.3% in terms of balances), lower levels of delinquency than those observed in the aggregate financing to families (3% in balances) and to the private sector as a whole (3.1%). Families with this type of financing represent less than 1% of the total number of families that take resources from the financial system.
The main policy measures taken were:
i. Between September 2019 and January 2020, the value of the installments faced by debtors who had contracted loans of up to 120 thousand UVAs was frozen;
ii. Through “Law 27,541”Law 27,541 on Social Solidarity and Productive Reactivation, at the beginning of 2020 a convergence scheme was designed that sought to address the situation of the freeze and thus avoid abrupt jumps in quotas. This scheme respected the principle of “shared effort” indicated in the law, absorbing both the State, debtors and financial institutions part of the effect “(Communication “A” 6884)”;
iii. In view of the COVID pandemic, through Decrees “No. 319/20” and “No. 767/20” a new freeze on installments was established from April 2020 to the beginning of 2021, reaching all UVA mortgage loans for housing. Then a new gradual convergence was established to the contractual value of the quotas, with a duration of one and a half years;
Graph A.2.1 shows a theoretical exercise that indicates the effect of the aforementioned freezing and convergence measures on the installments of a UVA mortgage loan taken out in December 2017 for the purchase of a property74. Given the availability of data, the acquisition of a 3-room apartment (70 m2) in a neighborhood of CABA is assumed, comparing the evolution of the UVA mortgage loan installments with an estimate of the cost that renting the same property would represent75. Then the monthly credit/rent installment ratio is computed, considering a scenario in which no freezing and convergence measures had been taken. In this exercise, significant financial relief is observed for debtors in the period from the end of 2019 to mid-2022.
Figure A.2.1 | UVA Mortgage. Exercise: Theoretical Quota with and without state intervention vs. Rent (%)

For its part, the BCRA provided that, between April 2020 and March 2021, financial institutions must incorporate the unpaid installments corresponding to the maturities operated in that period at the end of the life of the credit, only considering the accrual of the compensatory interest rate. Although this measure covered all credit lines, in the particular case of mortgage loans on single UVA homes, the customer could opt for this scheme or for the aforementioned one (freezing and then convergence).
Decree “No. 767/20” also mandated financial institutions to offer, until mid-2022, facilities for those debtors whose installment exceeded 35% of income. Under this scheme, the entities received 1,573 applications from mortgage customers, of which:
a. 1,092 (69.4%) were rejected, 366 approved (23.3%), 109 (6.9%) were in the process of analysis, and the remaining applications were withdrawn by the applicant;
b. In the case of rejected applications, the entities reported that in 72.2% of the cases the presentation of income was not correctly complied with, in 13.8% there was evidence of a quota/income ratio of less than 35%, while in the remaining 14% there were other reasons (for example, owning more than one home);
c. In the case of approved applications, 57.9% of them received a refinancing as a benefit, 41% a bonus, and the remaining 1.1% a combination of both types of benefits.
Section 3 / Evolution of household indebtedness according to income
The aggregate indebtedness of Argentine households to the financial system is currently equivalent to 4% of GDP (see Section 3), a level that is relatively limited in a historical comparison – it reached almost 7% four years ago – as with respect to other emerging and developed economies. Added to this are moderate levels of household debt servicing burden—just over 10% of the annual wage bill—which influences sustaining the payment capacity of this sector. These developments are in line with the low levels of credit irregularity, moderating this source of associated vulnerability for financial institutions.
However, although this analysis provides a broad view of the household segment of the economy, it only provides an average perspective. In other words, we could be losing sight of the heterogeneities that exist within the different income strata of households. As a result, in order to carry out a more accurate diagnosis of the sector’s leverage and try to capture potential sources of vulnerability, in previous editions of IEF76 a monitoring was carried out on the level of relative indebtedness of families according to income strata. Using a similar methodology, Graph A.3.1 analyzes the evolution of indebtedness by income strata between the end of the third quarter of 2019 and the same period of 2022, once the most acute stage of the impact of the COVID-19 pandemic during 2020 has passed with subsequent recovery of the local economy.
Figure A.3.1 | Debt-to-income ratios and irregularity
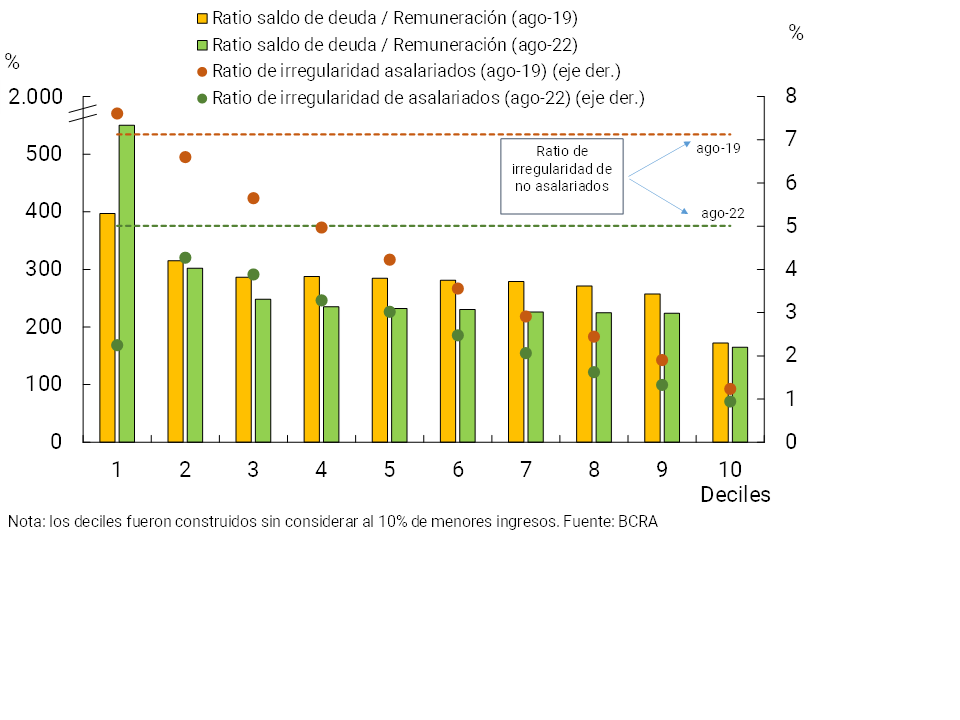
As can be seen, between the peaks of the period, and considering information on just over 5.3 million employed people in a dependent relationship who took out some type of credit in the financial system, there is a fall in the ratio of debt balance to wages in general,with the exception of the first decile of income. Thus, this ratio is currently at 302% in the second income decile (i.e., the equivalent of 3 monthly incomes) below the value of 4 years ago, with a decreasing path to 165% in the tenth decile of highest incomes, also slightly lower than in the same month of 2019.
The analysis shows that the levels of irregularity have also been reduced in recent years in all income strata of families (with a maximum level of 4.3% in the second income decile and a minimum of 0.9% in the highest income decile), remaining below the irregularity ratio of those households that, Although they have some type of debt in the system, they do not have income in a dependent relationship (around 6.3 million people, including self-employed and non-employed people, with an aggregate irregularity of 5% at the end of the third quarter of 2022 – lower than at the end of the third quarter of 2019).
From this monitoring, it can be deduced that the potential vulnerabilities arising from the different income strata of families are limited, although they must continue to be monitored, even considering other sources of non-bank indebtedness.
Section 4 / Recent trends in Mutual Funds (FCIs)
The net worth (NP) managed by the CRFs amounted to $6.3 trillion as of November 2022 (see Figure A.4.1), equivalent to approximately 8.1% of GDP78. Throughout the year, FCIs presented a volatile performance as a result of new subscriptions and redemptions observed, accumulating a real drop of 5%79 since December 2021 (-6.5% YoY). Money market FCIs, which have the highest weighting in the industry (51% of the total), had a growth of 2.2% in real terms since the end of 2021. In the case of fixed-income FCIs, the NP contracted 11% and mixed income funds (15%) and SMEs (20%) also contracted, which are next in importance. The sustainable FCIs, which began in 2021 with one (1) fund in operation80, had a growth of 145% until November 2022 and came to have 7 funds, although they represent less than 1% of the industry’s NP.
Figure A.4.1 | FCI Industry Evolution by Fund Type and Industry Size
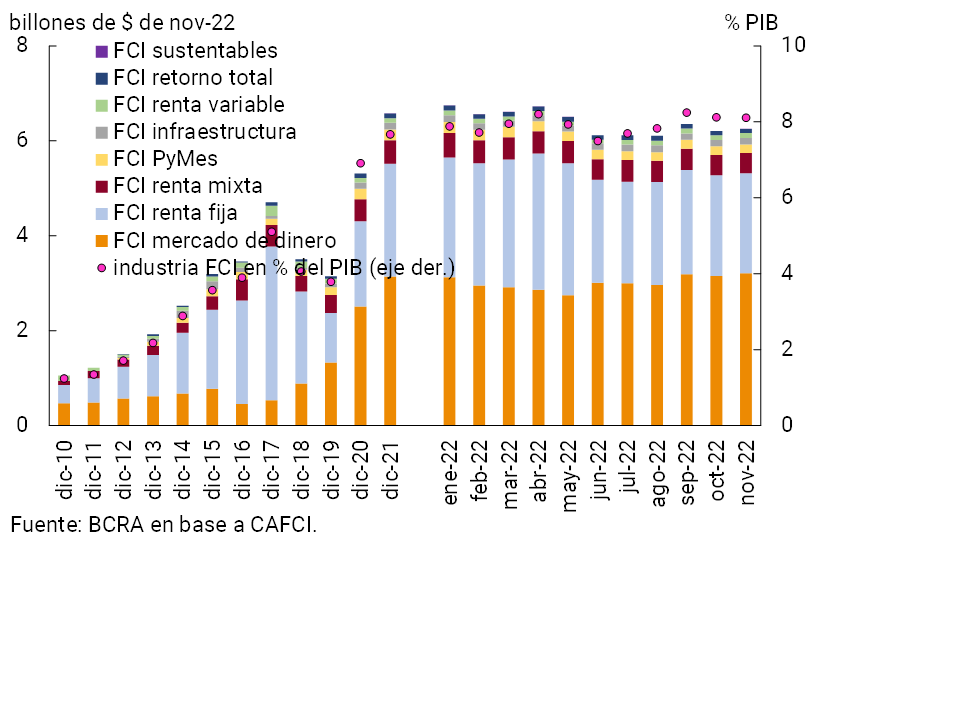
Among the main trends in 2022, it is worth mentioning that, in a context of greater uncertainty, in the middle of the year there was a dismantling of positions in National Government securities, especially in those with adjustment for CER, with an impact on the sovereign curves of yields in pesos. This coincided with redemptions in the quota-shares of fixed-income FCIs in June and July. In response, the BCRA carried out purchase operations of national government securities in pesos in order to reduce volatility and bring yields in line with their macroeconomic fundamentals and to a reasonable relationship with those resulting from Treasury auctions81. The BCRA also took other measures with the aim of preserving financial stability, such as: offering financial institutions a put option82; the opening of the liquidity window for the FCIs through 1-day pass-through operations83; and the adequacy of interest rates in line with the Objectives and Plans for 2022, within the framework of the ongoing monetary policy normalization process (see Section 1).
As a result of the episodes of stress, fixed income FCIs, which had been recovering since June 2021 – accumulating significant net subscriptions until May 202284 – verified net redemptions between June and July equivalent to 20% of the NP under management and 8% of the total industry (see Figure A.4.2). Part of the fall was offset by the reallocation of portfolios in favor of money market funds, by investors prioritizing liquidity. This shift implies a greater direct interconnection between CRFs and financial institutions as mentioned in Section 4.2. In terms of the composition of the portfolio by asset, there was an increase in the weighting of availabilities and term operations (they went from 45% in May to 52% in November 2022), composed mostly of demand deposits and fixed terms, respectively. The dismantling of CER positions led to a reduction in the weighting of domestic government securities in the industry’s portfolio in general and in particular in fixed-income FCIs (whose investments in government securities account for more than 80% of investments in the industry). National public securities went from representing 33% of the total industry portfolio in May 2022 to 24% in October 2022 (see Chart A.4.3), with those with CER adjustment being 14% of the total (10% bills and 4% bonds) compared to 25% in May 2022.
Figure A.4.2 | | Net flows (subscriptions-redemptions) and change by yield by type of FCI
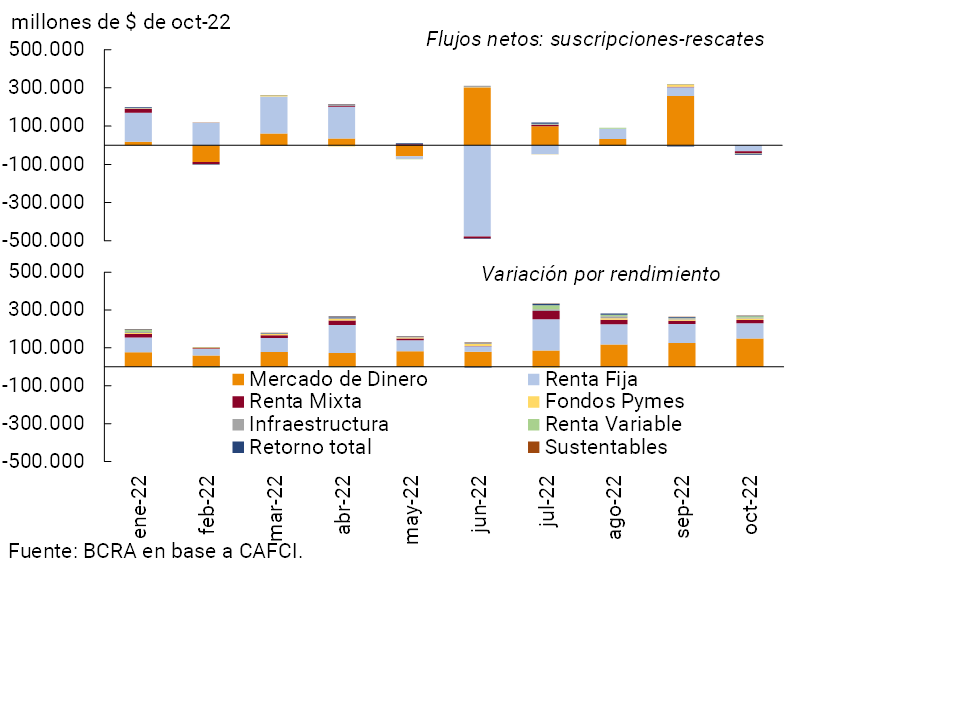
Figure A.4.3 | FCI Industry Portfolio Composition
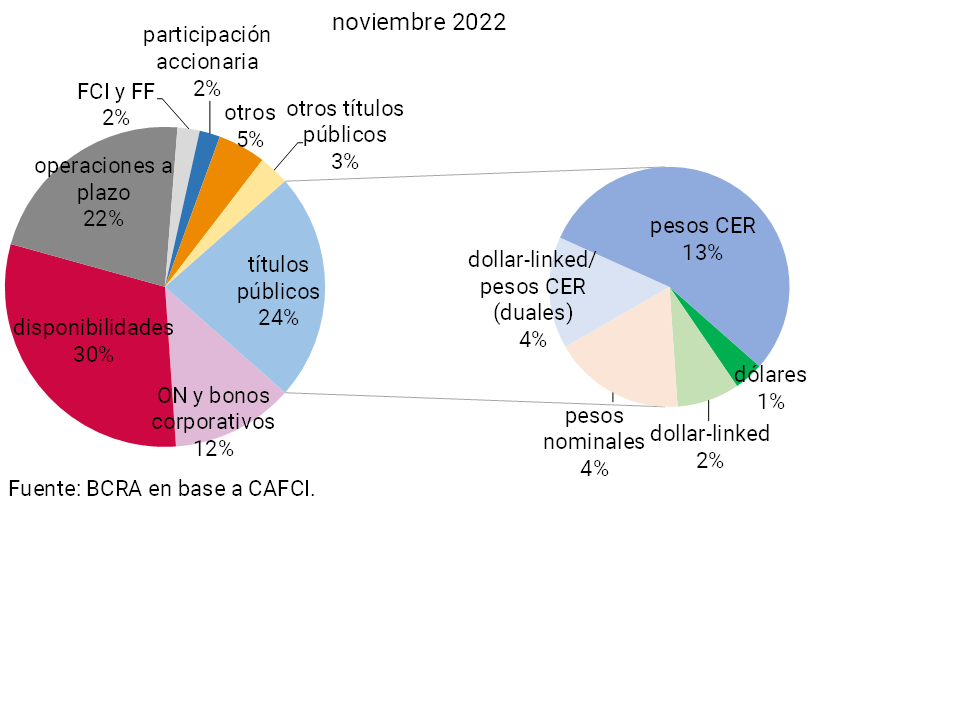
With respect to the85 yield, accompanying the rise in reference rates, the nominal yields of money market funds increased, although their differential with respect to the BADLAR BP has been reduced in recent months. In real terms, there was a slight increase in general, becoming less negative in the case of both money market funds and fixed income funds.
References
1 For more information on the evolution of the level of activity both globally and locally, as well as an overview of the policies applied in Argentina, see “Monetary Policy Report”.
2 Quote data updated to mid-December. It is noteworthy that the rise in US Treasury yields and the appreciation of the dollar slowed down towards October, with a partial decline in November and December (the latter coinciding with an improvement in equity prices).
3 Lower expected volatility (lower VIX) is generally associated with higher risk appetite in international markets.
4 After the sharp declines recorded between the last months of 2021 and the first half of 2022, the prices of the main cryptocurrencies registered a certain rebound, but in mid-November they were again showing downward corrections (due to the uncertainty generated by problems faced by a specific platform).
5 In the case of Brazil, the real depreciated 1% since the middle of the year. However, heterogeneity was observed in the evolution of exchange rates, with some discrimination between countries based on macroeconomic fundamentals (including the early start of the cycle of interest rate hikes in certain emerging economies).
6 Between July and November, the refinancing rate was approximately 168% on average (137% accumulated from January to November).
7 In the medium term, the BCRA seeks to gradually converge towards managing the economy’s liquidity through OMA with Treasury bills and other short-term securities denominated in local currency (a mechanism similar to that used in other countries). For more information , see “BCRA Intervention in the Domestic Currency Debt Market” in IPOM of September 2022.
8 For more information, see communiqués “of July 12,” “July 28,” and “August 11.”
9 See “Objectives and plans regarding the development of monetary, exchange, financial and credit policies for the year 2022”.
10 See, for example, “Reconstruction of the secondary market for public debt in pesos and liquidity risk” in IEF of “IIS-22”.
11 With an average term of less than one year.
12 Throughout the last semester, 3 new social, green and sustainable NOs were placed. Thus, 35 bonds have been added since the first issue in 2017. In terms of currency, the species denominated in dollars (about 90% of the funding obtained so far) stand out. In terms of sectors, the energy sector stands out, as expected. As of November, the balance of financing qualified within the framework of the “Guidelines for the issuance of Negotiable, Social, Green and Sustainable Securities in Argentina” of the CNV and in line with the Principles of Sustainability-Linked Bonds represents 5% of the total stock of Notes in the corporate sector.
13 For example, personal loans came to represent 82% of the total trust assets in the period. In this total, the participation of banks and non-bank financial institutions was insignificant (3% of the amounts of securitizations), as has been observed in recent years. More in perspective, and as an example, by 2015 banks and EFNB accounted for 18% of the amount of securitizations.
14 This behavior was more marked in dollar-linked NOIs, whose average term (weighted by amount) fell to 41 months between July and November, from 66 months in the previous 5 months (when 5 NOs were placed in the electric power, oil and commercial air service sectors at 120 months). For bonds in pesos, the average term went to about 15 months from 16 months (in those periods, respectively). In deferred payment checks (with information as of November), the terms were shortened to less than 100 days. In peso promissory notes and financial trusts, the trend was uneven (the average term was 310 and 370 days, respectively).
15 In the case of dollar-linked bonds, on the other hand, there was a drop in the cut-off yields of placements (on an average-weighted basis). This is explained by numerous ONs placed with 0% yield (33 out of a total of 49 ONs in the segment between July and November).
16 The maturities of ON in dollars amount to about US$1,500 million in IS-23.
17 This is Communication “A” 7106 and amendments, in force since October 2020, from which a significant part of the maturities in dollars of 2021 and 2022 were refinanced. So far in the second half of the year, there have been 2 additional operations linked to ONs of companies in the energy and oil sectors.
18 Until March 2023, the entities covered must maintain a balance of financing comprised that is at least 7.5% of their private sector deposits in September 2022 pesos. Interest rates remain at 64.5% TNA for financing investment projects and at 74.5% TNA for the rest of the destinations. For more detail, see “Ordered Text”.
19 According to information as of August 2022 from the “Ministry of Labor, Employment and Social Security”.
20 Made up of financial institutions whose assets are greater than or equal to 1% of the total assets of the financial system. For more details, see the ordered text of “Authorities of financial institutions”.
21 Defined as the sum of the balances of availabilities, concepts included in the integration of minimum cash and other instruments of the BCRA, both in national and foreign currency.
22 During 2020 and 2021, in the context of the pandemic, the macroprudential regulations implemented by the BCRA suspended the distribution of dividends by institutions. In 2022, financial institutions were able to distribute up to 20% of what was accumulated until 2021 in 12 monthly installments. See Ordered Text on “Distribution of results”.
23 Including, for example, abrupt changes in expectations about the monetary policy bias of developed economies, an escalation in the conflict in Ukraine (see “Russia-Ukraine conflict and challenges to global financial stability” in IEF I-22), negative developments regarding the COVID epidemic in the context of the winter in the northern hemisphere or major credit events (or significant increase in rating downgrades credit and defaults) that generate a sudden rethinking of risk appetite among investors.
24 For more detail, see Section 3 of the “IEF of July 2022”.
25The guidelines established in Box 5 of the “IEF I-22” are followed.
26 The balance of forecasts for the portfolio in an irregular situation is estimated as the total net forecasts of the theoretical forecasts for the regular portfolio (criteria of the minimum regulatory forecasts for risk of uncollectibility).
27 Transport and communications, Hotels and restaurants and Other social and community services. For more detail, see “IPOM”.
28 See Section 3 of the “IEF of June 21”.
29 “Principles for the effective management and supervision of climate-related financial risk”.
30 “FSB Roadmap for Addressing Financial Risks from Climate Change 2022 progress report”.
31 “Within the framework of the Technical Committee on Sustainable Finance (MTFS)”.
32 In this case, in addition to loans, financing through public securities is considered.
33 Financing to the private sector net of the total forecasts in terms of total assets also decreased when compared to the previous IEF (2.4 p.p. to 27.2%).
34 Credit to the private sector in foreign currency as a percentage of total assets fell by 0.3 p.p. compared to the previous IEF, reaching 2.3% in September.
35 Economic activities were grouped into 4 categories: (i) Greater weight and rest (Industry, Commerce, Construction, Financial Intermediation, and Real Estate and Business Activities), (ii) Primary Activities (Agriculture, Fishing, and Mining), (iii) Most Affected by the Pandemic (Transportation and Communications, Hotels and Restaurants, and Other Social and Community Services), and (iv) Basic Services (Public Administration, Health, Education and Electricity, Gas and Water).
36 See footnote above.
37 It is defined as the proportion of the credit balance that, being initially in credit situation 1 and 2 (regular), becomes in situation 3, 4, 5 and 6 (irregular) at the end of the period under analysis (in this case, a three-month comparison is taken).
38 These indicators reached 3.6% and 128.8% when considering the average of the last 10 years; and totaled 3.6% and 114.5% on average from 2008 to 2010 (international financial crisis).
39 Given that debtors in the financial system went from almost 4 million at the beginning of 2003 to more than 12 million in September 2022, another way of analysing the degree of concentration of these debtors is by considering the relative importance of a constant set, once ordered from highest to lowest with respect to the financial system. In this case, the first millionth of debtors (with the largest balance) currently account for 5.1% of the total balance (below the historical average of 5.4%) and the first one hundred thousandth (with the largest balance) 13.7% (lower than the average of 17%).
40 Balances as of September as a percentage of GDP estimated in the third quarter of 2022 (without seasonality). In addition to loans from financial institutions regulated by the BCRA, this includes financing from credit card systems, loans from mutual societies and cooperatives (based on INAES), financing from other non-bank credit providers registered with the BCRA, financing in the portfolio of financial trusts not linked to infrastructure, loans from the FGS (including PRO.CRE.AR portfolio), negotiable obligations issued by the non-financial private sector with local legislation, deferred payment checks, loans linked to leasing and factoring and external financing (based on INDEC) through bonds and loans (not including credits and commercial advances). For external financing data (INDEC), the latest published data (June) are used and adjusted based on the exchange rate.
41 The normative approach in this matter is intended to separate transactions arranged in national currency from those in foreign currency. Resources from deposits in foreign currency can only be channeled to debtors with income from foreign trade operations and related activities, and if they are not applied to this type of destination, they must be kept available (liquid). For more details see “TO Credit Policy” and “TO on Minimum Cash”.
42 When differentiating by currency, between April and September, the relative weight of items denominated in foreign currency increased, while those denominated in pesos and those adjustable by CER or UVA were reduced. These movements mainly reflected the effect of the National Government’s debt swap carried out in August 2022, in which bonds and bills in pesos (with and without adjustment for CER) were taken for new dual-currency bonds maturing in 2023 (yield in pesos arising from the greater variation between the CER plus a coupon of 2% per annum and the peso-dollar exchange rate).
44 For more details see “Press Release” of 1/11/22.
45 The weighting of deposits in national currency made by the FCIs totaled 20.2% as of September, increasing 1.5 p.p. compared to the last IEF and 1.3 p.p. y.o.y. On the other hand, deposits in national currency with a balance greater than $20 million gained relevance in total funding, especially in the last quarter (+3.8 p.p. compared to mid-year and +5.5 p.p. y.o.y. to 55% in September).
46 Deposits in national currency with a residual maturity of less than 1 month accounted for 85.9% of the total, 0.5 p.p. below the level observed in the previous IEF.
47 In the last 15 years, the average broad liquidity ratio of the sector aggregate in pesos totaled 43.8% and 80.9% for the segment in foreign currency.
48 The financial institutions that are obliged to comply with these requirements are those belonging to Group A. For more details on these ratios, see the ordered text of the “Liquidity Coverage Ratio (LCR)” and the “Net Stable Funding Ratio (NSFR)”.
49 Of the total of 78 entities, as of Nov-22, only 20 (7 EFNBs and 13 banks) have outstanding NBs.
50 Payments for 63% in pesos, 19% in UVA, 8% dollar-linked and 9% dollars (local market).
51 While the margin on BADLAR BP tended to fall between July and November.
52 For more details see “Basel Supervisory Committee – Supervisory Framework for Calculating and Controlling Large Risk Exposures”.
53 See TO on “Large Exposures to Credit Risk”.
54 Among the complementary standards are “Credit Graduation”, “Financing to the Non-Financial Public Sector” and additional capital requirements (“Minimum Capital of Financial Institutions”). For its part, since the entry into force of the regulation on Large Exposures to credit risk, the regulation on “Fractionation of credit risk” was left without effect.
55 This group of publicly offered companies represents a segment of the local corporate sector characterized by relatively medium-sized and large-sized companies based on their assets. For more details on coverage and methodology, see sections on “Equity Situation of the Corporate Sector” in “IEF I-17”, and “Financial Situation of Companies with a Public Offering” in “IEF I-19”.
56 This is also true for the 25th and 75th percentiles of the indicator’s distribution.
57 For more details on the methodology, see “Financial Situation of Publicly Offered Companies” in “IEF I-19”.
58 For more details on the methodology that follows international guidelines, see “here”.
59 The Sustainability Guarantee Fund (FGS) continues to be the main institutional investor given the value of the portfolio under management, followed by mutual funds and insurance companies.
60 See “Section 5 / Evolution of the Mutual Fund (FCI) industry and interconnection with the financial system” in IEF IS-21.
61 The performance of the money market FCIs occurred in a context of increased deposits from individuals and linked to payment service providers. See “Financial Inclusion Report, October 2022”.
62 Although this market is small in relative terms, with an average amount traded per day equivalent to less than 1% of the balance of private sector deposits and decreasing at the margin, it is relevant in terms of the signals it can provide given the use of it by entities for liquidity management.
63 For example, in recent months there has been a drop in the number of nodes that refers to the number of financial institutions participating in the market (it fell from 67 at the end of June to 55 in November). The number of links and the density of the network also fell compared to the previous period. For the definition of them and the main terminology used in network analysis, see Section 3 of the “IEF II-18” and Section 4 of the “IEF I-19”.
64 While the ECB and the Bank of England implemented increases in monetary policy rates in a range of 250-350 bp.
65 The Federal Reserve began in June with the contraction of its balance sheet at a rate of US$47.5 billion per month. As of September, the pace of reduction increased to US$95 billion per month.
66 Interest rate futures show that the market expects the federal funds rate to peak at around 5% by mid-2023, and then begin a tapering path.
67 Such a situation would imply, for example, a possible generalized and disorderly disarmament of positions.
68 Such as the COVID-19 shock (about US$80 billion) and the episode of adjustment of expectations with respect to the Federal Reserve’s tapering in 2013 (US$145 billion between mid-2013 and the end of the first quarter of 2014).
69 It should be noted that in 2022 the outflows are occurring more markedly from funds specialized in bonds (unlike the two previous episodes of outflows mentioned). Likewise, more recently and at the margin, in the second half of November there were net inflows to both funds specializing in stocks and emerging bonds.
70 For example, interest rate hikes in the face of increases in inflation in developed economies or in response to a shock in these economies (changes in investors’ outlooks) would have a less benign impact on emerging economies than those due to issues related to the real economy (prospects for an increase in the level of activity). See, for example, “How Do Rising U.S. Interest Rates Affect Emerging and Developing Economies?” (World Bank, 2022).
71 Although the experience is diverse, in the face of cycles of interest rate hikes in developed economies, capital flows to emerging economies tend to be more affected once the cycle is advanced or already concluded. See section “Expectations on US monetary policy and Impact on the assets of emerging economies” in IEF for the first half of 2015.
72 In the face of more adverse conditions, the possibility of forced dismantling of positions in different instruments to cover redemptions in the fund industry is compounded by the effect of liquidity needs to face the recomposition of margins in the derivatives markets. For more information on the debate around the NBFI sector in general (and on how to address the systemic risk it generates) and the work agenda proposed at the international level, see the FSB’s recently published paper on “Enhancing the Resilience of Non-Bank Financial Intermediation: Progress report”.
73 Three-quarters of these correspond to public financial institutions.
74 The operation assumes that the debtor takes a loan in UVAs for 75% of the value of the property, under the conditions of average rate and term operated in the month of granting, and that he begins to pay in the following month.
75 The data on rent and price per m2 come from the General Directorate of Statistics and Censuses of the GCBA.
76 For more detail, see Section 2 “Analysis of household indebtedness based on microdata from the Central Debtors” of the “IEF I-19” and Section 3 “Indebtedness of Families by Income Strata” of the “IEF II-16”.
77 Net remuneration corresponding to the month indicated in the graph.
78 The FCI industry is the second largest institutional investor in Argentina, behind the FGS (11.9% of GDP). See “Section 5 / Evolution of the Mutual Fund (FCI) industry and interconnection with the financial system” in IEF IS-21.
79 Variations in homogeneous currency are considered in all cases, unless otherwise clarified.
80 The CNV regulated the operation through RG 885/2021, creating a special regime for these funds. According to it, for a fund to be considered “sustainable” it has to have at least 45% of the investments (in terms of the NP) in assets considered social, green and sustainable or listed within the authorized panels with good corporate, social and/or environmental governance practices.
81 See “Section 5 / BCRA Intervention in the Domestic Currency Debt Market” in “IPOM of September 2022”.
82 For those awarded since July 2022 and maturing before the end of 2023, “Communication “A” 7546″.
83 “Communication “A” 7579″. The interest rate for FCIs is equivalent to 75% of the rate of passive passes for financial institutions. Put option of national public securities for those awarded since July 2022 and maturing before the end of 2023.
84 That growth was also accompanied by performance in terms of yield, with the result that the growth of the NP of fixed income CRFs exceeded the NP of the money market CRFs as a whole up to April 2022. Thus, in May 2022, fixed-income FCIs outperformed money market funds in terms of PN (43% and 42% of the total industry as of May 2022) for the first time since August 2019, when the National Government’s debt reprofiling (the weightings were 53% and 23%, respectively in that month).
85 From a sample of collections.
Glossary of abbreviations and acronyms
€: Euro
to.: Annualized
AFIP: Federal Administration of Public Revenues
ANSeS: National Social Security Administration
RWA: risk-weighted assets
ATM: Automated Teller Machine
BADLAR: Buenos Aires Deposits of Large Amount Rate (interest rate paid for 30 to 35-day fixed-term deposits, more than $1 million, average of entities)
ECB: European Central Bank
BCBA: Buenos Aires Stock Exchange
BCBS: Basel Committee on Banking Supervision
BCRA: Central Bank of the Argentine Republic
IDB: Inter-American Development Bank
BIS: Bank for International Settlements
BoE: Bank of England
BONUSES: Fixed-rate Treasury bonds in pesos
CABA: Autonomous City of Buenos Aires
CAFCI: Argentine Chamber of FCI
Call: Interest rate on unsecured financial market operations
CCP: Central Counterparty (Contraparte Central)
CDS: Credit Default Swaps
CEMBI: Corporate Emerging Market Bond Index
CER: Reference Stabilization Coefficient
NVC: National Securities Commission
COVID-19: Coronavirus wished 2019.
MUST: Immediate Debit Payment Method
DPN: National Public Debt
DSIB: Domestic Systemically Important Banks
ECAI: External Credit Assessment Institution
ECB: European Central Bank
ECC: Credit Conditions Survey
USA: United States
EFNB: Non-Banking Financial Institutions
EMAE: Monthly Estimator of Economic Activity
EMBI+: Emerging Markets Bond Index
EPH: Permanent Household Survey
FCI: Mutual Funds
Fed: US Federal Reserve
Fed Founds: US Federal Reserve Benchmark Interest Rate
FGS: Sustainability Guarantee Fund
IMF: International Monetary Fund
FSB: Financial Stability Board
GBA: Greater Buenos Aires (includes all 24 matches)
A.I.: Year-on-year
IAMC: Argentine Institute of Capital Markets
IBIF: Gross Domestic Fixed Investment
IEF: Financial Stability Report
INDEC: National Index of Statistics and Censuses
CPI: Consumer Price Index
IPIM: Domestic Wholesale Price Index
IPMP: Commodity Price Index
IPOM: Monetary Policy Report
VAT: Value Added Tax
CSF: Liquidity Coverage Ratio
LELIQ: Liquidity Bills of the Central Bank of the Republic of Argentina
LFPIF: Financing line for production and financial inclusion
LR: Leverage Ratio
MAE: Electronic Open Market
MERCOSUR: Southern Common Market
Merval: Buenos Aires Stock Market (benchmark stock market index)
MF: Ministry of Finance
MH: Ministry of Finance
MSMEs: Micro, Small and Medium Enterprises.
MSCI: Morgan Stanley Capital International
MULC: Single and Free Exchange Market
NIC: International Accounting Standard.
IFRS: International Financial Reporting Standards (IFRS)
OECD: Organization for Cooperation and Development Ec.
ON: Negotiable obligations
OPEC: Organization of the Petroleum Exporting Countries
P.B.: The Basics
P.P.: Percentage points
PEN: National Executive Branch
PGNME: Global Net Foreign Exchange Position
GDP: Gross Domestic Product
PN: Net Worth
PPM: Mobile Payment Platform
SMEs: Small and Medium Enterprises
REM: Market Expectations Survey
ROA: Return on assets
SWEE: Return in terms of equity
ROFEX: Rosario Futures Exchange (Mercado a término de Rosario)
RPC: Computable Patrimonial Liability
S&P: Standard and Poor’s (Index of the main stocks in the US by market capitalization)
s.e.: Series without seasonality
SEFyC: Superintendence of Financial and Exchange Institutions
NFPS: National Non-Financial Public Sector
SGR: Reciprocal Guarantee Society.
TCR: Real exchange rate
TM20: Interest rate for fixed-term deposits of 20 or more million pesos or dollars.
TN: National Treasure
TNA: Annual Nominal Rate
Trim.: Quarterly / Quarter
ICU: Utilization of Installed Capacity
EU: European Union
US$: US Dollars
UVA: Unit of Purchasing Value
ICU: Housing Unit
UVP: GDP-Linked Units
Var.: Variation
VIX: S&P 500 volatility
WTI: West Texas Intermediate
Share on


