Summary
During 2021, a period in which progress was made in the reopening and recovery of the local economy, the aggregate financial system developed its activities of intermediation of funds and provision of payment services without disruption. The institutions as a whole continued to show a significant degree of resilience, in a context of comfortable levels of liquidity, forecasting and capital such as those it has had since before the start of the COVID-19 pandemic, to deal with any trace of vulnerability. Added to this were the benefits of having a regulatory framework in line with international standards, strengthened by the financial policies applied by the BCRA in the face of the shock.
Local economic activity resumed the path of recovery in the third quarter of the year – even with heterogeneous sectoral performances – after the impact of the second wave of the pandemic. As a result, GDP growth expectations for all of 2021 are in the order of 9%, an evolution that will be driven by the greater flexibility of activities in the face of the growing vaccination coverage of the population and by the benefits of the public policies implemented. With its actions, the BCRA continued to promote the path of recovery of activity in recent months, preventing the pandemic scenario from materializing in permanent damage to the private sector of the economy. In this regard, the axes of the prudential policy were maintained, which seeks to boost credit to companies and families under flexible financial conditions, alleviate the financial situation of sectors still in the process of recovery, strengthen savings in local currency, sustain the soundness conditions of the entities, as well as calibrate exchange regulations to promote an efficient use of international reserves.
Local financial markets showed a mixed performance in recent months, although the Treasury was able to carry out tenders with good results in terms of refinancing. The objective of advancing in the construction of a curve in pesos that is attractive and sustainable over time, consistent with the situation and prospects of the local market, is maintained. Public policies continue to promote the development of a more efficient and deeper capital market. Financing to the private sector through the local capital market showed some progress in the second half of the year. However, the size of this market remains relatively limited, maintaining a significant potential margin for development, so that it acts as a complement to the banking market to finance investment in the medium and long term.
The Argentine financial system preserves features of solidity in the face of a set of exogenous risk factors that could eventually impact its normal functioning. Among the main risk factors, potential changes in the health situation (effects of new variants of the virus) continue to predominate, a scenario that could eventually condition the evolution of the local economy. On the other hand, in addition to the recent episodes of increased volatility in some segments of the local financial markets, there is the impact of factors such as expectations about an upcoming agreement with the IMF, or the seasonal dynamics of the foreign exchange market, among others. Likewise, the risk of a deterioration in the external context increased at the margin, both due to the developments regarding the pandemic in the northern hemisphere, and due to the increase in the probability of future corrections in the monetary policy of developed economies (which would imply higher interest rates in international markets, a more appreciated dollar at the global level and a decrease in commodity prices). This is a scenario in which significant vulnerabilities continue to prevail globally. Among these, the existence of high valuations in part of the financial markets, growing leverage at the global level and the existence of economic sectors with an economic-financial situation still compromised by the shock continue to stand out. Added to these global vulnerability factors is the significant expansion of non-bank financing in recent years (mainly driven by investment funds), a factor that amplifies global financial pro-cyclicality and makes portfolio movements between countries more volatile. This could generate new abrupt reversals in flows to emerging countries, episodes with acute negative impacts such as the one evidenced at the beginning of 2020.
In general terms, the balance between the potential sources of vulnerability of the Argentine financial system and its resilience elements showed a slight improvement with respect to the previous IEF, mainly from a certain consolidation of the latter. This behavior was generated in a context in which the financial system continued to orient its activity mainly towards the transactional segment, with relatively unsophisticated products, limited interconnection channels and a very low depth in the economy, all factors that limit the potential systemic impacts.
Indeed, there has been a slight reduction in vulnerability derived from the system’s equity exposure to aggregate credit risk of firms and households (at a moderate level (less than 31% of assets) and decreasing), along with an increase in equity exposure to the public sector. This performance occurs in a context in which the levels of irregularity of credit to the private sector have increased since the first quarter of 2021, which was foreseeable given the targeting of financial relief measures. Despite the aforementioned increase in the irregularity ratio, it should be noted that in August and September some reduction was observed in it, being one of the indicators to be monitored in the coming months. Although at limited levels, this potential vulnerability of the financial system would remain the relatively most relevant for 2022, on which some of the risk factors raised could have an impact (especially those linked to economic performance and their spillover on the payment capacity of debtors). To address these potential scenarios, the aggregate of entities maintains high levels of coverage through forecasting as well as capital integration (increasing in recent months), in a context of low to moderate levels of indebtedness of both companies and households and the positive effects of the financial relief measures promoted by the BCRA.
As usual in financial systems, the performance and composition of funding remains another potential source of relative vulnerability for all entities at the local level, in a context in which, unlike the previous IEF, funding through deposits in pesos from the private sector showed a recomposition in the second and third quarters of the year in real terms. Possible episodes of volatility in local financial markets – a risk mentioned above – could affect the demand for deposits in the aggregate of financial institutions, both in terms of their volume and their composition. To deal with possible situations of this type, it should be noted that the financial system maintains high and growing levels of coverage with liquid resource margins, comfortably complying with the minimum requirements for liquidity ratios recommended by international standards.
Finally, another potential source of vulnerability in the financial system is the performance of the local resource intermediation process, which has seen relatively moderate growth in recent months. In the third quarter of the year, the balance of credit in pesos to the private sector increased in real terms, after two quarters of decline. A possible weakness in the financial intermediation process resulting from the materialization of any of the aforementioned risk factors, especially in terms of the performance of economic activity, could impact the traditional sources of income of the entities. The eventual materialization of this hypothetical scenario would find the financial system with relatively high levels of capital, as well as with a recent level of sectoral profitability in positive territory. Here we must also consider the positive effects that the credit stimulus measures implemented by the BCRA in conjunction with the PEN will continue to have on financial intermediation and, in this way, on the local economic recovery.
The BCRA expects the aggregate of financial institutions to maintain a high degree of resilience for 2022, even in the face of events of materialization of some of the risk factors raised. The economic recovery currently underway, added to the health of the Argentine financial system and the sustained actions of the BCRA to maintain its prudential policy axes, will continue to promote progress in the development of the sector with a positive impact on the development of the economy as a whole.
1. International and local context
The external context has maintained a generally positive bias since the publication of the last IEF. The global economy continued to recover, albeit at a slower pace, given the continuing COVID-19 pandemic and bottlenecks in global supply chains. There is also an uneven growth rate between developed and emerging economies. With economic recovery and an increase in the price of energy-related raw materials (until mid-November)1, inflationary pressures at the global level also increased. As developed economies largely continued to maintain their stimulus policies, in international financial markets, perceived risk (commonly approximated through the VIX) remained at limited levels for much of the period under review, rising towards the end of November, given concerns about the new COVID variant (omicron). In this context, the prices of financial assets showed heterogeneous behaviors by segments and markets.
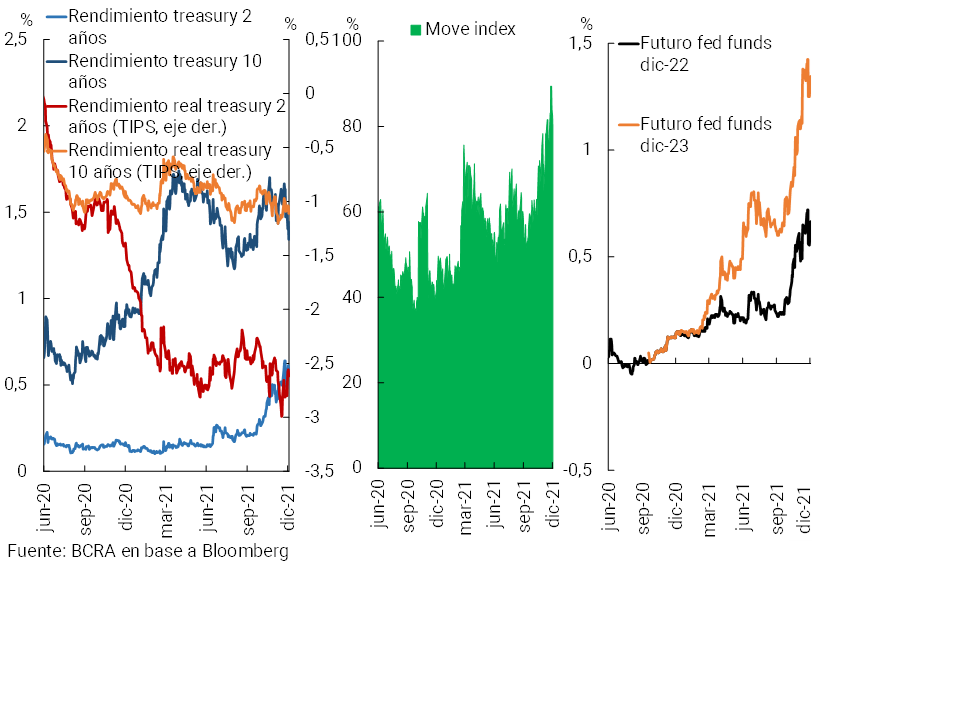
With growing inflationary pressures in developed economies, there has been an increase in the yields of their public securities in recent months. In particular in the case of the US, from mid-September onwards there was an environment of greater expected volatility and a rise in short- and long-term yields in the Treasury market (which initially implied some flattening of the yield curve), with partial reversal in November and early December (see Chart 1). The aforementioned hike accompanied the greater focus of the investor base on the possibility of increases in the monetary policy rate starting in 2022, following the announcement in November by the Federal Reserve of its intention to begin reducing its asset purchases as of that same month (a bias that was further emphasized at the December meeting)2. The trend, which had already been observed, of appreciation of the dollar against the rest of the currencies was then emphasized.
Graph 1 | Nominal and real yields – treasuries
As mentioned in previous IEFs, the normalization of monetary stimulus policies in developed economies could generate abrupt changes in market expectations, generating a challenge for financial stability at the global level, given the presence of various vulnerabilities, with potential spillover effects on emerging economies. These vulnerabilities include the existence of high valuations in different segments of global markets (e.g., equities and corporate debt), with some disconnect from economic fundamentals, which makes them susceptible to sudden correction3. Added to this is growing leverage globally, while there are segments of the corporate sector with results generation still compromised by the pandemic4. Another vulnerability is given by the increase in recent years of non-bank financing, led by the investment fund industry, with pro-cyclical behavior and particular incidence on portfolio movements between jurisdictions (increasing the possibility of abrupt changes in flows to emerging markets).
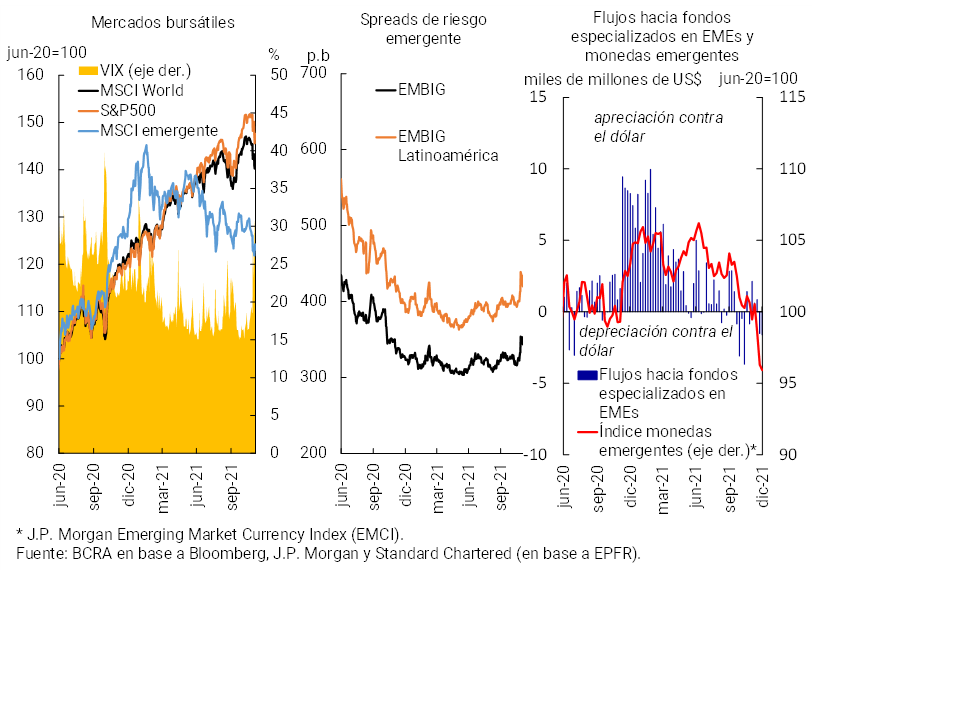
With regard to the markets of emerging economies, in the second half of the year there have been falls in stock market indices measured in dollars (12% according to the MSCI EM until the end of November, see Chart 2) and an increase in the margins required in the secondary markets for sovereign debt (60 bps in the EMBIG). Since June, investment funds specialising in emerging markets have accumulated net inflows in aggregate terms, with inflows to specialised equity funds partially offset by outflows from specialised debt funds. However, so far in the second half of the year, emerging market debt placements in primary markets remain at levels similar to those observed pre-COVID5.
Graph 2 | International financial markets – selected variables
At the local level, economic activity resumed the path of recovery in the third quarter, in a scenario still conditioned by the pandemic and by the transition implied by the policies applied to address the macroeconomic imbalances that existed prior to the COVID-19 shock6. The dynamics of economic activity are expected to continue to improve, underpinned by the relaxation of activities and capacity, depending on the progress of the vaccination campaign and the evolution of the epidemiological situation, especially benefiting sectors most affected by the pandemic (such as recreational activities, or services linked to tourism). Added to this is the announcement, in recent months, of new measures to stimulate activity and support different productive and social sectors, in order to promote sustainable and inclusive economic growth, without neglecting the sustainability of public accounts. In the case of the financial sector, measures to stimulate credit to the private sector stand out, such as the “Financing Line for Productive Investment of MSMEs” (LFIP) for the 2021/2022 period, the program called “Zero Rate Credit 2021” and the extension of the “Ahora 12” for credit cards until the end of January 2022.
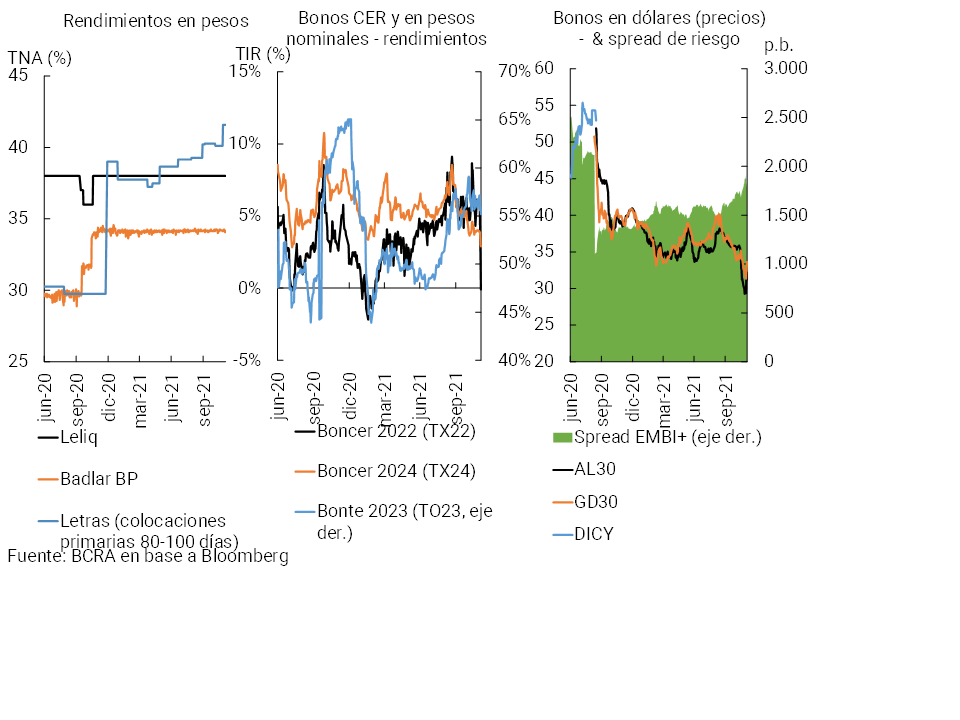
The different variables linked to local financial markets continued to show a mixed evolution since the publication of the last IEF (see Chart 3). The Treasury continued to access local funding, mainly through bills, with good results in terms of refinancing (ratio of amounts placed in relation to maturities). Placement yields were gradually increasing, given the objective of continuing to advance in the construction of an attractive and sustainable curve, consistent with the situation and prospects prevailing in the local market. It should be noted that the Market Makers Program began in August, with the aim of generating liquidity and facilitating the purchase and sale of Treasury instruments (see Section 1). In relation to the secondary markets, in recent months there has been an increase in the yields of Treasury instruments in nominal pesos, with a steepening of the LEDES curve (those with the highest liquidity), while for instruments adjustable by CER the yields tended to contract. On the other hand, bond yields in dollars widened (based on foreign quotations), which translated into an increase in the margin of the Argentine EMBI. This occurred in a scenario in which negotiations to reach an agreement with the IMF continue, while greater volatility in exchange rate expectations was observed, typical of the electoral process. The BCRA then calibrated its intervention in the spot and forward exchange markets, in addition to adapting the exchange rate regulation. In addition, in October and November, the CNV implemented new provisions on transactions of negotiable securities with settlement in foreign currency to reduce the volatility of financial variables and contain the impact of fluctuations in financial flows on the real economy7.
Graph 3 | Interest rates and fixed income instruments in Argentina
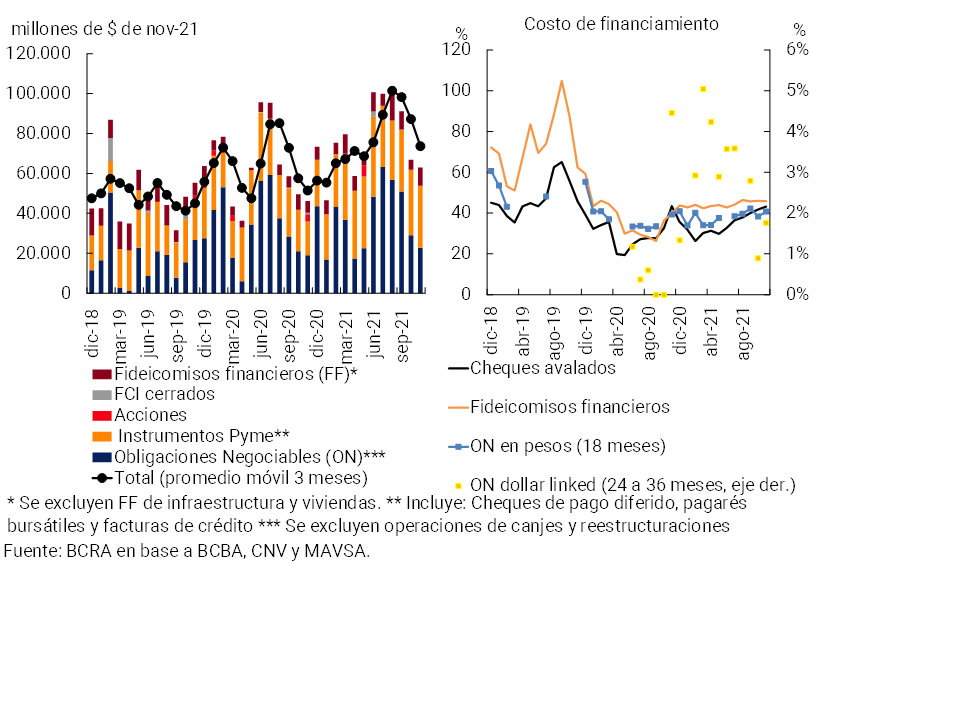
Finally, financing to the private sector through the local capital market continued to increase in the second half of the year, although the size of this market remains limited compared to that of other emerging economies and, therefore, with significant room to deepen its development, so that it acts as a complement to the financial system to finance investment in the medium and long term. Between July and November, the aggregate amount of financing through the market (in gross terms) registered a year-on-year growth of 35% compared to the same period in 2020 and 11% compared to the previous five months in real terms (see Chart 4), although with a generally increasing cost for the main instruments in pesos. The increase in the amounts placed was generalized among instruments (negotiable obligations, financial trusts, deferred payment checks, promissory notes and credit invoices)8 in year-on-year terms, highlighting the role of negotiable obligations (ON), the main financing instrument (see Section 2). In the SME segment, although the main instrument continues to be the deferred payment check (with more than 70% of its amounts in E-CHEQ format), in recent months the dynamism observed in the operation of promissory notes is remarkable.
Figure 4 | Financing the private sector through the local capital market
2. Main strengths of the financial system in the face of the risks faced
In the second half of 2021, the financial system operated without disruptions, maintaining moderate exposures to the risks faced and high hedges. The operational economic framework gradually normalized, in parallel with a significant advance in vaccination against COVID-19. In particular, there was an increase in the aggregate level of activity with improvements in a growing number of productive branches and an increase in the mobility of people to their usual places of work. Faced with this scenario, the National Government and the BCRA focused on the assistance programs for the private sector implemented in the context of the pandemic9.
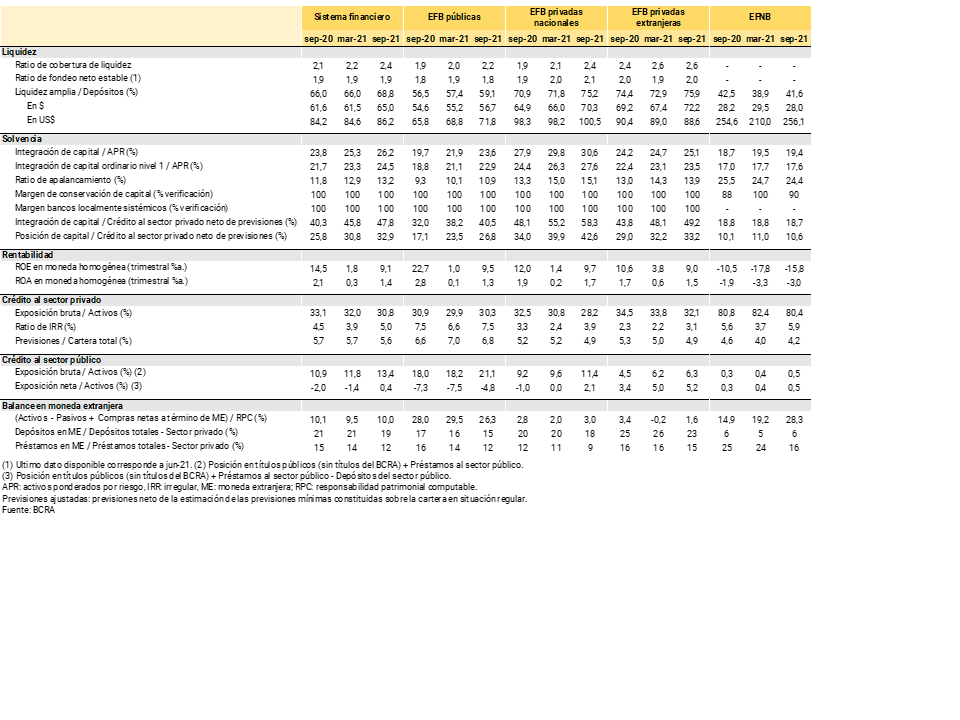
The financial system continues to maintain a set of structural characteristics that help to keep systemic financial risk at limited levels. In particular, there is a low depth of credit to the private sector in the economy, traditional financial intermediation (unsophisticated and oriented towards the transactional segment) predominates, and there is a low direct interconnection between financial institutions. In addition, financial institutions as a whole maintain soundness indicators (see Table 1) and a regulatory and supervisory scheme that includes international recommendations on best practices, adapting them to the reality of the local market (see Section 4). As usual, this section includes a review of the main relative strengths of all financial institutions in the face of the possible materialisation of risk factors, while the following sections will delve into these and other features of the sector’s strength within the framework of the assessment of its sources of vulnerability.
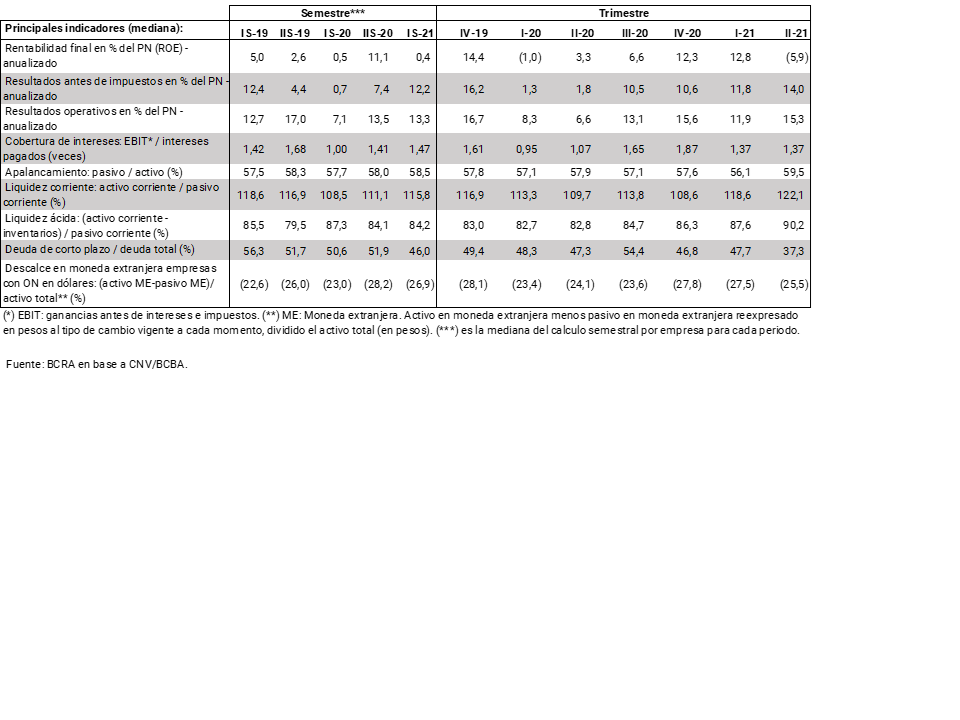
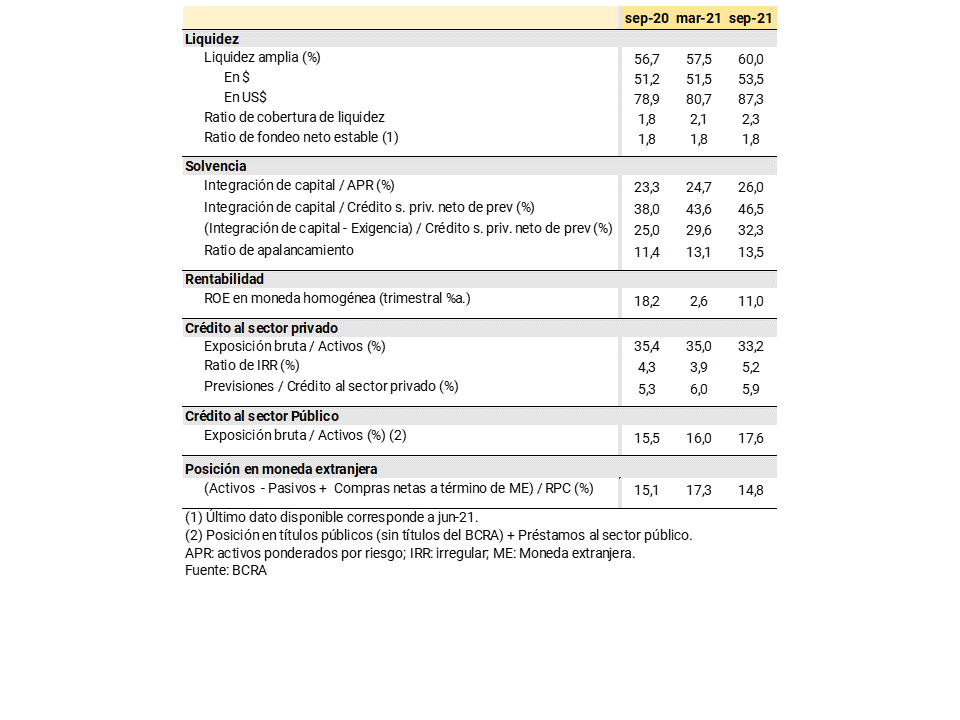
Table 1 | Main indicators of the soundness of the financial system
i. High levels of liquidity of the aggregate financial system. At the end of the third quarter of 2021, the liquidity in the broad sense10 of the financial system stood at 68.8% of deposits (65% in the segment in pesos and 86.3% in foreign currency). This level was slightly higher than the previous IEF record and the one observed in a year-on-year comparison, remaining above the average of the last 10 years (48.9%) and being relatively high when compared to the records of other financial systems in the region (see Chart 5). In terms of the composition of liquidity in pesos in the broad sense, in the last 6 months the relevance of the BCRA’s instruments increased, while the weighting of the current account balances that financial institutions maintain in this Institution was reduced.
Graph 5 | Liquidity and solvency of the region’s financial systems
Latest information available

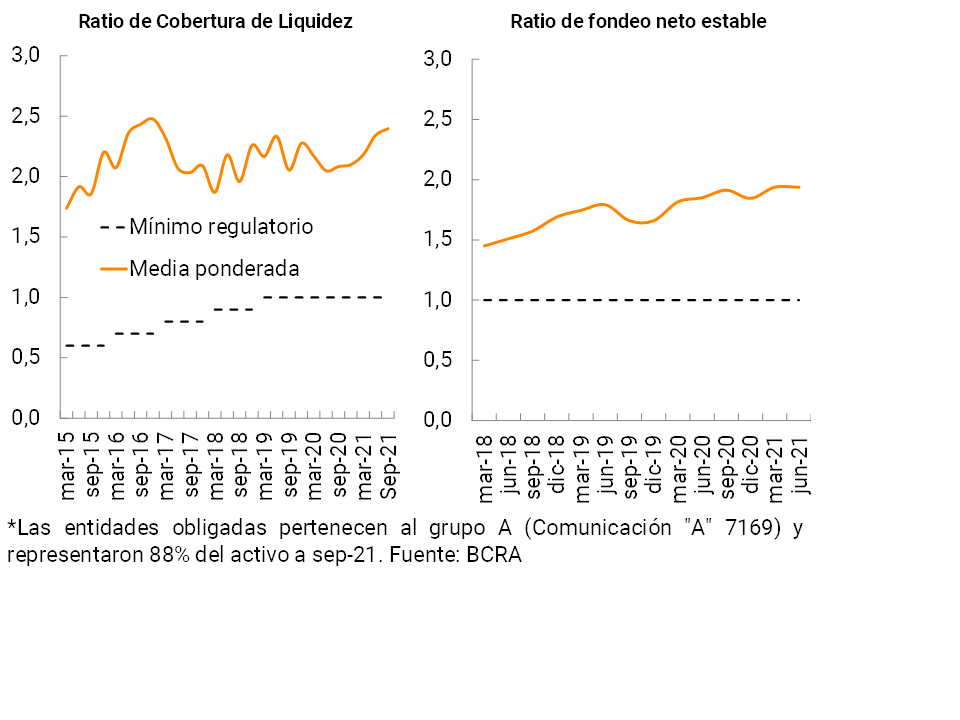
In addition, in relation to the internationally recommended standards in terms of liquidity, the set of local entities required to verify them (group A entities that represent 89% of the total deposits in the financial system) continued to comfortably exceed the minimum requirements. In particular, at the aggregate level, the Liquidity Coverage Ratio (LCR) and the Stable Net Funding Ratio (NSFR)11 reached 2.4 and 1.9 in September, respectively, remaining at levels similar to those verified at the time of publication of the previous edition of the IEF. These local levels of Basel liquidity ratios are comfortable when compared with those of other financial systems (see Chart 6).
Graph 6 |Basel ratios for liquidity and leverage
International comparison according to availability – Latest information
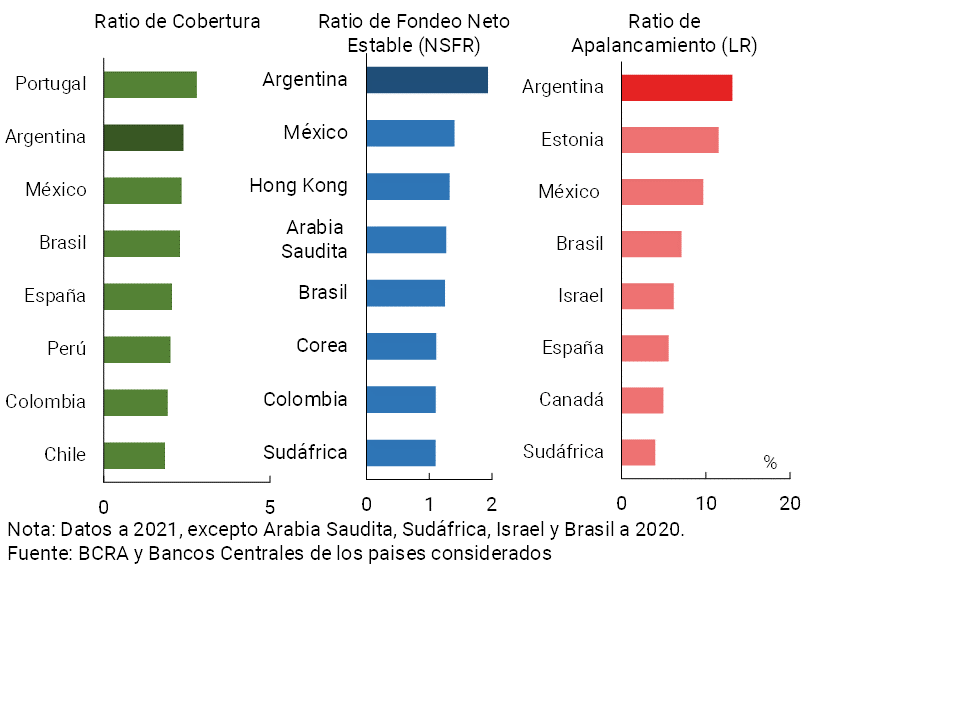
ii. High solvency indicators of all financial institutions. Both with respect to the previous IEF and in a year-on-year comparison, regulatory capital integration (PRC) in terms of risk-weighted assets (RWA) increased, totaling 26.2% for the aggregate financial system in September 2021, as a result of an increase in real terms in the PRC and a real decrease in RWAs. This indicator is high, when compared to the average of the last 5 years (18.8%) and with respect to the levels observed in the financial systems of other economies in the region (see Chart 5). At the local level, 93% of the PRC is explained by Tier 1 capital (mainly ordinary capital), which has the greatest capacity to absorb losses in the event of shocks. For its part, the financial system increased the excess regulatory capital (above the minimum required) in the last 6 months, as well as compared to September 2020, to reach a level equivalent to 222% of the regulatory requirement. In addition, the set of financial institutions maintained a high verification of the additional regulatory capital margins (capital conservation and by locally systemic banks).
It should be considered that the ratio between the excess capital of the entities as a whole (above the minimum required) and the credit to the private sector net of the forecasts, also expanded in the last 6 months and in a year-on-year comparison, to total 32.9% in September 2021. This indicator, whose current level is more than double the average of the last 15 years, synthesizes the degree of soundness of the financial system in the face of an eventual materialization of credit risk, by combining features such as the high capital position, moderate exposure to the private sector and high forecasting. With respect to this last point, the level of total forecasting of the sector continued to be high, in the order of 5.6% of credit to the private sector at the end of the third quarter, similar to the record of last March and September 2020. Accounting forecasts continued to exceed the balance of credit to the private sector in an irregular situation in September 2021, although this indicator was reduced compared to March of this year in the context of the effects of financial relief measures on the credit situation of debtors losing weight.
In addition to the minimum capital requirements, the banks as a whole also had a high level of leverage ratio (ratio between Tier 1 regulatory capital and a broad measure of exposures; as defined by the Basel Committee). This indicator totaled 13.2% in September, slightly increasing compared to the previous IEF and in a year-on-year comparison. As a result, the leverage ratio remained comfortably above the required minimum of 3% and exceeds that recorded in other financial systems (see Chart 6).
For its part, the financial system obtained positive comprehensive total results in homogeneous currency, although in decline from 2021 and with heterogeneous evolution among groups of entities.
The high solvency indicators of the aggregate financial system partly reflect the effect of the macroprudential regulations implemented by the BCRA, which include the suspension of the possibility of dividend distribution of entities in the context of the pandemic.
iii. Low weighting of assets and liabilities denominated in foreign currency and reduced currency mismatch in the balance sheet of the financial system. The financial system’s foreign currency assets were equivalent to 17.3% of total assets in September, decreasing both with respect to the past IEF and in a year-on-year comparison. Liabilities in foreign currency represented 15.7% of total funding (liabilities and equity), below the level observed last March and a year ago. Considering these assets and liabilities in foreign currency, as well as the forward purchases and sales of foreign currency classified off-balance sheet, the spread in this denomination represented only 10% of the PRC in September, without significant changes from the previous IEF and in a year-on-year comparison. The limited level of exposure of the financial system to the segment denominated in foreign currency is partly explained by the framework of the macroprudential measures in force.
iv. Moderate differential between assets and liabilities of the financial system with CER adjustment. It is estimated that in September the set of financial institutions registered a positive level, in the order of 59.5% of the PRC, in the differential between assets and liabilities with capital adjustment by CER or UVA. Both the assets and liabilities with CER adjustment, as well as their spread have increased slightly compared to the values recorded last March and in a year-on-year comparison. This differential is explained to a greater extent by the group of public financial institutions.
v. The exposure of the financial system to the public sector remains at limited levels. Although it increased slightly compared to the previous IEF and year-on-year, in September 2021 credit to the public sector represented 13.4% of the total assets of the financial system, remaining at moderate levels based on current macroprudential regulations. This level remained slightly below the average for other emerging economies12. The increase verified by this indicator occurred within the framework of the entry into force since mid-2021 of the regulation that allows financial institutions to integrate with national public securities in pesos – with certain characteristics13 – the portion of the minimum cash requirement that can be integrated with LELIQ14. It should be noted that in order to ensure that these securities have liquidity at all times, a specific mechanism was established by which the entities, if required, can sell to the BCRA the holdings they have purchased to integrate the reserve requirements. If public sector deposits are taken into account, the net position of the financial system vis-à-vis this sector (all levels) was slightly creditor in September (0.4% of the assets of all institutions).
Based on the strengths aspects mentioned so far, the financial system is expected to remain resilient in the event of an adverse scenario. In this sense, as part of the stability analysis, the main exogenous risk factors that the financial system could eventually face in the coming months are reported below:
i. Risk of a temporary slowdown in the economic recovery and/or greater volatility of local financial markets. . In recent months, the economy has shown signs of greater dynamism, with expectations that this trend will deepen hand in hand with the normalization of activities (with compliance with health protocols and vaccination schemes) and the implementation of new stimulus measures. For its part, the BCRA continues to make use of the tools available to promote local conditions of financial stability. However, the pandemic has not yet been overcome and there are still factors that generate uncertainty and can condition the economy. In addition, there could be situations of increased volatility in some segments of the local financial markets as in recent months (at the time linked to the legislative election process already completed). In this sense, the potential impact of factors such as expectations regarding an upcoming agreement with the IMF or the seasonal dynamics of the exchange market, among others, must be taken into account. These types of issues, depending on their nature, could affect both the environment in which financial intermediation takes place (demand and supply of credit, evolution of deposits) and the credit risk faced by banks.
ii. Risk of worsening of the external context in the transition to a new normal, in a context in which vulnerabilities persist worldwide. As mentioned for the local case, at the global level the pandemic continues to generate uncertainty, despite the significant progress verified. Although the risk is more contained, the problems linked to COVID-19 could intensify (impact of the new strain, intensity of the third wave of infections in the northern hemisphere, problems with vaccination processes), with negative effects on growth expectations and international trade. On the other hand, although the international financial markets have maintained a mostly favorable bias, the possibility of a materialization of new episodes of tensions of magnitude cannot be ruled out. In recent months, the probability of eventual corrections in the expected speed and intensity of monetary policy normalization in developed economies has grown. Given the existence of vulnerabilities at the global level (mentioned in the first section of this IEF), this could generate challenges to international financial stability in general and to emerging markets in particular. Depending on the type of shock that occurs – with a greater impact on the real channel or the financial channel – a worsening of the external context will have greater effects on economic activity (through impacts on the price of raw materials and the level of activity of Argentina’s trading partners) or on financial conditions, with particular emphasis on portfolio flows and currency markets (spillover effects). In the latter case, although local regulation of the foreign exchange market and the exchange rate management policy help to cushion the effects of tensions in international markets, there could be an effect on local interest rates as well as bank funding in general, with an impact on financial intermediation.
iii. Operational risks, in a context of greater dependence on technology.While the use of teleworking and digital channels for financial transactions gained widespread strength after the COVID-19 shock, its presence is expected to remain relevant in a post-pandemic world, generating exposure to operational risks in the financial system worldwide. In the case of Argentina, although there have been no disruptive events associated with this type of risk so far, efforts are maintained in terms of disclosure and prevention, especially with regard to fraud and cybersecurity attacks, which are in addition to the BCRA’s regulatory framework on the matter and the respective supervisory actions.
Other risk factors that may be mentioned include, for example, those linked to climate change. In this regard, a work agenda on sustainable finance is being generated both globally and locally (see Box 1). On the other hand, thinking about a post-pandemic scenario, it remains to be seen what structural changes end up materializing at the global level (such as changes in business models, technological innovations in the field of finance or regulatory modifications) with an impact on financial intermediation. For example, the growth in the use of cryptoassets (starting from relatively low levels at present) could become a source of potential risks, especially for relatively more vulnerable emerging economies, generating challenges for monetary and exchange rate policy.
Box 1. Progress in sustainable finance in Argentina.
In recent months, Argentina has continued to promote the approach to the financial challenges and risks caused by climate change (CC)15, an issue that has risen significantly both on the agenda of the different international organizations and in that of developed and emerging countries. In this framework, throughout 2020 the Technical Committee on Sustainable Finance (MTFS)16 was created as a permanent body to develop and strengthen sustainable finance in our country. The Ministry of Economy (coordinator), the BCRA, the National Securities Commission (CNV) and the National Insurance Superintendence (SSN), among other public sector entities, participate in the MTFS. Its objective is to begin to formulate a National Strategy for Sustainable Finance that contributes to achieving economic and social objectives within the framework of the United Nations Sustainable Development Goals (SDGs). This includes the consideration of climate change mitigation and adaptation goals in the country.
As a result of the coordination efforts carried out by the MTFS, in September of this year the “Joint Declaration of the Regulatory Entities of the Banking, Insurance and Capital Market Sector in Relation to the Development of Sustainable Finance in Argentina” was signed17. This declaration addressed, among other commitments: i) the promotion of the development of sustainable finance at the local level and the promotion of adequate incorporation, management, regulation and supervision of risks associated with environmental, social and governance (ESG) aspects; ii) the development of a joint agenda that allows the entities under supervision to develop, in the medium/long term, the necessary capacities to identify, manage and incorporate ESG criteria into their business strategies; and (iii) the assessment of potential risks to the stability of the financial system and the balance of payments linked to ESG factors.
The BCRA is beginning to address the issue from its own internal structure, participating in international forums and planning a cross-cutting work agenda for the entire Institution. The latter will include tasks and responsibilities, assuming that sustainable finance requires a multifocal approach. Among the initial objectives to be considered, it is worth mentioning that of preparing a statement of the financial system, in order to evaluate the degree of incorporation of financial risks linked to climate change as a variable in the business strategy of the entities. This would consolidate a process of awareness among all entities about the need to identify and, eventually, incorporate the aforementioned risks into their institutions and management policies. It should be noted that although the sustainable agenda has a long-term projection, it is necessary to advance in intermediate steps to carry out a process of analysis, evaluation and implementation in a comprehensive manner in the Argentine financial system.
The impetus and approach made by the different countries in terms of climate change and sustainable finance must present solid bases for coordination at the international level, thus tending to achieve a path of lower emissions of polluting gases worldwide. The challenge is to achieve this goal without generating adverse shocks to economic activity, especially in those countries that are currently developing.
In the next section, we will delve into the analysis of financial stability, considering the main sources of vulnerability identified for the local financial system, given the exposure in its balance sheet to the aforementioned risk factors. These sources of vulnerability will be contrasted with the strengths of the financial system, in order to assess the conditions in which it is to face the eventual materialization of the risk factors indicated above.
3. Sources of vulnerability and specific resilience factors of the financial system
3.1 Equity exposure to credit risk
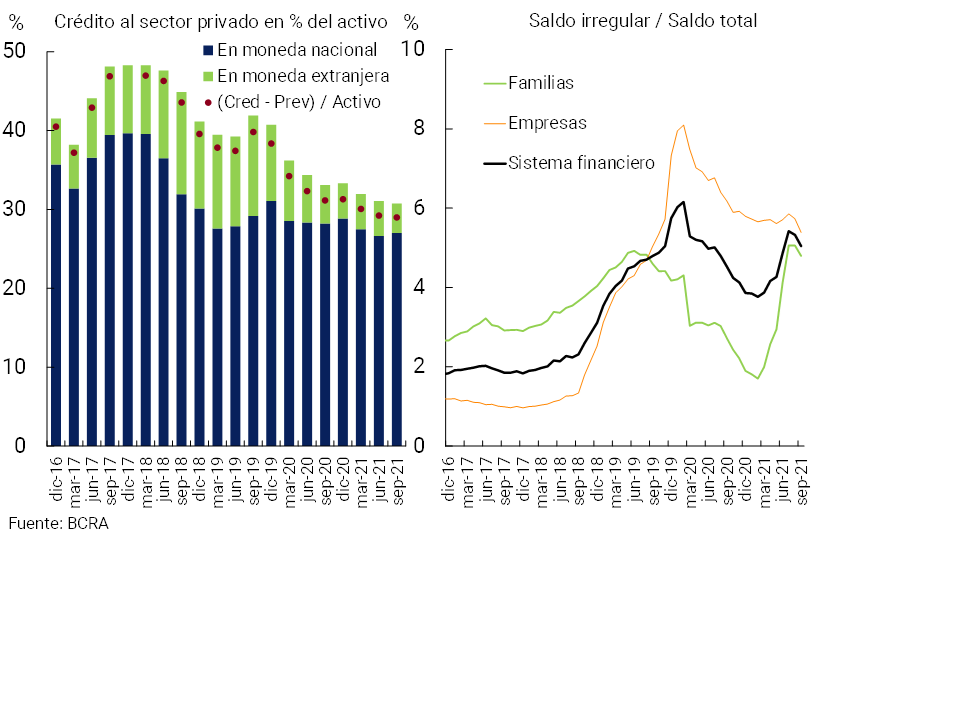
At the end of the third quarter of 2021, the financial system’s exposure to the private sector remained at moderate levels, reducing compared to the previous IEF and in a year-on-year comparison (see Chart 7). The balance of credit to the private sector stood at 30.8% of the total assets of all financial institutions, falling 1.2 p.p. compared to March 2021 and 2.3 p.p. y.o.y. (the average of the last 10 years of this indicator is 44%). Private sector financing net of total forecasts in terms of total assets also declined in the period, to 29%.
Figure 7 | Gross exposure of the financial system to the private sector and the ratio of irregularity of credit to the private sector
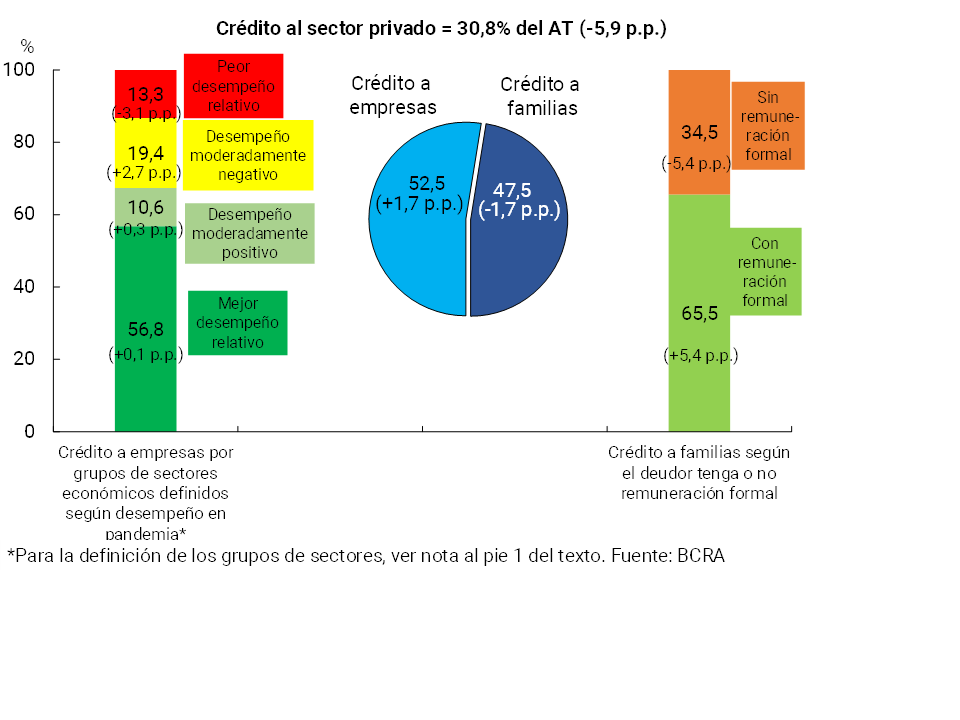
As of September 2021, the financial system’s exposure to the private sector was made up in similar parts (see Chart 8) of loans to companies (52.5% of the total) and loans to households (47.5%). Most of the exposure of the aggregate of entities to the corporate financing segment is explained by the grouping of sectors that had the best relative economic performance since the beginning of the pandemic (almost 57% of the total)18. In contrast, credit to all sectors with the worst relative economic performance since February 2020 currently accounts for a moderate portion of total financing to companies (13.3% of the total). For its part, according to the information available, it is estimated that almost two thirds of the financial system’s exposure to loans to households was made up of loans whose debtor had a dependent job (a ratio that would have increased slightly compared to the pre-pandemic situation).
Figure 8 | Composition of the financial system’s exposure to the private sector
Credit to the private sector as a percentage of total assets as of Sep-21 (vs. Feb-20)
In relation to the indicators of credit risk materialization, the ratio of financing to the private sector in an irregular situation (according to the regulatory classification of debtors) for the entities as a whole totaled 5% last September (see Graph 7). As expected, this indicator increased compared to March (+1.2 p.p.), as the effect of the measures specially designed in the context of the pandemic to alleviate the financial burden on the private sector was tempered. The gradual dismantling of such measures is part of the strategy of targeting policy actions carried out by the BCRA. The aim is to readjust the attention, especially towards the sectors that are still vulnerable and even more affected by the pandemicscenario 19. Notwithstanding the aforementioned increase in the irregularity ratio in the last 6 months, it should be noted that in August and September some reduction was observed, a performance reflected in both the segment of credit to households and companies.
The irregularity ratio of financing to households stood at 4.8% of this portfolio in September, 2.8 p.p. above the March 2021 figure (+2.1 p.p. y.o.y.), mainly due to the performance of personal loans. It should be considered that these levels are slightly higher (+0.5 p.p.) than those recorded prior to the beginning of the pandemic. Within the household credit segment, the irregularity ratio remained low dispersion by geographical area, with this indicator being slightly higher in Cuyo and the Central zone (see Graph 9). For its part, the non-performing ratio of loans to companies totaled 5.4% in the period, 0.3 p.p. below the March 2021 figure (-0.8 p.p. y.o.y.).
Figure 9 | Irregularity ratio of credit to the private sector
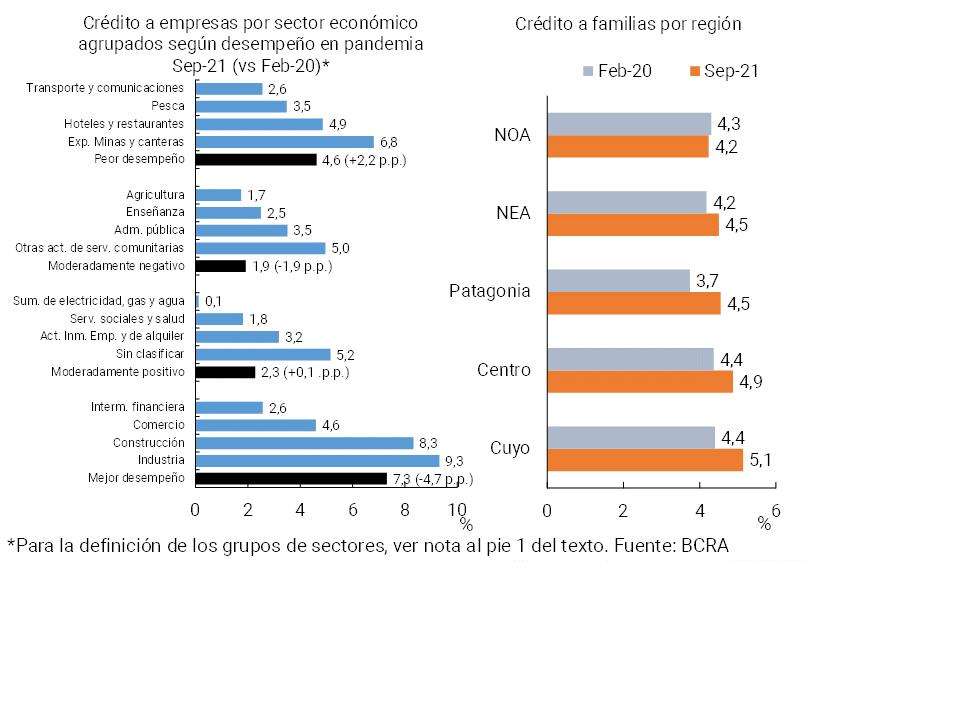
In the context of the regulatory changes implemented20, the current levels of the irregularity ratio for corporate lending are lower than those evidenced before the start of the pandemic (-2.7 p.p.). Taking into account credit to companies by grouping of economic sectors, the NPL ratio corresponding to the group that had the best relative economic performance since the beginning of the pandemic, although high, showed the most significant reduction (-4.7 p.p. since February 2020, to 7.3%, see Graph 9)21. On the other hand, financing to all sectors with the worst relative economic performance during the pandemic has seen an increasing irregularity ratio over the period (+2.2 p.p. since February 2020), although based on a below-average level of credit to companies.
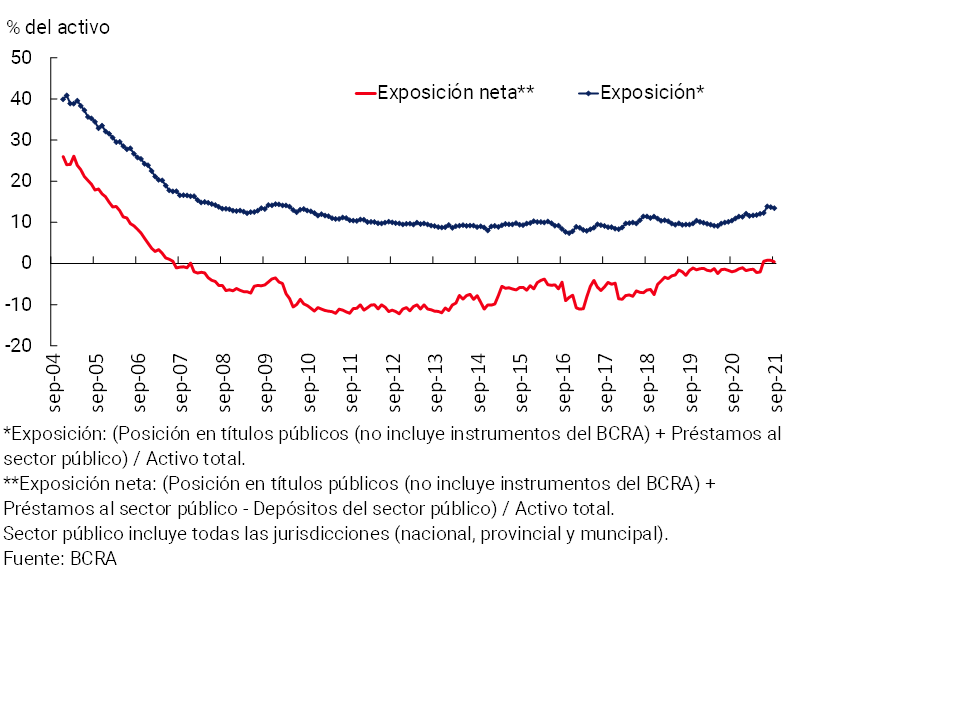
With regard to the exposure of the financial system to the public sector (all jurisdictions), from moderate levels there was an increase compared to the previous IEF and in a year-on-year comparison (see Chart 10). Financing to the public sector accounted for 13.4% of the total assets of the entities as a whole in September, 1.6 p.p. more than in March (+2.4 p.p. y.o.y.). This level is slightly lower than the average for a sample of emerging countries22. At the end of the third quarter, the net position of the financial system vis-à-vis the public sector – including the financing to this sector net of its deposits, from all jurisdictions – was slightly creditworthy, for the equivalent of 0.4% of the assets of the group of entities.
Figure 10 | Exposure of the financial system to the public sector
In the context of the changes that have been registered in the exposures assumed by the system—a slight reduction in exposure to the private sector and a slight increase in exposure to the public sector—in addition to the performance of irregularity—with a foreseeable increase after the targeting of financial relief measures and some expectation of new adjustments—, this source of vulnerability would remain relatively the most relevant for 2022 for the aggregate of financial institutions, while its evolution and potential impact will be conditioned to the eventual materialization of the risk factors set out in Section 2.
3.1.1 Resilience elements and mitigating measures:
The solvency of the aggregate financial system remained relatively high. First, it should be noted that as of last September, the total forecasts accounted for by the financial system represented 110.5% of the balance of credit to the private sector in an irregular situation. Although this ratio was lower than that recorded at the time of the publication of the previous IEF23, it remained at relatively high levels (the average for this indicator was 95.4% between September 2019 and February 2020 —prior to the beginning of the pandemic—). On the other hand, the excess regulatory capital (above the minimum required) in terms of credit to the private sector net of forecasts is well above the average of the last 10 years (see Chart 11). This is reflected both at the system level and across all groups of entities.
Figure 11 | Capital regulatory position (PRC-requirement) in terms of the balance of credit to the private sector net of forecasts

The financial relief measures taken by the BCRA in the context of the pandemic (which were gradually focused on the recomposition of economic activity and the evolution of the health situation still under monitoring) contributed to providing a framework of sustainability to the productive framework of the local economy, supporting both companies and families24. These measures sought to limit the possible deterioration of the financial situation of the private sector in the face of the initial shock, thus reducing possible adverse impacts on the solvency of the aggregate of local financial institutions. As mentioned, although in 2021 these measures focused on the sectors still affected by the pandemic scenario, a portion of the debtors who received these benefits in 2020 still have part of them, contributing positively to their financial situation.
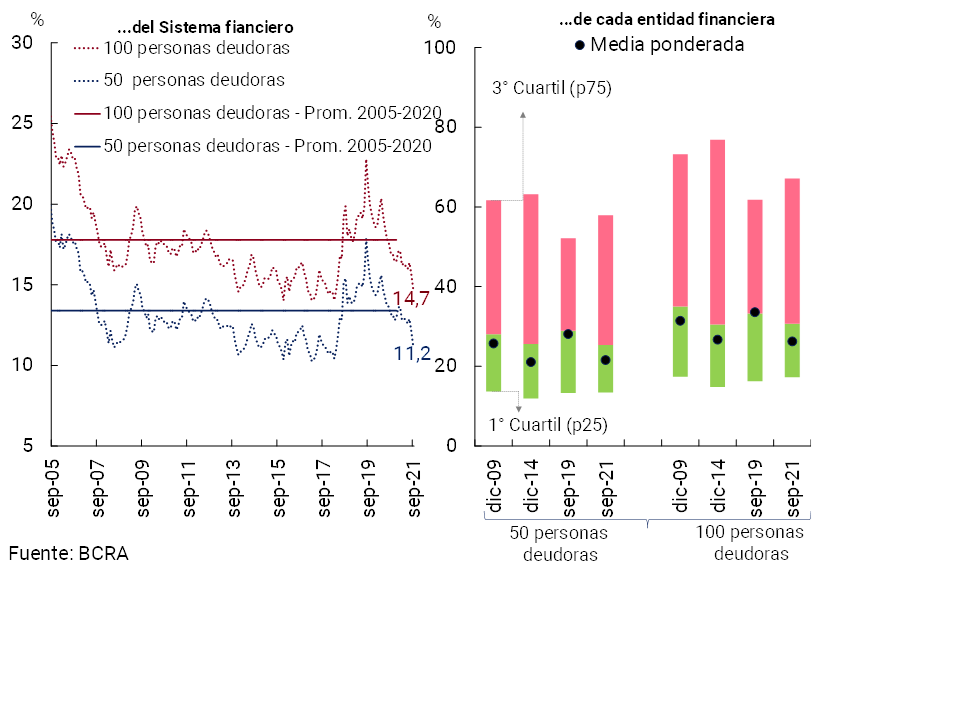
The degree of concentration of bank credit among debtors is moderate, showing a new decrease during 2021.The top 100 and 50 debtors accounted for 14.7% and 11.2% of credit to the private sector, respectively (see Chart 12), remaining in an environment of low records compared to the average of the last 15 years. The declining performance of these indicators in the last year occurred in the context of the programs promoted by the BCRA in conjunction with the PEN, such as the “Financing Line for Productive Investment of MSMEs” (LFIP), the “Zero Rate 2021” line and the “Ahora 12” program (see Boxes 3 and 4) which, as they are intended for MSMEs and families, they generally generate loans located in the relatively smaller sections.
Figure 12 | Participation in credit to the private sector of the main debtors…
In recent years, there have been no major changes in credit origination standards. According to the Credit Conditions Survey (ECC)25 corresponding to the third quarter of the year, the credit standards associated with households did not present significant changes with respect to the previous waves; this situation covers almost all lines. In the case of business loan origination standards, although there was a small relaxation in the last wave of the CCP, in recent years there have been no major modifications in them.
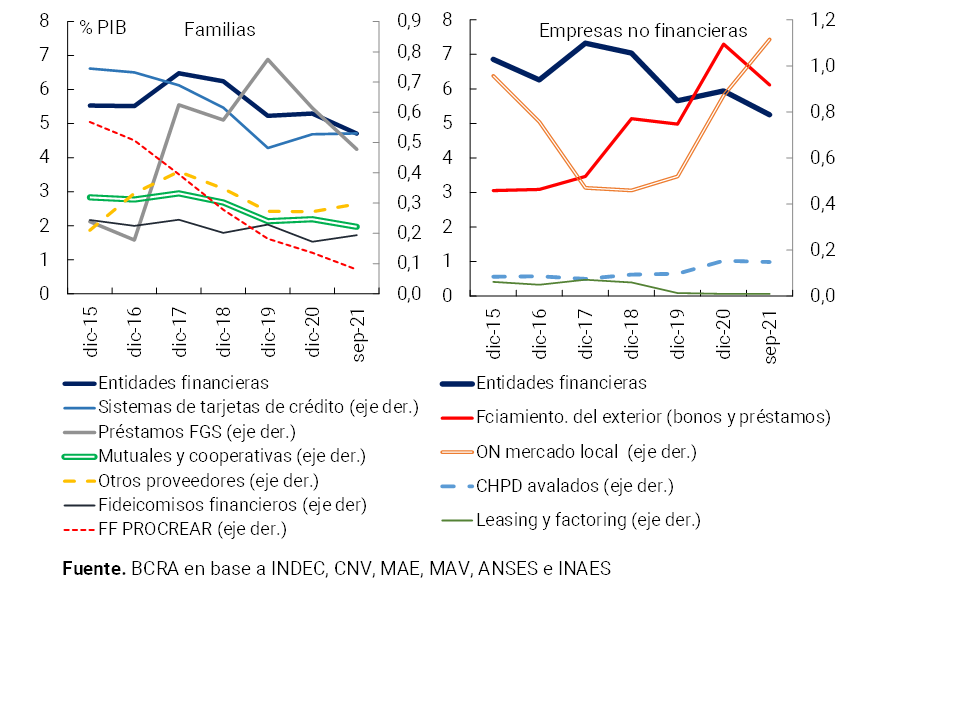
The levels of indebtedness of households and companies remain at minimum levels in a historical and international comparison. As of September 2021, the estimated balance of private debt in the broad sense26 represented 6.5% of GDP for households and 12.6% for the corporate sector27, decreasing compared to the end of 2020 (it represented 7.3% of GDP for households and 14.3% for companies)28. The fall in these ratios is due to the combined effect of a decrease in real terms in financing balances, with an increase in real GDP. In terms of credit to the household sector, both bank loans (the main component) and loans from the FGS and those from mutuals and cooperativesfell in real terms 29 (see Graph 13). This is only marginally offset by increases in real terms in the balances of non-bank credit card schemes, credit granted by other providers registered with the BCRA (which are neither cards nor mutuals nor cooperatives30) and financial trusts. In the corporate segment, the decrease in real terms of balances was more widespread. This occurred both for the two main components, bank loans and financingfrom abroad 31, and for the capital market instrument most used by SMEs, deferred payment checks. However, there was a real increase in the balances of local non-financial private sector non-financial bonds, due to the combined effect of net placements (see Section 2) and, to a lesser extent, the re-expression of balances in pesos32. In general, it is noteworthy that the financial ratios of companies with public offerings tended to improve, with the proportion of companies in a relatively more vulnerable situation decreasing (see Box 2).
Figure 13 | Financing in the broad sense to families and companies
In % of GDP
Households and businesses have a moderate burden servicing their bank debt It is estimated that at the end of the third quarter of the year the debt burden of households33 and companies continued at limited levels in aggregate terms, partly reflecting the effect of credit stimulus policies under favorable financial conditions for debtors.
Low and decreasing relative importance of credit to the private sector in foreign currency, with limited currency mismatch of debtors (effects of macroprudential regulation).The balance of financing to the private sector in foreign currency represented only 12.2% of the total credit balance to this sector at the end of the third quarter, falling compared to the March figure and in a year-on-year comparison. It should be noted that, in line with current macroprudential regulations, this financing in foreign currency is channeled to debtors with income in foreign currency, or income positively correlated with the exchange rate – mainly belonging to an activity related to foreign trade. This limits the eventual materialization of credit risk derived from fluctuations in the exchange rate.
Box 2. Financial situation of publicly offered companies
Companies with a public offering, a set used as a first approximation of the situation of the corporate sector34, show in the first half of 2021 balance sheets with certain improvements. This trend is verified for several of the main financial indicators. The recovery compared to the same period in 2020 (impact of the COVID-19 shock35) stands out, with a relatively slight improvement in the margin.
So far in 2021, there has been a year-on-year increase in operating results and pre-tax results (in terms of the median; see Table R.2.1)36. In terms of ability to pay, these behaviors led to a sustained improvement in the interest-to-income coverage ratio. The recomposition of liquidity also continued. In relation to the degree of leverage, although in recent semesters there was a slight upward trend (with heterogeneity between sectors37), there was a lower relative weight of short-term liabilities. The currency mismatch was reduced (in absolute terms) compared to the previous semester, although it remained above what was observed a year ago. In 2021 there were no specific cases of companies having problems paying for services or capital of negotiable obligations (NEs), unlike what was observed in 202038
Table R.2.1 Companies with a public offering – Evolution of main indicators
The evolution of corporate sector indicators was reflected in a decrease in the number of companies39 here considered to be in a relatively more vulnerable situation. At the end of the first half of 2021, the estimated number of companies in this situation amounted to 15 companies (12% of the total sample), below the recent high of 19 (15%, end of 2020) and only slightly above the values observed two years ago (12 companies -10%-, in mid-2019). The financial debtsof 40 of these companies represented only 10% of the aggregate financial debt of the total number of non-financial companies with a public offering, decreasing with respect to the weighting at the end of 2020 (20%), and returning to 2019 values (pre-COVID). These companies imply a very limited credit exposure for the aggregate financial system (less than 1% of total bank loans to the corporate sector), while their bonds represent 16% of the total outstanding balanceof bonds 41
Implementation of a mechanism to provide liquidity to certain public sector instruments that financial institutions can use to integrate minimum cash requirements Part of the increase in the financial system’s exposure to the public sector occurred in the context of changes to the Minimum Cash standard at the beginning of the year42. In this context, and with the aim of ensuring that such public securities are sufficiently liquid, a mechanism was established so that entities can automatically sell them to the BCRA43
3.2 Financial System Funding and Liquidity Performance
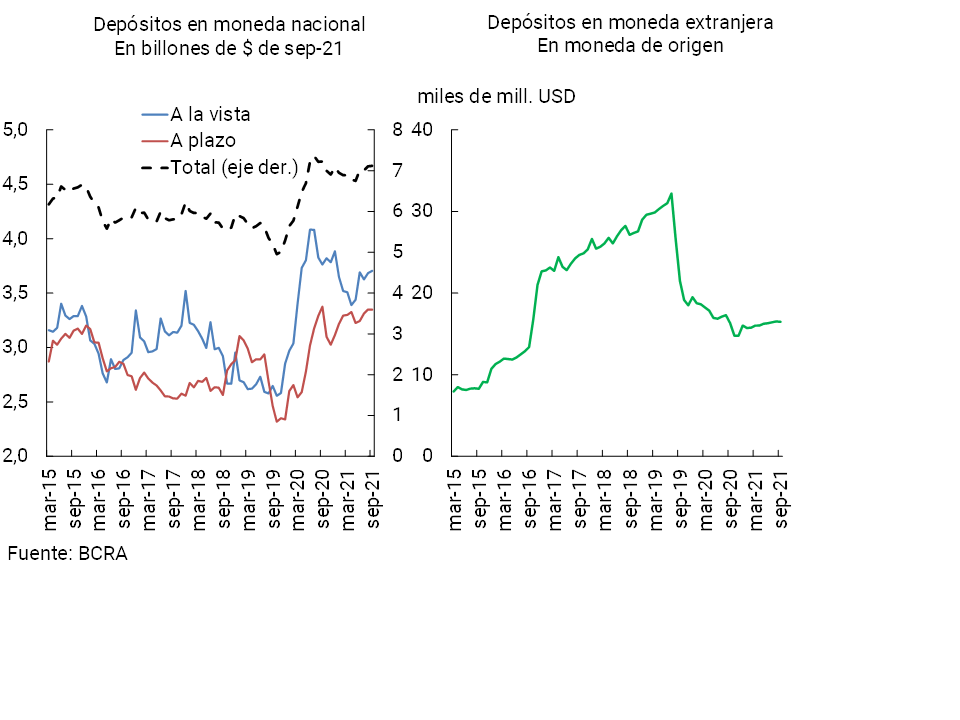
Reflecting the effect of the improvement in economic activity, private sector deposits in local currency accumulated two consecutive quarters of growth, increasing 3.4% in real terms between March and September 2021 (see Chart 14). In this way, the performance of late 2020 and early 2021 is reversed to some extent. Within this segment of deposits, in the last 6 months demand accounts increased by 5.6% in real terms and time deposits by 1.5% in real terms. The dynamism of UVA-denominated time deposits was highlighted, especially in the first part of the year – although they still have a relatively low weighting. In addition, unlike what has been observed in the latest IEF publications, private sector deposits in foreign currency grew in the last six months (2.9% in foreign currency).
Figure 14 | Private sector deposit balance
Financial system
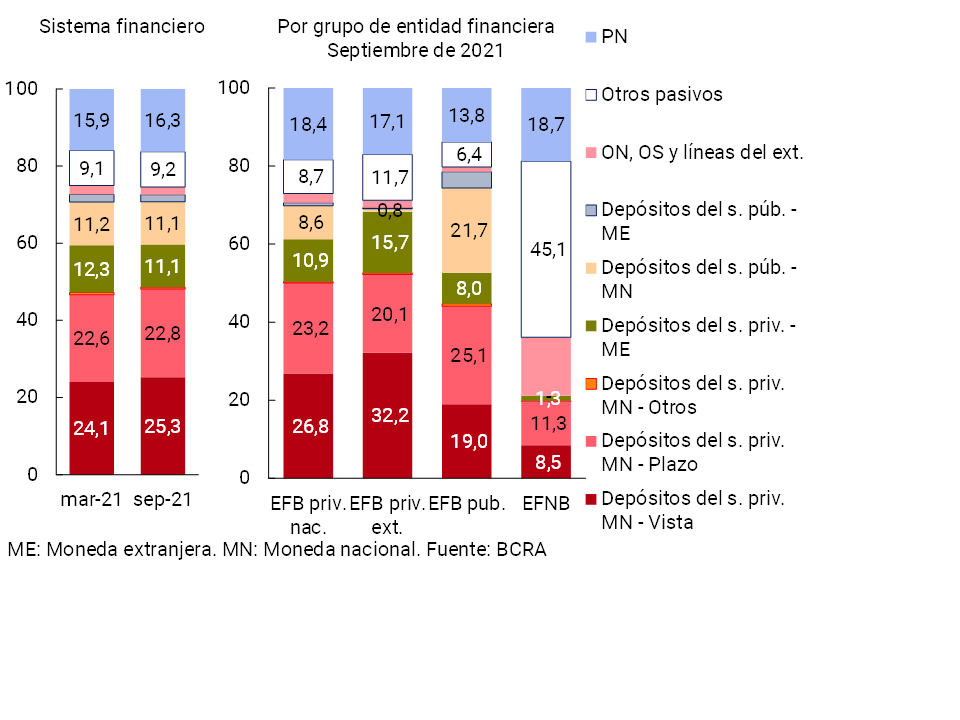
Deposits denominated in pesos in the private sector (given the behavior of demand loans), the main component of liabilities, slightly increased their participation in the total funding of the financial system at the aggregate level between March and September 2021 (+1.3 p.p. to 48.6%; see Chart 15). On the other hand, when considering the total funding of the group of entities according to currency of origin, it was observed that those arranged in national currency without CER adjustment were the ones that increased their relative weight in the total the most compared to the last IEF, while liabilities in foreign currency reduced their weighting in that period.
Figure 15 |Total Funding Composition
As % of total funding
Given the intrinsic nature of the banking business, possible changes in the levels and composition of funding sources may have an impact on the financial system’s position in the face of liquidity risk, and consequently on the behavior and conditions of the credit supply. It is therefore useful to additionally monitor other relevant characteristics of funding such as the average maturity of liabilities, the ratio between demand and time deposits, the level of concentration of deposits and the type or profile of depositors (for example, if they are associated with wholesale or retail sectors).
Considering the type or profile of depositors, in recent years there has been an increase in the participation of those legal entities holding relatively larger deposits belonging to the financial services provider sector (such as mutual funds (such as mutual funds (representing 18.8% of the private sector’s deposits in national currency). see Chart 16), a segment that tends to potentially have higher relative volatility compared to the retail segment44. In line with this evolution, it is estimated that in the first half of 2021 the weighting of the main depositors in the total deposits of each entity increased—an indicator to approximate the degree of concentration—(see Chart 17). These indicators suggest that a certain degree of exposure of all institutions to possible changes in the behavior patterns of depositors is maintained, a situation that the BCRA evaluates and monitors periodically.
Figure 16 | Private sector deposits in national
currency
Share % by type of depositor – Financial system
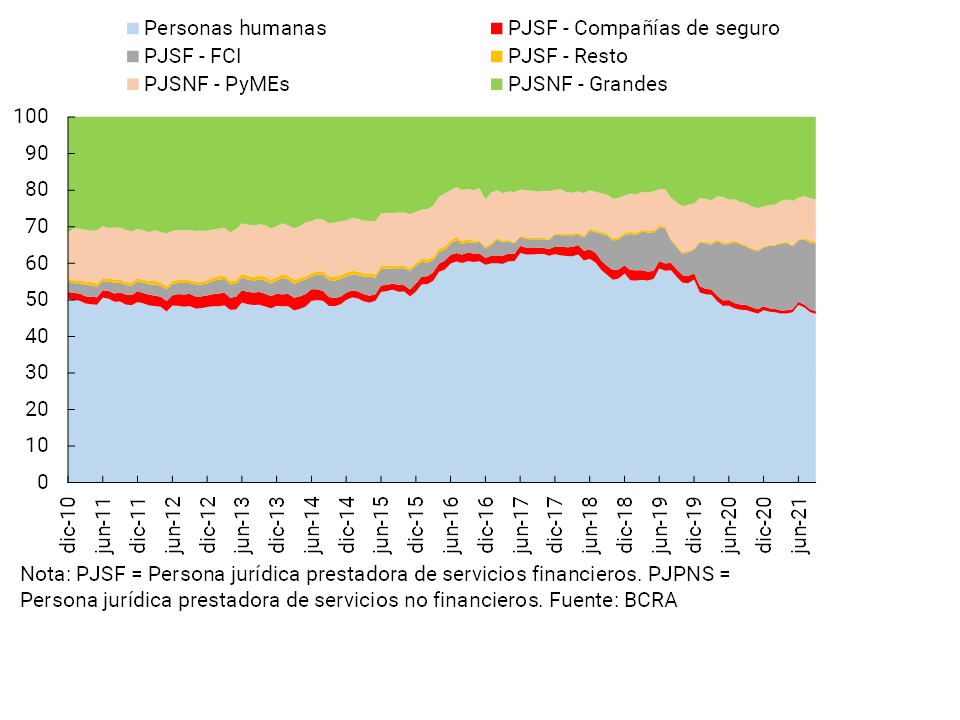
Figure 17 | Indicators of financial system exposure to liquidity risk
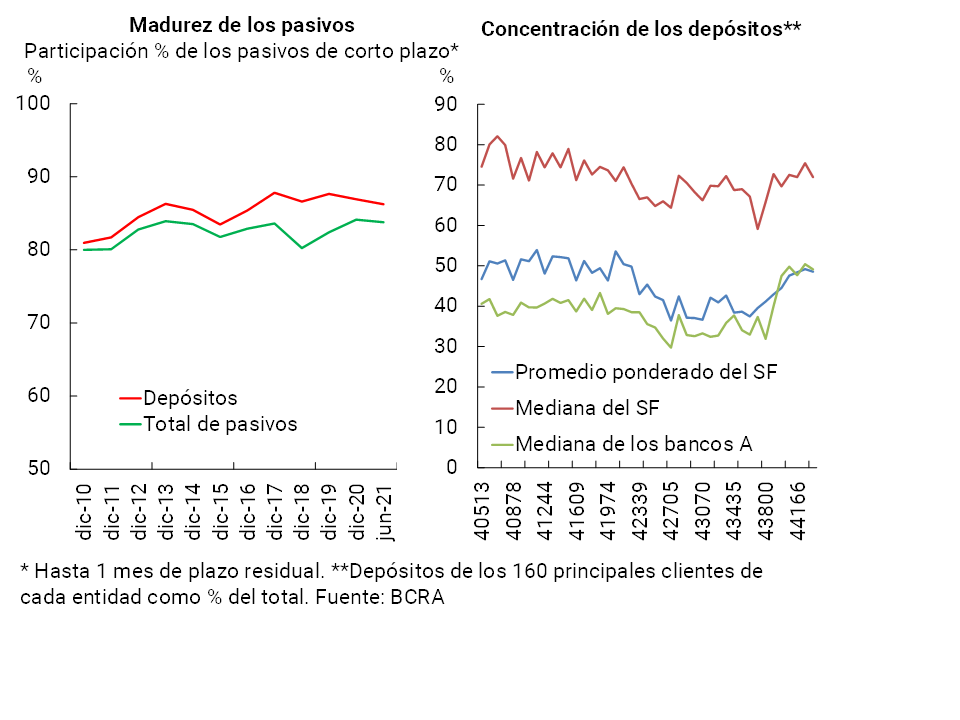
On the other hand, the indicators used to assess changes in the relative maturity of the aggregate financial system did not show any relevant changes with respect to the last IEF. In particular, the share of short-term liabilities (up to one month of residual term) in total funding remained relatively stable in recent semesters (see Chart 17), totaling 84% in June (latest available information), only 3 p.p. more than the average of the last 10 years45. The ratio of demand and time deposits (private sector, in local currency) amounted to 1.11 at the end of the third quarter, slightly higher than in the previous IEF, although below the average of the last 10 years.
In summary, the recent behavior of deposits has been relatively positive, while limited/moderate changes have been observed in terms of greater exposure to liquidity risk faced by the financial system. In this context, it should be considered that both the level and the composition of the different sources of funding of the group of entities could be altered in the event of the materialization of some of the risk factors set out in Section 2.
3.2.1 Specific elements of resilience
Ample liquidity margins in the aggregate financial system Broad liquidity totaled 68.8% of deposits at the end of the third quarter. Compared to the past IEF, the liquidity ratio increased both for items in pesos (+3.5 p.p. to 65%) and in foreign currency (+1.7 p.p. to 86.3%). The current levels are high from a historical perspective, for example, when compared to the average of the last 10 years, the liquidity indicator was 19.8 p.p. higher. The performance of liquidity occurs in a context in which since the middle of this year the possibility of integrating part of the reserve requirements (those already integrated with LELIQ) with certain public securities was enabled. In order to ensure that the securities used to integrate reserve requirements are liquid at all times, a specific mechanism was established by which institutions, if required, can sell these holdings to the BCRA46.
For their part, the set of obligated local entities (Group “A”) continued to exhibit liquidity ratios well above the minimums recommended by the Basel Committee and required locally (see Chart 18). In particular, the liquidity coverage ratio (LCR) stood at an aggregate level of 2.4 in September, in line with the last IEF and 0.3 above in a year-on-year comparison47. The BCRA’s monetary regulation instruments were the high-quality liquid assets (LCR numerator) that increased the most so far this year, while unsecured wholesale funding – already weighted by its risk factor – was the potential source of cash outflow that grew the most in the period (the most relevant component of the LCR denominator). For its part, the stable net funding ratio (NSFR) verified by all obligated entities totaled 1.9 as of June (latest available information), with no relevant changes in the last48 quarters. The availability of stable resources (numerator of the NSFR) came mainly from deposits and regulatory capital (concepts estimated to be the most dynamic in the period), funds mostly destined to the granting of loans to the private sector (the main concept of the denominator of the NSFR in terms of relative weight and estimated dynamism).
Figure 18 | Basel liquidity ratios
Group A of financial institutions
The funding of the financial system through markets remains limited, with manageable amounts of maturities to be repaid or refinanced in the coming months. The capital market continues to represent a marginal contribution to the funding structure of the financial system in aggregate terms (as of September 2021, out of a total of 79 financial institutions, only 20 have outstanding bonds), although for some specific entities the weighting may be relevant. In fact, at the end of the third quarter of the year, negotiable obligations (NBs) represented 0.6% of the total funding of the aggregate financial system, while, if only the group of entities that actually have outstanding bonds are considered, they account for 1.3% of their total funding. 30% of the total outstanding balance of NOTES issued by the financial system matures during the first half of 202249, with maturities mostly in50 pesos. Since the publication of the last IEF (July-November period), 7 financial institutions placed bonds in the local market for a total of $15,200 million (at constant November pesos), with a decrease of 26% in real terms compared to the same period in 2020 (see Graph 19). 86% of the amount placed was in nominal pesos (with a weighted average term of 17 months) and the rest in UVA (with a 48-month term) and dollar-linked (18-month term). As in the last semester, in the second half of 2021 there were several ON buyback operations by financial institutions.
Figure 19 | Placement of ON from the financial system and characteristics of the ON balance

3.3 Moderate performance of financial intermediation activity
In a context in which economic activity has once again shown signs of recovery since mid-2021, the process of intermediation of the financial system showed a slight increase in recent months, although it continued at moderate levels. In particular, in the third quarter of the year, the balance of credit in pesos to the private sector increased in real terms, after two quarters of decline. The real balance of private sector deposits in local currency also showed growth in the third quarter. Despite this performance, in year-on-year terms the real balances of loans and deposits of the private sector in national currency were reduced. On the side of the segment in foreign currency, the balance of credit to the private sector decreased slightly since the last publication of the IEF, while deposits in this sector increased (variations in currency of origin).
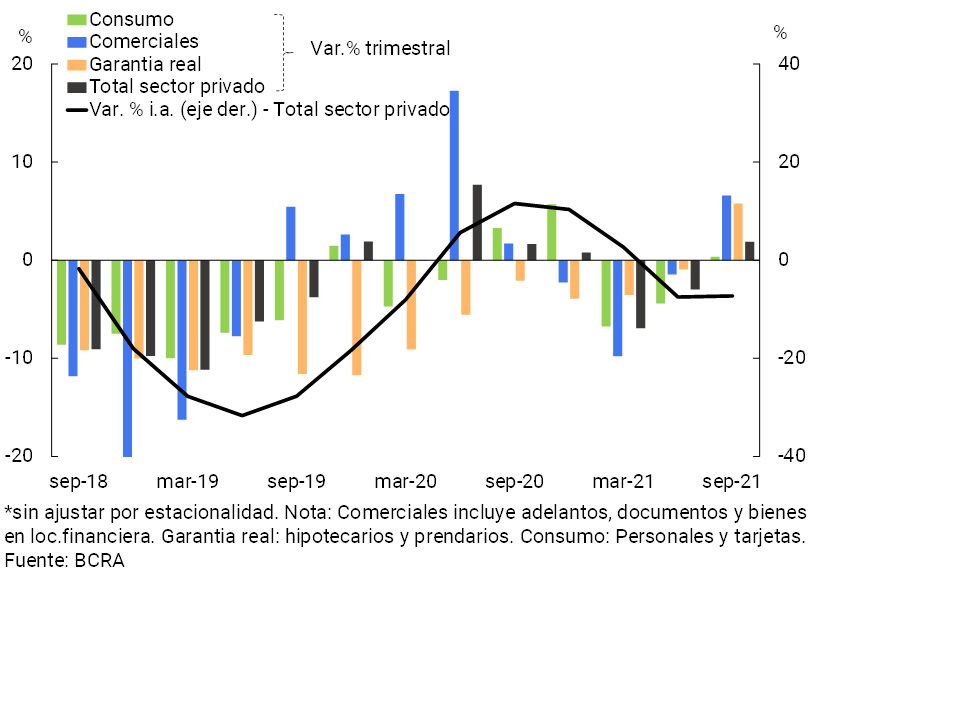
The balance of credit to the private sector in pesos increased by 1.9% in real terms in the third quarter of the year (see Chart 20), although it was below the level verified last March (at the time of the publication of the last IEF). The performance in the margin was mainly driven by commercial lines and, to a lesser extent, by loans with real collateral (mainly pledges) and by those intended for household consumption. Part of this growth was explained by the various assistance programs implemented by the BCRA in conjunction with the PEN, aimed at the sectors most affected by the effects of the pandemic (See Boxes 3 and 4). In a year-on-year comparison, the balance of financing in national currency to the private sector accumulated a 7.3% real fall in September.
Figure 20 | Change in the balance of credit in pesos to the private sector
In real terms*
Box 3. Scope of the Financing Line for Productive Investment (LFIP) for MSMEs —Quota 2021—
The Financing Line for Productive Investment of MSMEs51 (LFIP) was consolidated in 2021 as the main credit stimulus tool promoted by the BCRA, providing more flexible financial conditions to debtors. The LFIP for the period 2021/2022 maintains financial terms and conditions similar to the two previous quotas52. In this new edition: i. eligible financing was expanded, favoring LFIP access to key sectors for the economy such as MSMEs producing meat and/or milk; ii. the possibility of financing MSMEs and non-MSMEs producing chicken and/or pork was maintained; and iii. benefits were incorporated into the sectors of gastronomy, hospitality, cultural and leisure services, which are given the possibility of accessing the working capital line with a grace period of 6 months before the first payment.
It is estimated that as of September 2021, the balance of financing channeled through the LFIP represented 11% of the balance of credit in pesos to the private sector (18% of total credit to companies)53. The total bank debt of the group of companies that took the LIFP is equivalent to 30% of the credit balance of the financial system.
In terms of the importance of the LFIP for the productive framework, several dimensions can be considered (see Figure R.3.1). On the side of the LFIP’s geographical scope, this program had a positive impact on all the provinces of the country. It is estimated that 26.3% of the balance as of September corresponding to the 2021 quota was channeled to companies with tax domicile in the province of Buenos Aires, 21.3% in CABA, 14% in Córdoba and 10.3% in Santa Fe (the total credit balance channeled by the financial system to these provinces represented 29.8%, 26.8%, 10.6% and 8.6%, respectively). Considering the different branches of activity, it can be seen that 33.8% of the balance of the LFIP would have been allocated to industry, followed by commerce and agriculture (with 25% and 17.7% respectively). In addition, it is estimated that the companies that participated in the program formally employ more than 1.4 million employees (approximately 12% of the registered workers in the country54).
Figure R.3.1 |Financing Line for Productive Investment (LFIP) for MSMEs
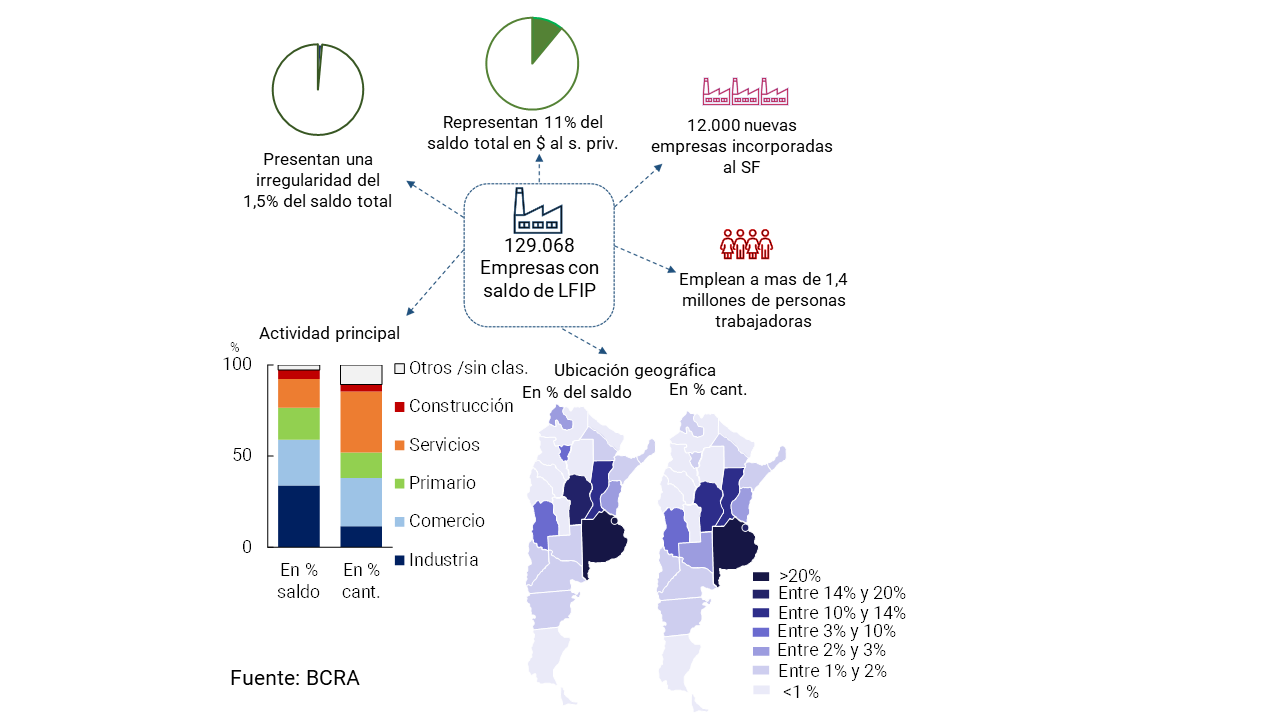
Through the LFIP, the expansion of credit (mainly to MSMEs) was promoted through two channels: i) increasing resources to companies that already had bank credit (about 70% of the companies identified as borrowers of some LFIP loan would have participated in the MSME Line at a nominal annual rate of 24% launched at the end of the first quarter of 2020 in the face of the COVID-19 shock)55) and, ii) facilitating access to companies that did not have bank financing. In particular, it is estimated that around 12 thousand companies that were not incorporated as debtors in the financial system as of February 2020, managed to be included through the LFIP (representing more than 9% of the total number of companies that have LFIP financing in force in the 2021 quota and it is estimated that they account for 3.4% of the balance of the same).
With regard to the indicators of credit risk materialization, it should be noted that the total financing in the financial system56 of the companies that accessed the LFIP presented a relatively lower level of irregularity than that recorded for the aggregate of the financial system: 1.5% and 5%, respectively. Considering the companies that accessed the LFIP by economic sector, it is observed that construction firms have the highest value for the irregularity ratio, while commerce registers the lowest of this indicator.
Loans in foreign currency to the private sector – in foreign currency – showed a heterogeneous behavior since the last publication of the IEF: an increase in the second quarter of the year and a decrease in the third, thus accumulating a fall of 5.3% in real terms compared to March and 12.9% in real terms in year-on-year terms.
Box 4. Recent measures by the BCRA to promote financing to the private sector
Throughout the second part of 2021, the BCRA’s credit policy continued to focus on assistance to the economic sectors most affected by the pandemic scenario. The measures promoted in the period, which took into account the liquidity and soundness conditions of financial institutions at the individual level and for the aggregate as a whole, had as their main objective to promote a balanced and sustained economic recovery throughout the country.
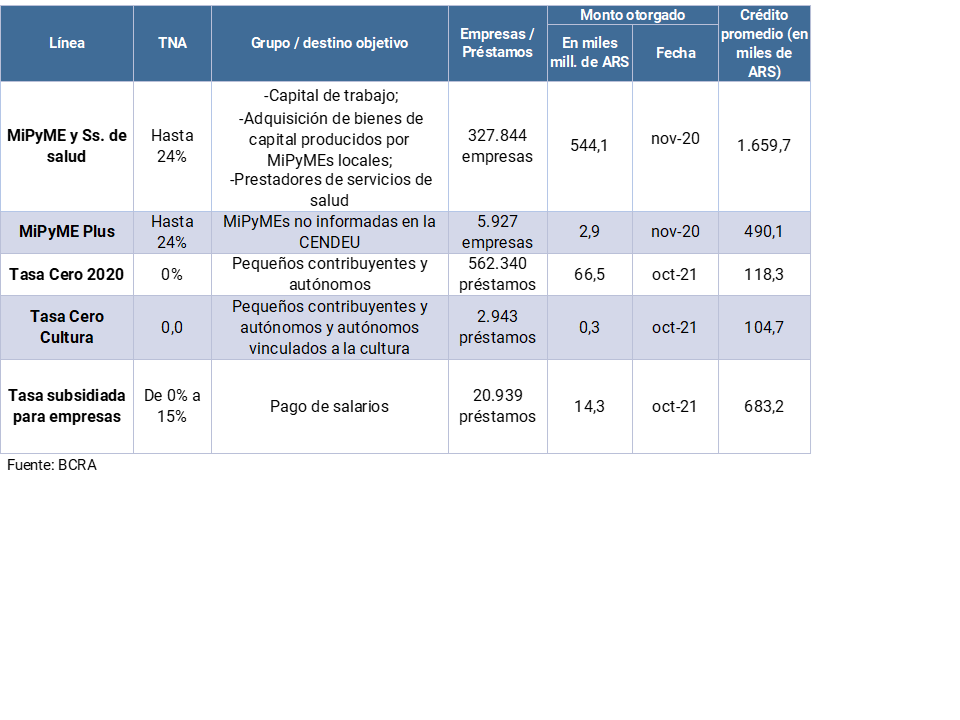
At the end of September, the BCRA extended the “Financing Line for Productive Investment in MSMEs” (LFIP) for the 2021/2022 period, maintaining similar financial terms and conditions to those provided for the two previous quotas57. In addition, in recent months, a set of measures were adopted in order to boost bank financing to households. With the aim of continuing to provide assistance to single-tax and self-employed workers, in August the BCRA together with the PEN implemented the program called “Zero Rate Credit 2021” (see Table R.4.1). It consists of obtaining a credit of up to $150,000 at an interest rate of 0%, and has a grace period of 6 months from the accreditation to begin to make its repayment in at least 12 equal and consecutive installments. In line with the provisions of the 2020 “Zero-Rate Loans”, in order to partially compensate financial institutions for the cost of the funds allocated to these operations, the BCRA provided that they may reduce the minimum cash requirement in pesos by an amount equivalent to 60% of the sum of the loans agreed58. Through this new edition, about $15,900 million have been granted until mid-October, including some 135,000 loans (to which approximately $66,500 million from the previous edition are added).
Table R.4.1 |Main financial programs in force in 2021
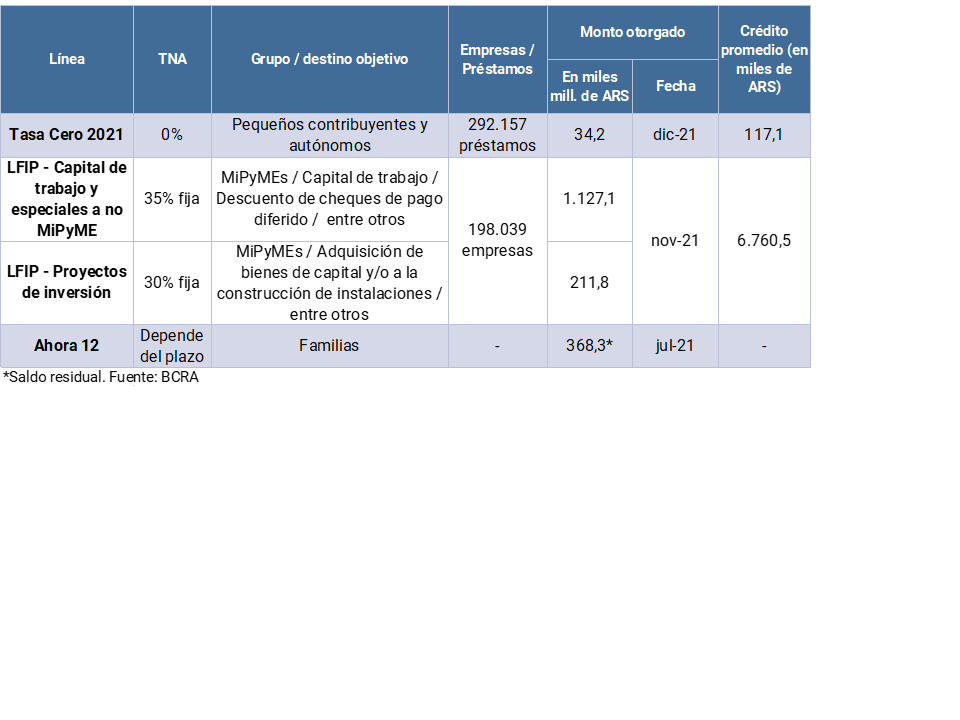
In August, the National Government extended the “Ahora 12” program until the end of January 202259, including the possibility of buying in 24 and 30 fixed monthly installments by credit card. In order to promote an increase in the supply of credit under this program, as of September the BCRA increased by 2 p.p. (up to 8% of the items in pesos subject to requirement) the ceiling for the reduction of the minimum cash requirement based on the granting of financing through this Program60. It is estimated that there would be a balance of more than $368,000 million as of July 2021 through this instrument. These initiatives taken in 2021 complement those taken in 2020 in response to the first effects of the shock (Table R.4.2).
Table R.4.2 |Other programs launched during the pandemic
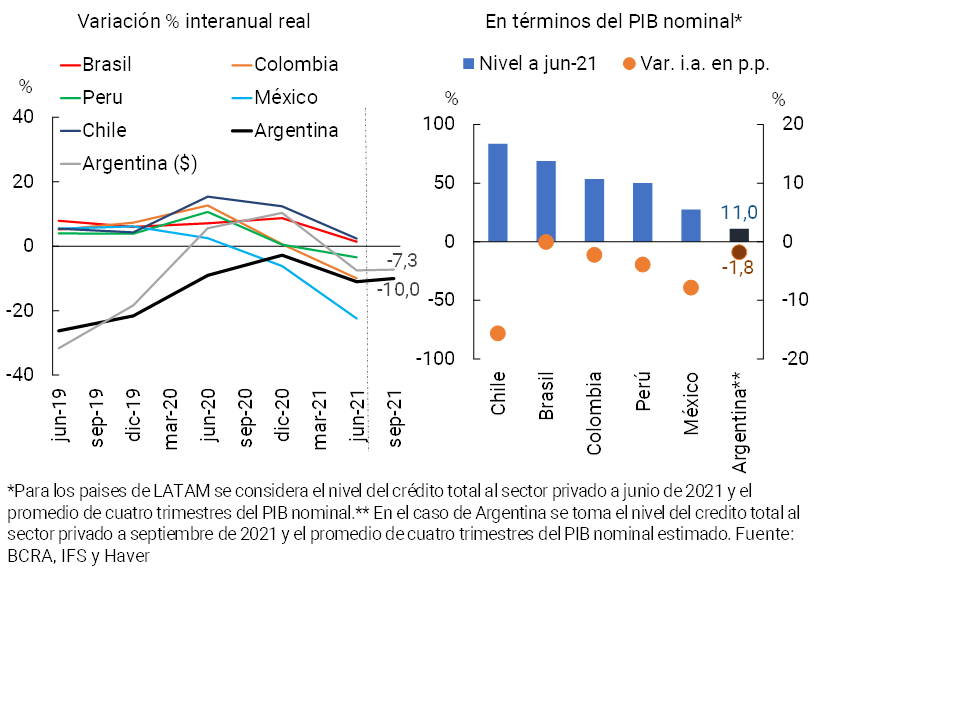
It should be considered that, within the framework of the recovery of economic activity both locally and regionally, and of a certain moderation and focus of the policies applied to address the imbalances generated by the context of the pandemic, in the first part of 2021 year-on-year falls in credit in real terms were observed in most Latin American countries (see Chart 21). This performance, coupled with the improvement in nominal gross product, led to a reduction in the ratio of bank credit in terms of GDP in almost all Latin American economies. In particular, in Argentina, this indicator is estimated to be around 11% in September (-1.8 p.p. compared to the level of a year ago), below the level recorded in other countries in the region, thus reflecting the low depth of credit in the local economy.
Figure 21 | Bank Credit Balance to the Private Sector – International Comparison
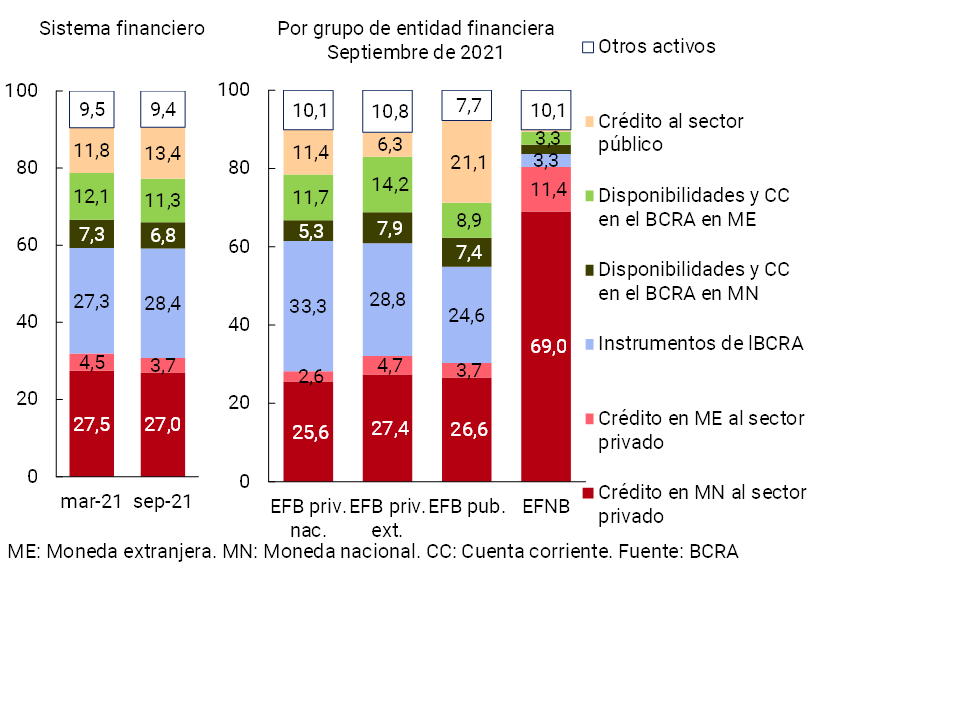
In this context, the total assets of the aggregate financial system increased slightly in real terms between March and September (see Chart 22). In relation to its composition, in the last six months the relevance of credit to the public sector increased to a certain extent. Meanwhile, total financing to the private sector (in domestic and foreign currency) slightly reduced its share of total assets in the period, as did liquidity in the broad sense61. Considering the composition of total assets by currency, from low levels in the last six months, the items adjusted by CER (including those denominated in UVA) increased their relative weight62.
Figure 22 | Composition of total assets
As a % of total assets
Over the next few months, it is expected that the process of gradual normalization of economic activity will continue, and that this will be reflected in financial intermediation. However, the materialization of any of the risk factors raised could slow down the performance of intermediation, impacting the main sources of income of the sector and its solvency, with a potentially greater effect on those entities whose activity is even more affected by the pandemic scenario.
3.3.1 Resilience elements and mitigating measures:
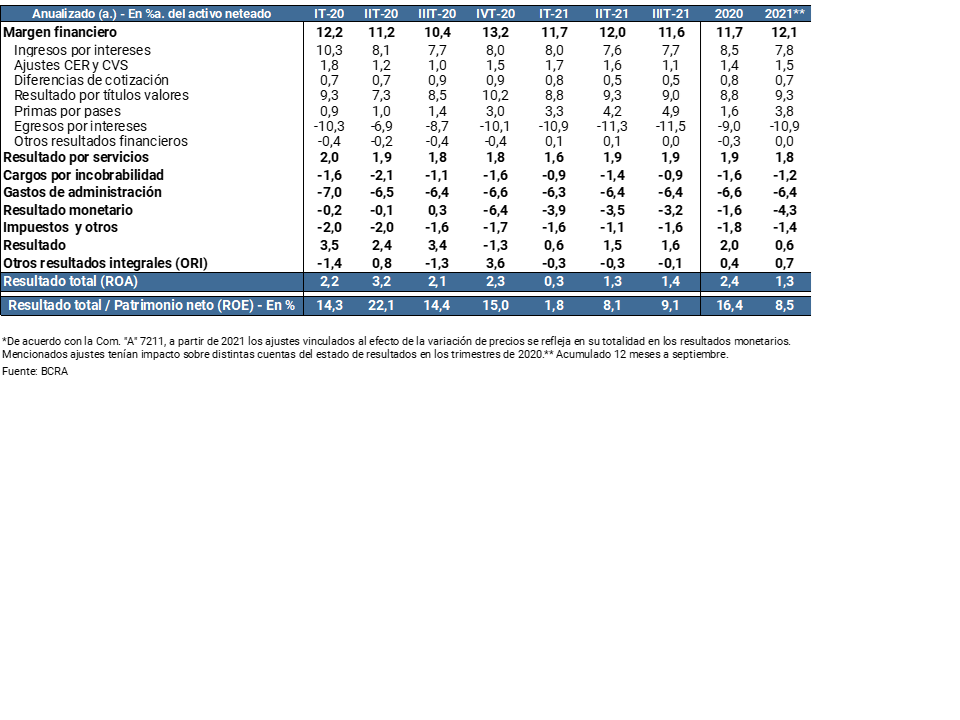
The profitability indicators of the aggregate financial system remain at positive levels. In the third quarter of the year, the financial system posted a total comprehensive result in homogeneous currency at levels higher than those recorded in the previous two quarters (also positive), although lower in a year-on-year comparison (see Table 2). Part of the increase in margin (when comparing the third quarter with the second quarter) was explained by the increase in premiums for passes, the reduction in charges for uncollectibility, in a context of lower negative monetary results63. These effects were partially offset by the reduction in earnings adjusted for CER, higher income tax accruals and the increase in interest expenses.
Table 2 | Financial System Profitability Table – In Homogeneous Currency*
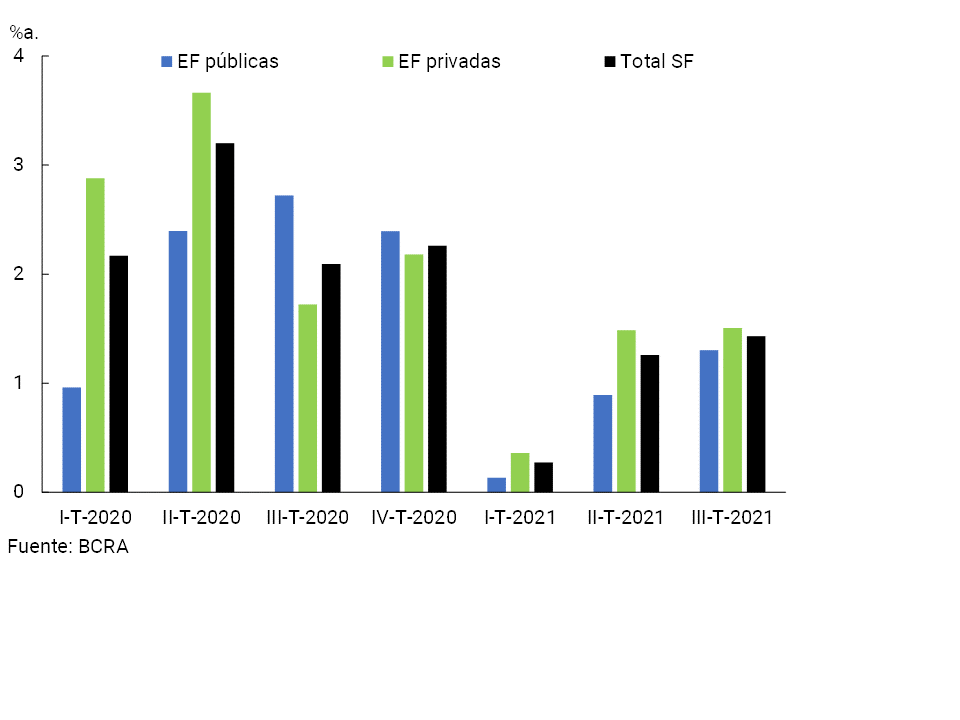
In the third quarter of 2021, a slightly higher ROA was observed in the group of private financial institutions (see Chart 23), showing some heterogeneity in the sector. In this context, all groups of institutions have high solvency indicators (see Table 1).
Figure 23 | Profitability by group of financial institutions – ROA
Risk-oriented supervision by the SEFyC Throughout 2021, the Superintendence of Financial and Exchange Institutions (SEFyC) continued to sustain its efforts to monitor and evaluate the performance of all financial institutions individually. It should be considered that, from a macroprudential monitoring perspective, the systemically important institutions at the local level (DSIBS) as a whole continued to exhibit adequate solvency and liquidity indicators (see Section 4.1).
Targeted measures to accompany the gradual normalization of the economy Since March 2021 and in line with the evolution of the pandemic, the BCRA together with the National Government focused its measures to accompany the economic recovery process mainly on the most vulnerable social strata and on the companies most affected by this scenario (see Box 3).
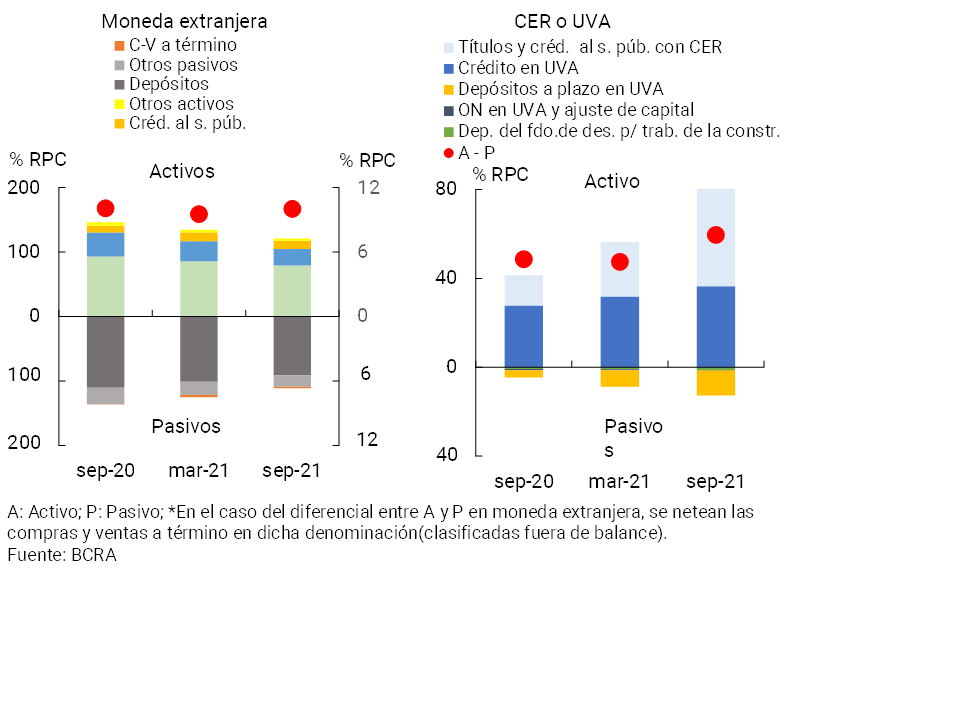
The aggregate of financial institutions maintains limited equity mismatches in currency (CER and foreign currency)It is estimated that the spread between assets and liabilities with capital adjustment by CER and/or UVA for the aggregate of financial institutions stood at 59.5% of regulatory capital (RPC) in September, increasing slightly compared to the level of March and that recorded a year ago (+12.1 p.p. and +10.9 p.p., respectively) (see Chart 24). This differential was mainly explained by the set of public financial institutions. For its part, the spread between assets and liabilities in foreign currency (including forward purchases and sales, off-balance sheet) of the financial system stood at around 10% of the PRC in September, growing slightly in the last six months due to the performance of private financial institutions, although it remained unchanged in magnitude in year-on-year terms.
Figure 24 | Estimating Spreads Between Assets and Liabilities by Currency
Financial system
4. Other topics of stability of the financial system
4.1 Systemically Important Financial Institutions at Local Level (DSIBS)
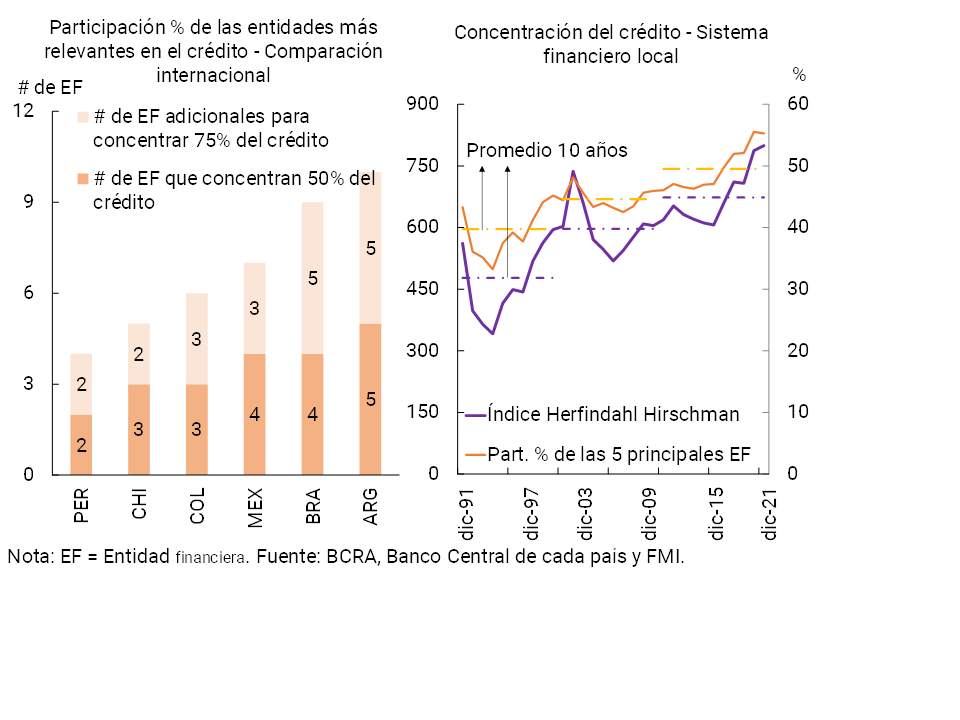
The local financial system maintains certain structural characteristics that distinguish it and that favor the maintenance of moderate levels of systemic risk. Among them is their relatively limited degree of concentration, as can be seen when compared to other emerging and developed economies. An indicator that illustrates this point is the number of financial institutions that account for at least 50% (or 75%) of the credit balance to the private sector – ordering the entities from highest to lowest, according to the credit balance; where at the local level the highest record in the region is observed (see Graph 25 left panel). In terms of the Herfindahl-Hirschman Index64 measured on loans to the private sector, in the context of low levels, it can be seen that in recent years the sector has shown a slight increase in the degree of concentration among entities (see Graph 25 right panel).
Figure 25 | Concentration of private sector credit providers
In addition to the relative size of each financial institution, which can be considered in terms of total assets, credit granted, number of branches, etc., dimensions such as the degree of interconnection in the system, the complexity of the business, and the level of substitutability are also taken into account in order to define systemically important local entities (DSIBs) in terms of the regulatory definition of systemically important local entities(DSIBs).. Within the framework of macroprudential monitoring, a differential monitoring of these entities is carried out, given that possible situations of tension in them could impact the system and the economy as a whole.
As of September 2021, DSIBs represented 49.4% of the sector’s assets, with no changes in magnitude when compared to the previous IEF. In regulatory terms, these entities must particularly verify an additional capital margin above that defined for the rest of the entities, equivalent to 1% of risk-weighted assets (RWA). As in previous semesters, at the end of the third quarter of the year all DSIBs had regulatory capital above the minimum requirement in order to comply with this specific additional margin. In line with the rest of the system, the solvency ratios of DSIBs have increased in recent months. The profitability indicators of the DSIB group increased in the third quarter of the year compared to the first half of 2021 (levels lower than those of 2020), in line with what was verified for the remainder of entities in the sector.
With regard to liquidity indicators, this group of institutions continued to show high levels, increasing compared to the previous IEF (see Table 3), although they were slightly lower than the rest of the system. The indicators associated with the credit risk of the DSIBs registered a performance similar to that evidenced for the sector’s remainder when compared to the last IEF: a slight decrease in gross exposure to the private sector, a slight increase in exposure to the public sector and an increase in the credit irregularity ratio, within the framework of the targeting of financial relief measures.
Table 3 | Main indicators of soundness for D-SIBs
4.2 Interconnection in the financial system
Deposits and time investments of institutional investors66 are the main source of direct interconnection between them and the financial system (set of entities regulated by the BCRA). In this regard, the weighting of institutional investors’ deposits in the funding of the financial system remained high in historical terms at the end of the third quarter of the year (13.4% of the total and unchanged compared to March 2021; see Chart 26), doubling the average of the last 10 years.
Figure 26 | Share of institutional investors’ deposits in the funding of the financial system
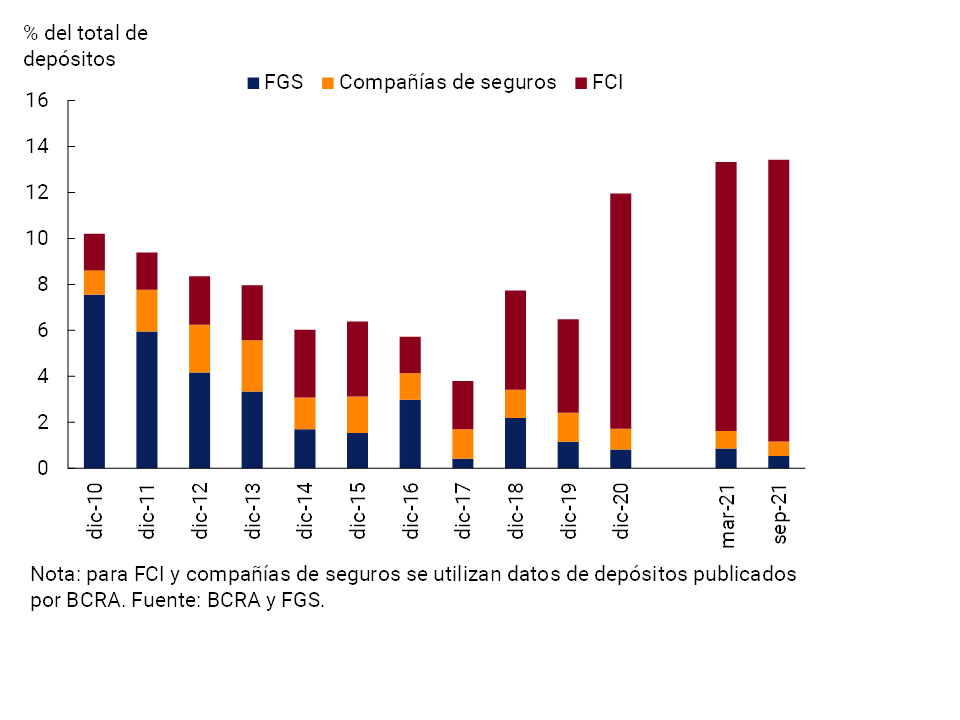
This performance was caused by an increase in deposits of Mutual Funds (FCI) measured in real terms, which offset the fall verified by those of the Sustainability Guarantee Fund (FGS) and insurance companies (the latter two investors reduce their weighting in the funding of the financial system). In the case of the FCIs, the increase occurred in a context of increased assets under management, led by the money market FCIs. The FCIs increased their assets under management by 9.4% between March and September (in real terms), mainly from new subscriptions (positive net flows grew 4.8% in the period) and the rest from the result of investments. 67 For money market FCIs, whose portfolio is accounted for in more than 90% by deposits (half of the deposits of the FCIs), the growth in equity was 4.8% in the same period (2.3% was the increase in net flows). The top 5 money market FCIs account for about 50% of the segment’s combined equity and 25% of the industry’s equity.
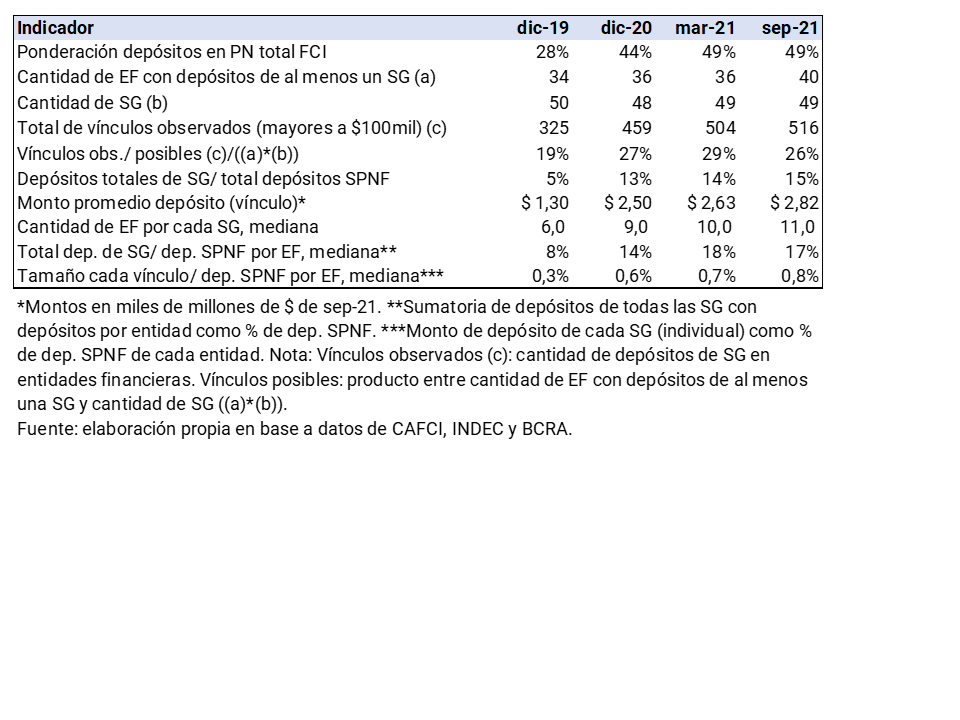
With granular information at the fund level and using network analysis, the direct interconnection between financial institutions and FCIs, grouped by deposits of each FCI Management Company (SG), is higher than that observed prior to the start of the COVID-19 pandemic (December 2019) (see Table 4)68. However, since March 2021, some indicators have shown a mixed performance. On the one hand, compared to March, both the total number of financial institutions with SG deposits increased (from 36 to 40), the average size of deposits ($2,820 million as of September 2021, +7.4% in real terms) and the number of financial institutions with which each SG has deposits (the median went from 10 to 11). On the other hand, although in the same period the number of links between SGs and financial institutions increased, i.e., the amount of consolidated deposits at the level of each SG in each individual financial institution went from 504 to 516, in terms of possible links it decreased from 29% to 26%. Moreover, the importance of the funding of GS on an aggregate basis at the level of each FI contracted slightly, going from 18% to 17% with respect to total NFPS deposits.
Table 4 | Indicators of direct interconnection between FCI deposits grouped by SG and financial institutions regulated by BCRA
With respect to direct interconnection within the financial system, one of the sources is given by the market for unsecured interfinancial loans (call market). This relatively small market69 is used by financial institutions for liquidity management. In a context in which in recent months there has been a slight increase in the amounts traded in this market (although they are still low in historical terms) and with relative stability both in the agreed rates and in relation to other reference rates (such as the BADLAR), in recent months there has been a general increase in interconnection based on the indicators estimated with network analysis methodology. However, in most cases the indicators indicate a lower interconnection with respect to long-term values70.
5. Main macroprudential measures
In the second part of 2021, the BCRA maintained the axes of the prudential policy promoted in the pandemic period, in a framework of focusing its actions in the face of improvements in the epidemiological situation (see Section 1). As mentioned in previous editions of the IEF, a large part of the measures implemented locally to deal with the shock are in line with those adopted by other emerging and developed economies, and leave a set of lessons to be taken into account in the future (see Section 3).
The BCRA’s prudential policy continues to have the following pillars:
i. Ensure that credit to the private sector, especially that channeled to MSMEs and families, continues to gradually expand, in a scenario in which part of the effects of the pandemic on the economy still persist. To this end, different extensions were made to the Financing Line for Productive Investment of MSMEs and the 2021 Zero Rate Program was launched, thus seeking to temper potential situations of tension on the payment capacity of a wide range of debtors, and their eventual negative effects on the financial system and the economy as a whole. (see Boxes 3 and 4). On the other hand, the BCRA maintained unchanged and at zero (0%) the required level of the Countercyclical Capital Margin71 for financial institutions, in a financial intermediation scenario that continues to be partly influenced by the evolution of the pandemic.
ii. Alleviate the financial situation of families and companies still impacted by the shock, in a targeted manner. In this way, the possibility of transferring unpaid installments at the end of the life of the credit continues to be given to employers covered by the Productive Recovery Program II (REPRO II) (accruing only compensatory interest)72 (see Section 3.1).
iii. To encourage bank savings in pesos for term purposes, in particular with regard to adjustable UVA deposits (traditional and pre-cancelable) and traditional fixed terms in pesos at a minimum rate regulated by the BCRA.
iv. Continue to promote the maintenance of prudential capital levels of institutions, for example, by temporarily suspending the possibility of distributing earnings/dividends. The aim is to have a system with a greater capacity to face a potentially more adverse operating scenario without significant tension (in the event of the materialisation of some of the risks analysed in the previous sections), and to reduce its potential procyclical impact on the economy.
v. Calibrate foreign exchange regulations and regulations on financial institutions to continue making efficient use of international reserves, avoiding transitory imbalances between supply and demand.
In addition to these axes, the BCRA is giving a strong boost to the growth of electronic means of payment in the economy, especially through the recent full launch of transfer payments within the framework of the Transfers 3.0 initiative. This new scheme, launched at the end of November, allows both businesses and users to obtain advantages in electronic payments, both in terms of security, immediacy, irrevocability and lower costs, leading to greater financial inclusion of the population (particularly the relatively most vulnerable groups).
Section 1 / Reconstruction of the secondary market for public debt in pesos and liquidity risk
The existence of liquid and deep public debt markets contributes favorably to the financial stability framework of an economy73, and the following benefits can be mentioned:
• reduce the liquidity risk faced by investors (including banks)74, as they can dispose of their positions when required without facing high costs associated with the transaction,
• more efficient debt management by issuers, and
• More correct valuation of financial instruments (relevant given the role of reference for the valuation of instruments of other agents), contributing to the development of more efficient financial markets, making it possible to channel savings into investments in an effective manner75.
The Argentine sovereign debt market is partly influenced by the situation observed in recent years, which implied in 2020 the realization of various debt swaps both locally and internationally (seeking to recover the sustainability of public debt). In this framework, the aim was to promote the financing of the National State in pesos, as well as to normalize the market for public debt instruments in the same denomination76, seeking an attractive and sustainable relationship between term and yield
As a result of this financial strategy, a wide range of instruments inpesos 77 was configured in the local primary market, which progressively tended to concentrate maturities in each segment. Efforts were made to generate increasingly larger issuances, in line with international best practices for public debt management. To provide greater predictability, a schedule of auctions convened for the following months began to be announced. Thus, the gradual extension of the terms for the placement of debt in domestic currency was achieved, while increasing the weighting of the same in the total balance of the national public sector debt.
Given that this is still a developing market with room for growth, the financial strategy subsequently sought to strengthen the operation of the primary and secondary markets for these instruments. Specifically, to continue advancing in the construction of a yield curve in local currency, and to promote the development of the secondary market for public debt instruments in that currency. In the same vein, the BCRA began operating in the public bond futures market to improve market depth.
In relation to the secondary markets, in the last three months the trading of instruments in pesos represented about 30% of the total traded in public securities in the MAE and BYMA (main trading places)78.
Two79 different types of Treasury Bills are currently traded, both of which are at a discount: in nominal pesos (LEDES, 5 instruments in force) and in pesos adjusted by CER (LECER, 8 instruments in force), with a greater participation of the former (see Graph A.1.1). Three different types of instruments are mainly traded among the bonds: in pesos with capital adjustment by CER (BONCER, consolidation bonds and other bonds issued on the occasion of the 2005 and 2010 exchanges), nominal peso bonds at a variable rate (BADLAR rate) and at a fixed rate. Bonds in pesos traded in the secondary markets are about 20 species in total, with a preponderance of the species with CER adjustment (14 surveyed).
Figure A.1.1 | Trading of peso-denominated
instruments
Amounts traded per day by instrument segment and share of peso-denominated instruments in the total traded in the main markets
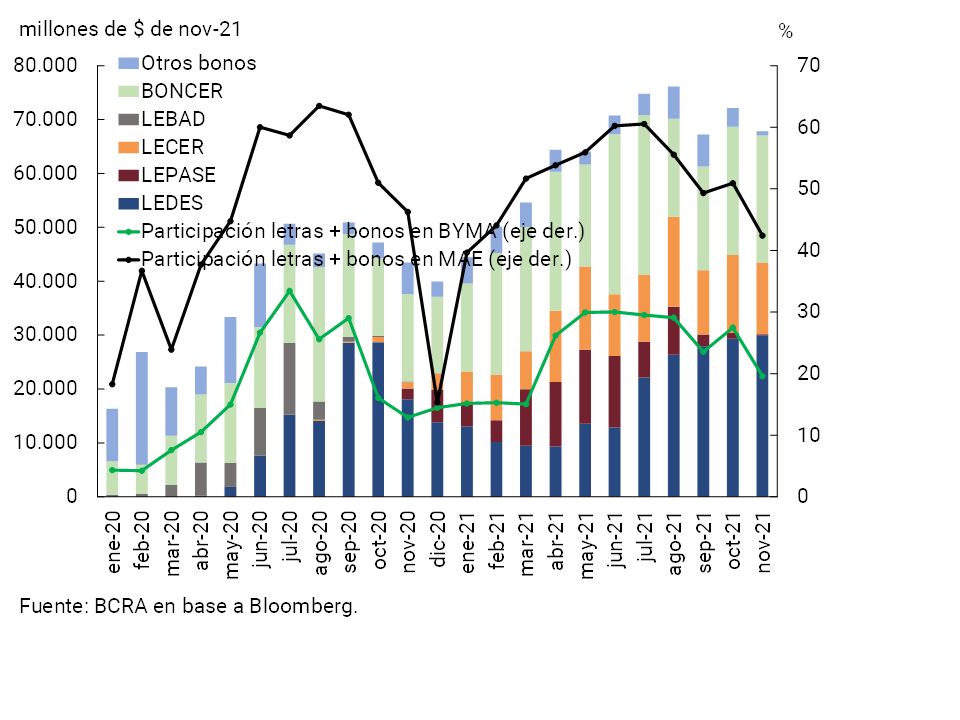
Within the framework of the measures adopted, a gradual relative increase was observed in the trading of public debt instruments in domestic currency in the main markets. However, other classic indicators considered to assess liquidity, such as the spread between buying and selling points (see Chart A.1.2) and the amount traded as a function of the outstanding balance (trading coefficient or turnover)80 (see Table A.1.1), account for the heterogeneity by segment and the potential for improvement in terms of the depth of the secondary debt market in pesos81. In general terms, however, LEDs stand out as the most liquid instruments in the local market.
Figure A.1.2 | Spread between purchase and sale prices of instruments
In pesos
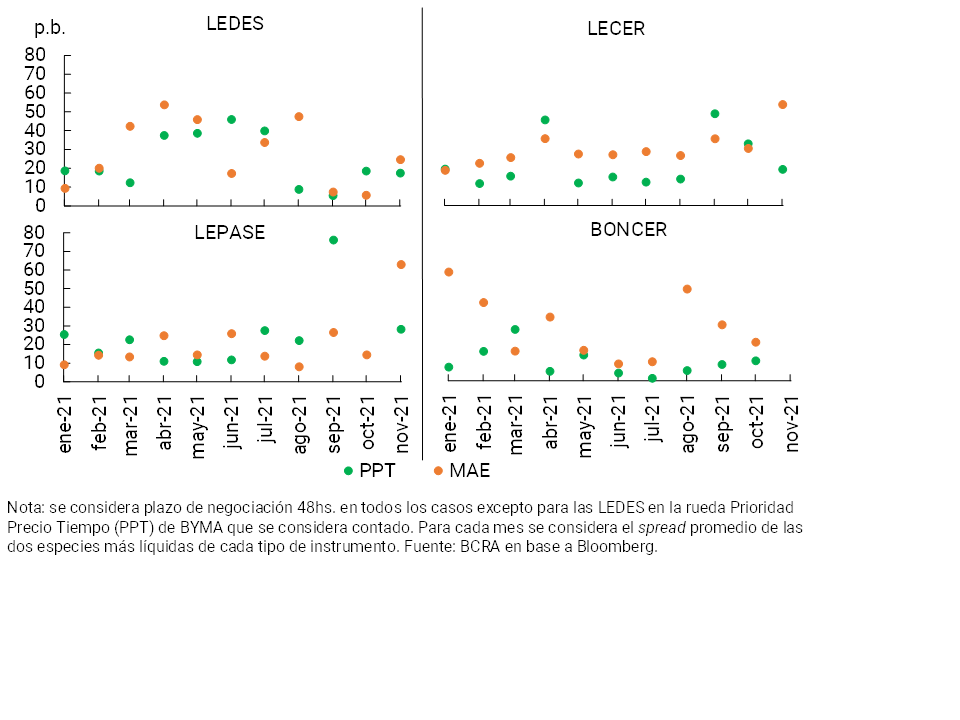
Table A.1.1 | Daily turnover of instruments in pesos by segment
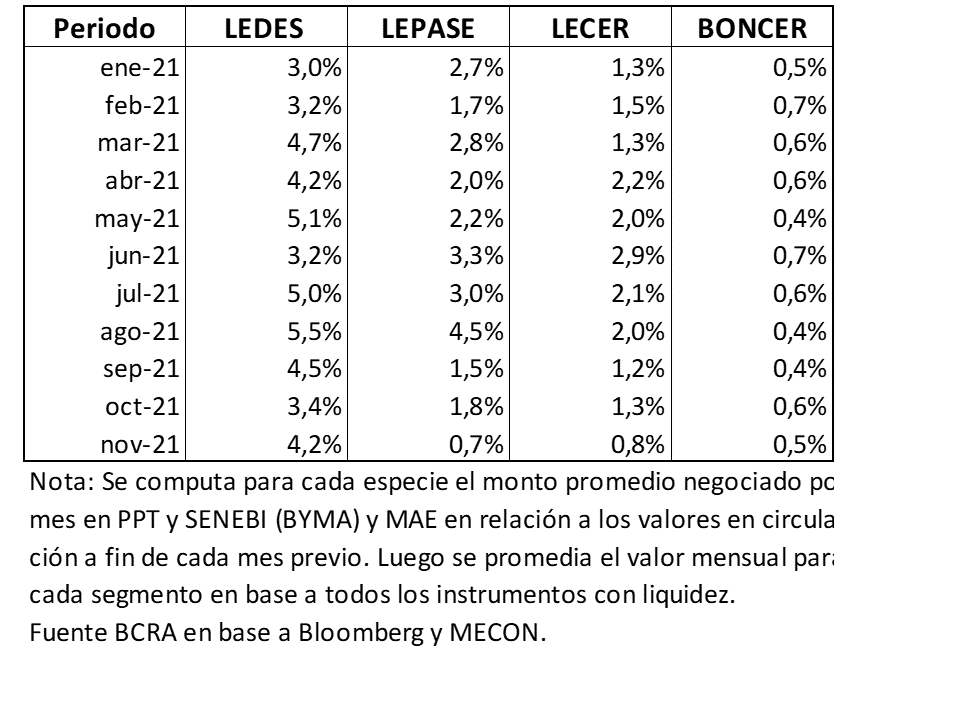
In order to advance in the development of the secondary market for public debt instruments in pesos and to provide greater transparency in the prices of the instruments that are taken as a reference (benchmark) in the local yield curve, the Market Makers Program (CMP) was launched in August82. In its first stage, the program focuses on Treasury Bills and includes the performance of a selected group of 13 aspiring market maker entities (9 are financial institutions)83. Within this framework, the entities that act as market makers (CMs) undertake to a minimum participation in operations both in the primary market (1.5% of the total tendered per quarter) and in the secondary markets, as well as to maintain purchase and sale price positions in a minimum period of the trading day84.
Section 2 / Recent trends in the placement of Notes
Negotiable Bonds (NBs) are the main financing vehicle for companies in the capital markets in Argentina. In a context of reconstruction of the local public debt market (see Section 1), there is a recovery in the amounts of ON placements in 2021, after the period of uncertainty of 2018-2019 and the initial impact of the COVID-19 shock in 2020. However, the development of the local capital market is incipient, given that it is still a small market in international comparison and in relation to the economy.
Gross financing through ON totaled $586 billion (in last November’s pesos) in the 11 months of 2021, with 39% y.o.y. growth compared to the same period in 202085. In the case of the ONs placed in the local market, they represent almost half of the financing accumulated in 2021, considering the range of instruments used (deferred payment checks, financial trusts, promissory notes, shares and others, in addition to ON).
Dollar-linked placements (denominated in dollars and payable in pesos) were the main financing vehicle since 2020: they account for more than 60% of the amount of ON placed in 2021 in the local market86 (see Graph A.2.1, 1 left panel). The rest is distributed between placements in pesos (19%) and UVA (16%). Dollar-linked operations in the local market are associated with larger amounts and terms. Regarding the average amount per operation so far in 2021 (at November prices), while for the latter equivalent to $3,257 million, for operations in pesos and UVA they are $862 million and $2,903 million respectively. In terms of average term, while in dollar-linked placements in 2021 it is 53 months (with placements of up to more than 130 months) for placements in pesos and UVA it is 14 months and 42 months (with placements of up to 60 months in both segments).
Figure A.2.1 | Financing through Negotiable Obligations
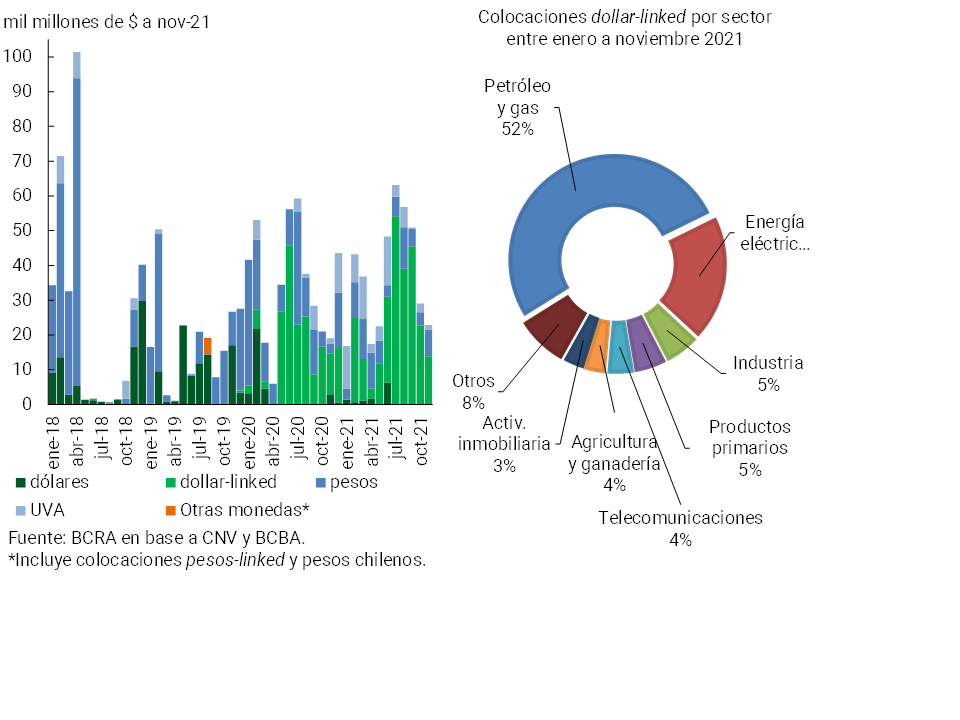
This occurs in a context in which the placements of ON in dollars lost dynamism (both in local and international markets), currently being mostly in the foreign market and being one-off placements of large size88, when in 2016-2017 they accounted for 70% on average. Dollar-linked issuances were mainly made by oil and gas companies, followed to a lesser extent by sectors such as electric power and primary products (see Figure A.2.1, right panel), with companies in several cases having at least part of their revenues in foreign currency.
As a result of the greater prominence in dollar-linked placements, the balance of outstanding bonds increased (which offset the decline in bonds in dollars and pesos), while there was an increase in the weighting of this currency in the total balance. The total balance of outstanding notes (considering local and international legislation) is estimated at US$23 billion (4.6% of GDP) at the end of September, compared to US$21.4 billion (5.4% of GDP) two years ago (pre-pandemic), while dollar-linked notes came to represent 14% of the total balance (+13 p.p. compared to two years ago) (see Chart A.2.2). Bonds in dollars continue to account for most of the balance (77% of the total, with more than 90% in instruments with international legislation)89. Considering the sum of ON payable in foreign currency (dollar, peso-linked and Chilean pesos) it represents 78% of the total, compared to 87% two years ago. With respect to currency risk linked to the balance of ON in dollars, it is noteworthy that there is a significant weighting of companies in the oil and gas sector (45%), with part of their revenues in foreign currency
Figure A.2.2 | Outstanding balance of Negotiable Obligations
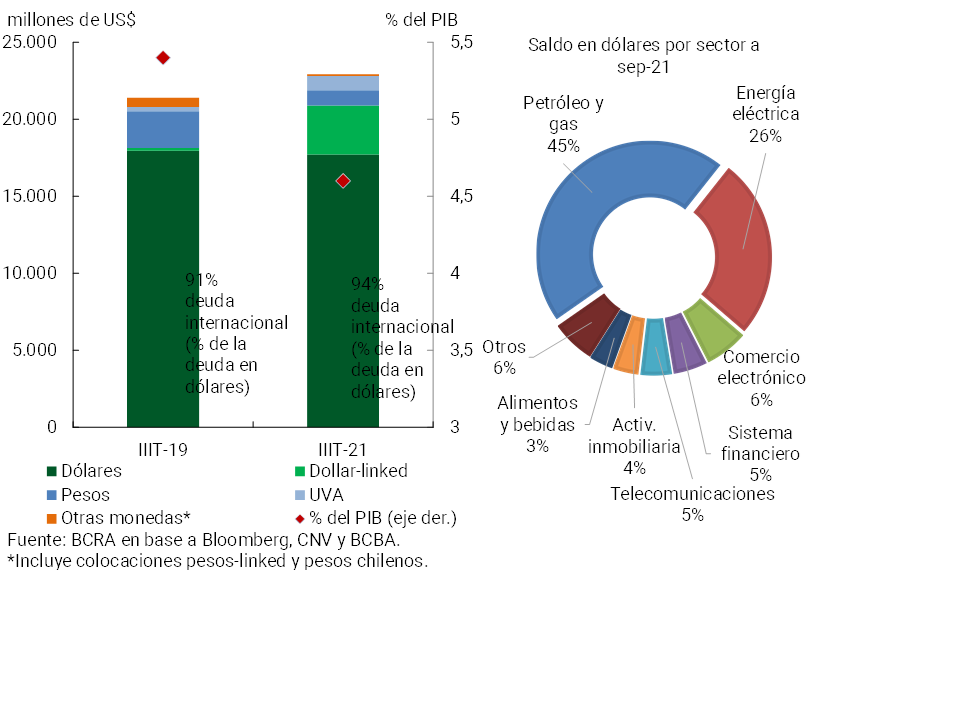
Section 3 / Some challenges and lessons from the financial rules implemented to deal with the pandemic
In response to the emergence of the COVID-19 pandemic, authorities globally implemented a wide range of extraordinary measures aimed at mitigating the adverse effects of the shock. Although the pandemic has not yet been overcome, its duration leads to discussions related to the regulatory approach taken so far, as well as the lessons that can be drawn from what has been done.
Although the shock did not originate in the banking sector, regulatory agencies had to resort to greater regulatory flexibility to encourage banks to sustain the flow of credit to the real economy90. The pandemic highlighted the importance of having a banking sector that proved to be solid and resilient, largely as a result of the regulatory changes introduced since the 2008 global crisis (Basel III). On the other hand, it should be noted that many international banks were reluctant to use the capital and liquidity buffers they had at their disposal in the face of the pandemicscenario 91. One of the lessons learned is that there are prudential tools that were designed to deal with certain types of risks – such as Basel III buffers to counteract systemic financial risk – that do not necessarily serve adequately to deal with events originating outside the financial sector.
Although the banking sector acted to temper part of the effects of the macroeconomic shock, not all actors in the financial markets performed equally. The regulatory changes taken in the face of the 2008 global crisis, added to the context of low returns at the global level from that moment on, led to financial risks becoming increasingly relevant in non-bank financial institutions. The onset of the pandemic led several jurisdictions to suffer liquidity stress in this sector generated by the reversal of risk appetite, in a context of growing demand for assets considered safe. This necessitated large-scale intervention by central banks, thus easing the existing tension in the markets. This situation highlighted the dimension taken by non-bank financial institutions and their interconnection with the financial sector. Given this, there is international consensus and global forums are making progress in the design of a global regulatory scheme that incorporates these actors of increasing relevance92
The totally unexpected nature of the pandemic led to wide-ranging emergency measures with a short-term profile being proposed at the beginning of 2020. The persistence of the pandemic caused several of the measures to be reviewed, prolonging their validity in several cases. During the second half of 2020, the modification of credit policies taken in the face of the initial situation was observed in a generalized manner at the global level, seeking to focus them on the most vulnerable sectors or those affected by the crisis93.
For its part, as of mid-2021, the focus was on planning for the removal of the mix of fiscal, monetary, and financial policies that were adopted. Although several jurisdictions began to reverse some of the measures implemented, most of the support measures remain in place, largely as a result of differences in economic recovery between regions. On some occasions, announcements have even been made about the end of assistance measures that were subsequently reviewed, mainly due to the development of the health situation and its potential impact on economies.
At the global level, there is consensus that the design of the exit strategy presents important challenges and is present on the agenda of international organizations. The latter refer to the need for coordination between different institutions and supervisory authorities, as well as flexibility and gradualness. In turn, they arise in a context of considerable uncertainty regarding the economic situation (although there is improvement, this could be reversed in the event of a possible outbreak of the pandemic)94.
This situation tends to lead to an assessment of the costs of maintaining measures for too long a period of time, as opposed to the costs of withdrawing them too soon. In this sense, most international forums indicate that the longer they are in force, the greater the possibility of affecting credit discipline, allocating resources to non-viable companies (e.g. due to high indebtedness, structural change in the productive framework, etc.), generating opacity and greater vulnerability in the balance sheets of credit providers and finally affecting investment and the medium-term trajectory of output and employment.
On the other hand, there is also some global consensus that the early removal of support measures could create difficulties for the corporate sector, thus affecting its creditors (banks and other investors), with second-round effects. This challenge is exacerbated when the fact that the pandemic did not affect all sectors equally, generating the possibility that the economic viability of certain sectors or companies is under strain. In this way, there is a tendency to argue that the exit strategy must be adapted to the context of each country (health, fiscal, financial situation, among other dimensions) and its capacity to maintain support for the private sector. Given the difficulties involved in actions aimed at dismantling pandemic-related policies, the communication of this strategy is extremely important.
Finally, the crisis left some issues to be analyzed. From the point of view of regulation, it tended to leave some evidence that it is increasingly necessary to have a holistic prudential approach including non-bank financial institutions, that tools designed for a specific purpose may not be as efficient in other situations (for example, the case of Basel III buffers) and that regulations to mitigate banking procyclicality are not enough to deal with a crisis. Likewise, structural changes must be incorporated, such as the greater digitalization of the financial sector that focuses on operational resilience, particularly in cyber risks that are increasingly frequent and sophisticated. These lessons and those that will come until the pandemic is fully overcome will impact future financial policies.
Section 4 / Basel III: Finalising post-crisis reforms
The regulatory framework commonly known as Basel III (BIII) emerged after the comprehensive review carried out by the Basel Committee on Banking Supervision (BCBS) regarding the global financial crisis that originated in 2007. The proposed changes were gradually incorporated, and the process was completed with the reforms of December 201795, 96. These latest reforms aim to improve risk measurement and promote greater homogenization in the methodologies used by banks to prepare this measurement.
The measures that will come into force in January 2023 mainly seek to restore the credibility of the risk-based calculation of capital, taking into account that the 2008 global crisis showed that the different methodologies used by banks to measure their risks generated considerable differences in their capital ratios that could not be explained by discrepancies in the risk profile of their portfolios97. The way in which the use of internal models (IRBs) was implemented – which in principle should have allowed a more precise measurement of risk than standardized models – generated incentives to minimize risk weights and opacity in the information provided, and was also difficult to apply to certain types of assets. The variability observed in capital ratios made it difficult to compare them between entities, impairing their reliability98. In this sense, the 2017 reforms attempt to limit excessive complexity in the calculation, introducing restrictions on estimates and removing, in some cases, the possibility of applying the advanced models of the IRB approach to the calculation of risk-weighted assets (RWA)99.
In the case of credit risk, the review limits the use of internal models. In addition, changes are made to the standardised approach (SA) in order to increase its sensitivity to risk and to reduce references to external risk ratings through the possibility of applying alternative methods and the due diligence requirement100, 101. The due diligence analysis incorporated into the SA approach seeks to ensure not only that the risk weights are appropriate and prudent but also that the bank has at all times an adequate knowledge of the risk profile and characteristics of its counterparties. In addition, it has implications for risk management, requiring the use of higher weights than those set in the standard when banks themselves identify greater implicit risks.
On the other hand, and in order to reduce the variability in the capital requirements of institutions that apply the IRB approach compared to those that do not, the calculation is subject to an output floor based on the RWAs calculated according to the new HS model. In addition, certain restrictions are introduced in the estimates of the parameters and the possibility of using the advanced IRB in some exposures is removedArticle 102.
The standard for calculating RWAs by operational risk through a single approach (SA) was also simplified, taking into account that the nature of the losses associated with this risk makes it difficult to predict them through the application of IRB models. These measures facilitate the comparison of RWAs between different banks by removing the use of multiple approaches and the IRB option provided for in BII. The new SA method is more sensitive to risk, the requirements are defined based on the bank’s revenues and historical operating losses. It is assumed that a bank’s operational risk increases at an increasing rate as its revenues increase and that those banks with higher historical operating losses are likely to suffer them again in the future
The adjustments to the credit risk and operational risk framework complement the leverage ratio (LR) margin requirement for global systemically important banks (GSIBs). The measure is consistent with the risk-weighted margin applied to these entities in order to mitigate the externalities they generate.
In the final adjustments disclosed, modifications are also made to the calculation of the counterparty risk capital. Financial institutions must observe a capital requirement for the possible losses derived from valuing the expected counterparty risk at market prices – losses known as “credit valuation adjustments” (CVAs). During the global financial crisis, this risk caused large losses to banks, so they sought to improve their sensitivity. The use of IRB models is eliminated, allowing banks with low notional amounts to calculate the CVA requirement as a multiplier of their counterparty credit risk requirement.
With these final recommendations, which are in addition to the approach carried out until 2017, the BCBS seeks to provide an exhaustive and complete response to the problems identified in the 2008 crisis. This new regulatory framework offers a relatively more forward-looking and complex view than that of previous regulatory frameworks, including the review of microprudential requirements and the development of macroprudential instruments.
References
1 The price of soybeans continued to fall in the second half of the year. See Monetary Policy Report.
2 Process known as tapering. With purchases of US$120,000 million of assets per month until November, the Federal Reserve will begin to lower this monthly amount at a rate of US$15,000 million per month. More recently, at the Federal Reserve’s December meeting, it was decided to reduce the monthly amount of purchases by $30 billion per month. Additionally, at this last meeting, the members of the Federal Reserve’s FOMC showed more aggressive rate hike projections for 2022.
3 For example, the S&P 500 and the Eurostoxx 50 have accumulated advances in dollar terms of 22% and 6% so far this year (until the end of November), while the cyclically adjusted price-to-earnings ratio is in both cases at relatively high levels.
4 This raises some concern about the possibility that default cases will begin to increase significantly, or that payment problems will occur in large companies. For example, in September there was an episode of increased uncertainty in international markets with a focus on the situation of a large Chinese company (Evergrande). Finally, the company defaulted on a payment in December.
5 Although corporate placements continue to predominate among emerging countries (more than 70% of the total placed between July and November), there is an advance in the weighting of sovereign placements at the margin (in recent months with a growing weight of investment-grade countries).
6 For more details, see the latest editions of the Monetary Policy Report.
7 For its part, in the stock market, since the end of June the Merval advanced 13% measured in dollars (considering the MEP quote). This occurred with an increase in traded volume, although it remains well below the recent highs reached in 2018.
8 See In the case of non-note bonds, placements linked to exchange processes are not considered. Placements from the financial sector are included. On the other hand, it is clarified that in the period under consideration, no shares were placed in the local market.
9 For more information see IPOM.
10 Considering balances of availabilities, concepts included in the integration of minimum cash and other instruments of the BCRA, both in national and foreign currency.
11 The Liquidity Coverage Ratio (LCR) considers the availability of assets liquid enough to face a potential outflow of funds in a severe scenario of short-term stress. The Stable Net Funding Ratio (NSFR) assesses whether financial institutions have a stable funding structure – in line with the business they are engaged in – to mitigate the risk of possible stress situations arising from their funding.
12 Considering the latest information available for a sample of 20 emerging countries, the average for this indicator was around 15.2% (source IMF).
13 The public securities that can be used do not include those linked to the price of the dollar. The securities must be acquired by primary subscription, with a residual term of not less than 120 days and no more than 450 days. See Communication “A” 7290 and 7383. It should be considered that since 2018 financial institutions were already authorized to integrate part of the minimum cash requirements with “National Treasury Bonds in pesos at a fixed rate” (maturing in 2020 / 2022).
14 As of September 2021, the public securities that can be used for the integration of minimum cash framed in communication “A” 7290 accounted for 14.3% of the credit to the public sector granted by the financial system.
15 For more detail, see Section 3 of IEF I-21.
16 https://www.argentina.gob.ar/economia/asuntosinternacionales/mesafs.
17 Joint Statement . https://www.bcra.gob.ar/archivos/Pdfs/Noticias/Declaracion-conjunta-finanzas-sostenibles.pdf.
18 An estimate of the evolution of the level of sectoral economic activity from February 2020 to September 2021 without seasonality is considered. 16 economic sectors are grouped into 4 sets defined according to the 4 quartiles of the distribution of the rates of change in the activity of each sector in the aforementioned period. The following sets emerge from this estimate: (i) better relative economic performance (made up of the Construction, Commerce, Industry and Financial Intermediation sectors), (ii) moderately positive economic performance (Electricity, Gas and Water Supply, Real Estate, Business and Rental Activities, Social Services and Health and Unclassified); (iii) moderately negative economic performance (Agriculture, Education, Other service and community activities, and Public Administration) and (iv) worse relative economic performance (Mining and quarrying exploration, Transportation and communications, Fishing and Hotels and Restaurants).
19 These measures include: (i) the refinancing of credit card payments on 2 occasions (April and September 2020), (ii) the possibility of transferring unpaid instalments at the end of the life of the credit without additional costs beyond the contractual interest rate – a measure in force for all private sector debtors between the beginning of April 2020 and the end of March 2021, and since then only available to those employers who are part of the Productive Recovery Program II—, and (iii) the modification of the parameters to classify debtors of the financial system —in force until mid-2021—, among others.
20 It should be considered that this indicator, usually used to have a dimension of the materialisation of credit risk, must be interpreted in the light of the regulatory changes still in force (see point (ii) of the footnote above).
21 The level of the aggregate NPL ratio for this group is influenced by specific cases of magnitude in the Industrial sector and, to a lesser extent, in Construction.
22 For more details see footnote 12.
23 Influenced by the effect that the gradual dismantling and targeting of financial relief measures had on the evolution of the balance in an irregular situation.
24 It is estimated that 6.2 million individuals have made use of some relief measure (51% of the total number of debtors) and 28.3 thousand legal entities (15% of the total number of debtor legal entities).
25 For more detail, see Third Quarter 2021 CCP.
26 Including, in addition to loans from all financial institutions regulated by the BCRA: financing of credit card systems, loans from mutual societies and cooperatives, financing from other non-bank credit providers registered with the BCRA, financing in the portfolio of financial trusts not linked to infrastructure, FGS loans (including PRO.CRE.AR portfolio), negotiable obligations issued by the non-financial private sector with local legislation, deferred payment checks, loans linked to leasing and factoring and external financing through bonds and loans (not including credits and commercial advances). Last November, the BCRA announced the creation of a registry for Peer-to-Peer Credit Service Providers (platforms that offer the service of bringing one or more providers into contact with credit seekers to carry out loan operations in pesos).
27 Balances as of September (except for mutuals and cooperatives and for foreign financing) as a percentage of GDP without seasonality estimated for the third quarter of 2021.
28 With respect to the average observed at the end of the previous 5 years, these levels imply a fall in the case of financing to families (average of 8% of GDP between Dec-16 and Dec-20) and an increase for companies (from 12% of GDP).
29 Total loans granted by mutuals and cooperatives, based on INAES data (data as of June).
30 Includes loans granted, among others, by retail chains, financial companies, and fintechs. For more information on other providers registered with the BCRA, see Report on Other Non-Financial Credit Providers.
31 Both in the form of bonds and loans, data based on information from international accounts published by INDEC (data as of June).
32 It should be noted that the balance of local non-financial corporate bonds is composed of 60% in dollar-linked instruments, 18% in dollars, 14% in UVA and 8% in nominal pesos (estimate as of September 2021). In the dollar-linked segment as in the dollar segment, the participation of companies in sectors such as oil and gas, agriculture and electric power (in several cases with revenues linked to the evolution of the exchange rate) stands out.
33 In the case of households, the estimate of the annual financial burden of the debt – without considering variations in the interest rate in the case of loans agreed at a variable rate, or early cancellations or refinancing – represented 14.1% of the wage bill as of October 2021.
34 The publicly offered companies considered constitute a segment of relatively large/medium-sized firms within the local non-financial corporate sector (the analysis does not include companies under the simplified regime for SMEs). For more details on coverage and methodology, see sections on “Equity Situation of the Corporate Sector” in IEF I-17, “Companies with a Public Offering and Currency Mismatch” in IEF I-18 and “Financial Situation of Companies with a Public Offering” in IEF I-19, II-20 and I-21.
35 For more information on the impact of COVID-19 on corporate balance sheets in 2020, see “Financial Situation of Publicly Offered Companies” (II-20 ) and “Financial Situation of Publicly Offered Companies in 2020” (I-21).
36 Final profitability (ROE) showed a less favorable evolution, mainly due to the effect of changes in income tax that affected the IIT-21 balance sheets.
37 With more marked increases in sectors such as services and construction, while it fell for primary production and trade.
38 Specific and insignificant cases (less than 1% of the total balance of NO in circulation). Some cases are still under negotiation with their creditors or have already proceeded to the opening of preventive bankruptcy.
39 It is approximated in a simple way based on three financial ratios that are particularly relevant for measuring credit risk: interest coverage, leverage and acid liquidity. For more details on the methodology, see “Financial Situation of Publicly Offered Companies” in IEF I-19.
40 According to balance sheet data. It includes bank loans, debt in the form of bonds and other financial liabilities.
41 Of the total outstanding notes of companies considered relatively vulnerable, 85% are denominated in dollars. However, payments linked to these notes represent only 10% of the dollar flows expected for non-financial sector bonds in all of 2022.
42 It is allowed to use certain national public securities in pesos to integrate a part of the Minimum Cash requirement.
43 See Communication “A” 7291 and Press Release (The BCRA generates mechanisms that promote the development of the capital market).
44 The coefficient of variability (quotient between the standard deviation and the mean) for the monthly balance of private sector deposits in national currency over the last 10 years was equivalent to 1.8 for the segment held by the FCIs, while for the rest of the deposits it stood at 1 (same level for the individual segment). It should be noted that at the end of the third quarter of 2019 and the beginning of 2020, regulatory changes (associated with monetary policy objectives) took place that resulted in the entry and subsequent exit of the FCIs from the pass market with the BCRA (Press Release 50.953 and Communication “A” 6861). On the other hand, in the context of these modifications, there were reductions and subsequent increases in FCI deposits in the financial system. Excluding these effects (for example, considering the time span from mid-2020 to the present), the coefficient of variability for the balance of deposits in the CRFs, although significantly reduced, remains at levels higher than that corresponding to the rest of the deposits.
45 When compared with other economies, it can be seen that the local financial system has a greater weighting of short-term liabilities in total funding, a structural characteristic associated in part with the transactional bias that predominates in the sector’s operations.
46 For more details see Communication “A” 7290 and Press Release of 27/05/2021
47 The LCR considers the liquidity available to deal with a potential outflow of funds in the event of a possible stress scenario in the short term. See Ordered Text (OT) Liquidity Coverage Ratio.
48 The NSFR takes into account the availability of stable funding of the entities, in line with the terms of the businesses to which it applies. See TO Stable Net Funding Ratio.
49 Estimate based on balance calculated at the end of November 2021.
50 Although 60% of the total balance of bonds of financial institutions is in dollars, the maturities in the IS22 are 54% for debt in nominal pesos, 25% in UVA and 16% in dollars (including peso-linked instruments, denominated in pesos but subscribed and paid in foreign currency) and 5% in dollar-linked.
51 For more details, see Ordered Text Financing Line for Productive Investment of MSMEs and Communication “A” 7369.
52 The maximum interest rate for loans for investment in capital goods is 30% nominal per annum, with a minimum average term of 2 years (weighting the principal maturities, without the total term being less than 36 months), while for financing for working capital it is 35% nominal per annum. Financial institutions may reduce the minimum cash requirement by an amount equivalent to 14% of financing to MSMEs, to the extent that they are channeled to investment projects in capital goods. For more details, see Ordered Text, Minimum Cash and Communication “A” 7161.
53 For a follow-up of LFIP disbursements, see the editions of the Bank Report.
54 According to data as of August 2021 from the Ministry of Labor, Employment and Social Security.
55 For more details, see the section “Measures adopted by the BCRA to sustain the flow of financing to the private sector” corresponding to IEF II-20.
56 Both the balance of the financing channeled through the LFIP and that of those credits granted outside the aforementioned program are considered.
57 For more details, see Ordered Text Financing Line for Productive Investment in MSMEs, Communication “A” 7369 and Box 3 “Scope of the Financing Line for Productive Investment (LFIP) for MSMEs —Quota 2021—” of this Report.
58 see Communication “A” 7342 and Decree 512/2021.
60vThe reduction, equivalent to 50% of the credit, in the minimum cash requirements was maintained. Communication “A” 7334
61 In the last six months, the fall in the broad liquidity of the aggregate financial system in total assets was mainly explained by a reduction in the balance of availabilities and current accounts (both in domestic and foreign currency) that the entities have in the BCRA. Meanwhile, the holding of BCRA instruments increased its weighting in the period.
62 In a year-on-year comparison, the assets of financial institutions as a whole fell by 3.2% in real terms in September. This performance occurred after the significant increase recorded in 2020, mainly driven by the increase in credit in national currency and monetary regulation instruments (as a reflection of the monetary sterilization carried out by the BCRA, after the issuance of pesos to finance extraordinary programs implemented by the PEN to counteract the effects of the COVID-19 shock).
63 The latter reflect the impact of the evolution of inflation on the profitability of institutions.
64 The Herfindahl-Hirschman Index is constructed as the sum of the square of each entity’s share in the credit or deposit market, indicating greater concentration the higher the value obtained.
65 The identification of local systemically important entities (D-SIBs) can be found HERE.
66 In terms of the volume of assets under management, the most important institutional investor at the local level continues to be the Sustainability Guarantee Fund, followed by the Mutual Fund industry and insurance companies.
67 In August, the CNV, through resolution 900/21, created a special regime for the creation of new money market funds whose purpose is to invest in public securities. On the other hand, within the framework of RG885/2021, the creation of CRFs was authorised for investment in negotiable securities with environmental, social and governance (ESG) impact.
68 Deposits are considered to be links between financial institutions and CRFs grouped at the level of GSs, without distinguishing between demand and fixed-term accounts. There are other investments such as the holding of ON by FCI whose issuers are the FIs or EF shares that are not included in this analysis. See Section 5 69 Although the average amount traded per day with respect to the balance of private sector deposits is less than 1%, it is relatively one of the main sources of direct interconnection between financial institutions.
70 A greater number of nodes (financial institutions participating in the market) and linkages (number of loans consolidated at the level of the financial institution) are observed on average compared to the previous 6 months. The greatest interconnection is observed in indicators such as medium grade, network density and distance. For the definition of these and the main terminology used in network analysis, see Section 3 of IEF II-18.
71 See Ordered Text on Distribution of Results. The Countercyclical Capital Margin is a macroprudential policy tool available to the BCRA, whose fundamental objective is to protect financial institutions from the accumulation of systemic risk resulting from excessive credit growth at the aggregate level.
72 Also allowing the transitory modification of the parameters to classify them.
73 See, for example, Financial Stability and Local Currency Bond Markets , CGFS Papers no. 28, June 2007.
74 In Argentina, the main holders of sovereign public debt are institutional investors and financial institutions.
75 Das, U.; Surti, J.; Ahmed, F.; Papaioannou, M.; Pedras, G., Managing public debt and its financial stability implications, IMF, Working Papers 10/280, December 2010.
76 See IEF Section 3 First Semester 2020 and Section 6 IPOM November 2020.
77 Discount bills, coupon bonds in nominal pesos and in pesos with CER adjustment, variable rate coupon bills and bonds (BADLAR) and 7-day Passive Pass rate coupon bills plus margin (LEPASE) were included. More recently, Treasury Liquidity Bills (LELITE) began to be issued, intended exclusively for FCIs, partially pre-cancelable and non-negotiable in the secondary market.
78 Considering the period from January to November, instruments in pesos represented 30% of the total traded. The rest of the negotiation is distributed in 28% of the total in national public securities denominated (and payable) in foreign currency and the rest in other instruments such as those linked to the dollar and provincial bonds, among others. The total amount traded in public securities so far in 2021 amounted to $222,000 million (in constant values of November 2021) on average per day, including the bonds of the different segments (dollar, linked to the dollar, pesos and others). Trading in the priority price-time (PPT) and bilateral (SENEBI) segment of the stock exchange (BYMA) and what is traded in purchase and sale operations in MAE are considered.
79 Until November, LEPASE was negotiated. These instruments were placed from November 2020 to August 2021, when the last auction placement of the specie maturing in November 2021 was carried out.
80 Thus, it is considered that the smaller the spread between buy and sell prices measured in bp, the more liquid the instrument is, usually being less than 5 bp. in the reference species in deep markets such as U.S. Treasury bonds and also in the case of the more liquid sovereign bonds of Brazil, Mexico, etc. As a reference, between 2006 and 2010 the spread of the Boden 12 was in an average range of 25-30 bps. For the trading coefficient, the indicator is typically calculated as the amount traded in daily, weekly or monthly terms based on the outstanding value (close to the technical value) or market value of the instrument to indicate the turnover or turnover: the higher the turnover, the more liquidity the instrument has.
81 The estimate made for the spread between buy and sell points, which covered the most traded species in domestic currency between January and November 2021 in MAE and the PPT segment of the stock exchange, yielded indicators (on a monthly daily average) in a range from less than 10 bp. for the most liquid LEDs and BONCERs, a value that exceeds 60 bp. in other instruments. Regarding the trading coefficient, it was computed as the monthly daily average traded in MAE and BYMA (PPT and SENEBI segment) from January to November 2021 based on the estimated outstanding value at the end of each previous month, seeking to cover all the instruments with secondary trading by segment. At the species level, for the most liquid peso bills this range was between 2.1% and 5.4%, while for BONCER it was between 0.5% and 2.1%. As a reference, in the most liquid sovereign bonds in dollars, the daily turnover is in a range of 4% to 27%.
82 See Joint Resolution 1/21.
83 Among other requirements to be met in order to be accepted as a CM, the entity must be a Settlement and Clearing Agent (ALyC).
84 With respect to the rights for CM entities, they may participate in the second round of tenders and participate in meetings with the Undersecretariat of Financing on issues related to the development of capital markets and the design of instruments. They will be able to access loans from public debt instruments (when available) and economic incentives to be defined.
85 Considering only transactions of a genuine nature (excludes exchanges), with all legislation. If the bonds with international legislation are excluded, the amount in the same period is $408 billion in November 2021 pesos, with a growth of 9% y.o.y.
86 Dollar-linked ON accounted for about 45% of the total amount in 2020. Of the operations in 2021, several are framed in the Guidelines for the issuance of social, green and sustainable Negotiable Securities in Argentina by CNV (considering 9 placements in 2021 in this segment, 4 were dollar-linked, 4 in pesos and 1 UVA).
87 The transactions considered here exclude swaps and therefore do not include transactions linked to refinancing processes carried out in accordance with the new BCRA rules as of October 2020 (Communication “A” 7106 and subsequently “A” 7230) on maturities in foreign currency. These operations implied lower net purchases in the foreign exchange market of about US$ 1,800 million compared to the original maturities for financial debts abroad and/or local securities in foreign currency (since the entry into force and during the semester of 2021, see Report on private external debt). In December, it was decided to extend for six months the validity of the foreign exchange provisions that expire at the end of the year regarding the refinancing of debt securities in foreign currency and other financial liabilities.
88 The total amount amounted to US$ 1,621 million in 2021 and US$ 665 million in 2020. The average term of ON placements in dollars, on the other hand, is 89 months in the 11 months elapsed in 2021 (with operations of up to 120 months).
89 The international swaps in early 2020 and the refinancing operations under Communication “A” 7106 (and later “A” 7230) did not generally involve capital write-offs, although they did lead to an improvement in terms of the maturity profile.
90 See IEF II-20. Section 4 / COVID-19. Use of regulatory flexibility; FSB: COVID-19 Pandemic: Financial Stability Impact and Policy Responses (November 2020).
91 FSB; COVID-19 Pandemic: Financial Stability Impact and Policy Responses – Interim report (July 2021).
92 FSB: Enhancing the Resilience of Non-Bank Financial Intermediation: Progress Report (November 2021).
93 See IEF I-20 Section 1 / Prudential approach to the COVID-19 shock by Central Banks and Supervisory Bodies.
94 FSB: Lessons Learnt from the COVID-19 Pandemic from a Financial Stability Perspective – Final report.
95 The first adjustments incorporated in BIII focused on strengthening capital requirements and introducing measures to contain systemic risk and limit the procyclicality of regulation (see IEF Sections 5 II-11, 3 I-14, 4 II-14 and 7 I-16 for details of the early stages of implementation). Conservation and counter-cyclical margins were incorporated as supplementary capital requirements (see Section 7 I-16 and Box 10 II-17 of the IEF) and the leverage ratio (see Section 4 II-14 of the IEF) as a complement to the risk-based requirements; quantitative liquidity standards (see IEF Sections 3 I-14 and 3 II-15); limits on large exposures to a counterparty and specific guidelines for systemically important banks. Certain areas of the venture capital framework that were not adequately designed were also reviewed, including standards for market risk, counterparty risk and securitization.
96 Basel III: Finalising post-crisis reforms – 2017.
97 Its implementation date was initially January 2022 but was postponed due to the crisis generated by the COVID-19 pandemic.
Analyses for developed jurisdictions found that the market-set capital price for these large banks had a positive correlation with an investor-calculated leverage ratio rather than regulatory capital. See, for example, Hoenig, T (2013): “Basel III Capital: A Well-Intended Illusion -Research Conference”; Basel, Switzerland.
99 The Internal Ratings-Based (IRB) approach can be applied by using two methods: Advanced IRB and Basic IRB.
100 The granularity in the risk weights to be assigned is increased. This is particularly relevant in mortgage-backed exposures to which BII assigned a constant weight.
101 Methods not based on external credit risk ratings (standard assessment approach) are incorporated for some of the credit exposures.
102 The advanced IRB approach is no longer applicable to exposures to banks and other financial institutions and to large companies belonging to economic groups with consolidated revenues greater than € 500 million. The use of any of the IRB approaches (advanced and basic) for the calculation of exposures by shares is eliminated.
Glossary of abbreviations and acronyms
€: Euro
to.: Annualized
AFIP: Federal Administration of Public Revenues
ANSeS: National Social Security Administration
RWA: risk-weighted assets
ATM: Automated Teller Machine
BADLAR: Buenos Aires Deposits of Large Amount Rate (interest rate paid for 30 to 35-day fixed-term deposits, more than $1 million, average of entities)
ECB: European Central Bank
BCBA: Buenos Aires Stock Exchange
BCBS: Basel Committee on Banking Supervision
BCRA: Central Bank of the Argentine Republic
IDB: Inter-American Development Bank
BIS: Bank for International Settlements
BoE: Bank of England
BONUSES: Fixed-rate Treasury bonds in pesos
CABA: Autonomous City of Buenos Aires
CAFCI: Argentine Chamber of FCI
Call: Interest rate on unsecured financial market operations
CCP: Central Counterparty (Contraparte Central)
CDS: Credit Default Swaps
CEMBI: Corporate Emerging Market Bond Index
CER: Reference Stabilization Coefficient
NVC: National Securities Commission
COVID-19: Coronavirus wished 2019.
MUST: Immediate Debit Payment Method
DPN: National Public Debt
DSIB: Domestic Systemically Important Banks
ECAI: External Credit Assessment Institution
ECB: European Central Bank
ECC: Credit Conditions Survey
USA: United States
EFNB: Non-Banking Financial Institutions
EMAE: Monthly Estimator of Economic Activity
EMBI+: Emerging Markets Bond Index
EPH: Permanent Household Survey
FCI: Mutual Funds
Fed: US Federal Reserve
Fed Founds: US Federal Reserve Benchmark Interest Rate
FGS: Sustainability Guarantee Fund
IMF: International Monetary Fund
FSB: Financial Stability Board
GBA: Greater Buenos Aires (includes all 24 matches)
A.I.: Year-on-year
IAMC: Argentine Institute of Capital Markets
IBIF: Gross Domestic Fixed Investment
IEF: Financial Stability Report
INDEC: National Index of Statistics and Censuses
CPI: Consumer Price Index
IPIM: Domestic Wholesale Price Index
IPMP: Commodity Price Index
IPOM: Monetary Policy Report
VAT: Value Added Tax
CSF: Liquidity Coverage Ratio
LELIQ: Liquidity Bills of the Central Bank of the Republic of Argentina
LFPIF: Financing line for production and financial inclusion
LR: Leverage Ratio
MAE: Electronic Open Market
MERCOSUR: Southern Common Market
Merval: Buenos Aires Stock Market (benchmark stock market index)
MF: Ministry of Finance
MH: Ministry of Finance
MSMEs: Micro, Small and Medium Enterprises.
MSCI: Morgan Stanley Capital International
MULC: Single and Free Exchange Market
NIC: International Accounting Standard.
IFRS: International Financial Reporting Standards (IFRS)
OECD: Organization for Cooperation and Development Ec.
ON: Negotiable obligations
OPEC: Organization of the Petroleum Exporting Countries
P.B.: The Basics
P.P.: Percentage points
PEN: National Executive Branch
PGNME: Global Net Foreign Exchange Position
GDP: Gross Domestic Product
PN: Net Worth
PPM: Mobile Payment Platform
SMEs: Small and Medium Enterprises
REM: Market Expectations Survey
ROA: Return on assets
SWEE: Return in terms of equity
ROFEX: Rosario Futures Exchange (Mercado a término de Rosario)
RPC: Computable Patrimonial Liability
S&P: Standard and Poor’s (Index of the main stocks in the US by market capitalization)
s.e.: Series without seasonality
SEFyC: Superintendence of Financial and Exchange Institutions
NFPS: National Non-Financial Public Sector
SGR: Reciprocal Guarantee Society.
TCR: Real exchange rate
TM20: Interest rate for fixed-term deposits of 20 or more million pesos or dollars.
TN: National Treasure
TNA: Annual Nominal Rate
Trim.: Quarterly / Quarter
ICU: Utilization of Installed Capacity
EU: European Union
US$: US Dollars
UVA: Unit of Purchasing Value
ICU: Housing Unit
UVP: GDP-Linked Units
Var.: Variation
VIX: S&P 500 volatility
WTI: West Texas Intermediate
Share on


