Summary
In the first part of 2022, the aggregate of local financial institutions continued to show comfortable levels of capital, liquidity and provisioning, as well as moderate NPL ratios in their loan portfolio, a situation that contributes positively to shaping a framework with a significant degree of resilience in the face of possible situations of stress. The operational scenario for the sector was favored by the maintenance of the local economic recovery process initiated in 2021, supported both by the improvements observed in the health situation and by the stimulus policies implemented by the National Government in conjunction with the BCRA. In this context, the Argentine financial system continued to carry out its activities of intermediation of funds and provision of payment services to families and companies.
At the beginning of 2022, the Argentine economy continued to strengthen the aforementioned reactivation process, after the effects of the COVID-19 shock. Positive prospects remain for the coming months, led by the recovery of the sectors that were most affected by the pandemic, although they are subject to somewhat increasing risks. The international context became less favorable after the publication of the latest IEF at the end of last year: the war between Russia and Ukraine generated a shock on the price of raw materials, aggravating concerns about inflationary pressures in developed economies, among other aspects. This resulted in a more restrictive monetary policy implementation faster than initially expected in these countries, generating fears in recent months regarding the possibility of stagflation scenarios and lower risk appetite.
Increases in commodity prices also had an impact on local inflation, in a context of recovering economic activity. The BCRA continued with the process of normalization of monetary policy interest rates, seeking to tend towards a path of interest rates that allows positive real returns for investments in pesos and avoid pressures in the foreign exchange market, without affecting the economic recovery process underway. To this were added, among others, the credit policy focused on productive development with an emphasis on MSMEs (Productive Investment Financing Line -LFIP-), as well as measures aimed at achieving a more efficient use of international reserves.
Local financial markets showed a mixed performance in recent months. Accompanying the policies to promote its growth, the Treasury refinanced debt maturities, while the private sector maintained the amounts of financing through markets, in a context of increases in nominal interest rates. The upward trend in yields in the secondary markets of Treasury bonds in pesos accelerated in June, so the BCRA intervened in order to recompose the curve in pesos and avoid excessive volatility that compromises financial stability. It is expected that the current policy scheme, in the context of the agreement with the IMF, will consolidate a framework of macroeconomic certainty, helping to limit expectations about the evolution of the exchange rate and inflation.
The Argentine financial system retains adequate features of soundness, although it faces the possibility of the materialization of different exogenous risk factors that could potentially condition its normal functioning. The deterioration of the external context stands out in recent months, with tighter global growth prospects and greater uncertainty, volatility in commodity prices, falls in the prices of instruments with greater relative risk and outflows from investment funds specialising in emerging markets. Given the presence of different types of vulnerabilities at the global level, this could trigger more marked negative dynamics with abrupt changes in international markets, implying challenges for emerging economies. At the local level, idiosyncratic factors must be taken into account, such as the effect of drought in the summer and the possibility of energy market tensions. Although significant progress has been made, possible negative effects of new strains of COVID-19 cannot be ruled out. Depending on the type of shock, this type of scenario could condition the evolution of the local economy or generate volatility in the local financial market.
The balance between sources of vulnerability and strengths of the financial system shows little change compared to the IEF at the end of 2021. There was a slight increase in certain exposures to risks, although these are low to moderate, with hedging remaining relatively high. In addition, the system preserves structural features that limit potential sources of systemic risk: (i) low credit depth in the economy, (ii) traditional financial intermediation biased towards the short term and with low relevance of complex operations, and (iii) reduced interconnection between entities in the sector.
In the first part of the year, there was a slight increase in the financial system’s equity exposure to aggregate credit risk, although it remains at low levels from a historical perspective. Total financing to the private and public sectors reached 46% of the system’s assets, increasing slightly in recent months, mainly due to the last component. The slight increase in exposure to the private sector (to approximately 30.9% of total assets) occurred in conjunction with a gradual reduction in irregularity levels, which reached 3.6% of the portfolio in April. The irregularity indicator is practically no longer influenced by the regulatory modifications implemented in 2020, aimed at alleviating the financial burden of debtors in the context of the pandemic. Looking ahead to the coming quarters, this source of vulnerability for the system – derived from its credit exposure – would remain one of the most important in relative terms. To weigh these potential effects (subject to the materialization of exogenous factors that have an impact on the repayment capacity of debtors), the system sustains high and growing levels of forecasts and capital, in a context in which indebtedness and the financial burden of the private sector are limited.
The performance of financial intermediation could also be a source of potential vulnerabilities for all institutions. Compared to the previous IEF, intermediation activity remained at moderate levels, with a slight increase in the real balance of credit to the private sector in pesos, with greater relative dynamism in public banks and commercial lines. The latter occurred within the framework of the LFIP, a stimulus program that resulted in a positive performance of loans to SMEs. In the coming months, the process of gradual recovery of economic activity is expected to continue, with a positive impact on intermediation, both in the supply and demand of financing and deposit funding. However, it should be considered that potential scenarios for the materialization of risk factors could generate challenges for the financial system. In contrast, the institutions as a whole maintain high and growing solvency indicators, with positive internal capital generation.
A third source of potential vulnerability for financial systems in general originates in the evolution, composition and conditions of funding. Compared to the IEF at the end of 2021, the real balance of deposits in pesos decreased slightly due to the performance of demand accounts, as time deposits increased. The latter were boosted by minimum interest rate hikes during 2022, as well as increased demand for UVA time deposits, instruments that offer positive real returns. Compared to the previous IEF, there was a slight increase in some indicators of exposure to liquidity risk, such as in terms of funding maturity. The indicators of depositor concentration did not show significant changes, although they remain at levels higher than those observed in the recent past. Going forward, changes in the system’s funding cannot be ruled out in the event of an eventual materialization of some of the risk factors raised. Faced with situations of this type, the institutions as a whole maintain high coverage with liquid assets, which comfortably exceed the minimum regulatory requirements that are in line with international recommendations.
In the remainder of 2022, the aggregate of financial institutions would maintain an adequate degree of resilience, with adequate margins to overcome potential scenarios for the materialization of any of the risks considered above. The ongoing economic recovery process will continue to contribute, in addition to the active actions of the BCRA with its policies that promote a context of financial stability.
1. International and local context
Since the publication of the last IEF, and continuing with the trends observed until then, the sources of risk from the external context have intensified. The concern that had already been observed regarding the increase in inflationary pressures worldwide was accentuated by the effects of the war between Russia and Ukraine (including sanctions on the Russian economy), with a particular impact on commodity prices. This situation contributed to the persistence of problems in international supply chains that arose in the context of COVID-191. Although so far this conflict has not generated a systemic event worldwide, it has configured a scenario of greater volatility (see Section 1), with a peak in early March according to the VIX index. This growing uncertainty conditions the heterogeneous recovery process of the global economy that has been taking place based on the improvements observed with respect to the Covid-19 pandemic. Since the end of April and the beginning of May, there has been a new outbreak of volatility, this time focused on concerns about the possibility of stagflation scenarios in developed economies. Both the evolution of the war and the macro fundamentals in developed economies and expectations regarding the normalization process of their monetary policies will be elements that will condition the behavior of volatility levels in the coming months (with a potential effect on financial stability at the global level).
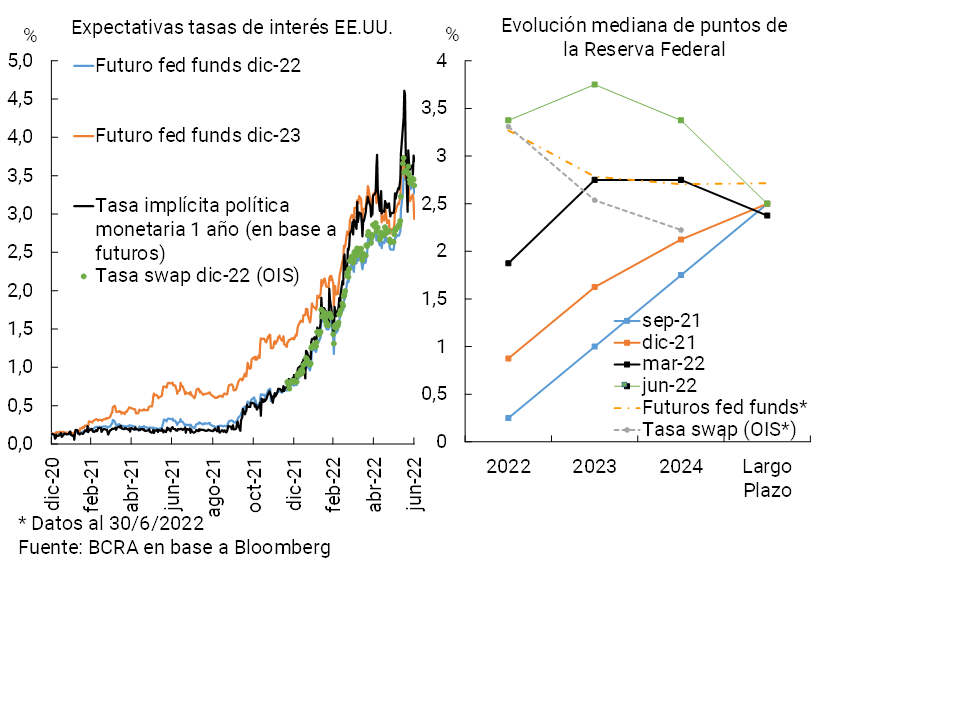
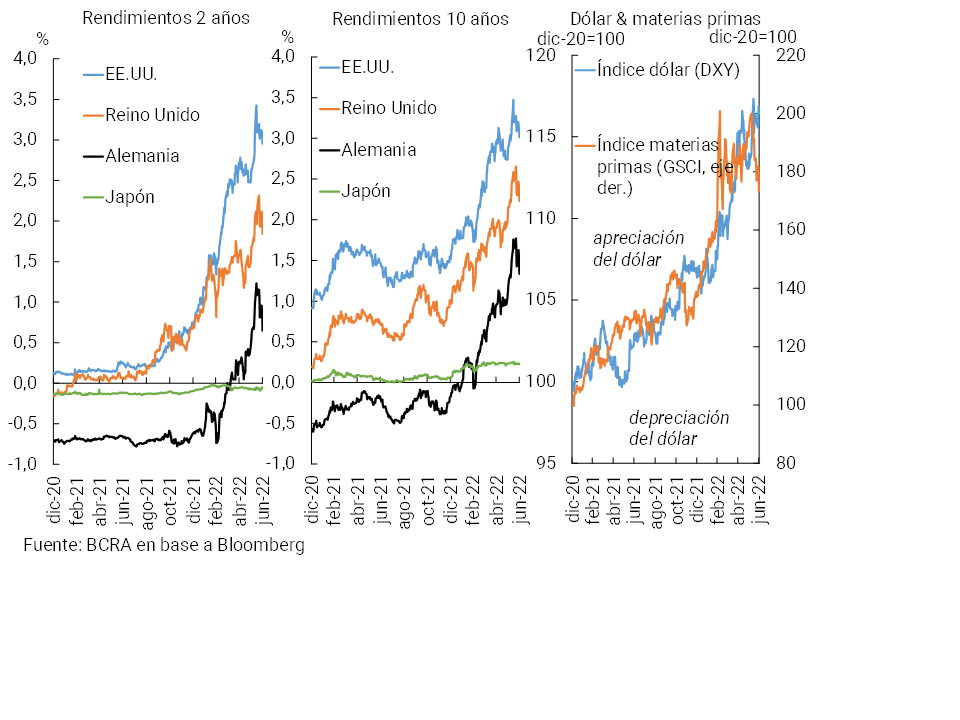
In the specific case of the US, the Federal Reserve began a cycle of interest rate hikes in March (with additional hikes in May and June), which was added to the end of net purchases of debt instruments2. There was then an increase in the yields of US Treasury instruments (more marked for two-year instruments, with a greater correlation with monetary policy rates), accompanying different indicators – such as the expectations implied in the derivatives markets and the forecasts of participants of the Federal Reserve’s FOMC – which were evidencing expectations of more aggressive interest rate hikes in 2022-2023 (see Chart 1)3. With greater volatility and expectations of increasingly high interest rates, the dollar continued to appreciate against the rest of the major currencies, accumulating a revaluation of 9% so far this year (see Chart 2). With regard to assets of greater relative risk, which had been the subject of concern given the existence of segments with historically high prices, the stock indices of the US and Europe accumulate losses in dollars in a range of 10-25% so far in 2022, while the main cryptocurrencies accumulate sharp falls (in a range of 60-75%).
Graph 1 | Implied Interest Rate Expectations in Derivatives Markets and Federal Reserve FOMC Member Projections
Graph 2 | Yields on developed country debt securities, the dollar and commodities
These factors influence a more challenging context for emerging economies, given that there are still important sources of vulnerabilities at the global level that could eventually contribute to the amplification of situations of tension in the face of an external shock (see Box 1). An example is the growing global weighting of investment funds, with a bias towards procyclical behaviour and very sensitive to changes in the international context. In the face of an external shock, the performance of these funds could amplify the impact on capital flows and significantly increase pressures on foreign exchange markets in emerging economies4.
Box 1 / Main vulnerabilities present in the global economy
As mentioned in previous editions of this IEF, in a context of abundant liquidity and low interest rates in international markets, a series of vulnerabilities have crystallized in recent years. This is challenging for financial stability globally, as these vulnerabilities mean that in an environment of perceived greater risk, abrupt negative dynamics can be unleashed across different markets and jurisdictions. The main vulnerabilities include:
• Over-appreciation in different market segments, including instruments of greater relative risk (stocks, cryptocurrencies or emerging market instruments considered as an asset class), more susceptible to sudden price corrections, for example, due to abrupt changes in portfolio flows). This situation was partly corrected (in some segments) by the price declines observed in recent months.
• Sustained global trend towards an increasing debt burden of both the public and private sectors. Greater risk of repayment perceived in a context still marked by the COVID-19 shock (with more limited fiscal space, more limited corporate profitability) and greater vulnerability in the face of a context of interest rate hikes. In the case of emerging economies, there is also the impact of greater fluctuations in the value of currencies, given the existence of relevant currency mismatches in many countries. Given the greater leverage observed at the global level (among both developed and emerging economies), efforts are being made at the international level to monitor the evolution of the corporate sector more closely.
• Growth of non-bank financial intermediation or NBFIs (led by investment funds) worldwide. In addition to increasing the interconnection between market segments and jurisdictions, the NBFI exhibits a pro-cyclical behavior, depending on the use of passive strategies, liquidity mismatches and, in the specific case of hedge funds, the presence of leverage. This implies that it may end up intensifying the effects of situations of tension, with a particular impact on emerging economies, with possible negative effects on both the dollar debt markets and the foreign exchange markets and the local currency debt markets (particularly in those markets that are relatively less liquid and deep). Given this issue, policies implemented to improve the resilience of NBFI are being reviewed at the global level (e.g. by revising recommendations to mitigate liquidity mismatches in open-ended investment funds) and move towards a systemic risk approach for this sector5.
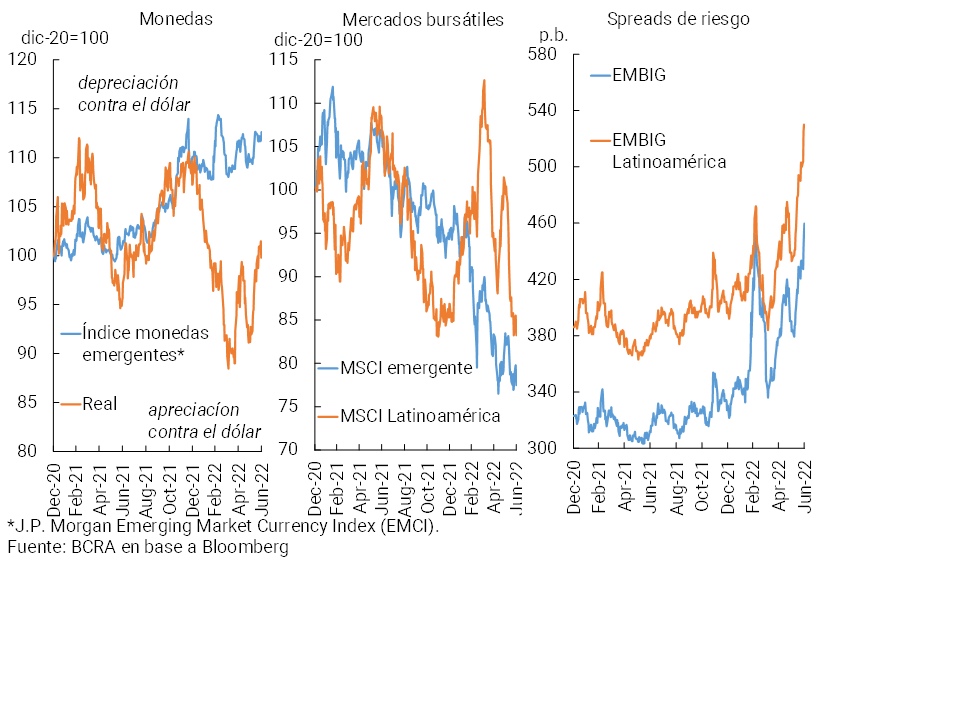
In 2022, the currencies of emerging economies tended to depreciate against the dollar on average, although with heterogeneous behaviors at the individual level and by region (depending on the link of each economy with commodities and the evolution of the monetary policy rate itself)6. The depreciation of emerging currencies was most marked in early March, between late April and mid-May, and in the second half of June (see Chart 3), mostly in line with periods of stronger outflows from investment funds specializing in emerging markets (although net inflows to this type of fund have accumulated since the last IEF). In this context, emerging market stocks measured in dollars have accumulated a decline so far this year according to the MSCI index (19%), although for Latin America it is much more limited (4%). In the sovereign debt market, yields in dollars tended to increase, accompanying the increases observed for US Treasury instruments. However, the EMBI margin, which accumulates an expansion of about 75 bps in 2022 for the aggregate of emerging economies, remains close to its historical average. In international markets, governments and companies in emerging economies continued to issue debt during the first 5 months of the year, although for amounts almost 40% below the record records observed on average, for the same period, in the last 5 years.
Graph 3 | Emerging Economy Assets – Selected Indicators
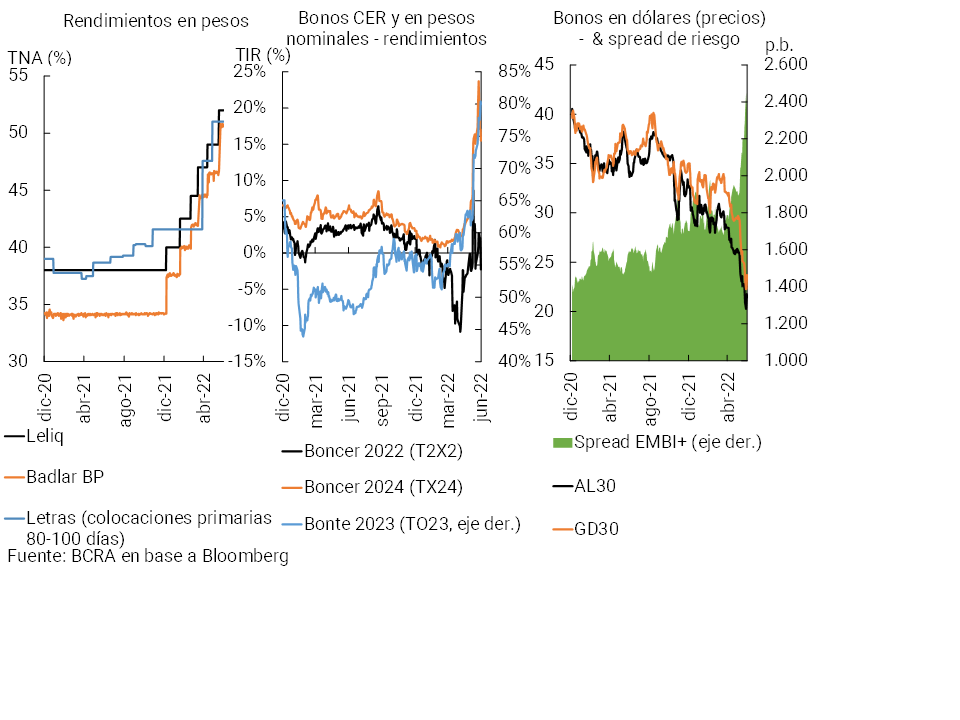
At the local level, economic activity continued to improve since the last edition of the IEF. This recovery process is expected to continue in the coming months (led by the sectors that were most affected by the pandemic at the time, such as the services sector), although partly conditioned by factors such as the impact of drought conditions during the summer and less favourable external conditions. The agreement reached with the IMF would also contribute to the consolidation of a framework of macroeconomic certainty, based on its expected effect on different variables, including, among others, the accumulation of international reserves, the reduction of monetary assistance to the Treasury in terms of GDP, and the gradual impact on the primary deficit. The EMBI margin for Argentina, which before the aforementioned agreement was confirmed reached levels close to 2,000 bp, reached levels below 1,700 bps in April. 7, although it subsequently rose again (to over 2,400 bps at the end of June) in a context of greater uncertainty regarding the possibility of stagflation in developed economies and expectations of a more restrictive bias in its monetary policies.
Progress in the process of normalizing the activities of the productive sectors allowed the BCRA to continue with its credit policy focused on the most backward sectors and on promoting productive development (see Box 6). In a more dynamic macroeconomic environment, coupled with higher international commodity prices and unfavorable weather conditions, inflation rose significantly. Faced with this scenario, and in line with the objective of beginning to leave behind the period of exceptional policies generated by the pandemic, the BCRA increased the monetary policy interest rate six times since January in order to set the path of the policy interest rate towards positive real returns on investments in local currency and avoid pressures in the foreign exchange market. without affecting the economic recovery underway (see June Monetary Policy Report). On the other hand, the rate of depreciation gradually readjusted to levels more compatible with the domestic inflation rate. Certain relaxations were also introduced in the regulations for the operation of negotiable securities with settlement in foreign currency.
The Treasury continued to manage to refinance debt maturities in the local market (ratio of placements against maturities on average above 100% so far this year), in addition to implementing several asset conversion operations. In this sense, the policy of rebuilding and promoting greater development of the local marketis maintained 8. The placements were mostly explained by bills – LEDES in nominal pesos and LECER adjustable for inflation – and bonds that adjust for CER (BONCER). Instruments with CERs were used to extend placement terms. Accompanying the rise in other reference rates in pesos, in the primary market the yields of Treasury debt were increasing for fixed-rate instruments. In the secondary market, yields also tended to rise, both for fixed-rate instruments and for instruments adjusted for CER (see Chart 4). Yield increases were strongest in June. To avoid excessive and unjustified price volatility that could compromise financial stability, the BCRA then intervened in the secondary market of public securities with the aim of recomposing the curve in pesos.
Figure 4 | Interest rates and fixed income instruments in Argentina
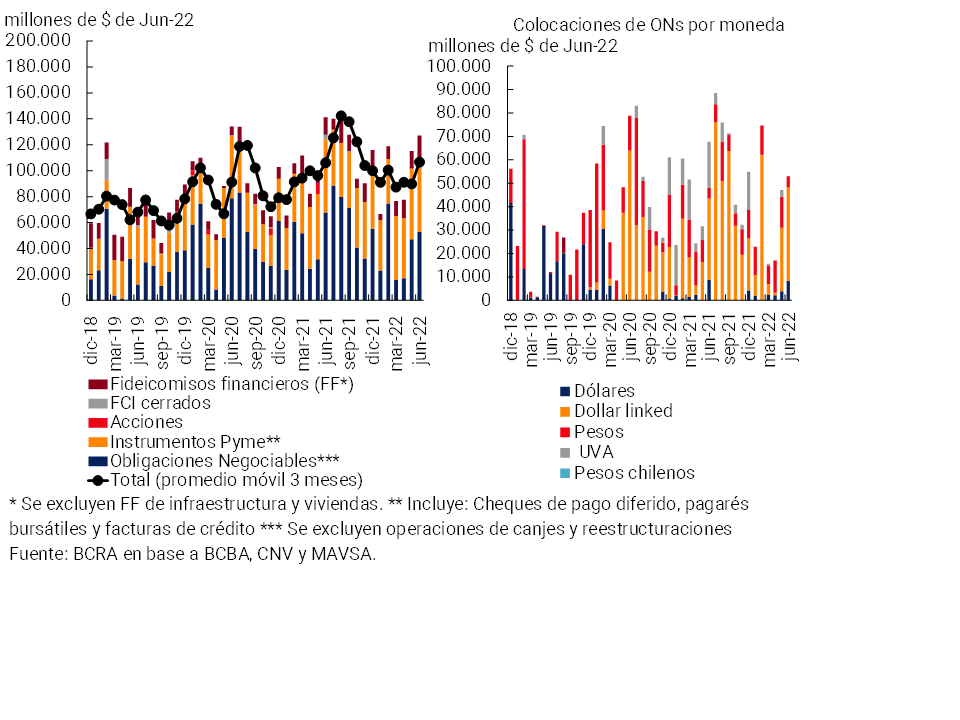
With respect to financing to the private sector through the local market during the first half of 2022 and considering the different instruments (negotiable obligations or ON, financial trusts, deferred payment checks, shares, promissory notes and others), the total amounts presented a practically neutral variation in year-on-year terms (see Chart 5)9. The local market continues to be limited compared to that of other emerging economies, with room to continue deepening its development. Among the non-bonded segments, the dollar-linked segment continues to stand out, which maintained its dynamism in year-on-year terms, while placements in pesos fell sharply in the case of placements in UVA. A large part of the amounts placed in dollar-linked ON were made by the energy and oil and gas sectors. Dollar-linked transactions have longer maturities than placements in nominal pesos10. In terms of cost, while the placement yields of dollar-linked bonds fell slightly, for bonds in pesos they tended to rise, keeping pace with the evolution of the different reference rates. With respect to sustainable finance, so far this year 7 companies have carried out 9 placements framed in the “Guidelines for the issuance of green, social and sustainable Negotiable Securities in Argentina” of the CNV11. Finally, in recent months there were a few ON operations in dollars linked to restructuring processes (Com. “A” 7106)12, after the dynamism observed during the fourth quarter of 2020 and the first quarter of 2021. These restructurings have allowed for a more efficient use of available international reserves and avoided a generalized default crisis13. The period proposed by Com. “A”7106 to restructure external liabilities was extended until the end of 2022.
Graph 5 | Financing the private sector through the local capital market
2. Main strengths of the financial system in the face of the risks faced
Since the last edition of the IEF, the financial system has continued to operate without disruption and to perform its functions of intermediation and provision of payment services, while at the same time being able to preserve the aspects that are characteristic of it in terms of strength. In particular, low exposures to the risks faced and relatively high liquidity and solvency coverage remained moderate.
In addition, certain structural features of the set of institutions that reinforce the perception of facing moderate systemic risk are preserved: limited depth of credit in the economy, fundamentally traditional financial intermediation – with low relevance of complex operations and a short-term bias – and reduced interconnection between entities in the sector. In addition, the financial system is operating within a framework of regulation and supervision that includes the best practices recommended at the international level, adapting them to the local reality.
Throughout this section, the main features of the strength of the local financial system in the face of an eventual materialization of risks are reviewed. The following sections will address in greater detail these and other aspects that provide robustness to the sector when assessing potential vulnerabilities from the perspective of macroprudential monitoring.
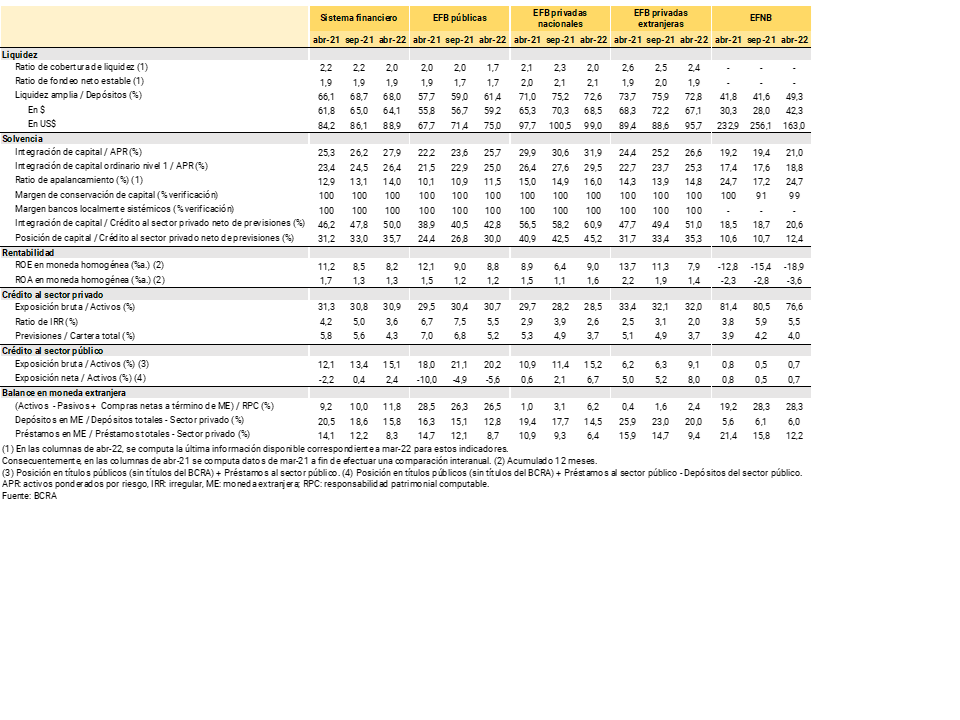
i. High relative levels of liquidity. The financial system maintains relatively high liquidity coverage when compared to its own records in recent years, as well as to the average of the values currently observed in the region’s financial systems (see Table 1). In April 2022, the14th broad sense liquidity of all financial institutions stood at 68% of deposits (64.1% in the segment in pesos and 88.9% in foreign currency). Although this figure was slightly lower than that observed at the time of publication of the previous IEF (-0.8 p.p.), it exceeded that verified in a year-on-year comparison (+1.9 p.p.), and far above the average of the last 10 years (+17.4 p.p.).
Table 1 | Main indicators of the soundness of the financial system
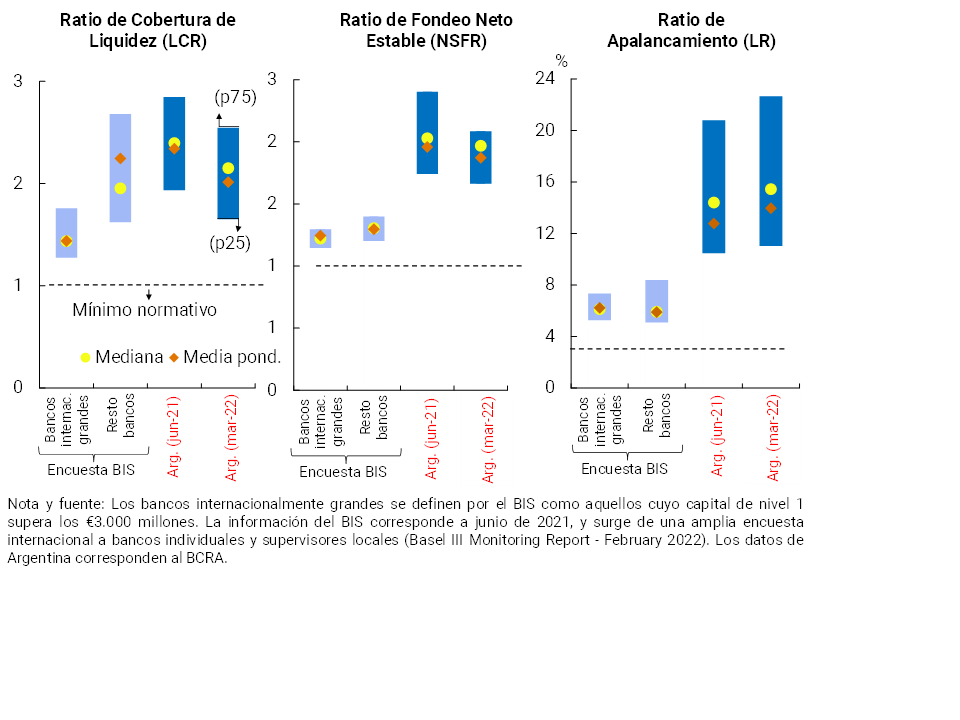
The liquidity indicators arising from the recommendations of the Basel Committee (BCBS) continued to exceed the regulatory minimums for all local entities required to verify them (Group A)15. The local level of the Liquidity Coverage Ratio (LCR)16 was in line with that of a sample of medium-sized banks in othercountries17 (and is higher than that of large banks), while the local Net Stable Funding Ratio (NSFR)18 remained relatively high when compared to what was observed in other economies (see Chart 6).
Graph 6 |Basel III Ratios – Local Financial System in Perspective
ii. Relatively high levels of solvency. Regulatory capital integration (RPC) for the aggregate financial system accounted for 27.9% of risk-weighted assets (RWA) in April 2022, up from the previous IEF and on a year-on-year basis. The year-on-year increase in the indicator (+2.6 p.p.) was due to both the growth in real terms of the PRC (+5.1% YoY) and the decrease in real terms of RWAs (-4.7% YoY), both of which were similar in size. The excess regulatory capital (above the minimum required) of all entities increased to 248% of the regulatory requirement. In addition, local financial institutions maintain extensive complementary verification of the additional capital margins established in local regulations.
To complement the minimum capital requirements, institutions should also verify a minimum level for the leverage ratio (as defined by the Basel Committee). This indicator stood at 14% over the beginning of 2022, comfortably exceeding the minimum required of 3% and the records of other economies (see Chart 6).
In a context of record solvency levels, the BCRA adopted changes in prudential rules allowing the distribution of up to 20% of distributable results in 12 monthly installments.
iii. Low relative importance of foreign currency items in the aggregate balance sheet of the sector and limited differential between assets and liabilities in this denomination. The total foreign currency assets of the financial system accounted for 15.2% of total assets in April 2022, decreasing compared to the last IEF and in a year-on-year comparison (being values lower than the average of the last 10 years, of 18.5%). Within assets, the balance of credit to the private sector in foreign currency (mainly granted to companies whose revenues are correlated with the exchange rate) accounted for only 8.3% of total credit to the private sector in April 2022, also falling with respect to the last IEF and year-on-year. For its part, at the beginning of the second quarter, the balance of total liabilities in foreign currency represented 13.4% of total funding (liabilities and equity), falling compared to last September and compared to April 2021 (moderate levels when compared to the average of the last 10 years, of 16.3%). Within funding, deposits in foreign currency totaled 15.8% of private sector deposits, below the level of the previous IEF and the one observed a year ago. Considering all assets and liabilities in foreign currency, as well as forward purchase and sale transactions of foreign currency classified off-balance sheet, the spread in this denomination for the financial system was equivalent to 11.8% of regulatory capital in April 2022, remaining at a range of values limited in the last year within the framework of the macroprudential measures in force.
iv. Moderate exposure to the private sector, with a decrease in the irregularity ratio to levels below pre-pandemic levels. The financial system’s exposure to the private sector stood at 30.9% of total assets in April 2022, slightly above the September 2021 record, although 0.4 p.p. below the April 2021 level. These levels of exposure are moderate when compared to the local average of the last 10 years (42.7% for the group of entities) and with the median of a sample of countries in the region (63% for the latest available information).
In this context, the irregularity ratio of credit to the private sector, which is less and less influenced by the effect of financial relief measures, reached 3.6% in April, lower than the level recorded prior to the beginning of the pandemic (this indicator reached 6.2% in February 2020 and 4.9% for the 12-month average up to that point).
Given the strengths of the Argentine financial system, it is expected that it will continue to show resilience in the event of adverse scenarios, which should be very extreme (low-probability events) to impact financial stability conditions. In this regard, as part of the stability analysis, the main potential risk factors (exogenous to the financial system) to be considered in the coming months are explained below.
Risk of further deterioration in the external context, given the uncertainty factors and existing vulnerabilities. Although an environment of growth in economic activity continues to be observed globally, and financial markets still show relatively favorable conditions in historical terms, the outlook is increasingly uncertain and subject to increasing volatility (as observed in June). The investor base remains focused on the processes of monetary policy normalization in developed economies and their impact on global growth. The Russia-Ukraine conflict also remains ongoing, with the potential to continue to affect commodity prices and help with the persistence of supply chain bottlenecks. Despite the considerable progress made in the normalization process, the pandemic context remains in force, with the possibility of complications in the face of new strains, although with high levels of vaccination. These uncertainty factors could have a stronger impact on the level of activity at the global and regional levels (with effects on international trade) or be combined with existing vulnerabilities at the global level (relatively high prices in certain market segments, greater gravitation of investment funds – with procyclical dynamics – increase in the debt burden of governments and companies – and greater implicit risk). to trigger new episodes of sudden revaluation of perceived risk that imply abrupt changes in financial conditions and capital flows. Thus, different types of shocks will have a greater impact on the commercial channel (with a more direct effect on the level of local activity) or on the financial channel (with a more direct effect on the exchange rate and interest rates), in turn affecting the local context in which financial intermediation is carried out and the credit risk faced by the financial system. Given the characteristics of the domestic financial system, and the existence of restrictions in the foreign exchange market, it is estimated that these shocks should be abrupt and of very high intensity to condition local financial stability significantly.
Risk of a lower-than-expected recovery of the local economy or greater volatility in the financial market. At the local level, the economic outlook remains positive, due to a lower incidence of COVID (which would allow an improvement in sectors that have not yet recovered to pre-pandemic levels, such as services), the achievement of an agreement with the IMF (enabling a reduction in perceived risk) and the maintenance of policies aimed at sustainable growth and the promotion of financial stability. However, risks linked to the evolution of the pandemic persist, in addition to idiosyncratic factors such as the effect of low rainfall scenarios on crops and exports, in addition to the local impact of the conflict in Ukraine (for example, generating potential tensions on the energy market or due to its impact on inflationary dynamics). This could eventually condition both the evolution of economic activity and the behaviour of the foreign exchange market (as observed in July) and of financial markets in general, with an impact – to the extent that they are major shocks – on the environment in which financial intermediation is carried out (demand and supply of credit, evolution of deposits) and/or on the credit risk faced by the banking sector.
Increasing operational risk, due to the increased reliance on technology. After growing during the pandemic, the use of teleworking and digital channels for financial transactions is expected to maintain its dynamism, while other technological innovations are being added. Although so far there have been no events of this nature with systemic incidences in Argentina, the rise of digital modalities implies by definition a greater exposure to operational risks, including disruptions in operations as well as fraud and cyber-attacks. In this regard, the BCRA continues to make continuous efforts in the areas of disclosure, prevention, and supervision (see Box 2).
Box 2 / BCRA’s Progress in Fraud Risk Management
The growth in the quantity and diversity of digital financial services arising from the evolution of technology and innovation – a process accelerated by the pandemic scenario – added to the promotion of new digital payment tools designed by the Central Bank (in particular with transfers), brought with them a wide range of benefits for users. with a consequent increase in risk exposure.
In that order. the document “BIS CPMI Fast payments – Enhancing the speed and availability of retail payments”19, points out that these new operations are presented as an alternative to cash, due to the focus they place on immediacy and interoperability, facilitating the flow of transactions between consumers/issuers and beneficiaries/receivers from any provider, interconnecting new and numerous participants to the payment system. However, this greater number of participants and their interconnection and the new ease of use supported by new technologies, although they facilitate the implementation of new services and generate benefits, also produce new risks to consider.
As mentioned in this document, there are risks that must be taken into account such as fraud and security risk. For the latter, it recommends that actions be implemented to address the cyber resilience of the business and critical services, that is, to promote the ability of organizations to recover quickly in the event of a cyber incident, maintaining redundancy and continuity. In relation to the risk of fraud, it highlights that immediate payment systems present challenges to traditional fraud prevention given the number of participants involved in the processing of the transaction, added to the immediacy and irrevocable nature of these payments. In this sense, it is recommended to define dispute and error resolution processes, establish clear responsibilities among participants, improve monitoring capacities, among others.
Local financial institutions have been developing their operations within a framework of minimum security measures that they must implement. There, it is worth highlighting the relevance of the analysis of parameters extracted from the systems that allow the identification of suspicious patterns of customer behavior that help prevent fraud incidents, among others.
This monitoring process is part of a comprehensive security scheme that financial institutions must have today for their electronic channels that is made up of 5 interrelated security processes: Awareness and Training, access control, Integrity and Registration, monitoring and control of events and incident management
In relation to customer protection, a financial institution should implement the aforementioned processes in order to:
• Keep customers informed and trained, through an awareness program with content according to the risks of the situation.
• Require customer identification and authentication for the use of electronic channels.
• Have records that allow determining the traceability of the activities carried out by the client.
• Have transactional monitoring mechanisms that can warn of suspicious situations based on characteristics of the customer’s profile and transactional pattern, verifying with the customer through alternative channels, in the event of certain alarms or alerts that occur.
• Have the capabilities to deal with detected incidents.
In order to strengthen actions against cyberattacks and improve cybersecurity and cyber resilience levels, in April 2021 the BCRA issued Com.”A” 7266 on “Guidelines for Response and Recovery in the event of cyber incidents”. This regulation covers Financial Institutions, and extends to Financial Market Infrastructures and Payment Service Providers and payment accounts.
In relation to the local transfer payment system, it is made up of various participants: initiating Payment Service Providers, payment service providers that offer payment accounts, digital wallets, administrators of transfer schemes, financial institutions, customers, among others. Given the diverse technological infrastructure that supports the scheme and the large interconnection resulting from the number of participants, frauds could occur in any member of the aforementioned payment chain. Therefore, it was necessary to require comprehensive fraud prevention, so that all participants in the scheme could provide information that would serve to monitor transactions and the scheme from start to finish.
Therefore, to mitigate the risks of fraud related to payment transactions through transfers (Transfers 3.020), in the first quarter of 2022 the BCRA issued a new regulation21. There, a set of guidelines was defined to reduce the potential occurrence of fraud and/or ignorance of payments and transfers, events that can occur in this type of operation, requiring that:
• The different instant transfer schemes and their participants implement technical and organizational measures for fraud management, as well as circuits, resolution procedures and information available to all members;
• Customer complaints are handled by the provider of the affected account;
• The schemes define internally with their participants and among them roles and responsibilities for fraud management, documenting the procedures to be followed in the event of complaints;
• The schemes and their participants define the information and infrastructure that will allow them to record the transactions and follow their traceability22 from end to end, with the data they deem sufficient, accurate and complete so that all participants can analyze the circuit that followed an operation and thus detect where the fraud may have originated;
• Transfer schemes exchange information on vulnerabilities and threats that affect their processes and infrastructures, contributing to the prevention of the ecosystem.
This regulation was extended to Payment Service Providers that provide digital wallet services, who must arbitrate the mechanisms to mitigate fraud23, thus covering all participants of payment systems with transfers, and their interconnections. This will allow, among others, to improve the information bases necessary to detect fraud when more than one actor is involved in a payment scheme, and consequently to focus and attend more efficiently to user complaints.
The BCRA continues to work on measures aimed at comprehensively addressing and preventing fraud risks that may affect the normal functioning of the financial system, in awareness campaigns for the development of a resilient financial system.
In addition to these risks, other factors can be mentioned that, it is considered, could be relevant in the medium and long term. On the one hand, the risks involved in the rapid growth of crypto-asset operations globally (although they are not yet in widespread use). This includes, in addition to its high volatility – which implies risks for both users and the financial system in aggregate terms – the challenges they generate in terms of monetary and exchange rate policy for emerging economies with less developed markets. In this regard, in May the BCRA determined that financial institutions will not be able to carry out or facilitate their customers to carry out operations with digital assets. Another front of risks to be taken into account, with greater monitoring at the international level, is those linked to climate change (see Box 3). Finally, beyond the normalization of the policies implemented during the pandemic (in particular with regard to the monetary policies of developed economies), in a post-pandemic scenario it remains to be seen what will be the structural scope of various changes observed in the framework of the COVID shock (including modifications in business models with differential impact between sectors, countries and regions).
Box 3 / Environmental, Social and Governance Factors: Actions of Financial Regulators in Latin America
In the last decade, there has been an awareness that Environmental, Social and Governance (ESG) aspects, and especially those related to climate change, must begin to be considered as emerging sources of financial risk. This is so given that they have the potential to eventually destabilize the provision of financial services at the level of an individual entity and even in the aggregate of the financial system24
Within the framework of the Paris Agreement and the United Nations 2030 Agenda, progress was made at the international level in addressing the effects of climate change and its interrelations with the financial system, in order to promote sustainable economic development at the global level. International Organizations25 and financial regulators have begun to focus their efforts on designing strategies that promote better management of the financial risks associated with ESG factors and in this way, among other objectives, achieve a transition to a low-carbon economy that is resilient to the impacts of climate change.
Latin America is no stranger to this trend and some of its financial regulators have begun to adopt different policy actions related to these risks, within the framework of their respective national strategies linked to sustainable development. In general terms, these strategies move around three axes: generation of information, development of green instruments and strengthening of understanding and capacities on this subject. Most Latin American banking regulators are at an early stage indicating to the banks in their jurisdiction their expectations about managing these risks. The tasks of these regulators consist of: (i) analyzing the state of affairs, (ii) improving their knowledge on the subject to generate the necessary capacities to evaluate and design the best possible policy, and (iii) designing future plans taking into account the best practices that emerge at the international level and the voluntary public-private agreements that usually precede other actions.
Within a second group of regulators are those that have already begun to require banks to incorporate the risk associated with climate change for large loans. Finally, Brazil is the jurisdiction that has fully incorporated the regulatory treatment of climate change risk. These are regulations that took into account a concept of proportionality for their design – with certain criteria of segmentation, materiality and under a gradual implementation.
The development of the capacities of the different market actors, i.e. regulators, government, investors and companies, as well as potential issuers of “green” products, is one of the points to advance in sustainable finance. In turn, the developments carried out by other central banks/supervisors in the region are of utmost relevance to advance in harmonized approaches.
A more detailed analysis of financial stability will be developed in the next section. To this end, the main sources of vulnerability identified for the local financial system will be considered, given their exposure to the aforementioned risk factors. These sources of vulnerability will be analyzed in contrast to the strengths of the financial system itself, with the aim of evaluating the present conditions to face the eventual materialization of the risk factors already indicated.
3. Sources of vulnerability and specific resilience factors of the financial system
3.1 Equity exposure to credit risk
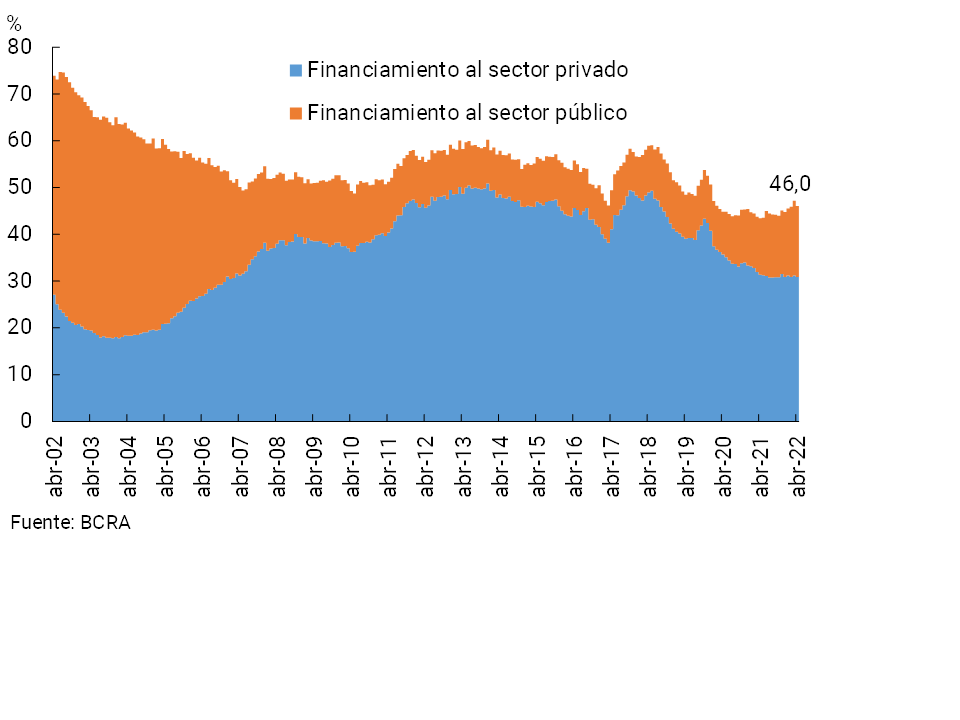
In April 2022, the financial system’s gross exposure to credit, both to the private sector and to the public sector26, was moderate from a historical perspective, verifying an increase compared to 2021 records. Total financing reached 46% of aggregate financial system assets, 1.8 p.p. and 2.6 p.p. above the level of September and April 2021, respectively (see Chart 7). However, the level of this indicator remained below the average of the last 20 years (55%).
Figure 7 | Gross exposure of the financial system to the private and public sectors
The recent increase in the weighting of credit in the assets of the financial system was mainly explained by financing to the public sector. The exposure of all entities to the public sector totaled 15.1% of total assets in April, 1.8 p.p. more than 7 months ago (previous IEF) and 3 p.p. y.o.y. It should be considered that this level of exposure is below the average of the last 20 years (approximately 18%). When taking into account public sector deposits, in April the financial system maintained a net credit position (net deposit financing) vis-à-vis this sector, in the order of 2.4% of its total assets.
The financial system’s exposure to the private sector remained at moderate levels (see Chart 8). The balance of credit to the private sector stood at 30.9% of the total assets of all financial institutions, slightly above the September 2021 figure, although 0.4 p.p. below the level of April 2021 (the average of the last 20 years reaches 37%)27. The slight increase in the exposure of the financial system to the private sector compared to the previous IEF was driven by the segment in pesos (it accounted for 28.3 p.p. of assets, 1.3 p.p. more than in September 2021).
Figure 8 | Credit to the private sector as a percentage of assets
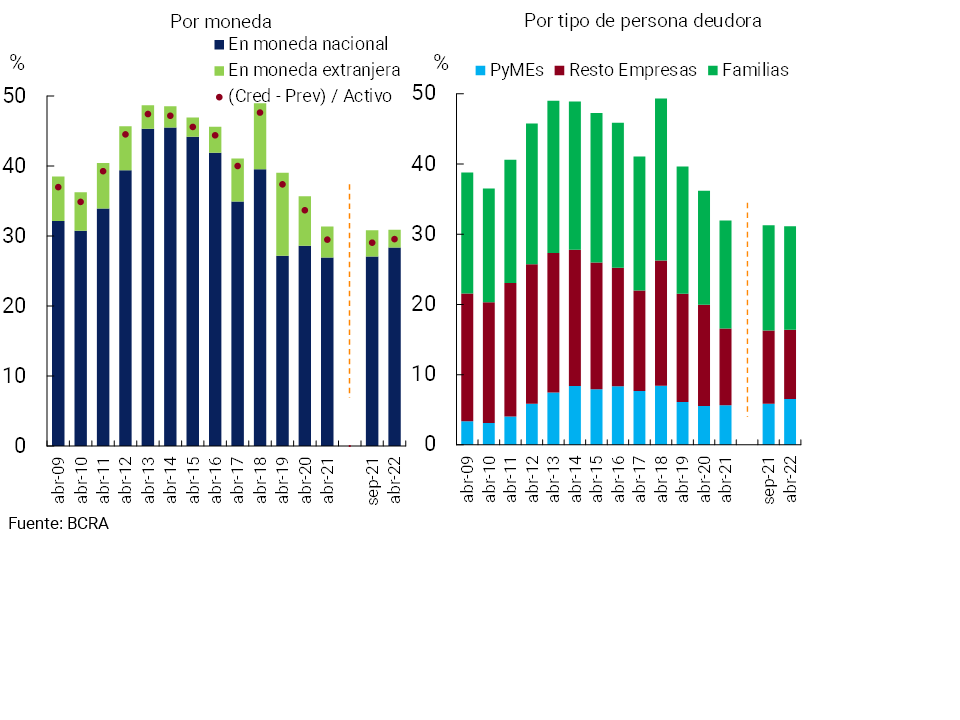
In terms of the composition of the financial system’s exposure to the private sector by type of debtor, as of April 2022, 47.4% corresponded to loans to households and 52.6% to loans to companies – the one aimed at SMEs with relatively more dynamism at the margin.
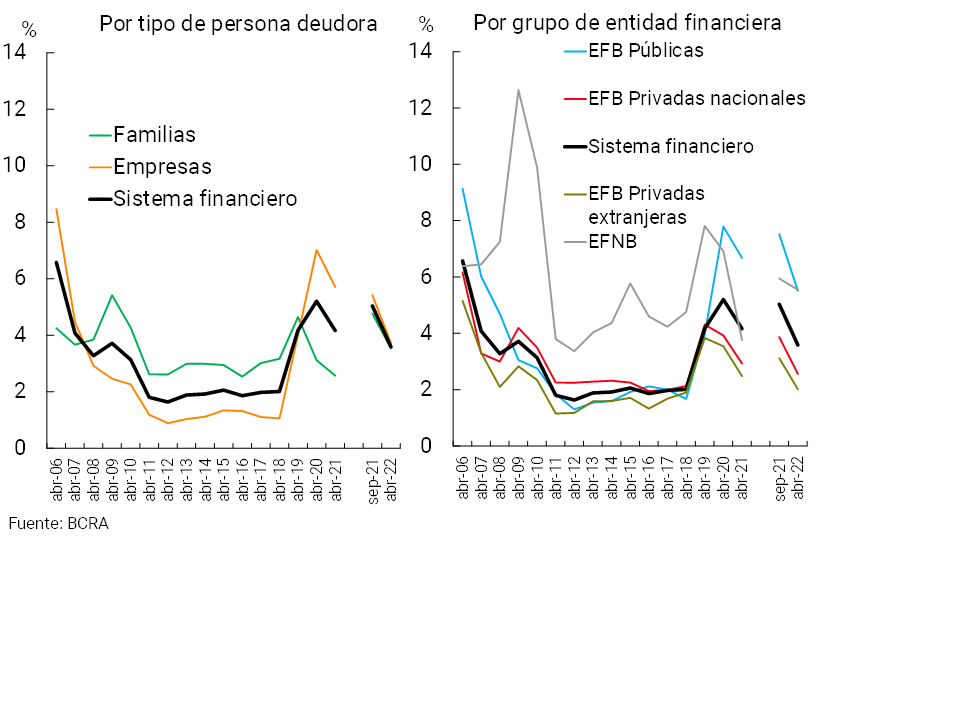
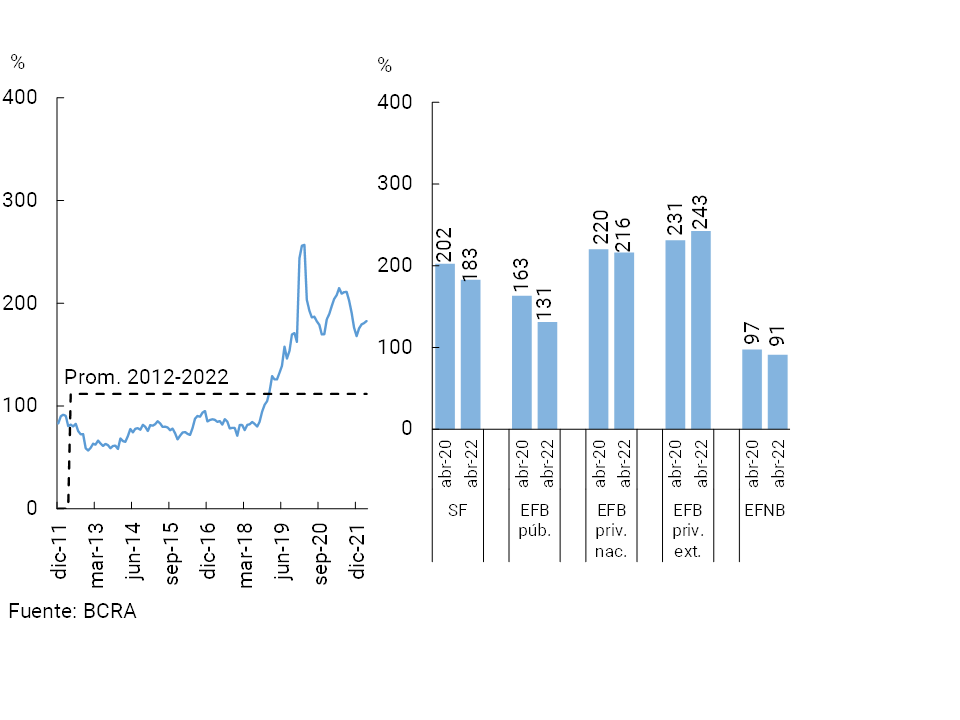
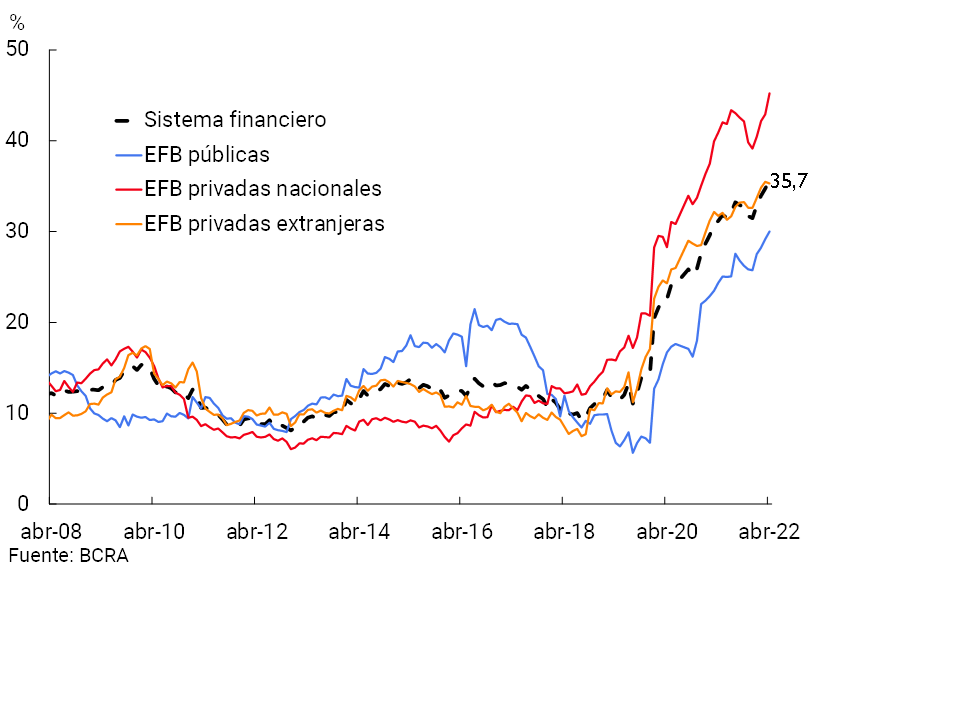
In relation to the degree of materialization of credit risk, the non-compliance ratio of financing to the private sector for institutions as a whole totaled 3.6% in April 2022, 1.5 p.p. less than in the previous IEF28 and 0.6 p.p. below April 2021. The regulatory modifications opportunely implemented in the context of the pandemic that alleviated the financial burden of debtors practically no longer have an impact on this indicator, allowing a more accurate comparison with pre-pandemic levels. The decrease in the irregularity ratio compared to September 2021 was verified in both the segment of credit to households and companies, and in all groups of financial institutions (see Chart 9).
Figure 9 | Irregularity ratio
Equity exposure to household credit risk
Credit to households accounted for almost 15% of the financial system’s assets in April 2022, slightly lower than the previous IEF record (-0.2 p.p.) and in a year-on-year comparison (-0.6 p.p.). As of April 2022, it is estimated that 64% of the financial system’s exposure to households was made up of loans whose debtor had a job in a dependent relationship (a ratio that increased approximately 4 p.p. compared to the situation 2 years ago and 3.6 p.p. compared to the average of the last 8 years).
Non-performing loans to households stood at 3.5% of this portfolio in April, 1.2 p.p. below the level of September 2021 (+1 p.p. y.o.y.), mainly due to the performance in the margin of consumer loans (personal and credit cards). The current levels of irregularity of credit to households are lower than those recorded prior to the beginning of the pandemic (-0.8 p.p. compared to the 6-month average to February 2020). Within the household credit segment, there was a low dispersion in the irregularity ratio between geographical areas of the country, being slightly higher than the weighted average in the Cuyo region and slightly lower in the Central zone. In turn, the fall in the irregularity ratio of credit to households compared to the level of September 2021 was relatively greater in this Central area (-1.4 p.p.), while it was more moderate in the NOA region (-0.6 p.p.).
Equity exposure to corporate credit risk
Financing to companies represented just over 16% of the assets of the financial system in April 2022, without significant changes compared to the previous IEF and in a year-on-year comparison. Within this segment, financing to SMEs (see Chart 8 and Box 4) represented 6.5% of the assets of the group of entities, evidencing an expansion in margin (+0.7 p.p. and +0.9 p.p. compared to September 2021 and a year ago, respectively), to the detriment of the rest, mainly associated with large companies.
Box 4 / Bank financing to SMEs: recent increase, exposure on the balance sheet of the financial system and hedging
Within the framework of the credit policy promoted by the BCRA since the end of 2019 that contributes to focusing resources on the promotion of productive development, in the last two years bank credit for SMEs29 grew significantly30. The real balance of financing in national currency for this sector expanded 26.4% year-on-year as of April of this year, more than doubling when considering the performance since the beginning of 202031.
Based on this marked dynamism, at the beginning of the second quarter of 2022, credit in national currency to SMEs reached 5.9% of the total assets of the financial system, 1.3 p.p. and 2 p.p. above the levels evidenced one and two years ago, respectively, an increase that amounts to 1.9 p.p. compared to the average of the last 20 years (see Graph R.4.1). This performance occurred in a context of gradual reduction in the exposure of all financial institutions to the private sector, which in turn caused credit in pesos to SMEs to reach a peak of participation close to 20% in total credit to the private sector at the beginning of 2022. Despite the increase observed in the last two years, when compared with other economies, it can be seen that the exposure of the local financial system to this segment of debtors is slightly below the average of the countries of the region (see Chart R.4.1)32.
Figure R.4.1 | Credit balance to SMEs
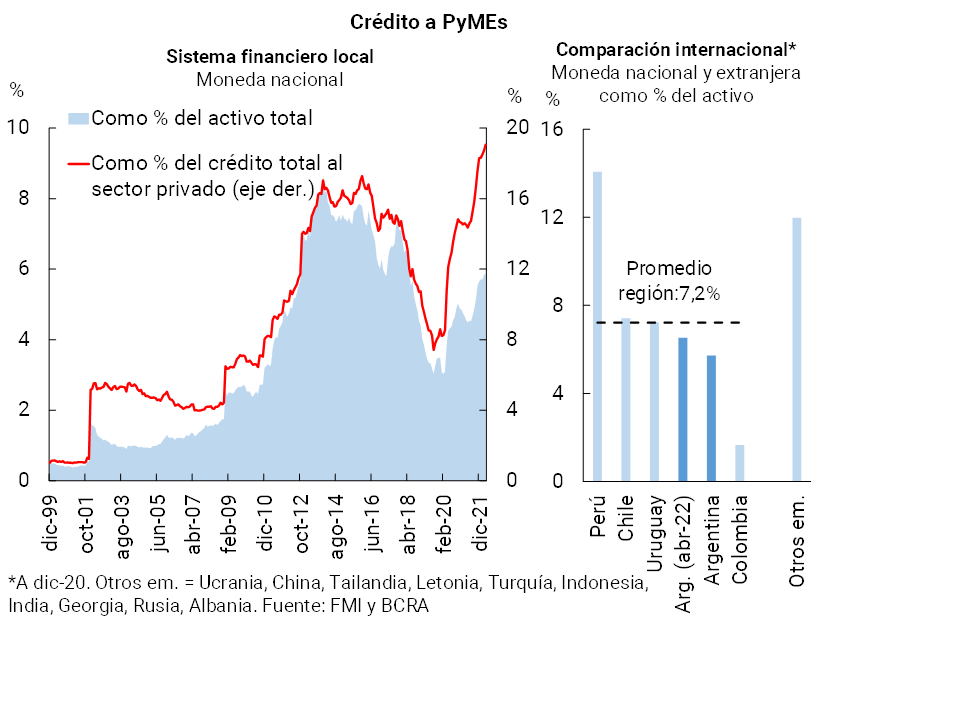
Figure R.4.2 | Credit balance to SMEs in pesos as a % of assets – Distribution among financial institutions
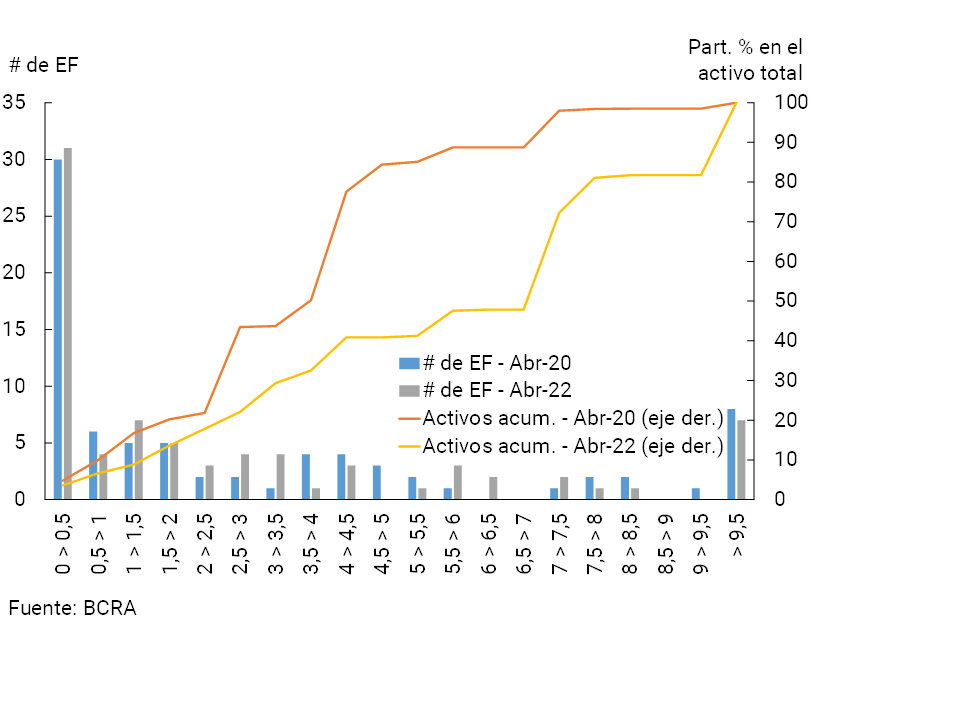
The increase in the exposure of the balance sheet of the financial system to SME credit in the last two years occurred together with an increase in the concentration indicators of the offering entities. In total, 27 of the 50 SME credit providers showed an increase in exposure to this segment in assets in the last two years (see Figure R. 4.2), while 23 reduced it. With regard to the indicators of concentration of supply, as of April 2022 the main 5 entities accounted for 72% of the balance of credit to SMEs, 11 p.p. more than in April 202033. It should be considered that financing to SMEs contributes to the diversification of the credit portfolio of entities, tempering to a certain extent their exposure to credit risk. This occurs in a context in which this type of debtor would present relatively lower levels of irregularity.
Figure R.4.3 | Capital position as % of credit to SMEs in local currency
To measure the relative size of the hedges constituted by the financial system in the face of possible scenarios of materialization of the counterparty risk of this credit segment, the relationship between the surplus regulatory capital and the balance of financing to SMEs can be considered. This ratio, although it fell in the last two years in the context of the strong dynamism of SME credit, remained in a range of high values when compared to the average of recent years: at the systemic level, this ratio rose to 183% in April 2022, 71 p.p. above the average of the last 10 years (see Graph R.4.3)34.
The non-performing ratio of loans to companies totaled 3.7% in the period, 1.7 p.p. below the level of September 2021 (-2 p.p. y.o.y.). In the same way as what was observed in households, the current records of irregularity in credit to companies are lower than those evidenced before the beginning of the pandemic (-2.9 p.p. compared to the 6-month average to February 2020).
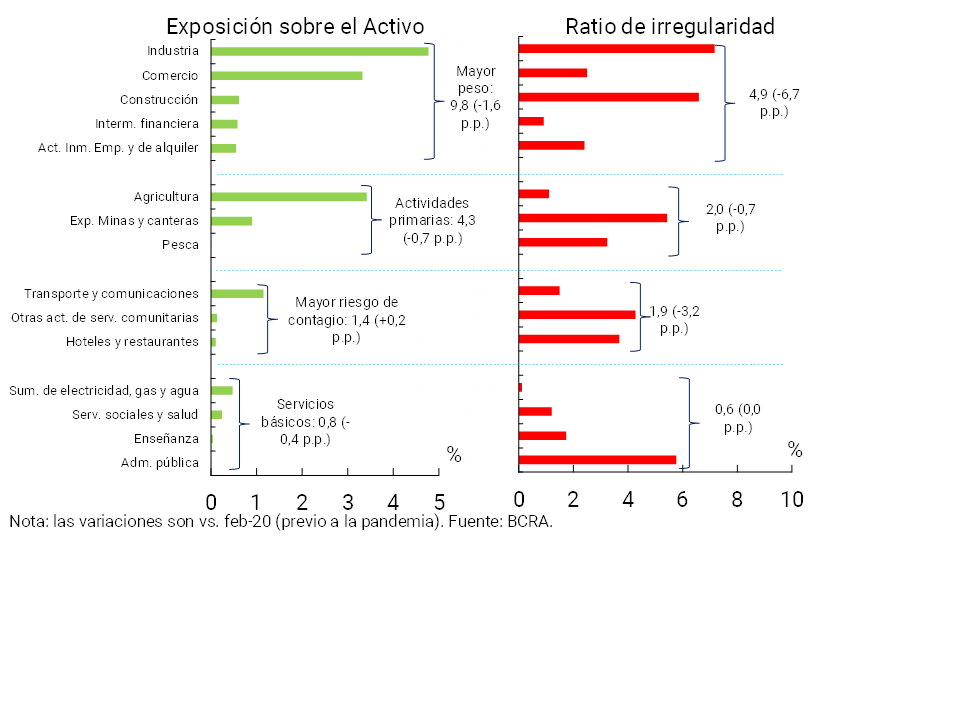
When considering the composition of financing to firms by sector, the group of companies whose activities have the greatest weight in the economy35 maintained a debt balance equivalent to 9.8% of the assets of the financial system in April 2022, 1.6 p.p. less than the pre-pandemic situation (see Chart 10). Companies belonging to primary activities were financed for an equivalent of 4.3% of the assets of all entities (-0.7 p.p. compared to February 2020). For its part, the exposure of the financial system to activities considered to be at greater risk of contagion (in the context of the effects of the pandemic) and to basic services was 1.4% of assets (slightly higher than the pre-pandemic level) and 0.8% (-0.4 p.p. compared to February 2020), respectively.
The credit irregularity ratio as of April 2022 was relatively higher in the set of companies with the greatest weight in the economy (4.9%) compared to the rest of the groupings, although it presented the largest decrease compared to the pre-pandemic situation (-6.7 p.p., see Graph 10).
Figure 10 | Composition of financing to companies by activity and irregularity
April 2022
As mentioned above, the financial system maintains a low exposure to debtors associated with activities considered to be at greater risk of contagion36. However, given the impact on companies in these sectors in 2020 and 2021, coupled with the potential risk of new occasional and repeated shocks from the pandemic on their performance, sensitivity exercises are carried out for all institutions to assess the degree of coverage against a hypothetical and unlikely shock (see Box 5).
Box 5 / Credit Risk Sensitivity Exercises
The results of the sensitivity exercises carried out with data as of April 2022 provide evidence that the Argentine financial system, in aggregate, maintains a significant degree of resilience to the eventual materialization of the credit risk assumed37. In these exercises, the impact on the solvency of the financial system is analysed (without assuming additional changes), in the event of a hypothetical total impossibility of recovering a certain set of loans (extreme assumption of very low probability of occurrence). These exercises are part of the BCRA’s set of monitoring tools to assess the stability of the financial system.
Exercise 1: it is assumed that in each financial institution the ratio of irregularity of loans to the private sector increases to the highest level reached at the individual level in the last 15 years (April 2007-April 2022)38. These assets are derecognized from the balance sheet, net of the estimated forecasts for them39. The resulting regulatory capital position is estimated as of April 2022 (latest available information) and February 2020 (prior to the start of the pandemic).
In this year, the median capital position40 of the institutions as a whole would decrease from 245% (weighted average of 248%) to 197% (226%) (see Chart R.5.1). Based on a high aggregate capital position, it is estimated that at present (April 2022) there would be greater slack once a possible shock occurred with respect to the pre-pandemic situation (February 2020).
Figure R.5.1 | Capital Position Sensitivity Exercises

Exercise 2: it is assumed that companies (and their employees) that have debts in the financial system and that belong to the sectors of activity “with the highest risk of contagion” due to the COVID41 Pandemic scenario, present a situation of impossibility of repayment of their loans42.
The estimated impact based on this exercise lowers the median capital position of the group of entities as of April 2022 by 65 p.p., to 180% (the weighted average would fall by 62 p.p., to 186%). Here too, the system would maintain, in aggregate, an appreciable capital slack.
Within the framework of the changes that have been registered in the credit exposures assumed by the financial system (both with the private and public sectors), and despite the recent improvement in the quality of the portfolio, in relative terms this source of vulnerability would remain the most relevant for the remainder of 2022 for the aggregate of financial institutions. The eventual materialization of the risk factors mentioned above (especially a less dynamic performance of economic activity than expected) would condition the payment capacity of debtors and, given the exposure of the financial system, there could be some impact on the sector’s balance sheet.
3.1.1 Resilience elements and mitigating measures:
The levels of forecasting and solvency of the aggregate financial system remained high. In April 2022, the forecasts accounted for dealing with bad debt situations represented 4.3% of total financing to the private sector. These forecasts continued to exceed the portfolio in an irregular situation (118.9% of it), above the September 2021 record and above the average in the 6 months prior to the pandemic (95%). The excess regulatory capital of the institutions as a whole, measured in terms of the loan portfolio net of provisions, remains high in a historical comparison (see Chart 11)43. The evolution of this ratio is reflected both at the level of the financial system and in all groups of banking institutions.
Figure 11 | Capital regulatory position (PRC-requirement) in terms of the balance of credit to the private sector net of forecasts
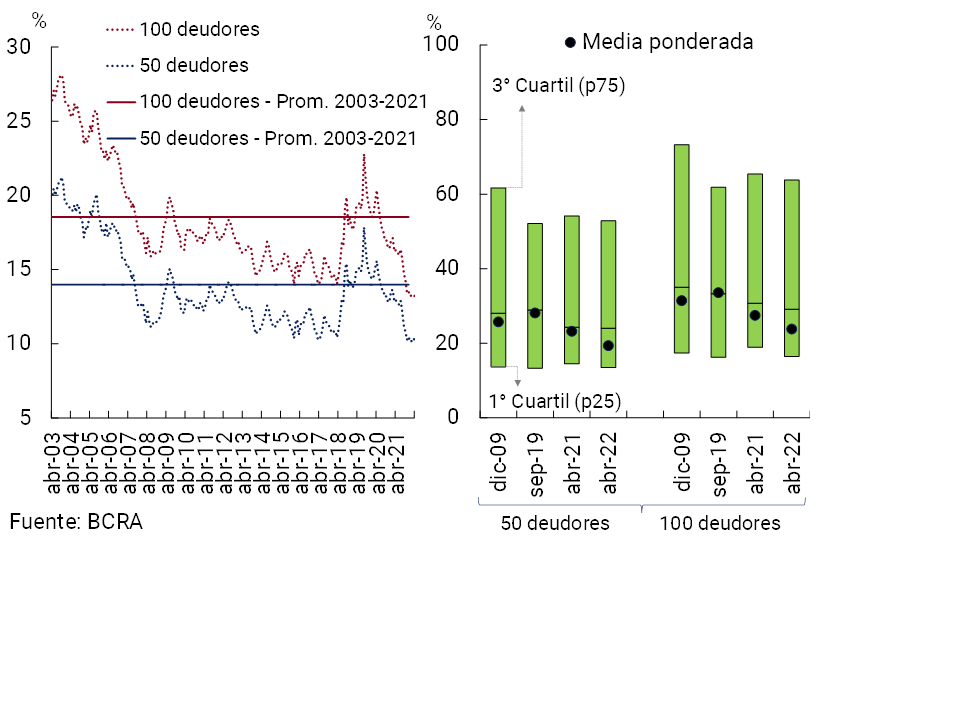
The concentration of private sector debtors in the financial system remains low. In April, the share of the top 100 and 50 debtors accounted for 13.2% and 10.2% of credit to the private sector, respectively (see Chart 12). These levels were lower than those recorded in the previous IEF (1.5 p.p. and 1 p.p., respectively), and remain at historically low values. Part of this performance is associated with the various credit stimulus programs promoted by the BCRA that made it possible to focus resources on the most backward sectors and promote productive development, such as the “Financing Line for Productive Investment of MSMEs” (LFIP, for more details see Box 6).
Figure 12 | Participation in credit to the private sector of the main debtors…
Box 6 / Financing Line for Productive Investment (LFIP)
Throughout 2021 and so far in 2022, the Financing Line for Productive Investment (LFIP) was an important tool to boost credit to the productive sector, especially to MSMEs44. In March 2022, the BCRA extended the LFIP until the end of September, maintaining relatively favorable financial conditions for companies and benefits for participating financial institutions45. The 2022 quota – in a context of increases in the monetary policy interest rate – has an interest rate (TNA) of 42% for investment projects, and 52.5% for the rest of the financing reached46.
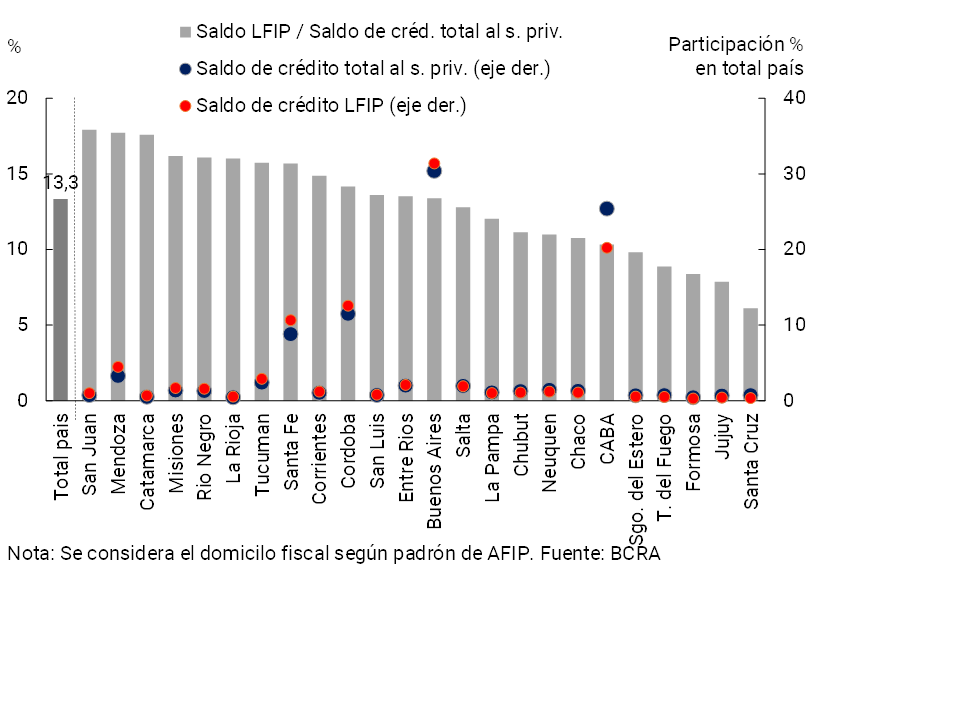
The LFIP credit balance is estimated at $790,400 million as of April 2022, equivalent to 27% of the total credit balance to companies (+8.7 p.p. compared to the level of September 2021) and 13.3% of the total balance to the private sector (+3.7 p.p.).47. Of the total balance, approximately 38.5% was used to finance investment projects.
The irregularity ratio of the total loans of the companies taking the LFIP stood at 0.7% as of April 2022 (-0.8 p.p. compared to September 2021), in a context in which this indicator for the total financing of the financial system stands at 3.6% (-1.5 p.p.).
It is estimated that since the last publication of the IEF, some 223 companies that did not have bank financing48, accessed this line of credit. Since the beginning of the LFIP, some 12,151 companies have been included in the financial system. As of April 2022, a total of almost 93,700 companies had a balance of financing channeled through the LFIP throughout the financial system. Most LFIP policyholders are relatively small in size: 94% (87%) of these companies have a staff of less than 100 (50) workers49. It is estimated that the number of people employed by companies with LFIP financing is equivalent to 19.5% of the total number of salaried people in the private sector50.
In terms of the distribution of LFIP resources among the different jurisdictions of the country, this tool continues to show a wide scope. Thirteen provinces have a weighting of the credit balance instrumented through the LFIP in total credit to the private sector that exceeds the average observed at the country level (see Figure R.6.1).
Figure R.6.1 | LFIP – Estimated distribution by province
Latest available data
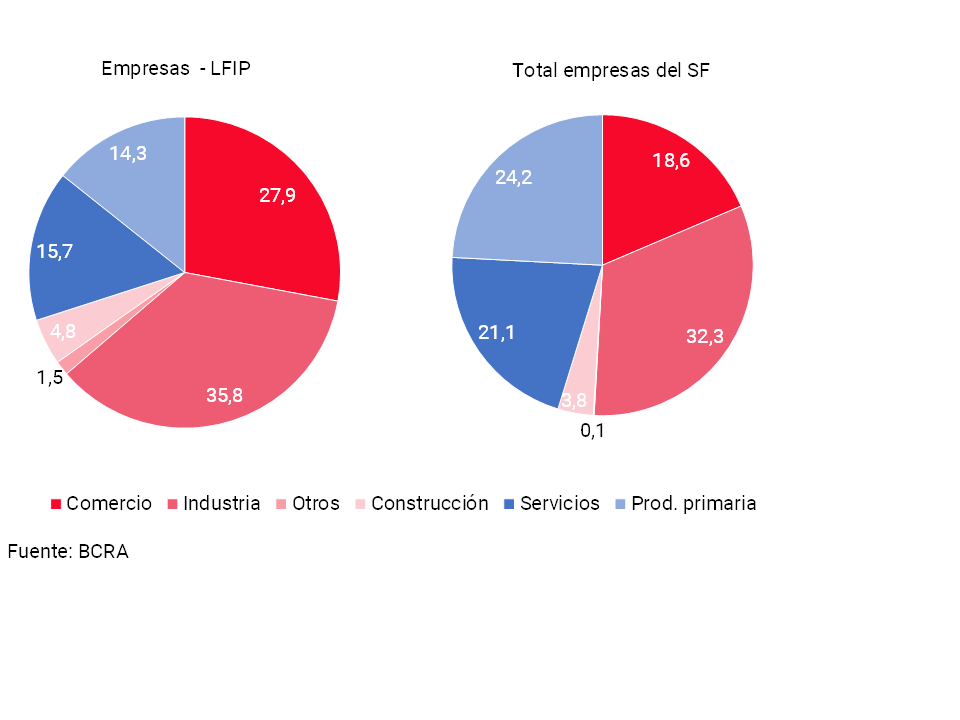
As for the sectors of activity of the companies taking the LFIP, about 36% of the balance would have been channeled to industry (see Graph R.6.2). In particular, companies engaged in the manufacture of food and beverage products accounted for approximately one-third of the total in this area. Meanwhile, it is estimated that almost 28% of the LFIP balance was granted to firms linked to trade (mainly wholesale trade companies). When comparing the distribution of the LFIP balance with the distribution of total bank credit to companies, it emerges that companies in industry, commerce and construction used this instrument relatively more than the rest of the sectors.
Figure R.6.2 | LFIP – Estimate by economic activity –
Share % in total balance – Latest available data
Credit origination standards remained unchanged over the past51 quarters. In the case of loans to households, according to the CCP, during the first quarter of the year there were no relevant modifications in credit standards. For its part, in the aforementioned survey, neutrality was observed in the case of credit origination standards for companies, both for large and SMEs.
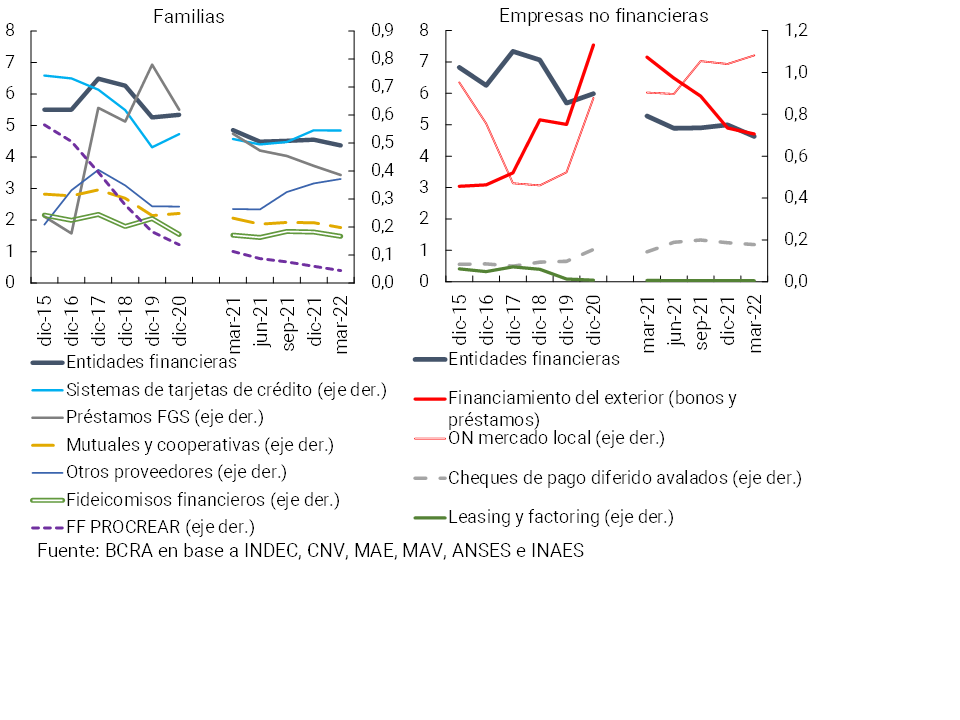
In aggregate terms and as a percentage of GDP, the levels of indebtedness of both companies and households remain limited. The broad credit ratio as a percentage of GDP represented a level of 6.1% for households and 10.6% for companiesin March 52, with decreases in both cases compared to their level six months ago (milder in the case of families). Data from publicly offered companies also show a downward trend in corporate leverage in the second half of 2021 (see Box 7). The six-month change occurs in a context of rising GDP and declining credit amounts (in real terms) in the broad sense for households (1% semi-annually) and companies (10% semi-annually). For both households and companies, the balances as a percentage of GDP are below the average of the last five years (about 8% of GDP for families and 12% for companies). Considering credit to households, the main component continues to be bank credit, the amount of which fell slightly in real terms between September 2021 and March 2022, with additional losses for FGS loans and loans in the FF PRO.CRE.AR, loans from mutuals and cooperatives and those in the portfolio of financial trusts not linked to infrastructure. On the other hand, the amounts associated with other credit providers registered with the BCRA53 and non-bank credit cards increased in real terms (see Graph 13). With respect to the corporate sector, the main components are bank credit and the balance of financial financing from abroad, both with six-month decreases in real terms as of March. The balance of local ON54, with a lower weight (6%) in total financing of companies, showed real growth, in contrast to what was observed for other local capital market instruments, such as deferred payment checks (with a more marginal weight on financing to companies).
Figure 13 | Financing in the broad sense for families and companies
% of GDP
Box 7 / Financial situation of publicly offered companies
One of the ways to monitor the situation of the corporate sector is through the analysis of the balance sheets of companies with public offerings in the non-financial private sector55. Measured in terms of their median, the financial indicators of these companies tended to recompose themselves in 2021, after the deterioration implied by the COVID-19 shock in 2020.
Final profitability in terms of equity, in homogeneous currency, improved in 2021 (see Table R.7.1), in a context of recomposition of operating results. This had a favorable impact on both liquidity indicators and payment capacity (interest coverage ratio with results)56. The leverage ratio ended 2021 with a decrease compared to 2020, which was accompanied by a trend towards a lower weight of short-term liabilities over total liabilities (consistent with a context of liability refinancing operations). On the other hand, in absolute value, the currency mismatch for companies that have ON in dollars ended the year slightly above the level observed a year ago.
Table R.7.1 Companies with a public offering – Main indicators
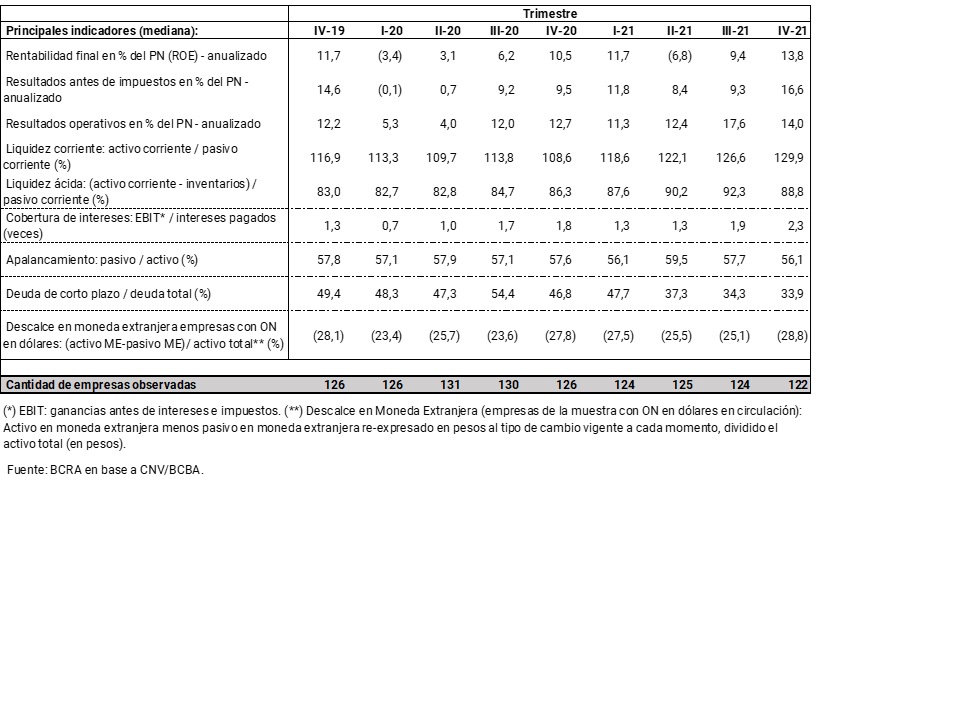
Given the evolution of the financial indicators of publicly offered companies, following a simple methodology57, at the end of 2021 it is observed that the proportion of companies in a relatively more vulnerable situation decreased. The financial system has a very limited exposure to these relatively more vulnerable companies (less than 1% of its total portfolio of loans to the corporate sector).
It is estimated that households maintained a moderate burden of servicing their bank debt, increasing slightly after the minimum evidenced in September 202158.
Reduced importance of financing to the private sector in foreign currency in the aggregate balance sheet of the financial system, with low foreign currency mismatch of debtors based on current macroprudential regulations. For more details, see the section on Main strengths of the financial system.
3.2 Performance of the financial intermediation activity
Financial intermediation activity has remained at moderate levels since the last publication of the IEF, in a scenario of gradual recovery of the different economic sectors. Despite the local and international context of higher inflation levels at the beginning of 2022 compared to previous periods59, the real balance of financing in pesos to the private sector increased slightly both in the last seven months, as well as in a year-on-year comparison.
For its part, the balance of deposits in national currency in this sector fell slightly in the period, accumulating a slight increase compared to the level of a year ago (see Section 3.3). On the foreign currency items, private sector credit and deposits continued to decline gradually when compared to the previous IEF.
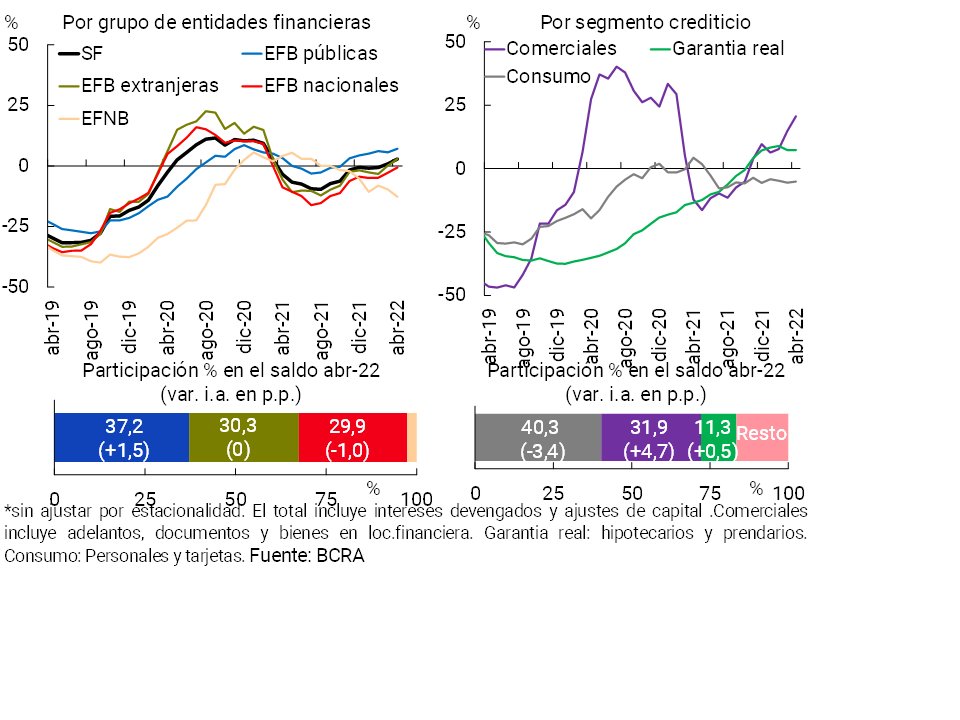
The balance of credit in pesos to the private sector increased 1.2% in real terms in the last seven months, and 2.8% y.o.y. in real terms, with a higher relative contribution from the group of public financial institutions (see Chart 14). Commercial loans (mainly documents) had the highest relative growth in the period and increased their share of total credit within the framework of the stimulus programs implemented by the BCRA, followed by lines with real collateral (mainly pledges). Given the reduction in the balance of financing in foreign currency, the total credit balance to the private sector (in domestic and foreign currency) accumulated a fall of 3% in real terms in the last seven months (-3.7% real y.o.y.).
Figure 14 | Private sector deposit balance
Year-on-year changes % in real terms*
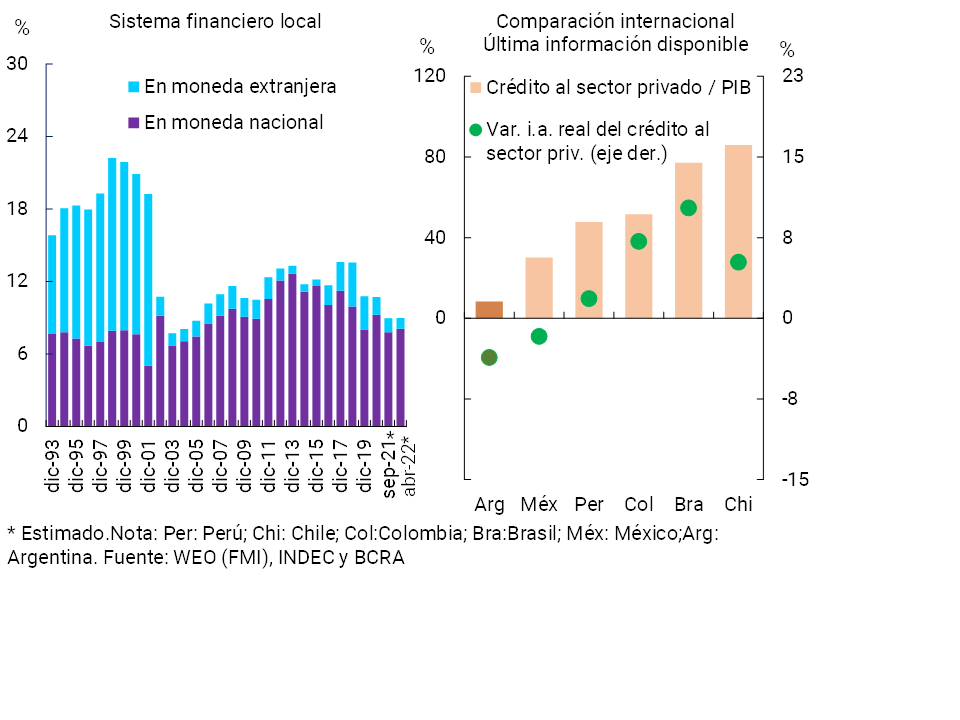
The local financial system continued to maintain a low degree of depth in the economy (see Graph 15). As has been commented in recent editions of the IEF, the ratio between bank credit to the private sector and output is at levels that are relatively low when compared to the local average of the last thirty years (13.5%) – already moderate – and with the records of other countries in the region (median of 49.7%).
Figure 15 |Private sector credit balance in terms of GDP
As % of total funding
The performance in financial intermediation took place in the context of the redesign of monetary policy instruments that began in January 2022, including the increase in the economy’s nominal interest rates. In this context, the aim was to ensure that lending rates were maintained at levels compatible with the promotion of credit to small and medium-sized enterprises, so that the development of tools such as the “Financing Line for Productive Investment in MSMEs” (See Box 6) can be deepened. It is estimated that for the first four months of 2022, the average nominal lending rates agreed for loans in pesos to individuals and legal entities increased less than the fixed-term interest rate, registering increases that are more in line with what was verified in the average nominal passive interest rate – operated by total deposits in pesos, both at sight and in the term.
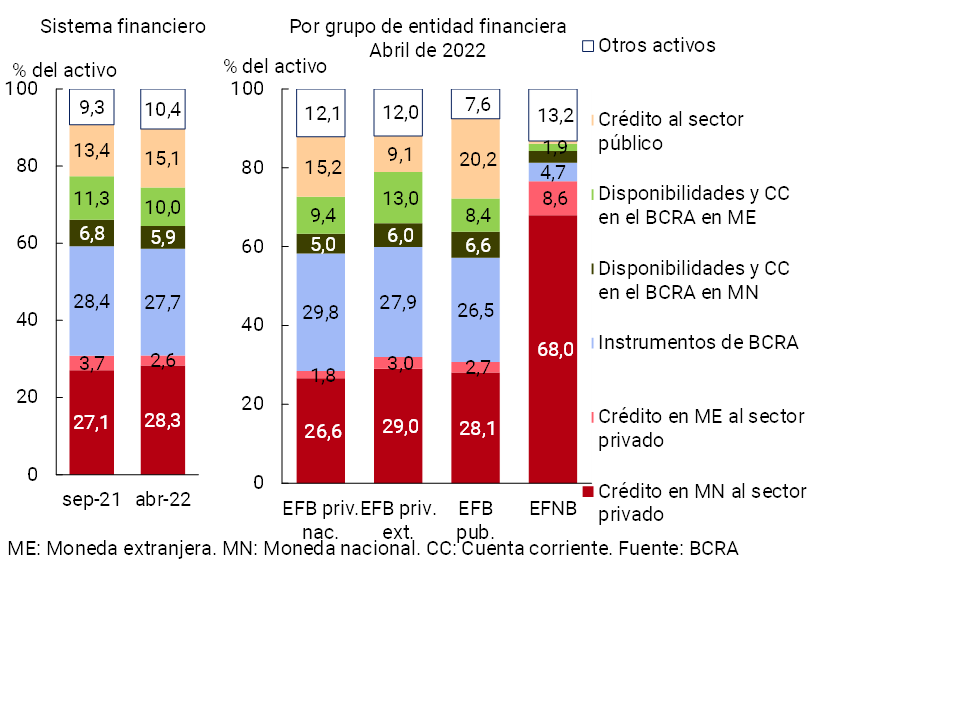
In the context of the aforementioned performance of financial intermediation, the assets of the institutions as a whole, measured in homogeneous currency, fell slightly compared to the level of the last IEF and in a year-on-year comparison (-3.3% real and -2.3% y.o.y., respectively), also reflecting certain changes in their composition. In particular, in the last seven months, the relative weight of financing to the public sector increased (to represent 15.1% of total assets) and credit in pesos to the private sector (up to 28.3% of the total); while the weighting of the balance of current accounts in the BCRA, of the BCRA’s instruments (mainly by passes) and of foreign currency loans to the private sector was reduced (see Graph 16). In the period, the financial institutions as a whole slightly increased the relevance of assets in national currency with CER adjustment (to 11.7% of total assets) and the share of those denominated in foreign currency decreased (to 15.2% of assets).
Figure 16 | Breakdown of total assets by main items
In the coming months, the process of gradual recovery of economic activity is expected to continue, a scenario that would have a positive impact on financial intermediation (supply and demand of credit and deposits, as well as financial services). However, this expected evolution could be affected by the eventual materialization of the risk factors mentioned in the previous section, generating a challenging context for all financial institutions.
3.2.1 Resilience elements and mitigating measures:
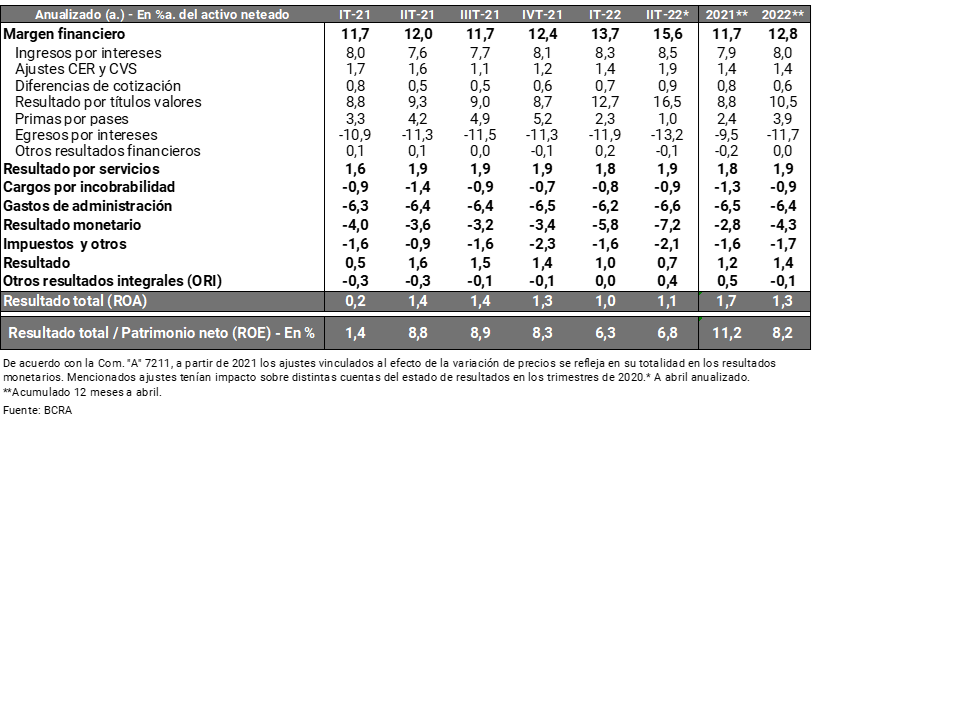
Internal capital generation. The aggregate of financial institutions continued to exhibit positive profitability at the beginning of 2022, although with indicators at slightly lower levels than those observed in the last quarters of 2021 (see Table 2). Considering the accumulated results in the last 12 months, the year-on-year decrease in the sector’s profitability levels is explained by the increase in interest outflows (increase in nominal interest rates and greater relevance of time deposits in funding) and by higher outflows due to exposure to monetary items (influenced by higher inflation). These changes were partly offset by higher premiums for passes and positive results for securities and lower charges for uncollectibility. Administrative expenses did not show significant variations compared to the previous year, maintaining an important relative weight in the aggregate financial system’s results table (see Box 8).
Table 2 | Financial System Profitability Table – In Homogeneous Currency
Box 8 / Measures of productivity and scale of the financial system. A regional comparison
Compared to the financial systems of other countries in the region, the Argentine financial system has similar levels both in terms of the unit cost of personnel employed (personnel expenditure per employee) and certain indicators of employment productivity (for example, based on the number of active account holders per employee60— (see Figure R.8.1, left panel). Notwithstanding the value of these indicators, the levels of sectoral operational efficiency – for example, approximate in terms of the ratio between personnel expenditure and the balance of loans to the private sector61 – are comparatively lower for the aggregate of local banks.
Figure R.8.1 |Indicators of scale and productivity of financial
systems
Annual data – Local evolution and latest available data for countries in the region* (2020)
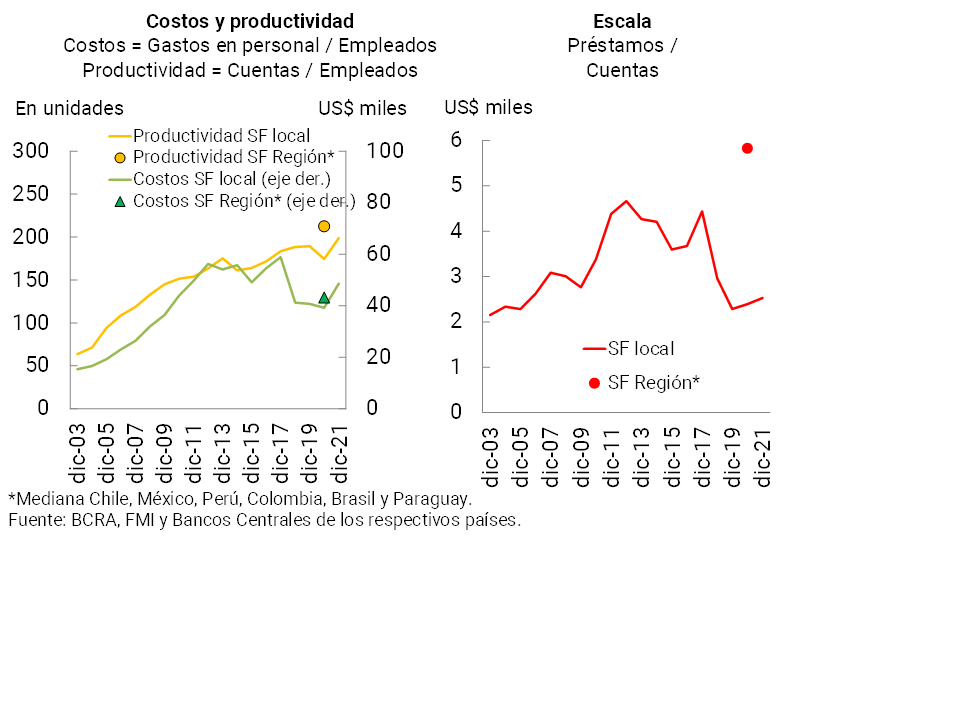
The differences in the observed levels of operational efficiency of the Argentine financial system would be reflecting, in large part, the effects of a relatively low scale of the sector —approximated here by the balance of loans to the private sector per account holder— (see Figure R.8.1, right panel)62. The local financial system would thus maintain a wide margin to benefit from the expansion of its size, generating economies of scale through the growth of credit (greater extensive and intensive use), thus resulting in potential benefits for the sector and for the economy as a whole. In this regard, the active credit promotion policy that the BCRA has been developing in recent years (see Box 4) is relevant, in addition to the gradual introduction of new technological tools and innovations in business models that would eventually be reflected in improvements in all sectoral indicators
Within the framework of the rise in monetary policy interest rates and the rest of the interest rates operated, it is estimated that in the first part of 2022 there were gradual increases in nominal implicit interest rates for the segment in pesos63. Compared to the end of 2021, the magnitude of the changes in implied rates was similar in assets (for loans to the private sector) and in liabilities (cost of funding for deposits), so that the differential between these implied rates did not present significant changes in the period. When estimating real implied interest rates (isolating the effect of inflation), the differential between the two concepts verified a reduction in the period.
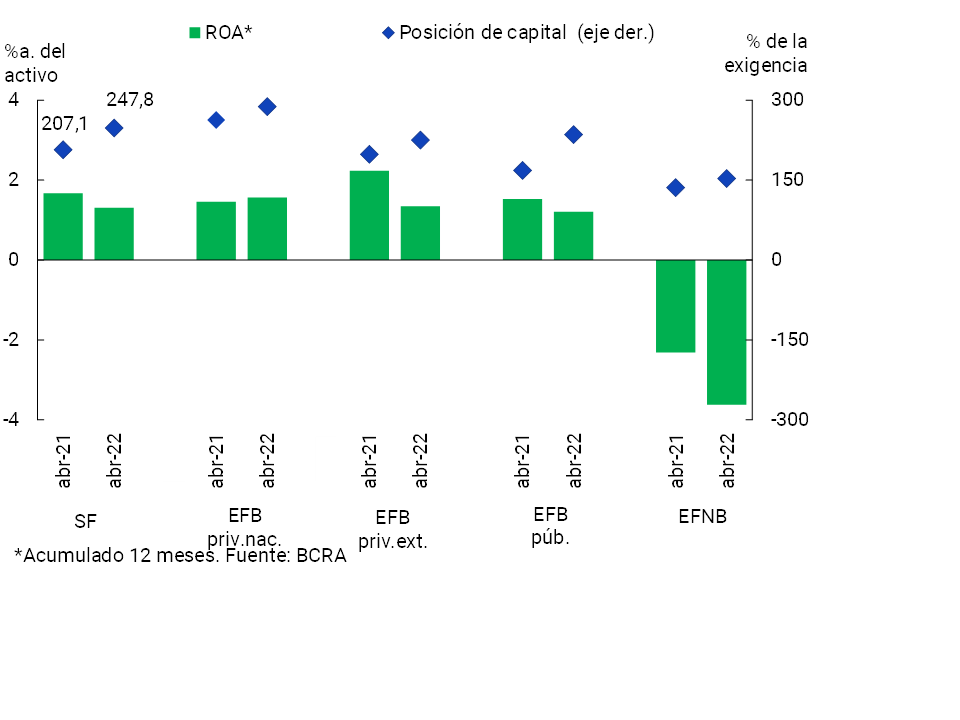
The profitability indicators maintained some heterogeneity among the groups of financial institutions, although it should be noted that all these groups presented high (and growing) solvency indicators (see Graph 17).
Figure 17 | Profitability and solvency indicators
By group of financial institutions
Regulation and supervision scheme in line with international recommendations on the matter. Within the framework of the risk-oriented supervision plan, the Superintendence of Financial and Exchange Institutions (SEFyC) continues to permanently monitor the performance of financial institutions. In particular, financial institutions defined as systemically important at the local level (DSIBS) maintained high levels of liquidity and solvency and limited risk exposures in the period (see Section 4.1).
Credit policies aimed at productive development. Throughout 2021 and so far in 2022, the BCRA continued to promote various policies to accompany the economic recovery process in a sustainable manner. With the aim of continuing to stimulate the production of certain productive sectors, at the end of the first quarter of 2022 the BCRA decided to extend the “Financing Line for the productive investment of MSMEs” until the end of September 2022, maintaining favorable financial conditions for debtors.
Low mismatch of foreign currency. In the context of the macroprudential regulations in force, the foreign currency mismatch faced by the aggregate financial system continued to remain at limited levels at the beginning of 2022 (see Section 2).
3.3 Funding and liquidity of the financial system
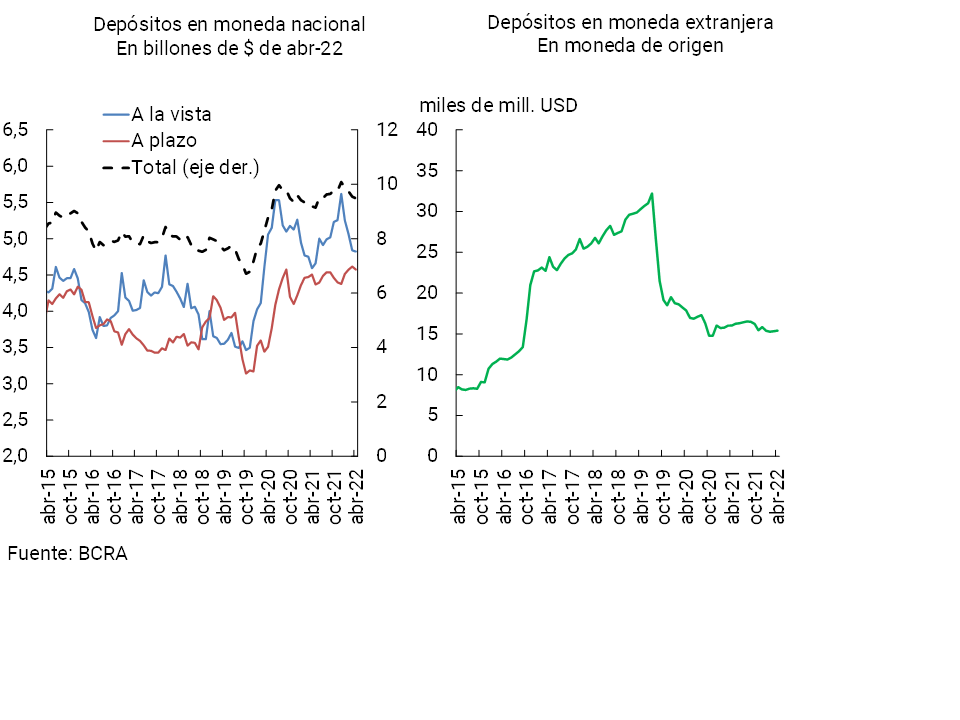
As mentioned in the previous section, the real balance of private sector deposits in national currency decreased slightly compared to the previous IEF (-1.7% in real terms, a variation explained by the performance of demand accounts, see Chart 18). For their part, the private sector’s time deposits in national currency increased in the period, mainly due to the performance so far in 2022 (see Box 9). The greater dynamism in this segment reflected the effect of the BCRA’s decision to increase the minimum limits of interest rates on fixed terms on several occasions. Private sector deposits in foreign currency were reduced compared to the level of last September (in currency of origin).
Figure 18 | Private sector deposit balance
Financial system
Box 9 / Recent performance of UVA time deposits in the private sector
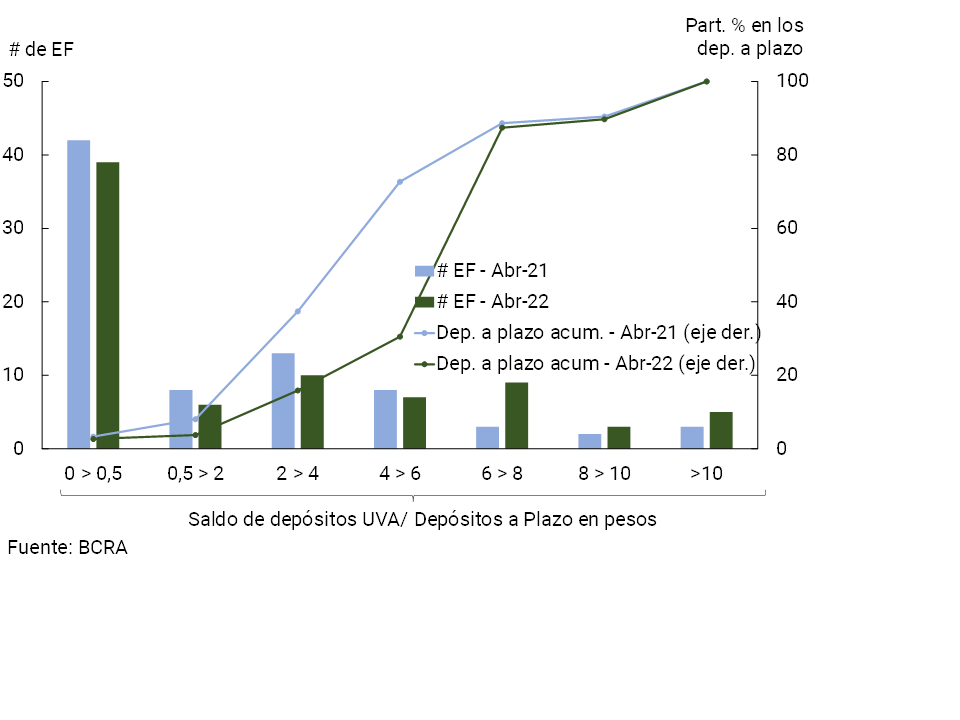
Since the end of 2021, there has been a significant growth in UVA time deposits, which offer positive real returns to the depositor. The balance of this type of private sector deposits increased 36.4% in real terms in the first four months of the year, thus reaching a level similar to that observed in mid-2021, and gaining share in total time deposits in pesos. In particular, those instruments with early cancellation64 —representing 39% of the total— verified a higher relative growth: an increase of almost 53% in real terms between December 2021 and April of this year (72.4% real y.a.). The balance of placements in traditional UVAs – 61% of the total65 – accumulated an increase of 27.6% in the last four months (14.7% real y.a.).
The performance of total UVA time deposits was driven by individuals: they represent almost 72% of these deposits and explain 83% of the growth in the last four months (see Graph R.9.1)66. Within the segment of individuals, this type of placements received by public financial institutions presented the greatest relative dynamism in recent months, followed by foreign private financial institutions. In the case of legal entities, UVA deposits from foreign private entities verified the largest relative increase since the end of 2021.
Figure R.9.1 |Estimation of the balance of private sector UVA time deposits by holder
In real terms*
As a result of the outstanding growth, UVA time deposits, considering traditional and pre-cancellable deposits, accounted for about 6.4% of the total balance of time deposits in pesos in the private sector as of April, increasing 1.5 p.p. in year-on-year terms. This increase in weighting was widespread among financial institutions (see Figure R.9.2).
Figure R.9.2 |Time deposits in UVA as % of time deposits in pesos–Distribution among financial institutions
Private sector
Private sector deposits in national currency continued to represent most of the funding (liabilities and net worth) of the financial system, reaching 49.5% of the total. This level was slightly higher than that evidenced in the last IEF, a dynamic driven by time deposits (23.9% of funding, +1 p.p. compared to September 2021, see Chart 19). The net worth of the financial system totaled 17.4% of total funding as of April, 1.1 p.p. above what was observed in the last edition of the IEF. On the other hand, compared to the end of September 2021, the foreign currency deposits of households and companies reduced their relative weight in total funding by 1.9 p.p., to 9.3% at the aggregate level.
Figure 19 | Funding
composition
As a % of total funding

In terms of distinguishing potential changes in the exposure assumed by institutions to liquidity risk, it is relevant to monitor certain characteristics of aggregate bank funding, such as the profile of depositors as well as the relative maturity and degree of concentration of the main liabilities.
In the last six months, there have been no changes in magnitude in terms of the composition of deposits by type of customer (depositor profile). In a context in which most private sector deposits are associated with a retail profile (with a certain bias towards greater relative stability), since the proportion of deposits from individuals and SMEs was around 58.4%, a slight increase in the relative importance of deposits from large companies (wholesale profile) was observed in the period. In addition, the share of deposits arranged with institutional investors – also with a wholesale profile – such as FCI, did not change in magnitude with respect to the previous IEF (see Graph 20), although it remained at a level above the average of the last 5 years (18.4% vs. 10.8%). In the same vein, the relative weight of the main depositors in the funding of each institution (concentration of depositors at the level of each institution) did not show significant changes with respect to the last IEF, although it remains at levels higher than those observed in the recent past (see Graph 21, right panel).
Figure 20 | | Private sector deposits in national
currency
Share % by type of depositor – Financial system
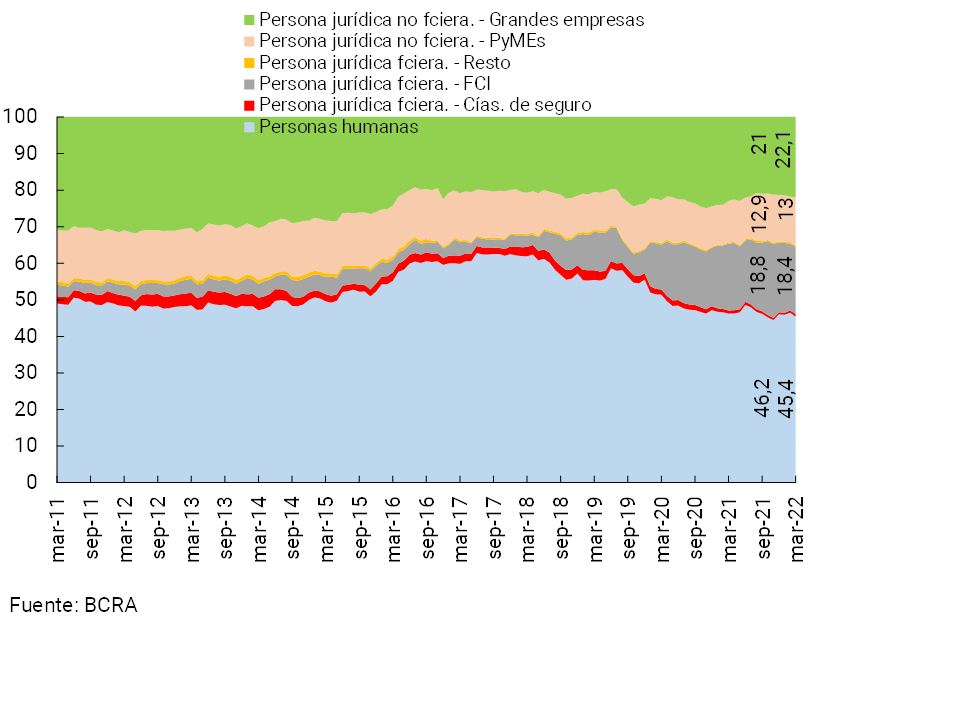
Figure 21 | | Liquidity risk exposure indicators
Financial system
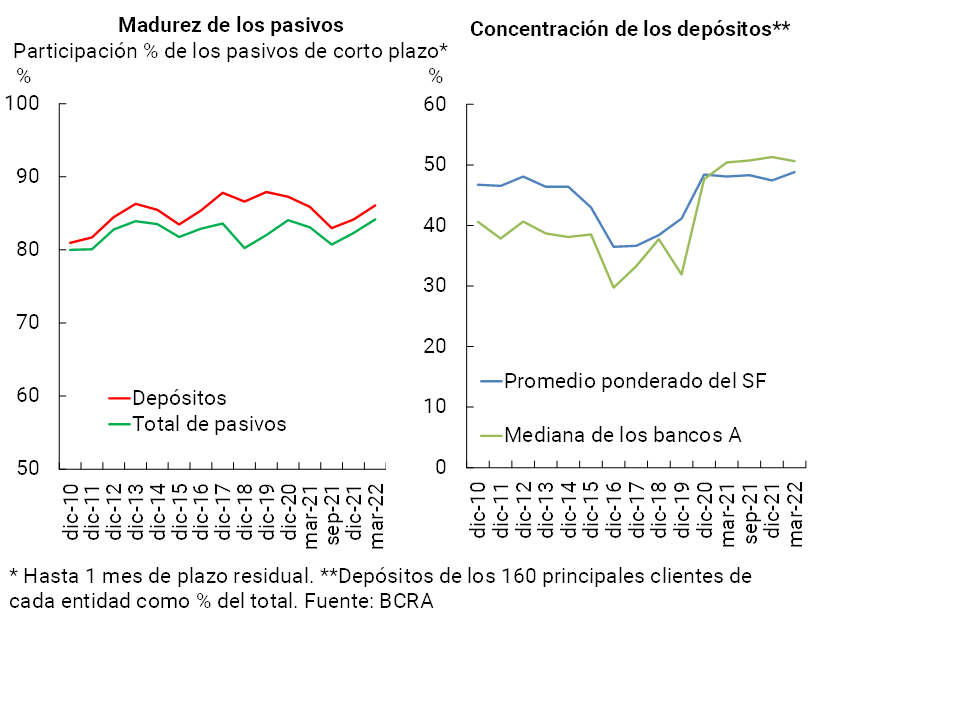
In terms of maturity, at the aggregate level, the share of liabilities (all currencies and sectors) with a residual maturity of less than one month increased slightly compared to the last IEF, representing 86.1% and 84.2% for deposits and total funding, respectively (see Chart 21, left panel), levels that correspond to the sector’s transactional bias. Looking ahead to the coming months, the maturity of liabilities could change as the dynamism of the private sector’s fixed-term deposits in pesos continues.
In this context, given the recent performance of liquidity risk exposure indicators – with slight increases in some cases or levels that are higher than the average of recent years in others – changes in the funding of the financial system could not be ruled out in the scenario of an eventual materialization of some of the risk factors raised in Section 2.
3.3.1 Resilience elements and mitigating measures:
Comfortable liquidity position at the aggregate level. As mentioned in section 2, the sector maintained high levels of liquidity, well above those observed in the last decade and compared to other financial systems in the region (see Chart 22).
Figure 22 | Liquid assets as % of total
assets
International comparison – Latest information available*
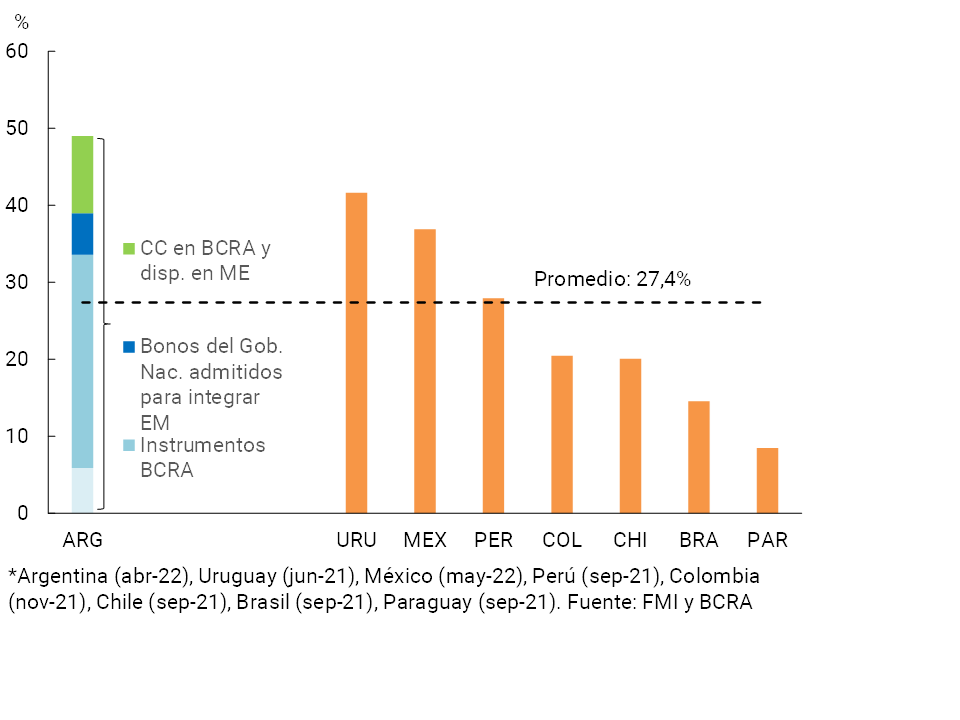
With regard to the liquidity indicators derived from the local regulatory framework based on the standards recommended by the Basel Committee (Liquidity Coverage Ratio (LCR) and Stable Net Funding (NSFR)67, the group of entities shows levels that are practically double the regulatory minimums and, as detailed in section 2, they are located in a high environment when compared to other economies (see Graph 6). In particular, all the institutions that are obliged to comply with these ratios (Group A68) exceeded the minimum requirement as of March 2022 (a situation that has been reflected uninterruptedly in recent years)69,70.
Limited transformation of deadlines. It is estimated that the duration of assets, liabilities and their difference71 for the aggregate financial system did not present significant changes with respect to the previous IEF, reflecting the limited transformation of terms developed by the sector. In line with the composition of deposits (demand and time) and the maturity indicators mentioned above, it is estimated that the duration of the total passive portfolio of the financial system remained at limited levels in the period (by just over 2 months). On the other hand, the estimated duration of assets also remained in an environment of low values (slightly over 3 months), based on the preponderance of credit lines and short-term debt instruments72.
Funding through the capital market continues to show a marginal weighting for the financial system, with maturities mostly in pesos for the coming months. The balance of outstanding negotiable obligations (NBs) represented 0.4% of the total funding of the financial system as of April 2022 (1.1% for the subgroup of entities that actually have outstanding notes)73. Maturities for the second half of 2022 (estimated as of June 2022) amount to only 16% of the outstanding balance of bonds in the financial system and are mostly in local currency (77% of the flows payable are in nominal pesos and in UVA), although the balance of bonds in the financial system is made up of a significant part in dollars (72%)74. So far this year, 9 financial institutions have placed bonds in the local market, for a total equivalent of $17,500 million (see Chart 23), in a period in which bonds of $38,800 million matured (both in the local and international markets)75. In constant pesos, these placements were 21% higher than the amount observed in the same period of 2021.
Figure 23 | ON of the financial system
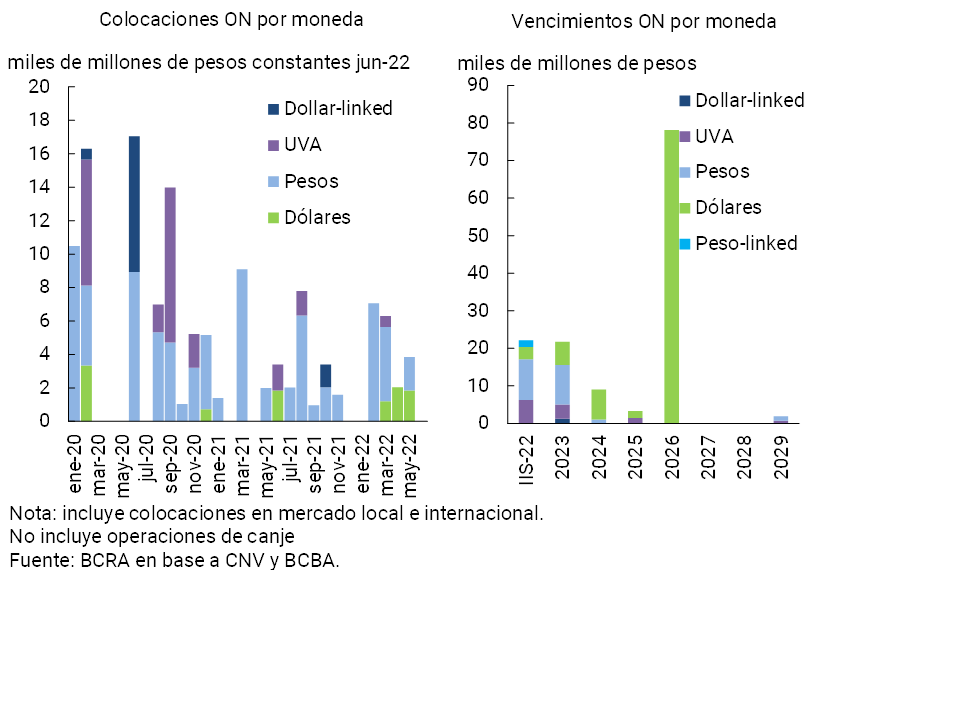
Finally, at the beginning of May, the BCRA ordered that financial institutions may not carry out or facilitate their customers to carry out operations with digital assets76, including cryptoassets and those whose yields are determined based on the variations they register (see Section 3). This measure seeks to mitigate exposures to the risks associated with these assets that could impact both users of financial services and the funding of the financial system.
4. Other topics of stability of the financial system
4.1 Systemically Important Financial Institutions at Local Level (DSIBS)
From a macroprudential perspective and following international guidelines on the matter, the BCRA established a methodology to identify systemically important institutions at the local level (DSIBs)77, assigning them special prudential treatment, which includes the requirement of an additional capital margin (1% of RWAs, to be integrated with the capital that has the best capacity to absorb potential losses).
As of April, the weight of the group of entities defined as systemic at the local level reached 50.4% in terms of assets, 1 p.p. above the level evidenced in the last IEF. From relatively high levels, the usual solvency ratios for this group of institutions increased compared to last September – slightly lower variations than those of the rest of the system – and full compliance with the capital conservation margin that all institutions must observe, as well as the specific additional component for systemic institutions, continued to be verified. The profitability indicators for the accumulated of the last 12 months of the DSBIS group presented levels above the rest of the sector, being higher than those verified in the previous IEF, although lower in a year-on-year comparison.
With regard to the liquidity indicators of this group of entities, from slightly lower levels than the rest of the system, there was a slight increase in the broad indicator of the DSIBs – both for items in domestic and foreign currency – when compared to the previous IEF (see Table 3). For its part, in terms of credit risk, as of April this group of institutions presented: a slightly higher relative exposure to the private sector than the rest of the system (slightly higher than the previous IEF record), higher levels of non-performing loans to the private sector than the remaining entities (although lower than those they had in the previous IEF), and a greater exposure to the public sector than the rest of the sector (and compared to the records of the last IEF).
Table 3 | Main indicators of soundness for D-SIBs
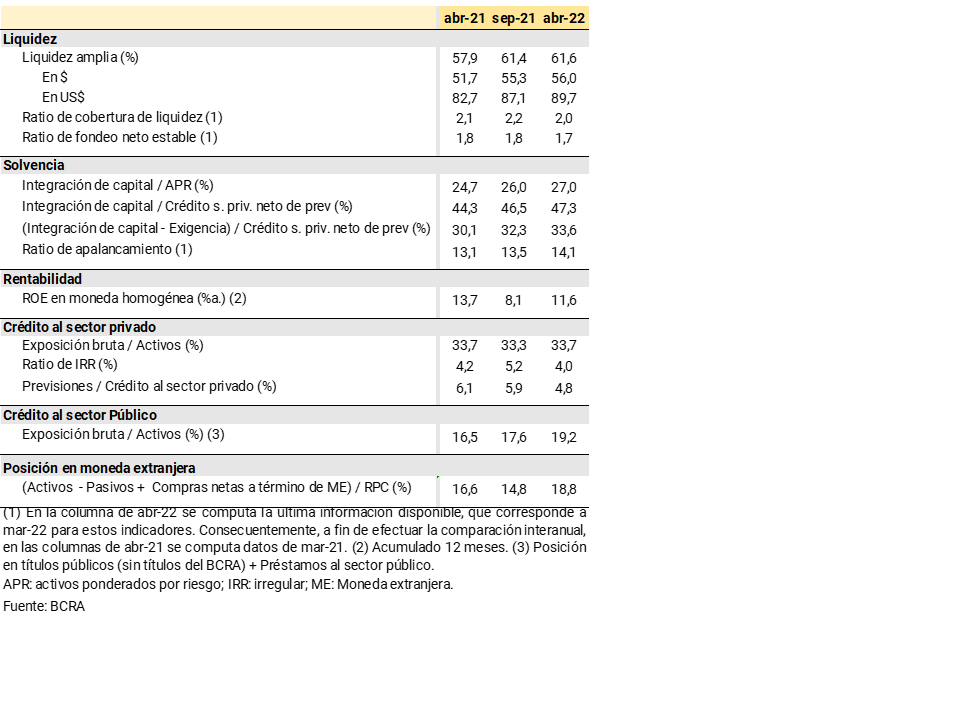
4.2 Interconnection in the financial system
With regard to the analysis of the interconnection of institutional investors78 with the financial system (a group of entities regulated by the BCRA), the deposits and time investments of the former continue to be the main channel of direct interconnection. In recent months, a slight increase in the weighting of these deposits was observed to reach 13.9% of the total as of April 2022 (see Chart 24). This performance was observed for the top three institutional investors, accompanying the increase in the value of portfolios under management. In perspective, the current weighting of institutional investors’ deposits in the total financial system is almost 6 p.p. higher than that of the average of the previous 10 years, with an increasing weight of FCIs, particularly those in the money market (a movement observed since the middle of the last decade)79.
Figure 24 | Share of institutional investors’ deposits in the funding of the financial system
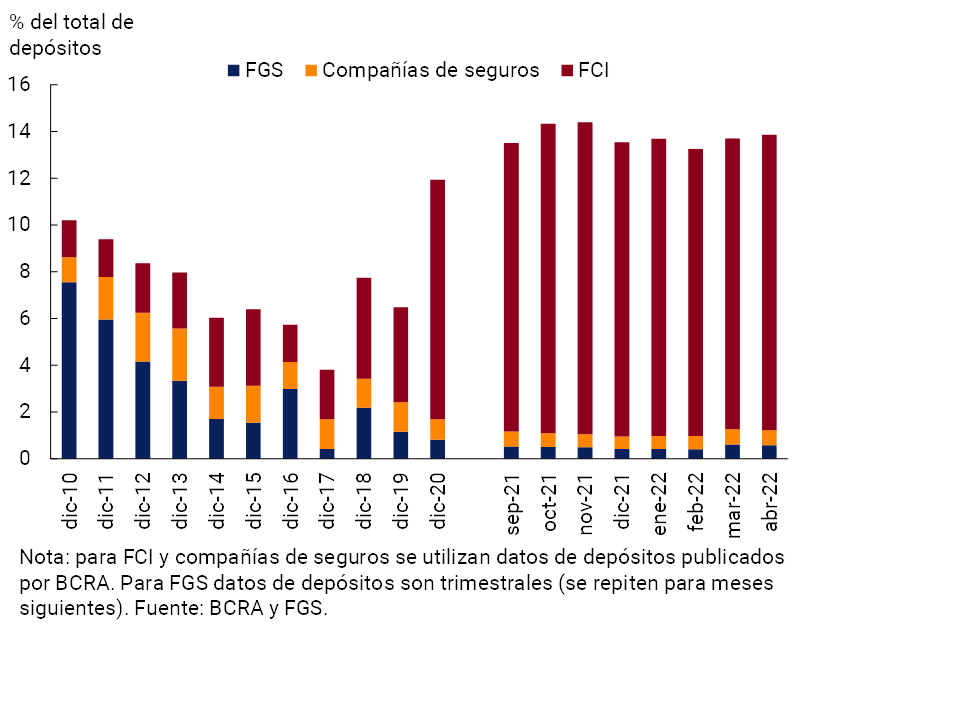
Focusing on FCIs, the increase in deposits so far this year was in line with that of assets under management, which increased 2% in real terms until May. Unlike what had been happening in recent years, the rise in fixed income FCIs stood out, growing 17% in real terms, while money market FCIs fell 6% in real terms in the same period. Fixed income FCIs (with less interconnection with the financial system) currently represent 42% of the total industry portfolio, behind 44% of money market FCIs (see Chart 25)80. Considering the new net redemption subscriptions up to the end of May, which accounted for nearly 40% of the change in assets of the FCIs as a whole (the remainder being the result of investments), more than 90% went to fixed-income funds, while money market funds recorded net outflows81. In particular, it is noteworthy that three-quarters of the new flows to fixed income FCIs were directed to FCIs that invest mainly in public securities with CER adjustment, in line with the financing strategy of the national public sector and with the demand for assets that offer this coverage82.
Figure 25 | Evolution of the FCI industry by type of fund
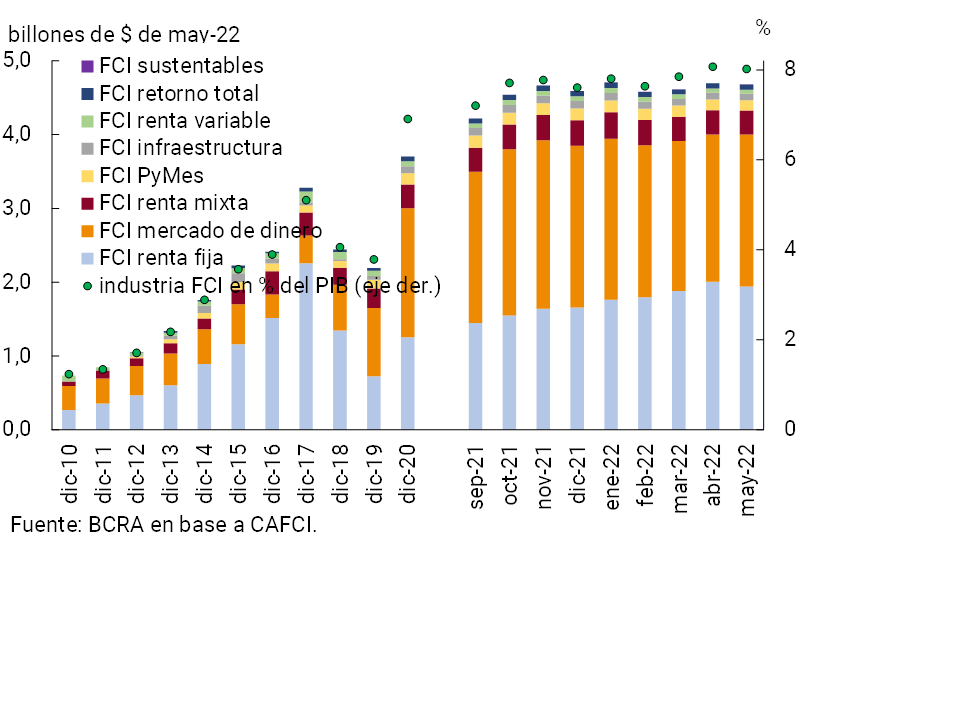
With respect to direct interconnection within the financial system, it can be analyzed through the market for unsecured interfinancial loans (call market). Although it is a relatively small market83, it contains relevant information since financial institutions use it for liquidity management. In this sense, an increase in recent months was observed in the amounts traded on average per month (although the amounts continue to be relatively low in historical terms), while the agreed rates accompanied the rise in reference rates (such as the monetary policy rate and the BADLAR). In this context, based on the indicators estimated with network analysis methodology, a greater direct interconnection is generally observed both in relation to the previous period and year-on-year84. However, in most cases the indicators indicate interconnection levels lower than the average values of the last 10 years.
5. Main macroprudential measures
Since the publication of the last IEF, the BCRA has continued with the process of calibrating its prudential policy, in a context in which the economic reactivation and growth observed since 2021 has gradually been consolidated, largely due to the progressive normalization of social mobility (see Section 1).
In this scenario, the BCRA oriented its prudential policy towards:
i. Strengthen financing for families and businesses—with particular emphasis on the development of MSMEs—without losing sight of the growing challenges arising from the global scenario of greater financial and geopolitical tensions (see Section 1). Thus, in March it launched a new edition of the Financing Line for Productive Investment of MSMEs (Quota 2022), with moderate adjustments on nominal interest rates given the changes implemented in monetary policy. On the other hand, given the still relatively weak performance of financial intermediation, the BCRA decided to extend the limit of financing available to large exporting companies, while the required level of the Countercyclical Capital Margin for entities remained unchanged and at zero (0%);
ii. Strengthen savings in pesos in the financial system, implementing adjustments in the minimum interest rates of deposits in line with the evolution of monetary policy rates, while generating new incentives for the constitution of time deposits of people with agricultural activity. In addition, the BCRA ordered that entities may not carry out or facilitate their customers to carry out operations with digital assets – including cryptoassets – (see Section 3), a measure that seeks to mitigate the risks to which users could be exposed, while mitigating potential vulnerabilities that could be generated on the funding of deposits of banks;
iii. Maintain adequate levels of capital in the financial system: in 2020 and 2021, the possibility of distributing dividends to financial institutions was suspended, a situation that began to gradually normalize at the beginning of 2022. In this way, the process of recovery of economic activity after the shock of the pandemic is accompanied, without neglecting the capacity of the financial system to face potentially adverse contexts such as those described in Section 3.1, with an eventual impact on families and companies;
iv. Help alleviate the financial situation of companies, focusing action on those that are still suffering the impact of the shock of recent years;
v. Adapt foreign exchange and entity regulations to provide for the efficient use of international reserves, reducing the likelihood of potential transitory imbalances in the foreign exchange market.
Section 1 / Russia-Ukraine conflict and challenges to global financial stability
From a strictly financial point of view, the escalation of the conflict between Russia and Ukraine, in addition to directly affecting the share prices linked to these two economies (and the region’s assets)85, generated a context of greater volatility at the global level. Accompanying the rise in geopolitical risk and economic uncertainty86 was an increase in expected volatility (see Figure A.1.1). The VIX (expected volatility for U.S. stocks) went from an average below 20% in 2021 to levels above 30% in the first half of March87. A similar behavior was shown by the emerging financial stress index prepared by the U.S. Department of the Treasury. 88.
Figure A.1.1 | Volatility in international markets
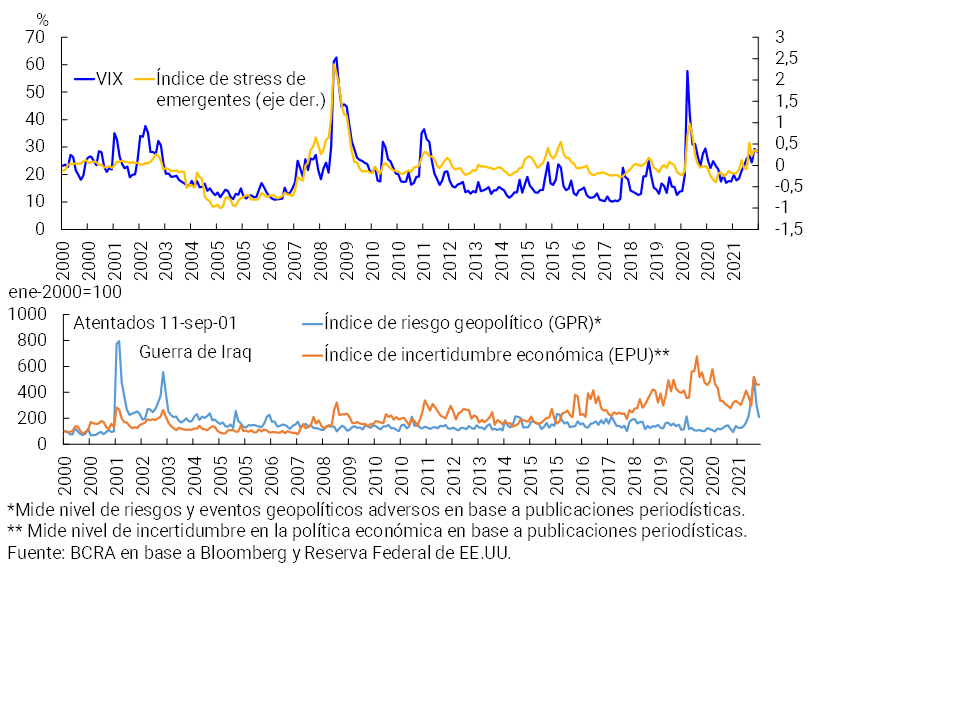
The volatile behavior was particularly marked among commodity prices. Products such as oil and gas showed relative peaks in their prices in March and subsequent partial correction, incorporating what could be interpreted as expectations of a relatively short conflict. A similar trend was observed for several foods (grains) and for certain metals (such as nickel, copper and aluminum). However, commodity prices subsequently resumed their upward trend, while the conflict dragged on over time (with new sanctions on Russia). With commodity prices on the rise, pre-existing concerns about inflationary pressures at the global level intensified, accelerating the trend of raising monetary policy interest rates – and reaffirming expectations of more restrictive measures – among both developed and emerging economies. These developments (with an impact on economic activity) explain the deterioration of the financial markets at the global level most recently (May-June). The evolution of commodity-linked derivatives markets was monitored more closely, given that the more erratic behavior of quotations increased the risk of spillover effects depending on the dynamics of margins or due to losses linked to speculative positions. So far, these markets have functioned in a mostly orderly manner.
The context of greater volatility, marked increases in the prices of certain commodities and rising interest rates emphasized the trend that had already been observed towards an appreciation of the dollar against the rest of the currencies of developed economies and a rise in the yields of US Treasury instruments89. So far, there has been no generalized and global search for liquidity for precautionary purposes – such as the one observed in early 2020 in the face of the emergence of COVID – or disruptive movements among investors. There was a decline in demand for assets with greater relative risk (although not necessarily as a direct effect of the conflict in Ukraine), with some differences in performance by region (such as the clearest deterioration among European stock markets in March).
In the case of emerging market assets, currencies and stock markets were pressured downwards until mid-March in the context of the war, and since April in a framework focused on expectations of stagflation in developed economies. In the case of debt spreads, they increased, which was added to the increases in the yields of US Treasury instruments. Significant heterogeneity in behavior was observed between countries. For example, the stocks and currencies of commodity-exportingeconomies90 performed better in March than those of commodity-importing economies (see Figure A.1.2).91 For flows to funds specialized in emerging markets, there was also a differentiated behavior between commodity exporters and importers (see Chart A.1.3).
Figure A.1.2 | Prices linked to emerging economies
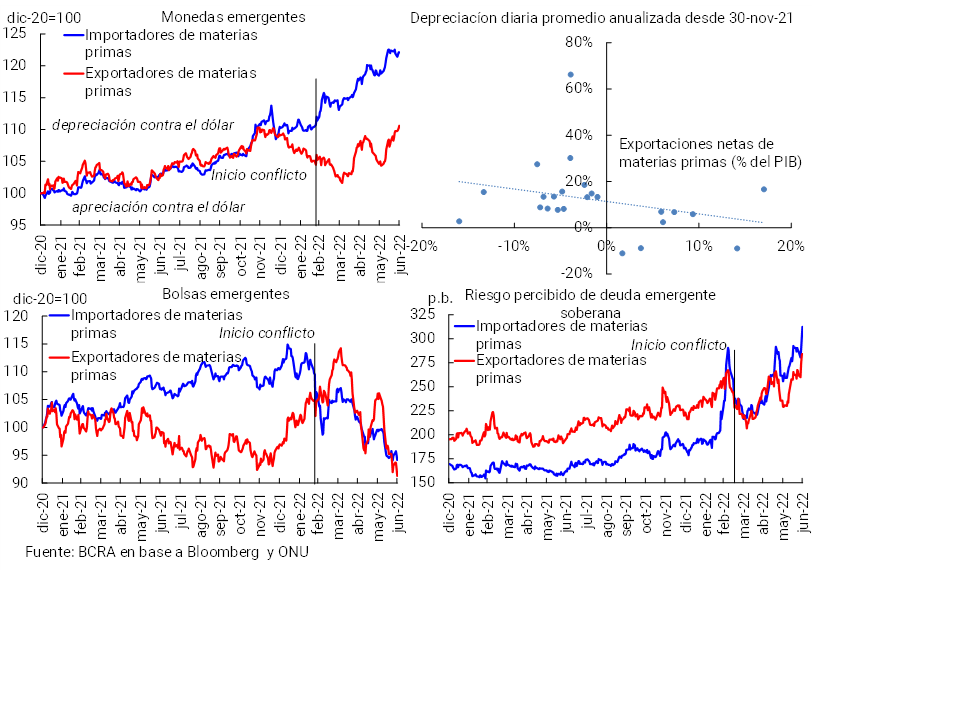
Figure A.1.3 | Flows to EME
equity funds
In billions of US$
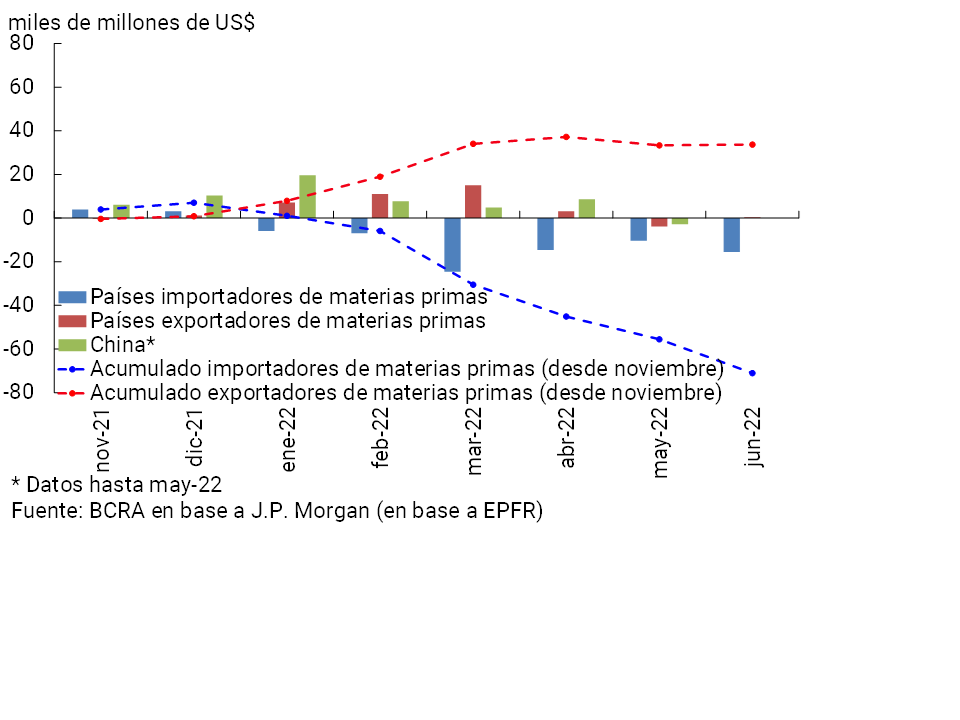
The conflict between Russia and Ukraine is a still-developing event that continues to act as a source of uncertainty. It cannot be ruled out that it could suddenly trigger a challenging scenario in international markets again, given the existence of a series of vulnerabilities at the global level and that could end up interacting with each other to amplify situations of tension.
In this framework, the monitoring of the conflict, its impact on financial markets and potential transmission channels is maintained. A more severe confrontation, expectations of a more aggressive restrictive bias in the monetary policies of developed economies or disorderly movements in the commodity derivatives markets (with an impact on the demand for liquidity), could significantly affect risk appetite among investors, affecting emerging market assets. On the other hand, given the sanctions against Russia, there could be difficulties in the repayment of liabilities directly or indirectly linked to that country, with a possible direct impact among agents with high exposure, an assessment of counterparty risk from other related economies and even effects on emerging debt in a more generalized way92. Other factors worth mentioning are the impact of greater volatility in the cryptocurrency market or the risk of more widespread cyber-attacks that affect the normal functioning of the markets.
Section 2 / Credit risk assumed by financial institutions due to their exposure to common debtors with non-financial credit providers93
As detailed in Section 4 of the IEF for the first half of 2021, from the perspective of macroprudential monitoring, in particular the analysis of the sources of vulnerability of the set of financial institutions (FIs), it is pertinent to study the interconnection channels that may exist between them and other sets of economic agents, such as non-financial credit providers (NFPs). It can be seen that in recent years the exposure to credit risk of all FIs to common debtor individuals (PHDC) with NFP has decreased. The credit balance in real terms per debtor in the PHDC group (in EF and in NFP) has decreased in recent years, a performance similar to that recorded by the rest of the debtors in EF (exclusive). However, the debt balance per debtor of PHDCs is substantially higher than that of those exclusive to PE. This occurs in a context in which the irregularity of the former is relatively greater, added to the fact that the portion of the debt they take on in PNF has been increasing. Based on a sensitivity analysis (hypothetical, extreme, and unlikely exercise) in which a possible credit deterioration of PHDCs in FIs is assumed, increasing their level of delinquency to that presented in NFPs, there would be no significant impact on the solvency of the financial system as a whole, accounting for a relatively high degree of resilience94.
At the end of the first quarter of 2022, FIs and NFPs together channeled loans to more than 17 million debtor individuals (PHDs), a level that has been growing in recent years (see Chart A.2.1), with some modifications in its composition. While PHDCs represented about 25.2% of the total as of March 2022 (4.3 million) and the remaining 74.8% (12.9 million) were exclusive to EF or NFP (PHDE), 4 years ago ordinary people represented 31.1% of the total, an additional 5.9 percentage points. Moreover, the credit exposure of all FIs to PHDCs was equivalent to 33.8% of the PH financing balance as of March95, 2.1 p.p. above the figure for the same month of the previous year and 5 p.p. below March 201896. Thus, in recent years, the interconnection between FIs and NFPs through this channel has decreased, indicating a lower gross exposure of FIs to the potential vulnerability associated with PHDCs.
Figure A.2.1 | Debtors (PHD) in CENDEU (*) – In % of total
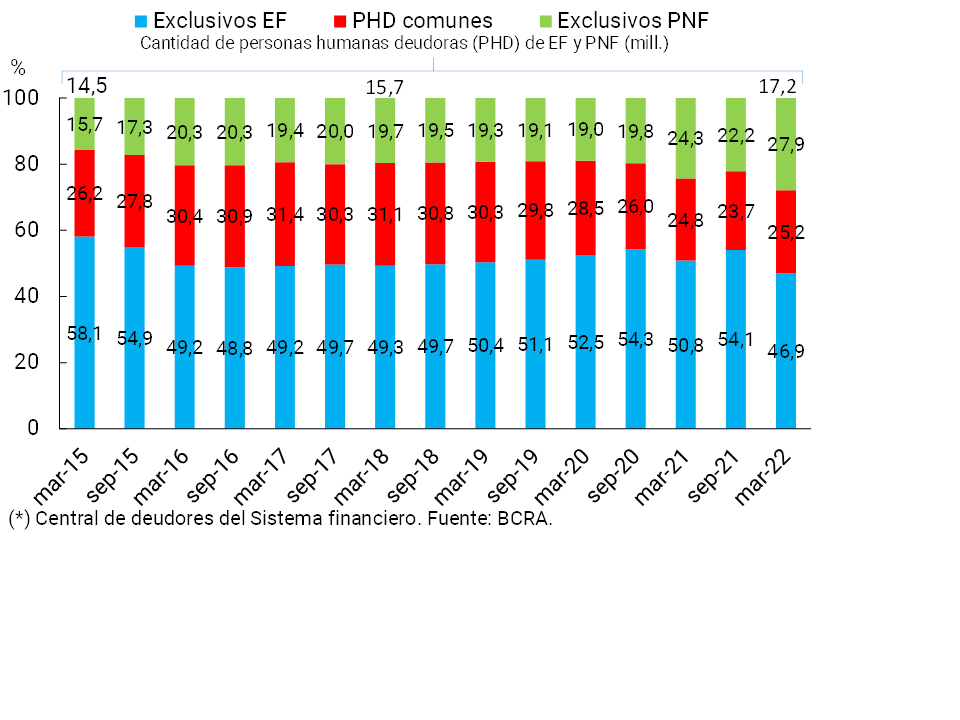
In addition to monitoring the amount of PHDCs and the exposure of the financial system, it is important to monitor the per capita debt balance of PHDCs to investigate whether there are excessive levels of indebtedness that could be linked to a search for additional sources of financing. Thus, in recent years, it has been observed that the per capita debt stock in PHDC financial institutions was much higher than that of FI exclusive institutions, although both balances fell in real terms at a similar rate, in a context in which the relative importance of PHDC’s debt in NFP increased. As of March, the median per capita debt balance of the PHDCs amounted to $176,000 (in EF and NFP), while this value represented $79,000 in the case of those individuals exclusive to PE. The current ratio between these medians is at a level similar to that recorded 4 years ago, since both debt balances per capita have been reduced by just over 30% in real terms in this period. On the other hand, specifically in the case of ordinary individuals, there was a certain increase in the ratio between the median credit per capita in NFP with respect to that of the total per capita balance to PHDC (25.6% in March, see Figure A.2.2). In other words, PHDCs are increasingly taking a greater part of their funding in NFP97.
Figure A.2.2 | Median credit balance per capita to debtors
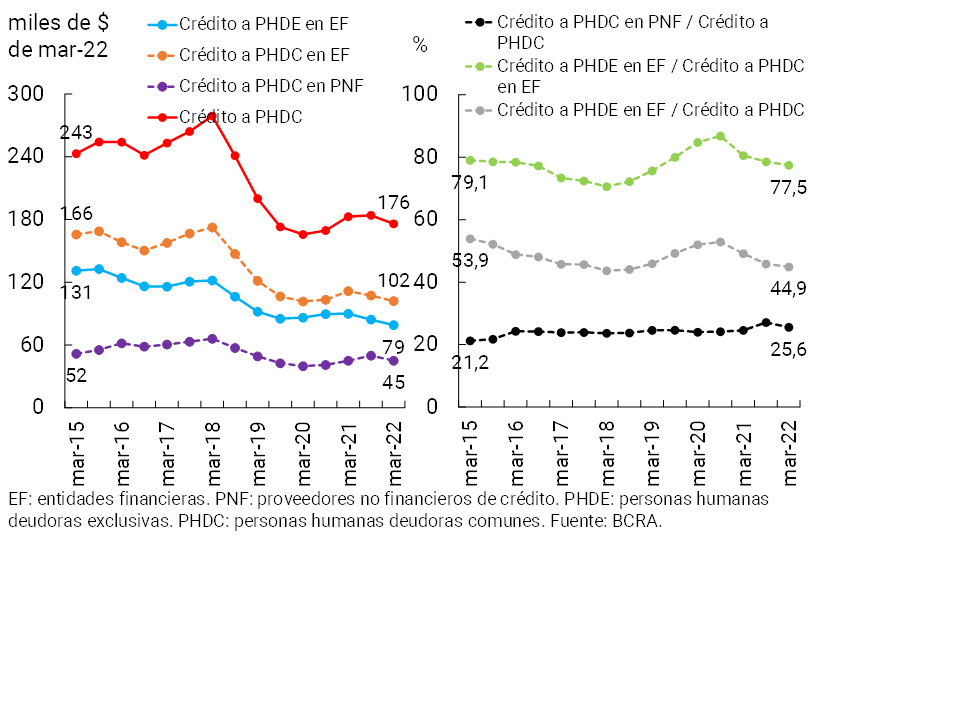
When considering the risk materialization indicators in the FIs as a whole, it can be seen that the irregularity ratio of the PHDCs in FI (5.9%) is higher than that of the credit to the PE PHDEs (2.6%) (see Graph A.2.3). The relative difference between these two indicators (2.3 times) is currently at levels similar to those of pre-pandemic (2.1 times in Mar-18), although it has widened compared to the level of 7 years ago (1.4 times). In addition, it is verified that the irregularity ratio of PHDCs in NFP (10.4%) is higher than that of this group of debtors in FI (5.9%), although the relative difference between the two was reduced in the last year (it is currently 1.8 times, while 4 years ago it was 2.9).
Figure A.2.3 | Irregularity ratios of credit to PHD and ratios
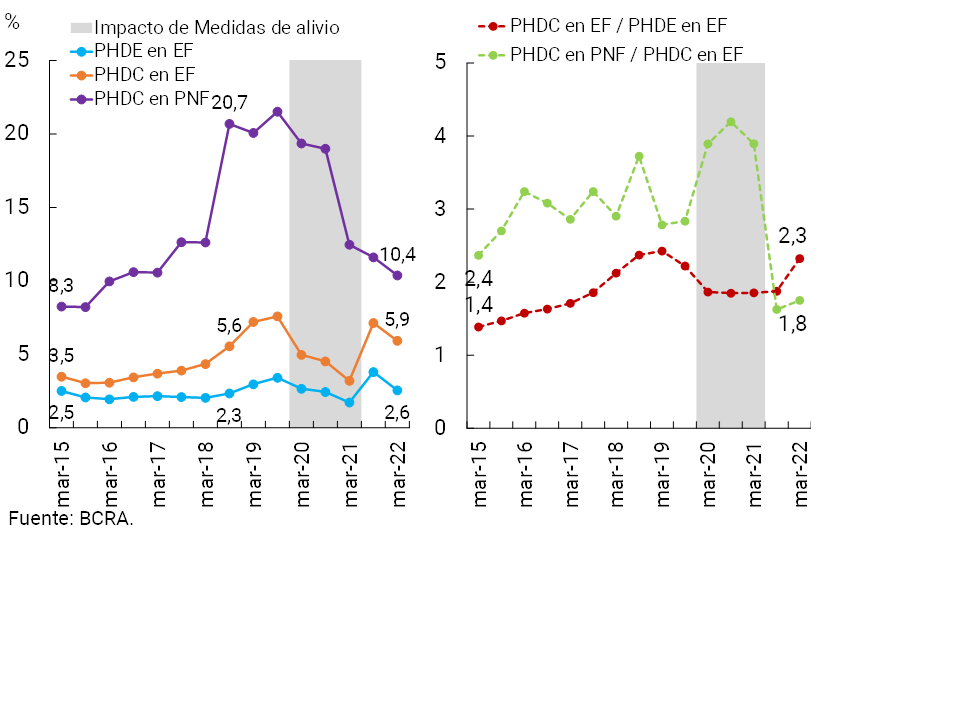
From the above analysis of indicators of exposure of the set of FIs to PHDC (moderate and decreasing), of credit per capita (also decreasing, with some indication of an increase in the relevance of PHDC’s indebtedness in NFPs), of the materialization of PHDC’s credit risk in EF (with slightly increasing and relatively higher levels of irregularity compared to PHDE), together with the hedging constituted by the sector and its recent dynamics (see Chapter 2 of the IEF), it appears that the financial system maintains its characteristic of resilience in the face of this type of potential vulnerability. To further illustrate this last point, a sensitivity exercise (hypothetical, extreme and unlikely) can be carried out to measure the magnitude of possible shocks on PHDCs and to assess the relative importance of the coverage available to all FIs. For example, if: (i) we assume that you migrate to a situation of non-payment of the balance of PHDCs that are regular in FIs, but that have irregular debts in other FIs and/or in PNF98; and (ii) it is considered that the forecast for this part of the portfolio is currently only 1% in the corresponding FIs (because it is in a “normal” situation in FI); then an impact of only 4% of the aggregate regulatory capital would be generated.
Within the framework of macroprudential monitoring, the BCRA will continue to analyze these and other sets of debtor groups (as well as sources of interconnection between economic and financial actors) whenever it considers that they can contribute to a better assessment of the sources of vulnerability for the financial system.
Section 3 / Cryptoassets. Some recent developments and main implications
Technological advances combined with changing user preferences mean that participants in the financial sector operate in a dynamic environment. Among the most relevant recent developments are cryptoassets, which imply potential benefits and risks99. Faced with this scenario, regulators have tended to focus their efforts on strengthening monitoring tools, as well as alerting the public to the risks of operating with them. Crypto-asset markets have evolved rapidly in the recent past in terms of their level of capitalization (see Figure A.3.1, panel A). However, according to the latest FSB100 risk assessment, despite their recent developments, crypto-assets still represent a small portion of the total assets of the global financial system (approximately 1%). Likewise, direct connections between cryptoassets and financial institutions, while growing, remain limited, and episodes of volatility have not spread to traditional financial markets and infrastructure. Crypto assets are not widely used in critical financial services, includingpayments 101. Recently observed episodes of tension seem to reinforce these key messages102.
Figure A.3.1 | Market capitalization of cryptoassets
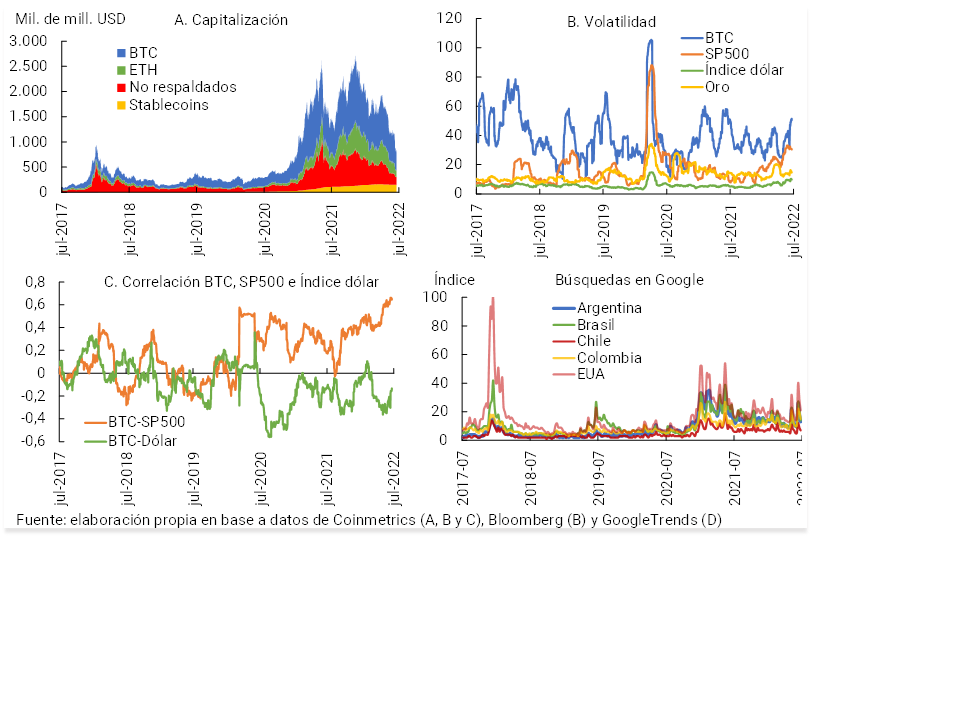
There is currently no universally accepted classification of cryptoassets. However, there is a growing consensus at the level of some jurisdictions and standard-setting bodies (SSBs) around the application of a functional approach, considering them as instruments that can be used for payment purposes, for investment purposes or for exclusive access to a digital service or platform. Recent developments suggest a complementary classification, which differentiates between first-generation cryptoassets, i.e. those instruments without intrinsic value or a centralized entity that supports their issuance and circulation (‘unbacked crypto-assets’, e.g., bitcoin), and those that, even without intrinsic value, have some explicit stabilization mechanism aimed at maintaining their value with respect to other assets. commonly known as103 stablecoins. As a result, a cryptoasset tends to be characterized as a digital representation of value of a privatenature 104, whose value depends on market supply and demand. On the supply side, its value is associated with the use of cryptography and DLT technology and, on the demand side, with the beliefs of its holders that it will fulfill traditional financial functions in the future105
The risks originating in cryptoassets that are of interest to financial stability are all those that, through some transmission channel, can end up becoming sources of systemic financial risk. A number of risk-associated vulnerabilities will then be assessed at the level of individual entities. Then, the possible transmission channels associated with risks at the aggregate level will be described (FSB 2018106)107.
Liquidity risk could materialize in a scenario of high adoption with substitution of bank deposits. This situation would reduce the financial system’s ability to obtain funding. Market risk could materialize in the event that an entity assumed exposure to crypto-assets on its balance sheet and subsequently decreased its price in local currency. Credit risk could be observed in the event that holders of cryptoassets are unable to meet their credit obligations as a result of the high volatility of these instruments (see Chart A.3.1, panel B), affecting financial institutions with exposures on their balance sheet. Other relevant risks from the point of view of financial stability analysis emerge from the underlying technological infrastructure, such as the possibility of financial losses caused by operational disruptions and/or cyberattacks. Associated with these aspects, many activities in DLT environments (e.g., the “mining” of cryptoassets) are concentrated in a relatively small number of agents, a situation that could have implications for the integrity of the market.
The materialization of financial, operational, and/or cyber risks in the crypto-asset ecosystem can undermine public confidence (FSB 2018). Trust is an essential aspect in the context of cryptoassets, since their prevalence as a payment instrument depends on the individuals who participate in the system trusting their usefulness. Finally, the risks originating in these markets could be transmitted to the financial system in the context of increasing interconnections with regulated entities. Recent developments in the correlation between bitcoin yields and the SP500 suggest a backdrop of increasing interconnections (see Figure A.3.1, panel C).
The aforementioned risks have the potential to affect financial stability if they become a source of systemic risk in a context of high adoption. For example, in the event that the level of adoption of cryptoassets as a store of value increases significantly, especially first-generation ones, any significant price variation could affect their holders (wealth effect). In addition, there could be a process of substitution between cryptoassets and reserve currency that can affect the level and volatility of the exchange rate108. This potential increase in the level of adoption as a store of value may be significant in emerging economies109.
The risks could be amplified in the event that their adoption increases, in the long term, for payments and compensations. The payments function is associated with stablecoins while clearing activity can be linked to first-generation cryptoassets, based on the advantages offered by DLT technology in terms of operational resilience. This increase in adoption could lead to a process of substitution between crypto assets, central bank money, and bank deposits. This could reduce the holding of working capital and deposits in domestic currency, weakening the role of banks in the process of financial intermediation. This would tend to reduce the monetary authority’s control over the economy’s liquidity, thereby weakening the effectiveness of monetary policy by affecting its transmission channels. In addition, this substitution process could make it difficult to manage the exchange rate.
In the context of monitoring activities, a tool to have a first approximation of the degree of public interest is to survey the evolution of Internet searches for terms linked to the ecosystem110. Preliminarily, both globally and locally, it is estimated that the relative interest in cryptoassets has increased at the end of 2020 and the beginning of 2021 and then decreased during 2022 (see Figure A.3.1, panel D). These approximations allow us to conjecture a certain degree of association between the degree of global and domestic interest that transcends the idiosyncratic context of each economy111.
Regarding regulatory developments, in the recent past there has been a certain intensity at the forum and SSB levels in the evaluation and approach of the possible benefits and risks for the global financial stability of cryptoasset markets112. In this context, the FSB is making progress in its monitoringtasks 113 and in addressing the regulatory and supervisory implications of stablecoins, as well as first-generation cryptoassets and the DeFi segment114. Among the SSBs, the advances in the prudential treatment of crypto-asset exposures by banks115, the analysis of the challenges of implementing AML/CFT116 standards and in the understanding of the DeFi segment117 stand out. At the level of individual jurisdictions, regulatory attention has been far from homogeneous, partly reflecting the challenges involved in addressing the regulatory and supervisory approach to cryptoassets. For its part, the BCRA is carrying out monitoring activities in order to advance in the understanding of the use cases for cryptoassets at the domestic level. In this framework, in conjunction with the CNV, in May 2021 it published an alert118 which highlights, among other elements, the high volatility of these instruments, the risks associated with operational disruptions and cyberattacks, ML/CFT risks, as well as the potential non-compliance with foreign exchange regulations and the absence of safeguards provided for by current regulations. Recently, the BCRA has decided that financial institutions under its regulation may not participate (directly or indirectly) in the supply of cryptoassets119, seeking to mitigate the risks that activities with these instruments represent both for users and for the financial system as a whole.
References
1 The wave of the Omicron variant was shorter and with less lethality than previous ones. However, the most recent outbreaks of Covid-19 implied new restrictions in China, hindering trade flows. Thus, in the first quarter of the year, a slowdown in the expansion of the world’s main economies is generally observed (with lower growth forecasts for 2022 and 2023). For more information on the evolution of the economy at a global level, see the latest edition of the Monetary Policy Report.
2 Likewise, as of June, the monetary entity began with the reduction of the balance sheet (Quantitative Tightening), which implies a monthly contraction of the balance sheet of US$47.5 billion until September, the month after which the monthly reduction increases to US$95 billion.
3 The rise in the yields of government instruments also occurred among different developed economies, partly linked to changes in their monetary policies. For example, in June the ECB confirmed the end of its net asset purchases, in addition to announcing that starting in July it would begin a cycle of hikes in monetary policy interest rates. For its part, the Bank of England had already begun the rate hike cycle at the end of 2021, with further hikes in February, March and May.
4 Periods of sustained interest rate hikes in developed economies are associated with portfolio outflows from emerging economies, appreciation of the dollar (with an effect on commodity prices), and higher interest rates in local markets. These movements depend on the context in which interest rate hikes occur (in response to what type of shocks) and in what form (how much they rise, how fast and if it is in a surprising way), in addition to the development of local markets (more accentuated impact in less developed markets).
5 The work agenda proposed in international forums on this issue includes, in addition to promoting the creation of better statistics to understand the interjurisdictional interconnection implied by NBFI, portfolio flows differentiated by currency and the characteristics of the different types of foreign investment funds that invest in each country (concentration, leverage, etc.). Regarding the reference topic, see the document US Dollar Funding and Emerging Market Economy Vulnerabilities (FSB, 2022).
6 For example, in the case of the Brazilian real, the currency has accumulated an appreciation of 5% so far in 2022.
7 The yield curve in dollars maintained its negative slope.
8 The market maker programme is consolidated, with sustained participation of these agents.
9 Gross financing amounts. Amounts associated with exchange operations are not considered.
10 In general, a lengthening of the terms of dollar-linked placements was observed in recent months, due to long-term placements for significant amounts by large companies.
11 For a total equivalent of about $22,000 million (11% of the total of NOTES placed in January-May). 85% was dollar-linked and the rest in pesos.
12 Operations in dollars not linked to exchange processes have remained at limited levels (representing less than 10% of the total placed in the local market) after 2019, while dollar-linked operations gained dynamism. See Recent trends in placements of negotiable obligations in IEF in the second half of 2021.
13 The effect on the balance sheets of companies of having closed access to the official foreign exchange market would have led them in some cases to a situation of bankruptcy, making it impossible to access credit for refinancing and exposing them to hostile purchases. See recent press release on private debt restructuring.
14 Considering balances of availabilities, concepts included in the integration of minimum cash and other instruments of the BCRA, both in national and foreign currency.
15 Made up of those financial institutions whose assets are greater than or equal to 1% of the total assets of the financial system. For more details, see ordered text of Authorities of financial institutions.
16 The LCR assesses the availability of assets to deal with a potential outflow of funds in a short-term stress scenario. The LCR stood at 2 in the first quarter of the year (compared to a regulatory minimum of 1, following the international recommendation). For more details, see the ordered text of the Liquidity Coverage Ratio (LCR).
17 BIS survey according to Basel III Monitoring Report of February 2022.
18 This indicator contemplates that financial institutions have funding aligned with the terms of the businesses to which it is applied (assets). The NSFR reached 1.9 for entity group A in March 2022 (required minimum of 1, as well as the BCBS recommendation). For more detail, see the ordered text of the Stable Net Funding Ratio (NSFR).
19 BIS CPMI, November 2016, https://www.bis.org/cpmi/publ/d154.pdf.
20 See the evolution of immediate transfers in recent months in the Report on Banks. As of May 2022, these transfers grew 78% year-on-year in amounts and 32% in real terms in amounts, driven both by operations between accounts opened in financial institutions (via CBU), as well as by those involving accounts in payment service providers (PSPs) (from and/or to a CVU).
22 For more detail, see Cybersecurity Glossary.
24 See, among others, Section 3 of the IEF of June 2021 and Box 1 of the IEF of December 2021
25 For example, international bodies and standard-setting bodies such as the G20, the Financial Stability Committee, and the Basel Committee on Banking Supervision, have focused on the need for quality data to understand the effects of climate change on the financial system, to achieve the measurement and assessment of climate-related financial risks, as well as the dissemination of information.
26 In this case, in addition to loans, financing through public securities is considered
27 Financing to the private sector net of the total forecasts in terms of assets increased in the period to 29.6% at the systemic level.
28 Part of this change was explained by the transfer of debtors classified as in an irregular situation to off-balance sheet items (irrecoverable), in accordance with the regulations in force. It is worth mentioning that these movements do not have an impact on the financial system’s income statement, as they are assets that were already fully forecasted. When considering the last seven months to April 2022, it is estimated that the irregularity ratio would have also fallen but by a smaller percentage (0.5 p.p.) if financial institutions did not send irregular to irrecoverable balance sheets off the balance sheet in the period. In other words, the effect of this transfer is estimated to be equivalent to 1 p.p. of the total credit balance (in 7 months). It is noteworthy that in the average of the last 15 years the pass-through effect on the ratio reached 0.8 p.p., in line with the current numbers.
29 The universe of debtor legal entities classified as SMEs is considered.
30 Currently, the BCRA’s credit promotion policy is mainly implemented through the Productive Investment Financing Line (LFIP), although from the beginning of the COVID-19 pandemic and until the end of 2020, credit policies were especially relevant to face this scenario (for more details, see Section 4 of IEF I-20 and Section 5 of IEF II-20).
31 This positive performance is in line with the results of the Credit Conditions Survey (CCS) on approval standards for the last 2 years.
32 As mentioned, in this Box the monthly information available considers SMEs that are constituted as legal entities. An approximation of the total credit in pesos to MSMEs (both legal entities and individuals) as of April 2022 yields a level that would increase the exposure of the financial system to this segment by 1.6 p.p. of total assets.
33 This occurred in a context in which the largest institutions in the system increased their exposure to this segment of debtors. Thus, in the last 2 years to April, the number of entities that had an exposure to SME credit of more than 4% of their assets fell from 24 to 20, while in terms of the assets accumulated by these entities the increase was significantly higher, going from 22.4% to more than 59.1%.
34 Similar indicators that consider total credit to the private sector are also at high levels. For more detail, see section 2 of this Report.
35 Economic activities were grouped into 4 categories: (i) Greater weight and rest (Industry, Commerce, Construction, Financial Intermediation, and Real Estate and Business Activities), (ii) Primary Activities (Agriculture, Fishing, and Mining), (iii) Greater Risk of Contagion (Transportation and Communications, Hotels and Restaurants, and Other Social and Community Services), and (iv) Basic Services (Public Administration, Health, Education, and Electricity, Gas and Water). For more information on this grouping, see IPOM
36 Moreover, in the case of the activities considered to be at greater risk of contagion, the exposure of the financial system would amount to 3.6% if the debt of formal employees of these companies is also taken into account (an increase of 2.2 p.p. with respect to the record that considers only the financing of companies). Non-performing loans for the whole (higher-risk activities, taking financing from companies and their employees) would reach 3.2% (+1.2 p.p.). In turn, if we compare the indicators of exposure and risk materialization of these activities with respect to February 2020 (the month prior to the beginning of the pandemic), they have decreased by 5.3 p.p. and 0.2 p.p., respectively.
37 For previous results see IEF II-18. The results obtained complement those that emerge from the tension tests carried out annually by the BCRA. Such stress tests are prepared using macroeconomic scenario analyses, not only on credit risk but also on liquidity, market and business risk (for more detail, see Section 4 of the IEF I-17).
38 For the financial system, the irregularity ratio in this period reached a maximum of 6.2% prior to the start of the pandemic.
39 For each financial institution, it is assumed that the balance of forecasts that would correspond to the portfolio in an irregular situation arises from the totals minus the theoretical ones for the portfolio in a regular situation (according to the criteria of the minimum regulatory forecasts for risk of uncollectibility)
40 Defined as the PRC with the least minimum regulatory requirement, all in terms of that requirement
41 These sectors are: Transport and communications, Hotels and restaurants, and Other social and community services. For more detail, see IPOM.
42 The impact of derecognition of these loans net of pensions from the balance sheet is considered.
43 This is equivalent to 35.7%, far exceeding the average of the last 10 years of 13%.
44 For more information, see Box 3 of the IEF II-21
45 In mid-April 2022 – through Communication “A” 7491 – it was established that the reduction of the minimum cash requirement is 34% of the financing that is channeled to investment projects (until then it was 30% of them).
47 The current residual balances of the financing attributed to the 2020, 2021 and 2021/2022 quotas are considered. Information subject to rectification.
48 As of February 2020 (date prior to the beginning of the pandemic).
49 Companies that have accessed the LFIP and register at least one employee are considered.
50 According to data as of March 2022 from the Ministry of Labour, Employment and Social Security.
51 For more detail, see the results of the Credit Conditions Survey (ECC) for the first quarter of 2022.
52 Balances as of March as a percentage of GDP estimated in the first quarter of 2022 without seasonality. In addition to loans from all financial institutions regulated by the BCRA, it includes: financing of credit card systems, loans from mutuals and cooperatives (based on INAES), financing from other non-bank credit providers registered with the BCRA, financing in the portfolio of financial trusts not linked to infrastructure, FGS loans (including PRO.CRE.AR portfolio), negotiable obligations issued by the non-financial private sector with local legislation, deferred payment checks, loans linked to leasing and factoring and external financing (based on INDEC) through bonds and loans (not including credits and commercial advances).
53 Includes loans granted, among others, by retail chains selling household appliances, financial companies (e.g., those that provide personal loans), and fintechs. See Report on Other Non-Financial Credit Providers.
54 Partly due to the evolution of the exchange rate and the CPI, given the existence of dollar-linked ON, in dollars and UVA (less than 10% of the balance of ON with local legislation is in nominal pesos).
55 Companies with public offerings represent a segment of the local corporate sector characterized by companies of relative size that are generally large/medium-sized (the analysis developed here does not include companies under the simplified regime for SMEs). For more details on coverage and methodology, see sections on “Corporate Sector Equity Situation” in IEF I-17, “Financial Situation of Publicly Offered Companies” in IEF I-19, and subsequent updates in more recent editions of the IEF.
56 In 2021 there were no cases of companies having problems paying for services or capital of negotiable obligations (NSs), as opposed to 2020 (with specific cases for insignificant amounts in relation to the total balance of NEOs).
57 It is approximated in a simple way based on three financial ratios that are particularly relevant for measuring credit risk: interest coverage, leverage and acid liquidity. For more details on the methodology, see “Financial Situation of Publicly Offered Companies” in IEF I-19.
58 At the beginning of 2022, it is estimated that the burden of servicing household bank debt slightly exceeded 13% of the wage bill.
60 To make it comparable between countries, it is converted to US dollars using the official exchange rates of each country at current prices. If the currencies expressed in purchasing power parity are considered, the conclusions are not significantly modified.
61 A similar conclusion is obtained when considering the total administrative expenses in terms of assets. Administration expenses are made up of personnel expenses (currently almost 60% of the total, includes salaries, social charges and benefits) and a remainder (40% of the total, includes services and fees, amortizations and others —electricity, stationery, rents, etc.—).
62 This paragraph seeks to explain the differences in identity: GP = GP/E P C/E x P/C Where GP = expenditure on personnel; E = employment; P = loans; C = accounts. That is, operational efficiency (GP/P) depends on the unit cost of employment (GP/E), productivity (C/E) and scale (P/C).
63 Nominal implicit interest rates arising from the main assets (loans to the private sector) and liabilities (cost of funding for deposits, considering the minimum cash regulations) in pesos are considered. The corresponding accrued flows of financial income and expenditure are considered. Concepts such as administrative expenses, tax expenses, cost of capital or other concepts related to coverage for risks intrinsic to financial intermediation operations are not considered. In this estimate, implied interest rates are built by accumulating the flows of the last 2 months and annualized.
64 UVA deposits in force since February 2020 (Communication “A” 6871), which, although they have a minimum term of 90 days, can be cancelled as of the 30th day obtaining a return. If the early cancellation option is exercised, the taxation accrues a fixed nominal rate for the period effectively elapsed. This interest rate has increased on several occasions since the end of 2021, going from 30.5% TNA (35.2% TEA) to 48% TNA (60.1% TEA) in mid-June 2022, reflecting what is evidenced in the minimum rates of traditional fixed terms.
65 Those with a minimum term of at least 90 days, without the option of early cancellation. When operating at maturity, the accrued interest is calculated and the principal is updated based on the value of the UVA at the time.
66 Considering the strata of amount, the balance of UVA deposits, which is between $1 and $20 million, showed the highest relative growth in recent months (and account for 37% of the total balance of traditional UVA fixed-term deposits as of March 2022), followed by those of less than $1 million (representing 22% of the total balance).
67 For more details, see the ordered text of the Liquidity Coverage Ratio (LCR) and the Net Stable Funding Ratio (NSFR).
68 Group A is made up of the entities with the largest relative size (1% or more of the assets of the sector as a whole). For more details, see Communication “A” 7403
69 At the aggregate level, the LCR stood at a record of 2 at the end of the first quarter, 0.2 less than in September and March 2021. In real terms, high-quality liquid funds (FALAC, ratio numerator) fell by 6.2% in real terms compared to the last IEF. In the formation of the FALAC, there was a greater participation of national public securities, to the detriment of the deposits of the entities in the BCRA. Net outflows of funds (SENT, denominator of the ratio) from the sector increased by 4.4% in real terms compared to the previous IEF. Within the SENT, in line with the aforementioned performance in terms of depositor profile, unsecured wholesale funding increased slightly in the period, while foreign currency deposits lost weighting
70 The level of the NSFR was around 1.9 for Bank Group A, similar to the record evidenced 6 and 12 months ago. Regulatory capital was the stable available funding (ratio numerator) that gained the greatest weighting in the last 6 months, to the detriment of demand and term deposits with a residual maturity of less than one year. On the other hand, among the components that make up the required stable funding (denominator of the ratio), in the last half of the year to March, unrestricted debt securities that are not in default (and that are not part of Tier 1 assets) gained relevance, while unrestricted loans granted to the financial sector (with a maturity of less than 6 months) reduced their relative importance in the period.
71 Estimated based on the data of the Minimum Capital Information Regime (flows that would generate assets (income) and liabilities (expenditures) in national currency through financial intermediation weighted by the time band to which they belong and that are not valued at market price).
72 Mainly monetary regulation instruments of the BCRA and national public securities.
73 For some specific entities, this ratio has less limited values. Of the total of 79 entities, as of May-22, only 17 have ON in circulation.
74 Including both instruments placed in local and international markets. The rest of the balance is expressed mostly in nominal pesos (17% of the total) or in UVA (9%).
75 So far this year, there have been no placements of Notes by financial institutions in the international markets. There were also no exchanges of ONs linked to financial institutions.
76 For more details, see Press Release of May 5, 2022.
77 The criterion used to determine the systemic importance of an entity was based on its size, degree of interconnectedness, substitutability of its business and complexity. For more details on the methodology used, see here
78 In terms of the volume of assets under management, the most important institutional investor at the local level continues to be the Sustainability Guarantee Fund, followed by the Mutual Fund industry and insurance companies. It should be noted, however, that there are differences in the form of valuation of certain assets such as government securities, which account for most of the portfolio considering the aggregate portfolio of each of the three institutional investors mentioned
79 See section 5 IEF I-21
80 In December 2021, those weightings were 36% and 48%, respectively.
81 The prices of fixed-income instruments saw falls in prices in May, with an increase in volatility, with an impact on withdrawals of funds from the industry in that month. This performance was maintained in June. In the future, the BCRA will continue to operate on the curve to guarantee the liquidity of Treasury instruments and the support of their prices (as it did in June) and will implement a liquidity line, exclusive to FCI, for Treasury debt securities.
82 Considering the portfolio of fixed-income FCIs, the holding of National Government debt with CER adjustment went to 54% of the total in May of this year, while, as a reference, as of December 2019 it amounted to 4%. Unlike money market FCIs, forward operations and availabilities (mostly deposits in the financial system) represented only 5.2% of the total fixed-income FCI portfolio as of May 2022.
83 The average amount traded per day is equivalent to less than 1% of the balance of private sector deposits.
84 From the second half of 2021 until the end of May, the number of nodes increased from 57 to 62 (referring to financial institutions participating in the market). The greatest interconnection is observed in indicators such as simplified average grade, diameter, shortest path and reciprocity both in relation to the previous period and on a year-on-year basis. For the definition of these and the main terminology used in network analysis, see Section 3 of IEF II-18 and Section 4 of IEF I-19.
85 In the currency markets, the Russian ruble went from a value of around 76 units per dollar in the first half of February to values close to 140 at the beginning of March, although it later recovered all the value lost, depending on the different measures taken by Russia. In the case of the Ukrainian currency, the country’s central bank established a fixed parity against the dollar since the beginning of the war. EMBI spreads for Russian and Ukrainian debt jumped to levels on average close to 3,500-3,700 bps in March (the liquidity of these instruments would be much more limited). For more information on the impact of the conflict on the real economy, see the latest editions of the Monetary Policy Report.
86 The Geopolitical Risk Index (GPR) prepared by the Federal Reserve showed a jump towards March-April to levels not seen since the War with Iraq (2003) and the attack on the Twin Towers (2001). The Economic Policy Uncertainty Index (UPR) grew strongly in March 2022, although it remains below what was observed in the face of the COVID shock.
87 Levels not seen since the beginning of 2021 (episode related to the actions of retail traders gathered in Reddit forums), but well below those observed in March 2020 (initial reaction to the shock of the pandemic).
88 Index built on the basis of 6 variables: EMBI Global spread, CEMBI spread, implied volatility of emerging currencies, price-to-book value ratio of the MSCI emerging index, implied volatility of oil and gold price.
89 In the United Kingdom and Germany, there were also rises in the yields of short- and long-term sovereign bonds, accompanied by increases in the monetary policy interest rate (Bank of England) or expectations of an early start to an upward cycle (ECB).
90 In this section, a country is considered to be an exporter/importer of raw materials which, on the basis of statistics published by the United Nations, are net exporters/importers of this type of product.
91 While the currencies of commodity-importing countries depreciated by up to 4% on average after the beginning of the conflict, the currencies of exporting countries appreciated by 3%.
92 Given the sanctions in place, in June Russia ended up defaulting on the payment in dollars of overdue bonds. Russian government and corporate debt was excluded from the indices produced by J.P. Morgan (EMBI+, CEMBI) at the end of March, while MSCI excluded Russia from the emerging category (placing it in the standalone category). So far, this has not generated disruptive situations due to portfolio rebalancing. In a context of low liquidity, the dismantling of positions would be carried out gradually.
93 For definition, see Ordered Text of Non-Financial Credit Providers as well as the Report of Other Credit Providers.
94 For more information, see Report on Other Non-Financial Credit Providers for December 2021.
95 It can be considered that there is dispersion in terms of this indicator for the FIs. In particular, when ordering the FIs by their level as of March 2022, the first and third quartiles of the distribution stood at 32.1% and 60.6%, respectively.
96 Consequently, in this period, the relevance of exclusive debtors increased.
97 It is worth clarifying that this does not imply that PHDCs take 25.6% of their financing in NFP. The calculation with medians is adequate to account for what happens within the populations without being influenced by significant extreme values (values that would have a greater impact in the case of averages). If we consider the averages, PHDCs take 25.1% of their financing in NFPs, 3 p.p. more than 4 years ago. Finally, it should be noted that the information available in the BCRA’s Debtors’ Central Bank does not necessarily reflect the complete universe of NFPs. This situation depends on the information requirements present in the regulations in force.
98 This situation is met by 12% of PHDCs, which have a regular balance in EF equivalent to 11% of all PHDCs in PE.
99 For a detailed account of the operation of distributed ledger technology (DLT) associated with cryptoassets, see, for example, the section “Cryptoassets: technological innovation and financial stability” of IEF II-18.
100 FSB (2022a), Assessment of Risks to Financial Stability from Crypto-assets.
101 However, it is difficult to assess the tipping points given the rapid evolution of these markets and the existing data gaps, which make it difficult to assess the extent of the use of cryptoassets in the financial system, thus limiting the authorities’ assessment of risks
102 Crypto asset prices and declined dramatically during May 2022, bringing the global size of the ecosystem to a level similar to that of February 2021. The sell-off was linked to events within the ecosystem, in particular, the collapse of TerraUSD/Luna, the largest algorithm-based stablecoin. For more details on the structural vulnerabilities of the crypto-asset ecosystem, see, for example, BIS (2022), Annual Economic Report 2022.
103 In the light of recent tensions, the stabilisation mechanisms of these instruments have revealed serious limitations. For more information on stablecoins, see BCRA (2019), Financial Stability Report, Second Semester.
104 Cryptoassets should not be confused with the digital version of central bank money. In this regard, see Katz (2022), What is Central Bank Digital Money (CBDC)? An introduction to its main features, opportunities, and potential
risks.
105 In the case of cryptoassets with payment claims, the belief should be associated with the possibility that cryptoassets will function as a means of payment and as a store of value. For a reference on the value of cryptoassets and the associated beliefs see, for example, Garrat & Wallace (2016), Bitcoin 1, Bitcoin 2, … : An experiment in privately issued outside monies.
106 FSB (2018), Crypto-asset markets: Potential channels for future financial stability implications..
107 Practically all the literature associated with cryptoassets and financial stability refers to advanced countries. With the exception of IMF work on cross-border payments and currency substitution (IMF 2020, 2021, FSB 2020, He et al 2022).
108 See, for example, Giupponi, E. (2022). Digital assets and financial stability. Risks of an increase in the demand for bitcoin on the volatility of the exchange rate in Argentina, UCEMA.
109 FSB (2020), Regulation, Supervision and Oversight of Global Stablecoin Arrangements“; see, also, IMF (2021), Global Financial Stability Report October 2021.
110 The data are obtained from the Google Trends platform. The information is indexed to the number of searches for a keyword (Choi and Varian 2009, 2011) and not to the search volumes themselves. For methodological detail , see Big Data Tools: Can we take advantage of Google Trends to forecast some relevant macro variables?, Blanco, 2014, XLIX AAEP Annual Meeting.
111 For an alternative estimate of the evolution of the cryptoasset market at the local level, see, for example, Coindance. To estimate by local carrier, view published data using local carrier APIs. It is important to note that these data sources do not imply representativeness with respect to the data universe.
112 G20 (2022), Communiqué FMCBG Meeting February 2022.
113 FSB (2022a).
114 FSB (2022b), FSB Work Programme for 2022. DeFi refers to the so-called decentralized finance (decentralised finance), which is an emerging segment consisting of a set of alternative financial markets and products that operate through so-called “smart contracts” built on the basis of DLT technology.
115 BCBS (2022), Prudential treatment of cryptoasset exposures – second consultation.
116 FATF (2021), Second 12-Month Review of Revised FATF Standards – Virtual Assets and VASPs.
117 IOSCO (2022), IOSCO DeFi Report.
118 BCRA, CNV (2021), Alert of the BCRA and the CNV on the risks and implications of cryptoassets.
119 BCRA (2022), The BCRA discourages the supply of cryptoassets through the financial system.
Glossary of abbreviations and acronyms
€: Euro
to.: Annualized
AFIP: Federal Administration of Public Revenues
ANSeS: National Social Security Administration
RWA: risk-weighted assets
ATM: Automated Teller Machine
BADLAR: Buenos Aires Deposits of Large Amount Rate (interest rate paid for 30 to 35-day fixed-term deposits, more than $1 million, average of entities)
ECB: European Central Bank
BCBA: Buenos Aires Stock Exchange
BCBS: Basel Committee on Banking Supervision
BCRA: Central Bank of the Argentine Republic
IDB: Inter-American Development Bank
BIS: Bank for International Settlements
BoE: Bank of England
BONUSES: Fixed-rate Treasury bonds in pesos
CABA: Autonomous City of Buenos Aires
CAFCI: Argentine Chamber of FCI
Call: Interest rate on unsecured financial market operations
CCP: Central Counterparty (Contraparte Central)
CDS: Credit Default Swaps
CEMBI: Corporate Emerging Market Bond Index
CER: Reference Stabilization Coefficient
NVC: National Securities Commission
COVID-19: Coronavirus wished 2019.
MUST: Immediate Debit Payment Method
DPN: National Public Debt
DSIB: Domestic Systemically Important Banks
ECAI: External Credit Assessment Institution
ECB: European Central Bank
ECC: Credit Conditions Survey
USA: United States
EFNB: Non-Banking Financial Institutions
EMAE: Monthly Estimator of Economic Activity
EMBI+: Emerging Markets Bond Index
EPH: Permanent Household Survey
FCI: Mutual Funds
Fed: US Federal Reserve
Fed Founds: US Federal Reserve Benchmark Interest Rate
FGS: Sustainability Guarantee Fund
IMF: International Monetary Fund
FSB: Financial Stability Board
GBA: Greater Buenos Aires (includes all 24 matches)
A.I.: Year-on-year
IAMC: Argentine Institute of Capital Markets
IBIF: Gross Domestic Fixed Investment
IEF: Financial Stability Report
INDEC: National Index of Statistics and Censuses
CPI: Consumer Price Index
IPIM: Domestic Wholesale Price Index
IPMP: Commodity Price Index
IPOM: Monetary Policy Report
VAT: Value Added Tax
CSF: Liquidity Coverage Ratio
LELIQ: Liquidity Bills of the Central Bank of the Republic of Argentina
LFPIF: Financing line for production and financial inclusion
LR: Leverage Ratio
MAE: Electronic Open Market
MERCOSUR: Southern Common Market
Merval: Buenos Aires Stock Market (benchmark stock market index)
MF: Ministry of Finance
MH: Ministry of Finance
MSMEs: Micro, Small and Medium Enterprises.
MSCI: Morgan Stanley Capital International
MULC: Single and Free Exchange Market
NIC: International Accounting Standard.
IFRS: International Financial Reporting Standards (IFRS)
OECD: Organization for Cooperation and Development Ec.
ON: Negotiable obligations
OPEC: Organization of the Petroleum Exporting Countries
P.B.: The Basics
P.P.: Percentage points
PEN: National Executive Branch
PGNME: Global Net Foreign Exchange Position
GDP: Gross Domestic Product
PN: Net Worth
PPM: Mobile Payment Platform
SMEs: Small and Medium Enterprises
REM: Market Expectations Survey
ROA: Return on assets
SWEE: Return in terms of equity
ROFEX: Rosario Futures Exchange (Mercado a término de Rosario)
RPC: Computable Patrimonial Liability
S&P: Standard and Poor’s (Index of the main stocks in the US by market capitalization)
s.e.: Series without seasonality
SEFyC: Superintendence of Financial and Exchange Institutions
NFPS: National Non-Financial Public Sector
SGR: Reciprocal Guarantee Society.
TCR: Real exchange rate
TM20: Interest rate for fixed-term deposits of 20 or more million pesos or dollars.
TN: National Treasure
TNA: Annual Nominal Rate
Trim.: Quarterly / Quarter
ICU: Utilization of Installed Capacity
EU: European Union
US$: US Dollars
UVA: Unit of Purchasing Value
ICU: Housing Unit
UVP: GDP-Linked Units
Var.: Variation
VIX: S&P 500 volatility
WTI: West Texas Intermediate
Share on


