Summary
Since the publication of the previous edition of the IEF (December 2020), the financial system continued to perform its functions without experiencing episodes of stress, preserving a set of strength traits that distinguish it and generate protection against its main sources of vulnerability given its intrinsic exposures to risks. This occurred within the framework of the policy measures applied in the face of the COVID-19 shock, which helped to consolidate the economic recovery at the local level in a framework of financial stability.
As is the case worldwide, local economic prospects continue to be conditioned by the evolution of the pandemic. The focus continues to be on the health situation – which in recent months led to the reintroduction of certain restrictions on mobility, although less intensely than a year ago – to which is added the progress in the application of vaccines that has been showing favorable results in line with a greater number of doses recently received. The achievements achieved, for their part, made it possible to advance in the targeting of the policy measures implemented. In this context, through its prudential actions, the BCRA continued to accompany the process of normalization of the functioning of the economy, seeking to mitigate a potential systemic impact of the shock on the private sector. Thus, the axes of the prudential policy implemented in the first part of 2020 were sustained, mainly aimed at: i. boosting credit to the private sector; ii. alleviating the financial situation of the private sector; iii. to promote bank savings in pesos in installments; iv. to maintain the slack in terms of solvency that the entities have; and V. Maintain and improve exchange regulations, preventing transitory imbalances between supply and demand from affecting the position of international reserves.
In the financial markets, on the other hand, mixed changes were observed in recent months, highlighting the lower exchange rate volatility, with accumulation of reserves by the BCRA. Also noteworthy is the progressive reconstruction of the domestic debt markets, a situation that allowed the Treasury to place debt above maturities, while the private sector evidenced a growth in real terms in its financing through the market.
For perspective, the situation remains challenging, given the presence of various potential risks in the near term. On the one hand, the external context continues to present a set of factors of uncertainty and vulnerabilities. With respect to the former, considerations prevail regarding the evolution of the pandemic and expectations regarding the effectiveness and sustainability of stimulus policies in developed countries. In terms of the sources of vulnerability, there are signs of over-appreciation in different market segments, growth in investment fund activity with pro-cyclical effects on the global financial cycle and increased leverage that raises doubts about debt sustainability, among others. In this context, a possible deterioration in the outlook and an increase in market volatility cannot be ruled out in the coming months. At the local level, expectations continue to be conditioned by the health situation, to which are added factors such as the open negotiation with international organizations (IMF, Paris Club) and the election process that will take place this year, among other factors. On the other hand, in view of an increase in the weighting of the operational risk factor related to the increase in teleworking and the greater use of digital channels to carry out transactions (as is the case globally), prevention and awareness actions are being developed focused on its mitigation, in addition to the regulatory framework and supervisory actions that the BCRA has in this area. While the aforementioned risk factors could have some impact on the financial system, an adequate degree of resilience in the sector is expected to continue to prevail, as observed so far.
Traditional financial intermediation with a low degree of sophistication and a high transactional component continued to be the main activity of the sector. In a context of relatively low credit depth in the economy, the financial system maintained high liquidity, solvency, and forecasting coverage, both with respect to recent history and compared to other countries in the region. Within the framework of the prudential regulations in force, mismatches in the system’s balance sheet (both currencies and maturities) remained limited, as did equity exposure to the public sector. The degree of direct interconnection of the institutions with each other and with the main institutional investors remained at relatively low levels, showing a decreasing path in the first case and a gradual increase in the second (role of the CRFs).
The balance between the potential vulnerabilities of the financial system and its strength traits showed some improvement in the margin (lower intensity in some vulnerabilities, in a context of higher risk coverage ratios). Compared to the previous IEF, there are some positive signs in terms of credit risk faced at the systemic level. During this period, there was a slight drop in the exposure of all institutions to the private sector, accompanied by signs of an improvement in the payment capacity of debtors. In this sense, within the framework of the actions implemented by the BCRA in conjunction with the PEN to temper the adverse effects of the pandemic context, since March 2020 both families and companies have benefited from a set of financial relief initiatives that gradually began to focus from the second quarter of this year. These contributed to limiting the deterioration of the financial situation of the private sector, avoiding a consequent adverse impact on the solvency of the aggregate of local financial institutions. Despite this improvement in the margin, for the rest of 2021 situations of tension in the payment capacity of debtors cannot be ruled out as long as any of the risk factors raised materialise – especially those concerning the level of economic activity – with this potential source of systemic vulnerability remaining the most important in relative terms.
A possible greater weakness in the financial intermediation process in the coming months constitutes another potential source of vulnerability for the system. If this scenario materializes, its sources of income could be affected and, eventually, its solvency – although starting from high levels. In this context, it should be mentioned that the system maintained positive levels of profitability in real terms, although decreasing. Over the next few months, the development of financial intermediation will be conditioned by the performance of economic activity, the latter influenced by developments regarding the second wave of COVID infections, public policies to address it and the vaccination process of the population.
A final relevant source of potential vulnerability for the financial system originates in the dynamics and composition of its funding sources. The real balance of private sector deposits in pesos decreased in real terms compared to the previous IEF. This performance occurred in the context of a lower monetary issuance by the BCRA based on the targeting of PEN assistance programs, the moderation of the process of multiplication of money given the aforementioned dynamics of credit and inflation levels above those of the previous semester. Beyond this performance at the margin, the total balance of private sector deposits in pesos accumulated a real year-on-year increase, highlighting the marked growth of the time deposit segment, which also increases so far in 2021. Faced with this potential source of vulnerability, the coverage of the financial system with liquidity margins remained high. Looking ahead to the short and medium term, in the event of a hypothetical scenario of greater volatility in the financial markets or a less dynamic than expected recovery in economic activity, they could have a certain impact on the demand for deposits (or their composition), with possible implications for the management of assets and liabilities in the financial system.
Going forward, the framework of uncertainty in terms of the development of the pandemic scenario – tempered by the recent acceleration in the vaccination process – continues to represent a challenge for the proper development of the economy in general and the financial system in particular. In a context in which the financial system has been showing a significant degree of resilience, the BCRA will continue its monitoring and evaluation of this scenario – in conjunction with the National Executive Branch – and, if necessary, will make use of the available tools in order to promote local conditions of financial stability.
1. International and local context
The international economic and financial scenario continues to be fundamentally conditioned by the evolution of the COVID-19 pandemic, although significant progress has been made with respect to the situation observed a year ago. After the publication of the last IEF at the end of 2020, the focus shifted to the second wave of infections, the appearance of new strains and the pace observed in vaccination campaigns globally. Although there is a recovery in the level of activity on a global scale (accompanied by an improvement in commodity prices)1, its pace is heterogeneous and uncertain. There is still significant uncertainty about the economic outlook, in turn linked to the continuity and effectiveness of the stimulus measures implemented in the different countries.
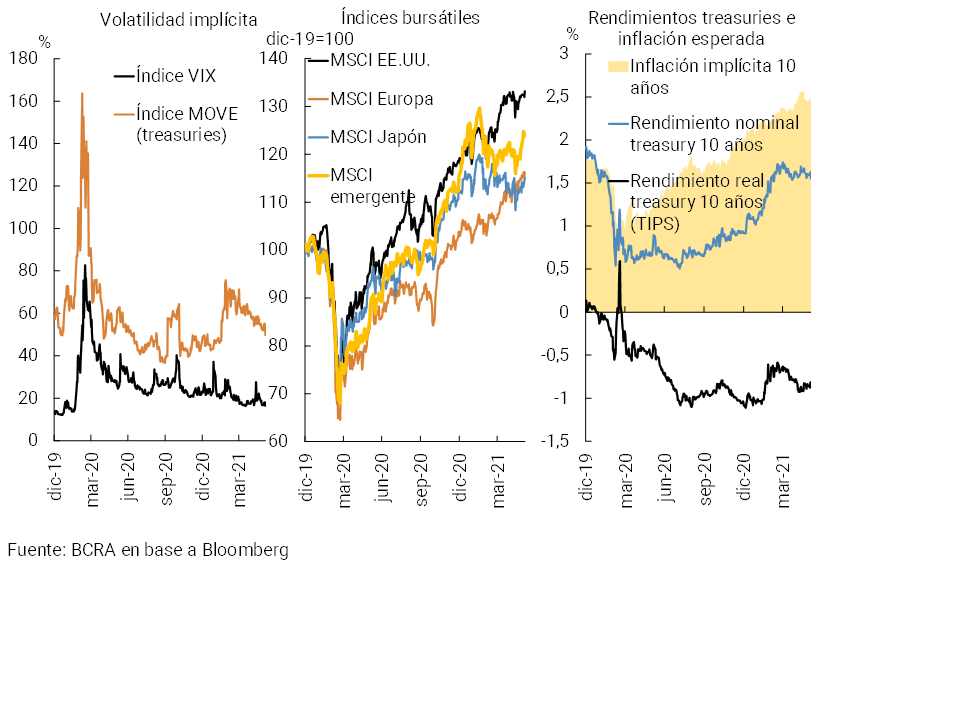
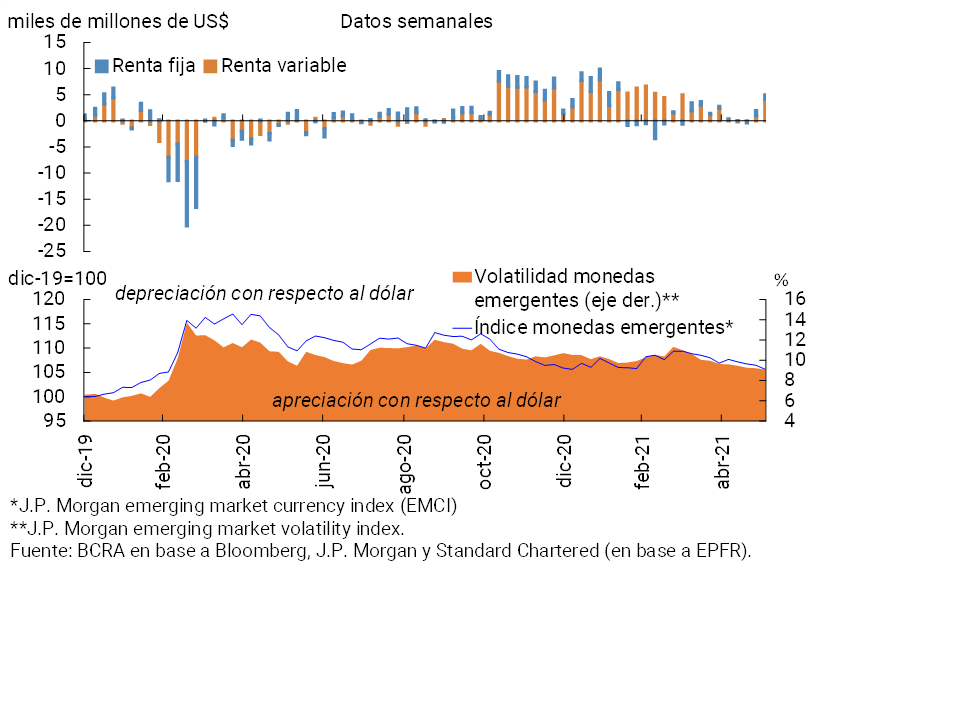
International financial markets have shown a favorable behavior so far this year (see Chart 1). However, due to the effect of the duration of the pandemic and the maintenance of a context of low interest rates in international markets, this positive trend is accompanied by the deepening of a series of vulnerabilities that have been commented on in recent editions of the IEFs. The existence of signs of over-appreciation in different markets (such as the stock markets of certain countries) is highlighted, with a certain disconnection between the prices of financial assets and the performance of the global economy. This generates the possibility of sudden corrections in prices due to changes in the perception of risk (such as the increase in volatility in the US stock market at the beginning of the year, an episode that finally had limited effects)2. On the other hand, with economic recovery and rising inflation expectations in certain developed economies, in a post-pandemic scenario, the markets’ attention would shift to the process of normalizing monetary policy and its impact on international interest rates. An indication of this already occurred in February and March, through the rise in the yields of 10-year US Treasury instruments3. More recently, at the Federal Reserve’s mid-June meeting, FOMC members’ forecasts showed for the first time a start of policy rate hikes (for the median) in 2023. A shift in expectations towards a faster-than-expected rise in interest rates in developed economies could have negative effects globally, in a context marked by over-appreciated assets, increased global leverage (and greater possibilities of rating downgrades or defaults) and increased non-bank financial intermediation. Although so far this year there have been inflows to investment funds specializing in emerging markets4 (see Chart 2), at the onset of the COVID-19 shock in 2020, they showed a strongly pro-cyclical behavior in a scenario of a run on liquidity that keeps the financial markets on alert —in particular equity funds specializing exclusively in LATAM that have exhibited net outflows since then—5
Graph 1 | International financial markets – selected variables
Graph 2 | Flows to investment funds specialising in emerging assets
Since the last publication of the IEF, the process of economic and employment recovery in Argentina continued to consolidate, although with heterogeneity between sectors. This was a function of the evolution of the epidemiological situation6 and the battery of policies applied in the face of the COVID-19 shock (including unprecedented fiscal and monetary stimuli and, more recently, progress in vaccination). The improvements have allowed progress to be made in a greater focus of policies on critical sectors of the economy; in this regard, it is worth mentioning the launch of the Productive Recovery Program II by the State at the end of last year, aimed at sustaining employment levels in the productive sectors that are still facing economic difficulties. This initiative was supported by the BCRA through the maintenance of financial relief measures for the segment of firms eligible for this Program. Although local growth expectations for 2021 have been improving at the margin, as in international terms, sources of uncertainty persist linked in large part to the evolution of the pandemic itself, including the evolution of cases, changes in health measures and progress in the vaccination process. among other factors. Added to this is the transition implied by the policies applied to address the macroeconomic imbalances that existed prior to the pandemic, with advances in the fiscal, external, and monetary situation7. In this regard, the BCRA continues to contribute to the normalization of the functioning of the economy, in coordination with the fiscal strategy of the National Government, in order to lay the macroeconomic foundations for a path of economic development with social equity8. As will be seen in the next sections of this Report, it is expected that in the face of this local context the financial system will continue to show an adequate degree of resilience, in line with what has been observed so far.
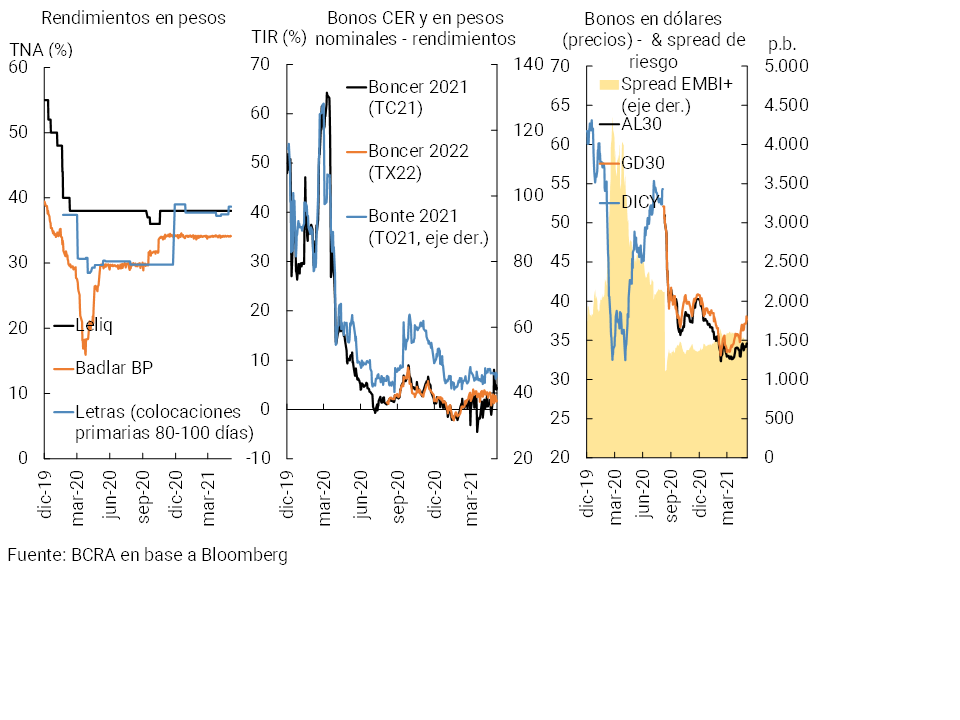
So far this year, the different variables linked to local financial markets had a mixed behavior. The lower volatility in the foreign exchange market stands out, after the tensions observed in the second half of 2020, which led to the application of a series of measures to achieve better currency management and prevent temporary imbalances. Thus, so far this year the BCRA managed to maintain an increasing trend in the balance of international reserves. Despite this, and while negotiations with the IMF and the Paris Club remain open, the prices of public securities in dollars have fallen since the publication of the last IEF, despite the fact that in May they showed some recovery in the margin (see Graph 3). On the other hand, in the local markets, the prices of public securities in pesos have accumulated improvements so far this year in their different segments, in a context in which the Treasury continued to renew the maturities of local debt with amounts awarded above the needs of each month, through different types of instruments (highlighting the greater weighting of those with CER adjustment, especially for longer terms). In order to continue normalizing and seeking greater liquidity in the public securities market (thus promoting the capital market in local currency), in May the BCRA determined that financial institutions will have the option of integrating the portion of their reserve requirements that they currently hold in the form of BCRA Liquidity Bills (Leliq) in Treasury bonds. 9
Graph 3 | Interest rates and fixed income instruments in Argentina
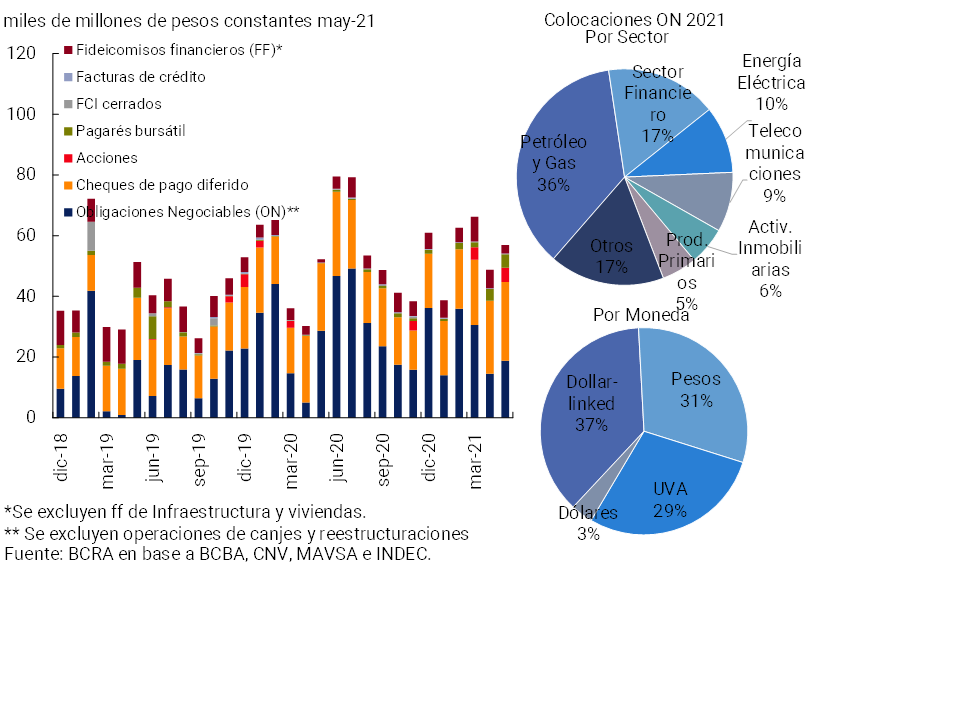
Placements of private sector instruments in the local capital market10 increased 10% in real terms year-on-year (January-May period, see Chart 4), while the cost of placement did not show major changes with respect to what was observed at the time of publication of the last IEF. By instrument, there was less dynamism for negotiable obligations (ON), which was offset by higher transactions of deferred payment checks (with an increasing weighting of E-CHEQs) and an improvement in the operations of stock market promissory notes and financial trusts. Among ON’s placements, those in areas such as oil and gas, the financial sector, electric power and telecommunications continued to stand out. In terms of placement currency, for the ON the weighting of operations in pesos and dollar-linked (with an average term of around 13 and 35 months, respectively), while those in UVA (average terms close to 43 months) gained ground. In line with the restructuring operations carried out by the public sector (national and provincial11), and following the guidelines established by the BCRA regulations (Com. “A” 7106 and amendments) with the aim of avoiding temporary imbalances in the foreign exchange market and prudently managing international reserves, foreign currency exchange operations continued to be carried out12. So far this year, operations in the oil and gas sector (the one with the highest weighting in the current balance of ONs) stand out, after the transactions observed in 2020 in sectors such as electric power, banks, real estate activities and agribusiness.
Figure 4 | Financing the private sector through the local capital market
2. Main strengths of the financial system in the face of the risks faced
So far in 2021, the aggregate financial system continued to carry out its functions without experiencing situations of tension, maintaining high coverage against the intrinsic risks assumed. The operational context through which the financial system went through showed a process of recovery of economic activity evidenced until the beginning of the year, largely favored by the stimulus measures of the National Government in conjunction with the BCRA, as well as by the start of vaccination of the population against COVID 19. This recovery scenario was subsequently tempered, mainly as a result of the worsening of the health situation from the end of the first quarter. 13
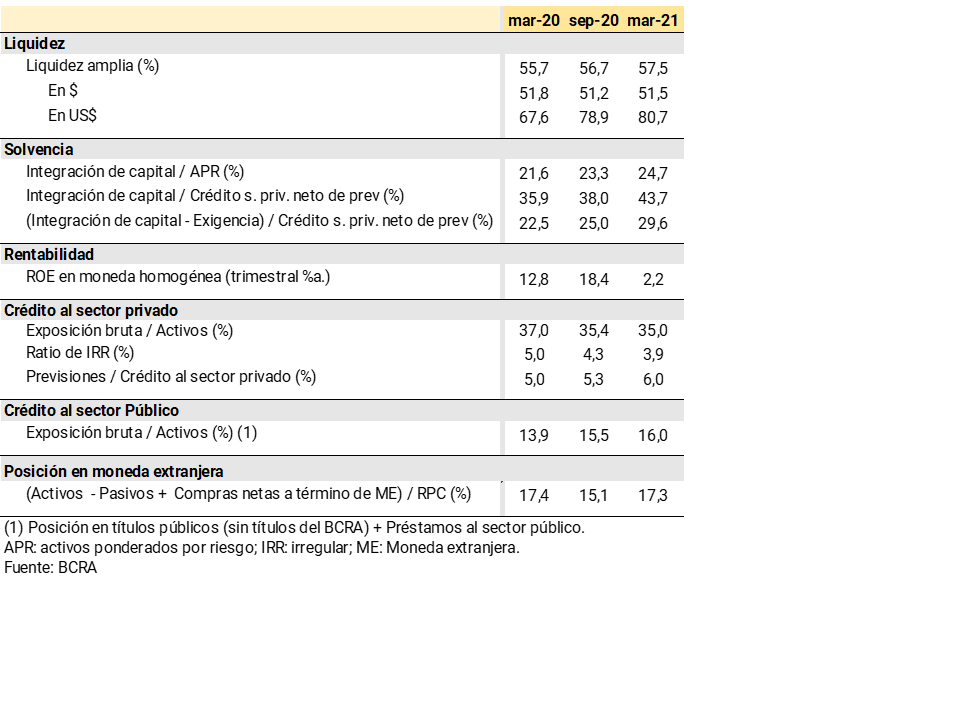
Similar to what was observed in the last publication of the IEF at the end of 2020, the set of financial institutions preserved high margins of liquidity, solvency and forecasting (see Table 1). The sector continues to develop traditional financial intermediation operations (not very complex), with a predominantly transactional bias, maintaining a low direct interconnection between institutions and a reduced depth of total credit in the economy. The equity mismatches (of currencies and maturities) assumed by the financial system as a whole remained at limited values, as did the equity exposure to the public sector, in line with the prudential regulations in force. It should be remembered that the activity of the sector was carried out within a scheme of regulation and supervision that is in line with the best practices recommended by international standards. Below are the main strengths of the sector in the face of the risks faced, which will be addressed in greater detail in the following sections.
Table 1 | Main indicators of the soundness of the financial system
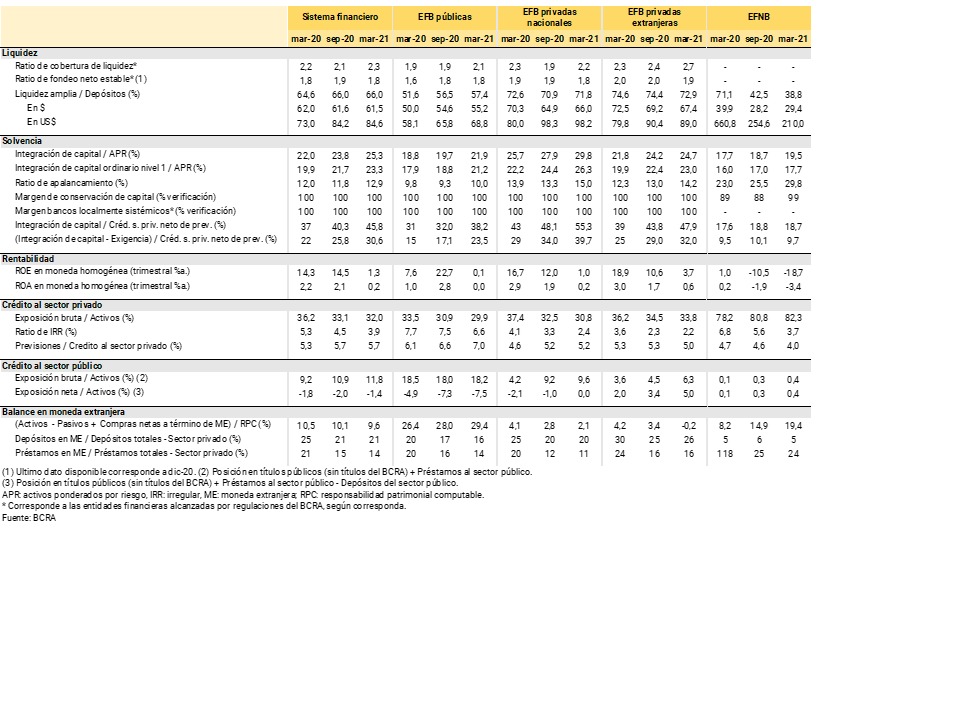
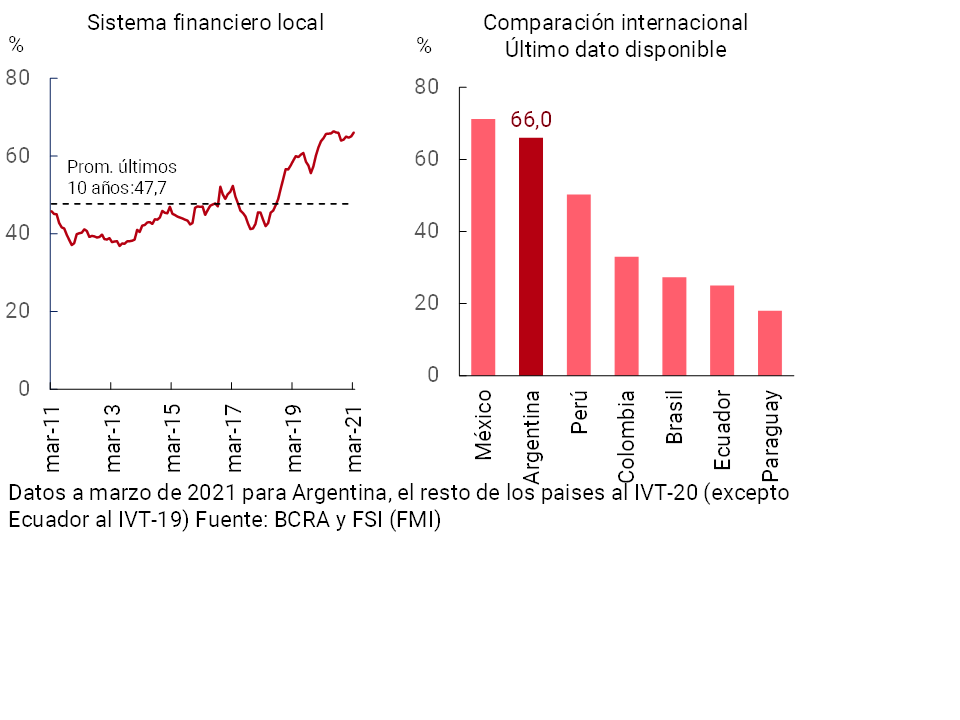
i. High levels of liquidity of all financial institutions. Since the last publication of the IEF, the financial system as a whole continued to preserve high liquidity margins. At the end of the first quarter of 2021, thesector’s broad sense liquidity 14 stood at 66% of total deposits, remaining without significant changes with respect to the previous edition of the IEF and slightly above the record for the first quarter of 2020. This level exceeds the average observed in the last 10 years and the values of other countries in the region (see Graph 5). Liquidity margins according to the currency of denomination of the liabilities also remain at relatively high levels and almost unchanged from what was observed six months ago (see Table 1).
Graph 5 | Liquidity of the financial system
In % of deposits
In addition, the liquidity indicators that emerge from the internationally recommended standards remained high, above the minimum regulatory requirements at the local level and the values observed in other economies in the region. In particular, the Liquidity Coverage Ratio (LCR) and the Stable Net Funding Ratio (NSFR)15 totaled 2.3 and 1.8 —for financial institutions belonging to group A, with information as of March 2021 and December 2020, respectively—, almost doubling the minimum levels required by regulation16.
ii. High and growing levels of forecasting and solvency of the financial system. In the last six months, the aggregate of financial institutions continued to increase their forecasting, in a context of comfortable and growing levels of solvency. The financial system’s accounting forecasts totaled 148% of the balance of credit to the private sector in an irregular situation in March 2021, 21.1 p.p. above the level of September 2020. For its part, the level of forecasting in relation to total financing to the private sector (in a regular and irregular situation) reached 5.7%, remaining unchanged in magnitude with respect to last September and increasing slightly in year-on-year terms. The year-on-year increase in this ratio observed at the margin was driven by public and domestic private financial institutions, while it fell in foreign private institutions and EFNBs.
With regard to the sector’s solvency, in the last six months the aggregate financial system increased its level of capital integration (RPC) in terms of risk-weighted assets (RWA), totaling 25.3% in March (+1.5 p.p. compared to September 2020 and +3.3 p.p. y.o.y.). Tier 1 capital—the capital with the greatest capacity to face eventual losses—comprised almost 93% of the total capital integration. These levels are above those observed in other economies in the region (see Chart 6). The capital position (RPC net of regulatory requirements) of all entities totaled 202% of the requirement, growing almost 23 p.p. compared to last September. The sector also continued to preserve a high degree of compliance with additional regulatory capital margins. In addition, the leverage ratio of all financial institutions (in terms of the definition recommended by Basel) stood at 12.9% in March, far exceeding the minimum required of 3% and above the value of last September and March 2020. The maintenance of the sector’s high solvency indicators is taking place within the framework of the macroprudential policy that suspended the possibility of distributing dividends to banks in the face of the shock of the pandemic, the obtaining of positive results – decreasing in the margin – by all institutions and a certain slowdown in the performance of financial intermediation.
Graph 6 |Solvency and forecasting
indicators
Regulatory capital – Comparison of LATAM financial systems
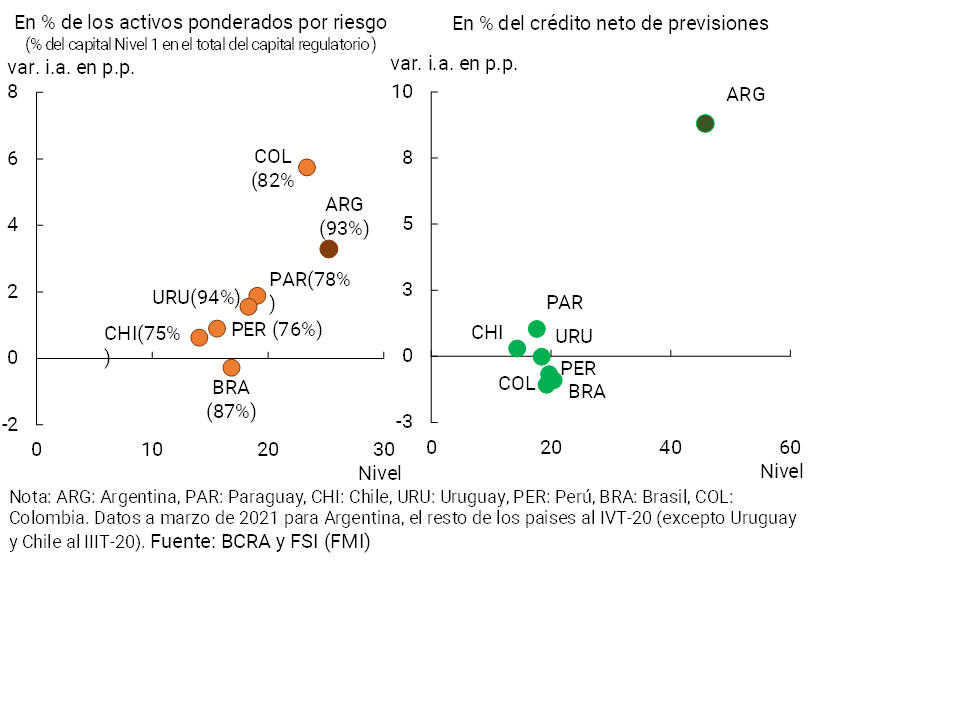
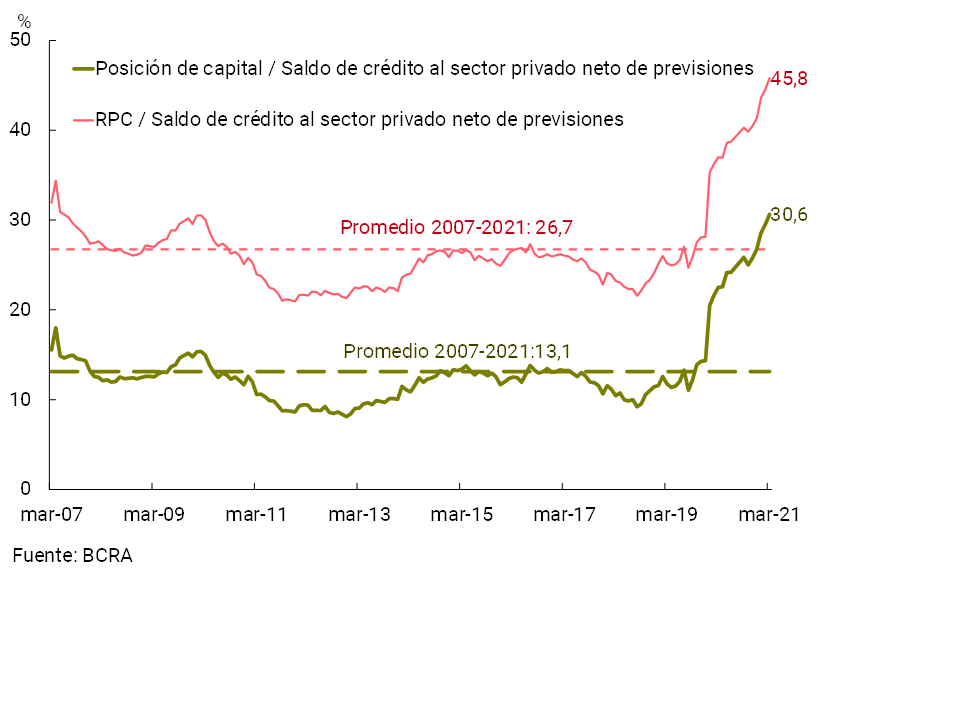
One way to show the level of resilience of the financial system in the face of a possible materialization of credit risk from a historical and international perspective (isolating the effect of the transitional measures adopted by the BCRA to alleviate the financial burden of debtors in the pandemic scenario) is to study the relationship between regulatory capital and credit to the private sector net of forecasts. This ratio at the local level stood at 45.8% at the aggregate level in March, reaching the highest level in the last 15 years and surpassing the records of other economies in the region17. This value reflects the relatively low credit exposure and the high levels of capital and forecasting of the aggregate of the local financial system.
iii. Reduced exposure of the balance sheet to foreign currency items and limited mismatch of foreign currency. The weighting of foreign currency assets and liabilities on the balance sheet of the aggregate financial system continued to remain low from a historical perspective. The foreign currency assets of all financial institutions represented 19.2% of total assets in March, decreasing in a year-on-year comparison and 0.7 p.p. less than the average of the last 10 years. Liabilities in the same denomination totaled 17.4% of total funding (liabilities and equity), below the level observed a year ago and 1.2 p.p. less than the average of the last 10 years. When including the forward purchase and sale of foreign currency classified off-balance sheet, the difference between assets and liabilities in this denomination represented 9.6% of regulatory capital at the end of the first quarter of 2021, a level that remains well below the average of the last ten years within the framework of the regulatory limits that entities must verify.
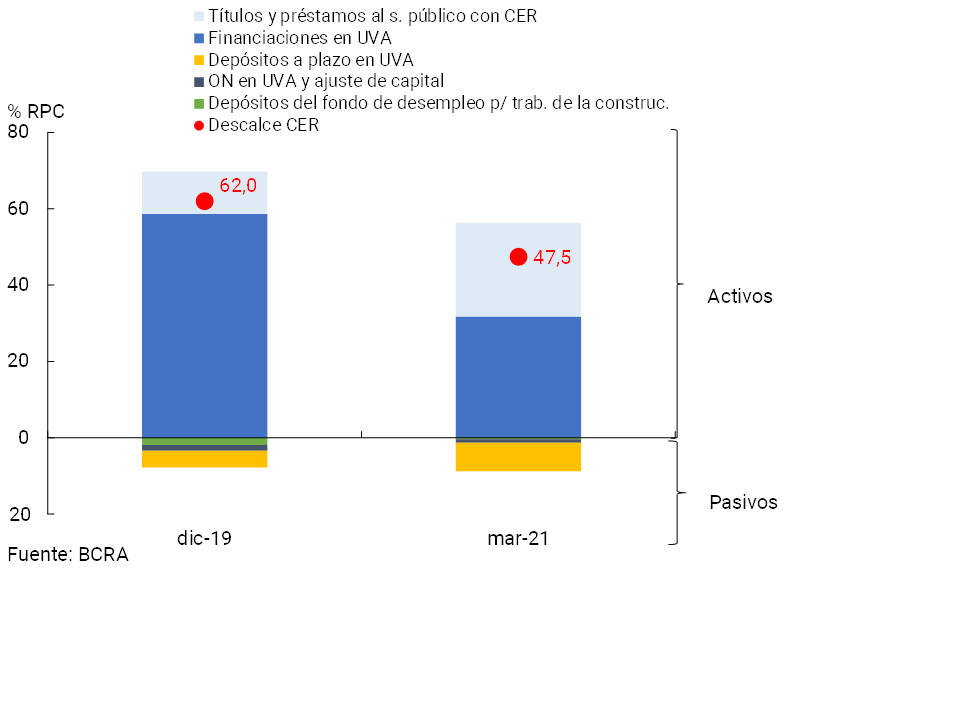
iv. Limited mismatch of items with CER adjustment in the balance sheets of the financial system. The aggregate of entities continued to show a moderate mismatch of items with CER adjustment in the last six months. Considering all assets and liabilities with capital adjustment by CER (including UVA adjustment), the aggregate financial system presented an active mismatch in this segment (greater assets than liabilities) estimated at 47.5% of the total regulatory capital integration at the beginning of 2021, falling almost 15 p.p. compared to the levels at the end of 2019 (see Chart 7).
Figure 7 | Estimation of the CER mismatch – Financial system
v. Limited exposure of all financial institutions to the public sector. At the end of the first quarter of 2021, credit to the public sector represented 11.8% of total assets, increasing slightly in recent months. The limited exposure to the public sector occurs within the framework of current macroprudential regulations. The financial system at the aggregate level maintains a net debt position vis-à-vis the public sector (all levels), when considering deposits from this sector.
vi. Regulatory framework in line with international standards. The micro and macroprudential regulations in force on the Argentine financial system focus on the particularities of the local environment, without neglecting international best practices. In this context, the BCRA recently made progress in replacing references to the London Interbank Offered Rate (LIBOR) in local regulations, replacing them with references to the rates recommended at the international level (see Section 1). This came after warning entities last year about the legal, operational and financial risks associated with LIBOR operations that extend beyond the end of 2021, at which time its preparation and dissemination in the United Kingdom will no longer be mandatory.
The elements mentioned as strengths of the financial system would allow it to sustain its current degree of soundness, maintaining its resilience in the face of a context that continues to be challenging. In this sense, within the framework of the stability analysis, the main exogenous risk factors that the financial system could eventually face in the coming months are identified below:
i. Possible deterioration of the external context, given the existence of various fronts of uncertainty and vulnerabilities at the global level. The emergence of vaccines and the progress (albeit heterogeneous) in their application generates more favorable expectations worldwide compared to the last IEF, but in the short term the pandemic continues to be a source of uncertainty. Possible complications may have an impact on the level of global activity, international trade and commodity prices, with an effect on emerging countries, including Argentina. Likewise, different vulnerability factors have been accentuated in international financial markets, linked to the persistence of interest rates at historically low levels18. On the other hand, there are different types of factors that could eventually trigger a generalized contraction in risk appetite, including, for example, a change in expectations regarding the pandemic or stimulus policies in developed countries (premature withdrawal of support measures), or an increase in uncertainty due to a possible generalized increase in rating downgrades or defaults by governments and/or companies. A possible scenario of abrupt changes in prices and short-term capital flows cannot be ruled out for the short term, affecting the majority of emerging economies. In the medium term, a context of normalization (higher level) of interest rates in international markets could also imply a challenge for emerging markets. With respect to local transmission channels in the face of the different types of shocks mentioned, the one linked to the real channel would have a more direct impact on local economic activity and, in turn, on the repayment capacity of families and companies. While the one related to the financial channel could generate greater volatility on exchange rates and interest rates, affecting the environment in which financial intermediation is carried out.
ii. Possibility of a less dynamic recovery than expected or greater volatility in local financial markets. Although expectations point to an improvement in the level of activity in the remainder of 2021 and a gradual decrease in inflation rates, the situation is dynamic and changing, while elements of uncertainty remain. The evolution of the second wave of the pandemic (and the associated health measures) could condition economic activity to some extent, and may affect both the context in which financial intermediation is carried out and the ability of debtors to pay. On the other hand, it is not possible to rule out the possibility of a more volatile context in the local financial markets, depending on factors such as the negotiation processes opened with the IMF and the Paris Club, the dynamics of the election process scheduled for this year or seasonal issues in the foreign exchange market (with the incidence of variables such as the liquidation of the harvest and the international price of raw materials). Greater volatility in financial conditions – including interest rates and/or the exchange rate – could affect the context in which financial intermediation occurs.
iii. Operational risks, increased by the greater dependence on technological resources as a result of the pandemic. Based on social distancing measures, from 2020 onwards, teleworking became widespread and a greater use of digital channels for financial transactions was promoted, which implies greater exposure to operational risks, a situation verified at a global level (including, for example, those linked to fraud or cybersecurity attacks or disruption in the provision of intermediation and payment services). So far, no disruptive event has been verified in the local market. In this context, outreach and prevention efforts continue to be deepened. In this regard, the BCRA issued cybersecurity guidelines for response and recovery, in addition to carrying out an awareness campaign regarding fraud and having preventive regulations on the subject (see Section 2). While exposure to this risk increased with the deepening of restrictions as a preventive measure against the second wave of infections, it is expected to decrease in the coming months, to the extent that it can converge to a greater normalization of activity.
Another risk factor that is important to mention is the one linked to the economic and financial impact that climate change could have (related to the process of global warming), which is having an increasingly marked international recognition (see Section 3). In the medium term, in addition to the aforementioned challenge that emerging economies would face with respect to the dismantling of monetary stimulus policies by developed economies (in a context of greater public and private indebtedness), it is expected that in a post-pandemic world, changes will be seen in the business models of both the corporate sector in general (given the effects on consumption patterns and on production and marketing chains). and the financial sector in particular (e.g., regulatory changes), with an impact on both banks and non-bank financial intermediation.
The next section continues with the analysis of financial stability, analyzing the main sources of vulnerability identified for the local financial system, given its exposure in the balance sheet to the aforementioned risk factors. These vulnerabilities will be contrasted with the strengths of the financial system, to consider how it is in a position to deal with the eventual materialization of these risks.
3. Sources of vulnerability and specific resilience factors of the financial system
3.1 Credit risk to the private sector. Exposure, materialization and coverage
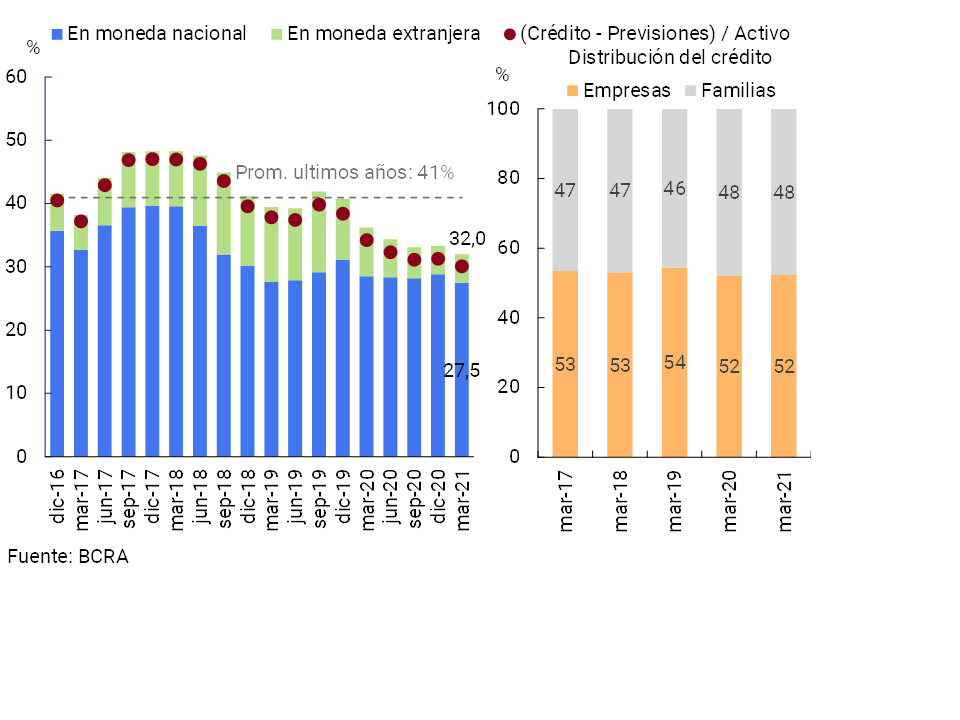
At the end of the first quarter of 2021, the financial system continued to have a low exposure to the private sector, lower than that recorded at the time of publication of the previous edition of the IEF. The credit balance to this sector stood at 32% of the assets of all financial institutions in March (27.5% for the segment in national currency), down 1.1 p.p. compared to the value of September 2020 (see Chart 8). Financing to the private sector net of forecasts in terms of the assets of the financial system also decreased in the period, totaling 30.1%.
Figure 8 | Gross exposure to the non-financial private sector
Financing to the private sector as a % of assets – Financial system
Within the framework of the actions implemented by the BCRA in conjunction with the PEN, aimed at mitigating the adverse effects on the private sector of the pandemic context, since March 2020 both families and companies have benefited from a set of financial relief measures. The measures sought to reduce potential episodes of financial stress to be faced by families and companies, and from the point of view of their debts with the financial system, the conditions of repayment were also facilitated, in order to limit the impact on the financial system, which also has low levels of exposure to the private sector. However, given the persistence of uncertainty factors associated with the pandemic and the need to reinforce confinement measures – with their consequent impact on the level of activity – situations of tension in the payment capacity of families and companies over the coming months cannot be ruled out, with potential spillover on the local financial system.
Until March 2021, a transitory modification was in force on the parameters for classifying debtors in the financial system, in addition to the possibility of transferring their unpaid installments at the end of the life of the loan, facing only the agreed compensatory interest. Regarding the parameters for the classification of debtors, the BCRA decided to establish a gradual transition schedule between April and May of this year, returning to the parameters existing prior to the pandemic as of June. At the same time, in order to mitigate the effect of the local situation derived from the second wave of the pandemic, while focusing efforts on those most affected, the BCRA recently allowed entities to incorporate the unpaid installments of assistance granted to employers reached by the Productive Recovery Program II —REPRO II— at the end of the life of the loan. considering only the accrual of compensatory interest.
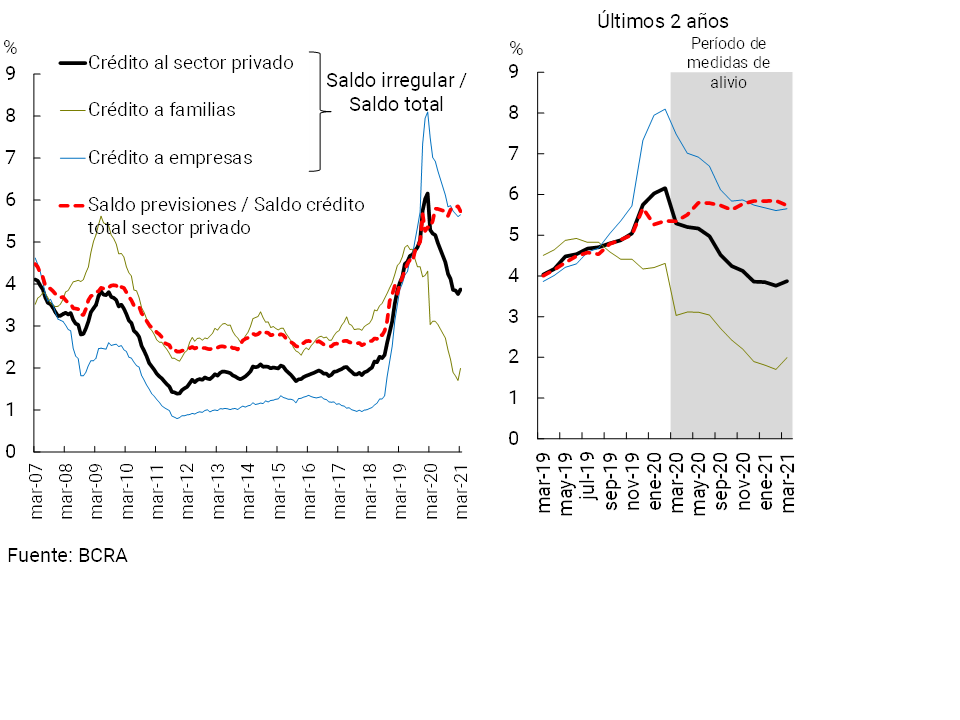
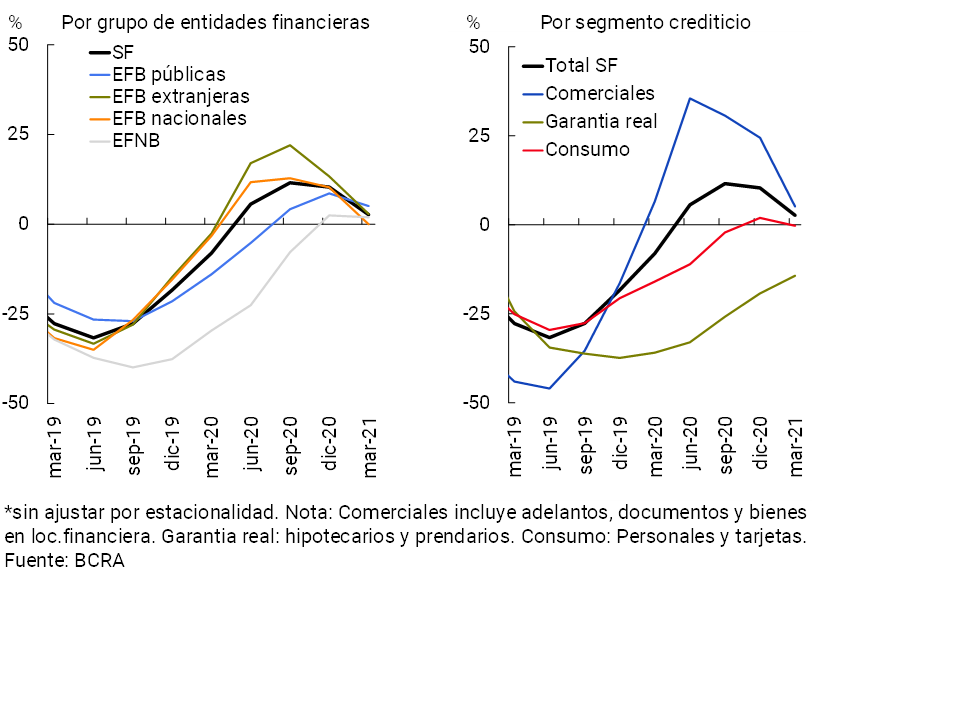
In this context, the non-performing loan ratio to the private sector stood at 3.9% in March 2021, reducing 0.6 p.p. compared to the value recorded in September 2020 (-1.4 p.p. y.o.y.) (see Graph 9), although growing slightly at the end of the first quarter of the year. Differentiating by credit segment, the indicator of delinquency of loans to households decreased 0.7 p.p. in the last 6 months to a total of 2% (-1 p.p. y.o.y.), mainly due to the performance of collateral and personal loans19. On the other hand, non-performing loans to companies stood at 5.6%, showing a fall of 0.5 p.p. compared to September 2020 (-1.8 p.p. y.o.y.). Within this sector, the irregularity of pledge and mortgage loans showed the largest relative drop. As mentioned in the last IEF, it should be noted that the level and variation of these indicators – commonly used to have a dimension of the materialisation of credit risk – must be interpreted within the framework of the aforementioned provisions on relief measures (see Box. Resilience of the financial system in the context of COVID-19: exposure and coverage to debt that is estimated to be in a relatively more vulnerable situation).
Figure 9 | Credit to the private sector. Irregularity and forecasting
Financial system
Box. Resilience of the financial system in the context of COVID-19: exposure and coverage to debt that is estimated to be in a relatively more vulnerable situation.
As detailed in the last two editions of the IEF, since the beginning of the pandemic, the BCRA in conjunction with the PEN began to implement financial relief measures to temper the effects of a significantly adverse context on companies and families. In particular, the parameters for classifying debtors in the financial system were modified (with convergence to pre-pandemic parameters as of next June), the transfer of unpaid installments at the end of the life of the credit was made possible (a tool that was in force until the end of the first quarter of this year) and the installments of mortgage and pledge loans that adjusted for UVA were frozen. among other measures20. Thus, the so-called irregularity ratio21 began to show some weakness in assessing the current evolution of the quality of the financial system’s loan portfolio. In this framework, and based on the information available, some complementary indicators are prepared and monitored on the degree of exposure of the financial system to financing granted to debtors who, under certain criteria, are considered to be in a situation of greater relative vulnerability at this juncture. Then, with this information, it is possible to generate additional estimates of the degree of resilience of the aggregate sector (relative impact on solvency) in the event of the materialization of credit risk.
In particular, here is presented the estimation of a complementary indicator called the Vulnerable Debtors Ratio, and for its construction the following additional criteria were used to characterize debtors with respect to their ability to repay: a) the activity to which they belong, b) whether they had the possibility (or not) of receiving subsidized credits within the framework of the Emergency Assistance Program for Work and Production (ATP), c) whether or not they used the relief measures promoted by the BCRA in conjunction with the National Executive Branch (whether these were debt refinancings, such as freezing mortgage and UVA loan installments), d) whether they observed a relatively high growth in their indebtedness with respect to the average variation in the income of their economic sector, and e) their eventual departure from the universe of formal jobs in the last year (in the case of individuals).
In this sense, the first part of the exercise consists of starting from the observed ratio of financing in an irregular situation and adding different credit blocks to the numerator according to the aforementioned categories of vulnerable debtors – who will not necessarily become debtors with effective problems in the repayment of their debts. We start from a level of irregularity of 3.9% at the end of the first quarter of the year for the entire financial system, which increases to 5.4% if we add the regular balance of debtors with some credit in an irregular situation (see left panel, Graph 10). When adding the balance of debtors eligible for the ATP program (and that of their employees, if any), belonging to economic activities that have performed relatively worse between February 2019 and December 2020, and that have taken some measure to relieve the financial system, the estimated debtor vulnerability ratio would reach 7.6%. If we do the same by also including ATP-eligible debtors who have not taken relief measures (and their employees), the ratio would rise to 9.1%. If we also incorporate those debtors whose debt increases much more than the average income of the economic sector – above the 90th percentile – of these activities with relatively more deteriorated performance (be it the sectoral GDP in the case of legal entities or the sectoral CVS for individuals), the aforementioned indicator reaches a level of 11.2%. Finally, if we add the debt of people who had formal remuneration on Mar-20 and stopped having it on Feb-21 for some reason, we reach a vulnerable debtor ratio of 12.8%. It should be noted that this percentage refers to credit to debtors who, due to the characteristics indicated, are estimated to be having a relatively lower capacity to repay, but that this would not necessarily translate into effective default on their obligations to meet their debt services.
Figure 10 | RDV and impact on Capital as of Mar-21
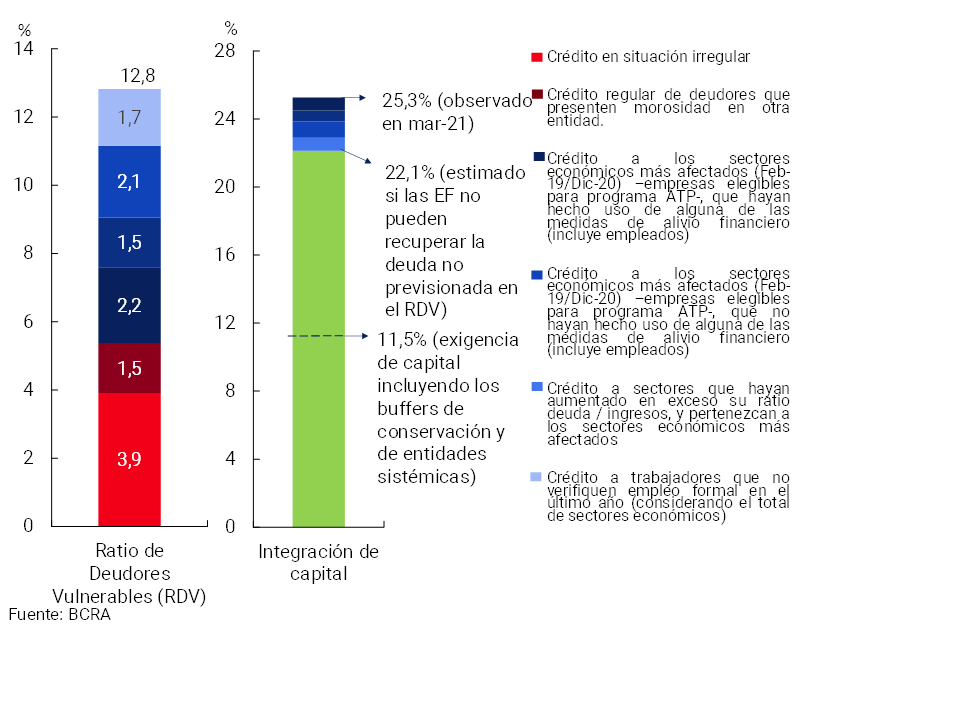
As mentioned, once this set of debts has been calculated, which could potentially be in a situation of greater relative vulnerability, the degree of resilience of the system – given its current high levels of regulatory capital and forecasting – is analysed in the face of a possible scenario of tension. In this sense, if we assume a hypothetical exercise (extreme, with a low probability of occurrence) of non-payment of all the debt considered here (which does not constitute a projection), the integration of the system’s regulatory capital would be slightly reduced (see right panel, Graph 10), maintaining a significant capital gap with respect to the minimum regulatory requirement, thus configuring a situation of significant solidity of the financial system at the aggregate level.
After the peak of the first wave of COVID-19, around the end of 2020 onwards, as the level of economic activity and household income gradually recomposed (with some heterogeneity between economic sectors), the degree of use of the aforementioned financial relief measures began to moderate. In this framework, the BCRA promoted various programs already focused on the sectors most affected by the pandemic context. It is estimated that the scenario for the first quarter of 2021 would have presented itself with fewer relative difficulties for debtors compared to the second and third quarters of 2020, tempering to some extent the credit risk faced by the entities.
Although the last six months have seen a slight drop in the financial system’s exposure to the private sector, accompanied by certain indications of an improvement in the payment capacity of debtors, this potential source of vulnerability of the financial system is expected to remain the most important relatively (within the set of risk exposures in the financial system) for the rest of 2021. The evolution of this will depend on the possible degree of materialization of the risk factors mentioned in Section 2, especially on the possibility of a less dynamic economic recovery than expected.
3.1.1 Resilience elements and mitigating measures:
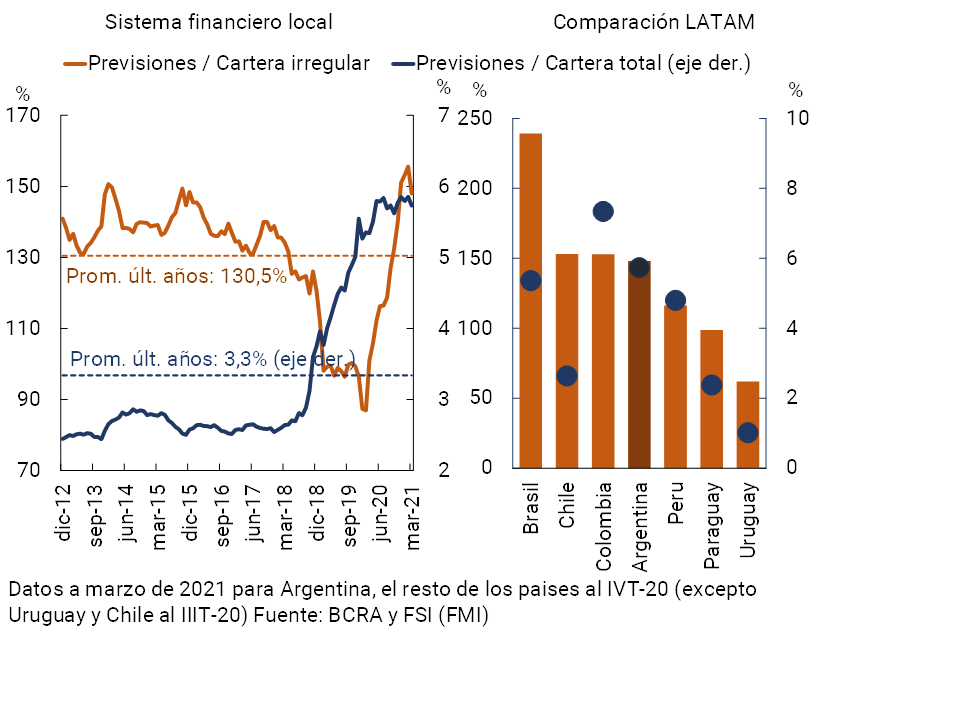
High levels of forecasts and regulatory capital in relation to credit exposure. In March, the accounting forecasts of all financial institutions totaled 148% of the irregular portfolio and 5.7% of the total balance of credit to the private sector, above the records of a year ago22. The year-on-year increase was mainly explained by the largest institutions (belonging to group A), in line with the requirements governing them to make forecasts based on expected loss models (within the framework of the adoption of the criteria included in International Financial Reporting Standards (IFRS). These levels are high compared to the records of the last 10 years and slightly above the average for the region (see Graph 11).
Figure 11 | Financial System Forecasting
The level of resilience of financial institutions as a whole to credit risk can be illustrated, among other ways23, by the relationship between the regulatory capital position (regulatory capital – regulatory requirement) and credit to the private sector net of forecasts. This ratio stood at 30.6% at the aggregate level in March 2021 (45.8% when considering regulatory capital, rather than position), reaching the highest level in the last 15 years (see Chart 12) and surpassing the records of other economies in the region. This indicator reflects a first approximation (hypothetically, extremely) of how much the deterioration in the quality of the private sector credit portfolio (without recovery)24 would have to be in order to exhaust the excess capital of the financial system as a whole. The historically high levels of these indicators suggest a high degree of resilience of the aggregate financial system to an eventual materialization of credit risk. This result reflects the effects of limited exposure to the private sector and high relative levels of capital and forecasting.
Figure 12 | Regulatory capital (RPC) and capital position (RPC – Requirement), in terms of the balance of credit to the private sector net of forecasts.
Financial System
Credit origination standards have not changed significantly in recent years. According to recent surveys by the Credit Conditions Survey (ECC)25, since the end of 2020, participating financial institutions as a whole have not relaxed the credit standards associated with loans to companies (general level). On the side of loans to households, in the last survey a heterogeneous behavior was observed according to credit assistance: a moderate relaxation of the standards associated with other consumer loans, neutrality for pledges and mortgages, and a slight restriction for credit cards.
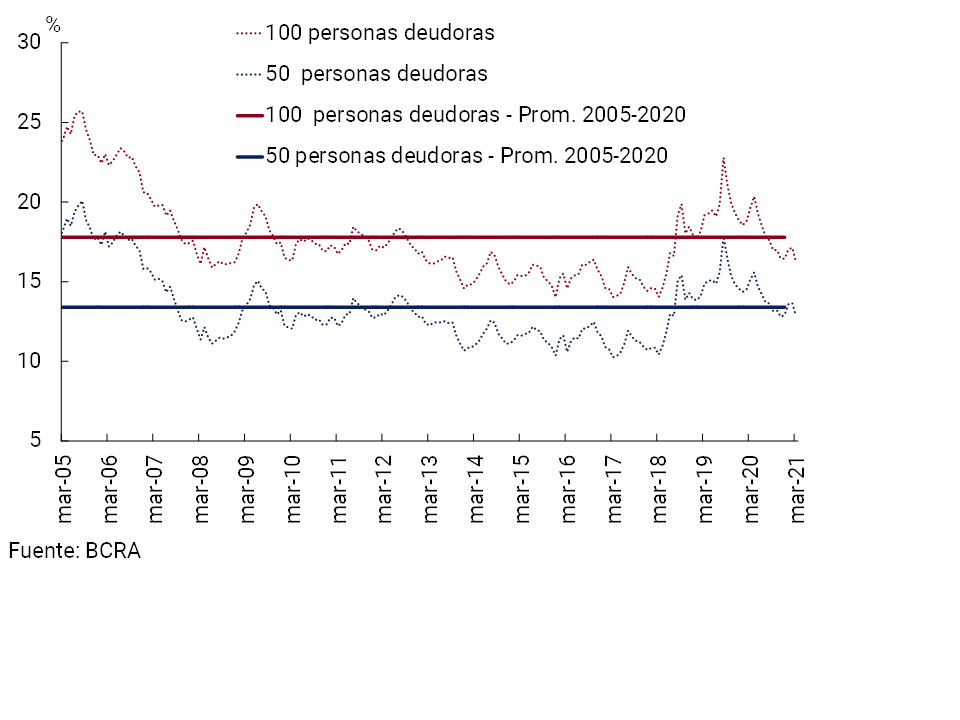
Moderate and decreasing concentration of private sector debtors in the financial system. Within the framework of the prudential regulation in force, the share of the main debtors (legal and human) in the total credit portfolio of all financial institutions remained limited at the beginning of 2021 (see Chart 13), showing a certain downward trend at the margin. In particular, the top 100 and 50 private sector debtors in the aggregate financial system accounted for 16.2% and 12.8% of the total credit balance at the end of the first quarter of the year, 3.4 p.p. and 2.3 p.p. below the levels of a year ago. To a certain extent, greater diversification of the debtors’ portfolio helps to temper the credit risk assumed.
Figure 13 | Share of the total balance of credit to the private sector of the main debtors – Financial system
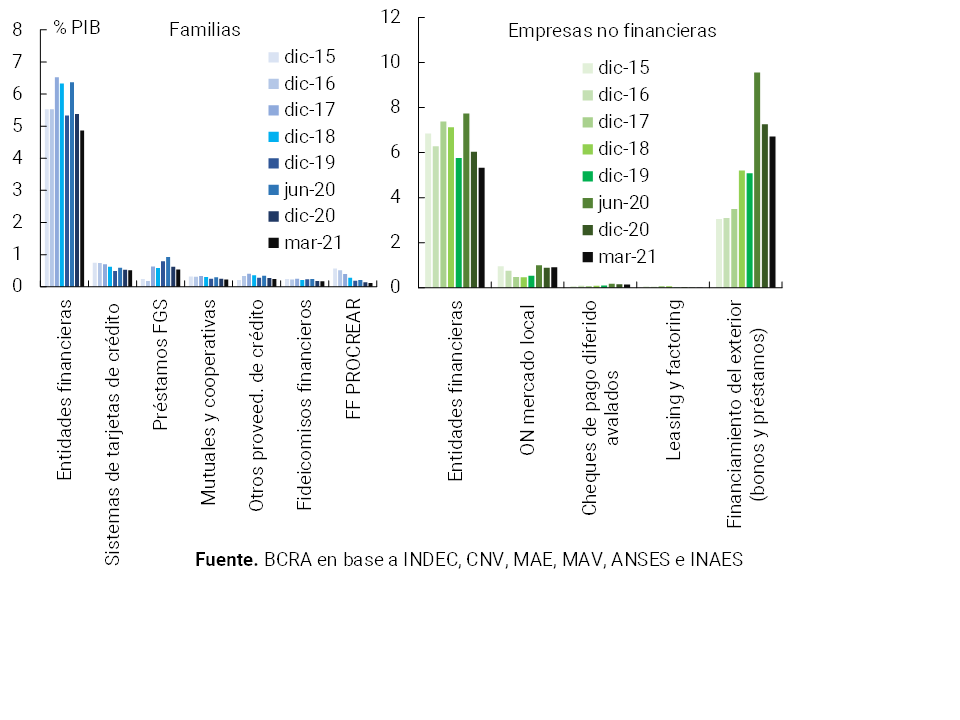
The balance of private debt fell in real terms and with respect to GDP in the first quarter, remaining at limited relative levels. As of March 2021, the estimated balance of financing in the broad sense was equivalent to 6.7% of GDP for households and 13.1% for companies (see Chart 14)26, levels that continue to be significantly limited, for example in an international comparison, particularly with respect to what has been observed for other emerging countries. These aggregate debt indicators show a decrease compared to the end of 2020, mainly explained by the recomposition of GDP, although debt balances fall in real terms. In the case of household debt, in the first quarter of 2021, both the loan balances of financial institutions, the main component of their debt, and the balances linked to non-bank financing fell in real terms – and at a similar rate27. In the case of companies (with debt mostly explained by two components, bank loans and foreign financing), all components fell in real terms in the quarter, except for the balance of bonds in the local market (due to the combined effect of net placements and restatement of balances in pesos). 28, 29 In the context of the evolution of financial stability conditions, the BCRA maintains periodic monitoring of the interconnection channels between the main credit providers in the economy (See Section 4).
Figure 14 | Financing in the broad sense for families and companies
Box. Financial situation of publicly offered companies – 2020
The monitoring of the situation of the non-financial corporate sector based on analysis of companies with publicoffering30 shows for 2020 mixed changes in the main indicators compared to what was observed in 2019. It should be remembered that in 2019 there was already evidence of a certain negative trend depending on the local recessionary context prior to the initial impact of the COVID-19 shock and the measures adopted to mitigate its health effects. Taking into account the median (see Table 2), in 2020 the liquidity indicators and, to a lesser extent, the interest coverage with income indicators weakened, while profitability increased (measured by ROE) and leverage fell slightly31. Although during the first half of the year there was a generalized deterioration in the indicators, they later tended to recover, accompanying economic activity. It is noteworthy that, despite the deterioration in the indicators during the first half of 2020, there were relatively few cases of problems in meeting payments for services or bond capital, which represented a negligible portion of the outstanding note balance of non-financial companies (0.35% of the note balance at the end of 2019, prior to the initial impact of the COVID-19 shock)32.
Table 2 Companies with a public offering – Evolution of main indicators
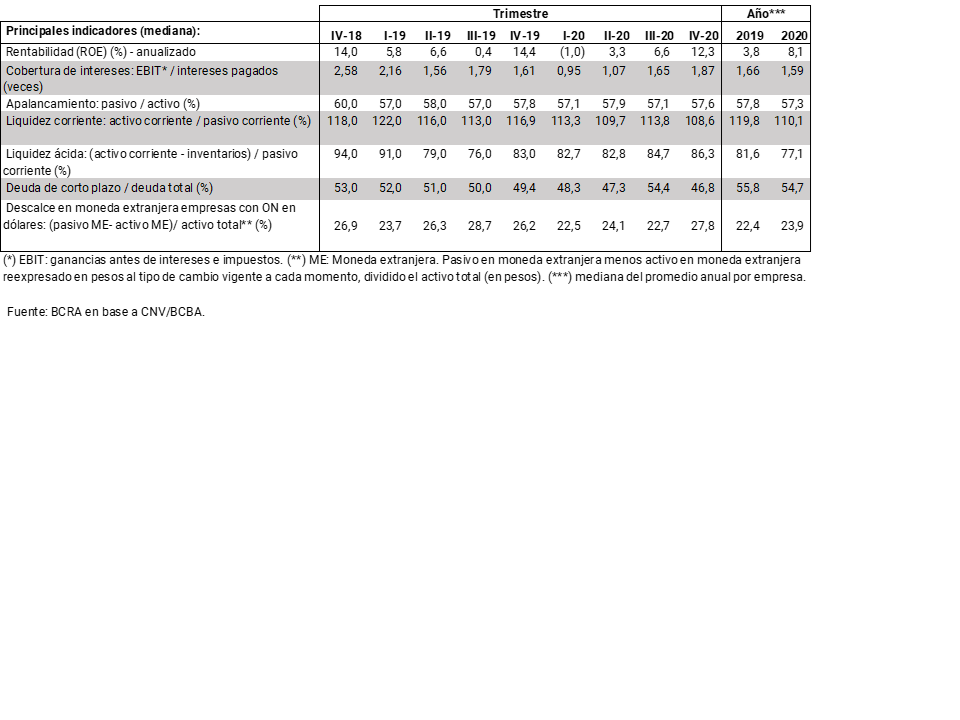
The evolution of the main financial indicators resulted in a slight increase in the number of companies with public offerings in a relatively vulnerable position; defined here as those firms that show vulnerability in at least two of the three most relevant financial ratios (interest coverage, leverage, and acid liquidity)33. Based on this simple methodology, at the end of 2020 there were 19 companies in a relatively vulnerable situation: 3 more than a year ago. The indebtedness (financing of financial institutions and markets) of these companies represents 21% of the total indebtedness of companies with public offerings,34.10 p.p. more than what was observed at the end of 2019. In terms of the credit exposure of the financial system to companies in relatively more vulnerable situations, although it is increasing, it remains at relatively low levels: they went from 1% to 4% of total credit to companies from the end of 2019 to the end of 2020. With regard to the capital market, the bonds of relatively more vulnerable companies went from representing 8% of the total balance (end of 2019) to 14% (end of 2020). The maturities of dollar bonds in the most vulnerable position represent only 9% of the flows payable in dollars for the total non-financial sector bonds during the second half of 2021 and all of 202235.
Moderate burden of household and corporate debt services. It is estimated that the aggregate of the family sector continued to maintain a limited relationship between the financial services of its debt with the financial system and its income since the publication of the last edition of the IEF, with a certain increase in recent months. At the beginning of 2021, the burden of household debt services accounted for approximately 14.1% in terms of the wage bill, 0.5 p.p. above the level of September 2020. Within the framework of policies to stimulate credit to companies – mainly to MSMEs under favorable financial conditions – and low levels of aggregate indebtedness, it is estimated that the debt service burden of the business sector also remains at limited levels.
Reduced participation of financing in foreign currency in the aggregate of the financial system and limited mismatch of foreign currency of debtors. The balance of credit to the private sector in foreign currency represented only 14% of the total credit balance to this sector in March, reducing 0.7 p.p. compared to the September 2020 record and 7.2 p.p. in year-on-year terms. In other words, the exposure of the aggregate balance sheet of financial institutions to credit risk derived from possible exchange rate fluctuations remains relatively low. In addition, in accordance with the macroprudential regulations in force, the balance of credit in foreign currency is granted mainly to debtors whose income is in foreign currency – due to their export activity – or is positively related to the evolution of the exchange rate, reducing the possibility of credit risk situations arising from fluctuations in the latter.
Limited link between potentially vulnerable public offering companies and the financial system Although in 2020 the balance sheets of publicly offered companies showed an impact due to the Covid-19 shock (which affected the number of companies in potentially vulnerable situations), the link between potentially vulnerable companies within this universe of companies and the financial system remains limited (see Box “Financial situation of publicly offered companies – 2020”).
Moderate exposure of the financial system to the public sector within the framework of the macroprudential measures in force. The credit of the financial system to the public sector totaled 11.8% of total assets in March, increasing slightly in recent months, although it continued to be low from a historical perspective. When considering public sector deposits, all financial institutions maintain a net debt position vis-à-vis the public sector.
3.2 Weak performance of financial intermediation activity
Since the last publication of the IEF, the activity of intermediation of funds from the financial system with the private sector has been reduced. The balances of credit and deposits in national currency in this sector decreased in real terms in this period, although they continued to be above those observed a year ago. This occurred in a context in which the rate of change in the general price level of the economy increased, and in which the recovery of economic activity – favored by the measures adopted by the National Government and the BCRA in the face of the health emergency – was attenuated since mid-March due to the worsening of the epidemiological situation and the sanitary measures to contain the second wave of infections of COVID36. At the same time, financial intermediation in foreign currency fell slightly in the period.
The real balance of credit to the private sector in national currency at the end of the first quarter of 2021 was 6.2% lower than at the end of the third quarter of 2020. This evolution was mainly explained by the performance of lines linked to companies (commercial), while the segment of loans to households (mainly those destined for consumption) remained without significant real variations in the last six months. However, receiving the effect of the credit stimulus programs promoted by the National Government and the BCRA, in year-on-year terms financing in pesos to the private sector accumulated an increase of 2.7% in real terms, exceeding the variations of the same month in previous years (see Chart 15). For their part, loans in foreign currency fell 8% – in source currency – when comparing March 2021 and September 2020 (with a year-on-year drop of 37.7%), although they are observing a recomposition in recent months.
Figure 15 |Balance of credit in pesos to the private
sector
Change: % year-on-year in real terms*
In the context of the economic recovery process that has taken place since the middle of last year and the aforementioned performance of financial intermediation, as mentioned in the previous section, in the last six months the ratio between total credit to the private sector from the financial system and the GDP of the economy has fallen. This indicator stood at 9.8% in March (8.5% for the segment in national currency), almost 2 p.p. less than the level of September 2020 (-1.4 p.p. in pesos), below the levels observed locally years ago, as well as in other economies in the region.
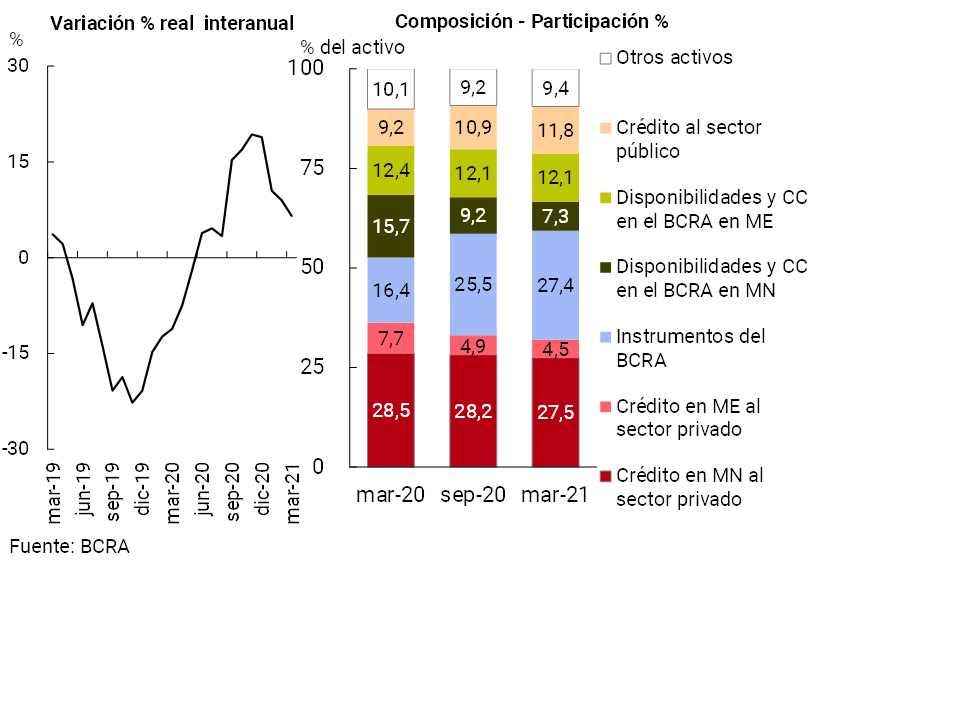
Within the framework of this evolution of intermediation activity, the total assets of all financial institutions showed a certain decrease between September 2020 and March 2021, although it accumulated a year-on-year increase of 6.6% in real terms (see Chart 16). In terms of its composition, in the last six months the relative importance of the holding of BCRA instruments (LELIQ and passes) and, to a lesser extent, of credit to the public sector increased. On the other hand, financing (both in domestic and foreign currency) to the private sector and the remaining liquid assets (mainly the current accounts in national currency of the entities in the BCRA) reduced their relative weight in total assets. This occurred in a scenario where there was a limited variation in the factors of monetary expansion – sterilizing surplus liquidity – and a progressive focus of official credit assistance efforts on the sectors most affected by the pandemic.
Figure 16 | Financial System Assets
In the coming months, developments regarding the development of the second wave of COVID infections and public policies to address this situation will take precedence, with a consequent effect on the activity of the financial sector. Recently, the National Government implemented restrictions on mobility to slow down the speed of infections and, in parallel, sought to focus its assistance programs on the most affected sectors to mitigate the economic and social effects, while advancing with the vaccination program. Going forward, if part of the risk factors set out in Section 2 materialize in terms of the development of economic activity, the financial intermediation process could be affected, especially the performance of credit to both companies and households. This situation could eventually translate into some impact on the sector’s sources of income, in a context in which lower levels of profitability were observed at the margin.
3.2.1 Specific elements of resilience
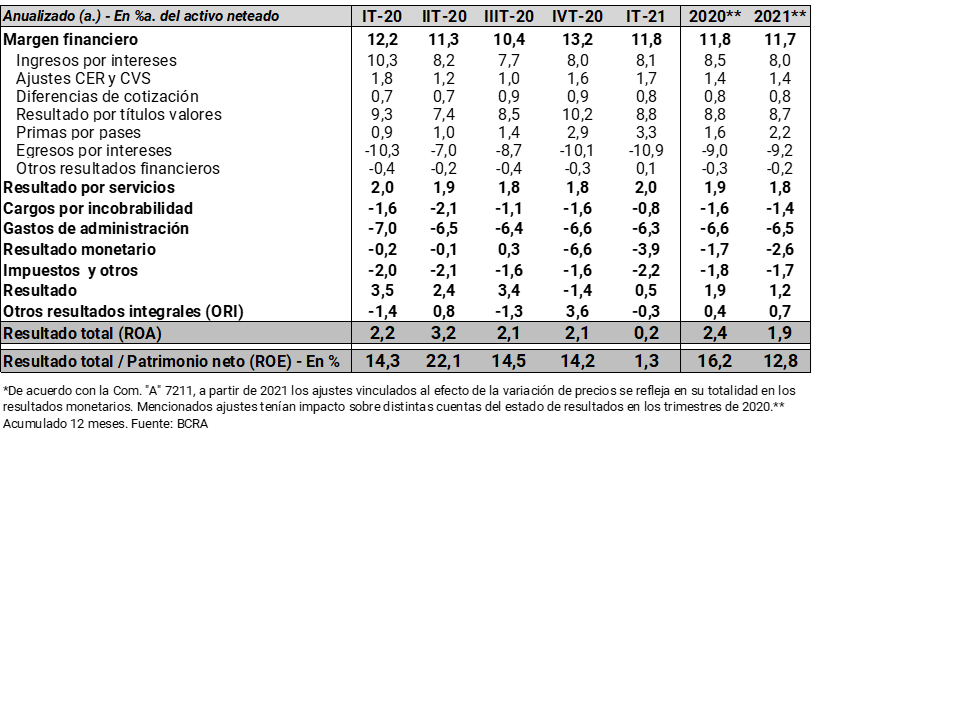
The profitability of the aggregate financial system, although declining, remains at positive levels. All financial institutions continued to register positive profitability indicators – considering comprehensive total results in constant currency – at the end of 2020 and at the beginning of 2021 (see Table 3). In the first quarter of 2021, these results represented 0.2% annualized (y.) of assets (ROA) and 1.3% y. of equity (ROE), being lower than those verified in 2019 and 2020. The lower levels for the profitability indicators recorded at the beginning of 2021, compared to the accumulated in 2020, are reflecting the effects of the dynamics of the items that reflect the adjustments linked to the evolution of the general price level, the higher interest outflows (in a context of an increase in the proportion of these placements in the funding of the financial system and minimum interest rates for deposits future) and a drop in the results of securities. These effects were tempered by a decrease in uncollectibility charges and administration expenses.
Table 3 |Financial System Profitability Table – In Homogeneous Currency*
Risk-oriented supervision by the SEFyC. The Superintendence of Financial and Exchange Institutions (SEFyC) continues to monitor the performance of financial institutions through the identification of their individual risks and the development of appropriate supervision plans. It should be noted that systemically important institutions at the local level continue to have relatively high levels for their robustness indicators (see Section 3).
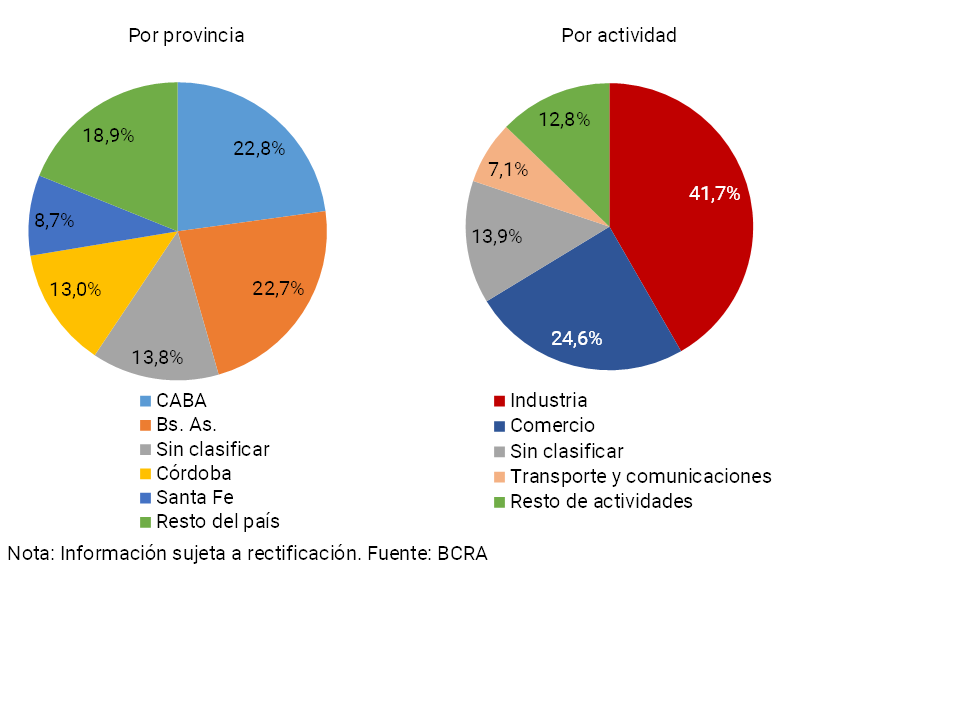
Credit assistance to small and medium-sized enterprises. Over the last six months, the BCRA continued to promote measures focused on the sectors most affected by the pandemic37. In order to continue expanding access to credit for MSMEs and contribute to economic reactivation, in March 2021 the BCRA established a new quota for the Financing Line for Productive Investment (LFIP), under financial conditions similar to those in force for the 2020 quota38. In the first month of the 2021 quota, the39 financial institutions granted disbursements for a total of $101,643 million (13% destined for investment projects), benefiting more than 22,100 companies. Through the 2020 quota, loans were granted that accumulated an average balance of almost $400,000 million between mid-October 2020 and the end of March 202140 . It is estimated that the LFIP had a positive impact in various areas of the country: 22.8% of the average balance corresponding to the 2020 quota was channeled to companies with tax domicile in CABA, followed by Buenos Aires (22.7%), Córdoba (13%) and Santa Fe (8.7%) (see Graph 17). The LFIP was channeled to various branches of activity41: it is estimated that almost 42% of the balance would have been allocated mainly to industrial companies and 24.6% to firms linked to commerce.
Figure 17 | Productive Investment Financing Line
Quota 2020 – Average accumulated daily balances
Moderate active mismatch of items with CER adjustment. The CER mismatch of all financial institutions continued to remain at limited values, standing at around 47.5% of the PRC (23% of the same when considering only the items denominated in UVA) at the end of the first quarter of 2021 (For more details see Section 2). When disaggregated by group of financial institutions, it can be seen that this mismatch was mainly explained by the set of public entities, and to a lesser extent, that of non-bank financial institutions.
3.3 Financial System Funding and Liquidity Performance
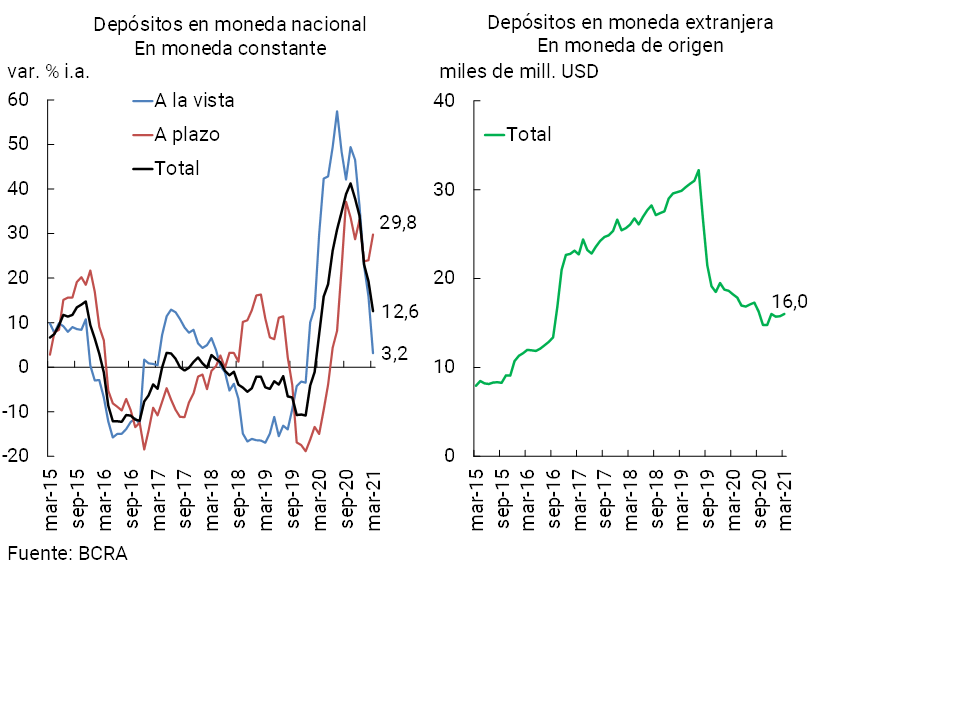
After the expansion of funding of the financial system through private sector deposits in pesos recorded in the first part of 202042, in the last quarter of last year and in the first quarter of 2021 the balance of these placements decreased in real terms. This performance occurred in the context of a lower monetary issuance by the BCRA based on the targeting of the National Government’s assistance programs and the moderation of the process of multiplication of money given the evolution of credit (see Section 1). Private sector deposits in national currency fell 4.7% in real terms in the last six months to March, a variation mainly explained by household deposits, and which is reflected to a greater extent in demand accounts. Time deposits in pesos in the private sector showed a better relative performance in the period, especially since the end of 2020 (-2.3% in real terms in the first half of the year and +6% in real terms in the first quarter of this year). Although still with little weighting, in line with the various savings instruments launched by the BCRA with inflation coverage, time deposits in UVA showed a significant relative increase in recent months.
Beyond the evolution in the margin, the total balance of private sector deposits in pesos accumulated an increase of 12.6% YoY in real terms over the end of the first quarter of 2021, with significant dynamism in the term segment (29.8% YoY). (see Graph 18). Public sector deposits in pesos also increased in a year-on-year comparison (+32.8% in real terms). In this context, distinguishing by stratum of amounts, larger placements in pesos (greater than $20 million) showed a greater relative increase in the last year43, reflected in a certain increase in the indicators of concentration of deposits44.
In recent months, the private sector’s foreign currency deposits have shown an incipient recovery, leaving behind the floor recorded at the end of last October (see Chart 18) as a result of an episode of some financial volatility.
Figure 18 | Private sector deposit balance
Financial system
Despite the reduction in real balances compared to the last edition of the IEF, private sector deposits in national currency continued to be the main source of funding for the financial system (liabilities and equity), accounting for about 47% of the total (see Chart 19). Within these liabilities, private sector time deposits increased their relative weighting slightly in the last 6 months to total 22.6% at the system level, while demand accounts slightly reduced their relevance to cover 24.1% of total funding. Deposits in national currency of the public sector represented about 11.2% of the total, resulting in total deposits in pesos being around 58.5% of the total funding of the system in March.
Figure 19 | Composition of funding by financial institution group
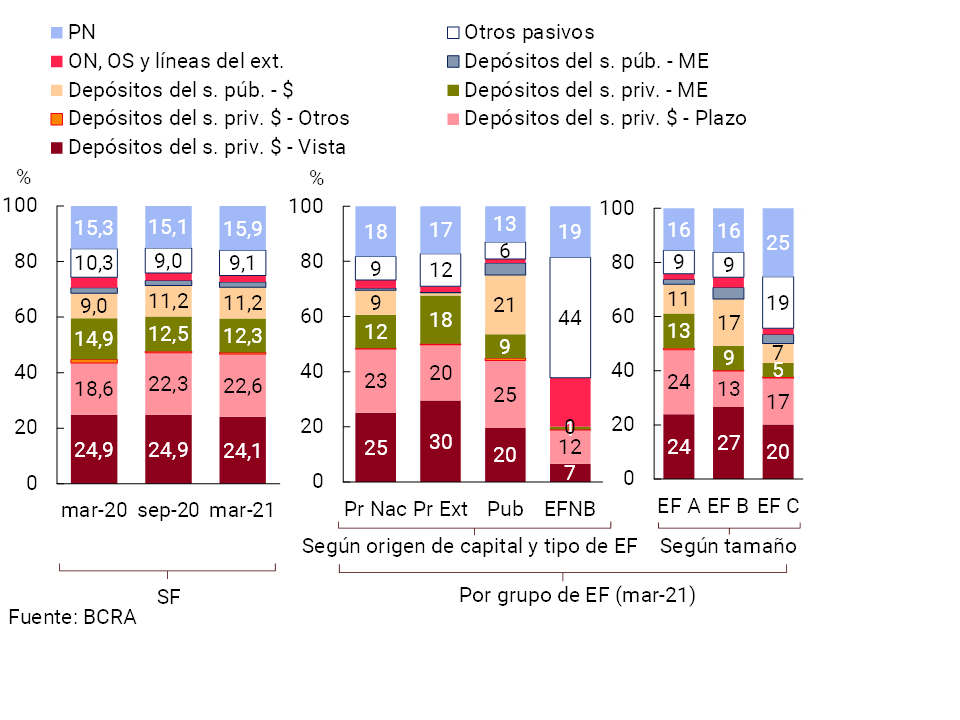
The rest of the financial system’s funding (41.5%) is mainly made up of net worth (15.9%), foreign currency deposits of the private sector (12.3%) and other liabilities such as On, Os, foreign credit lines and miscellaneous obligations. Among these concepts, in the last six months the relative increase in equity stood out (see Chart 19), partly reflecting the effects of the macroprudential measure of suspension of the distribution of results of the entities, implemented by the BCRA to temper the potential economic and financial impacts of the pandemic.
Going forward, the level and composition of funding sources could be affected if any of the risk factors set out in Section 2 materialize. In particular, greater volatility in financial markets, as well as a less dynamic than expected recovery in economic activity, could have a certain impact on the demand for deposits (or their composition) by companies and households, as observed in previous years, with possible implications in terms of asset and liability management for the financial system.
3.3.1 Specific elements of resilience and mitigating measures
Broad liquidity risk hedging. The financial system has liquid assets in the broad sense that as of March 2021 represented 66% of total deposits, being practically the same level as that evidenced in the previous edition of the IEF. The liquidity ratio reached 61.5% for items in pesos and 84.6% for the foreign currency segment at the end of the first quarter of the year, observing records similar to those of September 2020 and higher than those of the average of the last 15 years (41% in national currency and 78.4% in foreign currency). In this context of high levels of liquidity, the BCRA recently provided that as of June 2021, financial institutions will have the option of integrating part of the minimum cash requirements in national currency with Treasury securities with a minimum duration of 180 days, replacing part of the integration with LELIQ —arising from the regulatory requirement for time deposits—45. This measure, which seeks to deepen the liquidity of the public securities market in pesos by promoting the development of the local capital market, is complemented by the implementation of a specific mechanism so that entities, if required, can sell these financial assets to the BCRA. In addition, it should be considered that the exposure of the financial system to the public sector is currently at limited levels (see Section 2), with the aggregate of financial institutions observing a net debt position vis-à-vis the public sector when considering their deposits —from all levels of government—. It should be noted that this new regulation is specific to operations in pesos.
In this context, the local financial system continued to exhibit high liquidity margins, well above international standards. In March 2021, the Liquidity Coverage Ratio (LCR)46 stood at 2.3 for the group of entities obliged to verify it (Group A), comfortably exceeding the established minimum equivalent to “1”. This indicator increased slightly with respect to the record of the previous edition of the IEF and was above the average of the last 6 years (see Graph 20). The latter is mainly due to the growing impact on the numerator of the ratio (High Quality Liquid Asset Funds -FALAC-) of monetary regulation instruments and the current account balances of institutions, in a framework in which the denominator of the indicator (Total Net Cash Outflow -SENT-) presented relatively minor modifications.
Figure 20 | Basel Group A liquidity ratios
of financial institutions
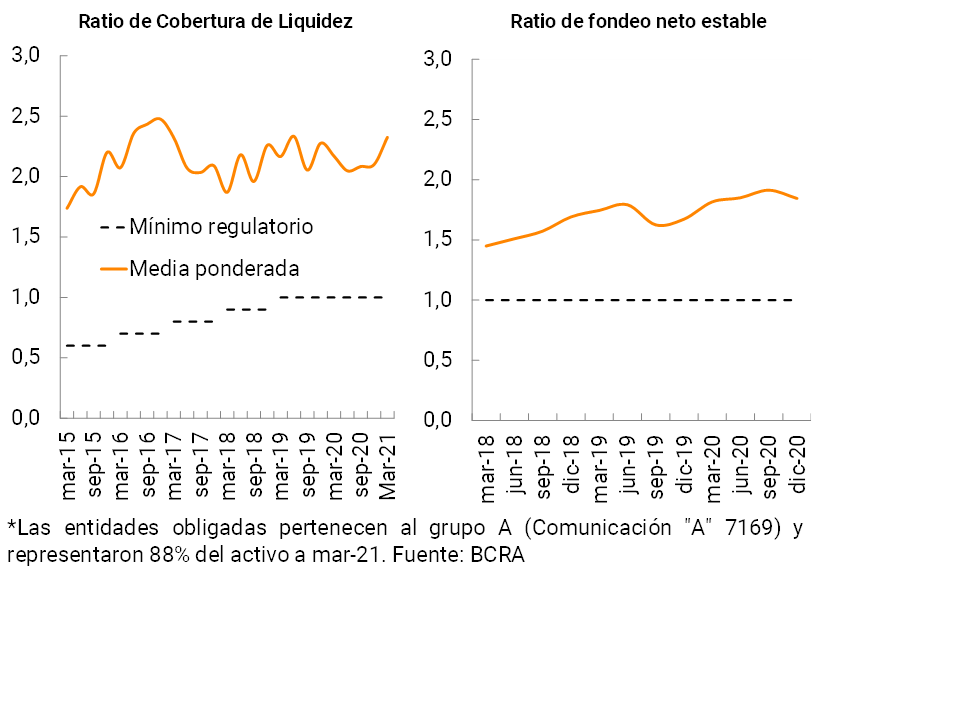
The Stable Net Funding Ratio (NSFR)47 totaled 1.8 at the end of 2020 (latest available information) for group A of financial institutions, exceeding the minimum requirement of 1 and the average of the last 3 years (see Chart 20). The high relative level of this indicator reflects the relevance of more stable deposits and regulatory capital (they account for most of the available funds (numerator), while the weight of assets with restricted availability over a period of more than one year (they make up the main concept of the required funds (denominator) remains moderate.
Limited mismatch of deadlines. The activity of the financial system continues to be characterized by low complexity, with a preponderance in transactional items, maintaining a low transformation of terms. Despite the better performance of fixed-term deposits in relation to demand accounts in recent months, the maturity of liabilities did not change in magnitude in the last year. Given the performance in terms of credit and liquidity (see Section 3), the average maturity of assets fell slightly in the last year, in a context of a greater share of the balance of public securities and monetary regulation instruments in the balance sheet of the entities – with a shorter duration than that of the rest of the assets. As a result, the exposure of all institutions to the assumed term mismatch decreased slightly in the period, thus remaining at moderate levels.
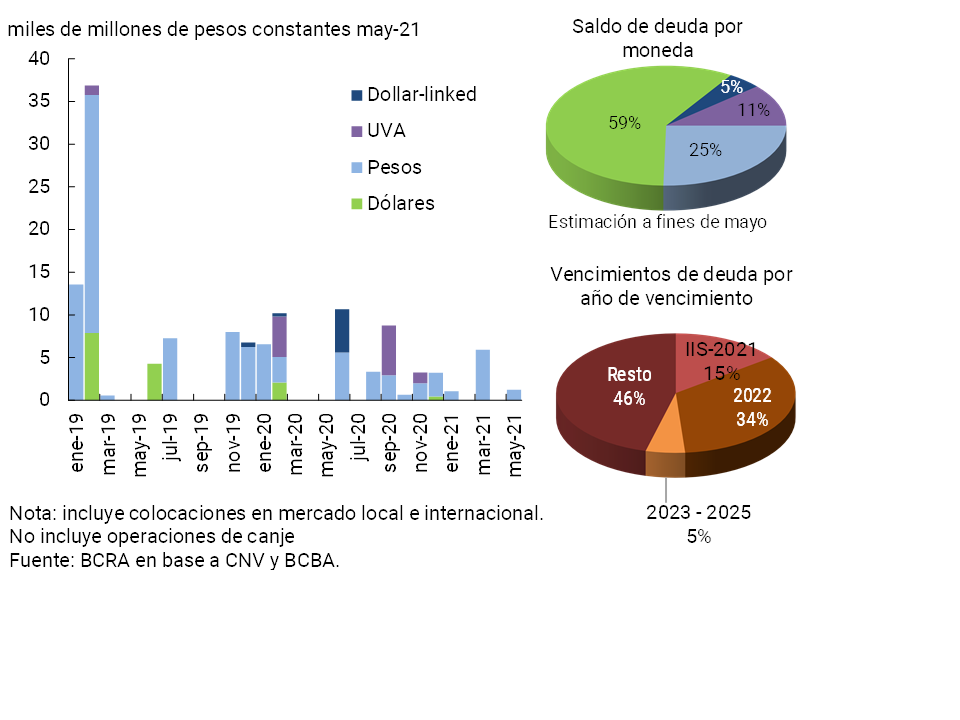
The funding of the financial system through the capital market continues at limited levels and with moderate amortizations in the coming months Currently, financing through the capital market represents a relatively small part of the total funding of financial institutions. For the aggregate of entities, outstanding bonds represent 0.7% of liabilities plus equity as of March of this year (1.7% if considered in aggregate terms only those entities that are funded with bonds)48. In turn, these bonds imply maturities for the second half of 2021 that represent 15% of the outstanding balance of these bonds in the financial system (the greatest weight of maturities occurs from 2023 onwards). In terms of currency, almost half of the maturities scheduled for 2021 are in pesos (including payments of ON in pesos, in UVA and dollar-linked) and the rest in dollars. Between January and May 2021, financial institutions made placements in the local market – not including swaps – for about $7,800 million (see Chart 21), which implies a year-on-year drop of 53% in real terms. These placements in 2021 were in nominal pesos and with a term between 12 and 15 months49. On the other hand, so far this year there has been only one ON buyback operation by financial institutions.
Figure 21 | Financial System ON Placements and Balance Characteristics
4. Other topics of stability of the financial system
4.1 Systemically Important Financial Institutions at Local Level (DSIBS)
The monitoring and differential approach of those financial institutions identified as systemically important at the local level (commonly referred to as DSIBS), seeks to prevent episodes of stress in an individual financial institution – which has certain characteristics – from causing adverse systemic effects. A hypothetical scenario of these characteristics could impact the economy as a whole, deteriorating the situation of families and companies.
This type of entity, which as of 2016 has received particular regulatory and supervisory treatment in Argentina50 – in line with what happens in other countries, in accordance with the standards recommended at the international level51 – can acquire systemic importance either because of their size, the level of their interconnections, the degree of complexity and the possibility of substitution they have. dimensions to consider regularly when monitoring their performance.
As of March 2021, the solvency and liquidity ratios of all local DSIBS (which represent approximately half of the assets of all institutions) were similar to those of the aggregate financial system and higher than those evidenced in the last edition of the IEF, with full compliance with the capital conservation margin52 (see Table 4). In line with the lower profitability in real terms that the sector has been showing in recent quarters, the ROE of DSIBS also decreased compared to 2020. Credit risk indicators remained in line with those recorded throughout the system, with an increase in margin forecasting and high capital coverage of credit net of forecasts. The exposure to the public sector and the mismatch of foreign currency of these entities presented levels above the average of the sector, and slightly higher than those of six months ago.
Table 4 | Main indicators of soundness for D-SIBs
4.2 Interconnection in the financial system
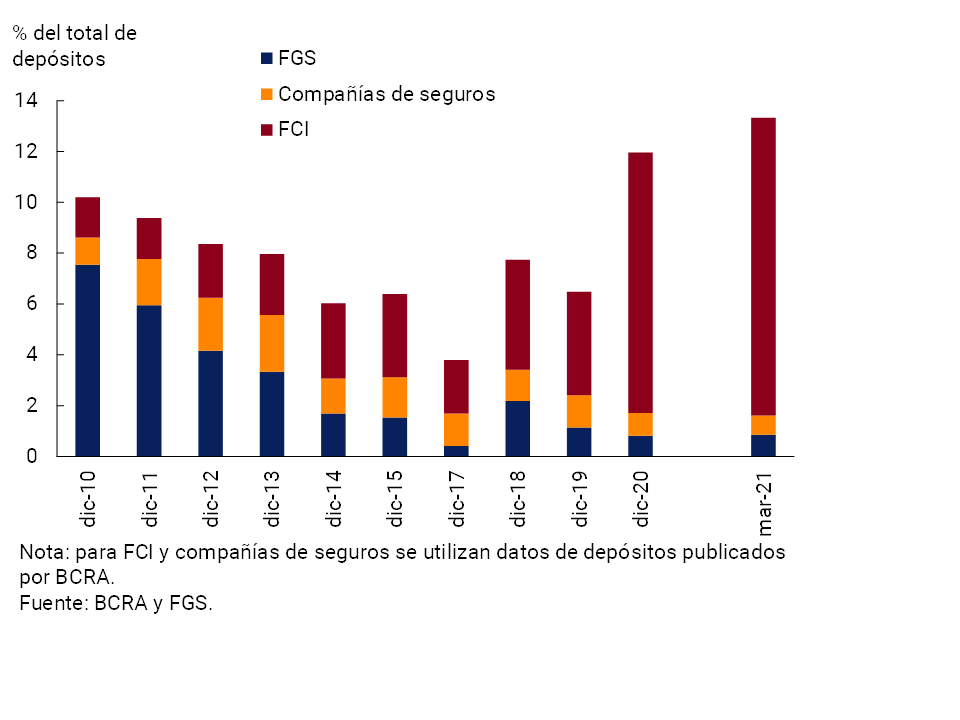
The main source of direct interconnection between institutional investors and the financial system (a group of entities regulated by the BCRA) is the deposits and time investments made by the former in the latter, with placements of Mutual Funds or FCIs standing out in this regard (see Chart 22)53. In recent months, there has been a new increase in the importance of funding provided by deposits from institutional investors for the total financial system, currently representing 13.3% of the total. This weighting exceeds by 3p.p. at the value observed 10 years ago and at 6p.p.al average of that period.
Figure 22 | Deposits of institutional investors as % of total deposits in the financial system
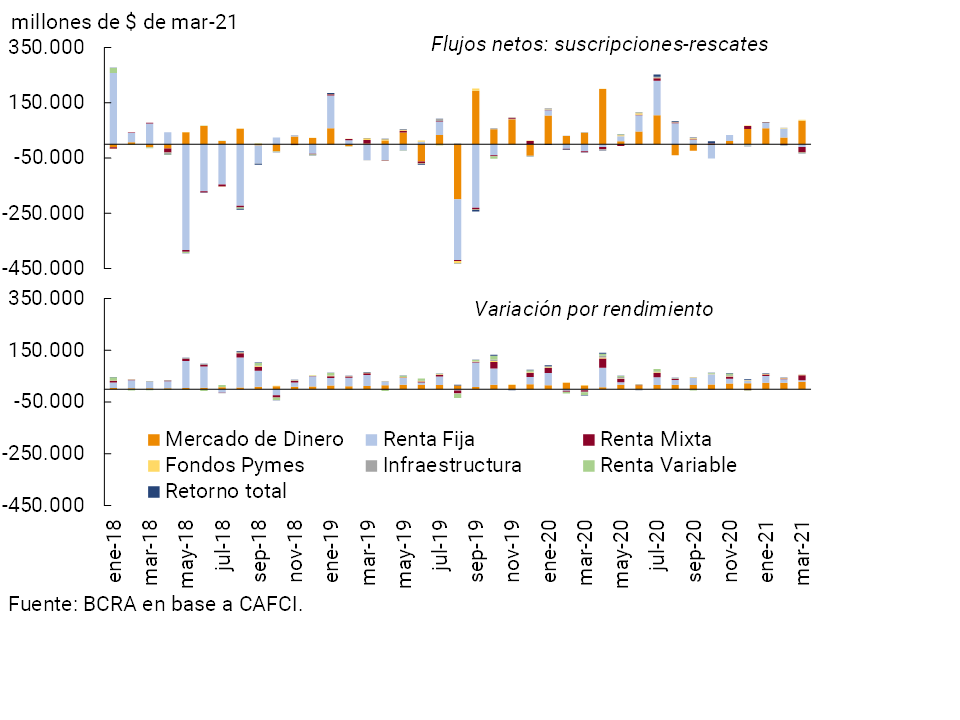
In particular, the increase in interconnection through deposits is largely explained by the performance of the FCIs, with assets that continued to grow in the first months of 2021, although at a slower pace than in the second half of 2020 (see Section 5). This dynamic is led by new subscriptions in money market FCIs (see Chart 23), which currently account for half of the assets of the FCIs.
Figure 23 | Evolution of net subscriptions and performance of the FCIs
Change in equity by FCI class
In terms of direct interconnection within the financial system, it is worth mentioning the recent performance of the market for unsecured interfinancial loans (call market)54. The intensity of this type of interconnection between the entities tended to decrease in recent months due to the decrease in the amounts negotiated in real terms. This was accompanied by a rise in the rates agreed in nominal terms, with a reduction in the differential with respect to other reference rates such as the BADLAR. Using the indicators of the network analysis methodology, a drop in the degree of interconnection in recent months with respect to longer-term values is also observed55, 56.
5. Main macroprudential measures
The BCRA’s prudential actions continued to be mainly focused on mitigating the systemic impact of the pandemic shock on the private sector of the economy, in a scenario in which the epidemiological situation remained challenging in recent months (see Section 1). At the end of 2020 and in the first part of this year, the axes of the prudential policy that was implemented in the first part of last year were maintained, in line with the initiatives taken by other developed and emerging economies to face the effects of the health situation. In this regard, the Financial Stability Board released a survey last April that indicates that, in the face of the still challenging scenario and uncertainty about the global macroeconomic outlook, most countries were still maintaining the measures taken to deal with the pandemic context57.
In the current macro-financial context, the BCRA maintained its regulatory approach in order to:
i. Boost credit to the private sector, especially through the Financing Line for Productive Investment in MSMEs (LFIP), expanding its available quota for 2021 and thus promoting favorable financial conditions for firms. This initiative was consolidated as the BCRA’s main credit promotion tool. More recently, measures were added to the same end, such as the implementation of regulatory incentives in terms of Minimum Cash, for those entities that generate loans to people who are not in the Debtors’ Central; 58
ii. Alleviate the financial situation of families and companies. Until the end of the first quarter of this year, a transitory modification was in force on the parameters for classifying debtors in the financial system, in addition to the possibility of transferring their unpaid installments at the end of the life of the credit (accruing only compensatory interest). Regarding the first of the measures, the BCRA decided to establish a gradual transition schedule between April and May, thus gradually returning to the parameters existing prior to the pandemic since the middle of the year. In terms of the possibility of transferring unpaid installments at the end of the life of the loan, in the face of the second wave of the pandemic, the BCRA decided to focus efforts on the most affected sectors, allowing employers covered by the Productive Recovery Program II (REPRO II) (accruing only compensatory interest) to use this tool.
iii. To support the measures that promote bank savings in pesos on a term basis, especially in terms of the availability of adjustable UVA pre-cancellable deposits that contribute to protecting depositors’ claims against variations in the general price level of the economy (even providing an additional return on the evolution of inflation);
iv. Maintain the current position of slack in terms of solvency that financial institutions have by temporarily extending the suspension of the possibility of distributing results. The aim is to protect the soundness of the system and its resilience in the event of stress events (possibility of materialization of private sector credit risk, see Section 3), while avoiding conditions that reinforce procyclical credit behavior;
v. Maintain and improve exchange regulations, preventing transitory imbalances between supply and demand from affecting the economy’s position of international reserves.
Finally, it should be mentioned that the BCRA recently issued a joint alert with the CNV with the aim of informing the public about the risks of operating with cryptoassets.
Section 1 / Global transition to new benchmark interest rates
A wide range of financial instruments available in the markets worldwide use the so-called reference interest rates. The use of these to set the price of financial contracts helps to reduce their complexity, while facilitating their standardization. This, in turn, helps reduce transaction costs and improve liquidity conditions.
Since 2007, when a set of facts of manipulation of reference interest rates59 was publicly disseminated, in particular of the London Interbank Offered Rate (LIBOR), a process of deterioration of confidence in them began to be evident. First, in what turned out to be a design flaw, LIBOR is built from a survey of a small group of banks reporting non-binding quotes rather than actual quotes from agreed trades. This created a widemargin of 60 for banks to have the ability to manipulate LIBOR. Second, the lack of liquidity in the unsecured interbank credit markets after the international financial crisis of 2007-08 gradually reduced their depth and solidity due to the lack of underlying transactions, a situation that deepened over time.
In 2014, the FSB’s publication of the document Reforming Major Interest Rate Benchmarks referring to the need to reform the main reference interest rates (IBORs61) and in particular the case of LIBOR, made clear the need for more solid reference interest rates that, among other dimensions, comply with the best practices and principles promoted by IOSCO. To this end, the FSB founded the high-level Official Sector Steering Group (OSSG), comprising the regulators and central banks of the jurisdictions involved62. This initiative resulted in the creation of new benchmark interest rates, which adopted the Principles for Financial Benchmarking (IOSCO 2013).
As a result, in 2017 the Financial Conduct Authority (FCA) of the United Kingdom – LIBOR’s regulator – agreed with the banks participating in the panel that the mandatory submission of their LIBOR estimates would be in force only until the end of 2021. In this context, it was agreed that the choice of a Risk Free Rate (RFR)63 should arise from overnight operations in unsecured markets, such as Overnight Index Swaps (OIS), or collateralized markets such as Repurchase Agreements (REOs). The rates selected were:
• SOFR (Secured Overnight Financing Rate) calculated from 2018 by the FED of operations in the overnight market of REPOs with treasury bonds;
• SONIA (Sterling Overnight Index Average) is an index computed on the Overnight Indexed Swaps (OIS) market that was introduced in 1997. Since 2016 the Bank of England has been its administrator and in 2018 it underwent some modifications to its calculation;
• TONAR (Tokyo Overnight Average Rate) is calculated by the Bank of Japan based on unsecured overnight transactions using information provided by money market brokers;
• SARON (Swiss Average Rate Overnight) is calculated from the REPO market. It was introduced in 2009 by the Swiss National Bank in cooperation with SIX Swiss Exchange;
• ESTER (Euro Short-Term Rate) published by the European Central Bank as of 2019. This rate reflects the cost of funding euro area banks in the unsecured overnight wholesale market;
However, there are some differences between LIBOR and RFRs. Thus, LIBOR consists of several components: (1) an RFR (the theoretical rate of a loan whose probability of default tends to zero), (2) a certain term (expectations about changes in rates during the period), and (3) credit risk. Alternative reference interest rates, on the other hand, consist only of the RFR component. As a result, the term alternative benchmark interest rate should not be interpreted as a replacement rate for existing contracts extending beyond 2021, which could result in legal consequences of not agreeing or renegotiating the transition in a timely manner.
In this scenario, the BCRA at the beginning of 2020 through Com. “B” 11933 and Com. “B” 11972 warned Financial Institutions about the legal, operational and financial risks associated with operations related to LIBOR that extend beyond the end of 2021. It also asked financial institutions for information on these exposures (see Figure A.1.1) and on the measures adopted to achieve a transition that does not jeopardize financial stability.
Figure A.1.1 | Exposure to Total Financial System
Libor
November 2020
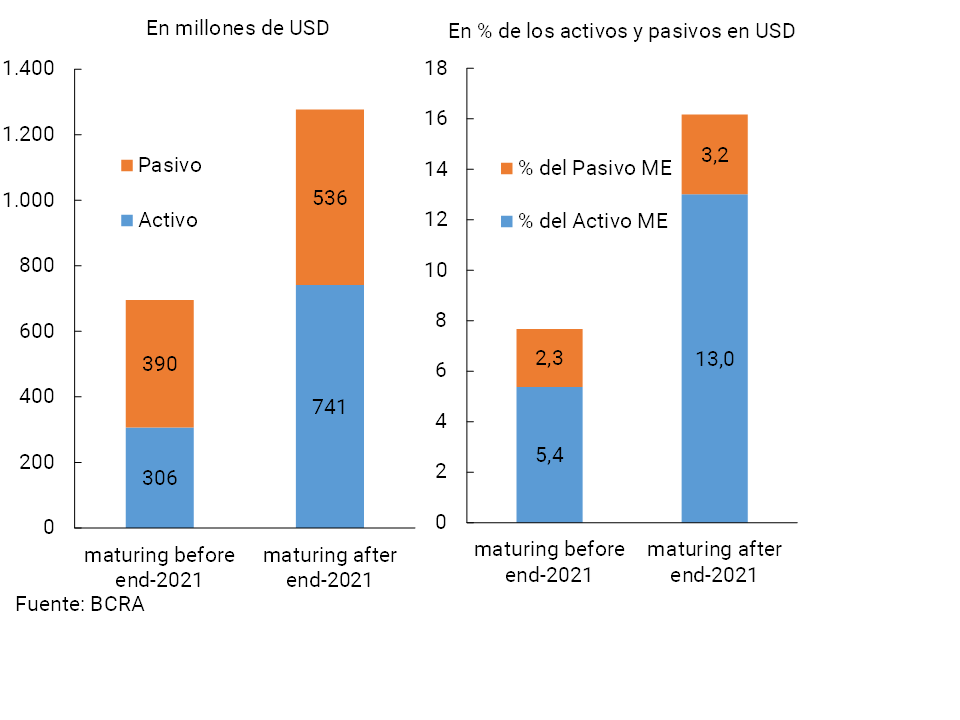
The FSB in its report to the G20 Supervisory issues associated with benchmark transition mentions that: “from a systemic perspective, uncertainty about the future of LIBOR as we approach the end of 2021 could increase macroprudential risks with increased volatility or disorder in the markets, if users are unable, unaware or unwilling to move to the new reference rates.” In this context, in line with what was confirmed by the United Kingdom regulator as the date for the end of LIBOR64, the BCRA through Com. “A” 7278 replaced LIBOR in the T.O. for Time Deposits and Investments with the five alternative reference interest rates.
Certain challenges still remain, such as the creation of a temporary interest rate structure through the development of forwardcontracts 65. While LIBOR has forward variants (e.g. 1-month LIBOR, 3-month LIBOR, etc.), the new RFRs are overnight rates and so far a sufficiently liquid derivatives market has not been developed in all maturities, to have a term structure of interest rates that can be used in a sustained manner and in the five currencies involved (Dollar, Euro, Pound Sterling, Yen and Swiss Franc) to avoid problems in the application of existing contracts. Currently, the FSB, the different bodies that issue regulatory standards, as well as different central banks continue to work on their development.
Section 2 / Guidelines for entities aimed at strengthening the cyber resilience of the financial system
Since the beginning of the pandemic, when different restrictions were established on the movement of the population in order to control the epidemiological situation, local financial institutions began to incorporate initiatives to adapt their activities to a context of less presence. In this way, the new scenario led to an acceleration of the process of digitization of financial services (supply), while promoting greater use of them by the population. The increased reliance on digital services highlighted in particular the need to adjust response procedures to potential cyber incidents. That is, the response to events66 that could impact a technological infrastructure (in which people, processes, and information systems participate) and endanger the cybersecurity framework.
To contribute to having more tools to face these growing challenges, in April of this year the BCRA released a set of guidelines for response and recovery from cyberincidents67, regulations aimed at both local financial institutions and payment service providers (PSPs) and Financial Market infrastructures (MFIs)68. This initiative included the work carried out within the framework of the Financial Stability Board (FSB)69 on effective cyber incident response and recovery practices, in which this institution participated.
It should be considered that these practices are necessary to be able to carry out a proactive approach that seeks to mitigate the impact of cyber incidents, which are usually of low probability of occurrence, but of high impact. The guidelines are based on the planning of the stages, setting out responsibilities from the governing body to the operational levels, and including in its components the best practices for analysis, mitigation, recovery, communication and coordination in the face of cyberattacks. In this way, at the operational level, it seeks to address and solve cyber incidents and their root cause, as well as to promote their investigation to avoid recurrences and have evidence for possible judicial interventions (identifying responsibilities). At the same time, it contributes, through better communication and coordination, to prevent them from becoming possible risk factors for the system in an aggregate way (overview).
The implementation of the aforementioned guidelines complements previous efforts by the BCRA that seek to address security and technology risks – including those linked to electronic channels – with the ultimate goal of providing security to users of financial services. The local regulations that have been in force for more than 10 years establish minimum mandatory compliance requirements for financial institutions in the different processes for:70
• Raising awareness and training of internal and external customers through the acquisition and delivery of knowledge in security practices, their dissemination, training and education, in order to prevent, detect and correct security incidents in electronic channels;
• The evaluation, development and implementation of security measures for the protection of identity, authentication mechanisms, segregation of roles and functions and other characteristics of the access of internal and external users to the Electronic Channels.
• The use of measures to control the integrity and registration of data and transactions, as well as the handling of sensitive information from the Electronic Channels and the techniques that provide traceability and allow its verification.
• Monitoring and control of transactions, behavior patterns of financial users, failures, unavailability, intrusions, and other situations that affect customers and services offered through electronic channels, which allow the entity, through the collection, analysis, and control of events, to warn and act preventively in the event of suspicious situations.
• The management of security incidents in electronic channels, i.e. the implementation of measures for their detection, evaluation, containment and response, as well as escalation and remediation activities of the technical and operational environment.
Finally, with the aim of providing complete information to the community, the main publications that have been prepared and implemented in the field of cybersecurity have recently been added to the BCRA website, containing the required and recommended standards, as well as guides on the subject71.
Section 3 / Risks faced by the financial system linked to climate change
Reflecting the growing international commitment to face the challenges caused by climate change in a coordinated manner (CC)72, 73, different international forums74, Central Banks and Regulatory/Supervisory Authorities, as well as market participants, have begun in recent years to advance in the analysis of its potential financial implications, outlining alternatives to address them. Thus, the financial challenges and risks that CC causes on financial sector participants began to be progressively internalized, a scenario that could jeopardize their normal functioning in their respective jurisdictions and even on a global scale75.
There is an international consensus, as reflected in the specialized literature and its approach is organized in the different forums, regarding the fact that two main types of risks associated with CC that could impact financial systems can be identified: physical risks and transition risks76, 77. Physical risks are made up of financial losses directly caused by the increasing severity and frequency of extreme weather events, such as the increase in the amount and intensity of rainfall, floods, droughts, extreme heat or cold waves, among other effects that put at risk a specific productive activity to which a financial institution is exposed—directly or indirectly—(e.g., crop losses, damage to production facilities, etc.). Physical risks also include the impacts of a gradual increase in average temperatures that, for example, lead to some productive areas that usually have access to bank financing becoming unsuitable for cultivation (e.g., as a result of changes in ocean temperature that causes changes in their level and circulation).
On the other hand, the so-called transition risks are linked to the financial impact of migrating in the short/medium term to an economy with a greater proportion and depth of less polluting activities78. This migration can be driven by the preferences of consumers and investors, who become environmentally and socially aware and act accordingly in their consumption and investment decisions, as well as by the effect of public and regulatory policies (e.g. those that reflect the different international agreements and commitments on pollution).
Although with different intensity between types of economies, the aforementioned risks linked to CC can impact the normal performance of institutions in different jurisdictions and even on a global scale. Among the main channels of equity impact on institutions are: i. the potential deterioration of the payment capacity of debtors of financial institutions, whose income is adversely affected by climatic events (credit risk), or by changes in consumer preferences or in state policies on pollution; ii. the possible loss of value of loan collateral, as in the case of real estate that suffers losses in value due to being in climate-exposed areas (among others) (credit risk); iii. the potential deterioration of the prices of the securities in which it invests (market risk), such as the stock holdings of firms exposed to the effects of CC or those that are highly polluting; iv. reputational risks for entities due to having channeled resources to activities that are not suitable from an environmental point of view; v. legal risks in the event of possible lawsuits due to the pollution generated; vi. operational risks linked to potential damage to the infrastructure necessary for the provision of financial services (electronic and face-to-face), among others. In this context, in recent years there has been a growing international consensus to involve Central Banks and Regulatory/Supervisory Authorities, whose responsibilities include promoting the proper functioning of the financial system, ensuring the financial stability of economies.
In this framework, several Central Banks began, among other initiatives79, to: i. assess the degree of consideration/internalization that the different actors in the financial market make of the financial risks linked to CC (and how they carry out this task)80; ii. to analyze the capacity of financial institutions to monitor and manage them, and what instruments and information are available for this purpose; iii. encourage institutions to make progress in the identification and management of risks linked to CC, through the establishment of recommendations for good practices; iv. advance in the development of metrics and instruments (of varying degrees of complexity), as well as data that serve as inputs to be able to evaluate and monitor the financial risks linked to CC from the point of view of financial stability. The aforementioned initiatives are, in general, of gradual implementation and with configurations that are intrinsically associated with the characteristics of each country and region (given its economic and financial market structure, as well as its degree of development)81.
Argentina is no stranger to this international trend. Since 1994 it has participated in the United Nations Framework Convention on Climate Change, and signed the Paris Agreement in 2015. In 2019, the National Climate Change Cabinet82 was created, which aims to coordinate between the different areas of government and civil society actors, the design of strategic public policies to reduce GHG emissions. This is in addition to a set of initiatives by the CNV, other State actors, as well as the private sector83.
The BCRA has been participating in international forums on the subject, especially in the FSB and the G20, as well as in local initiatives that integrate different State agencies in the field of sustainable finance and risks related to CC. In this framework, the BCRA – together with other areas of the State – has the objective of strengthening efforts to evaluate and mitigate the risks that CC implies for the Argentine financial system. One of the main guidelines of this initiative is the preparation of a diagnosis of the state of the sector (degree of knowledge/internalization of the financial risks linked to the CC), raising awareness among market players about its relevance, advancing in the identification and evaluation of the system’s exposure to the physical and transition risks assumed, advancing in tools for evaluating them with a systemic perspective and, eventually, the design of policy actions to carry out a prudential approach.
These initiatives will be consolidated both by the different contributions that this Institution receives from other areas of the State, from civil society, as well as from international actors who have had a greater trajectory in the matter.
Section 4 / Certain channels of interconnection between financial institutions and non-financial credit providers
As mentioned in Section 3, the set of financial institutions (FIs) that make up the Argentine financial system84 originate the largest proportion of credit to households and companies. The private sector also obtains funds from other local sources, such as non-financial credit providers (NFPs), a segment mainly made up of mutuals, cooperatives, credit and/or purchase card issuing companies, the so-called Fintechs, as well as other legal entities that offer credit to the general public85, 86. In the context of the macroprudential monitoring periodically carried out by the BCRA, it is important to evaluate various aspects of the PNFCs, such as their channels of interrelation with the financial system, in order to have a better diagnosis of their potential sources of vulnerability.
This box provides an analysis of some of the interconnection channels between the FIs and the NFPs. On the one hand, it seeks to dimension the interconnection between both sectors through the credit that the FIs grant to the PNFCs, an interconnection here called via funding. On the other hand, the debtors who are financed with both the FIs and the PNFCs (common to both segments) are identified, an interconnection here called via debtors in common (DC). In the latter case, an attempt is made to know the representativeness of these DCs – for each block – and some of their characteristics such as the level of delinquency.
The number of PNFCs registered with the BCRA, according to regulatory requirements, exceeded 350 as of the date of analysis87. On the other hand, according to the data available from the Central Debtors’ Office88, as of March of this year the balance of credit to the private sector granted by the PNFCs represented 7.1% of the total credit to the private sector jointly supplied by all the FIs and all those PNFCs (265) that contribute data to this source89. This indicator did not present significant changes in a year-on-year comparison.
In terms of the aforementioned interconnections, the following can be observed:
I. Interconnection via anchorage:
• As of March 2021, 53 FIs granted financing to 317 NFPs (see Figure A.4.1), constituting a balance equivalent to 2.8%90 (+0.3 p.p. y.a.) of credit to the private sector generated by this group of FIs (2.7% of credit for the entire financial system). The irregularity ratio of this financing stood at 1.7% on the same date, below the 3.9% observed for credit to the private sector of the entire financial system. More than 76% of the funding channeled to the PNFCs was accounted for by 8 EF91.
Figure A.4.1 | Interconnection between the FIs and the PNFCs through the funding they receive from the FIs – March 2021
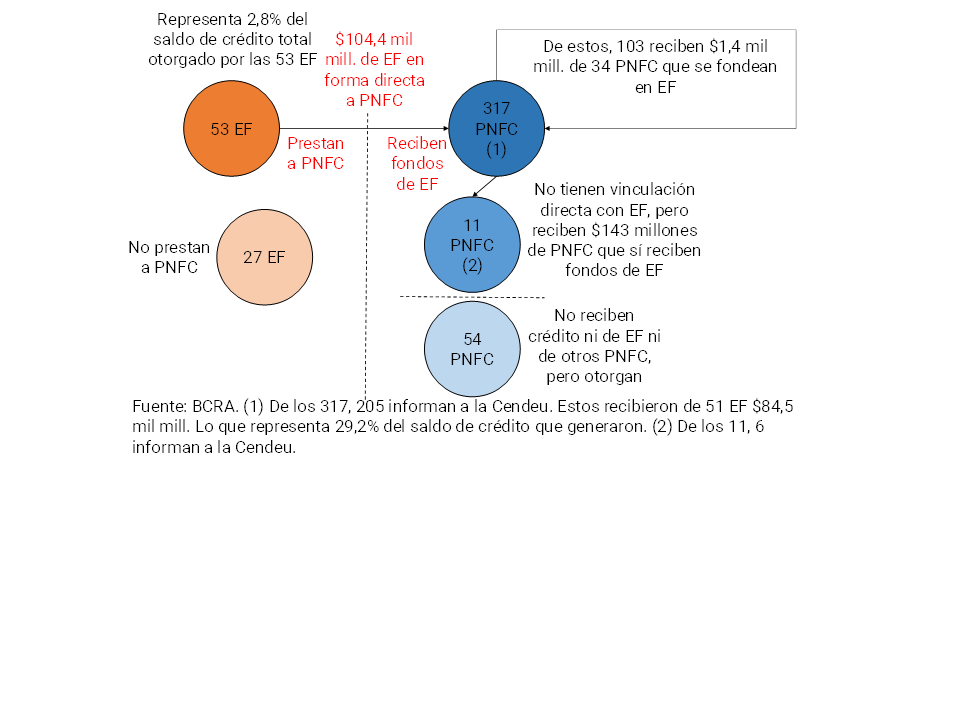
• From the point of view of the PNFCs that received resources from the FIs, there is a set of 205 that reports data to the Debtors’ Central. Out of this sample of 205, the funding received from EF represented 29.2% (-0.9 p.p. y.a.) of the credit balance that these PNFCs had in force as of March of this year92;
• In addition: i. considering these 205 PNFCs, there were 34 that, in turn, granted credit to 103 PNFCs; ii. 11 NFPs were not funded directly with a FI, but took credits from another NFMP that was funded with a FI; and iii. 54 PNFC did not take loans from a FI (and reported data to the Debtors’ Central)93.
II. Interconnection via common debtors:
• At the end of the first quarter of 2021, there were 15.5 million debtors in the universe of EF and PNFC. Of this total: i. 23.5% was financed in both segments (EF and PNFC)94, i.e., there were 3.6 million DCs (see Figure A.4.2); ii. 56.3% only did so in PE; and iii. 20.1% in PNFC alone;
Figure A.4.2 | Interconnection between FIs and PNFCs via debtors in common
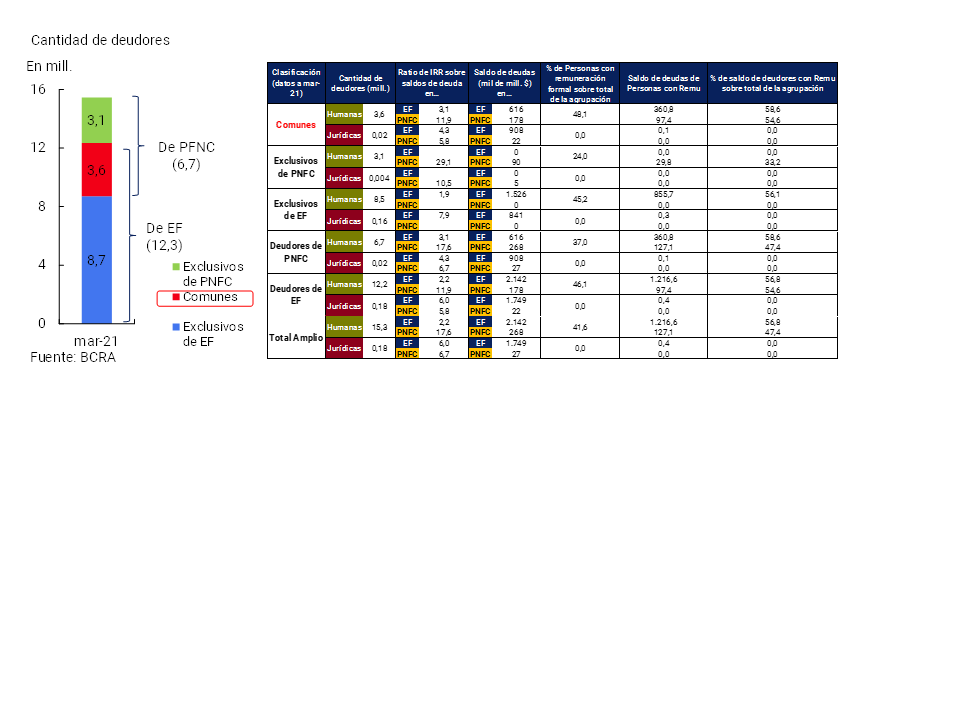
• 99.5% of the DC were explained by human persons.
• As of March 2021, the debt balance of the DC reached 41.2% of the total credit balance of EF and PNFC95 (-6.3 p.p. y.o.y.).
• In terms of the indicators associated with the materialization of credit risk, the non-compliance ratio of loans channeled by NFPs is usually higher than that corresponding to financing granted by FIs. This would be in line with the relative bias in terms of the average credit profile of all debtors in each group, in particular with regard to non-common debtors (relatively lower income levels in the case of PNFC customers). Within the DC universe, it is also observed that the irregularity ratio for FIs is relatively lower than that recorded for NFPs. As of March, the NPFC NPL ratio reached 16.6% (-8.6 p.p. y.o.y.) (17.6% for individuals, -9.4 p.p. y.a.).
• Considering exclusively the set of DCs (human persons), it is observed that:
i. Its non-performing loan ratio amounted to 3.1% in the FIs as of March of this year (see Chart A.4.2). This value is higher than that corresponding to the set of debtors who receive financing exclusively from these entities (1.9%; the average being 2.2% for all individuals who are debtors of the FIs);
ii. Its non-performing loan ratio reached 11.9% in the PNFCs. Although this level is relatively high, it is below the irregularity of individuals who are exclusive debtors of the PNFC (29.1%; with an average irregularity for this group of entities of 17.6%);
iii. In general, it can be observed that there is a higher proportion of individuals with formal income among the DCs (48% of the total) than in the group of exclusive debtors of PNFC (24%), a situation to which differential credit performance could be associated, at least in part.
Section 5 / Evolution of the Mutual Fund (FCI) industry and interconnection with the financial system
As of May 2021, the FCIs managed assets of $2.4 trillion, equivalent to 7.1% of GDP, being the second main local institutional investor behind the FGS (see Chart A.5.1, left panel). While fixed income and mixed income funds are the most numerous (316 and 108 funds, respectively), money market funds (43 in total) have the largest weighting of FCI’s total assets under management by the industry, at around 50% (see Figure A.5.1, right panel). Money market FCIs, with a shorter-term investment horizon and lower volatility in the value of the share, are frequently used for liquidity management96. The investments of money market FCIs mostly include time transactions (fixed-term deposits, sureties and passes) and availabilities (deposits in demand accounts). They can also invest in debt securities, collective investment vehicles (FCIs and financial trusts) and97 others.
Figure A.5.1 | Portfolio of the main institutional investors in Argentina
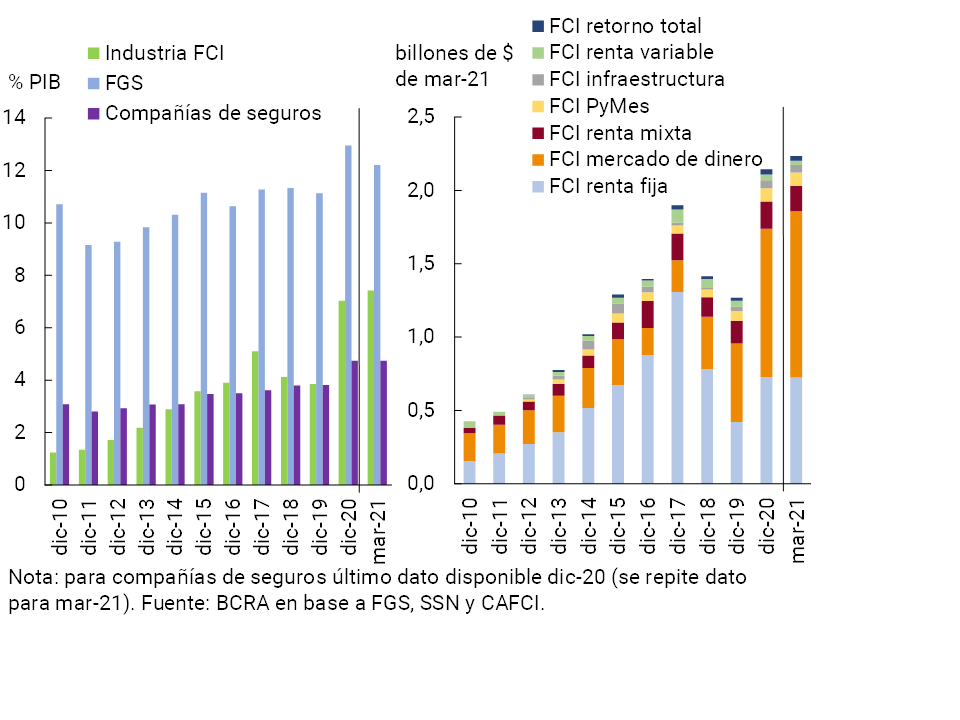
It should be considered that the total assets of the FCIs accumulated falls in 2018 and 2019 (of 26% and 10% in real terms, respectively), affected by the volatility of the markets in general and the reprofiling of Treasury instruments98 (a situation that resulted in sharp falls in the prices of public securities, which represented the majority of the investments of the FCIs, and a greater demand for liquidity). Towards the end of 2019, there began to be some recovery in the sector and already in 2020 the assets of the FCIs grew almost uninterruptedly month by month in nominal terms, accumulating an increase of 69% in real terms year-on-year to December 2020. This dynamic continued in 2021, although at a slower pace (estimated growth of 2% in real terms accumulated until May).
With the investor base prioritizing shorter maturities and less volatility in returns, in recent years there has been an increase in the positions of money market funds to the detriment of those of fixed income, which are no longer the main class in the industry. In 2020 and so far in 2021, money market FCIs were the ones that grew the most in relative terms and largely explain the performance of the sector, while increasing their share of the total (from 42% at the end of 2019 to 47% at the end of 2020). The growth is explained by new subscriptions and, to a lesser extent, by the return on investments.
In this scenario, based on the growth of money market funds since 2019, and given the composition of their portfolios, there is an increase in the direct interconnection between the FCI industry and financial institutions (regulated by the BCRA)99. For the aggregate of the FCIs, deposits in the financial system (in demand and fixed-term accounts) reached 49% of the total equity of the industry as of March 2021, equivalent to 12% of the total balance of deposits in the financial system (mostly concentrated -94%- by money market funds). As of December 2019, CRF deposits accounted for 28% of total ICF assets and were equivalent to less than 5% of total deposits in the financial system100.
With granular information at the fund level and using network analysis, among other indicators, an increase in the direct interconnection between financial institutions and FCIs is also observed, grouped by deposits of each FCI Management Company (SG) (see Table A.5.1)101, 102. For example, between December 2019 and March 2021, the ratio between observed and possible links increased (+10 p.p. to 29% in March 2021) and the average amount of the link in real terms doubled. As of March 2021, there is an increase in the weighting of the deposits of the 10 main SGs and at the level of each SG, there is an increase in the number of FIs with which they operate (the median goes from 6 to 10). From the point of view of each FI, there is an increase in the weighting of the deposits of the FCIs (grouped by SG) on their funding. Considering each link at the individual level between SG and financial institution (with respect to the total private sector deposits of each institution), an increase is also observed in March 2021, a situation that can also be visually seen in greater network density in March 2021 (see Graph. A.5.2). It should be considered that, from the prudential point of view of financial institutions, the increase in SG deposits occurred together with a significant increase in the institutions’ high-quality liquid funds, thus reflecting an improvement in the Liquidity Coverage Ratio (LCR) (Basel III) of the financial system in recent months (see Section 3).
Table A.5.1 | Indicators of direct interconnection between FCI deposits grouped by SG and financial institutions regulated by BCRA
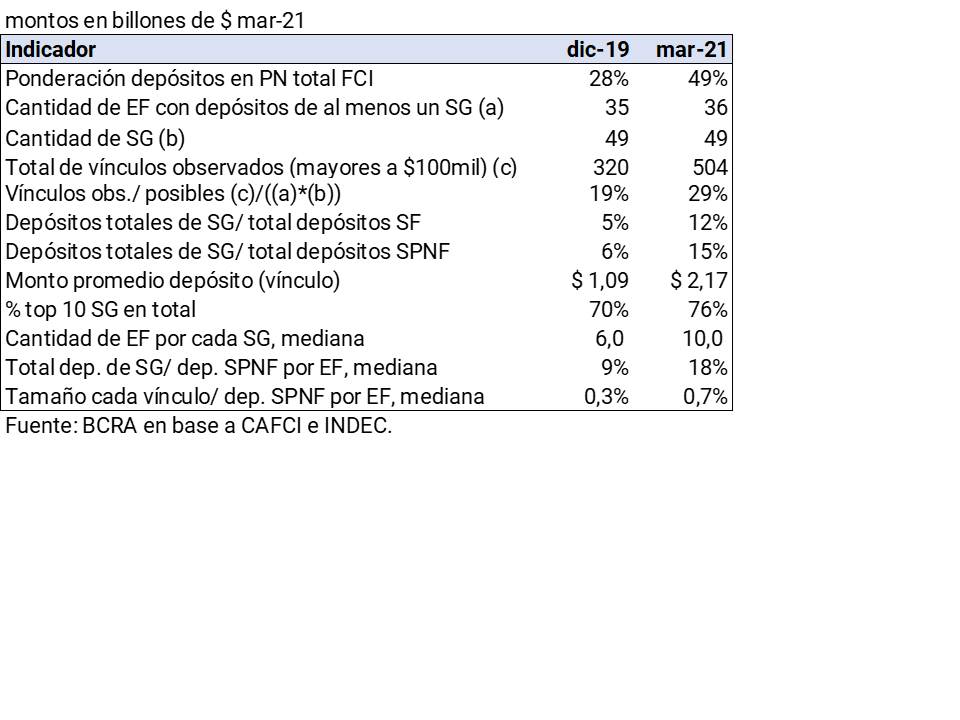
Figure A.5.2 | Bipartite network between FCI deposits grouped by SG and financial institutions regulated by the BCRA
Weighted links by amount Upper
axis SG, lower axis EF
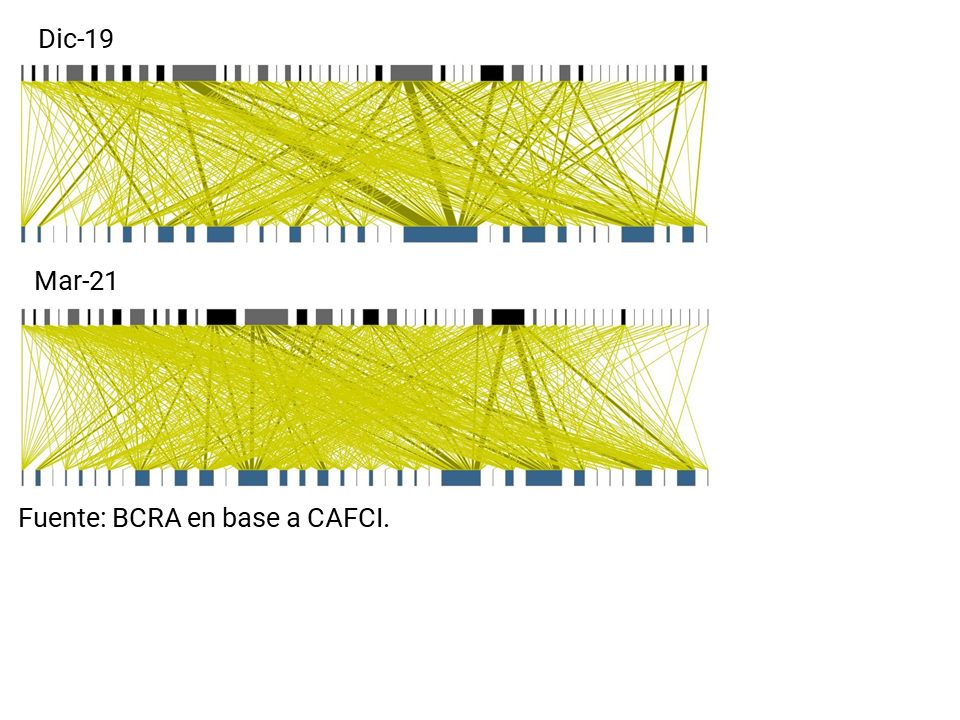
References
1 For more information on the evolution of economic activity at the global and local levels, see Monetary Policy Report.
2 The VIX (expected volatility for the S&P 500, based on options) went from an average of 24% in the first half of January to almost 40% in the last days of the month, after strong rises in specific securities of firms with low capitalization (operations linked to the retail segment, based on recommendations on social networks).
3 Yields on 10-year Treasury instruments rose from about 1.1% (average first half of January) to 1.7% in late March and early April (later declined slightly). In the same period, yields on inflation-adjustable 10-year Treasury instruments went from -1% to -0.7%.
4 Although at a slower rate than that observed in the last quarter of 2020. These inflows into emerging market funds were accompanied by dynamism in the placement of debt in international markets by emerging markets.
5 See section on Investment Funds and Financial Stability at a Global Level in the IEF above. With respect to investment funds in general, it should be noted that in March there was an episode of problems with a family fund (Archegos Capital Management) with significant exposures in derivatives, which could not meet additional margin calls requirements. Although this episode did not have systemic consequences, it generated concern regarding the segment of family funds, which are not regulated or monitored like other funds (such as mutual funds). These family funds have significant vulnerabilities (opacity, high leverage due to the use of derivatives, direct interconnection concentrated in a few counterparties, indirect interconnection through common positions with other agents – such as brokers – that can generate contagion effects), which in some cases they share with hedge funds.
6 Although since March, due to the increase in infections, new restrictions on mobility have been implemented, they are less intense than a year ago and are more focused.
7 For more details on this subject, see the latest editions of the Monetary Policy Report.
8 See BCRA Objectives and Plans for 2021.
9 Prior to this, financial institutions could meet the minimum liquidity requirements through current account deposits, Leliq and Bonte 2022, subject to different integration limits. In May, by decision of the Board of Directors of the BCRA, it was established that for the percentage of reserve requirements that can be integrated into Leliq, Treasury bonds in pesos (minimum duration of 180 days) may also be used. A specific mechanism was also established by which banks can sell to the BCRA the bonds they have purchased to integrate the reserve requirements.
10 Includes placements (gross amounts) of negotiable obligations, financial trusts, deferred payment checks, stock notes, credit invoices, shares and closed-end funds. Only genuine financing is taken into account (transactions linked to exchanges are not included).
11 So far this year, Córdoba, Salta, Entre Ríos and Jujuy have reached restructuring agreements for their foreign currency debt issued under international legislation (thus joining the provinces of Mendoza, Chubut, Neuquén and Río Negro that closed their negotiations in the last months of 2020). Given the principle of agreement with the ad hoc group of bondholders to restructure their bonds, Chaco announced an offer in June, while the provinces of Buenos Aires, La Rioja and Tierra del Fuego are still in the process of restructuring.
12 The renegotiations registered during the IVT-20, of some 40 companies, implied lower net purchases in the foreign exchange market by about USD 500 million compared to the original maturities for that same period. See Report on Private External Debt.
13 For more information see IPOM May 2021 edition
14 Considering balances of availabilities, concepts included in the integration within the framework of the BCRA’s minimum cash regime and instruments, both in items in domestic and foreign currency.
15 The Liquidity Coverage Ratio (LCR) measures the liquidity available to face a potential outflow of funds in a severe scenario of short-term stress. The Stable Net Funding Ratio (NSFR) assesses whether financial institutions have a stable funding structure – in line with the business they are engaged in – to mitigate the risk of possible stress situations arising from their funding.
16 Considering the latest BIS compilation with information as of December 2019 on the internationally recommended liquidity standards (Basel III Monitoring Report- December 2020), the level of the ratios (LCR and NSFR) for all the local entities obliged to verify them exceeded the values observed in other economies. In particular, the median LCR and NSFR for that period were around 2.6 and 1.8 respectively for the local financial system, while at the international level the largest banks (defined as those with Tier 1 capital greater than €3,000 million) showed levels close to 1.4 (1.8 for the rest of the entities) with respect to the LCR and 1.2 (same record for the rest of the entities) for the NSFR in the same Period
17 The regulatory capital position (regulatory capital – regulatory requirement) in terms of credit to the private sector net of forecasts stood at 30.6% at the aggregate level in March, 17 p.p. above the average of the last 15 years.
18 As mentioned in the Context section, these include, among others: market segments with signs of over-appreciation, growth of non-bank financial intermediation (increasing the pro-cyclicality of the global financial cycle) and generalized increase in leverage (with greater concern about debt sustainability issues). See sections on COVID-19 and challenges to financial stability globally and COVID-19 and risks to financial stability in emerging economies in the two previous editions of the IEF.
19 For more details, see the latest editions of the Bank Report.
20 For an exhaustive development of the relief measures taken, see the Normative Annex , as well as those corresponding to the last two editions of the IEF.
21 Defined as the ratio between credit in an irregular situation and total credit (regular plus irregular).
22 The balance of regulatory forecasts attributable to the non-performing portfolio represented 122% of said portfolio at the end of the first quarter of 2021.
23 Since traditional indicators such as the irregularity ratio are influenced by the impact of financial relief measures, they lose their informative content in terms of characterising credit quality. In view of this, alternative indicators are proposed that seek to isolate these effects, allowing a homogeneous comparison over time and with respect to other economies in the region.
24 The aforementioned indicator is constructed before considering the recovery of credits for the guarantees constituted (the total balance of credit to the private sector includes lines of loans with guarantees, such as pledge and mortgage loans).
25 For more detail, see the ECC’s survey of the first quarter of 2021.
26 Balances as of March as a percentage of the estimated GDP without seasonality of the first quarter of 2021.
27 Loans from financial institutions to households fell by 6% in real terms in the quarter, a similar pace to that observed for the aggregate of the rest of the estimated financing of households (sum of credit cards, financial trusts, mutuals and cooperatives, financing from the FGS – loans and PROCREAR – and other credit providers that submit information to the BCRA). In this context, the weighting of bank loans (73%) over total debt estimated for households in this monitoring is maintained. Within non-bank sources, the dynamics of two segments stand out in the quarter, financial trusts and non-bank cards, with real growth rates of 2% and 0.3%, respectively.
28 At the time of updating this information, the external debt data (financing from abroad through bonds and loans, not including commercial debt) available was as of December 2020. For its estimate as of March, this balance was expressed in dollars at the March exchange rate.
29 In the case of local non-governmental securities in the corporate sector (not including financial institutions), the balance is composed of 46% dollar-linked instruments, 27% in dollars and 11% in UVA (only 16% is in nominal pesos). More than half of dollar-linked ONs are in the oil and gas sector, with the rest explained by other sectors with lower weightings (electric power, agriculture and livestock, primary products, real estate, chemicals, etc.). The bonds in dollars are mainly from oil and gas companies (36% of the balance of local bonds in dollars), agriculture and livestock (27%), electricity (16%) and real estate activities (13%).
30 For more details on coverage and methodology, see sections on “Equity situation of the corporate sector” in IEF I17, “Companies with a public offering and currency mismatch” in IEF I-18 and “Financial situation of companies with a public offering” in IEF I-19 and II-20.
31 Both ROE (bottom line in terms of equity) and leverage showed greater dispersion in 2020. In the case of ROE, while the median increases in 2020, the simple average per company falls.
32 Of 12 publicly offered companies (non-financial sector) that had problems meeting their bond payments, 6 are SMEs. In most cases, debt restructurings have already been implemented or payments have been regularized. In the SME segment, in several cases, payments were made by a guarantor.
33 See “Financial Situation of Companies with Public Offering,” for more details on the methodology” in IEF I-19.
34 With respect to the total Argentine corporate sector, this weighting would be much more limited (only publicly offered companies are analyzed here).
35 The aforementioned estimates could change depending on further restructurings within the framework of the provisions of Communication “A” 7106 of the BCRA.
36 For more information, see IPOM , May 2021 edition.
37 For more details, see the latest editions of the Banking Report.
38 For more details see Normative Annex.
39 The entities covered are those included in group “A” as of April 1, 2021 and those that – not included in said group – operate as financial agents of the national, provincial, Autonomous City of Buenos Aires and/or municipal governments.
40 Value that amounts to $411,678 if considering the accumulated disbursement between mid-November and the end of March.
41 It is considered the main activity of debtors according to the AFIP registry.
42In the context of the beginning of the pandemic, the National Government and the BCRA implemented a set of extraordinary measures to assist the private sector. For more details of the measures implemented throughout the first part of the year, see IEF II-20 and the editions of the Banking Report for that period.
43 Mainly due to the performance of those corresponding to mutual funds (FCI) and companies of relatively larger size.
44 In particular, throughout 2020 (December latest available information) the median indicator of the concentration of deposits of financial institutions increased (it is constructed, for each institution, as the balance of deposits of the 160 main customers over the total of their deposits). For entities belonging to group A (they account for more than 90% of deposits in the financial system), the median of this indicator stood at 46.3% at the end of 2020, increasing compared to the end of 2019, and being 9.2 p.p. higher than the average of the last 15 years.
45 Communication “A” 7290 (see Press Release) established that for the percentage of reserve requirements that can be integrated into LELIQ, Treasury bonds in pesos with a minimum duration of 180 days and a maximum of 450 days may also be used. In order to ensure that the integrated requirements are liquid at all times, a specific mechanism was established by which entities can sell to the BCRA the bonds they have purchased to integrate the reserve requirements (Communication “A” 7291).
46 The LCR considers the liquidity available to deal with a potential outflow of funds in the event of a possible stress scenario in the short term. See Ordered Text (OT) Liquidity Coverage Ratio.
47 The NSFR takes into account the availability of stable funding of the entities, in line with the terms of the businesses to which it applies. See TO Stable Net Funding Ratio.
48 Value amounting to 1.4% of assets if subordinated obligations are included (3.1% if only those entities whose funding is through ON and OS).
49 With a weighted average term of 13 months for operations in nominal pesos, against 15 months in August-December 2020.
50 Since the beginning of 2016, the BCRA has provided additional capital margins for the DSIBS identified in the Argentine market (both public capital, as well as domestic and foreign private capital). For more details on the methodology used, see here.
51 For more detail, see A framework for dealing with domestic systemically important banks, BIS, 2012.
52 Equivalent to 3.5% of RWAs (1 p.p. above the capital conservation margin to which financial institutions that are not classified as DSIBs are subject).
53 In terms of the volume of assets under management, the most important institutional investor at the local level continues to be the Sustainability Guarantee Fund (FGS) – with a portfolio equivalent to 12.2% of GDP – followed by the Mutual Fund (FCI) industry – assets under management equivalent to 7.4% of GDP – and insurance companies – a portfolio equivalent to 4.7% of GDP. However, in terms of deposits, the main agents are the FCIs. For the FGS and the FCI, the information used is as of March 2021 and for insurance companies it corresponds to investments and availabilities as of December 2020 (latest available).
54 This market is small. The average daily amount traded is less than 1% of the balance of private sector deposits. However, it is relatively one of the main sources of direct interconnection between financial institutions. Through this market, entities manage their liquidity and price signals (rates) are formed from these unsecured operations.
55 A drop in the weighted average degree indicator and in the density of the network was observed, and an increase in the average distance.
56 See Section 3 of IEF II-18 for the definition of medium grade, density and the main terminology used in network analysis and IEF I-19 for the definition of assortativity.
57 COVID-19 support measures: Extending, amending and ending, FSB, 2021.
58For more detail, see Normative Annex
Investigations by regulators in the US and elsewhere uncovered explicit manipulation by banks to influence rate setting, with the intention of projecting financial soundness and thus benefiting their own trading positions. Between June 2012 and February 2013, the U.S. Commodity Futures Trading Commission (CFTC) and the U.K.’s Financial Services Authority (FSA) fined three banks in total, for more than $2.6 billion. See LIBOR: Origins, Economics, Crisis, Scandal, and Reform.
60 As mentioned in the BIS Quarterly Review, March 2019
61 Inter Bank Offered Rates: LIBOR, EURIBOR, HIBOR, MIBOR, SIBOR, TIBOR.
62 LIBOR is traded in 5 different currencies (Dollar, Euro, Pound Sterling, Yen and Swiss Franc).
63 It should be clarified that, although the credit risk of these rates is almost non-existent, it is greater than zero. Therefore, although they are usually referred to as RFR, they are actually nearly risk free rates. In addition, some of them (SOFR and SARON) are guaranteed since they arise from REPO operations, which constitutes an additional credit risk mitigator.
64 Immediately after 12/31/21, for all adjustments in British pounds, euros, Swiss francs and yen, and for 1-week and 2-month U.S. dollar adjustments. Immediately after 6/30/23, for all other dollar adjustments. https://www.bankofengland.co.uk/news/2021/march/announcements-on-the-end-of-libor.
65 Forward looking term rate or colloquially forward rate curve.
66 These may or may not be the result of malicious activity (phishing, denial of service or fraud are some examples of cyber incidents).
68 The guidelines for responding to cyber incidents were presented through virtual meetings with the different local banking associations, PSPs and MFIs in order to inform them of the purpose, the general structure and provide a space for possible consultations.
69 Effective Practices for Cyber Incident Response and Recovery, FSB, 2020.
70 Consolidated Text on Minimum Requirements for the Management, Implementation, and Control of Risks Related to Information Technology, Information Systems, and Associated Resources for Financial Institutions (Section 6 on Electronic Channels)
71 http://www.bcra.gov.ar/SistemasFinancierosYdePagos/Ciberseguridad.asp
72 According to the Ministry of Environment and Sustainable Development , climate change refers to a significant variation in the components of the climate when prolonged periods are compared, which can be decades or more. In particular, it is indicated that the Earth’s climate varied at different times throughout its history, due to natural changes such as volcanic eruptions, modifications in the Earth’s translational orbit, variations in the composition of the atmosphere, among others. However, since the last years of the nineteenth century, the average temperature of the earth’s surface has risen by more than 0.6°C (or higher), an increase that is linked to the process of industrialization that began more than a century ago and, in particular, to the burning of increasing quantities of oil and coal, the clearing of forests and some methods of agricultural exploitation. As a result, the Greenhouse Gases (GHG) produced by people’s activities enhance the planet’s natural greenhouse effect, generating an increase in its surface temperature.
73 International commitment that among its main milestones is the signing of the Paris Agreement in 2015 and the establishment, in the same year, of the 2030 Agenda for Sustainable Development (United Nations).
74 These include the G20, the United Nations, the Basel Committee on Banking Supervision (BCBS), the Financial Stability Board (FSB) and the Network of Central Banks and Supervisors to Green the Financial System (NGFS), among others.
75 Although it is not the central theme of this Section, the following considerations should be made: 1. in general, the international approach encompasses broader considerations than the CC, such as those related to the environment (protection of biodiversity, for example) as well as the care of social aspects, among others; and 2. This new scenario is also a source of new business opportunities for financial institutions, such as by addressing initiatives linked to less polluting energy sources.
76 Part of the specialized literature also identifies another set of risks, such as legal risks, among others.
77 For more detail, see, among others: The implications of climate change for financial stability, FSB, 2020; The Green Swan. Central Banking and Financial Stability in the Age of Climate Change, Bolton et al., BIS, 2020; Climate-related risk drivers and their transmission channels, BCBS, 2021.
78 That is, with lower GHG emissions.
79 See Section 2 “The challenge of central banks in the face of climate change”, from IPOM May 2021, for a discussion of the effects of climate change on monetary stability.
80 See, among others, Stocktake of Financial Authorities’ Experience in Including Physical and Transition Climate Risks as Part of Their Financial Stability Monitoring, FSB, 2020;
81 In this framework, several international forums such as the G20, BCBS, FSB, NGFS, IMF, among others, currently have working groups dedicated to analyzing and studying different dimensions and financial effects linked to climate change, several of them with a broader perspective (considering environmental aspects such as biodiversity, social, as well as corporate governance).
82 Created by Law No. 27,520 “On Minimum Budgets for Adaptation and Mitigation to Global Climate Change”.
83 Signing in 2019 of the Sustainable Finance Protocol by a group of local financial institutions.
84 Set of financial institutions subject to the Law on Financial Institutions.
85 For more detail, see Ordered Text of Non-Financial Credit Providers as well as the Report of Other Credit Providers.
86 Although there are other additional credit providers of a certain magnitude locally (see Section 3), this Box focuses the analysis on those for which granular information (microdata) is available by debtors (segment of financial institutions and non-financial credit providers).
87 See second footnote of this Section.
88 It should be noted that the information available in the BCRA’s Debtors’ Central Bank does not necessarily reflect the entire universe of non-financial credit providers that operate locally. This situation is in line with the information requirements present in the regulations in force (for more details see Ordered Text of Non-Financial Credit Providers).
89 Of this percentage, 4.7 p.p. was explained by credit and/or purchase card issuing companies and 2.4 p.p. by other PNFCs. It should be clarified that all unconsolidated balances are taken for the funding received by the PNFCs from the FIs.
90 65% of this balance is granted to credit and/or purchase card issuing companies and the rest to other PNFCs.
91 Entities belonging to Group A.
92 67% was granted by credit and/or purchase card issuing companies and the rest by other PNFCs.
93 It should be noted that the BCRA’s Central Debtors Office has information on those PNFCs that have current (active) financing in the time periods under analysis.
94 From the point of view of the PNFCs, the DCs represented 54% of the total number of debtors.
95 For the PNFCs, the balance of the DC represented 68% of the total credit balance that they reported to the Central Debtors’ Office.
96 Fixed income and mixed income CRFs account for 32% and 8% of the total open CRFs, respectively. There are other types of funds (total return, infrastructure, equities and SMEs) with a lower weighting in the total and closed CRFs (which are not considered in the Section).
97 By regulation, they may have up to 30% of the portfolio in assets valued at accrual (fixed-term deposits, passes and bonds) (a), on which a mandatory liquidity margin of at least 80% operates in deposits in demand accounts. In pre-cancellable fixed-term deposits (b) they can have up to 20% of the portfolio, valued at the market (when they are not in the pre-cancellation period, they are computed as assets valued at accrual). Debt securities must be market-valued and have a term of less than 1 year. Investments in (a) and (b) added together may not exceed 50% of the total assets. Forward transactions included passes with the BCRA when they were available as an instrument (in the second half of 2019 until February 2020).
98 On that occasion, the BCRA decided to temporarily hold auctions of active passes and purchases of Treasury Bills in FCI’s portfolio. For more detail, see Section 3 “The BCRA’s response to the impact of financial volatility on the FCIs” of the IPOM) of October 2019.
99 As regards the direct interconnection between the CRFs and other institutional investors, it is low in the case of the FGS and is significant between the CRFs and insurance companies. The investment in shares of FCI represented 1.1% of the FGS portfolio (2% of the total assets of the FCIs) as of December 2020. In the case of insurance companies, the holding of FCI shares represented 30.9% of the total investments and availabilities of those institutional investors as of December 2020 (22.5% of the total assets of the FCIs as of the same date). It is clarified that in addition to direct interconnection, which is focused on in this Section, there is indirect interconnection linked, for example, to the existence of overlapping portfolios and exposure to common factors.
100 However, as mentioned in Section 4 considering the three main institutional investors as a whole, although the current weighting of deposits shows a growth in margin in recent months, considering the historical values of, for example, December 2010, the increase is less marked.
101 Deposits are considered to be links without distinguishing between demand accounts and fixed-term accounts. There are other investments such as the holding of ON by FCI whose issuers are the FIs or EF shares that are not included in this analysis.
102 In terms of network analysis, the interconnection between the deposits of the CRFs (or their grouping into deposits at the level of each GS) and the financial institutions is qualitatively presented as a bipartite network. In a type of bipartite network there are two sets of nodes that are disjoint or independent of each other. The relationship between a node in one set and a node in the other set is given by a link.
Glossary of abbreviations and acronyms
€: Euro
to.: Annualized
AFIP: Federal Administration of Public Revenues
ANSeS: National Social Security Administration
RWA: risk-weighted assets
ATM: Automated Teller Machine
BADLAR: Buenos Aires Deposits of Large Amount Rate (interest rate paid for 30 to 35-day fixed-term deposits, more than $1 million, average of entities)
ECB: European Central Bank
BCBA: Buenos Aires Stock Exchange
BCBS: Basel Committee on Banking Supervision
BCRA: Central Bank of the Argentine Republic
IDB: Inter-American Development Bank
BIS: Bank for International Settlements
BoE: Bank of England
BONUSES: Fixed-rate Treasury bonds in pesos
CABA: Autonomous City of Buenos Aires
CAFCI: Argentine Chamber of FCI
Call: Interest rate on unsecured financial market operations
CCP: Central Counterparty (Contraparte Central)
CDS: Credit Default Swaps
CEMBI: Corporate Emerging Market Bond Index
CER: Reference Stabilization Coefficient
NVC: National Securities Commission
COVID-19: Coronavirus wished 2019.
MUST: Immediate Debit Payment Method
DPN: National Public Debt
DSIB: Domestic Systemically Important Banks
ECAI: External Credit Assessment Institution
ECB: European Central Bank
ECC: Credit Conditions Survey
USA: United States
EFNB: Non-Banking Financial Institutions
EMAE: Monthly Estimator of Economic Activity
EMBI+: Emerging Markets Bond Index
EPH: Permanent Household Survey
FCI: Mutual Funds
Fed: US Federal Reserve
Fed Founds: US Federal Reserve Benchmark Interest Rate
FGS: Sustainability Guarantee Fund
IMF: International Monetary Fund
FSB: Financial Stability Board
GBA: Greater Buenos Aires (includes all 24 matches)
A.I.: Year-on-year
IAMC: Argentine Institute of Capital Markets
IBIF: Gross Domestic Fixed Investment
IEF: Financial Stability Report
INDEC: National Index of Statistics and Censuses
CPI: Consumer Price Index
IPIM: Domestic Wholesale Price Index
IPMP: Commodity Price Index
IPOM: Monetary Policy Report
VAT: Value Added Tax
CSF: Liquidity Coverage Ratio
LELIQ: Liquidity Bills of the Central Bank of the Republic of Argentina
LFPIF: Financing line for production and financial inclusion
LR: Leverage Ratio
MAE: Electronic Open Market
MERCOSUR: Southern Common Market
Merval: Buenos Aires Stock Market (benchmark stock market index)
MF: Ministry of Finance
MH: Ministry of Finance
MSMEs: Micro, Small and Medium Enterprises.
MSCI: Morgan Stanley Capital International
MULC: Single and Free Exchange Market
NIC: International Accounting Standard.
IFRS: International Financial Reporting Standards (IFRS)
OECD: Organization for Cooperation and Development Ec.
ON: Negotiable obligations
OPEC: Organization of the Petroleum Exporting Countries
P.B.: The Basics
P.P.: Percentage points
PEN: National Executive Branch
PGNME: Global Net Foreign Exchange Position
GDP: Gross Domestic Product
PN: Net Worth
PPM: Mobile Payment Platform
SMEs: Small and Medium Enterprises
REM: Market Expectations Survey
ROA: Return on assets
SWEE: Return in terms of equity
ROFEX: Rosario Futures Exchange (Mercado a término de Rosario)
RPC: Computable Patrimonial Liability
S&P: Standard and Poor’s (Index of the main stocks in the US by market capitalization)
s.e.: Series without seasonality
SEFyC: Superintendence of Financial and Exchange Institutions
NFPS: National Non-Financial Public Sector
SGR: Reciprocal Guarantee Society.
TCR: Real exchange rate
TM20: Interest rate for fixed-term deposits of 20 or more million pesos or dollars.
TN: National Treasure
TNA: Annual Nominal Rate
Trim.: Quarterly / Quarter
ICU: Utilization of Installed Capacity
EU: European Union
US$: US Dollars
UVA: Unit of Purchasing Value
ICU: Housing Unit
UVP: GDP-Linked Units
Var.: Variation
VIX: S&P 500 volatility
WTI: West Texas Intermediate
Share on


