Executive summary
• Financial Service Access Points (PDAs) registered a 1.2% increase in the first half of 2023 | The number of ADTs per 10,000 adults (15 per 10,000 adults) and the coverage of ADTs, both in relation to the percentage of localities (52.3%) and the adult population (92.5%), did not show significant changes.
• The number of people with accounts reached 35.7 million as of June 2023, approaching the level of full coverage of the adult population | The number of people who have both bank accounts and payment accounts climbed from 18.3 million in December 2022 to 20.1 million in June 2023, which represented more than 55% of the adult population. This trend would show that people take advantage of the opportunities offered by the system to access a multiplicity of interoperable financial services.
• The number of people who registered activity in one of their accounts amounted to 21.9 million in the second quarter of 2023 | In this way, 61.4% of people with an account had at least one credit or debit movement. The population between 20 and 44 years of age had the highest levels of activity (over 70%), with a maximum in the age range of 25 to 29 years.
• The number of companies and organizations (E) with accounts reached 500,000 units | E with accounts grew by 13,000 units compared to December 2022 and the greater participation of those that operate only through bank accounts (80%), compared to those that have both types of accounts (19%) or only payment accounts (1%) stands out.
• Electronic means of payment (EMP) maintained their expansionary trend in the first half of 2023 | Each adult person made, on average, 25 monthly payments by electronic means, which represents an all-time high. Likewise, the amount transacted per adult increased by 25% at constant prices compared to the first half of 2022.
• The number of fixed terms in pesos of individuals stood at 8.2 units per 100 bank accounts, reaching the highest point in the last 4 years | This metric grew 45% between June 2022 and 2023. This growth is also reflected in a greater share of fixed-term loans in national currency in the total balances of savings and investment products, which went from 37% in June 2022 to 43% in June 2023.
• The percentage of the adult population with financing in the expanded financial system (SFA) registered an increase of 0.9 p.p. compared to December 2022, reaching a share of 55.4% as of June 2023 | In this way, the SFA consolidates a dynamic in which new people are incorporated with financing but with a reduction in the average balance per debtor. The other non-financial credit providers (OPNFC) are the main drivers of this phenomenon, given their operation of granting personal loans digitally and for small amounts.
• The number of MSMEs with credit in the SFA continued to grow in the first half of 2023 | One million productive units had credit in the SFA as of June 2023, a net increase of close to 57,000 productive units compared to June 2022. Likewise, the financing balance of MSMEs in the SFA registered a year-on-year drop of 5.1% at constant prices. The support provided through the BCRA’s Financing Line for Productive Investment, which represented 28.5% of the total balance of financing for MSMEs, maintained its positive impact in terms of financial inclusion with a focus on the productive development of micro, small and medium-sized enterprises.
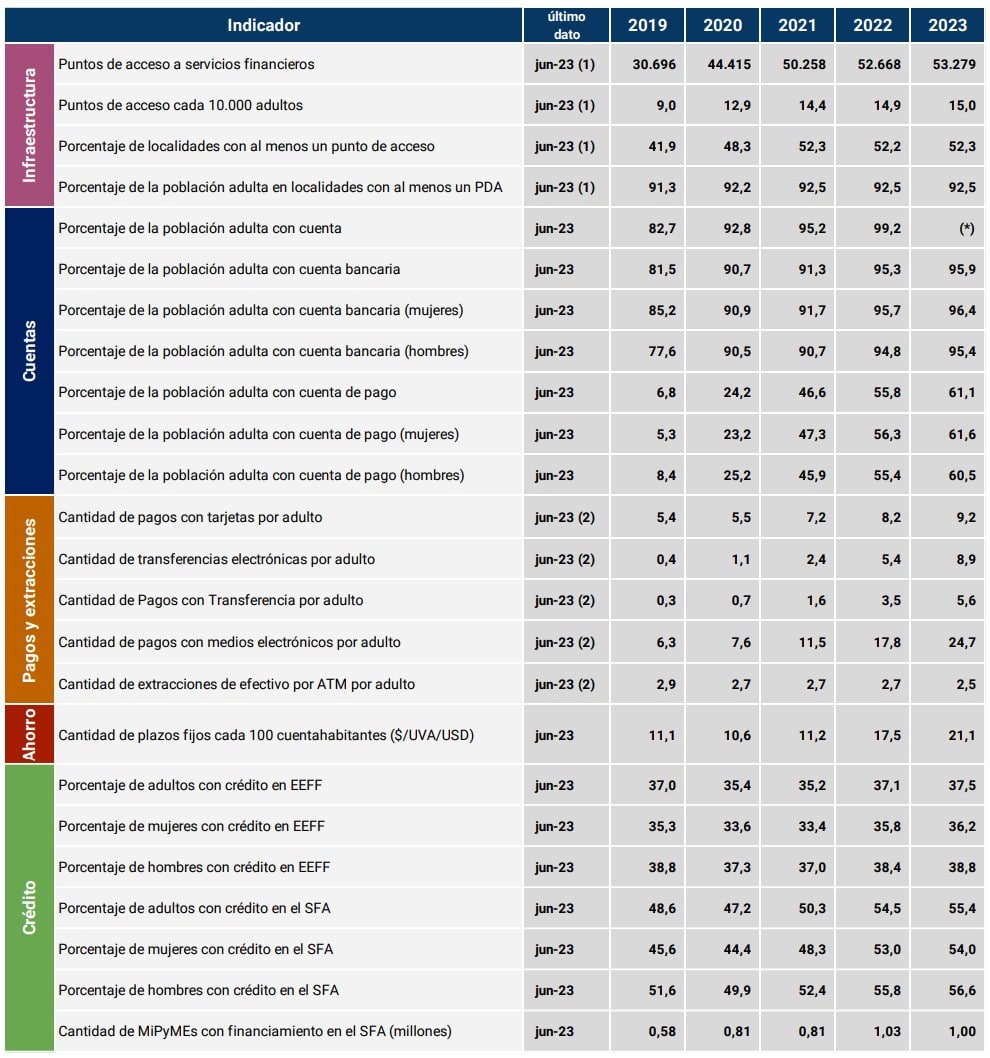
Indicator Table | Financial inclusion in Argentina
Notes:
ATM: ATMs, EEFF: Financial institutions, SFA: Extended financial system.
ATMs, EEFF: Financial institutions, SFA: Expanded financial system.
(1) This includes access points for financial institutions (branches, mobile branches, ATMs, self-service terminals and complementary financial services agencies) and ATMs operated by non-financial institutions.
(2) Monthly average for each year. Year 2023: monthly average for the first half of the year.
(*) Given that as of the date of this publication, data by age group from the 2022 National Census of Population, Households and Housing (INDEC) are not available, work continues with the projections of the 2010 Census. The indicators developed in this IIF in relation to the adult population should be taken as provisional until updated information from the last census is available. In this sense, the percentage of the adult population with at least one account shows a value of 100.4% in June 2023.
Introduction
Financial inclusion in Argentina showed a favorable evolution in its most relevant indicators during the first half of 2023. This is happening in an international context where the growing adoption of digital financial services highlights the relevance of communications infrastructure and information technologies. At the local level, financial institutions (EEFF) and non-financial institutions1 have been adapting their service offer based on the incorporation of technology. The BCRA, for its part, incorporated digital financial services into its regulation, seeking to balance the benefits offered to users and mitigating their associated risks.
A first evidence of this phenomenon can be seen in the growth of joint bank and payment account ownership, which as of June 2023 exceeded 55% of the adult population. This indicator reveals the importance of interoperability between both types of accounts, a quality that allows the population to access a variety of financial products, such as means of payment, savings, investment and financing instruments. In this sense, the first measurements of activity in accounts (i.e., with debits and/or credits) indicate that the proportion of people with movements in their accounts increased.
In the same vein, electronic payments have been experiencing continuous and high growth, where the number of transactions per adult reached a record value during the first half of 2023. This, added to the downward trend in the average amount transacted per adult2, shows the penetration of electronic means of payment in regular transactions of smaller amounts.
The evolution of digital infrastructure accompanied the incorporation of financial services into digital channels by entities. Mobile internet access continued to expand at rates well above population growth (6% per year in the first half of the year) (0.9%), while fixed internet access continued its upward trend, although at more moderate rates (1.4% per year in the first half of the year)3.
Likewise, access to digital infrastructure presents pending challenges such as the quality and availability of internet connection in small towns and the availability of electronic devices4. For its part, the physical infrastructure for access to financial services, which globally shows a downward trend for branches and ATMs, remained relatively constant during the first half of 2023.
For its part, the local macroeconomic context showed variability in the levels of economic activity, consumption, and employment between the first and second quarters of 2023. These indicators have an impact, directly or indirectly, on the financial inclusion of individuals and companies. Economic activity showed an expansion during the first quarter of the year (0.9%) and a contraction in the following quarter (-2.8%)5. The demand for consumer goods registered a qualitatively similar performance to that of the gross domestic product (GDP).
In the labor market, the economy continued to create jobs in the first three months of the year, although it reduced them in the second6. A notable feature of recent years is that the economy tended to intensify employment levels relative to GDP7. In this way, employment growth creates favourable conditions for greater financial inclusion of people. In this sense, the number of individuals with accounts reached 35.7 million as of June 2023, approaching the level of full coverage of the adult population, and the number of individuals with financing continued to expand (19.7 million people).
Labor income, on the other hand, continued to exhibit differentiated behaviors. Those linked to registered persons remained relatively stable in the first half of 2023 compared to the end of the previous year, while those of those not registered showed a reduction in period8 .
Lending and passive interest rates, after remaining stable in the first quarter of the year, increased during the second. The BCRA decided to accelerate the process of raising the benchmark interest rate with the aim of tending towards positive real returns on investments in local currency and preventing financial volatility from impacting inflation expectations and exchange market dynamics9.
In this context, access to credit registered the incorporation of new individuals (PH) and MSMEs, but with an average balance per debtor that continues to decrease. In particular, the BCRA issued regulations aimed at achieving greater financial inclusion of MSMEs that had an impact on the number of MSMEs that took financing in the SFA.
In terms of savings and investment products, the change in PH portfolios continued to be accentuated, with a reduction in the holdings of immediate liquidity instruments and an increase in those instruments with higher maturities and returns.
1. Financial infrastructure
Advances in the digitization of financial services, the greater availability of mobile devices and the internet, and the goal of reducing costs by financial institutions (EEFF), among other factors, have led to changes in the growth and composition of financial services access points (PDAs) globally10 .
Branches and ATMs exhibit, worldwide, a downward trend, while non-traditional access schemes such as complementary financial services agencies (ACSFs) have grown significantly, mainly due to the actions of India and Indonesia. Over the last five years, this phenomenon has led to a significant change in the composition of ADPs, where the share of ATMs and branches as a whole went from 61% in 2017 to 27% in 202211 , while, excluding India and Indonesia, it went from 83% to 74% in the same period of time.
However, over the period mentioned, FLWPs exhibit different behaviors depending on the income level of the countries: (i) high-income countries reduce ATMs and branches and maintain very low levels of ACSF; (ii) low- and middle-income countries register significant growth in ACSFs and ATMs and keep the number of branches relatively stable.
Graph 1 | Number of PDAs by type and set of countries
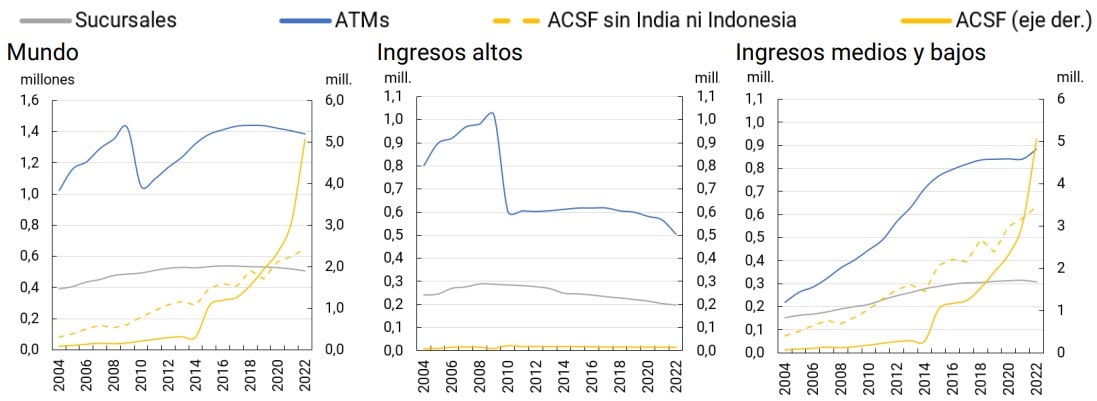
Note | A sample of 85 countries that report financial infrastructure data to the IMF is considered. “Mill”: millions.
Source | Financial Access Survey, FMI.
The evolution of ADPs in Argentina is similar to that of low- and middle-income countries as a whole, in a context where electronic means of payment grew significantly in both the number of transactions and the amount.
Physical infrastructure. During the first half of 2023, PDAs in Argentina registered an increase of 1.2%, mainly driven by the incorporation of new electronic devices. The number of FLW per 10,000 adults and the coverage of ADP did not show significant changes, both in relation to the percentage of localities and the adult population.
In line with the global trend12 , branches continue on a downward path and during the first half of 2023 they showed a fall of 1.2% mainly explained by the behavior of private banks. The ACSF, on the other hand, remained practically constant with a slight increase of 0.1%. This type of PDA, which is located almost exclusively in premises of the extra-bank collection networks13 , could have found a ceiling since it covered almost all the points of service of the country’s collection networks.
Table 1 | Financial Services Access Points by Location
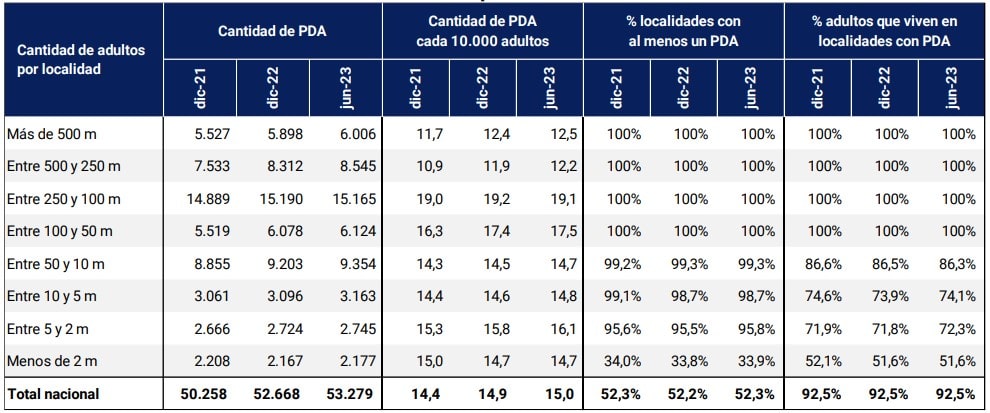
Note | M: Thousands. Number of localities and percentage of urban population as of June 2023: more than 500 m: (5.14%); Between 500 and 250 m: (19.20%); Between 250 and 100 m: (46.23%); Between 100 and 50 m: (48.10%); Between 50 and 10 m: (268, 18%); Between 10 and 5 m: (232 and 6%); Between 5 and 2 m: (402.5%) and Less than 2 m: (2518.4%).
Source | BCRA, networks and INDEC.
In relation to electronic devices, ATMs registered an increase of 3.2% compared to December 2022, with 607 new devices incorporated mainly by public banks (386 ATMs) and non-financial entities (217 ATMs). 31% of these new ATMs were located inside the branches, while the remaining 69% were located outside. ATMs located outside bank branches contribute to improving the capillarity of the financial system’s infrastructure. In addition, these ATMs provide users with longer hours of operation and the possibility of withdrawing cash in locations such as public offices, service stations and extra-bank collection locations, among others. Self-service terminals (TAS), on the other hand, increased by 0.6% with 53 new devices eminently from private banks and located mostly within branches.
In terms of coverage, the percentage of localities with at least one FLW remained at practically constant levels since December 2021, as well as the percentage of adults living in localities with at least one ADP, although marginal increases were observed in localities with less than 10,000 adult inhabitants in the last semester. 99.5% of the localities with more than 10 thousand adults had at least one PDA and 96.4% offered a full range of financial services to their inhabitants (that is, they have at least one branch).
Table 2 | PDA Combination
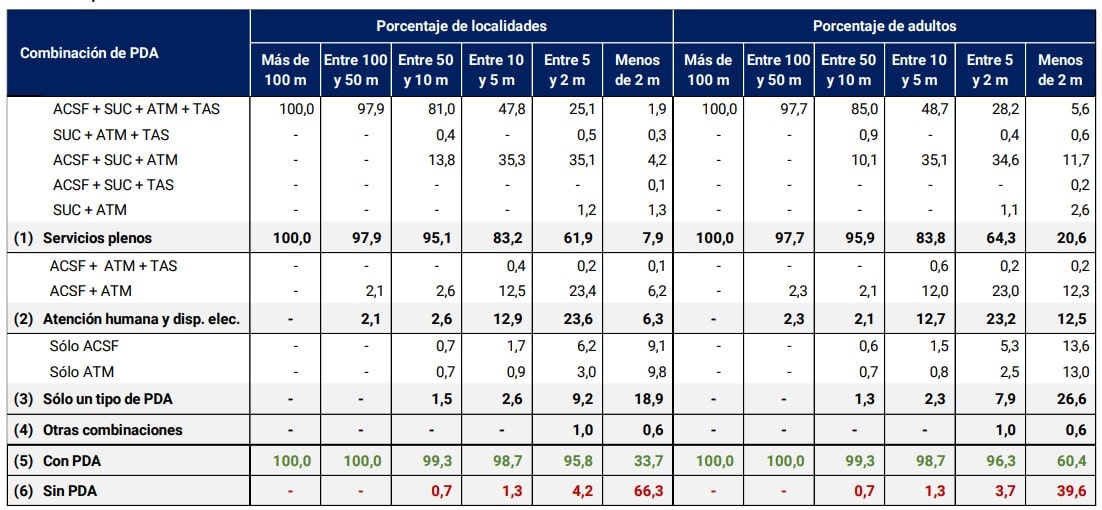
Note | m: miles and SUC: branch. The percentage of adults without FLW includes those living in localities that do not have FLW coverage and the dispersed rural population.
Source | BCRA, networks and INDEC
However, the quantity and variety of FLW decreases as the population of the localities increases. In smaller towns, the presence of only one type of PDA is more frequent, either an ATM or an ACSF, which implies that its inhabitants must move to access the full offer of face-to-face financial services. In this way, the main challenge remains to reach the most remote locations and with smaller populations, where digital infrastructure is even more important to allow access to and use of digital financial services. Likewise, the availability of POS devices that allow digital payments and cash withdrawals in stores becomes a key factor for financial inclusion (See Electronic Payment Methods section).
Box 1 / Estimating the use of physical infrastructure
To measure the use of physical infrastructure by the population, the number of transactions through PDAs and electronic channels in three types of transactions was compared: (i) payments for services and transfers; (ii) fixed terms and (iii) loan registration14 .
Firstly, the physical infrastructure shows a minority participation in transactional and savings operations and a majority in credit operations. This situation could be linked to the requirements requested at the time of taking out a loan, either due to the complexity of its digitization or due to the preference of the applicants to carry out these operations in person at the branches.
Graph 2 | Distribution of the number of transactions by PDA type and channel
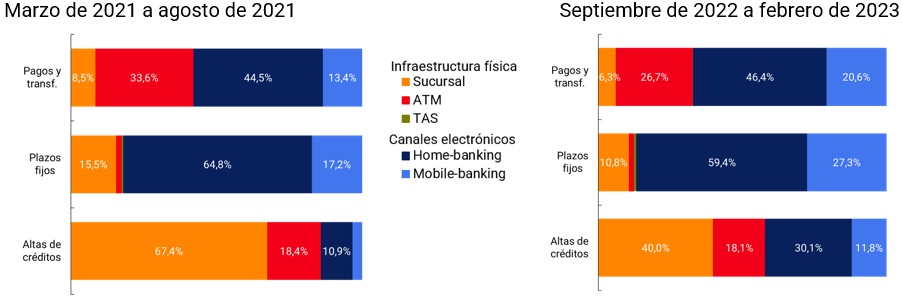
Source | BCRA and networks.
Secondly, the passage of time shows a substitution of face-to-face channels for electronic ones in fixed-term and credit registration operations. This is in line with a further development of the electronic channels for these types of operations. On the other hand, although for all the operations analyzed, the use of home banking is more frequent than mobile banking, a broad growth in mobile banking is observed over time, as a result of the greater possession and use of cell phones over computers.
In a context of extensive digitalization of financial services, physical infrastructure remains important, especially for more complex operations. It is also a critical channel for those with limited digital skills or who lack electronic devices and internet access.
Digital infrastructure. Adult adoption of digital financial services continues to grow15 . This phenomenon highlights the relevance of digital infrastructure in all its aspects, from device ownership to the quality of Internet connection, since it shapes the degree and type of use of digital financial services.
In the first place, the possession of electronic devices such as computers or cell phones in our country reaches 62.6% of households and 89.3% of individuals, respectively16 . Argentina has a better performance in device ownership than other jurisdictions in the region, but lower than in developed countries where digital financial services have very high levels of use (Denmark and Finland).
Secondly, 92% of households have an Internet connection, a key factor for the use of digital financial services. Likewise, the quality of the connection, both in terms of its speed and its stability, also plays a key role since it affects access to and use of digital financial services. The average average mobile Internet speed of 22 mbps and fixed Internet of 60 mbps recorded at the national level is more than sufficient for the use of electronic channels such as home and mobile banking17 . However, our country’s performance is not so favorable when compared to other countries in the region (such as Brazil and Uruguay), or developed countries such as Denmark and Finland.
Table 3 | International comparison of digital infrastructure
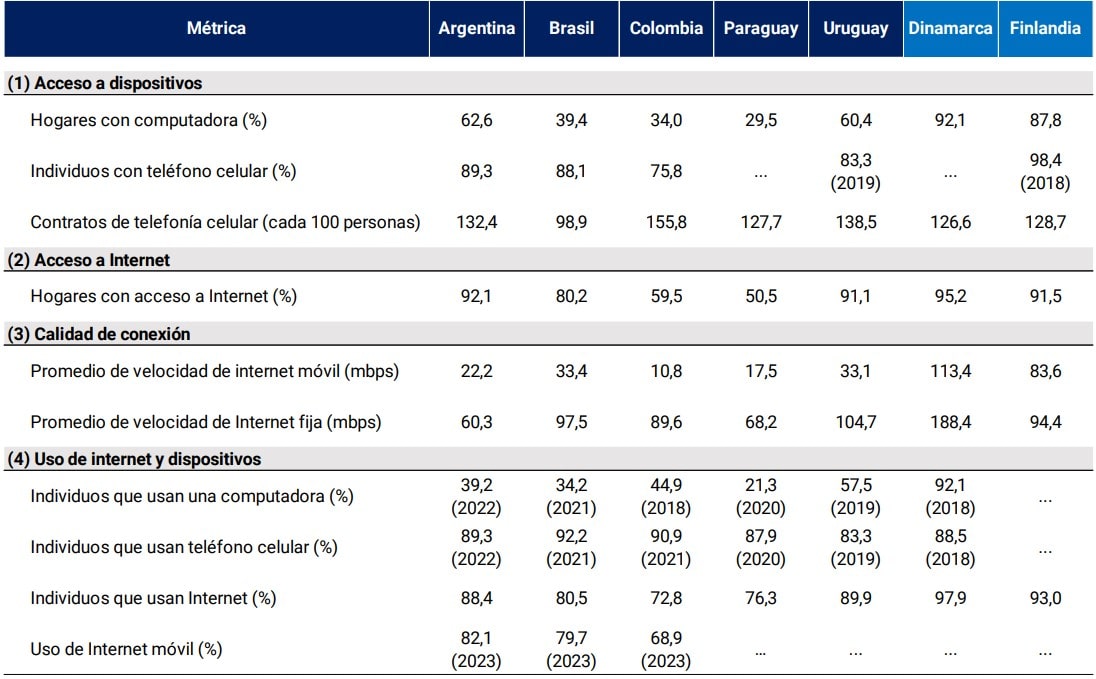
Note | For data in which the year is not indicated, this is 2022, except for connection quality 2023.
Source | Statista, Datareportal.com, ITU and INDEC.
Likewise, by virtue of the extensive territory, the characteristics of connectivity are not homogeneous at the level of localities, with clear differences in terms of the available technology and the speed of connectivity. In particular, a greater presence of wireless connectivity is observed in smaller localities18. Likewise, smaller localities have a higher proportion of their connections with lower speed, which could negatively impact the use of electronic channels for financial transactions (although most of them are sufficient speeds for the use of digital financial services).
Graph 3 | Distribution of fixed Internet access by technology and speed
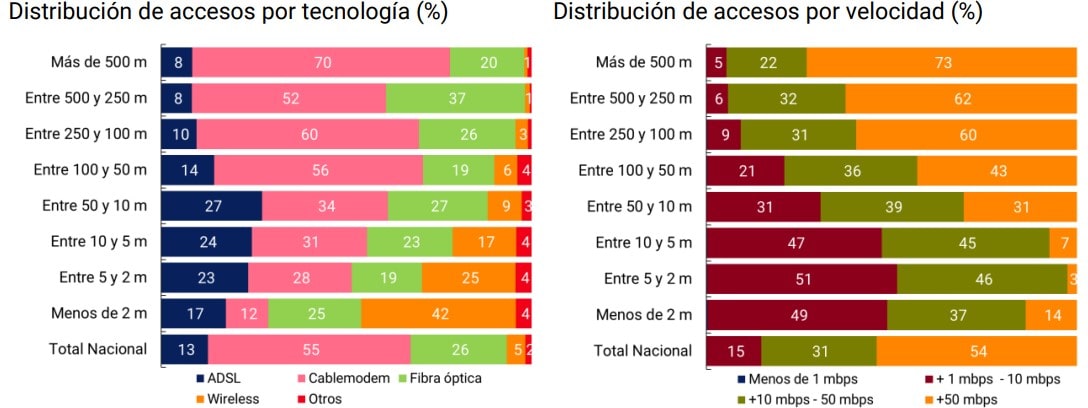
Note | Data as of June 2023. M: Thousands.
Source | BCRA based on data from ENACOM and INDEC.
Third, the use of devices and connectivity impact access to and use of digital financial services. In this sense, 39% of people in our country use a computer. The use of cell phones is more widespread and covers 89% of the population. On the other hand, 88% of individuals use the internet and 82% use mobile internet, surpassing several countries in the region, but with lower values than developed countries. The increased use of cell phones would have a positive impact on the use of mobile banking and virtual wallets over home banking through computers (See Box 3 / Devices and initiation channels).
With these data, it is evident that the conditions of access, quality and use of digital infrastructure are heterogeneous throughout Argentina, and sufficient for the use of digital financial services in larger populations, with more and better connectivity and use of technologies.
A fundamental aspect that complements this analysis is the demand for digital financial services, which is closely associated with the financial capabilities of the population, which, as we have explained in other reports19, observes higher levels in populations with more inhabitants, better levels of income, education, among the aspects to be highlighted, and which manifests itself as one of the main challenges of policymakers20 .
In contrast, face-to-face financial services continue to be chosen by people who do not have the necessary digital infrastructure at their disposal or the skills to use them, and they play a primary role in assisting these people.
2. Account Holding
The number of individuals (PH) who had at least one account stood at 35.7 million as of June 2023. This implies that the adult population reached levels close to full coverage of accounts to make payments and transfers and to constitute savings and/or investments21 . In this way, the number of account holders registered a net increase of 600 thousand compared to December 2022, which translated into a six-month increase of 1.7%.
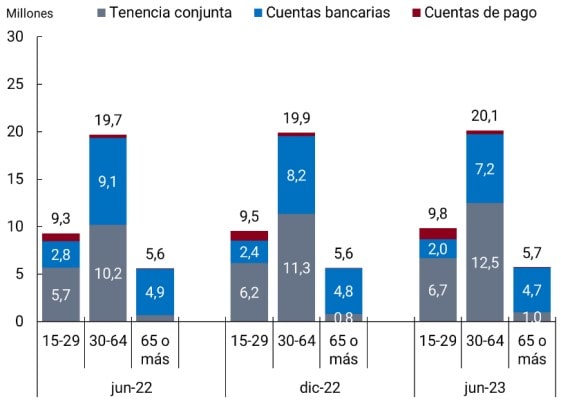
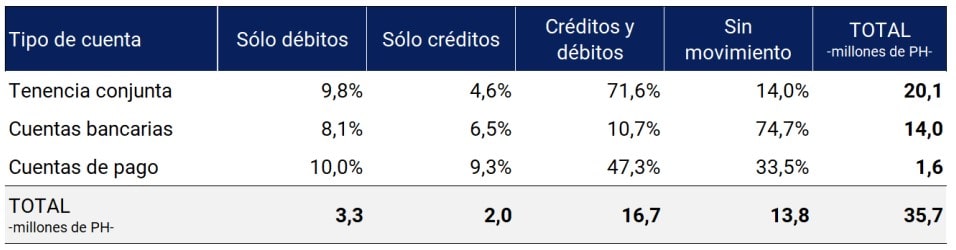
The number of people who had bank and payment accounts climbed from 18.3 million in December 2022 to 20.1 million in June 2023. Given that 9 out of 10 people already had a bank account in December 2022, there would be evidence of the migration of people with only a bank account (a drop of 1.4 million) to the group of individuals with both types of accounts (a rise of 1.8 million). The group that exclusively owned payment accounts registered an increase of 200 thousand people.
Figure 4 | Individuals with accounts
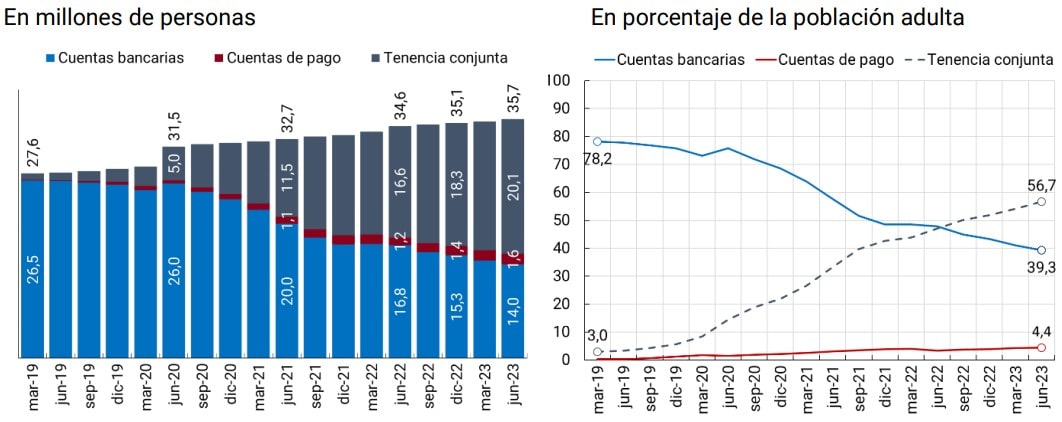
Note | Bank accounts: people who only have these types of accounts; Payment accounts: people who only have payment accounts; Joint tenancy: people who have bank and payment accounts; Percentage of the adult population: takes as a denominator the projections of the adult population made from the results of the 2010 National Census. Estimated growth rates may differ from actual rates and thus overestimate account holding levels.
Source | BCRA based on COELSA and INDEC.
The group of people who had both bank accounts and payment accounts accounted for just over 55% of the adult population in June 2023. Holding both types of accounts offers practical advantages by leveraging their interoperability to transfer funds at no cost. This expands the range of transactional services and savings and investment options that PHs can access according to their needs, improving the conditions of financial inclusion in the country.
Of the increase of 600,000 people with at least one account, young people, in the range between 15 and 29 years old, contributed to explain half of this increase (300,000), while the contribution of middle-aged people, that is, those between 30 and 64 years old, was a third (200,000). However, the growth of individuals with both types of accounts was mainly explained by those of intermediate age with a contribution of 63% to the total rate of change of 9.8%, although young people and older adults (65 years or older) also registered positive variations in the semester and contributions of 28% and 9% respectively.
Graph 5 | Individuals with accounts based on account type and age group
Source | BCRA based on COELSA and INDEC.
At this point, it is worth mentioning that young people and adults had a preference for joint account holding, with shares of 68% and 62% if the population that has at least one account as of June 2023 in each age group is considered. On the other hand, the elderly were mostly inclined to have exclusive bank accounts: within the population aged 65 or over with an account, 83% had only a bank account.
The dynamics of account holders showed a growing trend towards joint ownership due to the incorporation of payment accounts by people who exclusively owned bank accounts. However, and despite the fact that almost the entire adult population (95.9%) had at least one bank account, there was evidence of a significant opening22 of bank accounts, which even exceeded that of payment accounts during the first half of 2023 (4.8 million vs 4.2 million). This behavior, in addition to reflecting that people seek to expand and complement their financial services by opting for a different type of account (payment accounts) than the one they had, would show that individuals are willing to add new bank accounts, since their offer is likely to fit additional needs. The commercial policy of public and private banks (through discounts), the benefits derived from the regulatory framework, the ease of opening through digital onboarding, and the free nature of accounts, among others, could explain this phenomenon23.
Box 2 / Corporate and Organizational Accounts
Bank or payment accounts allow companies and organizations, constituted as legal entities, to receive collections and make payments for inputs or their payroll, as well as to carry out the financial administration of their resources. The reasons that induce companies and organizations (E) to operate with accounts can be summarized as:
(1) electronic means of payment (EPM) are more efficient and secure in the collection process than the use of cash;
(2) merchants have more incentive to accept PEMs the more consumers have these instruments (similarly, more consumers will be willing to use PEMs if more merchants accept PEMs)24;
(3) The development of e-commerce acts as an additional incentive to the need to have a bank or payment account, given that it is complex to replace electronic payment with cash payment in a non-face-to-face environment.
The analysis of the evolution of the E accounts is therefore of particular importance.
Graph 6 | Businesses and organizations with accounts
Source | BCRA based on COELSA and INDEC.
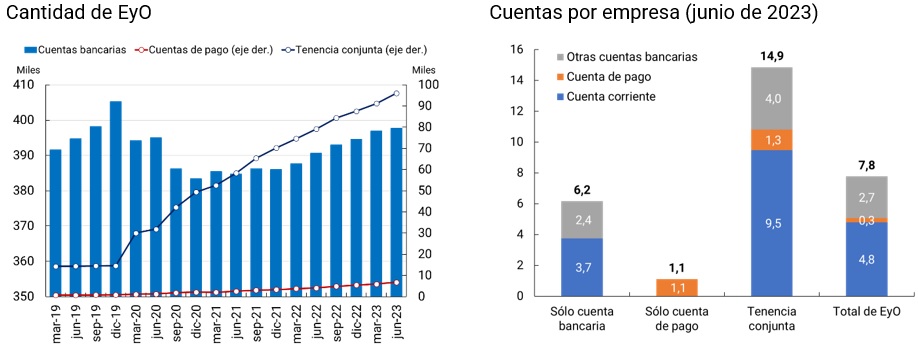
In recent years, the number of E with accounts exhibited an increasing trend, going from around 407,000 in March 2019 to 500,000 in June 202325. One-off events implied abrupt changes in the opening of payment accounts, such as the COVID-19 pandemic. Specifically, E with bank and payment accounts grew by around 15,500 in the first quarter of 2020, a figure that was partially offset by the reduction of those with only bank accounts (-11,000). Thus, the onset of the COVID-19 pandemic not only resulted in E that previously had only bank accounts additionally having a payment account, but also the opening of both types of accounts during the quarter.
However, at the aggregate level, the proportion of E that have paid accounts (exclusive or not) is still small, reaching about 21% of the total E with accounts. This is an aspect that contrasts significantly with what has been observed in the case of PHs, where 61% of the adult population has at least one payment account. The result is in line with the BCRA’s Retail Payments Report, which shows that businesses preferentially use bank accounts to credit payments.
Account activity. The use of accounts to carry out transactions generates progress in the financial inclusion of the population. The ability to make payments and transfers, build savings and investments, and take out financing facilitates the financial management of resources, reduces dependence on cash, and helps build credit histories.
To approximate the degree of use of the accounts, new data provided by COELSA were used to indicate whether account holders registered debits or credits in any of their bank and/or payment accounts throughout a quarter26 . Since this indicator considers the subset of operations in which COELSA is involved, the activity metrics are underestimated. In particular, the indicator does not capture those account holders who operate with a debit card and do not make transfers to or from payment accounts, among others. Another aspect of the indicator is that debit transactions are, in general, initiated by the PH account holder itself, while credit transactions are originated by a third party (PH or PJ). This distinction has different considerations in terms of financial inclusion, given that in the first case it is an active operation of the PH.
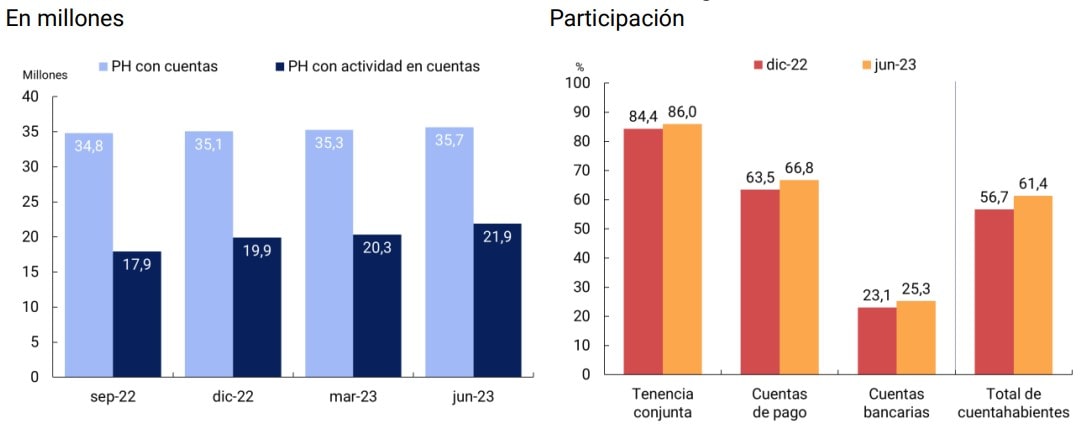
Considering the aforementioned limitations, the number of PHs that registered at least one credit or debit operation27 in any of their accounts amounted to 21.9 million during the second quarter of 2023, that is, 61.4% of the PH account holders as of June 2023. In this way, the PH as a whole with this type of activity in its accounts registered an increase of 1.6 million compared to the previous quarter, which translated into a quarterly increase of 7.6%. When considering the holding by type of accounts, PHs with joint tenure registered the highest activity ratios, followed by PHs with only a payment account and lastly, PHs with only a bank account.
Figure 7 | Individuals who account holders have activity in one of their accounts
Note | “Accounts” considers bank and payment accounts. “Activity” is determined by the transactional credit or debit transactions cleared by COELSA.
Source | BCRA based on COELSA and INDEC.
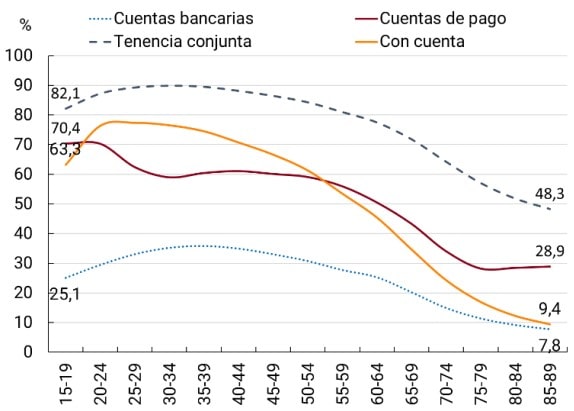
*Age. In terms of the age of account holders, the age groups between 20 and 44 years old registered activity levels above 70%, reaching a peak in the range between 25 and 29 years old. After this maximum, from the age of 30, the degree of activity begins to decrease as age increases, with values below 50% from the age of 60 and less than 20% from the age of 75. The high exclusive ownership of bank accounts among older people (65 years and older) could explain the low ratios of activity by age of this metric, since it excludes transactions carried out with debit cards (which are used in a higher proportion in this age range than in the younger age range -22 to 29 years-)28. The other age extreme, that is, the youngest population (15 to 19 years old), registered activity levels of 63.3%.
Young people make more intensive use of cell phones and the Internet29, which would generate greater activity in account movements30 . It should be noted that account holders of financial institutions (EEFF) registered a higher average age than account holders of payment service providers (PSPs). In this last group of entities, the installation of an application on the cell phone is required to open an account and carry out transactions, an aspect that favors the possession of payment accounts by young people.
Figure 8 | Activity coefficient with respect to the number of account holders by age group
Note | The X-axis illustrates the age ranges in the form of lustrum; Bank accounts: bank accounts only; Payment accounts: payment accounts only; Joint tenancy: bank and payment accounts. With an account: people who have a bank account and/or payment account. This ratio measures the percentage of people with activity within each age group and by exclusionary group according to account holding.
Source | BCRA based on COELSA and INDEC.
*Type of movement. 86% of the people who had both types of accounts had some type of movement in their accounts, while for those who only had bank accounts the activity rate drops to 25%. Likewise, this phenomenon is not exclusively attributable to a particular age group, but remains at low levels even in young people. The latter value operates as a minimum level of activity since transfers between bank accounts and debit card payments are not included, operations that can be frequent in holders of only bank accounts.
As of the second quarter of 2023, 71.6% of the population with joint tenure registered debits and credits in their accounts. These people are characterized by making intensive use of accounts that, through interoperability between the financial system and PSPs, usually take advantage of the advantages of each type of account. More than 60% of the young and middle-aged population had joint tenure, of which 87% were active in the quarter analyzed.
Table 4 | Individuals with Account Ledger Movements by Account Type
Data as of the second quarter of 2023
Note | Bank accounts: bank accounts only, Payment accounts: payment accounts only. PH: human persons.
Source | BCRA based on COELSA.
3. Electronic means of payment and savings and investment modalities
3.1. Electronic means of payment
The acceleration in the adoption of electronic payments to the detriment of the use of cash is a global trend. Regardless of income level, countries are experiencing substantial digitization of their payments and lower cash withdrawals. Electronic means of payment (EMP) play a key role in people’s financial inclusion, since they are the gateway to the financial system.
Argentina is part of this behavior and shows a clear advance of electronic means of payment (MPE) over the Gross Domestic Product (GDP) (76.6% for the second quarter of 2023 vs. 58.2% for the same period of 202231). The MPEs show continuous and high growth, where the number of transactions per adult reached a record value and rate of change during the first half of 2023. This trend covers all electronic payment instruments, as each of them recorded sustained increases in the number of transactions per adult, to a greater or lesser extent.
As a consequence, there is a diversified use of MSPs where the advance of new digital alternatives has complemented traditional tools and, as a result, there is evidence of a growth of MSPs as a whole.
Amounts and amounts transacted. In the first half of 2023, each adult made, on average, 25 monthly payments by electronic means, which represents a new all-time high32. The number of operations per adult increased by 62% compared to the first half of 2022, being the highest rate since the beginning of series33, and multiplied by 4 compared to the first half of 2019.
For its part, the amount transacted per adult increased by 25% y.o.y. in real terms34 in the first half of the year. Therefore, the average amount in real terms of each electronic payment continued to decline for the fifth consecutive semester, indicating that people would be opting for digital means for regular transactions of relatively smaller amounts.
As in the previous three semesters, the contribution of immediate payments35 to the growth of the MPEs was notorious, contributing 50 p.p. of 62% for the amounts and 21 p.p. of 25% for the amounts. As a consequence, instant payments, electronic transfers (transfers) and payments with transfer (PCT), were positioned as the most used payments by the adult population. In the first half of 2023, almost 6 out of 10 electronic payments were made via transfers or PCT, while a year earlier that ratio was 4 out of 10.
Figure 9 | Electronic means of payment (EPM)
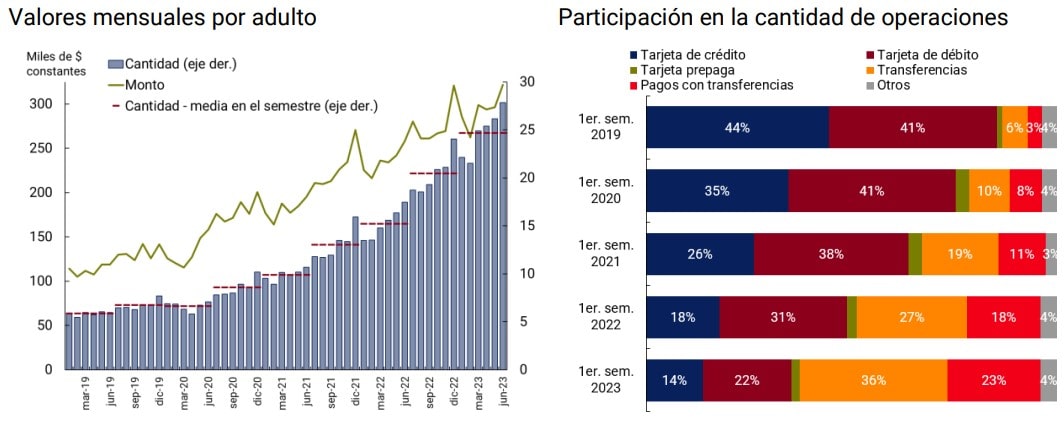
Note | Other: includes direct debit and DEBIN.
Source | BCRA, INDEC and networks.
The expansion of this set of payments, which, added to debit card payments, account for 8 out of 10 electronic payments during the first half of 2023, could be associated with the advantages for businesses in terms of availability of collections and their costs. These instruments, unlike credit cards, share short or immediate terms for the crediting of funds together with zero or relatively low commissions (debit cards: 0.8% and PCT: 0.6% to 0.8%) for the recipient. At the opposite extreme, credit cards with the longest crediting terms and highest commissions given their function as a payment and financing instrument, strongly reduced their participation in the number of transactions (from 44% to 14% between the first half of 2023 and the same period of 2019).
The BCRA’s regulation played an important role in promoting MSEs in order to discourage the use of cash: (i) at the end of 2020, PCT was launched with the aim of expanding the scope of immediate transfers to everyday payments, which stands out for the immediate accreditation of collections and low commissions, avoiding the expenses of cash handling for businesses (transportation, storage, security); and (ii) in mid-2021, the financial institutions (EEFF) agreed with the BCRA to shorten the deadline for the crediting of funds for debit card charges to one business day.
MPE and cash withdrawals. The dynamics of MPEs and withdrawals of money through ATMs and extra-bank points (such as shops) would indicate an advance of MPEs over cash (see Section 2). For each cash withdrawal, a person has made a little more than 9 monthly payments with MPE during the first half of 2023, while, in the same period of the previous year, electronic payments involved a little more than 5 operations. At the same time, for every $1,000 withdrawn per month, a person has made payments with MPE for approximately $7,300 during the first half of 2023, while, in the same period of the previous year, MPEs implied disbursements of $4,500.
The evolution of means of payment in supermarket sales is an example of this behaviour. The share of cash in the amounts paid fell from 30% to 27% between the first half of 2022 and 2023, in contrast to the growth of debit cards (2 p.p.) and other means (1 p.p.)38 .
The expansion of digital payments to the detriment of cash withdrawals is a phenomenon that is registered in different economies around the world and regardless of their income level.
Table 5 | Number of electronic payments for each cash withdrawal
Per capita data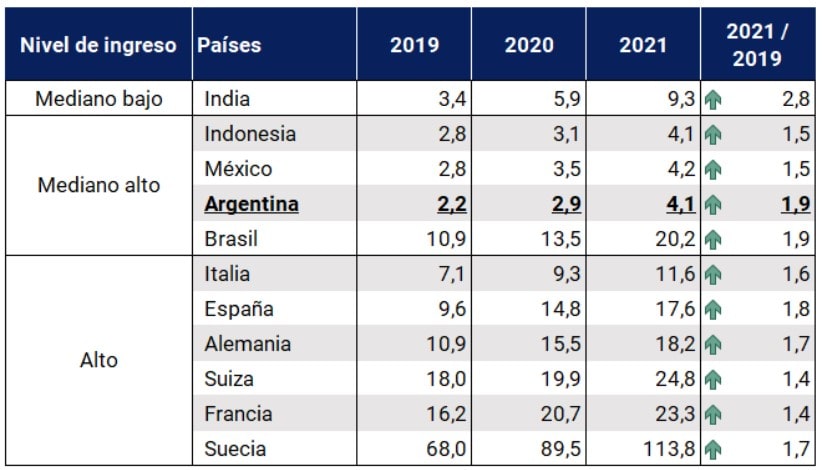
Note | The series published in BIS consider the following variables to make up the set of retail payments: transfers, direct debits, debit and credit cards, and electronic money payments (e-money payments). The “2021/ 2019” column is the result of the division between the “2021” and “2019” columns. Argentina: the data published by the BIS coincide with the data published by the BCRA.
Source | Extractions and MPE (BIS) and World Bank.
Although there is heterogeneity between the countries in the sample39 and within each income group, there is heterogeneity between the number of electronic payments for each cash withdrawal, all exhibited growth between 2019 and 202140. Argentina, which shares pre-pandemic values similar to those of other economies in the same income category, registered the highest growth together with Brazil for its group and the second highest for the total sample.
Despite the disparity in the number of MPE transactions per withdrawal between different countries, which may be the result of various factors (development of the digital payment system, connectivity, digital skills, income composition, among others), the global trend is consolidating towards the expansion of digital payments and lower cash use. This propensity is accentuated among lower-middle-income and upper-middle-income countries since they start from a lower base than high-income economies.
Box 3 / Initiation devices and channels41.
People can initiate their payments electronically from a variety of channels, which have a physical device associated with them (e.g., a cell phone). To have an approximation of the most used physical devices42 , the metrics of quantity and amount of transactions for each MPE were grouped according to their initiation channel. As a first point, between 2021 and 202243, MPE operations registered increases in both quantity and amount per adult, in all physical devices and channels, with the exception of ATMs44.
Figure 10 | Engaging devices and onboarding channels
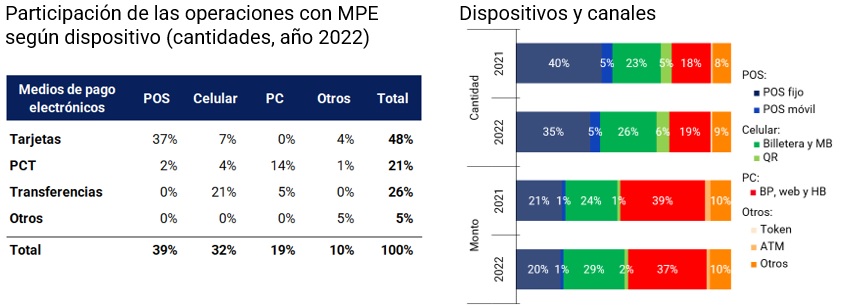
Note | Devices: POS, Cell Phone, PC (computer) and others (ATM, telephone sales, token, among others); Channels: Fixed POS, Mobile POS, Wallets, “MB” Mobile Banking, QR Code, “BP” Payment Button (can be incorporated into the store’s website, integrated with different social networks or sent by email), web, “HB” home banking, “token” (random key), ATM, others. “Other”: Direct debit, immediate debit, automatic debit, etc.
Source | BCRA, INDEC and networks.
Number of operations. The cell phone has been the device with the highest growth in electronic payments measured in quantities per adult (68% y.o.y.), with its share advancing 4 p.p. In 2022, out of every 10 transactions with MPE, more than 3 originated in this device, mainly explained by those executed via mobile banking and/or digital wallets. Initiation from the cell phone through QR code also deserves a special mention, since it evidenced the highest positive variation (72% y.o.y.). Despite the decline in the share of operations in more traditional devices such as POS, these units concentrated the highest number of operations (almost 4 out of 10) in the last year.
Amount transacted. The cell phone also showed the highest growth between 2021 and 2022 (42% YoY), increasing its share by 4 p.p. As in the case of quantities, digital wallets and mobile banking explained this behavior. The rest of the devices lost ground as a result of the increase in the weight of the cell phone. However, computers (PCs) were the ones that channeled the largest amounts due to interbank transfers through home banking (almost 4 times higher than those made via mobile banking) in 2022.
Hand in hand with the high use, which increased in the last year, the advance of the cell phone as a device to make electronic payments is to be expected. The improvement to the detriment of PCs, in the case of amounts, reflects the lower, and even low, relative use of this technology (See Table 3).
Immediate payments46.
(i) Wire Transfers. During the first half of 2023, transfers were consolidated as the instrument most chosen by individuals to make electronic payments (36% of the total)47. Each adult made, on average, 8.9 transfers per month, which more than doubles the operations in the same period of the previous year. This growth is due to the dynamics of transfers initiated from a cell phone48.
In addition to being the most traded instrument, transfers continued to channel the largest flow of the amounts transacted per adult of the total MPE (59%). A point to highlight is that the intervention of payment accounts (CVU) is relatively higher in the number of operations than in their amounts. On the other hand, bank accounts contribute, in relative terms, more on the side of the amounts transferred than on the number of operations.
During the first half of 2023, on average, adults made more than twice as many transfers between bank and payment accounts as in the same period of the previous year (3.2 vs 1.2, respectively). In this way, an interoperability model between different accounts that accounted for 36% of total transfers is consolidated, 6 p.p. more than in the first half of 2022. This dynamic, which reflects the principle that governs the BCRA’s regulations to take advantage of network effects from the interoperability between bank and payment accounts, was accompanied by a notable growth in the amounts per adult, although to a lesser extent (75% YoY).
Table 6 | Instant payments
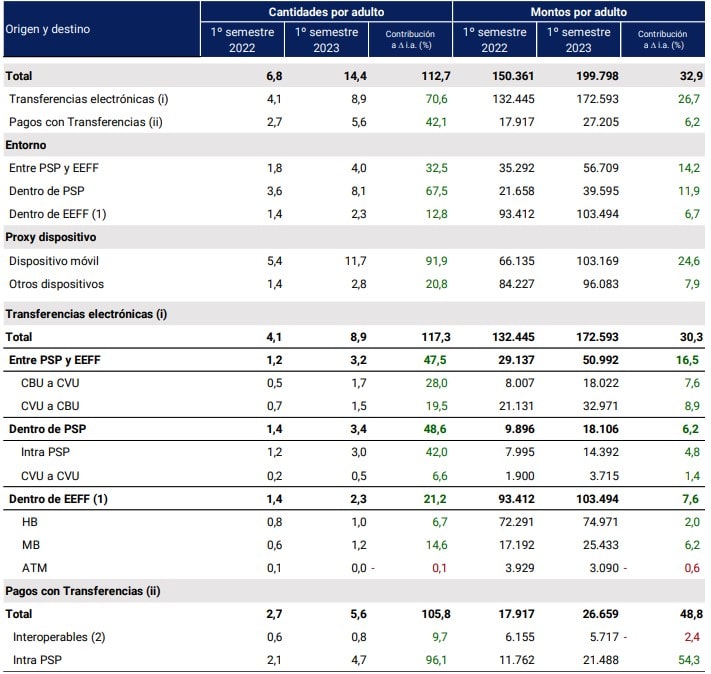
Note | Amounts at constant prices in June 2023 (CPI June 2023 = 100). (1) CBU to CBU, interbank. Does not include intrabank transfers. (2) Interoperable PCTs are made between different PSPs/EEFF and include those initiated in interoperable QRs, in POS with card credentials, with random keys and payment button. (3) Rate of change in bold black color; Contribution rate in green.
Source | BCRA, INDEC and networks.
(ii) Payments by Transfer (PCT)49. During the first half of 2023, each adult made, on average, 5.6 monthly payments via PCT, twice as much as in the same period of 2022, making it the second most chosen MPE instrument along with debit cards. The amounts per adult channeled 52% more than during the first half of 2022. The dynamics of PCTs were mainly explained by transactions between users of the same payment service provider (PSP).
Transactions for “interoperable PCTs“50 grew by 45.6% y.o.y. in terms of quantities per adult, driven mainly by those initiated through the reading of QR codes. While intra-PSP PCTs continued their growth with triple-digit rates (122% YoY), largely explained by payments initiated through payment buttons and websites, associated with non-face-to-face e-commerce.
Debit cards. In the first six months of 2023, debit card payments continued their upward trend (+13%). This trend would be based, among other factors, on the familiarity of its use by the population, the reduction of the period of crediting funds for businesses together with the discounts offered by the EEFF for purchases with this means.
With the return to face-to-face activities, traditional POS devices are the channel of choice for operating with debit cards (8 out of 10 payments via this means in the first quarter of 2023). This behavior was manifested in a framework where the stock of POS that registered operations remained unchanged (as of June 2023, around 490,000 active units were counted) and as a consequence, each of them on average registered 24% more transactions.
3.2. Savings and investment modalities51
Individuals (PH) have the possibility of allocating their money among various savings and investment products, depending on their liquidity objectives, term and risk-return ratio. Considering the products offered by financial institutions (EEFF) and payment service providers (PSPs), the savings and investment balance of PHs represented 8.5% of the Gross Domestic Product (GDP) in the second quarter of 202352. In that period, the balance of savings and investment was composed of immediate liquidity products at 49% and short and medium term products at 51%.
In the last year, the change in the portfolio of PHs continued to be accentuated, with a reduction in the holdings of immediate liquidity instruments and an increase in those instruments with higher maturities and returns. Likewise, within the balances of immediate liquidity, recompositions were also observed, with an increase of 71.7%53 in the balances of Mutual Funds (CDF)-PH54 with a 13.9% drop in account balances between June 2022 and 2023.
Figure 11 | PH savings and investment products
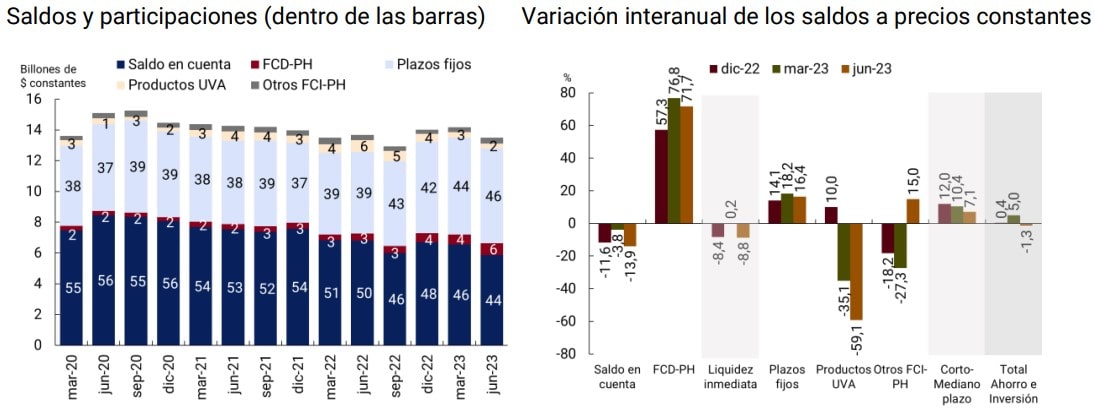
Note | In the graph on the left, the savings and investment balances of the PHs consider products in local and foreign currency. A trillion equals a trillion. The internal values of the bars express the percentage shares of each set. In the graph on the right, the bars indicate percentage changes.
Source | BCRA, CAFCI and INDEC.
On the other hand, the balances invested in short- and medium-term instruments (traditional fixed terms, UVA products and other FCIs) showed a growth of 7.1%. Balances in traditional fixed terms and in other Mutual Funds increased by 16.4% and 15%, respectively, but product balances in Purchasing Value Units (UVA) decreased by 59.1%.
The increases in the minimum interest rate for fixed terms in pesos for PH during 2022 and the first half of 2023 had a positive impact on retail savers. These more attractive returns would be one of the factors that explain the growth in the balances of fixed-term deposits and DCFs.
Likewise, the greater availability of savings and investment instruments, the growing joint holding of accounts and the interoperability between the different types of accounts, allowed individuals to allocate resources towards active savings alternatives, leaving an increasingly smaller volume of balance tied up in their accounts, registering minimum values (44%) in the second quarter of 2023. However, they still represent a very relevant portion within the savings and investment products of PHs.
Fixed terms. In June 2023, the number of fixed terms in pesos in force of PH stood at 8.2 units per 100 bank accounts, reaching the highest point in the last 4 years. Between June 2022 and 2023, the metric in question grew 45% due to a significant increase in the number of fixed terms of 54%. This growth is also reflected in a greater share of fixed-term loans in national currency in the total balances of savings and investment products, which went from 37% in June 2022 to 43% in June 2023.
The high year-on-year growth in the number of placements together with a lower increase in the total balances of this product (13%) produced a 26% drop in the average balances placed in fixed terms. These increases are in line with the growth in the number of non-financial private sector (NFPS) holders of fixed-term operations, which went from 3.5 million in June 2022 to 4.6 million in March 202358 .
Figure 12 | Fixed terms with respect to the bank account park and average balances
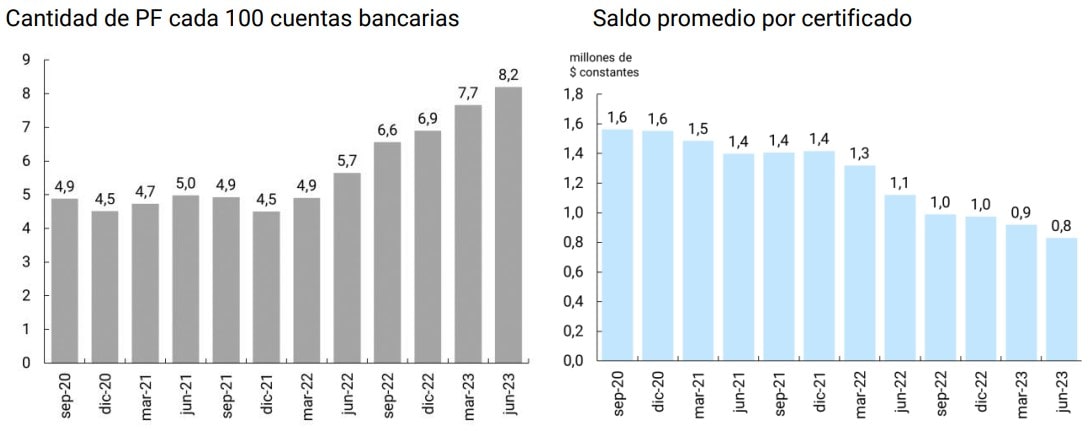
Note | The number of fixed-term certificates includes fixed terms in ARS and UVA without the option of pre-cancellation. The graph on the left considers the bank accounts of those EEFFs that offer FP. “PF”: fixed term.
Source | BCRA, CAFCI, COELSA and INDEC.
Likewise, since the event of the COVID-19 pandemic, several EFSAs enabled the possibility of constituting fixed terms through electronic channels, which contributed to the positive dynamics of fixed terms59. In terms of balance, 83% of fixed-term balances in national currency as of June 2023 are concentrated in electronic channels60.
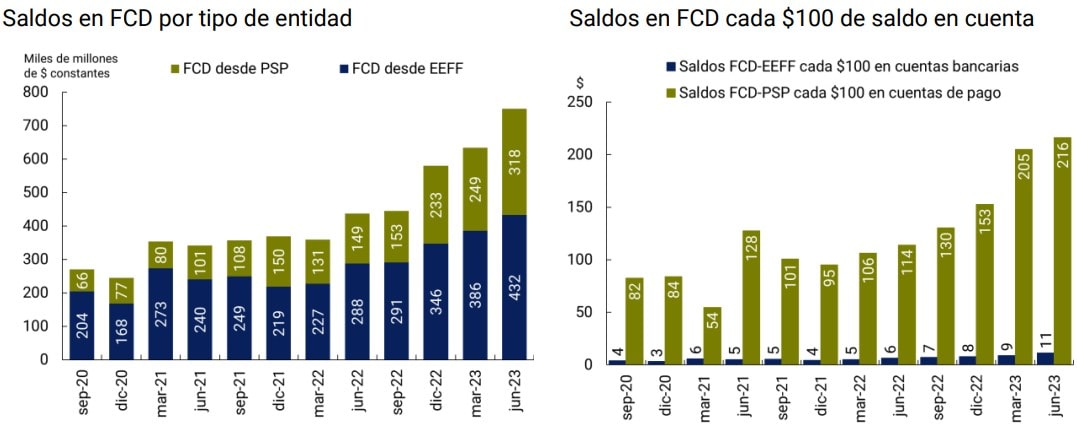
Liquidity management. In the last 3 years, there was a growth in CDF balances from PSP and EEFF with respect to balances in payment accounts and bank accounts, presenting year-on-year increases of 90% and 81% as of June 2023. The growing digitalization that is manifested through the greater number of banking applications and virtual wallets and the need to preserve purchasing power drove the growth of balances in this investment product, both in value and with respect to account balances. However, due to the high liquidity of DCFs, their yield is lower than that of fixed-term loans61 , which discourages balances subscribed in DCFs from having a significant share in the portfolio of savings and investment products of PHs.
Figure 13 | DCF balances
Source | BCRA, CAFCI and INDEC.
As of June 2023, FCD balances from PSPs per $100 in payment accounts exceeded FCD balances from EEFF by 20 times in terms of bank account balances. This disparity could be due to several factors: (i) PSPs offer DCFs as the only investment option, so the person making the decision to invest derives the funds solely to these instruments; (ii) the simplification in the subscription process and in the operation of the CDFs from PSPs, together with the ease of converting these funds into liquid money for transactions, encouraged the constitution of DCFs from PSPs with balances that were previously held in payment accounts. Thus, the number of PH accounts in PSP with balances in FCD went from 4.9 million in June 2022 to 8.8 million in June 2023 (+80%). This growing adherence is reflected in the fact that 32.7% of payment accounts registered balances in DCF in June 202362.
On the other hand, the ESFFs offer a greater variety of savings and investment instruments. This would cause people to choose to allocate their money towards more profitable alternatives such as fixed terms in pesos, allocating a low proportion of balances to CDFs from EEFF. In addition, bank account balances are 26 times higher than those in payment accounts, reducing the ratio between DCF balances and EEFF account balances. This would reflect people’s preferences to leave their balance immobilized in bank accounts rather than in payment accounts, due to the greater ease of trading, the possibility of having cash and the greater security derived from the regulatory framework.
It should be remembered that 40% of people with at least one bank account have only this type of account. These individuals tend to make fewer trades and are likely to make less use of their accounts to set up DCFs, which would drive down the ratio of DCF balances to balances in EEFF accounts.
4. Credit
4.1 Credit to individuals
The number of individuals (PH) with financing in the expanded financial system (SFA) reached 19.7 million in June 2023, which implies that 55.4% of the adult population had at least one financing. Thus, this group registered a net increase of 0.9 p.p. compared to December 2022, maintaining the trend of the incorporation of new debtors, but at a slower rate than that observed in previous periods. In particular, during the second quarter of the year there is evidence of a stabilization in the percentage of the population with credit.
The total PH financing balance in the SFA fell by 8% in real terms, resulting in a fall in the average balance per debtor. In this way, the SFA consolidates a dynamic in which new debtors are incorporated, but the average balance of financing is reduced. This phenomenon is mainly driven by other non-financial credit providers (OPNFCs) that grant personal loans digitally and for small amounts.
Figure 14 | SFA Financing to Individuals
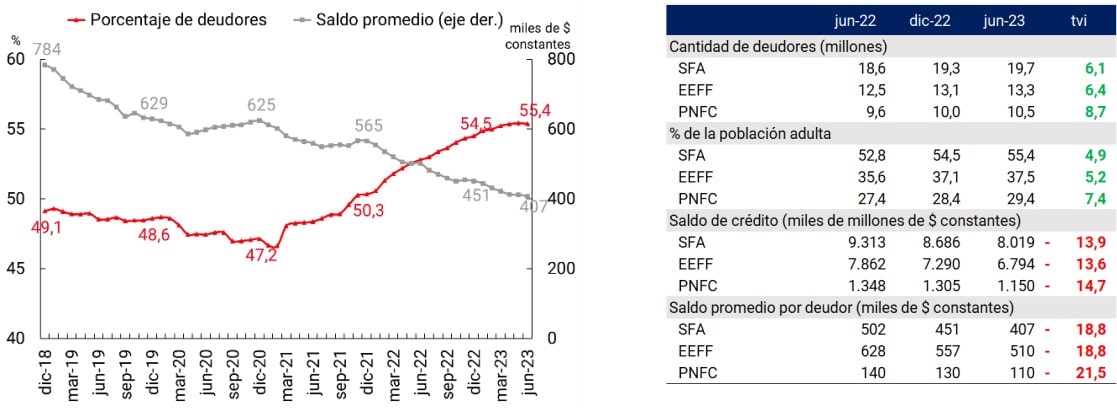
Note | Tvi: year-on-year rate of change.
Source | BCRA and INDEC.
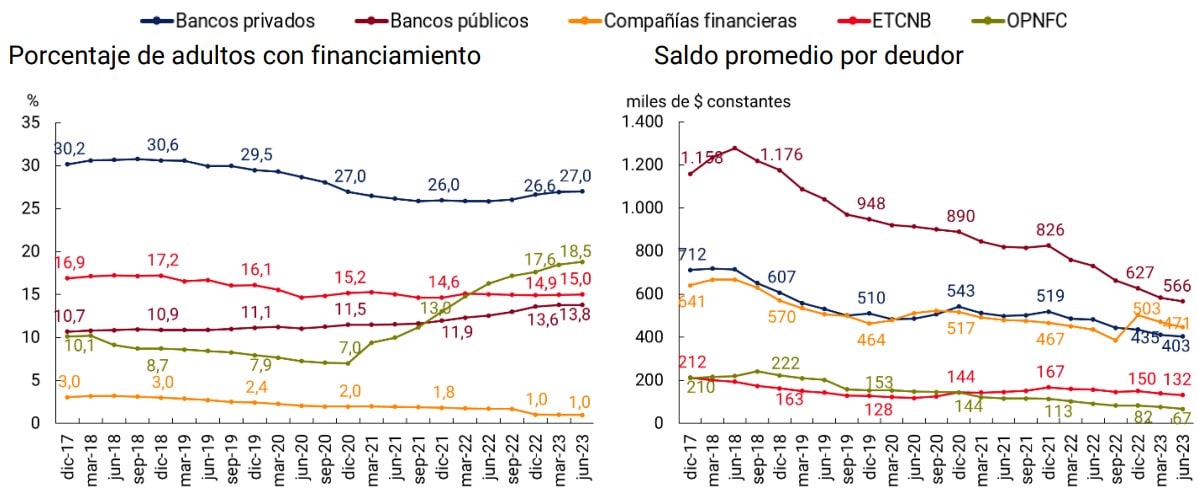
Credit providers64. Among financial institutions (EEFF), as of June 2023, private banks provided financing to 9.6 million people (27% of the adult population), while public banks reached 4.9 million (13.8% of the adult population). Compared to December 2022, both institutional groups registered a 2% increase in the number of adults to whom they provide financing. In terms ofbalances 65, both private and public banks deepen their trend of decreasing the average amount financed per debtor, which in the first half of 2023 reached 7% for the first group and 10% for the second. However, public banks continue to offer the highest level of SFA financing, exceeding the average balance per debtor of private banks by 40%.
Within the set of non-financial credit providers (NFCPs), non-bank credit card issuers (NTCNBs) financed 5.3 million people (15% of the adult population), a value that has remained unchanged considerably since December 2020. The average balance per debtor financed by the ETCNBs showed greater stability over time than that of the other institutional groups. Despite this, during the first half of the year the average balance per debtor has experienced a reduction of 13% and is still considerably lower than that of the EEFF.
Figure 15 | Percentage of the adult population with financing and average balance per debtor66
Note | Graph on the left: the sum of the percentages does not coincide with the values in Graph 14 for the accounting of single debtors at the level of institutional group (see footnote 63).
Source | BCRA and INDEC.
The OPNFCs, for their part, continued their trend of incorporating new debtors, reaching the figure of 6.7 million people assisted as of June 2023 (7% increase in the first half of the year). However, there is a marked and constant reduction in the average balance per debtor, which between December 2022 and June 2023 registered a decrease of 19% (53% compared to December 2020) and places the average balance per OPNFC debtor at a value that represents only 13% of the average balance per debtor of the EEFFs. Thus, although the OPNFCs are the institutional group that has incorporated the most people into formal financing (177% increase in the number of people assisted between December 2020 and June 2023), they are also the group that registers the largest drop in the average financed balance per debtor67.
Among the stylized facts of recent years is the gap in the average balance of financing between public and private banks. From the end of 2017 to the end of the first half of 2023, the average balance owed to public banks was at least 40% higher than that owed to private banks. This difference is attributable to people who have high levels of financing, in the order of or greater than $10 million, and whose representation is more significant in public banks than in private banks. At the same time, this difference is also replicated in the proportion of debt that is backed by guarantees. The percentage of secured debt is significantly higher for public banks than for private banks68. Thus, the difference in the average balance owed is not due to soft biases in the distribution of financing balances by tranches between the two groups of entities but, on the contrary, to concentrations in certain tranches. This is due to the fact that public banks registered a greater supply of long-term financing products.
As of June 2023, 43% of the total debtors had debt exclusively with EEFF (i.e., they did not register financing simultaneously with a PNFC), while 28% registered debt only with PNFC. The group of people with financing from both sets of suppliers reached 25.2%. Throughout the series, and in line with the aforementioned increase in debtors registered for the PNFC as a whole, there is a reduction in the proportion of people who registered financing only with EEFF, while the participation of people with debt only in PNFC grows. These data would confirm that the new debtors who joined PNFC’s financing in recent years are mostly people who did not have debt in EEFF.
On the other hand, as of June 2023, 55.5% of the total debt balance was concentrated in people with debt only in EEFF compared to 5.2% of the balance for people with debt only in PNFC. In this way, in line with the above, there is evidence of a lower allocation of the financing balance by the PNFCs.
With this distribution, the question arises as to whether access to financing with one set of providers over another responds to factors that influence and/or limit the possibilities of access (for example, income level or employment status69).
Figure 16 | Distribution of debtors and debt balance
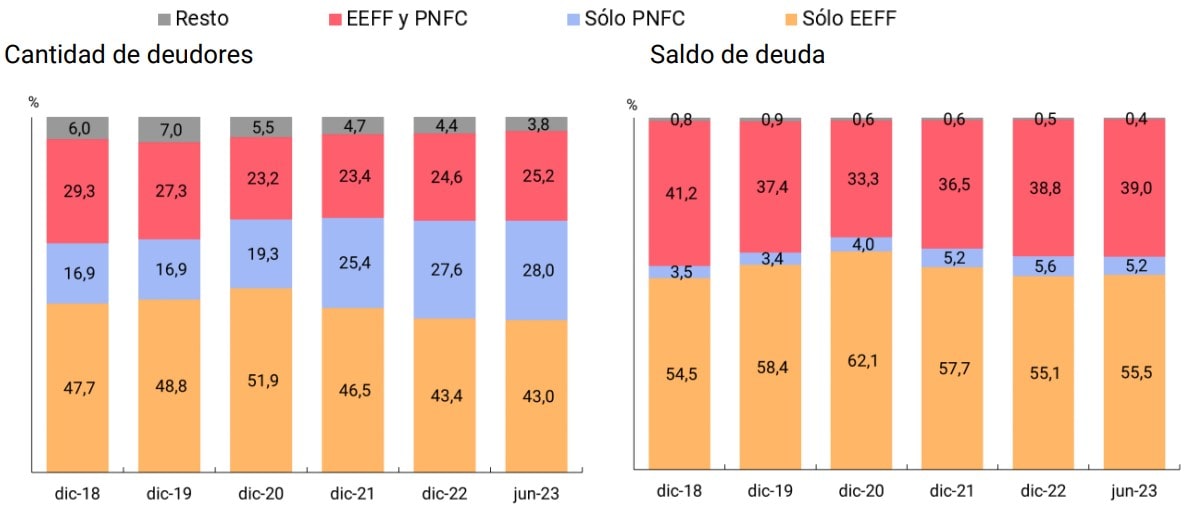
Note | EEFF only: indicates that debtors registered financing only in EEFF (and not in PNFC, although they can register debt in financial trusts -FF). PNFC only: indicates that the debtors registered financing only in PNFC (and not in EEFF, being able to register debt or not in FF). EEFF and PNFC: indicates simultaneous financing of EEFF and PNFC (being able to register debt or not in FF). Remainder: includes debtors who registered debt only in FF. 70
Source | BCRA.
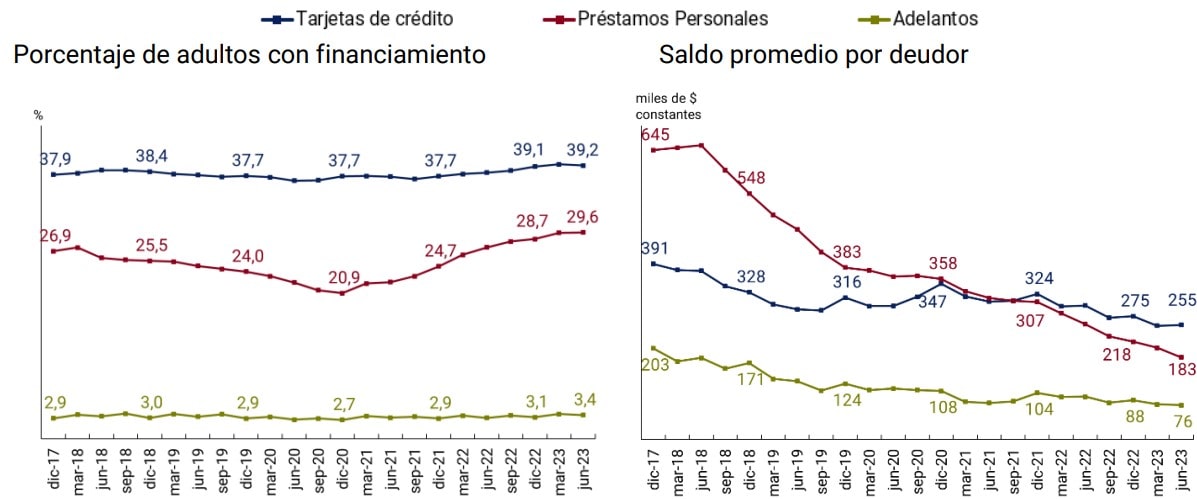
Characteristics of financing. In terms of the type of assistance, the credit card is the most widespread financing instrument, reaching 39.2% of the adult population in June 2023. During the first half of the year, the number of debtors per credit card remained at a relatively constant level while the average balance per debtor registered a drop of 7% in the same period. In recent years, credit card financing has shown a slight trend towards the incorporation of new debtors, with an average balance per debtor decreasing.
Personal loans are in second place, with a reach of 29.6% of the adult population in June 2023. During the first half of 2023, this indicator registered an increase of 0.9 p.p. and accumulates an increase of 8.7 p.p. between December 2020 and June 2023. This implies that an additional 3.3 million PH obtained credit during the last mentioned period, placing personal loans as the type of assistance with the highest growth. This type of financing continues with a marked growth driven mainly by OPNFCs that offer consumer loans digitally.
However, the average balance per debtor in constant values registers a drop of 16% during the first half of 2023, a reduction that reaches 49% if June 2023 is compared to December 2020. This performance shows that new loans granted are made for considerably smaller amounts. Although both types of assistance analyzed register reductions in the average balance, the fall in personal loans is more constant and pronounced, which caused that since September 2021 the balance for this type of loan has been lower than that of credit cards.
Figure 17 | SFA funding by type of assistance
Source | BCRA and INDEC
One of the differences between EEFF and PNFC personal loans is in the cost of financing for users71. The BCRA’s Transparency Regime compiles, among other characteristics of financing, the maximum Total Effective Financial Cost (TFC) offered by credit providers. According to these data72, the maximum CFT for personal loans established by the PNFCs, on average, was almost double that of the EEFF in June 2023 (588% for PNFC vs. 321% for EEFF). In the last 24 months, the average maximum CFT was consistently higher for NFPPs than for FFSPs, although the difference between the two TFCs shows a tendency to decrease. In June 2021, PNFC’s average maximum CFT was 3.5 times that of EEFF, while in June 2023 that ratio was 1.8 times.
Figure 18 | Maximum Total Effective Financial Cost of Personal Loans
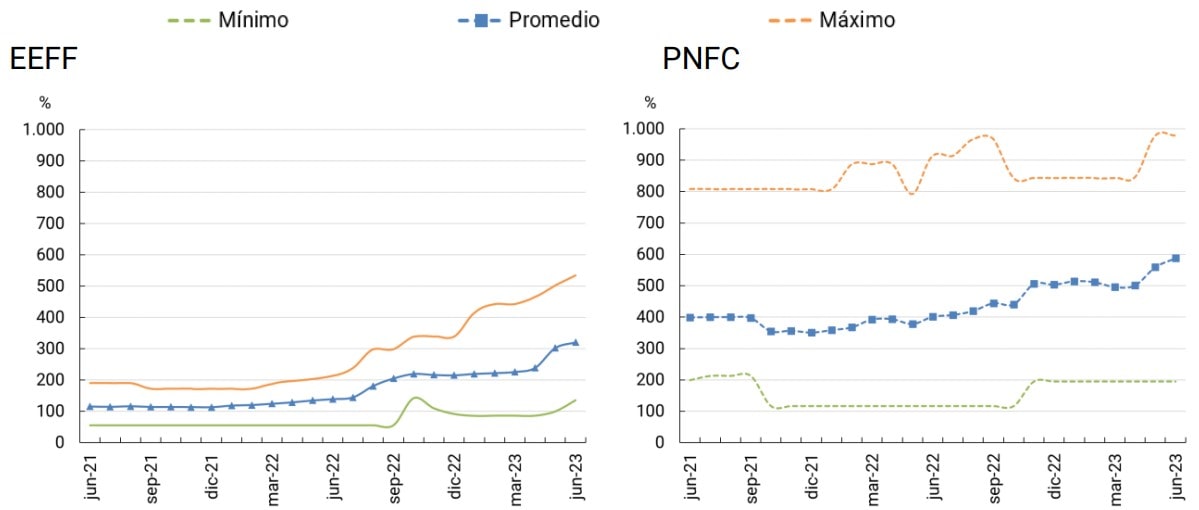
Note | The data correspond to a sample of the 15 providers that register the highest number of debtors as of June-23 of each group (EEFF and PNFC) and that report personal loan data to the BCRA’s Transparency Regime. Personal loans in pesos to PH are included. Loans can be offered nationally or in certain provinces and are aimed at the general public or certain groups (e.g. people who receive their salaries in the EEFF or people with a certain employment status).
Source | BCRA.
Characteristics of debtors.
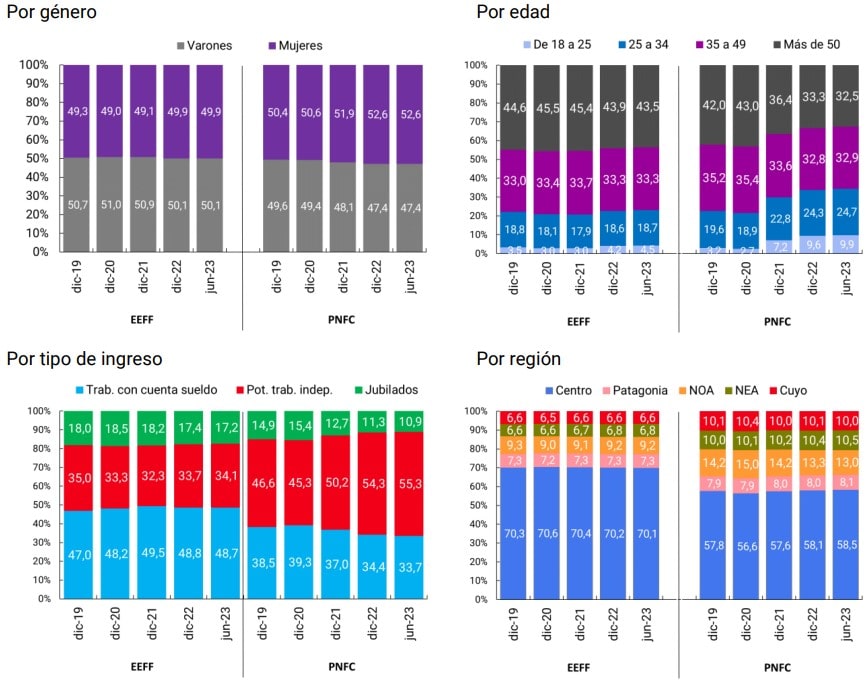
*Gender. As of June 2023, the portfolio of debtors of the EEFF was divided almost equally between men (49.9%) and women (50.1%)73 . These proportions have remained relatively constant over the last few years, although if the current situation is compared with that of December 2019, an improvement of 0.6 p.p. in women’s participation can be observed. For its part, the portfolio of debtors of the PNFCs registers a higher proportion of women (52.6% vs. 47.4% of men). It is also observed that women’s participation has increased progressively in recent years, having started from an almost equivalent situation in December 2019. In this way, it can be inferred that, although the increase in the number of debtors is registered in both genders, women would have a greater preponderance among the new people with financing.
*Age74. The PNFCs concentrated a greater proportion of their debtors among young people. As of June 2023, the group of debtors between 18 and 25 years of age represented 9.9% of the total number of PNFC debtors, while for EEFF debtors that value reached 4.5%. For debtors under 34 years of age, PNFCs totaled 34.6% and EEFF 23.2%. The intermediate age range, of people between 35 and 49 years of age, concentrated similar values in both sets of providers, while for people over 50 there is evidence of a higher participation in EEFF than in PNFC (43.5% vs. 32.5%). With these values, there is a clear focus of the PNFCs towards the younger population and of the EEFF towards people over 50 years of age, a behaviour that the PNFCs have deepened in recent years. The strongly digital component of the main OPNFCs is a relevant factor for the incorporation of young people into financing.
Figure 19 | Distribution of debtors according to socio-demographic characteristics
Note | Workers with a salary account includes all debtors who collect their salaries in a salary account. Potential independent workers correspond to debtors between 15 and 64 years of age who do not register a salary account. Retirees corresponds to debtors 65 years of age and older who do not have a salary account.
Source | BCRA.
*Type of income. Combining the existence (or not) of proof of remuneration in a salary account with age, the source of income of the debtors is estimated and this characteristic is analyzed among the different credit providers. The credit in a salary account indicates the possession of a job in a relationship of dependency. On the other hand, debtors without a salary account of working age are people who would have some type of income from independent work, while those over 65 without a salary account would have a retirement benefit for having reached the corresponding age.
Thus, it can be seen that, as of June 2023, 48.7% of all EEFF debtors were holders of a salary account, while, for PNFCs, this value reached 33.7% of the total debtors. Potential self-employed workers have a greater preponderance among the PNFCs (reaching 55.3% of the total), while for the EEFF the group with the greatest weight are the workers with a salary account. The higher proportion of workers with a salary account among EEFF debtors may be associated with the fact that salaries can be collected through EEFF and not through PNFC. In general, the EEFF offers a package of products that includes credit cards along with the salary account, which contributes to increasing the number of people with financing in EEFF.
In turn, retirees and pensioners have a greater weight among EEFF debtors than PNFC debtors. The collection of retirement benefits in bank accounts also contributes to increasing the participation of this group among EEFF debtors, while issues related to the digital skills of older adults can have a negative impact on access to financing for digital NFPs. Looking at the time series, the distribution of debtors by type of income remains relatively stable for EEFF, while for PNFC potential self-employed workers were increasing their participation to the detriment of dependent workers and retirees.
*Region. Finally, in terms of geographical distribution of debtors, as of June 2023, the LEFs concentrated a higher proportion of their debtors in the central region, with 70.1% of the total compared to 58.5% of the PNFCs. In second place, both sets of suppliers placed the Northwest Argentine region (with 9.2% and 13% for EEFF and PNFC, respectively), but the third place for the EEFF was the Patagonian region, while for the PNFCs this region registered the lowest proportion of debtors. In the case of the distribution by regions, there are no significant changes in the series over time.
4.2. Credit to productive units
The global vision of financial inclusion recognizes all micro, small and medium-sized enterprises (MSMEs) as a vulnerable group in terms of access to and use of financial services. In particular, the lack of access to financing is a relevant barrier in the expansion process of MSMEs. The lack of guarantees, documentation requirements76, the absence of data to assess their solvency, the high levels of informality and uncertainty about the macroeconomic context77 are some of the explanatory factors for this restriction.
In the early stages, companies tend to use their own resources to continue the business cycle. Then, as they undertake growth plans that require investment and productivity improvements, the need for external financing increases. By definition, the MSME set condenses productive units that are at different stages of the company’s expansion cycle and, for this reason, face different challenges in their financial inclusion process.
To address these problems, over the years the BCRA issued regulations aimed at improving the credit of MSMEs, which can be classified into three groups:
-
- Induce financial institutions (EFSAs) to expand their credit supply78:
Financing Line for Productive Investment (LFIP)79 : establishes a monthly supply of resources that the EEFF must direct to MSMEs at an interest rate that is subject to a maximum limit. For the funding of this line, the EEFF must allocate a percentage of the deposits of the Non-Financial Private Sector (NFPS).
Reduction of minimum cash requirements when:
– credit to MSMEs in the total portfolio of the FI represents 4% or more;
– the credit is granted to MSMEs not reported by EEFF in the “Central of debtors of the financial system” in December 2020.
Granting of guarantees: guarantees act as a backstop, facilitating MSMEs’ access to financing, since in the event that the company is unable to pay the debt, a third party will face the payment. The regulation establishes incentives for the EEFF to grant financing to MSMEs with guarantees from Mutual Guarantee Societies (SGRs). At the same time, it establishes financial requirements for the constitution of the risk fund and risk exposure of SGRs to MSMEs.
- Induce financial institutions (EFSAs) to expand their credit supply78:
-
- Creation of environments for the commercialization of new financial instruments:
– Open circulation system (SCA) for the over-the-counter circulation, negotiation, transmission and cancellation of MSME Electronic Credit Invoices (FCEM).
– Central of FCEM unpaid at maturity.
- Creation of environments for the commercialization of new financial instruments:
- Simplification in credit management:
– Low-amount financing where only documentation referring to the identification of the client is required (maximum amount: 8 minimum living and mobile wage -SMVM-);
– Use of credit scoring models to measure the risk and/or probability of default in order to replace proof of income with specific documentation; and
– Loans to microentrepreneurs (maximum amount: 50 SMVM) and financing to Microcredit Institutions.
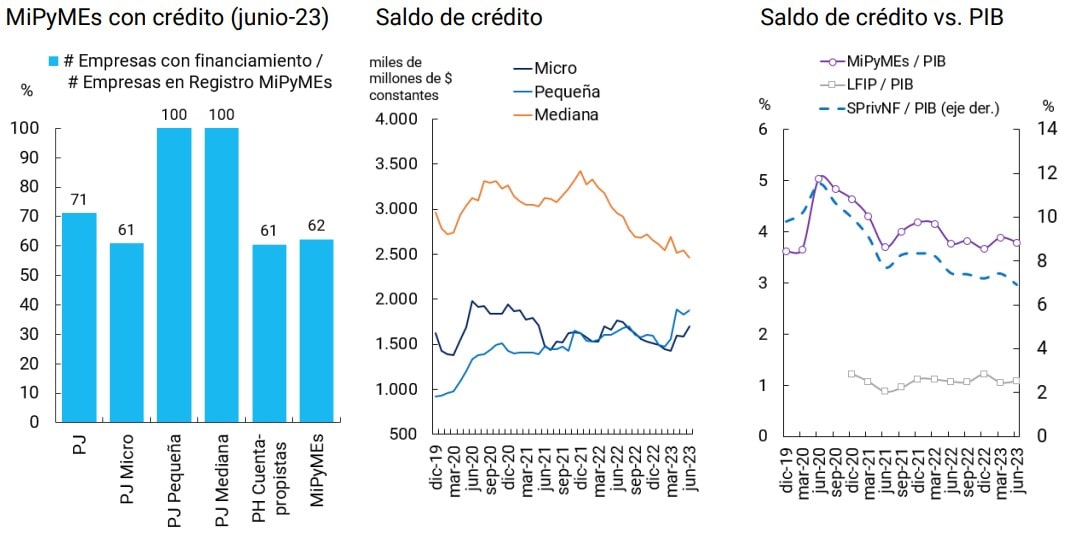
General metrics. In terms of access to credit, out of a total of 1.6 million companies with MSME certification, 62% (1 million) had financing in the expanded financial system (SFA) in June 202380 , while this ratio rises to 48% if the number of companies surveyed in the National Economic Census 2020-2021 is taken as a reference81(CNE 20-21). Small and medium-sized enterprises had much higher levels of access to SFA credit than micro enterprises, regardless of their form of incorporation (natural or legal person). It should be noted that in the case of small and medium-sized companies constituted as legal entities (PJ), access to financing (without considering the amount of the same) was full, reaching 100% of them. These results are in line with different studies that indicate that the size of the firm is positively associated with the level of indebtedness82.
Figure 20 | Benchmarks on MSME financing
Note | The ratios to GDP are calculated by taking: (i) numerator: last month of the quarter; and (ii) denominator: GDP for the quarter.
Source | Open Data on Productive Development, INDEC and BCRA.
On the other hand, SFA credit to MSMEs performed better than credit to the non-financial private sector (NFPS) once the critical period of the COVID-19 pandemic was over. The evolution of financing since the end of 2019 at the size level shows at least three differentiated behaviors83. On the one hand, financing balances grew at the beginning of the COVID-19 pandemic for the three sizes of companies, micro, small and medium-sized, and were sustained approximately until the end of 2020. On the other hand, small companies are the ones that showed an increasing trend in financing balances in recent years. Finally, micro and medium-sized companies reduced credit balances as of 2022, although in the case of micro companies they exhibited a recovery at the margin.
The difference in behavior between NFPS and MSME lending is influenced by specific regulations that aim to guide financing to the MSME sector. It should be noted that financing to MSMEs through the specific lines partially absorbs the funds from the deposits, given that for every $100 pesos that the EEFFs can lend, about $10.7 must be allocated at least to MSME credit84.
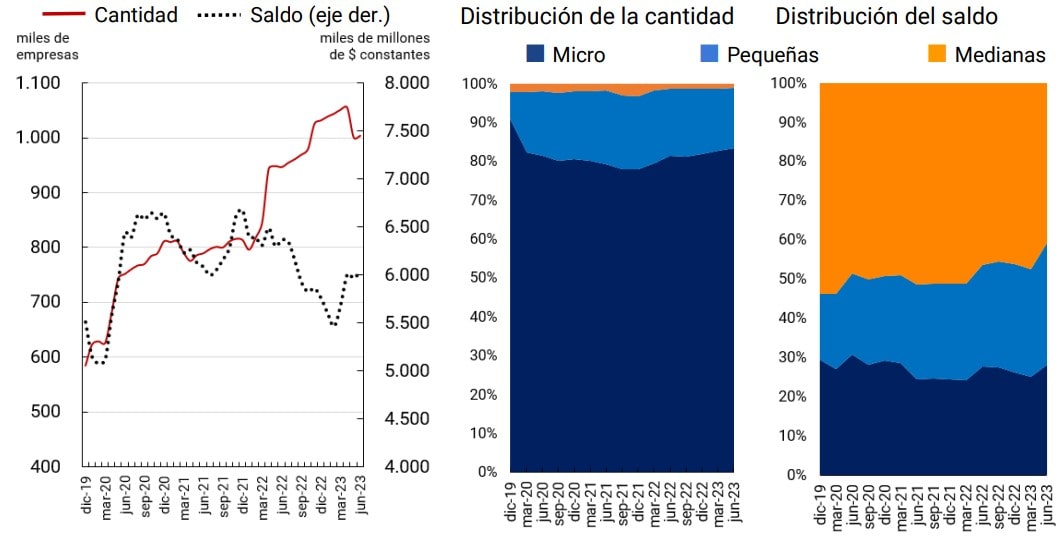
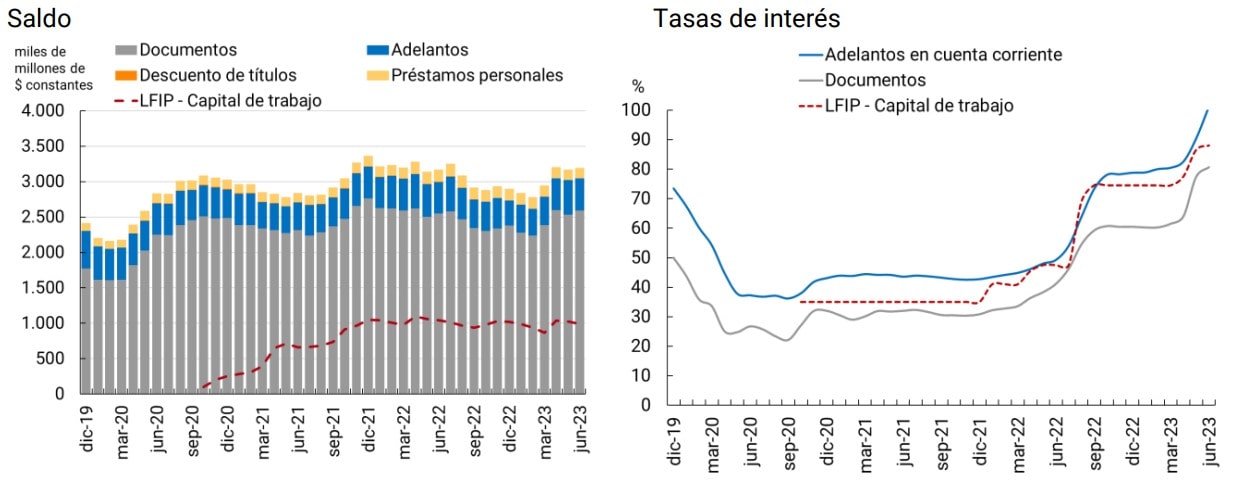
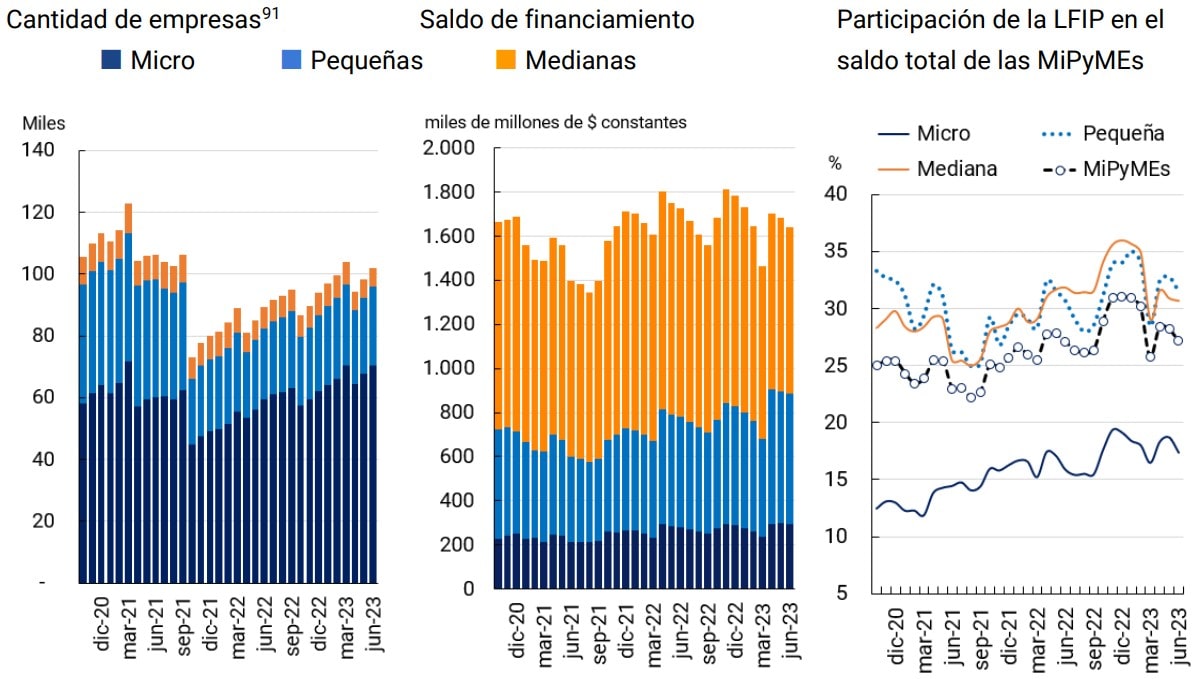
The number of MSMEs with financing in the SFA reached 1 million as of June 2023 and registered a net increase of close to 57 thousand productive units compared to June 2022. The distribution by size indicates that micro enterprises concentrated more than 83% of MSMEs with credit in the SFA. Of this participation, 73 percentage points (715,000 signatures) correspond to MSMEs of individuals (PH).
Figure 21 | MSMEs with SFA financing
Source | BCRA.
On the other hand, the financing balance of MSMEs in the SFA amounted to $6 trillion in June 2023, showing a year-on-year drop of 5.1% at constant values85. In contrast to the number of companies, medium-sized companies concentrated the largest participation in the total balance of financing. Likewise, small companies played a leading role since they registered a significant increase in their share of total financing balances86.
Credit assistance. The financing of MSMEs in the SFA is mainly linked to short-term lines of credit, whose destination is associated with working capital. The share of working capital in total financing went from 49% in January 2019 to 65% in June 2023. On the other hand, financing with larger amounts and longer terms was losing ground at the expense of loans with a shorter term and amount.
Figure 22 |Financing of MSMEs by assistance group87
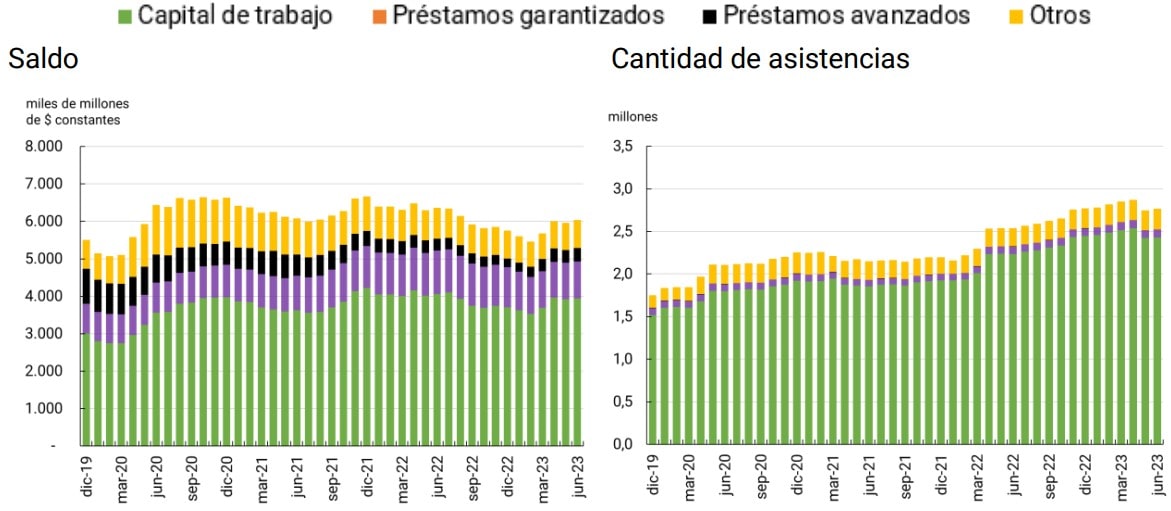
Source | BCRA.
The use of financing through documents (single-signature, discounted and purchased) predominates throughout the series as the most relevant assistance in terms of balance. The preference of MSMEs for this type of credit is influenced by the dynamics of their interest rate. Throughout the series, the interest rate on documents is below other financing alternatives. In addition, the LFIP influences the dynamics of the interest rate of the documents since it establishes a maximum interest rate for the financing of working capital, which, in a relevant portion, is channeled through documents.
Figure 23 | Financing of MSMEs associated with working capital net of credit cards
Source | BCRA.
Financing under the LFIP. The balance of financing granted through the LFIP reached approximately $1,721 billion in June 202388 (about 28.5% of the total financing balance to MSMEs). The number of companies and funding balance under the LFIP are distributed by size in a similar way to the overall SFA funding. More than 50% of the financing balance was granted to medium-sized companies89 , while the largest number of companies reached were micro and small in size.
One way to analyze the impact of the LFIP in terms of financial inclusion is through the LFIP’s participation in the total financing of the SFA. The relative weight of credit via LFIP was more significant in small and medium-sized enterprises than in micro enterprises. However, in the case of micro companies, this proportion went from 12.4% in October 2020 to 17.4% in June 2023, registering the highest growth of the 3 sizes. In general terms, a small portion of the financing of micro enterprises has the favorable conditions with respect to the cost of financing offered by the LFIP.
The low participation of the LFIP in the total credit of micro enterprises could result from the intensive use of the credit card as a means of financing90, which cannot channel credit through the LFIP. On the other hand, the credit products used to channel financing through the LFIP, such as document discounting and personal loans, are used by a small number of micro enterprises, which limits the impact of the LFIP on the total credit balance.
Figure 24 | MSMEs and other companies with financing under the LFIP
Source | BCRA.
Section 1 / Digitalisation, pandemic and account opening: exploring young people’s access to financial services
In the previous Financial Inclusion Report, we showed that the number of people with bank and/or payment accounts went from 27.6 million in March 2019 to 35.1 million in December 2022, which represented a growth of 27%. The age group that contributed the most to this increase was 15 to 19 years old, with 6 p.p., while with almost 3.5 p.p. the next age group (20 to 24 years old) did so.
Given the fluidity observed in the behavior of young people, it is natural to ask: Do they behave differently from adults when it comes to starting out as users of financial services? Do their characteristics and the context that surrounds them influence their behavior?
Answering these types of questions faces additional challenges imposed by the available observation window. Between 2019 and 2022 we lived with two significant, related but distinct processes. A structural one that accelerated, the deployment of technology as a means of access to financial services. Another conjunctural situation, although with a strong impact, was the outbreak of the COVID-19 pandemic.
This section summarizes the main results of a research document by the BCRA’s Senior Management of Financial Inclusion that explores possible responses to the challenges previously mentioned. The research involved the construction of econometric models of “time to an event” data at the individual level, considering the period between the first quarter of 2019 and the quarter of 2022 as the observation window92.
The variable that is sought to be explained is the amount of “time” that elapses until a person opens an account, either in a financial institution (EF and EEFF in the plural) or in a payment service provider that offers payment accounts (PSP). These models show, among other variables, the cumulative probability that at a given moment in time the population that did not have an account will continue not to have one or, in addition, that it will become one. Working with a series of stratified, representative random samples of people between 13 and 85 years of age, methodologies commonly used in time-to-event studies are applied, which are the tools of choice when the answer to “why” requires a response to “when” as a priority93.
There are two conditioning factors to identify the time under study (t) in this analysis: 1) the observation window and 2) the legal age to be able to access the reference financial service. This is why we have chosen to work with two different definitions of t=0. In the first instrumentation, the moment t=0 corresponds to the first calendar quarter for which we have information (first quarter of 2019). In the second, t=0 corresponds to the moment when the person was about to turn 13 years old to open accounts. In both cases, the time will evolve in quarters (given the nature of the available data) but with a different meaning in each case.
Consequently, the variable “time” has two meanings depending on the proposed analysis. In the first case, it is the calendar time (evolution of the quarters between 2019 and 2022) while, in the second case, it represents the age of the people starting at 13 years and ending at 1694. Thus, the evolution of the time under analysis refers to the passage of chronological time first; so two people present at the same time t coincide in time, but they may have different characteristics, including their age. In the second case, two people who coincide at a time t will have the same age, although they may have reached it at two different moments in calendar time.
Thus, for this section, we worked with two types of samples. One includes all those people who in the first quarter of 2019 were 13 years of age or older, did not have the type of account (bank or payment) corresponding to the reference account provider, and up to 85 years of age for the first account registration. In the second case, it includes people aged 13 to 16 between 2019 and 2022 who did not have an account with the corresponding reference account provider in the first quarter of 2019.
Account adoption by the general population
Nonparametric survival models yield the following results:
- The adoption of accounts by the population is not uniform over time. For example, events such as the COVID-19 pandemic had a positive impact. More recently, between the first and third quarters of 2022, the probability of opening accounts increased again.
- A period of 4 full years is not enough for the entire group of people without an account to have one, although a majority were financially included in terms of account holding.
- The adoption of accounts during the COVID-19 pandemic was mainly explained by financial institutions (EEFF). No significant differences are observed between public and private entities96 . For their part, in the case of Payment Service Providers (PSPs), the adoption of accounts during the COVID-19 pandemic was not a singular event but a sustained process over time.
Figure A.1.1. | Adoption curves by entity groups
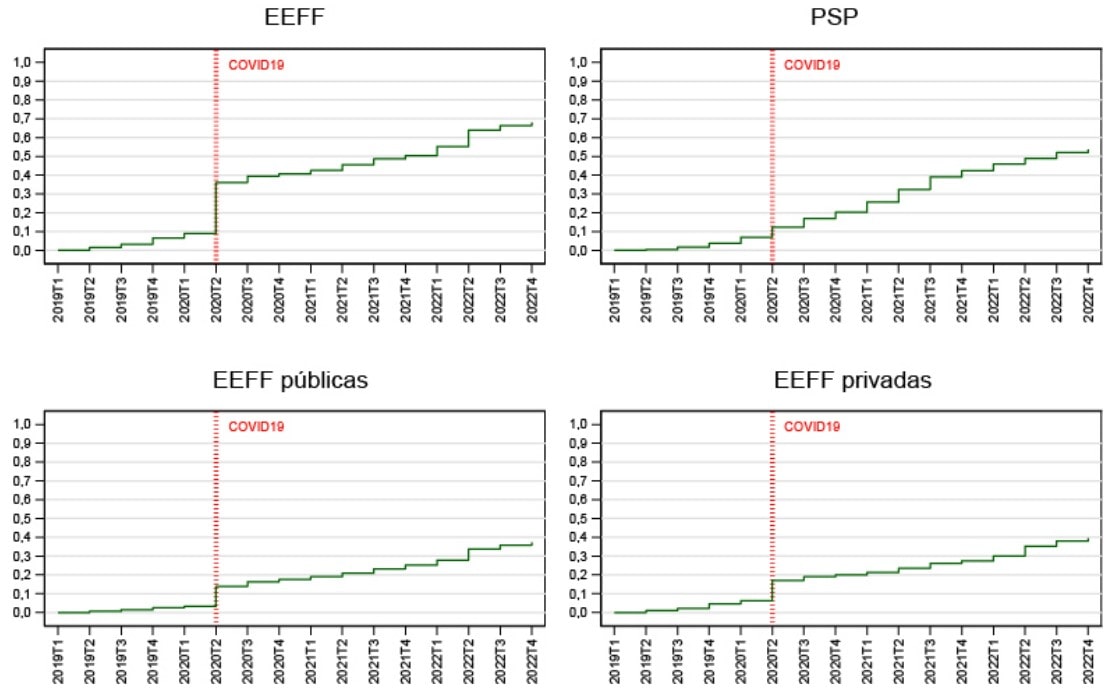
Note | Sample: No 2019Q1 and 13 and over in 2019Q1 up to 85 age first discharge. Time under analysis: quarter – Adoption curves (Kaplan-Meier failure). The adoption curves show the cumulative probability that people who did not have an account at the beginning of the first quarter of 2019 will have one in the following periods.
Source | Own estimates based on COELSA data.
Exploring the differential behavior of young people and adolescents
The previous results are accentuated by separating individuals into different groups of people, first between “young” (13 to 29 years old) and “adult” (30 to 85 years old) and, second, between “adolescents” (13 to 16 years old) and “mature” (17 to 85 years old).
- The disaggregation into opposing age groups shows that it was mature people, and to a lesser extent young people, who explained the adoption of accounts in EEFF at the beginning of the COVID-19 pandemic, while the adoption of adolescents was more recent (as of 2022).
- In the case of PSPs, adoption has been gradual, although in all trimesters it was higher in the case of young people and adolescents than in the case of adults or mature people.
- These results suggest that population groups behave differently. These hypotheses were then statistically evaluated based on a logarithmic range test97. The tests refuted the hypothesis of equality of behavior.
Figure A.1.2. | Adoption curves according to age groups (young people vs. adults)
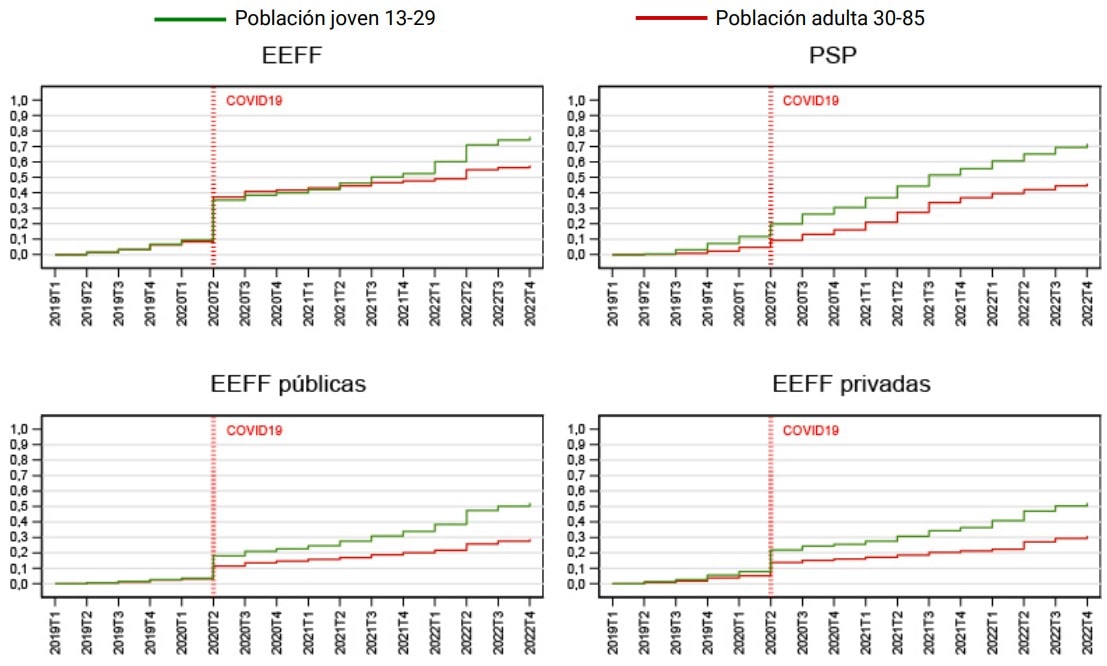
Note | Sample: No 2019Q1 and 13 and over in 2019Q1 up to 85 age first discharge. Time under analysis: quarter – Adoption curves (Kaplan-Meier failure). The adoption curves show the cumulative probability that people who did not have an account at the beginning of the first quarter of 2019 will have one in the following periods.
Source | Own estimates based on COELSA data.
Figure A.1.3. | Adoption curves according to age groups (adolescents vs. mature people)
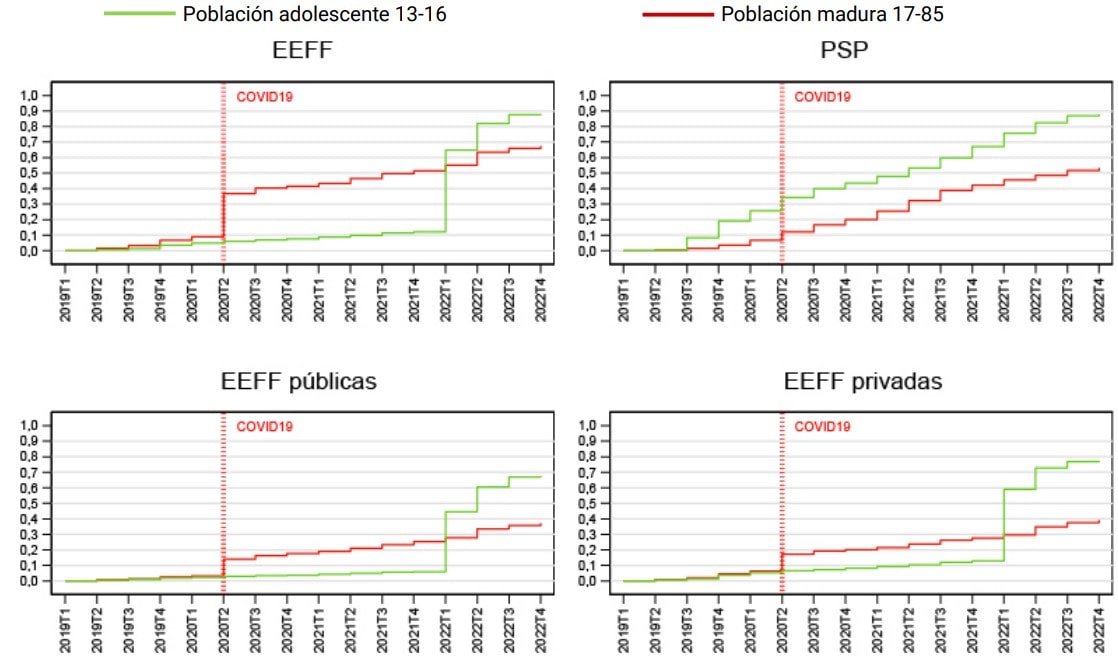
Note | Sample: No 2019Q1 and 13 and over in 2019Q1 up to 85 age first discharge. Time under analysis: quarter – Adoption curves (Kaplan-Meier failure). The adoption curves show the cumulative probability that people who did not have an account at the beginning of the first quarter of 2019 will have one in the following periods.
Source | Own estimates based on COELSA data.
Adoption of accounts according to the age of teens
The second type of sample used for the estimates suggests that the adoption of bank accounts by adolescents begins mainly from the age of 16. On the contrary, adoption is earlier and more gradual in the case of paid accounts, and tends to increase as these people get older.
For the same age, adolescent adoption is higher for PSPs than for EEFFs. These differences could be due both to young people’s preference for payment accounts and to the fact that the EEFF began to offer accounts for adolescents through electronic opening later.
Figure A.1.4. | Adoption curves according to adolescent age
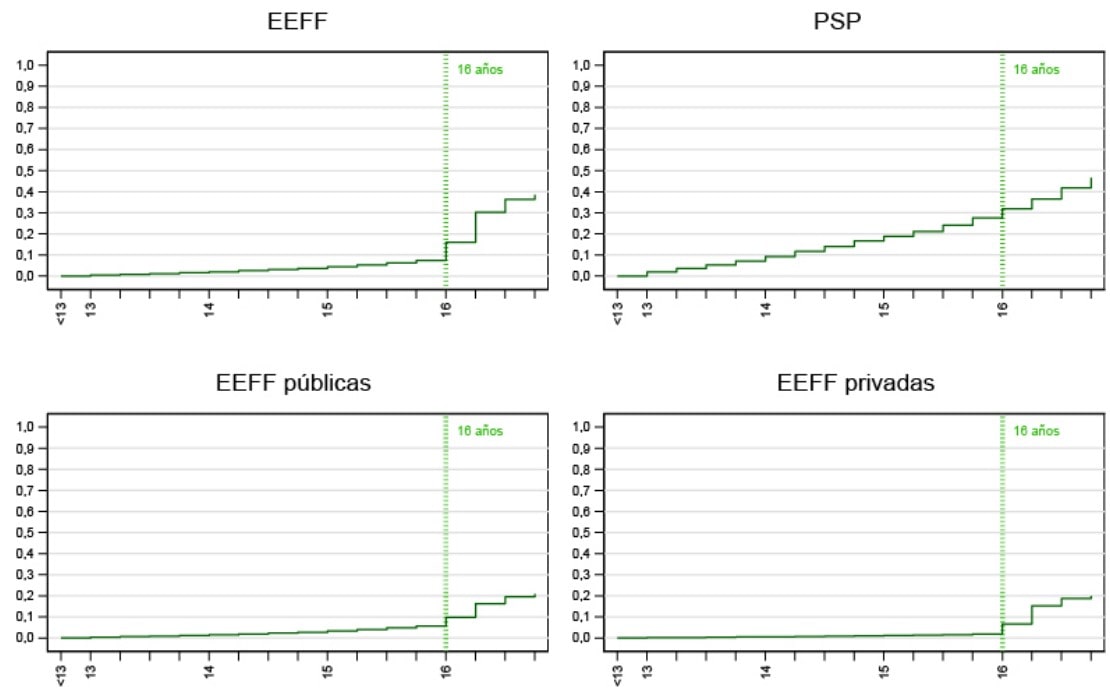
Note | Sample: No 2019Q1 and 13 and over in 2019Q1 up to 85 age first discharge. Time under analysis: quarter – Adoption curves (Kaplan-Meier failure). The adoption curves show the cumulative probability that people who did not have an account at the beginning of the first quarter of 2019 will have one in the following periods.
Source | Own estimates based on COELSA data.
Semi-parametric Cox models with time-varying coefficients
To the analysis based on non-parametric models of Kaplan and Meier, the research adds the estimation of Cox models with variable coefficients over time that offer some key relative advantages such as the inclusion of multiple explanatory variables, the transcendence of the violation of the assumption of proportional risks and the possibility of performing simulations with the estimated parameters to differentiate possible causes and incentives for the opening of accounts.
Both the non-parametric and semi-parametric models used, with their corresponding tests, allow us to conclude that:
- Young people show different behavior than adults with a more significant openness.
- Adolescents show a different behavior than mature people with a more significant opening in PSP and also in EEFF, although with a certain time delay.
- The characteristics of the service provider play a transcendent role in the dynamics of account opening. Although the processes for the different types of suppliers share certain characteristics such as being bottom-up, there are also aspects that differentiate them such as, among the most notable, the upper limit reached, and the jump corresponding to the impact of the COVID-19 pandemic.
- The evidence, arising from the estimation of behavioural models and the performance of simulations with the estimated parameters, allows us to clearly differentiate the impacts of the deployment of technology from that of the outbreak of the COVID-19 pandemic.
- The COVID-19 pandemic has a greater impact on males than females in terms of EEFF, which could be attributed to motorized emergency public support programs, although the subsequent dynamics bring the process of women closer to that of men, especially in public banking. In terms of PSPs, and although women start from a lagging position compared to men, the process ends up reversing this situation at the end of the observation window.
- There are differences in the opening patterns for the different types of account providers, since in contrast to a “trend” dynamic typical of PSPs, another of an “eventual” type characteristic of the LFS is observed, resulting from their reaction to the COVID-19 pandemic and the deployment of specific actions to facilitate access to accounts towards the end of the observation window.
- There is a “critical” age of around 16 for opening bank accounts.
- Despite the emergence of “digital/virtual” facilities for the opening and use of bank and payment accounts, “territorial” characteristics still seem to play a significant role in the dynamics of account opening.
- Contrary to the sustained assertion that the actions of PSPs are focused on enabling the financial inclusion of people who reside in small communities, the evidence shows that in terms of timing, this role is fulfilled by public LFFs while PSPs stand out in localities with the largest number of people aged 15 and over. The expansion of PSP account opening occurs more quickly in localities that already have banking infrastructure, both public and private.
Section 2 / Dynamics of cash withdrawals and financial inclusion
The acceleration of digital payments in Argentina is a consolidated trend, however, cash continues to be a relevant means of payment in everyday use. This phenomenon, which also occurs in other economies of the world such as those belonging to theeuro zone 98, raises the following question: How has the use of cash evolved in our country in recent times?
63.5% of people said they used cash very frequently in their regular purchases, according to a survey at the end of 202299. While 69.4% of household spending was made in cash according to a survey prior to the pandemic (2017-2018)100. Both figures provide an idea of the daily life of cash as a means of payment at different points in time.
Figure A.2.1 | Relationships between cash withdrawals, electronic means of payment and GDP
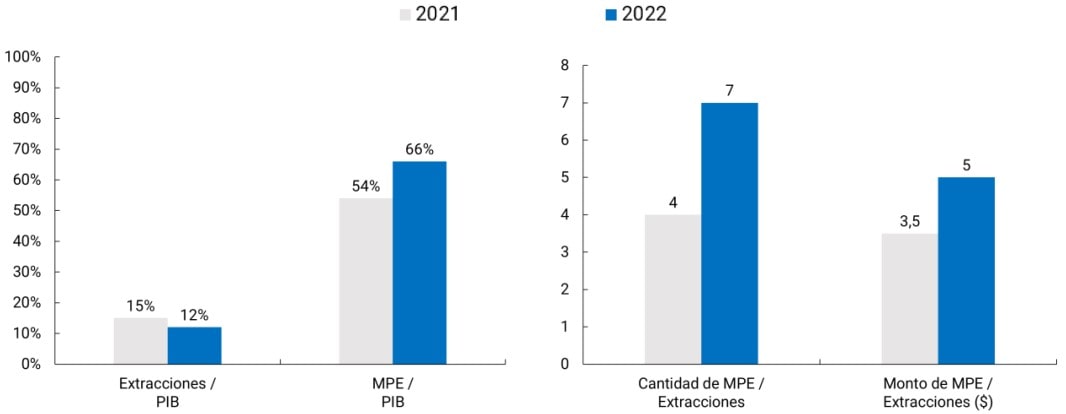
Note | “Withdrawals”: cash withdrawals; “MPE”: electronic means of payment. Amounts for each year in current terms.
Source | BCRA and INDEC.
At the same time, the amounts – in real terms – withdrawn from ATMs, a proxy for the use of cash as a means of payment101, fell by 23% during 2022. This is to be expected in light of the increase in the volumes -at constant prices- of electronic means of payment -MPE- (+25% y.o.y.). Likewise, the proportion of the amounts extracted from cash over the total amount produced in the economy fell by 3 p.p. between 2021 and 2022 (from 15% to 12%). MEPs as a proportion of GDP advanced from 54% to 66% in the same period. In terms of population, each adult made -on average- more electronic payments for each cash withdrawal per month in 2022 than during 2021 (7 vs 4, respectively). A similar situation was recorded in terms of real amounts ($5 vs. $3.5 for each peso extracted, respectively). This leads to the conclusion that, on average, each Argentinian would increasingly use PEMs instead of cash.
In short, cash is still important when making everyday payments, but its use would be losing ground to the advance of digital payments. Now, is this trend verified for the entire population? Or can different behaviors be identified according to different population groups (Groups I, II, III and IV102)?
There are disparate behaviors in the use of cash depending on the level of income and type of labor income (registered or unregistered) according to the results of the aforementioned surveys. The use of cash (a) grows as people’s income levels decrease, while (b) it is lower among those who receive a registered labor income.
This behavior can be corroborated from the information on cash withdrawals collected by the BCRA. These data, classified according to the degree of development of the physical financial infrastructure of the localities, allow their inhabitants to be grouped into four groups and characterized according to the following attributes: (a) number of people who receive their remuneration through a salary account (proxy of registered employees); (b) amount of remuneration received through a salary account (proxy for the income level of registered employees) and (c) activity of account holders -bank and/or payment-, among others.
The analysis of the data verifies the trends found in the individual surveys in relation to the level and type of income (although in this case the availability of the information only allows us to work with data on the formal labor income of those who receive their salaries in a salary account):
(a) As the level of the average remuneration per salary account holder (registered salaried proxy of the population) increases, the proportion of cash withdrawals over formal remuneration tends to decrease and the activity of account holders (bank and/or payment) increases.
(b) In population groups with a lower proportion of salary account holders (proxy of registered employees), a higher percentage of cash withdrawals is observed compared to formal remuneration and a lower activity of account holders (bank and/or payment).
(c) The differences between the population groups for the variables analysed were maintained in all quarters between June 2021 and December 2022.
Table A.2.1 | Characterization of population groups
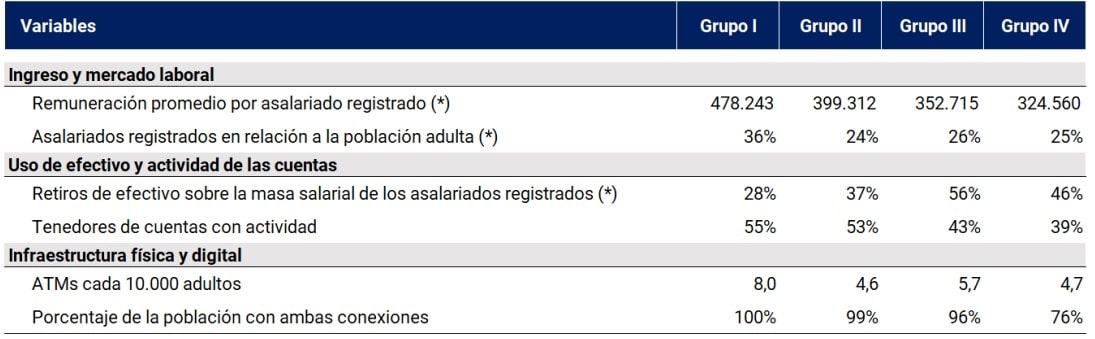
Note | Data as of December 2022, except for digital infrastructure (August 2022) and for active account holders (4th quarter of 2022). (*) In this table, “registered salaried employee” is used to refer to people who receive their salaries through a salary account and the “wage bill of registered wage earners” considers the sum of the remunerations of these workers. Account holders with activity: Percentage of account holders with at least one debit. Population groups (I to IV): according to the regulation, localities throughout the country are grouped into 6 categories according to the level of physical financial infrastructure and certain financial development indices (from I to VI, from highest to lowest level of infrastructure). The cash withdrawal data is presented in 4 groups since the last 3 categories (from IV to VI) are aggregated in the same set. In this way, the population of the localities that make up each group is taken as the unit of analysis. Amounts expressed at constant prices in June 2023 (CPI June 2023 = 100).
Source | BCRA, COELSA, ENACOM and INDEC.
Other factors, such as physical and digital financial infrastructure, could also help explain differential behaviors in cash management. For example, greater access to withdrawal points (ATMs, cash withdrawal shops, ACSF, etc.) decreases the need to make significant withdrawals for precautionary reasons and tends to increase their frequency for smaller amounts. In particular, population group I, which registers the lowest rate of withdrawals with respect to formal remuneration, has a higher number of ATMs per adult. On the other hand, the possibility of developing a digital payment network depends on the existence of a solid internet connection system that naturally affects consumers and businesses. The population that can access both connections (fixed and mobile) has an impact on the potential of digital financial services. Although in this case there is not a great difference between most of the groups, in group IV, a quarter of the population lives in localities that do not have both types of connection. In addition, the quality of connectivity (e.g. browsing speed) should be assessed in order to be able to analyse the possibilities for the effective development of digital infrastructure106.
As previously stated, generally speaking, the amounts withdrawn from cash have decreased while the MPEs have advanced. The next question is whether and to what extent this decrease in the use of cash has been verified in all population groups.
Table A.2.2 | Decrease in cash withdrawals
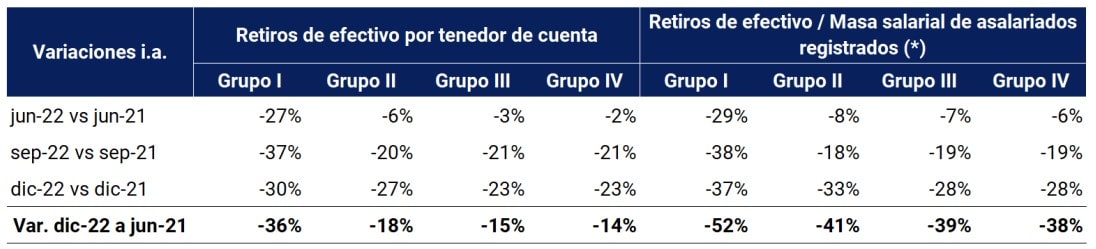
Note | Changes i.a. on amounts expressed at constant prices in June 2023 (CPI June 2023 = 100). (*) In this table, “registered salaried employee” is used to refer to people who receive their salaries through a salary account and the “wage bill of registered wage earners” considers the sum of the remunerations of these workers.
Source | BCRA and COELSA.
As a first point, it can be pointed out that cash withdrawals -at constant prices- have decreased in the 4 population groups considering account holders (bank and/or payment) and with respect to formal remunerations received in salary account -at constant prices- (for all variations I.A. and between the peaks of the period analyzed). The fall in the use of cash has been reflected in all population groups, regardless of the level and type of income and the availability of physical and digital infrastructure.
Second, the rate of decline in cash withdrawals has not been uniform across population groups.
Cash withdrawals – at constant prices – in group I, which relatively has the highest average remuneration per registered employee and the highest proportion of formal workers (who receive their credits in a salary account), have fallen by a greater magnitude than the rest of the population groups both in terms of account holders (bank and/or payment) and with respect to formal real remuneration (for all variations i.a. and between the peaks of the period analyzed). It could be said that the fall in the use of cash (and its replacement by electronic payments) has occurred at a faster pace in the population as a whole with the highest rate of registered salaried employees (salary account holders), the highest level of formal remuneration and better access to physical infrastructure.
In conclusion, the analysis of the data on cash withdrawals from ATMs collected by the BCRA and processed by population groups allows: (1) to confirm the existence of differential behaviors in the handling of cash according to the level and type of labor income (formal/informal), (2) to assert that, despite this, in recent times the fall in cash is a phenomenon that is verified throughout all population groups regardless of their income conditions and physical and digital financial infrastructure and (3) affirm that this trend has been of greater magnitude among people with a higher level of income, a greater presence of registered employment and better access to physical infrastructure.
Under the premise that digital payments are the gateway to the use of the financial system, since they allow people to access other services such as savings and/or financing, this analysis would allow us to understand in which population groups the potential growth of financial inclusion has been greater/lower, as a counterpart to the evolution of the use of cash. and what challenges could be addressed to achieve universal use of financial services.
Other characteristics for which information is not available, such as digital skills, behaviors in situations of vulnerability, and disruptions in the operation of the information and communications infrastructure, can also affect this behavior. There is evidence of this for both developed and developing countries. Thus, although the drive for digitalization is systemic, even in highly developed environments of digital transactional environments, the use of cash and accessibility to physical service points are essential to facilitate the financial inclusion of remote populations, the elderly, and people with some type of personal and/or social vulnerability107.
Methodological note
Population data
This IIF presents indicators that are disaggregated by different demographic and geographical variables. As of the date of publication of this edition, the final results of the 2022 National Census of Population, Households and Housing (CNPHV) have not been disseminated, so population data based on the 2010 CNPHV were used.
Given that the National Institute of Statistics and Census of the Argentine Republic (INDEC) does not publish a series that simultaneously contains all the disaggregations used throughout this IIF (gender, age group and geographical location at the provincial, departmental and locality levels), it was necessary to take different series according to the definition of each indicator:
- for the indicators at the national and provincial levels, the series entitled “Population by sex and five-year age groups for the country and provinces as a whole” was used. Years 2010-2040″;
- for the indicators at the departmental level, the series “Estimated population on July 1 of each calendar year by sex, by department” was taken as a basis;
- finally, since INDEC does not publish a projection of the evolution over time of the number of inhabitants of each locality, it was necessary to construct the series for the indicators at that level, for which the results of the CNPHV of 2010 were used.
Considering that there are differences between the provisional results of the CNPHV 2022 and those of 2010, the indicators developed in this IIF in relation to the adult population should be taken as provisional until updated information from the last census is available.
Finally, for the purposes of this IIF, an “adult” is considered to be a person 15 years of age or older, following the standard used by the World Bank for its financial inclusion indicators.
Regionalization
For the purpose of developing regional indicators, the regionalization criterion proposed by the Ministry of Economy and Public Finance (currently the Ministry of Economy) was used, which establishes five regions, namely:
– NOA (Northwest Argentina): Salta, Jujuy, Tucumán, Catamarca and Santiago del Estero.
– NEA (Northeast Argentina): Formosa, Chaco, Misiones and Corrientes.
– Nuevo Cuyo: Mendoza, San Juan, San Luis and La Rioja.
– Patagonia: La Pampa, Neuquén, Río Negro, Chubut, Santa Cruz and Tierra del Fuego.
– Centro and Buenos Aires: Córdoba, Santa Fe, Entre Ríos, Buenos Aires and the Autonomous City of Buenos Aires.
In this IIF, Nuevo Cuyo is mentioned as Cuyo and Centro and Buenos Aires as Centro.
Payment accounts at payment service providers
Among the Payment Service Providers (PSPs) that operate in COELSA, there are providers that are registered in the BCRA’s Registry of Payment Service Providers (PSPs) and other providers that are not registered108 . For the purposes of this report, only payment accounts for vendors that are registered as PSPs that offer payment accounts are counted.
Account activity
The “Activity” series comes from COELSA and indicates whether account holders registered debits or credits in their bank and/or payment accounts throughout a quarter. If a person makes transactions from different accounts, either from the same entity or from different entities, it is posted only once.
The series makes it possible to distinguish whether the movement of funds is the result of a debit and/or credit and includes debits and credits made through immediate transfers, payments with online transfers, transactions with checks, direct debits, DEBIN and batch (deferred) transfers, to the extent that they are settled and cleared by COELSA.
Given that the “Activity” series considers the subset of operations in which COELSA is involved, the activity indicators are underestimated. In particular, the indicator does not capture those account holders who operate with a debit card and do not make transfers to or from payment accounts, cash withdrawals, among others. Another aspect of the indicator is that debit transactions are, in general, initiated by the PH account holder itself, while credit transactions are originated by a third party (PH or PJ). This distinction has different considerations in terms of financial inclusion, given that in the first case it is an active operation of the PH.
MSME Business Credit
The MSME criterion proposed by the Ministry of Industry and Productive Development109 was used, in which an MSME is a micro, small or medium-sized enterprise, whose economic activity in the country is grouped in one of these sectors: services, commercial, industrial, agricultural, construction or mining. The size of the MSME is determined based on the economic activity and the amount of total annual sales. When the BCRA regulations so provide, the EEFF report in the Central Bank of Debtors of the Financial System (CENDEU) the field “código_pyme”110, which is composed of 2 digits, one indicating the size and the other the economic sector. Given that there are cases where the same company has different “código_pyme” assigned for the same period, the “código_pyme” corresponding to the credit assistance with the highest balance in each of the periods studied was used. There is a possibility that the first balance is identical to the second, in this case the highest possible “código_pyme” is taken. For the assignment of the province to MSME companies, the tax domicile declared in the AFIP Registry was used.
Balances of savings and investment products of individuals (PH)
The savings and investment balances of the (PH) are classified as follows:
- Immediate liquidity balances: include: (i) balances in current accounts and savings accounts denominated in local and foreign currency; (ii) balances in payment accounts and (iii) value of the net worth (PN) of the Mutual Funds (CDF) subscribed by PH (estimate).
- Balances in short- and medium-term products: include: (i) balances in fixed terms in pesos and in foreign currency, (ii) balances of products in UVA and (iii) value of the NP of other Mutual Funds (Other FCIs) subscribed by PH (estimate). They include fixed income (bonds), equities (shares), mixed income, structured funds, among others111.
To estimate the PN of the DCFs subscribed by PH, the sum of the DCFs subscribed through PSPs, the exclusive DCFs of PHs in EEFF and, for those DCFs that may be constituted by both PH and PJ in EEFF, those corresponding to PH were estimated on the basis of weights. The weights were obtained through the calculation of the share of the PH FCIs in the Total FCIs (PH+PJ). Exclusivity was consulted through a survey of the websites and management regulations of the DCFs.
On the other hand, to estimate the NP of the other CRFs, the difference between the NP value of the FCIs subscribed by PH (using the series called “FCIs opened by PH” published by CAFCI monthly) and the PN value of the DCF subscribed by PH was calculated.
Dynamics of cash withdrawals and financial inclusion
The data on cash withdrawals collected by the BCRA through the Monthly Accounting Information Regime, available for the quarters from June 2021 to December 2022, are classified into categories based on the degree of physical financial infrastructure and financial development indices of the localities (from I to VI, from highest to lowest level of infrastructure/financial development).
The data on cash withdrawals are presented in 4 groups since the last 3 categories (from IV to VI) are aggregated in the same set. These 4 groups can be characterized by the following attributes: (a) number of people who receive their remuneration through a salary account (proxy for the number of registered employees); (b) amount of remuneration received through a salary account (proxy for the income level of registered employees) and (c) activity of account holders -bank and/or payment-, among others.
Glossary of abbreviations and acronyms
ACSF Complementary Financial Services Agency
AFI Alliance for Financial Inclusion
AFIP Federal Administration of Public Revenues
ARS Argentine Peso
ATM ATM
BCRA Central Bank of the Argentine Republic
BIS Bank for International Settlements
BP Payment Button
CABA Autonomous City of Buenos Aires
CAFCI Argentine Chamber of Mutual Funds
CBU Uniform Bank Code
CENDEU Central Bank of Debtors of the Financial System
CFT Total Financial Cost
CNE National Economic Census
CNPHV National Census of Population, Households and Housing
NVC National Securities Commission
COELSA Electronic Clearing House
CVU Uniform virtual key
Der Law
EEFF Financial Institutions
EF Financial Institution
EMAE Monthly Estimator of Economic Activity
ENACOM National Communications Entity
EPH Permanent Household Survey
ETCNB Non-Bank Credit Card Issuers
E Companies and organizations
FAS Financial Access Survey
CDF Direct Pool Fund
FCD-PH Pool of Money of Human Persons
FCEM Electronic Credit Invoices for MSMEs
FCI Mutual Fund
FCI-PH Common Investment Fund for Individuals
FF Financial Trust
IMF International Monetary Fund
FSB Financial Stability Board
HB Home banking
year-on-year i.a
IIF Financial Inclusion Report
INDEC National Institute of Statistics and Censuses
CPI Consumer Price Index
ITU International Telecommunication Union
LFIP Financing Line for Productive Investment
MB Mobile Banking
Mbps Megabits per second
M Miles
Billion Millions
MSMEs Micro, Small and Medium Enterprises.
MPE Electronic Payment Methods
MPOS Mobile Device at Point of Sale
NEA Northeast Argentina
NOA Northwest Argentina
ON Negotiable obligation
OPNFC Other Non-Financial Credit Providers
PCT Transfer payments
PDA Access Points
FAQ Fixed Term
PH Human Person
GDP Gross Domestic Product
PJ Legal Entity
PN Net Worth
PNFC Non-Financial Credit Providers
POS Point of Sale Device
p.p Percentage points
PSP Payment Service Providers
QR Quick Response code
SCA Open Circulation System
SEPyME Secretariat for Small and Medium Enterprises and Entrepreneurs
Shadow Fiend Financial system
SFA Expanded Financial System
SGR Mutual guarantee companies
NFPS Non-Financial Private Sector
SMVM Minimum living and mobile wage
SUC Branch
TAS Self-service terminal
TD Debit Card
TNA Annual Nominal Rate
TVI Year-on-year rate of change
UVA Purchasing Value Units
References
1 Includes payment service providers (PSPs) and non-financial credit providers (NFCPs).
2 Average amount at constant prices in June 2023. The amount transacted per adult, at constant prices, increased by 25% in year-on-year terms in the first half of the year.
3 Rates obtained from the Internet Access report (INDEC).
4 Smaller localities have a higher proportion of their connections with lower speed (1 to 10 mbps) (See Graph 3). On the other hand, the ownership of electronic devices such as computers or cell phones reaches 62.6% of households and 89.3% of individuals, respectively.
5 The percentage changes correspond to the seasonally adjusted global supply and demand ( INDEC) series.
6 According to the Permanent Household Survey, employment reached around 13.2 million people in the first quarter of 2023, compared to 13.1 million in the fourth quarter of 2022. In the second quarter of this year, employment fell to 13.1 million (INDEC, Permanent Household Survey).
7 The indicator that was evaluated is the quotient between the number of people employed (EPH, INDEC) and the level of seasonally adjusted gross domestic product (INDEC). Between 2019 and the first half of 2023, the employment/output ratio grew at a rate of 2% per year.
8 The Wage Index (INDEC) was used and the series were deflated by the Consumer Price Index (INDEC). The salary of the registered sector increased 0.3% on average in the first half of 2023 compared to the second half of 2022. In the same period, wages in the unregistered private sector fell 6.6%. In the aggregate, the wage index showed a reduction of less than 1%.
9 See Monetary Policy Report for July 2023 (BCRA)
10 Financial Access Survey, 2022 Trends and Developments.
11 A sample of 85 countries that report financial infrastructure data to the IMF is considered.
12 See Financial Inclusion Report, second half of 2022, Graph 1.
13 As of June 2023, 99.6% of the ACSF corresponded to businesses in non-bank collection networks.
14 Data sent by the EEFF to the BCRA were used. Set (i) is made up of immediate transfers, ordinary (deferred) transfers, transfers of higher amounts and payment of services and taxes; (ii) is made up of fixed-term and fixed-term web and (iii) is made up of registration of personal, pledge and mortgage loans. The combination of channels and transaction types may involve different sets of EFS, as not all reporting EFFs offer all transactions through the channels considered.
15 See the sections on Account Holding, Electronic Payment Methods and Credit to Individuals.
16 Data to 2022, ITU.
17 In terms of speed, the minimum threshold recommended by the U.S. Federal Communications Commission for general Internet browsing and email usage is 1 mbps, while downloading high-definition video requires a minimum speed of between 5 and 8 mbps. Broadband Speed Guide.
18 ENACOM, Types of connection.
19 See Section 3 / Education, a key investment to take care of financial health, Financial Inclusion Report, April 2022, BCRA.
20 To promote financial inclusion, the BCRA carries out educational programs aimed at different audiences to promote the development of the financial health and capabilities of all people, prioritizing the most vulnerable sectors.
21 Given that as of the date of this publication, data by age group from the 2022 National Census of Population, Households, and Housing (INDEC) are not available, work continues with the projections of the 2010 Census. The indicators developed in this IIF in relation to the adult population should be taken as provisional until updated information from the last census is available. In this sense, the percentage of the adult population with at least one account shows a value of 100.4% in June 2023.
22 Opening refers to the net opening (or net increase) in the number of accounts (bank or payment), which arises from the difference between the number of new accounts that were opened and the number of accounts that were closed.
23 It should be clarified that, since several incomes are collected through bank accounts, the opening of accounts for these reasons could also occur.
24 An analysis of bilateral markets or platform economies can be found in Rochet and Tirole (2004).
25 As of June 2023, companies (for-profit entities) represent 82% while organizations (non-profit entities), 14.5%. It was not possible to determine the legal form of 3.5% of the E with accounts.
26 The transactions settled and cleared by COELSA consider debits and credits made through immediate transfers, payments with transfers (PCT), checks, direct debits, DEBIN and batch transfers (deferred). Immediate transfers include those that involve a CVU, at the origin and/or destination, and in the case of PCTs it does not include those interoperable that are managed by other Financial Market Infrastructures other than COELSA. Additionally, transfers that are cleared within each financial institution and intra-PSP PCTs are not included. Finally, transactions settled by the Link and Banelco networks, such as debit card payments and transfers between CBUs, are also not included in the indicator. Considering the number of operations, it is estimated that in the first half of 2023, COELSA was involved in 24% of operations.
27 This metric measures the proportion of account holders who registered at least one transaction in one of their accounts throughout the quarter.
28 Use of means of payment according to age. First report on indebtedness, gender and care in Argentina 2023. ECLAC and the Ministry of Economy of Argentina.
29 The youngest generations (18 to 29 years old) are the ones with the highest levels of internet (96.7%) and cell phone (97.8%) use. Middle-aged people (30 to 64 years old) register values of 93% and 97.2% respectively. While people aged 65 and over have the lowest figures (63.6% and 78.1%). INDEC, Access and use of information and communication technologies. EPH. Fourth quarter of 2022.
30 See First Report on Indebtedness, Gender and Care in Argentina. ECLAC
31 The numerator arises from dividing the amount sent through electronic means of payment (MPE) during the second quarter of 2023 by GDP at current values for the same period.
32 The amounts and amounts presented in this section refer to the monthly average within a six-month period.
33 Data available as of January 2016.
34 The amounts in this section are expressed at constant prices in June 2023 (CPI June 2023 = 100).
35 The term “instant payments” includes transfers and payments by transfer (PCT). It should be noted that money transfers can include operations that are not payments in themselves, since there is no consideration for a service or the delivery of a good in exchange. However, it is understood that these operations, although they exist, are not significant.
36 Ten business days for accreditation from May 2019 and then July 2021 between 8, 10 or 18 business days depending on the size of the company. In terms of costs, the commission ranged between 2.1% and 1.8% (current).
37 Monthly average within the aforementioned semester.
38 Source: INDEC. 24/08/23. Supermarket survey. Debit card participation went from 29% to 31%. “Other media” includes vouchers, coupons, basket tickets, gift cards, among others.
39 Made up of the countries that have data for all the variables used with the exception of the Netherlands (which has a particular configuration of MPE) and Saudi Arabia.
40 Last available period.
41 Based on the available data, the analysis includes all operations with MPE except for transfers from a CBU to a CVU (quantities and amounts) and interoperable PCTs (amounts) due to the lack of channel unbundling information. CBU to CVU transfers accounted for 2% and 5% of the amounts and 2% and 4% of the MPE amounts in the years 2021 and 2022, respectively. While interoperable PCTs represented 3% and 2% of the total amounts of MPE in those years.
42 This is an approximate exercise since some channels such as payment button / web could be executed through a browser from a cell phone.
43 The year 2022 is the latest data available.
44 Who have been displaced by other means when making transfers (see IIF, second half of 2022).
45 In the fourth quarter of 2022, 89.3% of the population aged 4 and over in urban agglomerations used cell phones, with an increase of 1.2 p.p. compared to the same period a year earlier. Source: INDEC: Access to and use of information and communication technologies. EPH. Fourth quarter of 2022. Fourth quarter of 2021.
46 See footnote 35.
47 It should be clarified that these transactions include movements of money that do not necessarily involve a payment. Based on the available data, it is not feasible to discriminate between remittances that do not constitute payments and those that do.
48 Transfers via mobile devices are estimated by adding CVU to CBU, CVU to CVU, intra PSP, and between EEFF operations via MB. This sum accounted for 82.7 p.p. of the 117.3% year-on-year rate of change.
49 PCTs are immediate transfers used to make a payment for the acquisition of a good and/or service with the participation of an acceptor. The acceptor offers merchants the tools to charge with this means of payment. PCTs have different commercial rules from the rest of the immediate transfers (Retail Payments Report, BCRA).
50 Interoperable PCTs are carried out between different PSPs/EEFF and include those initiated in interoperable QRs, in POS with card credentials, with random keys and payment button.
51 The amounts mentioned in this section are expressed at constant prices in June 2023 (INDEC CPI June 2023 = 100).
52 The balance is calculated as the sum of the balances of each of the savings and investment products at current values in the second quarter of 2023 and is divided by the GDP of the same quarter at current values.
53 The significant increase in the actual balances of PH DCFs could be attributed to the combination of successive increases in the monetary policy rate, the flexibility and liquidity provided by this financial vehicle, and the diversification of investments made by savers. The supply of available DCFs increased from 50 in December 2022 to 54 in June 2023.
54 DCFs are CRFs that are characterised by their high liquidity and very low volatility. These funds invest in very short-term assets, mainly fixed-term deposits, deposits in demand accounts, passes and guarantees. See CACFI Glossary.
55 Traditional fixed terms correspond to those that are contained in the OT of Time Deposits and Investments. Section 1, points 1.8 and 1.9.
56 The other CRFs have higher returns but also higher risk and lower liquidity. They can be fixed income (bonds), variable income (shares), mixed income, structured funds, among others. See Glossary, CAFCI.
57 Only accounts in pesos are considered.
58 See Number of holders of products offered by financial institutions, by entity group (BCRA). This variable also includes the fixed terms of legal entities
59 According to information received by the BCRA from the EEFFs, it is estimated that in the semester between September 2022 and February 2023, 87% of fixed terms in local currency were constituted through home-banking and mobile-banking. This proportion was higher than the 80% recorded in the semester between September 2020 and February 2021.
60 Corresponding to June 2023. Fixed Term Deposits of the Non-Financial Private Sector, Information on Financial Institutions, BCRA.
61 In national currency.
62 Data prepared on the basis of COELSA and the BCRA’s Information Regime for “Payment Service Providers”.
63 The SFA comprises financial institutions (EEFFs) and non-financial credit providers (NFCPs). Throughout the section, the metrics consolidate unique debtors within the vendor group that they base. Duplication caused by multiple funding lines within the same provider and by funding across different providers in the same analysis group is eliminated.
64 Credit providers are grouped into two large groups with differentiated characteristics: the BSE and the NFCPs. Among other factors, they are differentiated by the types of products offered, the documentation requirements, the cost and amount of financing, the way of managing credit (face-to-face or digitally) and business models. Both sets are under the regulatory orbit of the BCRA.
65 The amounts in this section are expressed at constant prices in June 2023 (CPI June 2023 = 100).
66 During the last quarter of 2022, a financial company merged with a private bank, resulting in a reduction in the number of debtors of financial companies and a modification of the average balance of this group.
67 In particular, this is explained by the emergence of Fintechs in the credit market, providers that have significantly increased their customer portfolio in recent years (see Report on Non-Financial Credit Providers).
68 According to the report “Information on Financial Institutions”, the percentage of debtors with debt between $10 and $25 million represented 1.03% of the people with financing in public banks and 16.3% of the financing portfolio of this same group of entities. In the case of private banks, these indicators fell to 0.21% in the case of the debtor portfolio and 4.84% of financing balances. On the other hand, the proportion of balances owed that were covered by guarantees was 63% for public banks and 30% for private banks. However, for the total balances, guarantees represented 28% of the loan portfolio of public banks and 11% in private banks.
69 Financial Inclusion Report, second half of 2022.
70 On the basis of the data available to date, it is not possible to determine whether the debt covered by the FF originated in the EEFF or in the PNFC. For this reason, the information of the debtors who only registered debt in FF as “Remainder” is presented and the debtors who registered debt in FF and EEFF to “EEFF Only”, those who registered debt in FF and PNFC to “PNFC Only” and those who registered debt in FF, EEFF and PNFC to “EEFF and PNFC” are added.
71 Along with the financial cost, other factors to consider that differentiate both sets of suppliers are the maximum amount offered and the term of the financing.
72 For this exercise, a sample of the 15 EEFF and 15 PNFCs that registered the largest number of debtors as of June 2023 and that, in addition, presented information related to personal loans in the aforementioned regulatory framework, was defined. This selection of 30 suppliers encompasses 81% of the debtors and 88% of the debt balance of EEFF and 74% of the debtors and 80% of the balance of PNFC in June 2023.
73 As of June 2023, the distribution of the country’s adult population was as follows: 51.6% females and 48.4% males. Source: INDEC. As of that date, the percentage of adult women with at least one EEFF funding was 36.2% and adult men with EEFF funding was 38.8%. For PNFC, the percentage of adult women with at least one financing was 29.9% and of adult men 28.7%.
74 As of June 2023, the distribution of the country’s adult population was as follows: between 15 and 24 years old 20%, from 25 to 34 years old 20%, from 35 to 49 years old 26%, over 50 years old 34%. Source: INDEC.
75 As of June 2023, the distribution of the country’s adult population was as follows: Centro: 65.1%, NOA 11.4%, NEA 8.9%, Cuyo 8.1%, and Patagonia 6.5%. Source: INDEC.
76 Promoting digital and innovative SME finance, GPFI, 2020.
77 Financial inclusion of small and medium-sized enterprises in Argentina, Sergio Woyecheszen, ECLAC, 2017.
78 Law 26.739 (28.03.12) amended the BCRA’s Charter and, among the changes introduced, established that the Board of Directors may “Establish differentiated policies aimed at small and medium-sized enterprises and regional economies” (cf. Art. 7 of said regulation). Over the years, the BCRA has implemented different specific regulations for this segment of companies, such as the Credit Line for Productive Investment (Com. A 5319 of 07.05.12), the Financing Line for Production and Financial Inclusion (Com. A 5874 of 12.31.15) and, more recently, the Financing Line for Productive Investment. On the other hand, the regulation of Mutual Guarantee Societies (SGRs) dates back to 1995 (Law 24,467 of March 1995), while the regulatory framework in competition of the BCRA dates back to 1996 (Com. A 2411 of 26.01.96). There is also regulation aimed at MSME credit prior to 1993. For example, Escudé et al. (2001) point out that until 1993 the BCRA established loan quotas that commercial banks had to assign to MSMEs (“MSMEs and the credit market in Argentina”, Working Paper No. 15, BCRA, July 2001).
79 Within the framework of the LFIP, 6 financing quotas were executed: (1) quota 1: from October 2020 to March 2021; (2) Quota 2: April 2021 to September 2021; (3) Quota 3: from October 2021 to March 2022; (4) Quota 4: from April 2022 to September 2022; (5) Quota 5: from October 2022 to March 2023; (6) Quota 6: from April 2023 to September 2023.
80 Corresponds to companies with MSME Registration in force on 30.06.23 (Open Data – MSME Registry).
81 The estimate of the MSMEs as a whole arises from netting the total number of economic units (2,189,472), the total number of non-profit organizations (76,084) since they are not included among the companies with the possibility of accessing the “MSME Certificate” and large for-profit companies because they are not part of the MSME concept (3,051). It should be noted that the criteria for classifying MSMEs into different sizes (micro, small and medium) is not symmetrical between the CNE and the MSME Certificate. While the CNE classifies based on the number of employees, the MSME Certificate classifies based on annual turnover.
82 Villar, L. (2020) Financing structure of companies in Argentina: influence of the size of the firm and the sector to which it belongs, LV Meeting of the AAEP.
83 The balances mentioned throughout the section on credit to productive units include financing in domestic currency and foreign currency and are expressed at constant prices (CPI June-23 = base 100).
84 The minimum cash requirements are around 30%, so that for every $100 pesos of deposits, $70 can be loaned, of which $7.5 must be allocated to MSMEs. The effective allocation, then, is around 10.7%.
85 The amounts mentioned in the section are expressed at constant prices of June 2023 (Indec CPI June 2023 = 100).
86 18.6% (monthly average of 2019) vs. 28.2% (average of the last 12 months).
87 “Working capital” includes advances, personal loans, credit cards, documents and discounts on securities; “Secured loans” includes pledge and mortgage loans; “Advanced loans” includes foreign trade lines and negotiable obligations and financial trust titles. The classification by assist group does not include assists with code ’99’.
88 Includes the balance granted to non-MSMEs within the framework of the LFIP.
89 Series average: 53%.
90 See Table 5 of the Financial Inclusion Report of April 2023.
91 The drop in the number of companies between the end of quota 2 (September 2021) and the beginning of quota 3 (October 2021) was concentrated in micro and small companies, both PH and PJ. In this period, a period of relaxation of social distancing measures began and, therefore, economic activity began to normalize. This factor could have influenced the decision not to renew the financing.
92 In the analysis of the history of events, it is common to consider both non-parametric descriptive models and semi-parametric transition rate models. In the course of the research we used both resorting, first, to the method of Kaplan and Meier, of a non-parametric type, and, second, to the Cox model, of a semi-parametric type.
93 Kaplan, E. L., and P. Meier. 1958. Nonparametric estimation from incomplete observations. Journal of the American Statistical Association 53: 457–481, Cox, D. R. 1972. Regression models and life-tables (with discussion). Journal of the Royal Statistical Society, Series B 34: 187–220 and Cox, D. R. 1975. Partial likelihood. Biometrika 62: 269–276.
94 Follow-up is carried out until the age of 16 because we have an observation window of only four years, so that, starting from the age of 13, we must conclude at the age of 17.
95 The set of variables whose impact was explored includes whether the account was opened in a financial institution (public or private) or in a payment service provider, certain characteristics of the locality in which the person opening the account resides (if its population is greater or less than 10,000 inhabitants, if it has a branch or ATMs of public or private banks) and attributes of the person (for example, the gender and age of the people).
96 The opening of accounts was also driven by public policies aimed at addressing the fall in the income of self-employed workers.
97 Hypothesis tests were used to test the hypothesis.
98 Electronic payments have advanced, but the use of cash still remains the main means of payment. In 2022, 59% of transactions at points of sale were made in cash in the Eurozone. In countries such as Italy, Spain and Germany, these figures reached 69%, 66% and 63%, respectively. Bank of Spain (2023) and European Central Bank (2022).
99 The survey stipulates three types of responses on the use of cash: (a) they use it regularly, (b) they use it little, and (c) they do not use it. First report on indebtedness, gender and care in Argentina. ECLAC and the Ministry of Economy of Argentina. 2023.
100 National Household Expenditure Survey 2017-2018. Income report. INDEC. June 2020.
101 According to Khiaonarong and Humphrey (2022), the value of cash withdrawals is an approximate indicator of the use of cash as a means of payment.
102 Based on prudential regulation, localities throughout the country are grouped into 6 categories according to the level of physical financial infrastructure and certain financial development indices (from I to VI, from highest to lowest level of infrastructure/financial development). The data on cash withdrawals are presented in 4 groups since the last 3 categories (from IV to VI) are aggregated in the same set.
103 There may also be differential behaviors based on other characteristics such as age range, educational level, and digital skills, among others. Based on the information available, this section mainly analyzes the variables related to formal labor insertion and the level of formal income.
104 Available for the June 2021 through December 2022 quarters.
105 Account holder activity measures the proportion of holders whose accounts recorded at least one transaction over the course of a quarter. These operations include debits made through immediate transfers, payments with online transfers, check transactions and direct debits, and correspond to transactions settled by COELSA. This indicator may be underestimated as it does not include other operations such as debit card payments and transfers that are not settled within the scope of COELSA.
106 See Digital Infrastructure in Section 1 of this report.
107 See, for example, Alonso, M., E. Gutiérrez, E. Moral-Benito, D. Posada, and P. Tello-Casas (2023). A Review of the various initiatives deployed at the national and international level to address the risks of financial exclusion, Occasional Document No. 2305, Bank of Spain.
108 TO Payment Service Providers.
109 What is an MSME?
110 Determination of the conditions of MSMEs. Point 1, BCRA.
111 See Glossary, CAFCI.
Share on


