Executive summary
• In September, the financial system’s intermediation activity with the private sector continued to increase, both in the segment in domestic and foreign currency. The real balance of financing to the private sector in pesos increased 0.5% in the month (47% YoY). Mortgage loans to households continued to gain dynamism, adding more than 4,700 new debtors to the financial system in the period (41,200 in the cumulative 12 months). The balance of credit to the private sector in foreign currency increased 3.2% in September (147.1% YoY).
• The real balance of private sector deposits in pesos increased 2.4% in September (17.1% YoY). Interest-bearing demand accounts grew 6.4% in real terms in the month and time deposits increased 3.7% in real terms in the period. Demand deposits in pesos without remuneration fell 1.1% in real terms in September. The balance of private sector deposits in foreign currency increased 5.2% compared to August (7.9% YoY).
• In September, the non-performing loan ratio to the private sector stood at 4.2%, increasing 0.4 p.p. compared to the previous month. The non-performing loan ratio to households reached 7.3% of this portfolio and that corresponding to financing to companies stood at 1.7%. For their part, the total forecasts of the institutions as a whole were equivalent to 102% of the balance of credit in an irregular situation and 4.2% of the total balance of credit to the private sector.
• The financial system’s ample liquidity in national currency did not change in magnitude between the end of the month, remaining at around 39.8% of deposits in this denomination. Availabilities in pesos represented 15.8% of deposits in national currency in the period (-2.1 p.p. monthly). For its part, in September, liquidity for the segment in foreign currency was equivalent to 60% of the segment’s deposits at the systemic level (+4.4 p.p. monthly).
• The sector continued to exhibit high solvency indicators. As of September, capital integration (RPC) in terms of risk-weighted assets (RWA) totaled 27.1% for all financial institutions, above the records observed in the region’s financial systems. In the period, the capital position (integration minus demand) of the financial system stood at 234% of the regulatory requirement and 31.4% of credit to the private sector (net of forecasts). The leverage ratio – according to Basel Committee guidelines – of the group of entities reached 18.9% at the end of the third quarter, well above the regulatory minimum (3%).
• Over the past 12 months, the total comprehensive results for the financial system were equivalent to 0.3% of assets and 1.4% of NP, levels lower than those recorded a year ago.
I. Financial intermediation activity
The intermediation activity of the financial system with the private sector increased during September, both in the segment in domestic and foreign currency. When analyzing the most relevant movements – in homogeneous currency – of the aggregate bank balance in pesos, the main sources of funds in the month were the increase in private sector deposits and the reduction in liquid assets. On the other hand, the most outstanding applications of resources in the period were the increase in credit to the private sector, the decrease in net worth and deposits of the public sector. Regarding foreign currency items, between the end of the month, the growth in financing to the private sector and liquidity stood out, movements funded mainly by the increase in private sector deposits.
In September, the real balance of credit to the private sector in national currency increased by 0.5% compared to August (see Graph 1; 47% y.o.y.). The monthly performance was heterogeneous among the credit lines when considering real variations in balances: loans with real collateral increased in the period (3.2%), consumer lines did not present variations in magnitude, while commercial loans decreased slightly (-0.7%).
Graph 1 | Real balance of credit to the private sector in pesos*
Monthly changes

Chart 2 : Foreign currency financial intermediation to the private sector
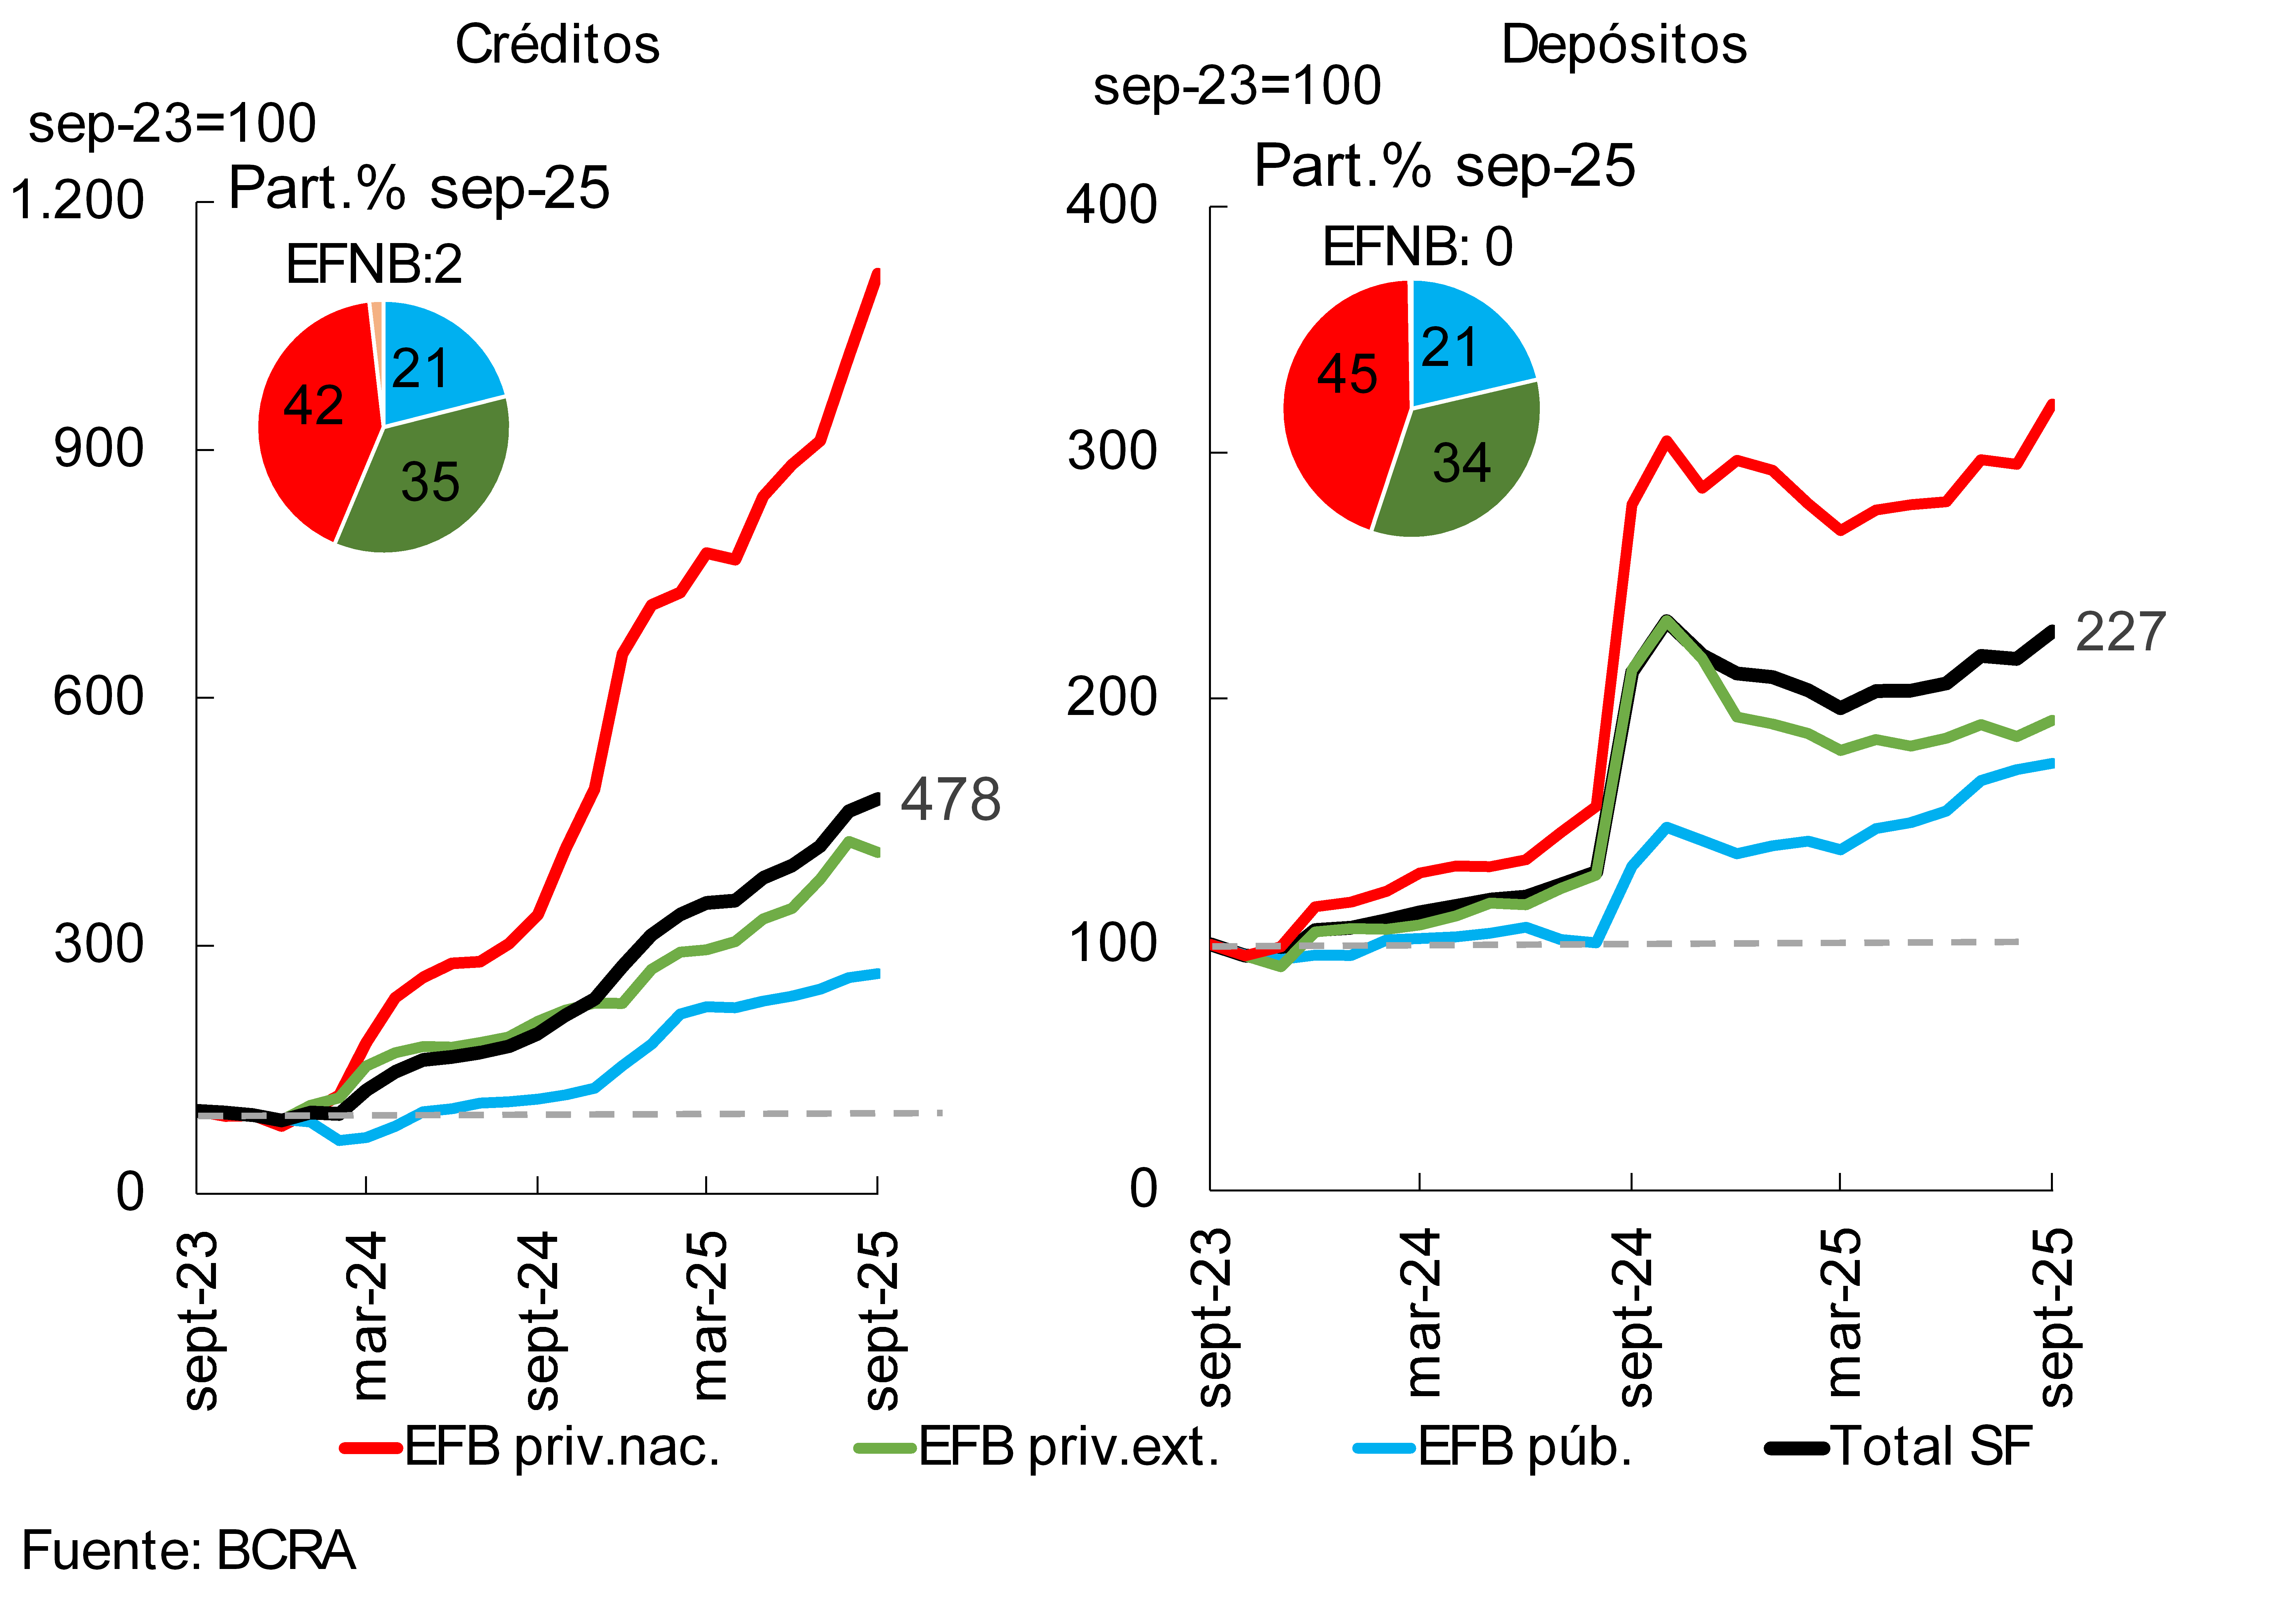
In relation to the foreign currency segment, in September the balance of credit to the private sector grew 3.2% – in currency of origin – (147.1% YoY; see Figure 2). During the last twelve months, national private banks led the increase in loans in foreign currency.
When considering the segment in domestic and foreign currency together, the total balance of credit to the private sector increased 1.3% in September. The monthly increase was reflected both in the household segment (with greater relative dynamism in pledge and mortgage lines) and in the corporate segment (driven mainly by the industry and primary production sectors).
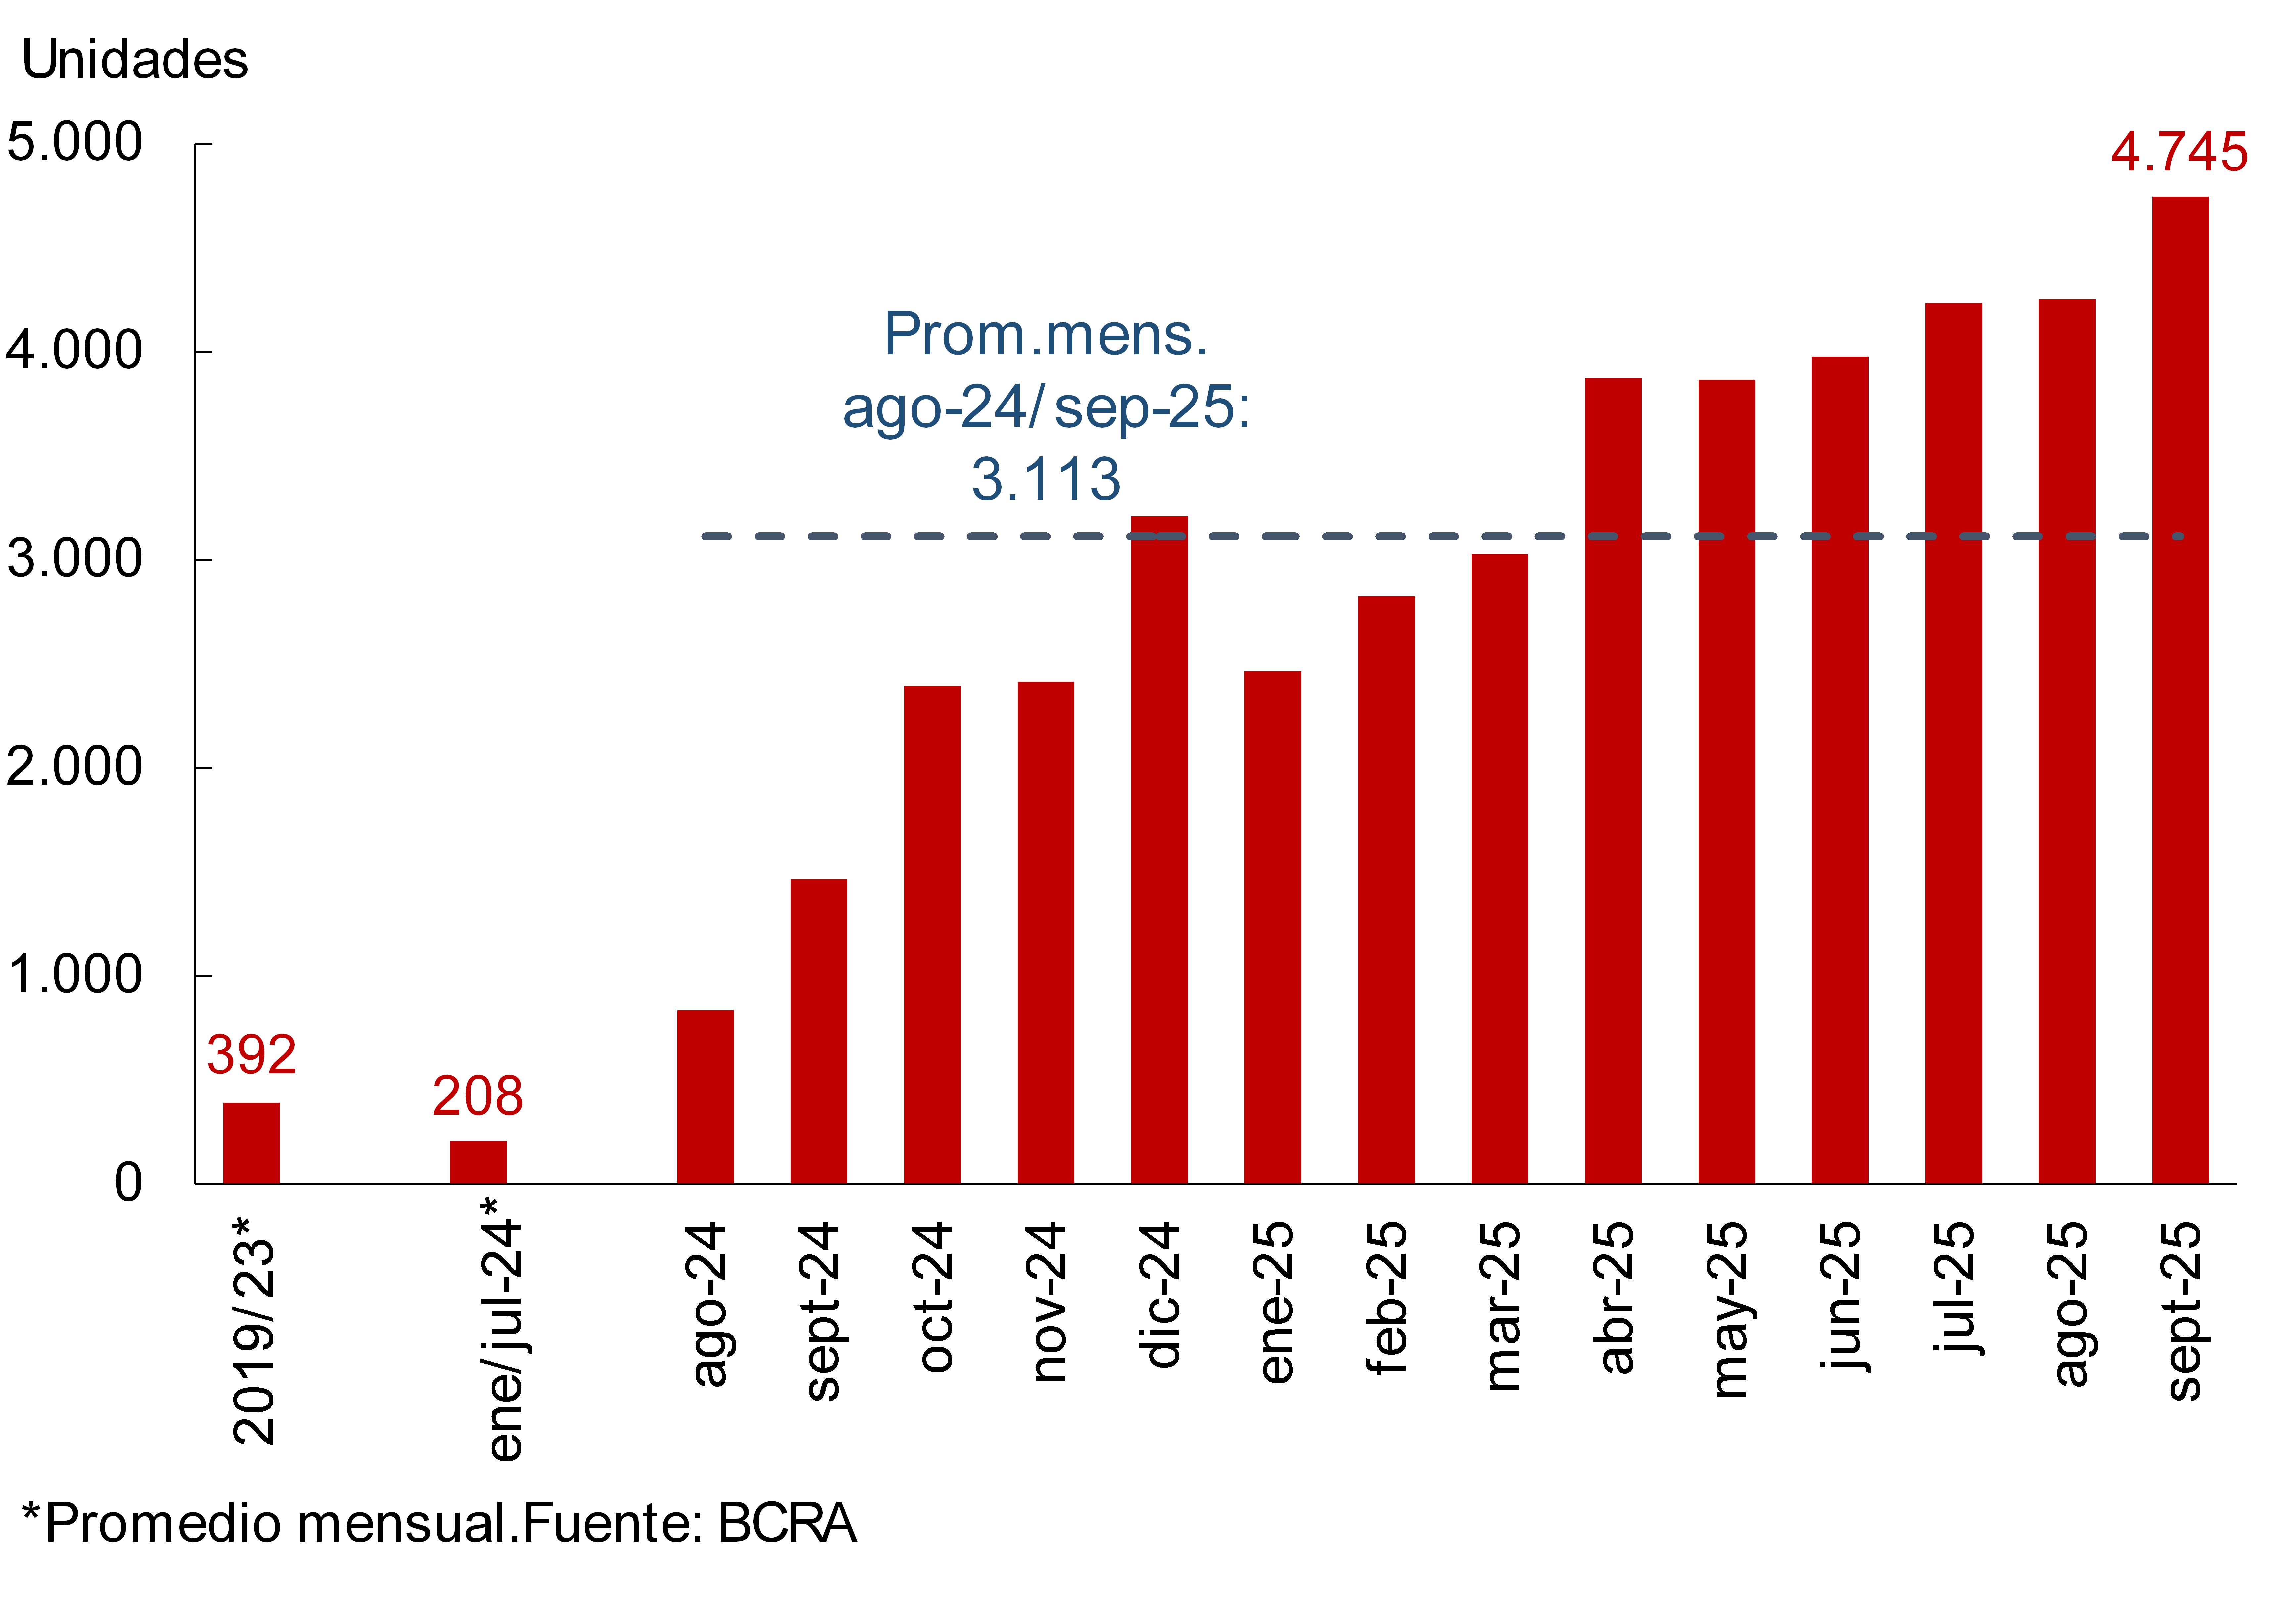
In September, mortgage lines for families continued to gain momentum. In the month, it is estimated that more than 4,700 new mortgage borrowers (registrations of individuals) were added to the financial system, increasing 11.6% compared to August (see Graph 3). In the accumulated of the last 12 months, the total number of new mortgage debtors exceeded 41,200.
Graph 3 | Estimation of mortgage registrations (individuals)
Financial system
Graph 4: Real balance of private sector deposits in pesos*.

The balance of private sector deposits in pesos increased 2.4% in real terms between the end of the month (17.1% y.o.y. in real terms; see Graph 4), with greater relative dynamism in foreign public and private banks. Interest-bearing demand deposits grew 6.4% in real terms in September, while non-interest-bearing deposits fell by 1.1% in real terms. For its part, the real balance of time deposits increased 3.7% compared to August, mainly explained by fixed-rate fixed-rate deposits of legal entities that are providers of financial services.
As for the foreign currency segment, in September the balance of private sector deposits increased by 5.2% – in source currency – (7.9% YoY; see Figure 2). Deposits in this denomination in national private banks showed the highest relative growth in the period. The real balance of total deposits (covering all sectors and currencies) increased 2.7% in September (growth of 15.5% YoY).
II. Evolution and aggregate composition of the balance sheet
In September, the total assets of the financial system grew 1.6% in real terms compared to the end of August. In the year-on-year comparison, the assets of the financial institutions as a whole expanded 13% in constant currency. Both public and private banks – national and foreign – showed real growth in their assets in the last 12 months.
During September, there were few changes in the composition of assets and total funding of all financial institutions. Considering the composition of total assets, compared to August, the share of current accounts in foreign currency that entities maintain in the BCRA increased slightly (see Graph 5), while the relative weight of credit in pesos to the private sector and current accounts in the same denomination in the BCRA decreased. Regarding aggregate funding, between the end of August and September, the share of private sector deposits in foreign currency increased slightly (see Chart 5), while net worth decreased in its relevance in the total.
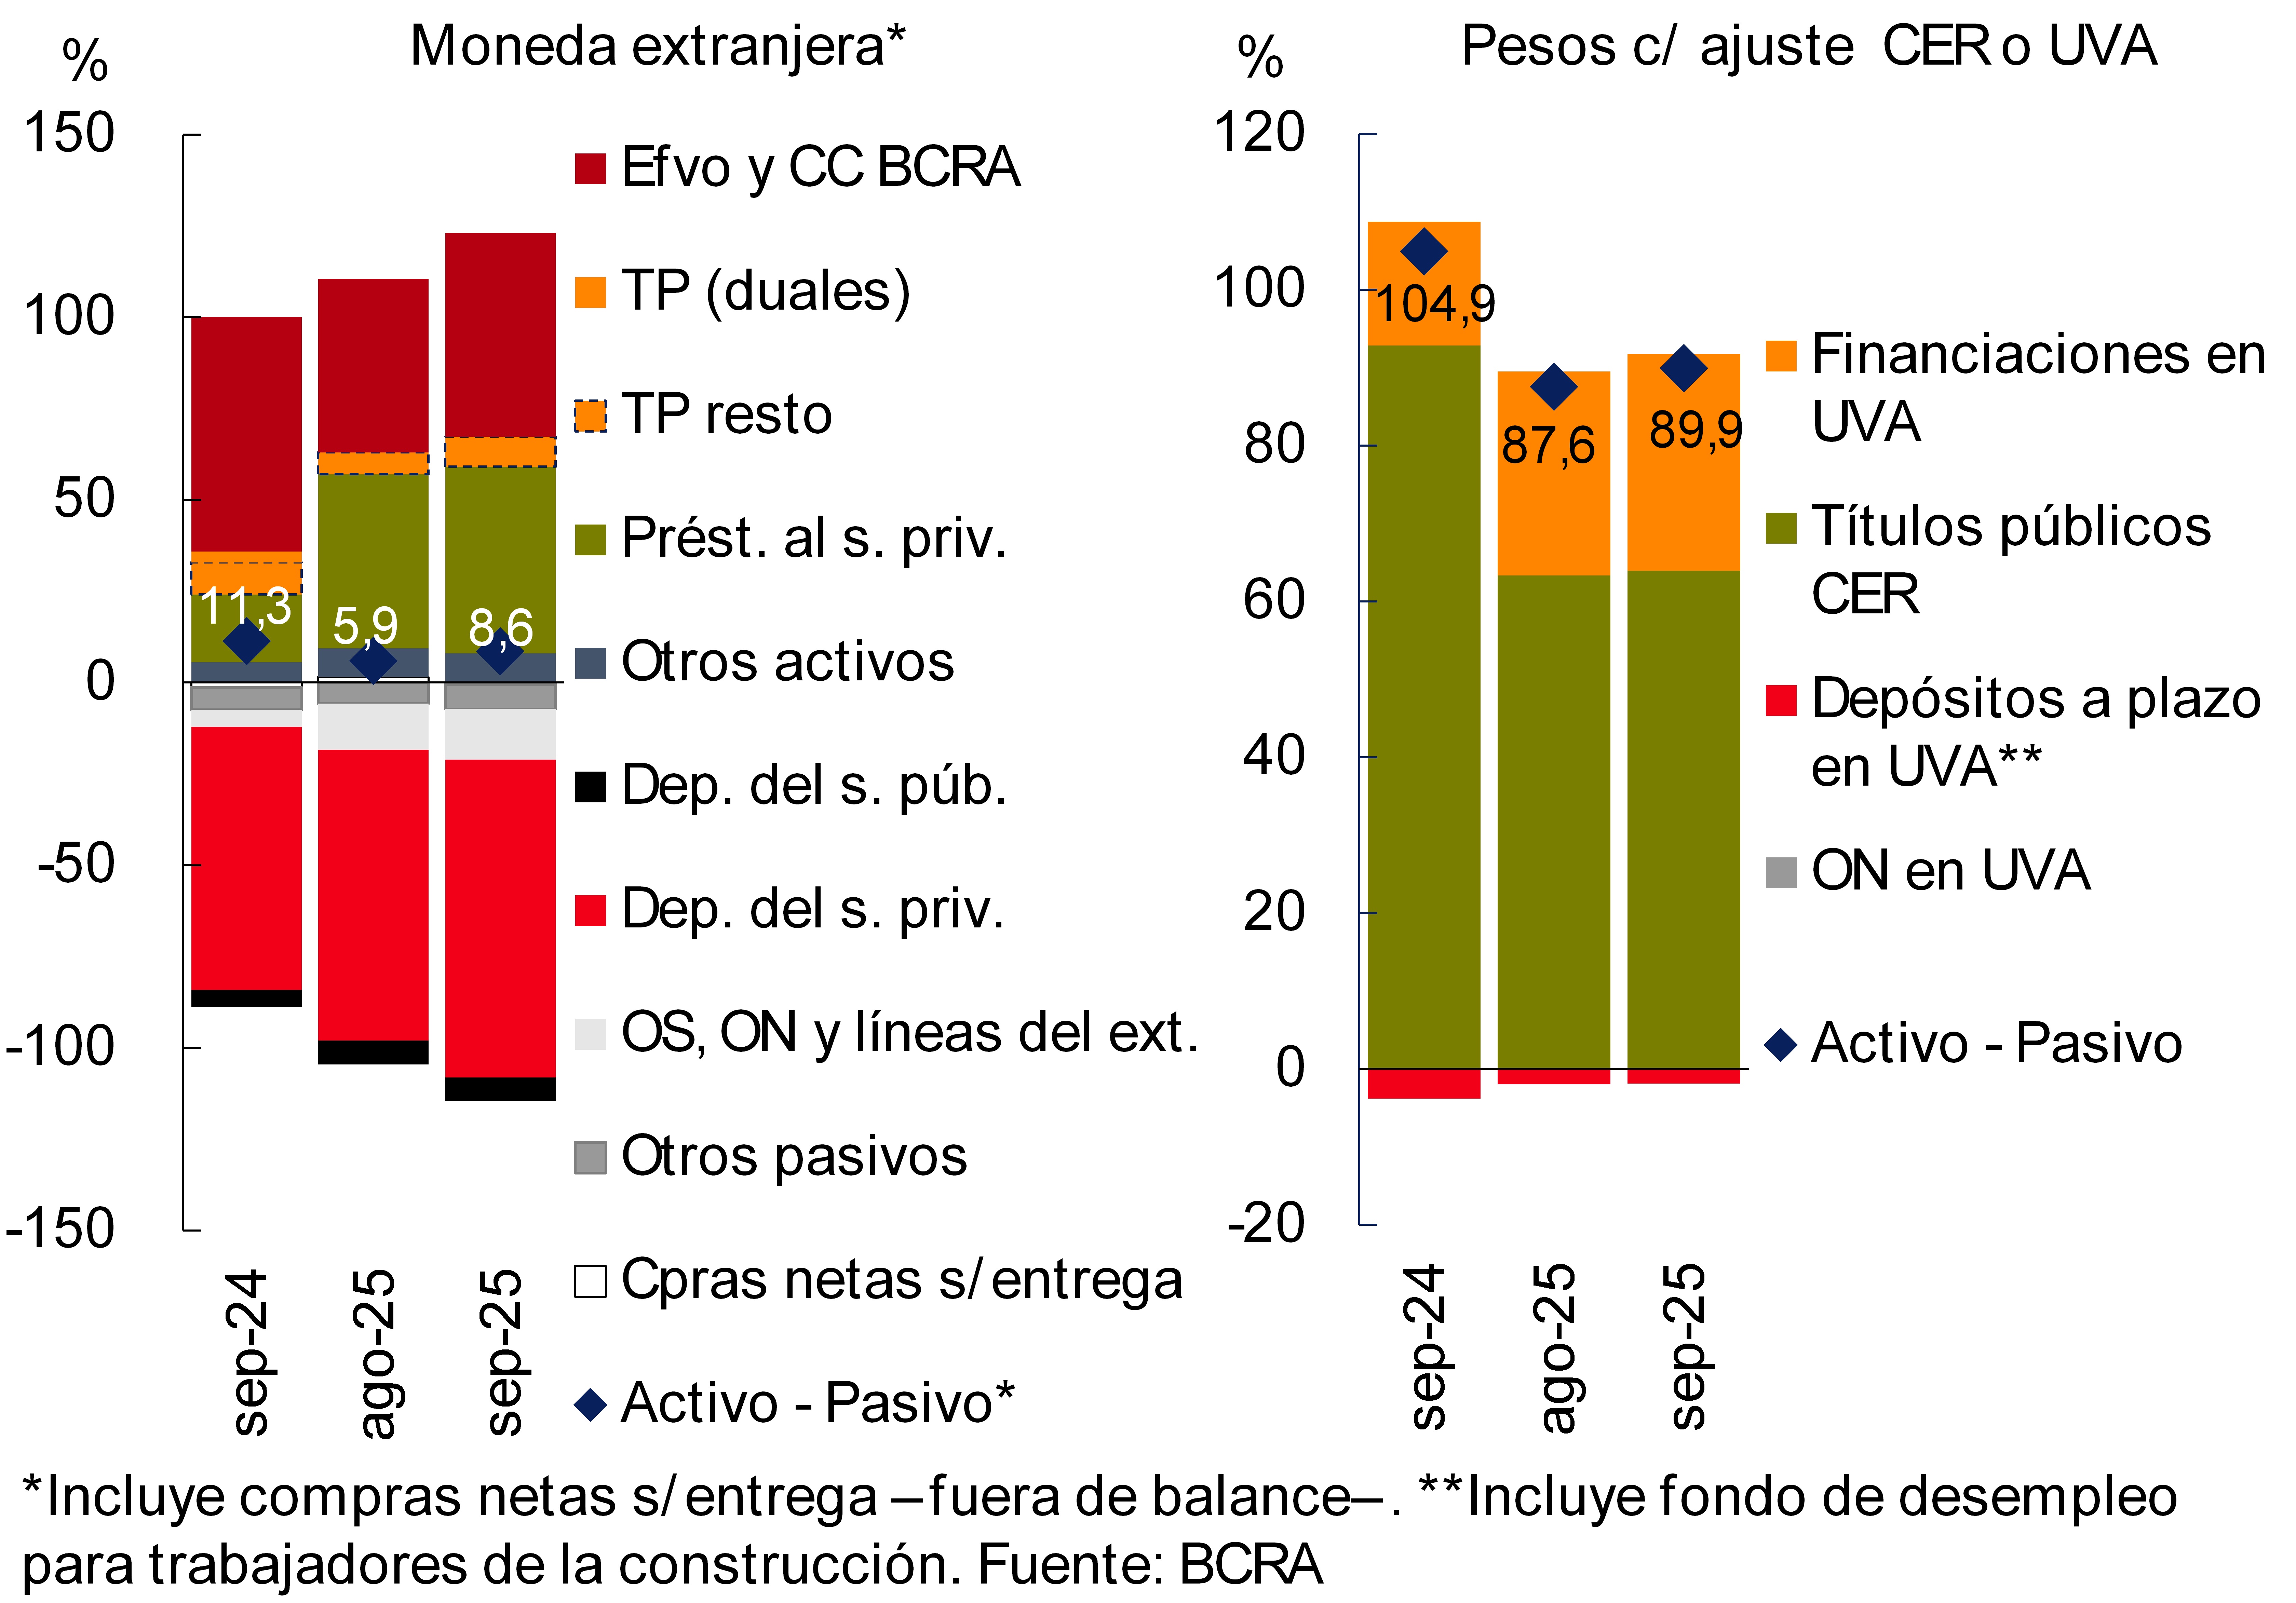
In September, the estimated spread between assets and liabilities denominated in foreign currency – considering off-balance sheet foreign currency purchase and sale transactions – increased by 2.7 p.p. of regulatory capital (CPR) to 8.6% (-2.7 p.p. y.o.y., see Chart 6). On the other hand, in the segment of items adjustable by CER or denominated in UVA, the aggregate differential between assets and liabilities increased slightly during the month in the context of the growth of mortgage loans in UVA (see previous section), standing at 89.9% of the PRC of the financial system (-15 p.p. y.o.y., see Chart 6).
Chart 5 – Composition of assets and funding
Financial system – In % share

Graph 6 | Spread between assets and liabilities
In % of the PRC – Financial system
III. Portfolio quality
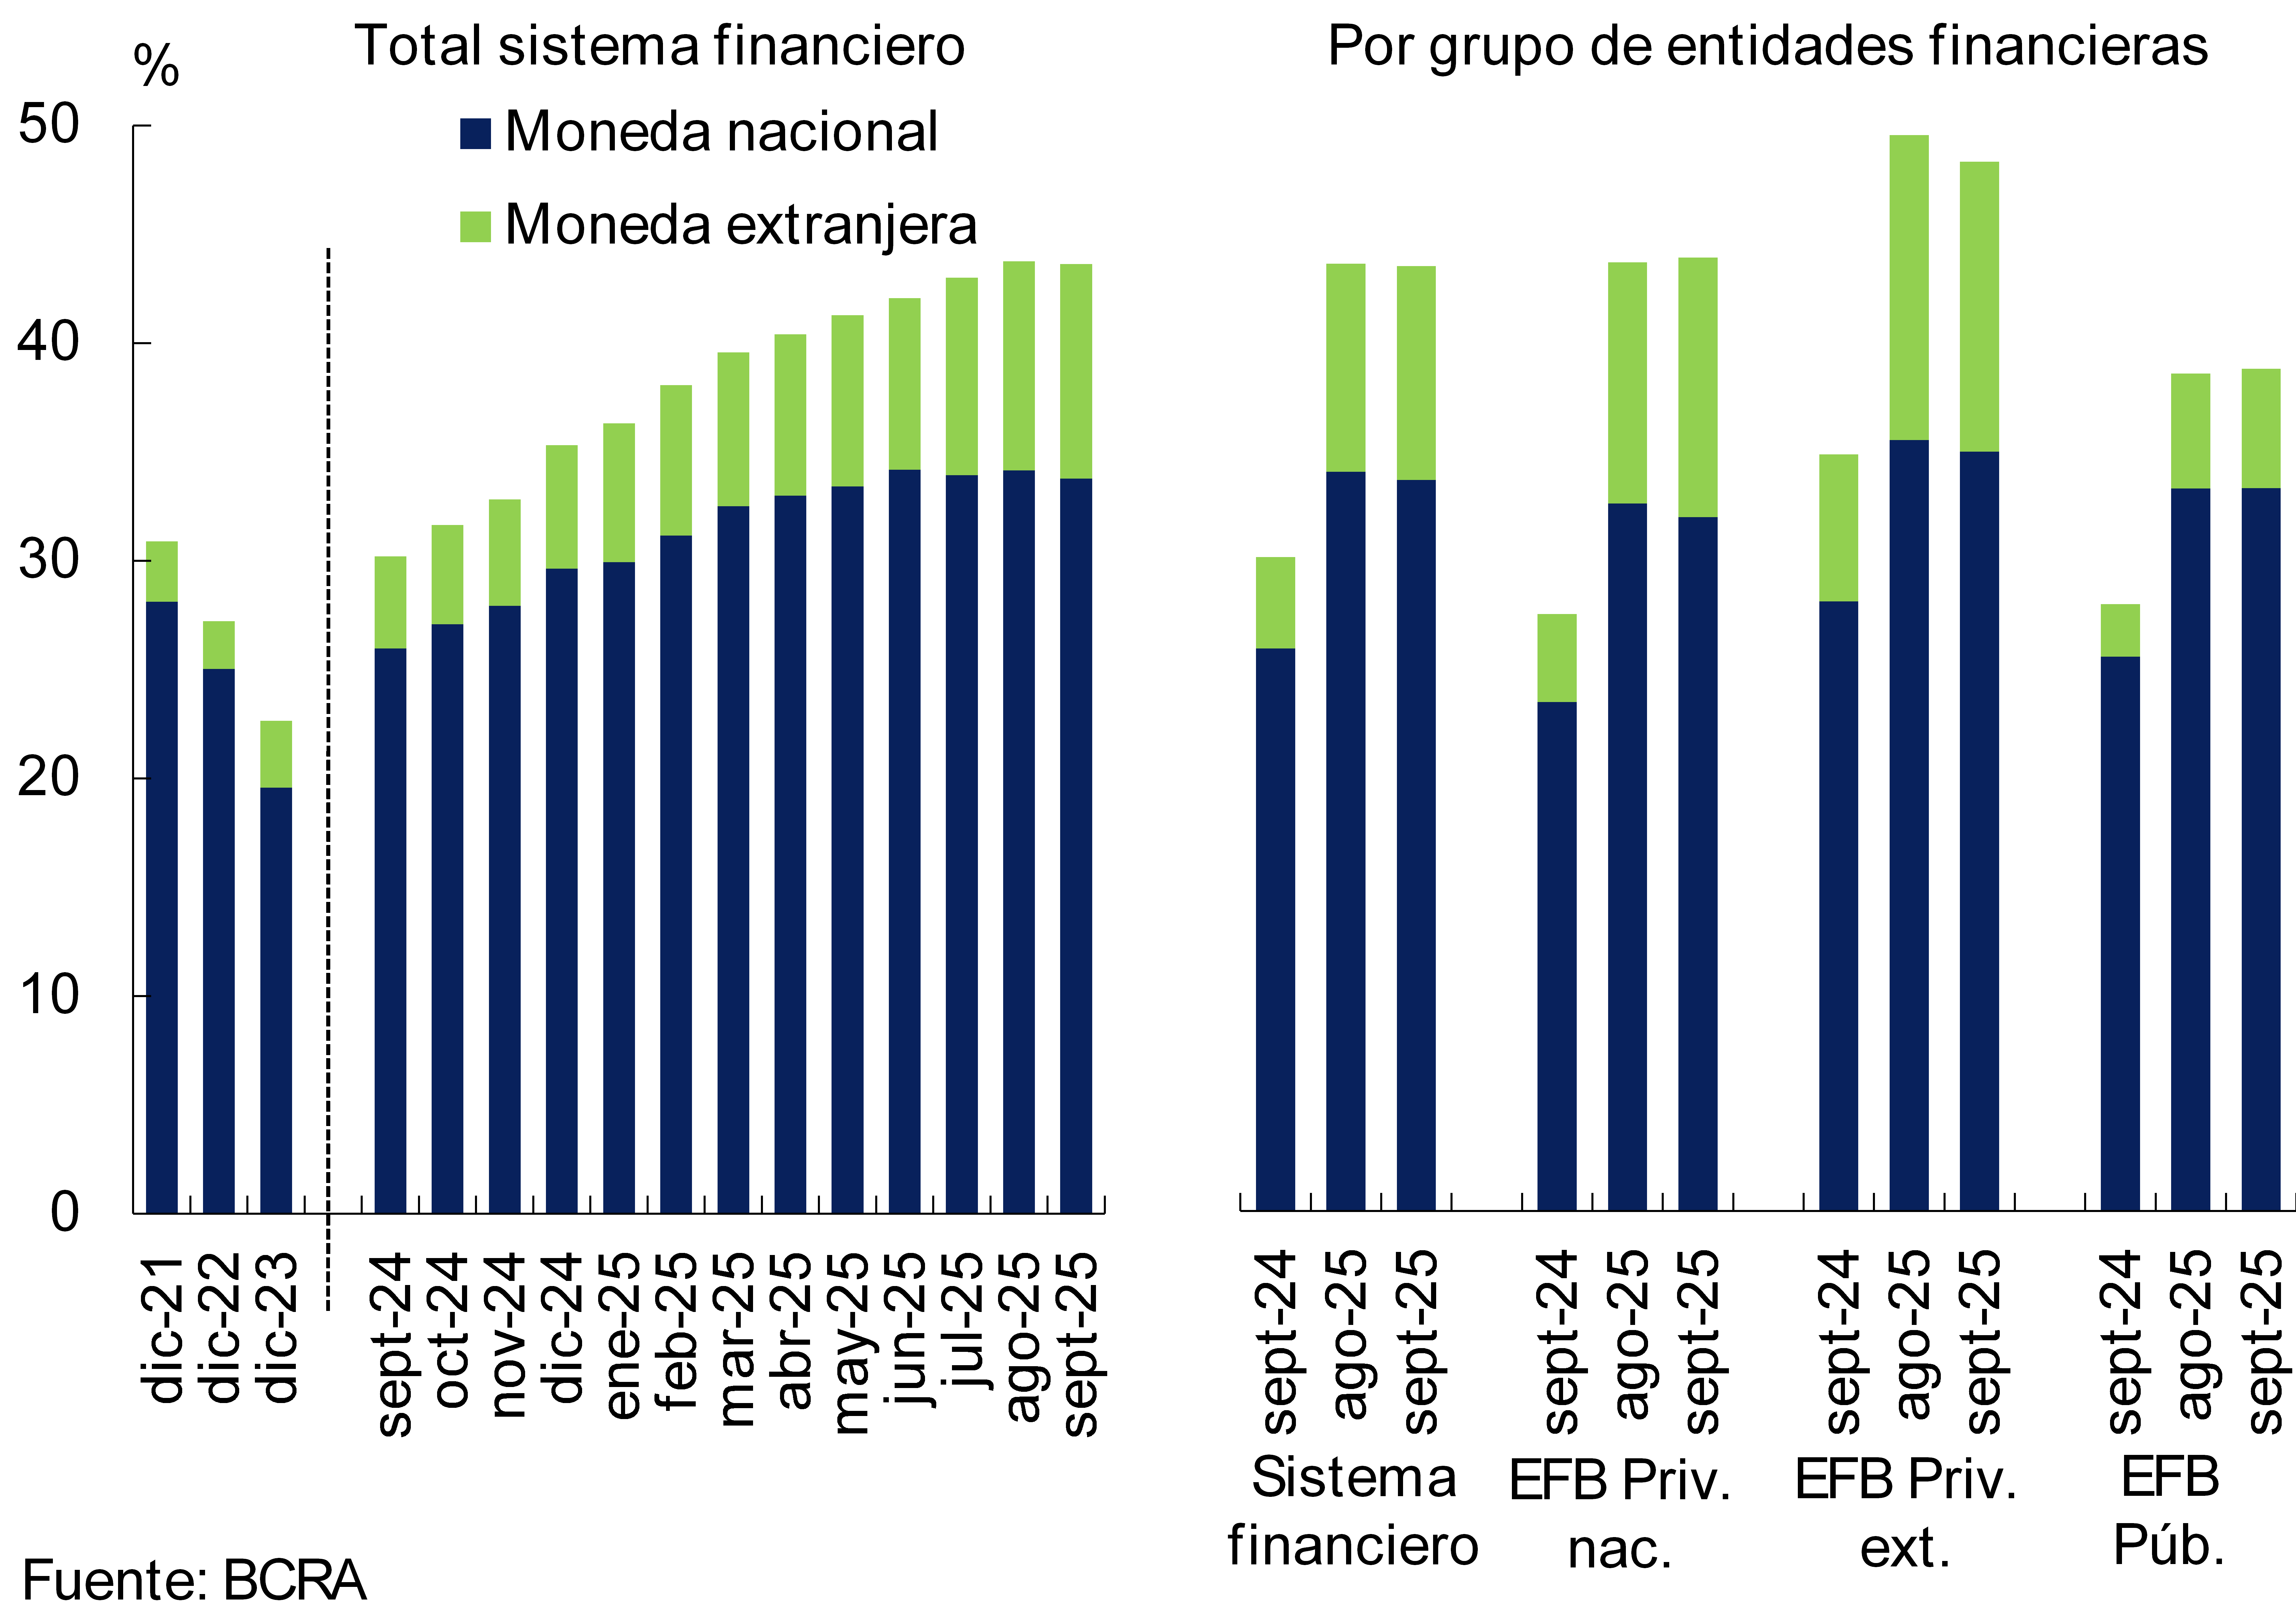
In September, the financial system slightly reduced its credit exposure to the private sector. This monthly performance was mainly explained by foreign private banks and by the segment in national currency. In the month, financing in pesos stood at 33.8% of assets, while the ratio between loans in foreign currency and total assets totaled 9.9%. In the year-on-year comparison, credit to the private sector accumulated an increase of 13.4 p.p. in assets (7.8 p.p. for the segment in pesos and 5.6 p.p. for items in foreign currency, see Chart 7). When disaggregated by type of debtor, the share of loans to companies within the total assets of the financial system stood at 23.9% in September, while credit to households accounted for 19.8% of assets.
Figure 7 | Balance of credit to the private sector in terms of assets
Financial system
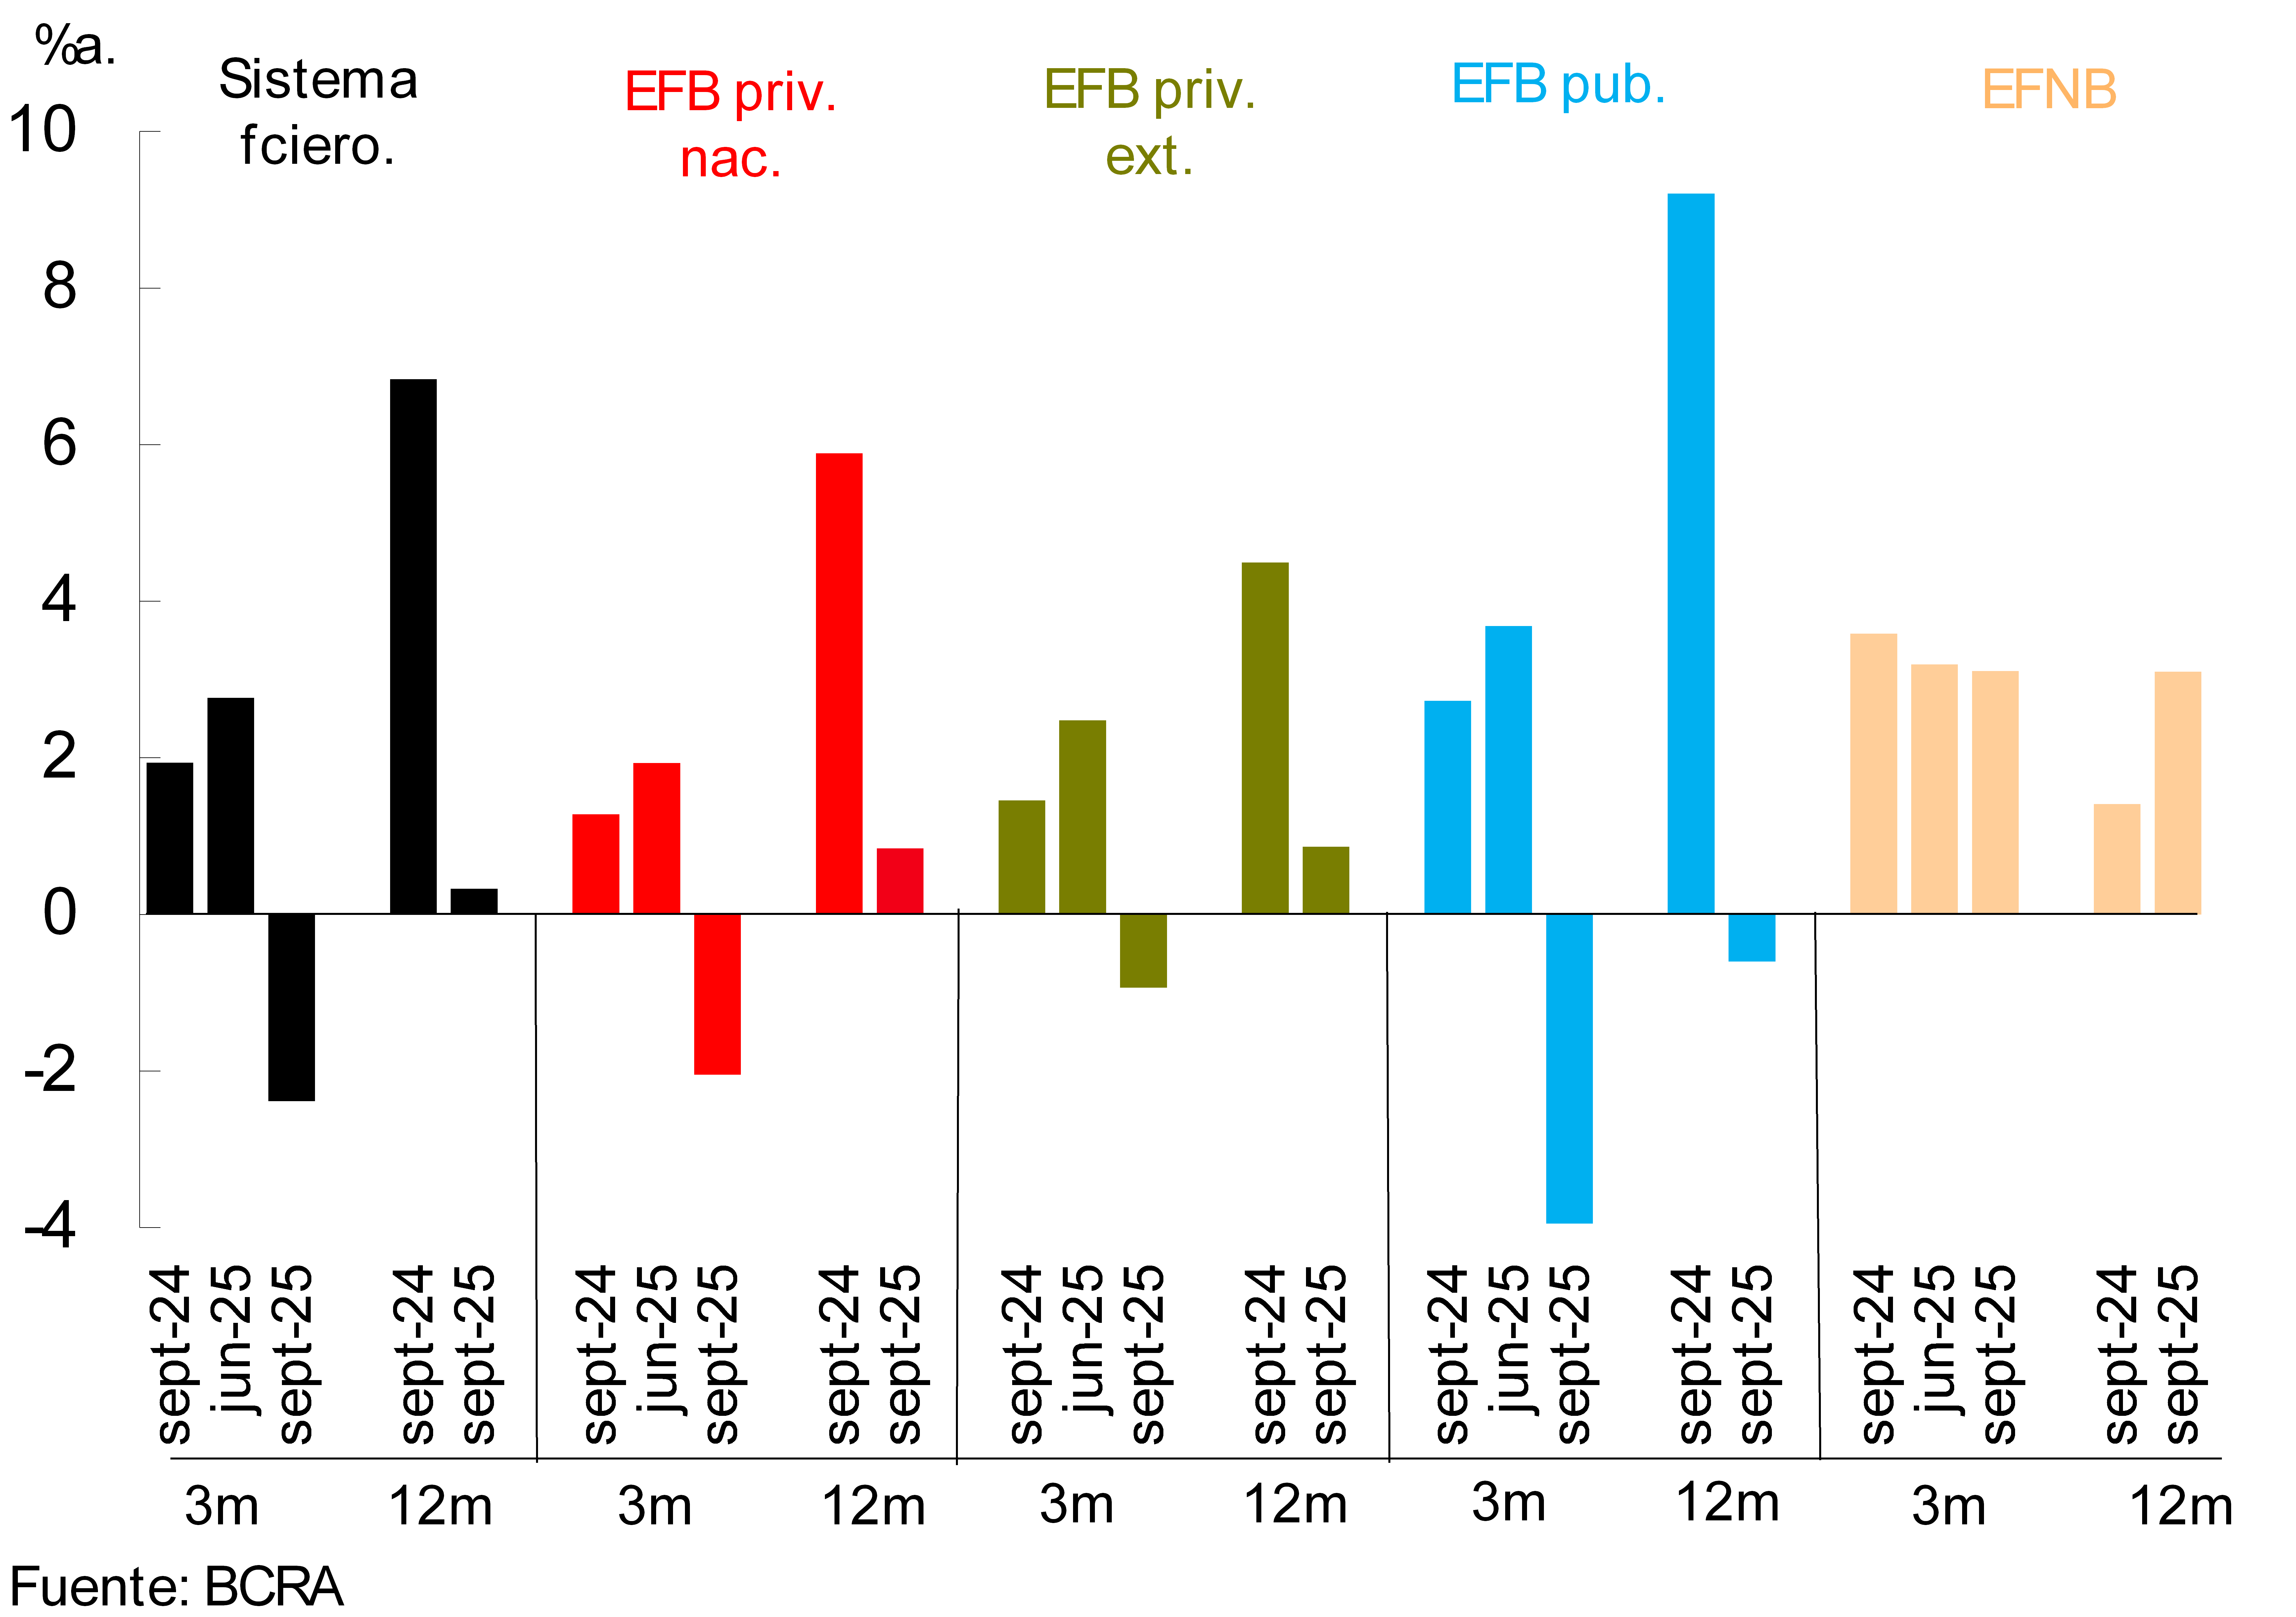
In September, the irregularity ratio of credit to the private sector reached 4.2% at the systemic level, increasing 0.4 p.p. in the month. The performance of this indicator was generalized among the different groups of financial institutions (see Graph 8). Considering the type of debtor, non-performing loans to households totaled 7.3% of the portfolio allocated to this segment, while the indicator corresponding to financing to companies stood at 1.7% in the period.
Chart 8: Private sector credit irregularity ratio
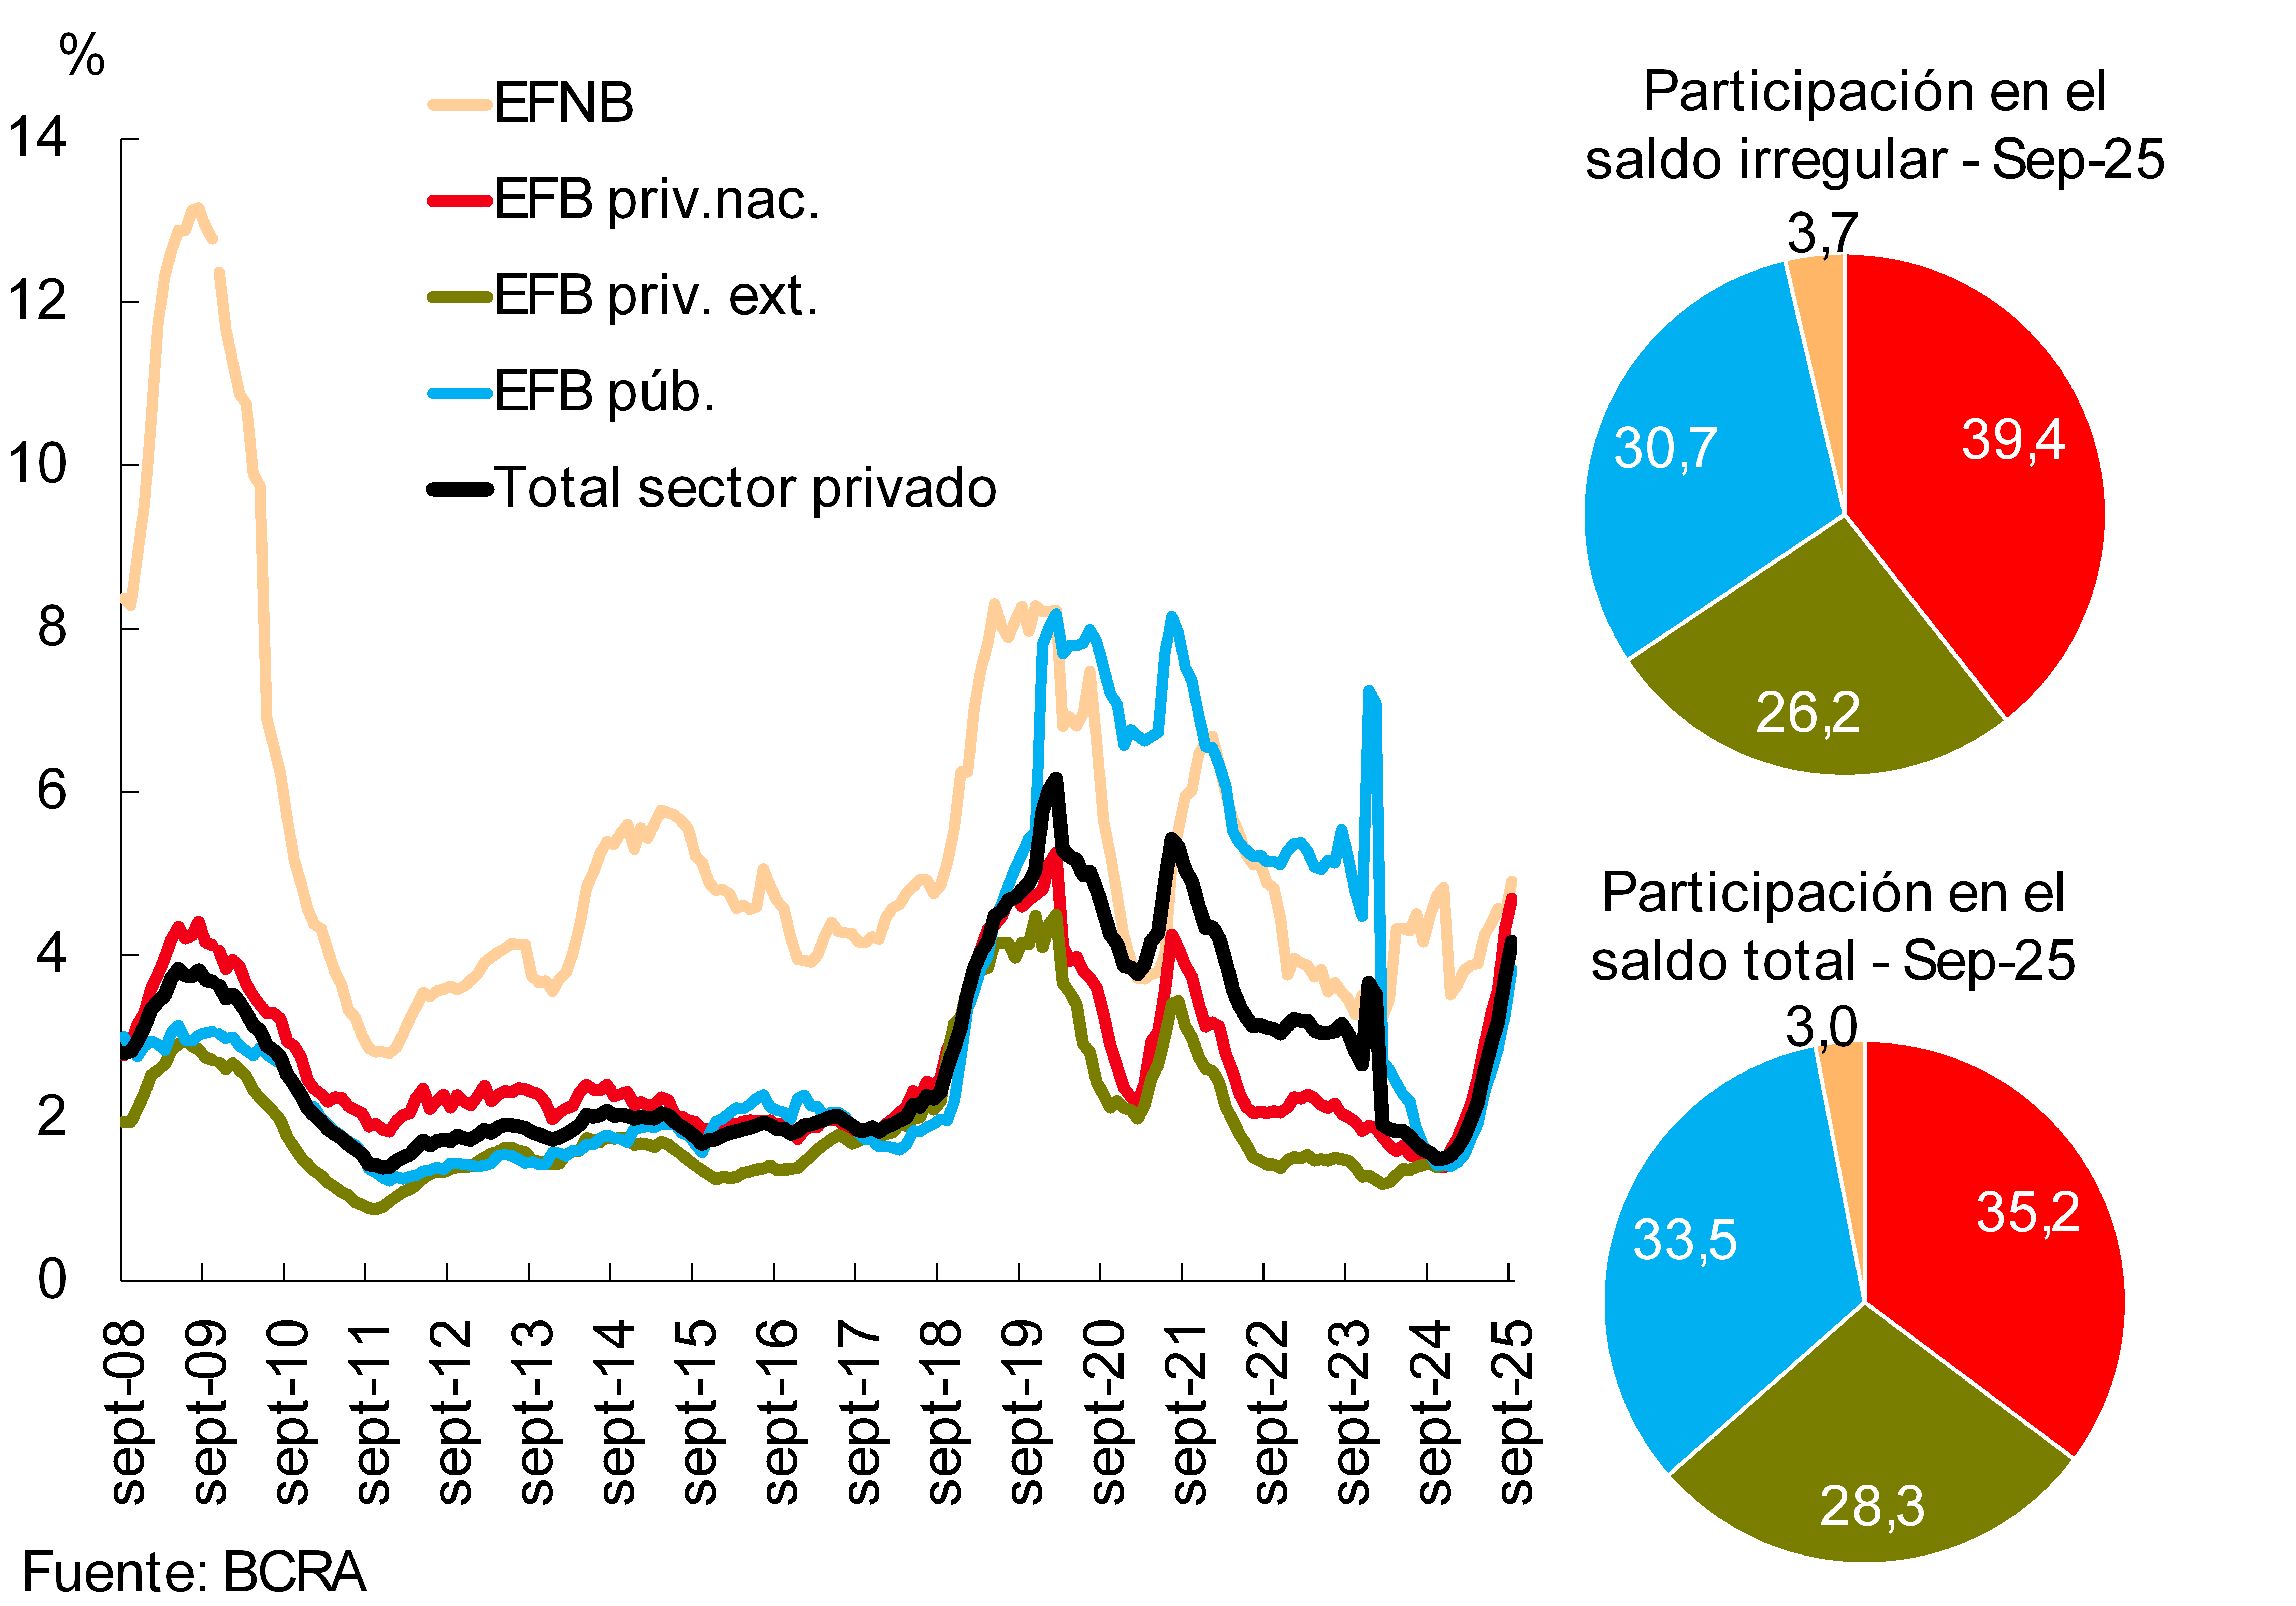
The total forecast balance of all financial institutions was equivalent to 102% of financing in an irregular situation (6.2 p.p. less than in August). Considered in terms of the total portfolio to the private sector, the total forecasts amounted to 4.2% in the period (0.2 p.p. more than in the previous month).
IV. Liquidity and solvency
The financial system’s ample liquidity1 in national currency did not change in magnitude between the end of the month, remaining at around 39.8% of deposits in this denomination (see Graph 9). Considering only the availabilities in pesos, in September the liquidity ratio totaled 15.8% of the deposits of this segment at the systemic level (-2.1 p.p. monthly). For its part, in September, liquid assets in foreign currency grew by 4.4 p.p. from deposits arranged in foreign currency to 60%.
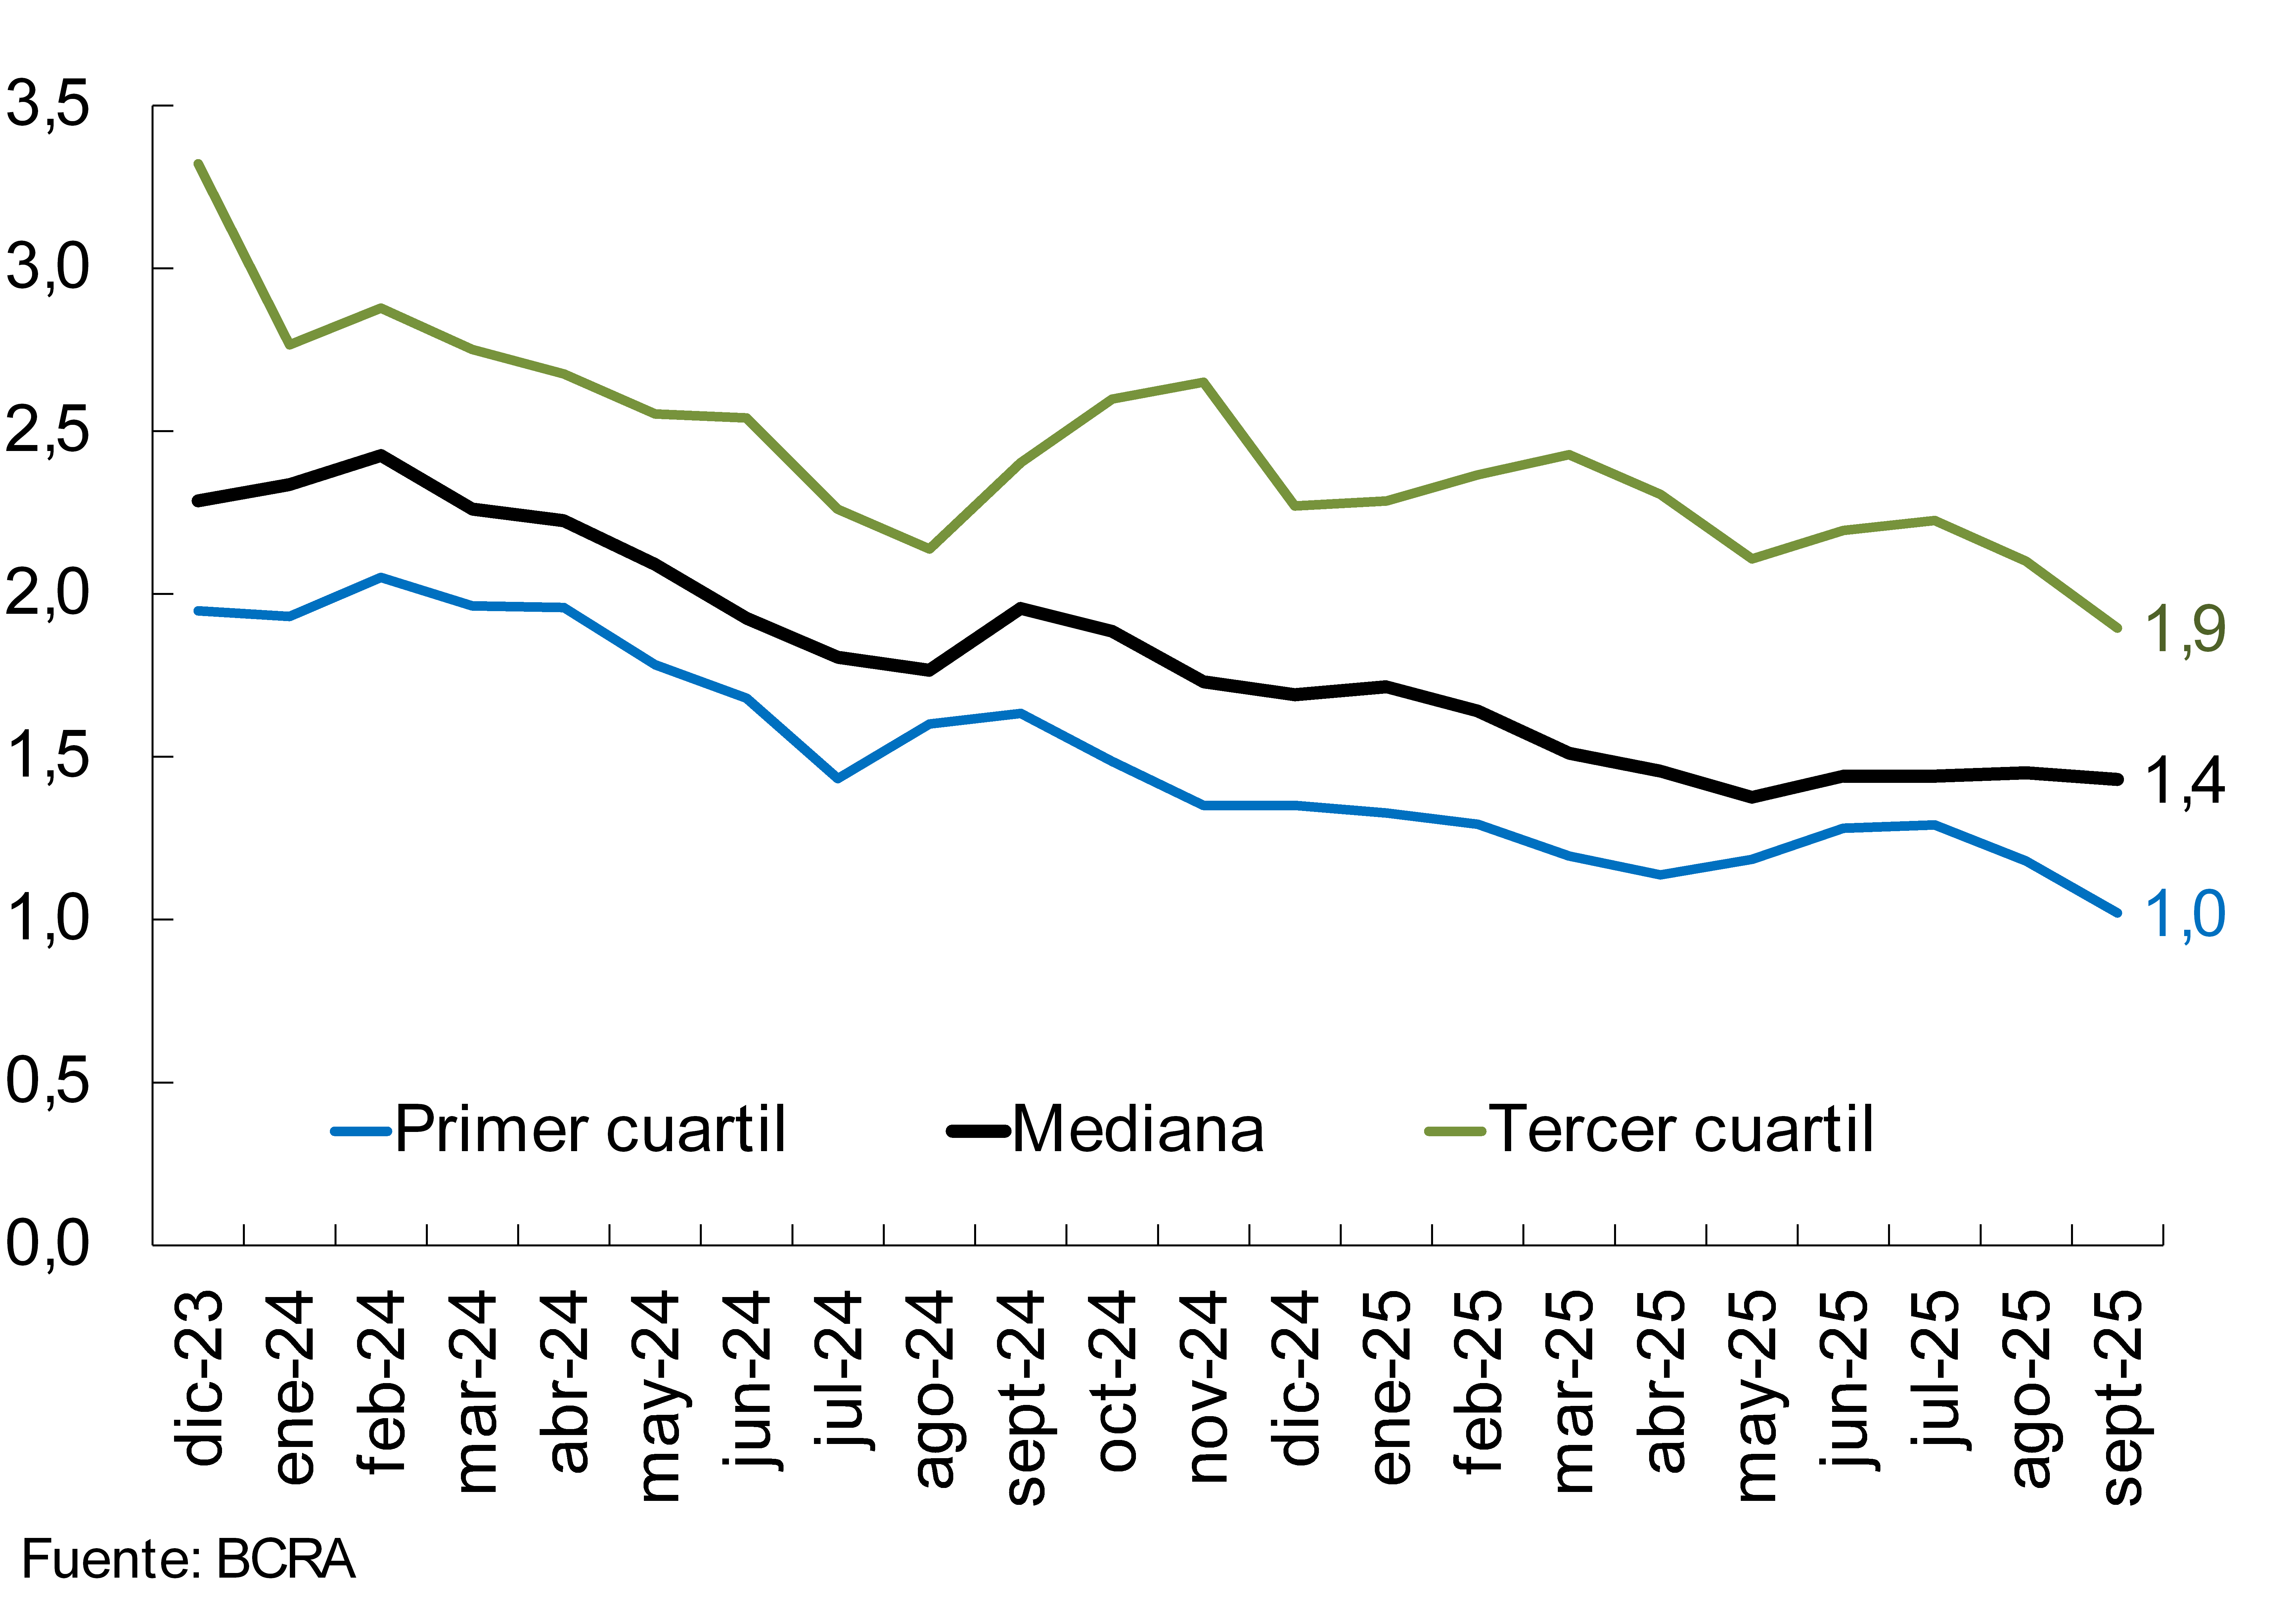
The liquidity coverage ratio (LCR; items in domestic and foreign currency) did not show significant changes in September, remaining at around 1.4 (for the median of banks obliged to verify it (Group A), see Chart 10).
Figure 9 | Liquidity
indicators As a % of deposits in each denomination
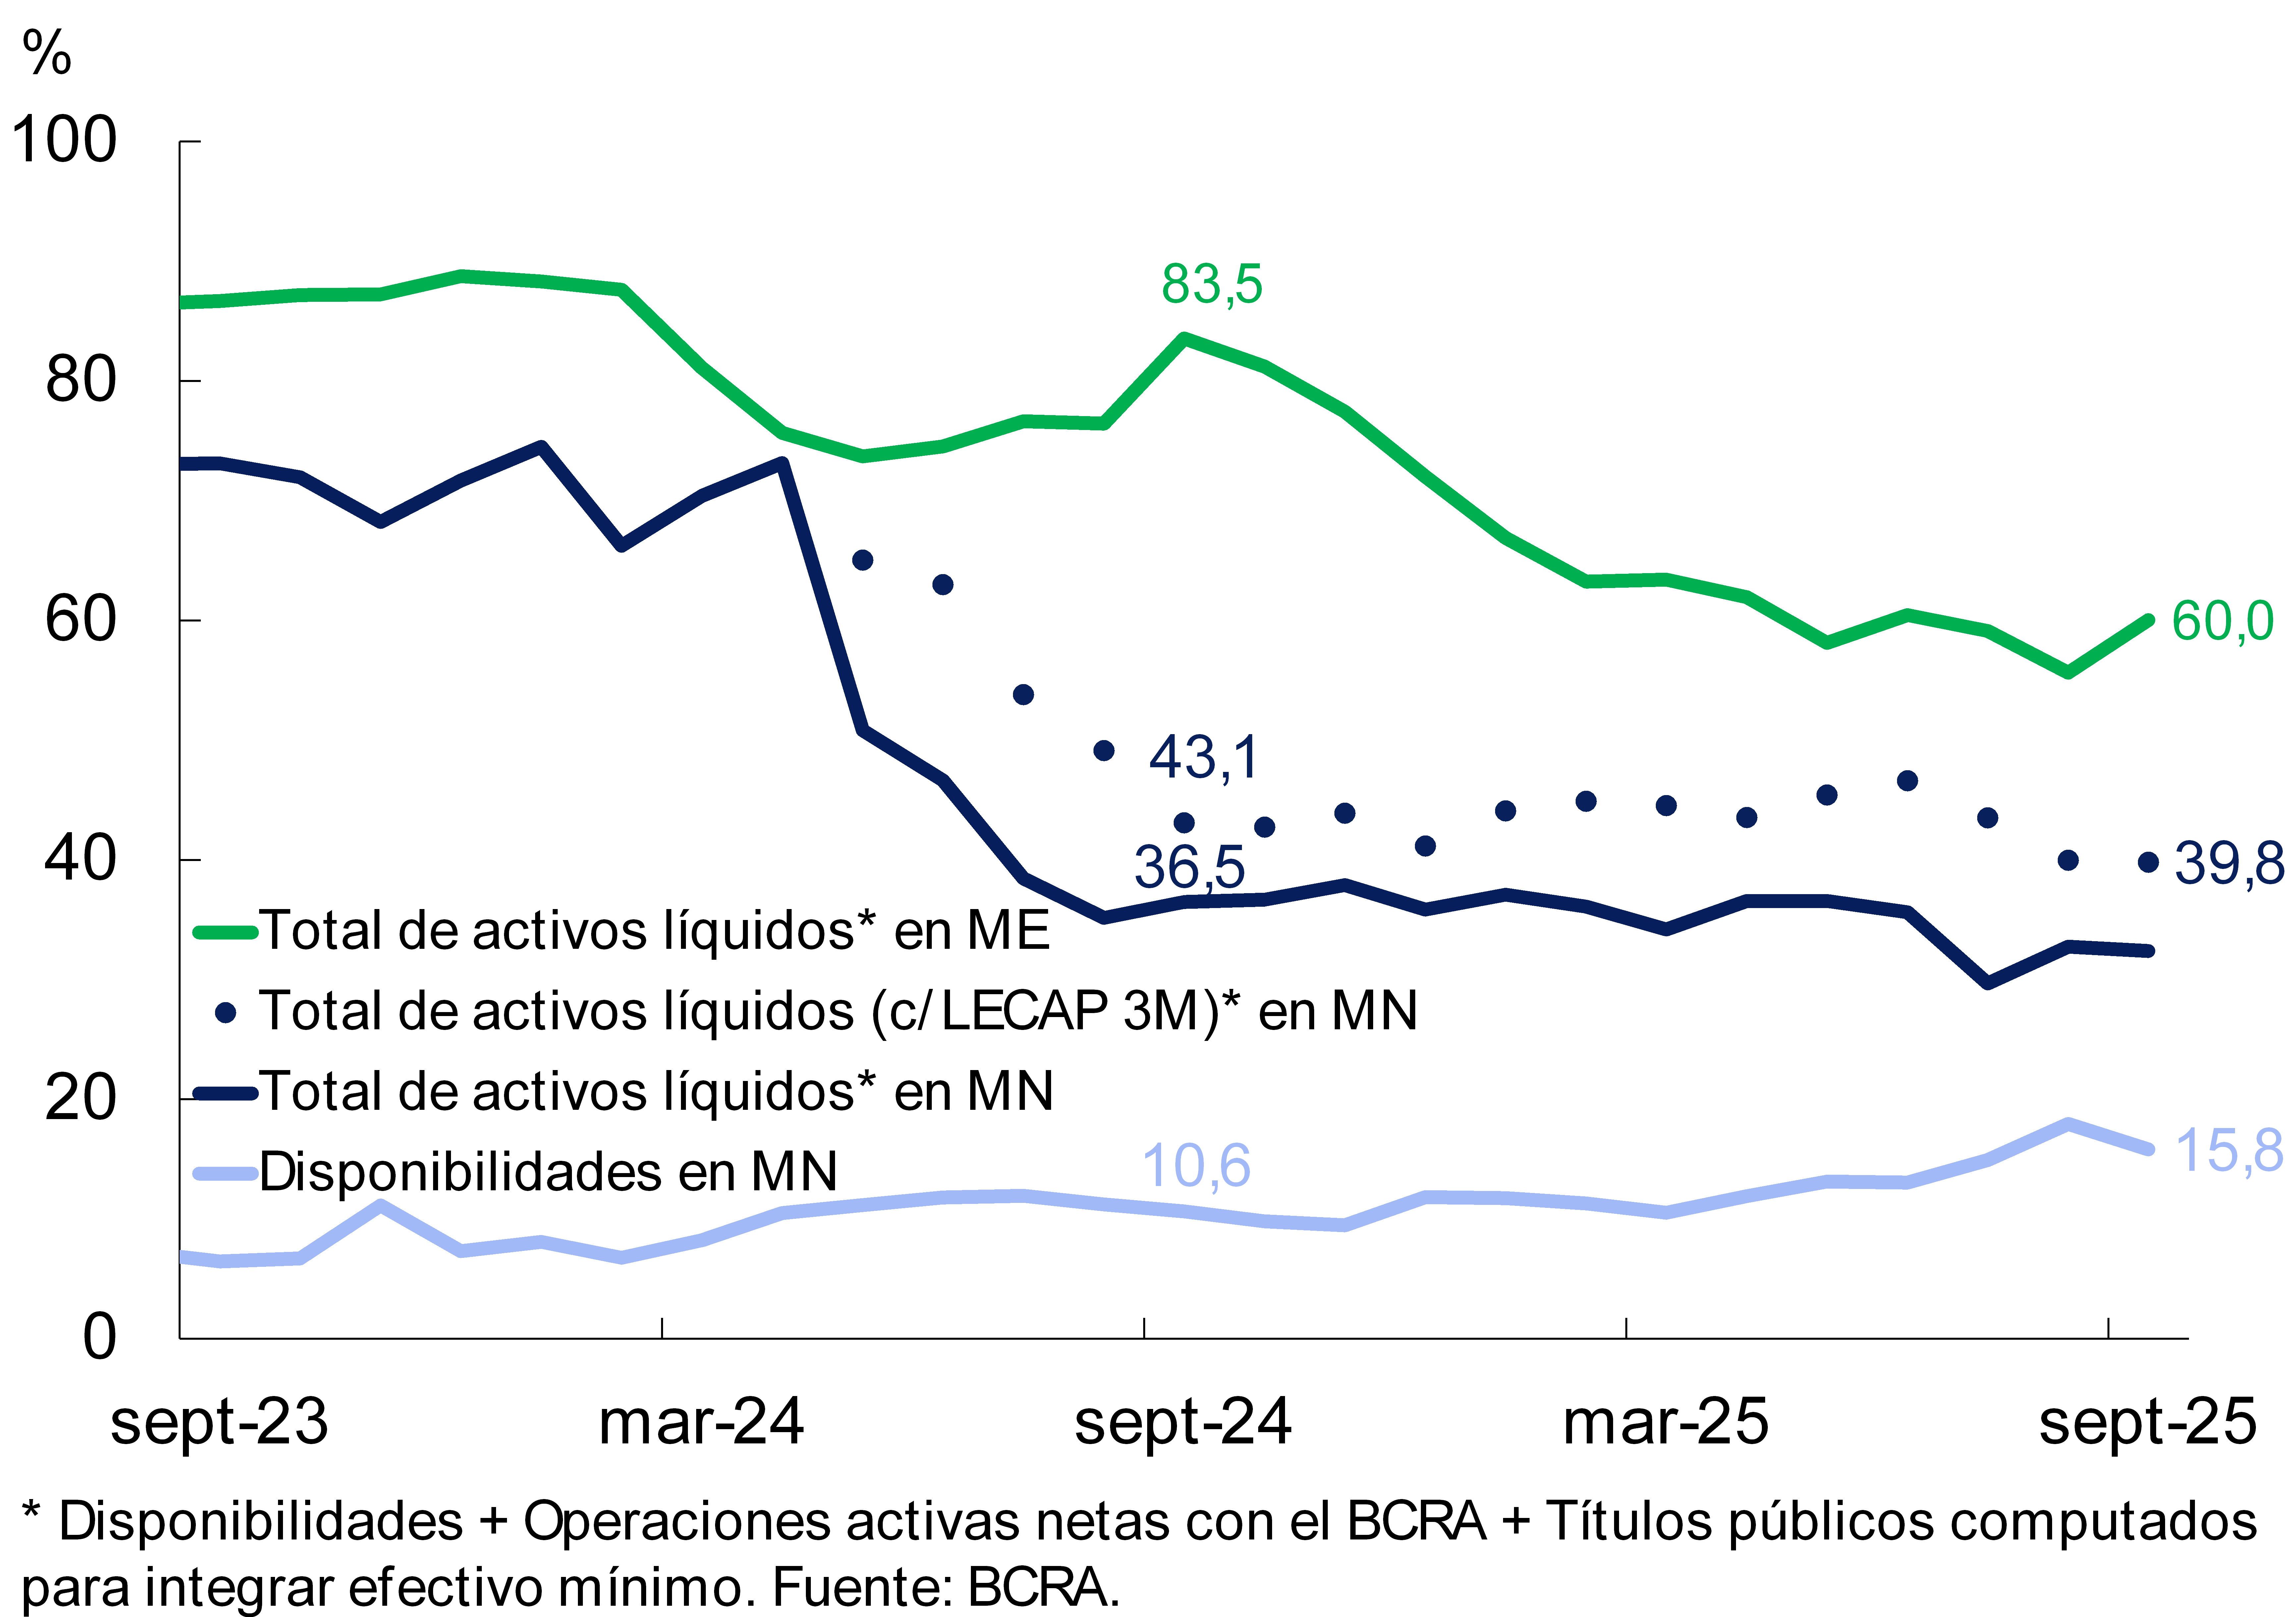
Figure 10 | Liquidity coverage ratio (LCR)
Group A financial institutions – In $+ME
The sector continued to exhibit high levels of solvency. As of September, capital integration (PRC) in terms of risk-weighted assets (RWA) totaled 27.1%, well above the records observed in the region (see Chart 11). In the month, this indicator showed a slight increase, based on a greater relative reduction in RWAs (-4% in real terms) compared to that verified in the PRC (-2.7% in real terms). 2 In the month, the capital position (net integration of the requirement) of the financial system as a whole totaled 234% of the requirement (+4.3 p.p. monthly) and 31.4% of the credit to the private sector net of forecasts (-1.1 p.p. monthly).
The leverage ratio – defined based on Basel Committee guidelines – totaled 18.9% for all financial institutions at the end of the third quarter, much higher than the regulatory minimum (3%). From these comfortable levels, in the last 12 months there was a reduction in the indicator, in line with the expansion of the aggregate balance sheet (effect on the denominator), in a framework of lower profitability (effect on the numerator).
Over the past 12 months, the total comprehensive results for the financial system were equivalent to 0.3% of assets and 1.4% of NP, levels lower than those recorded a year ago (see Chart 12). The year-on-year reduction was explained by a lower real comprehensive financial margin (lower positive results for securities, premiums for passes and differences in quotation, partially offset by a reduction in interest outflows on deposits and lower losses due to exposure to monetary items), which was mitigated by lower taxes and administrative expenses.
Graph 11 : Integration of capital
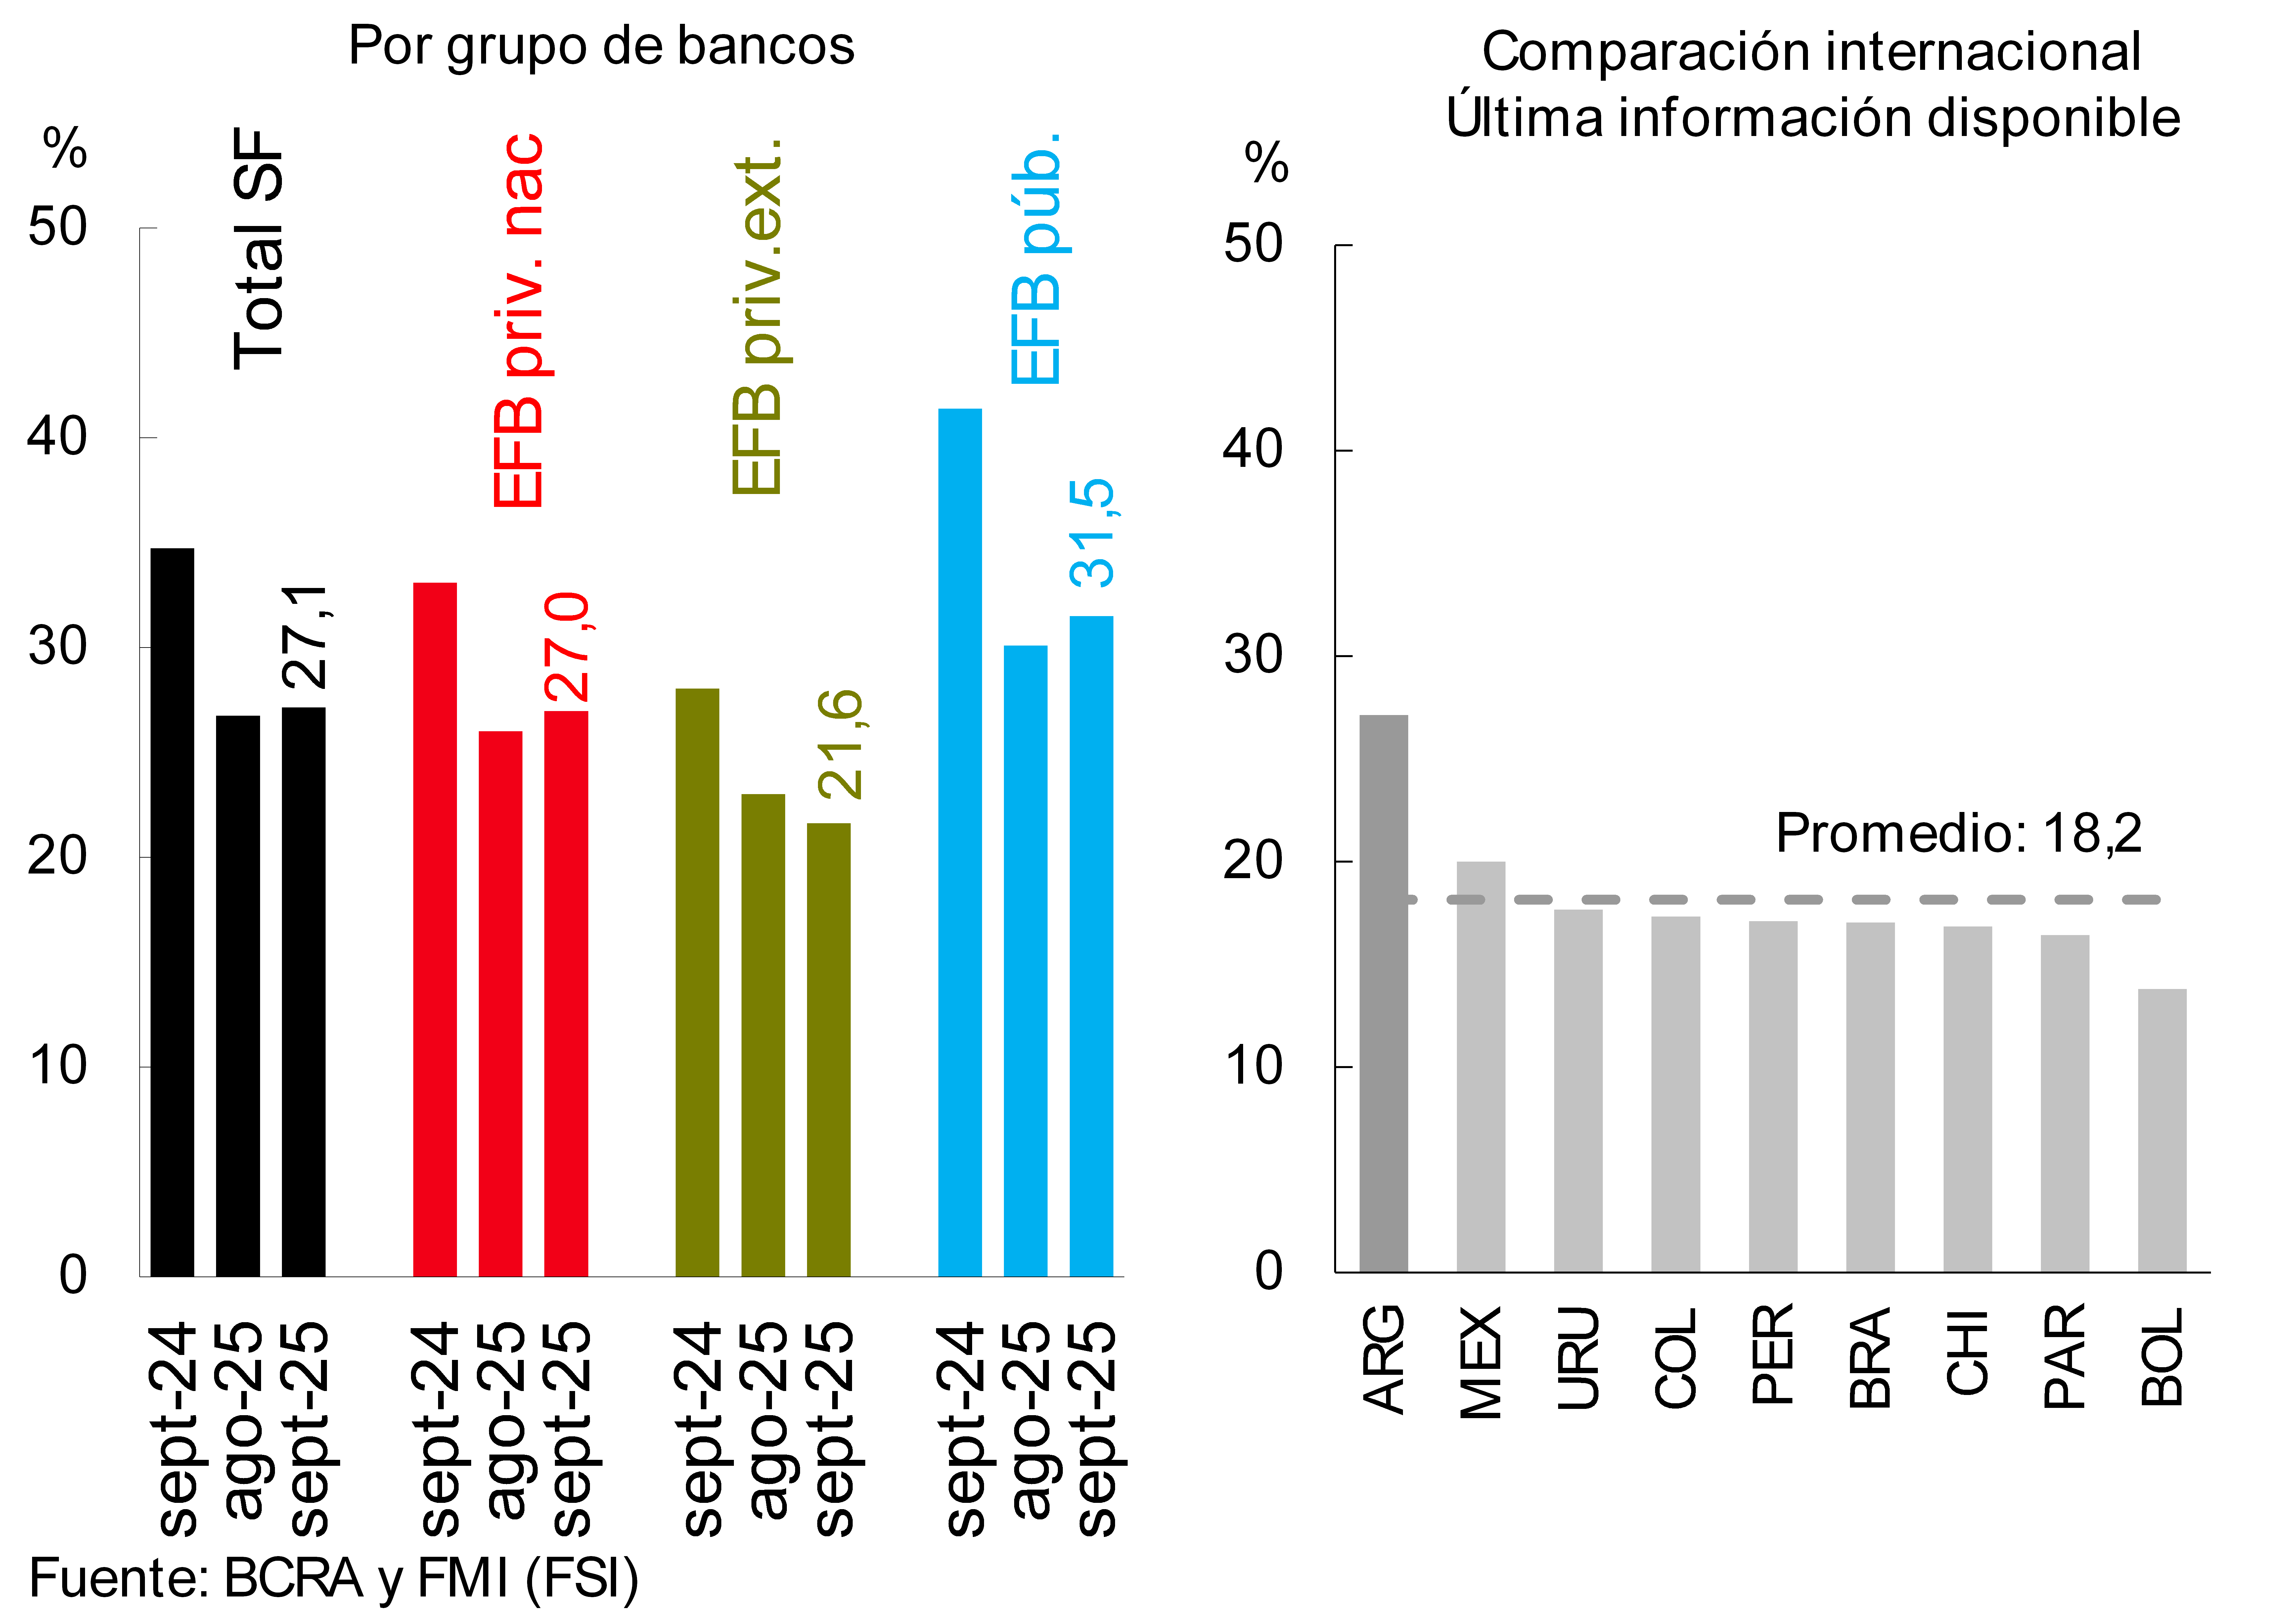
Figure 12 | Cumulative return over 3 and 12 months
V. Payment system
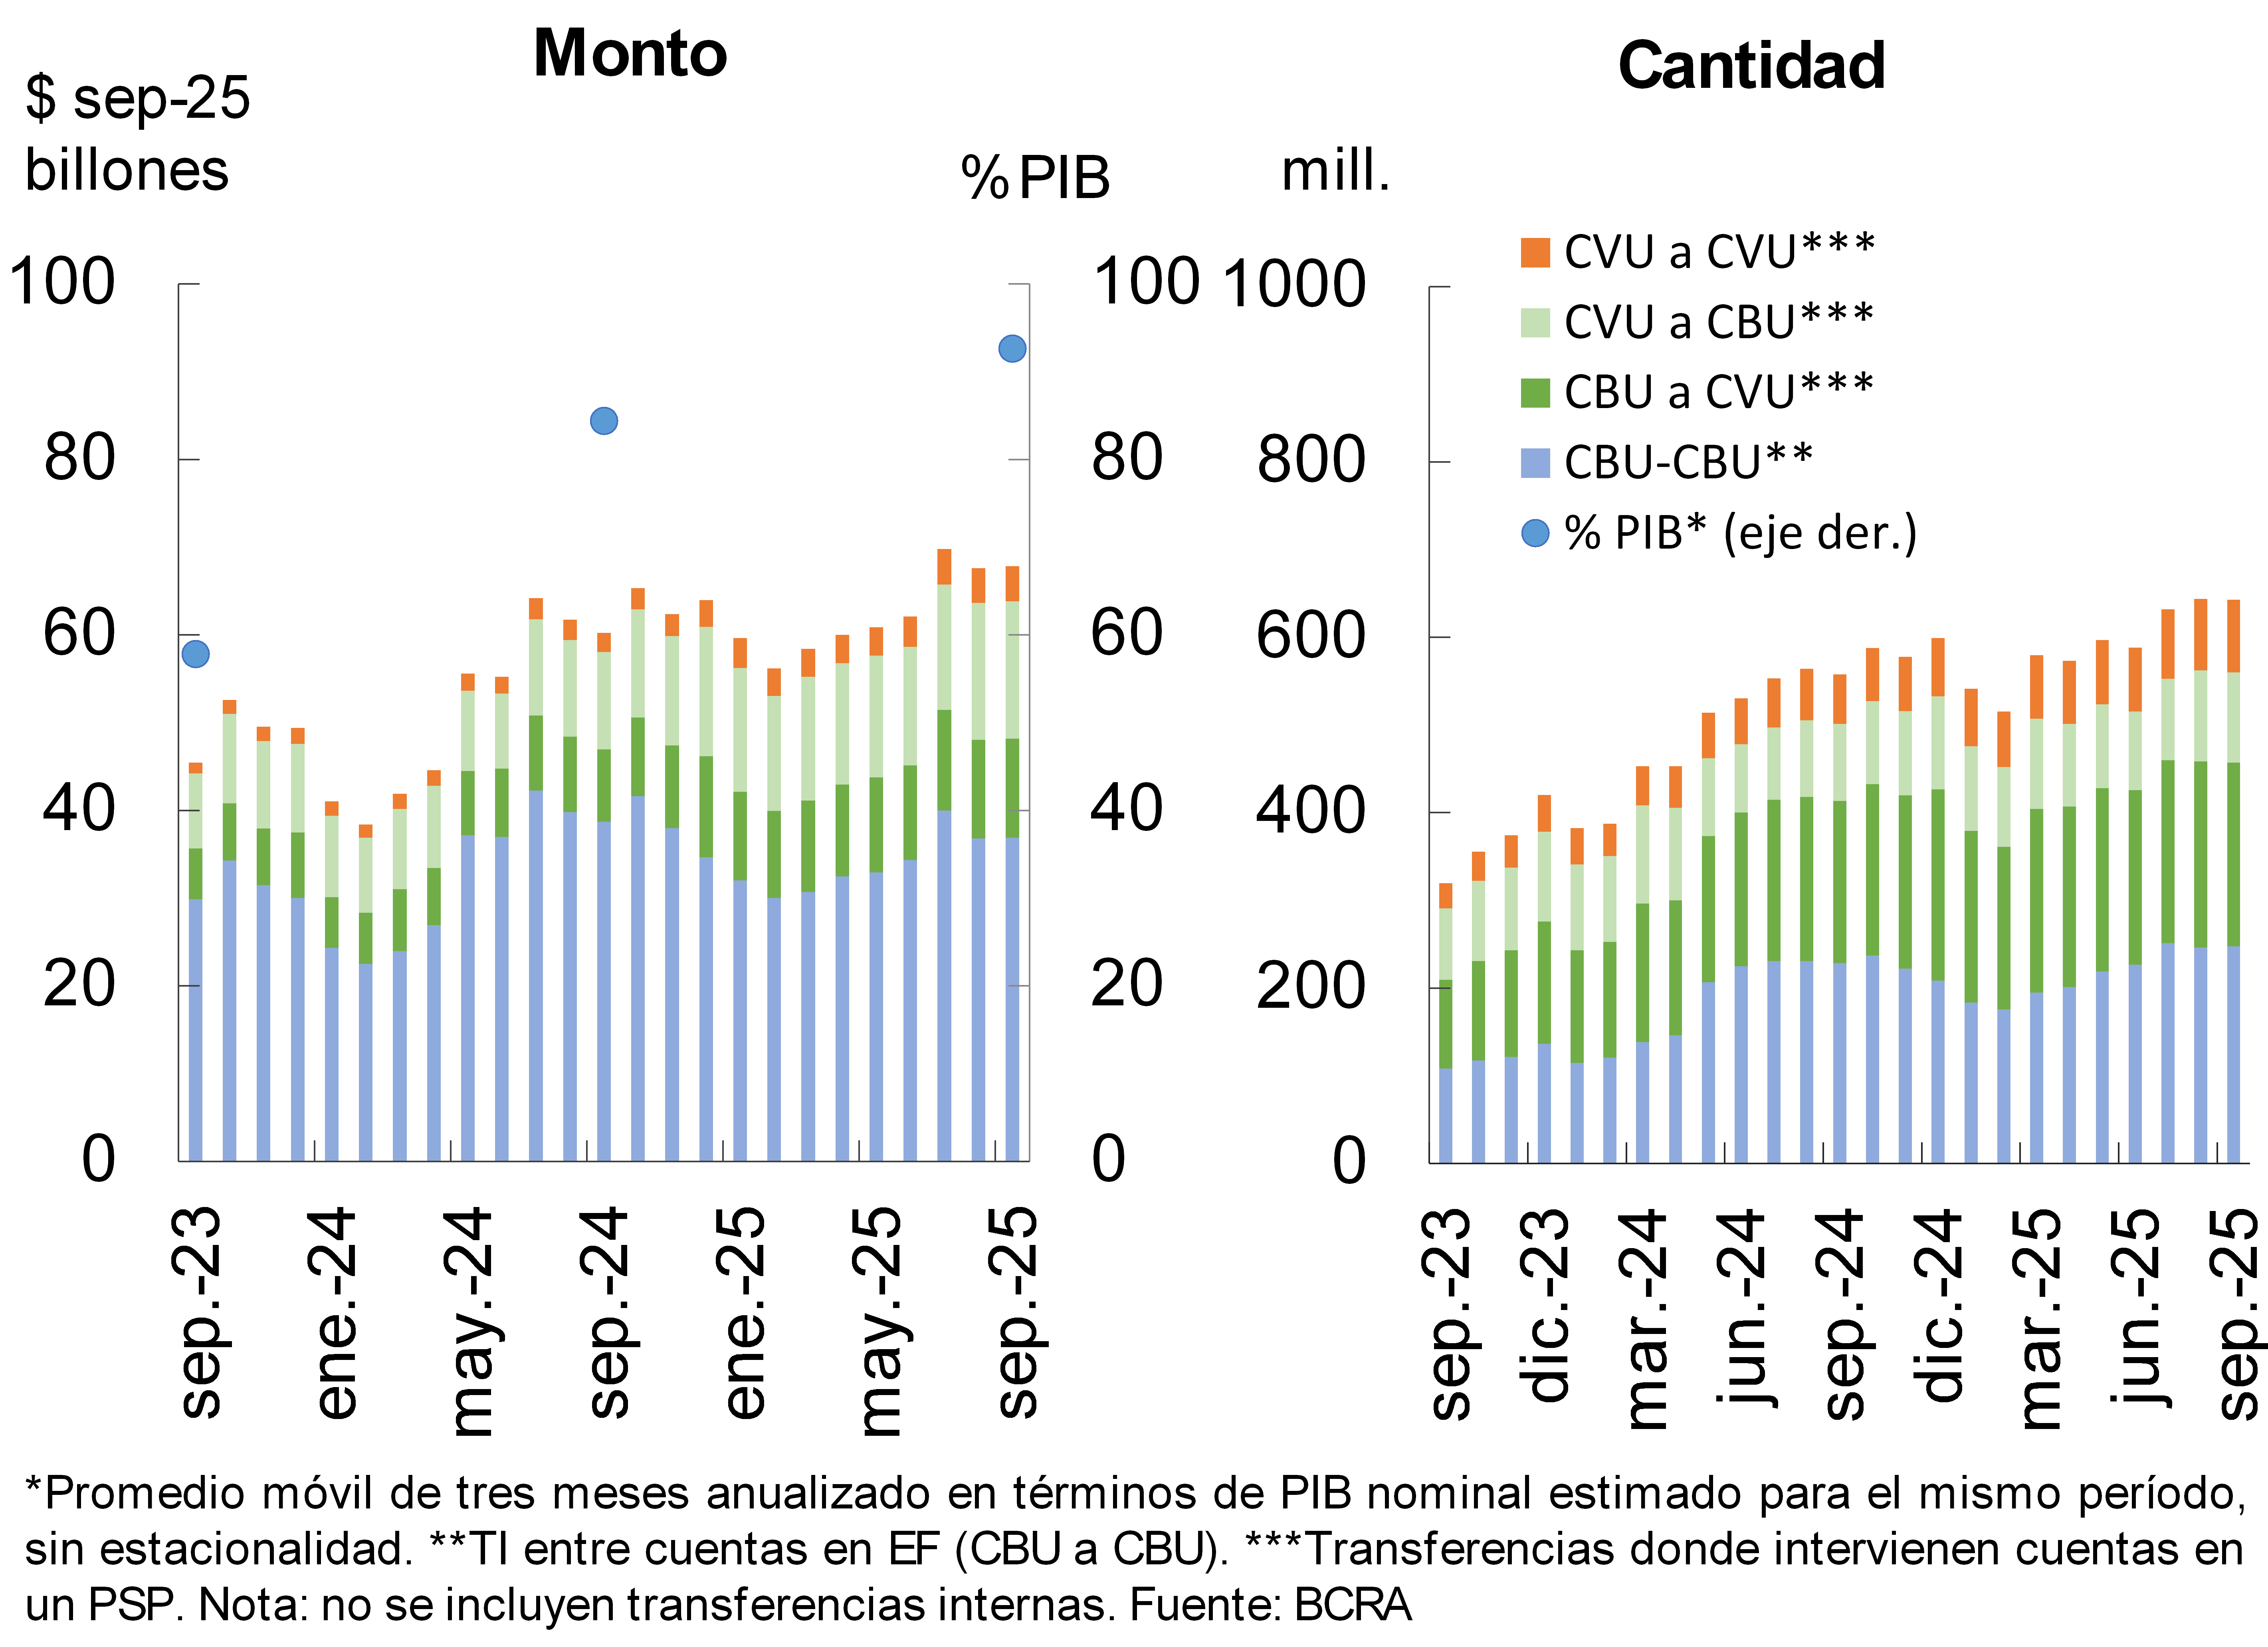
In September, immediate transfers (TI) did not show significant changes compared to last month (real increase of 0.3% in amounts and -0.1% in number of operations). Compared to the same month in 2024, IT grew 12.7% in real amounts and 15.3% in quantities (see Chart 13). When disaggregated by type of account, the dynamism of the operations in which CVUs are involved stands out: the real amounts increased 84.8% in IT between CVUs, 41% from CVUs to CBUs and 36.7% from CBUs to CVUs. In contrast, the actual amounts of operations exclusively between CBUs of different entities decreased by 4.7% y.a.3 4 The amount traded by IT in the last three months (annualized) represented 92.6% of GDP, increasing 9.8 p.p. y.o.y.
In the month, payments with interoperable transfers (PCT) via QR code increased 2.3% in amounts, while real amounts showed a slight reduction of 0.2%. In the year-on-year comparison, PCTs expanded 71.7% in real amounts and 54.3% in quantities. 5 These payments (three annualized months) represented approximately 1.9% of GDP, growing 0.7 p.p. y.o.y.
Chart 13 – Immediate Transfers (IT)
In September, the clearing of checks increased 10.5% in amounts and 10.4% in real amounts. In the year-on-year comparison, cleared checks increased 7.4% in amounts and 17.7% in real terms (see Chart 14). 6 When distinguishing by format, ECHEQs continued to expand, with increases of 26.2% YoY in quantities and 26.7% YoY in real amounts, while physical checks decreased (11.4% YoY and 10.7% YoY, respectively). As a result, the ECHEQs accounted for 58.9% of the total compensated in quantities (+8.7 p.p. y.o.y.) and 81.8% in amounts (+5.8 p.p. y.o.y.). Overall, the value offset in the last quarter (annualized) was equivalent to 27.1% of GDP, 3.1 p.p. above the record of a year ago.
Graph 14 : Check clearing
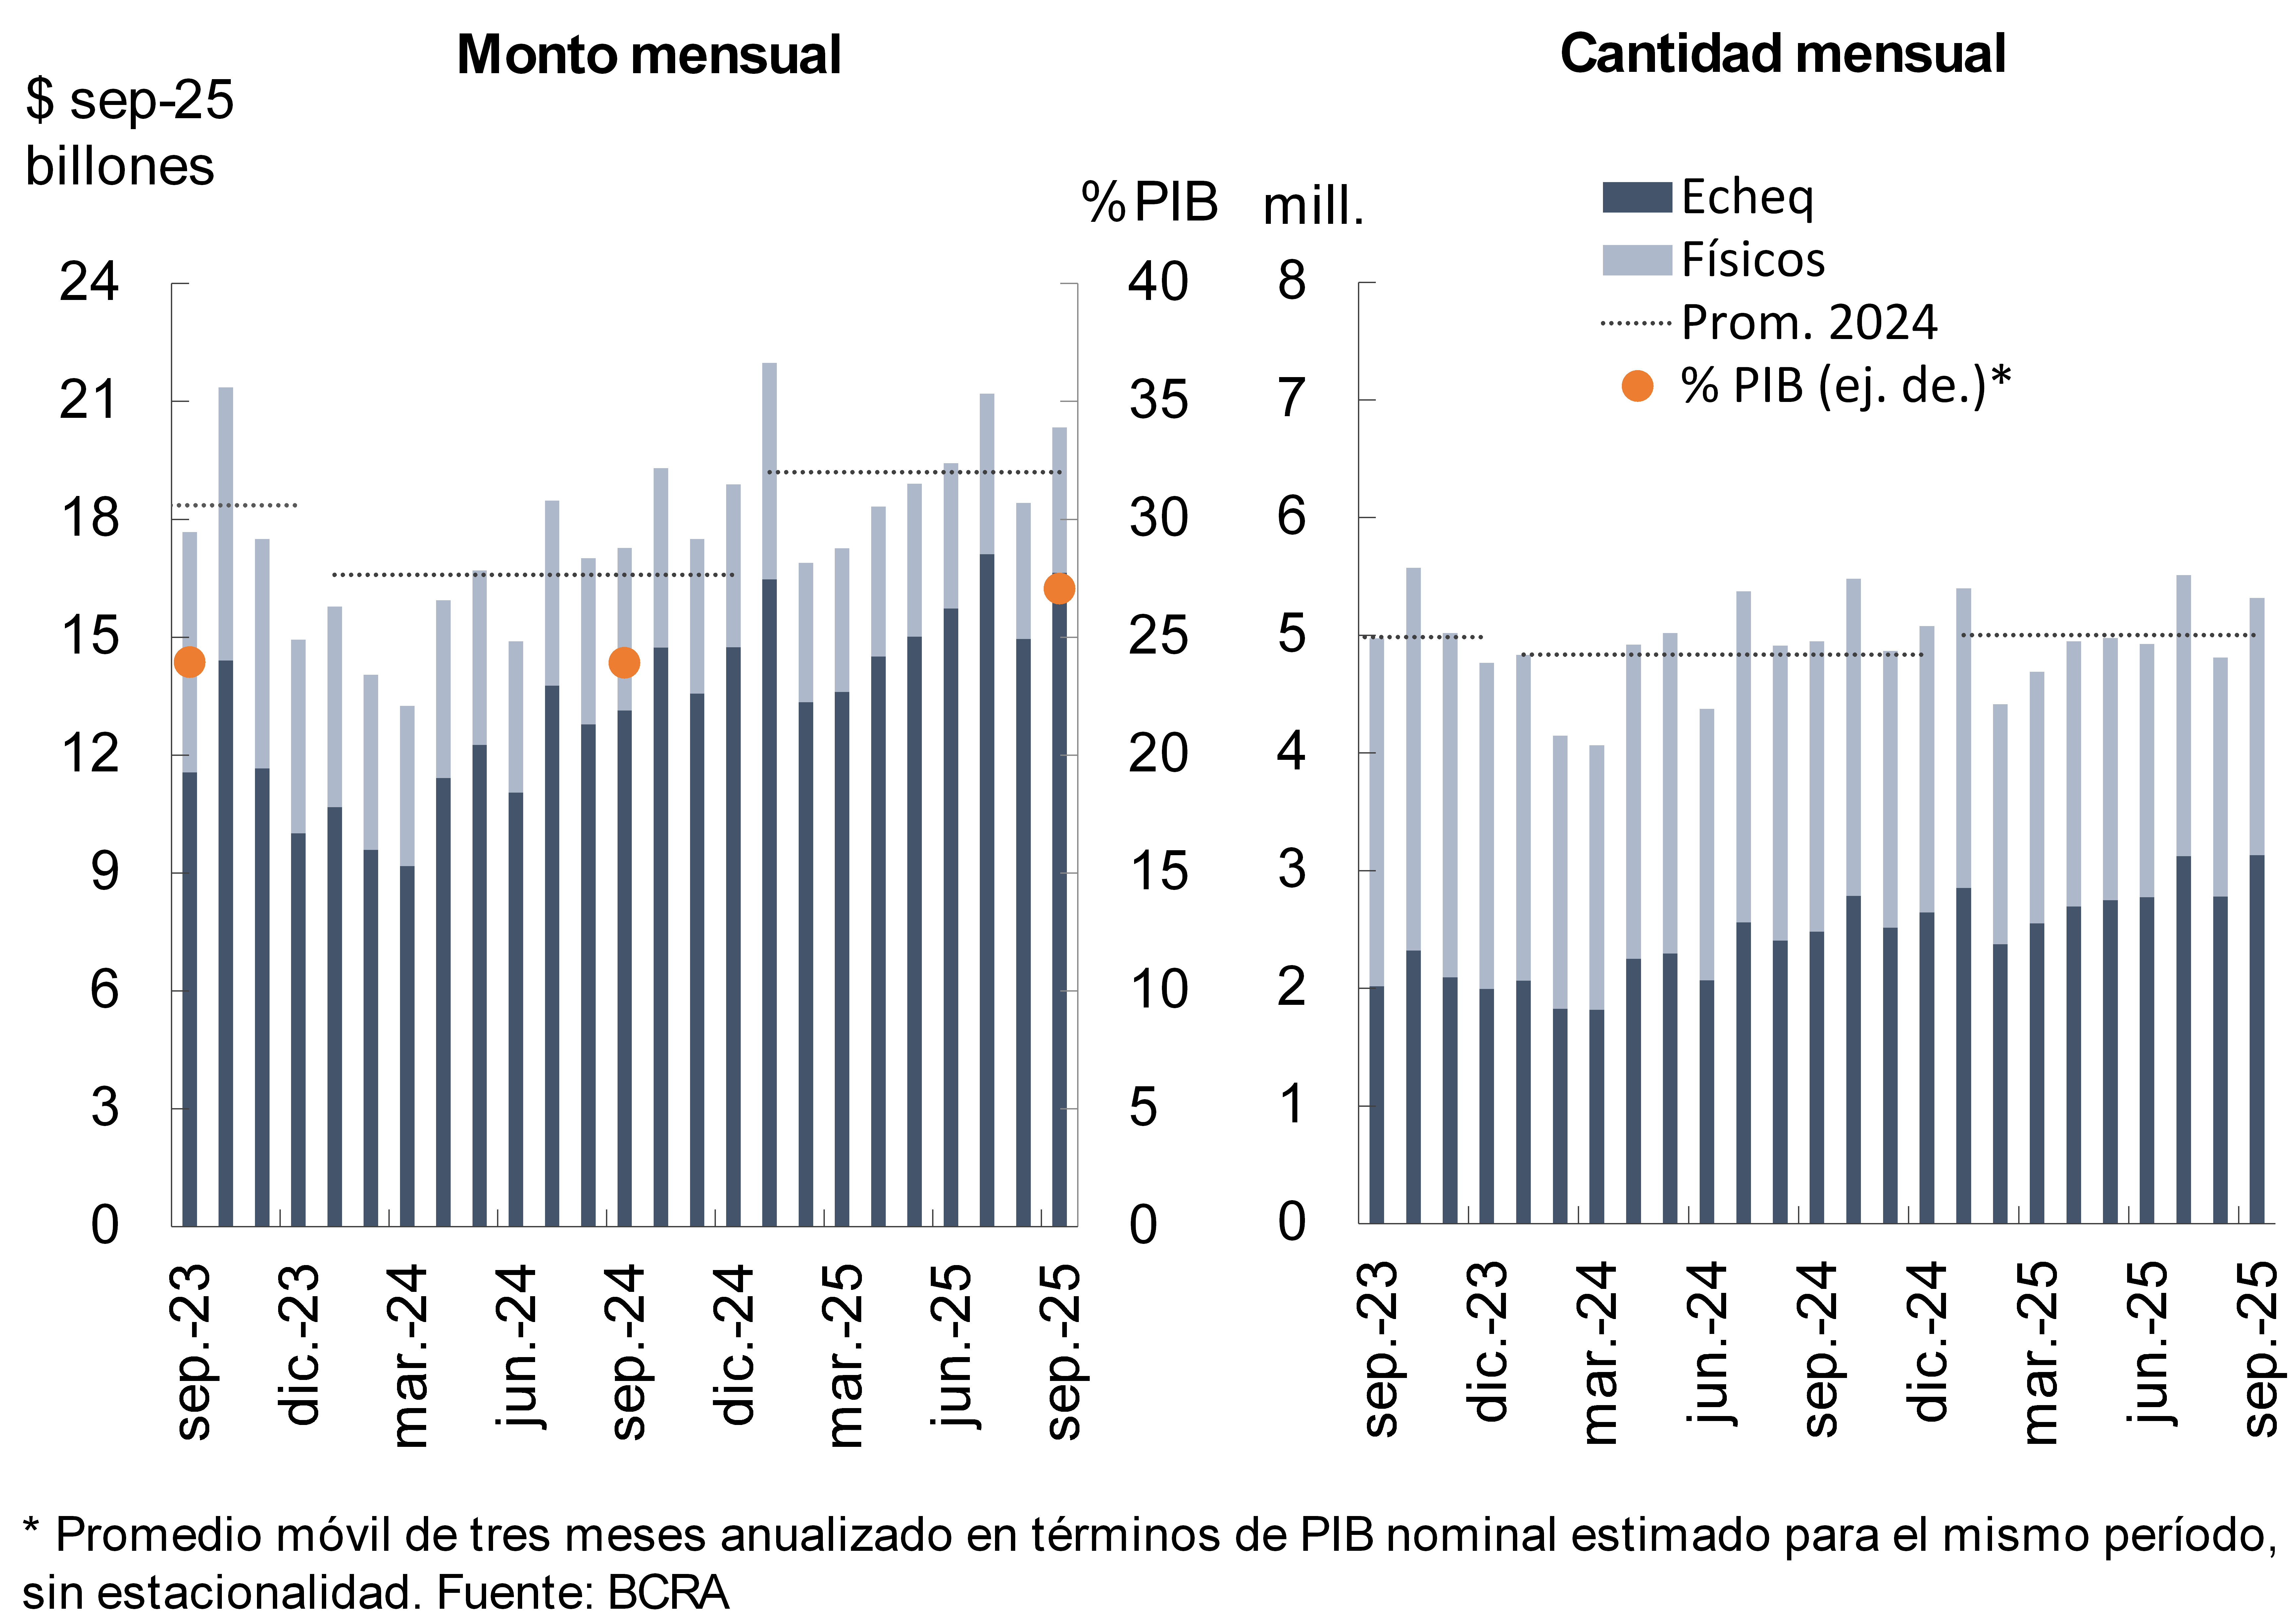
In September, the ratio of rejected checks due to lack of funds over the total cleared stood at 1.74% in amounts and 1.37% in real amounts. Both values increased compared to August (+0.25 p.p. and +0.22 p.p., respectively) and remained above the records of a year ago (+1.07 p.p. in quantities and +0.95 p.p. in amounts).
References
1 Considers availabilities (cash and current account at the BCRA), net asset transactions with the BCRA, the balance of government securities species that entities compute as integration of Minimum Cash and LECAP holdings maturing in the next 3 months (until June 2025 it considered liquidity fiscal bills -LEFI-).
2 The performance of RWAs was based on regulatory changes in the requirement of capital for operational risk. For more details, see Normative Annex and Communication A8329. On the other hand, the performance of the PRC mainly reflected the effect of the accounting results of the period.
3 In year-on-year terms through September, the amount of IT among CVUs increased 46.6%, while those among CBUs grew 8.3%. On the other hand, CBU to CVU operations and vice versa also registered increases (13.3% YoY for the first case and 17.4% YoY for the second).
4 In September, the average value of IT was $105,500.
5 In September, the average value of PCTs through QR codes was $19,300.
6 In September, the average amount of cleared checks was $3.8 million (physical format: $1.69 million; ECHEQs: $5.31 million).
Share on


