Executive summary
• From high levels – which exceed the average of the last 5 years – the solvency ratios for the financial system increased during October. In particular, capital integration (RPC) accounted for 17.3% of risk-weighted assets (RWA), 1 p.p. more than in September and 2.1 p.p. on a year-on-year basis (YoY). The PRC almost doubled the minimum capital requirement at the aggregate level (199%). This ratio increased 11.2 p.p. in the month and 20.2 p.p. compared to October 2018.
• The liquidity of the financial system remained at high levels in October. The broad liquidity ratio stood at 55.6% of total deposits in the month (53.7% for items in pesos and 60.1% in the foreign currency segment), 2 p.p. less than in September but 4 p.p. more than in a year-on-year comparison.
• The balance of deposits in pesos in the private sector fell by 4.7% in real terms in October (nominal -1.5%), as a result of decreases in both time deposits and demand accounts. The balance of private sector deposits in foreign currency fell 10.7% in the month – in source currency – slowing its fall compared to the previous two months. Thus, private sector deposits accounted for 57.6% of total funding (liabilities plus net worth).
• In October, the balance of credit in pesos to the private sector increased by 3.3% in real terms (+6.7% nominal), while loans in foreign currency fell by 10.7% (in the currency of origin). The weighting of credit to the private sector in assets stood at 43.3% in the month, increasing 1.4 p.p. compared to September (-0.5 p.p. y.o.y.). The financial system’s exposure to the public sector stood at 10.4% of total assets, 0.7 p.p. more than in September (-1 p.p. y.o.y.).
• The irregularity ratio of total financing to the private sector reached 4.9% in October, increasing slightly in the month (+0.1 p.p.; and 2.3 p.p. y.o.y.), thus maintaining a relatively more moderate rate of increase than that observed at the end of 2018 and the beginning of 2019. In a context of greater dynamism in consumer credit, the ratio of non-performing loans to households decreased by 0.2 p.p. in October to 4.4%. The irregularity of mortgage loans to families remained low: 0.5% for those denominated in UVA and 0.8% for the rest. The non-performing loan ratio to companies stood at 5.3%, increasing 0.3 p.p. compared to September.
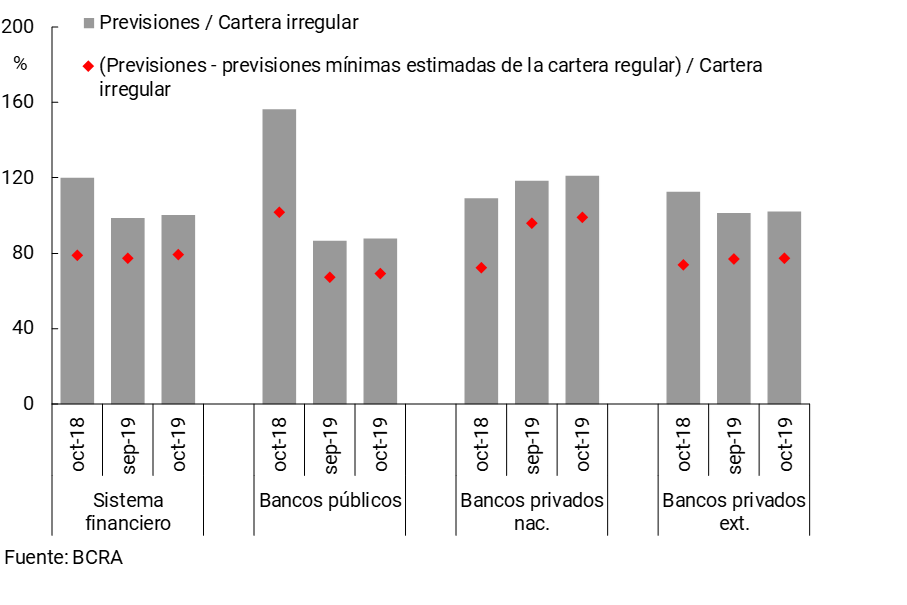
• The balance of total accounting forecasts was equivalent to 100% of the non-performing portfolio to the private sector (79% of this portfolio, when considering the balance of forecasts net of the estimate of the minimum regulations on the regular portfolio). The unforecasted unhedged irregular portfolio is estimated to have accounted for only 3.9% of the PRC in the month, 0.5 p.p. below the September level.
• In October, the financial system accrued nominal gains equivalent to 6.2% annualized (a) of assets (ROA) and 48.2% y/y of net worth (ROE). In the 12-month cumulative period, the banks as a whole totaled a nominal ROA of 4.8% and a nominal ROE of 43.2%.
I. Financial intermediation activity
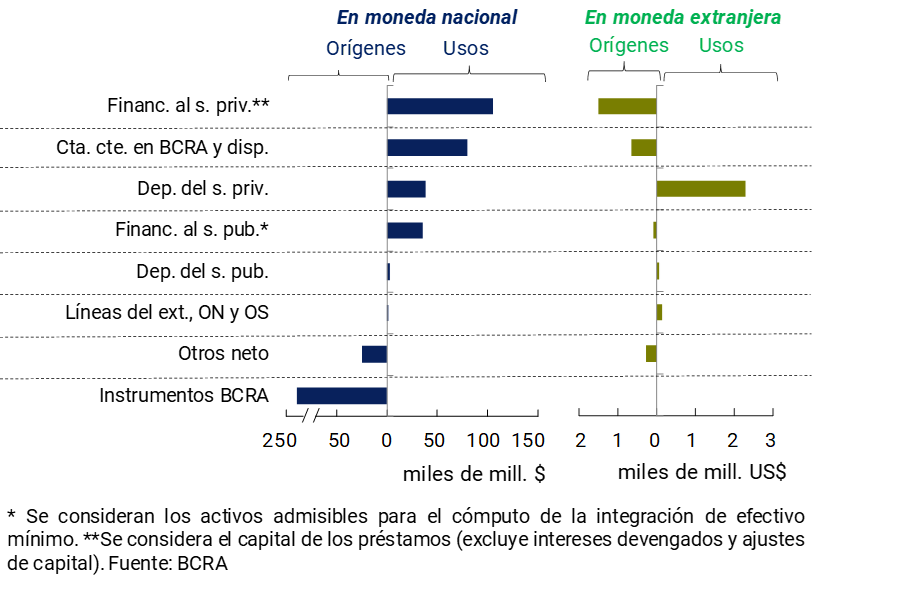
According to the variations between month peaks on the items of the aggregate financial system’s balance sheet, it is estimated that in October the main source of funds in national currency was the reduction in the balance of LELIQ (see Chart 1). These resources were mainly used to increase both financing to the private sector in that currency, as well as the balance of the current accounts that banks have in the BCRA. For its part, in October the balance sheet in foreign currency of the financial system was reduced. The decrease in private sector deposits in foreign currency was the main application of funds, being supplied by the reduction of credit to the private sector and liquidity in the same denomination.
Graph 1 | Oct-19 Cash Flow Estimate
Financial System – By Currency
In this context, total bank assets decreased by 4% in real terms in October (-0.8% nominal), thus accumulating a year-on-year fall of 18.6% in real terms (-15.6% YoY in real terms for private banks and -22.9% YoY in real terms for public banks).
In the month, the foreign currency assets of the financial system represented 28.1% of total assets, almost 1 p.p. below the September level. The foreign currency liabilities of the banks as a whole totaled 26.5% of total funding (liabilities and equity) in October, 1.1 p.p. lower than the level of September. The difference between assets and liabilities in foreign currency – including forward operations – stood at 12.2% of the regulatory capital (RPC) of the financial system in October (see Chart 2), 1.6 p.p. less than in September and 4.9 p.p. lower than the figure a year ago.
Graph 2 | ME Asset – ME Liability + ME Forward Position
Financial system
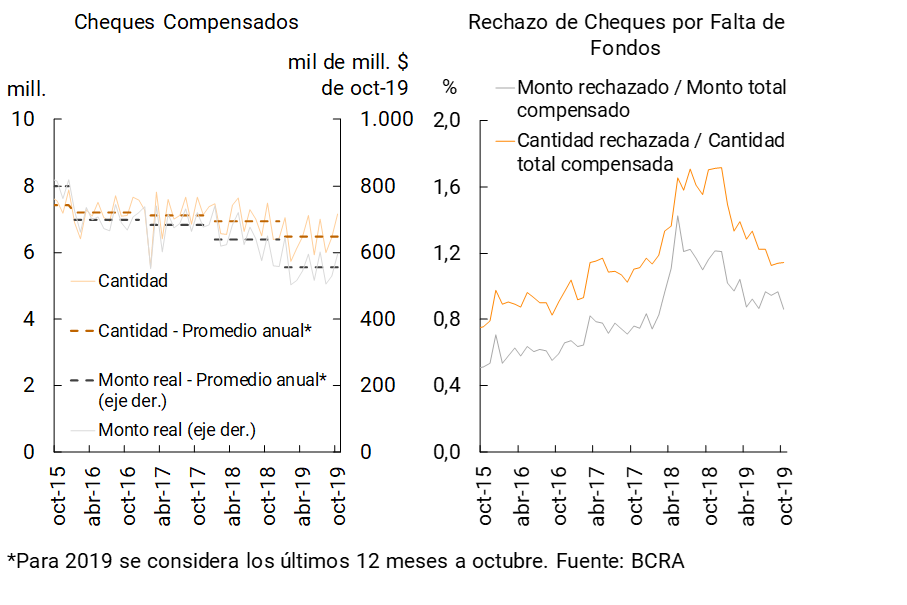
In relation to the operations of the Payment System, during October both the quantity and the average daily value of immediate transfers increased (7.8% and 15.4% in real terms respectively), thus accumulating an increase of 32.7% y.o.y. for the number of operations and 38.4% y.o.y. in real terms with respect to the values processed (see Graph 3). On the other hand, in the month the number and monthly value of cleared checks was higher than the annual average. In this context, in October the rejection of checks due to lack of funds in terms of the total compensated fell in values (-0.1 p.p. to 0.86%) and remained stable in terms of amounts (totaling 1.14%) (see Graph 4). In year-on-year terms, the current level of the ratio of rejection of checks due to lack of funds was 0.3 p.p. lower for the amounts processed and 0.6 p.p. lower considering the amounts transacted.
Graph 3 | Immediate Funds Transfers
Daily average
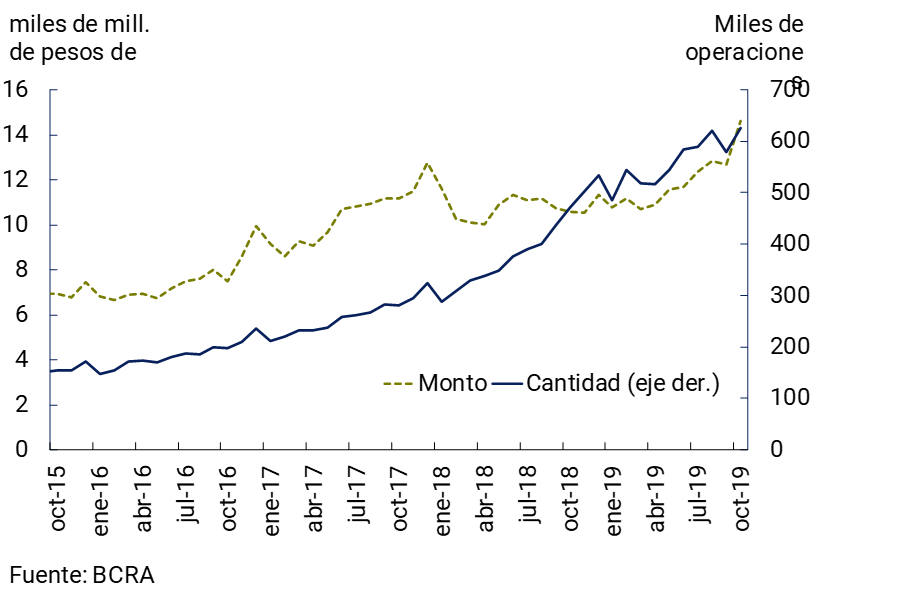
Figure 4 | Check clearing and rejection
II. Deposits and liquidity
The balance of deposits in pesos of the private sector fell 4.7% in real terms in October (-1.5% nominal). This performance was explained by the fall in time deposits and demand accounts. Private sector deposits in foreign currency decreased 10.7% in the month – in source currency – slowing their decline compared to the previous two months.
In a year-on-year comparison, the balance of private sector deposits in pesos fell by 10.6% in real terms (+34.5% YoY nominal), with a fall of 16.6% YoY in term placements (+25.5% YoY nominal) and 4.2% YoY in demand balances (+44.2% YoY nominal). On the other hand, deposits in foreign currency of the private sector decreased by 29.9% y.o.y. – in source currency. Total public sector deposits also fell in real terms over the past twelve months. Thus, the balance of total deposits in the financial system fell by 22.4% YoY in real terms (+16.8% YoY nominal) in the period.
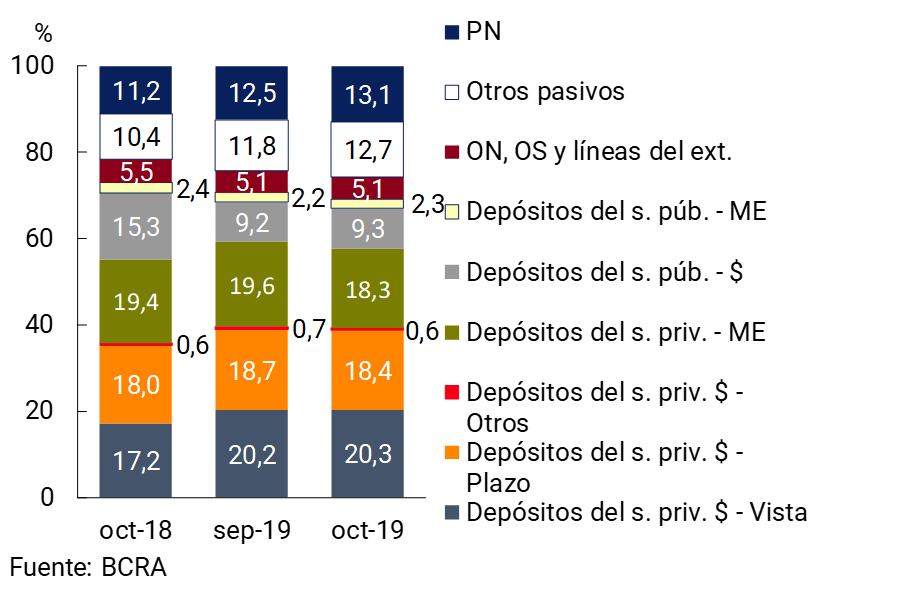
In this context, the relative importance of private sector deposits in total funding – liabilities and net worth – as of October stood at 57.6%, 1.6 p.p. less than in September (see Chart 5).
Graph 5 | Total funding of the financial system
Share % of total
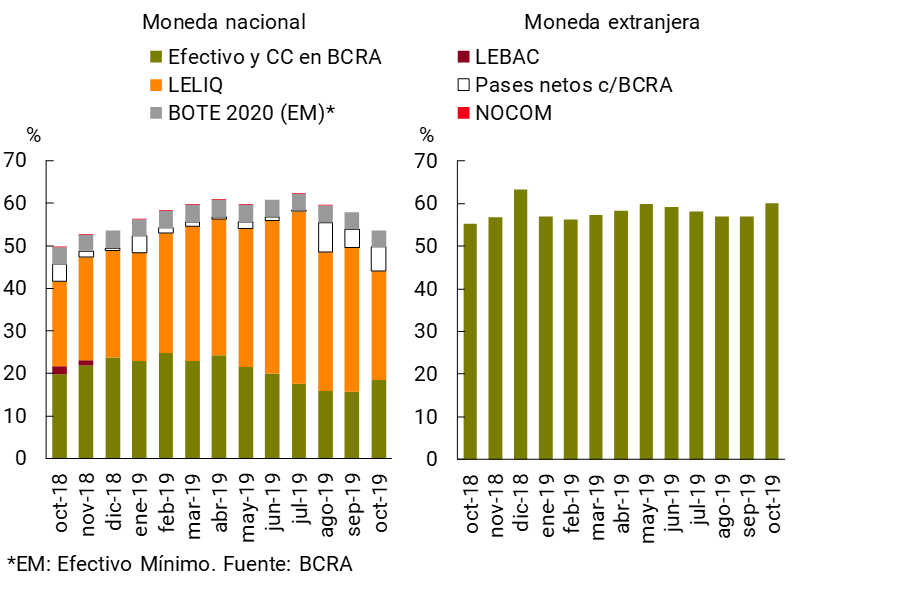
The liquidity of the financial system continued to be high in October. The broad liquidity indicator1 stood at 55.6% of total deposits in the month (53.7% for items in pesos and 60.1% in the foreign currency segment)2, 2 p.p. below the previous month’s figure and 4 p.p. above the level recorded a year ago (see Chart 6). Among liquid assets in pesos, in October the participation of LELIQs not linked to pass operations decreased, while the relevance of cash and current account balances in the BCRA increased. The year-on-year increase in the broad liquidity indicator was verified both in the segment in pesos (+3.7 p.p. y.o.y.) and in foreign currency (+4.8 p.p. y.o.y.).
Graph 6 | Liquidity of the financial system
In % of deposits
III. Credit and Portfolio Quality
In October, the balance of credit in pesos to the private sector increased by 3.3% in real terms (+6.7% nominal) (see Chart 7)3. Credit cards and advances mostly boosted this performance, while title loans and personal loans showed real declines in the month. For its part, the balance of credit in foreign currency fell 10.7% compared to the previous month – in currency of origin – a variation mainly explained by export pre-financing and documents.
Figure 7 | Private sector credit balance by currency*
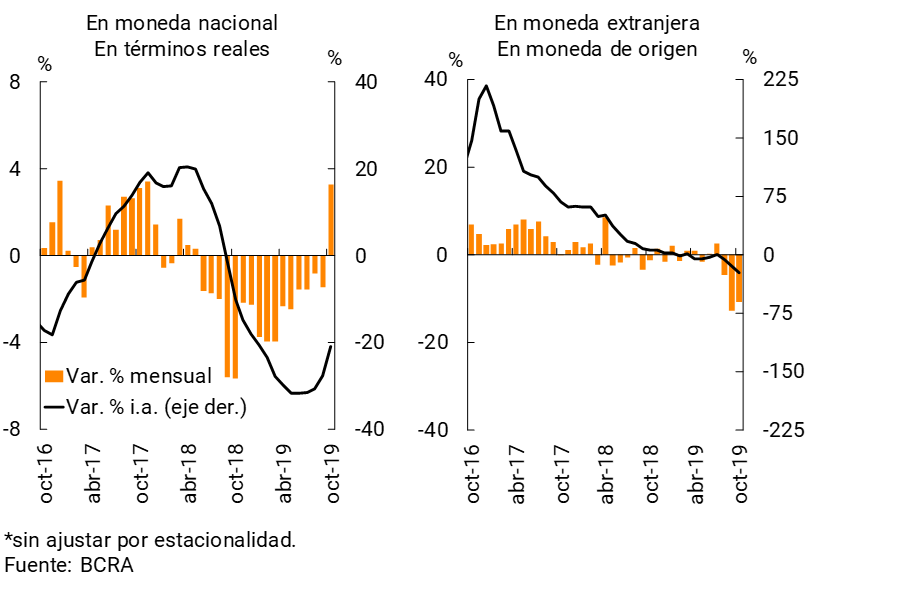
In year-on-year terms, the balance of loans in pesos to the private sector fell 20.8% in real terms in October. Financing in foreign currency decreased 23.2% YoY (in source currency).
Total credit to companies (in domestic and foreign currency) fell in real terms by 3.2% compared to September (unchanged in nominal terms) and by 19.9% y.o.y.4 The monthly variation was mainly driven by financing to industry. For its part, the balance of financing to households (in domestic and foreign currency) increased by 1.8% in real terms in the month (+5.1% nominal), although it fell by 18.2% in real y.o.y. The evolution of the month was mainly explained by credit cards.
The weighting of credit to the private sector in the total assets of the aggregate financial system stood at 43.3% in October, increasing 1.4 p.p. compared to last month5, a generalized variation among the different groups of banks. Compared to the same month of the previous year, the indicator fell 0.5 p.p., mainly explained by national private banks.
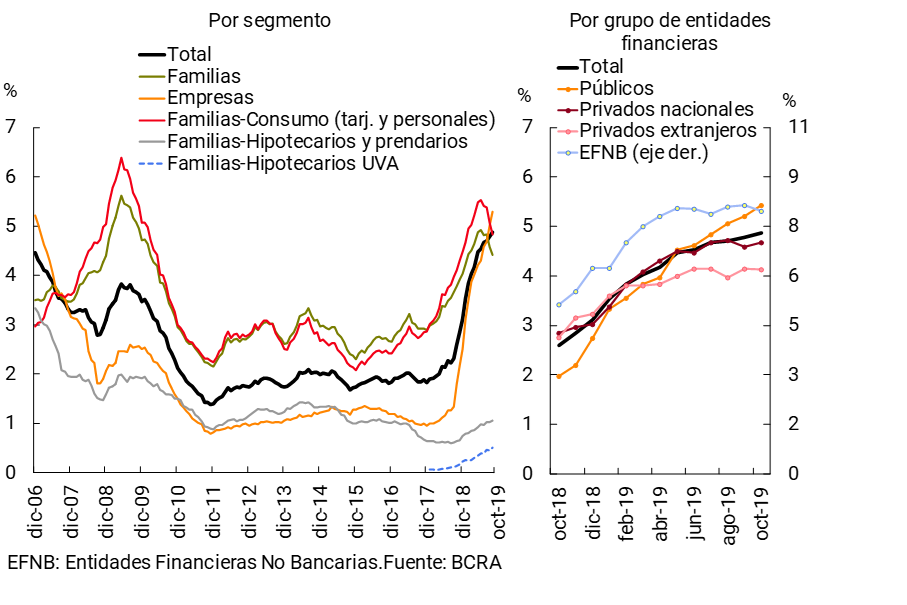
The ratio of irregularity of financing to the private sector increased slightly in the month (+0.1 p.p.), thus maintaining a more moderate performance than that observed at the end of 2018 and the beginning of 2019. Thus, the irregularity ratio of credit to the private sector stood at around 4.9% in the period (+2.3 p.p. y.o.y.) (see Graph 8). In a context of greater dynamism in consumer credit, the NPL ratio of loans to households decreased by 0.2 p.p. in October to 4.4% (+0.6 p.p. y.o.y.). The irregularity of mortgage loans to households continued at low values: 0.5% of the portfolio for those denominated in UVA and 0.8% for the rest. 6 On the other hand, non-performing loans to companies stood at 5.3%, increasing 0.3 p.p. in the month (+3.5 p.p. y.o.y.).
Figure 8 | Irregularity of credit to the private sector
Irregular financing / Total financing (%)
The balance of total accounting forecasts (both for the regular and irregular portfolios) stood at 100% of credit to the private sector in an irregular situation in October. It is estimated that the balance of forecasts attributable to loans in an irregular situation represented 79% of this portfolio in the period (see Graph 9), without significant changes so far this year, and comfortably exceeding the minimum required (estimated at 50% of the irregular portfolio). Taking into account this level of forecasting and solvency indicators (see next section), it is estimated that the non-performing portfolio not covered with forecasts is equivalent to 3.9% of the PRC in the month (7.7% of excess regulatory capital), 0.5 p.p. below the value recorded in September.
Figure 9 | Forecasting of the Financial System
In October, the financial system’s exposure to the public sector stood at 10.4% of total assets, 0.7 p.p. above the September value, although 1 p.p. below the October 2018 figure. These movements were driven by public banks. Taking into account public sector deposits, this sector continued to be a net creditor of all banks, for an amount equivalent to 1.1% of the system’s assets.
IV. Solvency
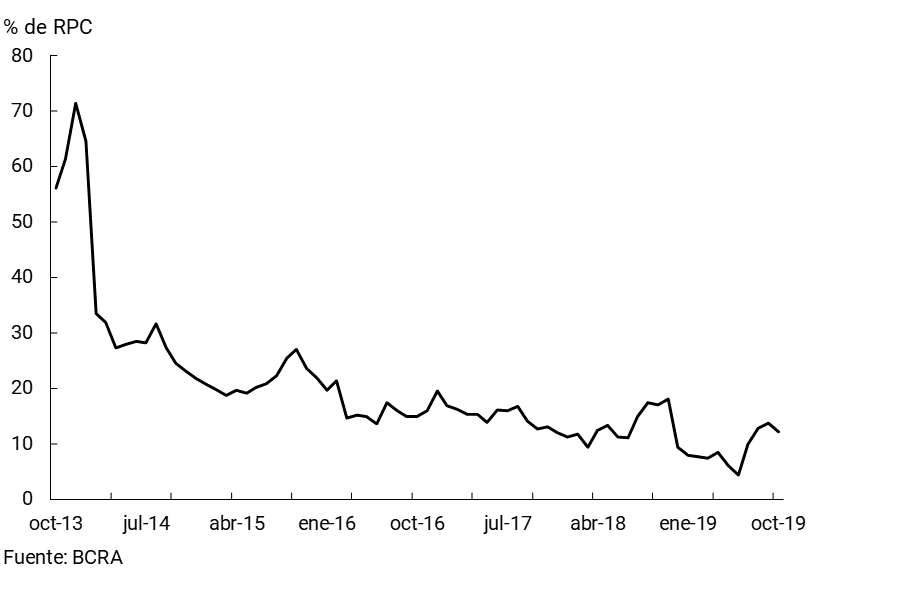
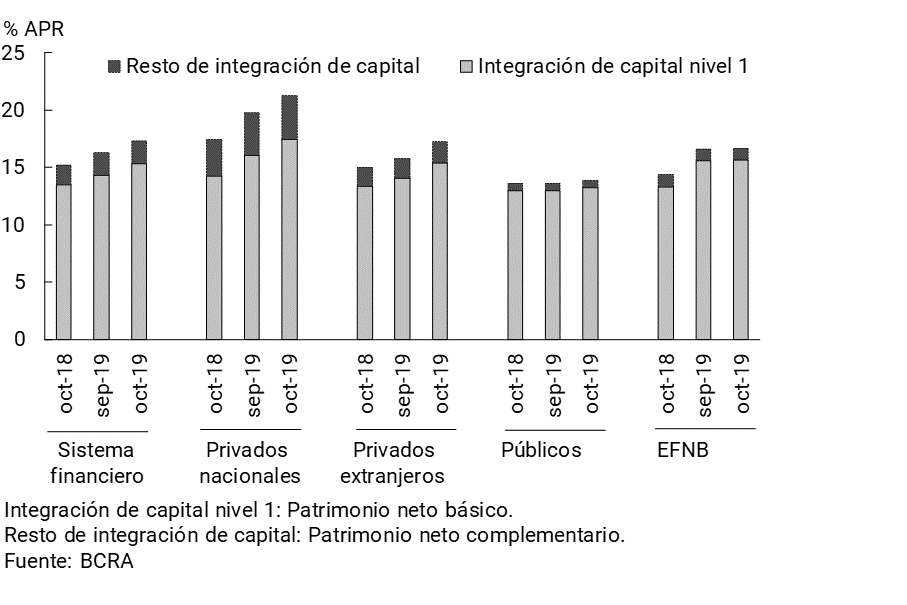
In October, the solvency ratios of the financial system increased. Capital integration (RPC) reached 17.3% of risk-weighted assets (RWA) in the month, 1 p.p. and 2.1 p.p. more than in the previous month and in October 2018, respectively (see Chart 10). In particular, the increase in the PRC (8.2% nominal compared to September and 42.8% YoY nominal) was relatively larger than the increase in RWAs (1.8% and 25.5% YoY). 7 During the period, the proportion of Tier 1 capital in the PRC remained at 88%. 8 The PRC of the financial system was equivalent to almost double the minimum capital requirement in October (199%). This ratio increased 11.2 p.p. compared to September and 20.2 p.p. in a year-on-year comparison.
Figure 10 | Integration of regulatory capital
In October, the financial system accrued nominal gains equivalent to 6.2% annualized (a) of assets (ROA) and 48.2% y/y of net worth (ROE). In the 12-month cumulative period, the banks as a whole totaled a nominal ROA of 4.8% and a nominal ROE of 43.2% (see Chart 11). 9
Figure 11 | Profitability of the financial system
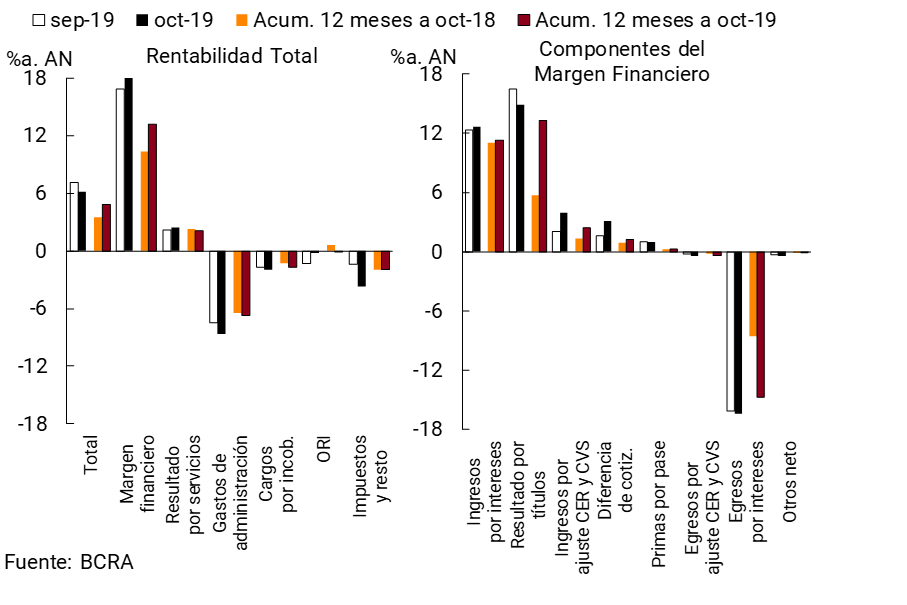
The financial margin of the banks as a whole increased by 1.4 p.p. of assets in October, to 18.3%a. Higher positive adjustments for CER, earnings from contribution differences and interest on loans explained the monthly increase. The fall in earnings from securities and the rise in interest expenses moderated the monthly performance of the financial margin. In the cumulative 12 months to October, the financial margin totaled 13.2% of assets, 2.9 p.p. y.o.y.
In the month, net results from services in the financial system represented 2.4% y/y of assets, 0.2 p.p. more than in September. In the cumulative period between November 2018 and October 2019, net income from services reached 2.1% of assets, falling 0.2 p.p. y.o.y.
Administrative expenses of the banks as a whole totaled 8.6% of assets in the month, 1.1 p.p. more than in September, mainly due to the performance of items associated with personnel expenses. In the accumulated 12 months, these expenditures represented 6.7% of the assets, increasing 0.3 p.p. y.o.y. On the other hand, in October, charges for uncollectibility reached 2% y/y of assets, 0.3 p.p. more than in September. In the last twelve months, bad debt charges represented 1.7% of assets, 0.4 p.p. more in a year-on-year comparison.
References
1 Availability, integration of minimum cash and BCRA instruments, in national and foreign currency.
2 Most of the withdrawal of foreign currency deposits was met with funds from the collection of loans to the private sector (see Graph 1). In this context, the liquidity ratio in foreign currency increased slightly in October.
3 Includes principal adjustments and accrued interest.
4 Information extracted from the Central Debtors (national and foreign currency). Loans to residents abroad are not included. Adjustments in principal and accrued interest are considered. Business financing is defined here as that granted to legal entities and commercial financing channeled to individuals. On the other hand, loans to families are considered to be those granted to individuals, unless they are for commercial purposes.
5 This behavior occurs in the context of a nominal fall in the denominator (see Section I).
6 As of October, out of a total of 103,195 UVA mortgage loans granted to individuals in the financial system (73% generated by public banks, 16% by national private banks and 11% by foreign private banks), 705 were in an irregular situation.
7 This performance of the PRC mainly reflected the effect of nominal earnings for the month and the recognition of 100% of the results of the third quarter —according to the “current regulations”, 50% of the profits are allowed to be computed until the quarterly balance sheets are audited.
8 Tier 1 capital is the capital with the greatest capacity to face unexpected losses, composed mainly of common shares and earnings.
9 The results consider the other comprehensive results (ORI) item.
Share on


