Executive summary
• In May, the financial system carried out the intermediation process while maintaining comfortable solvency and liquidity margins. Electronic means of payment continued to expand steadily in the period, highlighting the monthly performance of immediate transfers (TI) and ECHEQs. A reflection of this is the growing weight that these means of payment have been presenting in regular transactions: it is estimated that the IT operated in the last three months represented an amount (annualized) equivalent to 52.5% of GDP (+12.6 p.p. y.a.), while ECHEQs were around 25.4% of GDP (+0.6 p.p. y.o.y.).
• The balance of credit in pesos to the private sector fell by 1.2% in real terms (-10.7% real YoY) in May, with a monthly increase in consumer loans, with no significant changes in the real collateral segment and a decrease in commercial lines. The LFIP financing balance totaled approximately $1.7 trillion in the month, representing 13.8% of total credit to the private sector (+0.9 p.p. y.a.) and 24.6% of financing to companies.
• In May, the irregularity ratio of credit to the private sector totaled 3%, with no changes in magnitude with respect to the April record and 0.3 p.p. lower than the level of the same month in 2022. In the period, the NPL indicator for loans to households stood at 3.2% (-0.1 p.p. y.o.y.) and 3% for loans to companies (-0.5 p.p. y.a.). The financial institutions as a whole maintained comfortable levels of forecasting in May: 3.9% of the total portfolio and 128% of that in an irregular situation.
• In May, the balance of deposits in pesos in the private sector decreased by 0.6% in real terms (+3.1% in real YoY). The monthly drop was reflected in both demand accounts and time deposits. In year-on-year terms, time deposits in pesos registered a higher relative real growth (+6.9% YoY), accompanied by the various increases in the minimum interest rates ordered by the BCRA.
• In the month, the broad liquid assets of the financial system totaled 78.7% of total deposits, 1.9 p.p. and 11.2 p.p. more than in April and in a year-on-year comparison, respectively. The current levels of the broad liquidity indicator exceed the average of the last 10 years (54.4%).
• Capital integration (RPC) of the aggregate financial system in terms of risk-weighted assets (RWA) totaled 31.3% in May (+0.1 p.p. mom and +2.4 p.p. y.o.y.). The capital position (CPR net of regulatory requirements) for all institutions represented 278.8% of the capital requirement (+1.1 p.p. monthly and +31.2 p.p. y.o.y.) and 44.6% of the balance of credit to the private sector net of forecasts (exceeding the average figure of the last 10 years, of 19.6%).
• The total comprehensive profit in homogeneous currency of the financial system for the accumulated in the last 12 months to May was equivalent to 2.4% of assets (ROA) and 13.7% of equity (ROE).
I. Financial intermediation activity
The financial intermediation activity of all entities with the private sector fell during May. Considering the main variations in the aggregate balance of the financial system for items in pesos (in homogeneous currency), the balance of public sector deposits increased during the month and financing to the private sector was reduced. On the other hand, during the period there was a decrease in private sector deposits, an increase in liquidity in the broad sense, and an increase in financing to the public sector1.
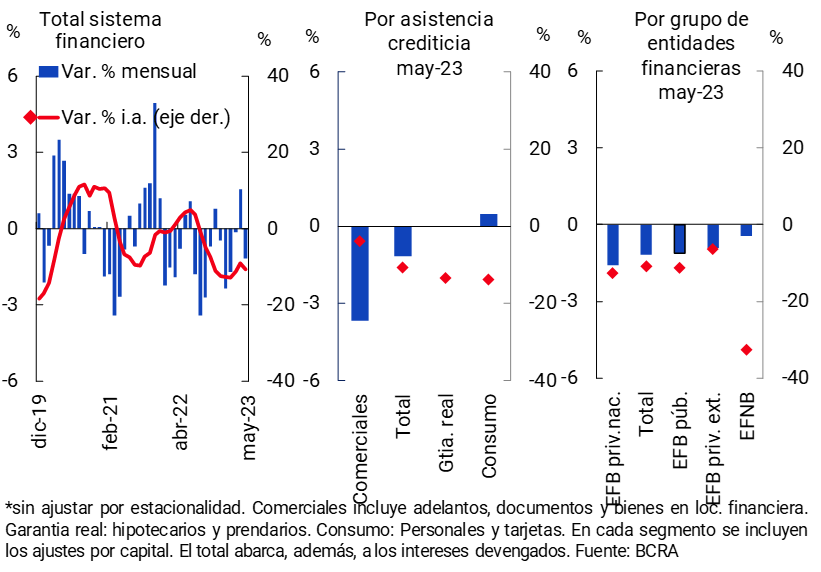
The real balance of financing in pesos to the private sector fell 1.2% in May (see Graph 1). When distinguishing by type of assistance, in the period there were increases in the real balances of the lines for consumption and falls in the commercial ones, while in those with real guarantee no changes of magnitude2 were perceived. In year-on-year terms, the balance of credit in national currency accumulated a decrease of 10.7% in real terms, with a relatively smaller reduction in commercial lines.
Graph 1 | Credit balance to the private sector in pesos
In real terms*
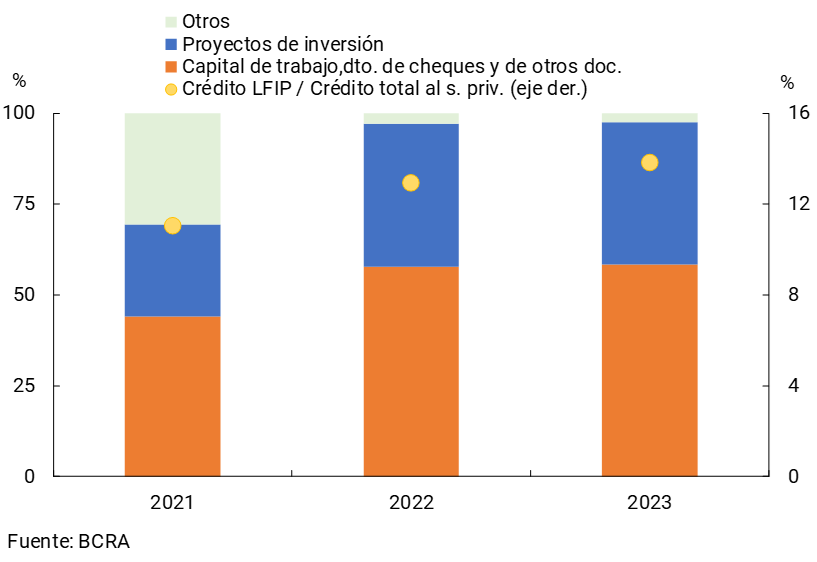
So far this year, the Financing Line for Productive Investment of MSMEs (LFIP) continued to consolidate itself as the main credit stimulus program3. Through the LFIP, almost $6.3 billion has been disbursed since its inception until June 2023, distributed among 455,266 applications. In terms of balance, the LFIP’s estimated credit totaled almost $1.7 trillion as of May, representing 13.8% of total credit to the private sector (+0.9 p.p. y.o.y., see Chart 2) and 24.6% of financing to companies (without significant changes compared to May 2022). About 39% of the total balance corresponds to investment projects.
Graph 2 | Estimated balance of the Financing Line for Productive Investment in MSMEs (LFIP) – In % of total
balance By financing destination
In the month, the balance of credit in foreign currency to the private sector fell by 0.5%4. Thus, in May the total credit balance (in domestic and foreign currency) to the private sector decreased by 1.1% in real terms, accumulating a year-on-year fall of 10.3% in real terms.
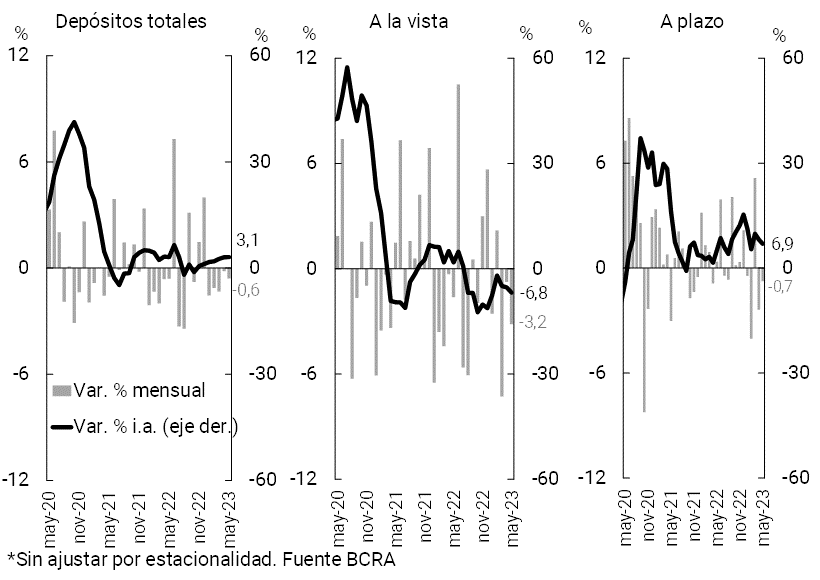
With regard to funding in the financial system, in May the balance of deposits in national currency in the private sector fell by 0.6% in real terms5. The monthly drop was reflected in both demand accounts and time deposits.
The balance of private sector foreign currency deposits remained unchanged in magnitude in month6. In this context, the real balance of total private sector deposits (in domestic and foreign currency) decreased by 0.5% compared to the previous month.
In year-on-year terms, the balance of deposits in pesos in the private sector accumulated an increase of 3.1% in real terms in May, mainly due to the performance of time placements (see Chart 3). When considering all currencies and sectors, the balance of deposits in real terms remained relatively stable compared to May 2022 (-0.9% YoY).
Graph 3 | Balance of private sector deposits in pesos
In real terms* – Sistema financiero
II. Evolution and aggregate composition of the balance sheet
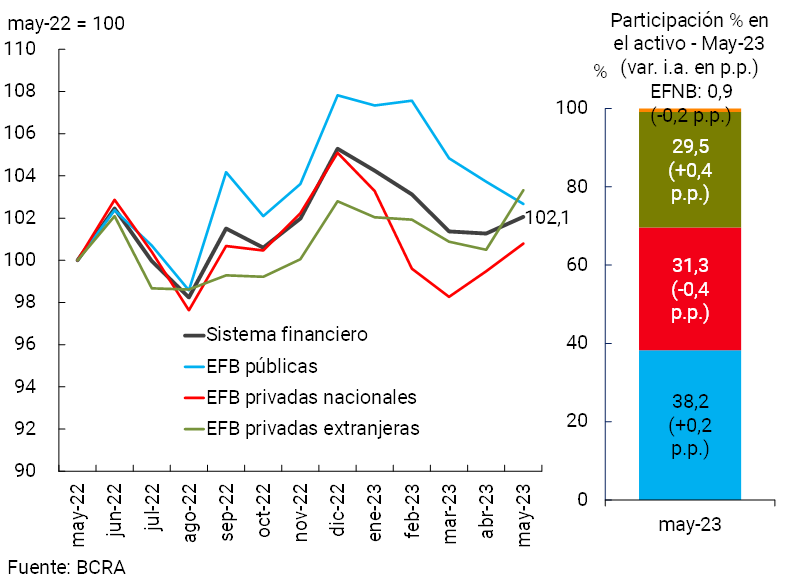
The balance sheet of the aggregate of financial institutions, measured in terms of the size of total assets in real terms, grew in May (see Chart 4). Private banks explained this monthly dynamic. In a year-on-year comparison, the sector’s total assets accumulated an increase in real terms of 2.1%, driven mainly by foreign private banks and public banks.
Figure 4 | Total assets in real
terms Financial system
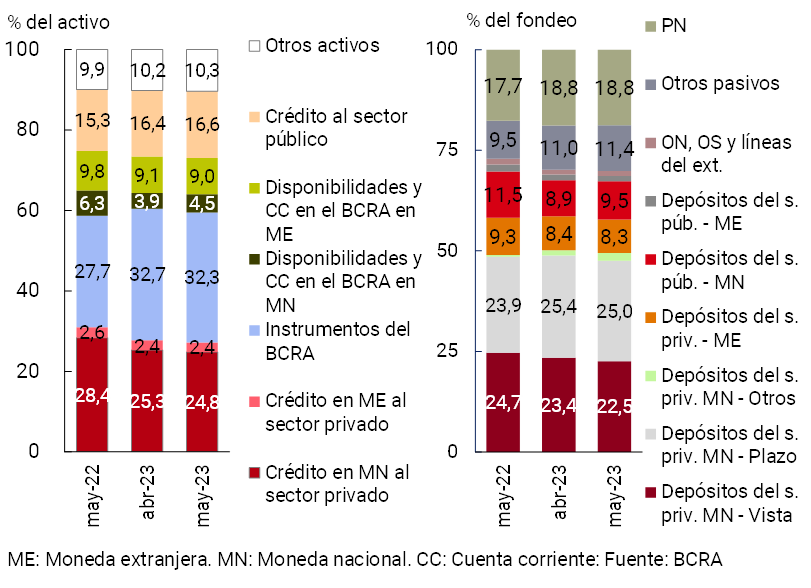
In terms of the composition of assets, in May the relative weight of the entities available and current accounts at the BCRA in pesos increased, while the weighting of credit in national currency to the private sector and BCRA instruments decreased (see Chart 5). In terms of components of the total funding of the group of entities, in the month the relative importance of public sector deposits in pesos increased, while the relevance of private sector deposits in pesos decreased: demand accounts and, to a lesser extent, term placements.
Graph 5 | Composition of assets and total
funding Financial system – Share %
The sector’s foreign currency mismatch, measured by the estimated spread between assets and liabilities in this denomination, fell by 2.6 p.p. of regulatory capital (PRC) in May, to 32.6% (+21.8 p.p. y.o.y.)7. On the other hand, it is estimated that the differential between the items of the aggregate balance sheet with CER adjustment (and in UVA) stood at 64.3% of the PRC in the period for the aggregate of the sector, 7.3 p.p. more than in April (-6.2 p.p. y.o.y.).
III. Portfolio quality
The financial system’s gross exposure to the private sector (including domestic and foreign currency) stood at 27.2% of assets in May, down 0.5 p.p. (-3.7 p.p. y.o.y.). The monthly performance was generalized among homogeneous groups of financial institutions (see Graph 6)8. The balance of credit to the private sector net of forecasts for the aggregate of entities represented 26.1% of assets in the month (-0.5 p.p. monthly and -3.6 p.p. y.o.y.).
Graph 6 | Credit balance to the private sector / Assets
By group of financial institutions
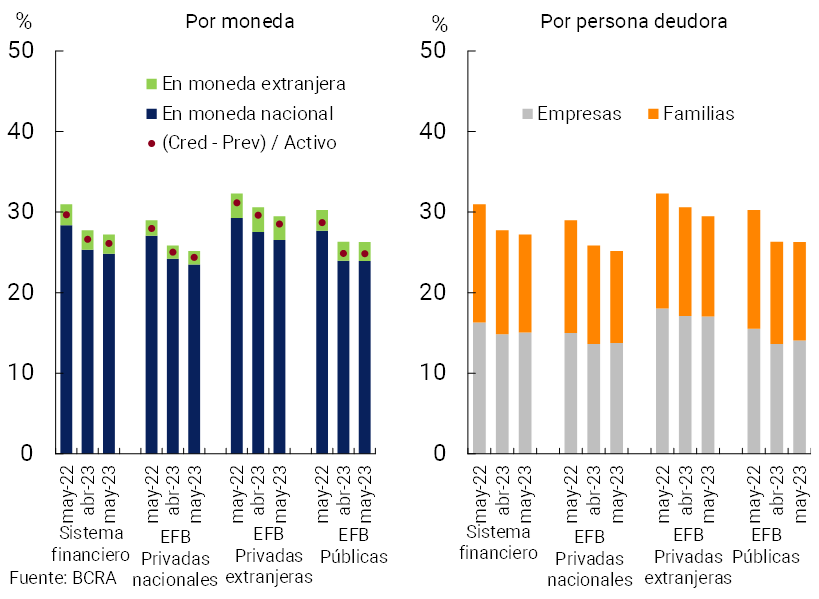
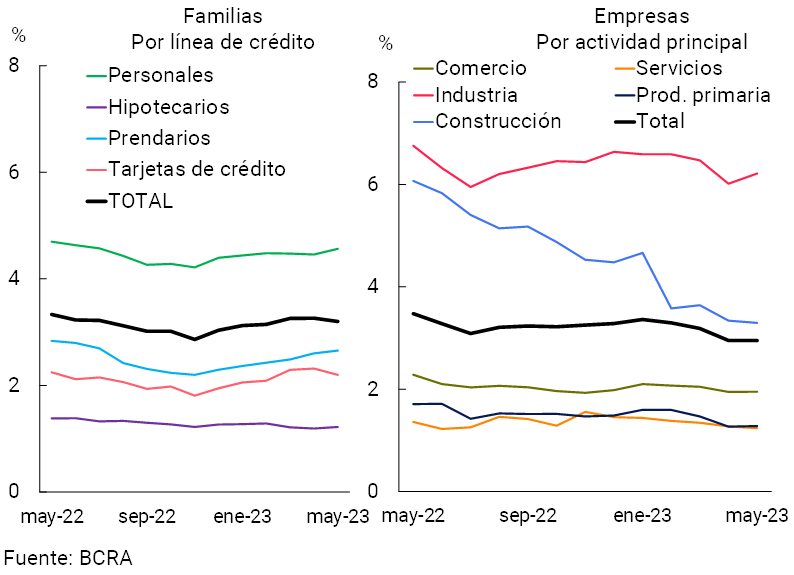
In May, the irregularity ratio of credit to the private sector stood at 3%, with no changes in magnitude compared to the April record (-0.1 p.p.) and 0.3 p.p. lower than the level of the same month in 2022. The irregularity ratio of the aggregate of entities did not show significant variations since mid-2022 and was in line with the average record of Latin America and other emerging economies (see Chart 7). When distinguishing by debtor, in May the indicator of delinquency of families totaled 3.2% (-0.1 p.p. in the month), with a slight decrease in the ratio of card financing (see Graph 8). The NPL ratio for loans to companies also remained stable in the month, at around 3%, a performance reflected in most economic sectors (see Chart 8).
Figure 7 | Credit Irregularity
Ratio International Comparison *
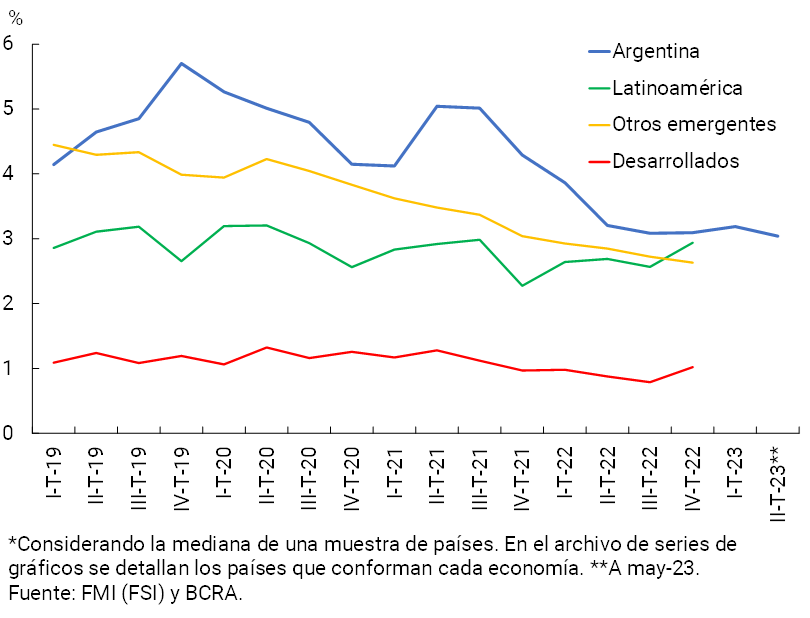
Figure 8 | Irregularity ratio of credit to the private sector – Financial system
The sector maintained comfortable levels of forecasting in May. The total forecasts for the financial system totaled 3.9% of the total portfolio to the private sector (in line with the April record and -0.2 p.p. y.o.y.) and 128% of that classified as in an irregular situation (+0.9 p.p. monthly and +7.1 p.p. y.o.y.). In the period, the balance of forecasts attributable to the portfolio in an irregular situation9 continued to cover almost all of this portfolio at the aggregate level (94.1%, +0.6 p.p. month-on-month and +3.9 p.p. y.o.y.).
IV. Liquidity and solvency
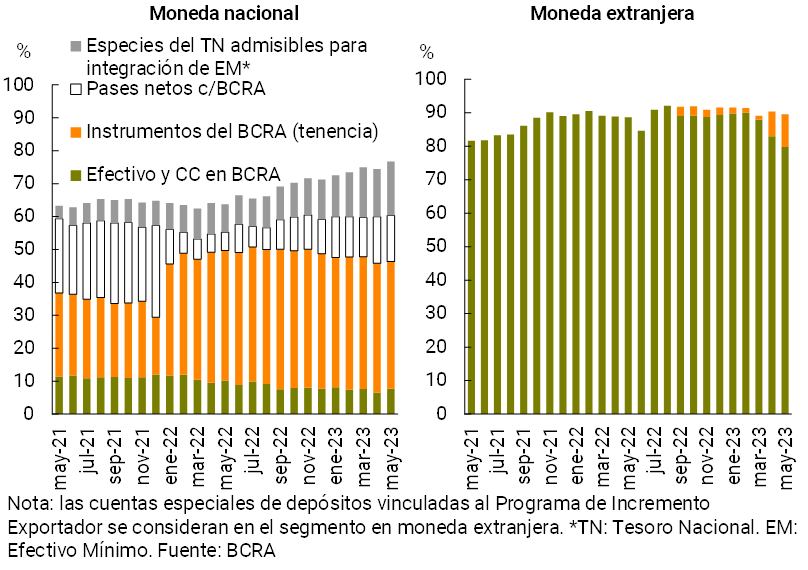
In May, the financialsystem’s broad-based liquid assets 10 amounted to 78.7% of deposits, increasing 1.9 p.p. compared to April. The indicator for items in pesos stood at 76.7%, and at 89.5% for foreign currency (see Graph 9). With regard to the composition of liquidity in national currency, between the end of the month the participation of the National Treasury species eligible for the integration of Minimum Cash and the balance of the current accounts that the entities have in this Institution increased, while the weighting of the BCRA’s instruments was reduced. Ample liquidity (in pesos and foreign currency) in terms of deposits increased 11.2 p.p. compared to May 2022.
Graph 9 | Liquidity of the financial
system As a % of deposits
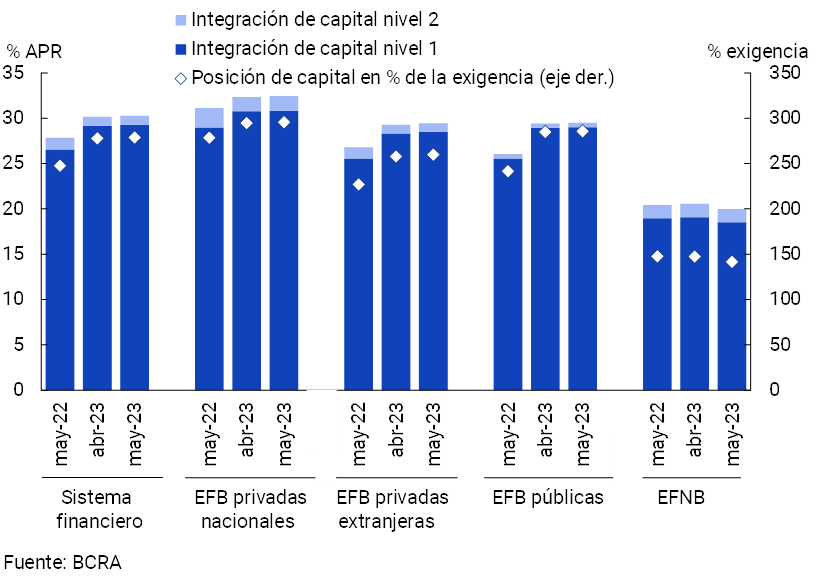
The sector’s solvency indicators remained at high levels compared to the average of the last 10 years. The integration of regulatory capital (RPC) of the aggregate of entities stood at 30.3% of risk-weighted assets (RWA) in the period, with no changes in magnitude compared to April (+0.1 p.p. monthly and +2.4 p.p. y.o.y., see Chart 10). 96.8% of the PRC was accounted for by Tier 1 capital, with a greater capacity to absorb potential losses. The capital position – regulatory capital net of the minimum regulatory requirement – totaled 278.8% of the requirement at the systemic level (1.1 p.p. more than in April and +31.2 p.p. y.o.y.) and 44.6% of the balance of credit to the private sector net of forecasts, well above the average of the last 10 years (19%).
Figure 10 | Integration of regulatory
capital By group of financial institution
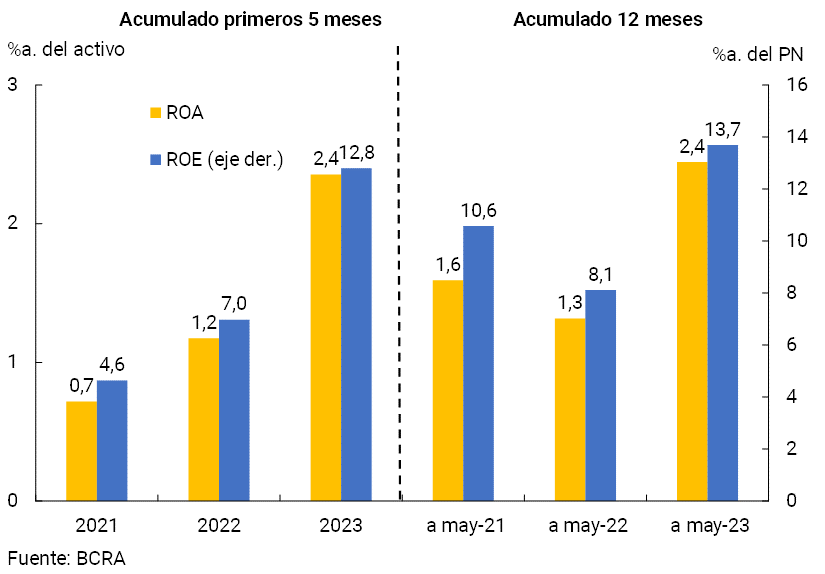
With regard to the sector’s internal capital generation, the financial system maintained positive profitability indicators in 2023. The total comprehensive profit in homogeneous currency of the financial system for the accumulated in the last 12 months to May was equivalent to 2.4% of assets (ROA) and 13.7% of equity (ROE). These indicators increased in a year-on-year comparison (see Chart 11) mainly due to a higher financial margin (increase in results from securities, interest income and price differences, all tempered by higher interest expenses). This movement was partially offset by higher losses due to exposure to currency items and tax burdens.
Figure 11 | Comprehensive total profit in homogeneous currency of the financial system
V. Payment system
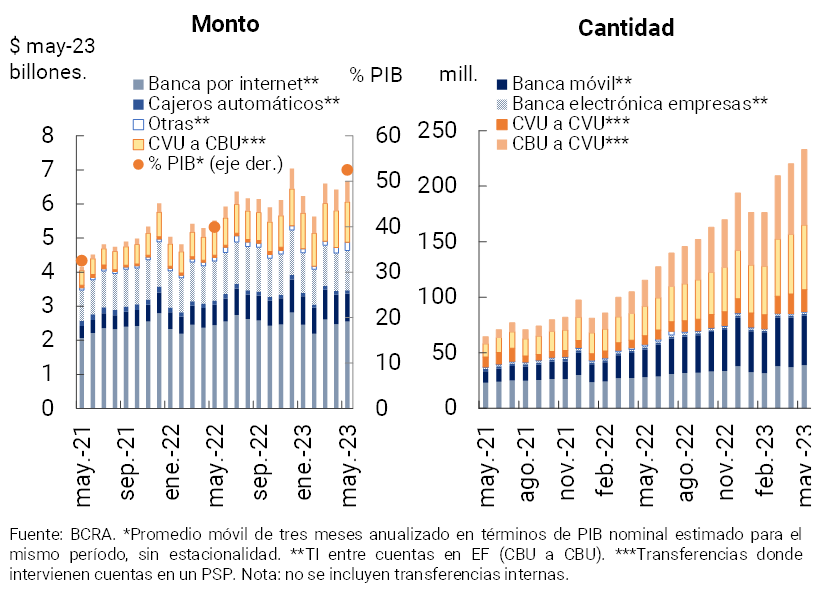
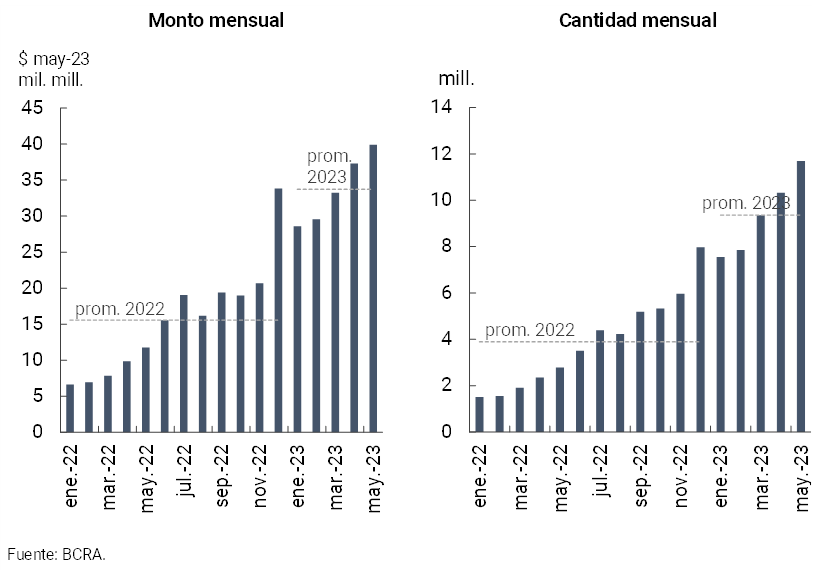
In May, immediate transfers (TI) increased 5.8% in quantities and 2.8% in real amounts (+104.1% YoY and +21.6% YoY, respectively). IT among CBUs grew 1.7% in both quantities and real amounts in the month (+53.6% YoY and +7.2% YoY respectively). In the period, ITs involving the use of CVUs increased relatively more: 8.4% in quantities and 5.7% in real amounts (+153.5% YoY and +78.8% YoY, respectively). It is estimated that the amount of IT operated in the last three months (annualized) represented 52.5% of GDP (+12.6 p.p. compared to the same month of the previous year, see Chart 12)11.
Figure 12 | Instant Transfers (TI)
In May, Payments with Transfer (PCT) through interoperable QR codes grew 13.2% in amounts and 7% in real amounts. In year-on-year terms, these operations increased by more than 320% in quantities and almost 240% in real amounts (see Chart 13), reflecting the effect of the measures timely implemented by the BCRA that promote the acceptance of payments with any digital wallet12.
Figure 13 | Payments with transfer (PCT) through interoperable QR codes
In April (latest available information) debit card operations were reduced, both in quantity and in real amounts. However, in year-on-year terms, these transactions increased 12.3% in quantity and 2.8% in real amounts. In terms of modality, e-commerce transactions were reduced, while face-to-face operations continued to grow both in the month and year-on-year. On the other hand, in April (latest available information) credit card operations decreased in quantities, although they accumulated year-on-year growth. The actual amounts of credit card transactions showed little change both monthly and year-on-year13.
In May, partly due to seasonal reasons, check clearing increased in both the number of transactions and the actual amounts. This performance was reflected in the physical checks and in the ECHEQs. Compared to the same month of the previous year, there was a growth in the quantity (+38.5%) and in the actual amounts (+17.5%) of cleared ECHEQs, while physical checks continued to decline. In this way, the ECHEQs continued to increase their participation to 37.6% of the total compensated in amounts and 63.1% in amounts. It is estimated that the amount of checks cleared in the last three months (annualized) was equivalent to 25.4% of GDP (+0.6 p.p. compared to the same month of the previous year)14.
The ratio of rejection of checks due to lack of funds in relation to the total compensated decreased in terms of quantities and in real amounts compared to April, remaining slightly higher in a year-on-year comparison (+0.13 p.p. y.o.y. to 0.81% in quantities and +0.01 p.p. y.o.y. to 0.65% in amounts). The average of this indicator so far in 2023 (0.82% for quantities and 0.58% for real amounts) was slightly above the average of the previous two years.
References
1 With regard to foreign currency items, in May credit to the public sector increased, public sector deposits were reduced, while credit to the private sector and availabilities decreased. At the same time, through the “Export Increase Program”, in May there was an increase in the real balance of deposits with variable remuneration depending on the evolution of the exchange rate, generating as a counterpart an increase in the holding of the BCRA’s Internal Bills in dollars and liquidable in pesos by the Reference Exchange Rate (LEDIV) at zero rate.
2 Includes principal adjustments and accrued interest.
3 For more information, see Box 1 of the June 2023 Financial Stability Report (IEF I-23).
4 Expressed in currency of origin.
5 Excluding the effect of deposits with variable remuneration depending on the evolution of the exchange rate (see Footnote 1), the fall in deposits in pesos would reach 1.7% in real terms in the period.
6 Including deposits with variable remuneration depending on exchange rate developments, in May private sector deposits in foreign currency would have increased by 5.9% (in currency of origin).
7 Includes forward purchase and sale transactions of foreign currency classified off-balance sheet. Liabilities include deposits that have variable remuneration depending on the evolution of the exchange rate – associated with the Export Increase Program.
8The balance of financing to the private sector in pesos represented 24.8% of total assets (-0.5 p.p. monthly and -3.5 p.p. y.a.), while the weighting of credit to the private sector in foreign currency stood at 2.4% (in line with the previous month’s record and -0.2 p.p. y.o.y.).
9 Total net forecasts of the minimum regulatory forecasts for debtors in situations 1 and 2, according to the criteria of the minimum regulatory forecasts for risk of uncollectibility.
10 Considera disponibilidades, instrumentos del BCRA en moneda nacional y extranjera, y la totalidad de títulos públicos habilitados para utilizar como integración de efectivo mínimo.
11 En mayo las operaciones mediante TI promediaron casi $28.200. Las TI entre CBU alcanzaron un promedio de unos $53.600 y las TI donde interviene CVU un promedio de $13.300.
12 En mayo las operaciones mediante QR interoperables promediaron unos $3.400.
13 Los promedios de los montos por transacción para tarjetas de débito alcanzaron $4.780 (comercio electrónico: $4.830 y comercio presencial (POS): $5.050); tarjetas de crédito: $10.500.
14 El promedio de cheques compensados fue de $ 643,700, mientras los cheques físicos alcanzaron un promedio de $ 380,700 y los ECHEQs de $1.079.300.
Share on


