Summary
At the end of the first quarter of 2025, financial intermediation with the private sector continued to expand. In March, the real balance of credit in pesos to companies and families grew 3.3% (88.9% YoY), with increases in all groups of financial institutions. The balance of credit in foreign currency to the private sector increased 4% in the month in the currency of origin (180.2% YoY). Taking into account all currencies (domestic and foreign), the real balance of financing to the private sector increased 2.9% compared to February (94.5% YoY). With this monthly performance, the real growth of credit to the private sector during the first quarter of 2025 (10.4%) exceeded the variations recorded for the same period in the last twenty years, both at the aggregate level and in all groups of financial institutions.
Credit to the private sector continued to expand its importance in the balance sheet of the financial system. Towards the end of the first quarter, bank financing to the private sector accounted for 39.6% of the assets of all entities (+1.5 p.p. compared to February and +17.2 p.p. y.o.y.). The irregularity ratio of credit to the private sector stood at 2% in March, increasing 0.2 p.p. in the month. The indicator of delinquency of financing to families totaled 3.3% and that of loans to companies 0.9%. The total forecast balance of the financial system represented 3% of the total credit balance to the private sector and 147.6% of the balance in an irregular situation.
The real balance of deposits in pesos of the private sector remained unchanged in magnitude compared to February (20.1% real y.o.y.). The real balance of demand deposits in pesos increased 4.2% in the month (11.4% real y.o.y.), mainly due to the interest-bearing segment, while the real balance of time deposits in pesos decreased 4.1% in March (although it increased 32.1% real y.o.y.).
In a context of sustained credit growth, the liquidity indicators in national currency of the financial system fell in March. The broad liquidity ratio stood at 34.2% of deposits in pesos in the period, 1.9 p.p. less than in February. The indicator that considers only availabilities in pesos totaled 10.5% of deposits in national currency, decreasing 0.8 p.p. in the month. The liquidity indicator for the foreign currency segment showed no changes in magnitude in March (63.4% of deposits in foreign currency for the system).
Solvency indicators for all banks remained high at the end of the first quarter. In March, the capital integration ratio of the financial system totaled 31.9% of risk-weighted assets (+2.9 p.p. compared to February and -7.5 p.p. y.o.y.) and the capital position ratio reached 297% of the regulatory requirement (+35 p.p. monthly and -99 p.p. y.o.y.). During the month, the regulatory modifications duly ordered by the BCRA on the calculation of the requirement for operational risk (Communication A 8068) came into force, in line with the guidelines of the Basel Committee.
In the accumulated 12 months to March, the financial system accumulated a total comprehensive result in homogeneous currency equivalent to 2.5% of assets (ROA) and 9.7% of net worth (ROE), these levels were reduced in a year-on-year comparison. In the first quarter of 2025, the banks as a whole accumulated slight negative results (-0.4% annualised assets).
In the first quarter, electronic payment methods continued to expand. In March, immediate transfers of funds (TI) increased, accumulating a year-on-year increase of 28% in quantity and 39.4% in real amounts. Payment with Transfer (PCT) operations by QR code grew in the month, accumulating growth of 98.4% YoY in quantities and 136.4% YoY in real amounts. The clearing of electronic checks (ECHEs) also grew in the period (40.3% YoY in amounts and 48.3% YoY in real amounts). ECHEQs represent 54.4% of the total checks cleared in amounts and 78.8% of the amounts.
Financial intermediation activity
In March, the financial intermediation of all banks with the private sector continued to expand. According to the most relevant differences in the balances of the balance sheet of the financial system on the items in pesos – in homogeneous currency – in March the fall in liquidity and credit to the public sector and, to a lesser extent, the increase in private sector deposits were the main sources of resources. These funds were mainly used to increase the real balance of credit to the private sector. In relation to the foreign currency segment, the main movements of the month were the reduction in the balance of liquid assets and financing to the public sector, with a counterpart in a fall in the balance of deposits in the private sector and an increase in credit to this sector.
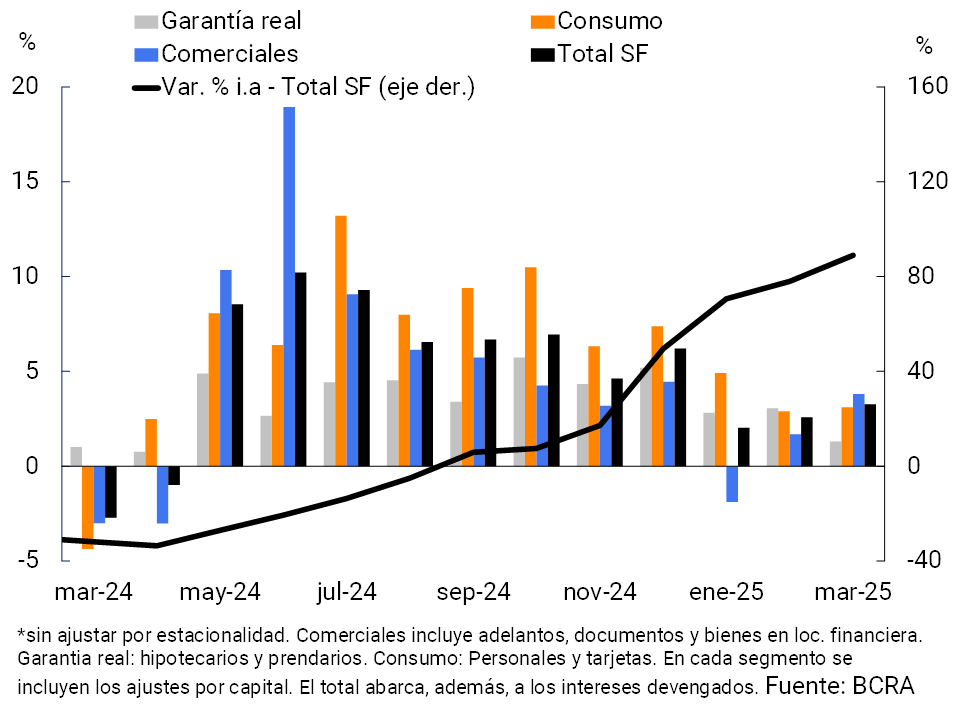
In March, the real balance of credit in pesos to the private sector increased 3.3% compared to the previous month (see Graph 1). 1 The monthly increase was widespread in all groups of financial institutions, with greater relative dynamism in private banks and EFNBs. All credit segments grew in the month, highlighting the increase in commercial loans (+3.8% in real terms) and, to a lesser extent, in consumer lines and those with real collateral (+3.1% real and +1.3% in real terms, respectively). In year-on-year terms, the real balance of financing in pesos to the private sector increased 88.9% in March. The positive year-on-year performance was broad-based across groups of institutions, with higher relative growth in NBEFs and domestic private banks.
Graph 1 | Credit balance to the private sector in pesos
In real terms*
As for the segment in foreign currency, the balance of credit to the private sector increased 4% in March – in currency of origin. This increase was mainly explained by trade lines (documents and pre-financing for exports). In a year-on-year comparison, the balance of loans in foreign currency to the private sector accumulated a growth of 180.2%, with generalized increases in all groups of financial institutions (highlighting national private banks).
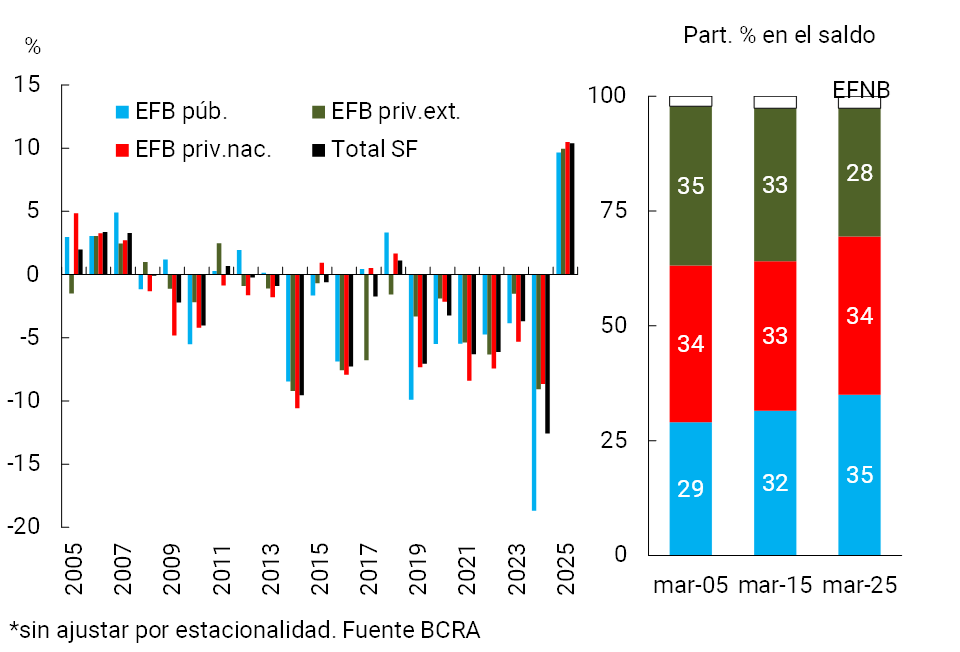
When considering all currencies (domestic and foreign), the real balance of total credit to the private sector accumulated an increase of 2.9% in the month and 94.5% in a year-on-year comparison. The positive performance of total bank financing to companies and households since last May was also reflected in marked real growth in the first quarter of 2025 (+10.4% between December and March) in all bank groups (see Chart 2). Thus, the quarterly performance significantly exceeds the growth rates recorded for the same period in the last twenty years, both at the aggregate level and in all groups of entities.
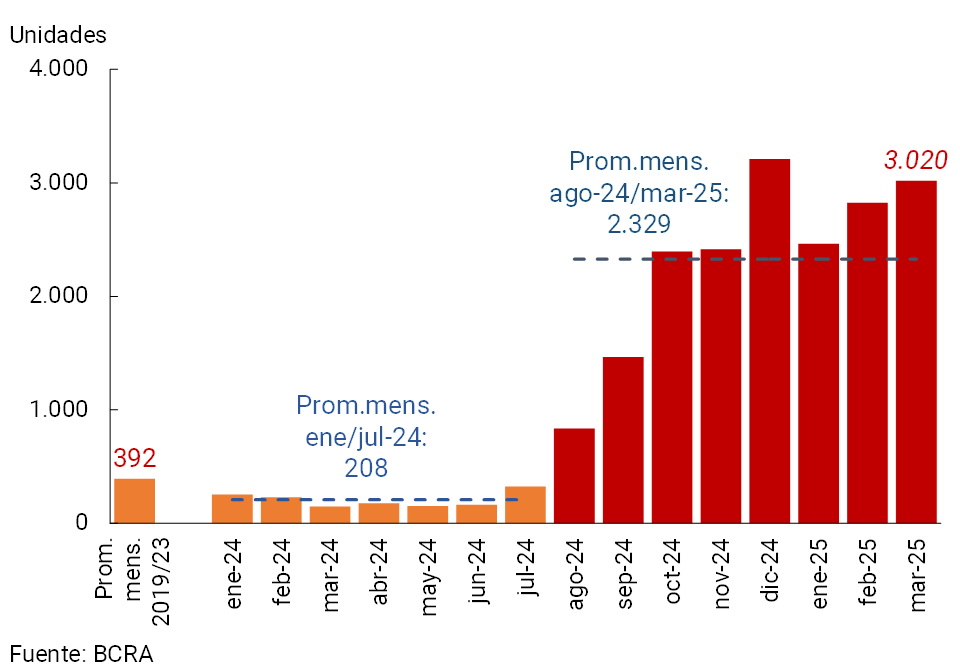
The balance of mortgage credit in pesos to the private sector continued to grow in March: 1.5% in real terms compared to February (35.8% y.o.y. in real terms) – including capital and adjustment of loans in UVA. In the month, it is estimated that more than 3,000 new mortgage debtors joined the financial system (registrations of individuals, see Graph 3), reaching a total of approximately 19,600 new debtors since March 2024.
Graph 2 | Real balance of total credit to the private sector*-
Changes in the first quarter
Graph 3 | Estimation of mortgage registrations (individuals) – Financial
system Financial system
In March, the real balance of deposits in pesos in the private sector remained unchanged from last month (+0.1% real monthly and +20.1% real y.o.y., see Chart 4). The real balance of demand deposits increased by 4.2% in the month (+11.4% real YoY), with a higher relative growth in interest-bearing accounts based on the behavior of FCIs. On the other hand, time deposits 2 fell by 4.1% in real terms in March (+32.1% real YoY), a performance explained by term investments (-16.6% real monthly).
Graph 4: Real balance of private sector deposits in pesos*.
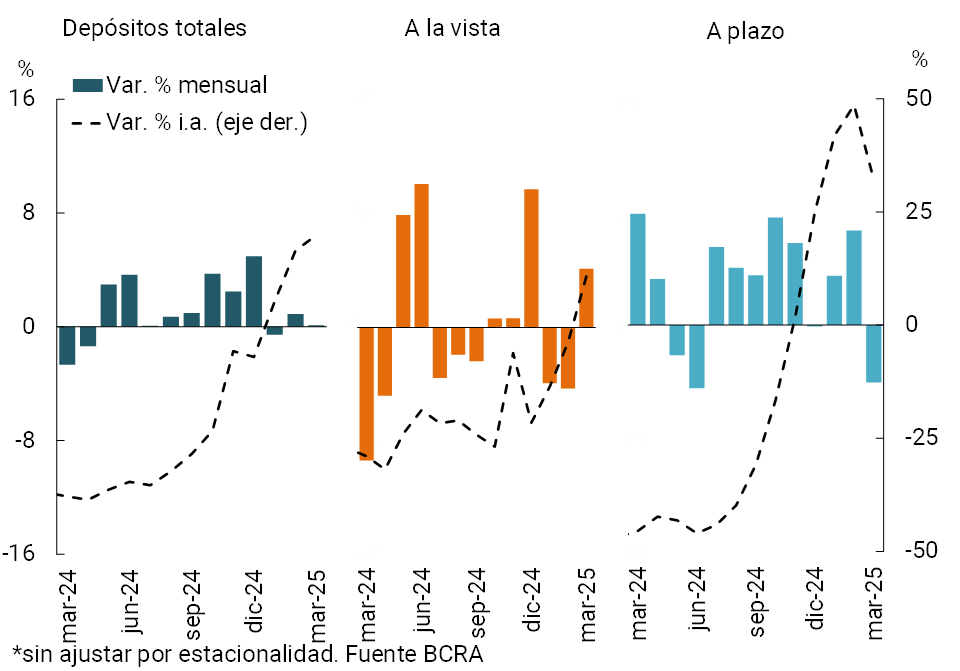
On the side of the foreign currency segment, in March the balance of private sector deposits decreased 3.5% – in currency of origin – and accumulated a year-on-year increase of 73.4%. Considering all sectors and currencies, the real balance of total deposits decreased 1.8% in the month (+16.6% real YoY).
II. Evolution and aggregate composition of the balance sheet
The balance sheet of the financial system fell slightly in real terms in the month. The assets of the aggregate of entities decreased 1% in real terms in March, mainly due to the performance of public banks. However, in the last year the asset grew 9.9% in real terms, driven by private banks.
The most relevant monthly changes in the structure of the asset were associated with the process of crowding in credit to the private sector. In the month, the share of private sector financing in total assets increased again and exposure to the public sector was reduced, thus widening the gap between the two to 5.6 p.p. of assets (39.6% private sector vs. 34% public sector, see Chart 5). Regarding the composition of funding, between the end of the month the participation of demand deposits in pesos of the private sector increased. Meanwhile, private sector deposits in foreign currency and time deposits in pesos reduced their relative weight in the sector’s funding in the period.
Chart 5 – Composition of assets and funding
Financial system – In % share
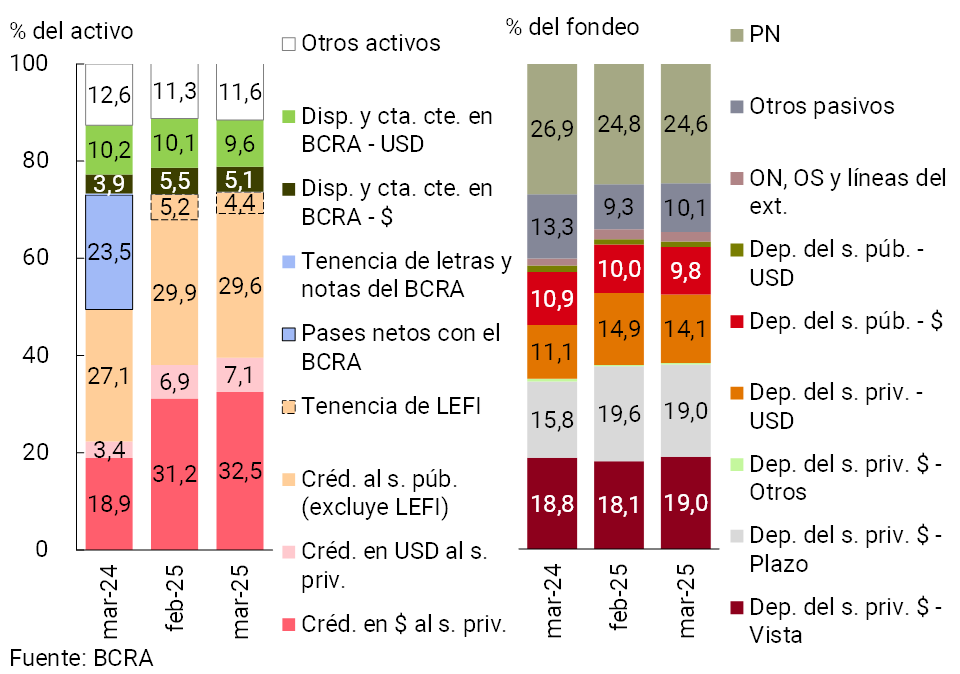
As of March, the weighting of foreign currency assets stood at around 19.5% of total assets (-0.6 p.p. month-on-month and without significant changes in a year-on-year comparison), while liabilities represented 17.8% of total funding (-0.8 p.p. monthly and +2.7 p.p. y.o.y.). The estimated spread between foreign currency assets and liabilities (including off-balance sheet foreign currency purchase/sale transactions) totalled 5.8% of the sector’s regulatory capital in the month (+0.9 p.p. monthly and -11.8 p.p. y.o.y., see Chart 6).
Graph 6 | Spread between assets and liabilities
In % of PRC
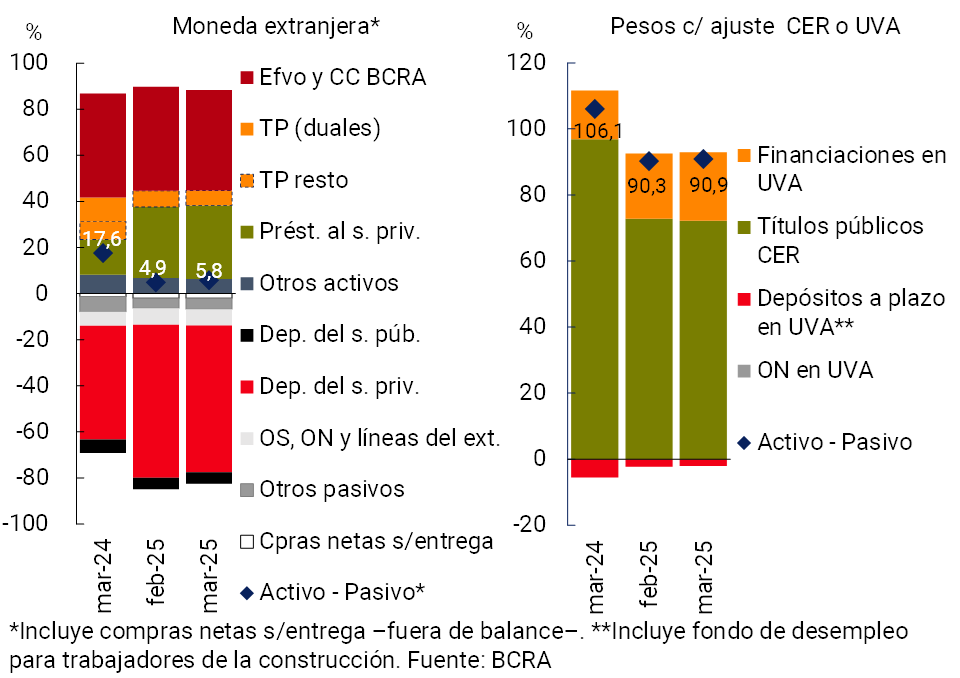
When considering the items whose capital adjusts by CER (or agreed in UVA), it is estimated that the assets of the financial system represented 20.5% of the total as of March (-0.2 p.p. in the month and -4.6 p.p. y.a.), while liabilities totaled only 0.4% of total funding (-0.1 p.p. monthly and -0.8 p.p. y.o.y.). In the month, the estimated difference between these assets and liabilities stood at 90.9% of the regulatory capital of the financial system (+0.7 p.p. monthly and -15.1 p.p. y.o.y., see Chart 6).
III. Portfolio quality
The exposure of the financial system to the private sector continued to increase at the end of the first quarter of the year. The balance of credit to the private sector represented 39.6% of total assets in March, 1.5 p.p. above last month’s level (+17.2 p.p. y.o.y.; see Chart 7). The monthly increase was disseminated among the groups of banks and was mainly explained by the segment in pesos. 3
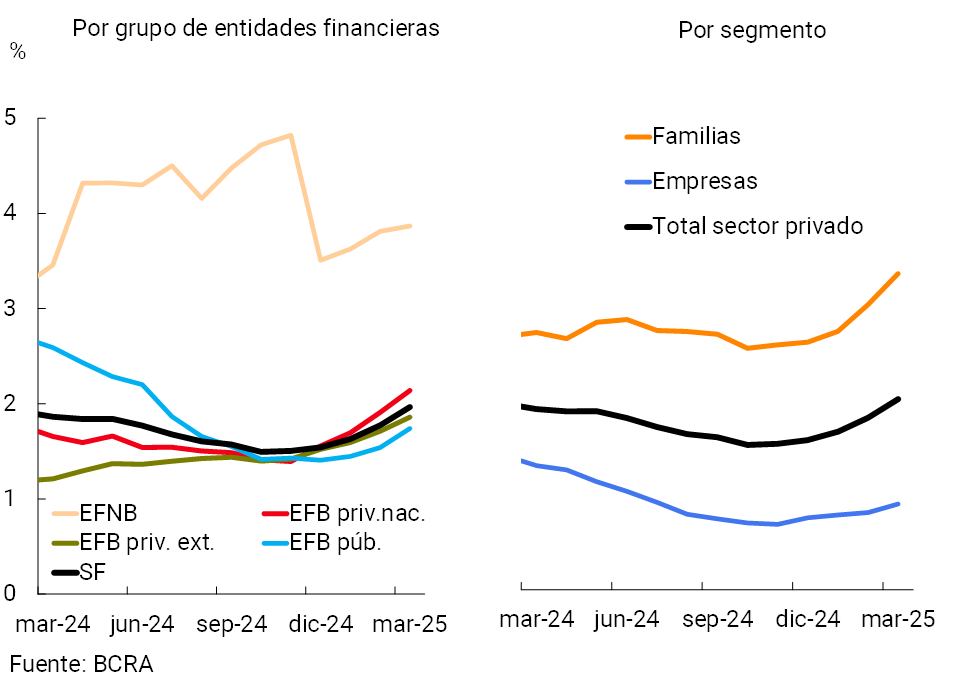
The irregularity ratio of credit to the private sector totaled 2% for the financial system in March, 0.2 p.p. more than in February (see Chart 8). The monthly dynamics of this indicator were generalized among the different groups of entities and types of debtors. At the end of the first quarter, the NPL ratio for financing to households stood at 3.3% (+0.3 p.p. monthly) and that of loans to companies at 0.9% (+0.1 p.p. monthly). In year-on-year terms, the non-performing loan ratio for the entire private sector did not change in magnitude (+0.1 p.p.).
Figure 7 | Credit balance to the private sector in terms of assets
By group of financial institutions
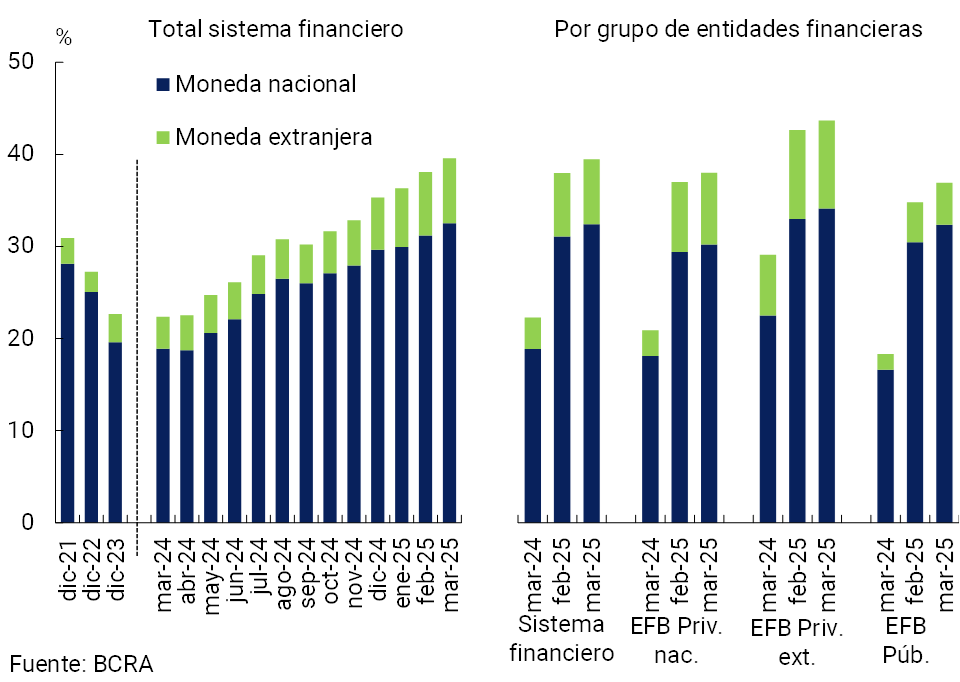
Chart 8: Private sector credit irregularity ratio
The ratio between bad debt charges (annualized -y.-) and the balance of credit to the private sector for the financial system also grew in the month: 0.4 p.p. to 4.7%a. Compared to the end of 2024, this indicator increased by 1.4 p.p. (see Graph 9), however, it was 0.4 p.p. below the March 2024 record.
Figure 9 | Forecast balance and annualized monthly flow of bad debt chargesas a % of credit to the private sector – Sistema financiero
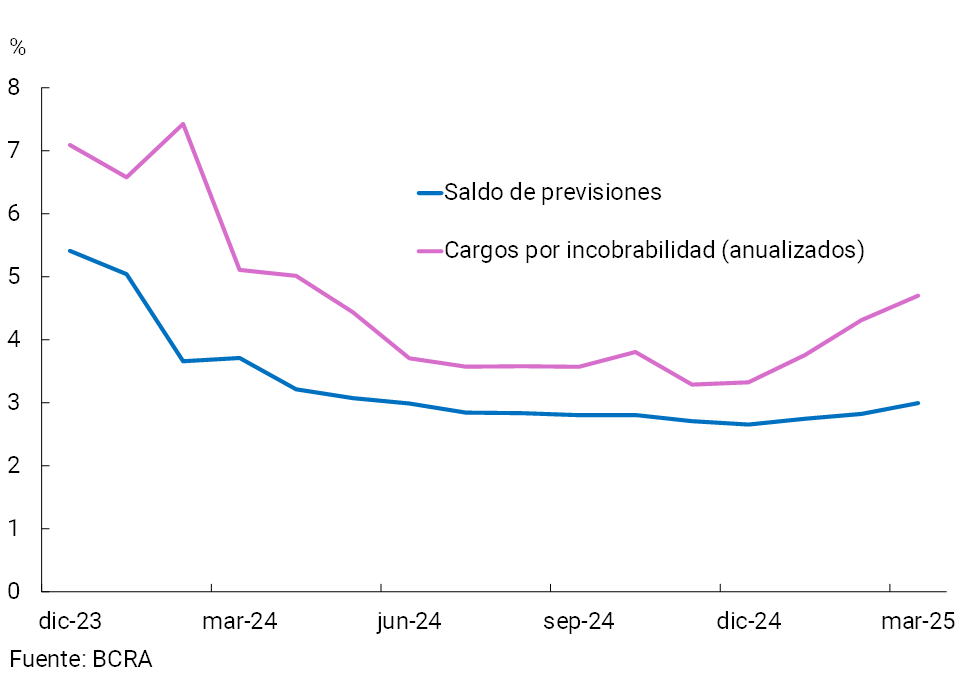
The group of entities maintains high forecasting. The forecasts for the financial system reached 3% of total financing to the private sector and 147.6% of the balance in an irregular situation.
IV. Liquidity and solvency
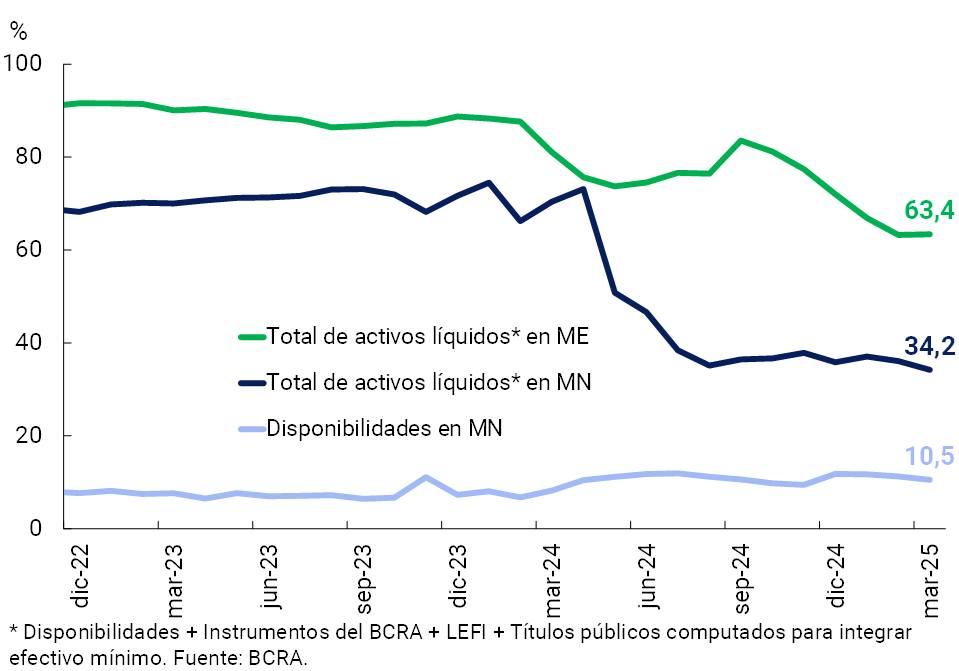
In a context of sustained growth in credit to the private sector, the liquidity indicators in local currency of the financial system fell in March. The broad liquidity ratio 4 5 stood at 34.2% of deposits in pesos in the period, 1.9 p.p. less than in February, while the indicator that considers only availabilities totaled 10.5% of deposits in national currency at the end of the first quarter, 0.8 p.p. below the level of February (see Chart 10). Between the end of the month, the balances of the LEFI and current accounts in pesos at the BCRA fell in real terms, while the balance of public securities used to integrate minimum cash increased. The liquidity indicator for the segment of the balance sheet denominated in foreign currency did not show any changes in magnitude in the month, standing at around 63.4% of deposits at the systemic level.
Figure 10 | Liquidity
indicators Financial system – As % of deposits in each denomination
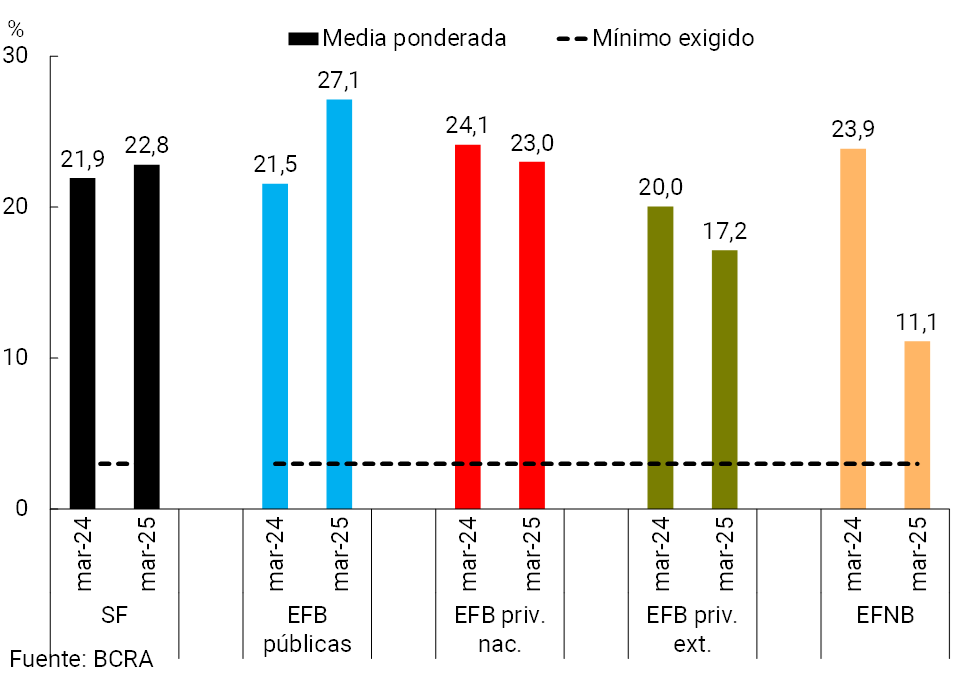
In relation to the minimum capital regulations, in March the readjustment of the calculation of the requirement for operational risk6 began to take effect, in line with the guidelines duly defined by the Basel Committee. In particular, at the local level, two groups of financial institutions are established: for Group 1 entities, the application of a standardised method defined on the basis of the entity’s results and its historical losses is established, while for Group 2 the current basic indicator method is maintained. 7 In this context, in March the capital integration ratio of the financial system totalled 31.9% of risk-weighted assets (+2.9 p.p. more than in February) and the capital position ratio 297% of the regulatory requirement (+35 p.p. monthly). In the first quarter of the year, the leverage ratio – defined according to the Basel guidelines – stood at 22.8% at the aggregate level, 0.9 p.p. above the record of a year ago, a dynamic driven by public banks (see Graph 11).
Figure 11 | Leverage
ratio Capital 1 in terms of a broad measure of exposure
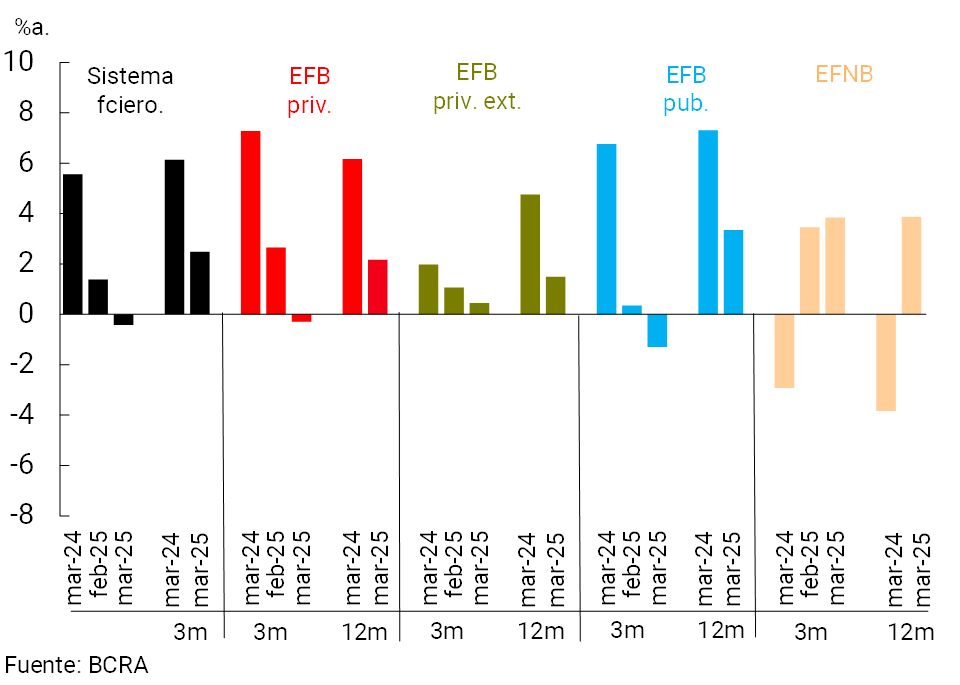
The financial system recorded slight losses in the first quarter of the year (-0.4%y/y) of assets,8 reflected in public and private national banks (see Chart 12). In recent months, there was a lower comprehensive financial margin, higher charges for uncollectibility and an increase in monetary losses, measured in terms of total assets. This dynamic was partially offset by lower administrative expenses. In the 12-month cumulative to March, the sector accumulated an ROA of 2.5% (ROE of 9.7%), 3.7 p.p. lower than a year ago (-21.4 p.p. y.o.y. in ROE).
Figure 12 | 3 and 12 Month Cumulative ROADash
By Financial Institution Group
V. Payment system
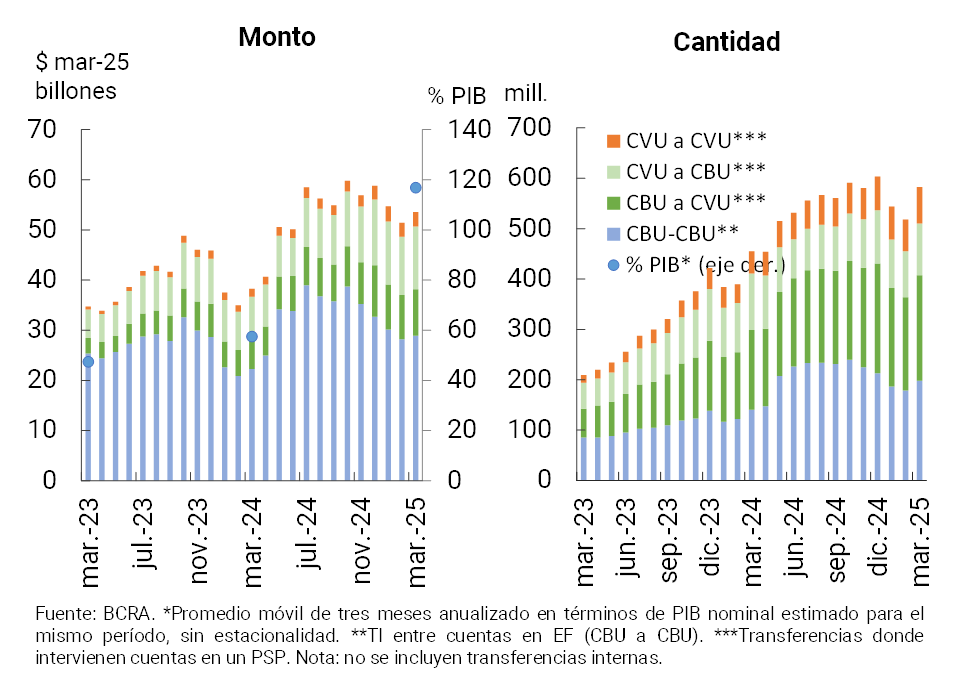
In March, immediate transfers (TI) showed a recovery compared to February. In the last twelve months, IT grew significantly: 28% in quantity and 39.4% in real amounts (see Graph 13), with greater relative dynamism in transactions between accounts in payment service providers (CVU to CVU). 9 10In the last 12 months, IT continued to gain relevance in the economy, representing 116.9% of GDP (+59.4 p.p. y.o.y.).
Chart 13 – Immediate Transfers (IT)
Payments with Transfer (PCT) transactions by QR code increased 7.4% in amounts and 3.4% in real amounts compared to the previous month. In year-on-year terms, these operations grew 98.4% in quantities and 136.4% in real amounts. 11It is estimated that PCTs with QR represented approximately 2.9% of GDP, which implies an increase of 2.1 percentage points in the last twelve months.
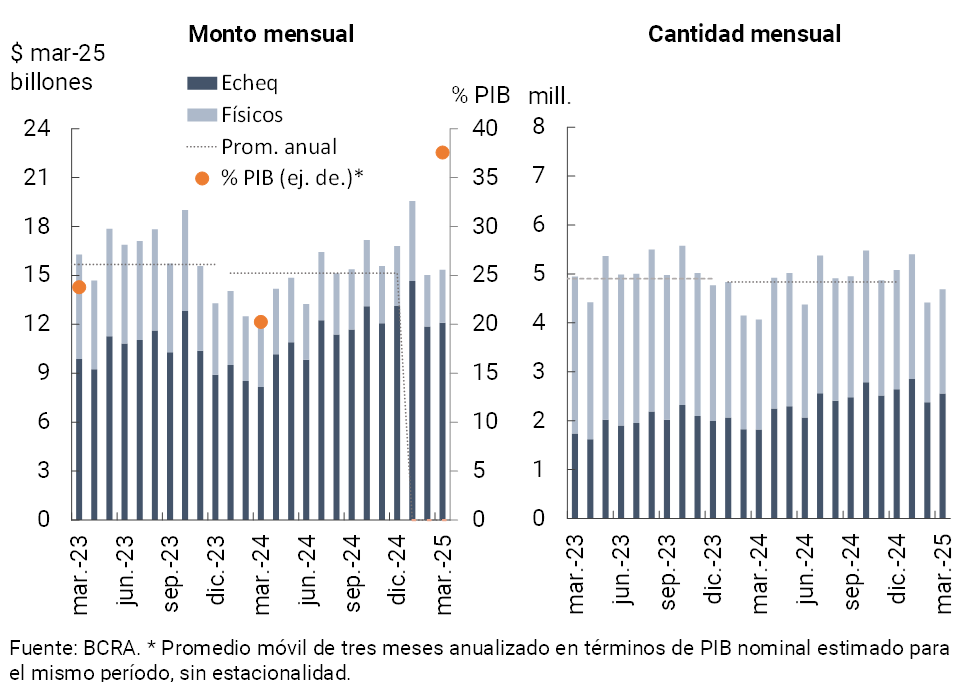
The clearing of checks also increased in the month: +6.2% in amounts and +2.2% in real amounts (see Chart 14). 12 In year-on-year terms, ECHEQs continued to consolidate themselves as the predominant modality, with a growth of 40.3% YoY in quantities and 48.3% YoY in real amounts. Currently, ECHEQs represent 54.4% of the total checks cleared in quantities and account for 78.8% of the amounts. This performance led to a greater relevance of check clearing with respect to total economic activity, reaching a level equivalent to 37.6% of GDP, which represents a year-on-year increase of 17.3 percentage points.
Graph 14 : Check clearing
The ratio of rejection of checks due to lack of funds (measured on the total compensated) increased again in March, both in quantities and in actual amounts. In the month it stood at 1.18% in terms of quantities (+0.23 p.p. monthly) and 0.78% in terms of amounts (+0.12 p.p. monthly). Both indicators are above the levels recorded in the same month of the previous year (+0.65 p.p. and +0.46 p.p., respectively), and also above the average observed so far in 2024.
References
1 Changes in balance sheet (not seasonally adjusted). Includes principal adjustments and accrued interest.
2 The balance of time deposits includes time deposits and term investments.
3 In March, total credit to households and companies net of forecasts totaled 38.5% of assets, 1.5 p.p. and 17 p.p. more than in February and the same period of 2024, respectively.
4 It considers availabilities (cash and current account at the BCRA), fiscal liquidity bills (LEFI), and the balance of the types of public securities that the entities compute as integration of Minimum Cash (until mid-2024 it incorporated BCRA instruments).
5 By incorporating the holding of LECAPs that mature within the next 3 months, the broad indicator of liquidity in national currency would amount to 44.3% of deposits in pesos at the systemic level (-0.6 p.p. monthly).
6 See Communication A 8068.
7 In addition, the restatement of items in homogeneous currency for both groups of entities is incorporated.
8 Comprehensive total results in homogeneous currency.
9 In year-on-year terms through March, the amount of IT among CVUs increased 63.5% (82.9% in real amounts), while those among CBUs grew 41% (28.1% in real amounts). On the other hand, CBU to CVU operations registered an increase of 32.6% year-on-year (47.5% in real amounts), while those from CVU to CBU showed a drop of 8.6% year-on-year, although with an increase of 54.6% in real amounts.
10 In March, the average value of IT was $89,700.
11 In March, the average value of PCTs through QR codes was $17,900.
12 In March, the average amount of cleared checks was $3.3 million ($1.5 million in the physical format and $4.7 million in ECHEQs).
Share on


