I. Financial intermediation activity
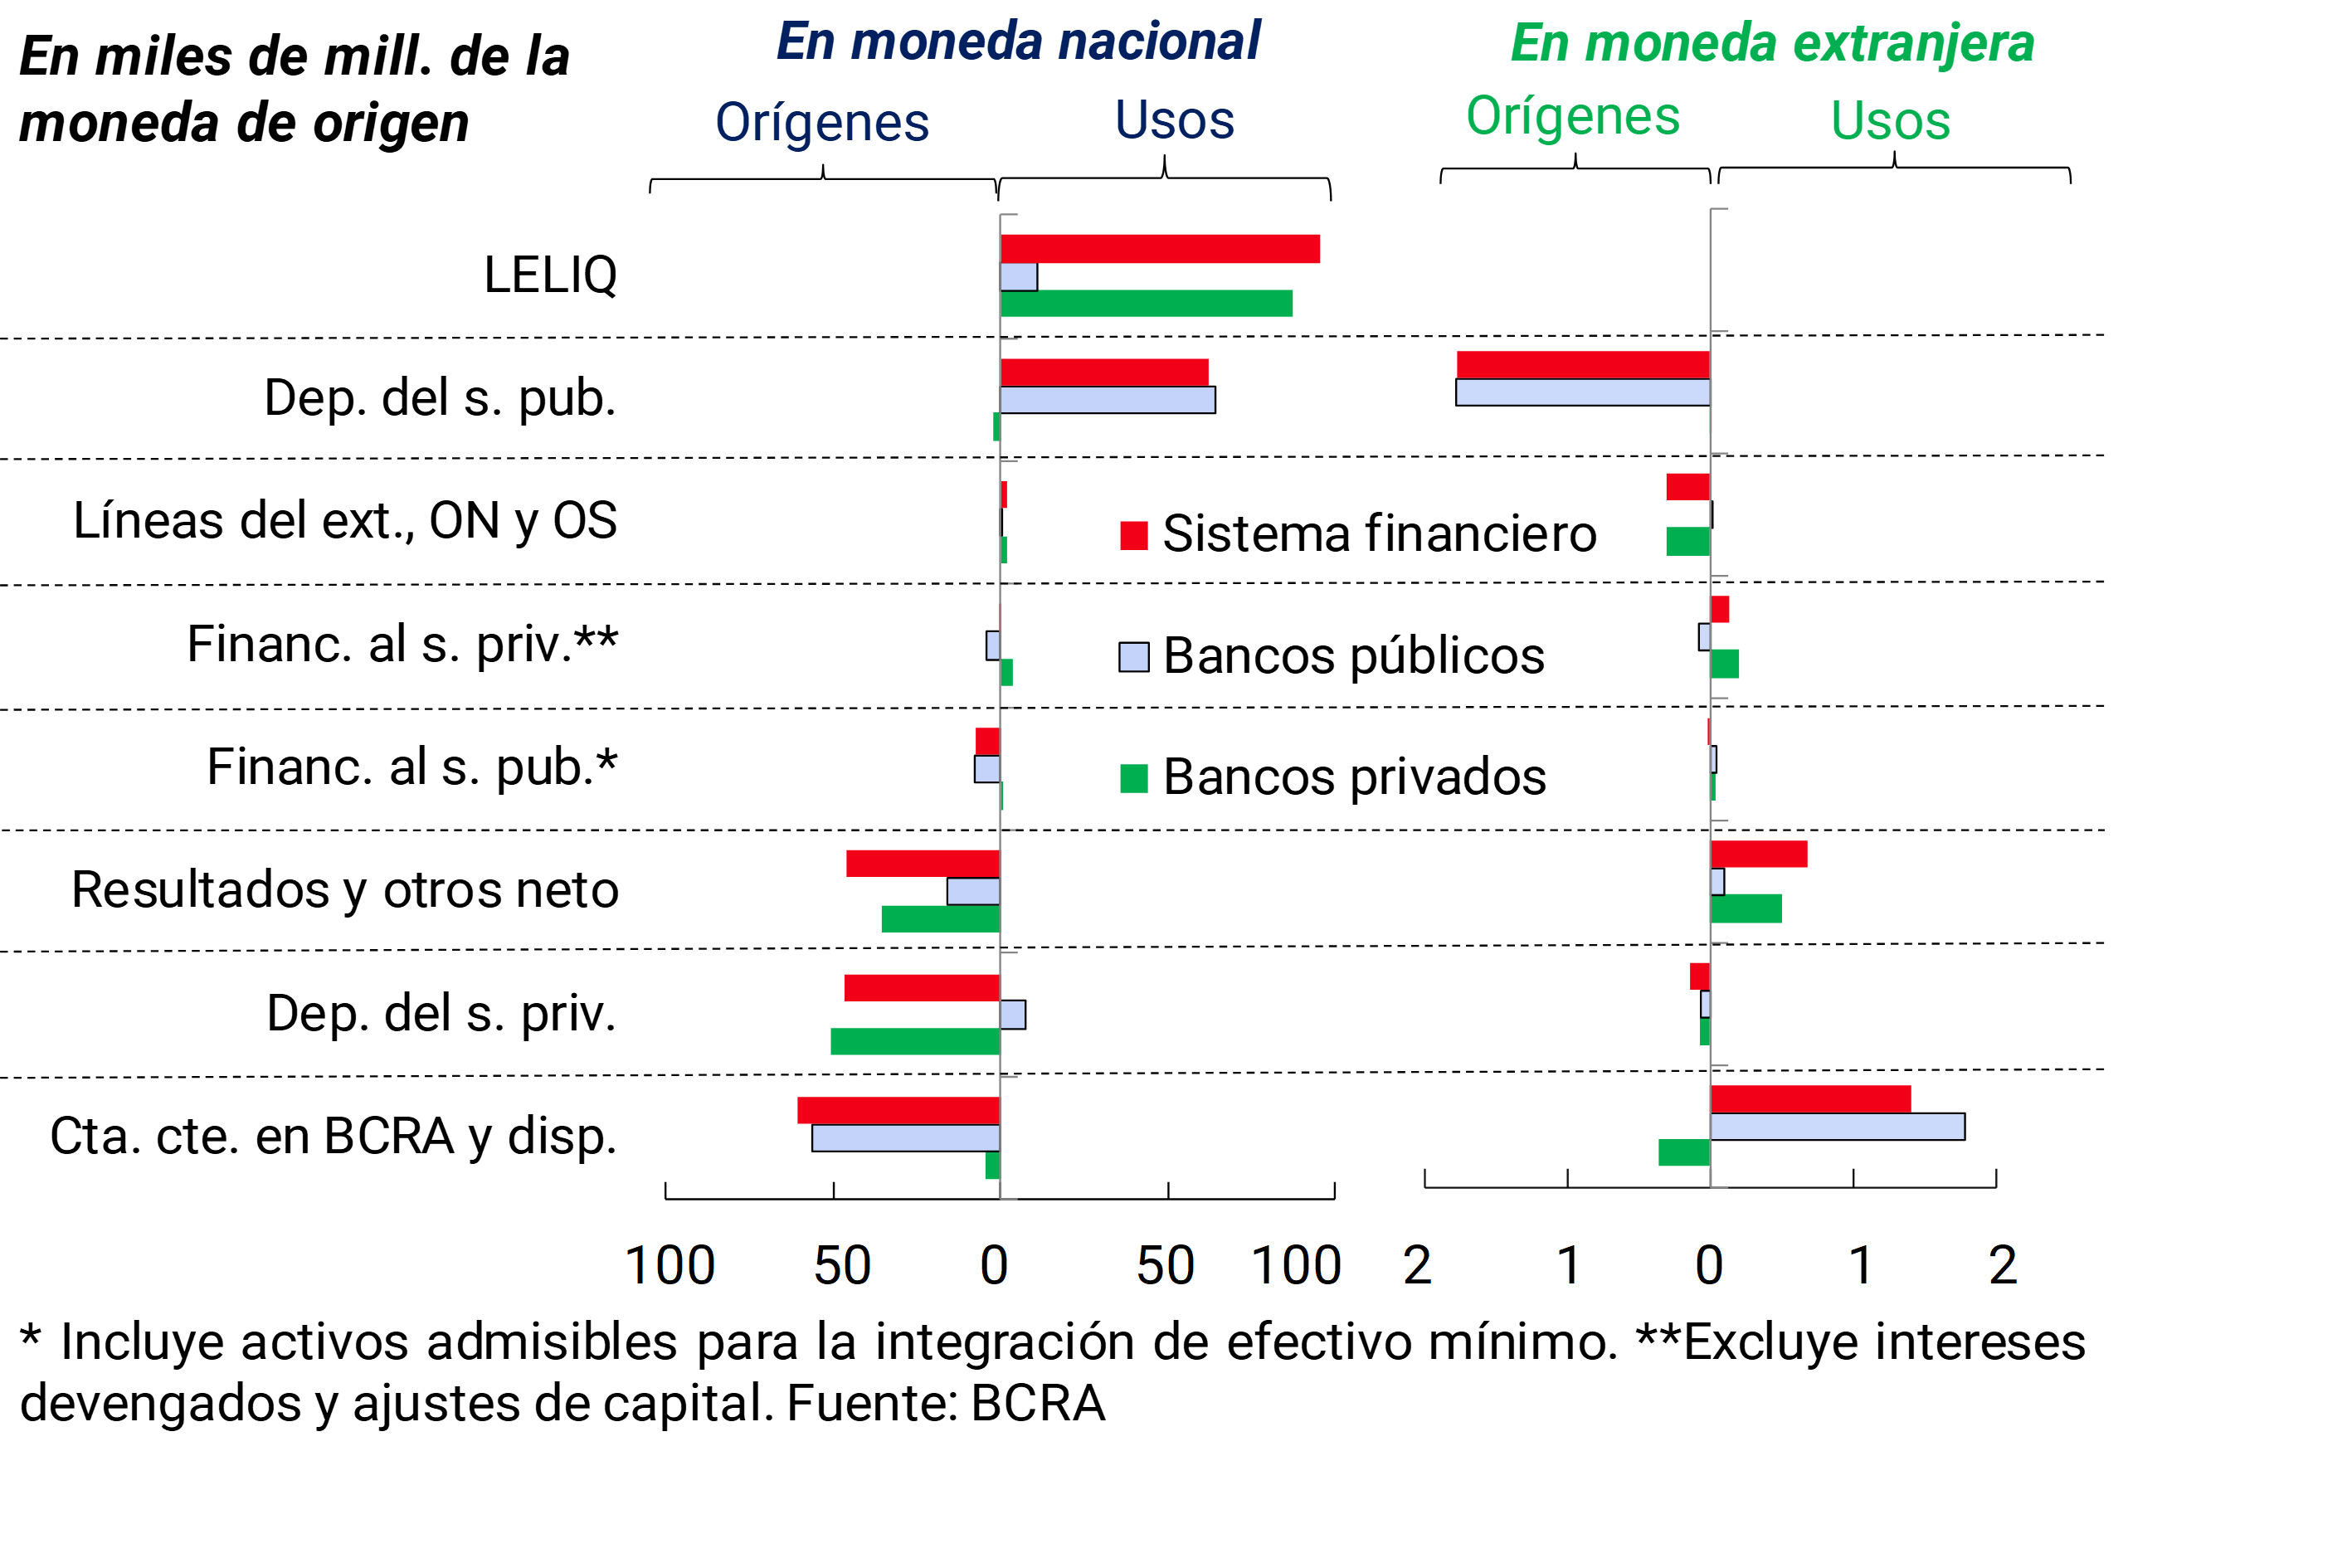
According to the estimated cash flow for March,2 among the items in national currency, the most relevant sources of funds were the reduction in the balance of current accounts in the BCRA (especially in public banks) and the increase in private sector deposits (mainly in private banks) (see Chart 1). These funds were mostly applied to increase LELIQ’s holdings in private banks and to reduce the balance of public sector deposits in public banks. Considering the segment denominated in foreign currency, in March the main source of funds was the increase in public sector deposits, while the most prominent use of resources was the increase in liquidity, both movements were mainly explained by public banks.
Graph 1 | Mar-19 Cash Flow Estimate
Given the evolution of the main items mentioned, in March the total assets of the financial system increased in real terms: 1% compared to February and 3.7% year-on-year (y.o.y.).
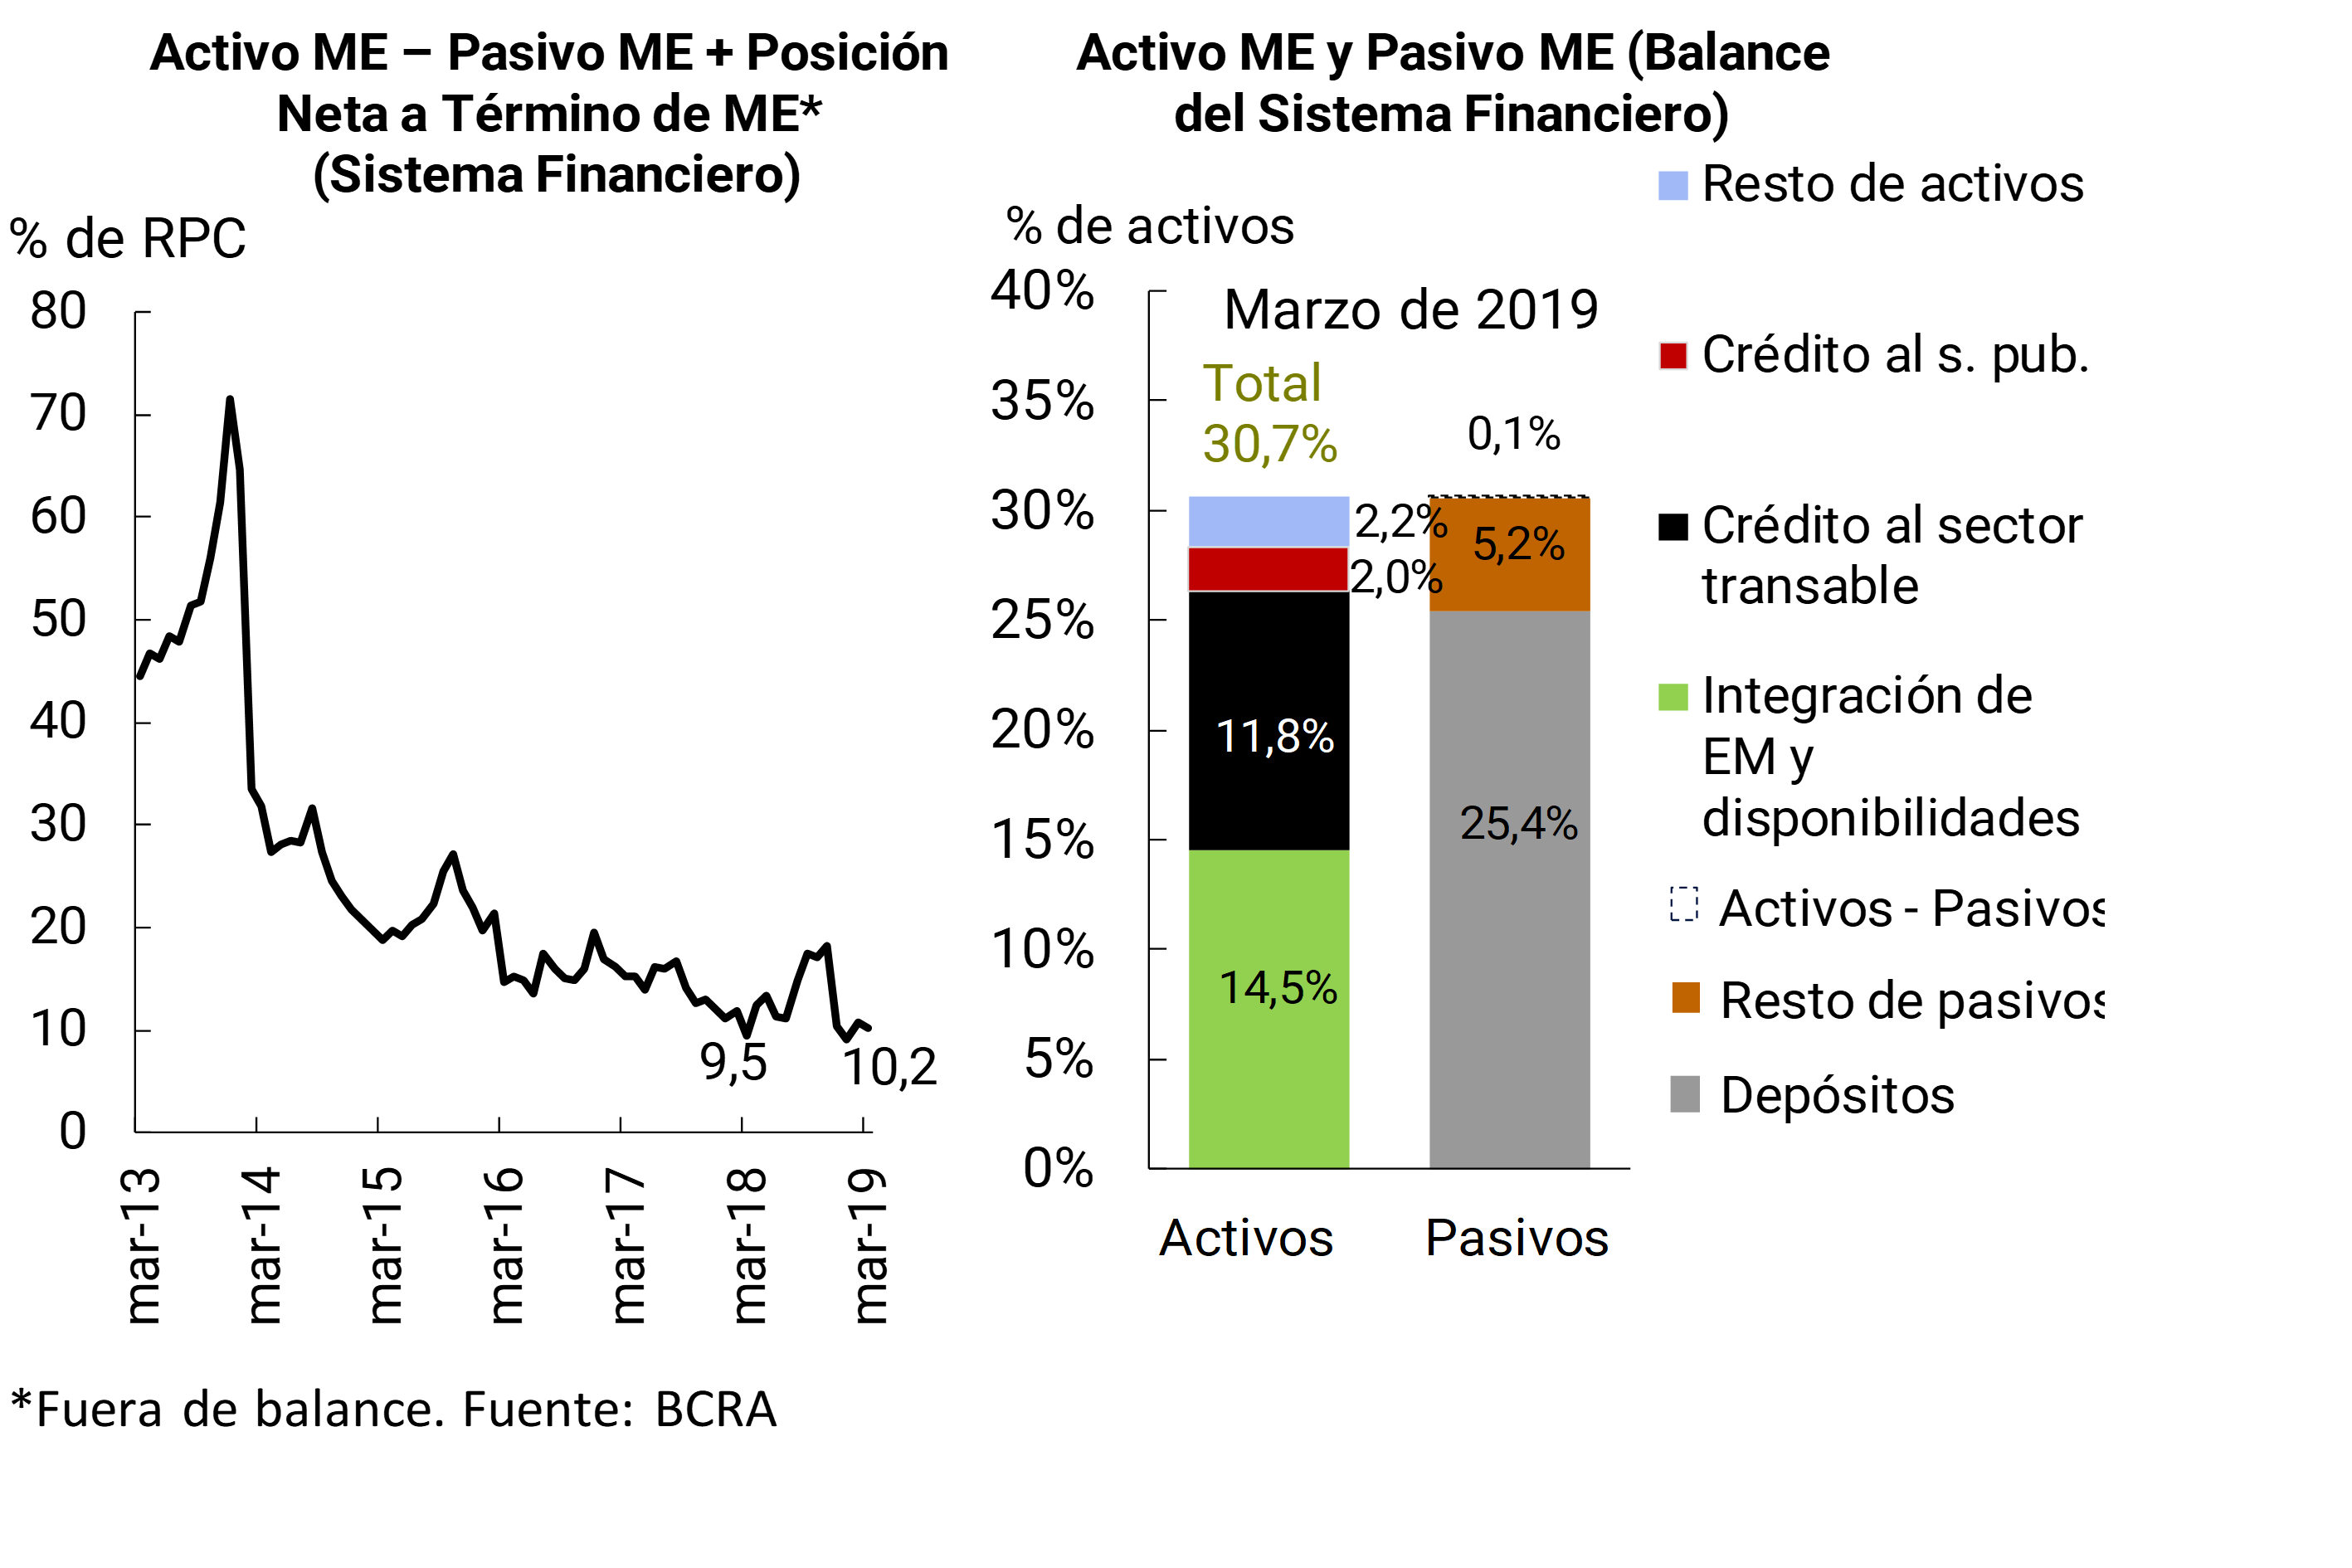
At the end of the first quarter of the year, the financial system’s foreign currency assets accounted for 30.7% of total assets (+2.7 p.p. in the month and +10.2 p.p. y.o.y.). Assets in foreign currency continue to be composed mainly of liquidity and credit to tradable sectors (see Chart 2). On the other hand, the weighting of liabilities denominated in foreign currency in total funding reached 30.6% in the period (+3 p.p. in the month and +10.9 p.p. y.o.y.), mainly explained by deposits. In this context, in the month the spread between assets and liabilities in foreign currency plus the net forward position in foreign currency totaled 10.2% of regulatory capital, slightly below the level of February.
Graph 2 | Foreign Currency Balance of the Financial System
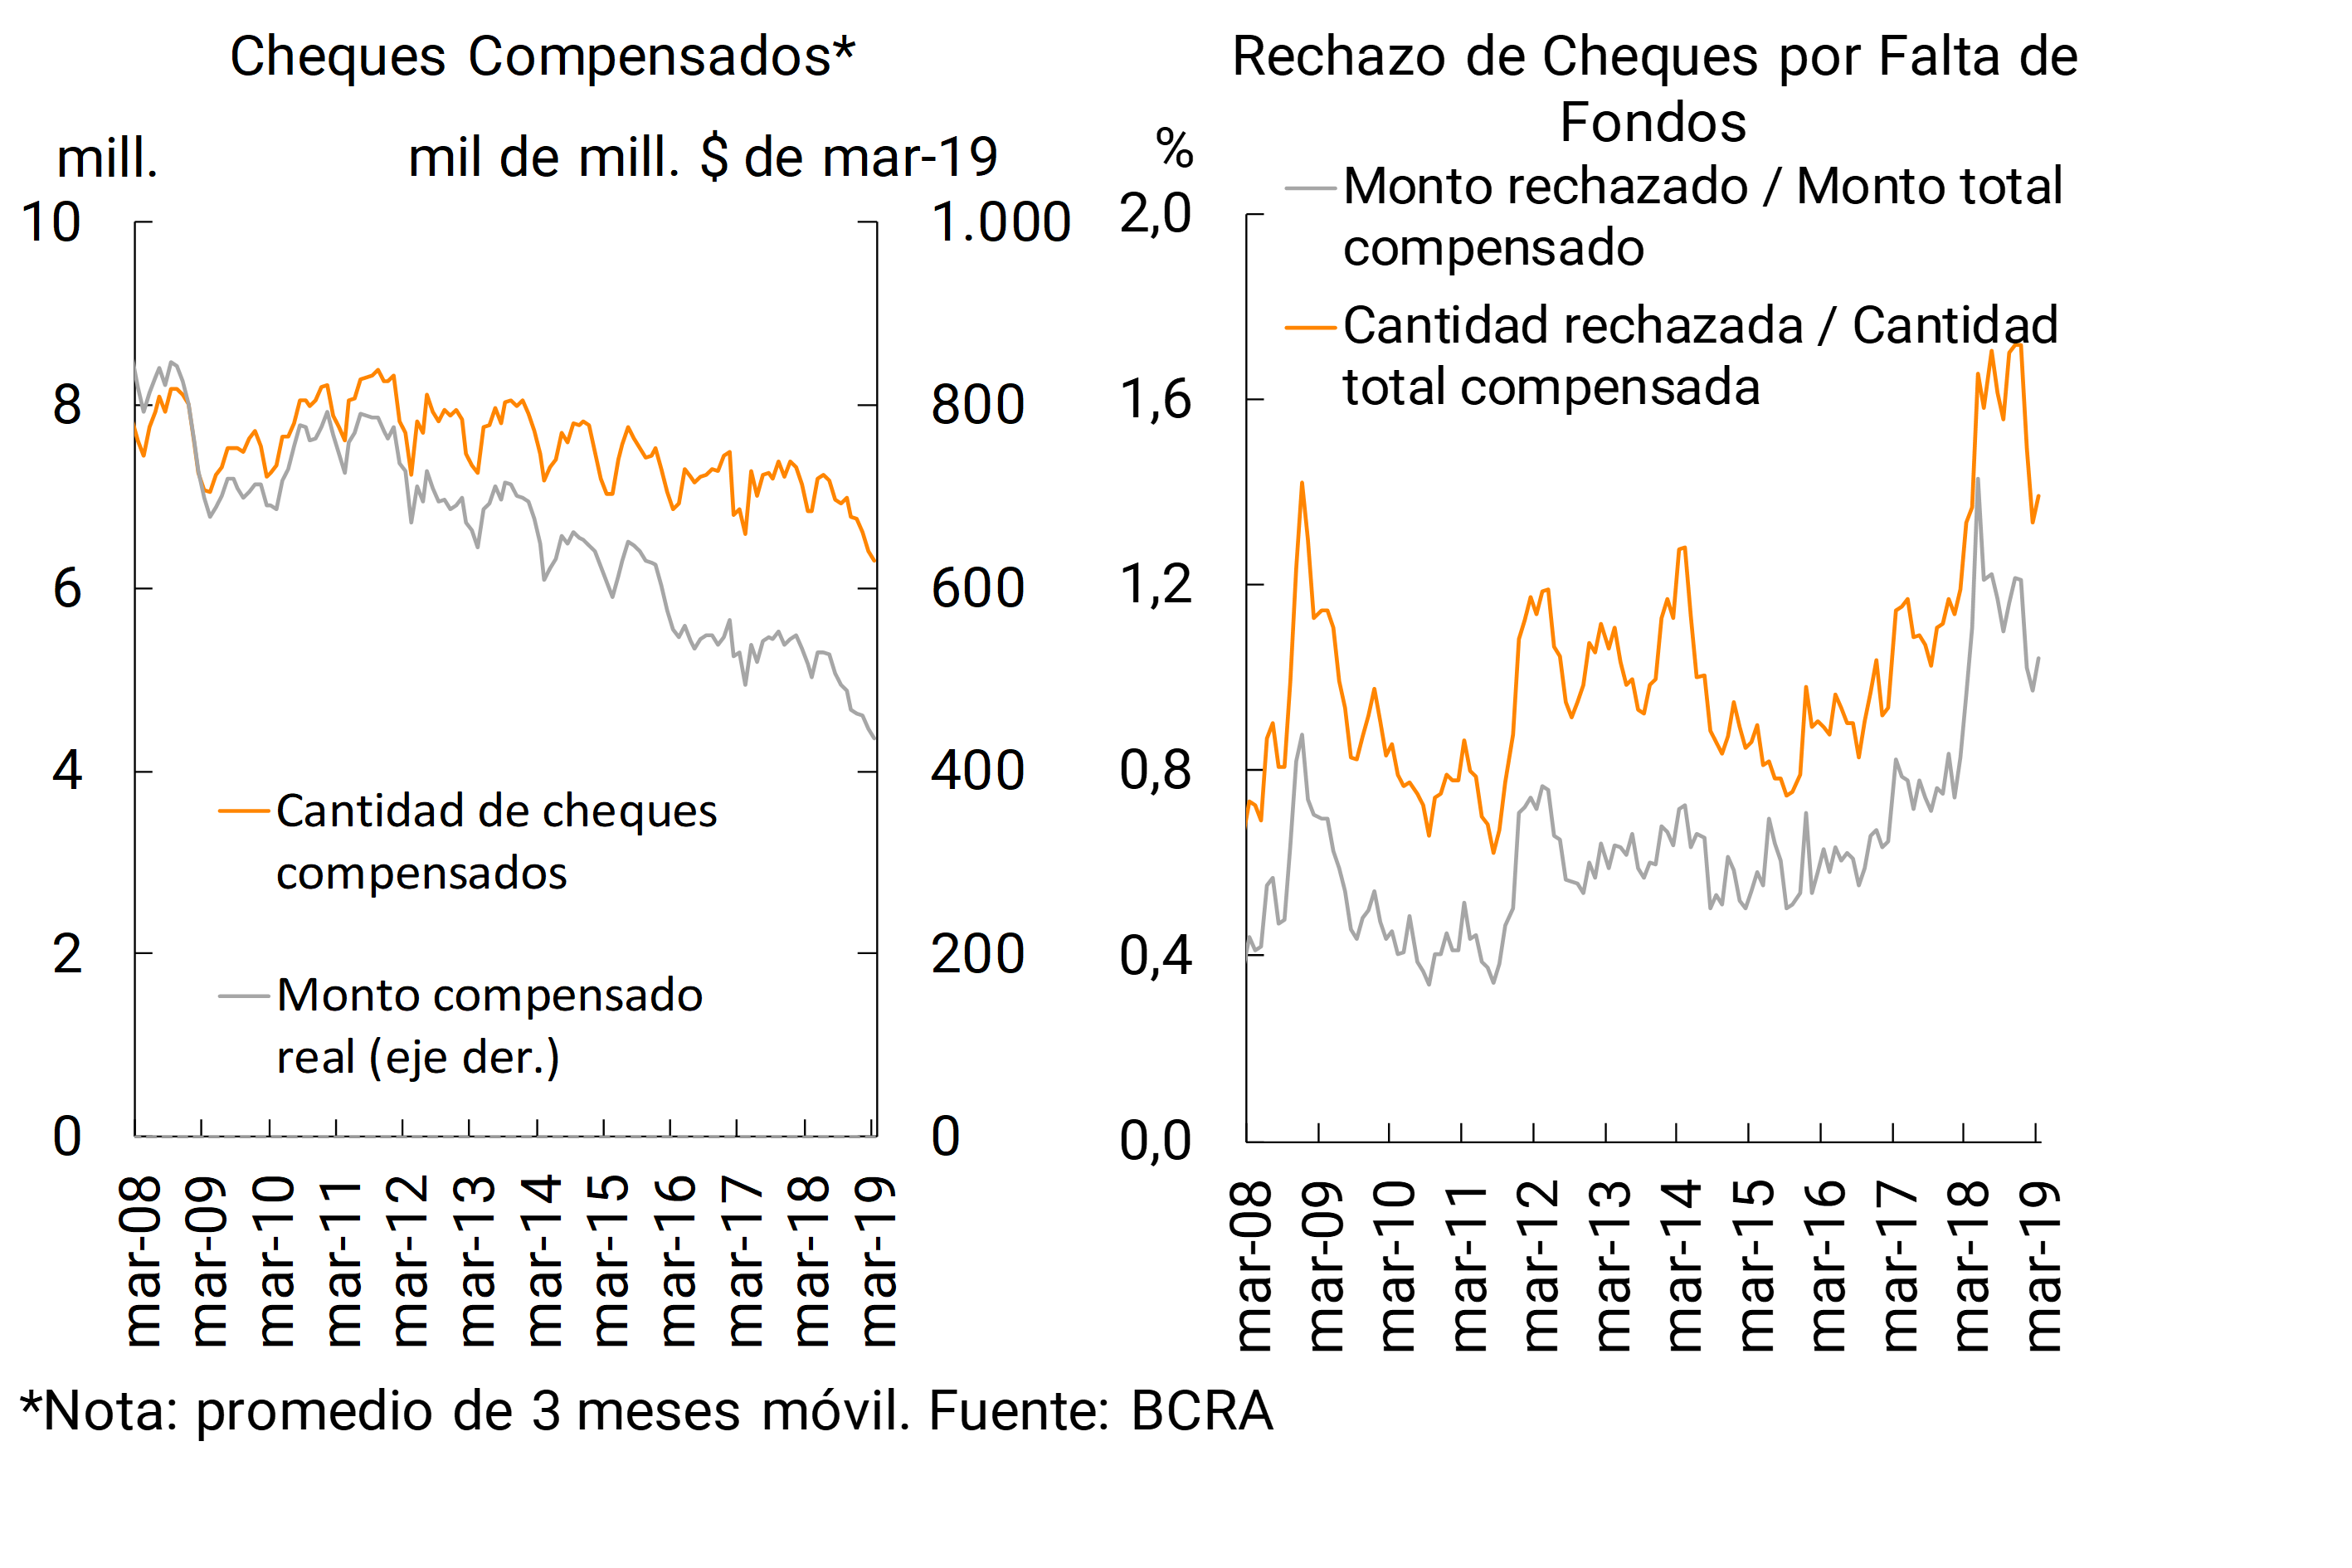
In terms of the operations of the National Payment System, immediate transfers of funds increased, both in the month (+5.3% for amounts and +6.1% in real terms for securities) and in relation to March 2018 (+57.2% y.o.y. for the number of operations and +6.1% y.o.y. in real terms, see Graph 3). 3 In the third month of the year, the volume of cheque clearing continued to decline, while the ratio of cheque rejection due to lack of funds in terms of total cleared increased slightly in the month, although it remained below the values at the end of 2018 (see Chart 4).
Graph 3 | Immediate Transfers – Year-on-year % change
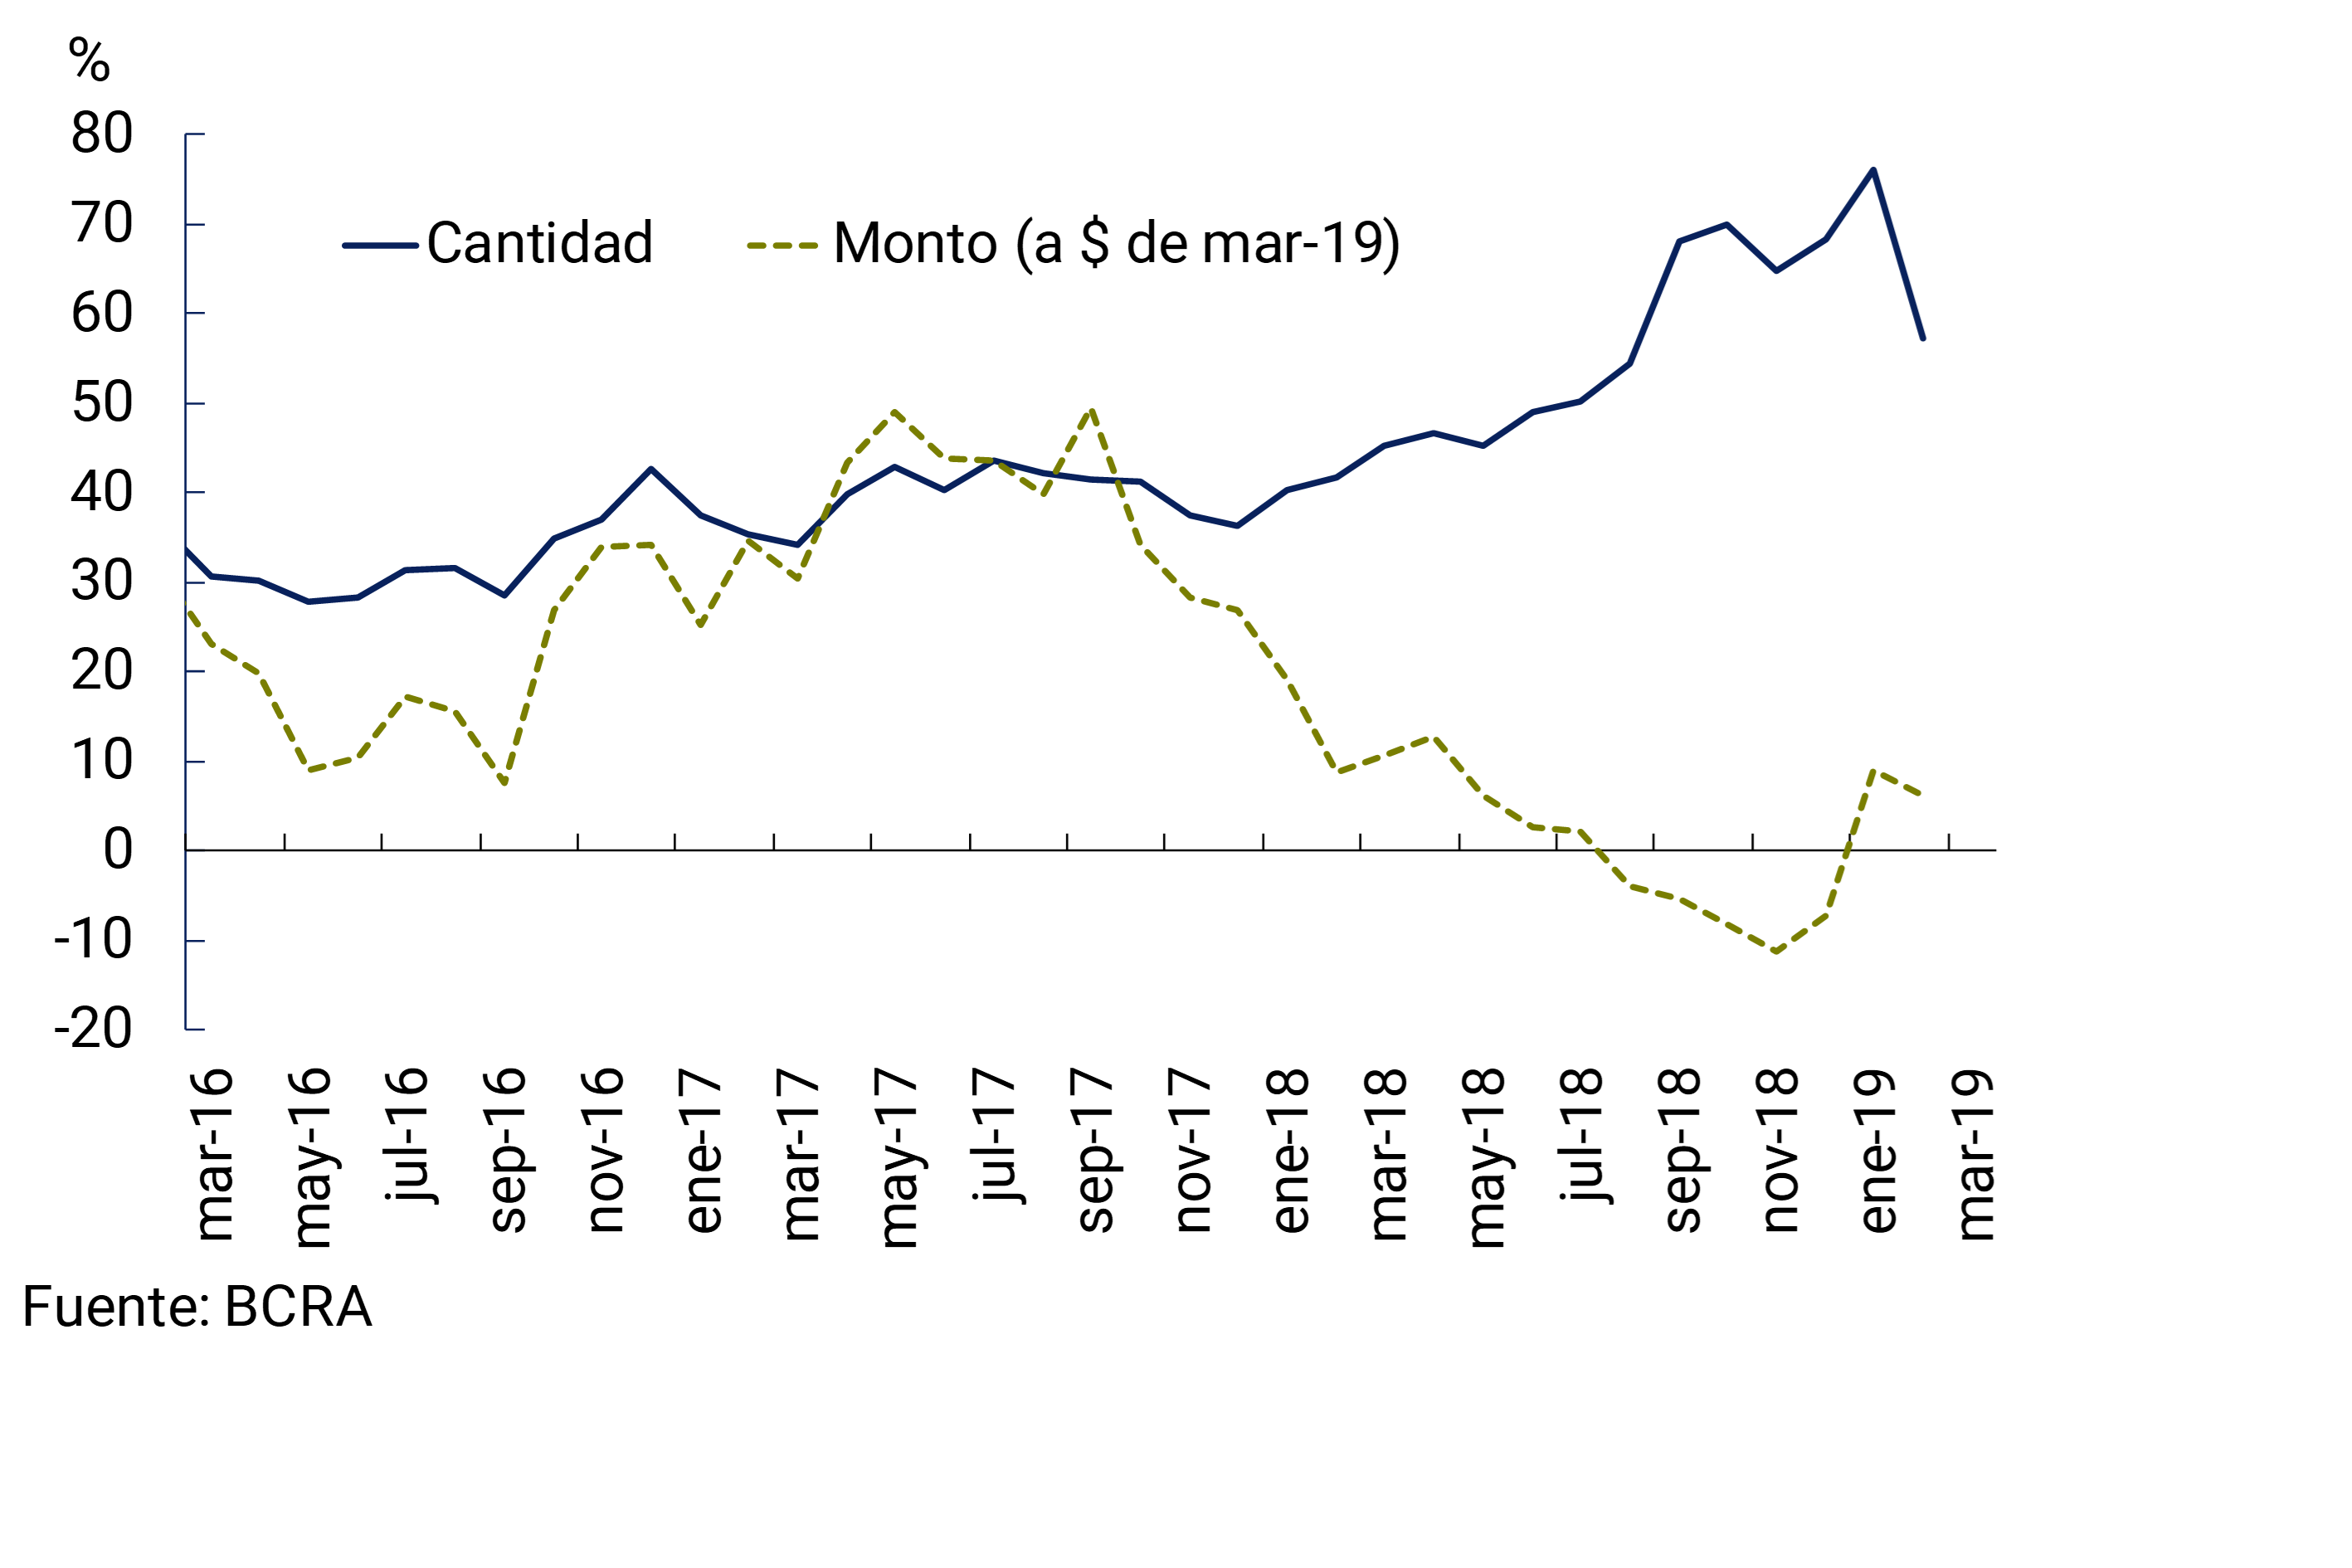
Figure 4 | Check Clearing and Rejection
II. Deposits and liquidity
Private sector deposits in pesos fell 2.4% in real terms in March (+2.1% nominal). This dynamic was explained both by the performance of time deposits and demand accounts (with nominal increases of 2.1% in these balances in the month). 4 Although deposits in pesos in the public sector also fell in real terms in March, the balance of total deposits increased by 0.5% in real terms in the month, mainly due to the increase in those in foreign currency. 5
In a year-on-year comparison, the balance of deposits in pesos in the private sector decreased by 4.5% in real terms, with an increase in time deposits (+11% y.o.y. in real terms) that partially offset the reduction in demand accounts (-16.9% y.o.y. in real terms). Private sector foreign currency deposits expanded 14.5% in the last 12 months in source currency. Total deposits grew 4.6% in real terms in the same period.
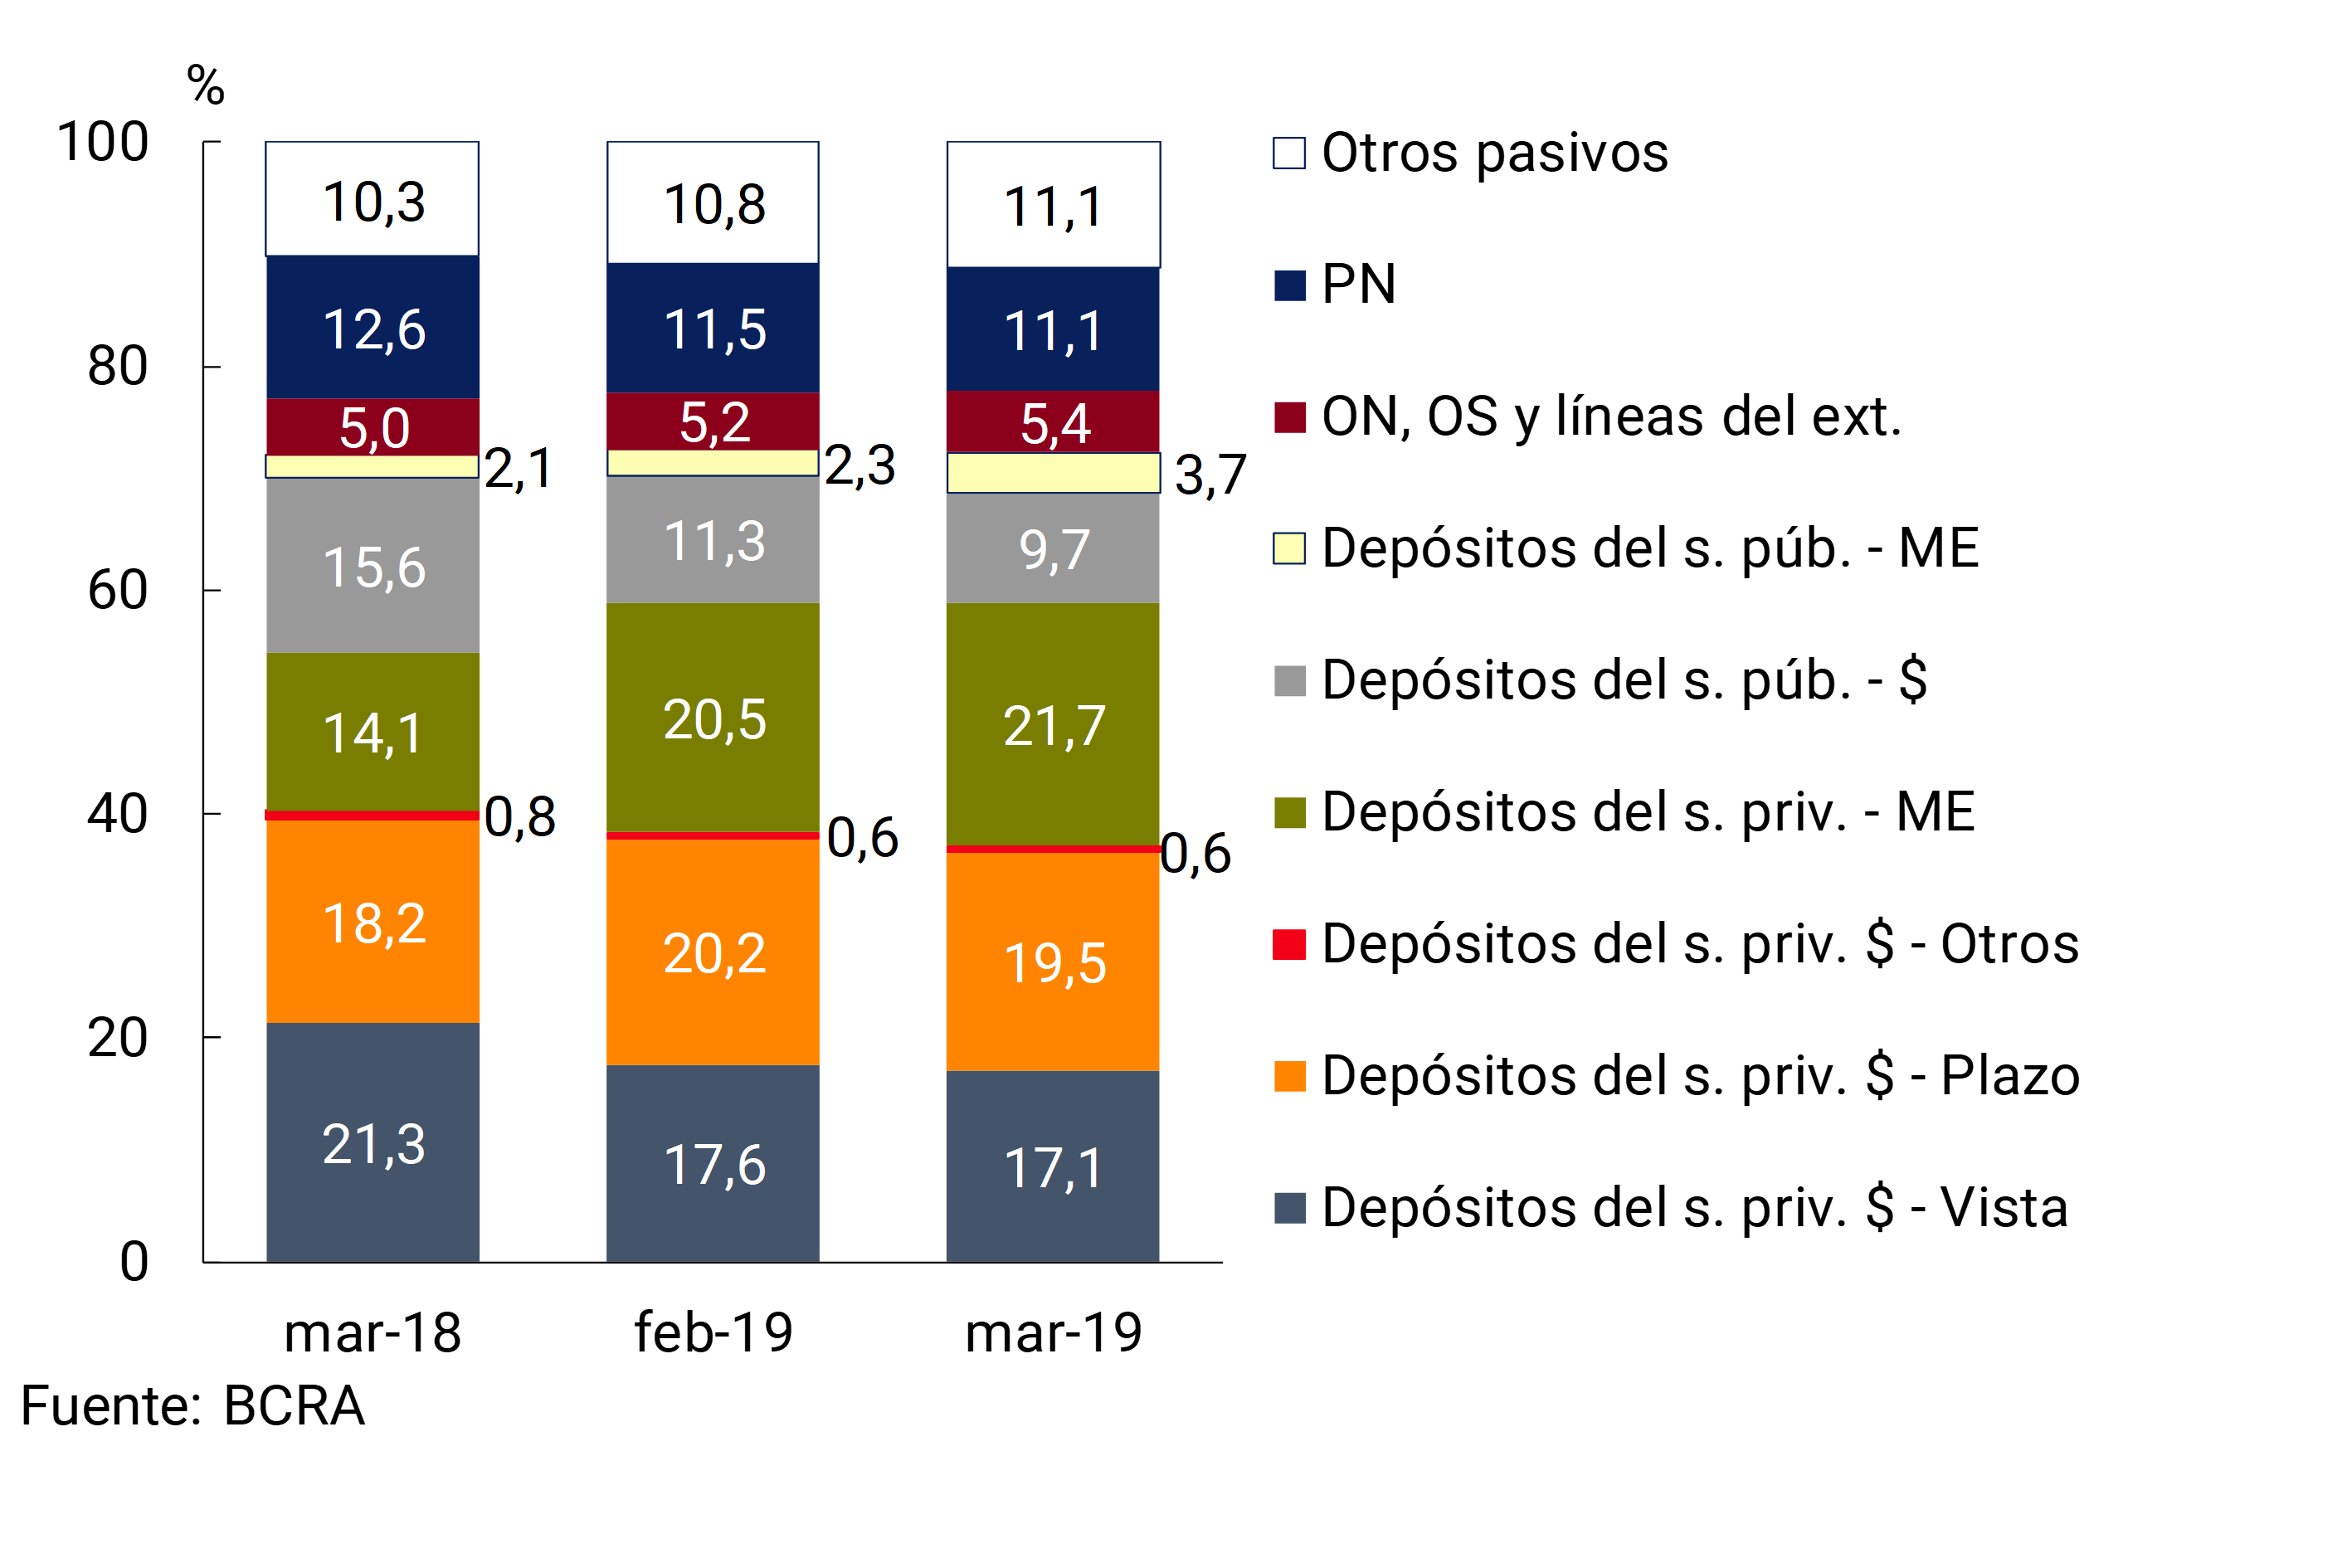
In March, the weighting of private sector deposits in the total funding – liabilities plus net worth – of the financial system stood at 58.9% (no significant changes compared to February and +4.5 p.p. y.o.y.), while the share of public sector deposits reached 13.4% (-0.2 p.p. in the month and -4.2 p.p. y.o.y.). Considering private sector deposits, in the year-on-year comparison, foreign currency placements and time deposits in pesos increased in relevance, to the detriment of demand accounts in pesos (see Chart 5).
Graph 5 | Total Funding (Liabilities + NP) – Sistema Financiero
The average nominal interest rate operated on time deposits in pesos of the private sector increased in the month, in line with the performance of the reference interest rate of the LELIQ.
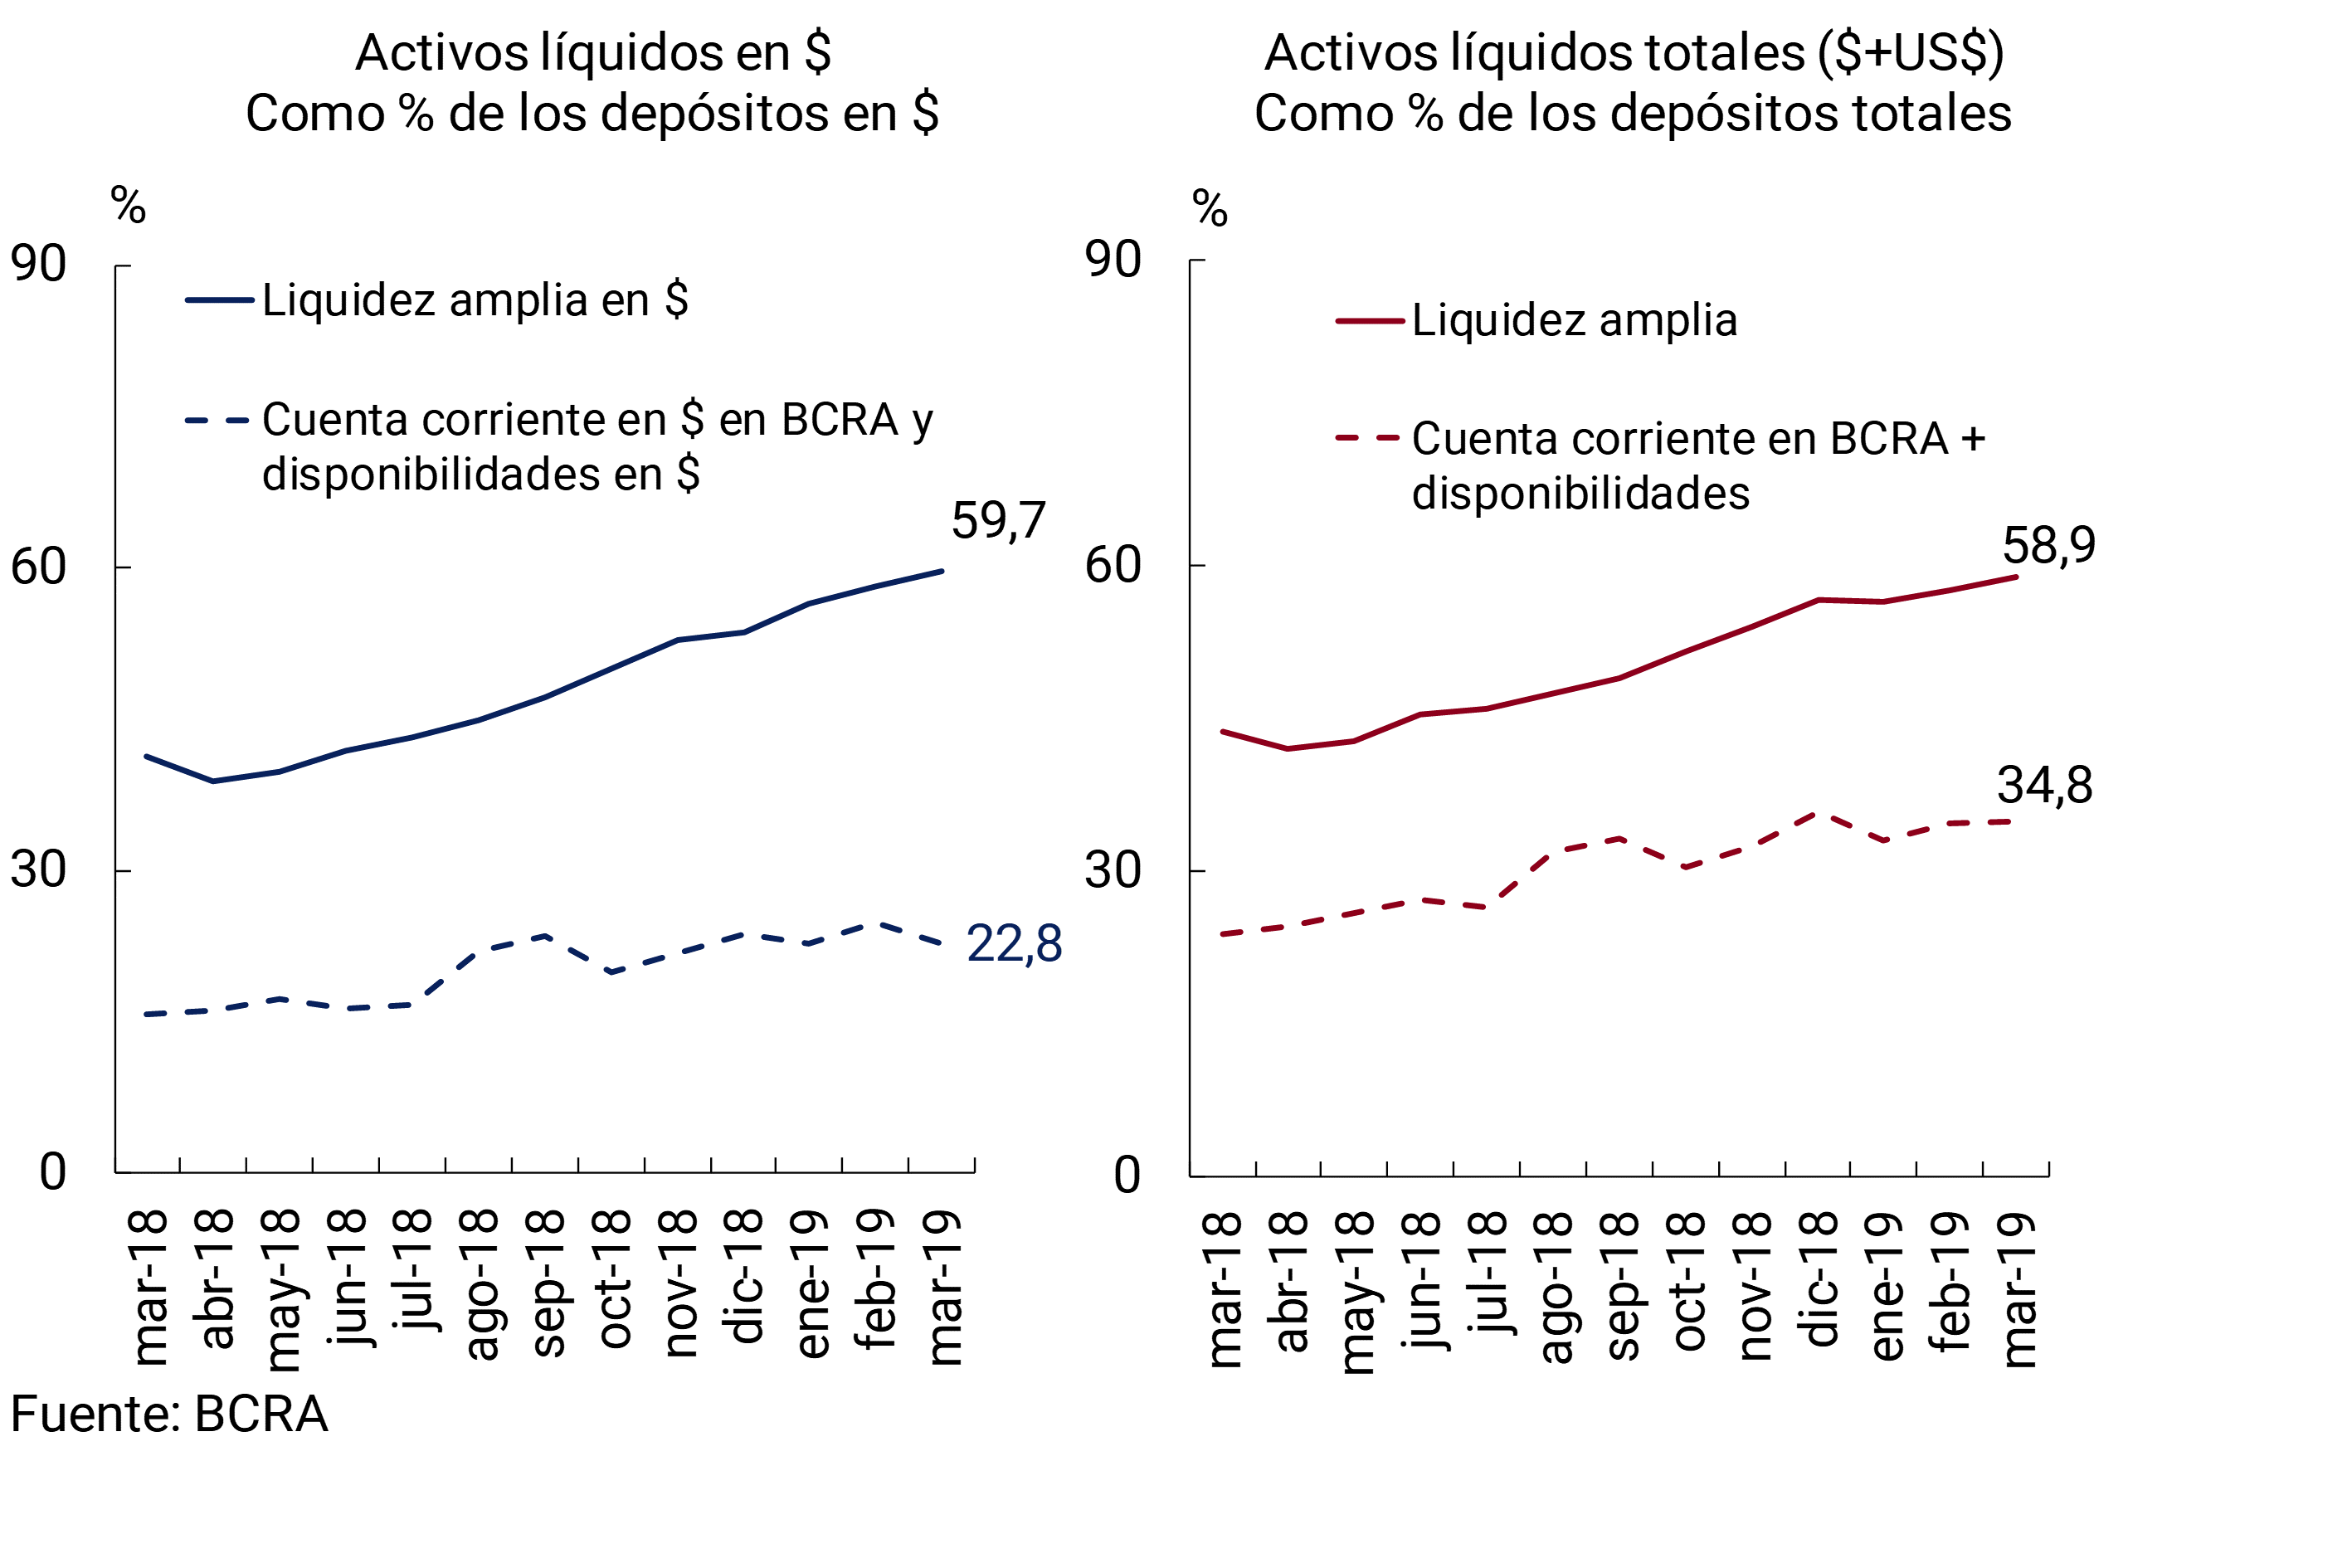
The liquidity of the financial system increased again in March. Broad liquidity indicator6 stood at 58.9% of total deposits in the month (59.7% considering the segment in national currency), 1.2 p.p. above the level recorded the previous month (+1.5 p.p. for items in pesos) (see Chart 6). The monthly increase in liquidity was mainly explained by the higher balance of LELIQ. In the last 12 months, ample liquidity grew by 15.2 p.p. in deposits (+18.4 p.p. for the ratio in pesos). Liquidity in foreign currency represented 57.3% of deposits in the same denomination in the period, 0.9 p.p. and 5.7 p.p. more than last month and March 2018, respectively.
Graph 6 | Liquidity of the Financial System
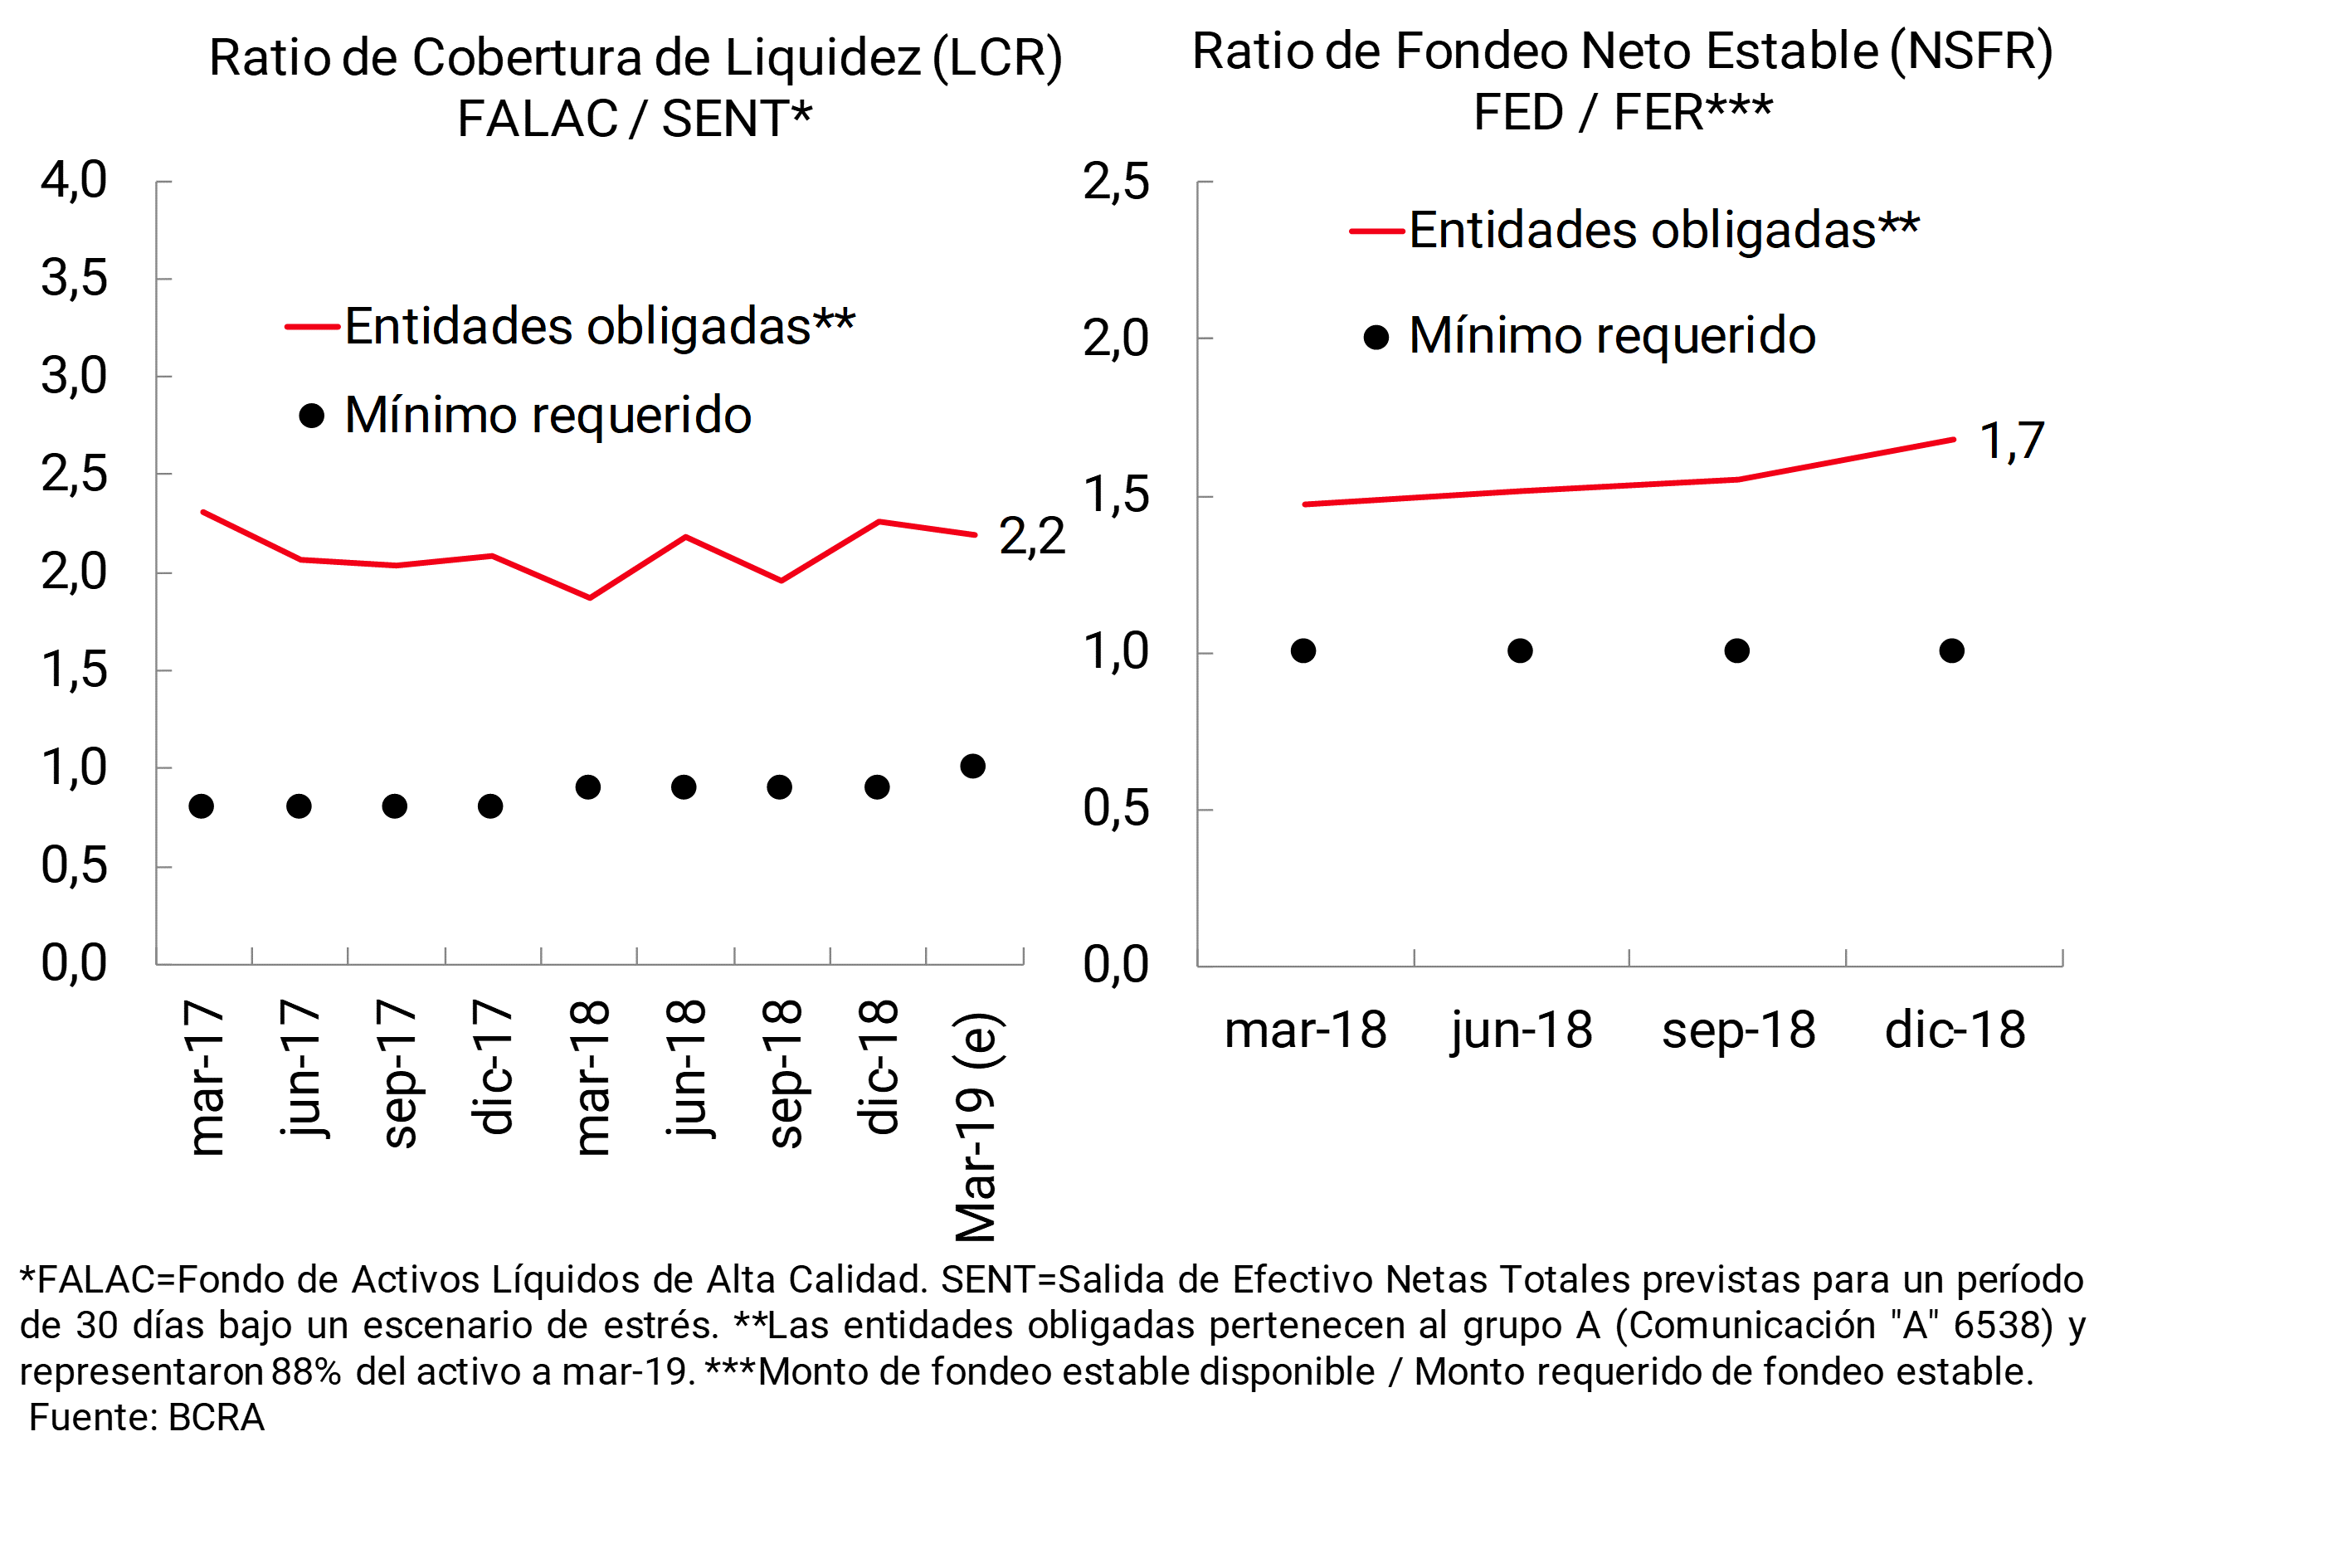
The context of ample relative liquidity in the financial system is also observed in terms of the indicators that emerge from the regulatory standards recommended at the international level (according to the Basel Committee). At the aggregate level, for the set of banks subject to these requirements, both the Liquidity Coverage Ratio (last observed level of 2.2) and the Stable Net Funding Ratio (1.7) continued to show values that far exceed the regulatory minimums required (1 for both indicators) (see Chart 7). 7
Figure 7 | Basel III Liquidity Indicators
III. Credit and Portfolio Quality
In March, the balance of credit in pesos to the private sector fell in real terms compared to February (+0.6% nominal). 8 All credit lines in pesos were reduced in real terms compared to last month. For its part, credit in foreign currency to the private sector increased 0.9% in the month (in currency of origin, see Chart 8).
Figure 8 | Private Sector Credit Balance by Currency
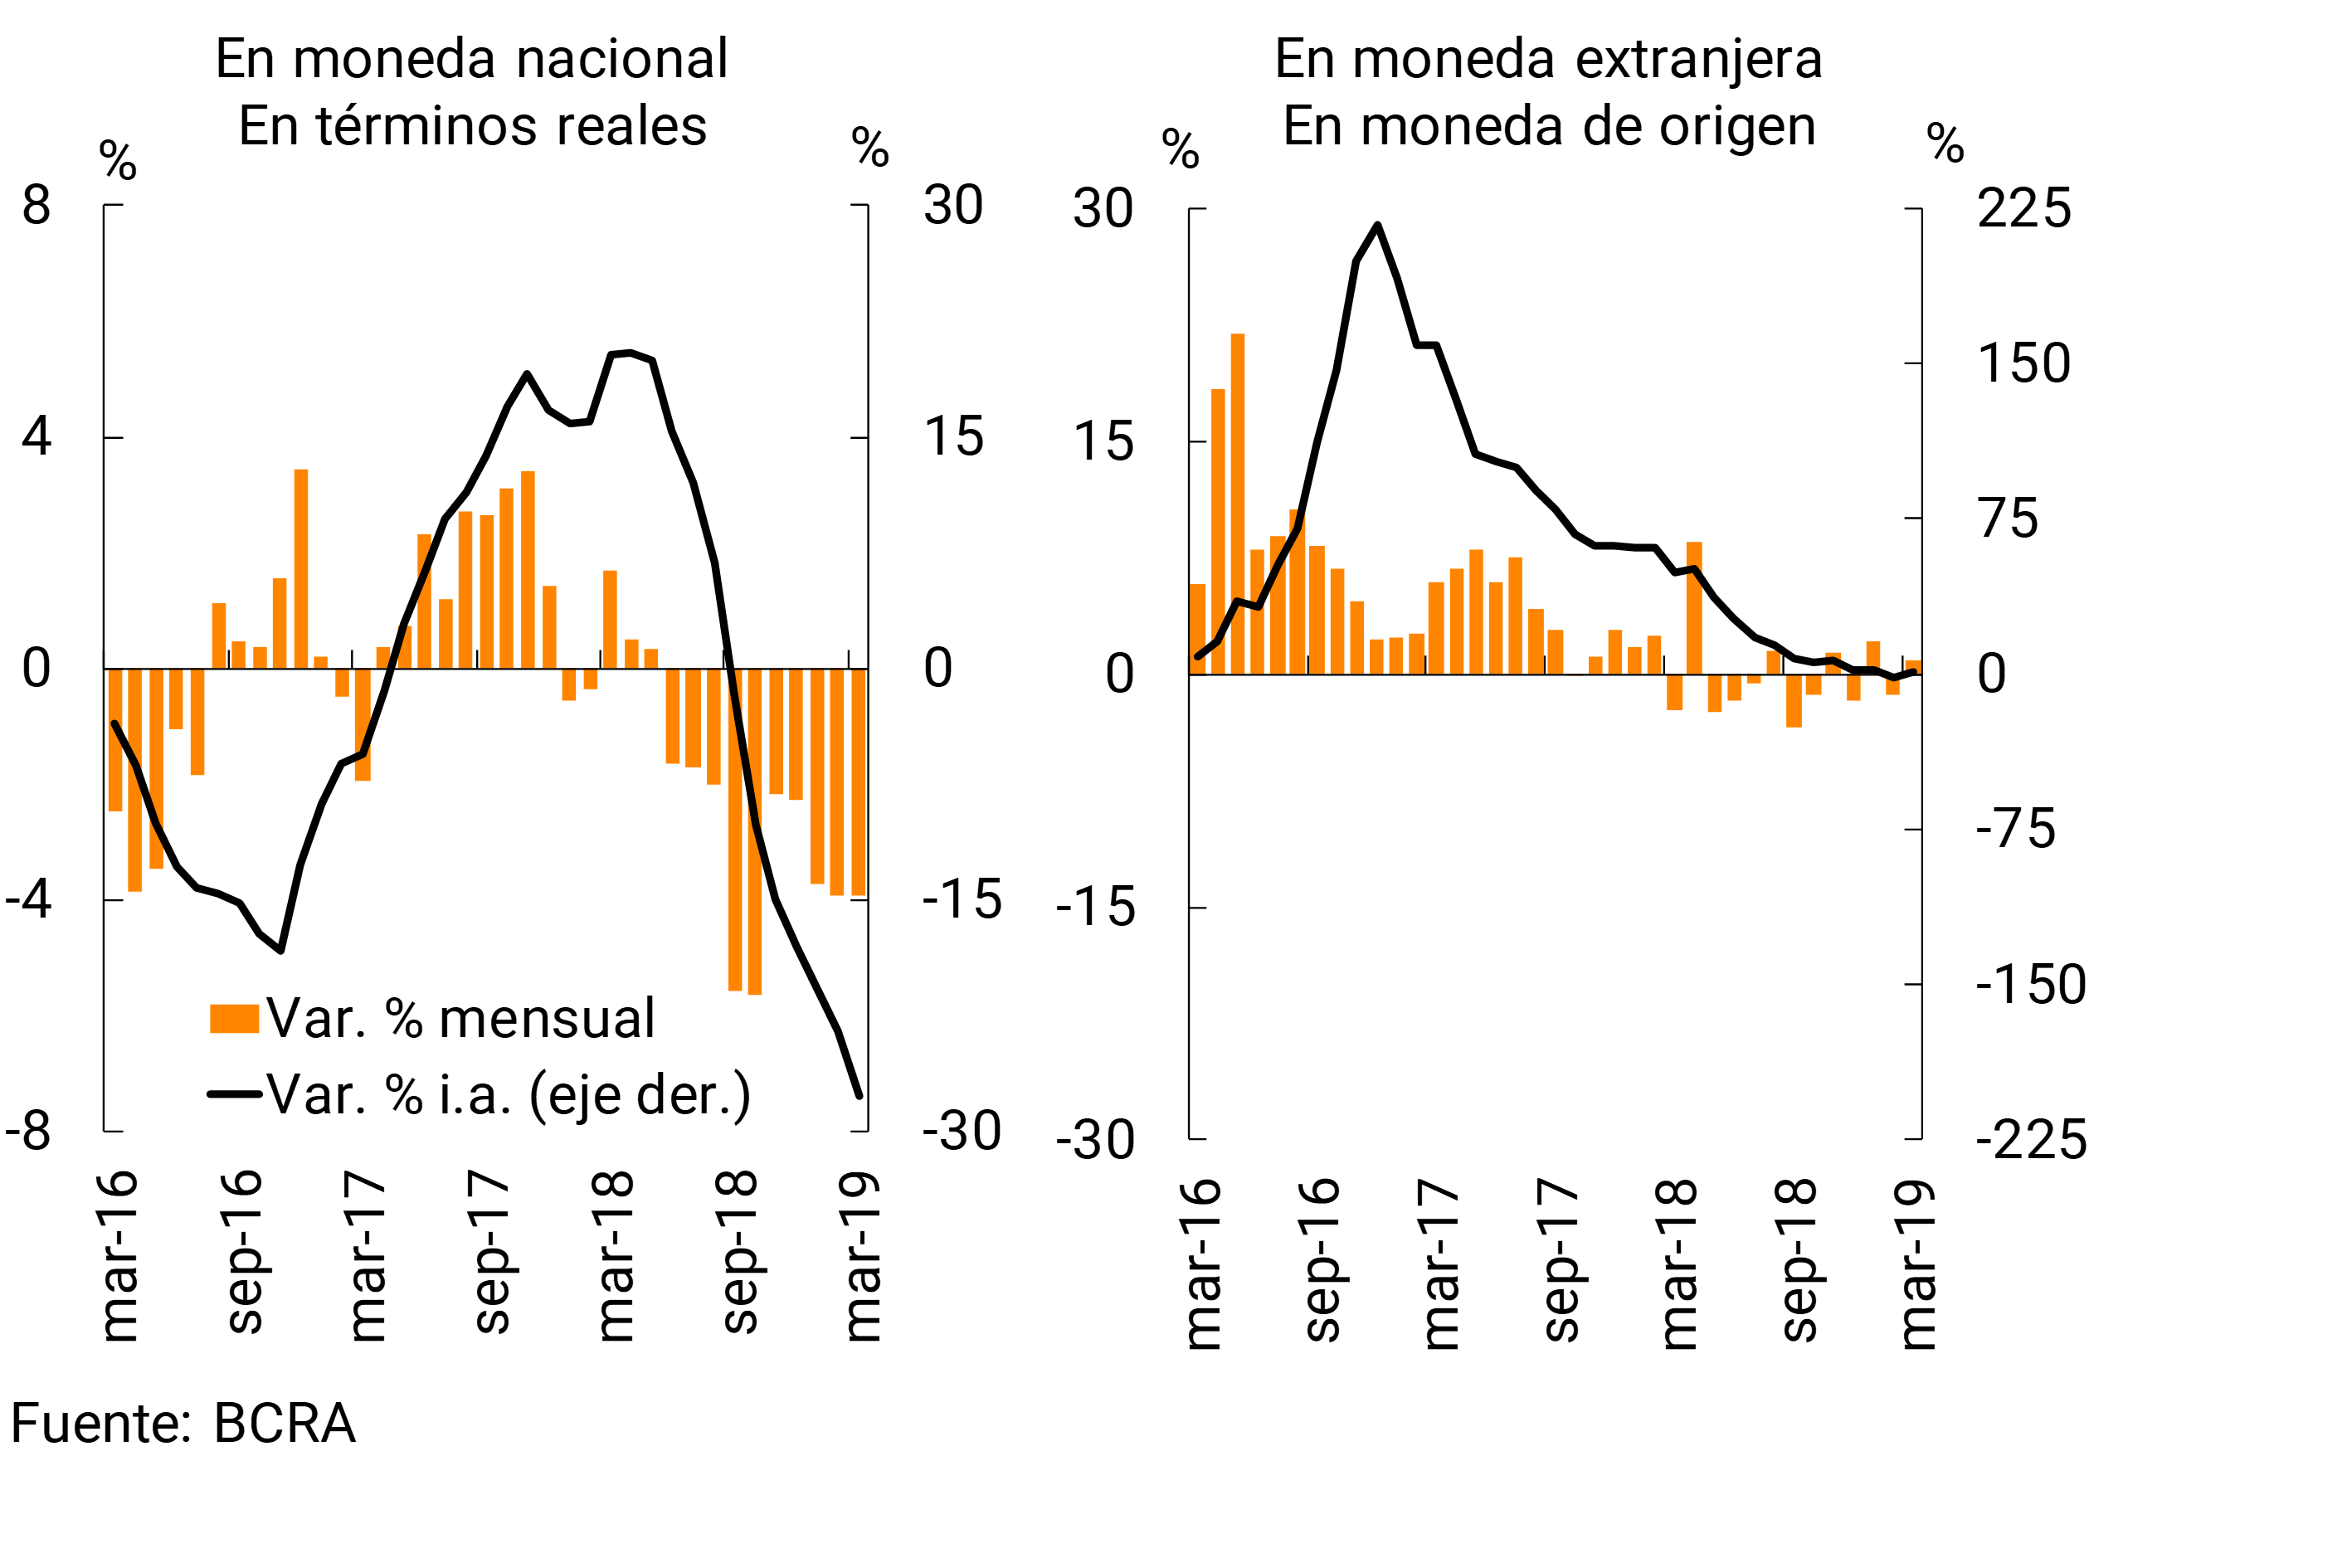
In a year-on-year comparison, financing in pesos to the private sector fell by 27.7% in real terms, while credit in foreign currency increased slightly (+1.5% YoY in the currency of origin).
The total credit balance (in domestic and foreign currency) to companies increased by 1.2% in real terms compared to February (+6% in nominal terms). 9 Compared to March 2018, the balance of financing to companies decreased 13% in real terms. For its part, the balance of credit to households fell 3.2% in real terms compared to February (+1.3% nominal). In year-on-year terms, loans to households fell by 17.7% in real terms. 10
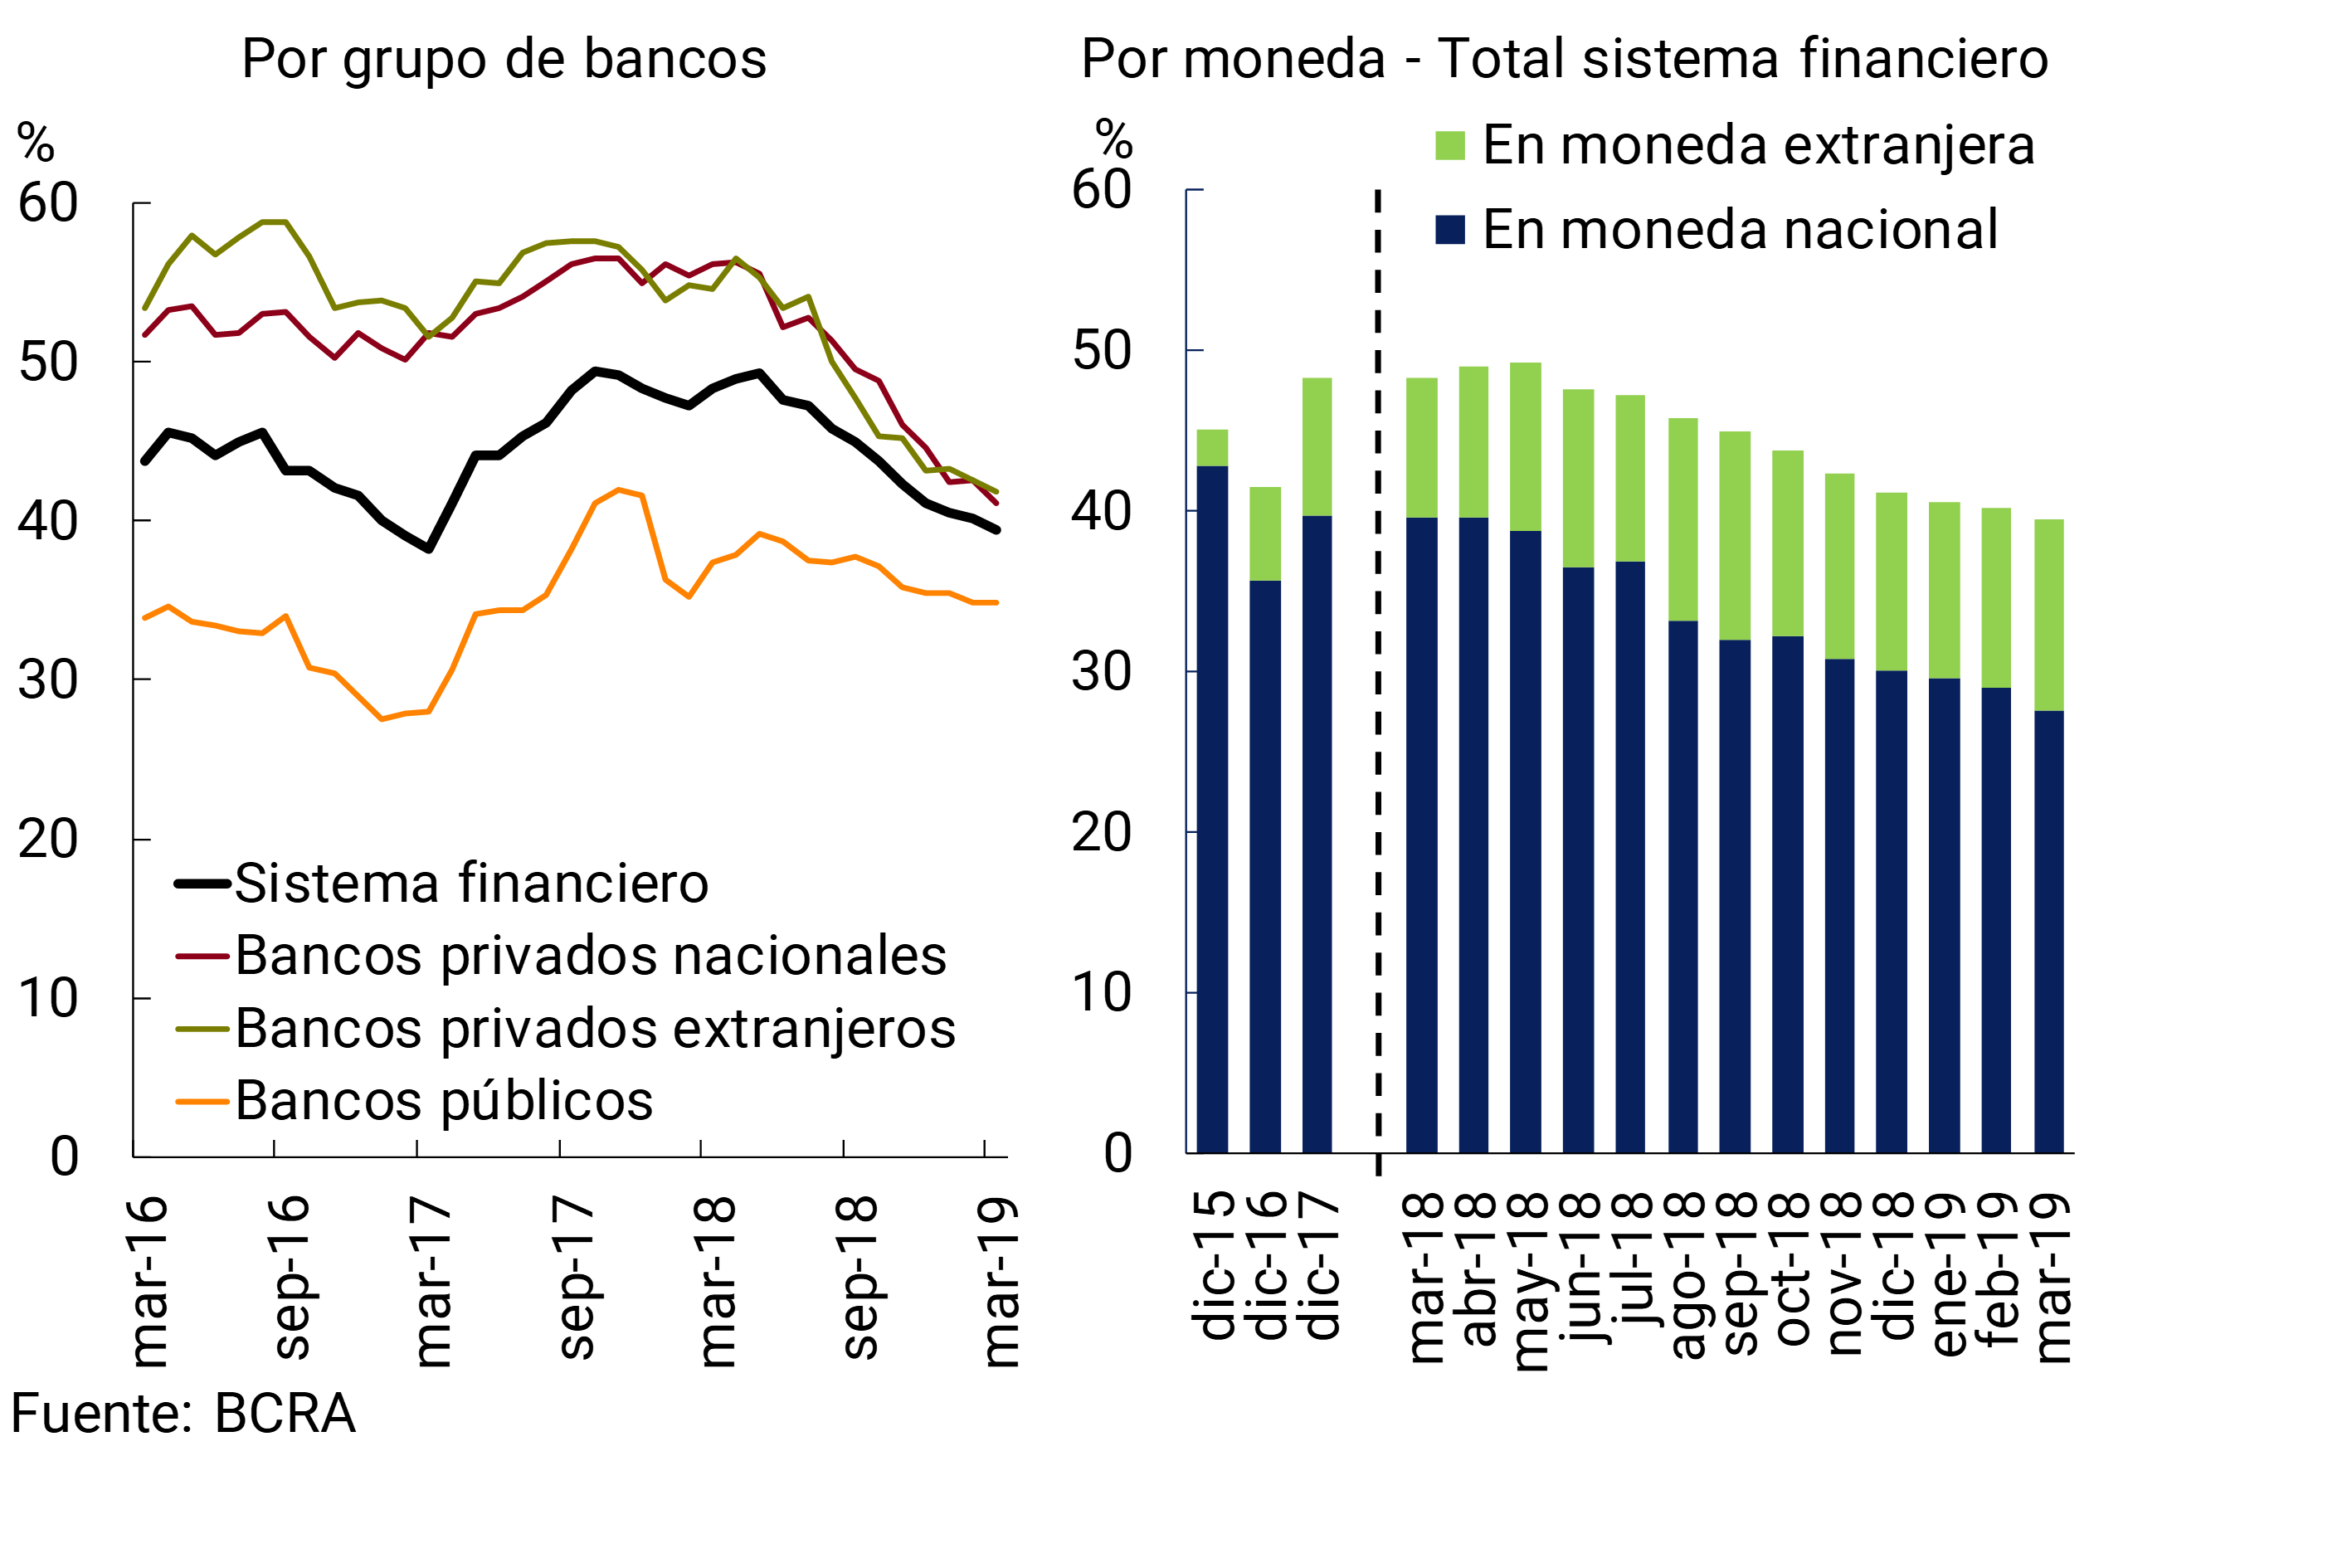
At the end of the first quarter of 2019, credit to the private sector accounted for 39.4% of total banking assets, falling slightly compared to the previous month (-0.7 p.p.). 11 In the year-on-year comparison, this ratio fell by 8.8 p.p. at the aggregate level, with a greater relative decrease in private banks and in items in national currency (see Chart 9).
Figure 9 | Private Sector Credit Balance / Total Assets
In line with the performance of the benchmark interest rate, lending rates, mainly for short-term peso operations – such as advances – and for signature documents increased throughout March. The interest rates agreed for personal loans showed fewer changes in March, averaging levels similar to those of February.
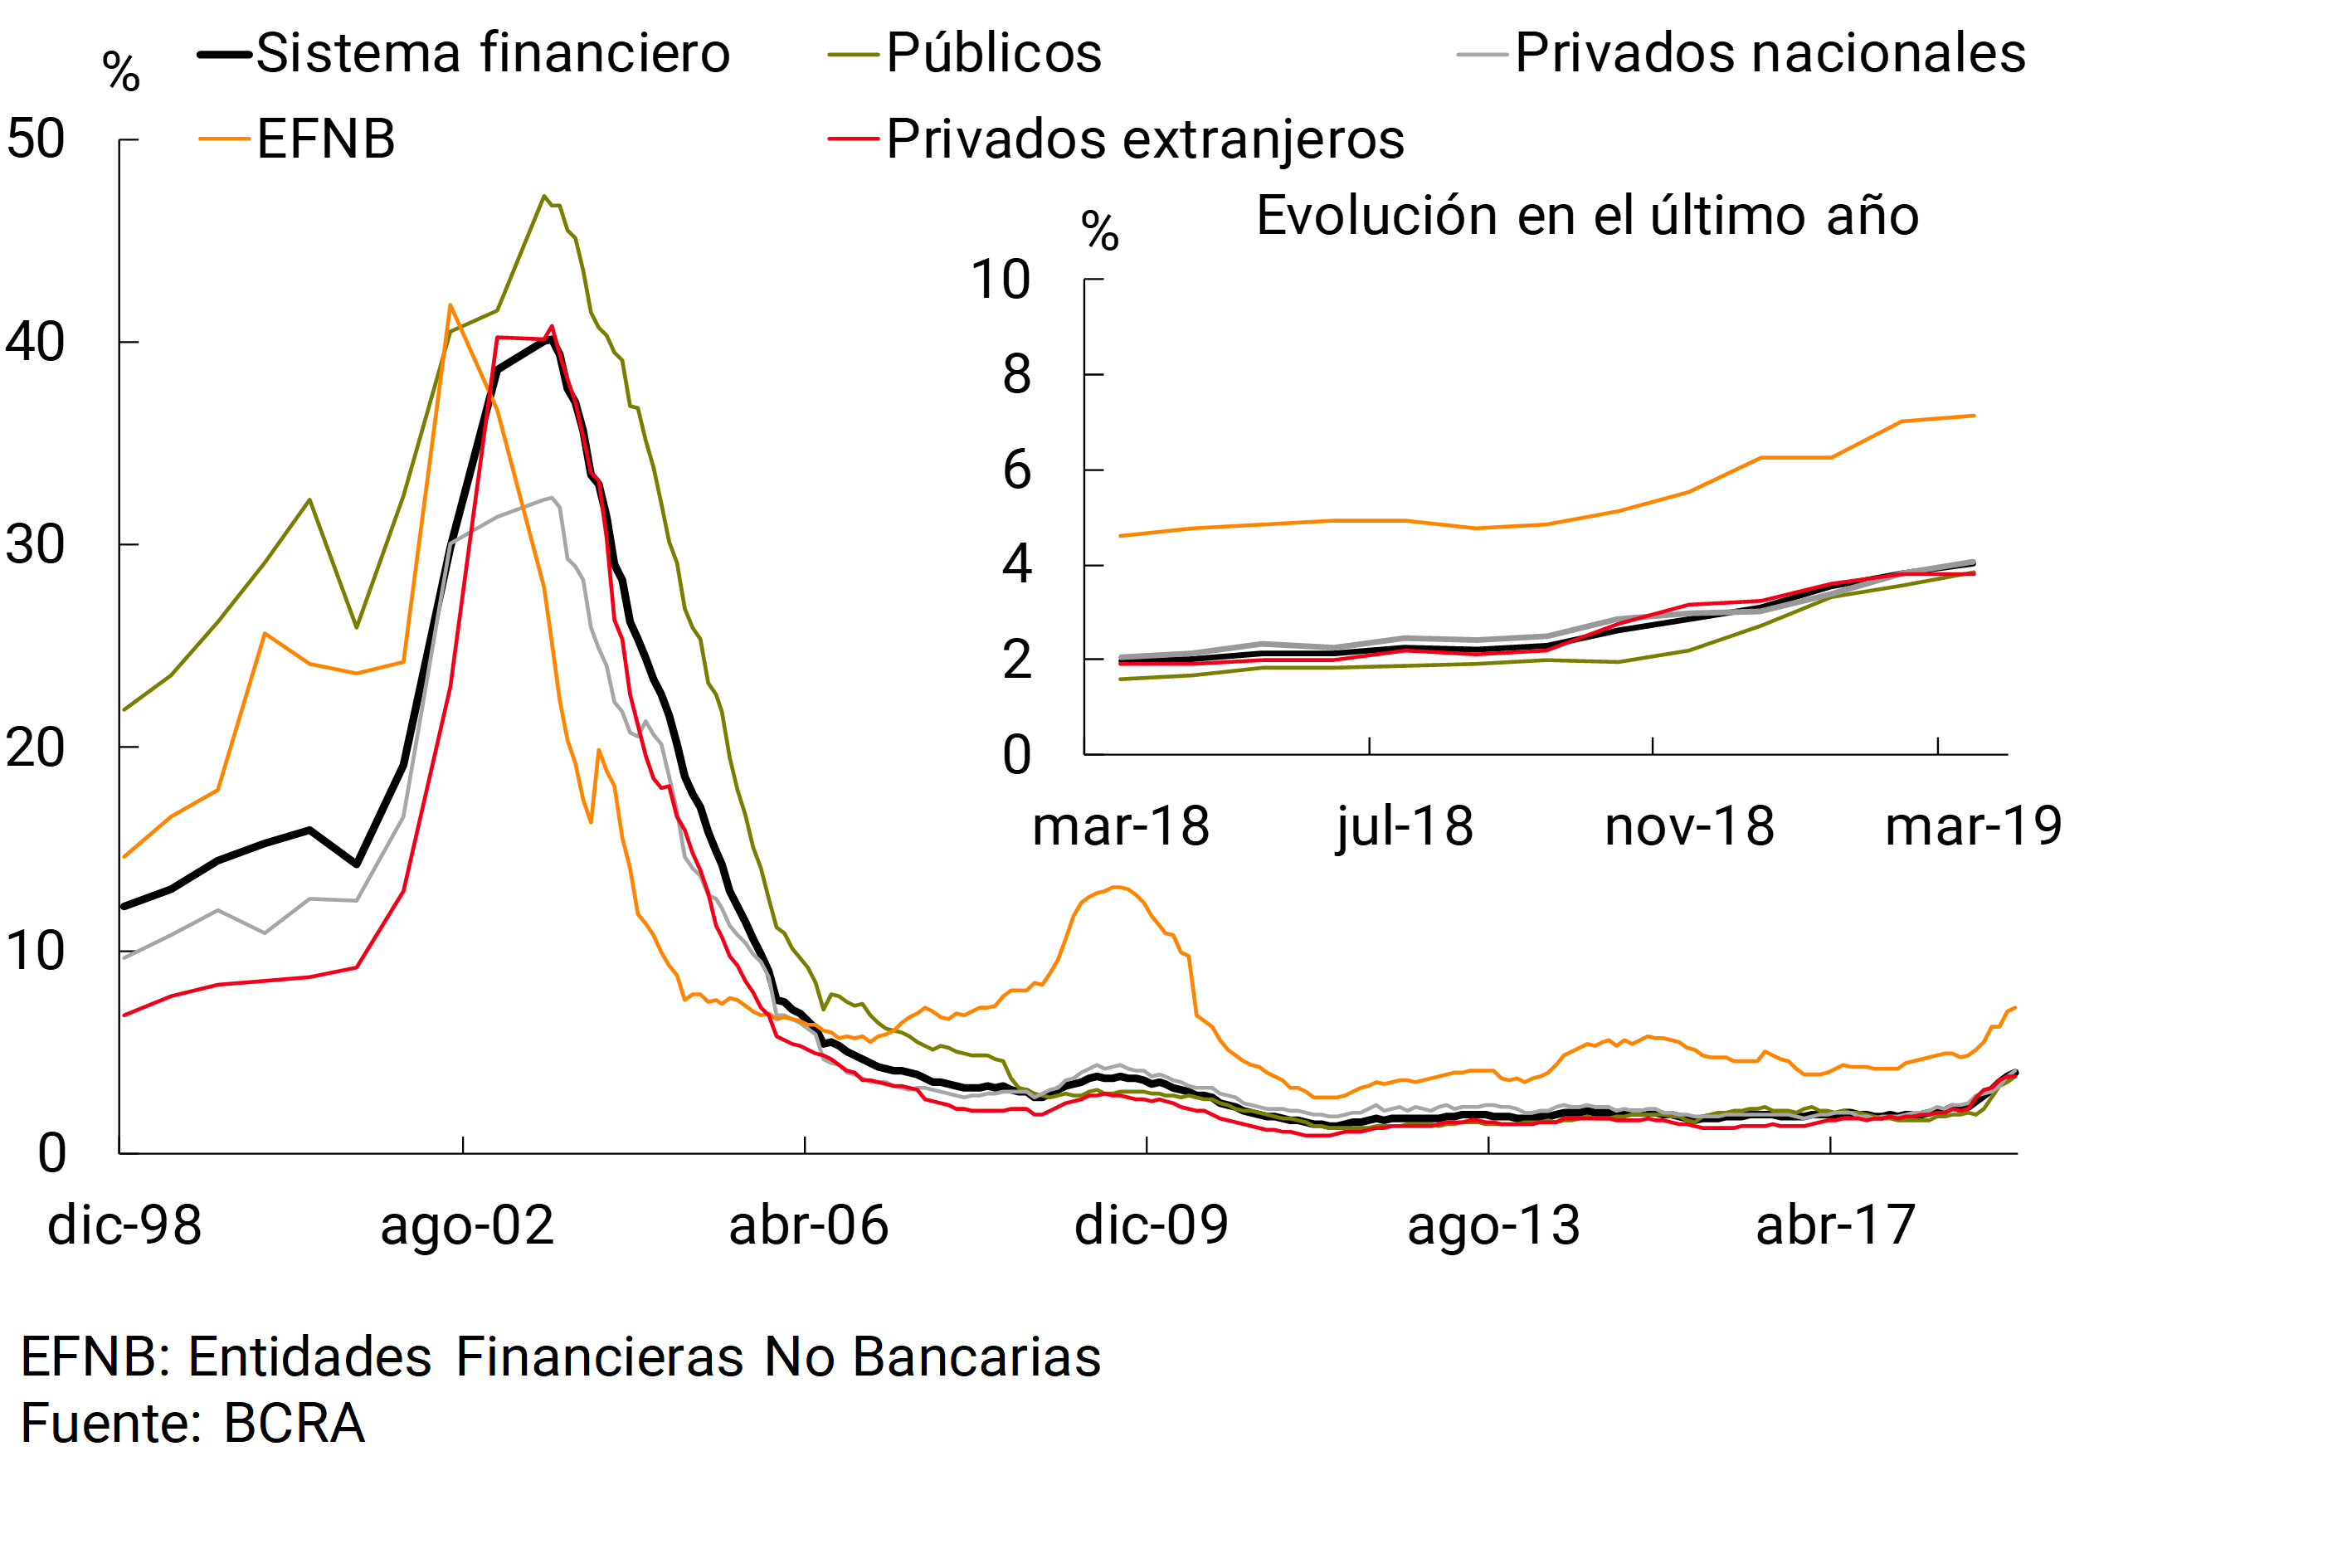
In March, the non-performing loan ratio to the private sector stood at 4%, increasing 0.2 p.p. compared to February (+2.1 p.p. y.o.y.; see Chart 10). The NPL ratio for loans to companies increased by 0.3 p.p. to 3.8% (+2.8 p.p. y.o.y.). The irregularity of financing to families reached 4.5% in March, slightly higher than in February (+1.4 p.p. y.o.y.). The delinquency rate of mortgage loans to households remained at relatively low levels at the end of the first quarter: 0.26% for those denominated in UVA and 0.61% for the rest, with no relevant changes so far in 2019.
Figure 10 | Irregularity of Credit to the Private Sector – Irregular financing / Total financing (%)
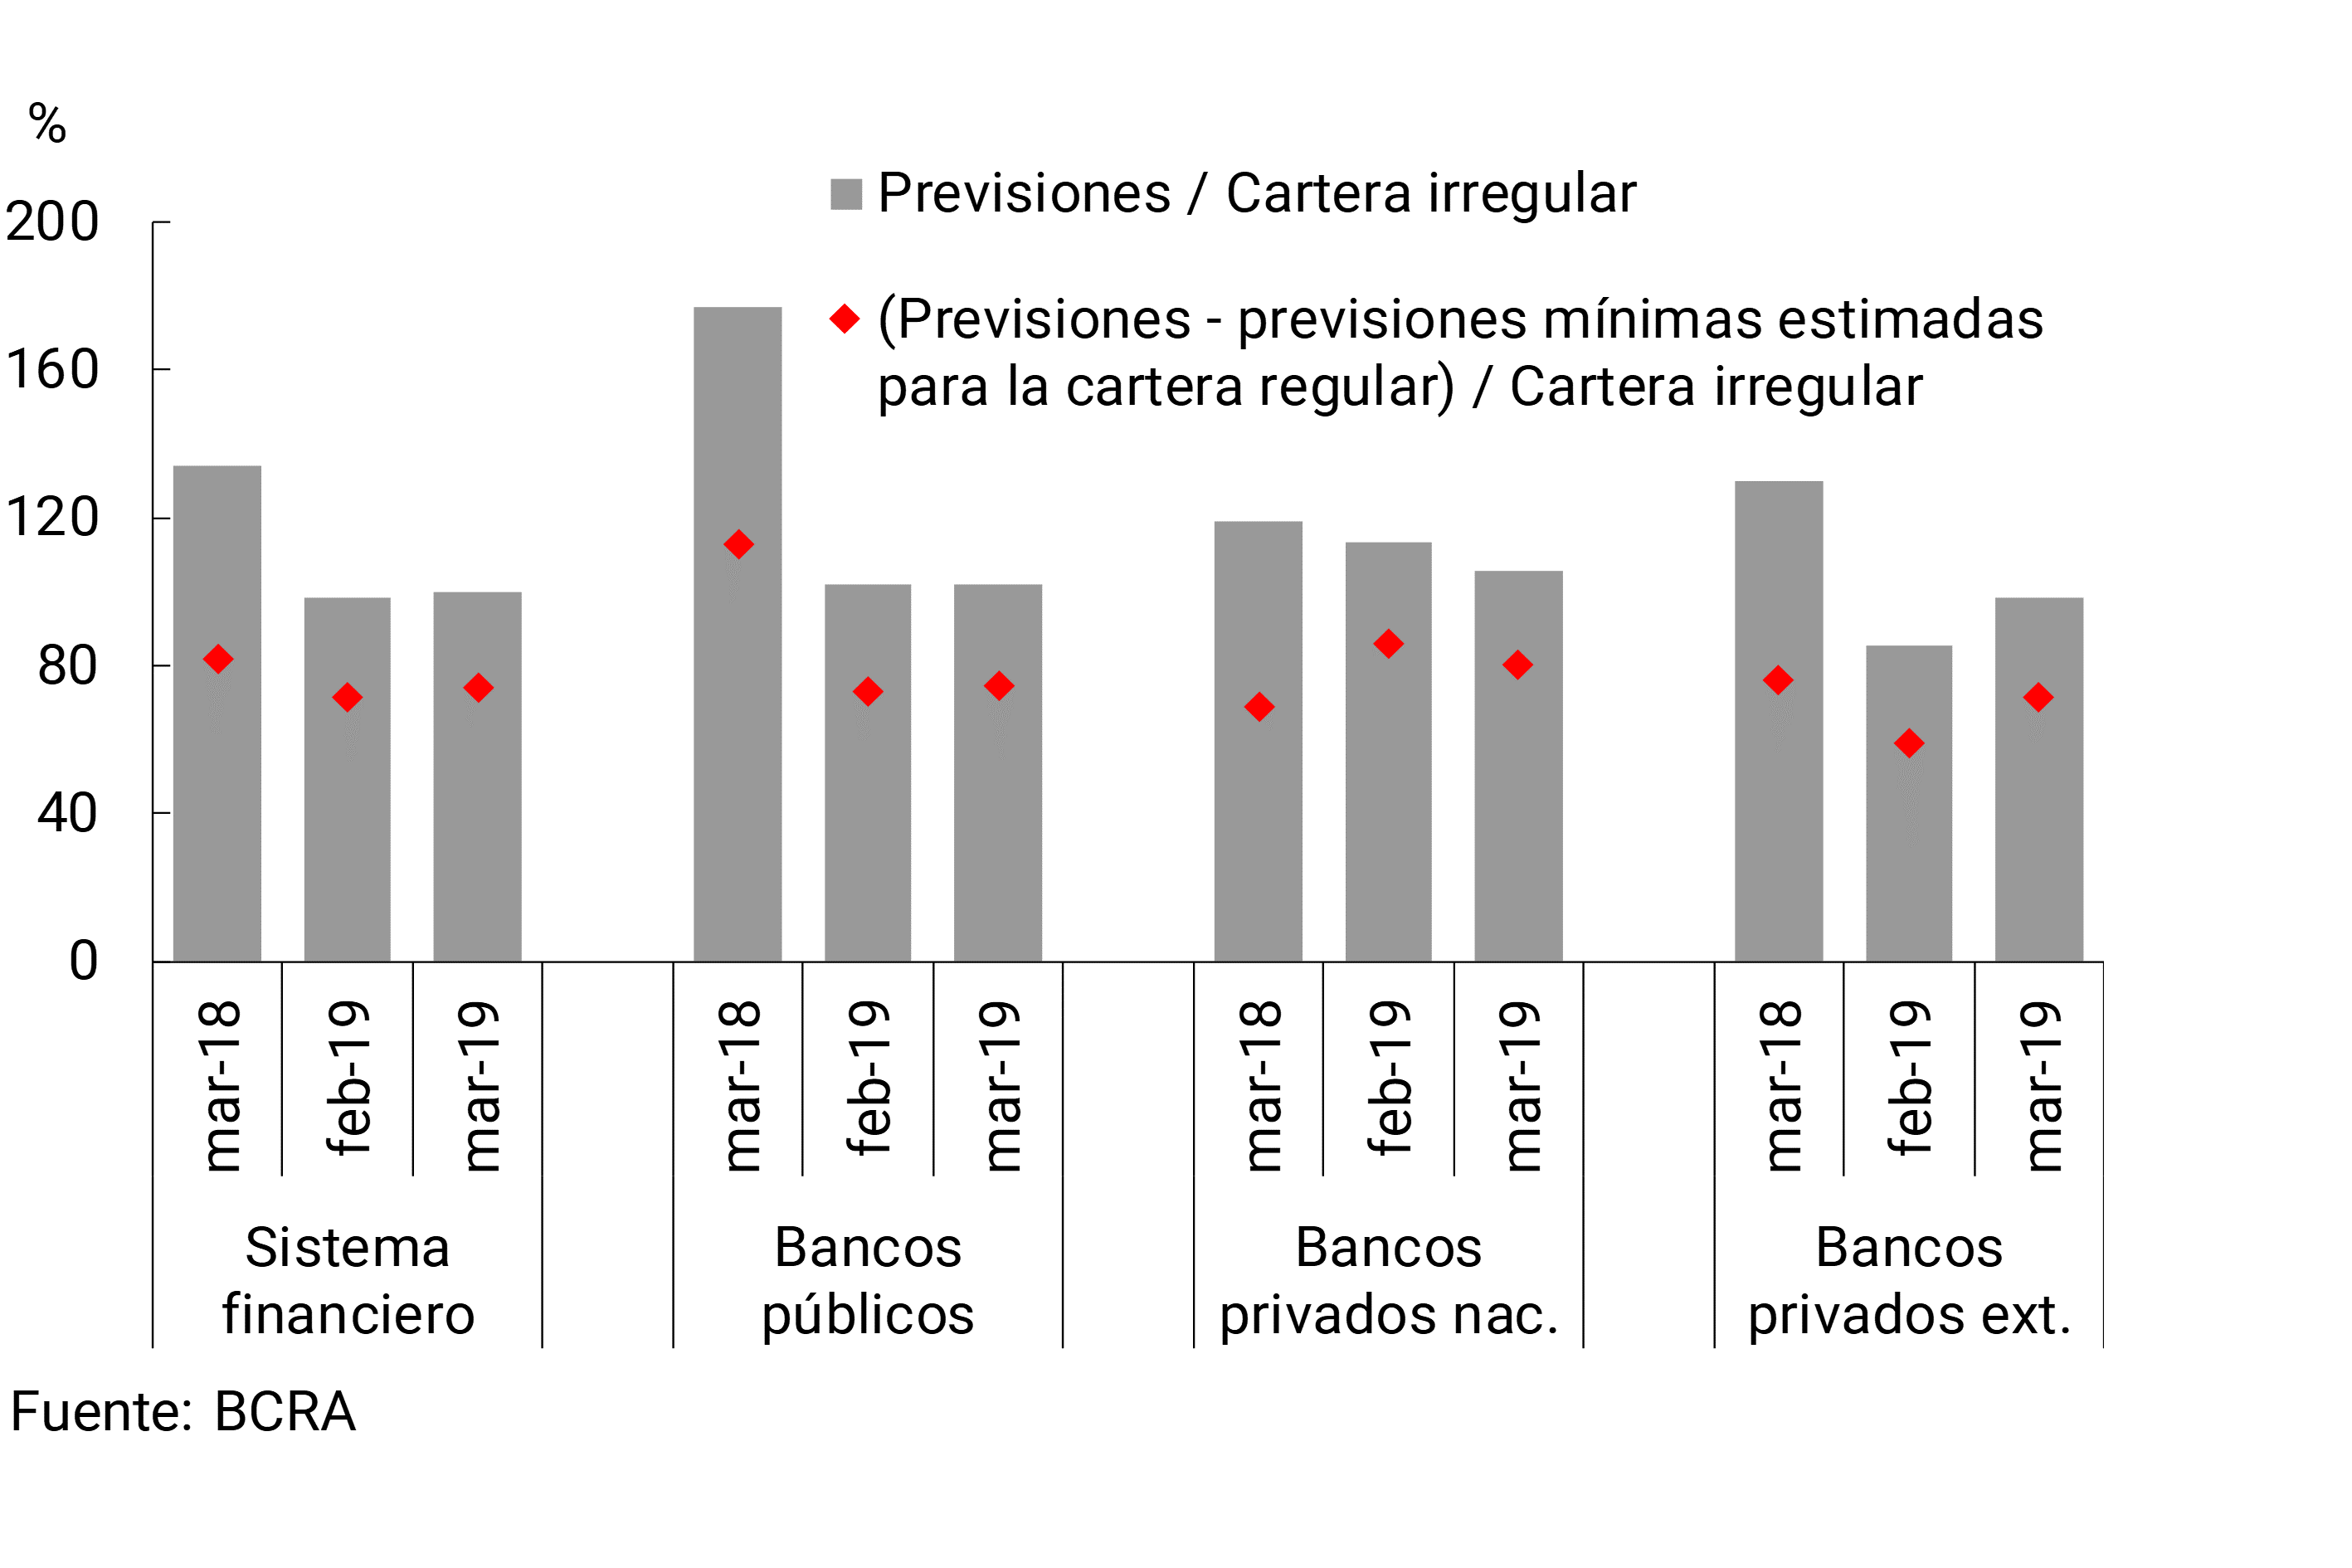
It is estimated that at the aggregate level, the balance of provisions constituted for loans in an irregular situation represented 74% of this portfolio in March (see Graph 11), well above the minimum required by regulation (estimated at 44% of the irregular portfolio). Considering the balance of total accounting forecasts (i.e., those awarded to both the regular and irregular portfolios), in the month the aggregate forecast represented an amount equivalent to 100% of the irregular portfolio to the private sector.
Figure 11 | Forecasting of the Financial System
The relatively high levels of forecasting and capital (see Section IV), together with the moderate weighting of credit in total assets and the current levels of irregularity, help to define a significant degree of resilience of the financial system at the aggregate level in the face of the possible additional materialization of the credit risk assumed.12
IV. Solvency
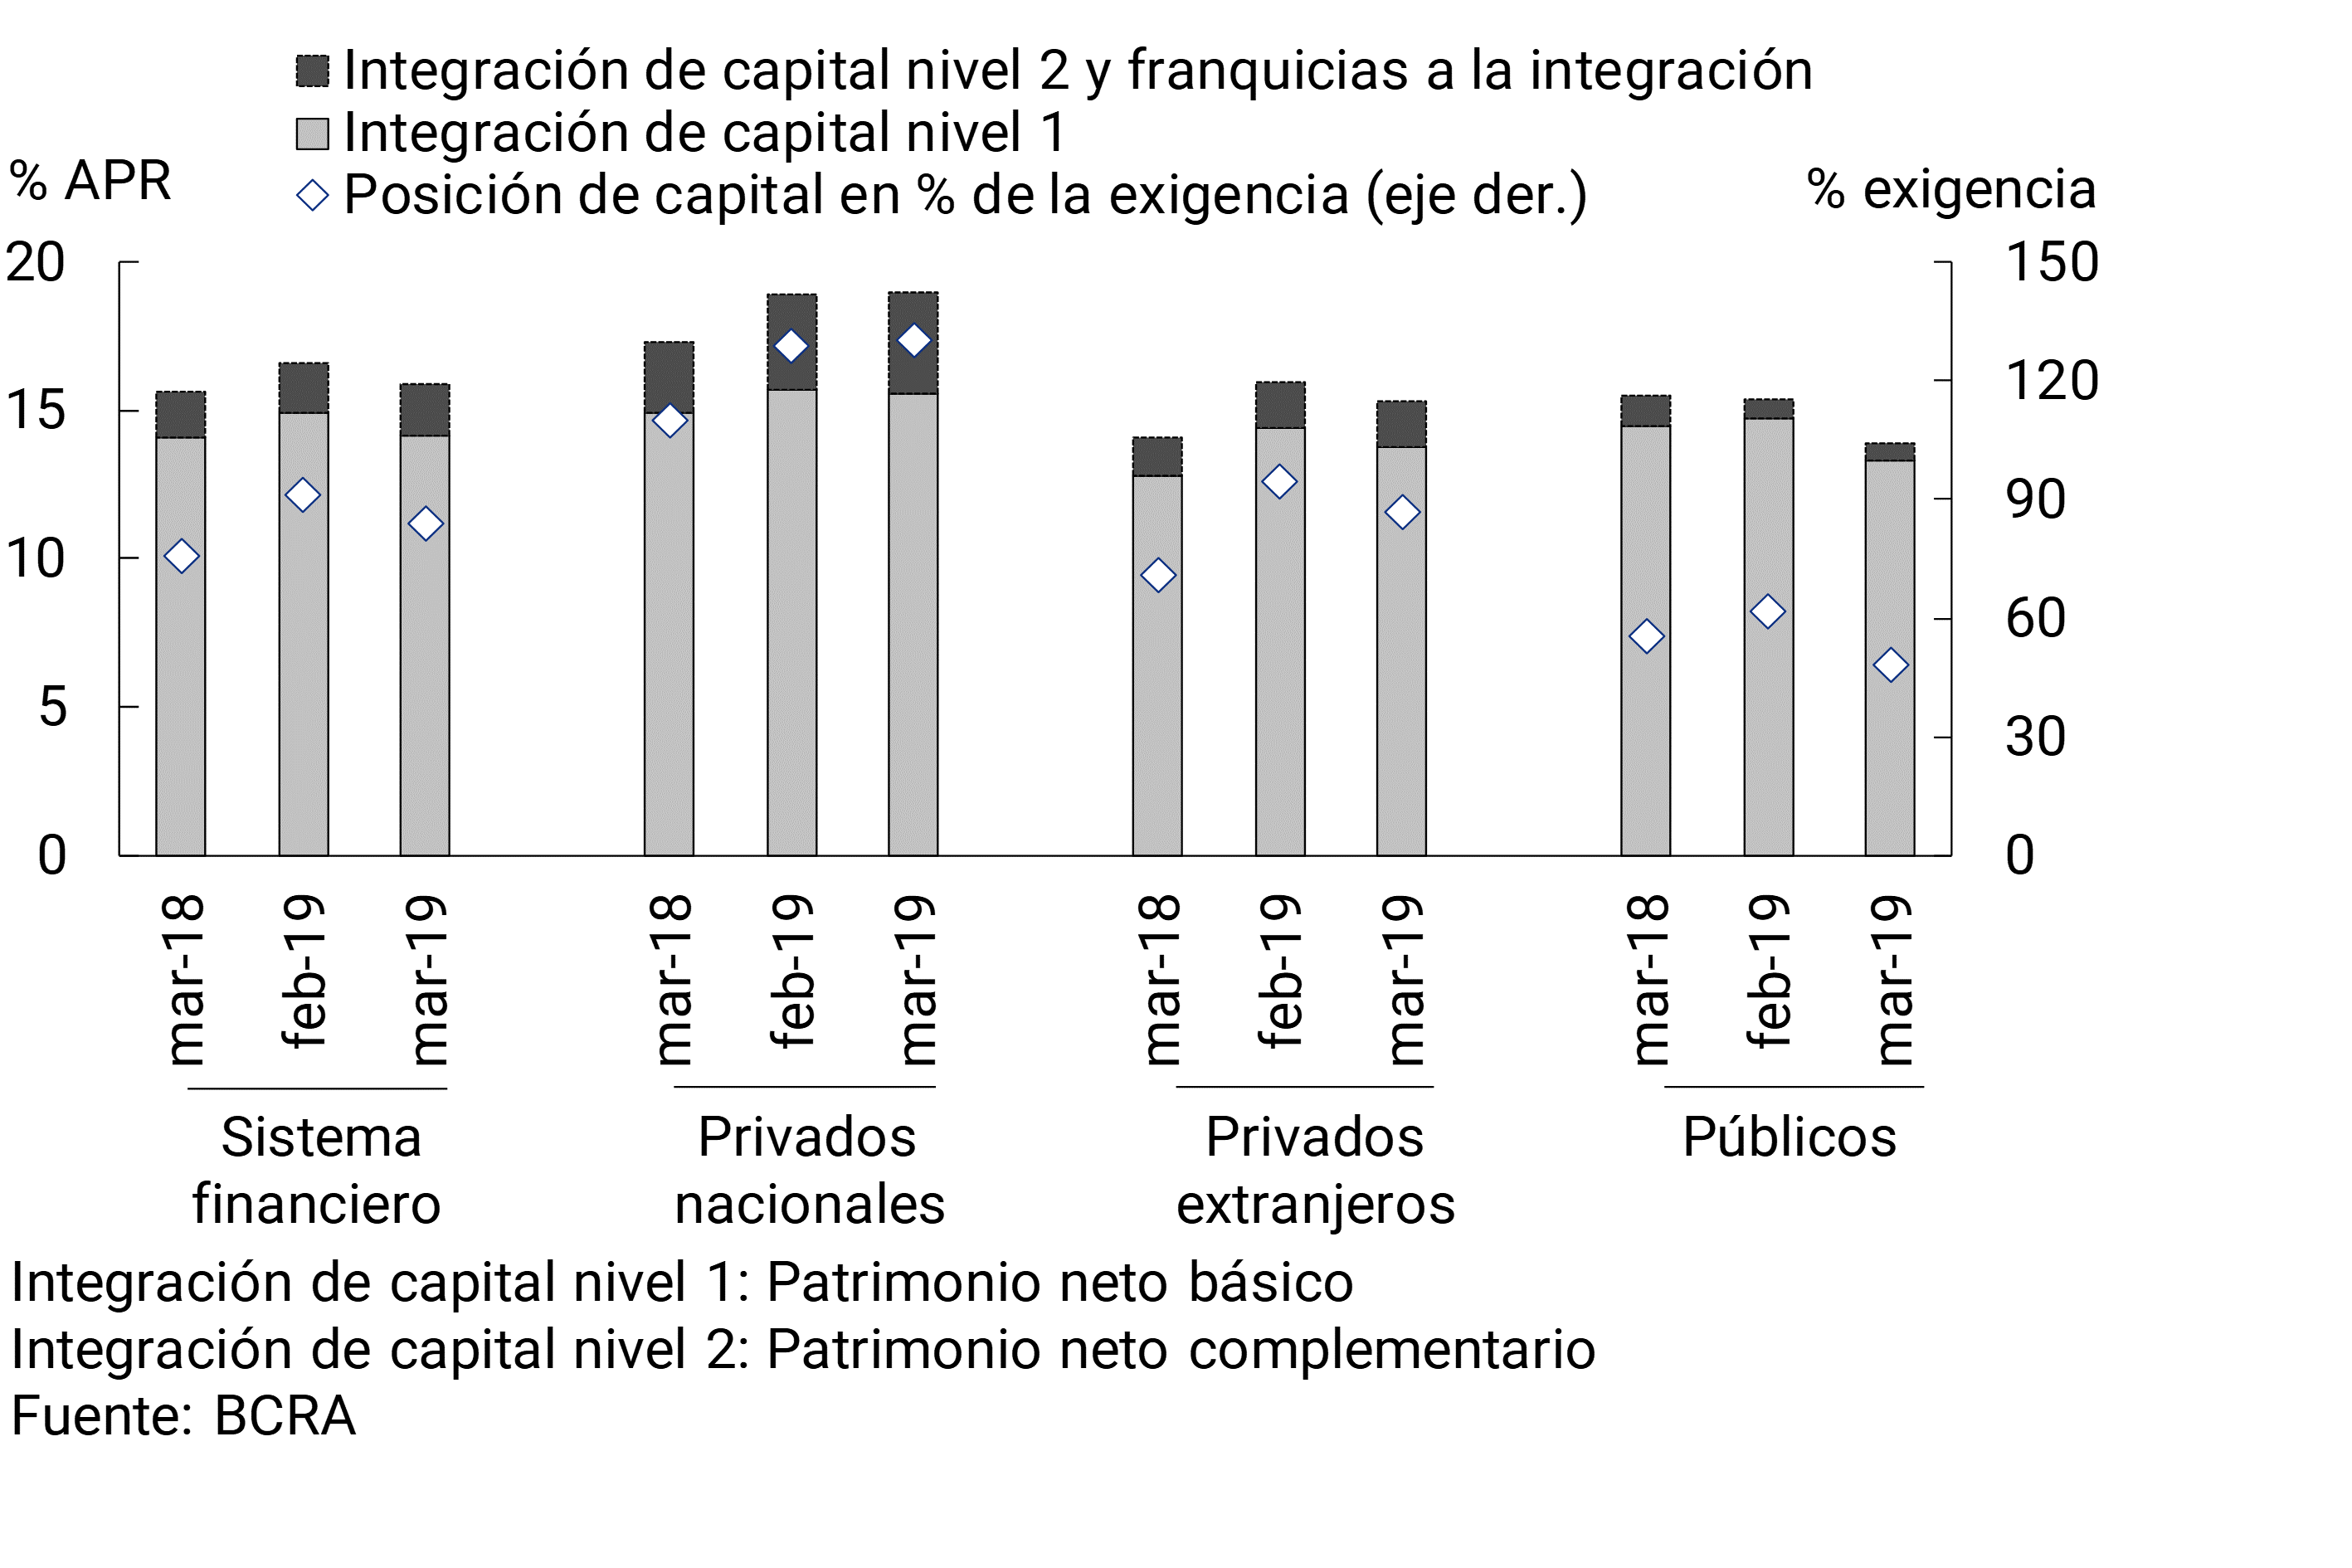
In March, the solvency ratios of the aggregate financial system remained at high levels. Capital integration represented 15.9% of risk-weighted assets (RWA) at the end of the first quarter of 2019 (see Chart 12), slightly lower than last February, although higher than the figure for the same month last year. In the period, excess capital integration reached 84% of the regulatory requirement.
Figure 12 | Integration and Excess Regulatory Capital
The financial system recorded nominal gains that in March represented 6% of assets (ROA) (see Chart 13). Taking into account the cumulative figure in the 12 months to March 2019, nominal earnings reached 4.5% of assets (+1.7 p.p. y.a.) and 40.7% of equity (+17.9 p.p. y.o.y.).
Figure 13 | Profitability of the Financial System
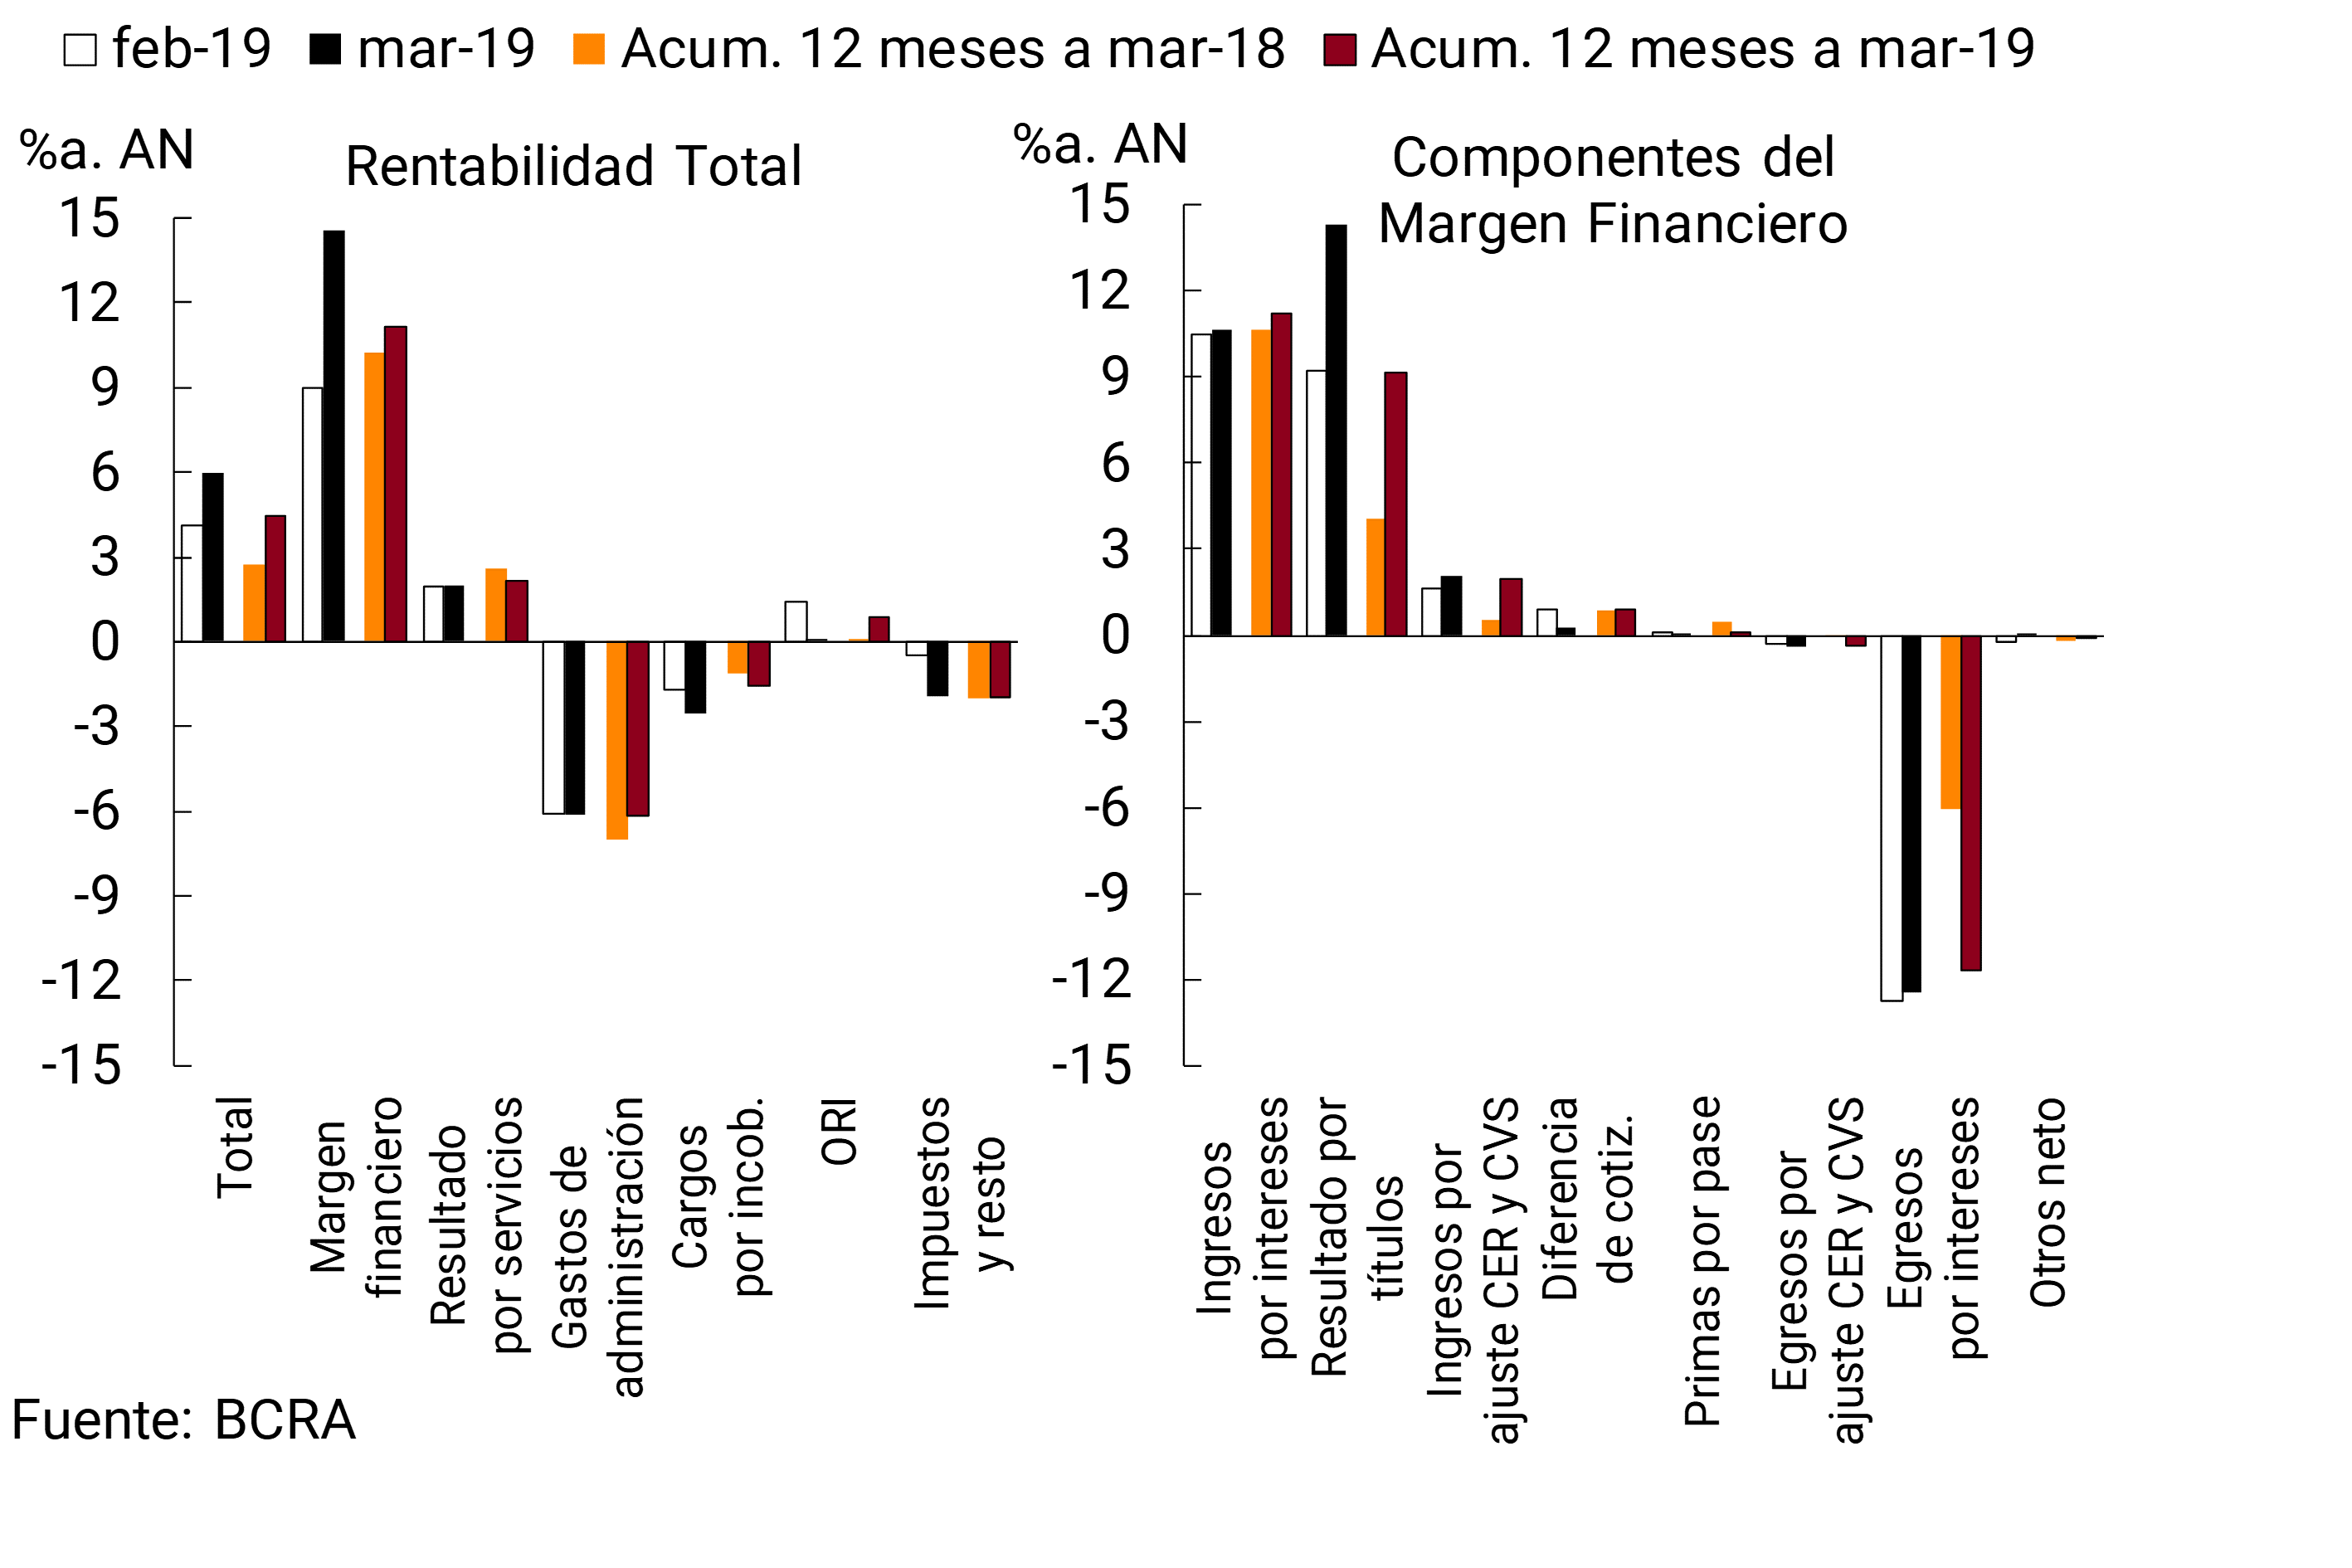
The financial margin of the banks as a whole stood at 14.6% of assets in the month, increasing compared to February mainly due to higher gains on securities. In the accumulated 12 months to March, the financial margin represented 11.2% of assets, 0.9 p.p. more in a year-on-year comparison.
Net income from services remained around 2% of assets in March, and considering the accumulated 12 months they represented 2.2% of assets (-0.5 p.p. y.o.y.).
Uncollectibility charges increased in March, to 2.5% y/y of assets (1.6% of assets in the cumulative 12 months, +0.5 p.p. y.o.y.). Administrative expenses totaled 6.1% y/y of assets in the month, without significant changes compared to February (6.2% of assets in the last 12 months, -0.8 p.p. y.o.y.).
References
1 For more details, see the Financial Stability Report of May 2019.
2 Considering differences in balance sheet balance.
3 In relation to electronic means of payment, it should be considered that the BCRA recently decided to simplify the operation of the DEBIN (immediate debit). See related news and Communication A6698.
4 The BCRA provided that financial institutions may offer adolescents between 13 and 17 years of age a savings account in pesos, without the need to be accompanied to open it by their legal representatives. For more details see and Communication A6700.
5 The increase in the nominal peso-dollar exchange rate in March (11.2%) influenced the re-expression in pesos of the balance sheet items in foreign currency.
6 Availability, integration of minimum cash and BCRA instruments, in national and foreign currency.
7 For more detail, see Section 3.1 and 3.3 of the May 2019 Financial Stability Report.
8 Includes principal adjustments and accrued interest.
9 This monthly variation was mainly explained by the effect of the depreciation of the peso against the dollar between the end of the month on credit lines in foreign currency.
10 Information from the Debtors’ Center (national and foreign currency). Loans to residents abroad are not included. Adjustments in principal and accrued interest are considered. Financing to companies is defined as that granted to legal entities and commercial financing granted to individuals. On the other hand, loans to families are considered to be those granted to individuals, unless they are for commercial purposes.
11 It reached 39.6% in terms of net assets.
12 For more detail, see Section 3.2 of the May 2019 Financial Stability Report.
Share on


