I. Recent measures1
In order to encourage savings within the local financial system, the BCRA reduced from 180 to 90 days the minimum term for deposits and other term investments in UVA, as well as the term for savings accounts called “Algancía UVA”2.
In April, the conditions for the operation of ATMs operated by non-financial entitieswere extended 3. It was provided that financial institutions must interconnect the ATMs of non-financial companies to the accounts and debit cards of their customers. Thus, it seeks to continue promoting the development of the system in a framework of greater competition, by promoting the installation of ATMs by non-financial institutions.
Recently, the BCRA relaxed the conditions for granting loans to agricultural producers who have coverage against climatic events4. In this regard, the capital requirements and provisions for the risk of uncollectibility were reduced for those loans to the agricultural sector that contain such hedges.
In order to continue improving interoperability between demand accounts and non-bank payment services, the Uniform Virtual Key (CVU) was created in May5. This key allows the identification and traceability of fund transfers made between demand accounts when, at least, one of them belongs to a company providing non-bank payment services.
In early May 2018, changes were made to the global net foreign currency position (GNP) of financial institutions. It was provided that the positive PGN will be computed in daily balances6, not being able to exceed 10% of the computable patrimonial liability (RPC) or the liquid equity of the entities, of both the lowest7.
On the other hand, the BCRA recently established that for the May-July period, the requirement and integration of the minimum cash in pesos will be observed on the average that arises from dividing the sum of the daily balances of the included items recorded during that period by the total number of days of quarter8.
II. Activity
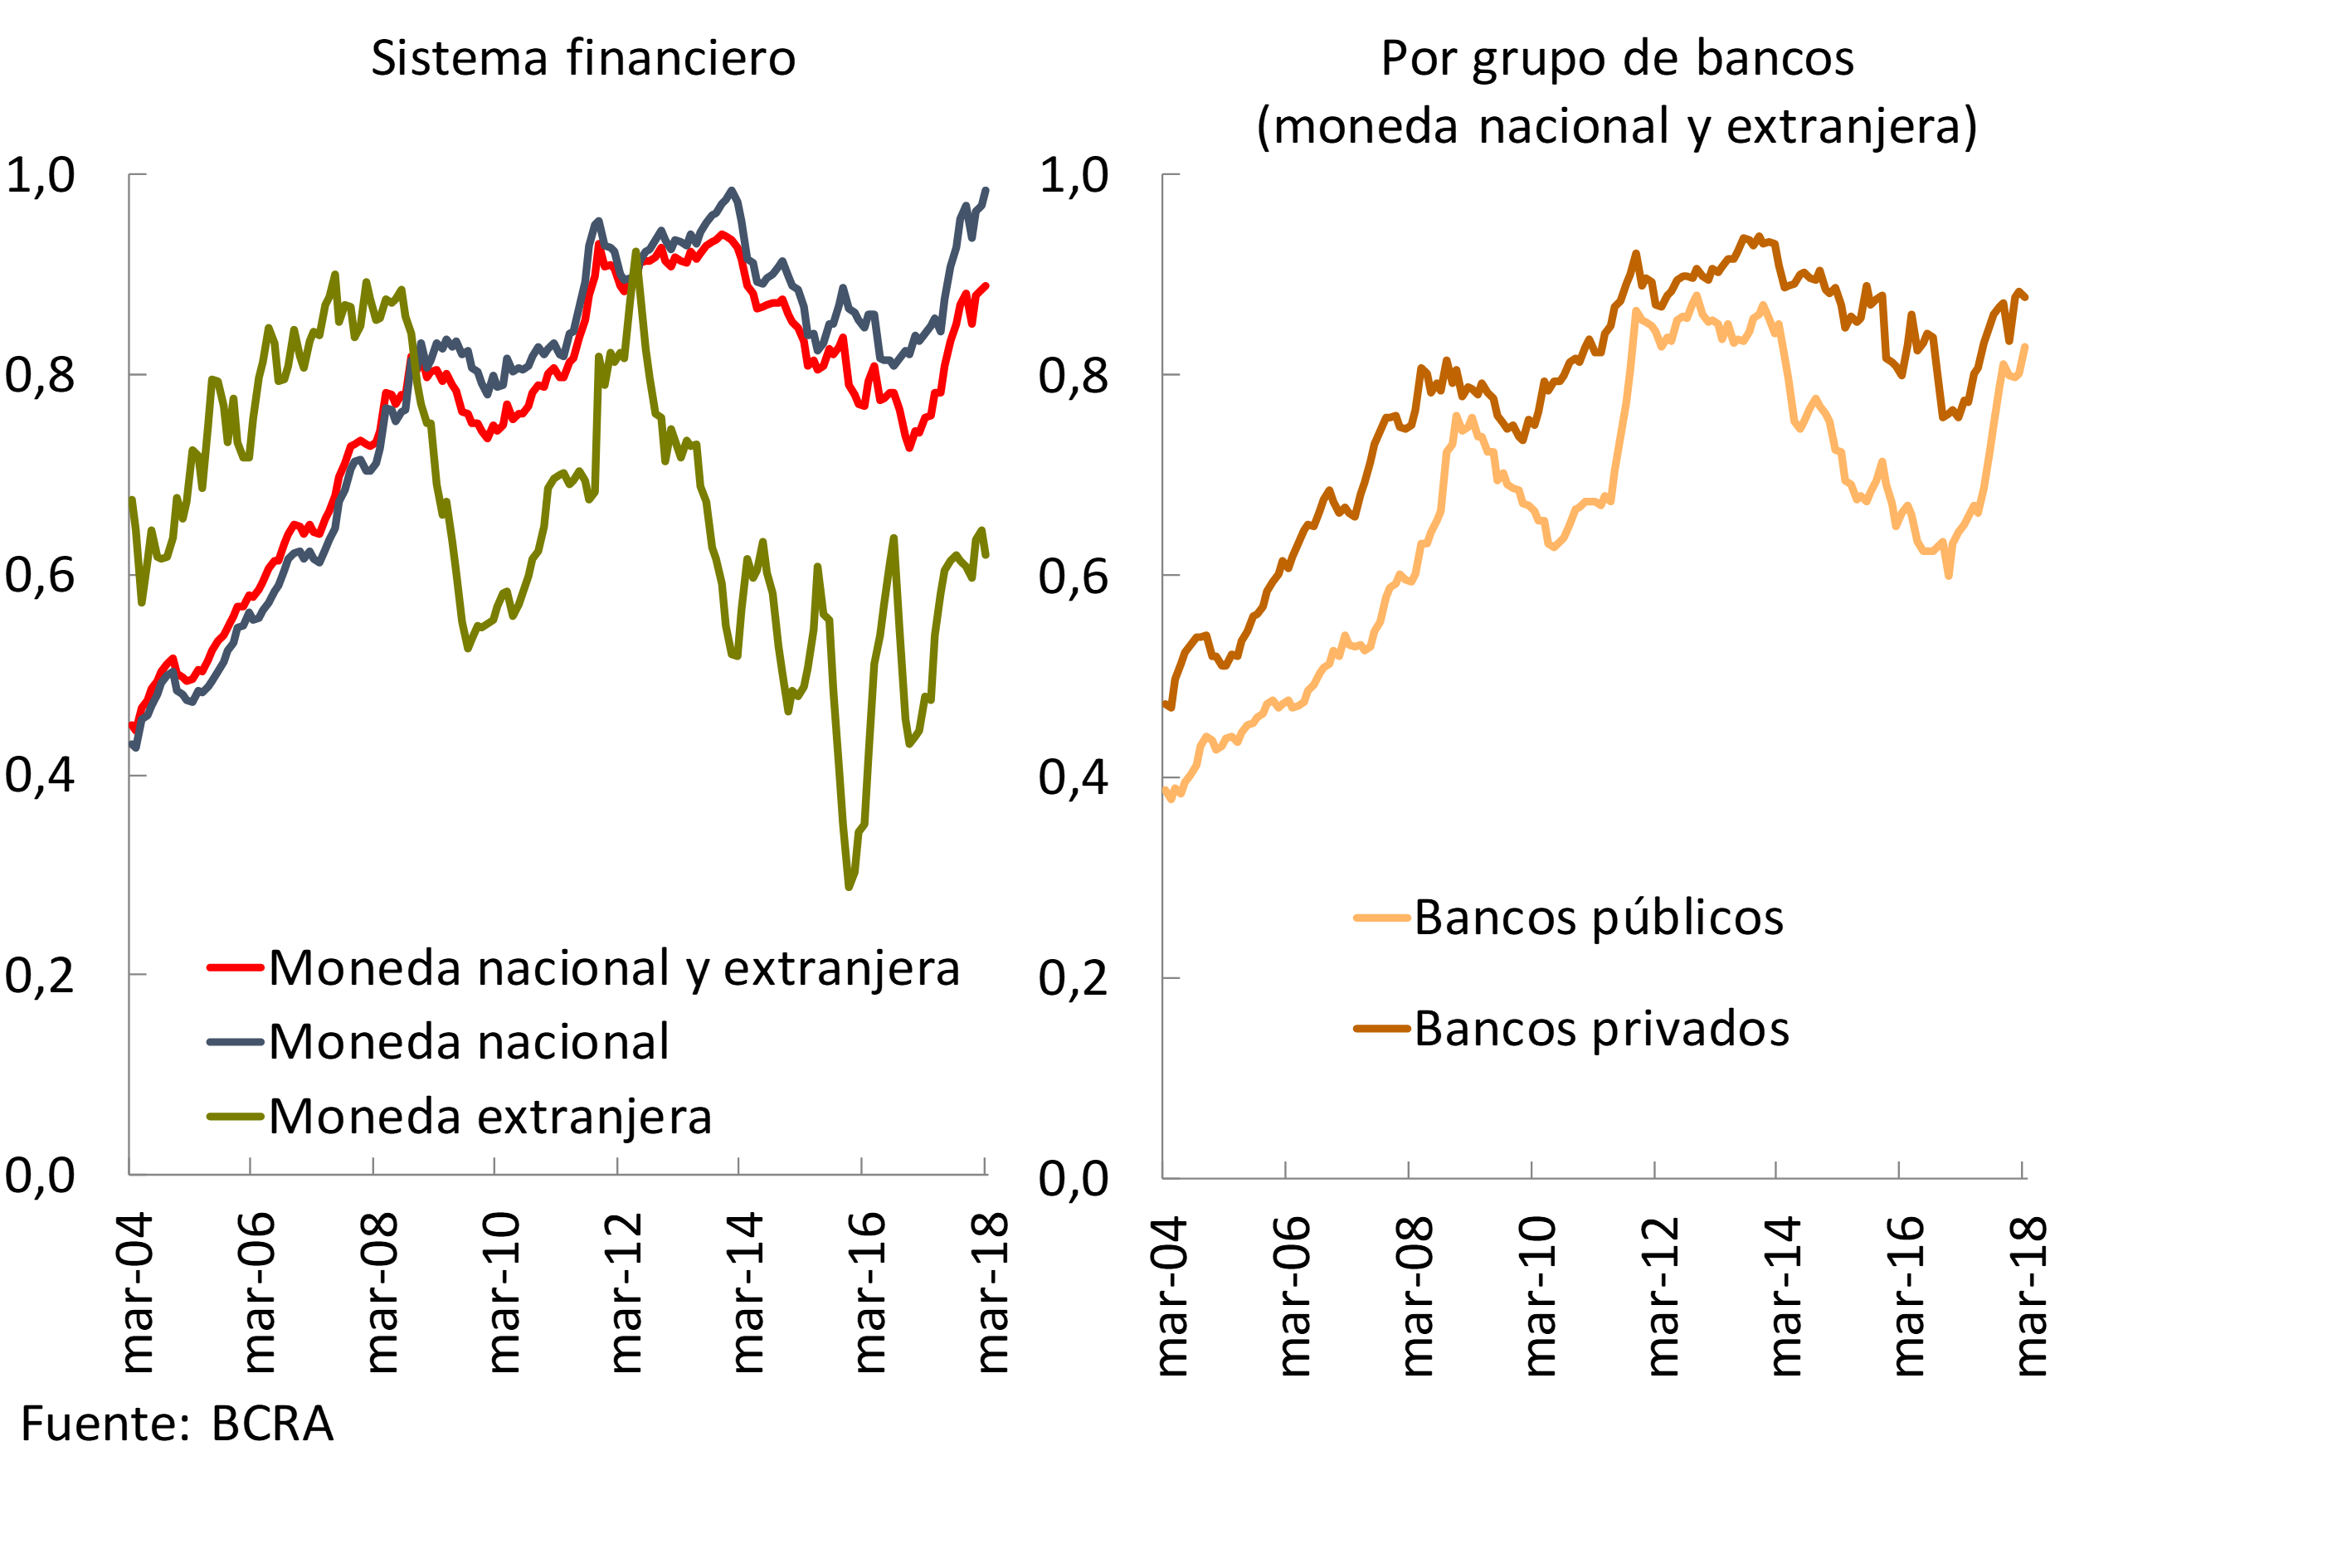
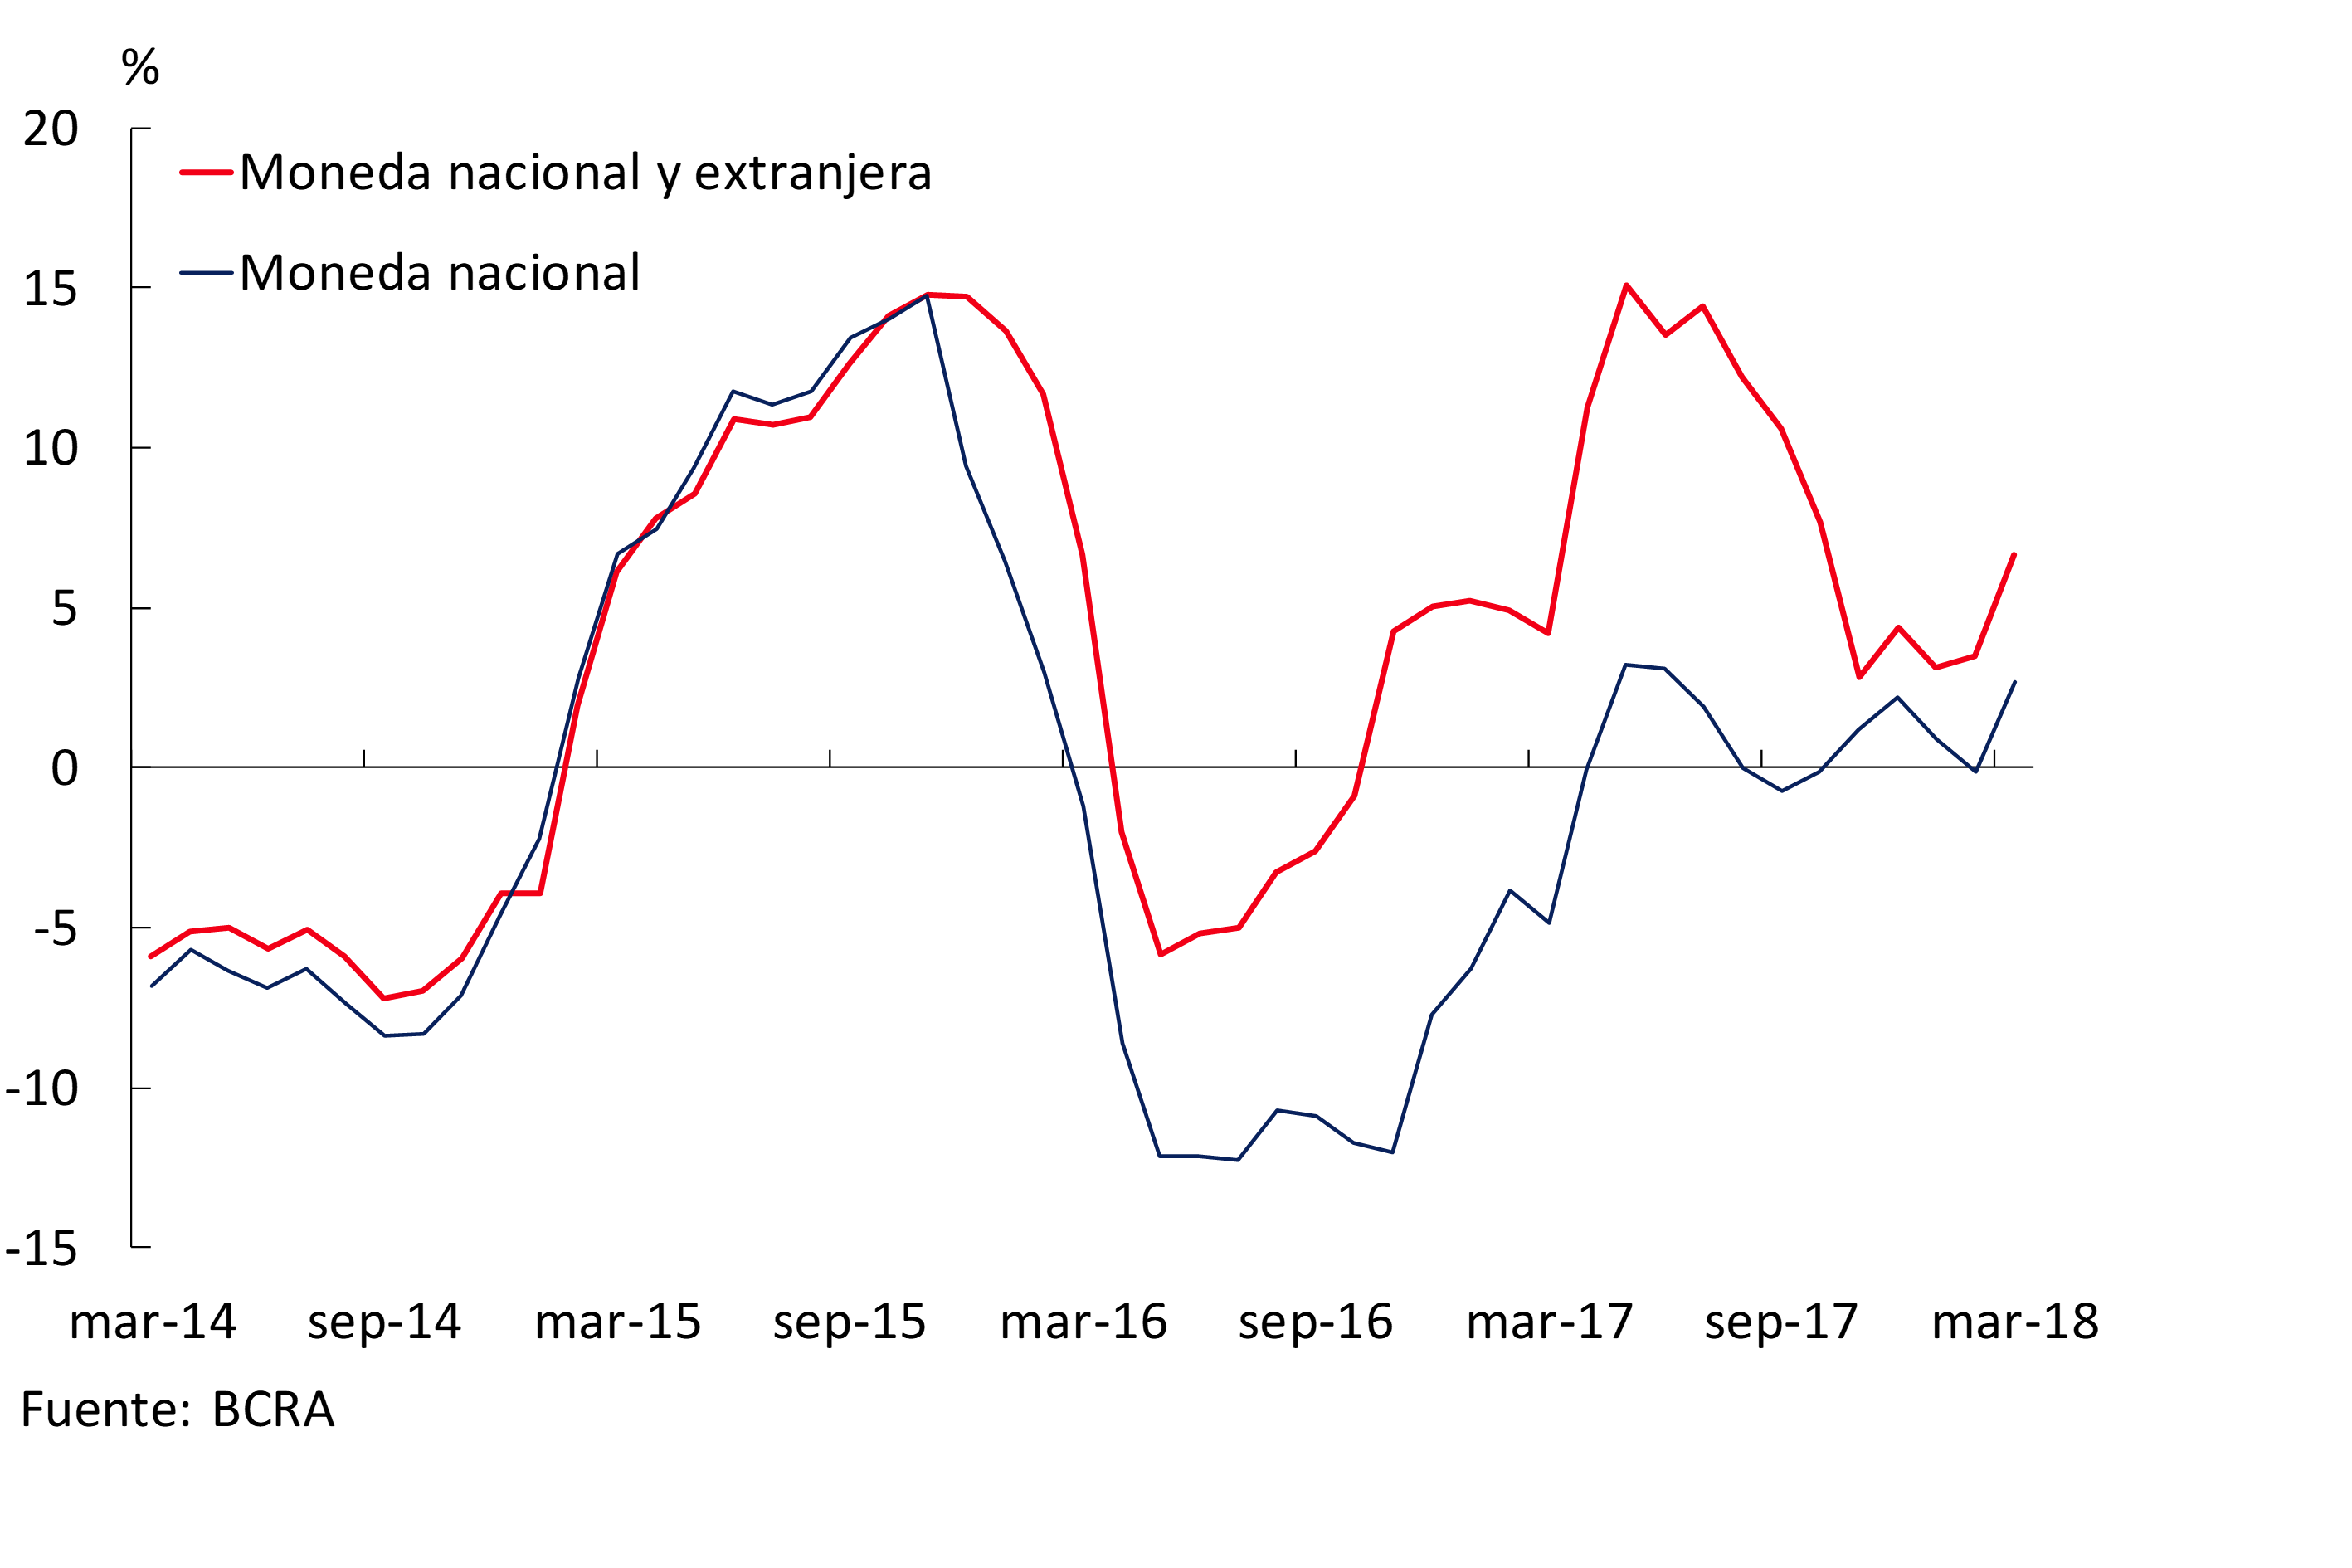
At the end of the first quarter , financial intermediation continued to grow, with the segment in national currency with the private sector standing out. Loans in pesos once again showed a greater monthly dynamism than deposits, mainly explained by public banks (see Graph 1). Thus, the ratio between loans and deposits in national currency was around 98%, 14 p.p. more than a year ago. On the other hand, considering the balances in domestic and foreign currency, the ratio between loans and deposits amounted to 89% at the end of the first quarter of the year, 13 p.p. above the level evidenced 12 months ago.
Graph 1 | Loans in Deposit Terms – Balance Sheet Balances – Private Sector
Based on the estimate of the monthly flow of funds for the financial system, the reduction in the holdings of BCRA instruments ($35,000 million) and the increase in private sector deposits in pesos ($34,000 million) were the main sources of funding for banks. These resources were mainly channeled to increase financing in pesos to the private sector ($55,000 million) and, to a lesser extent, to reduce the balance of deposits in pesos of the public sector ($25,000 million).
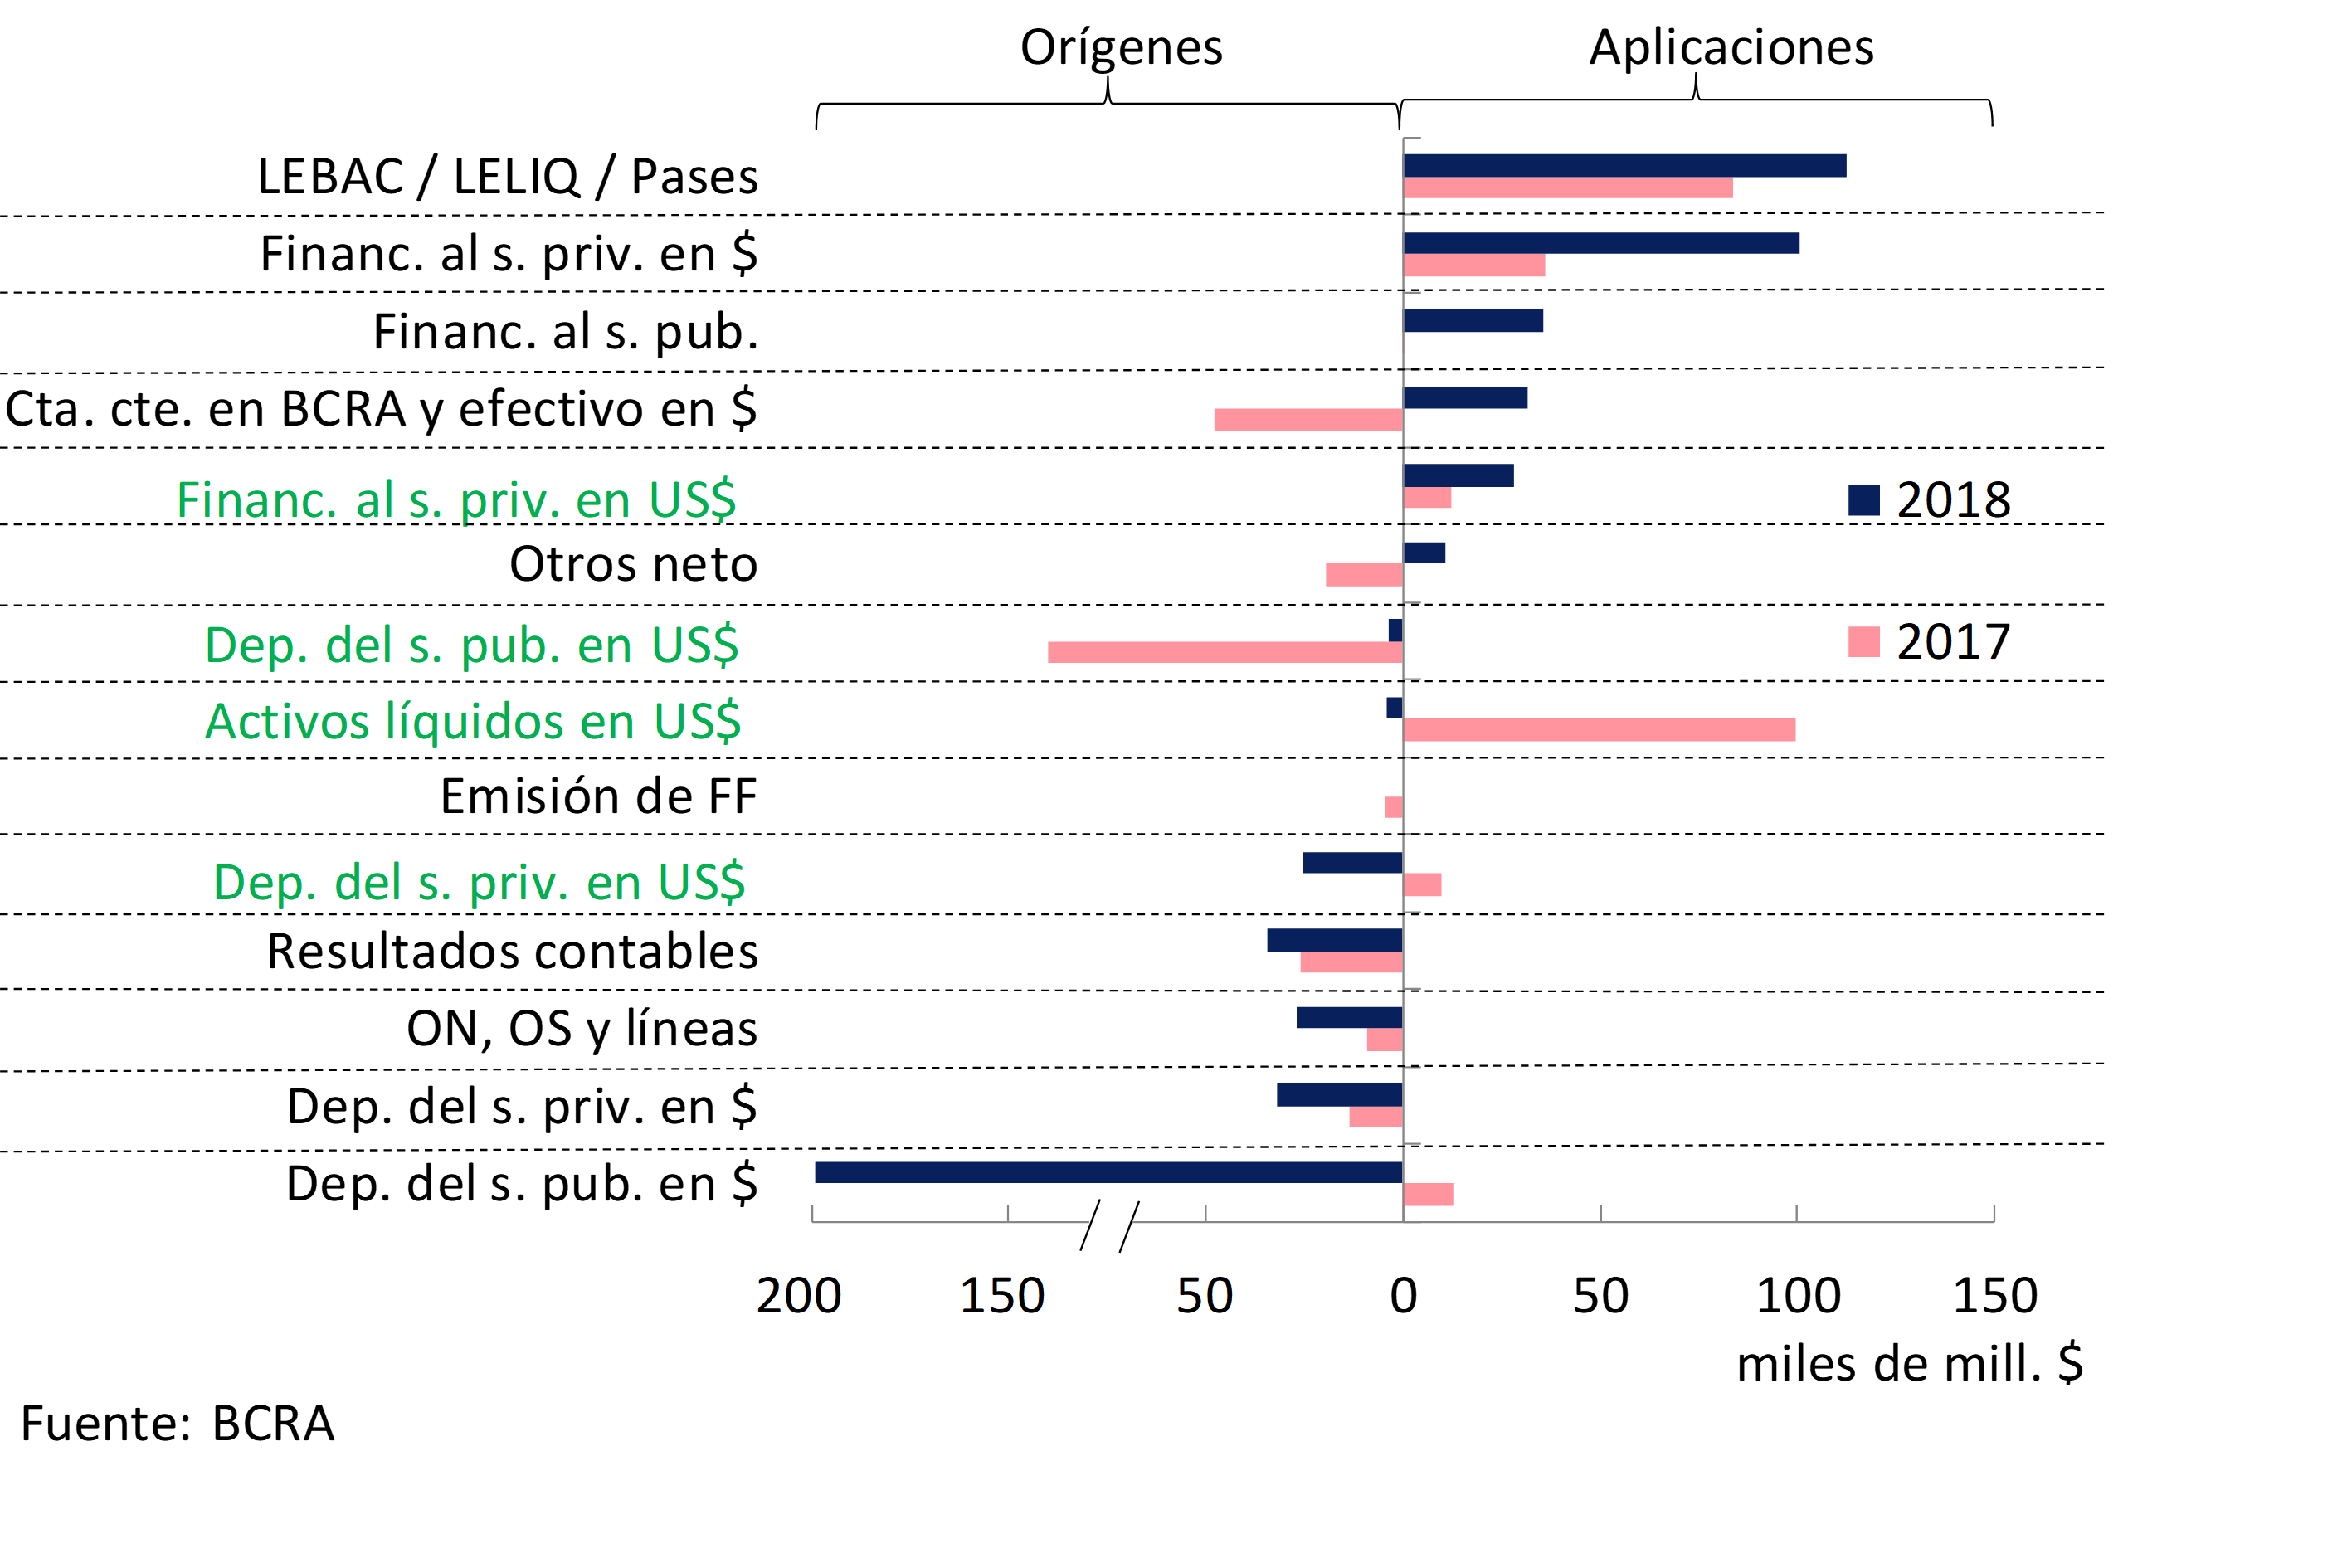
Considering the first quarter, the increase in public sector deposits ($199,000 million) was the most prominent source of resources for the banks as a whole (see Chart 2). These funds were mainly applied to increase the holdings of BCRA instruments ($111,000 million) and credit to the private sector in national currency ($100,000 million). Compared to what was evidenced a year ago, in the first three months of this year a greater volume of financial intermediation in pesos was observed. The quarterly performance both this year and last year was greatly influenced by the operations of public banks. On the other hand, when considering the flow of funds in the first three months of this year for private banks, it was evident that the reduction in financing to the public sector and the increase in negotiable obligations were the main sources of funding9, mainly channeled to increase credit to the private sector in national currency.
Graph 2 | First Quarter Cash Flow Estimate – Financial System
Considering the different equity mismatches in the financial system, it is estimated that in the first months of the year the difference between assets and liabilities that adjust for inflation is equivalent to 43% of regulatory capital. For its part, the foreign currency mismatch fell by 4.3 p.p. of the PRC in the month to a total of 7.4%. The monthly behavior was driven by foreign banks that reduced net forward purchases, the balance of loans in foreign currency and increased deposits in that denomination.
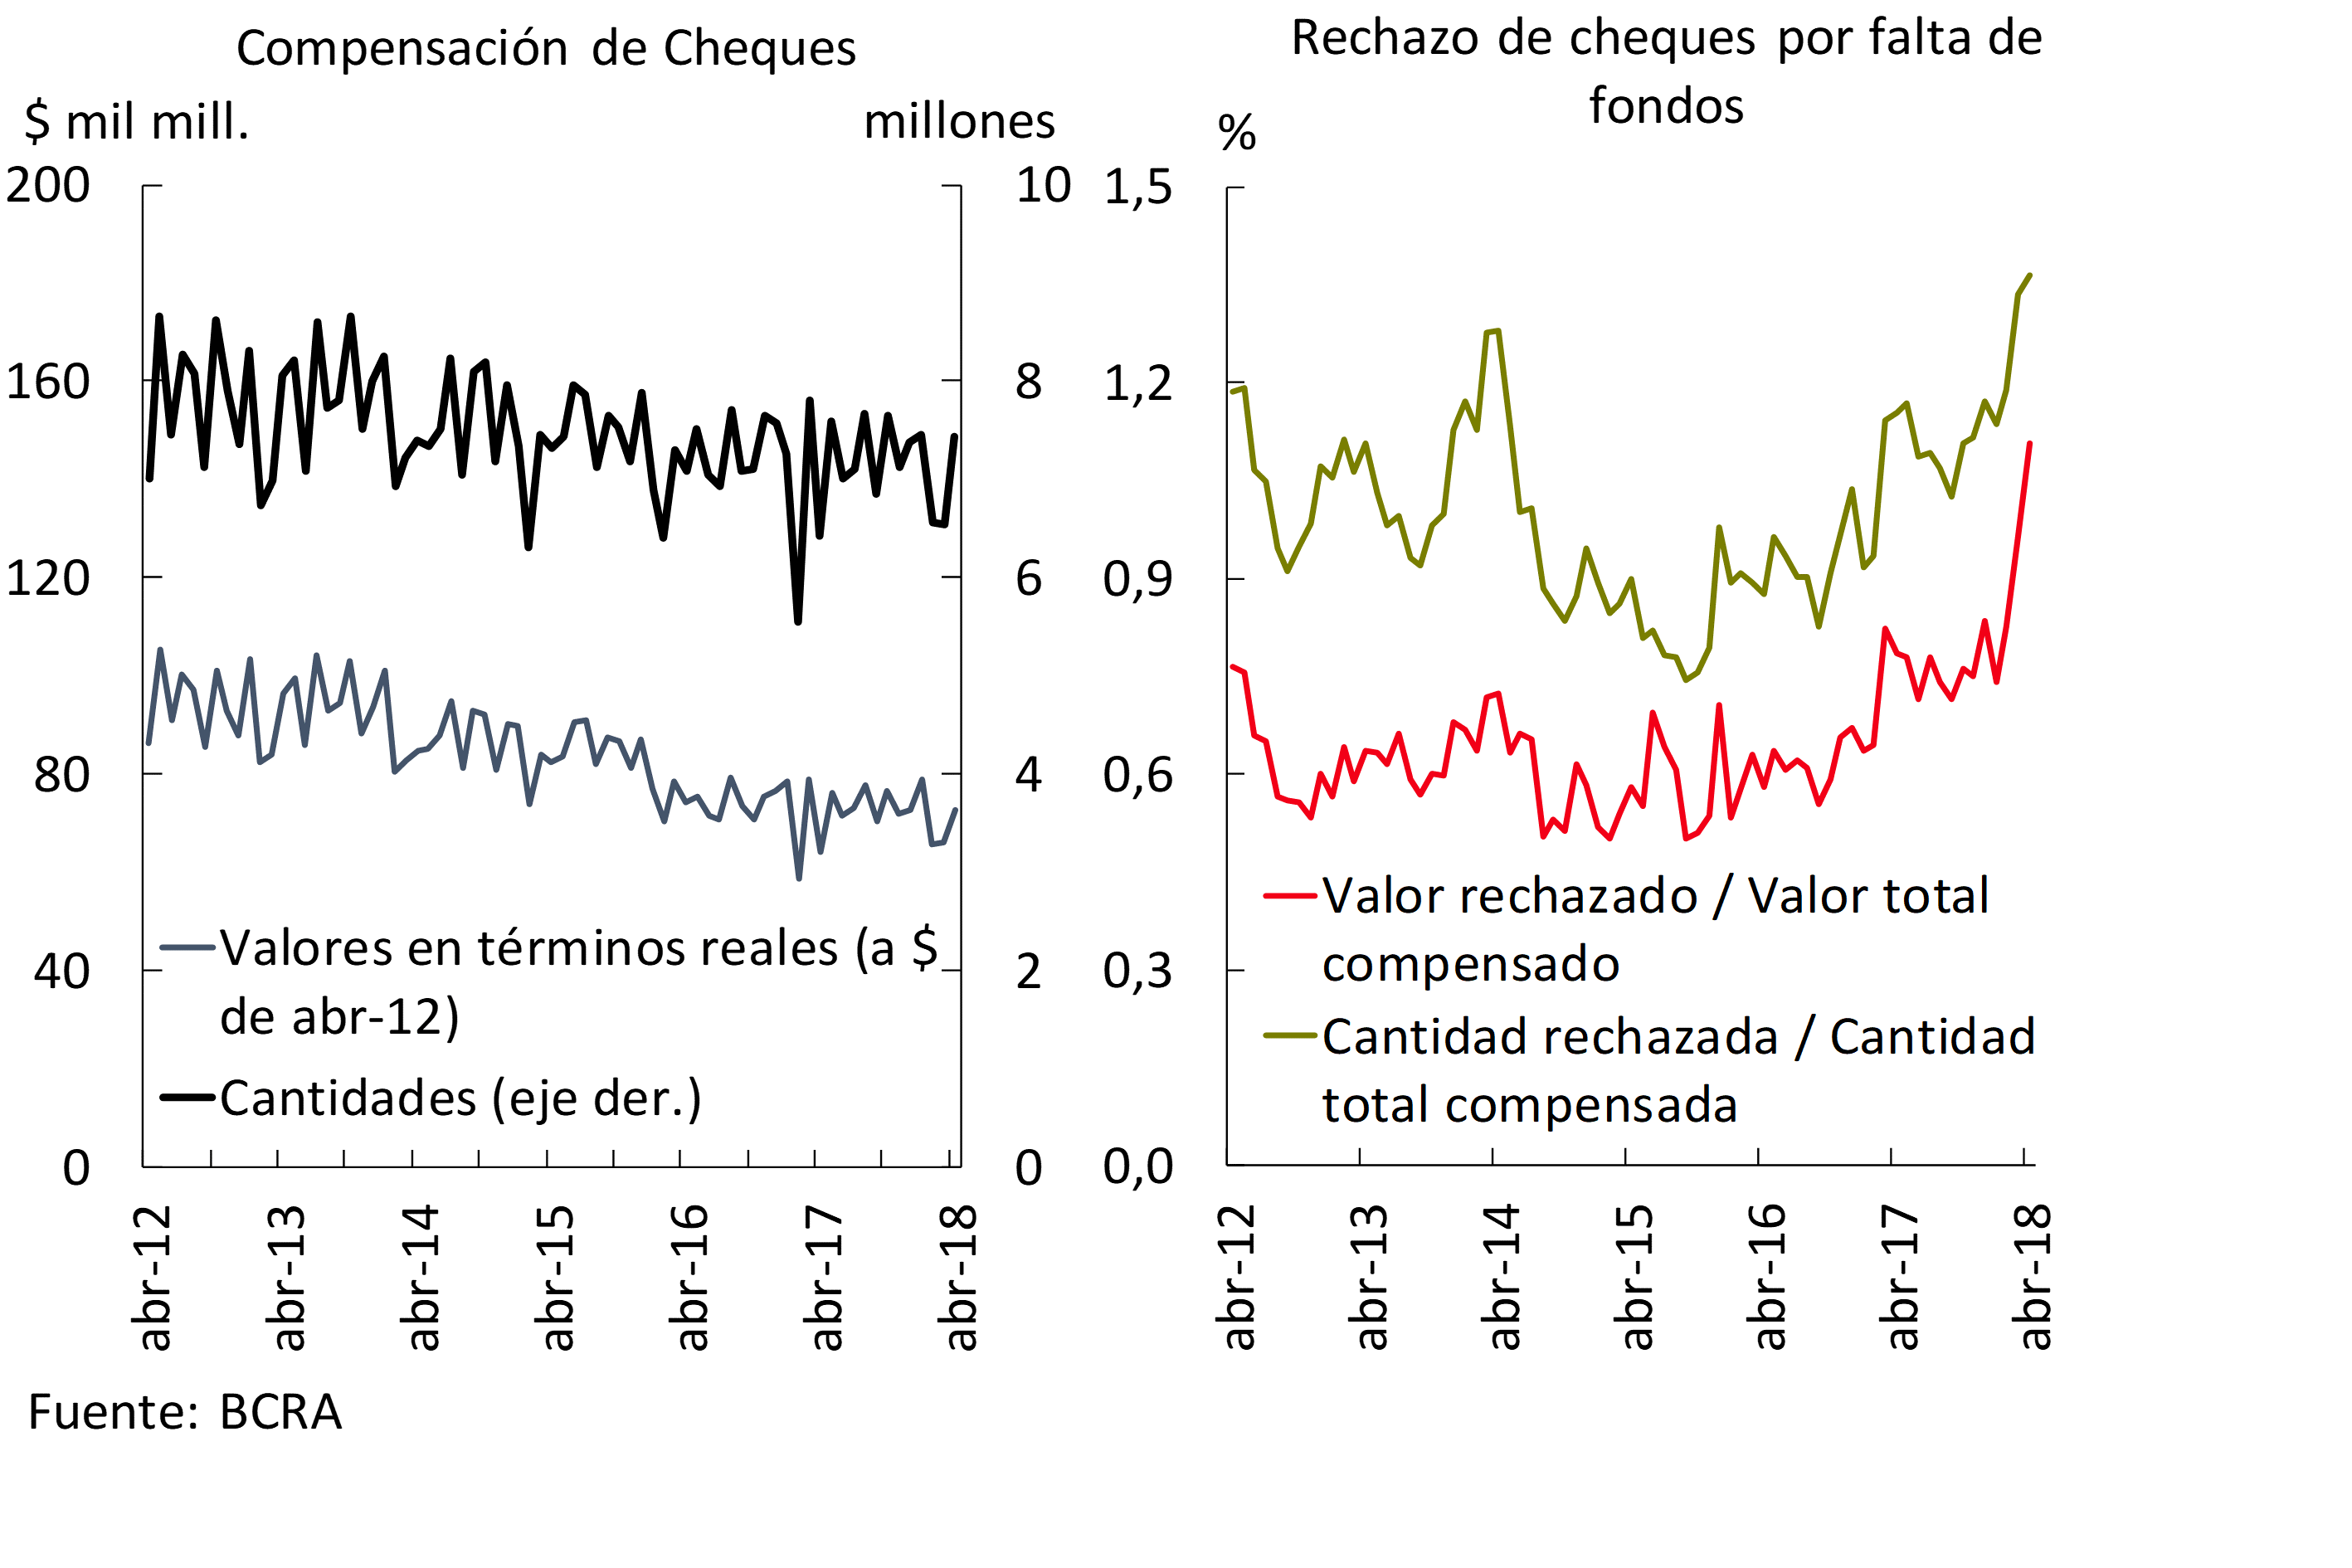
Regarding the performance of the payment system, at the beginning of 2018 transfers to third parties continued to grow10 – both in amount and in number of operations – driven mainly by immediate ones. With data up to April, the latter grew 10.6% YoY in real values and 45.3% YoY in quantity (see Graph 3). In contrast and in line with what has been observed in recent years, in April the clearing of checks increased slightly compared to the previous month. Adjusted for inflation, the values were 13.5% higher than in April 2017 (see Graph 4), while the amounts increased 15.8% y.o.y. For its part, in the fourth month of the year, the ratio of rejection of checks due to lack of funds increased in values and amounts, remaining in any case at limited values, as it reached 1.11% and 1.36% respectively.
Graph 3 | Third-Party Funds Transfers – Financial System
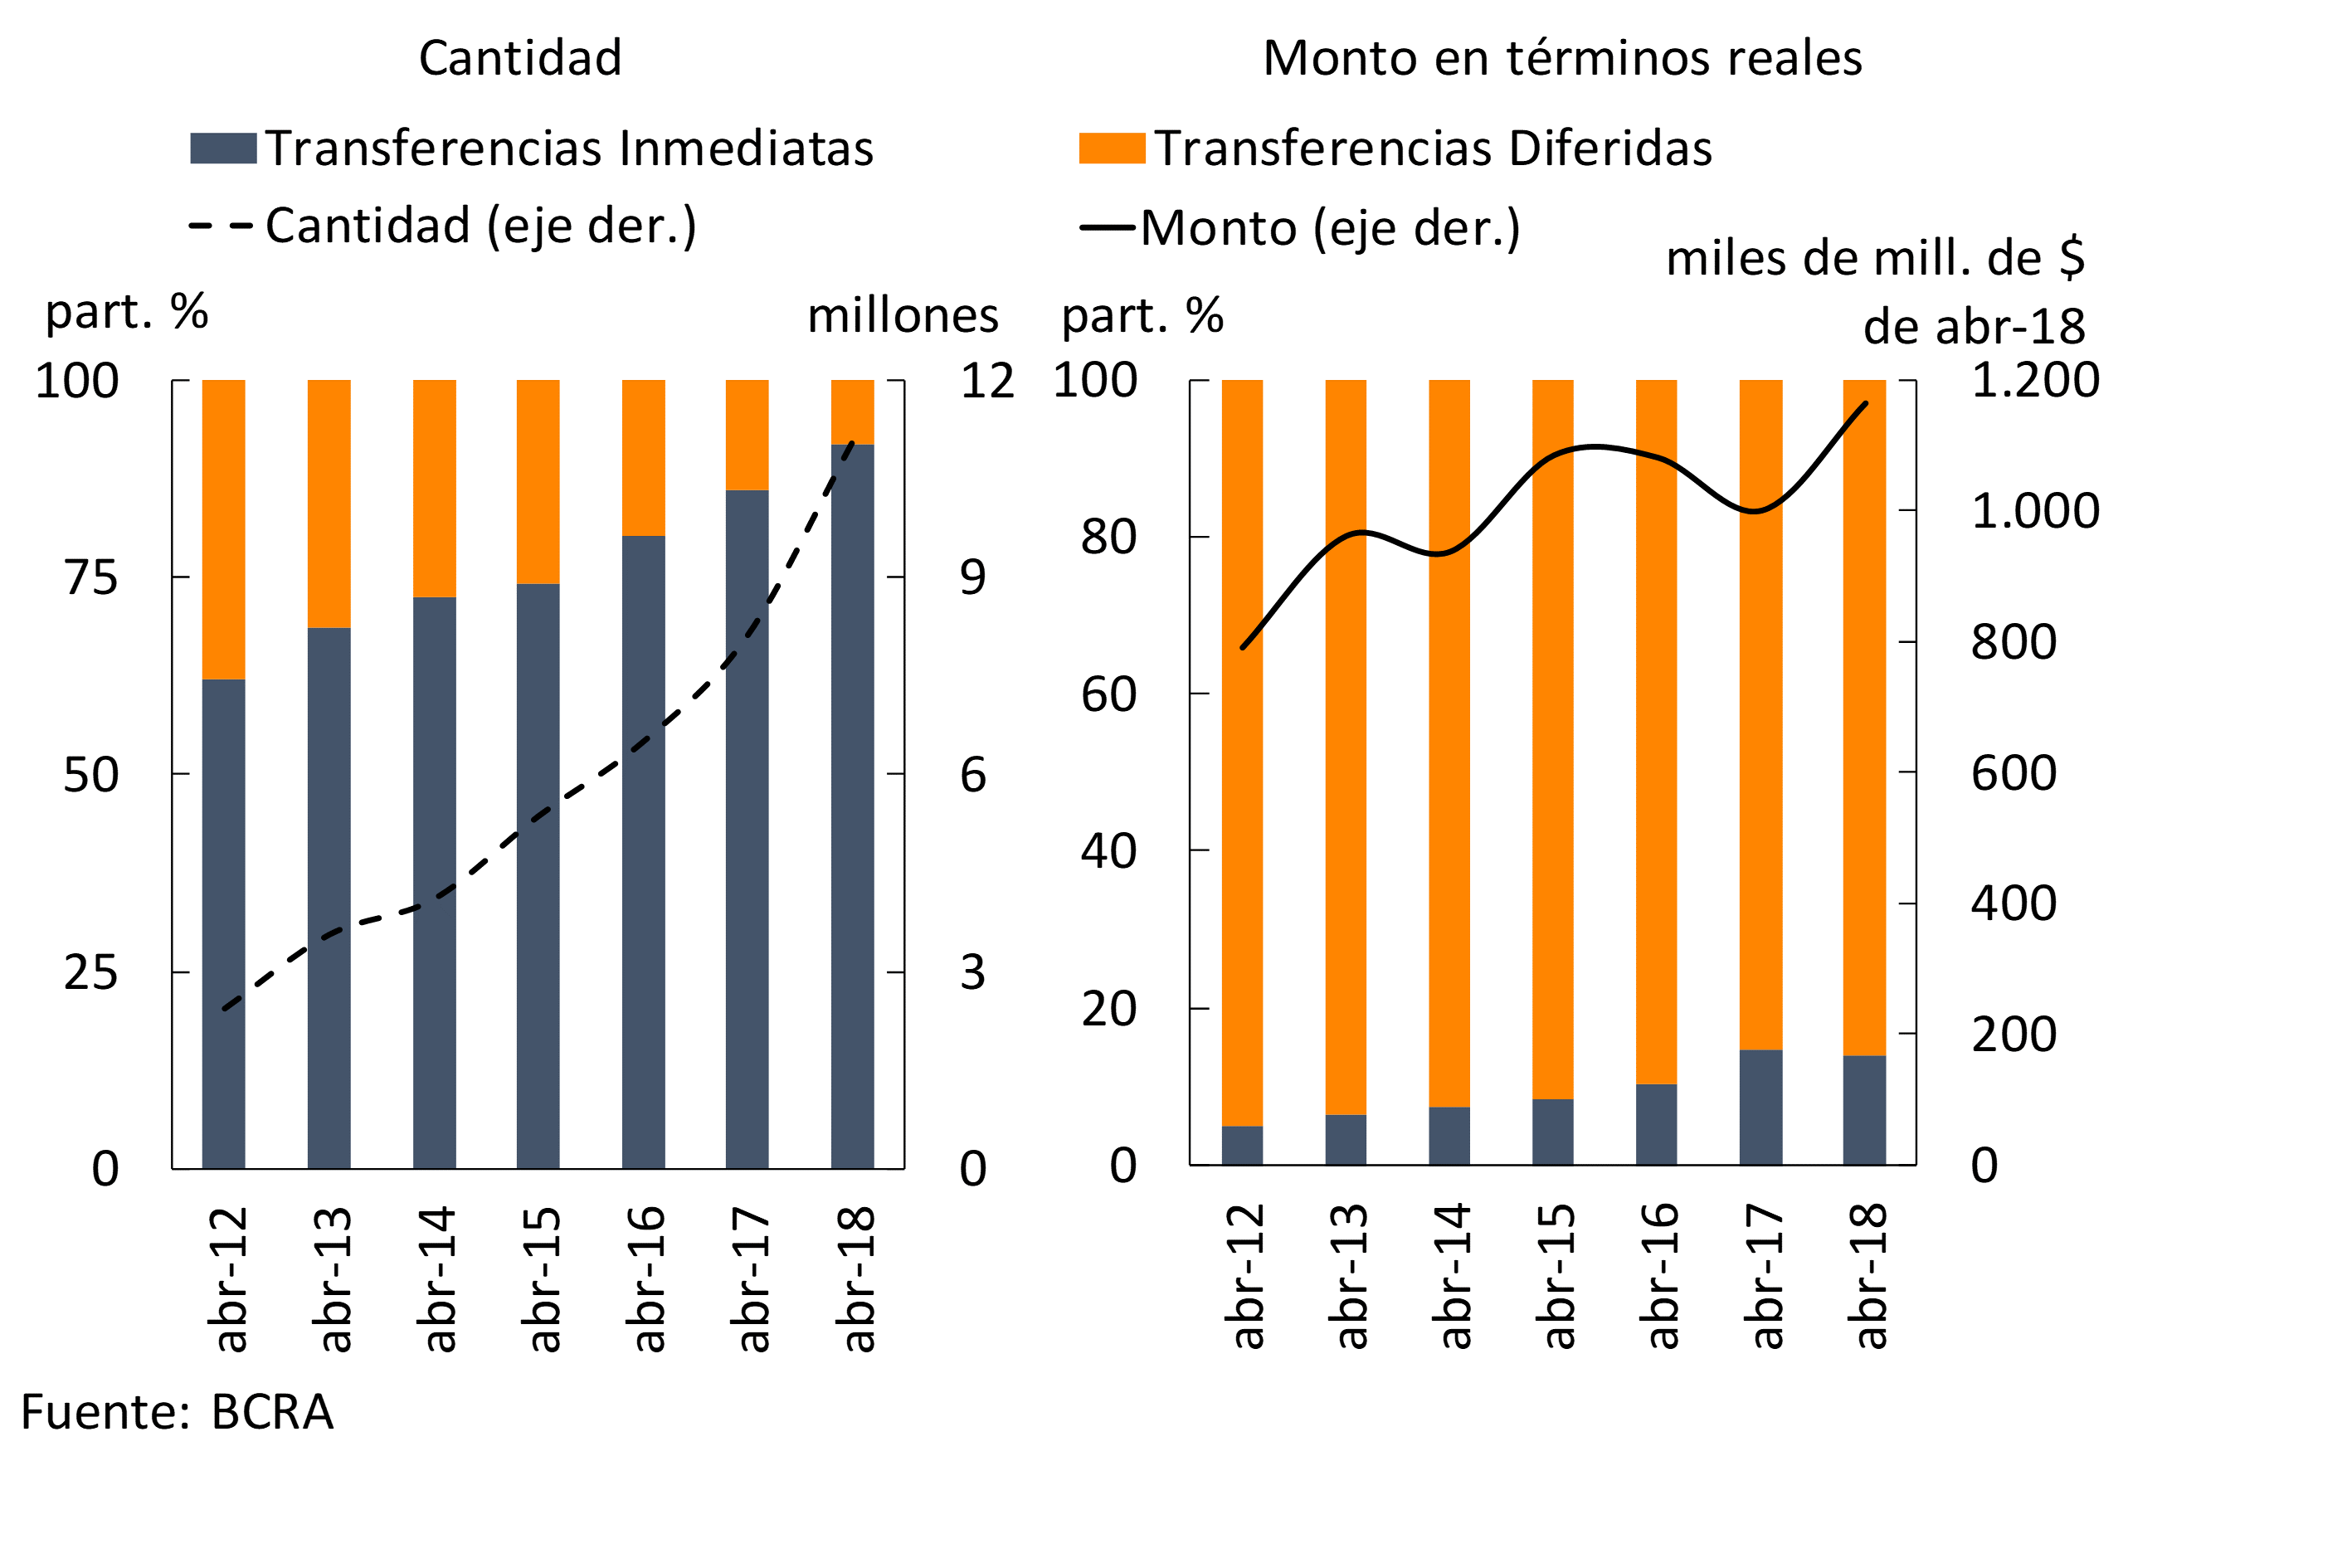
Figure 4 | Cleared Checks – Financial System
III. Deposits and liquidity
The real balance of private sector deposits did not show significant changes compared to February (-0.2%). Placements in foreign currency in this sector grew 1.5% (in currency of origin) in the month, while those in pesos remained stable when adjusted for inflation in the period. Within this segment, the increase in time placements (+2.2% in real terms) was offset by the reduction in demand deposits (-1.8% in real terms). As public sector deposits fellby 11 in real terms in the month, total placements in the financial system decreased in March.
In a year-on-year comparison, total deposits in the financial system grew 2.9% adjusted for inflation. This dynamic was driven by private sector placements, which expanded 6.7% in real terms in the last 12 months (see Chart 5), with a greater relative increase in dollar deposits (+14.7% YoY in source currency) compared to those arranged in national currency (2.7% YoY in real currency). Within the latter segment, there was an increase in the balance of demand accounts (+6.5% YoY adjusted for inflation) and a slight reduction in term placements (-0.8% YoY in real terms). On the other hand, total public sector deposits decreased 7.5% in real terms compared to March 2017, mainly due to the performance of placements in foreign currency.
Graph 5 | Total Private Sector Deposits – Var. A.I. of the balance in real terms
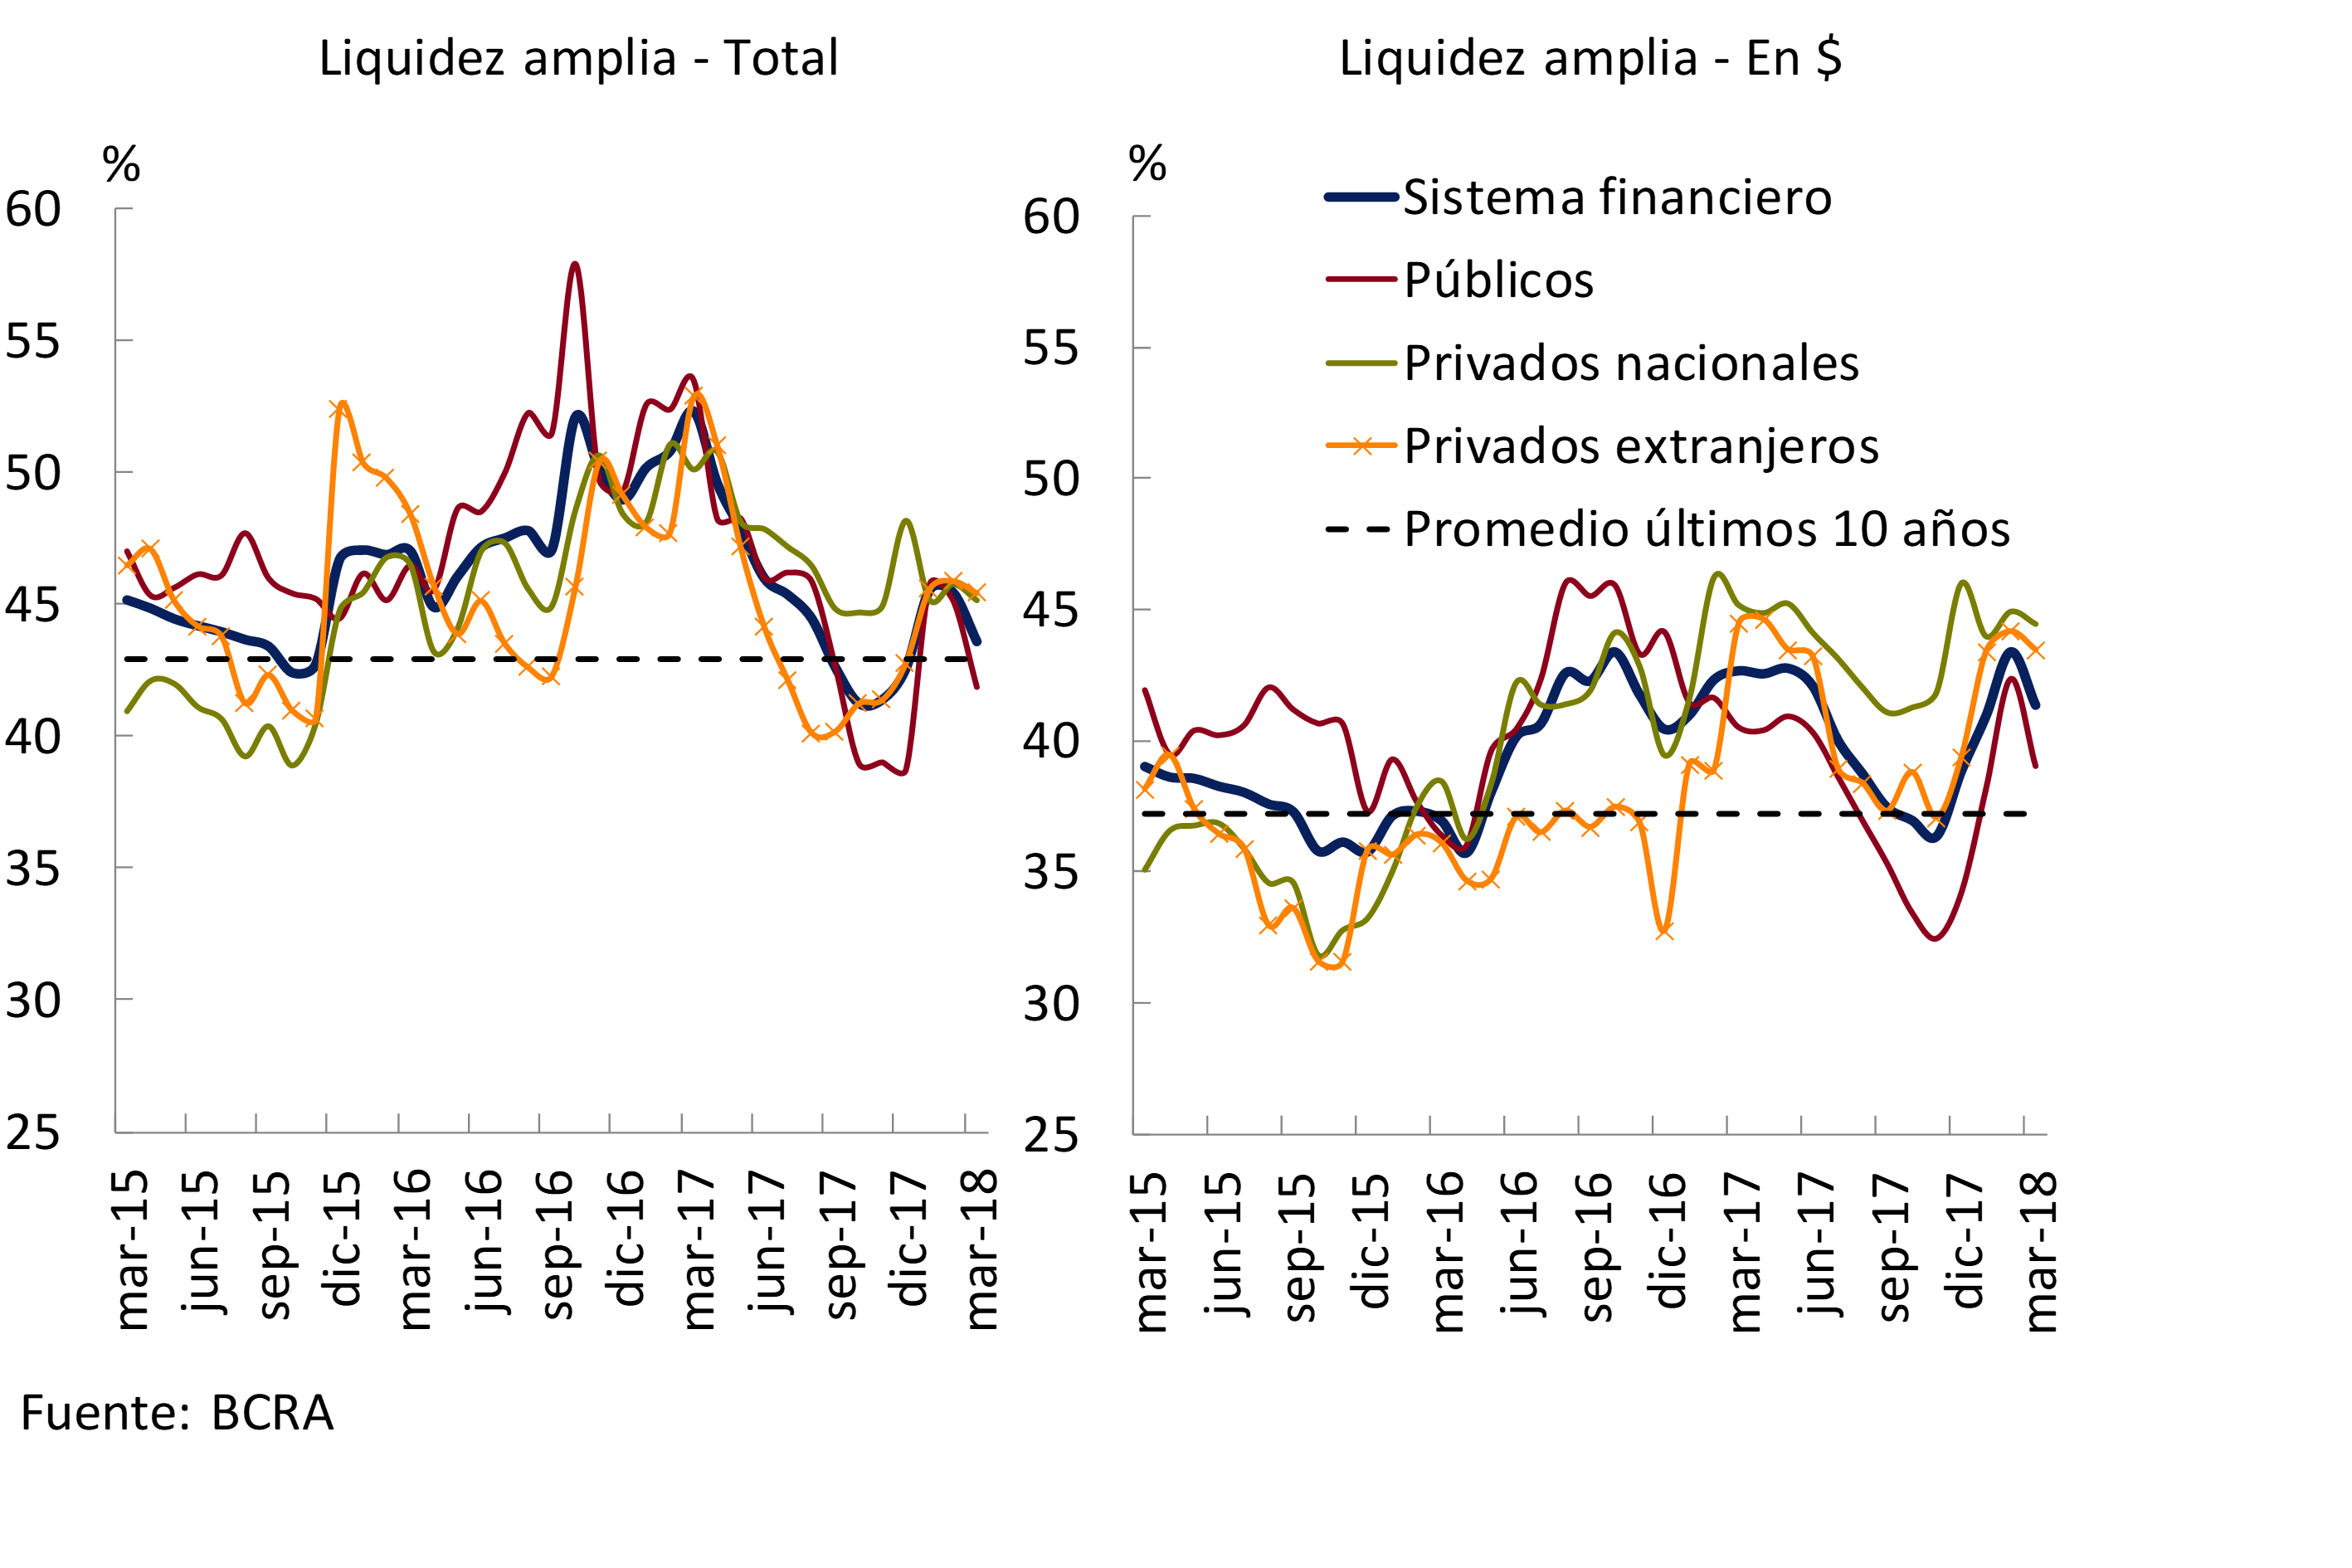
In March, the broad liquidity indicator – considering the current account of the banks in this institution, the availabilities, the passes with the BCRA, the LEBACs and the LELIQ – in national and foreign currency totaled 43.6% of the deposits of the financial system, decreasing 1.9 p.p. compared to the previous month (see Graph 6). The ample liquidity in pesos of the set of financial institutions also fell in the month to reach 41.4% (-2 p.p. compared to February). This behavior was mainly due to the reduction in passes with the BCRA and in the holdings of LEBAC and LELIQ. In the last 12 months, ample liquidity fell 8.8 p.p. from deposits, with a relatively greater decline in public banks. However, the level of this indicator was slightly above the average of the last 10 years, a situation that was also verified in the group of public banks and in the private banks12. Liquidity in the strictest sense – considering only the availabilities and the balance of the current accounts that banks have in the BCRA – reached 23.8% of deposits in March, 0.5 p.p. below the value recorded the previous month.
Graph 6 | Ample Liquidity of the Financial System
In March, the estimated funding cost for time deposits operated in pesos in the private sector increased slightly (see Chart 7). This behavior is in line with the performance of the average interest rate operated by fixed-term deposits in pesos. Likewise, during the month there was a slight reduction in the relative importance of demand accounts in relation to term placements, which contributed to increasing the total funding cost of the financial system aggregated by deposits in national currency.
Figure 7 | Estimated Funding Cost for Private Sector Deposits in Pesos* and Ratio between Demand and Time Deposits**

IV. Financing
In March, the balance of total credit to the private sector increased by 0.4%13 in real terms compared to the previous month, mainly due to the performance of public banks. The increase in the period was driven by lines in pesos, which grew 1.5% when adjusted for inflation. In particular, mortgage loans increased 7% in real terms in the month, almost 3 p.p. above the level recorded in February. On the other hand, foreign currency lines fell by 2.3%14, mainly due to the performance of export pre-financing and cards.
The financial intermediation of banks as a whole continued to increase so far in 201815. In year-on-year terms, the total balance of financing to companies and households accumulated real growth of 25.3% as of March, 3.3 p.p. above the level at the end of 2017 (see Chart 8). Considering the peaks of the first quarter of the year, credit to companies and families showed a slight increase, while in the previous six years there were falls in the same period. Differentiating by currency, credit in foreign currency grew 49% y.a.16, while lines in pesos to the private sector accumulated an increase of 20.1% y.o.y. when adjusted for inflation, highlighting the increase in mortgage loans.
Figure 8 | Total Credit Balance to the Private Sector in Real Terms

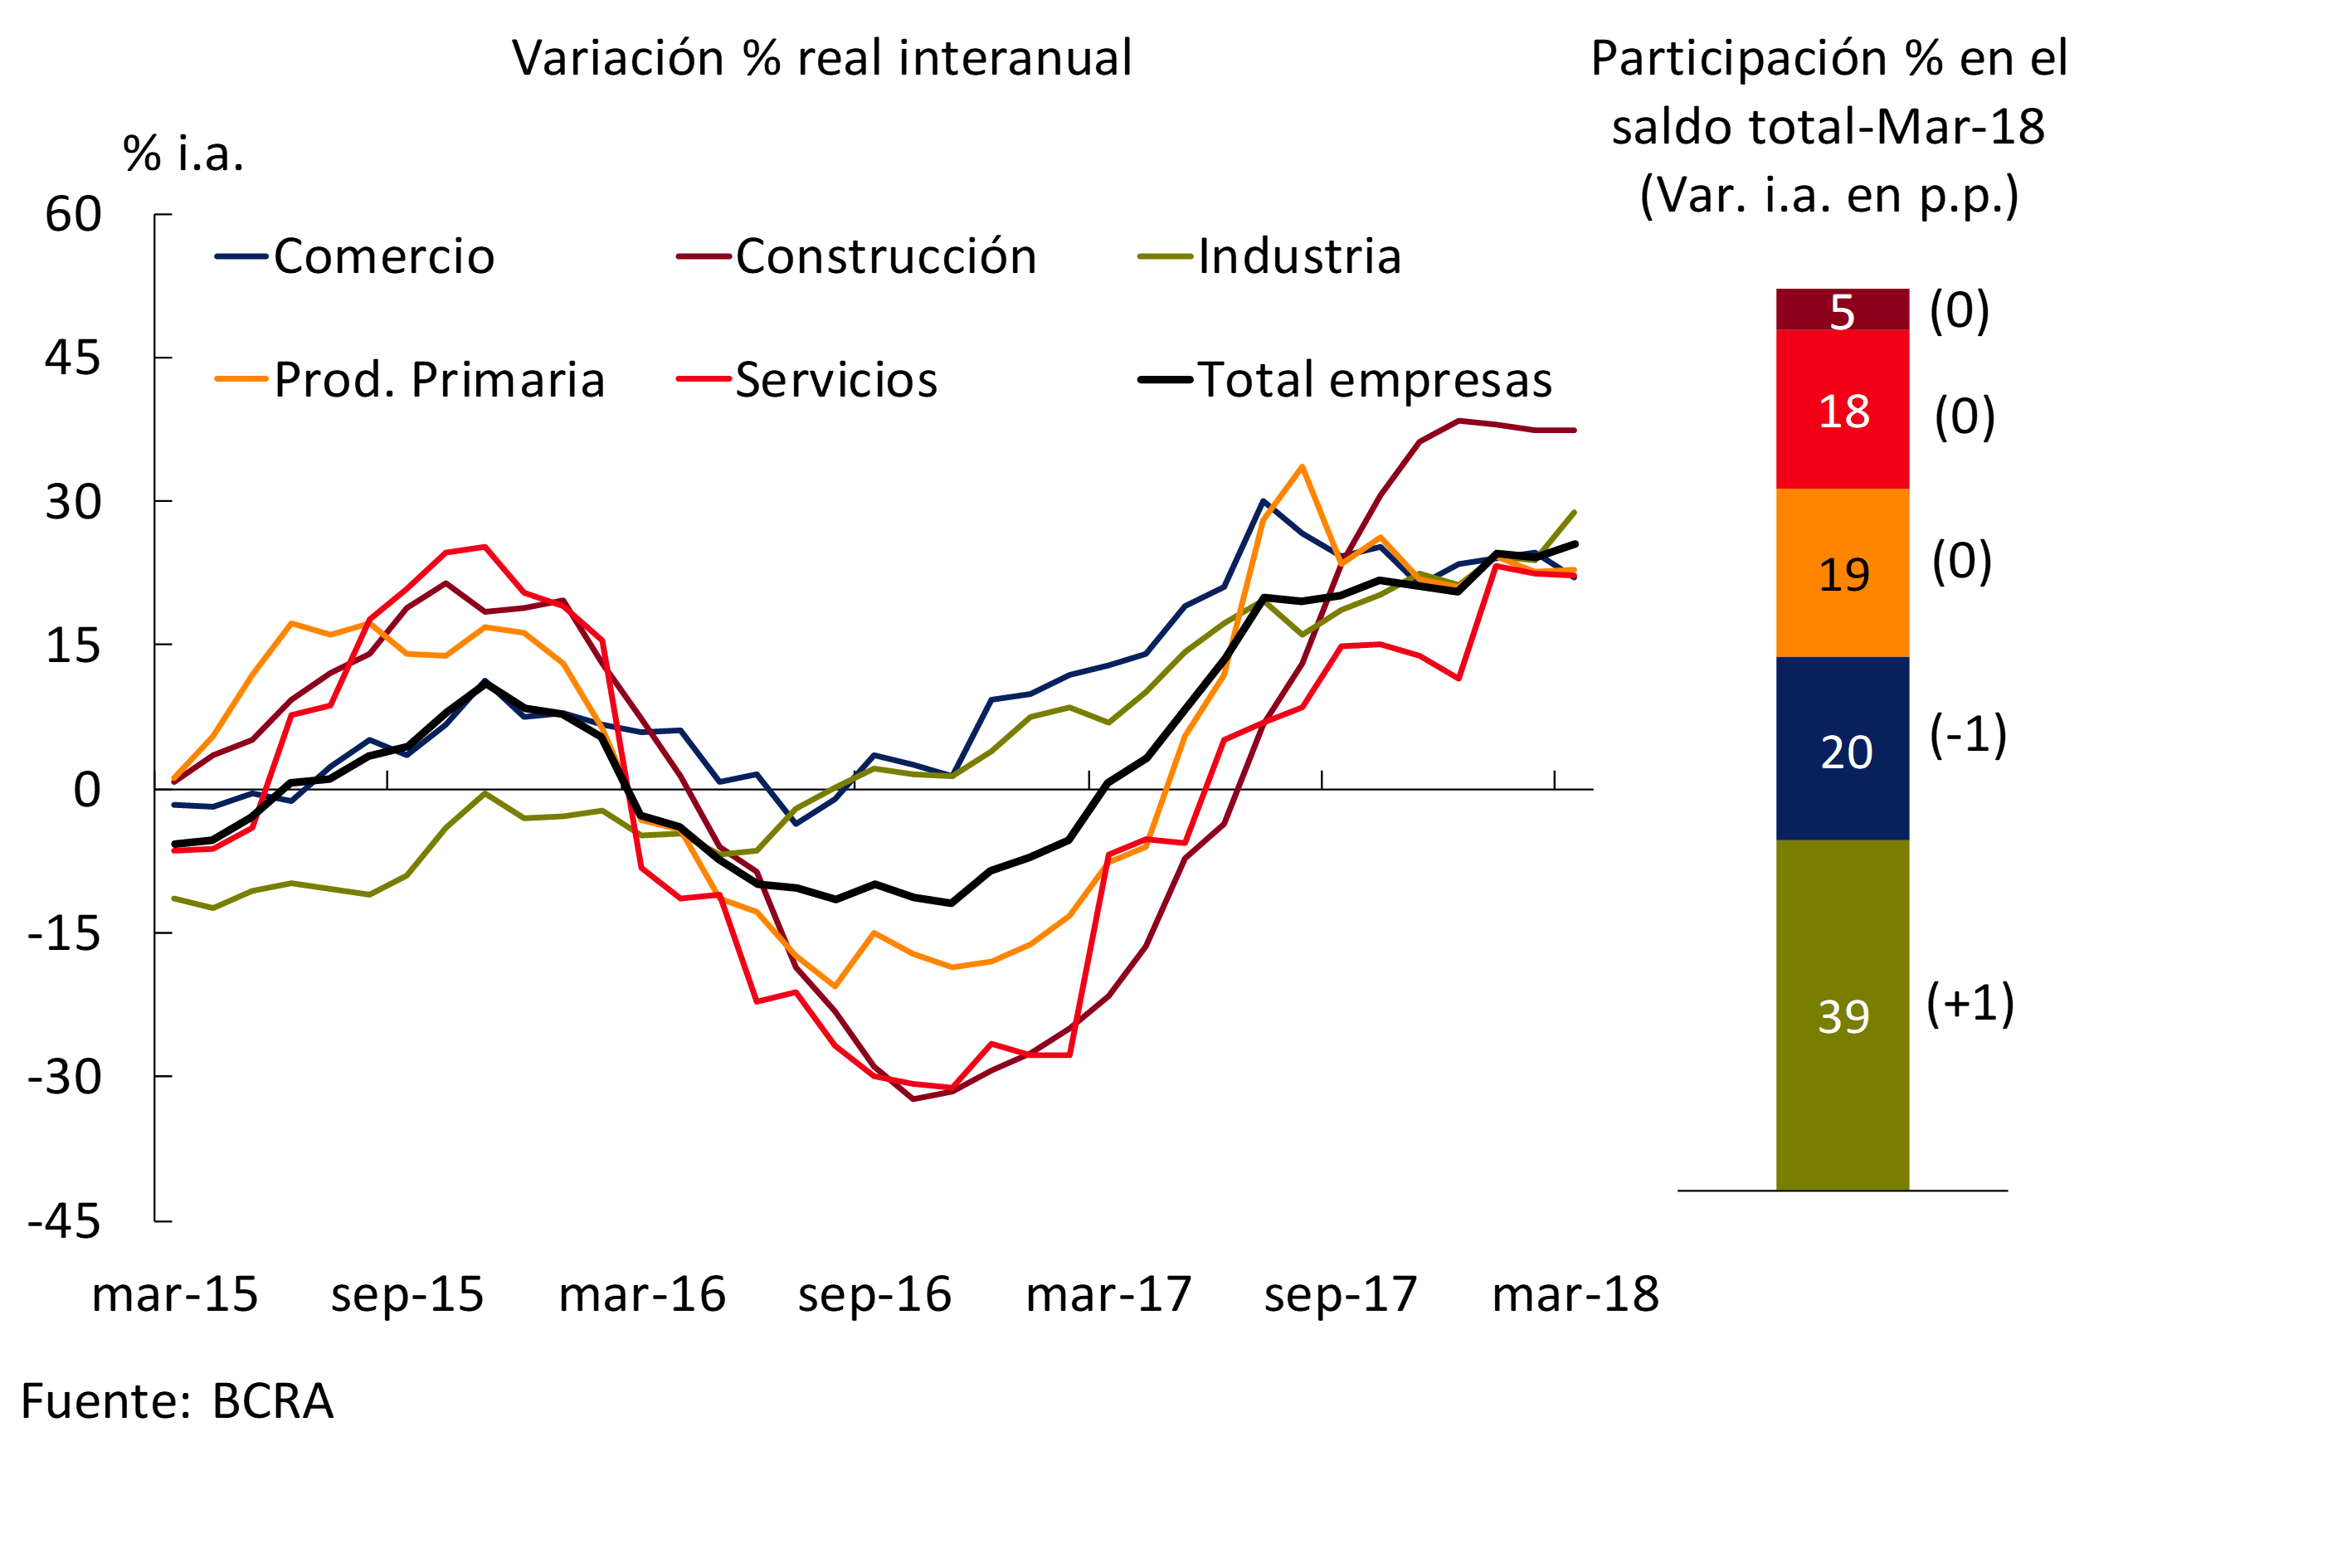
In March, the balance of credit to companies in real terms showed a slight decrease compared to February (-0.5% in real terms). In particular, in the period, heterogeneous performances were observed among financing by productive sector: real increases in service provider companies and slight falls in the rest of the items. Despite the monthly performance, it should be noted that, in the first quarter of the year, financing to companies showed a positive real evolution (+4.4% annualized —y.— real). In year-on-year terms, in March, loans to companies accumulated a growth of 25.5% adjusted for inflation (see Graph 9), with construction financing being the most dynamic.
Figure 9 | Total Credit Balance to Companies
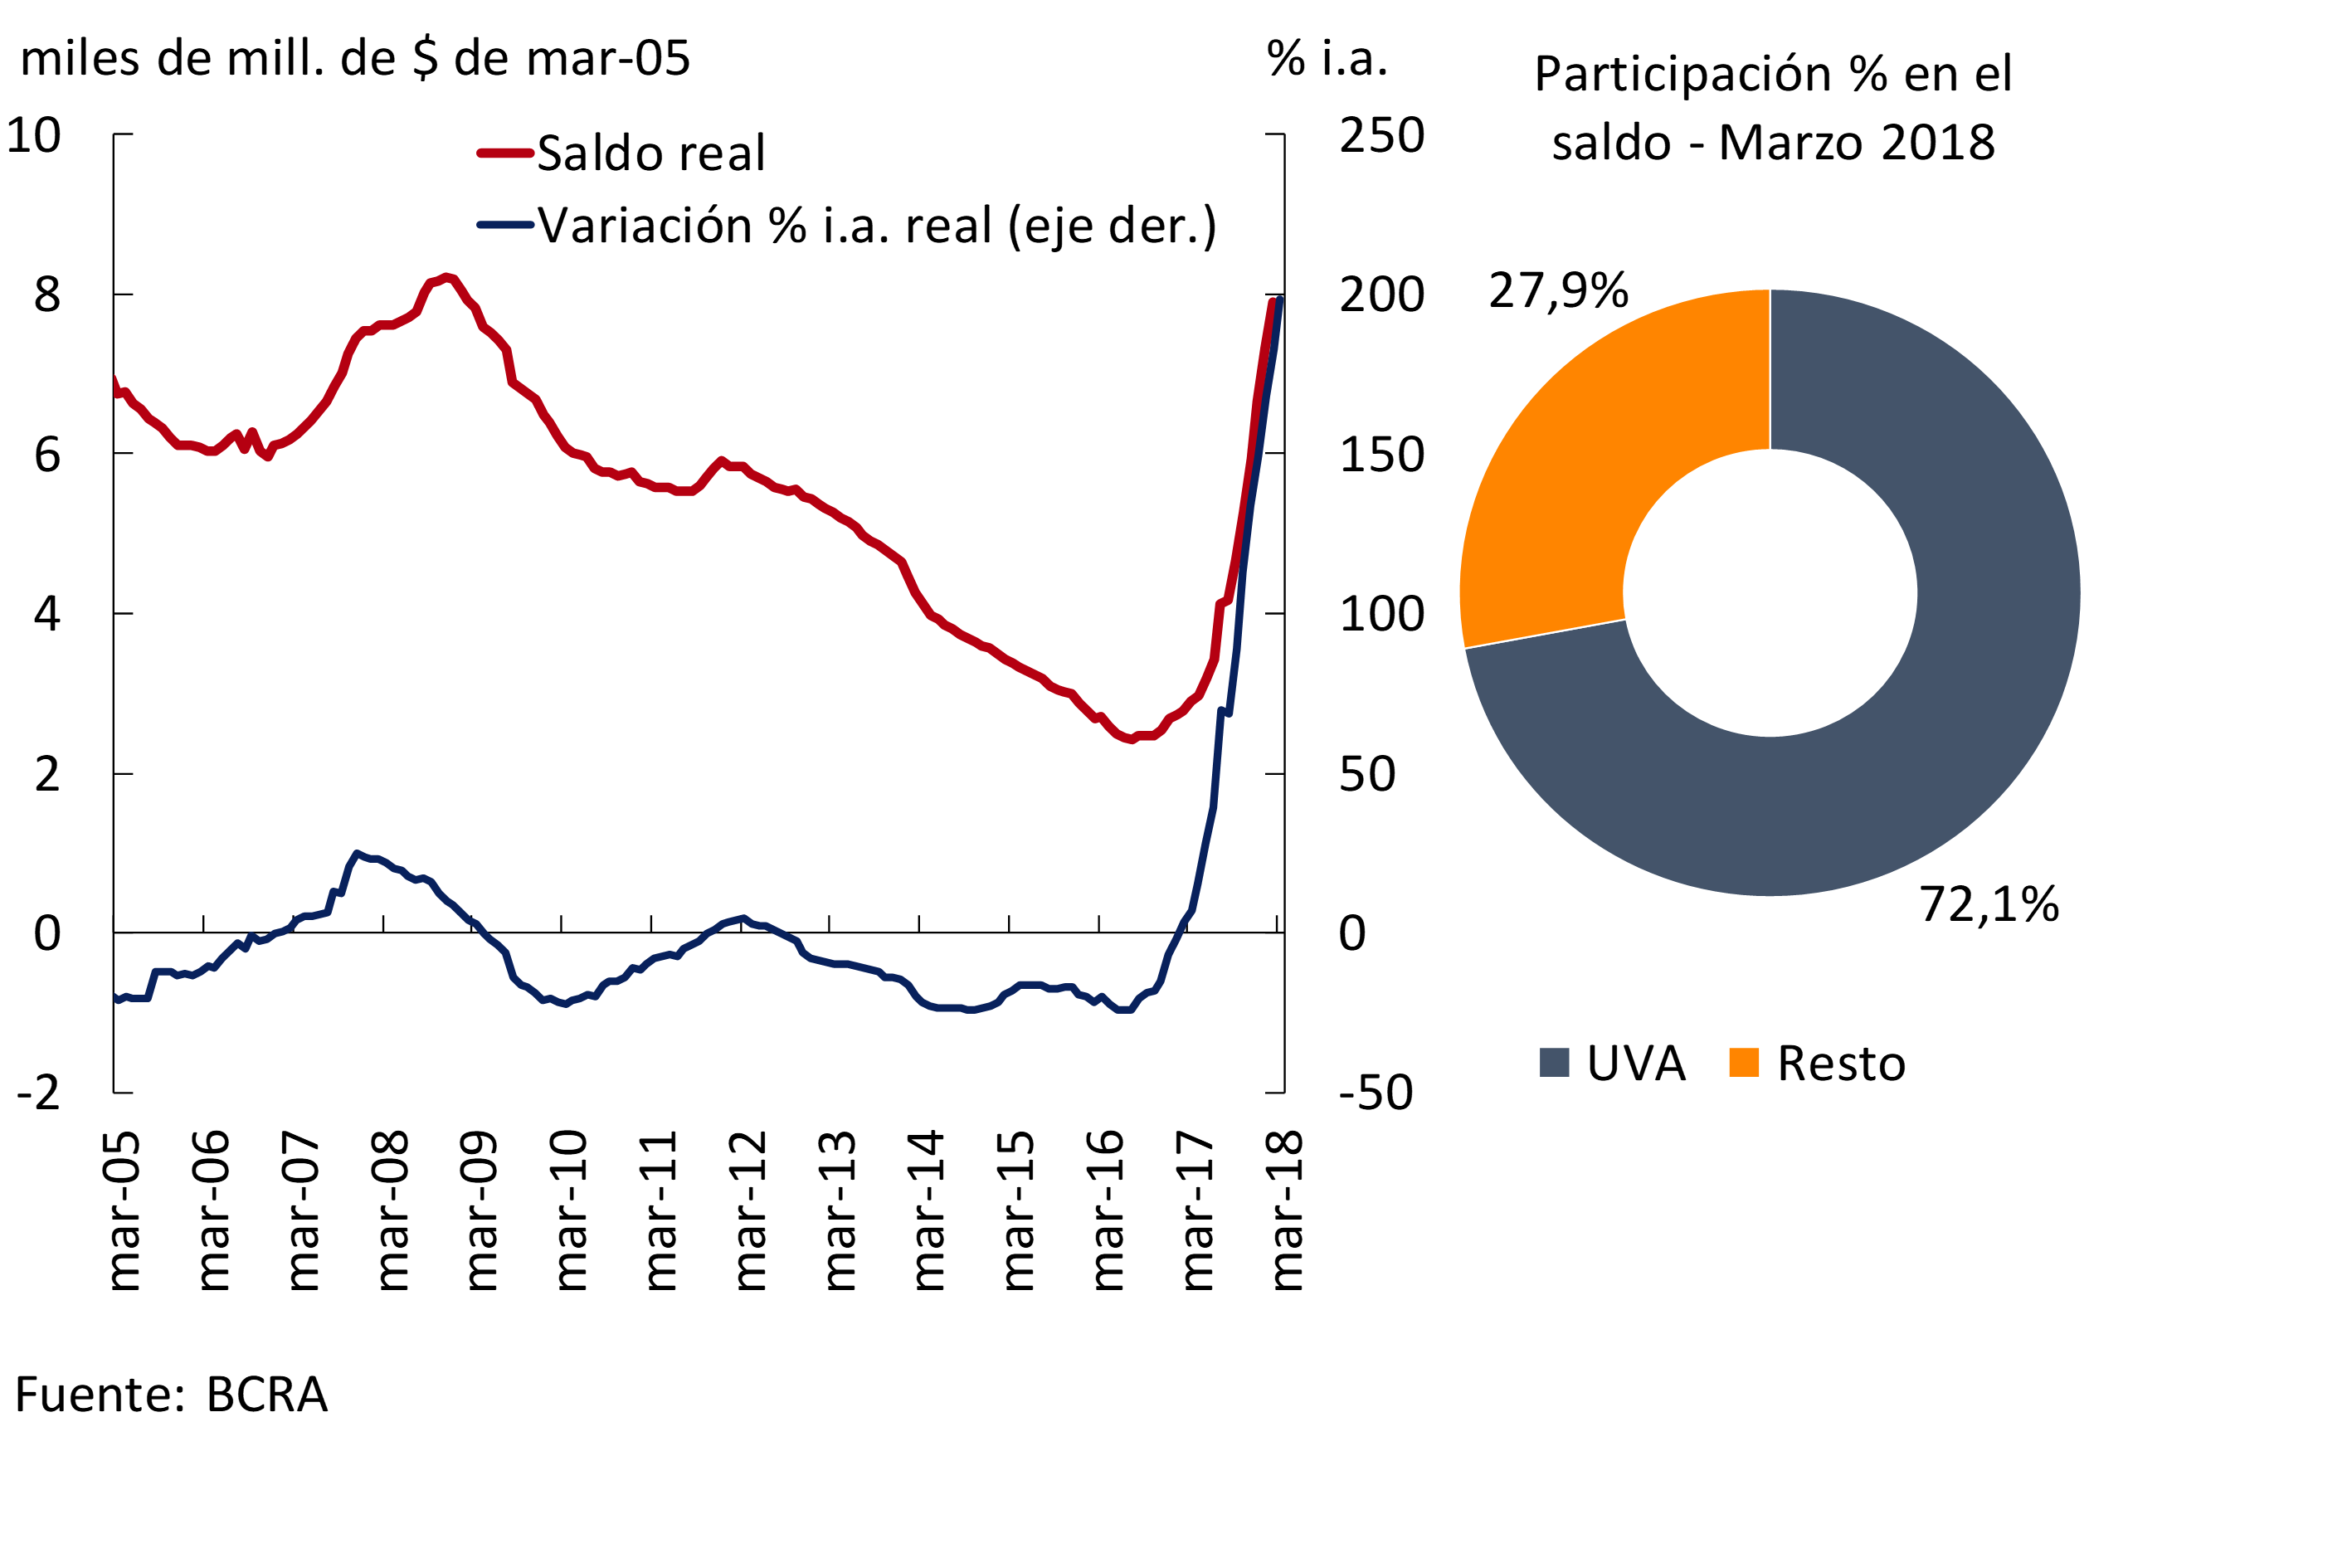
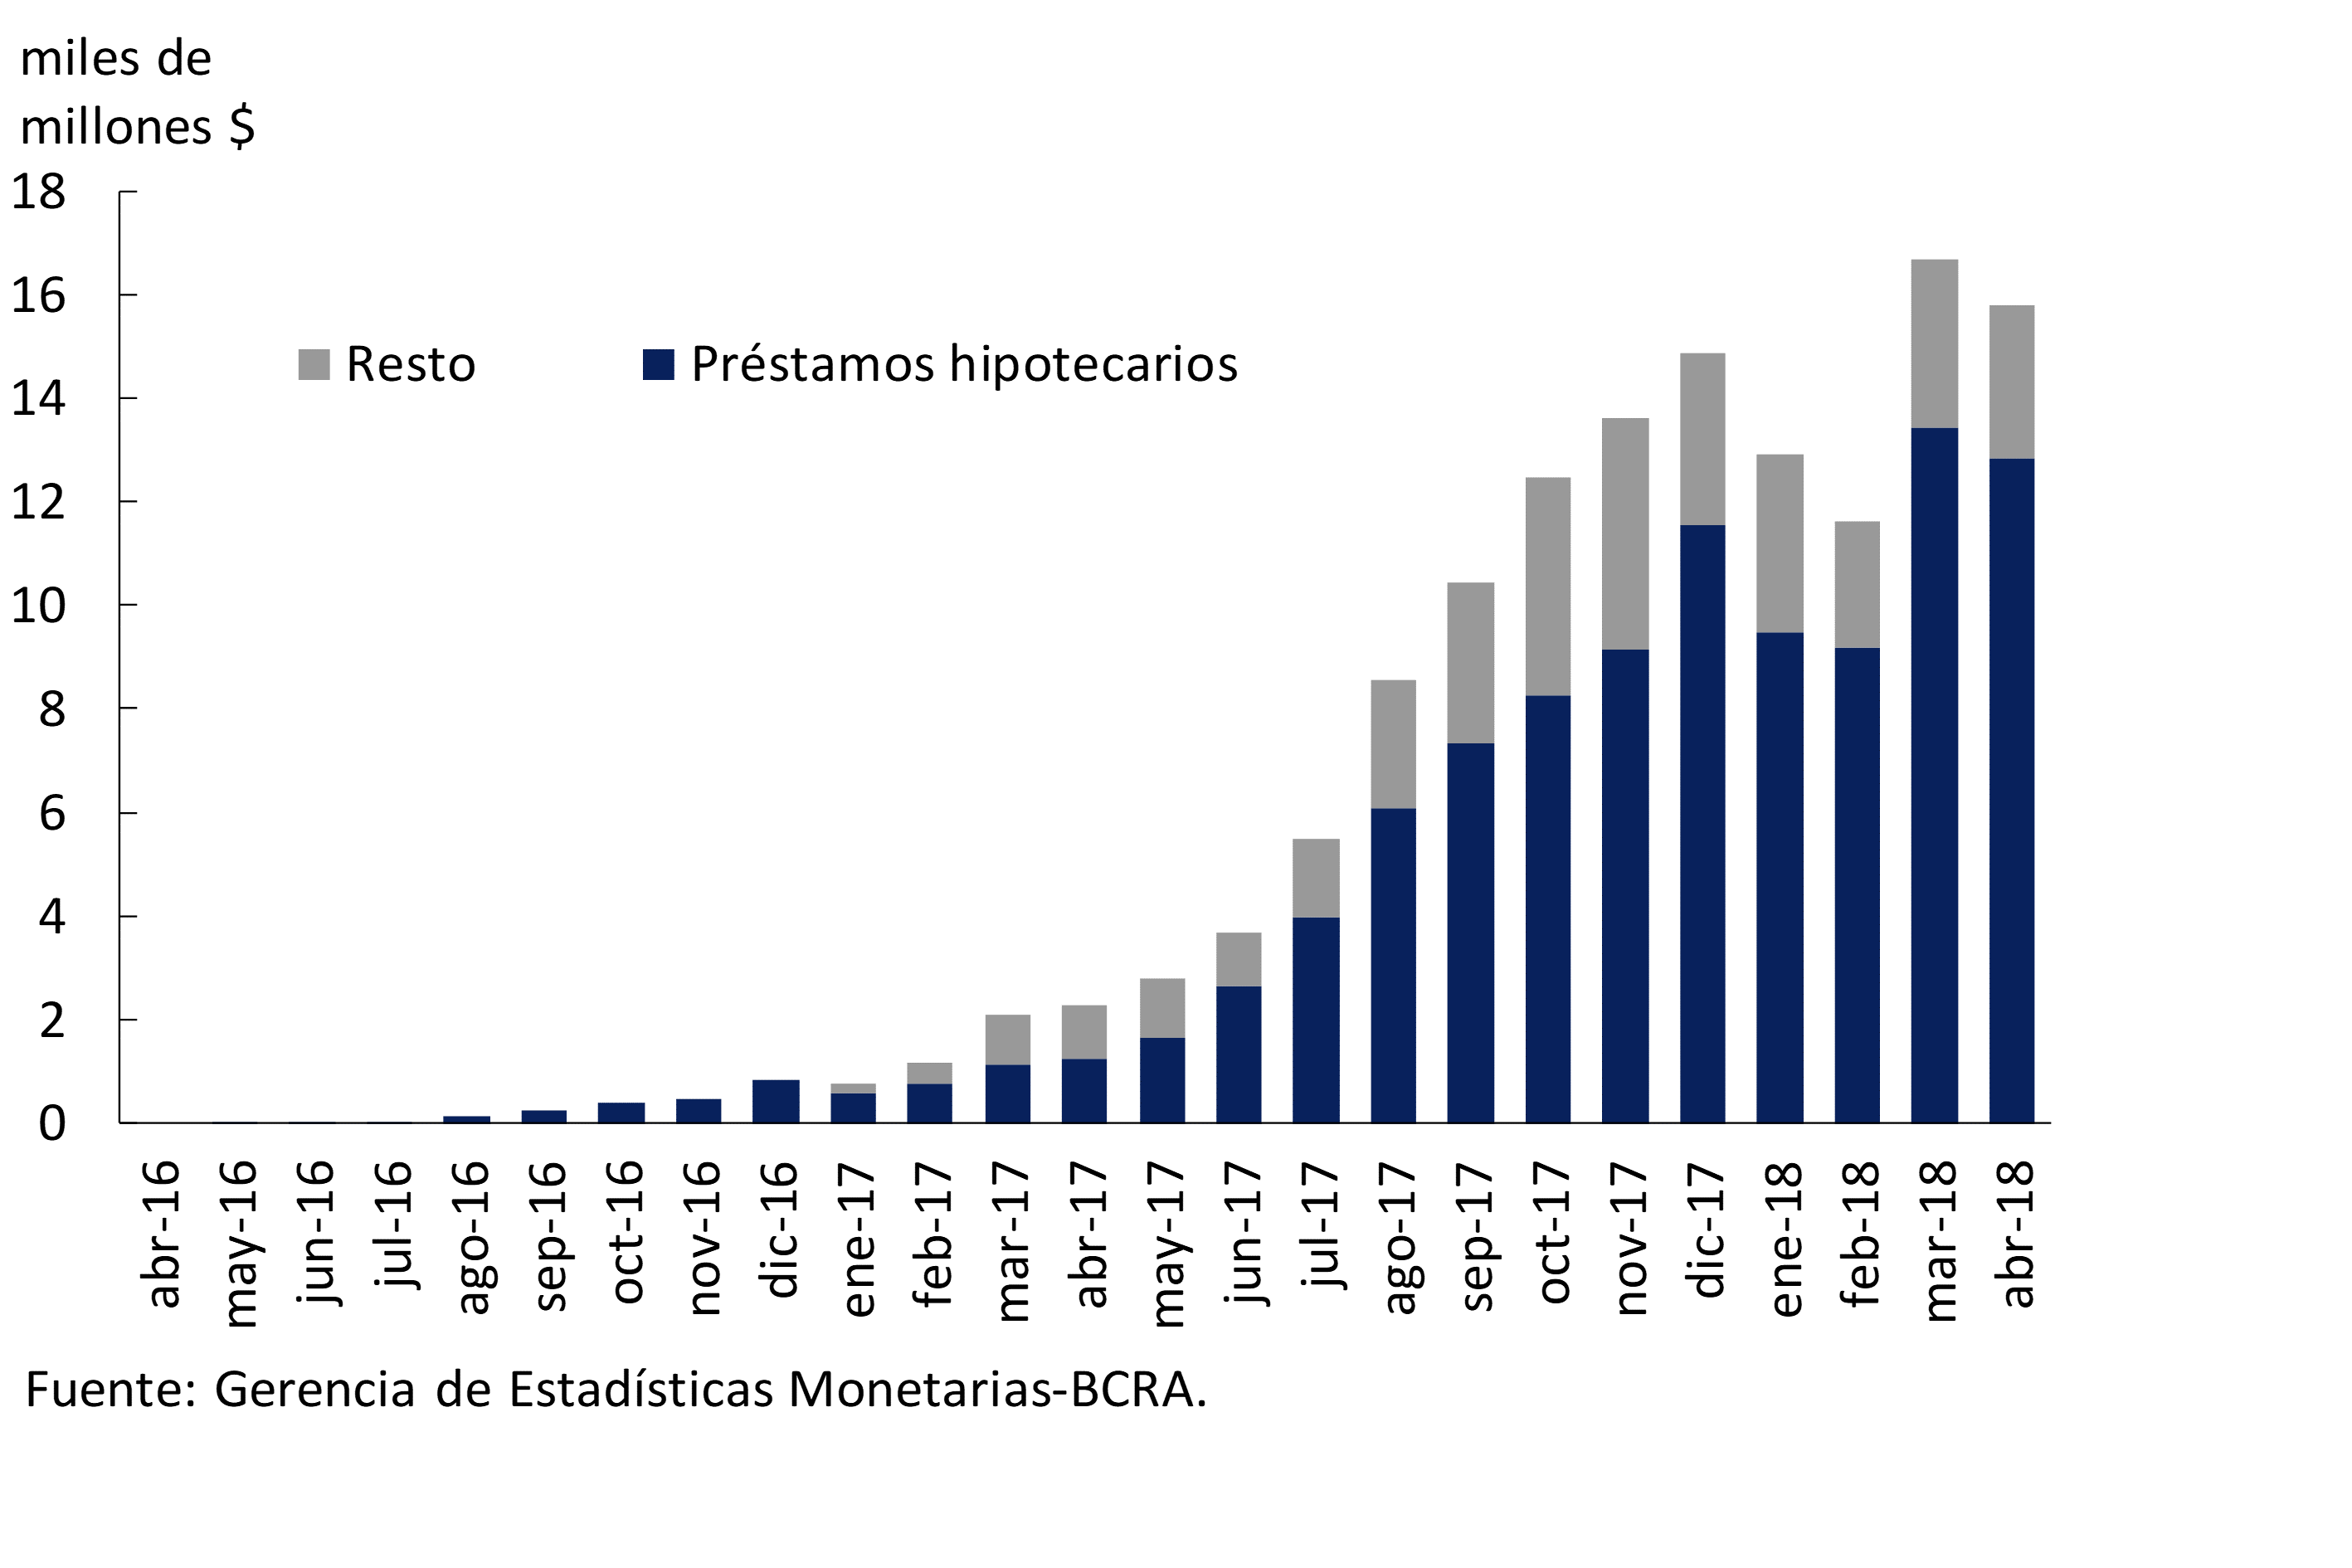
Financing to families increased by 1.3% adjusted for inflation compared to February, with real increases in most lines – with the exception of cards. In the first three months, loans to this sector grew by 20.8% y/y. In a year-on-year comparison, loans to households accumulated a real increase of 26.1%, with mortgage loans and pledges being the most dynamic (see Graph 10). Specifically, the balance of mortgage lines to households almost tripled in real terms in the last twelve months, corresponding to 72.1% of the UVA segment (see Graph 11).
Figure 10 | Total Credit Balance to Families

Figure 11 | Mortgage Financing for Families
In April, the financial system granted almost $15.8 billion in new loans to the private sector in UVA, slightly below last month (see Chart 12). In March of the month, the total balance of these loans was above $137,000 million17 (which represents 7.6% of the total balance of credit to the private sector of the financial system), corresponding 73% to mortgage lines, 21% to personal loans, 5% to pledges and 1% to documents.
Figure 12 | UVA Financing – Amounts Granted
In March, the average nominal active interest rate operated in pesos with the private sector18 stood at levels similar to those recorded in the previous month. The interest rates agreed on personal, mortgage, pledge and advances fell slightly in the period, while on documents and cards they increased slightly. For its part, the average interest rate operated in UVA totaled 6%, slightly reduced compared to February. In particular, mortgage interest rates were around 4.8%, a value similar to last month.
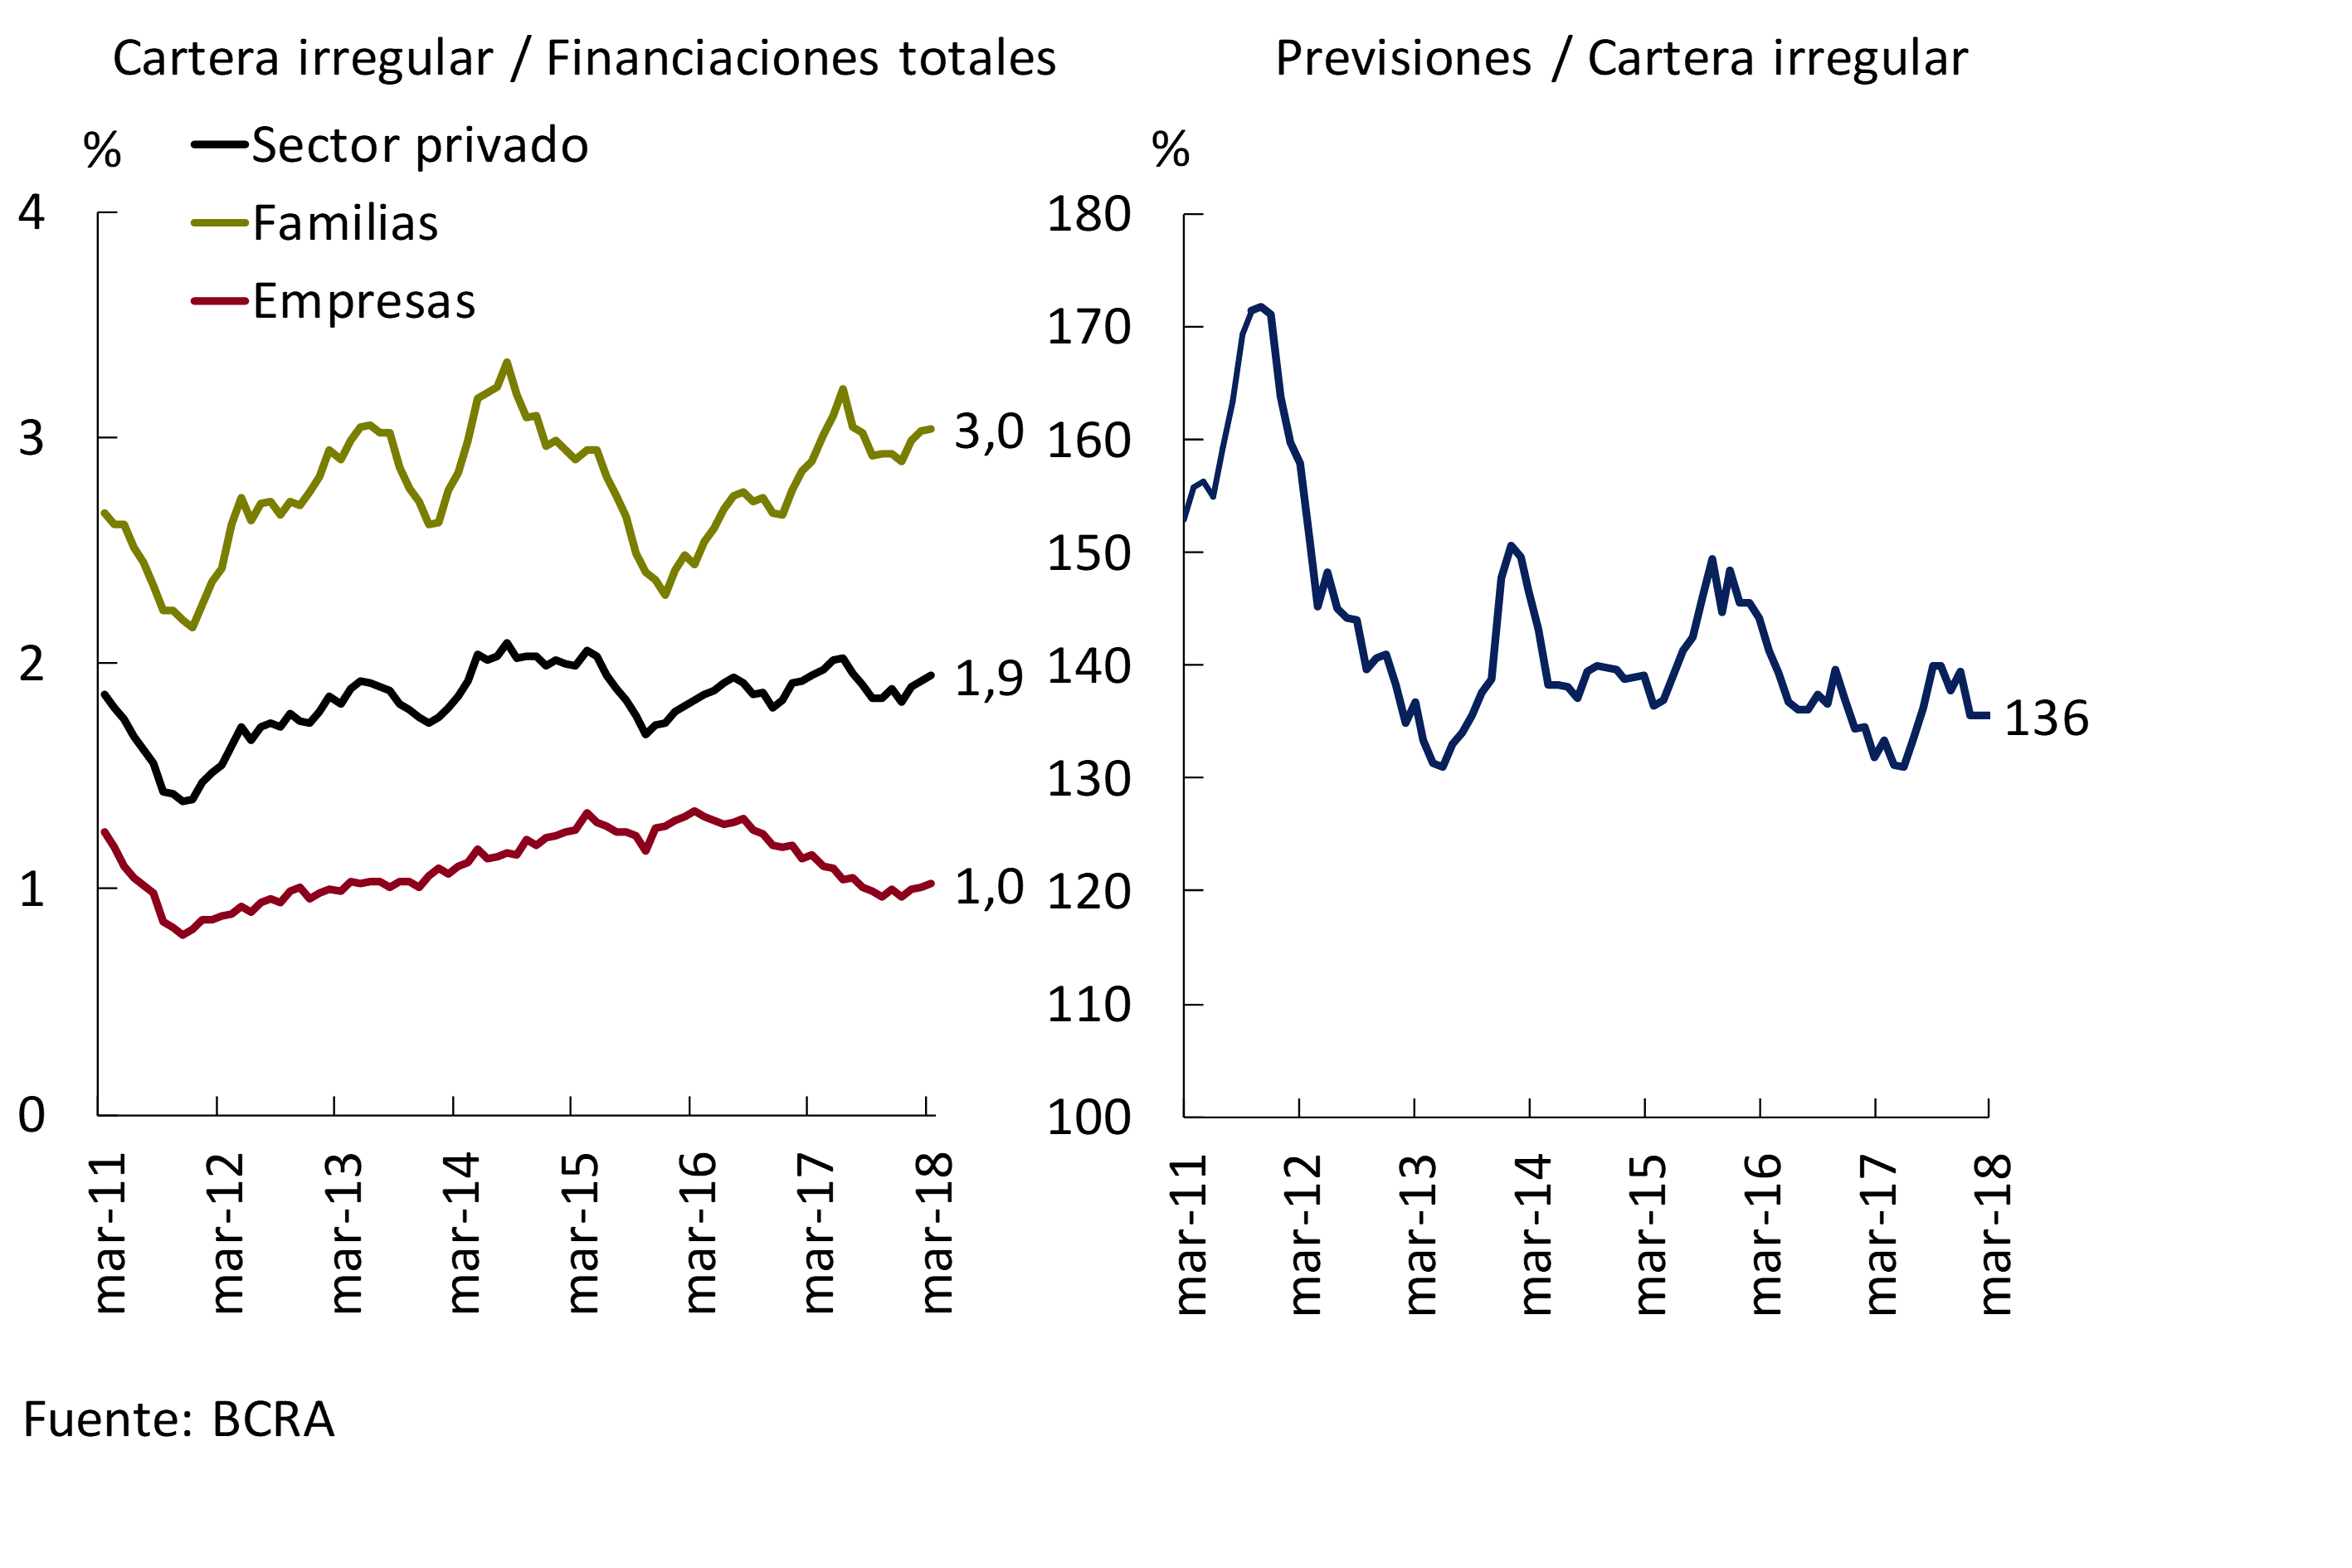
The irregularity of financing to the private sector remained unchanged at 1.9% of the total portfolio in March (see Chart 13). The NPL ratio of loans to households remained at 3%, while the non-performing loan ratio of loans to companies stood at 1% in the period. At the end of the first quarter of the year, the forecasts reached an amount equivalent to 136% of the portfolio in an irregular situation, with no variations in magnitude with respect to last month’s record and 3.7 p.p. above the level evidenced a year ago. The observed levels of irregularity, forecasts and capital (see next section) contribute to sustaining a significant degree of resistance of banks as a whole to the materialization of credit risk19.
Figure 13 | Irregularity and Forecasting of Credit to the Private Sector
V. Solvency
The financial system closed the first quarter with high solvency indicators. The net worth of the banks as a whole was equivalent to 12.2% of the sector’s total assets as of March 2018 (see Chart 14), in line with the average leverage of the last 10 years. This indicator is at a relatively high level in an international comparison (see Chart 15), which is an indicator of the relative low level of leverage of local financial institutions. In addition, the integration of regulatory capital at the aggregate level continued to exceed the regulatory requirement, showing an excess of capital equivalent to 76% of what was required. It should be considered that, even taking into account regulatory capital margins20, the financial system remains in a situation of slack21. Capital integration totaled 15.3% of risk-weighted assets (RWA) in the month, with 90% explained by the segment with the highest relative quality to absorb eventual losses (Level 1, see Chart 16). From these high levels, compared to February, solvency indicators were slightly reduced, largely due to the performance of public banks22.
Figure 14 | Evolution of Equity and Leverage – Consolidated financial system
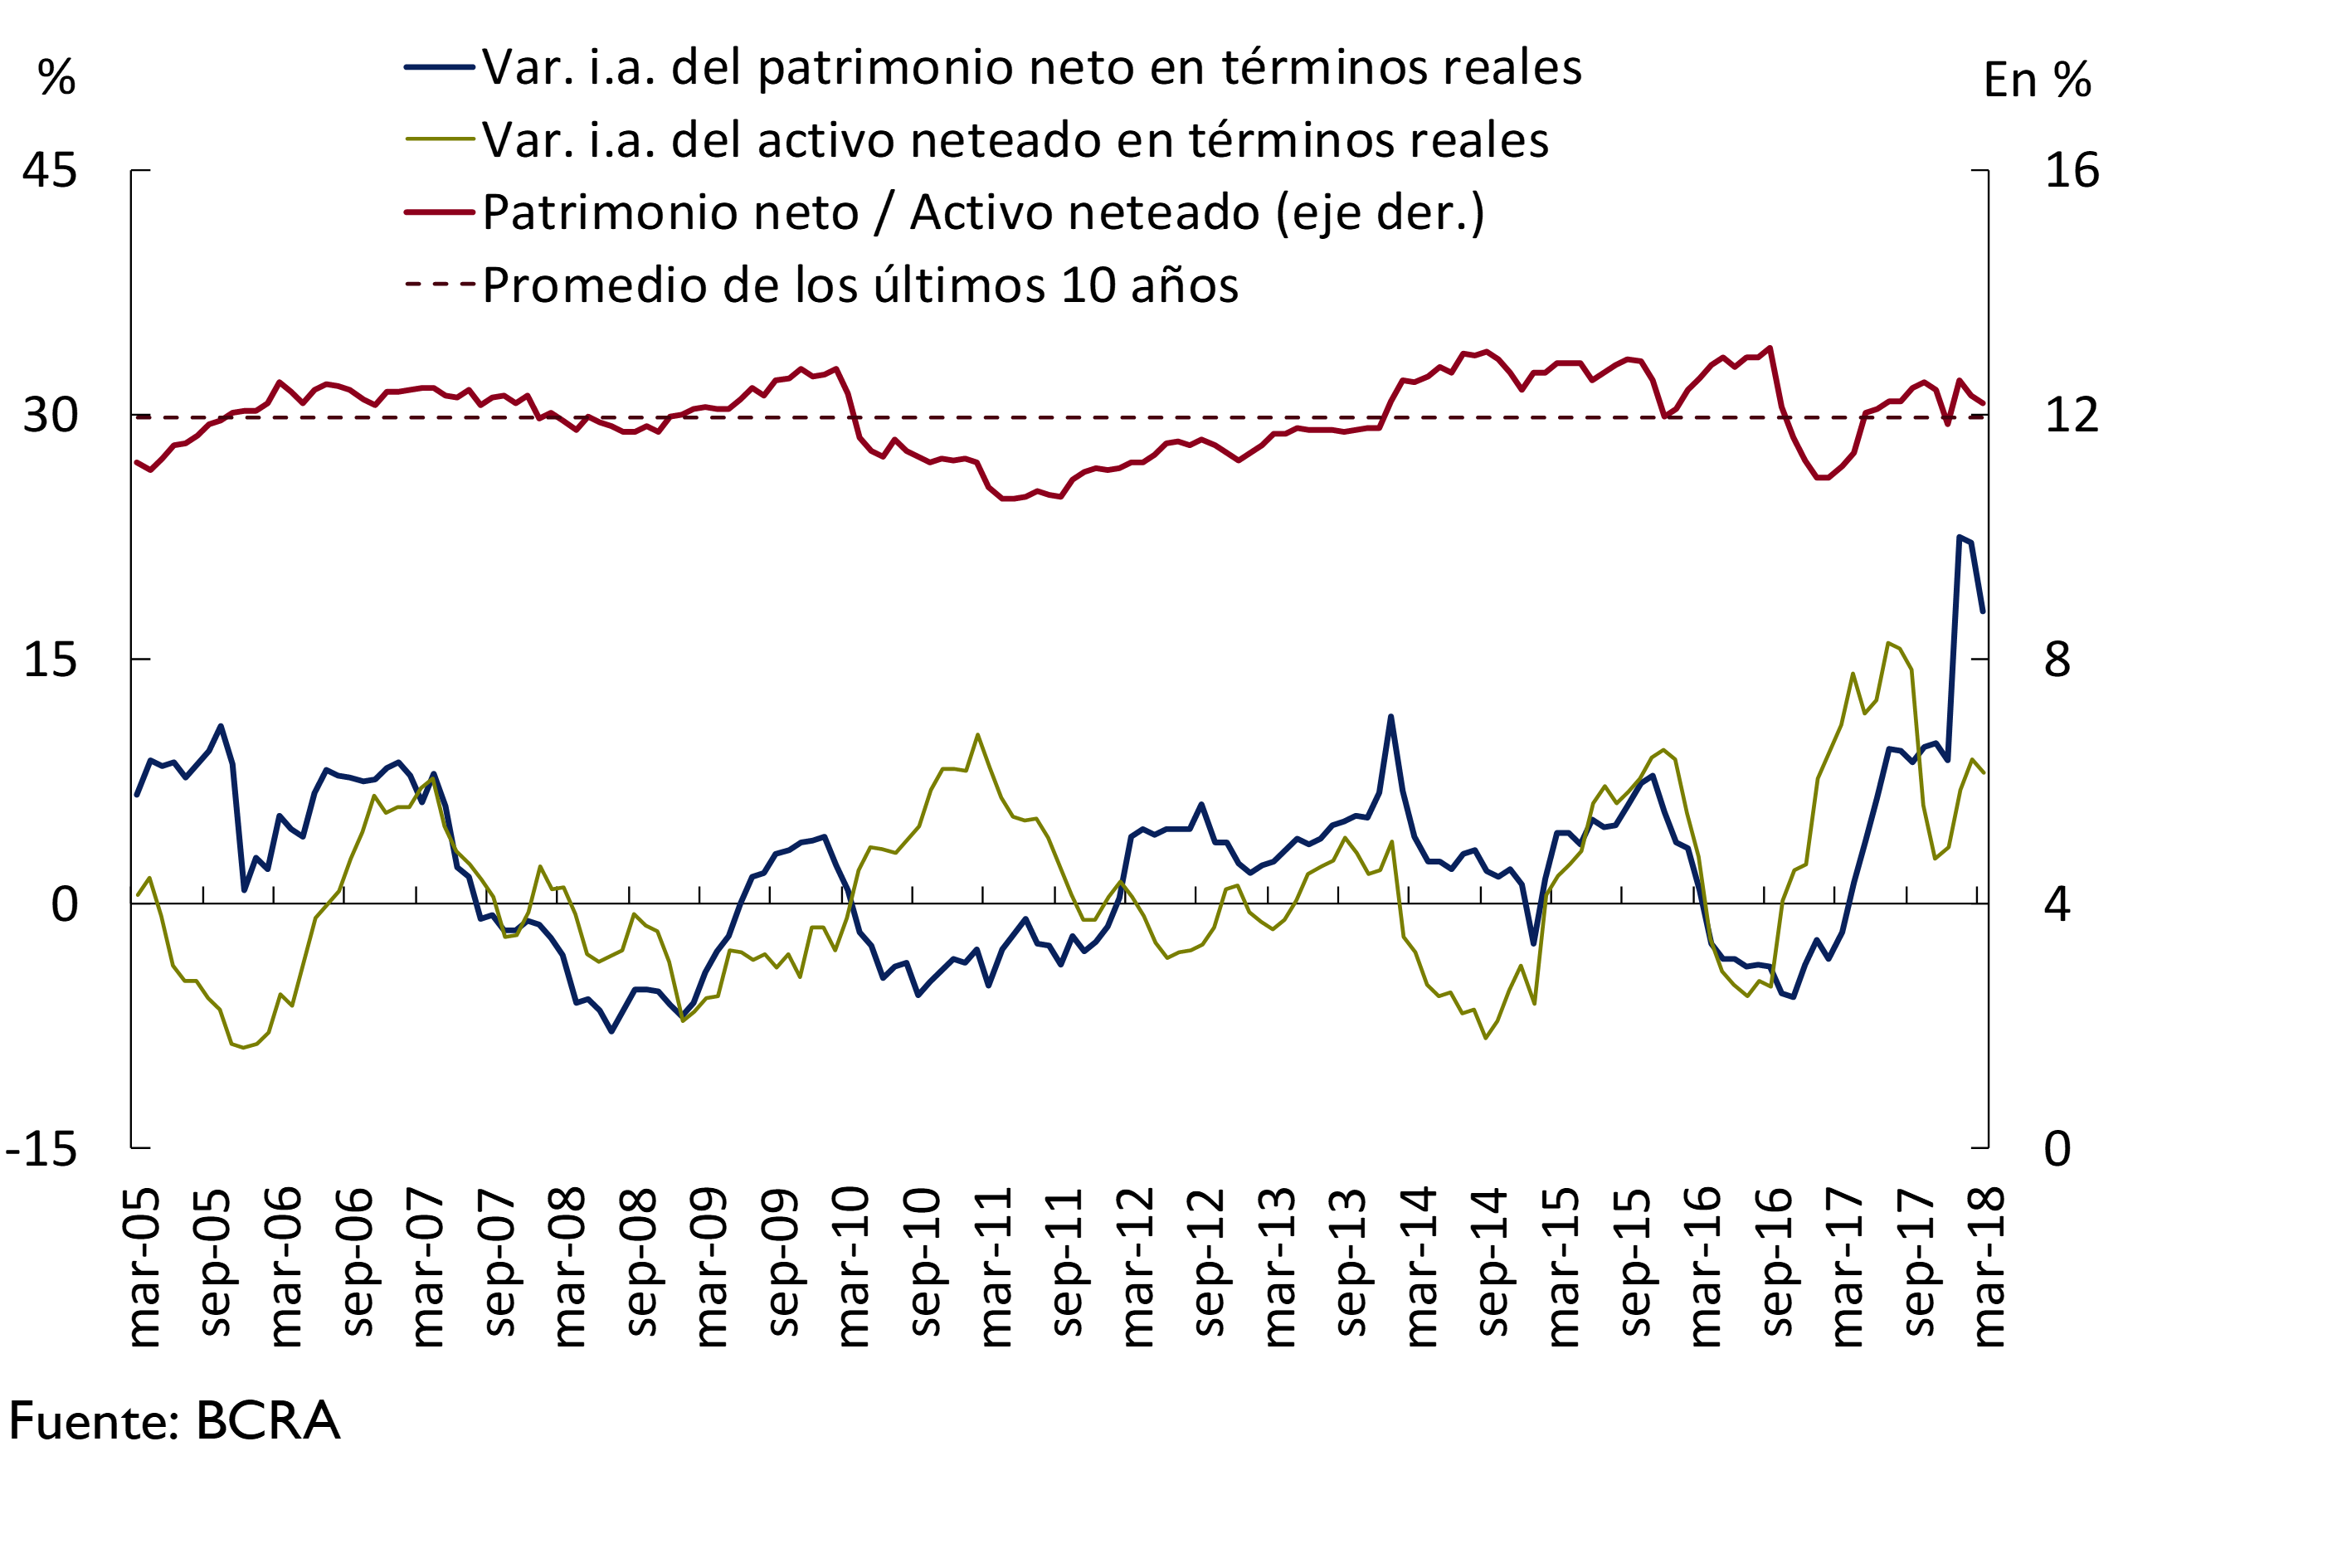
Figure 15 | Net Worth / Total Assets – International Comparison
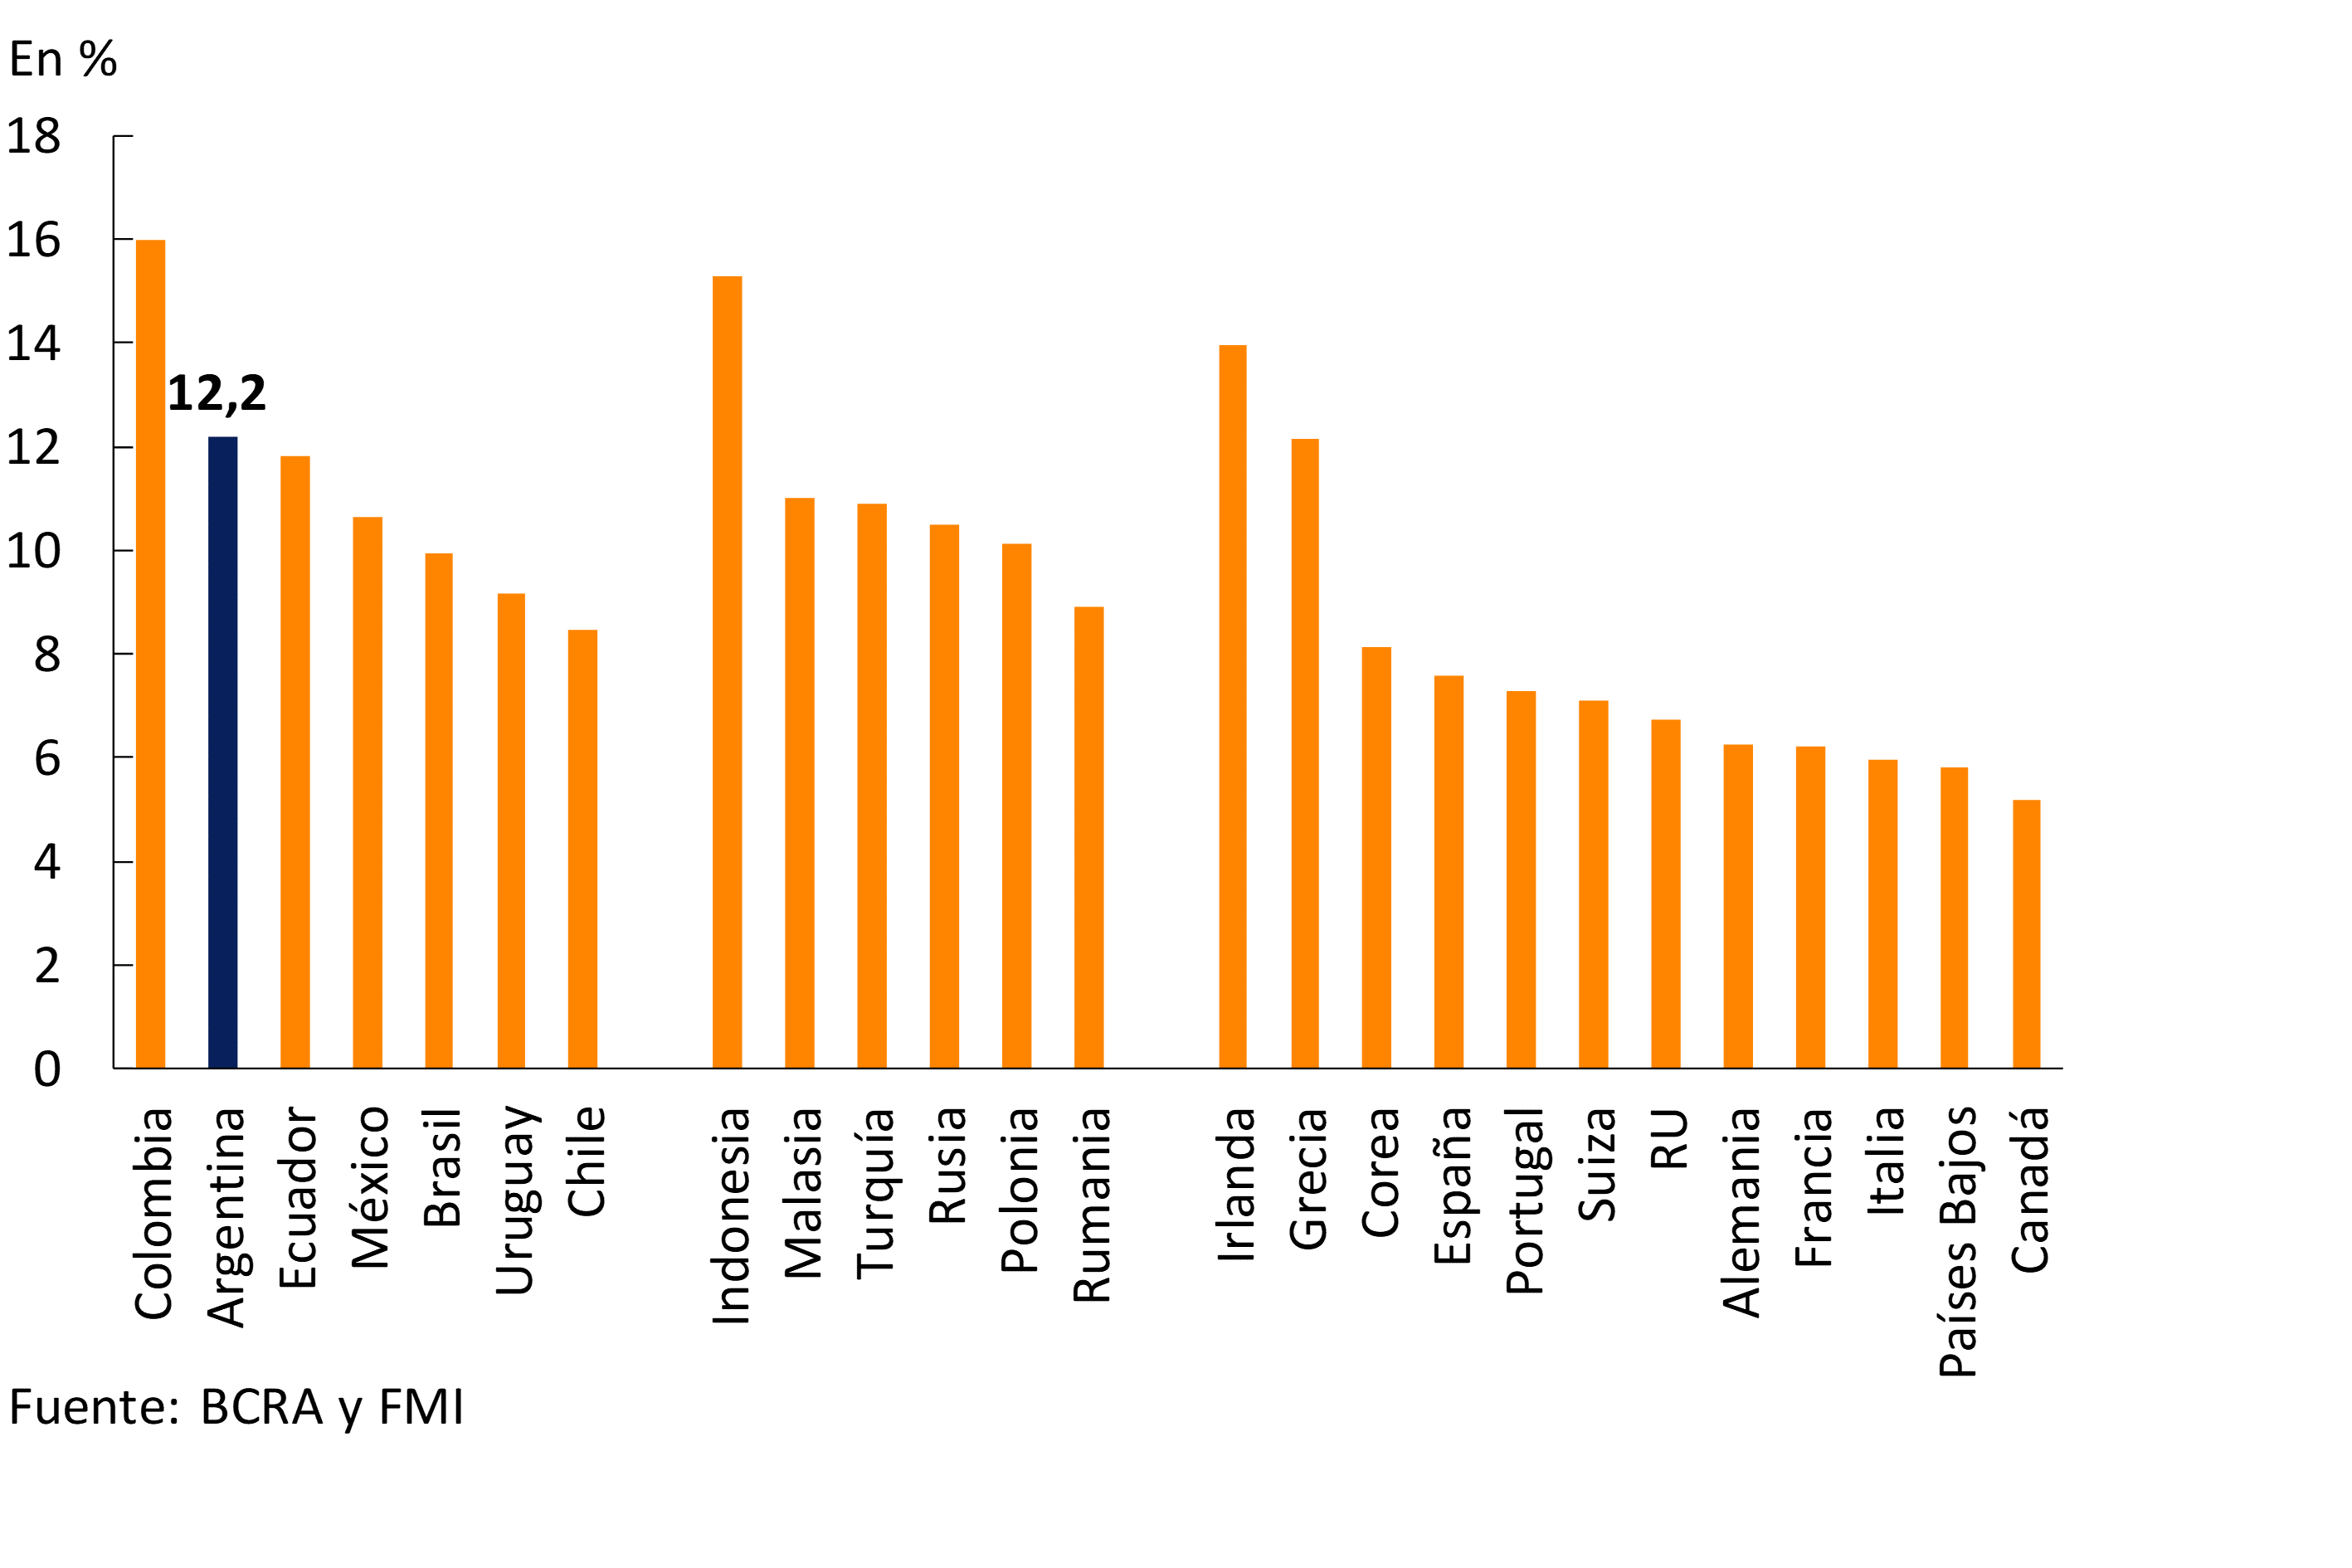
Figure 16 | Integration and Excess Regulatory Capital (Position)

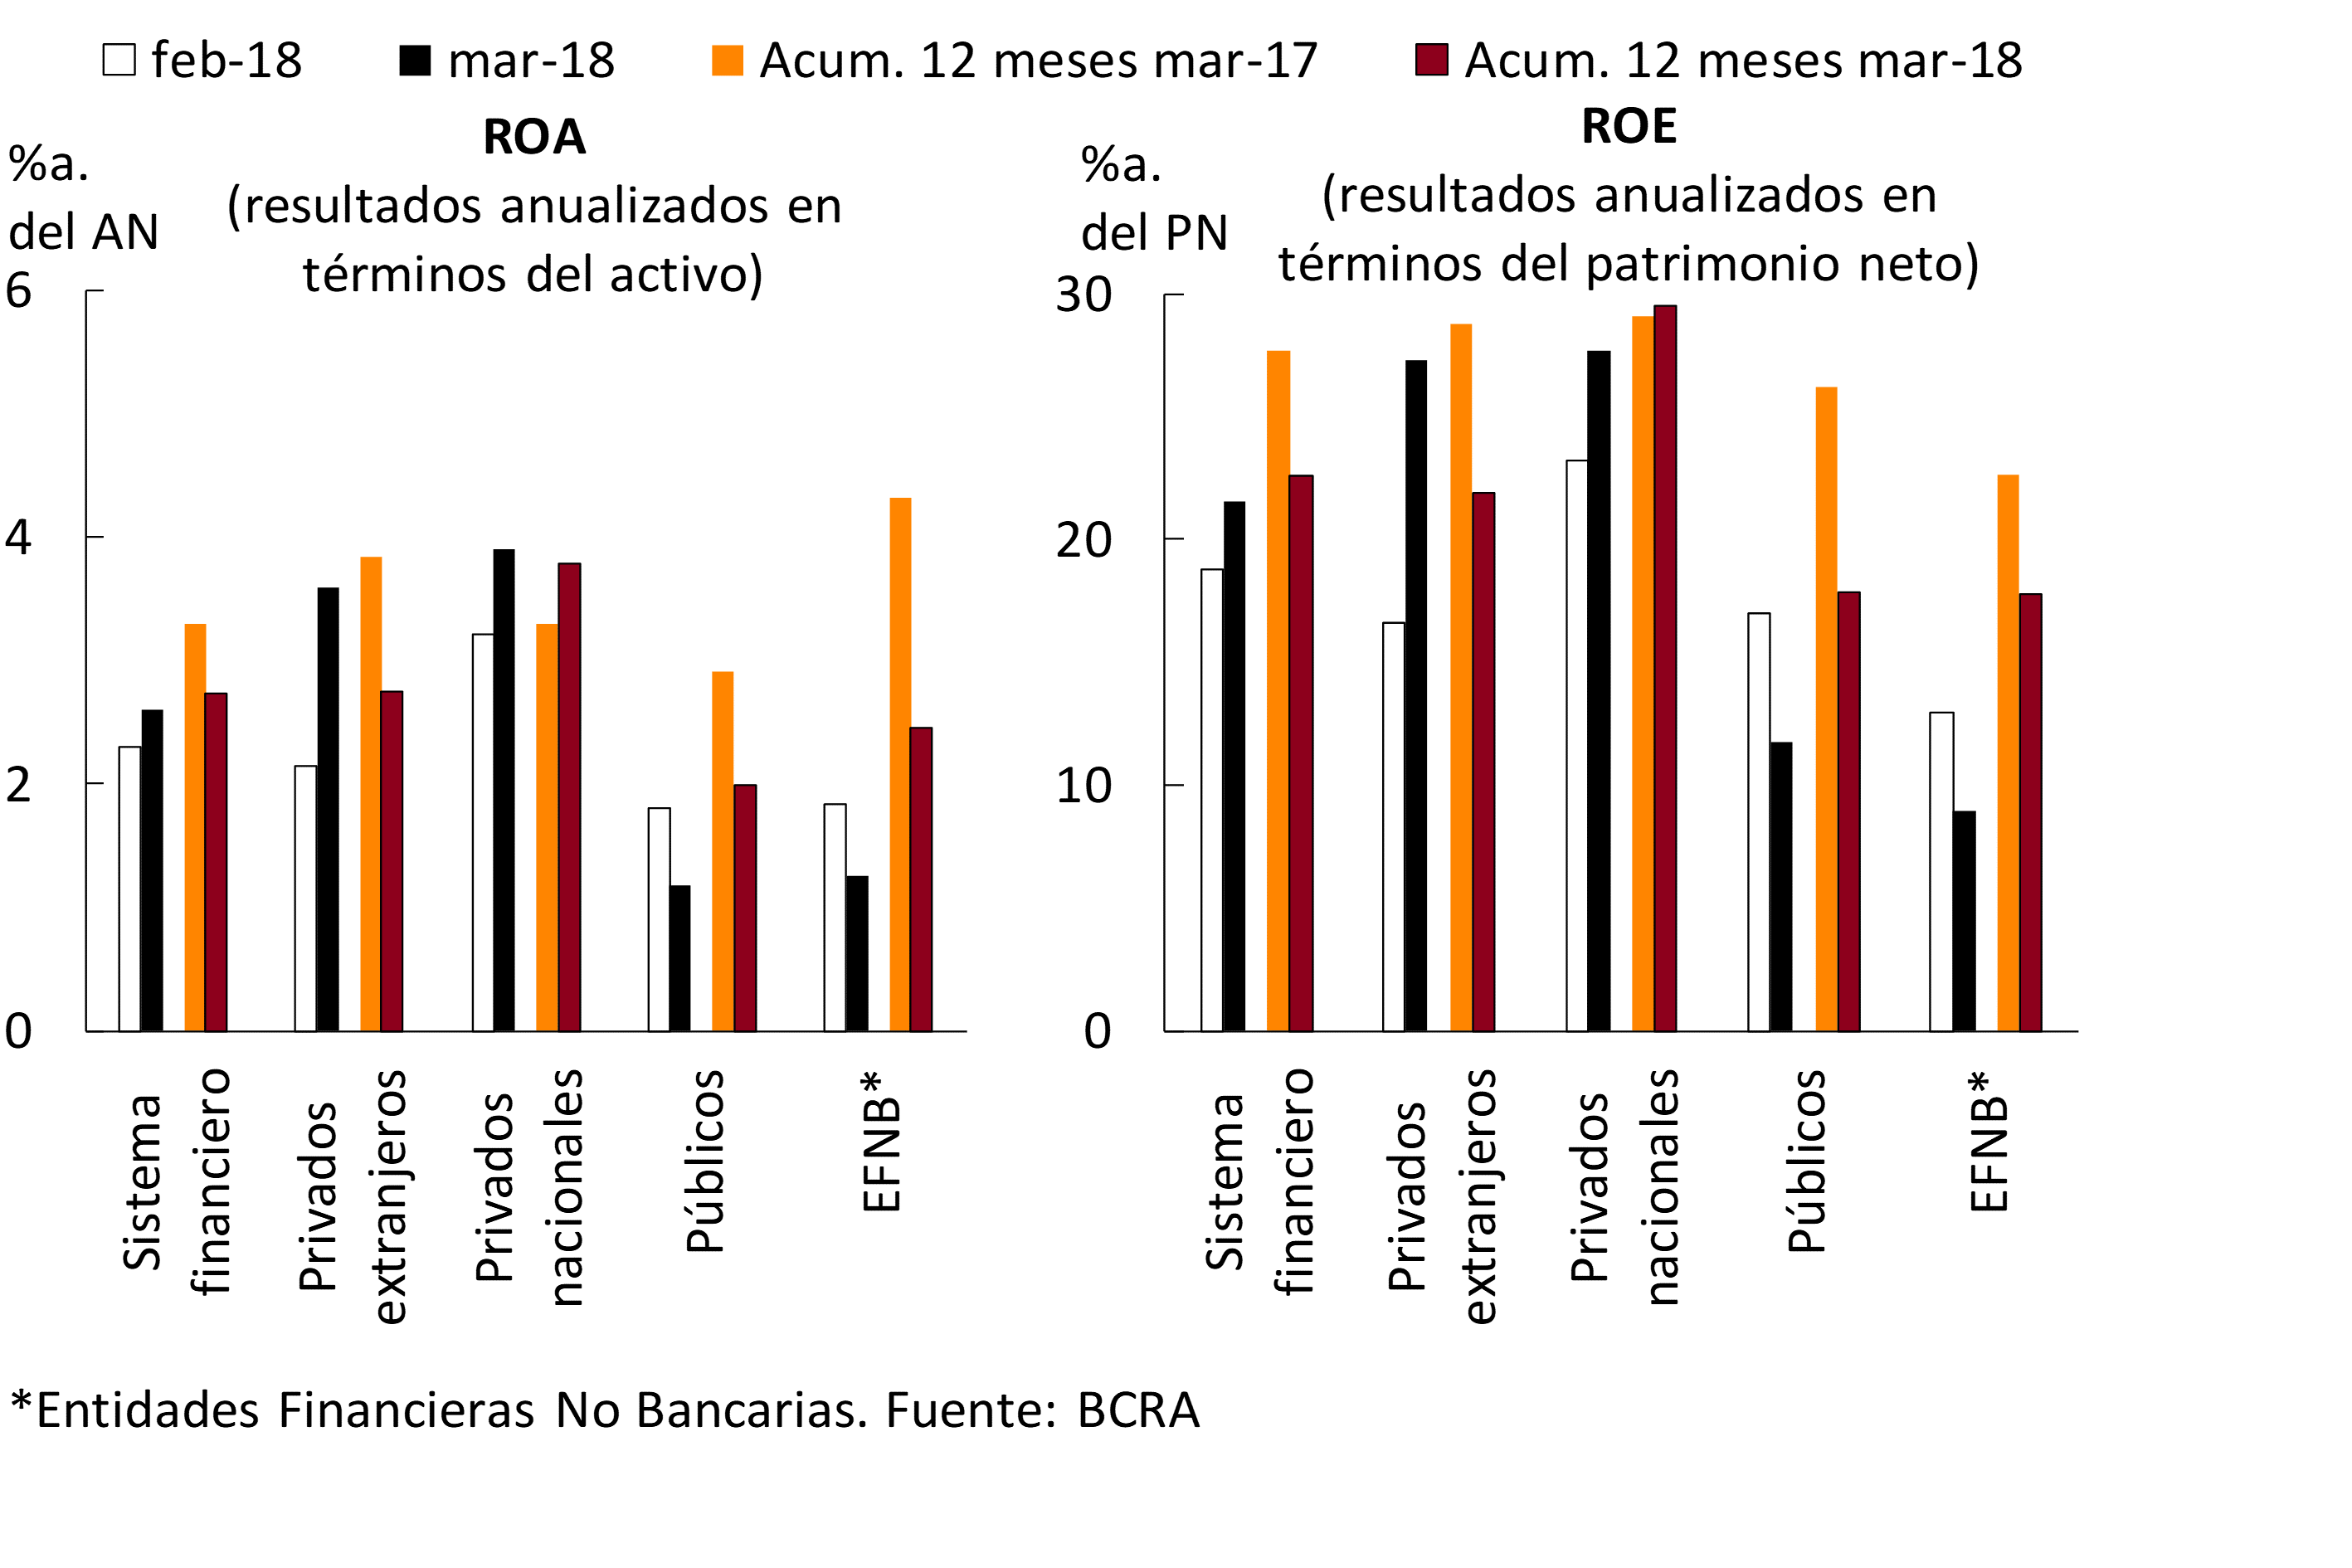
The positive results recorded in March by the financial system reached 2.6% annualized (y) of assets (21.6% y/y. of net worth), increasing 0.3 p.p. compared to February (see Chart 17). This increase was mainly explained by a higher financial margin, partly offset by the performance of non-financial expenses (administrative expenses, charges for uncollectibility and other comprehensive income23 (ORI). Private banks led the monthly increase in nominal profitability by recording gains of 3.7% of assets in the month. While public banks obtained 1.2% of the assets, showing a slight drop in this ratio. Considering the accumulated profits in the 12 months to March, the financial system obtained gains of 2.7% of assets (about $83,764 million, with a nominal increase of 12.8% YoY), 0.6 p.p. less in a year-on-year comparison. The group of private banks obtained a cumulative ROA in 12 months of 3.3%, falling 0.3 p.p. in a year-on-year comparison.
Figure 17 | Income Statement by Financial Institution Group
In March, the monthly financial margin reached 10.8% of assets, increasing 1.5 p.p. compared to February. This monthly increase was mainly explained by higher interest income and securities gains (see Chart 18), effects tempered by the rise in interest expenditures. The accumulated financial margin in the last 12 months represented 10.4% of assets, 0.3 p.p. less in a year-on-year comparison. This fall was due to lower interest income (mainly from loans) and a decrease in securities gains, effects partially offset by lower interest expenses (mainly from deposits).
Figure 18 | Components of the Income Table – Financial System
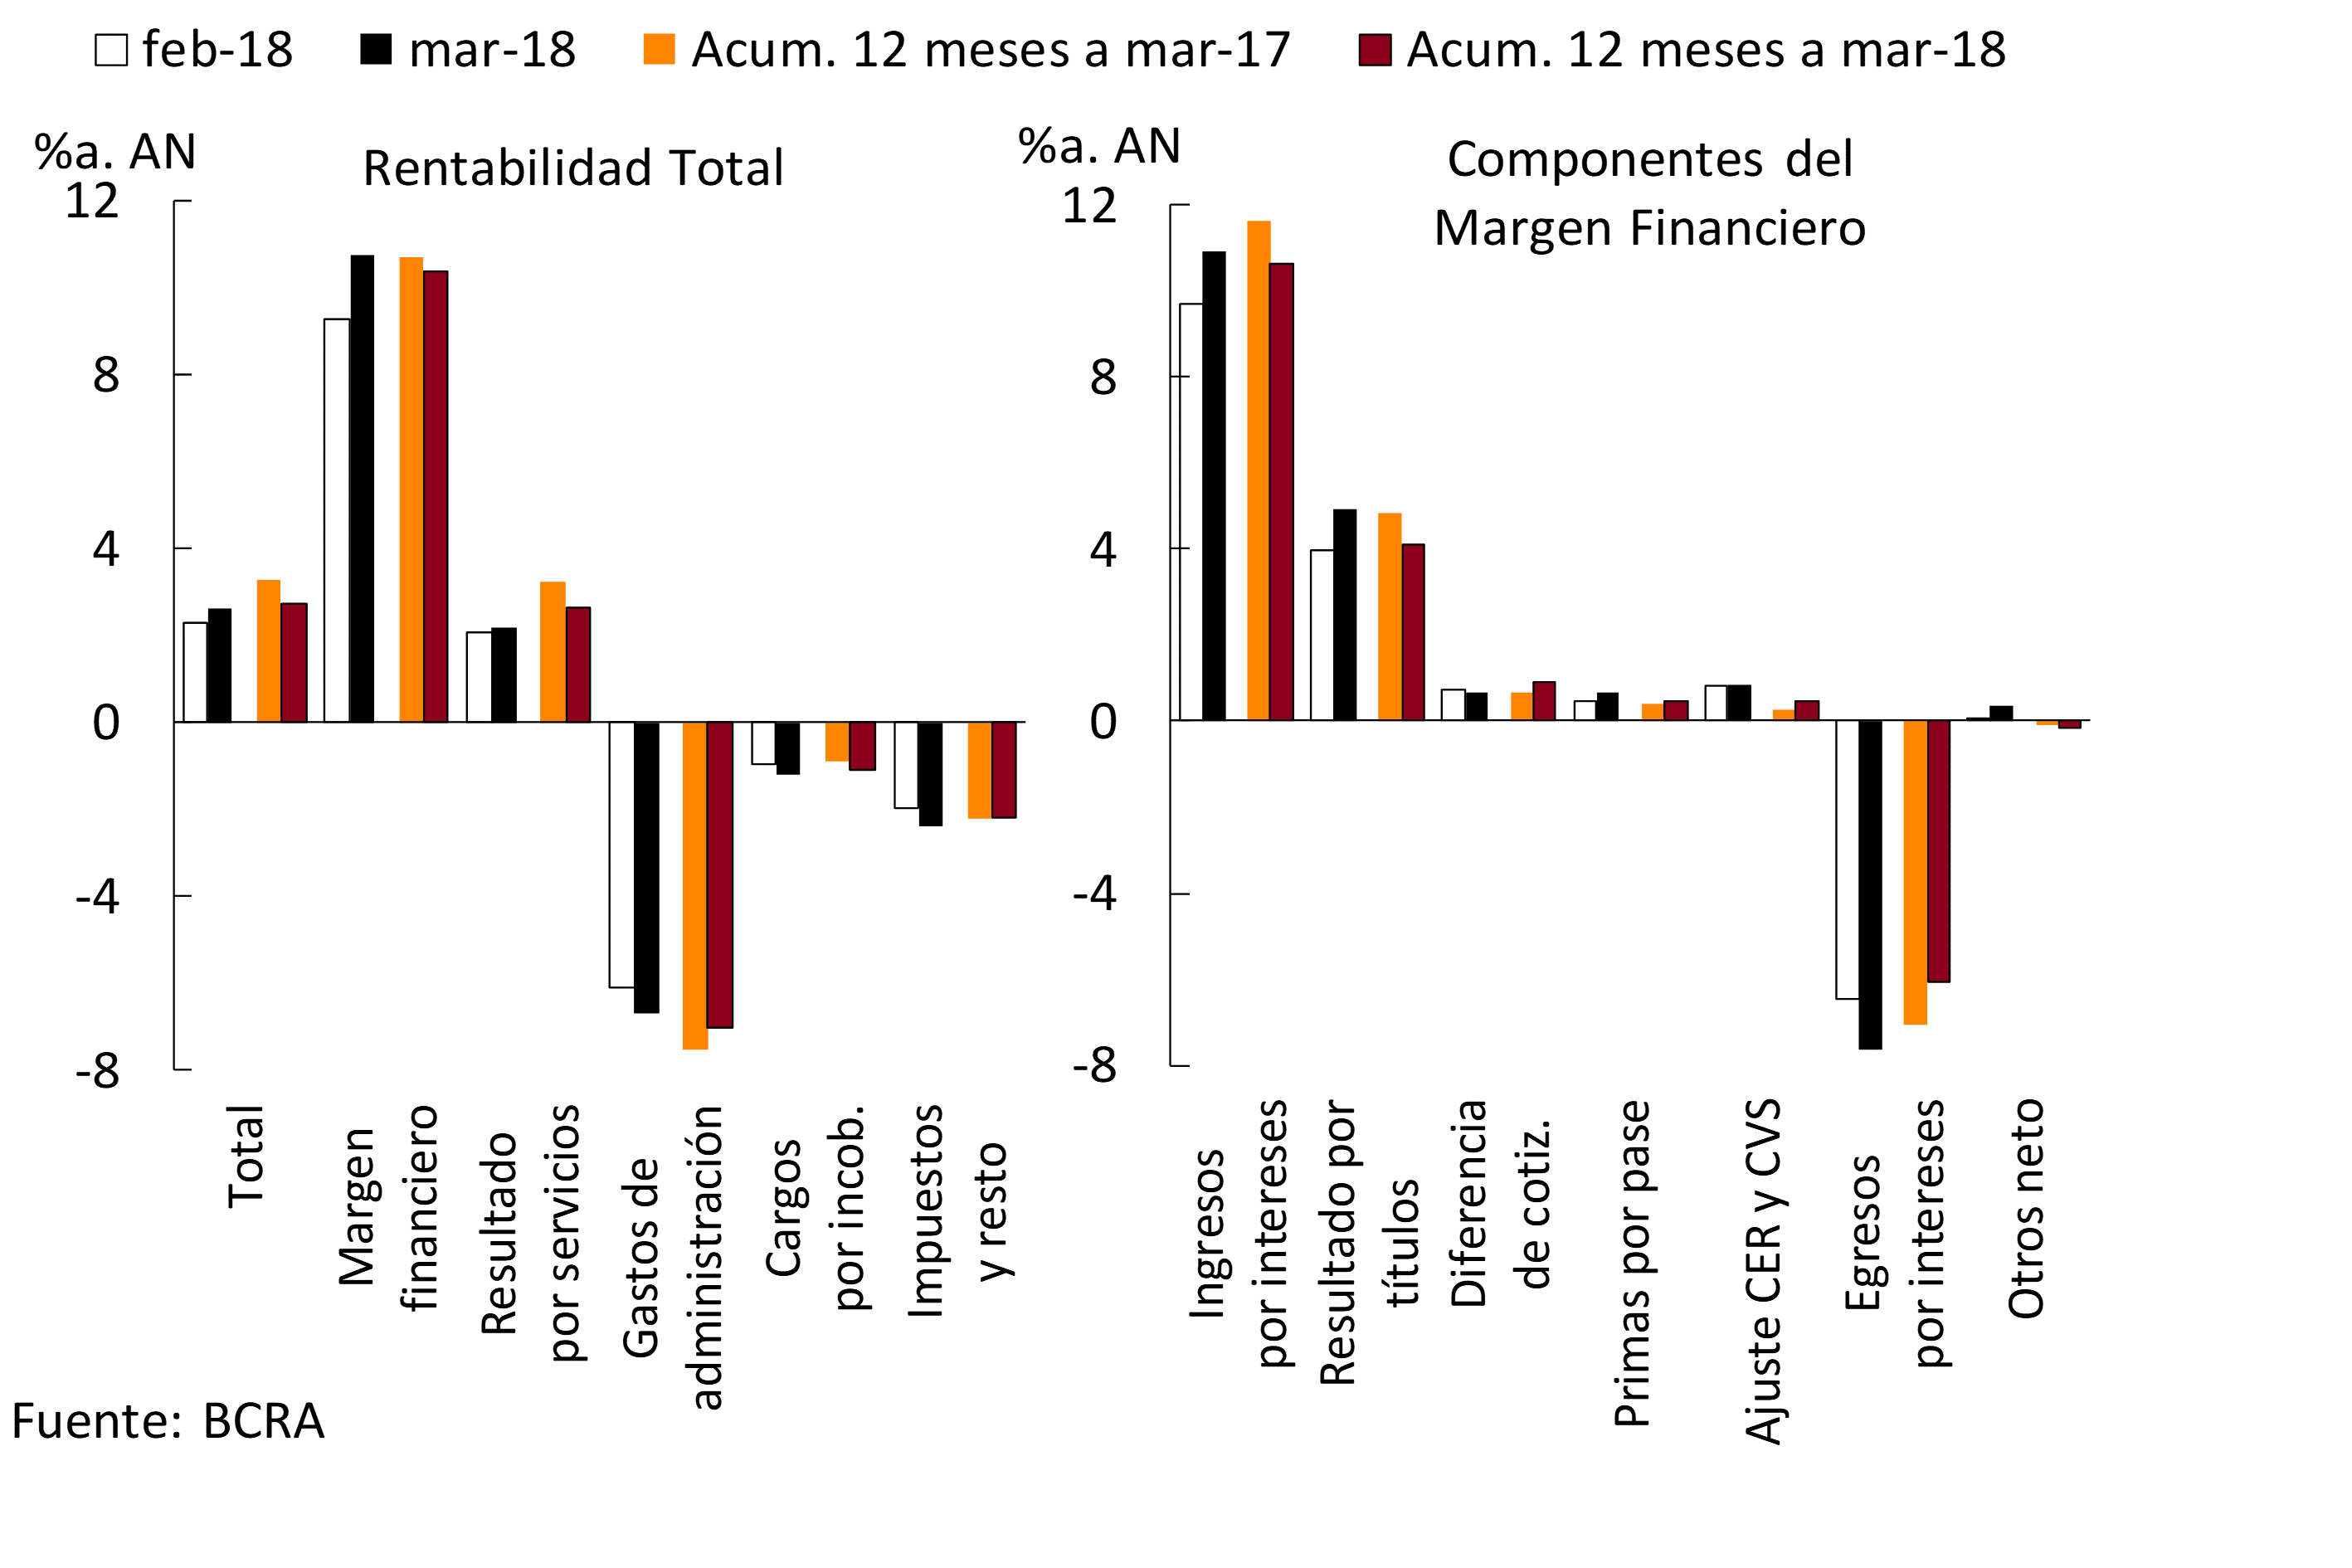
Earnings from financial system services accounted for 2.2% y/y of assets in March, 0.1 p.p. more than in February. Between April 2017 and March 2018, net income from services totaled 2.6% of assets, falling 0.6 p.p. y.o.y.(see Graph 18).
On the other hand, bad debt charges for banks as a whole accounted for 1.2% of assets, increasing slightly compared to February. In the 12 months to March 2018, bad debt charges totaled 1.1% of assets, up 0.2 p.p. year-on-year.
Administrative expenses were equivalent to 6.7% of assets in March, increasing in relation to the February figure. In the accumulated 12 months, the sector’s administrative expenses stood at 7% of assets, reducing 0.5 p.p. in a year-on-year comparison24 (see Graph 18).
Regulations
Summary of the main regulations of the month, implemented by the BCRA, related to financial intermediation activity. The effective date of the regulation is taken as a reference.
Communication “A” 6464 – 09/03/18
The rules on “Distribution of results” are modified, leaving without effect the requirement of prior authorization from the Superintendence of Financial and Exchange Entities to distribute profits. Notwithstanding the foregoing, until 31/03/20, entities that, in order to determine the distributable result, have not increased the level of capital required by 1% must have prior authorisation.
Communication “A” 6467 – 15/03/18
The maximum limits of assistance that financial institutions can channel to mutual guarantee societies (SGR) or Public Guarantee Funds (FGCP) are extended, from 25% to 50% of the computable patrimonial liability (RPC) of each entity, provided that such assistance does not exceed the basic limit established in the rules on “Credit graduation”. The ceiling provided for determining the complementary credit margin to SGR and FGCP is increased from 5% to 10% of the RPC of the borrowing entity.
Communication “A” 6468 – 16/03/18
The rules on “Classification of debtors” are adapted, extending until 12/31/19 the special calculation of the days of arrears for the classification of debtors covered by the Agricultural Emergency Law.
Communication “A” 6474 – 23/03/18
It is established that, in credit transactions with users of financial services, the Total Financial Cost (TFC) must be identified legibly, in the same font and with a size at least five times larger – preserving all the proportions of stroke thickness, height and width – than that used for the other information included in the customer relationship documents (contracts, receipts, debit notes, etc.).
Communication “A” 6475 – 23/03/18
The rules on “Authorities of financial institutions” are modified, establishing that financial institutions are classified into two groups according to their assets: Group “A” (assets greater than or equal to 1% of the assets of the financial system) and Group “B” (other entities). It is provided that the obligation to maintain the separation of executive and administrative functions will fall on the entities included in Group “A” as well as on public financial institutions. Likewise, a specific treatment is established for financial institutions that, being included in a certain group, must migrate to another, but with values close to the limit of 1%. In relation to new financial institutions that apply for authorization to operate, a criterion is established for their classification, allowing them to be included in Group “B” until they can have information on their amount of assets.
References
1 Reference is made to those measures of relevance to the financial system that were adopted since the date of publication of the previous Report on Banks.
2 Communication “A” 6494 and Press Release of 04/19/18.
3 Communication “A” 6483 and Press Release of 10/04/18.
4 Communication “A” 6489 and Press Release of 04/19/18.
7 Communication “A” 6501 and Press Release of 05/04/18.
9 For more information, see Section 3 of the Financial Stability Report for the First Quarter of 2018: IEF I-18.
10 For more information, see Chapter 4 of the First Quarter 2018 Financial Stability Report: IEF I-18.
11 The decrease in public sector deposits was explained by the performance of term accounts (-20.6% in real terms), which was partially offset by the increase in demand loans (+19.3% in real terms), partially reversing last month’s movements.
12 For more information, see Chapter 3 of the First Quarter 2018 Financial Stability Report: IEF I-18.
13 If the balance sheet is corrected for the assets securitized in the month and derecognized from the asset, the real growth of loans in pesos to the private sector would remain at 0.4%
14 Variation in currency of origin.
15 For more information, see Chapter 2 of the Financial Stability Report (FSR) for the first half of 2018: IEF I-18
16 Variation in currency of origin.
17 Includes capital and adjustment of capital for the evolution of the CER.
18 It includes a fixed and repacable interest rate.
19 For more details, see Chapter 3 of the Financial Stability Report (FSR) for the first half of 2018: IEF I-18.
20 According to the Ordered Text of Distribution of Results.
21 For more detail, see IEF I-18.
22 Explained by a bank within the framework of the provisions of Law 27,431.
23 Calculation of losses on financial instruments (equity) at fair value with changes in ORI by a public bank of magnitude.
24 For more details on the reduction in administrative expenses, see Chapter 2 of the Financial Stability Report for the first quarter of 2018: IEF I-18.
Glossary
%a.: annualized percentage.
% YoY: Year-on-year percentage.
Liquid assets: availabilities (integration of “minimum cash” in current accounts at the BCRA and in special guarantee accounts and other concepts, mainly cash in banks and correspondent offices) plus the net credit balance for transfer operations of financial institutions against the BCRA using LEBAC and NOBAC.
Consolidated assets and liabilities: those arising from deducting transactions between entities in the system.
Net Assets (NA): Assets and liabilities are net of accounting duplications for pass-through, forward and spot transactions to be settled.
APR: Total Risk Weighted Assets.
BCBS: Basel Committee on Banking Supervision (BCBS).
Irregular portfolio: portfolio in situation 3 to 6, in accordance with the “Classification of Debtors” regime.
Credit to the public sector: Position in public securities (without LEBAC or NOBAC) + Loans to the public sector + Compensation to be received + Debt securities and Certificates of participation in financial trusts (with underlying public securities) + Miscellaneous credits to the public sector.
Credit to the private sector: loans to the non-financial private sector including accrued interest and CER and CVS adjustment and leasing.
Contribution differences: Results from the monthly update of assets and liabilities in foreign currency. The item also includes the results originated by the purchase and sale of foreign currency, which arise as a difference between the agreed price (net of the direct expenses originated by the operation) and the book value.
Miscellaneous: miscellaneous profits (including, but not limited to, gains on permanent shares, recovered loans and unaffected provisions) less miscellaneous losses (including, but not limited to, losses on permanent shareholdings, loss on sale or disposal of goods for use and amortization of business keys).
Equity exposure to counterparty risk: irregular portfolio net of provisions in terms of equity.
Administration expenses: includes remunerations, social charges, services and fees, taxes and amortizations.
IEF: BCRA Financial Stability Report.
IPCBA: Consumer Price Index of the City of Buenos Aires.
CSF: Liquidity Coverage Ratio (LCR).
LEBAC and NOBAC: bills and notes issued by the BCRA.
LELIQ: BCRA liquidity bills.
LR: Leverage Ratio (LR).
Financial margin: Income minus financial expenses. It includes interest and securities earnings, CER and CVS adjustments, exchange rate differences and other financial results.
Mill.: Million or million, as appropriate.
IFRS: International Financial Reporting Standards.
ON: Negotiable Obligations.
ORI: Other comprehensive results.
OS: Subordinated Obligations.
Other financial results: rental income from financial leases, contribution to the deposit guarantee fund, interest on availabilities, charges for loan depreciation, premiums for the sale of foreign currency and other unidentified items.
PN: Net Worth.
p.p.: percentage points.
SME: Small and Medium Enterprises.
Consolidated profit: Results from permanent holdings in local financial institutions are eliminated. Available since January 2008.
Income from securities: includes results from public securities, temporary shares, negotiable obligations, subordinated obligations, options and other credits for financial intermediation. In the case of public securities, it includes the results accrued in terms of income, differences in share price, exponential increase based on the internal rate of return (IRR) and sales, in addition to the charge for forecasts for the risk of impairment.
Interest income: interest charged minus interest paid for financial intermediation, following the accrual criterion (balance sheet information) and not what is received. It includes interest on loans and deposits of government securities and premiums for passes.
Result for services: commissions charged minus commissions paid. It includes fees related to obligations, credits, securities, guarantees granted, the rental of safe deposit boxes and foreign and exchange operations, excluding in the latter case the results from the purchase and sale of foreign currency, the latter being accounted for in the “Differences in quotation” account. Expenses include commissions paid, contributions to the ISSB, other contributions for income from services and charges accrued from the gross income tax.
ROA: Final result as a percentage of net assets. In the case of referring to accumulated results, the average of the NA for the reference months is considered in the denominator.
SWEE: Final result as a percentage of equity. In the case of referring to accumulated results, the average net worth for the reference months is considered in the denominator.
RPC: Computable Patrimonial Liability. For more details, see Ordered Text “Minimum Capitals of Financial Institutions”.
TNA: Annual nominal rate.
US$: US dollars.
UVA: Unit of Purchasing Value.
ICU: Housing Units.
Share on


