Executive summary
• Financial intermediation with the private sector grew for the third consecutive month in July, in a context in which surplus systemic liquidity fell from relatively high levels. The indicators for the materialisation of the credit risk assumed by all institutions remained limited in the period and high aggregate solvency ratios were preserved.
• The real balance of financing to the private sector in pesos increased 9.2% in July and 3.4% in the foreign currency segment. The real balance of total credit to the private sector (including domestic and foreign currency) increased 8% in the month, with increases in both financing to companies – driven mainly by industry and primary production – as well as to households – mainly reflected in consumption lines.
• The non-performing loan ratio to the private sector remained unchanged in the month, standing at 1.7% (-1.4 p.p. y.o.y.). In July, the NPL indicator for financing to companies stood at 0.9% (-2 p.p. y.o.y.) and 2.7% (-0.6 p.p. y.o.y.) for loans to households. The balance of accounting forecasts of the aggregate financial system represented 162.9% of the credit in an irregular situation (+38.8 p.p. y.o.y.), exceeding 100% in all groups of banks.
• In July, the real balance of deposits in pesos in the private sector remained unchanged in magnitude compared to the previous month. The balance of demand accounts in pesos in the private sector fell 3.6% in real terms in the month, while time deposits in national currency in this sector increased 5.6% in real terms. In July, the balance of deposits in foreign currency of the private sector grew 3.9%. Thus, in the month the real balance of total deposits of the private sector (considering national and foreign currency) increased 0.6%.
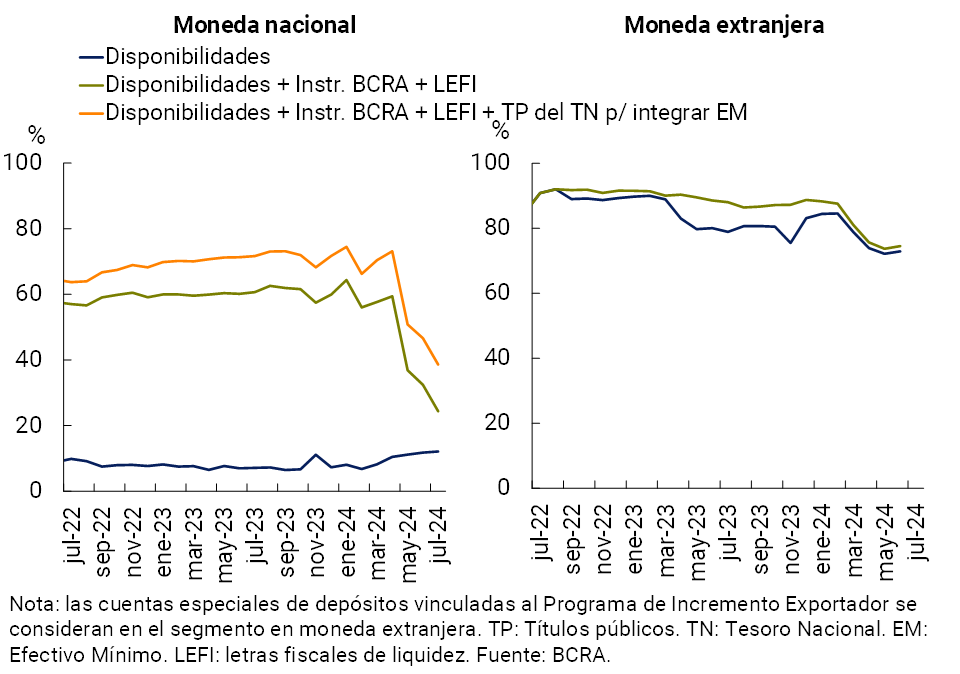
• The broad liquidity indicator stood at 46.3% of total deposits in July, decreasing 5.8 p.p. monthly. In the month, fiscal liquidity bills (LEFI) were incorporated into the balance sheets of financial institutions. Within the framework of the new stage of the stabilization program, the LEFIs issued by the Treasury replaced the passes with the BCRA with the aim of eliminating the endogenous monetary issuance that the latter instruments generated and thus tend to clean up the balance sheet of this Institution. Considering only the availabilities (cash balances and current accounts in BCRA in terms of total deposits, considering national and foreign currency), the liquidity indicator of the financial system stood at 24.8% in July.
• The integration of regulatory capital (RPC) of the aggregate of financial institutions remains at high levels, standing at 35% of risk-weighted assets (RWA) in July, 2 p.p. below the previous month’s record. In July, excess regulatory capital (RPC minus minimum regulatory requirement) totaled 339% of the regulatory requirement at the systemic level and 61.6% of the balance of credit to the private sector net of provisions.
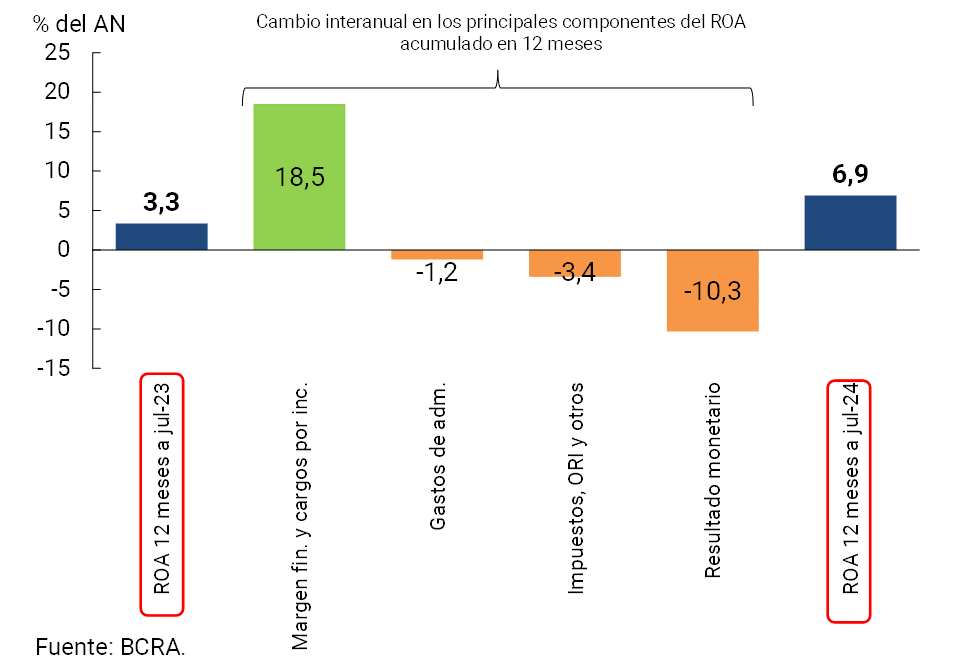
• Considering the cumulative figure for the last 12 months to July, the total comprehensive profit in homogeneous currency of the financial system was equivalent to 6.9% of assets (ROA) and 28.3% of equity (ROE), levels that increased in a year-on-year comparison.
• Electronic means of payment grew in July. Immediate transfers (TI) accumulated increases of 93.3% YoY in amounts and 42.9% YoY in real amounts. In the period, payments with transfer (PCT) via interoperable QR codes maintained a positive performance, growing 268.6% YoY in quantities and 202.1% YoY in real amounts.
I. Financial intermediation activity
The financial intermediation activity of all entities with the private sector increased in July. Considering the most relevant movements – in real terms – of the financial system’s balance sheet in national currency, the reduction in ample liquidity was the main source of funds in month1. On the side of the applications of resources in pesos, in July the real balance of financing to the private sector increased and, to a lesser extent, the real balance of public sector deposits decreased. With regard to foreign currency items, the balance of deposits (both private and public sector) increased during the period and financing to the public sector decreased, with an increase in credit to the private sector and liquid assets as a counterpart.
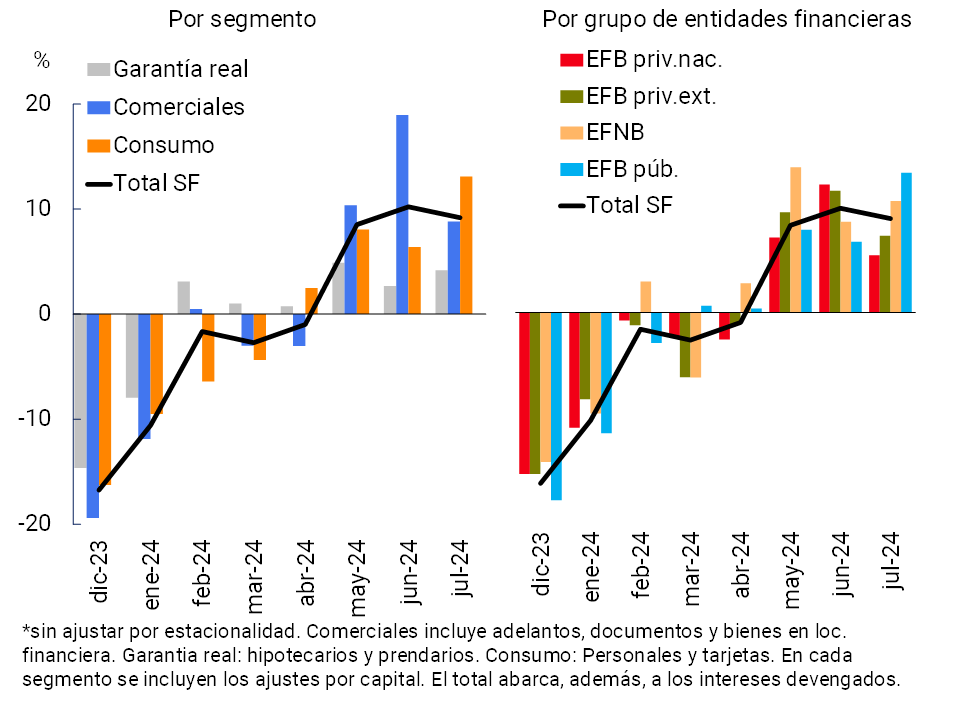
The real balance of financing in pesos to the private sector increased 9.2% in July, thus verifying growth for the third consecutive month (see Graph 1)2. Consumer credit lines were the most dynamic in the period (13.1% real), followed by commercial loans (8.8% real) and those with real collateral (4.2% real). All groups of financial institutions increased their real credit balances in pesos to companies and households in month3.
Graph 1 | Balance of credit to the private sector in pesos
Monthly changes in real terms*
Graph 2 | Total credit balance to the private
sector Contribution to the monthly change in real terms*
As for the segment in foreign currency, the balance of credit to the private sector increased 3.4% compared to June —in currency of origin—, with greater relative growth in financing through cards and in documents4. The monthly performance was driven mainly by public banks and foreign private banks.
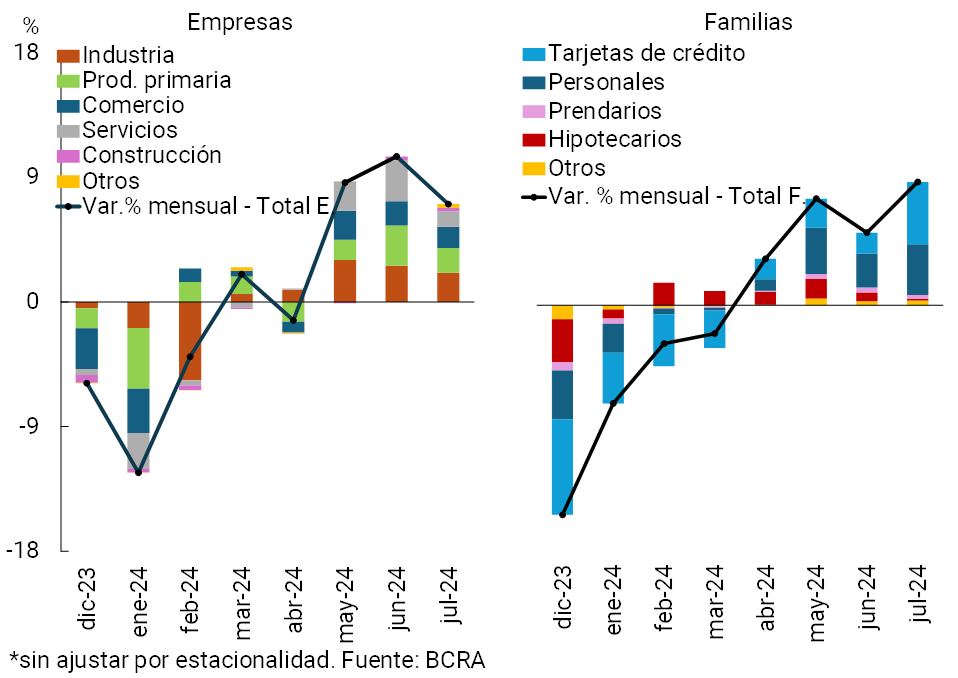
Thus, in July the total credit balance (in domestic and foreign currency) to the private sector accumulated an increase of 8% in real terms compared to the previous month, with increases in both the segment of financing for companies and households (see Graph 2)5. In particular, the total credit balance to companies increased by 7.1% in real terms in the period, a performance driven mainly by industry and primary production, in a context of a generalized increase in financing in the different productive sectors. Meanwhile, the total credit balance to households increased by 9.1% in real terms in the month, with a greater relative contribution of lines to consumption (they accounted for almost 92% of the growth in the period)6.
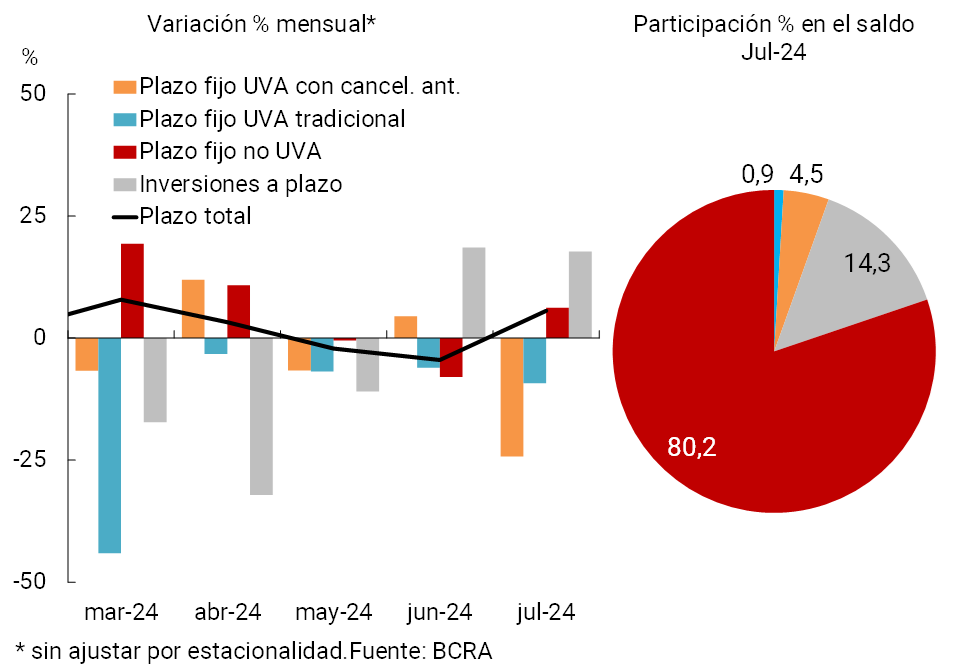
With regard to the funding of all financial institutions, in July the real balance of deposits in pesos in the private sector remained unchanged in magnitude compared to June (0.1% in real terms; see Graph 3). Demand accounts fell by 3.6% in realterms 7, while time deposits increased by 5.6% in real terms. Within the latter segment, the monthly performance was driven by term investments (17.7% in real terms) and by fixed-term deposits at a traditional fixed rate (not adjustable by CER) (6.2% in real terms, see Graph 4), corresponding mainly to legal entities8
On the foreign currency funding side, in July the balance of private sector deposits grew 3.9%, with increases in both demand accounts and time deposits9. The total balance of deposits (covering all currencies and sectors) fell by 1% in real terms compared to June, explained by the performance of public sector deposits10.
Graph 3 | Balance of private sector deposits in pesos
Changes in real terms*
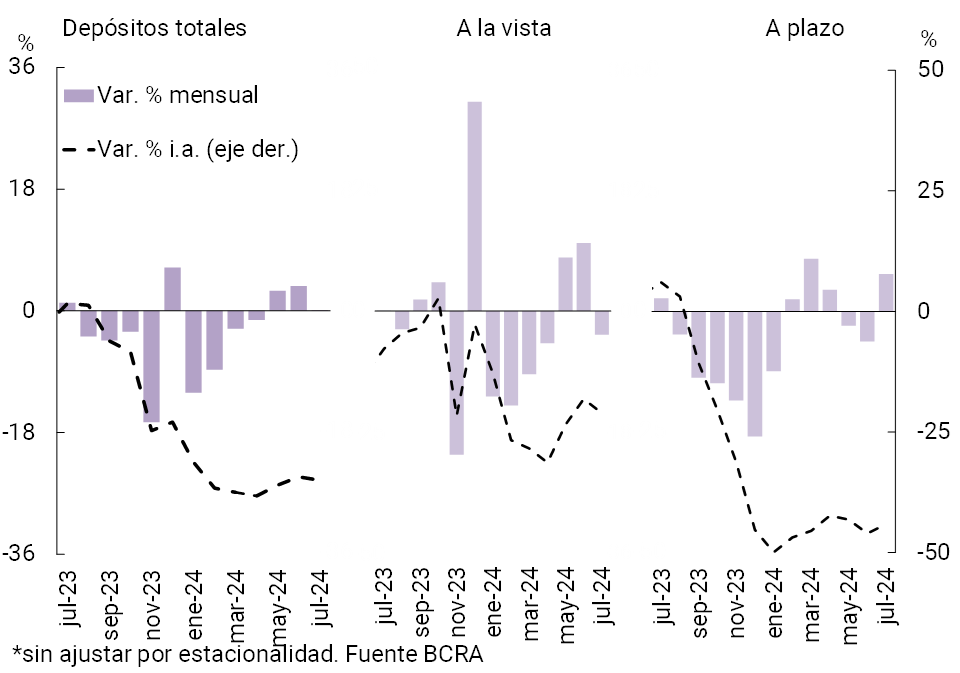
Figure 4 | Real balance of private sector time deposits in pesos
II. Evolution and aggregate composition of the balance sheet
The total assets of all financial institutions fell 2.8% in real terms in July. Considering the last 12 months, total assets accumulated a decrease of 14.4% in real terms.
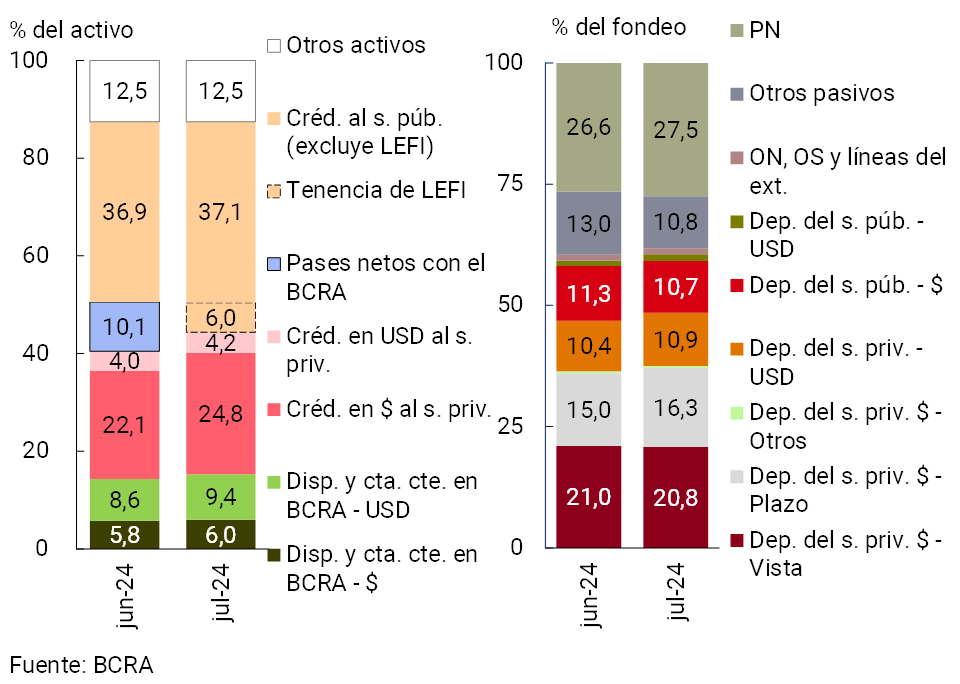
With regard to the composition of the system’s total assets, in the context of the dynamism of financial intermediation (see Section 1), the weighting of credit to the private sector in the total increased in July (see Chart 5). In addition, in the month, the holdings of fiscal liquidity bills (LEFI) were incorporated into the balance sheets of financial institutions. The LEFIs, issued by the Treasury, were designed to replace the passes with the BCRA based on the decision to eliminate the endogenous monetary issuance that these instruments generated and to tend to the consolidation of the balance sheet of this Institution11. With regard to the composition of the total funding of the financial system, the main monthly variations corresponded to the increase in the relevance of term placements in pesos from the private sector and the reduction in the relative importance of public sector deposits in the same denomination.
Graph 5 | Composition of assets and funding Financial
system – Participation %
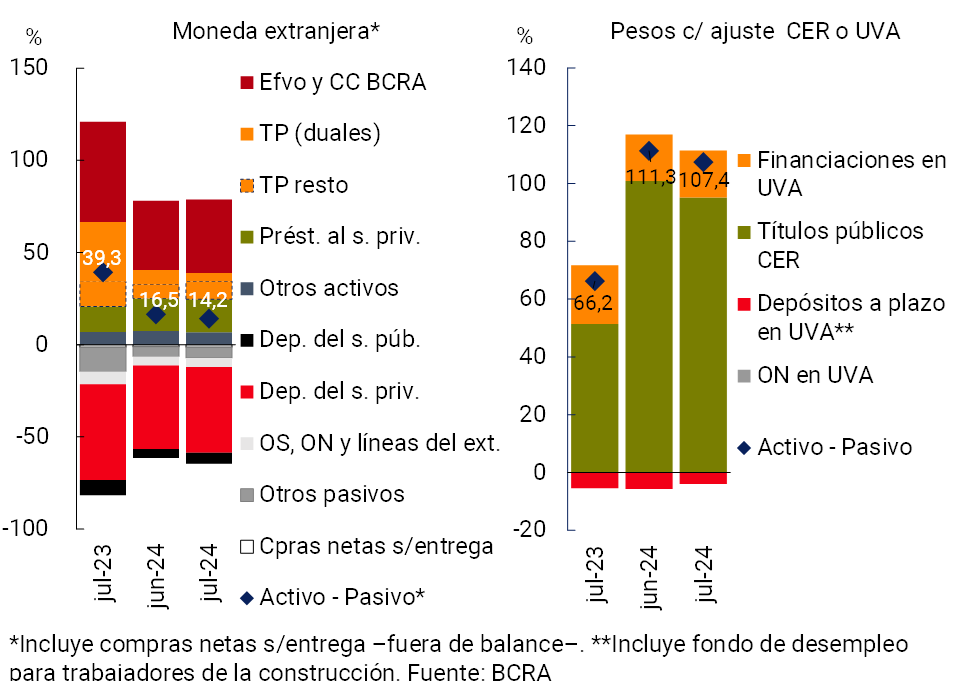
The estimated spread between assets and liabilities of the financial system denominated in foreign currency12 narrowed in July to 14.2% of the PRC (-2.3 p.p. in the month and -25.1 p.p. y.o.y., see Chart 6). Considering the items in pesos with capital adjustment by CER (or that are agreed in UVA) in both assets and liabilities, in July the aggregate positive differential totaled 107.4% of the regulatory capital of all financial institutions (-3.9 p.p. monthly and +41.2 p.p. y.o.y.).
Graph 6 | Spread between assets and liabilities
In % of PRC
III. Portfolio quality
The gross exposure of all financial institutions to the private sector grew in July, reflecting the effect of the increase in the real balance of loans to companies and households (see Section 1) and the fall in real terms of assets at the aggregate level (see Section 2).
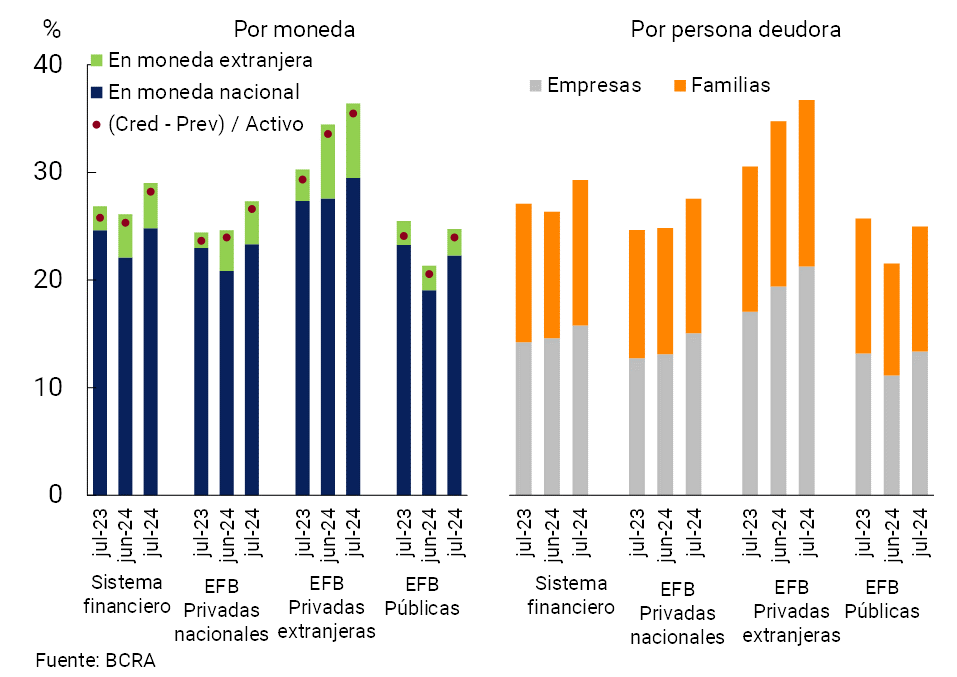
In July, the balance of total credit (in domestic and foreign currency) to the private sector increased its relevance in total assets by 2.9 p.p., to 29% (+2.2 p.p. YoY; see Figure 7). The monthly dynamics were mainly explained by the family segment. When distinguishing by currency, financing in pesos represented 24.8% of assets in July, increasing 2.7 p.p. in the month (+0.2 p.p. y.o.y.). Meanwhile, credit exposure in foreign currency increased slightly in the month (+0.2 p.p.), totaling 4.2% of assets at the aggregate level (+2 p.p. y.o.y.). The balance of total financing to the private sector net of forecasts represented 28.2% of assets in July, verifying an increase in both monthly and year-on-year terms (+2.9 p.p. monthly and +2.4 p.p. y.o.y.).
Graph 7: Credit balance to the private sector in terms of assets
In July, the irregularity ratio of credit to the private sector did not present variations in magnitude with respect to the level of June, standing at 1.7% (-0.1 p.p. monthly and -1.4 p.p. y.o.y.; see Figure 8). The NPL indicator for loans to companies stood at 0.9% (-0.1 p.p. in the month and -2 p.p. y.o.y.). For its part, the irregularity ratio of credit to households totaled 2.7% (-0.1 p.p. monthly and -0.6 p.p. y.o.y.)Question 13.
Figure 8 | Irregularity ratio of credit to the private sector – Financial system
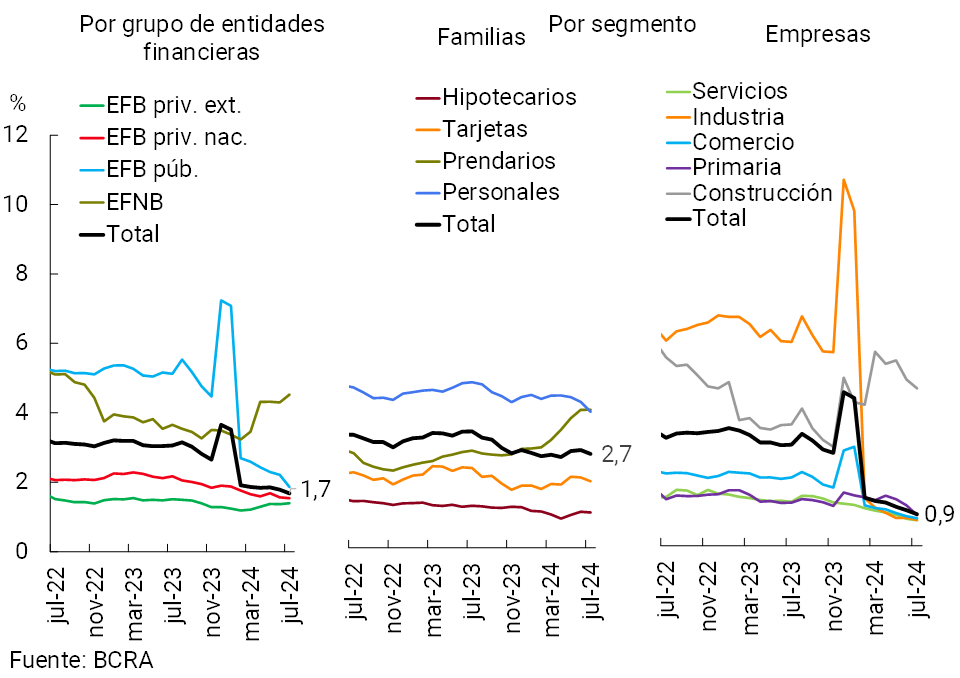
Figure 9 | Financial System Forecasting
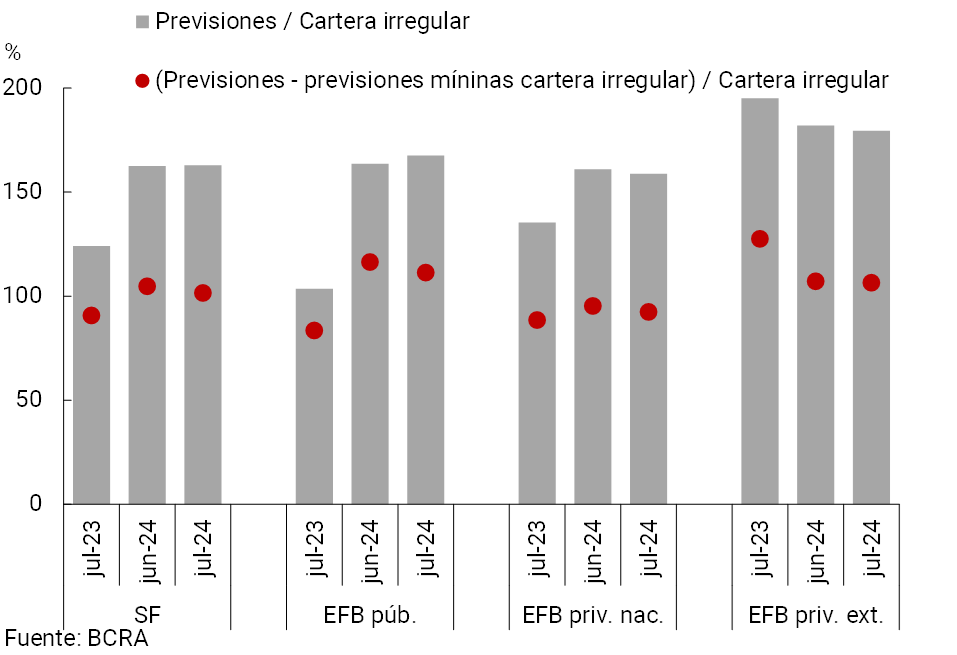
The balance of accounting forecasts represented 162.9% of the loan in an irregular situation (+0.3 p.p. monthly and +38.8 p.p. y.o.y.), exceeding 100% in all groups of banks (see Graph 9). For its part, the estimated balance of forecasts attributable to the portfolio in an irregular situation totaled 101.5% of said portfolio (-3.3 p.p. in the month and +10.8 p.p. y.o.y.)Question 14.
IV. Liquidity and solvency
In the context of the increase in financial intermediation (see Section 1), the liquidity of all institutions fell in the month from high levels. The broad liquidity indicator15 stood at 46.3% of total deposits on July16, decreasing 5.8 p.p. compared to the June level. With regard to the composition of liquid assets in pesos, during the month the active passes of the entities with the BCRA were dismantled, the Fiscal Liquidity Bills (LEFI)17 were incorporated, and the balance of National Treasury securities computed to integrate Minimum Cash and that of the accounts that the entities have in the BCRA increased. Considering only availabilities (cash balances and current accounts in the BCRA, in terms of total deposits), the liquidity indicator stood at 24.8% in July: 12.1% for items in pesos (+0.3 p.p. in the month and +5 p.p. y.a., see Chart 10)18 and 74.5% for items in foreign currency (+1.6 p.p. in the month and -4.4 p.p. y.y.).
Figure 10 | Liquidity
indicators Financial system – As % of deposits
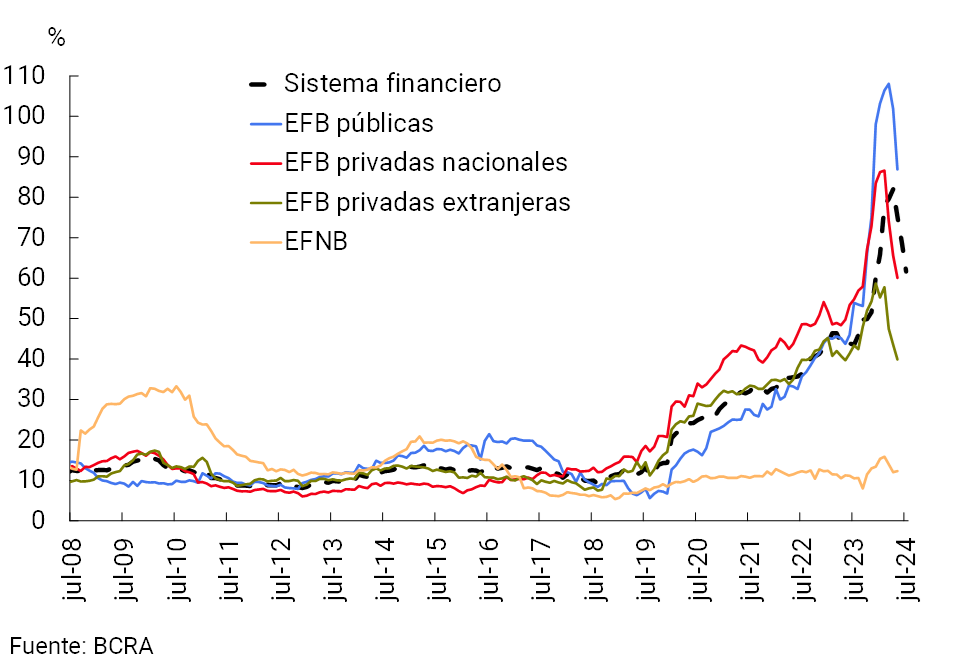
The integration of regulatory capital (RPC) of the aggregate of financial institutions totaled 35% of risk-weighted assets (RWA), 2 p.p. below the June figure (+5.9 p.p. y.o.y., see Chart 11). The monthly decline reflects the effect of the 5.2% increase in RWAs in real terms (from the increase in credit to the private sector) and a 0.4% real fall in the PRC. In July, excess regulatory capital (RPC minus minimum regulatory requirement) totaled 339% of the regulatory requirement at the systemic level and 61.6% of the balance of credit to the private sector net of provisions (well above the average of the last 10 years, of 25%). From high levels, the latter ratio has been falling in recent months in all groups of banks (see Chart 12).
Figure 11 | Capital Integration (RPC)
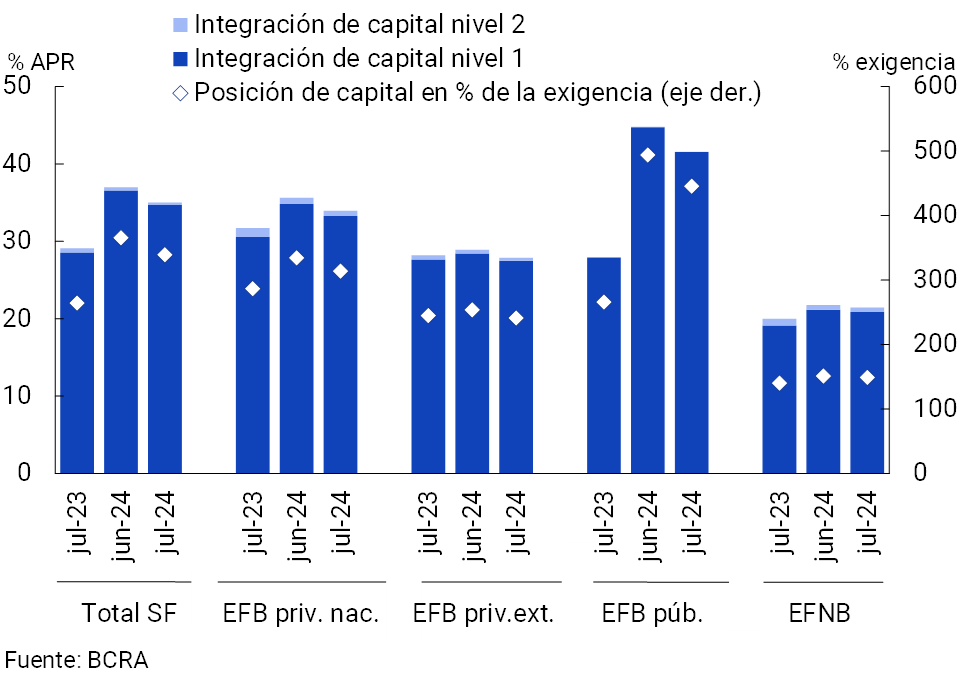
Figure 12 | Capital position in terms of credit balance to the private sector net of forecasts
Considering the accumulated of the last 12 months to July, the total comprehensive result in homogeneous currency of the financial system was equivalent to 6.9% of assets (ROA) and 28.3% of equity (ROE), levels that increased in a year-on-year comparison. In relation to the components of the income statement, this increase in ROA (or ROE) was mainly due to a higher financial margin (see Chart 13), an effect that was partially offset by increased losses due to exposure to monetary items, tax expenses, and administrative expenses.
Figure 13 | ROA of the financial
system Accumulated 12 months
V. Payment system
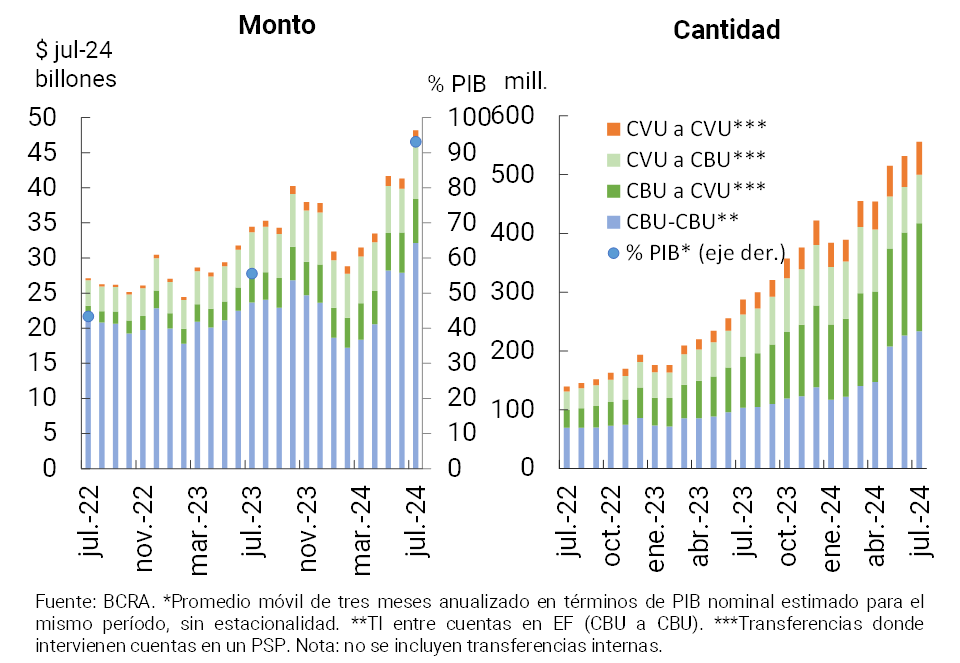
In July, immediate transfers (TI) increased 4.3% in quantities and 16.2% in real amounts (see Graph 14)19. In year-on-year terms, IT accumulated a growth of 93.3% in quantity and 42.9% in real terms in amounts, a dynamism that was mainly reflected in transactions between bank accounts (from CBU to CBU) and between accounts in payment service providers (from CVU to CVU)20 21. During the last year, the amount of IT traded continued to increase with respect to the level of aggregate production: it is estimated that the total volume of IT in the last three months (annualized) represented approximately 93.1% of GDP (+37.6 p.p. y.o.y.).
Figure 14 | Instant Transfers (TI)
Interoperable transfer payments (PCT) through QR codes increased 5.9% in amounts and 10.8% in real amounts compared to last June. In year-on-year terms, PCTs grew 268.6% in quantities and 202.1% in real amounts (see Chart 15)22.
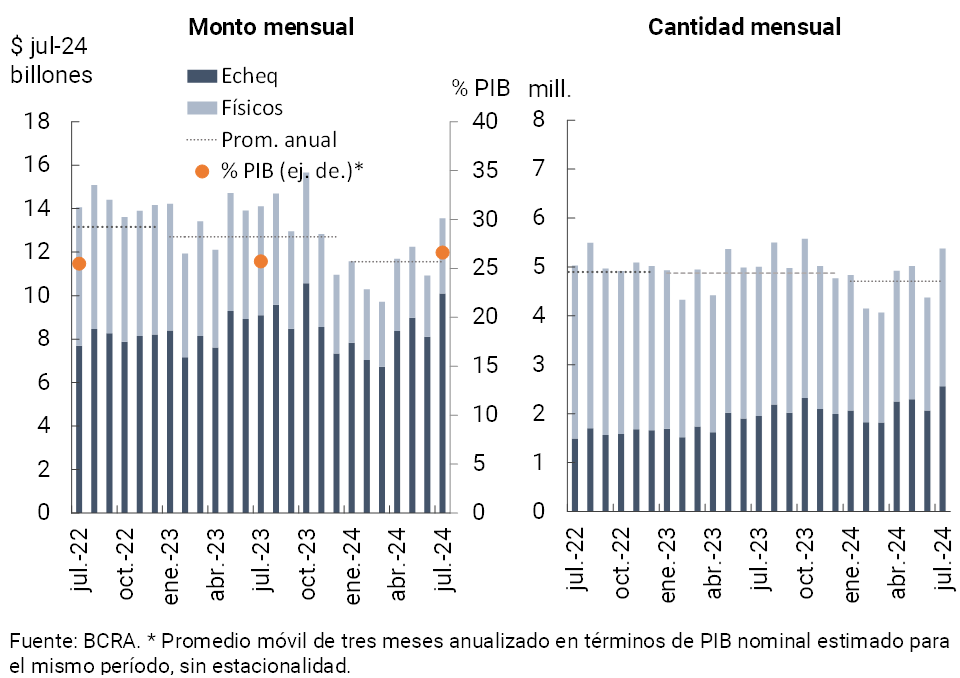
In July, the clearing of checks increased 22.9% in amounts and 24% in real values (see Graph 16)23. The Echeqs continued to consolidate, representing 47.6% of the operations in quantities (+8.6 p.p. y.o.y.) and 74.5% in real amounts terms (+10 p.p. y.o.y.) in the month. For its part, in the period, the rejection of checks due to lack of funds in terms of the total compensated reached 0.53% in amounts and 1.07% in values.
Figure 15 | Payments with transfer (PCT) through interoperable QR codes
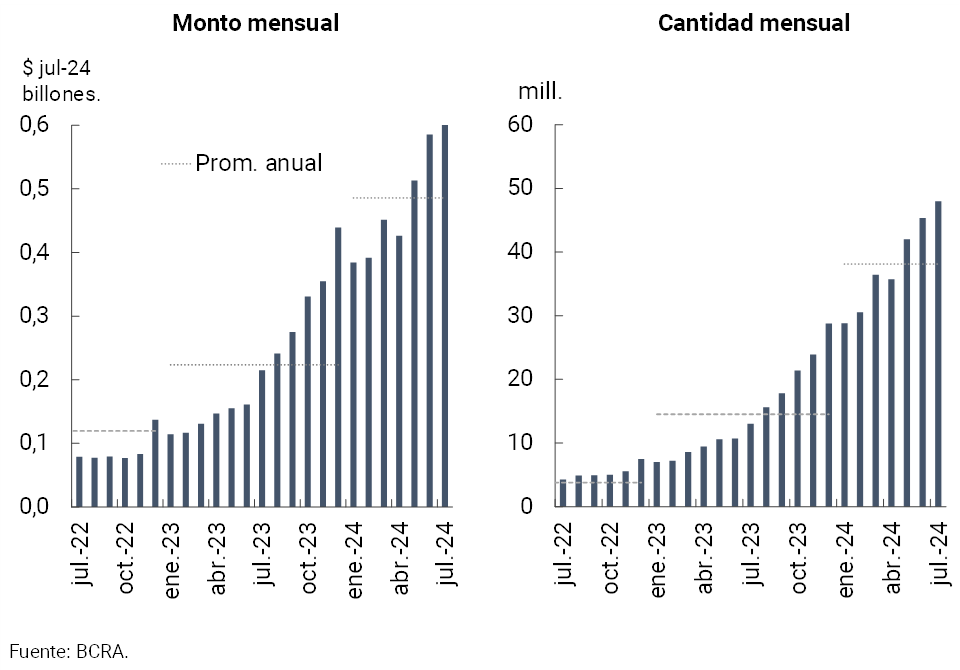
Figure 16 | Check clearing
References
1 As of July 22, the BCRA decided to suspend the operation of passive passes with financial institutions, taking a new step in the process of cleaning up the Institution’s balance sheet. The implementation of the replacement of these remunerated liabilities for the BCRA was carried out through the “Fiscal Liquidity Bills” (LEFI) issued by the Treasury, which became the main liquidity management mechanism of the financial system. LEFIs are capitalized at the monetary policy interest rate, have a maximum term of 1 year and financial institutions can only negotiate them with the BCRA at technical value. For more details see Press Release of 10/07/24 and Press Release of 23/07/24.
2 Includes principal adjustments and accrued interest.
3 In a year-on-year comparison, the balance of credit in pesos to the private sector accumulated a fall of 13.7% in real terms.
4 The balance of credit in foreign currency to the private sector increased by 72.3% YoY – in the currency of origin – in July.
5 Financing to companies is defined here as that granted to legal entities and commercial financing granted to natural persons. On the other hand, loans to families are considered to be those granted to individuals, unless they are for commercial purposes.
6 On a year-on-year basis, the real balance of total credit to the private sector decreased by 7.5% in July.
7 The fall in demand deposits was mainly explained by the performance of the non-interest-bearing segment.
8 The real balance of private sector deposits in pesos accumulated a fall of 34.8% YoY.
9 In currency of origin.
10 In year-on-year terms, the balance of total deposits (considering all currencies and sectors) fell by 25.1% in real terms.
11 For more details see footnote 1.
12 Includes off-balance sheet foreign currency forward purchase and sale operations. Liabilities include deposits that have variable remuneration depending on the evolution of the exchange rate – associated with the Export Increase Programme – and LEDIV are included in assets.
13 With regard to the segment of loans to households in UVA, the NPL ratio stood at 1.2% in July, remaining without significant variations compared to last month’s figure (-0.3 p.p. y.o.y.). The irregularity of mortgage loans in UVA to families remained at 1% in the period.
14 Corresponds to the balance of total net forecasts of the minimum regulatory forecasts for debtors in situations 1 and 2, following the criteria of the minimum regulatory forecasts for risk of uncollectibility.
15 Considers availabilities (cash and current account at the BCRA), fiscal liquidity bills (LEFI), pass operations against the BCRA, holding of BCRA instruments, and the balance of the types of public securities that the entities compute as Minimum Cash integration.
16 By adding the holding of LECAP with a residual term of less than 3 months, the broad liquidity ratio would amount to 58.5% of deposits for the financial system as a whole
17 See footnote 1 of the Report.
18 The growth in the ratio observed in recent months was largely explained by the changes made to the minimum cash regulations. For more details see TO Minimum Cash.
19 In July, transfers between bank accounts (CBU to CBU) increased their share to 41.7% of the total, with an increase of 6.1 p.p. year-on-year. Transfers from CBU to CVU also showed growth, reaching 33.3% of the total (+2.7 p.p.). Transfers between CVU accounts, although representing a smaller portion, increased their share to 10.1% (+1.3 p.p.). In contrast, CVU’s to CBU operations decreased their share to 14.9%, with a drop of 10.1 p.p. compared to the previous year.
20 Transfers between CVUs increased 120.7% (+125.7% in real amounts), and transfers between CBUs grew 126.6% (+39.9% in real amounts). On the other hand, operations between CBU and CVU registered an increase of 110.3% (+65.3% in real amounts), while those between CVU and CBU grew more moderately, 15.2% (+29.4% in real amounts).
21 In July, the average value of IT was $81.7 thousand. IT between CBUs averaged $129 thousand, followed by CVU to CBU with an average of $93.5 thousand, CBU to CVU with $32.7 thousand, and finally, IT between CVUs reached an average of $30.5 thousand.
22 In July, interoperable QR operations averaged $13 thousand.
23 In July, the average amount of cleared checks was $2.4 million ($1.2 million in the physical format and $3.8 million in ECHEQs).
Share on


