Summary
• Throughout 2017, there was a sustained growth in the financial intermediation of banks with companies and families. The financial system’s credit to the private sector saw a year-on-year increase (y.o.y.) of 22% when adjusted for inflation, this being the highest annual growth in the last 10 years. In 2017, loans to households increased 22.6% in real terms, while those channeled to companies expanded 20.8%, in both cases above previous years. Specifically in December, financing to the private sector increased 2.5% in real terms compared to November.
• Given this favorable credit performance, at the end of 2017 loans to the private sector represented 14.3% of GDP, growing 2.4 percentage points (p.p.) compared to the end of 2016. The depth of credit in the economy totaled the highest value observed in the last 16 years.
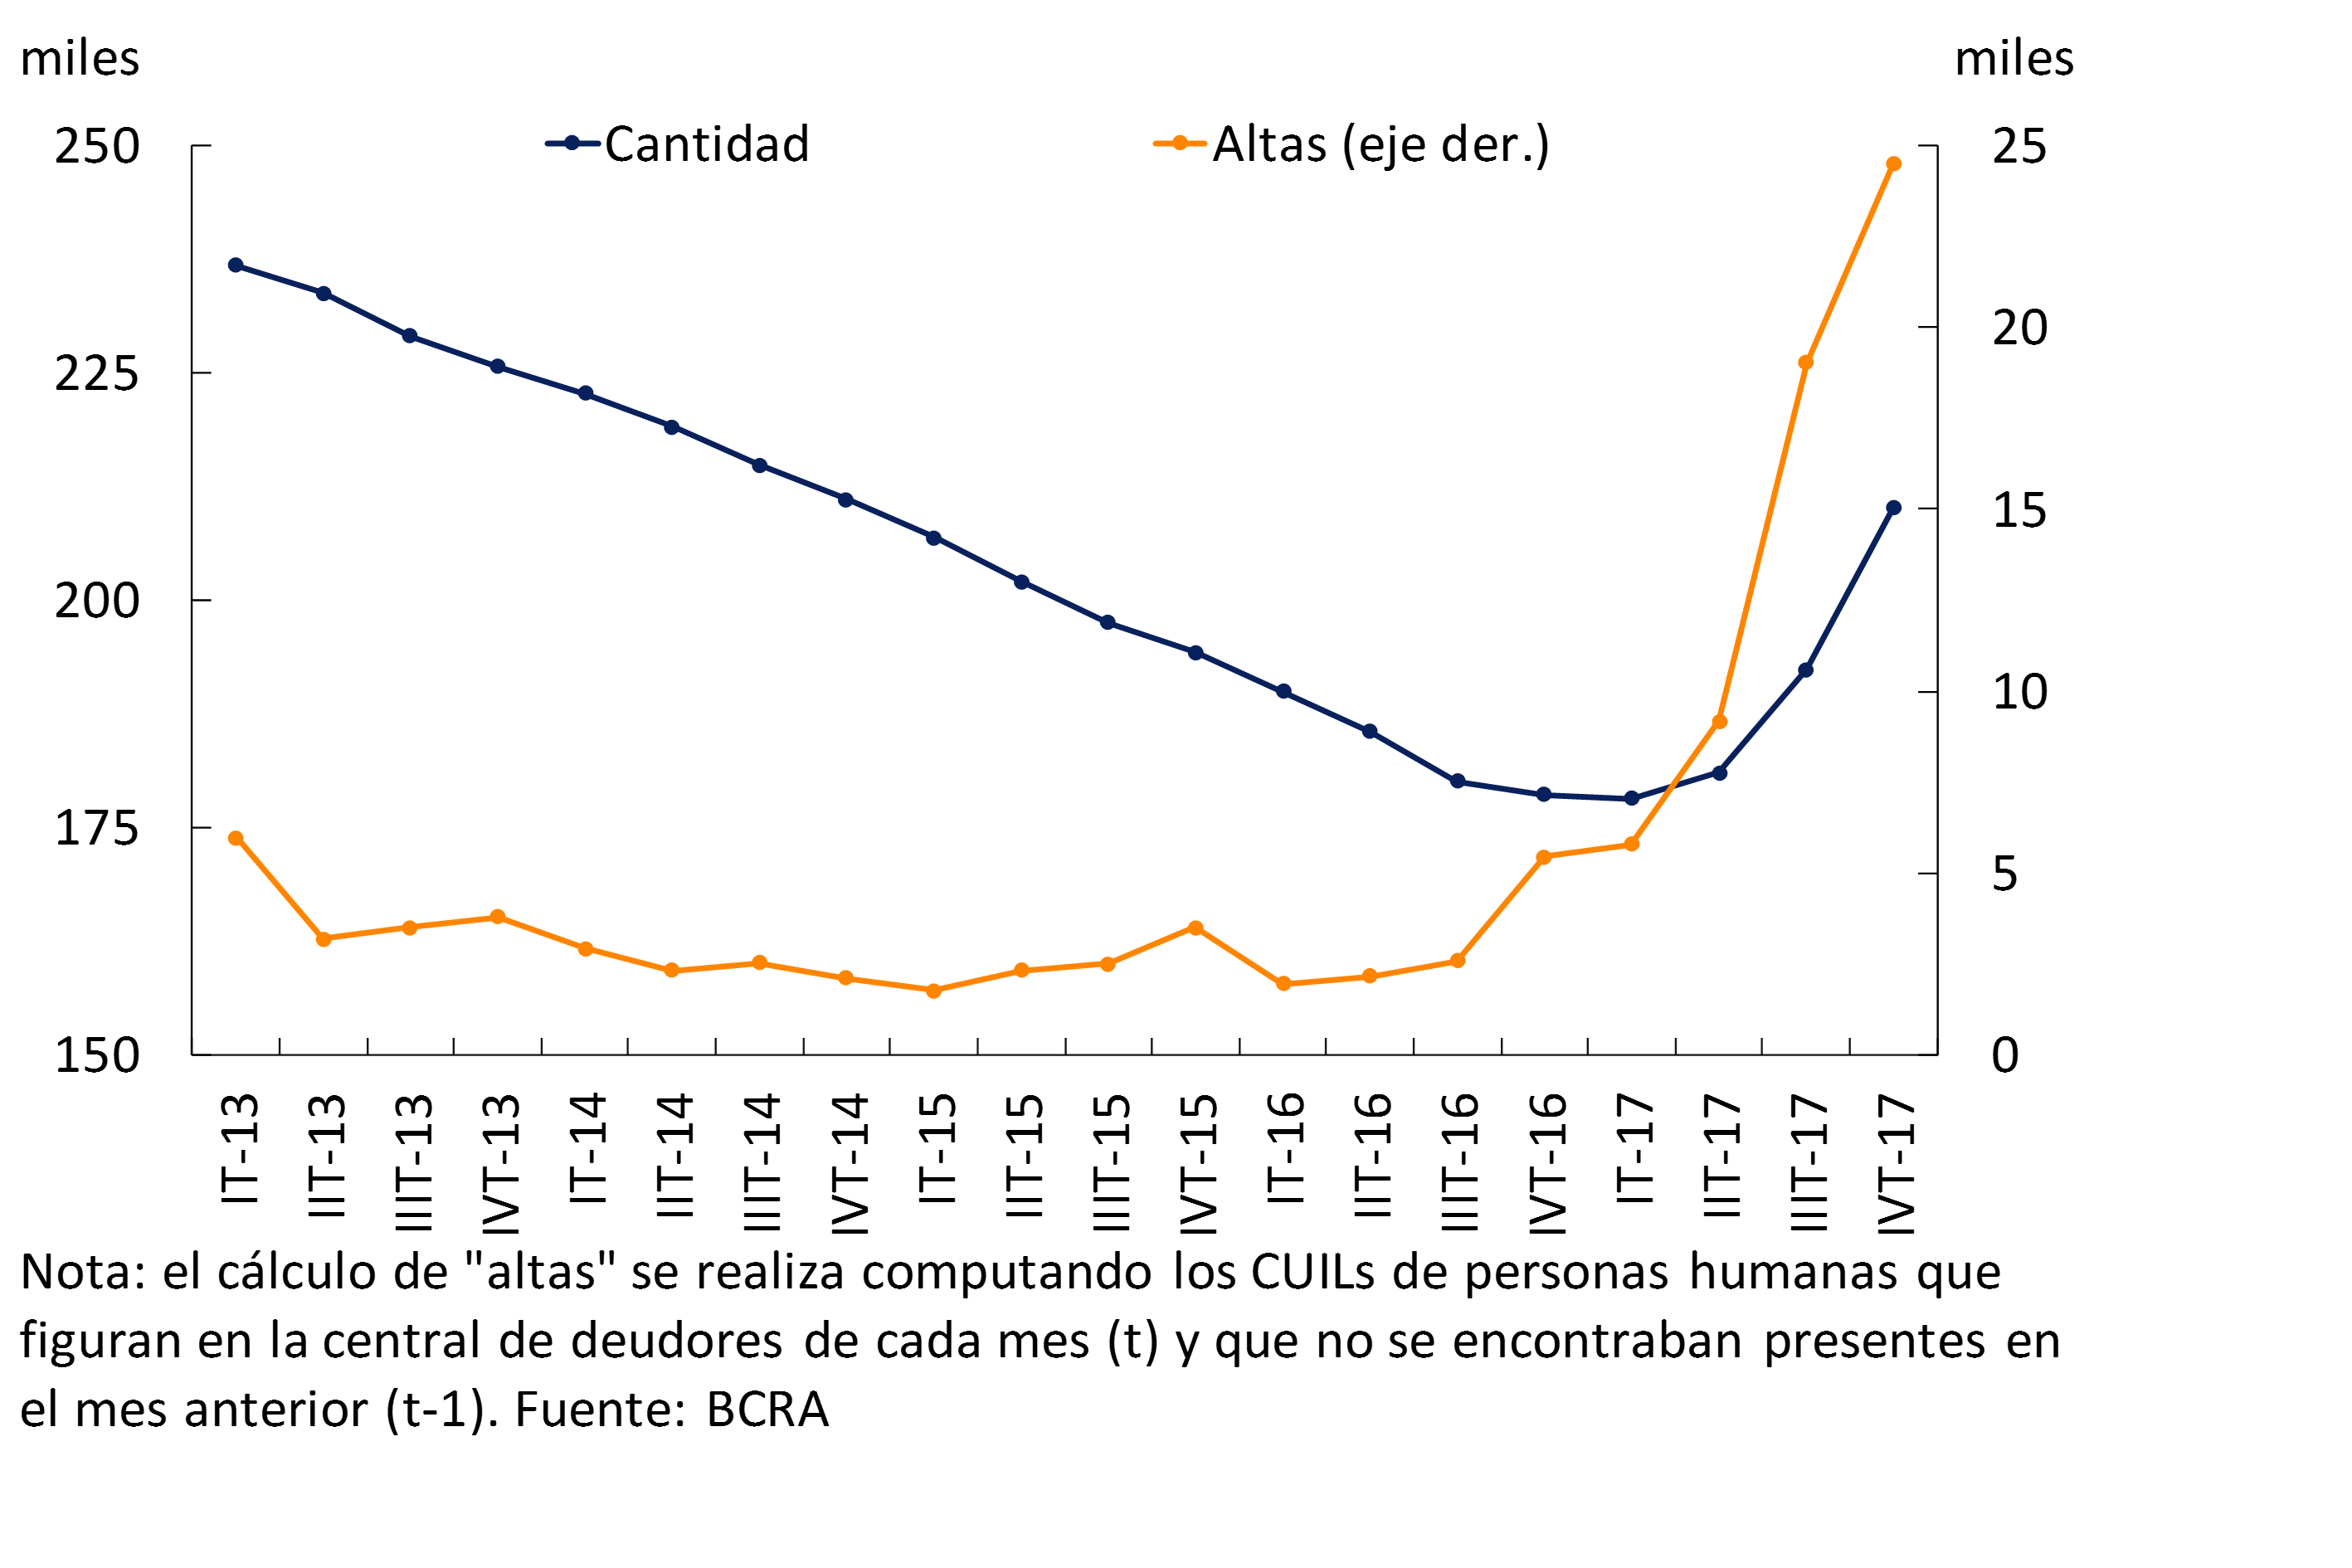
• Credit lines channeled to households were the most dynamic throughout 2017, with mortgage loans standing out, a line that accumulated an annual expansion of 148% when adjusted for inflation. In 2017, almost 58,500 new mortgage debtors (registrations) joined the local financial system , the highest level of new additions observed in recent years. As a result, a total of 210,000 individuals maintained this type of bank financing at the end of the year (almost 31,500 more than at the end of 2016 on a net basis), an amount that grew again at the beginning of 2017 after showing a decline since 2012.
• In the last month of 2017, the non-performing loan ratio to the private sector decreased slightly to 1.8%, a level similar to that of a year ago. The non-performing loan ratio to households stood at 2.9% in December, and at 1% in the case of lines to firms. At the end of 2017, all financial institutions continued to show a comfortable level of forecasting, well above regulatory requirements.
• Financial system solvency indicators remained high across all bank groups throughout 2017, with a small annual decline at the system level, mainly due to sustained expansion of credit to the private sector. The capital integration of the financial system closed 2017 at 16% of risk-weighted assets (RWA), 91% of which is made up of Tier 1 capital, resources that have the best capacity to absorb eventual losses.
• Private sector deposits in pesos increased 2.2% in real terms throughout 2017, while those in foreign currency expanded 17.5% in the period. In year-on-year terms, total deposits grew at the same rate as inflation, so they did not change in real terms. In the last month of the year, total deposits grew 5.3% in real terms, driven by those in the private sector (6.2% in real terms). The demand accounts explained the monthly increase in deposits of families and companies in both domestic currency (5% adjusted for inflation) and foreign currency (5% in currency of origin).
• The ample liquidity of the financial system – considering passes and holdings of LEBAC – fell by 6.4 p.p. throughout 2017, mainly due to the outstanding performance of credit to companies and households. In December, the broad liquidity ratio increased by 1.2 p.p. to 42.6% of deposits. This increase was mainly explained by greater operations of passes and holdings of LEBACs. Liquidity in the strictest sense – availabilities and current account at the BCRA – fell in the month to 25.2% of deposits.
• Throughout 2017, the accumulated profits of the financial system were equivalent to 3% of assets (ROA) or 25.8% of equity (ROE), these records being the lowest in the last five years. The decrease in annual profitability indicators was led by a lower financial margin (reduction in interest income from loans and gains from securities, effects tempered by the decrease in interest expenditure on deposits) and lower results for services, in a context in which the system’s administrative expenses decreased .
• The gains accrued in December by the financial system totaled 3.1% y/y of assets (26.5% y/y. of net worth), recomposing 0.9 p.p. with respect to the November level, while the group of private banks obtained gains of 3.8% y/y of assets in the same month. At the end of 2017, the financial margin of the banks as a whole totaled 11.5% of assets, 3 p.p. higher than in November, mainly due to higher gains from securities and the increase in share price differences.
I. Recent measures1
At the beginning of 2018, the National Executive Branch introduced two Decrees2 aimed, among other aspects, at achieving a higher level of financial inclusion and competition in the banking sector. On the one hand, it sought to improve the quality and credit capacity of credit subjects by more adequately specifying the definition of non-seizure of salary accounts. In addition, greater access to financial services was promoted remotely – not in person – by modifying the specific regulations on checks, bills of exchange, promissory notes and credit cards. Additionally, the possibility of making loans in UVA or UVI to finance the balance of the price of tickets for the sale of land, lots or plots or other properties already built was included. On the other hand, through Decree No. 30/2018 and its subsequent regulation by the BCRA3, the regulatory ceilings on interest rates were readjusted so that deposits are covered by the guarantee system. This measure was implemented in order to stimulate competition from financial institutions for the collection of deposits, which eventually tends towards an improvement in the remuneration for users’ savings.
In terms of foreign exchange activity, in the context of the regulation of DNU 27/18, the BCRA modified the existing regulatory framework on the activity of exchange houses, agencies and offices, with the aim of favoring a greater development of this market, leading to lower costs and greater competition. In particular, it was provided that both companies that habitually operate in the Free Exchange Market and individuals who have previously constituted a Sole Proprietorship or a Simplified Stock Company, may operate as an exchange agency with the only requirement of registering in the “Registry of Exchange Operators”4. In this way, any business will be able to add the operation with foreign currencies to its main activity, in the same way that an individual can do it.
Within the framework of technological progress in access to financial services, at the beginning of 2018 the BCRA authorized financial institutions to use mobile phone devices in their branches to promote, install and/or explain to their customers how to operate the mobile banking applications and/or mobile payment platform that the institutions have made availableto them 5.
In January 2018, the BCRA ordered the issuance and placement of Bills denominated in pesos with a maturity of 7 days (LELIQ)6. These new instruments have a secondary market restricted to financial institutions, with the CRyL being the only registration, settlement and deposit agent.
At the beginning of February7, in order to facilitate the mobility of users of financial services and therefore contribute to competition in the system, it was provided that users can cancel their accounts and other financial services at any branch of the entity.
II. Activity
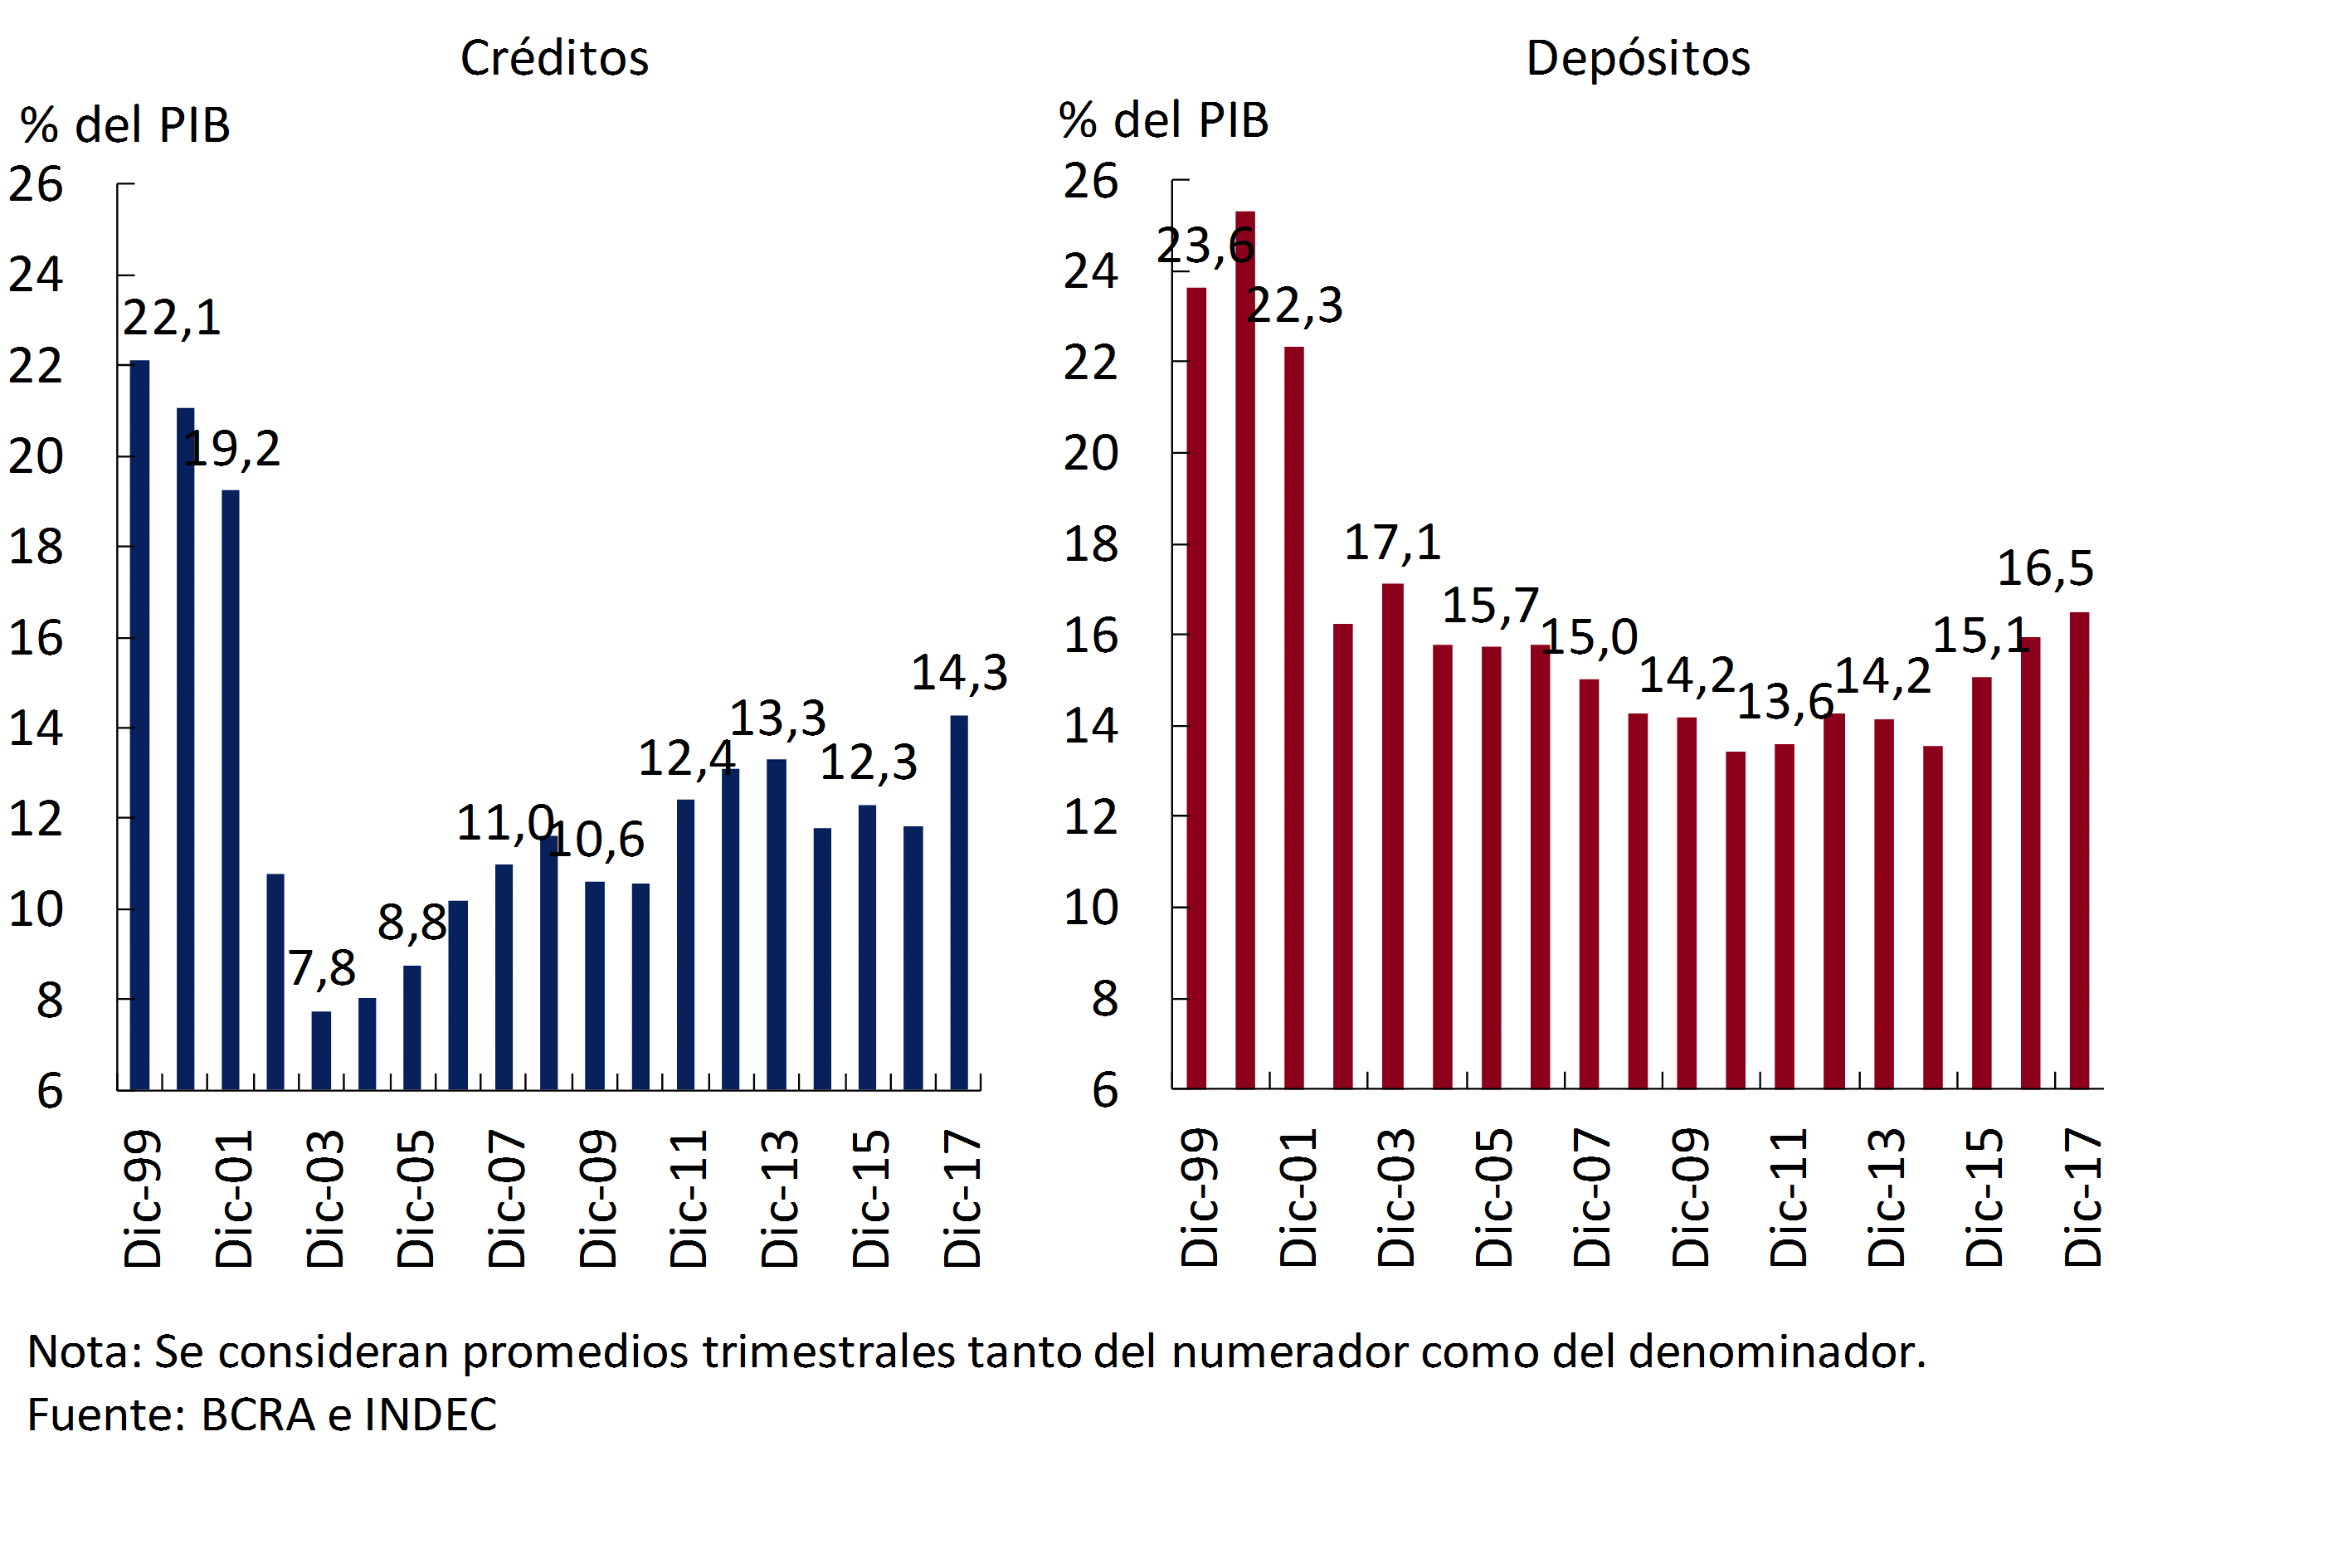
In line with what has been evidenced in recent months, in December the financial intermediation of banks with the private sector continued to grow. As a result, in 2017 loans to the private sector grew by 2.4 p.p. to 14.3% of GDP, the highest value observed in the last 16 years. The dynamism of deposits in the same sector was somewhat more moderate, increasing 0.5 p.p. of GDP in 2017 to represent 16.5% at the end of the year (see Graph 1). This last level is the highest since the beginning of 2004.
Graph 1 | Loans and Deposits in GDP Terms – Private Sector – 3-Month Moving Average
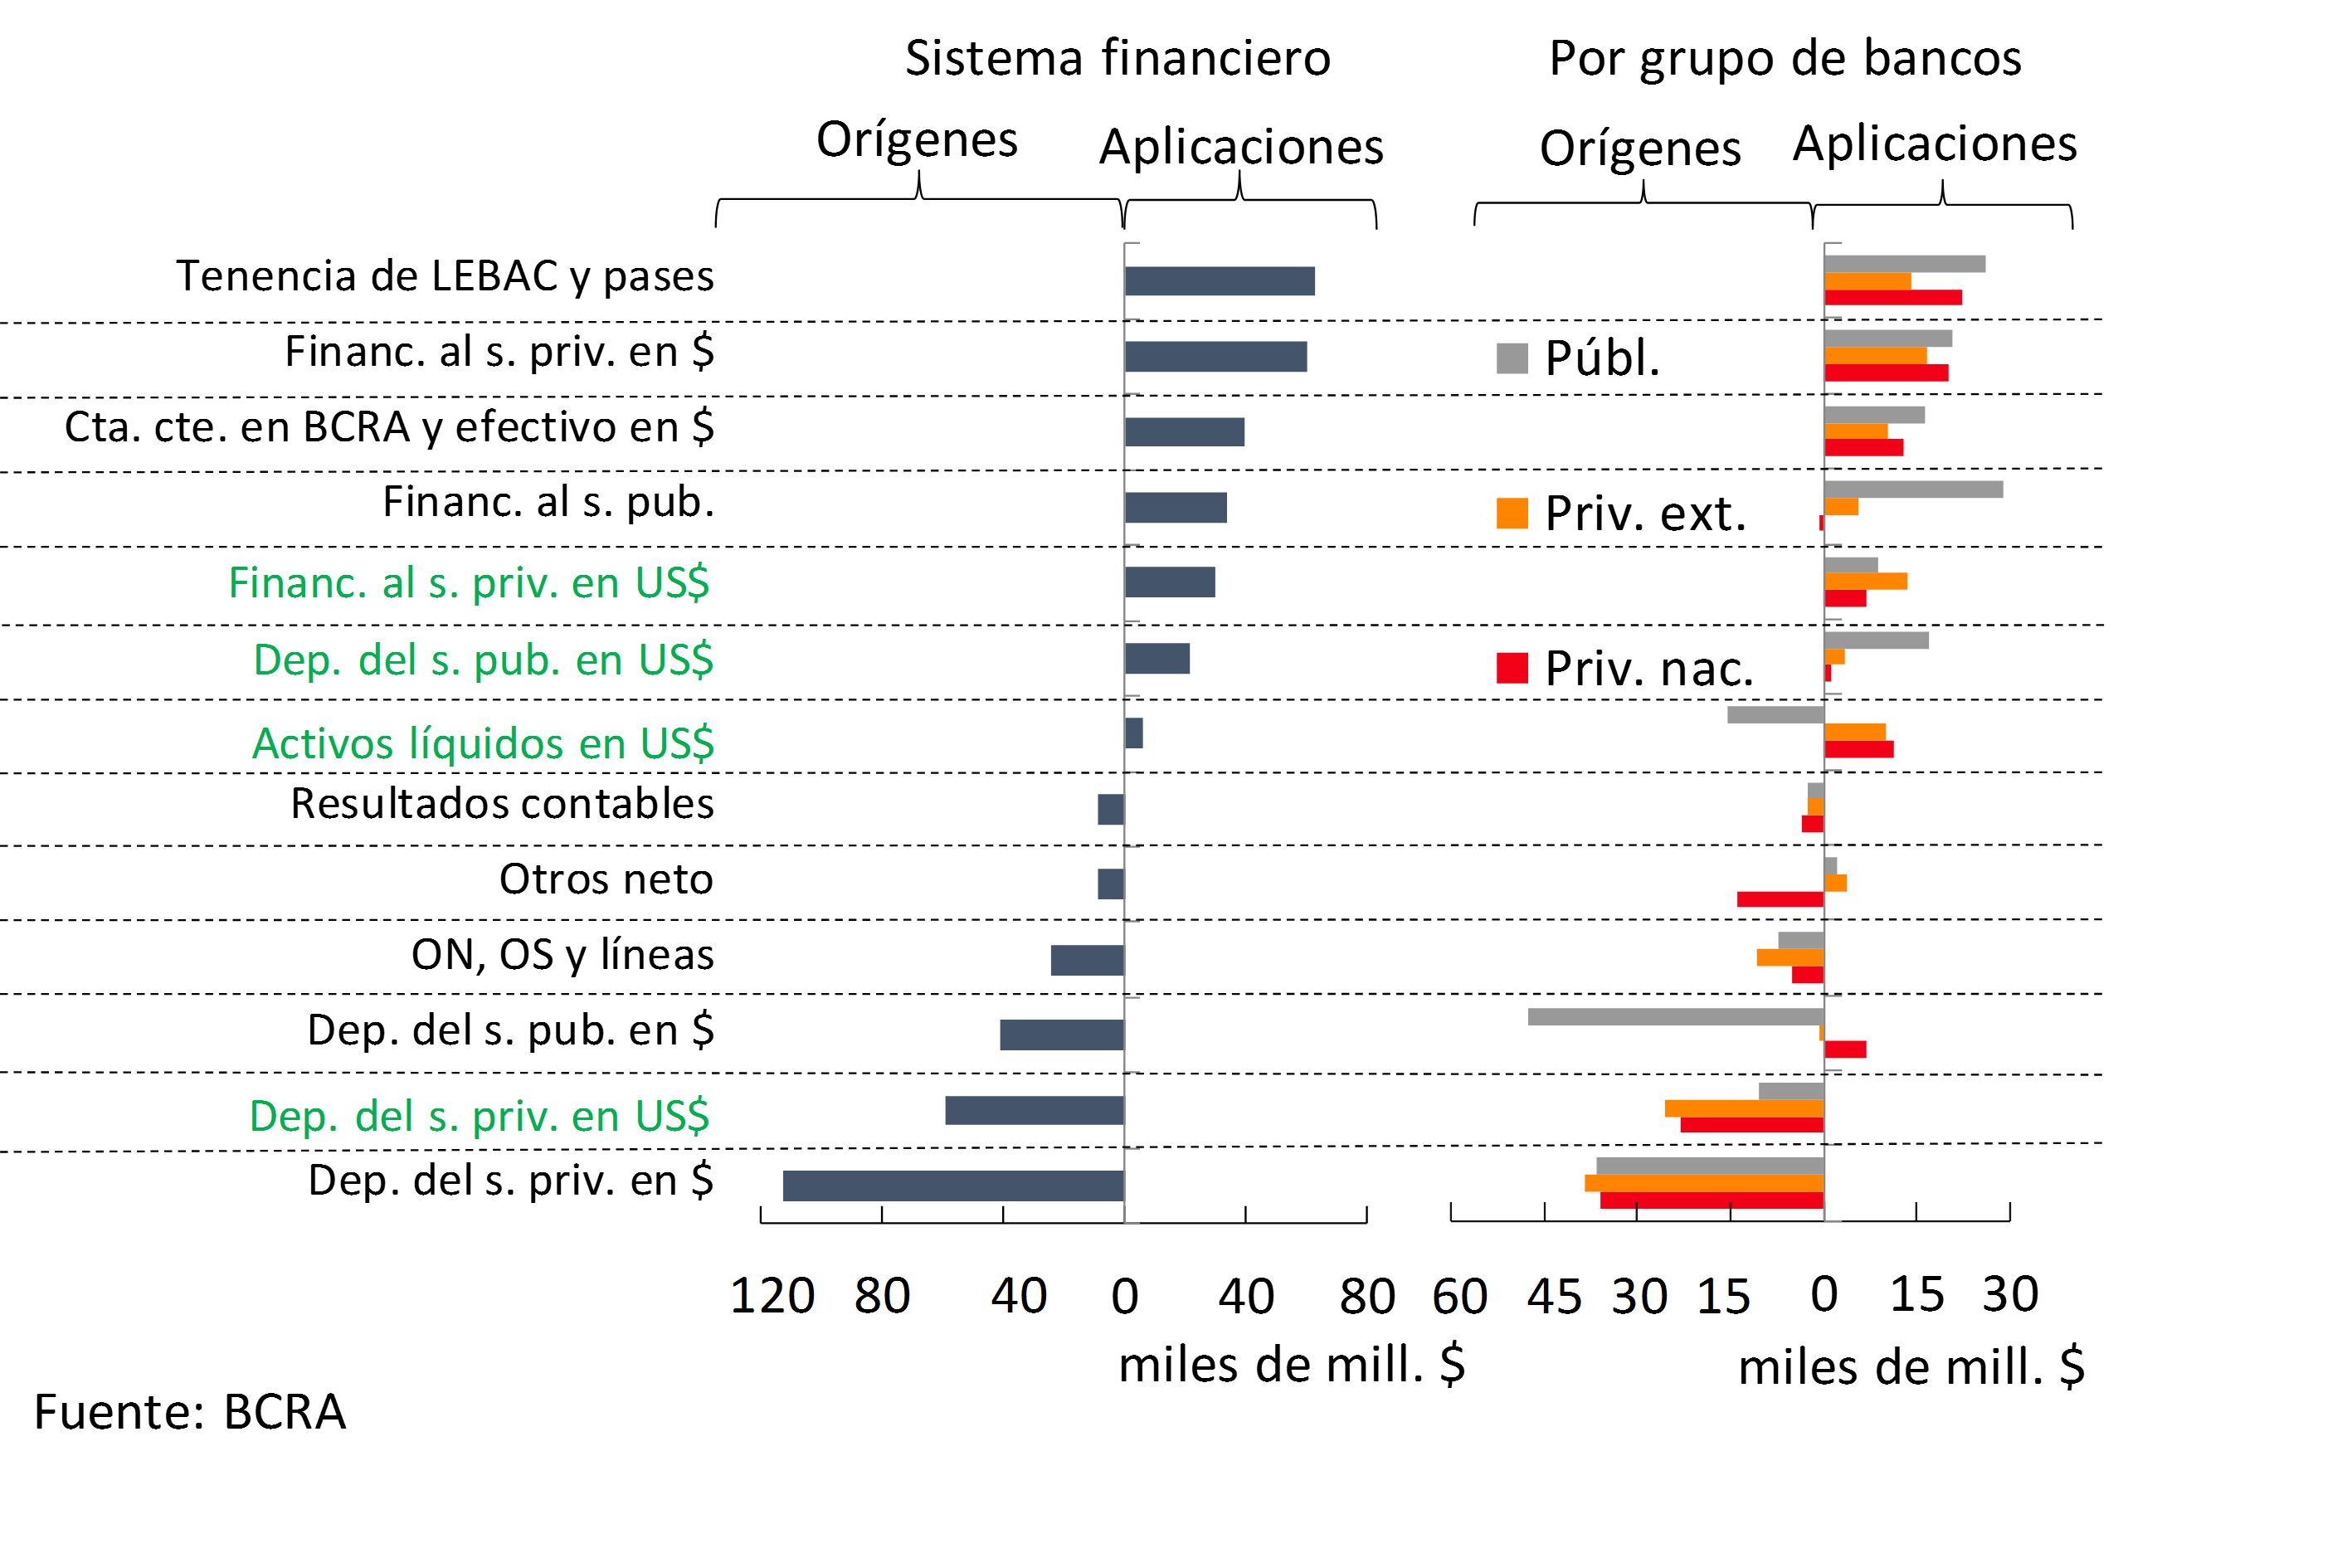
Based on the estimate of the monthly cash flow8 , in the last month of the year the increase in private sector deposits in national currency ($113,000 million) was the most prominent source of funding for the financial system (see Graph 2). These resources were mainly applied to increase the stock of LEBAC for operations of passes and holdings ($63,000 million) and to financing in pesos to the private sector ($61,000 million). On the other hand, in relation to foreign currency items, the monthly increase in deposits and loans to the private sector were the main sources and uses of bank funds, respectively.
Graph 2 | Monthly Cash Flow Estimate – Dec-17 – By Bank Group
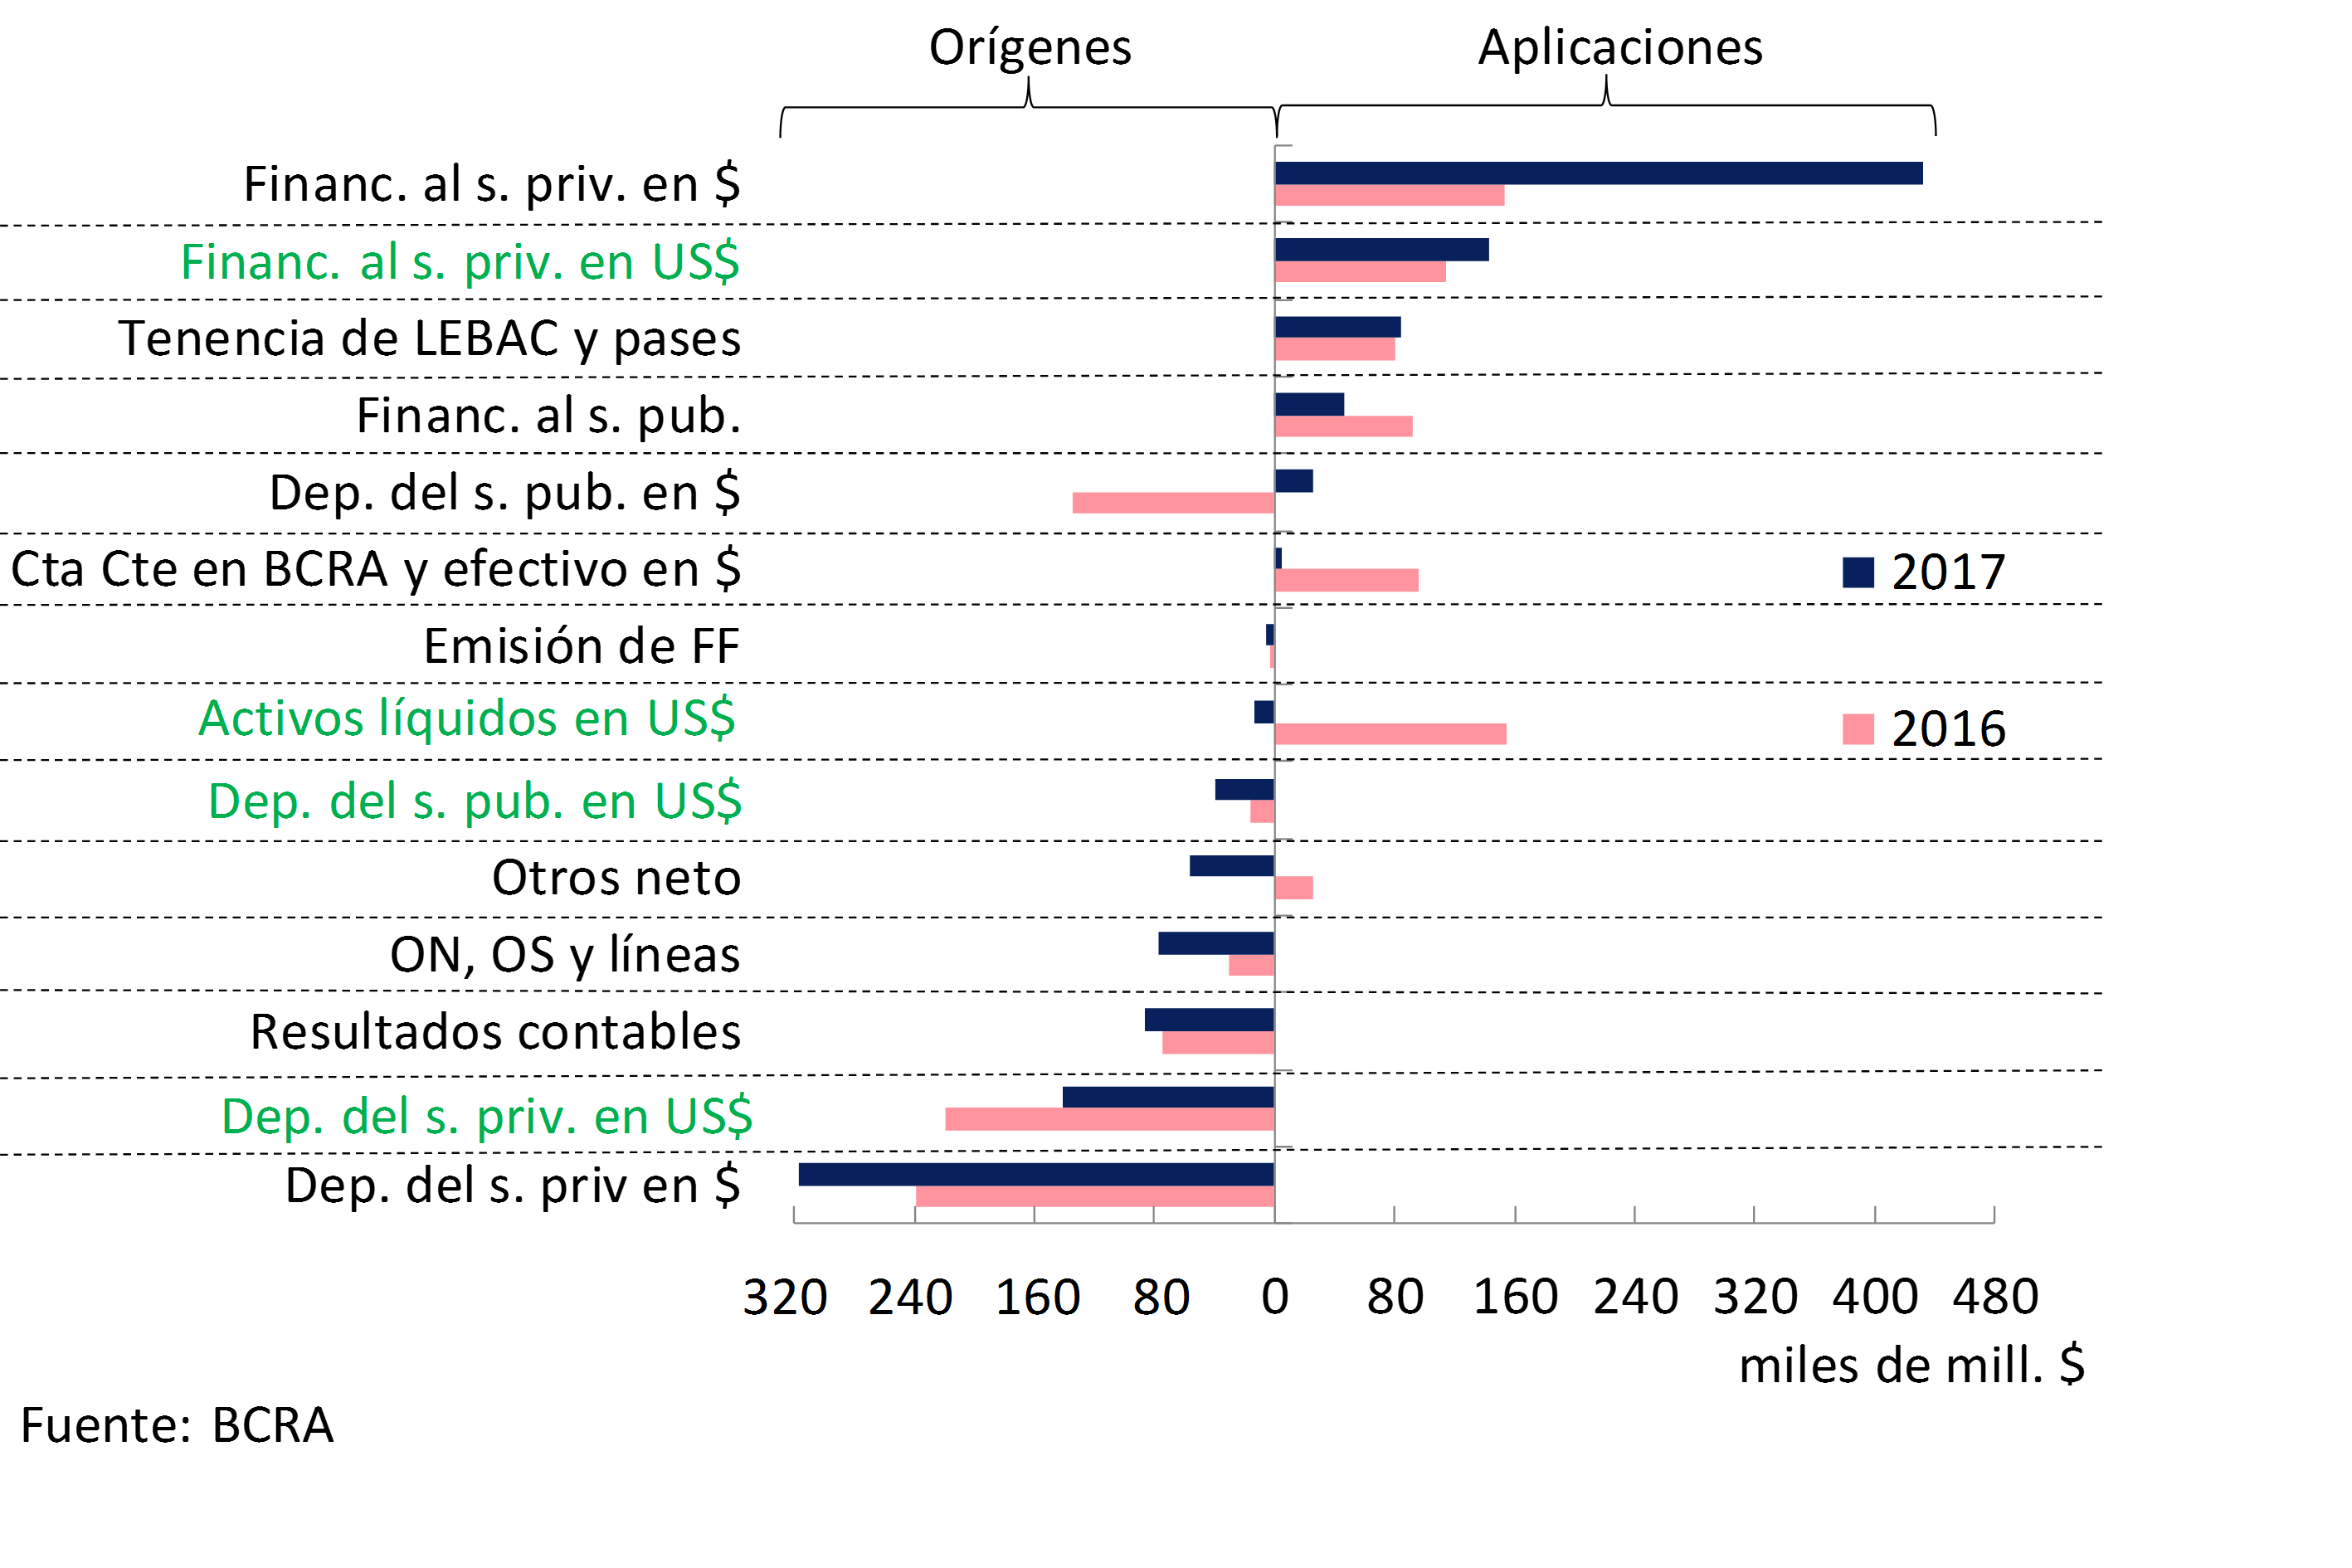
Given the outstanding performance of financial intermediation with the private sector, the estimated flow of funds for 2017 ended with deposits and loans to the private sector as the main sources and applications of resources, respectively, both considering the balance denominated in pesos and in foreign currency (see Chart 3). Thus, in the year private sector deposits in national currency nominally grew by $317,000 million (32.8% more than a year ago). Meanwhile, financing in pesos to families and companies accumulated a year-on-year increase of $432,000 million (183% more than what was evidenced in 2016) to December. For its part, the annual increase in private sector deposits in dollars totaled US$3,900 million, while the increase in financing to the same sector in that denomination accumulated a growth of US$6,100 million in the last year.
Graph 3 | Annual Cash Flow Estimate – Financial System
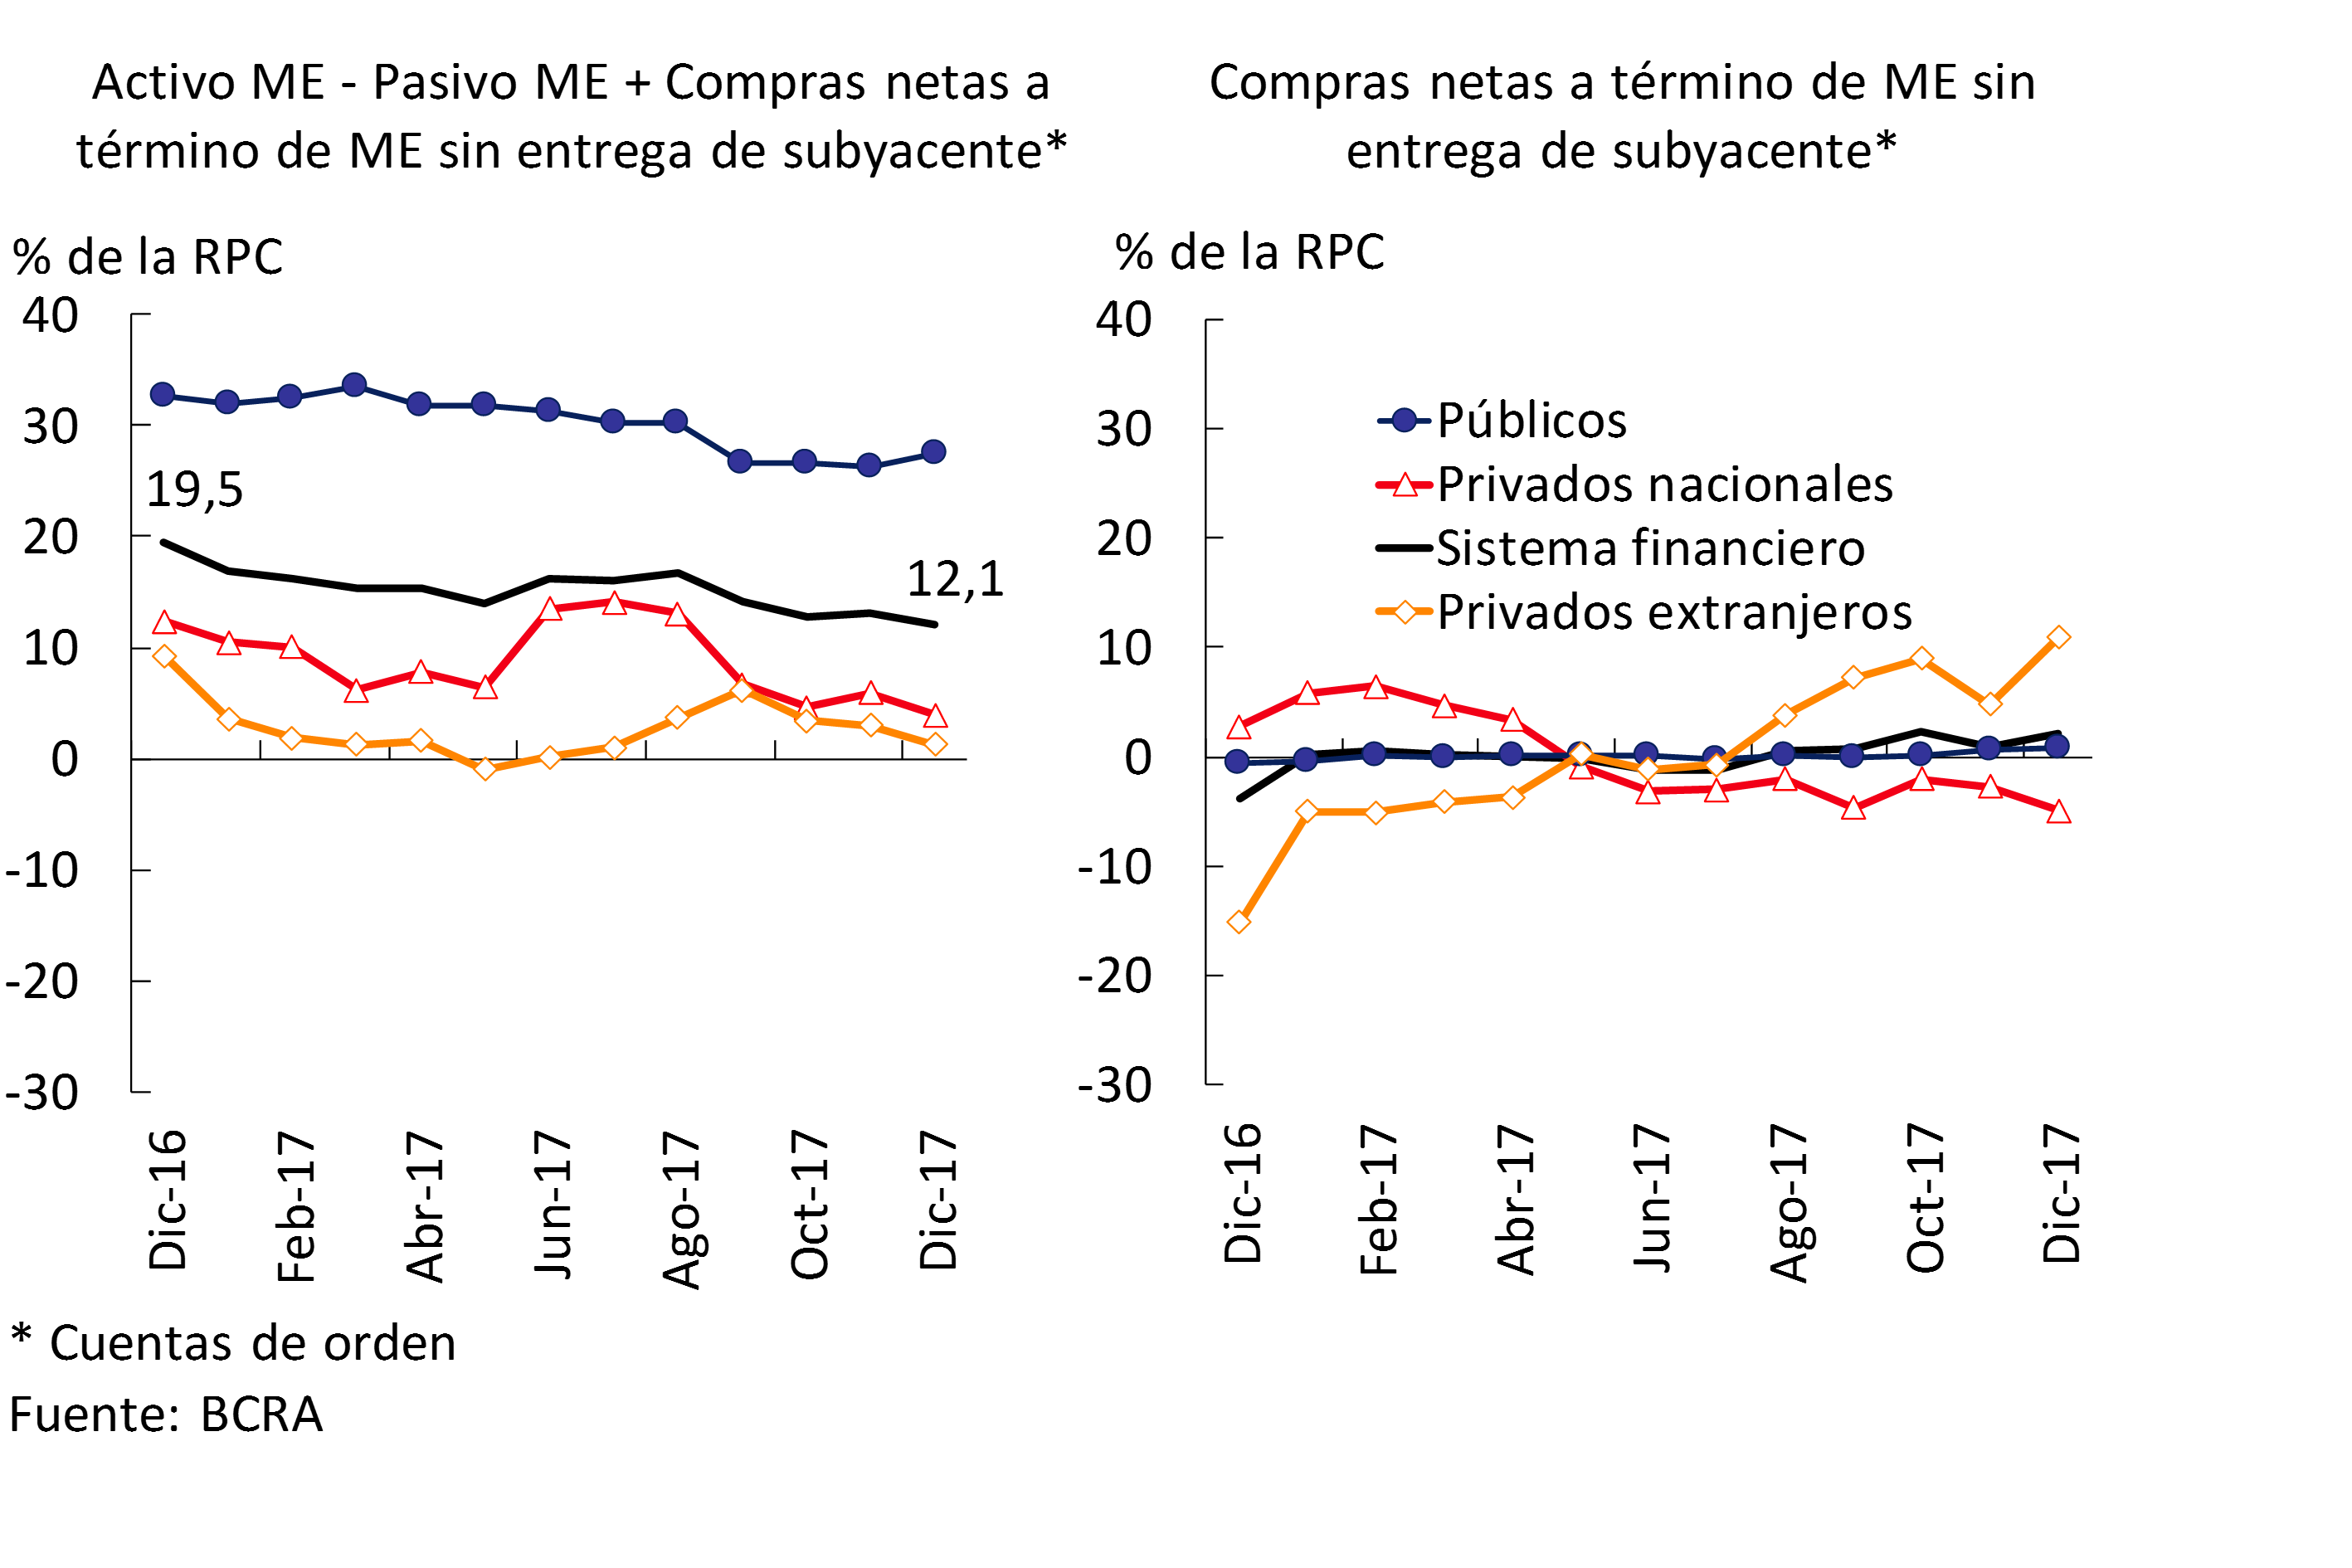
Against a backdrop of sustained growth in financial intermediation, in 2017 the various equity mismatches of banks are at reasonable levels. On the one hand, given the marked dynamism of UVA loans in recent months, the spread between inflation-adjustable assets and liabilities in relation to regulatory capital began to increase slightly in the banks as a whole, currently standing at approximately 34% of the PRC (9.5% in the case of private banks). On the other hand, the net position purchased in foreign currency represented 12.1% of the PRC (Computable Patrimonial Responsibility) in December, almost 1 p.p. below the November figure (see Chart 4). In a year-on-year comparison, this indicator fell by 7.4 p.p. from the PRC, thus reaching a historically low level.
Figure 4 | Foreign Currency Mismatch
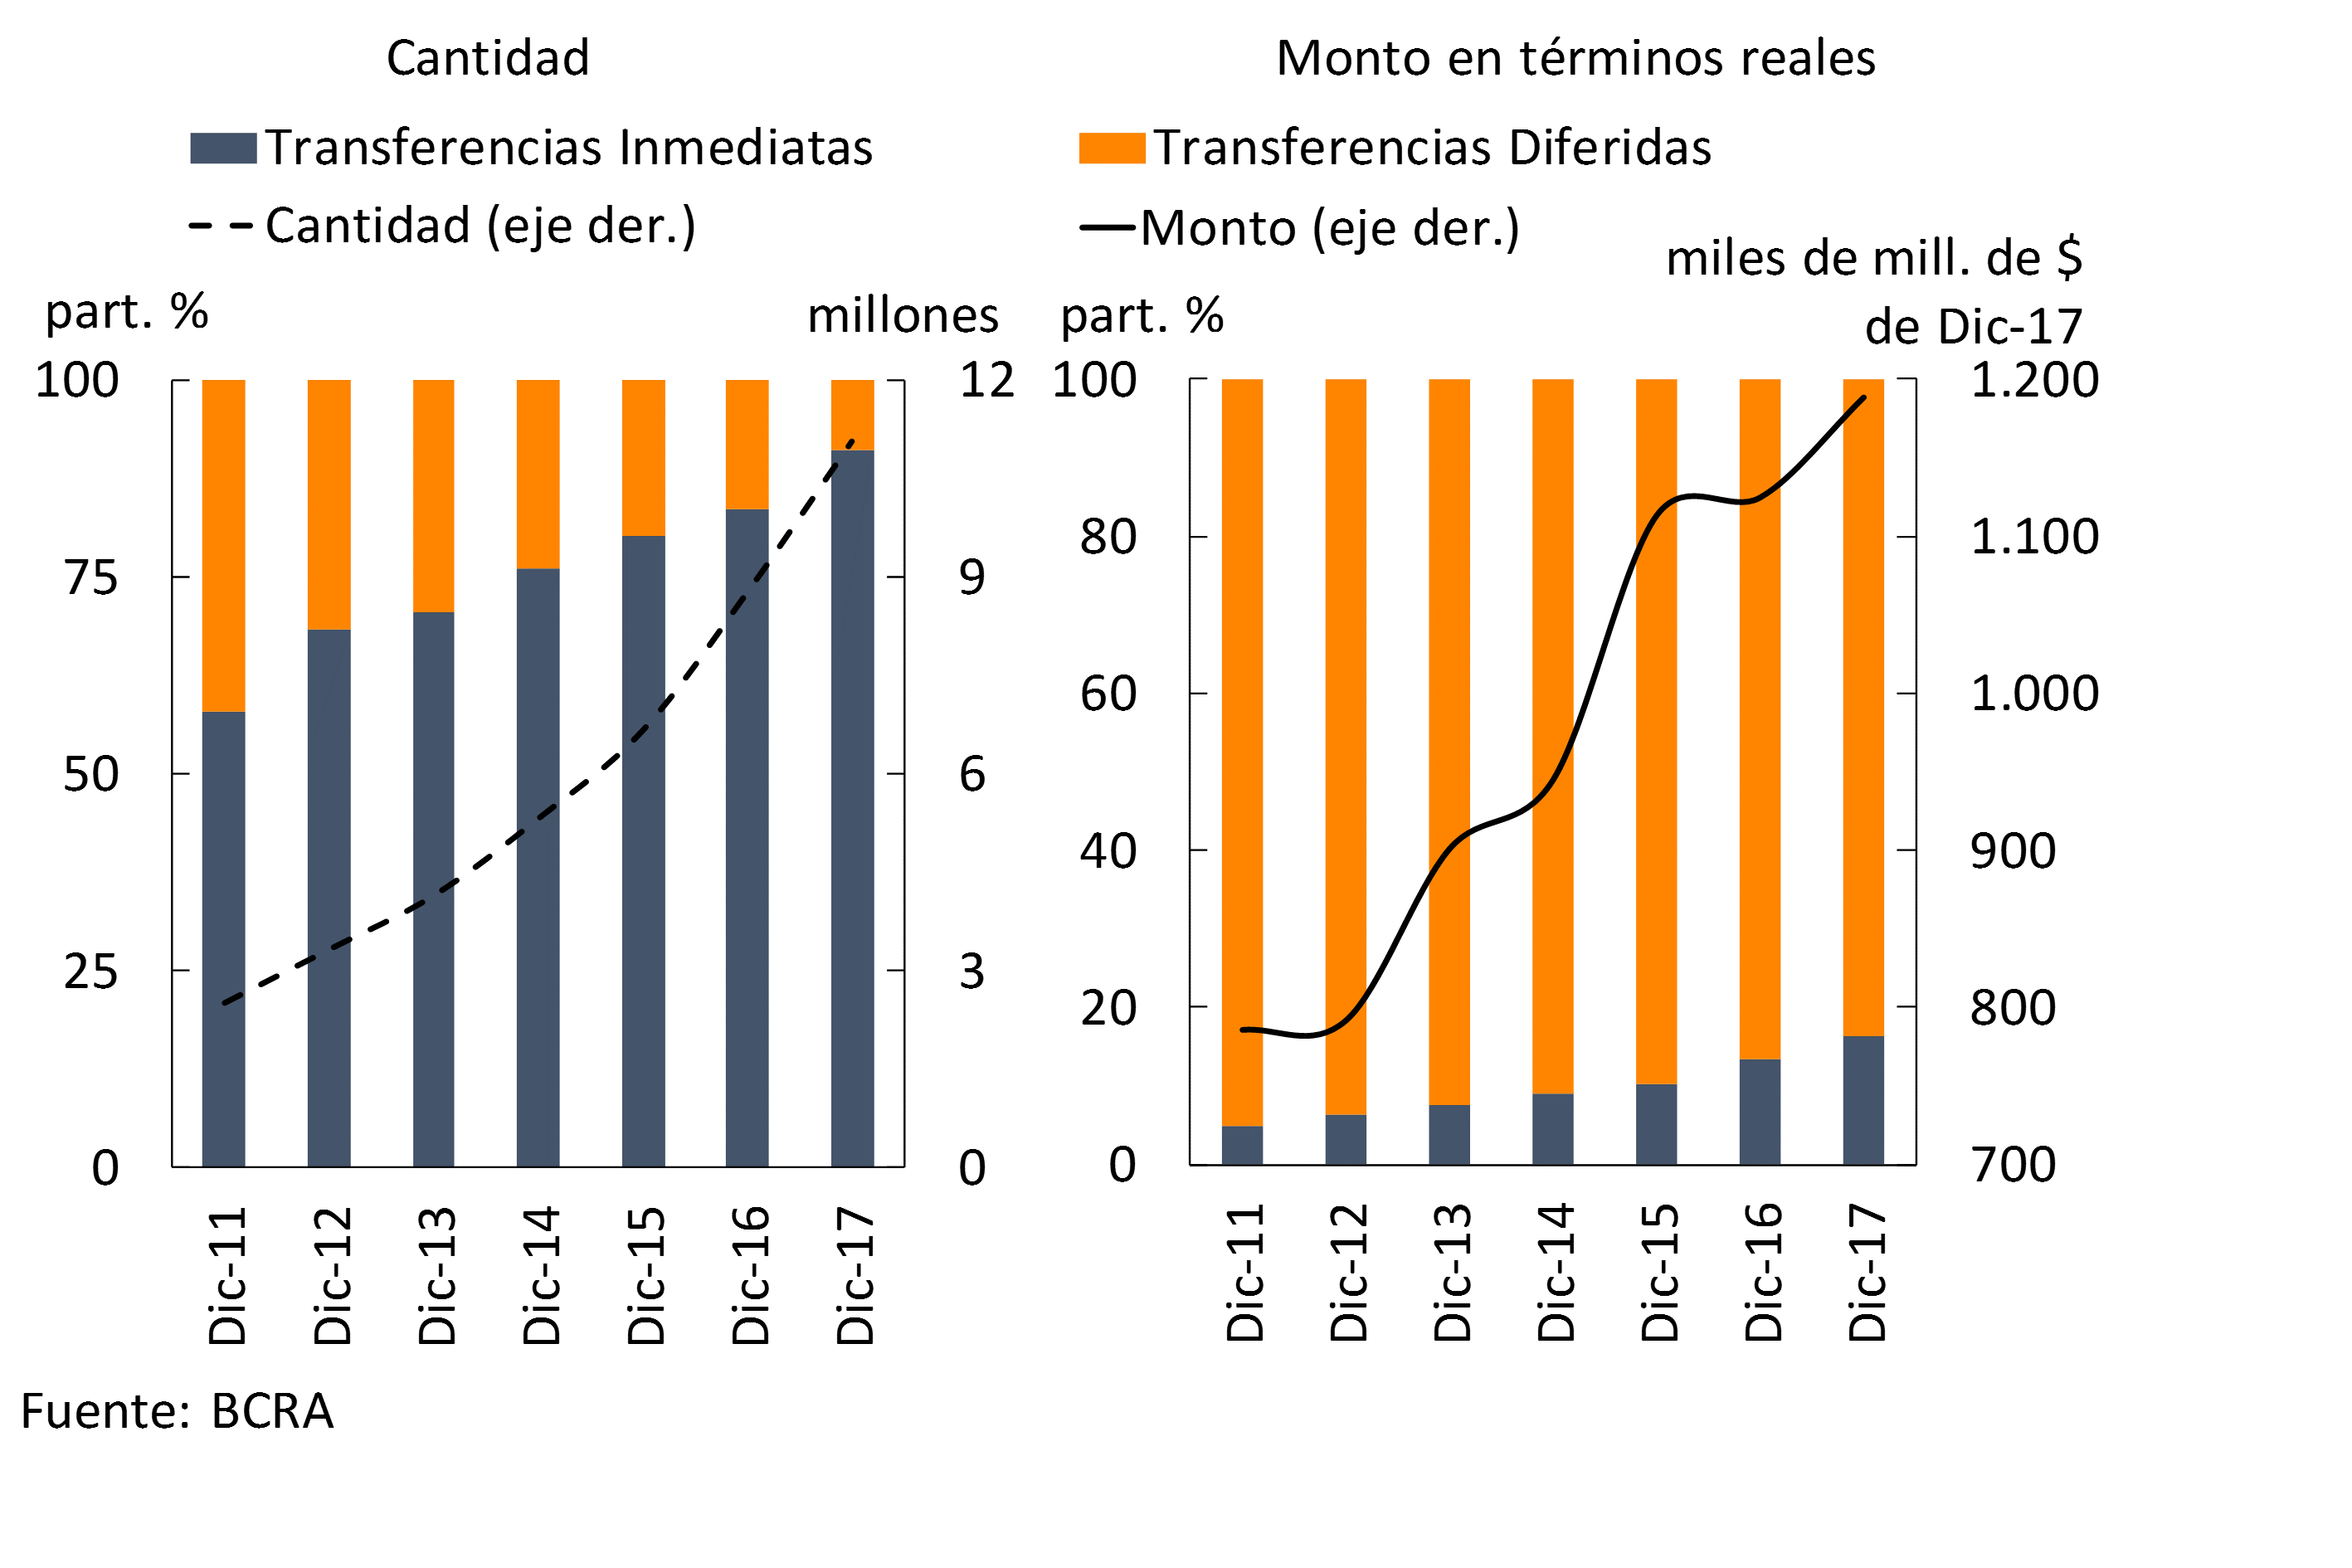
In 2017, the use of electronic means of payment alternative to cash continued to gain share. The performance of electronic transfers to third parties is remarkable, mainly driven by those with immediate accreditation. The latter continued to gain weight over deferred collection transactions, accounting for about 91% of the transactions carried out in December (7.4 p.p. more than a year ago), equivalent to 16.4% of the total amount traded in the month (2.9 p.p. more than at the end of 2016) (see Graph 5). As for the channels through which transfers are made, currently almost 1 in 10 immediate transfers is made from mobile banking, showing a growing trend. ATMs slightly reduced their relative weight, accounting for approximately 2 out of 10 of the aforementioned operations. Most of these types of operations are still carried out through traditional electronic banking or home banking (almost 7 out of 10 transfers).
Graph 5 | Transfers of Funds to Third Parties
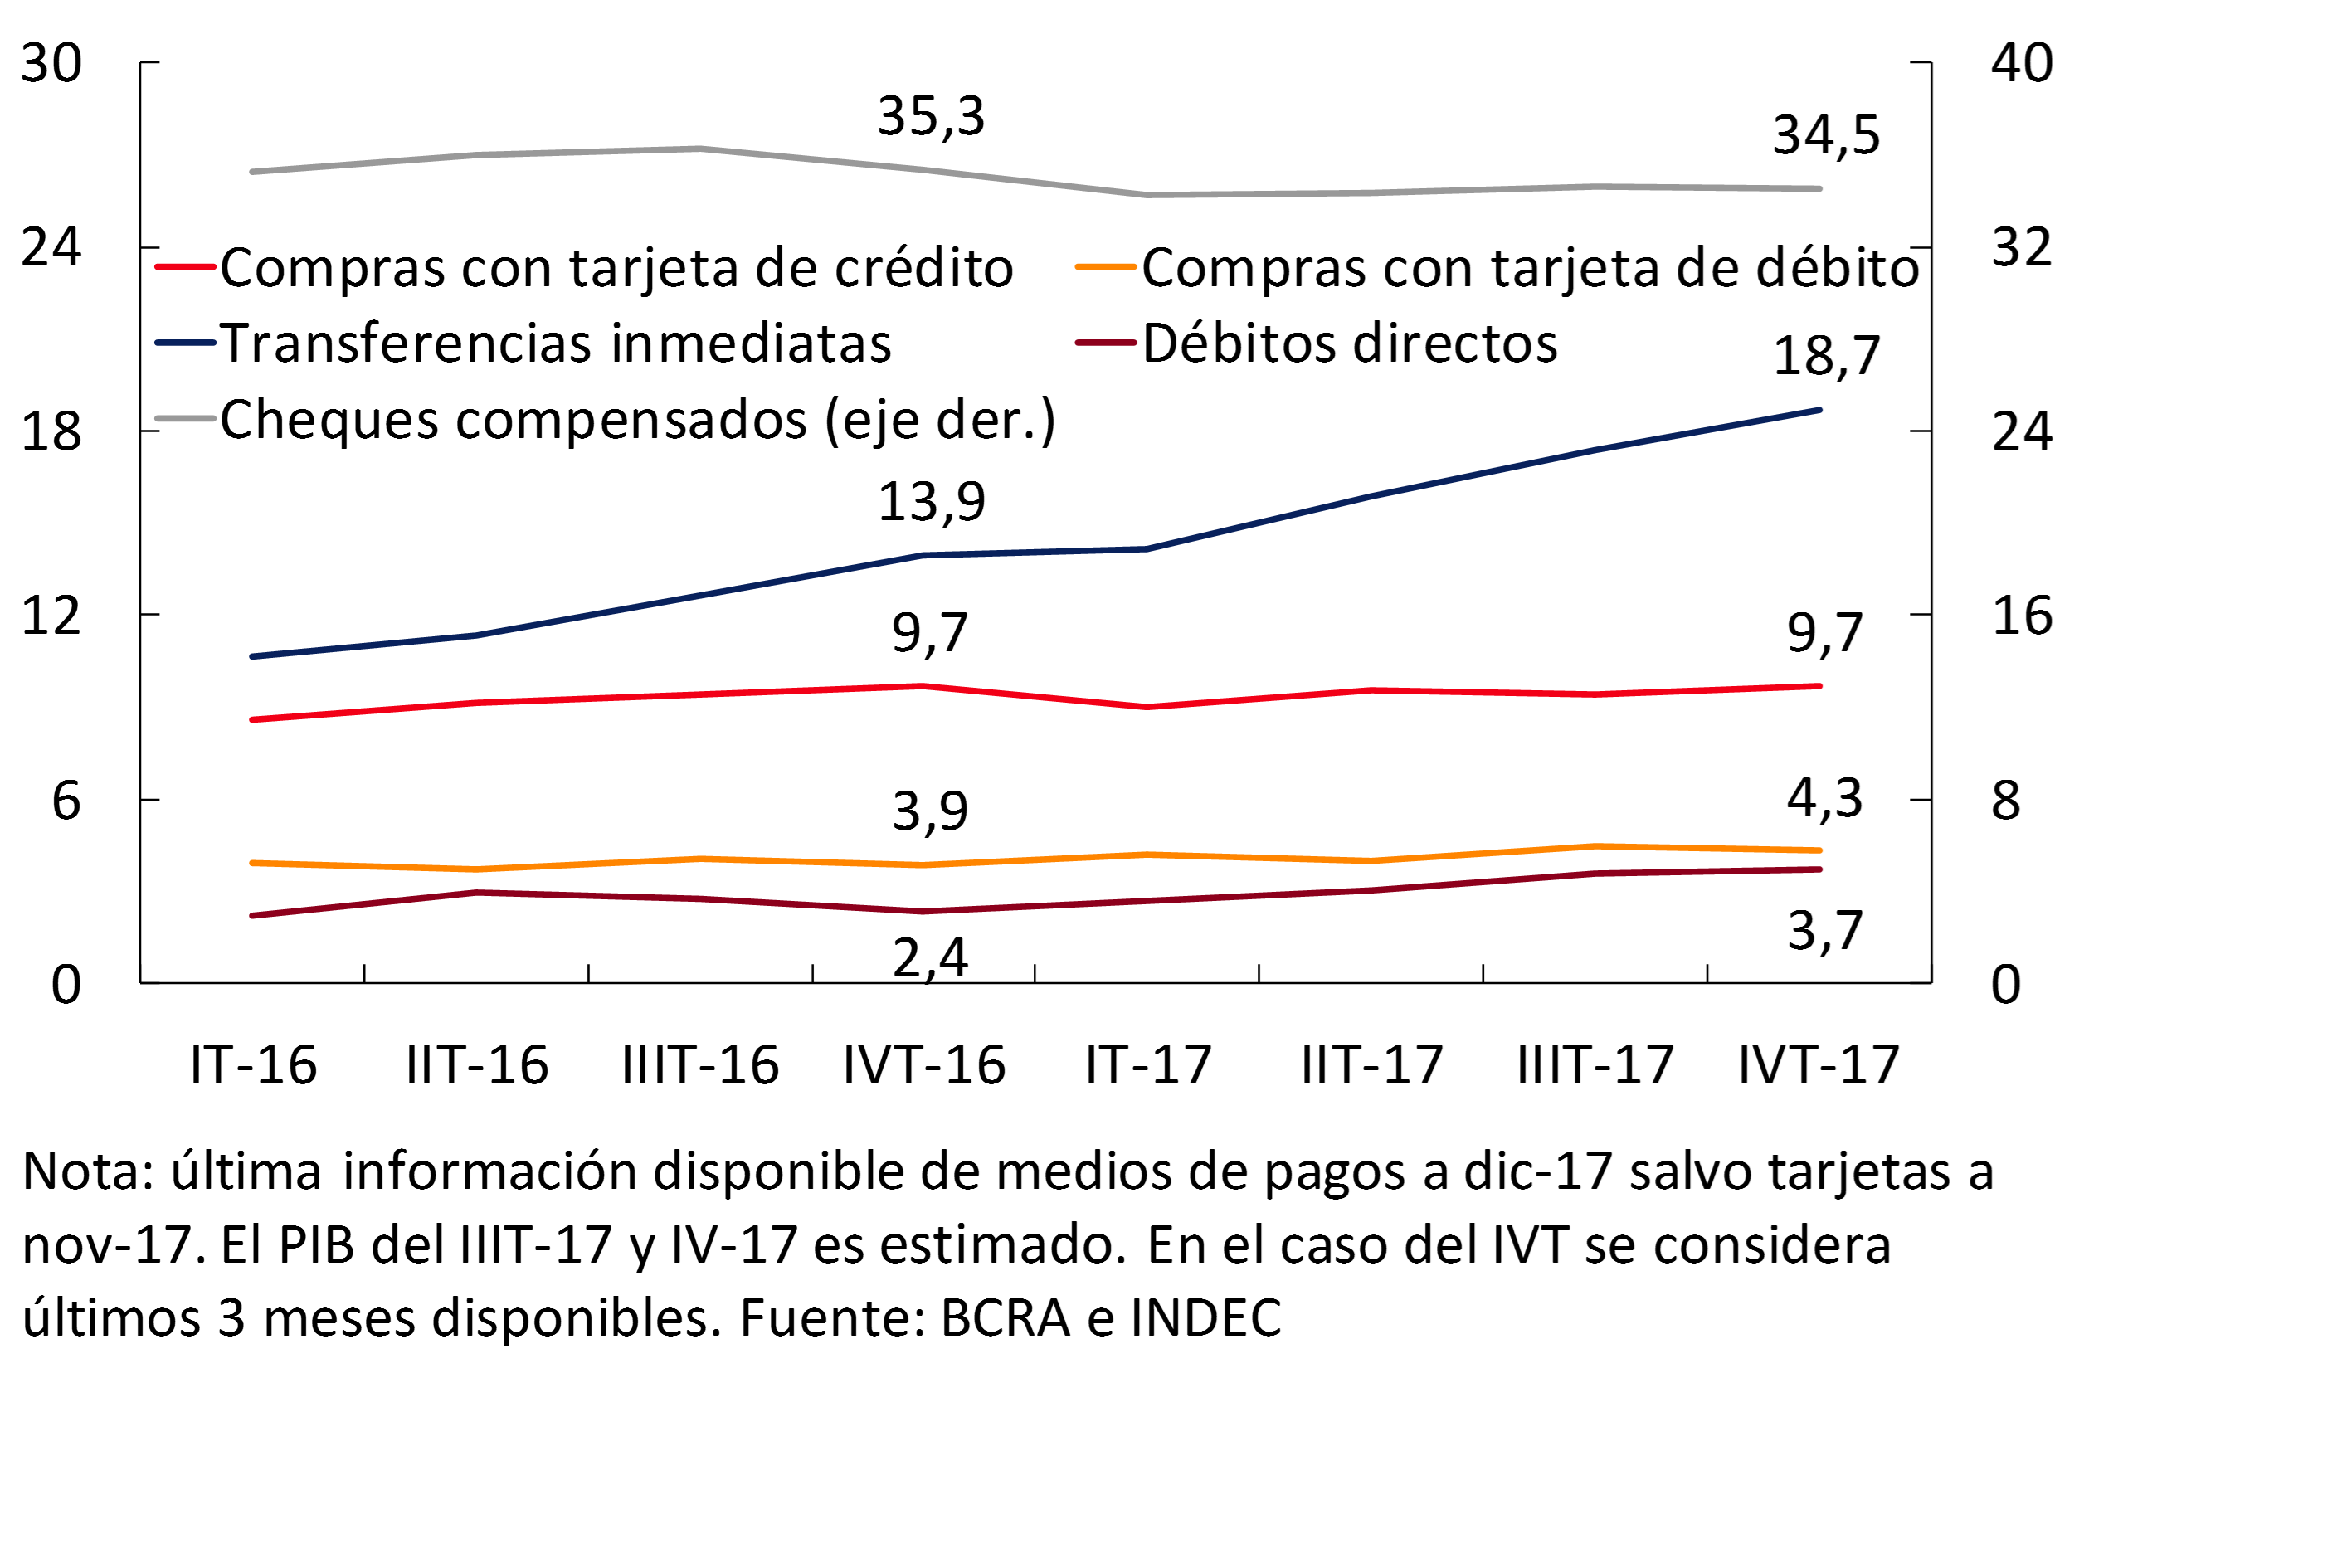
The values processed through immediate transfers grew significantly in terms of GDP, going from representing 13.9% of the product in the last quarter of 2016 to 18.7% in the same period of 2017. To a lesser extent, in 2017 the share of the volume sent through the rest of the electronic means of payment in the economy (especially direct debits) also grew, while the weighting of cleared values of checks decreased slightly in the period (-0.8 p.p. of GDP to 34.5%) (see Chart 6).
Graph 6 | Alternative Means of Payment to Cash – Quarterly annualized – In % of GDP
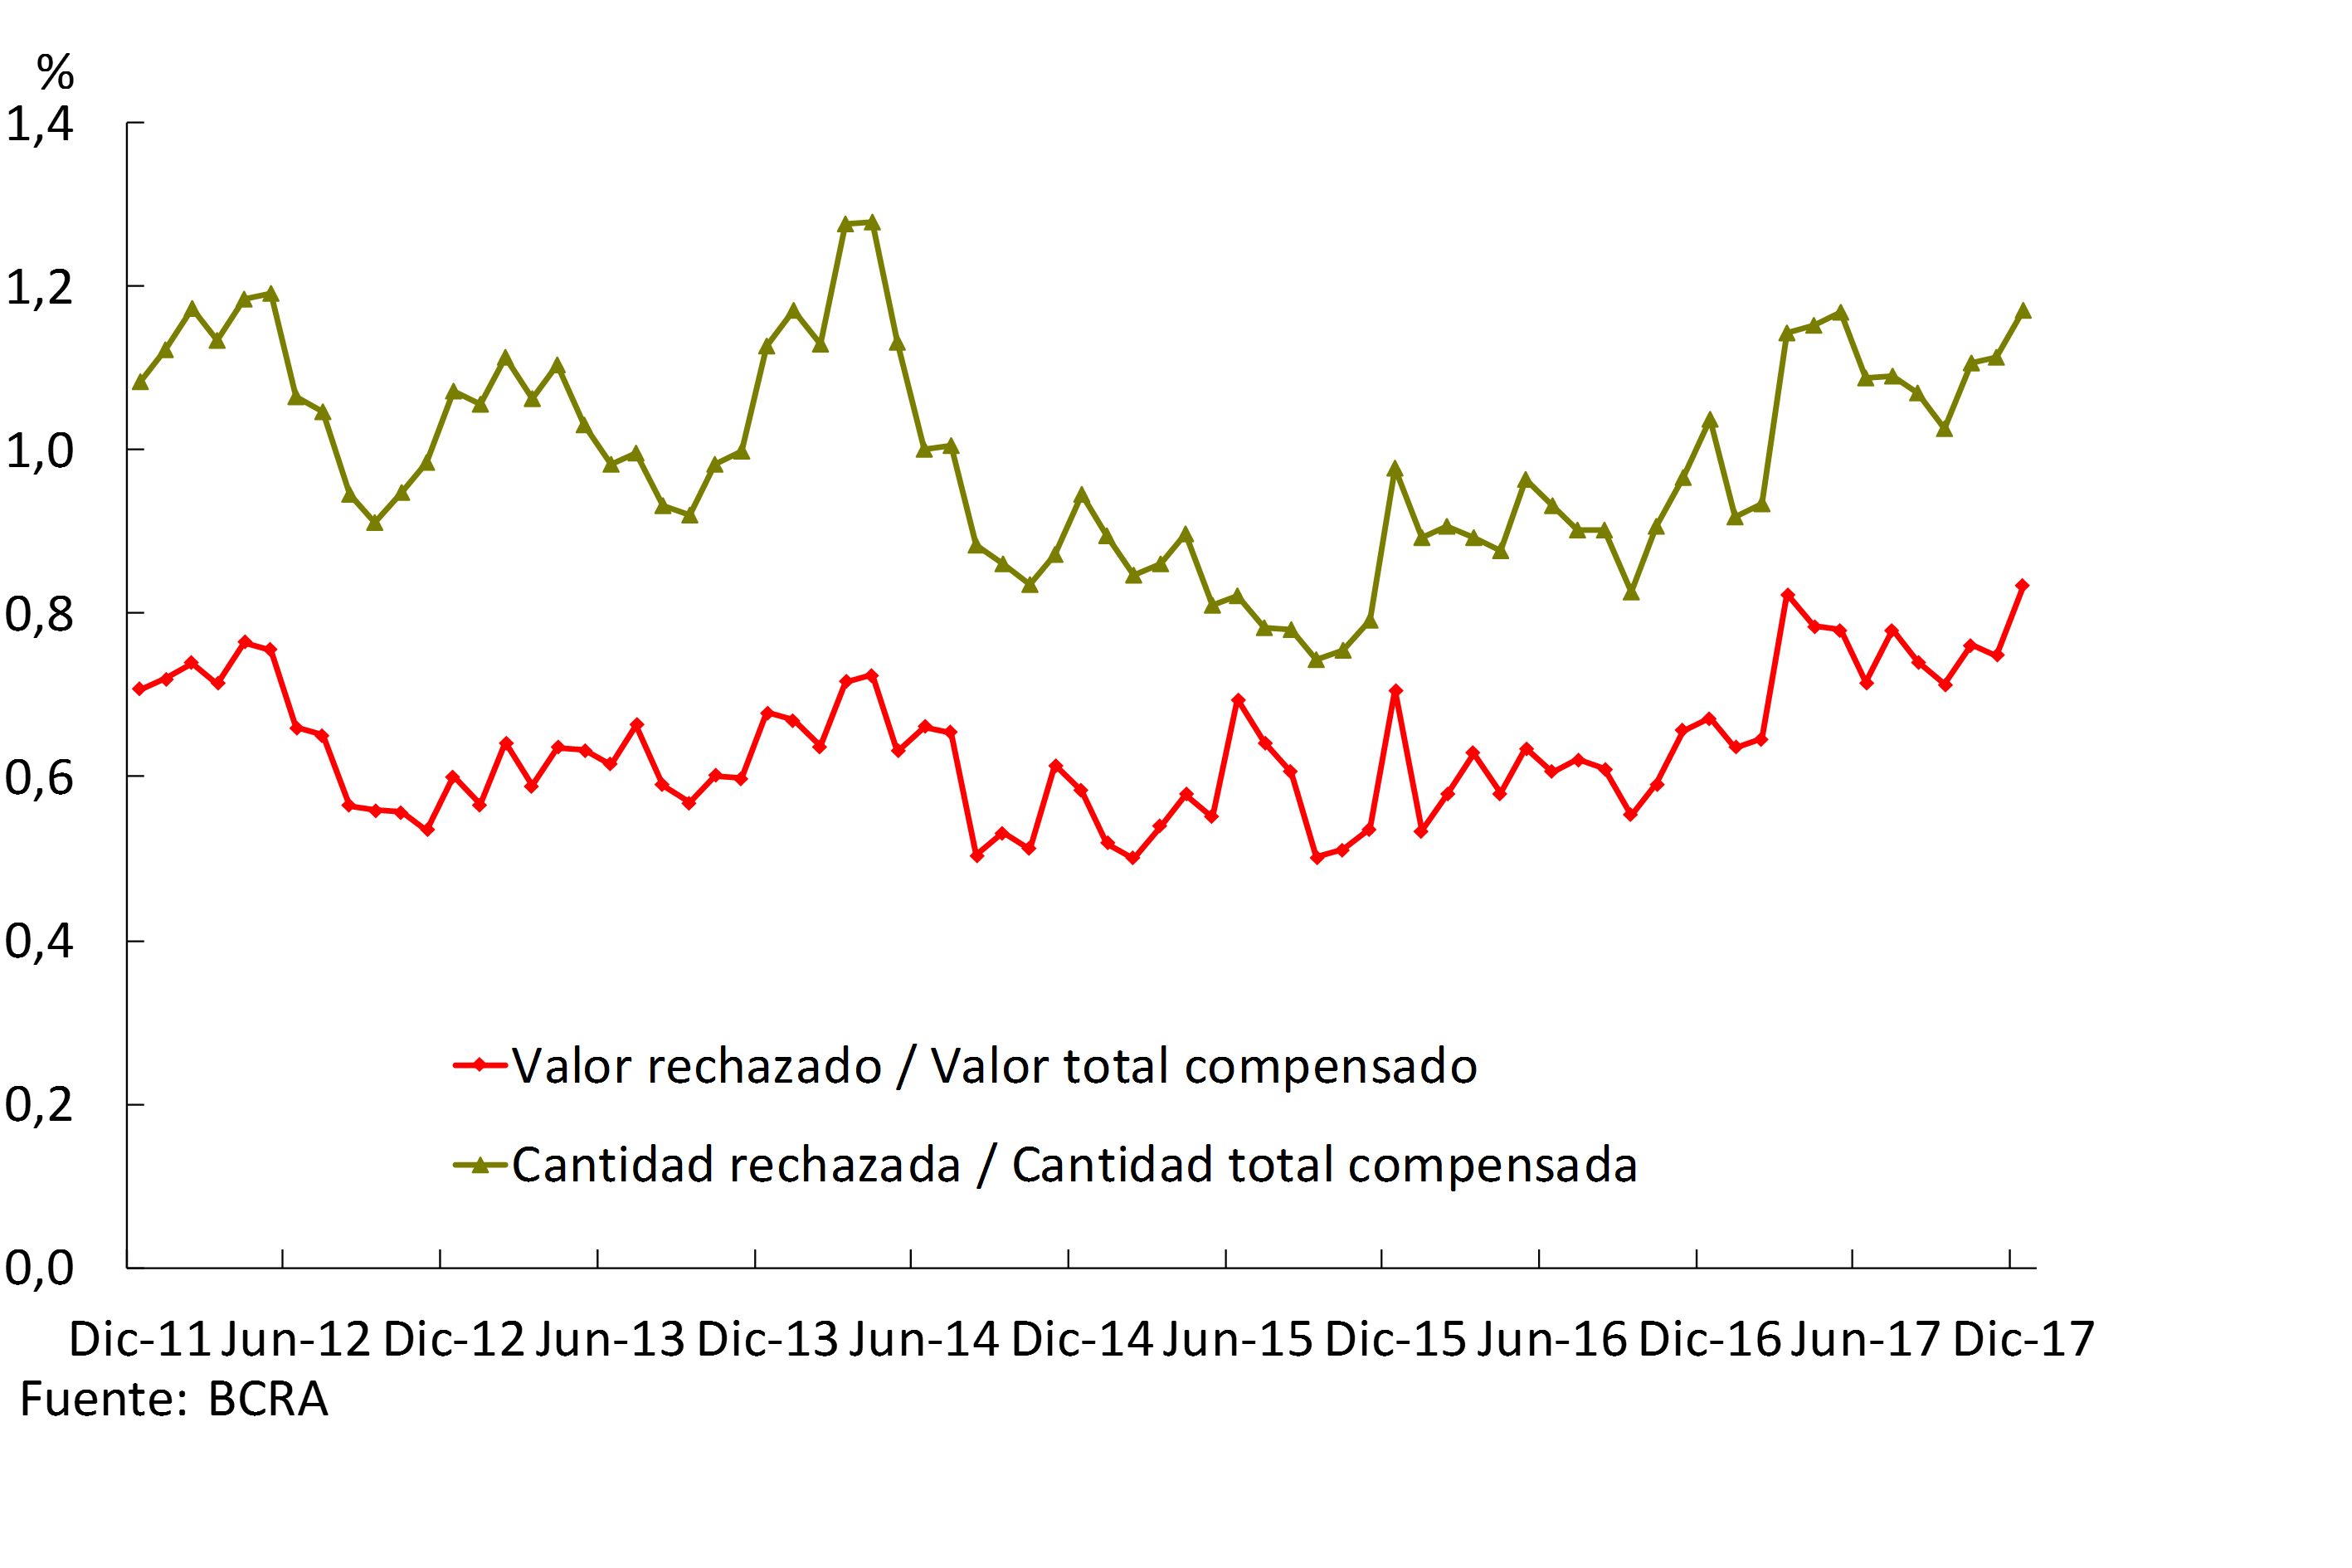
As usual for this part of the year, in December the clearing of checks increased: 4.1% for the amount compensated and 3.3% for the amount issued. In year-on-year terms, the compensated value of checks fell 5.2% in real terms and the amount issued decreased 2.8%. For its part, the ratio of rejection of checks due to lack of funds over the total compensated increased slightly in the month, both in quantity (to around 0.83%) and in amount (to reach 1.17%). The current level of amounts and amounts of checks rejected due to lack of funds in terms of the total compensated was above what was observed a year ago (see Graph 7).
Figure 7 | Bounce Checks for Lack of Funds
III. Deposits and liquidity
At the end of the year, total deposits grew 5.3% adjusted for inflation compared to November, driven by private sector accounts (6.2% in real terms). Within the framework of the payment of the half bonus and the liquidity needs of the end of the year, demand deposits in pesos of companies and families grew 9.8% in real terms. These impositions explained the monthly increase in private sector deposits in national currency (5% adjusted for inflation). Private sector foreign currency deposits increased 5% in source currency in December, partly for reasons associated with the end of the fiscal year. On the other hand, public sector deposits grew slightly in the month (1.3% in real terms), with a reduction in accounts denominated in foreign currency that was more than offset by the increase in those in pesos.
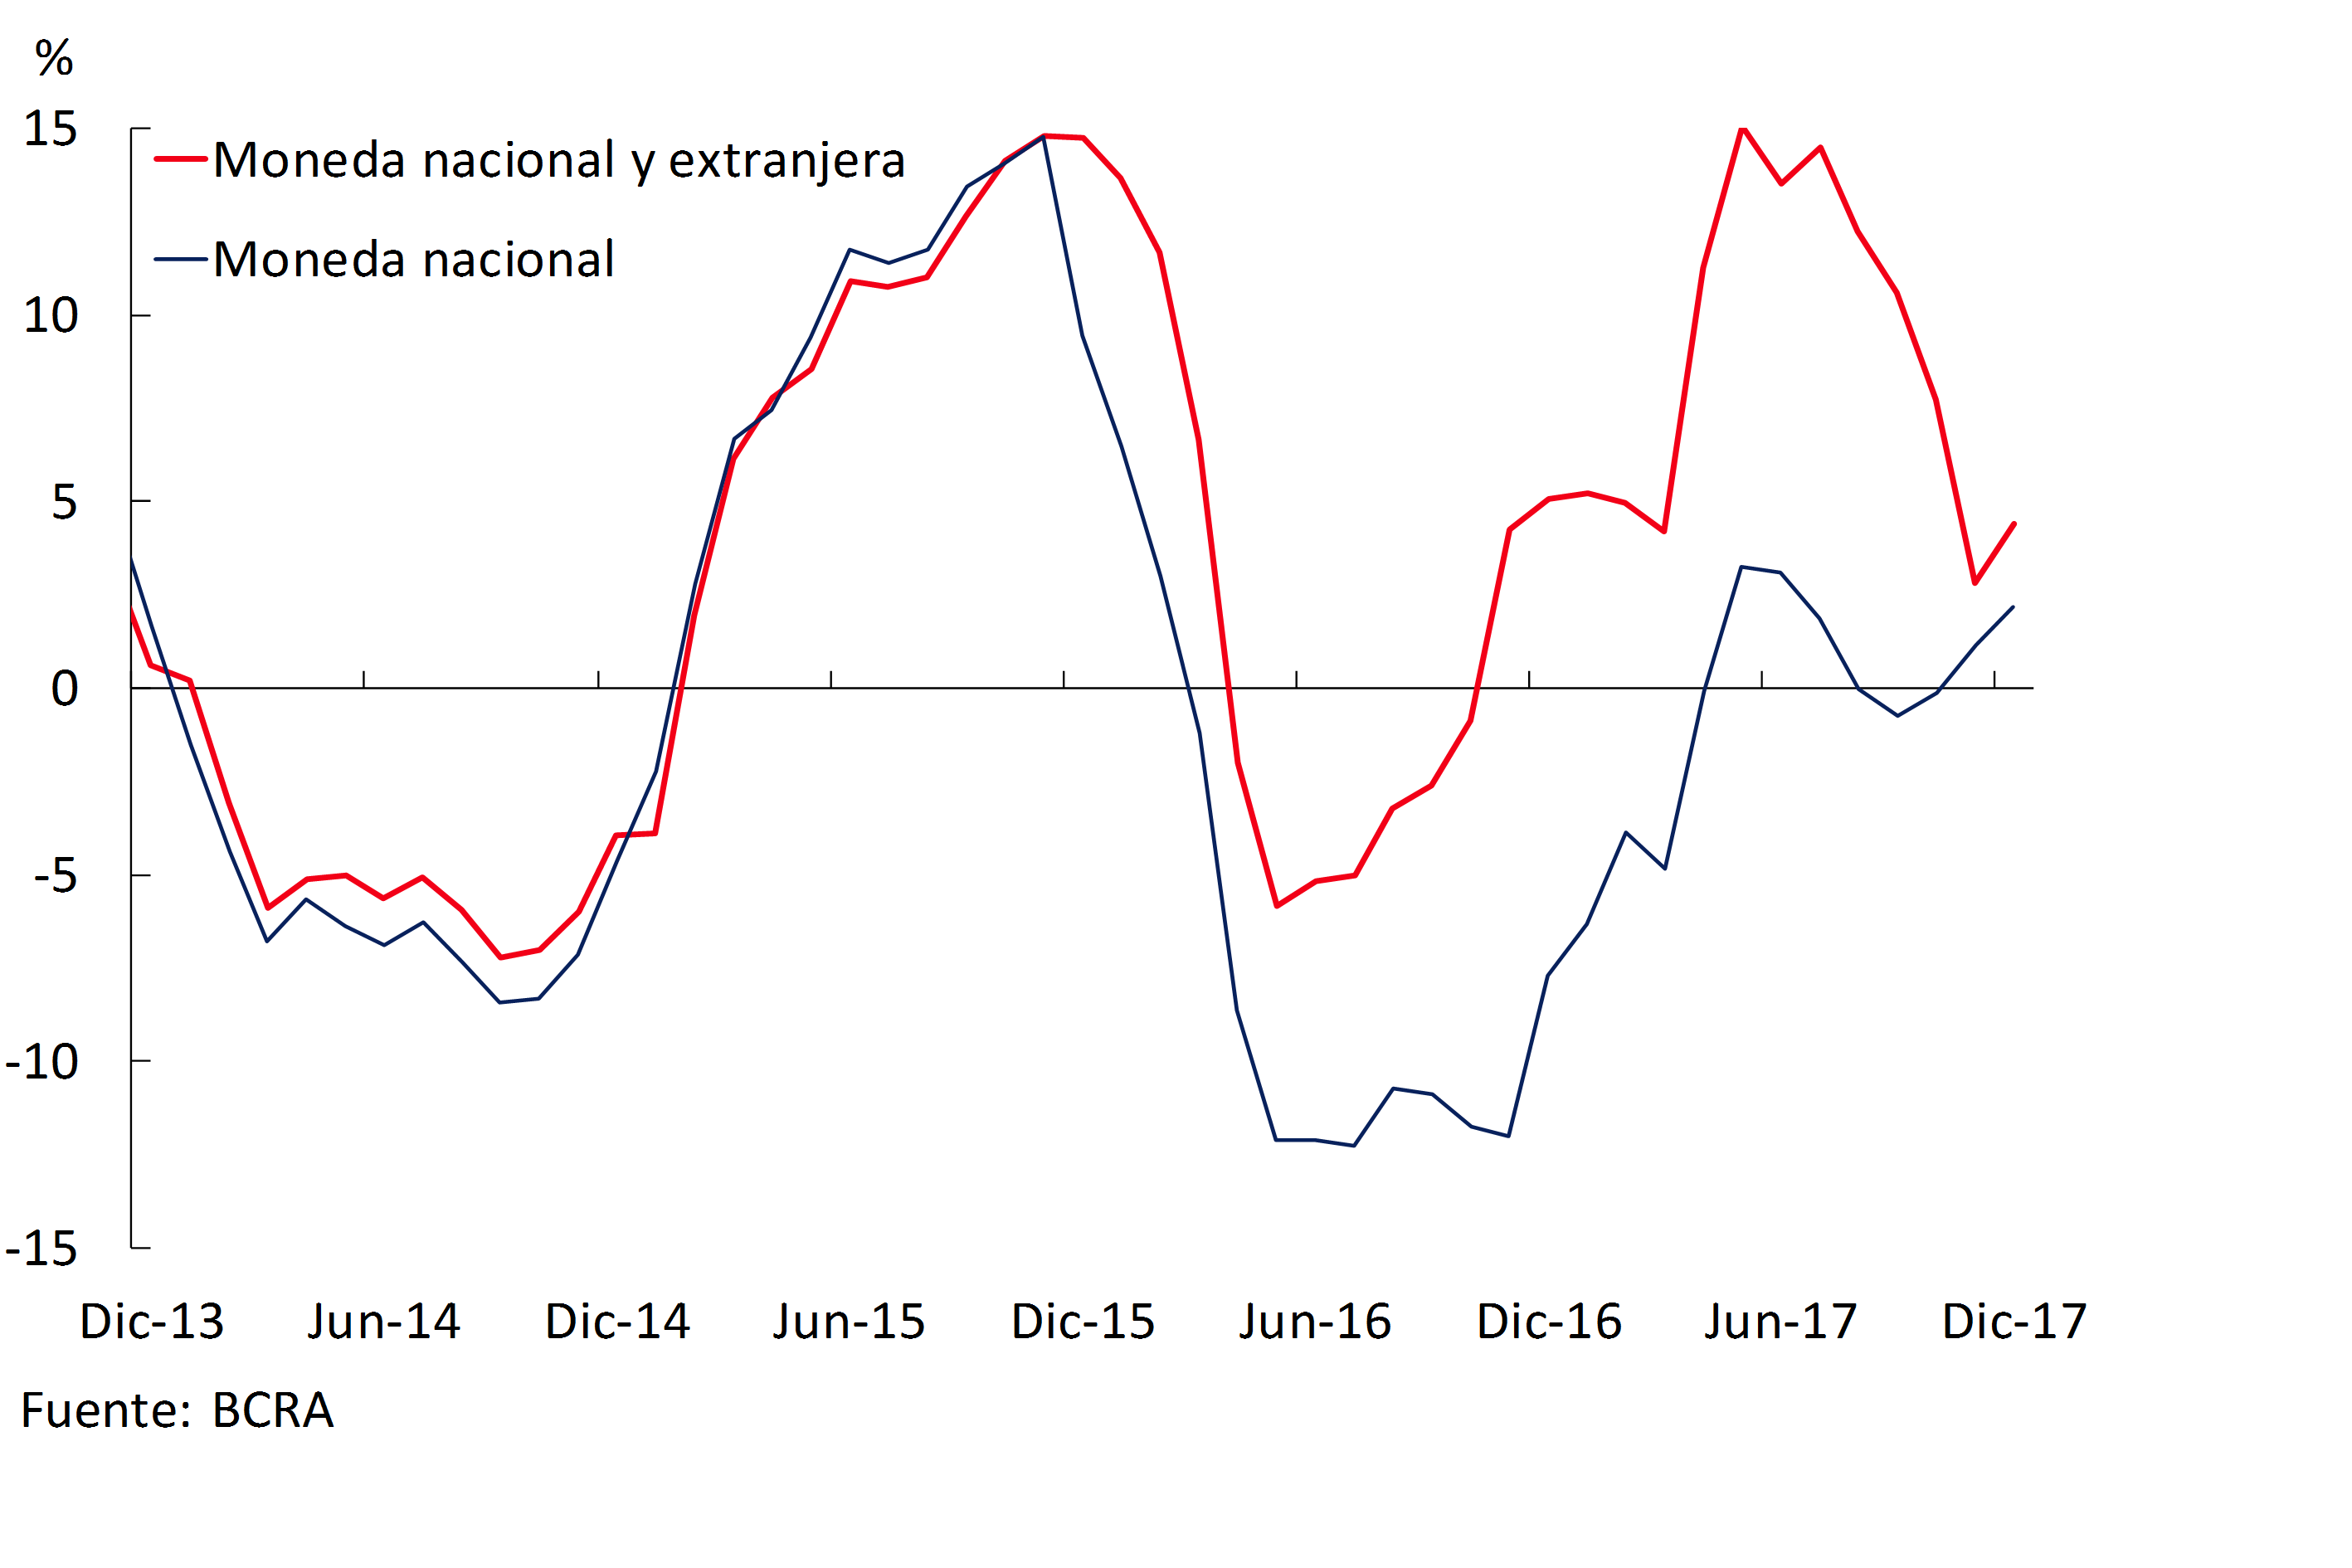
Throughout 2017, the balance of total deposits grew at almost the same rate as inflation, which remained practically stable in real terms. Total private sector deposits grew by 4.4% in real terms in December (see Chart 8), reflecting the good performance of demand deposits (18.8% real YoY). Deposits in national currency of families and companies increased by 2.2% in real terms in the last twelve months, while those arranged in foreign currency increased by 17.5% in foreign currency in the same period. For their part, in the last year both deposits in pesos and dollars in the public sector were reduced in real terms and in currency of origin, respectively.
Figure 8 | Total Private Sector Deposits – Var. A.I. of the balance in real terms
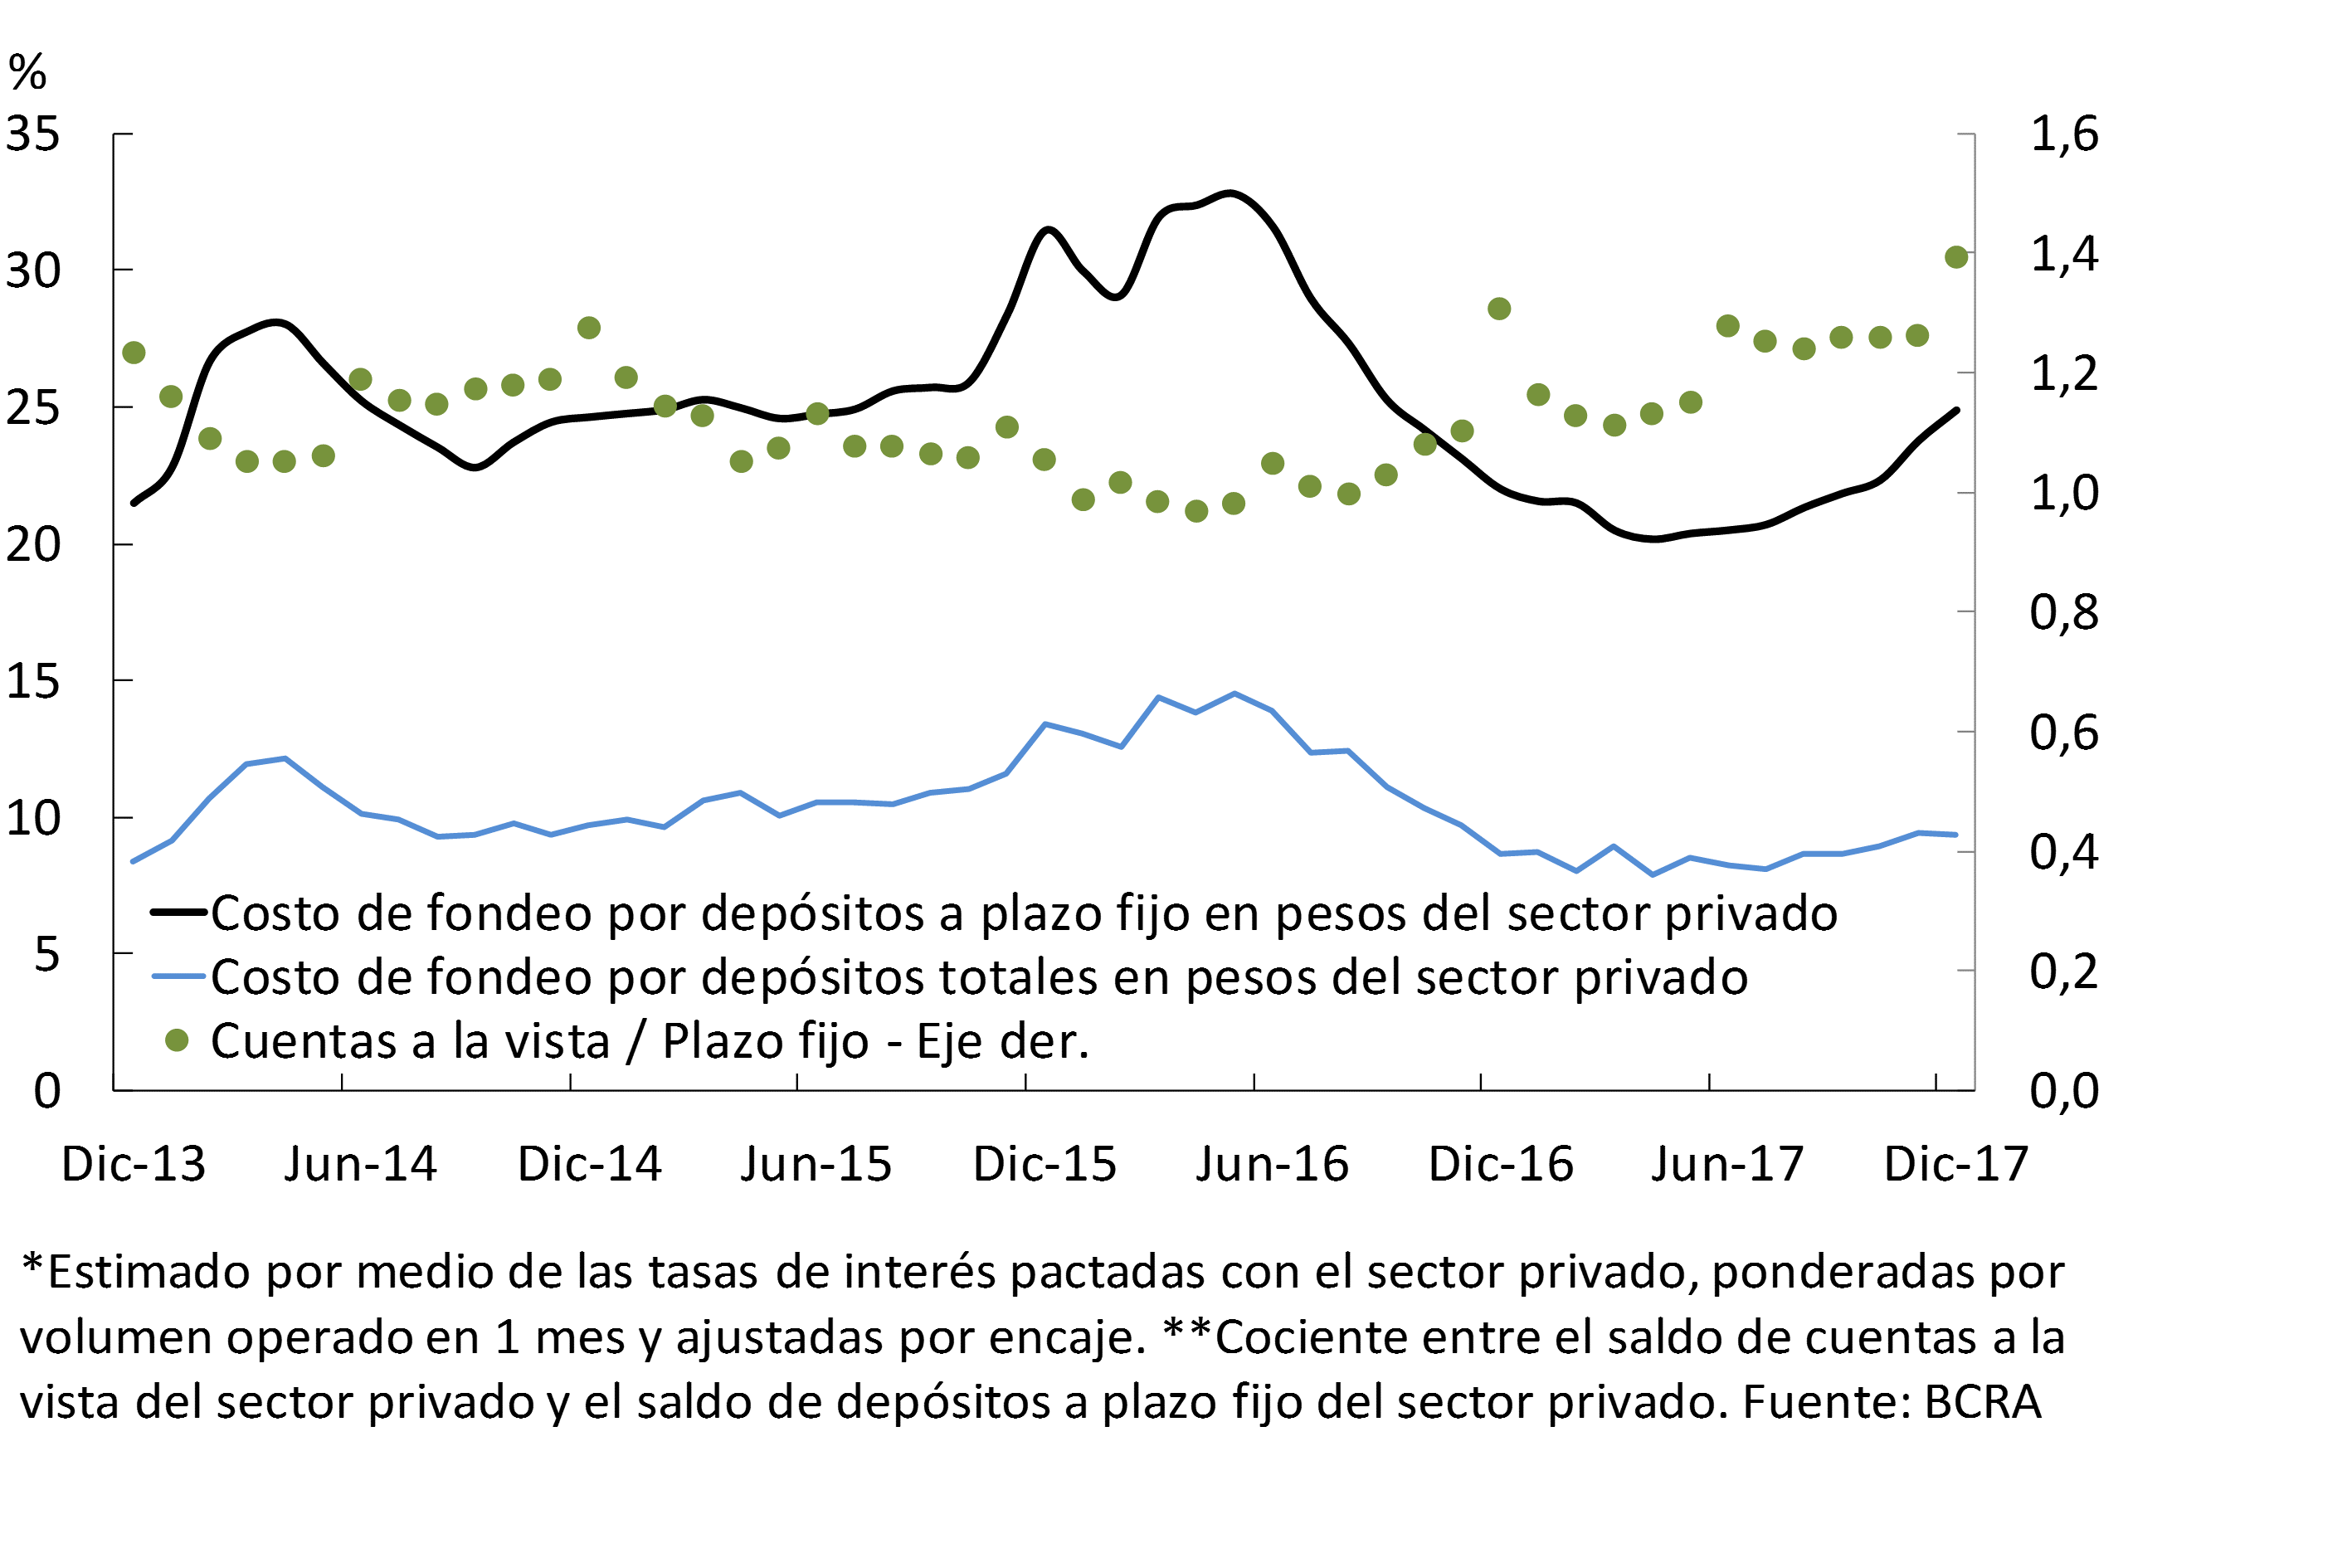
The higher returns on time deposits in pesos agreed by banks in recent months resulted in an increase in the cost of funding through these placements by the private sector (see Chart 9). However, the greater weighting that the accounts in sight had on the bank balance sheet in the year tempered the growth rate of the total funding cost for deposits in national currency.
Figure 9 | Funding Cost for Private Sector Deposits in Pesos* and Ratio between Demand and Time Deposits**
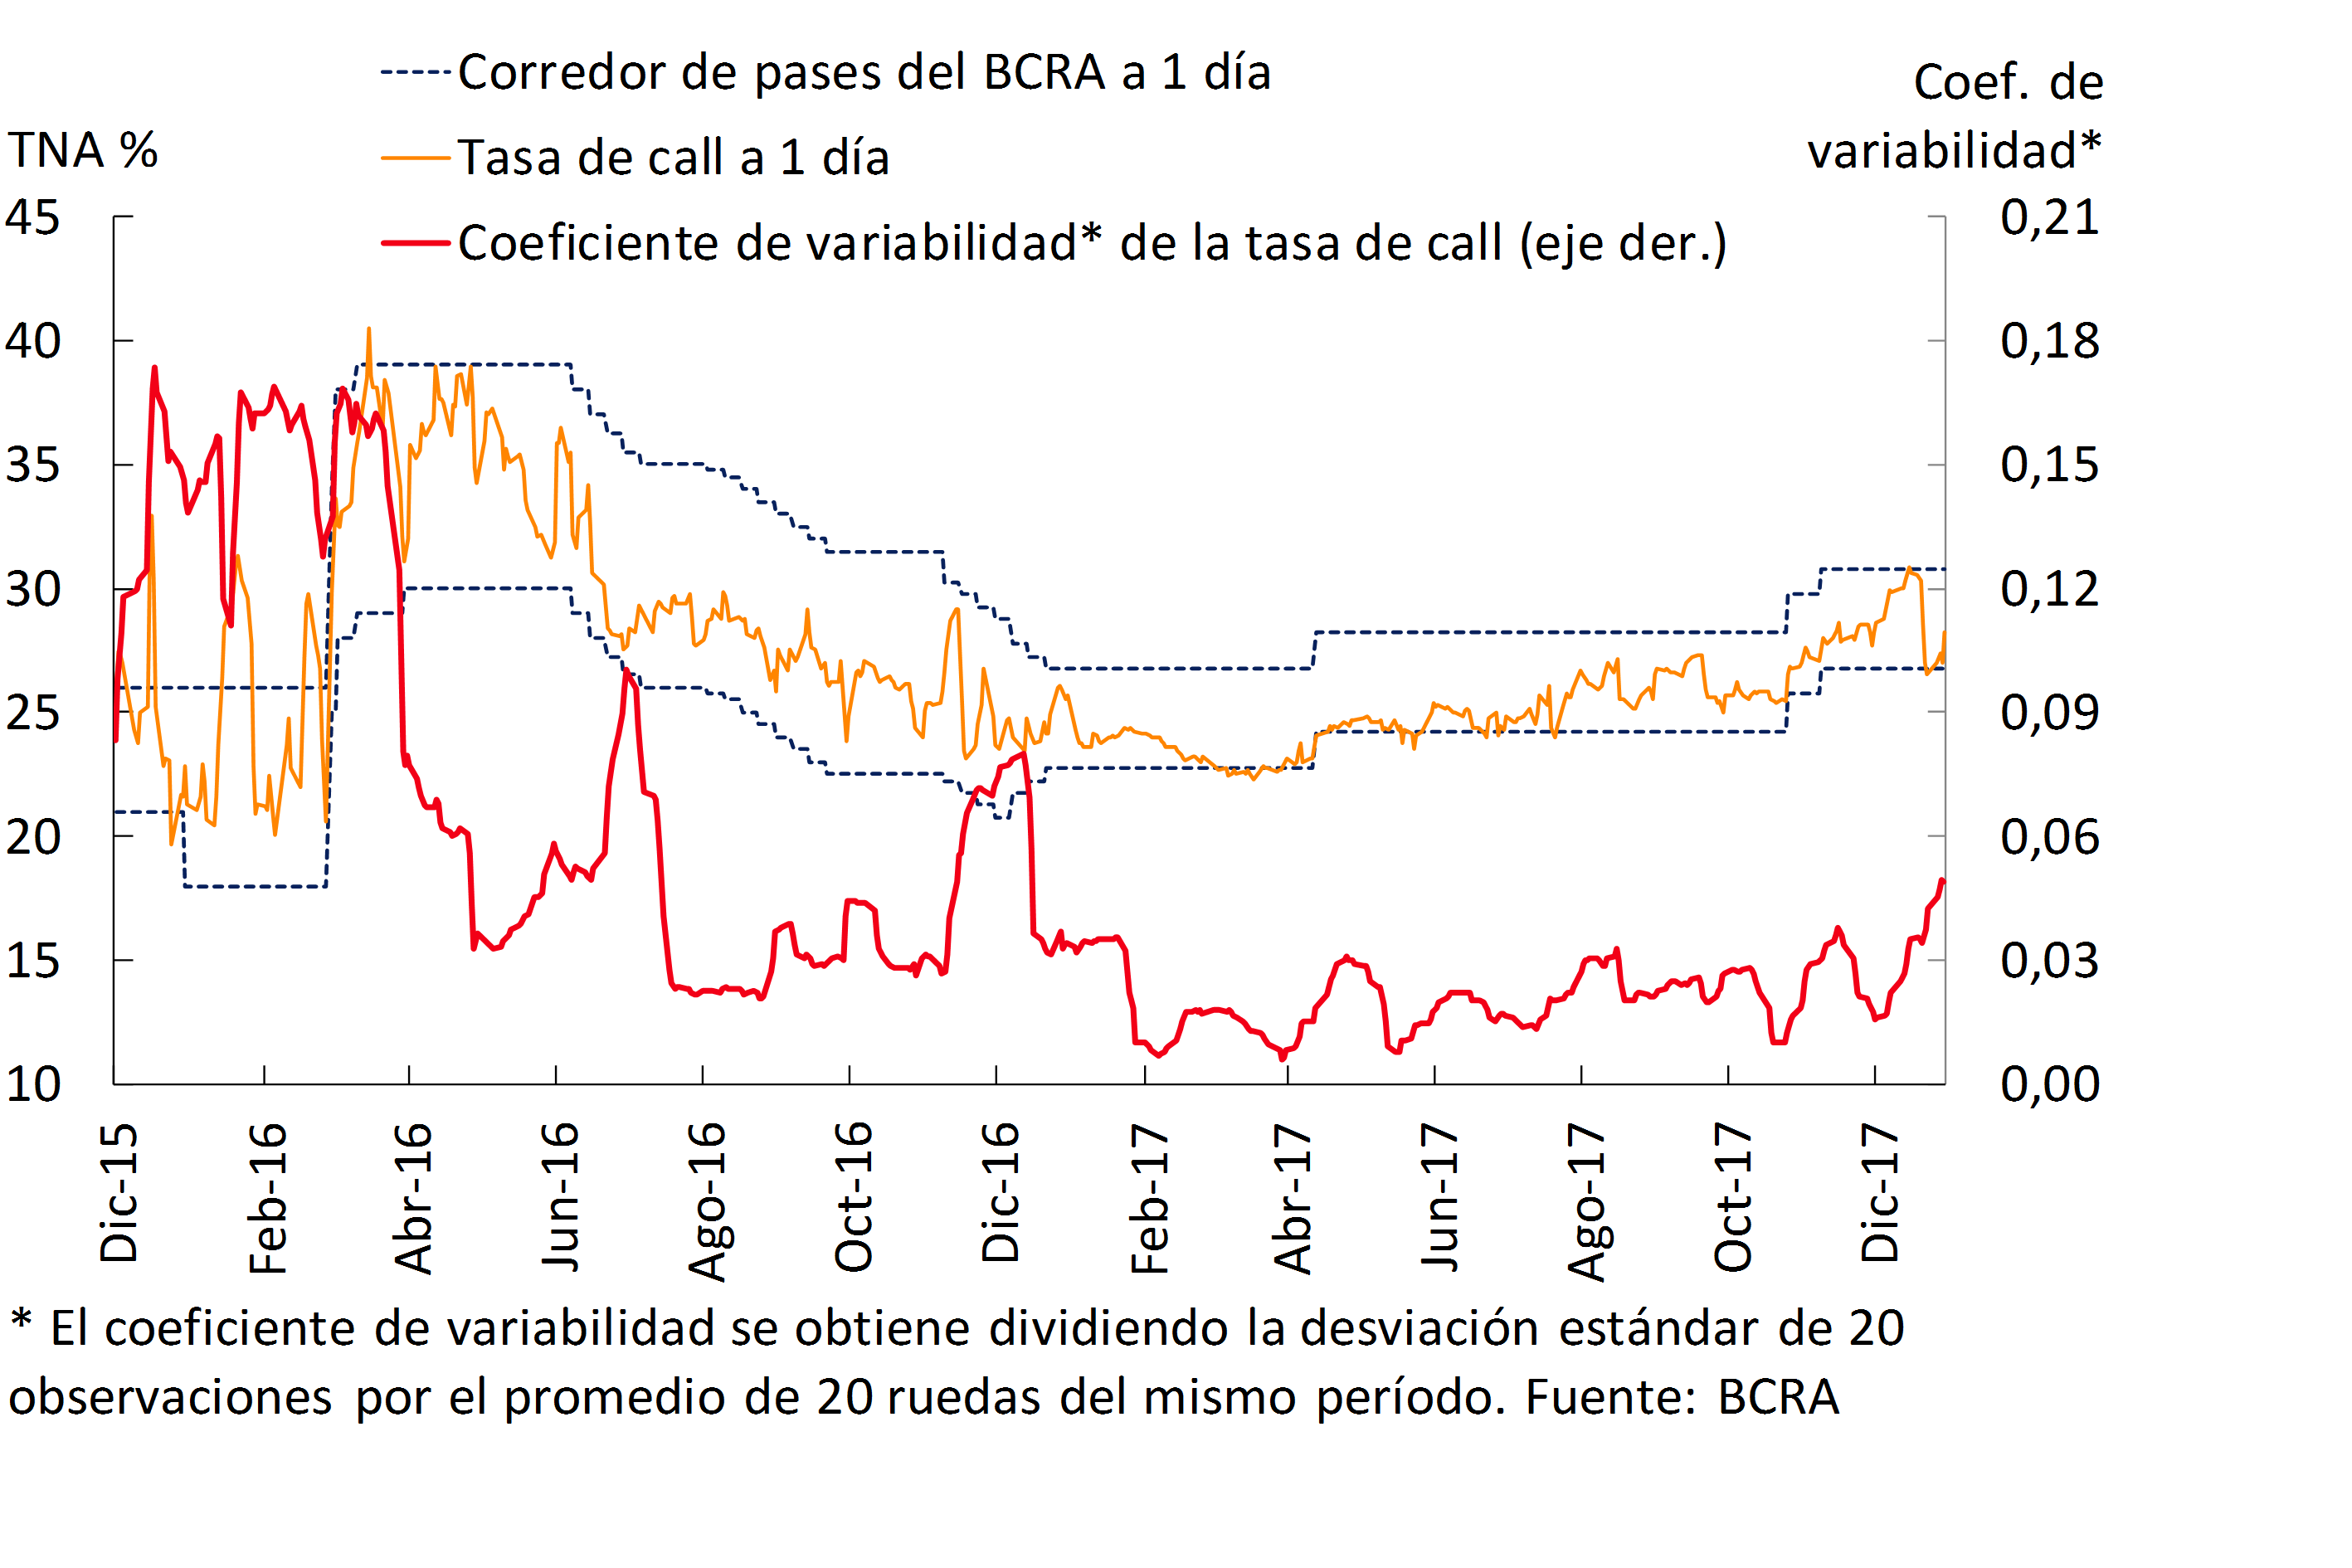
In December, the average interest rates for loans between unsecured banks (call) continued to operate in an environment of limited volatility, placing themselves in most of the rounds within the rate corridor established by the BCRA in the pass market (see Chart 10). The average monthly volume traded in this market was 9.4% lower than in November.
Figure 10 | Interest Rates in Interfinancial Markets and Volatility
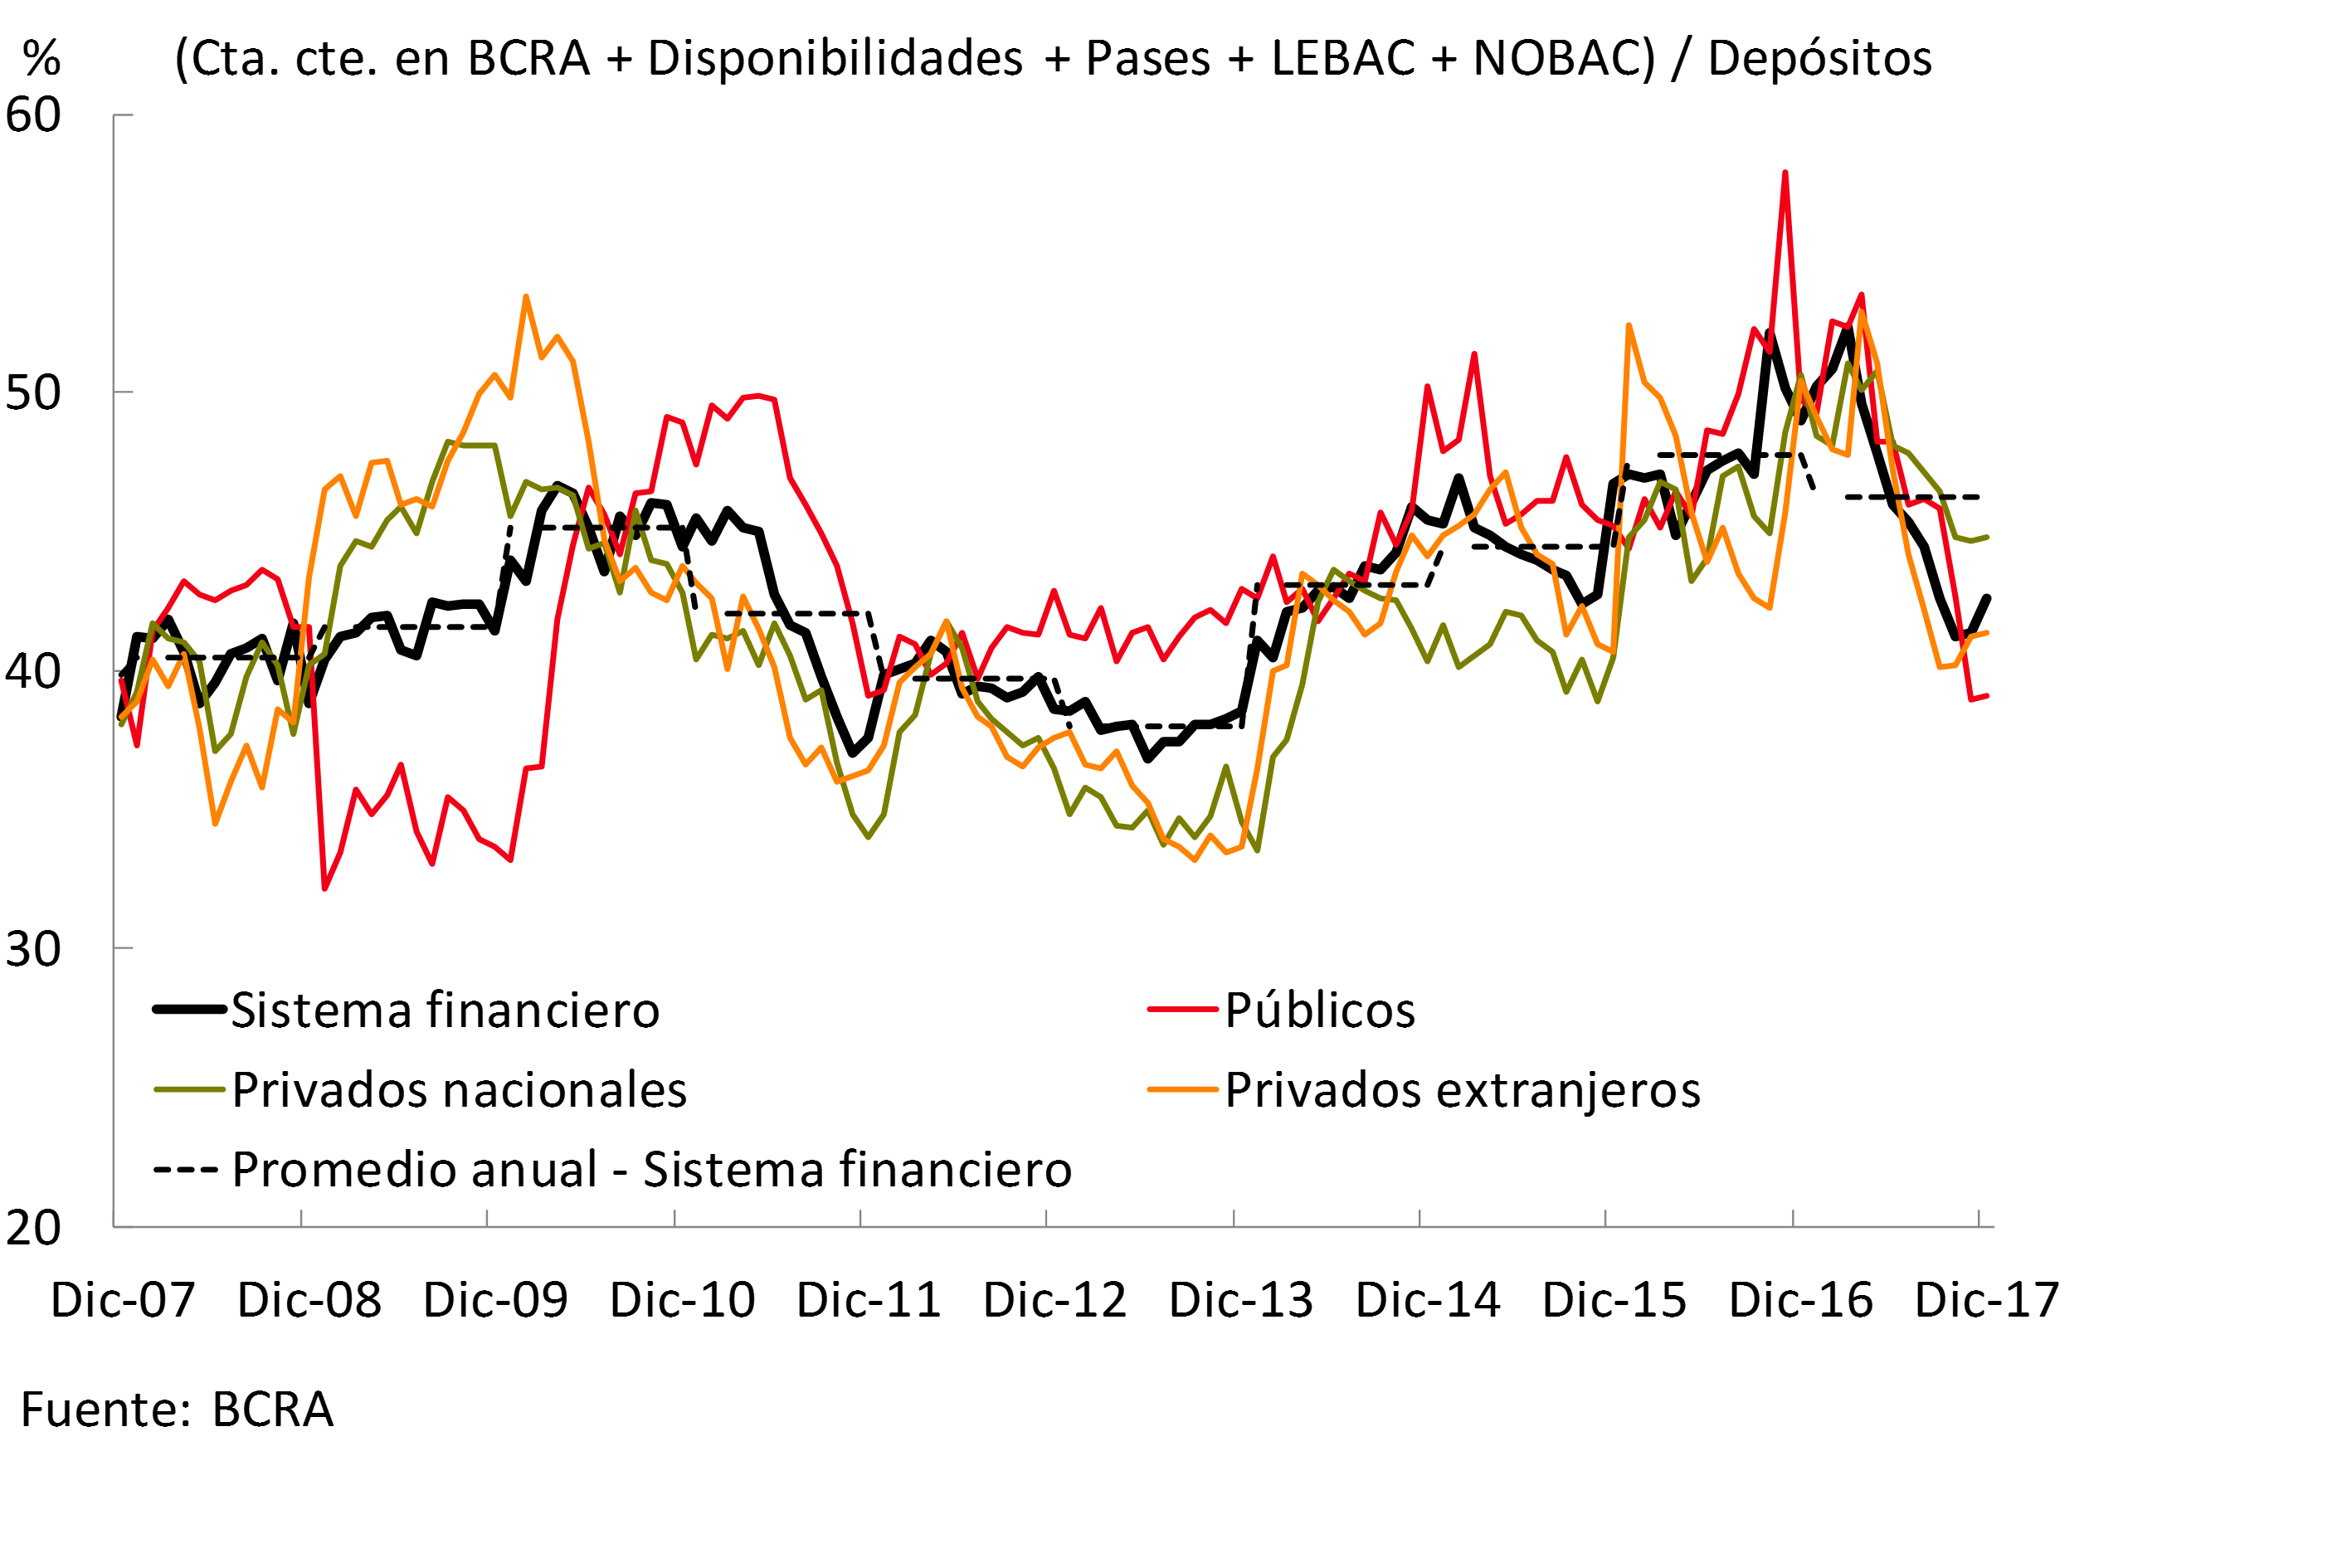
The liquidity of the aggregate of banks grew slightly in December, being driven by private banks. Thus, the most liquid assets – including LEBAC passes and holdings – totaled 42.6% of deposits at the systemic level, 1.2 p.p. more than on November9. The monthly increase in liquidity was mainly due to higher balances in LEBAC passes and holdings. Despite the monthly increase, this indicator fell by 6.4 p.p. of the system’s deposits in relation to the end of 2016. Public banks showed a relatively higher year-on-year reduction in liquidity than in the rest of the system (see Chart 11). Liquidity in the strictest sense – considering only the availabilities and the balance of the current accounts that banks have in the BCRA – fell by 0.1 p.p. of deposits in the last month of the year to reach 25.2%. In 2017, the latter indicator decreased by 6.5 p.p. of deposits.
Figure 11 | Ample Liquidity by Group of Banks
IV. Financing
The balance of total financing to the private sector grew 2.5% when adjusted for inflation in December, in line with the previous month’s record. This performance was mainly driven by mortgage and personal documents, which together accounted for more than half of the monthly increase in credit to the private sector. Loans in foreign currency increased 2.8%10 compared to November. On the other hand, lines in pesos to the private sector grew in real terms by 1.4% in the period. Within this segment, mortgage loans continued to show the highest relative monthly growth (8% real).
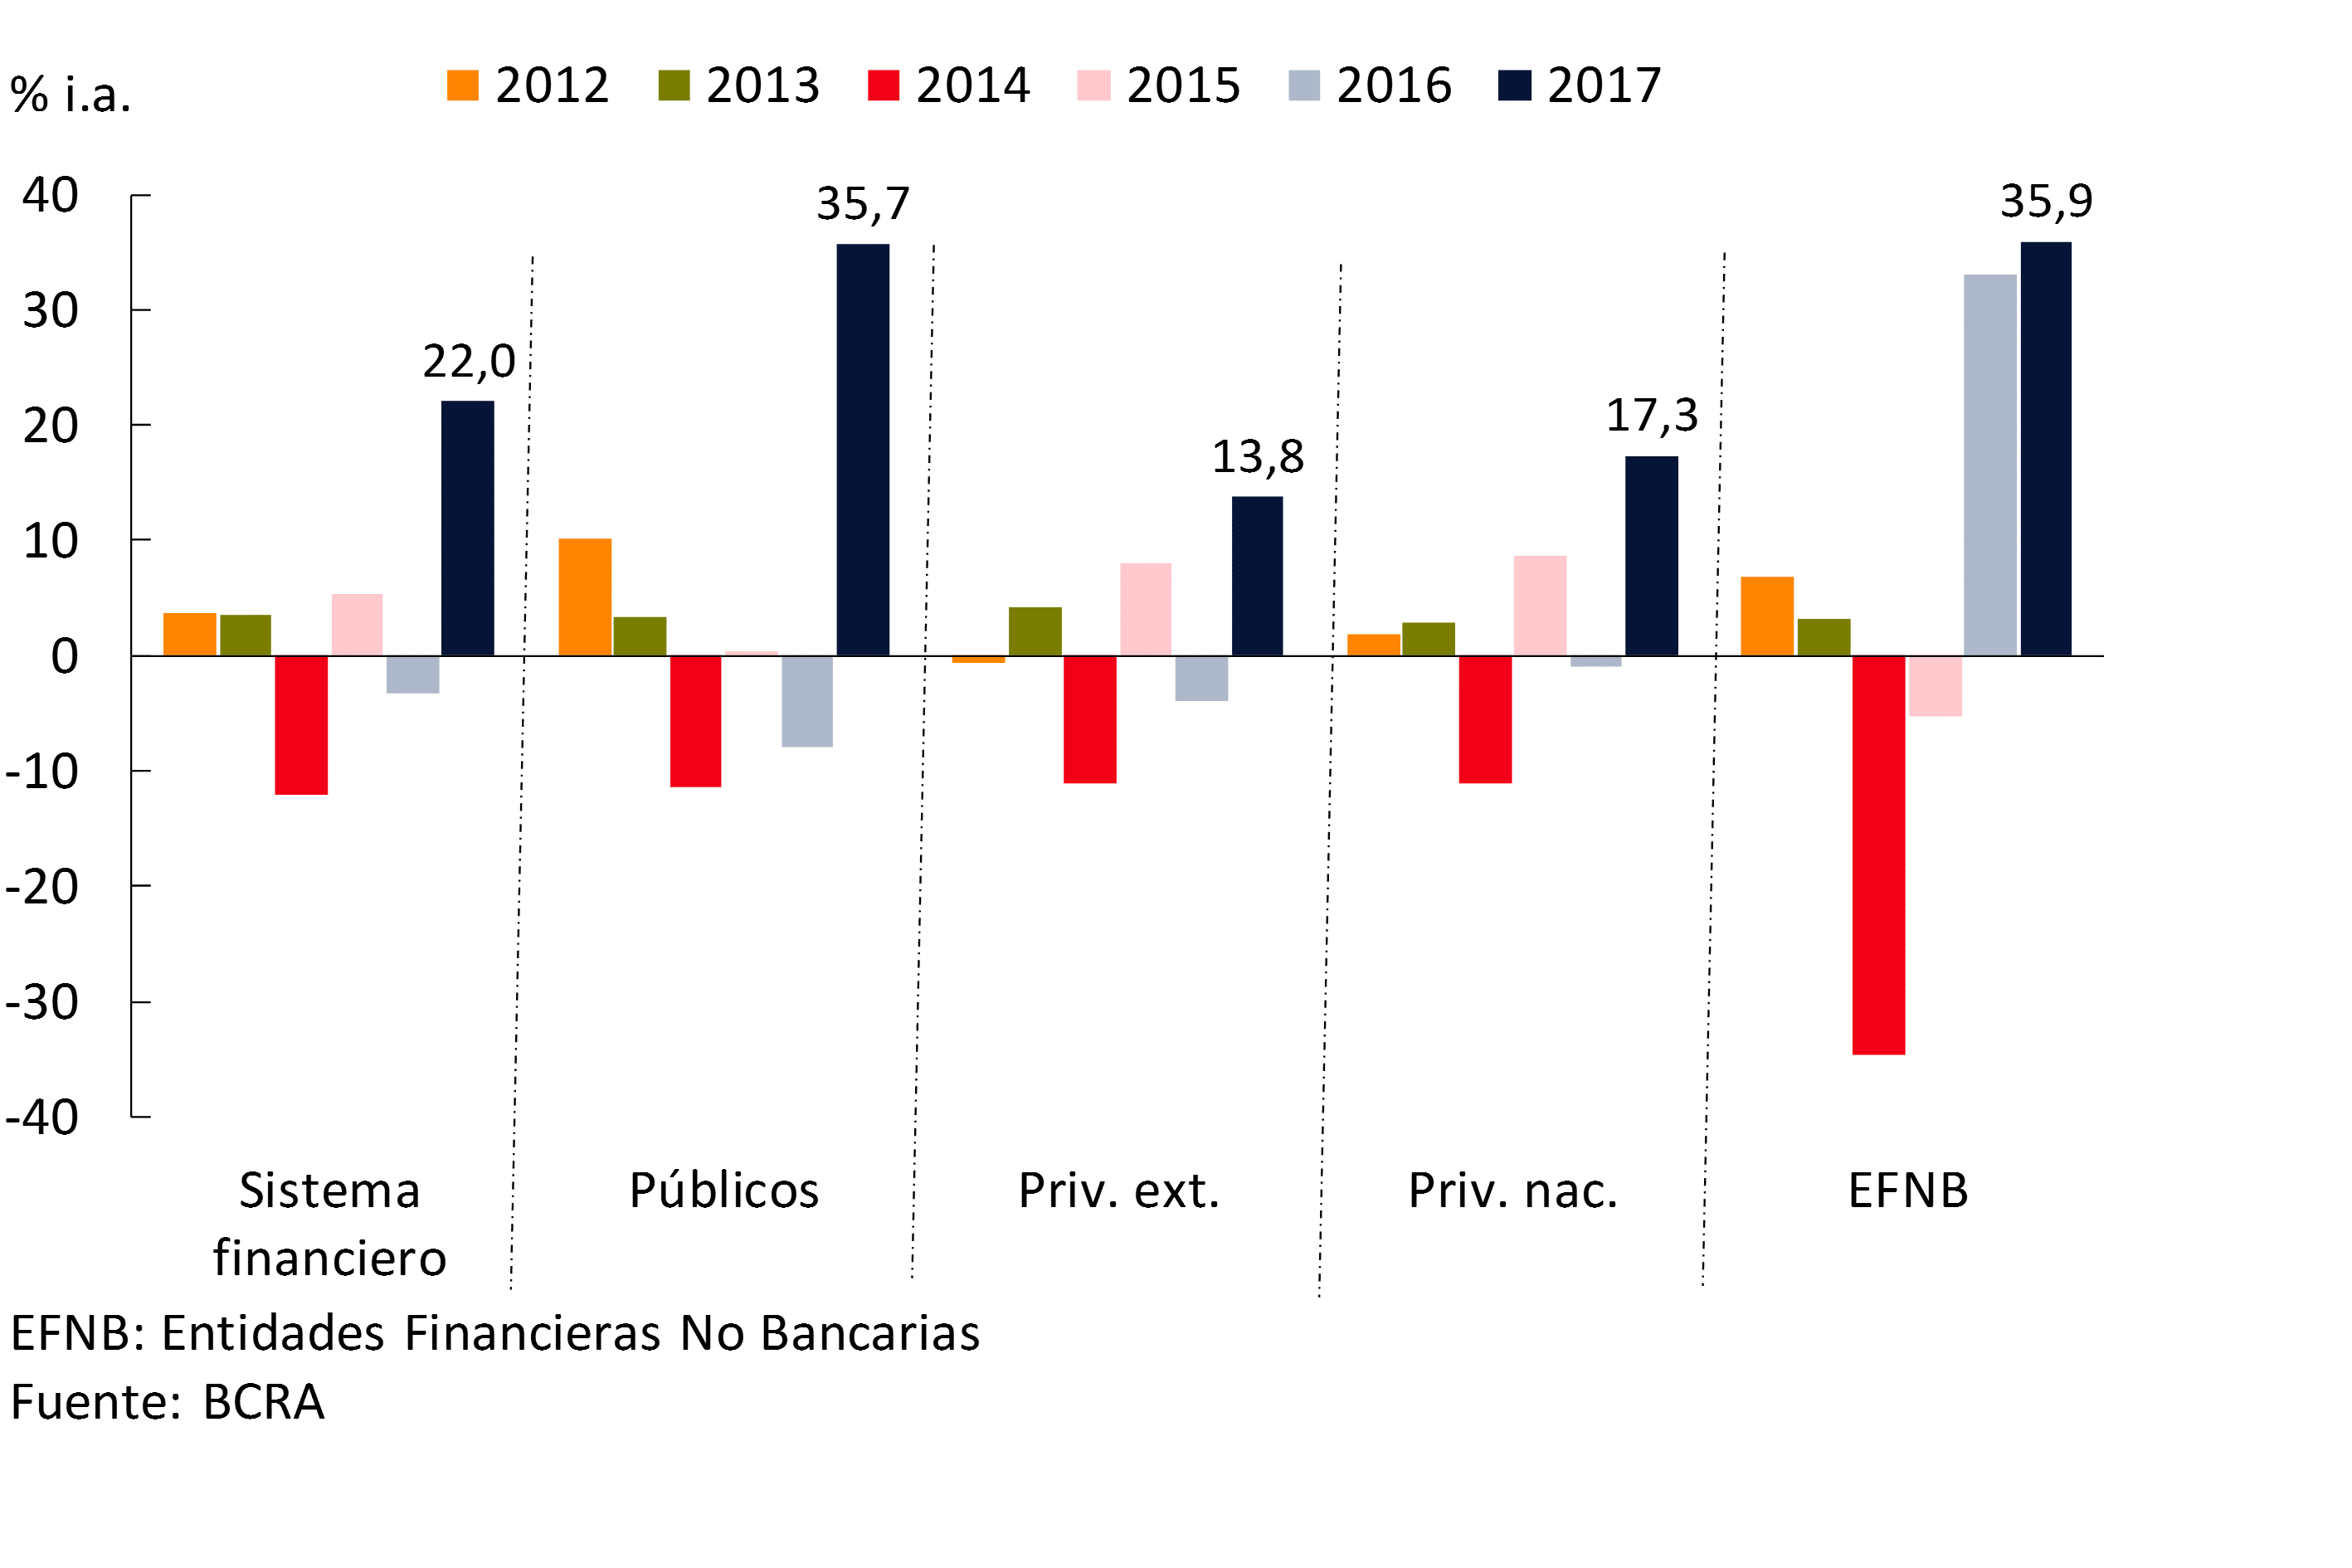
Total credit to the private sector closed the year with an increase of 22% y.o.y. adjusted for inflation (see Graph 12), this being the highest annual growth in the last 10 years. The real year-on-year increase in financing to companies and households was widespread among groups of financial institutions, with public banks and non-bank financial institutions standing out (see Graph 13). In December, lines to the private sector in pesos grew by 16.8% YoY in real terms, while loans in foreign currency grew by 62.5% YoY.11 in the period.
Figure 12 | Real Balance of Total Credit to the Private Sector
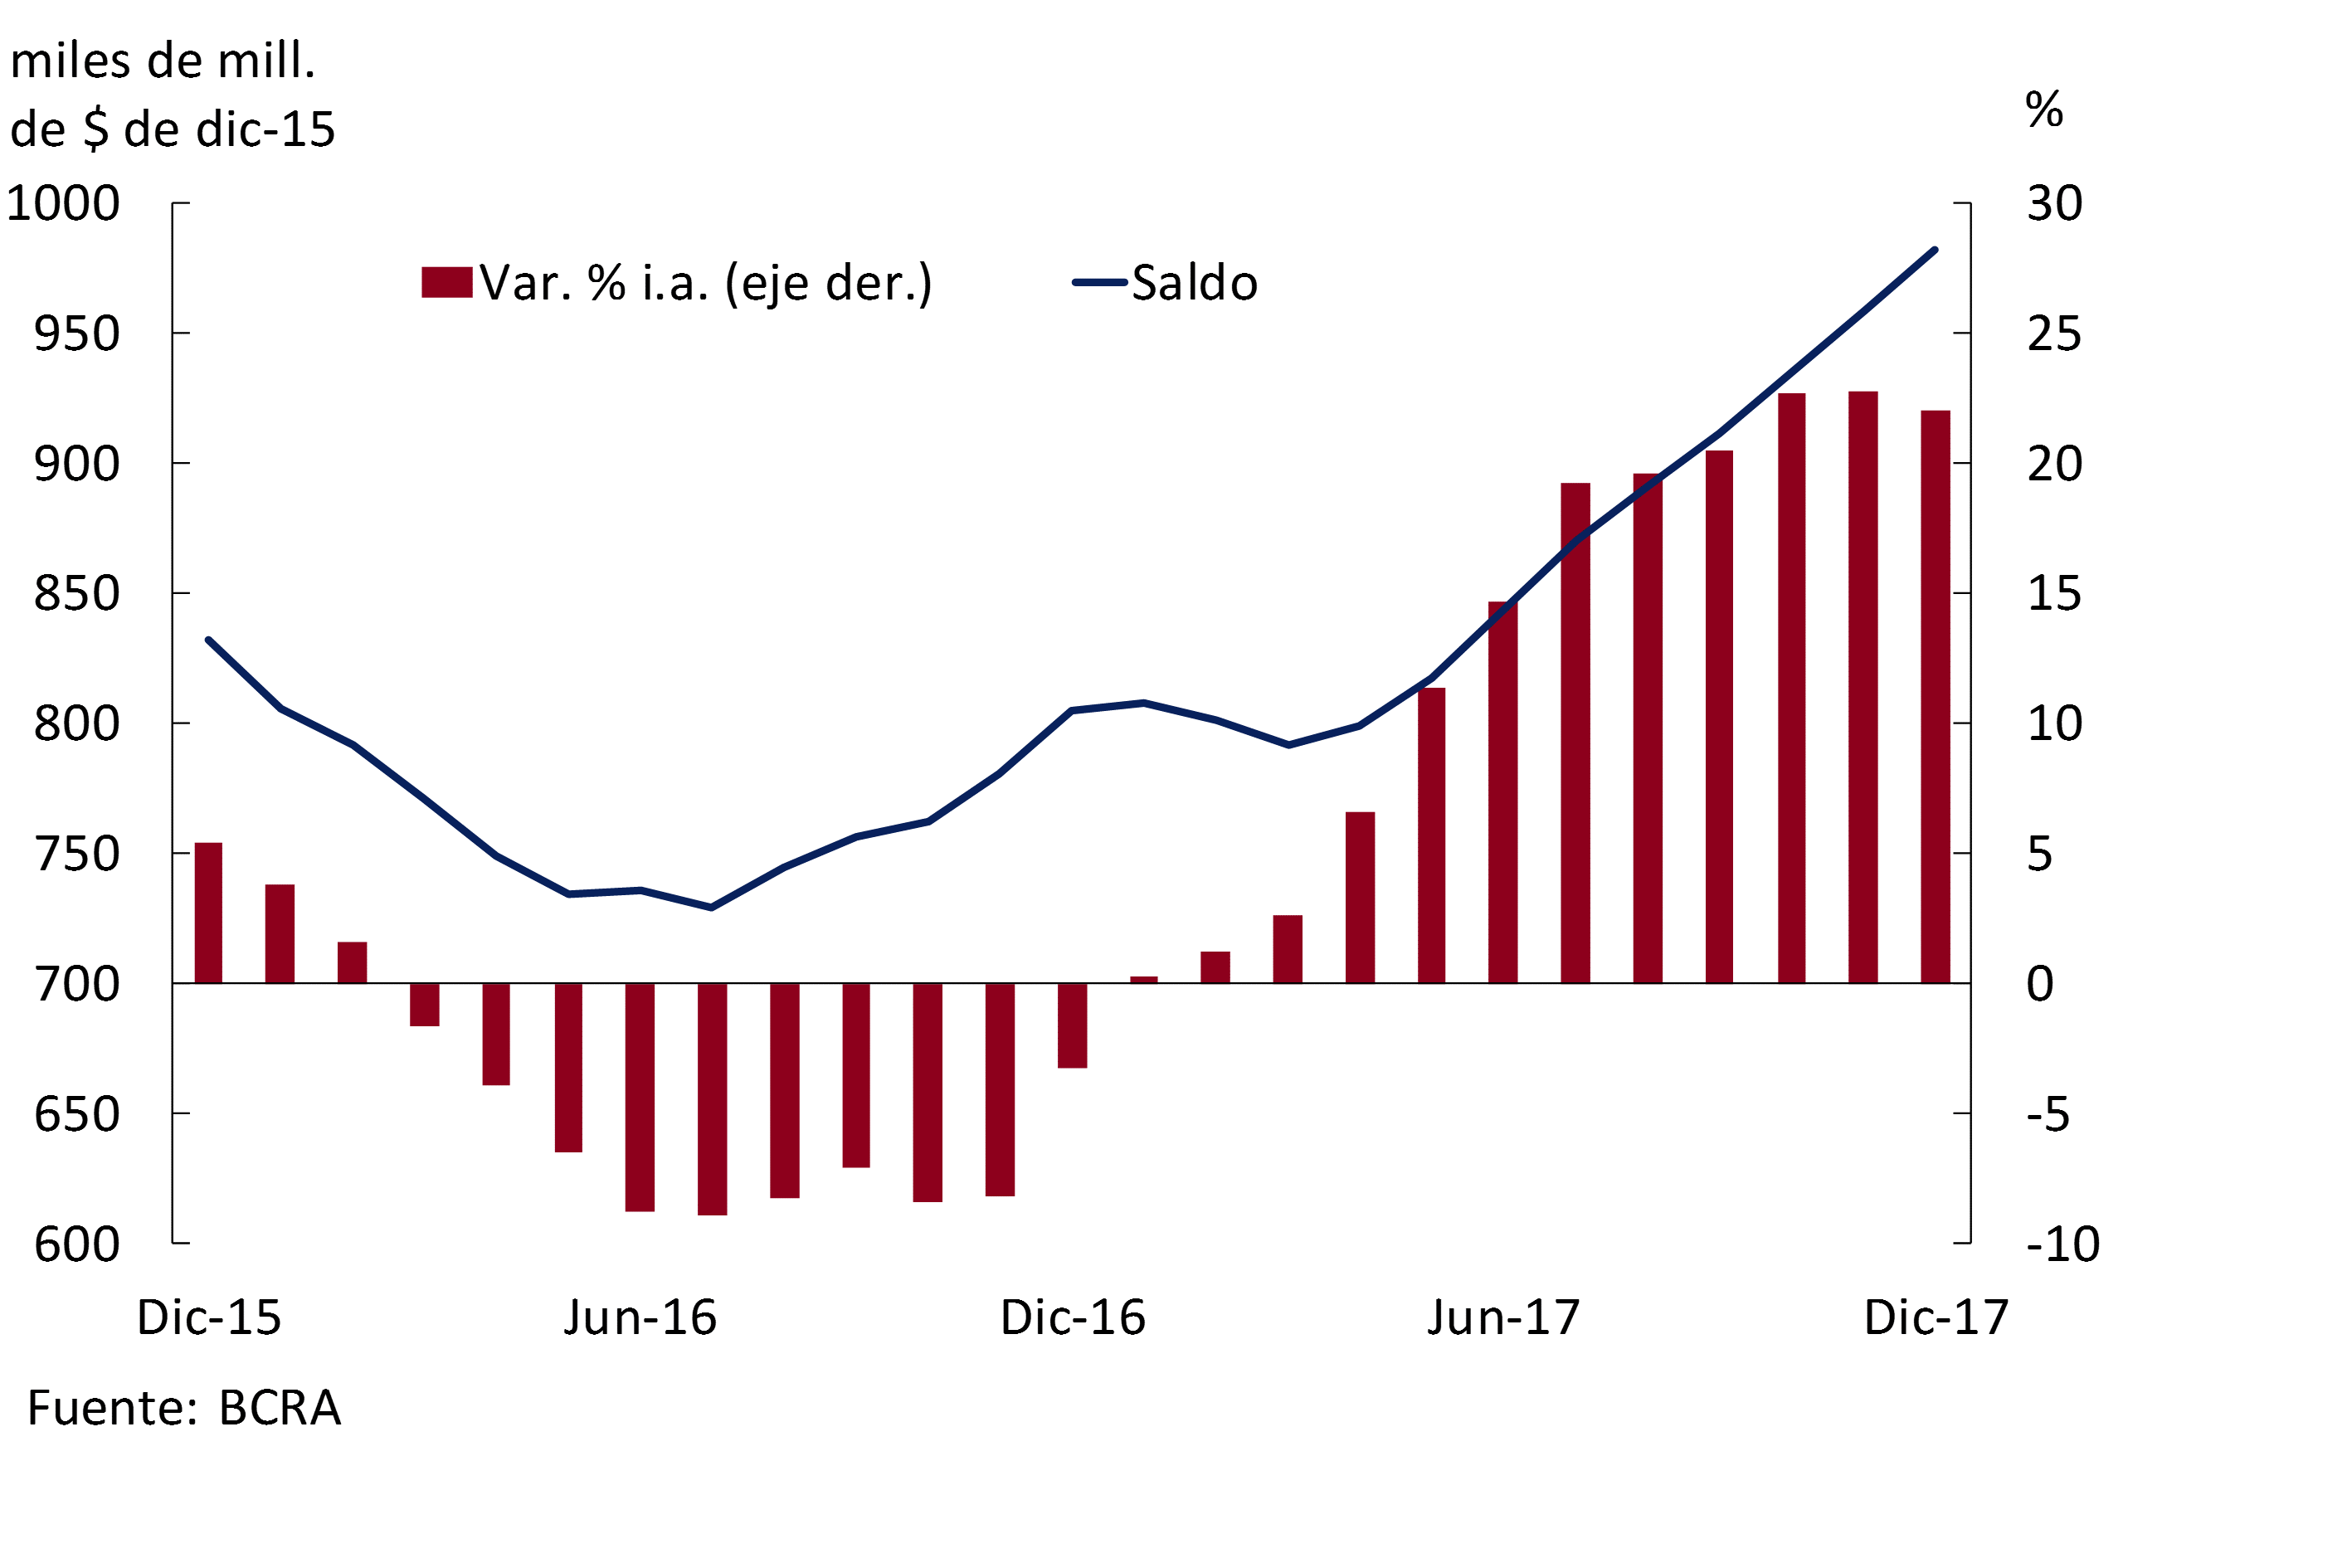
Figure 13 | Total Credit Balance to the Private Sector – Real Year-on-Year Change %
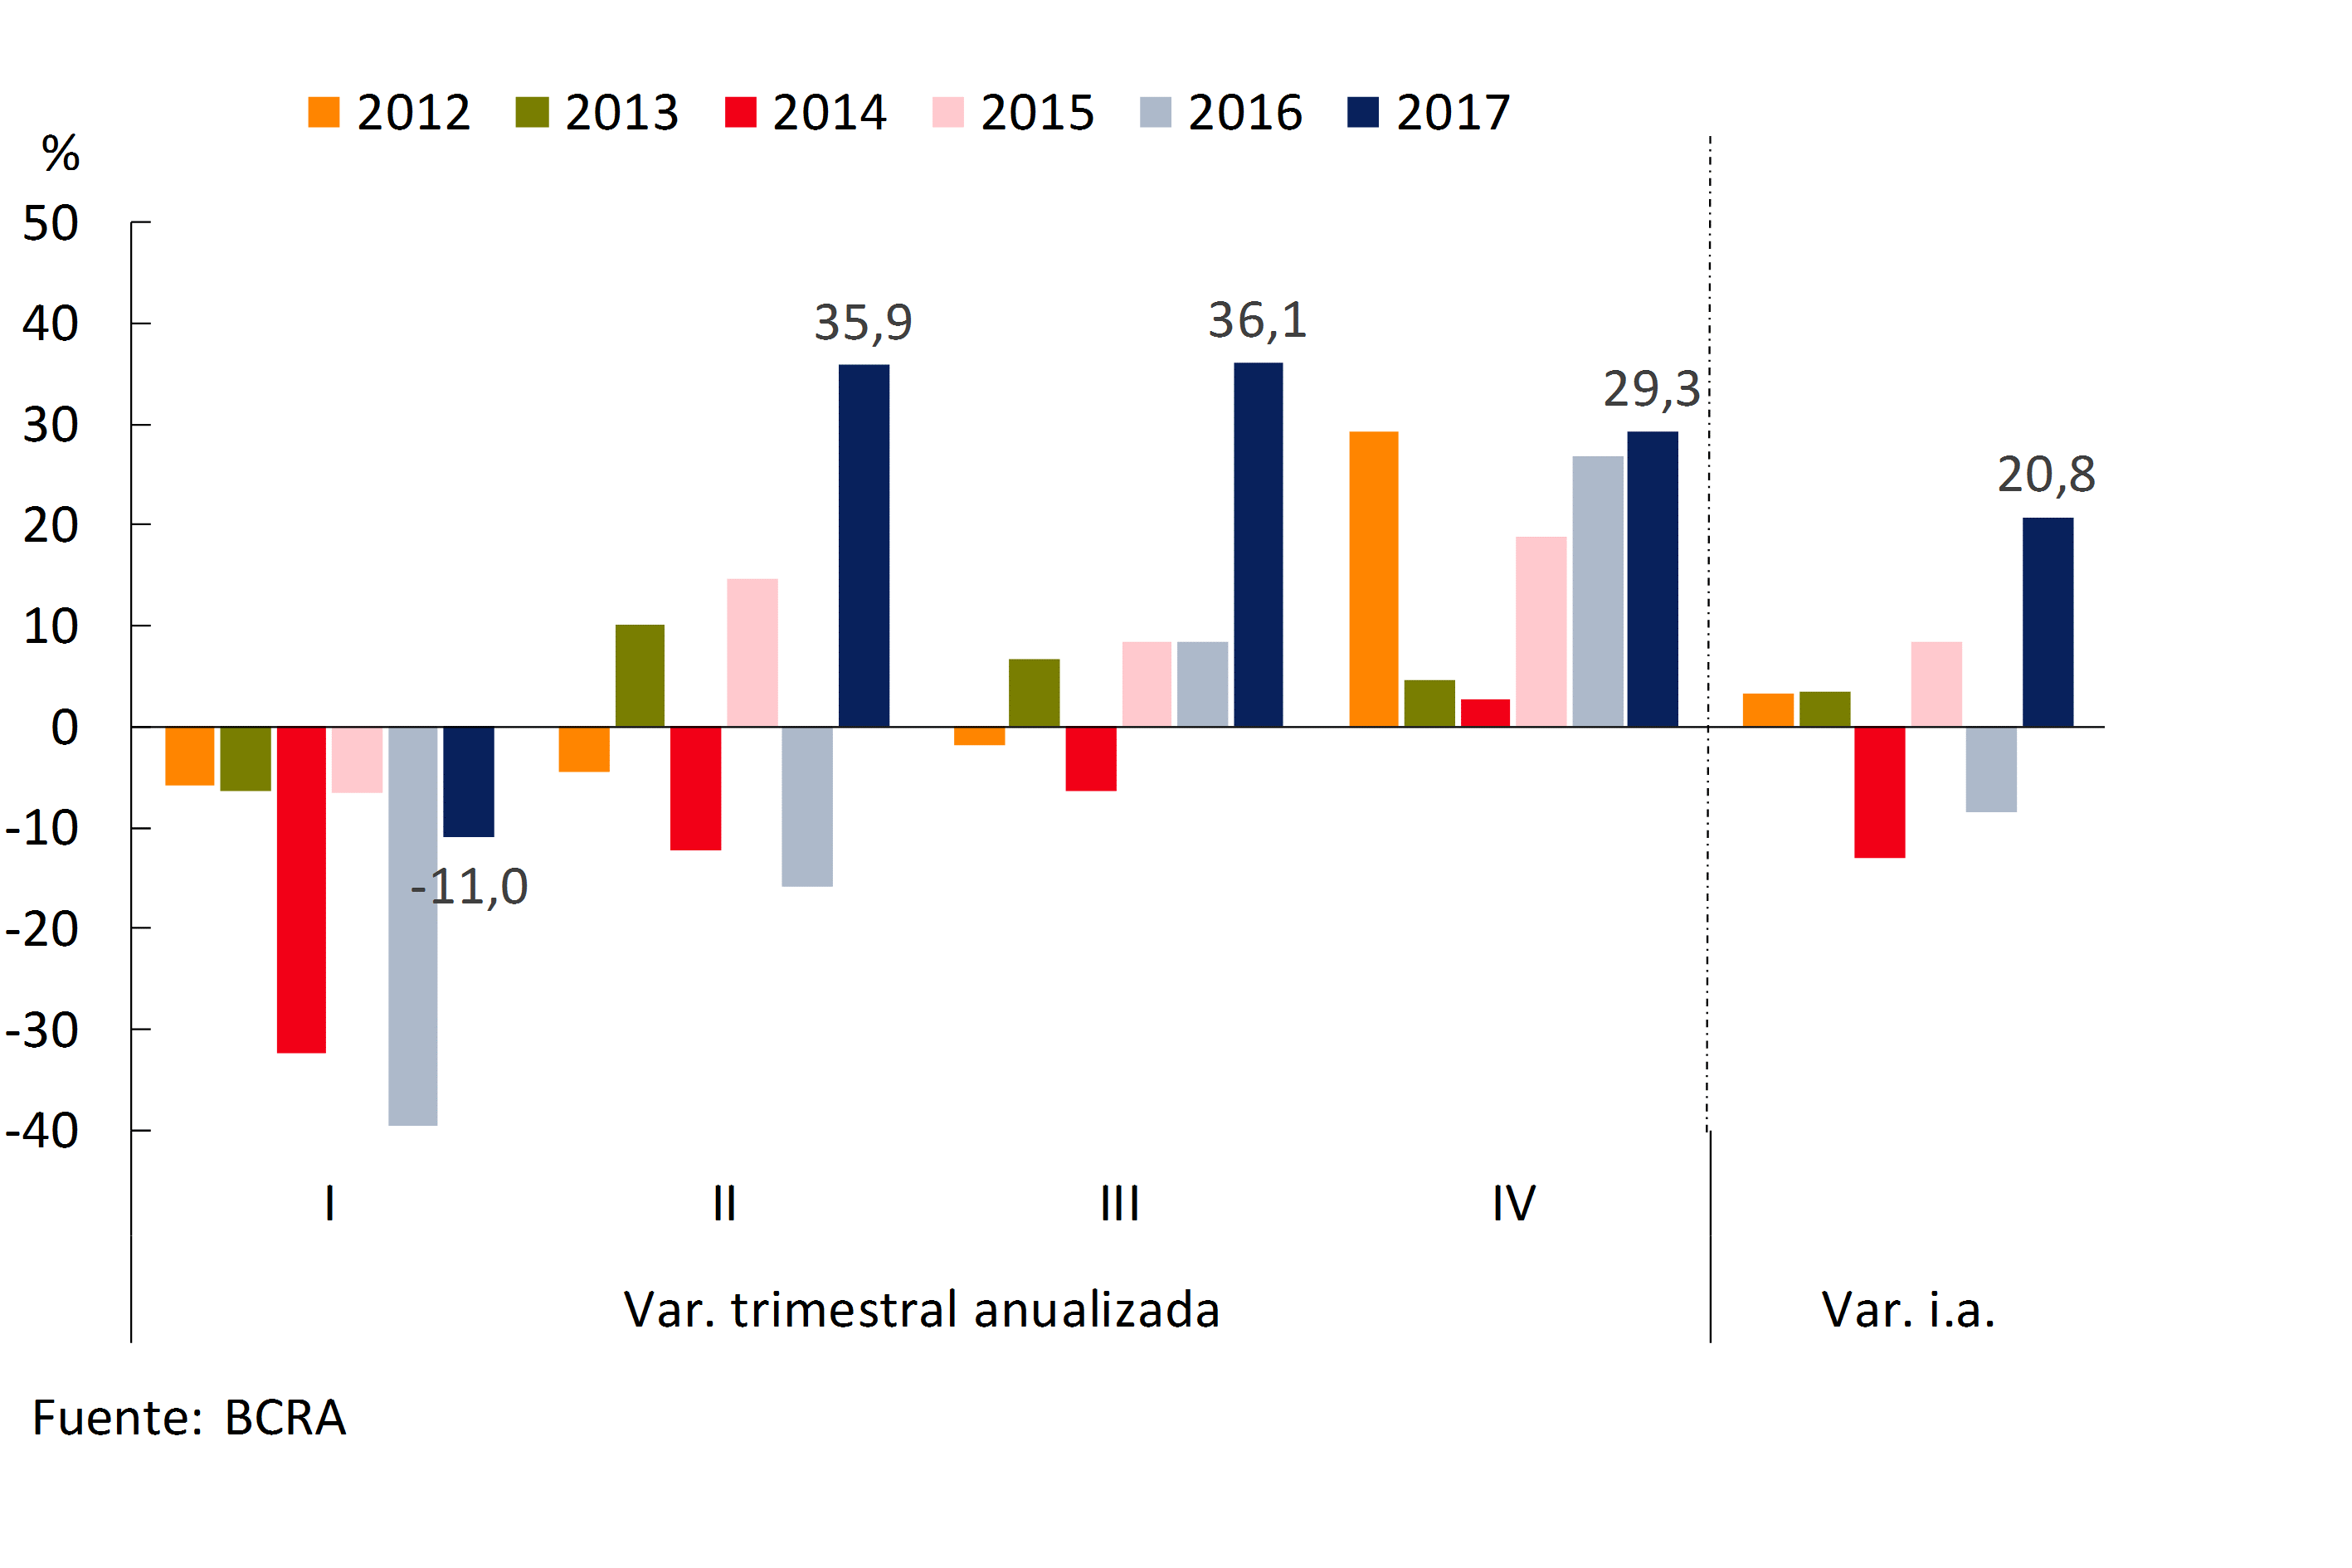
In December, total financing to companies12 increased 3.3% adjusted for inflation, with a greater relative dynamism of loans to commerce and construction. Throughout 2017, the balance of credit to firms expanded by 20.8% in real terms, above the levels of previous years (see Chart 14). The year-on-year evolution of loans to companies was mainly led by public banks, followed by domestic and foreign private banks. Throughout the year, construction financing was the most dynamic, although loans to industry continued to account for most of the year-on-year increase in loans to this segment. According to the Credit ConditionsSurvey 13 carried out by the BCRA, for the first quarter of 2018 banks expect the moderate increase in credit demand in all business segments to be sustained.
Figure 14 | Total Credit Balance to Companies – Annualized and year-on-year quarterly real % changes
In the last month of the year, the balance of loans to households did not show any changes in magnitude (0.6% adjusted for inflation compared to November). In the month, heterogeneous behaviors were recorded among the different types of credit: while mortgages increased 11.8% when adjusted for inflation, the remaining lines showed slight real reductions. Throughout 2017, loans to households increased by 22.6% in real terms (see Graph 15), reaching the highest annual value since 2007. This performance was mainly led by public banks, in a context in which all groups of banks verified real increases in their credit balances channeled to this segment. Disaggregated by lines, in 2017 the performance of mortgage loans stood out, accumulating a growth of 148% when adjusted for inflation in the year (see Chart 16). In this context, the number of mortgage debtors14 increased continuously throughout the year, reaching a total of 210,000 in December (see Graph 17), almost 31,500 more than at the end of 2016 on a net basis. In particular, in 2017, almost 58,500 new mortgage debtors (registrations) joined the local financial system, reaching the highest level of incorporation in recent years. It should be noted that according to the Credit Conditions Survey, for the first quarter of 2018 the entities would expect the demand for mortgage credit to continue to grow, although at a slower rate than that observed in previous quarters.
Figure 15 | Total Credit Balance to Households – Annualized and year-on-year quarterly real % changes
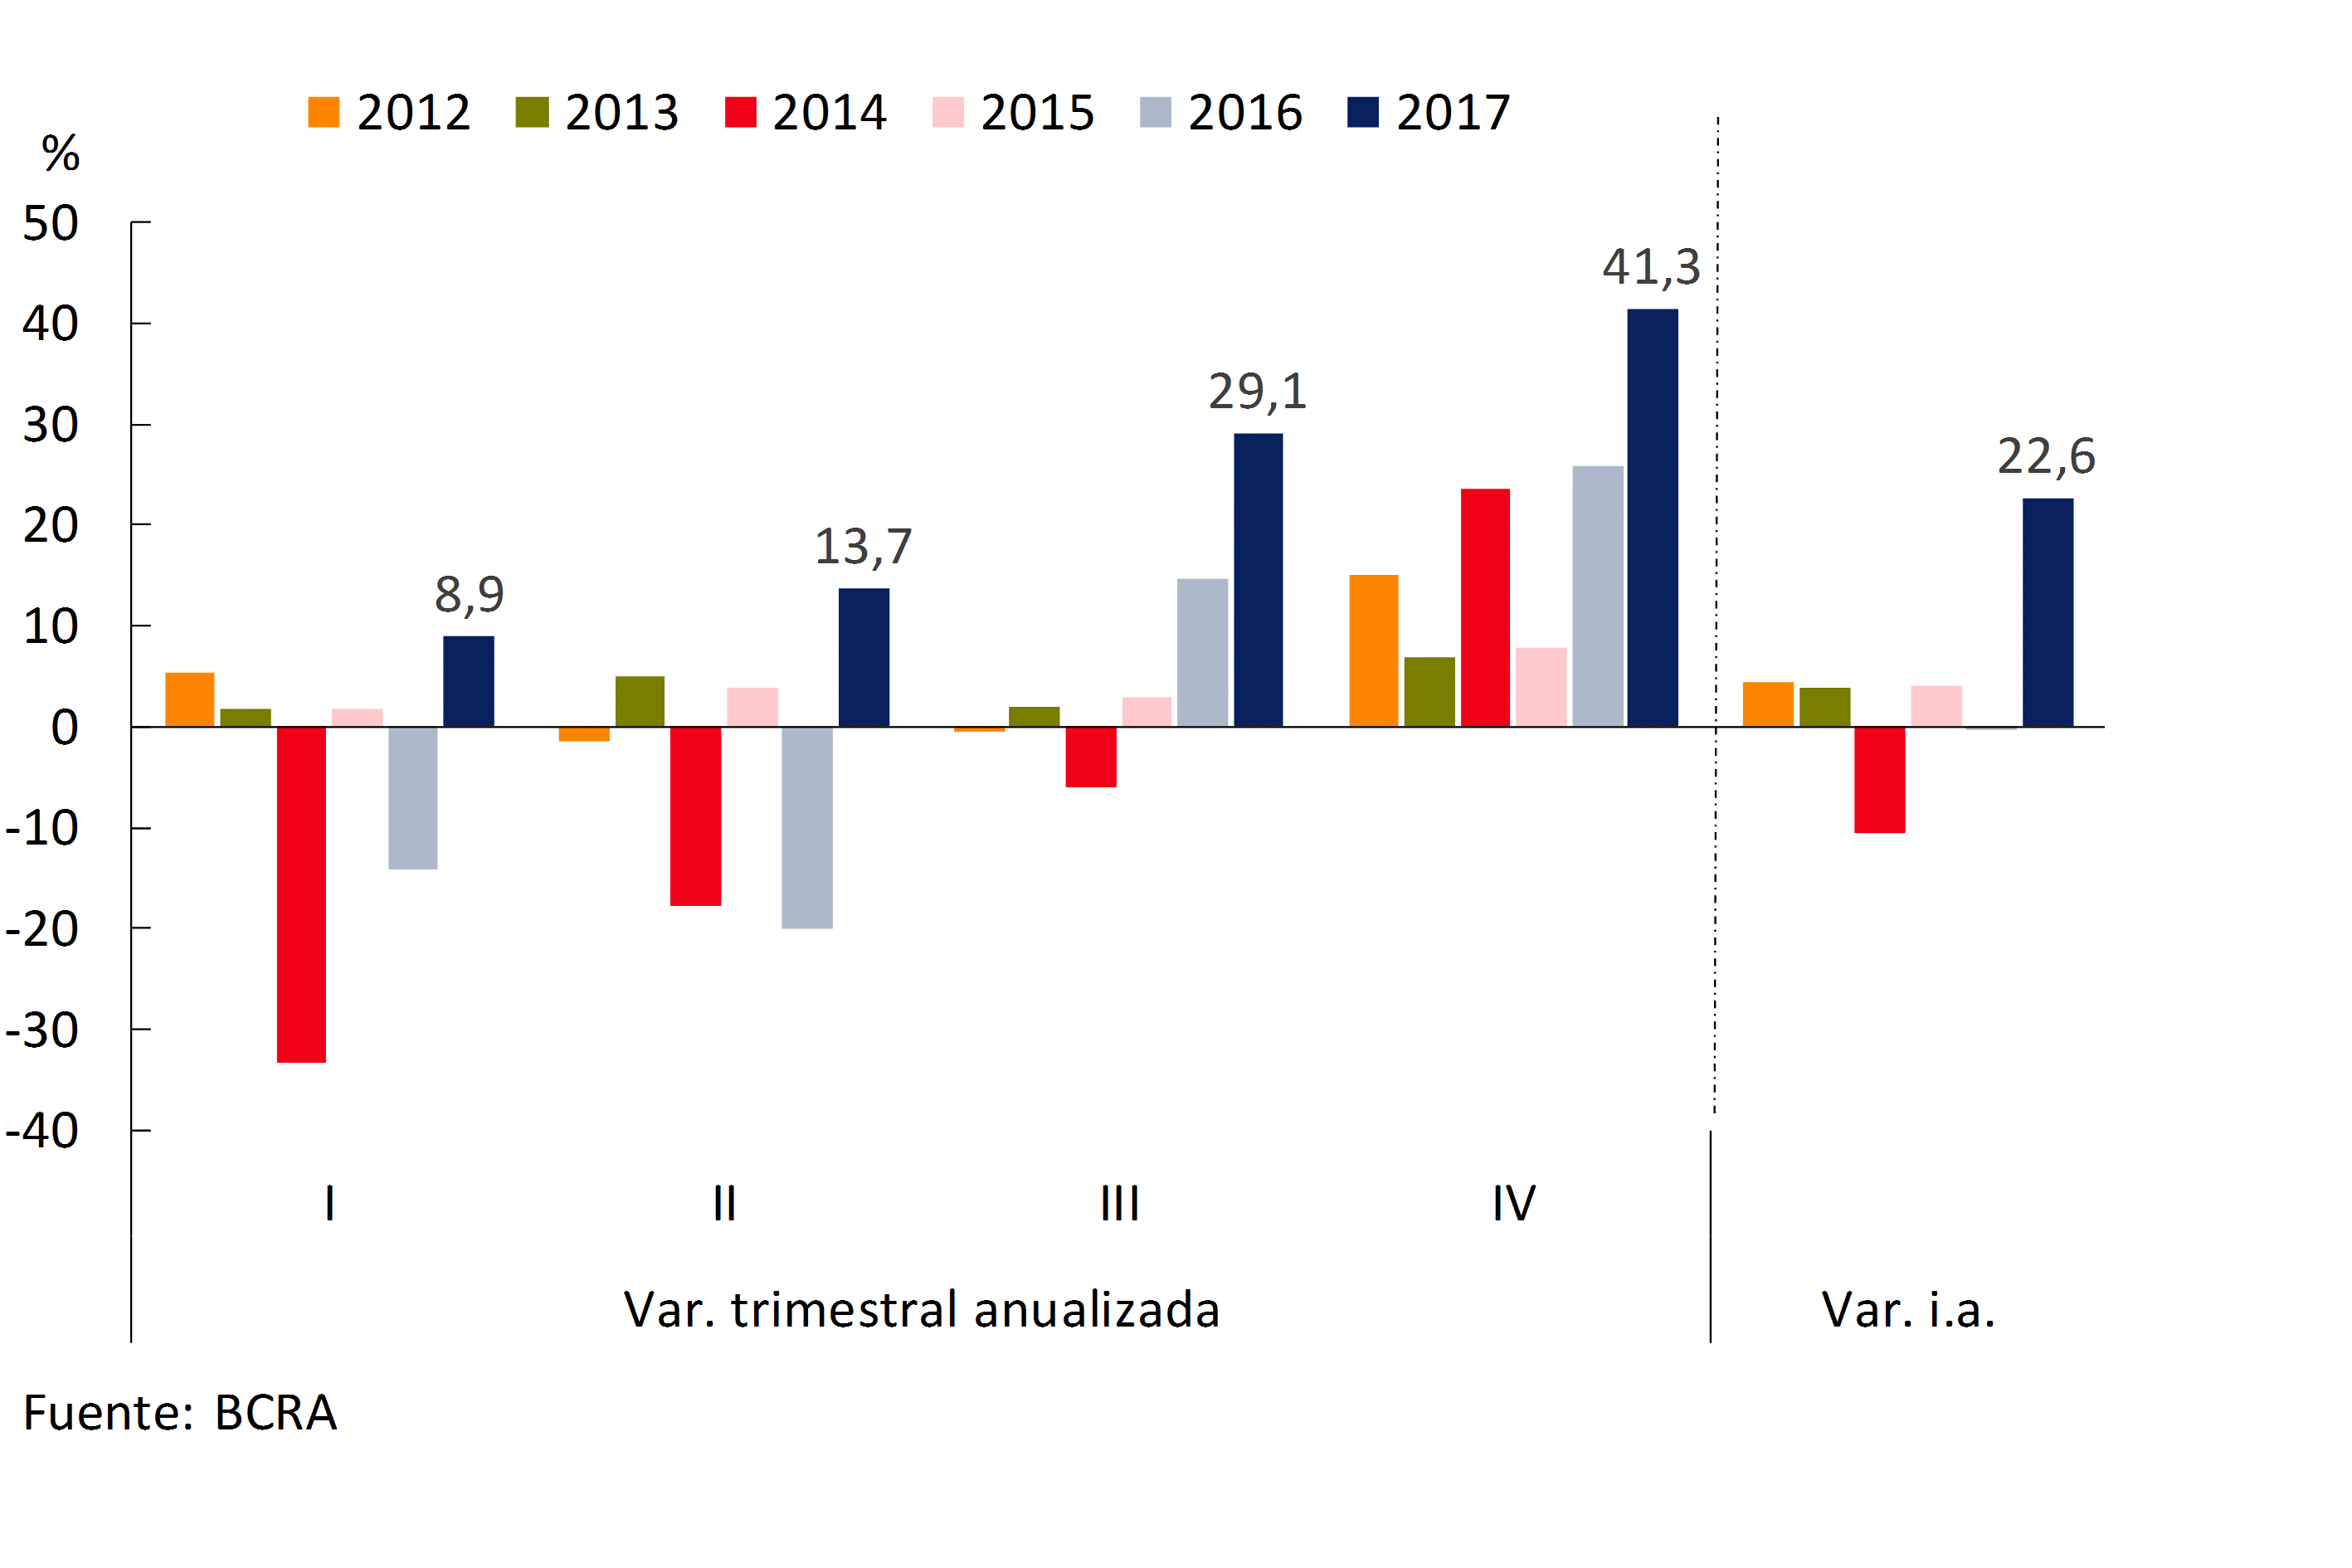
Figure 16 | Mortgage Credit Balance to Families
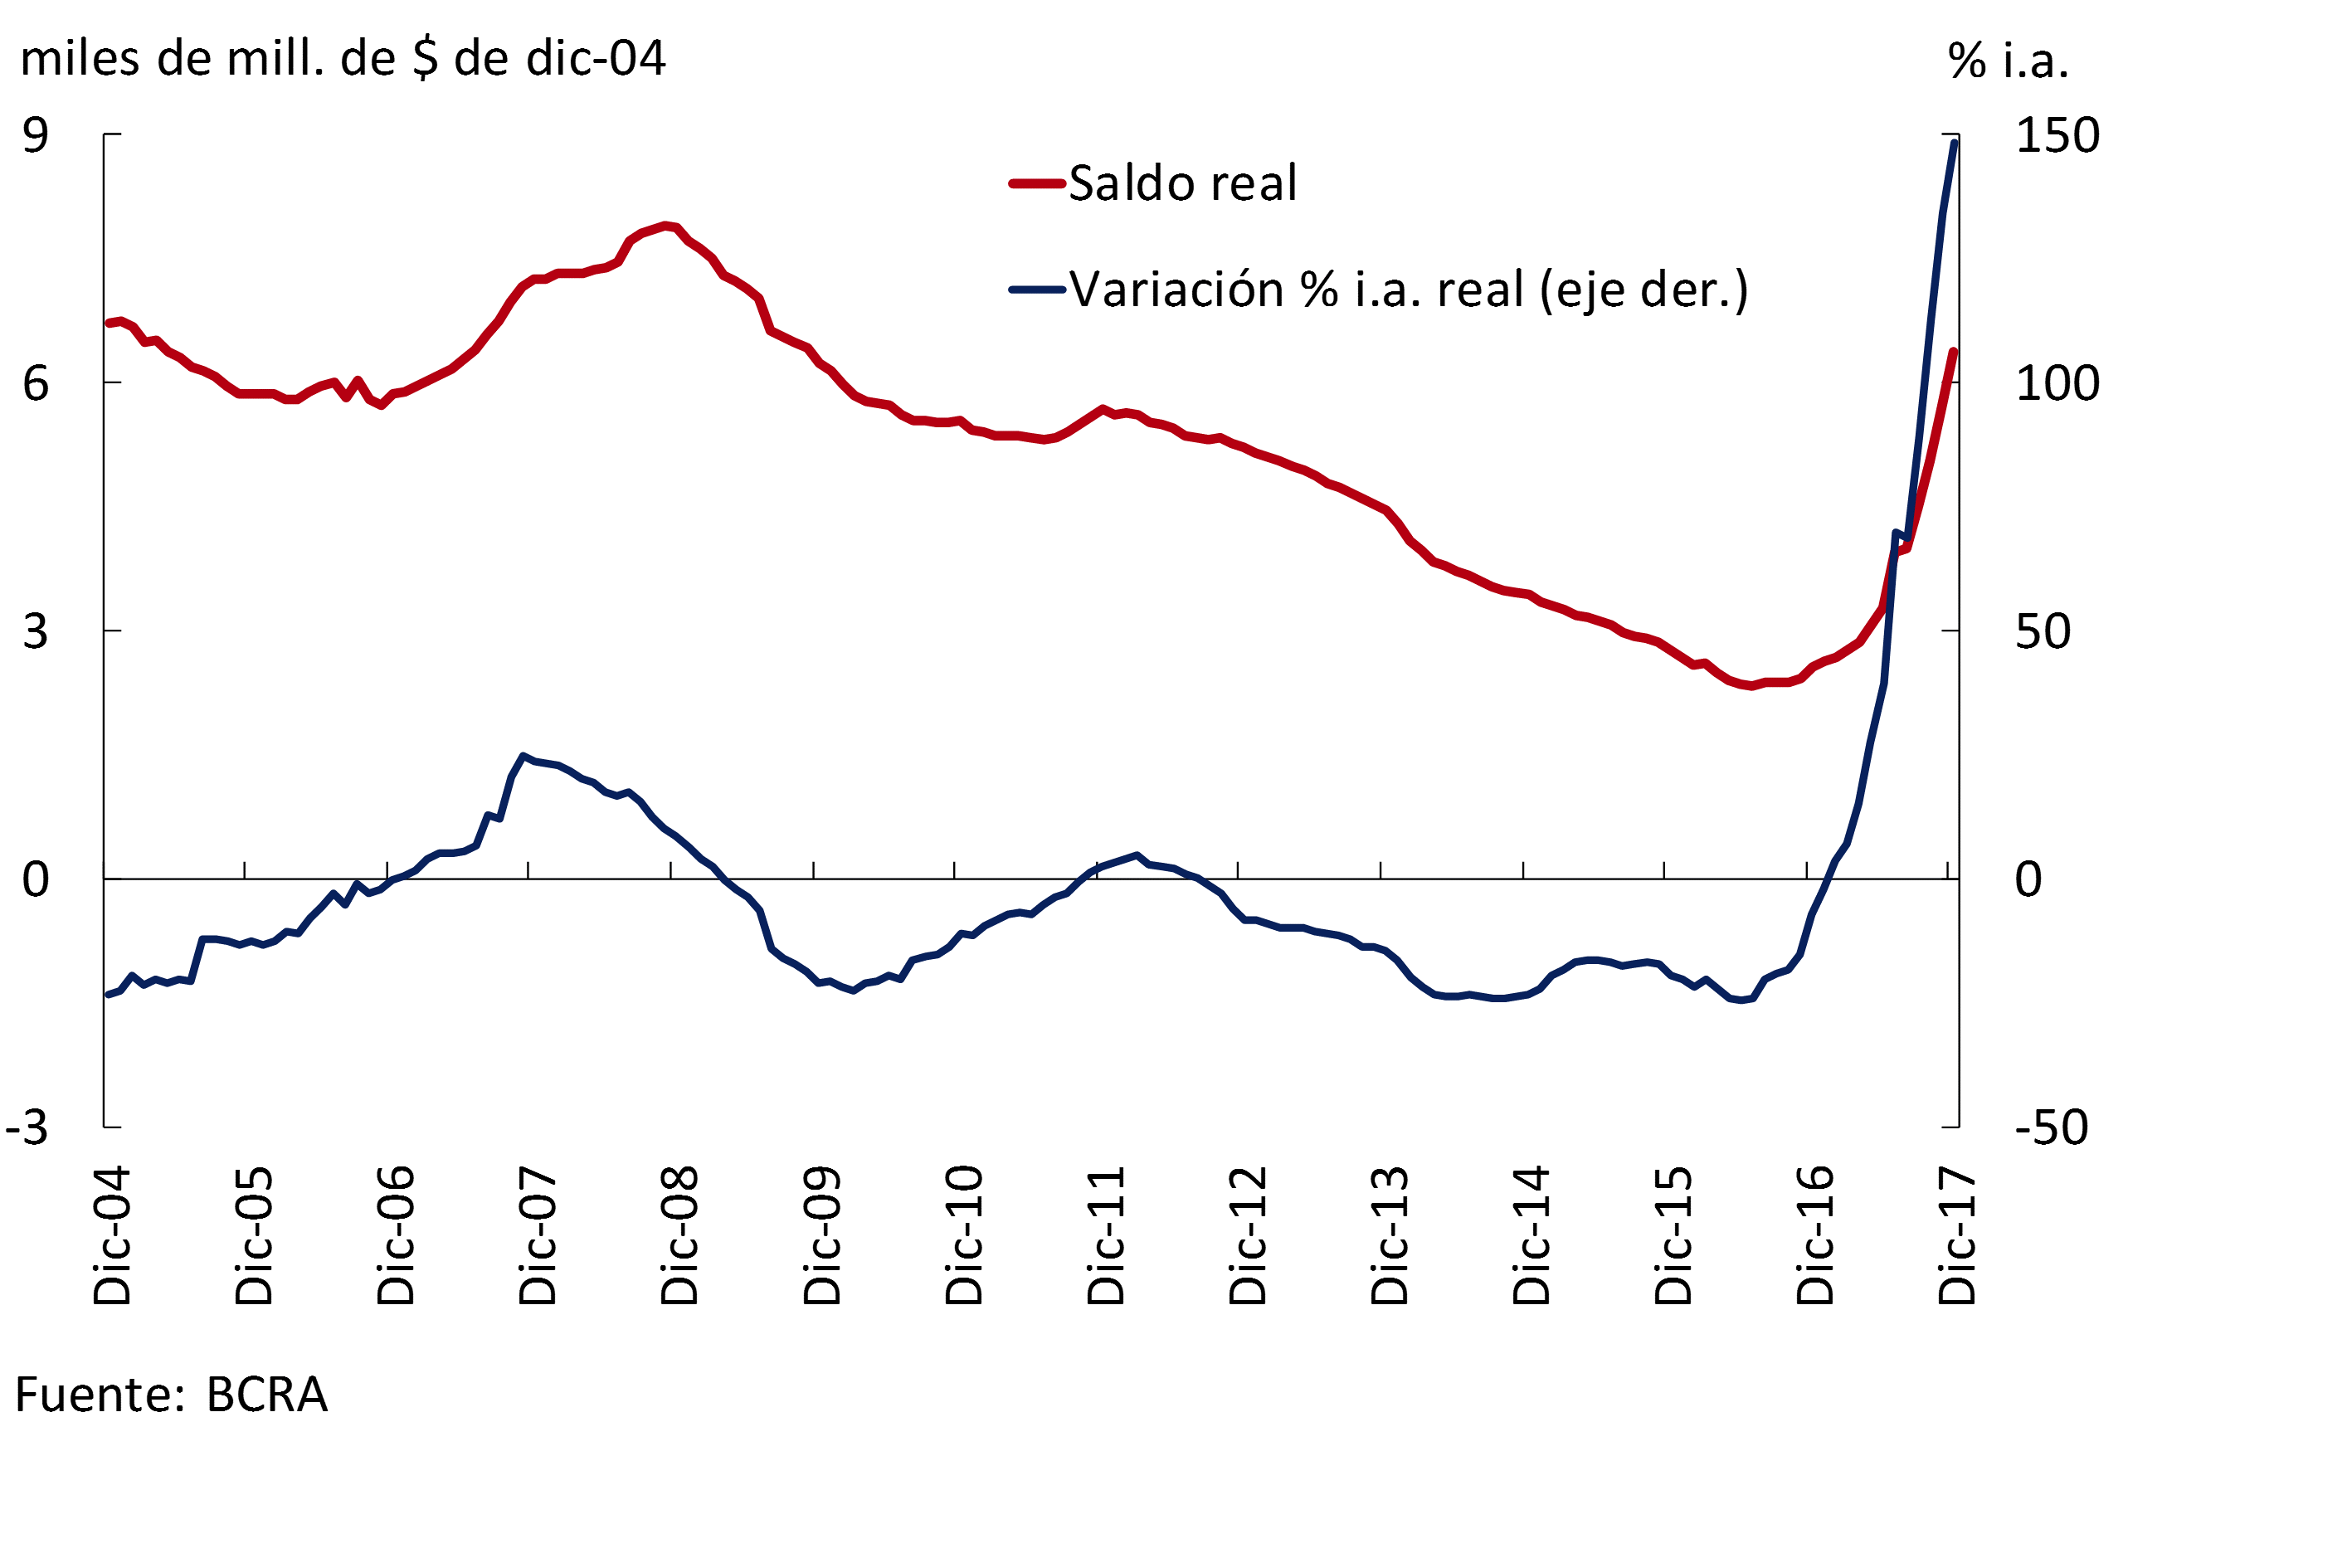
Figure 17 | Mortgage Bank Debtors – Individuals
Throughout 2017, the positive dynamics observed by mortgage loans to households was mainly explained by those granted in UVA. The latter, in particular, accounted for more than 92% of the total amount of mortgage credit granted to individuals in that period. The diffusion of mortgage loans in UVA in the course of 2017 facilitated access to housing for the different income strata of the population, not only for the richest segments15.
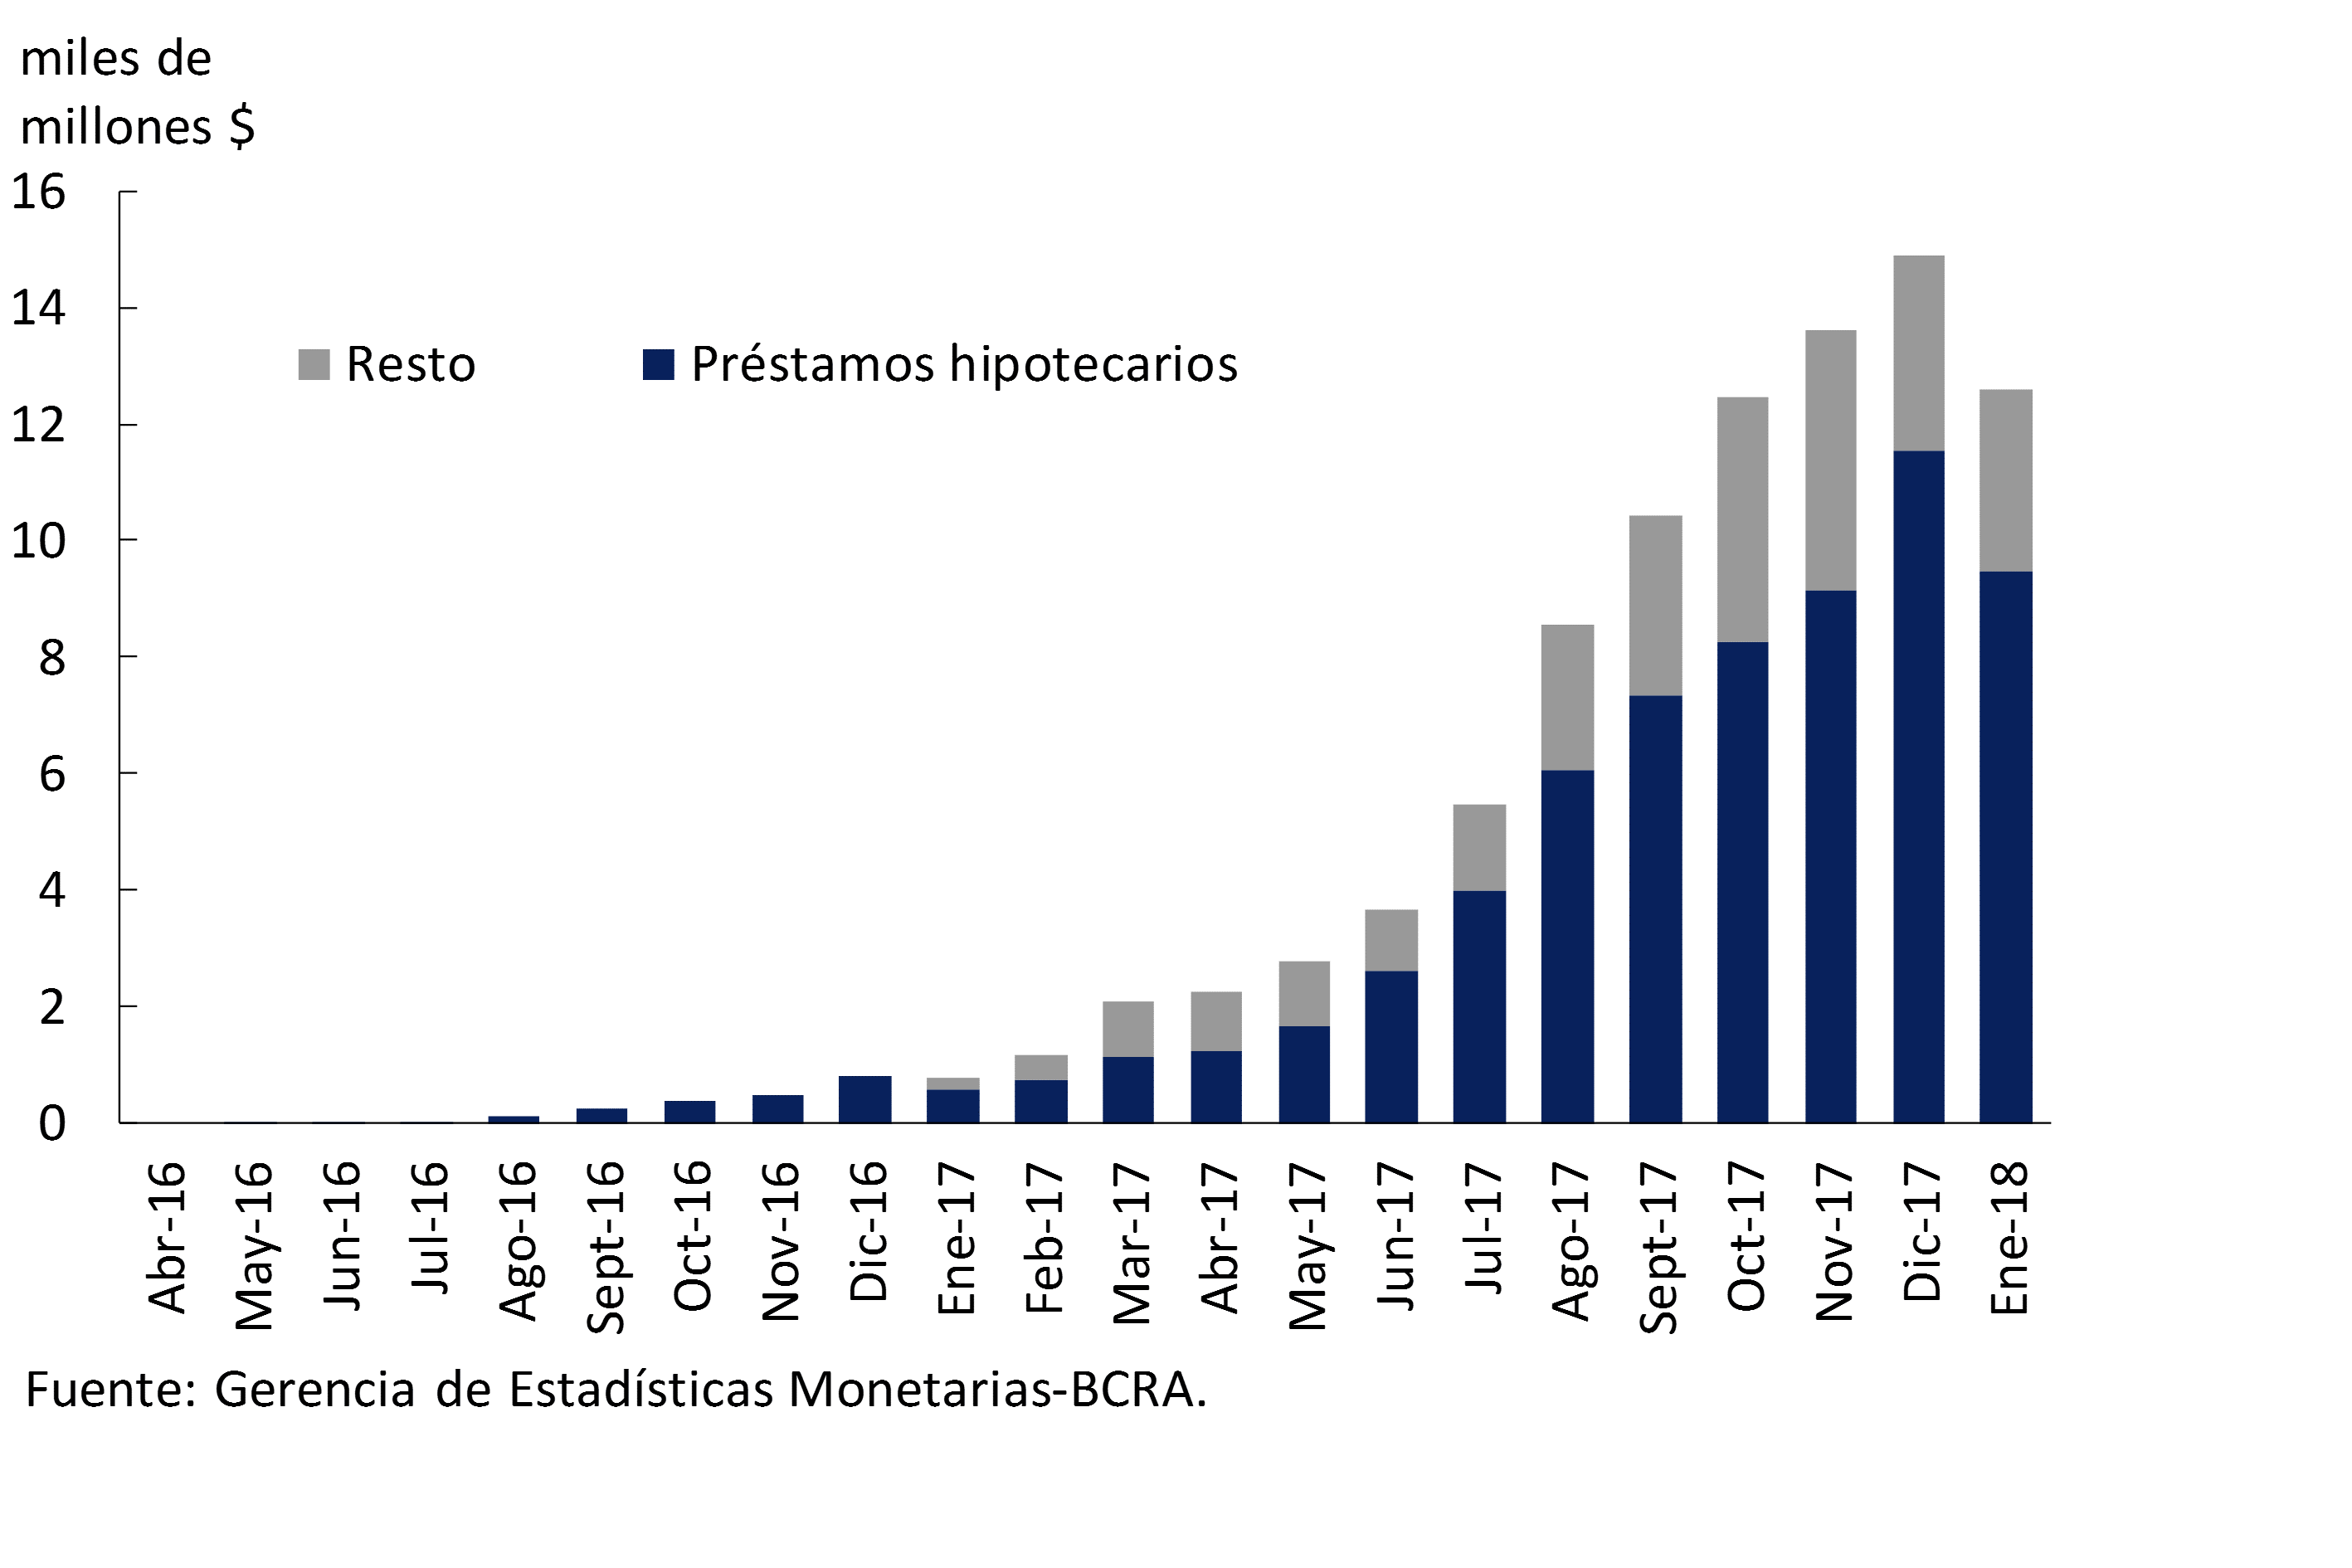
In a context of lower seasonal demand, in the first month of 2018 total UVA financing to individuals and legal entities exceeded $12,500 million (see Graph 18), with 75% being channeled to mortgage loans, 17% to personal loans and the rest to pledges. In this framework, since the launch of the UVA loans in April 2016, until the beginning of 2018, more than $92,800 million in UVA financing has been granted.
Figure 18 | UVA Financing – Amounts Granted
In the last month of 2017, nominal interest rates operating in national currency with the private sector16 increased in almost all lines of credit, with documents verifying the largest relative increase. The only active interest rate that showed a slight drop in the month was the one agreed on pledges (-0.4 p.p.). Taking into account the interest rates operated in UVA, in December they were reduced slightly, to an average of 5.9%.
V. Portfolio Quality
In the last month of 2017, the non-performing loan ratio to the private sector fell slightly to 1.8% of the total portfolio, a level similar to that of a year ago (see Chart 19). This indicator showed an increase in the first half of the year (mainly by foreign private banks), while in the second part of the year it fell across the board among financial institutions (mostly in public banks).
Figure 19 | Irregularity of Credit to the Private Sector – Irregular portfolio / Total financing (%)
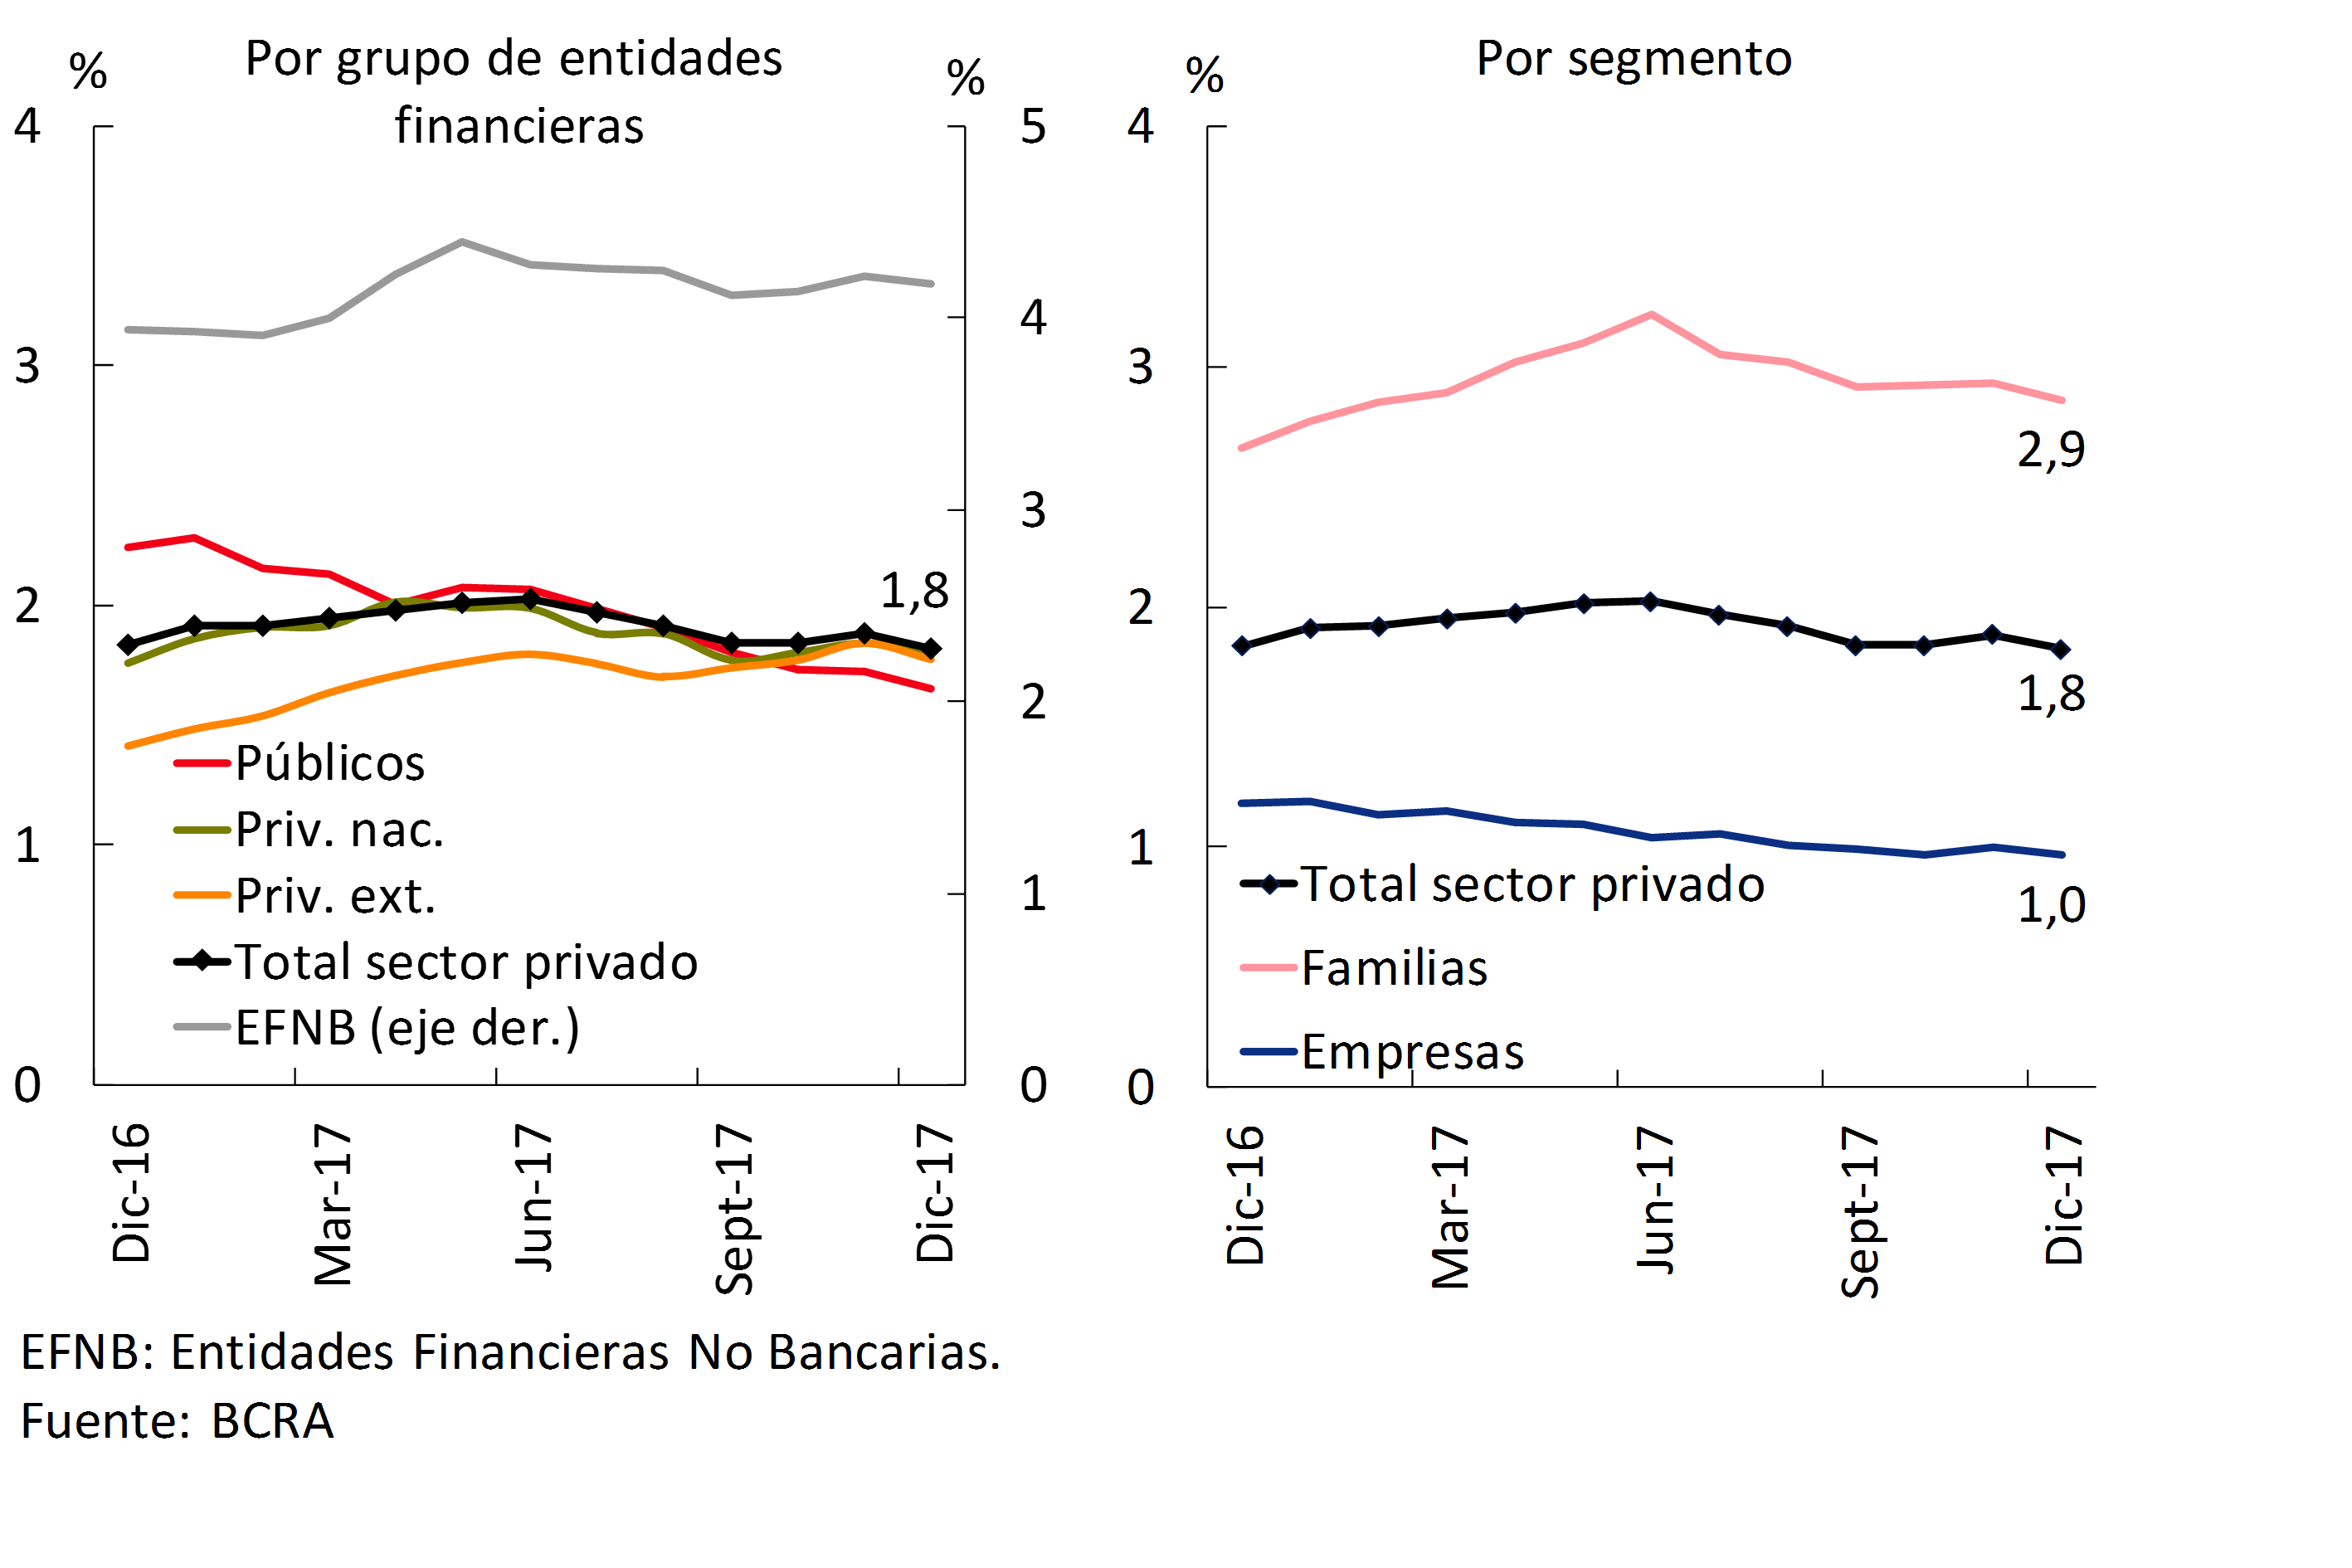
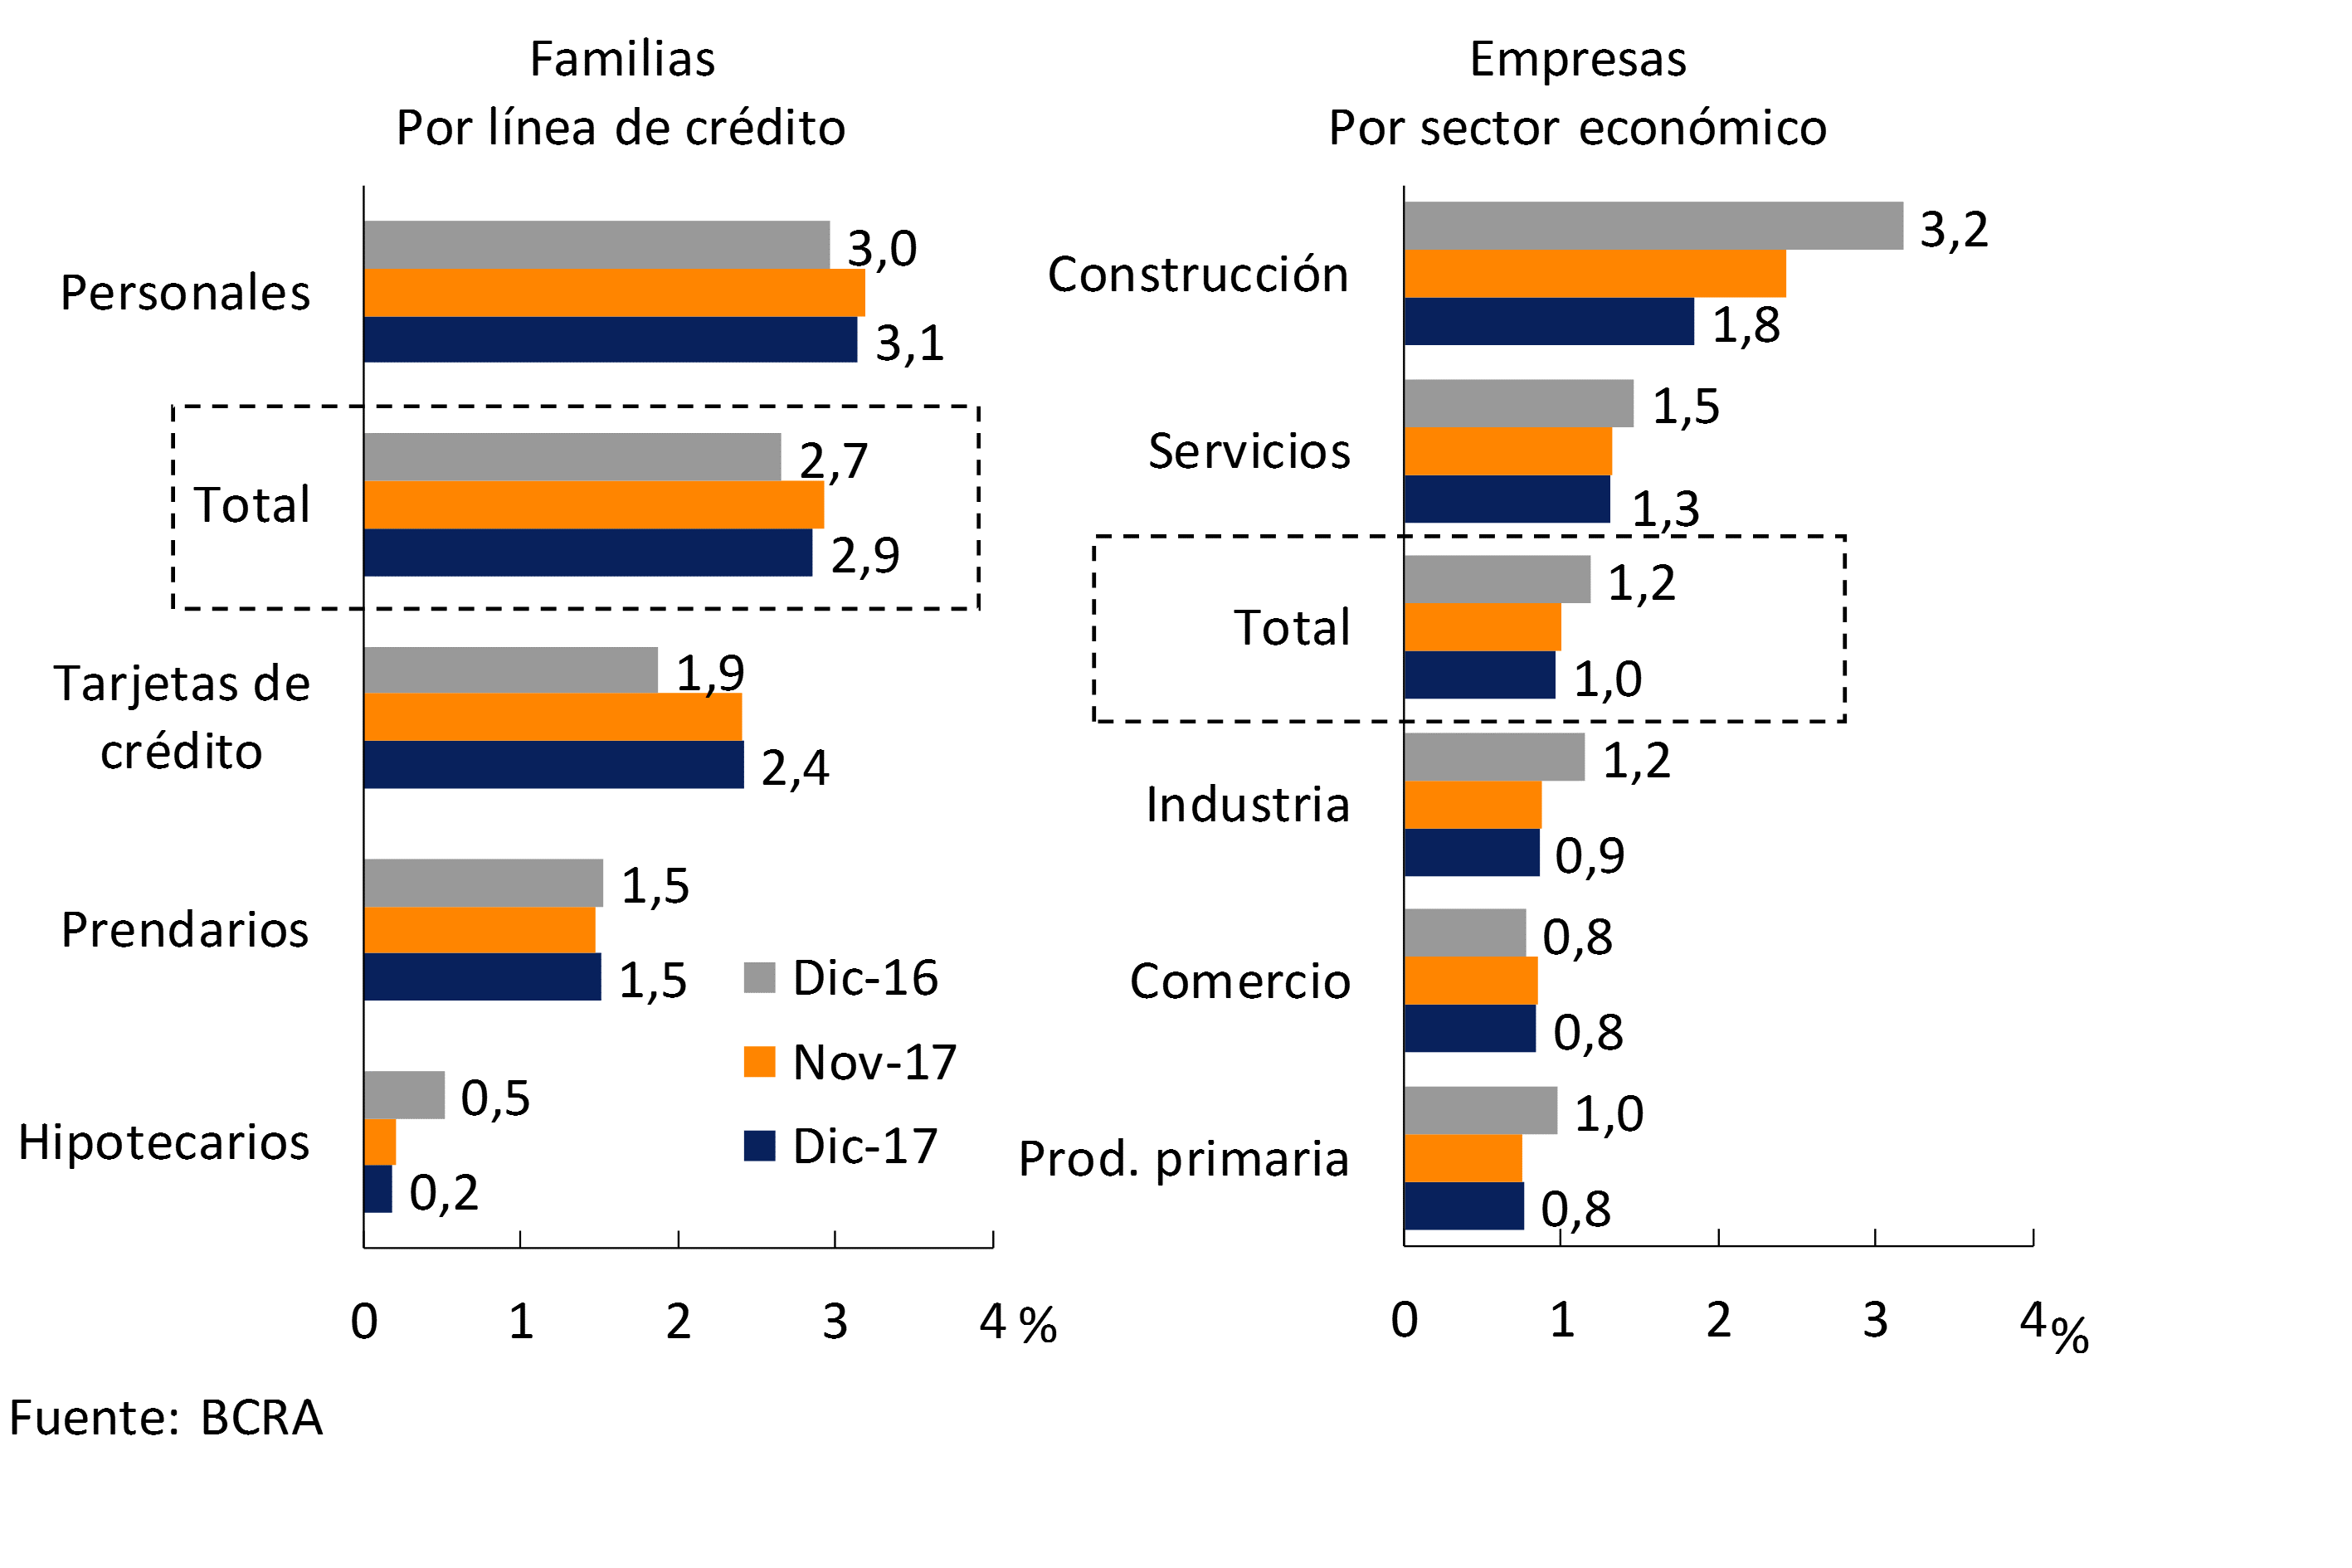
Non-performing loans to households decreased slightly in December, standing at 2.9% of the portfolio (see Chart 20). In a year-on-year comparison, this coefficient had a small increase, a performance explained by the lines of consumption —credit cards and personal—. On the other hand, the irregularity of mortgage loans to households decreased throughout 2017, while that of title loans remained unchanged in magnitude in the period.
In December, the NPL ratio of loans to firms remained around 1% (see Chart 20). In the last twelve months, a slight improvement in the credit situation of companies was observed, a performance that was reflected to a greater extent in loans to construction and industry.
Figure 20 | Irregularity of Credit to the Private Sector – Irregular Portfolio / Financing (%)
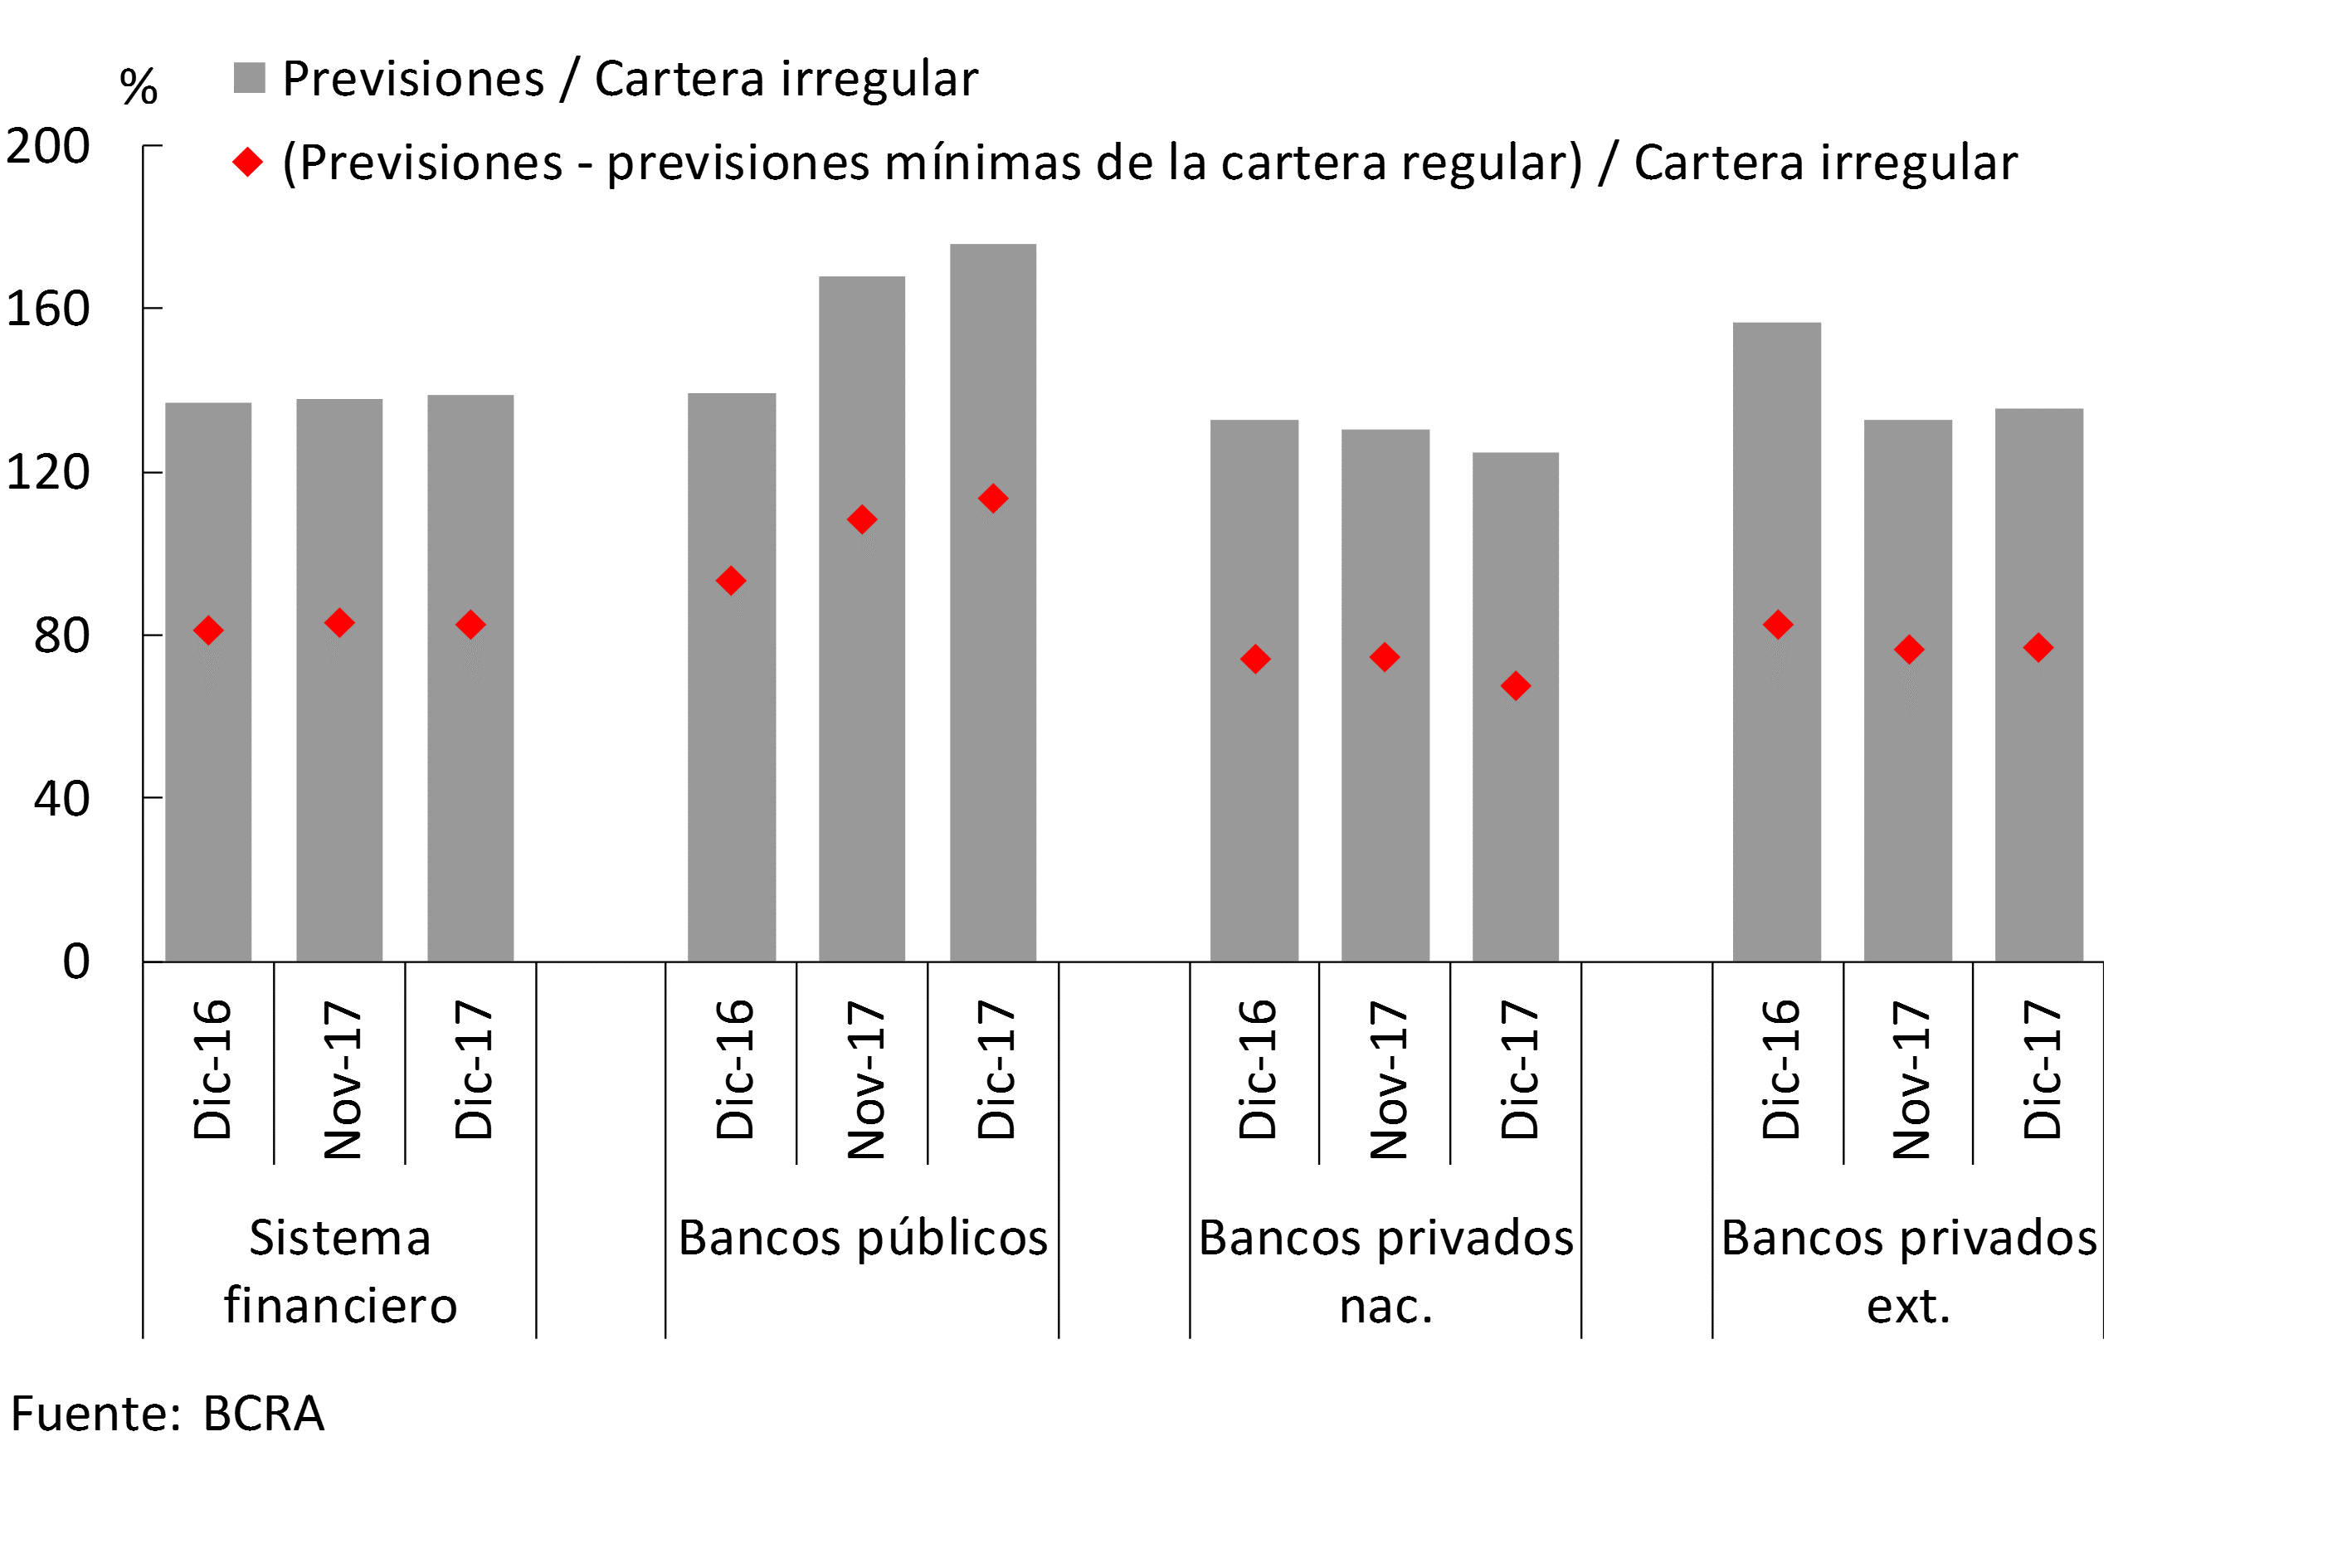
At the end of 2017, the set of financial institutions continued to show a comfortable level of forecasting. The balance of accounting forecasts of the financial system represented 139% of the loans in an irregular situation in December (see Graph 21). Excluding the minimum forecasts attributable to the regular portfolio, this ratio would stand at 83%.
Figure 21 | Forecasts and Irregular Portfolio by Group of Banks
VI. Solvency
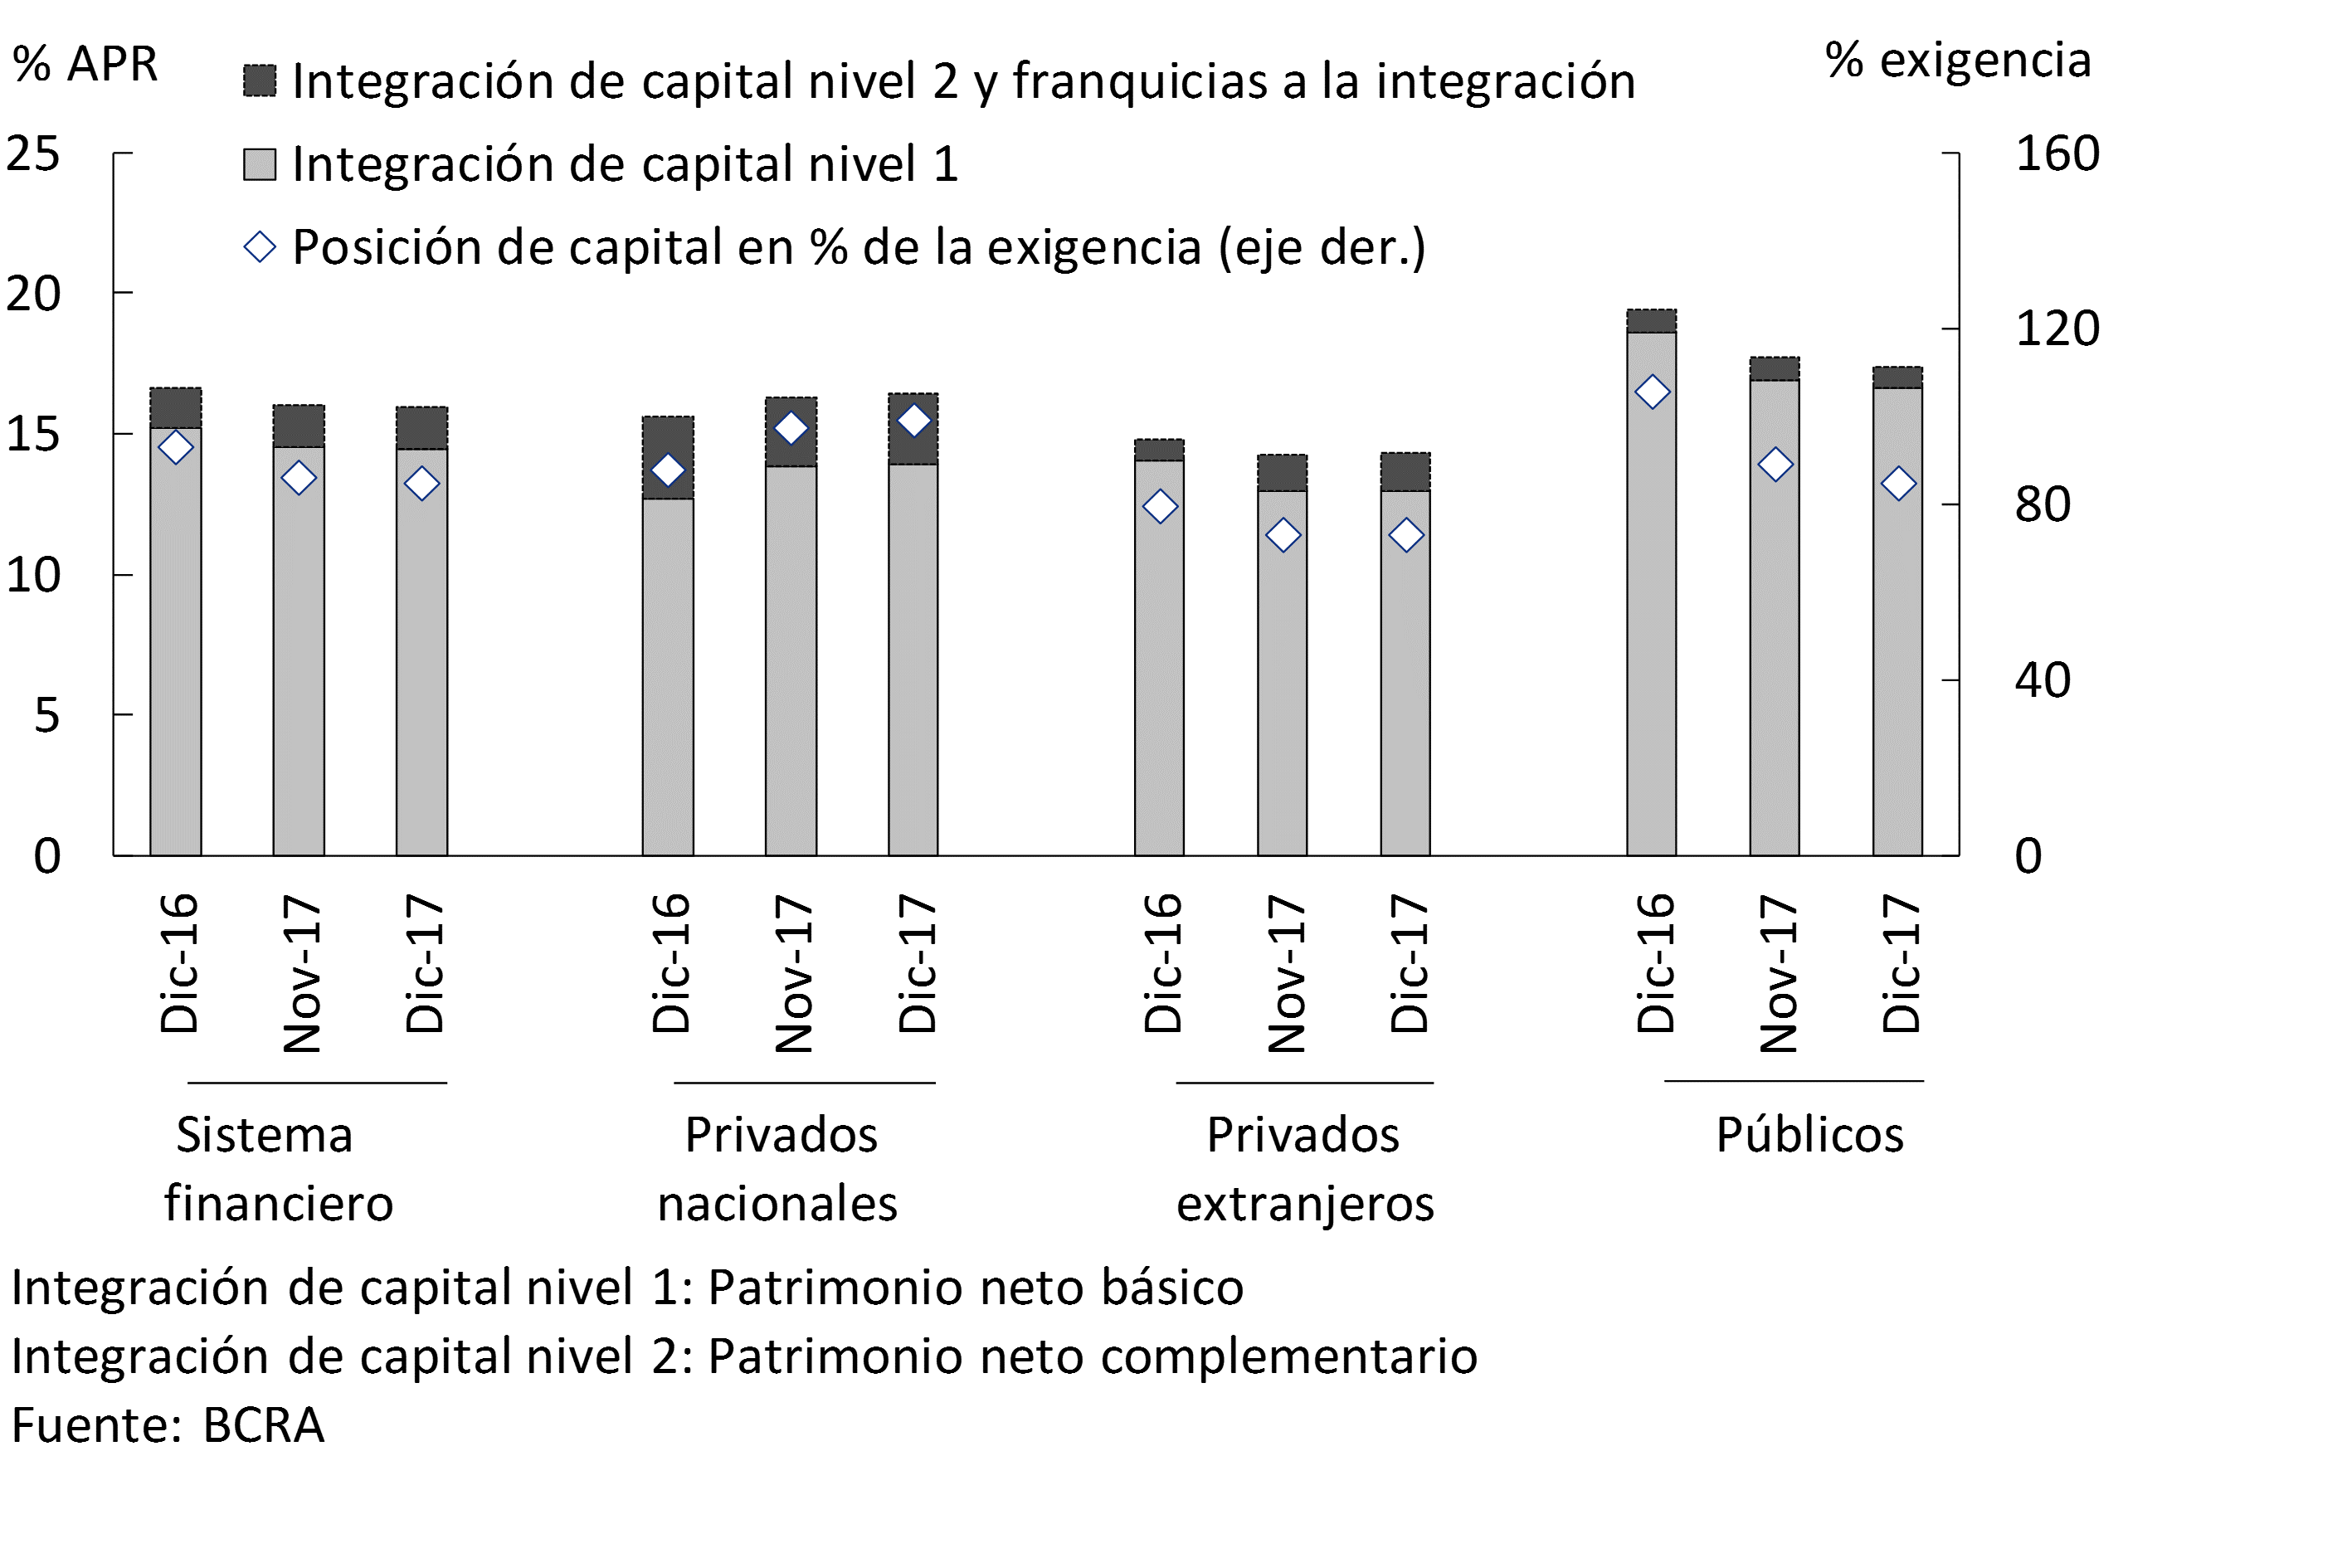
At the end of the year, solvency indicators of the aggregate financial system remained at high levels. The capital integration of the banks as a whole did not register significant changes with respect to November, representing 16% of risk-weighted assets (RWA) in the last month of the year (see Chart 22). In a year-on-year comparison, this ratio fell slightly (-0.7 p.p.), mainly in public and foreign private banks. This decrease was the result of the increase in RWAs, driven by the dynamism of credit to the private sector. Tier 1 capital17 totaled 14.5% of RWAs in December. The excess integration of regulatory capital in the system was equivalent to 85% of the regulatory requirement.
Figure 22 | Integration and Excess Regulatory Capital (Position)
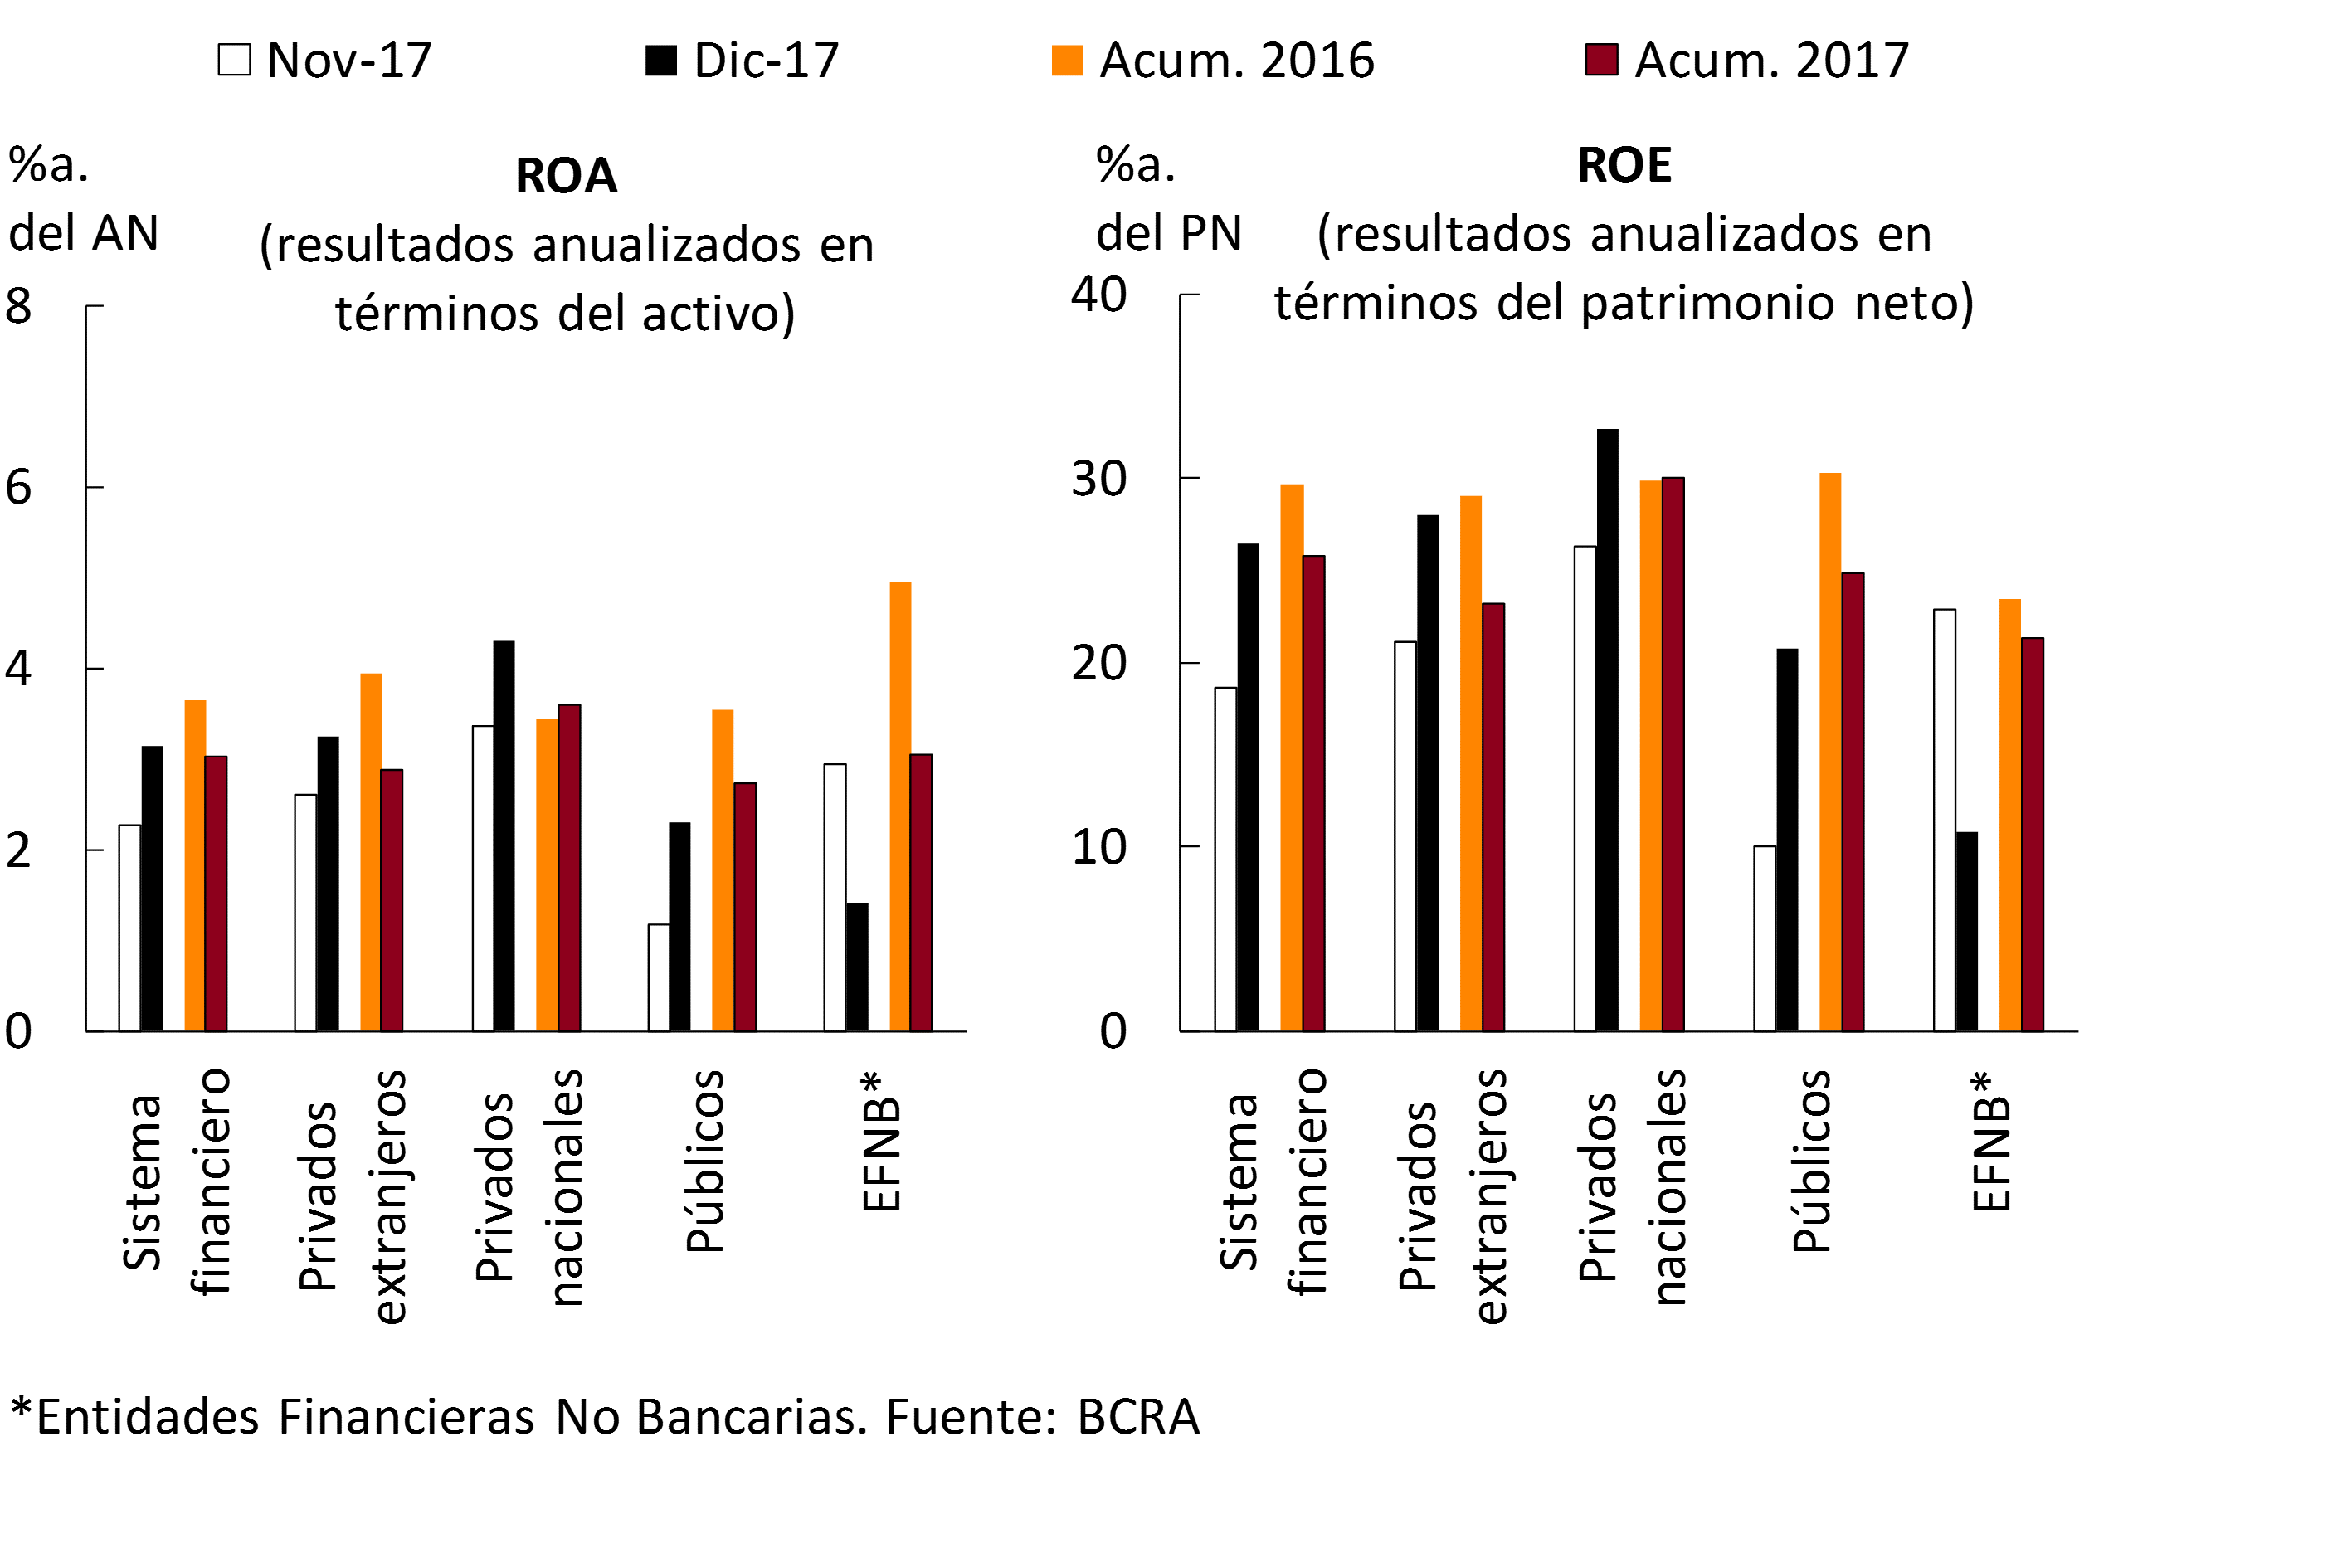
The gains accrued in December by the financial system totaled 3.1% y/y of assets (26.5% y/y. of equity), recomposing with respect to the level of November18. Cumulative nominal results in 2017 were equivalent to 3% of assets, 0.6 p.p. less than in 2016 (throughout 2017 they were $85,930 million, with an increase of 15.3% YoY). Thus, in the year the results of the system represented 25.8% of net worth (ROE), being the lowest record in the last five years (see Chart 23). The decrease in annual profitability indicators (both ROA and ROE) was evident in public banks, foreign private banks and in EFNBs (see Chart 24), while national private banks slightly increased these ratios.
Figure 23 | ROE of the Financial System and Inflation
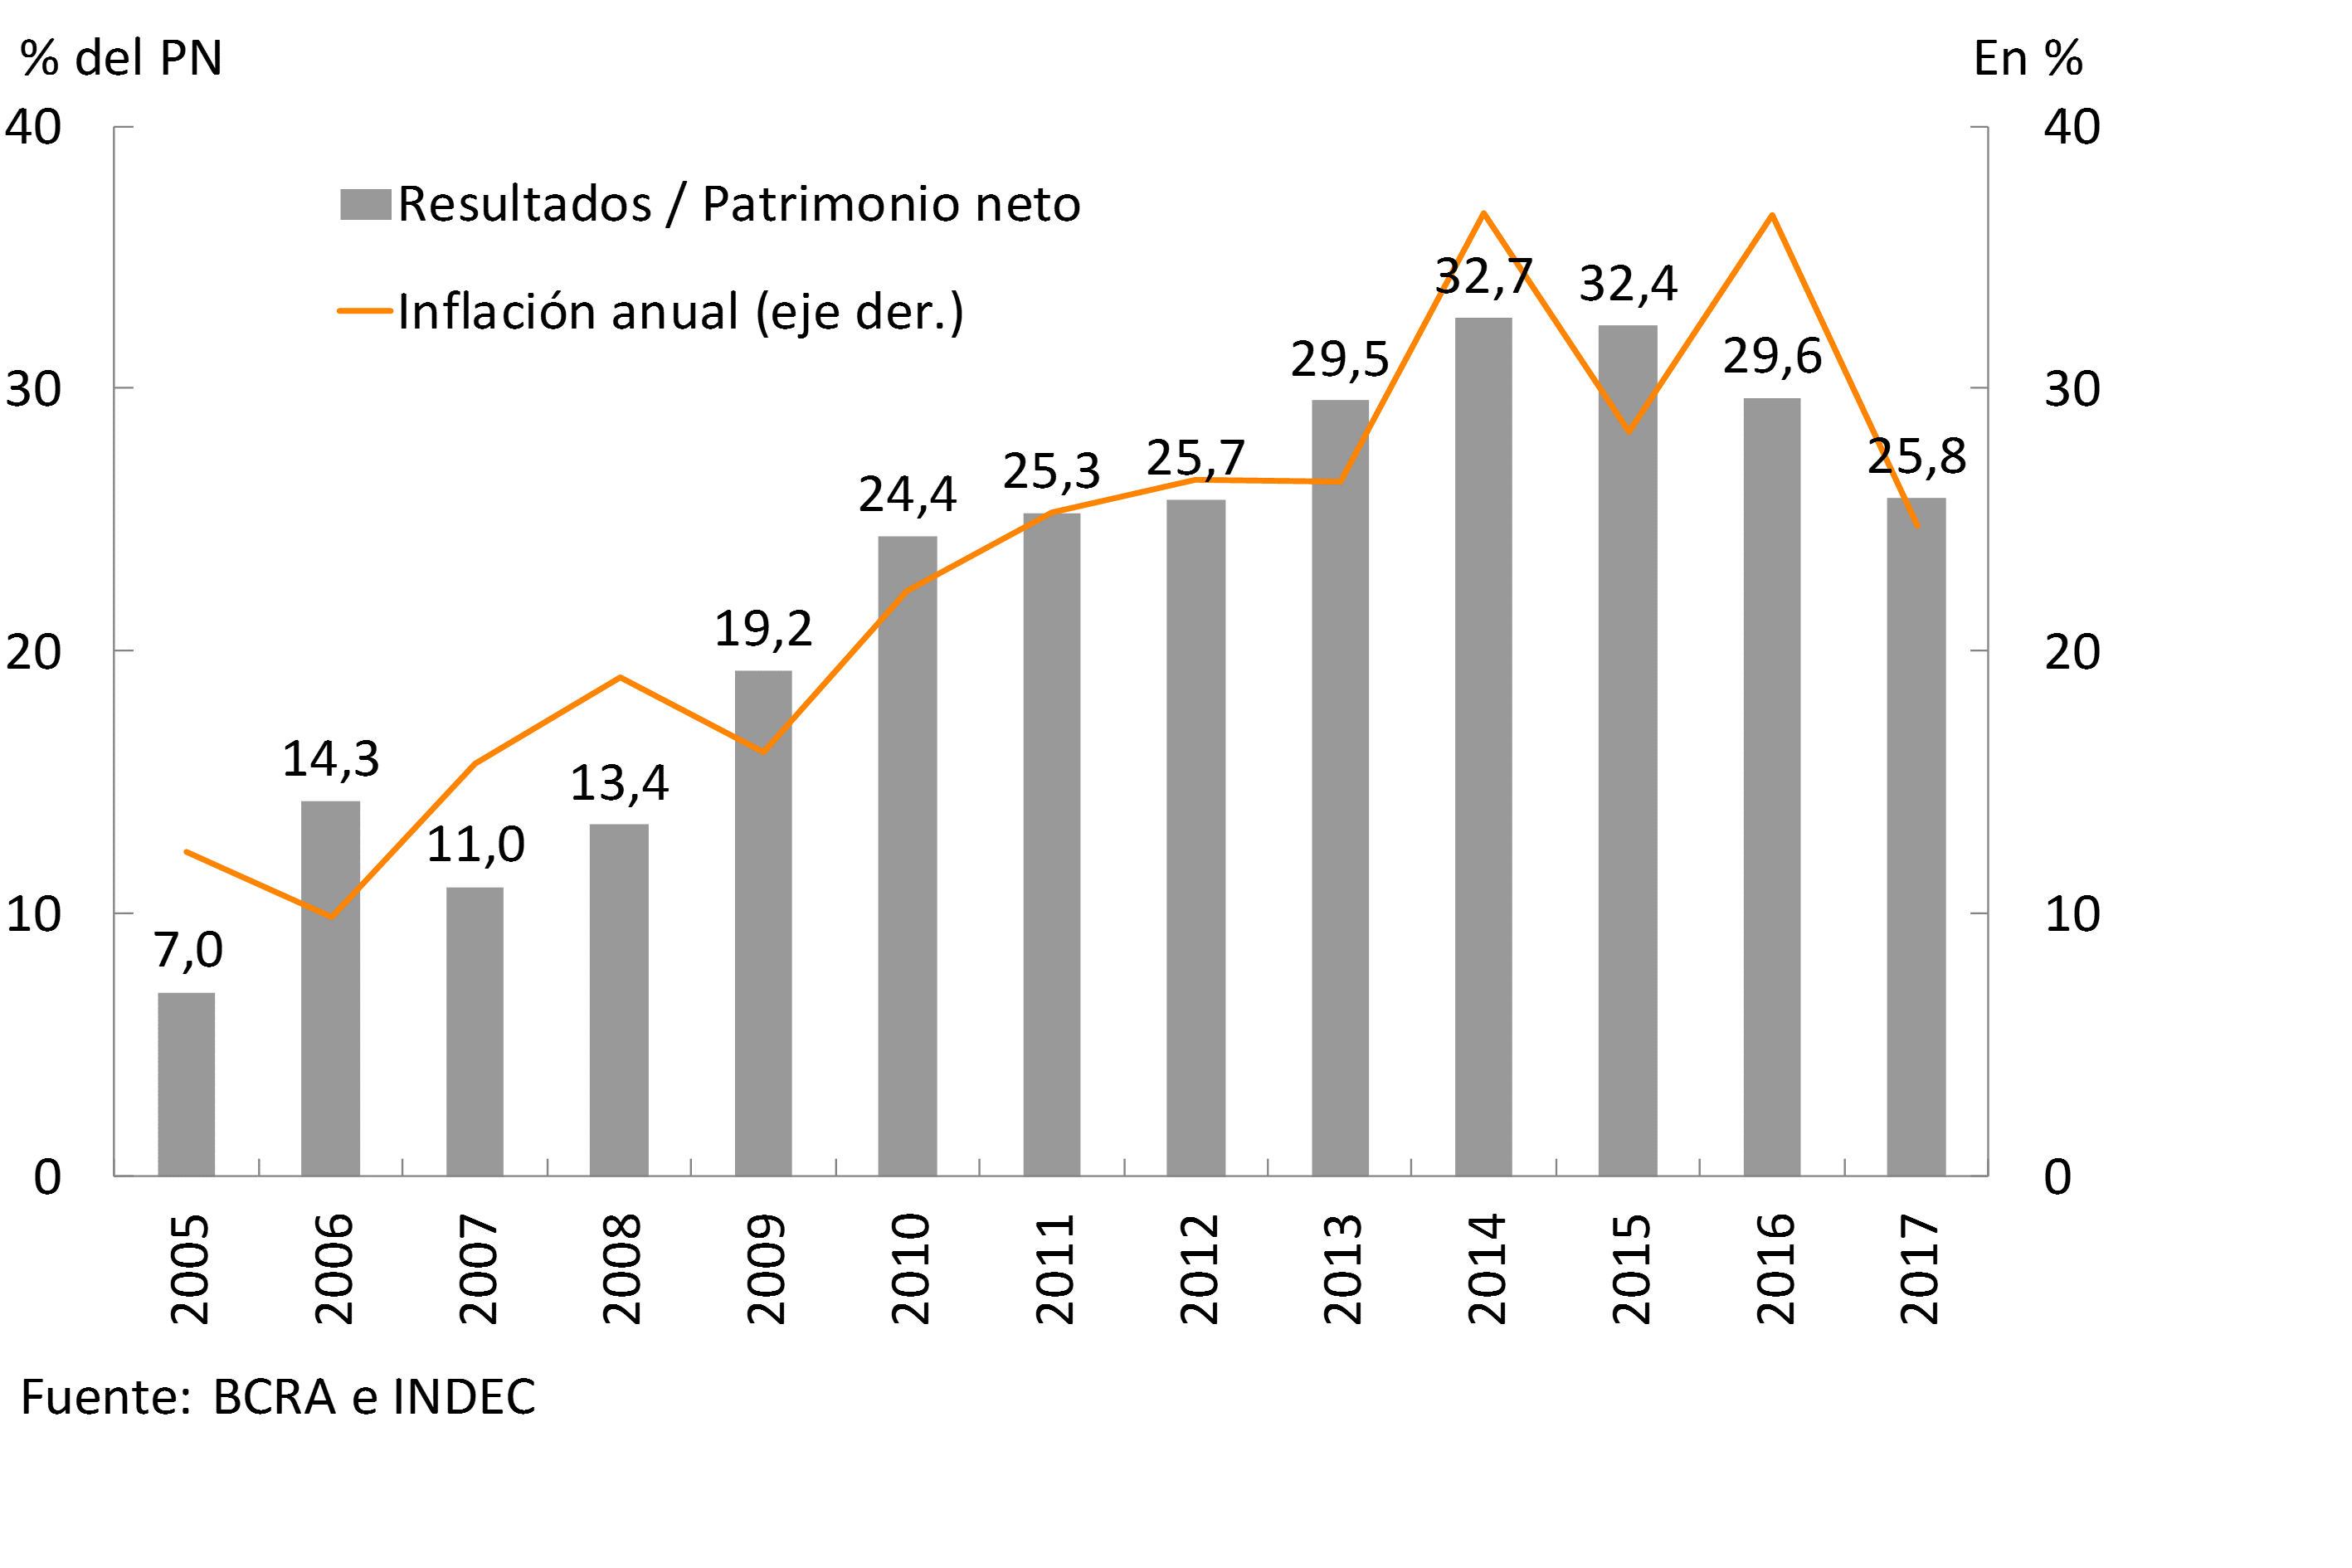
Figure 24 | Profitability by Group of Financial Institutions
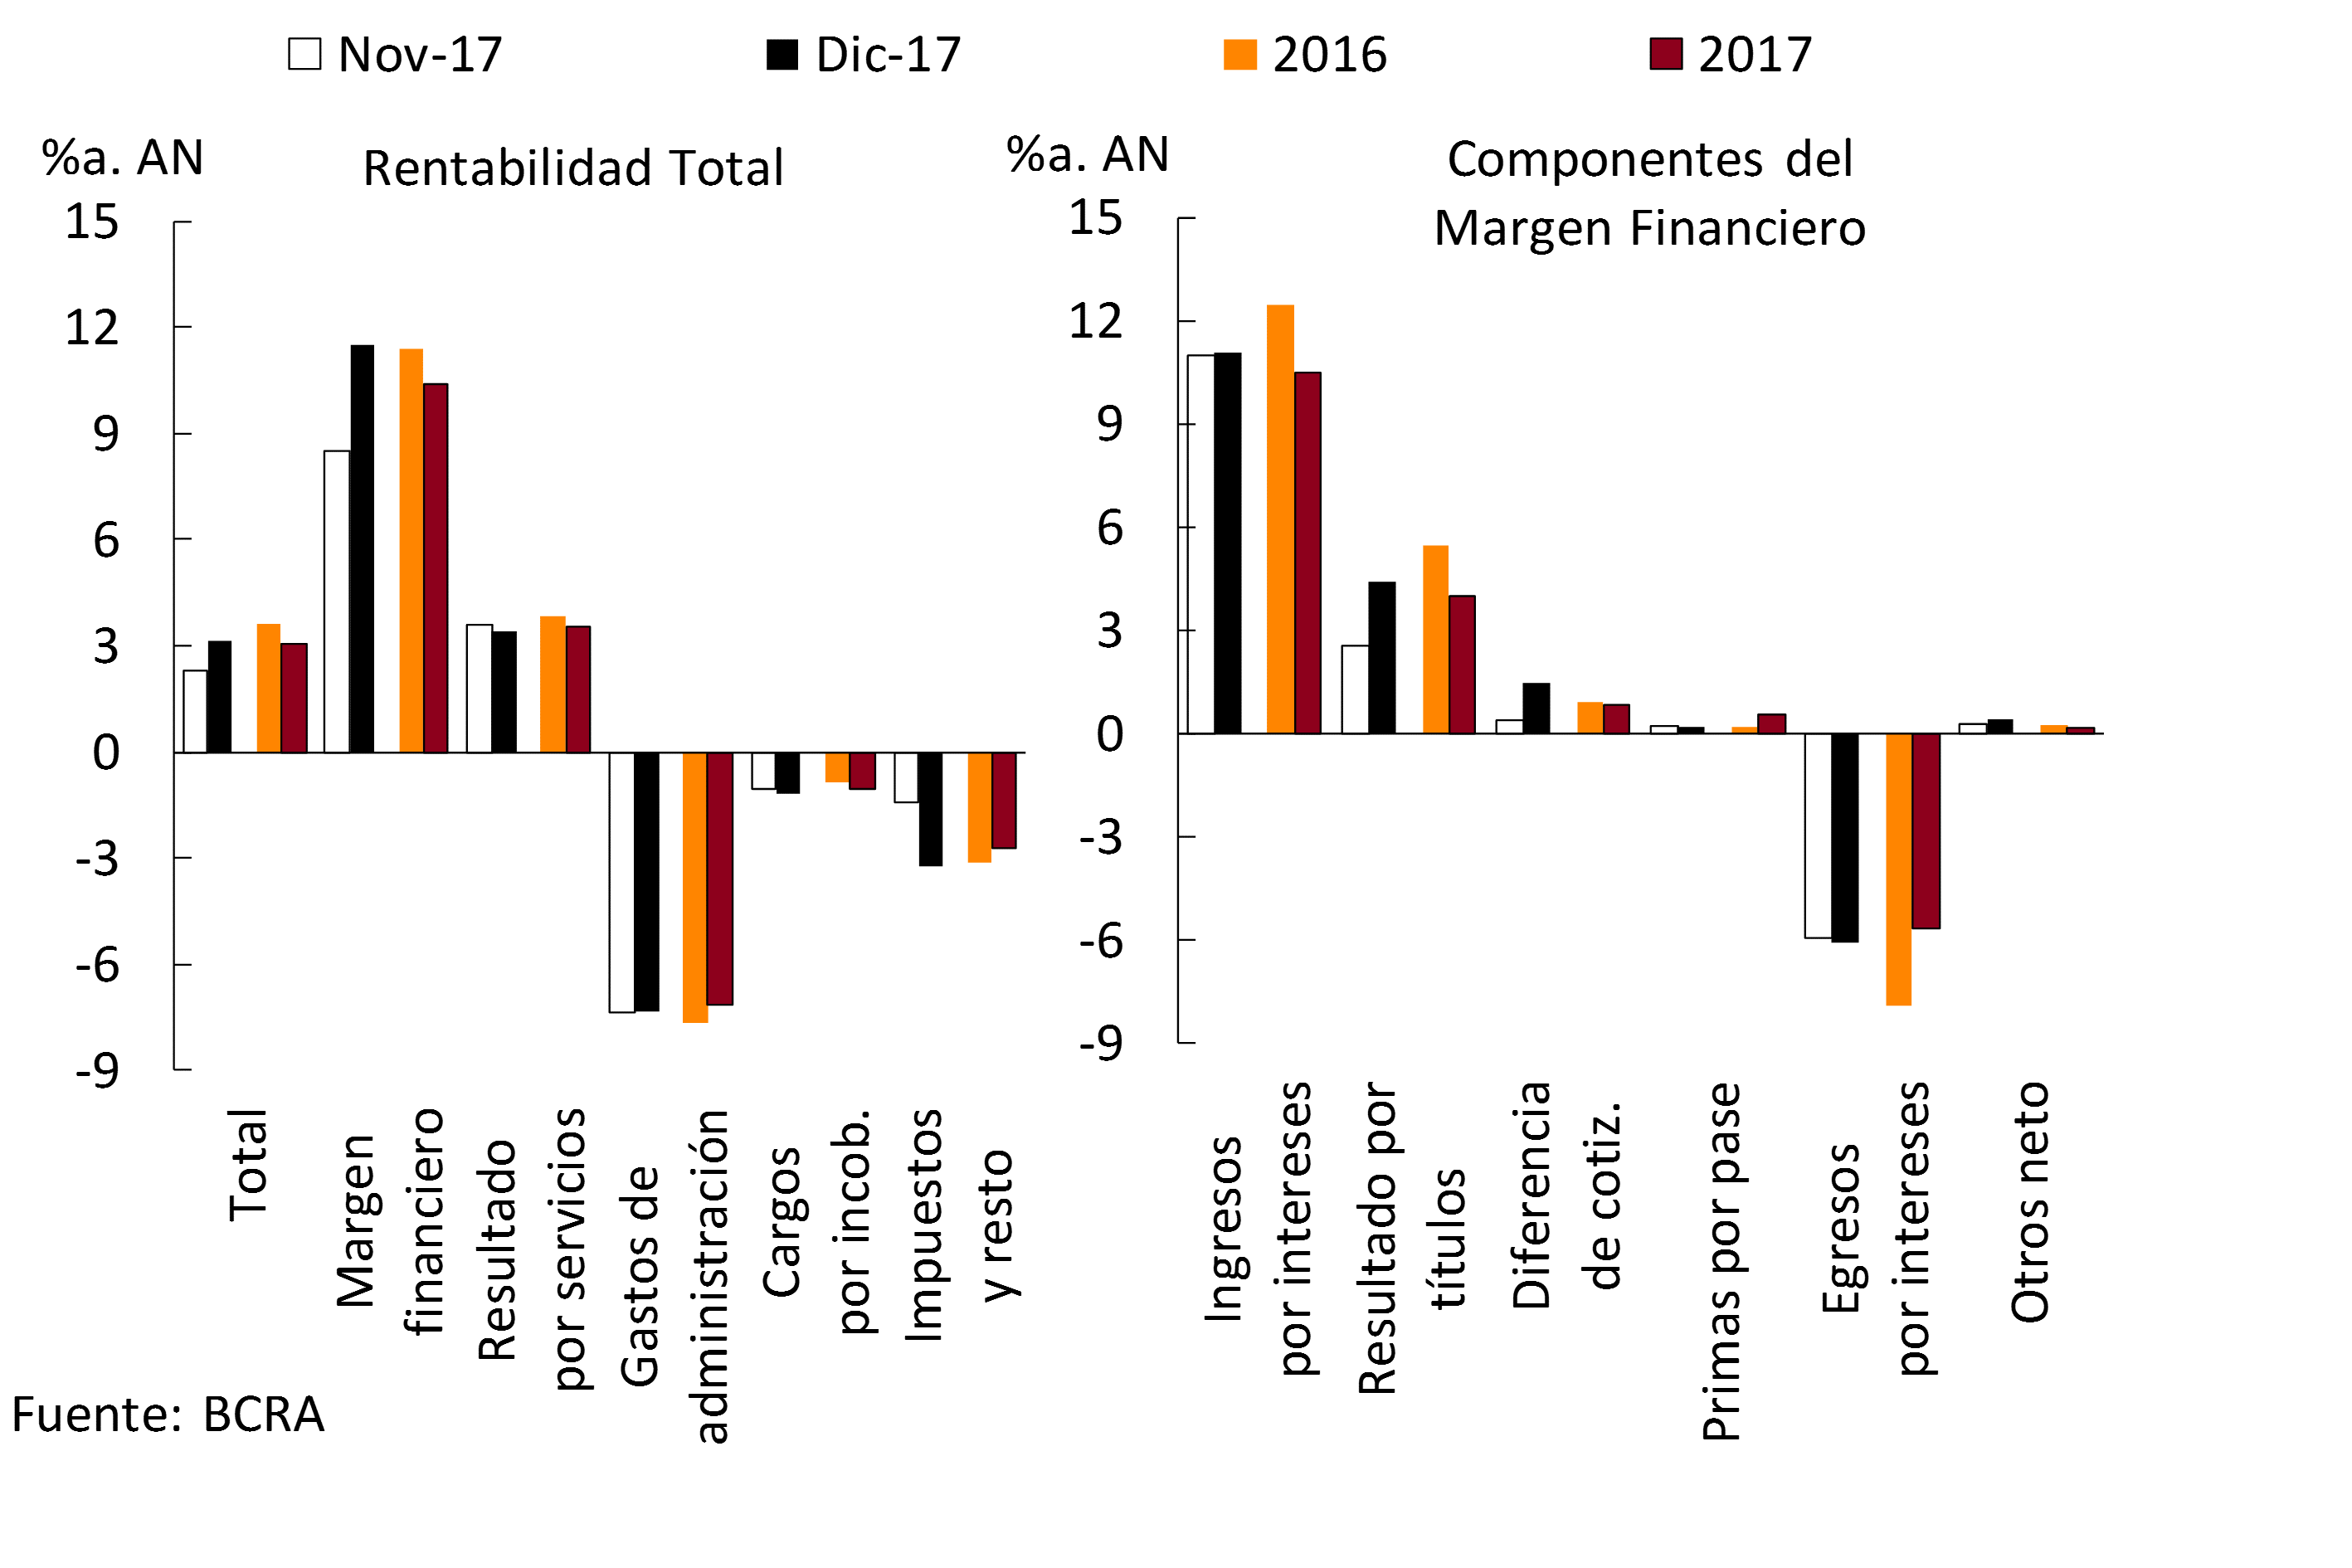
In the last month of the year, the financial margin of the banks as a whole totaled 11.5% of assets, 3 p.p. more than in November, mainly due to higher gains on securities – spread among entities – and due to an increase in share price differences19. The cumulative financial margin between January and December 2017 reached 10.4% of assets, 1 p.p. less than in 2016 (see Chart 25) as a result of the reduction in interest income from loans and gains from securities, effects tempered by the decrease in interest outflows on deposits and the increase in premiums on passes. As for the group of private banks, in December the financial margin totaled 11.9% of assets, 1 p.p. more than in November mainly due to higher gains from securities (in 2017 the financial margin of private banks represented 11.3% of assets, falling 0.8 p.p. year-on-year).
Figure 25 | Components of the Profitability of the Financial System
In December, the results for services of the financial system reached 3.4% y/y. of assets, falling 0.2 p.p. compared to November. In 2017, net income from services of the banks as a whole stood at 3.6% of assets, down 0.3 p.p. in a year-on-year comparison (see Chart 25).
Bad debt charges totaled 1.2% of assets in the last month of 2017, slightly higher than in November. In the year to date, charges for uncollectibility of the financial system represented 1% of assets, 0.2 p.p. more than last year.
In the month, administrative expenses stood at 7.4% of assets, without significant changes compared to November. In all of 2017, the administrative expenses of the financial system represented 7.1% of assets, reducing 0.5 p.p. compared to 2016 (see Graph 25). It should be noted that all banking groups reduced their administrative expenses in terms of assets throughout 2017.
In December, tax burdens reached 2% of assets, in line with those of the previous month. Such tax burdens totaled 1.9% of assets in 2017, similar to those of 2016. For its part, the income tax accrued in December was 1.5% of the asset, increasing compared to November20. In 2017, income tax totaled 1.4% of assets, falling 0.3 p.p. year-on-year.
Regulations
Summary of the main regulations of the month, implemented by the BCRA, related to financial intermediation activity. The effective date of the regulation is taken as a reference.
Communication A6383 – 01/12/17
The rules on “Mutual Guarantee Companies” (SGRs) are modified, requiring them to submit a special report issued by an external auditor on compliance with the requirements set forth in these standards, among other considerations.
Communication A6396 – 11/12/17
The rules on “Minimum capital of financial institutions” are modified, adding other comprehensive income (ORI) as a computable item within Common Equity Tier One (Con1) capital. The rules on “Classification of debtors” are adapted, incorporating as financing included the Negotiable Obligations valued at amortized cost and/or at fair value with changes in ORI. The rules on “Distribution of results” are modified, including as a deductible concept the result from the revaluation of property, plant, equipment and intangibles and investment property. The rules on “Net Global Position in Foreign Currency” adapt the definition of the concepts included, incorporating commitments and other instruments and operations for financial intermediation in foreign currency or linked to the evolution of the exchange rate.
Communication A6397 – 15/12/17
A new treatment of interest rate risk in the investment portfolio is incorporated into the rules on “Guidelines for risk management in financial institutions “. It is established that financial institutions must use a standardized methodology based on the change in the economic value of equity to quantify the effects of certain predetermined interest rate shocks, providing that entities classified as local systemically important must also use their internal measurement systems to compute risk measures based on economic value. Group “A” entities shall use their internal measurement systems to calculate the measure of interest rate risk in the results-based investment portfolio. On the other hand, it is established that the adequacy of capital for the purposes of interest rate risk in the investment portfolio must be specifically considered as an integral part of the internal process of evaluating the adequacy of economic capital.
Communication A6398 – 22/12/17
Effective as of 4/1/18, the rules on “Mutual Guarantee Companies” and “Public Guarantee Funds” are adapted, establishing the effects generated by non-compliance to submit information to the “Debtors’ Center”. A period of 30 calendar days (15 calendar days in cases of repeated non-compliance in the calendar year) is established to correct such omission, after which, if the non-compliance persists, the guarantees will no longer be considered as preferred.
Communication A6418 – 29/12/17
Effective as of 1/3/18, the rules on “Protection of users of financial services” are modified, incorporating a control body that involves members of the management of the obligated entities in the processes of protection of users of financial services.
Communication A6419 – 29/12/17
The rules on “Communication by electronic means for the care of the environment” are adapted by introducing a new Section establishing the contents that must or may be disseminated on a mandatory or voluntary basis, as the case may be, by financial and exchange institutions, non-financial companies that issue credit and/or purchase cards and representatives of foreign financial institutions not authorized to operate in the country. in their public service premises.
References
1Reference is made to those measures of relevance to the financial system that were adopted since the date of publication of the previous Report on Banks.
2DNU No. 27/2018 and DNU No. 30/2018 and Press Release of 11/01/18.
4Communication A6443 and Press Release of 25/01/18.
8Considering balance sheet balances.
9Ample liquidity, considering only items in pesos, stood at 38.8% of deposits in December, 2.5 p.p. above the previous month and 1.6 p.p. lower than the figure at the end of 2016.
10Variation in currency of origin.
11Variation in currency of origin.
12Information extracted from the Central Debtors (includes both national and foreign currency). Loans to residents abroad are not included. Business financing is defined here as that granted to legal entities and commercial financing granted to individuals. On the other hand, loans to families are considered to be those granted to individuals, unless they are for commercial purposes.
13For more information see Credit Conditions Survey – Fourth Quarter of 2017.
14Human persons.
15For more information, see the BCRA Blog “How does the relative level of household debt change in the new context of mortgage credit expansion?”
16It includes a fixed and repacable interest rate.
17Tier 1 capital defined as basic equity (common and additional capital, net of deductible accounts). See Com. A5369.
18The group of private banks obtained gains of 3.8% y/y of assets in the last month of the year (accumulated ROA in 2017 of 3.2%y, being 0.4 p.p. lower than in 2016).
19Within the framework of the 8% increase between the end of the month in the nominal peso-dollar exchange rate, mostly with an effect on the balance sheet of a public bank of magnitude.
20Influenced by a public bank of magnitude.
Glossary
%a.: annualized percentage.
% YoY: Year-on-year percentage.
Liquid assets: availabilities (integration of “minimum cash” in current accounts at the BCRA and in special guarantee accounts and other concepts, mainly cash in banks and correspondent offices) plus the net credit balance for transfer operations of financial institutions against the BCRA using LEBAC and NOBAC.
Consolidated assets and liabilities: those arising from deducting transactions between entities in the system.
Net Assets (NA): Assets and liabilities are net of accounting duplications for pass-through, forward and spot transactions to be settled.
APR: Total Risk Weighted Assets.
BCBS: Basel Committee on Banking Supervision (BCBS).
Irregular portfolio: portfolio in situation 3 to 6, in accordance with the “Classification of Debtors” regime.
Credit to the public sector: Position in public securities (without LEBAC or NOBAC) + Loans to the public sector + Compensation to be received + Debt securities and Certificates of participation in financial trusts (with underlying public securities) + Miscellaneous credits to the public sector.
Credit to the private sector: loans to the non-financial private sector including accrued interest and CER and CVS adjustment and leasing.
Contribution differences: Results from the monthly update of assets and liabilities in foreign currency. The item also includes the results originated by the purchase and sale of foreign currency, which arise as a difference between the agreed price (net of the direct expenses originated by the operation) and the book value.
Miscellaneous: miscellaneous profits (including, but not limited to, gains on permanent shares, recovered loans and unaffected provisions) less miscellaneous losses (including, but not limited to, losses on permanent shareholdings, loss on sale or disposal of goods for use and amortization of business keys).
Equity exposure to counterparty risk: irregular portfolio net of provisions in terms of equity.
Administration expenses: includes remunerations, social charges, services and fees, taxes and amortizations.
IEF II-17: BCRA Financial Stability Report.
IPCBA: Consumer Price Index of the City of Buenos Aires.
CSF: Liquidity Coverage Ratio (LCR).
LEBAC and NOBAC: bills and notes issued by the BCRA.
LR: Leverage Ratio (LR).
Financial margin: Income minus financial expenses. It includes interest and securities earnings, CER and CVS adjustments, exchange rate differences and other financial results.
Mill.: Million or million, as appropriate.
ON: Negotiable Obligations.
OS: Subordinated Obligations.
Other financial results: rental income from financial leases, contribution to the deposit guarantee fund, interest on availabilities, charges for loan depreciation, premiums for the sale of foreign currency and other unidentified items.
PN: Net Worth.
p.p.: percentage points.
SME: Small and Medium Enterprises.
Consolidated profit: Results from permanent holdings in local financial institutions are eliminated. Available since January 2008.
Income from securities: includes results from public securities, temporary shares, negotiable obligations, subordinated obligations, options and other credits for financial intermediation. In the case of public securities, it includes the results accrued in terms of income, differences in share price, exponential increase based on the internal rate of return (IRR) and sales, in addition to the charge for forecasts for the risk of impairment.
Interest income: interest charged minus interest paid for financial intermediation, following the accrual criterion (balance sheet information) and not what is received. It includes interest on loans and deposits of government securities and premiums for passes.
Result for services: commissions charged minus commissions paid. It includes fees related to obligations, credits, securities, guarantees granted, the rental of safe deposit boxes and foreign and exchange operations, excluding in the latter case the results from the purchase and sale of foreign currency, the latter being accounted for in the “Differences in quotation” account. Expenses include commissions paid, contributions to the ISSB, other contributions for income from services and charges accrued from the gross income tax.
ROA: Final result as a percentage of net assets. In the case of referring to accumulated results, the average of the NA for the reference months is considered in the denominator.
SWEE: Final result as a percentage of equity. In the case of referring to accumulated results, the average net worth for the reference months is considered in the denominator.
RPC: Computable Patrimonial Liability. For more details, see Ordered Text “Minimum Capitals of Financial Institutions”.
TNA: Annual nominal rate.
US$: US dollars.
UVA: Unit of Purchasing Value.
ICU: Housing Units.
Compartir en


