Executive summary
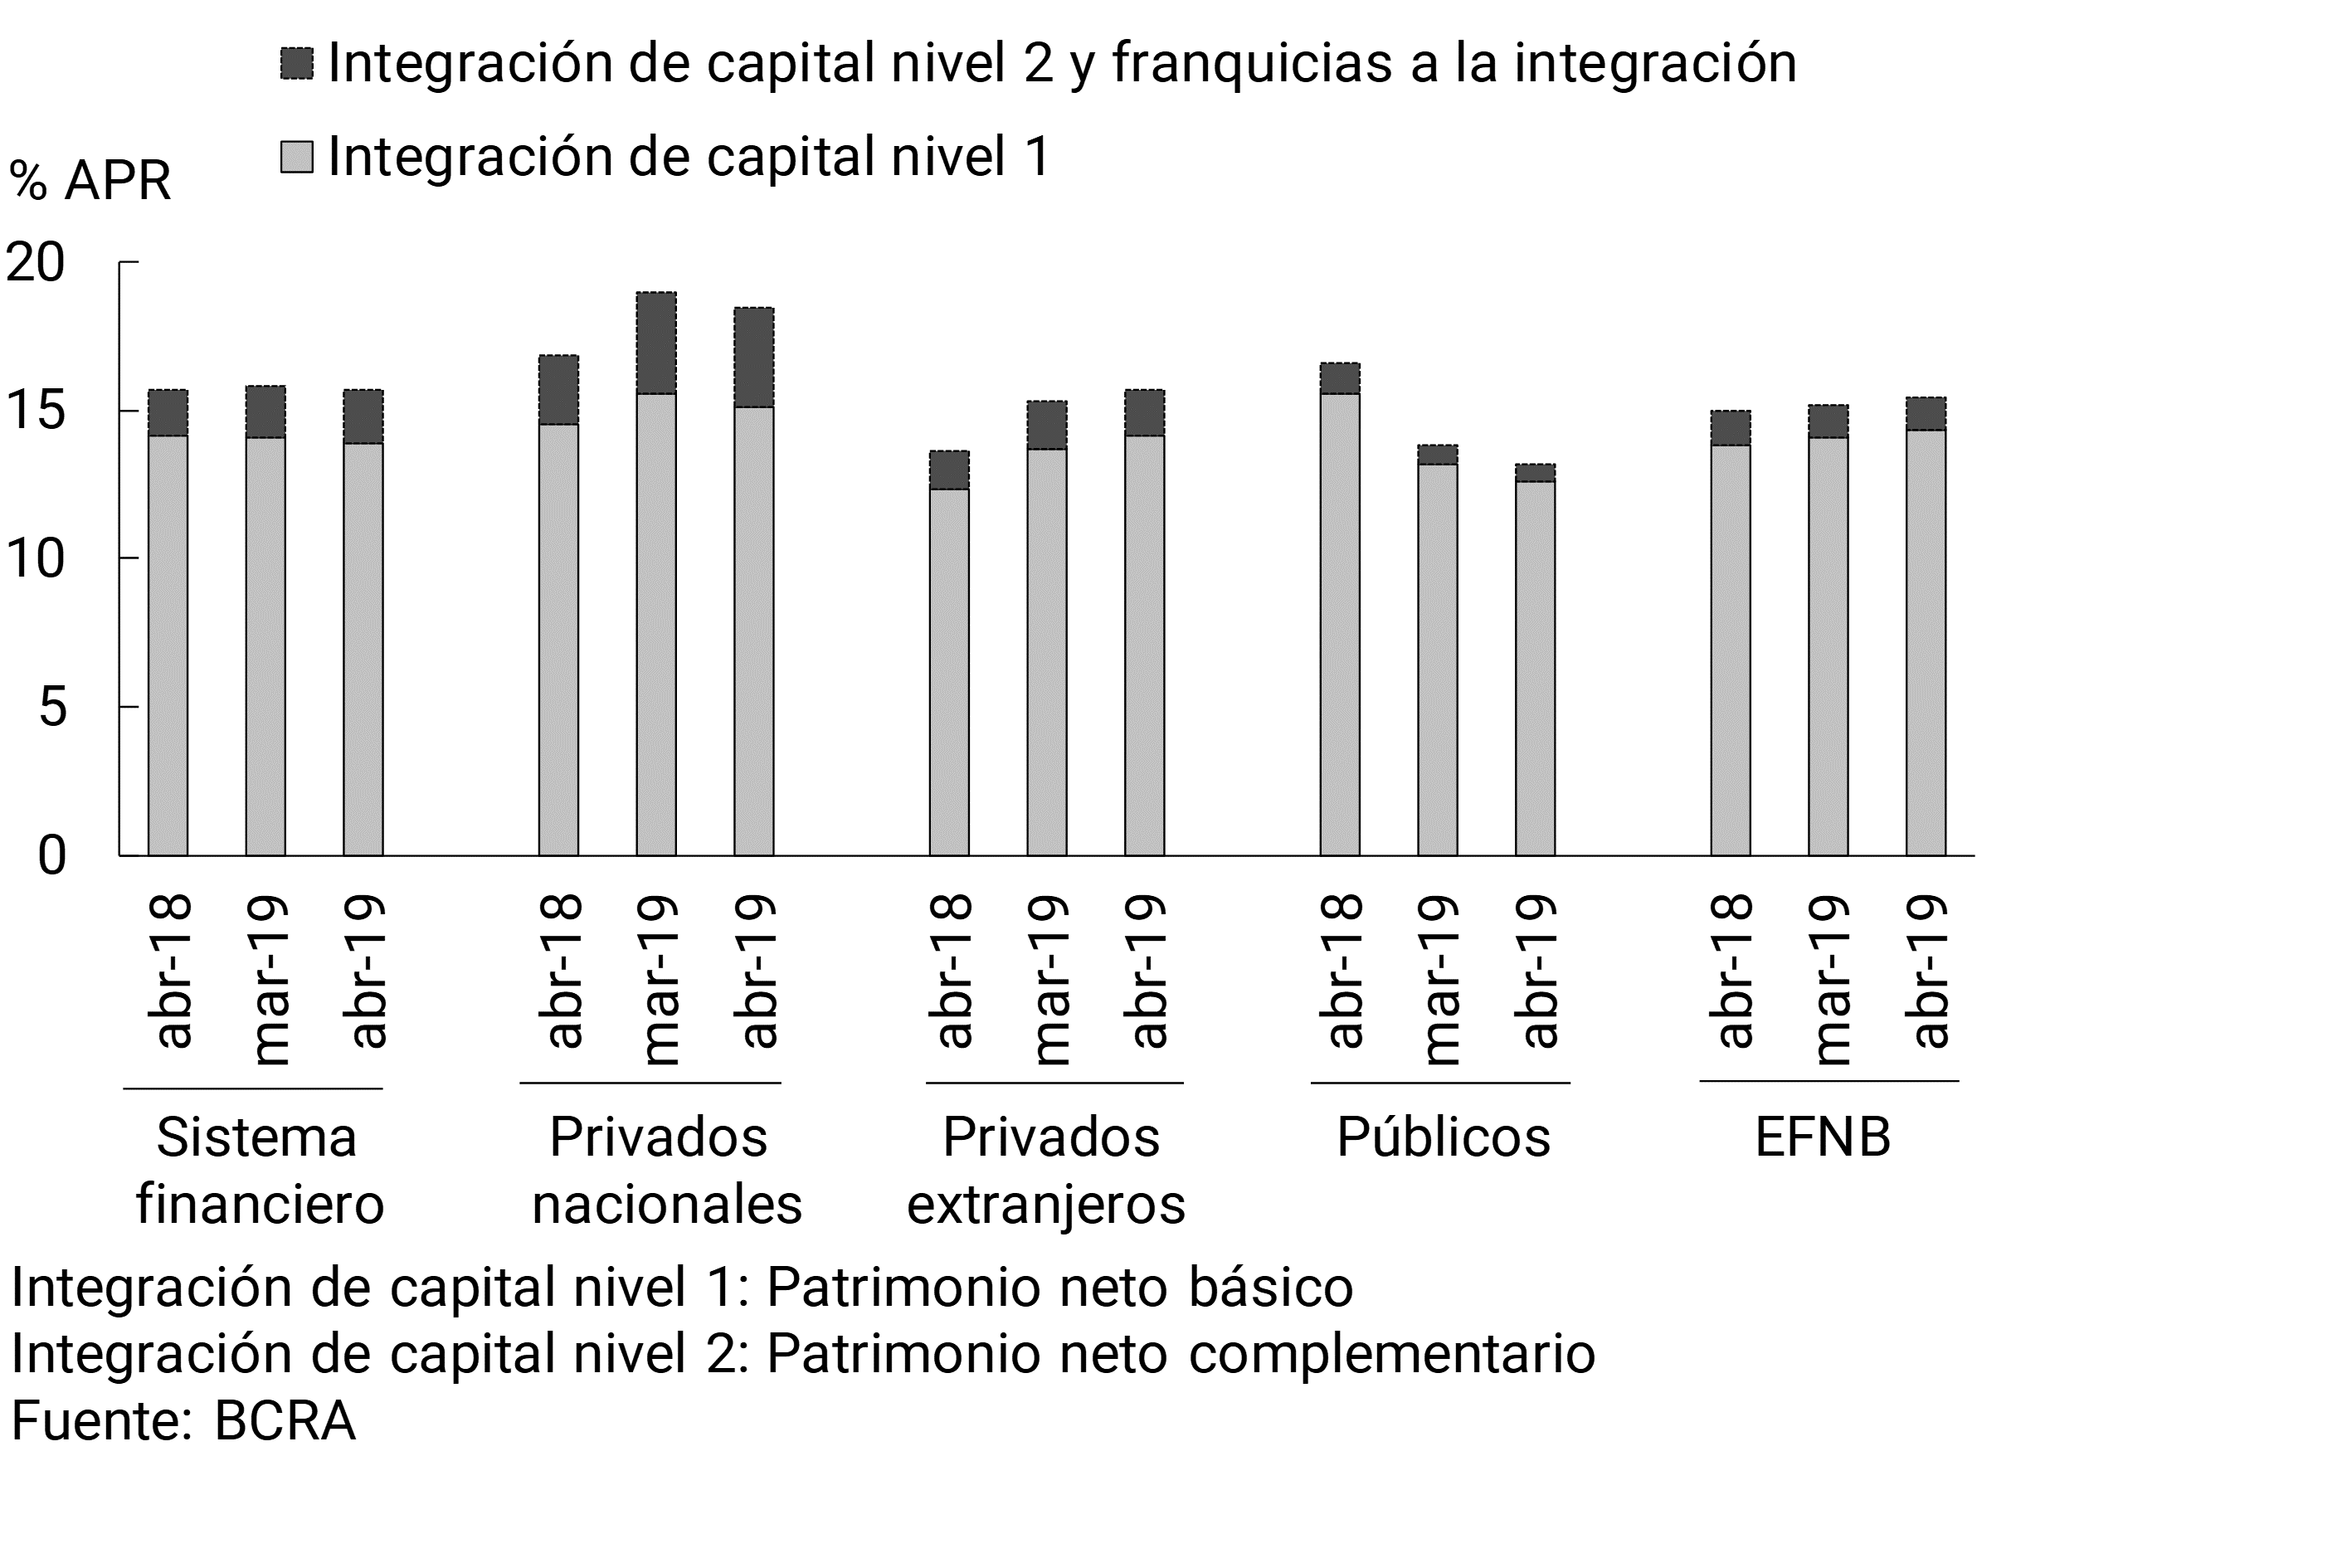
• The solvency levels of all financial institutions did not show significant changes in April, remaining at high values. In the month, total capital integration reached 15.7% of risk-weighted assets. Total regulatory capital continued to comfortably exceed the minimum regulatory requirement, representing 181% of the latter.
• The liquidity indicators of the financial system continued to increase in April. The broad liquidity ratio reached 60% of total deposits (60.8% in pesos), 1.1 p.p. above the March level (similar increase for the segment in pesos). In a year-on-year comparison (y.a.), ample liquidity grew 18 p.p. of deposits (+22 p.p. for the ratio in pesos).
• Private sector deposits in pesos fell 1.8% in real terms in April (+1.5% nominal). For their part, deposits in foreign currency of the private sector grew 1.4% in the month (in currency of origin). The share of total private sector deposits in the total funding (liabilities plus net worth) of the financial system stood at 58.9% in April (without significant changes compared to March and +4.9 p.p.i.a.).
• In April, credit in pesos to the private sector fell by 2.3% in real terms compared to March (+1% nominal), while credit in foreign currency to this sector grew by 0.9% (in the currency of origin). The share of credit to the private sector in bank assets was 39% (-0.4 p.p. compared to March and -9.9 p.p.i.a.).
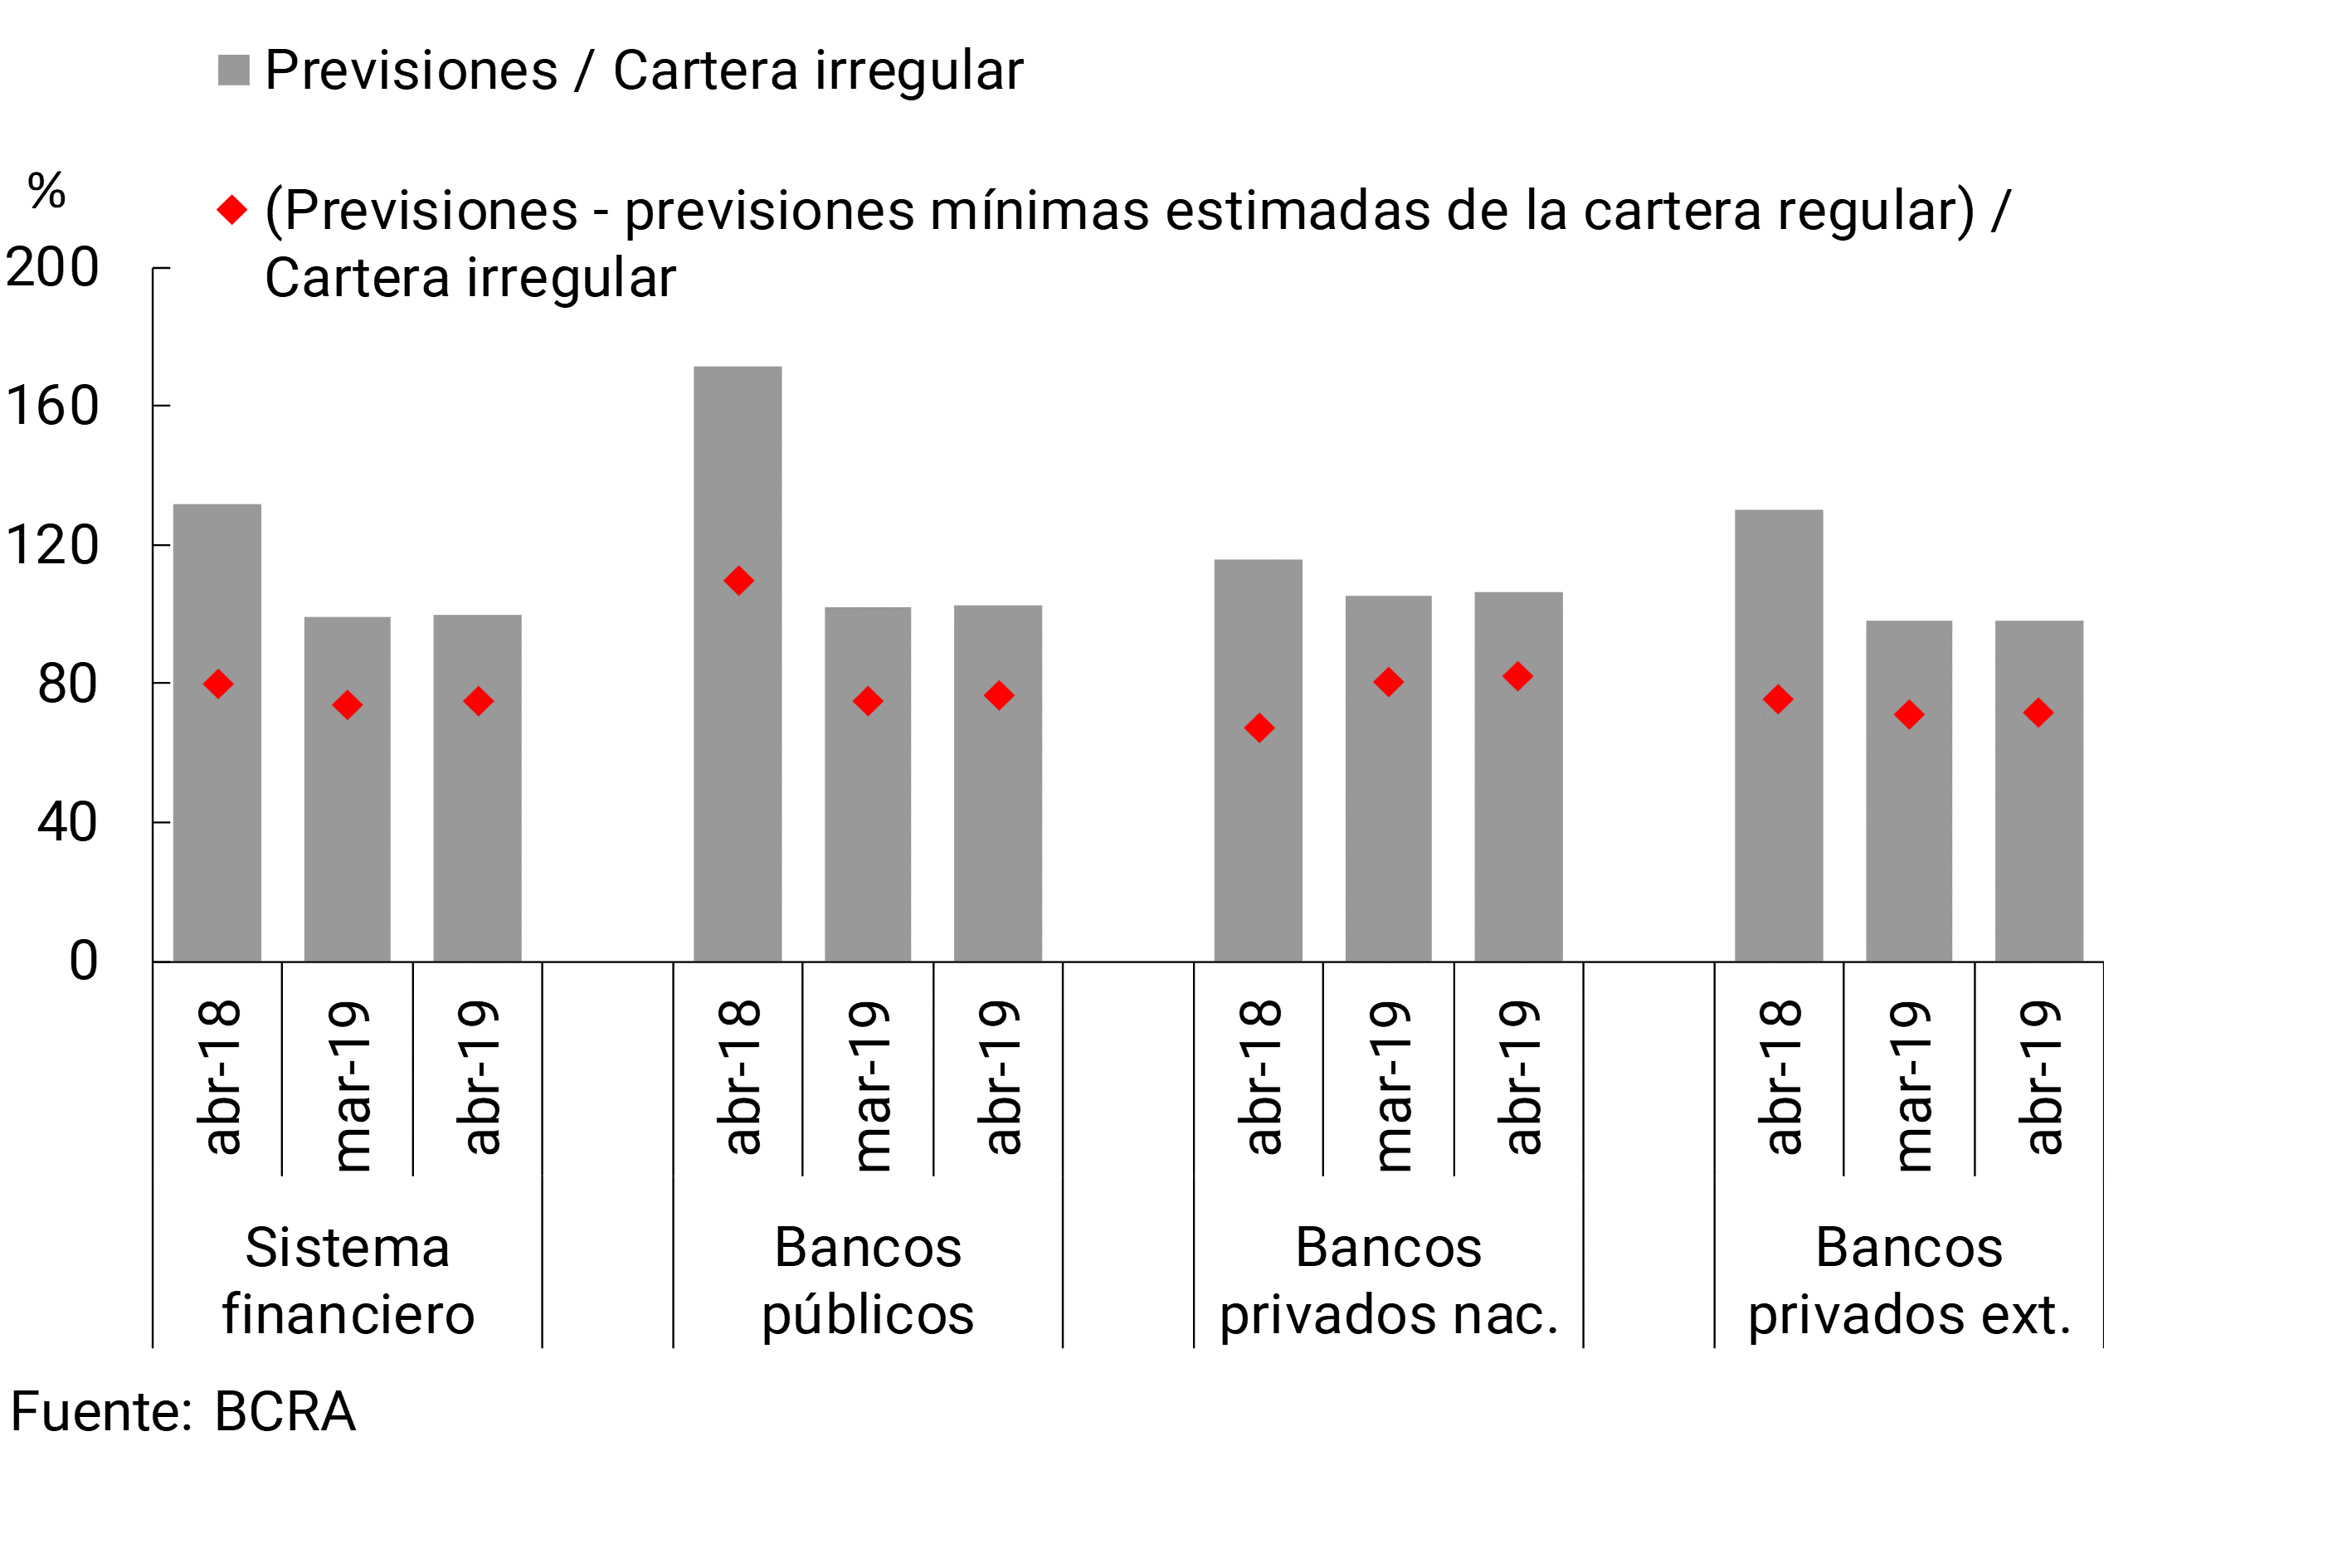
• The non-performing loan ratio to the private sector reached 4.2% in April, 0.1 p.p. above the value of March. Non-performing loans to companies accounted for 4% of the total portfolio (+0.1 p.p. compared to March), while non-performing loans to households stood at 4.6% in the month (0.1 p.p. more than in March). The irregularity of mortgage loans to households remained low (0.3% in the UVA segment and 0.6% in the remaining segments). Projected coverage of all irregular loans remained at high levels. The estimated balance of accounting forecasts attributable to the irregular portfolio represented 75% of the latter (100% if the total balance of forecasts is considered).
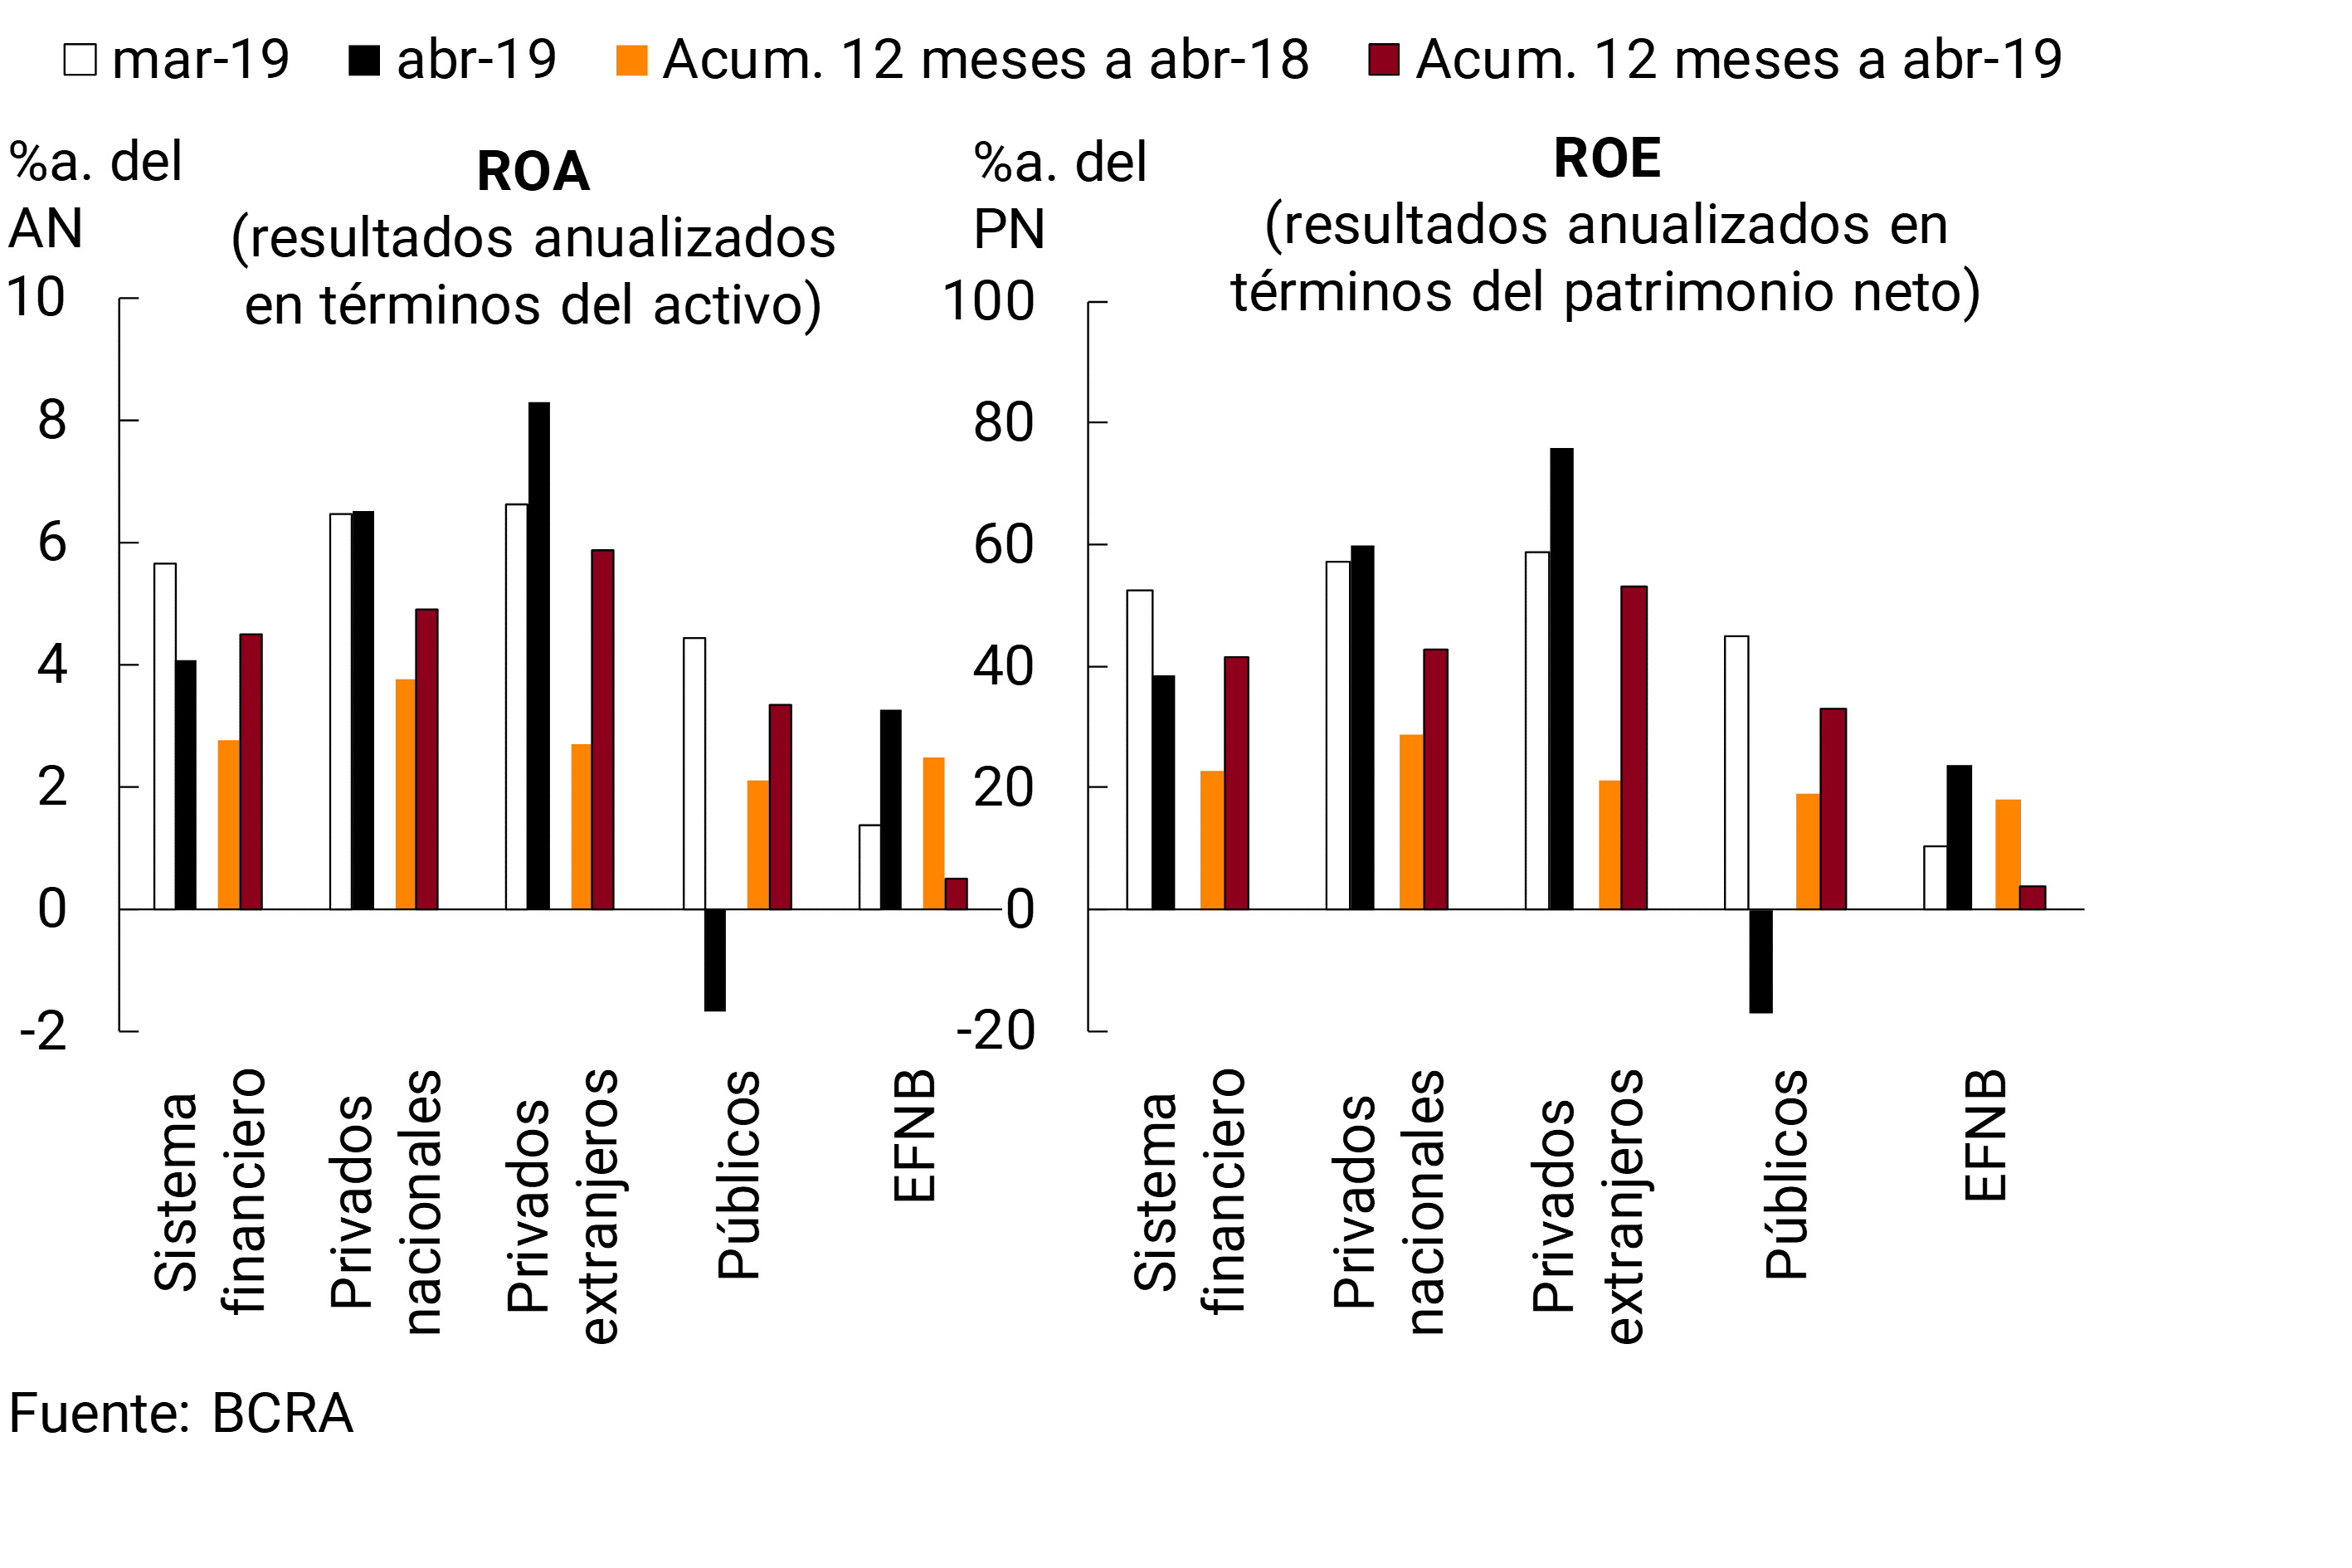
• In April, the nominal earnings accrued by the sector represented 4.1% of assets (ROA) and 38.6% of equity (ROE). In the 12-month cumulative period, ROA was 4.5% and ROE 41.4%.
• In relation to the operations of the National Payment System, in April the real amount of immediate electronic transfers increased compared to last month. In this context, cleared checks – both in amounts and in real values – registered a new fall. The rejection of checks due to lack of funds in terms of the total compensated decreased in April, thus returning to the values observed a year ago.
I. Financial intermediation activity
Based on the estimate of the monthly flow of funds for the financial system,1 the nominal increase in private sector deposits was the most relevant source of resources (see Graph 1). For their part, the main application of these funds was the increase in the balance of the current accounts that banks have in the BCRA. To a lesser extent, in April the accrued gains were another source of funds, while the reduction in public sector deposits and the nominal increase in credit to the private sector were other relevant applications of resources. Most of the origins and uses of funds mentioned were explained by private banks, with the exception of the fall in public sector deposits (mainly verified in public banks, offset by the reduction in liquid assets).
Graph 1 | Apr-19 Cash Flow Estimate
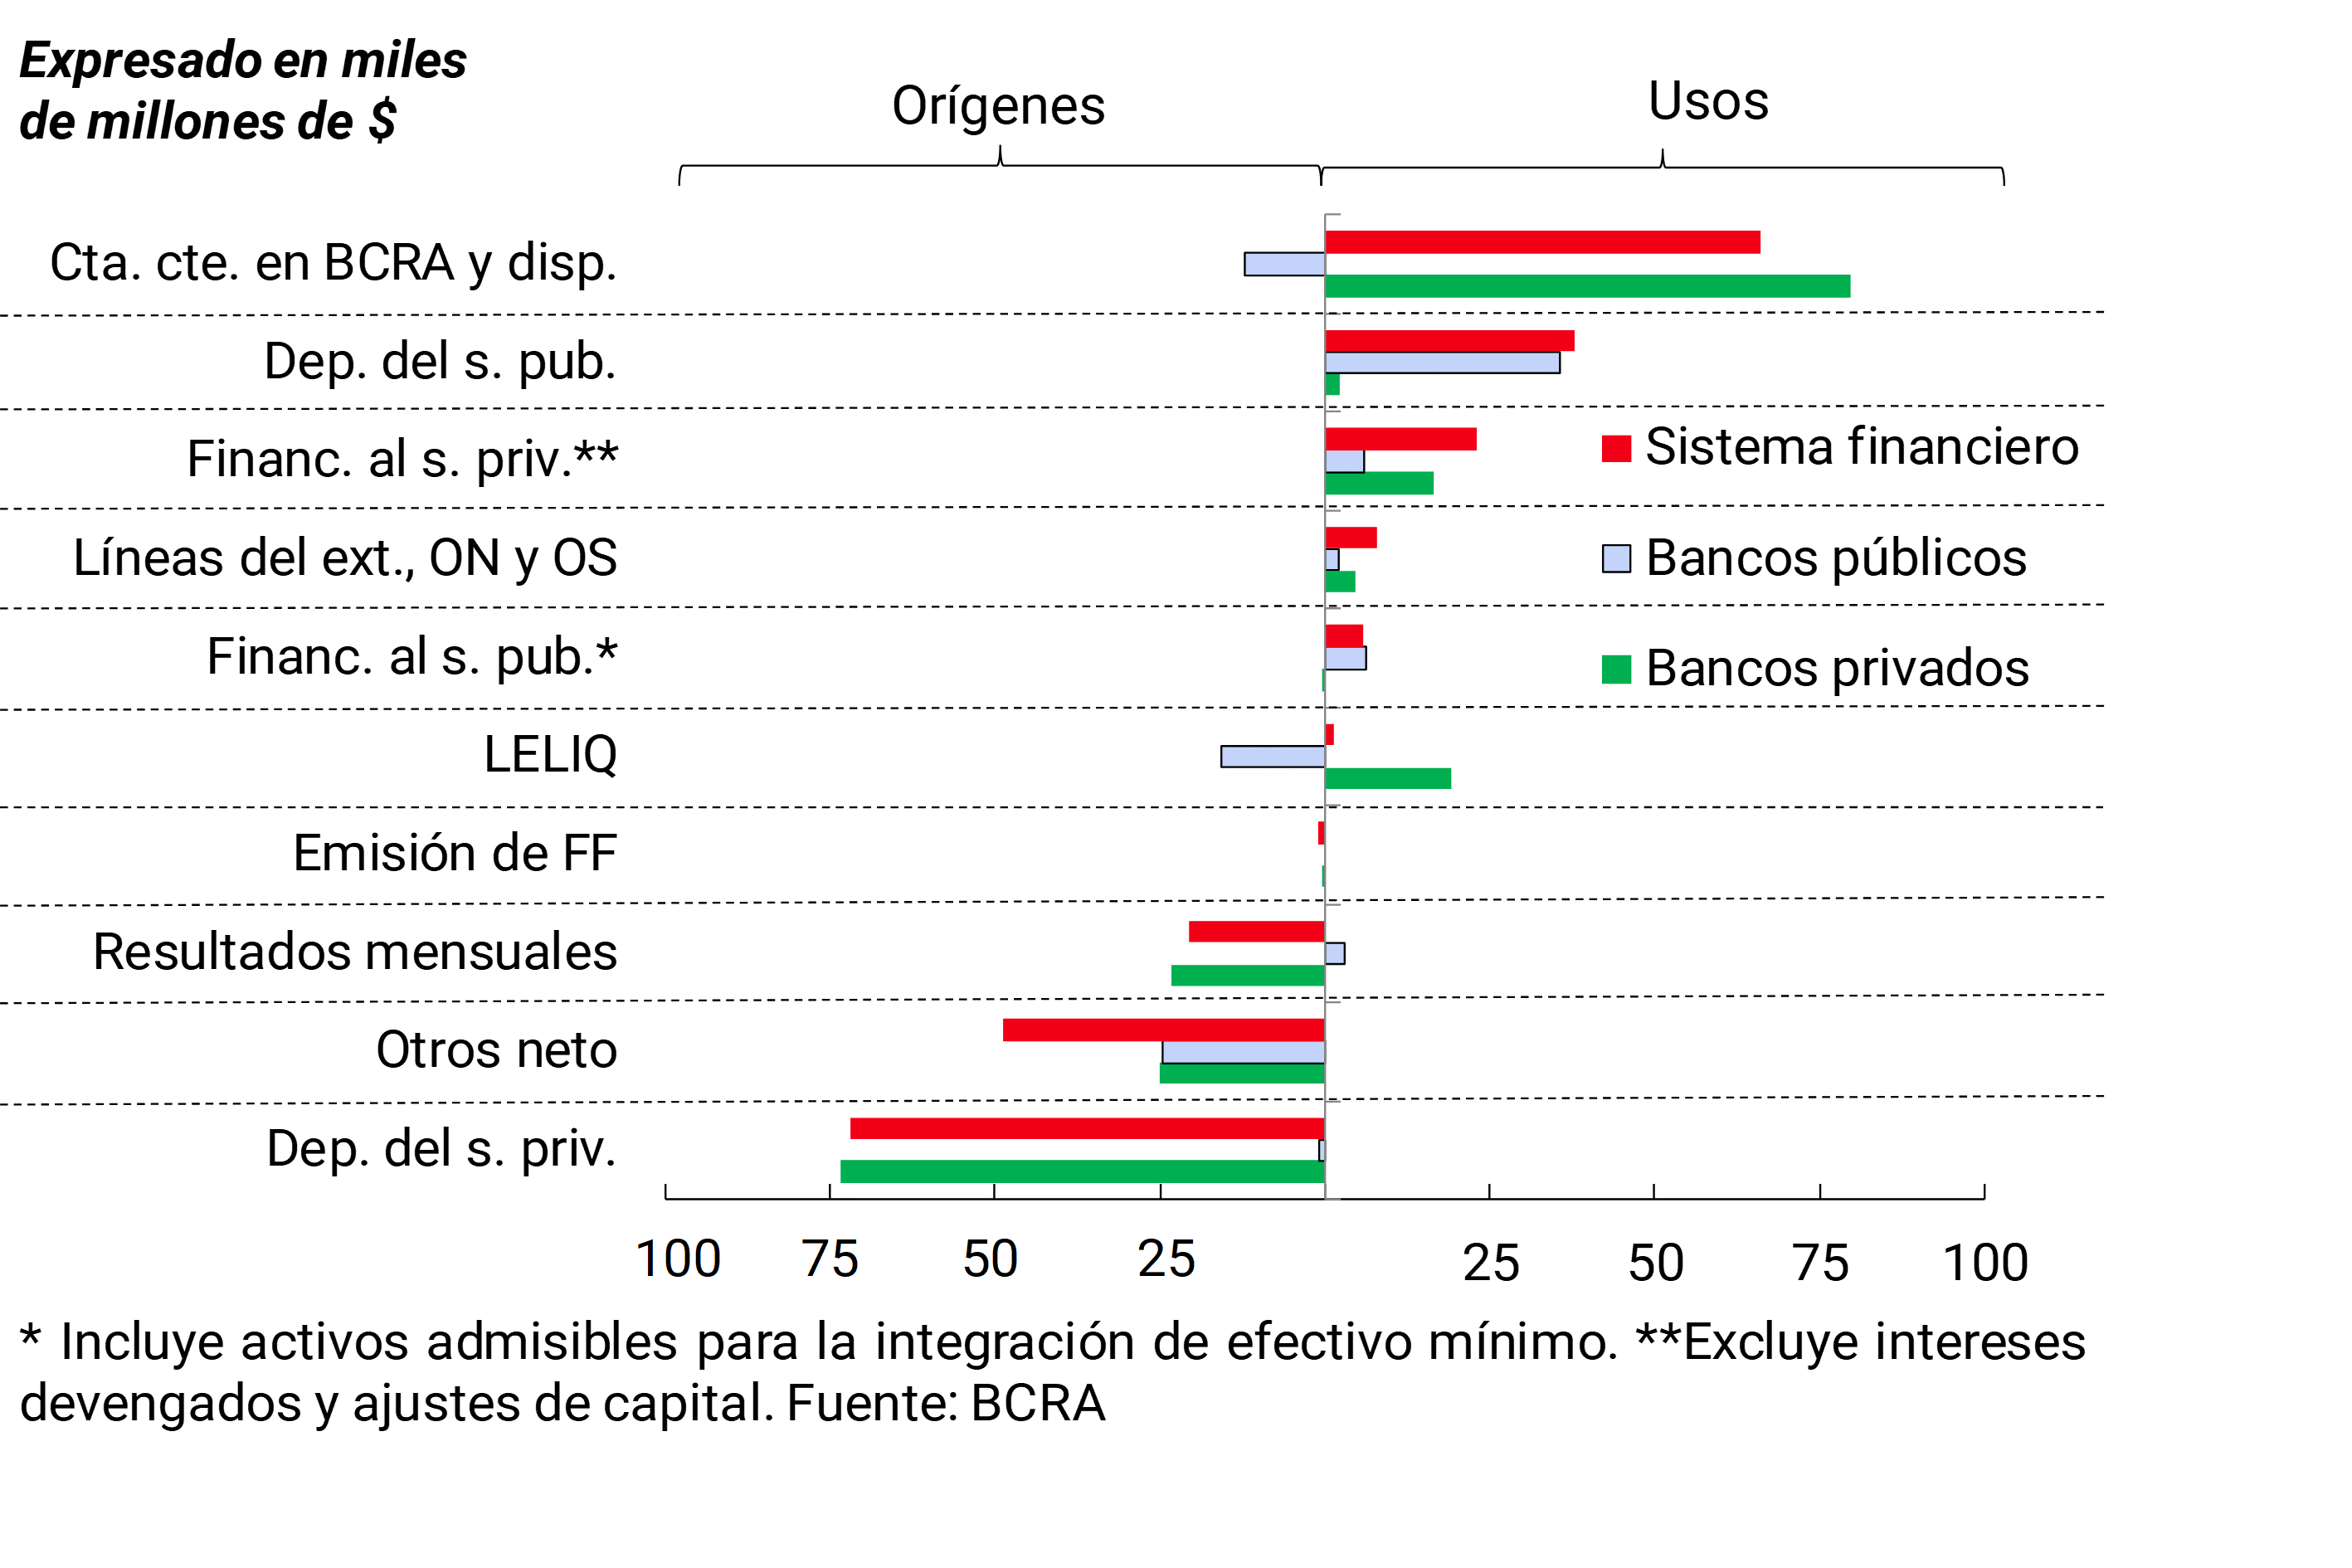
Within the framework of the changes in these balance sheet items, total bank assets fell by 0.9% in real terms in the month (+2.5% nominal), although in year-on-year terms (YoY) they increased by 2.2%.
The relative share of items denominated in foreign currency in the bank balance sheet did not show significant changes in the month. Assets in foreign currency (30.3% of the total) are mainly made up of liquidity (14.5% of total assets) and loans to tradable sectors (11.9% of total assets), while liabilities in this denomination (30% of total funding) are mainly explained by deposits. The spread between assets and liabilities denominated in foreign currency, including balance sheet items and forward purchases and sales of foreign currency classified off-balance sheet, stood at 11.1% of regulatory capital (0.9 p.p. more than in March and 1.3 p.p. lower than the figure recorded a year ago).
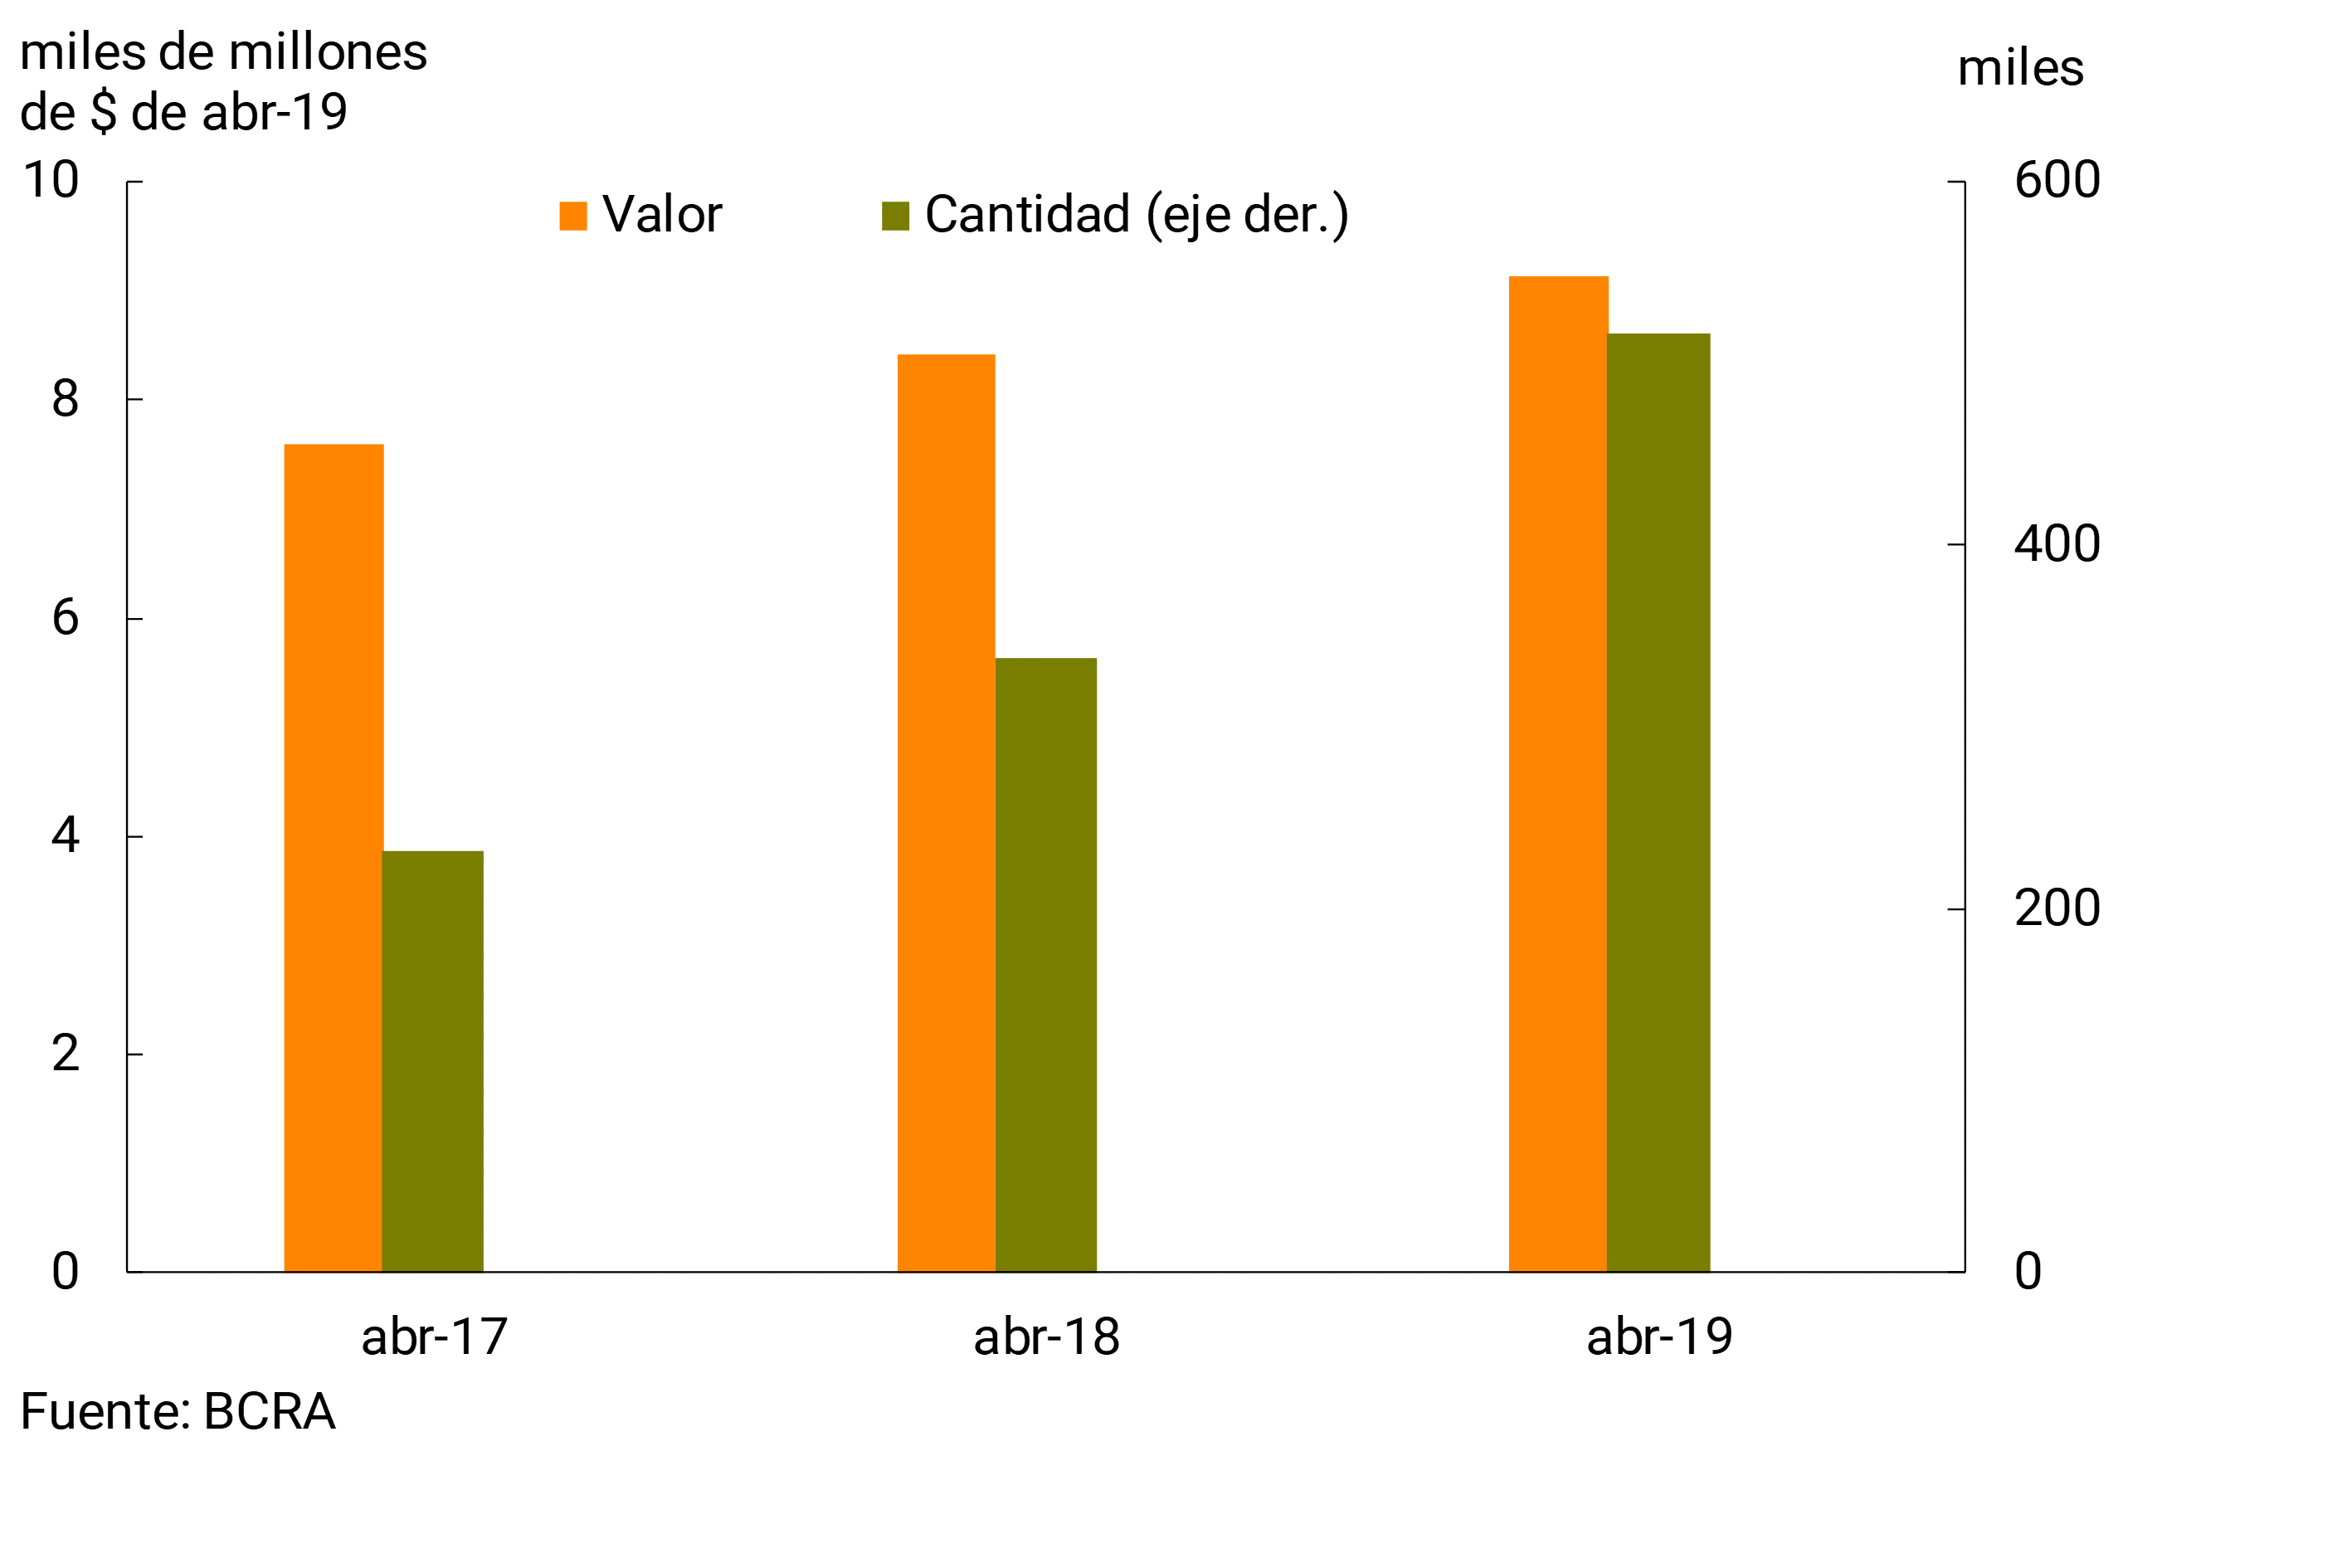
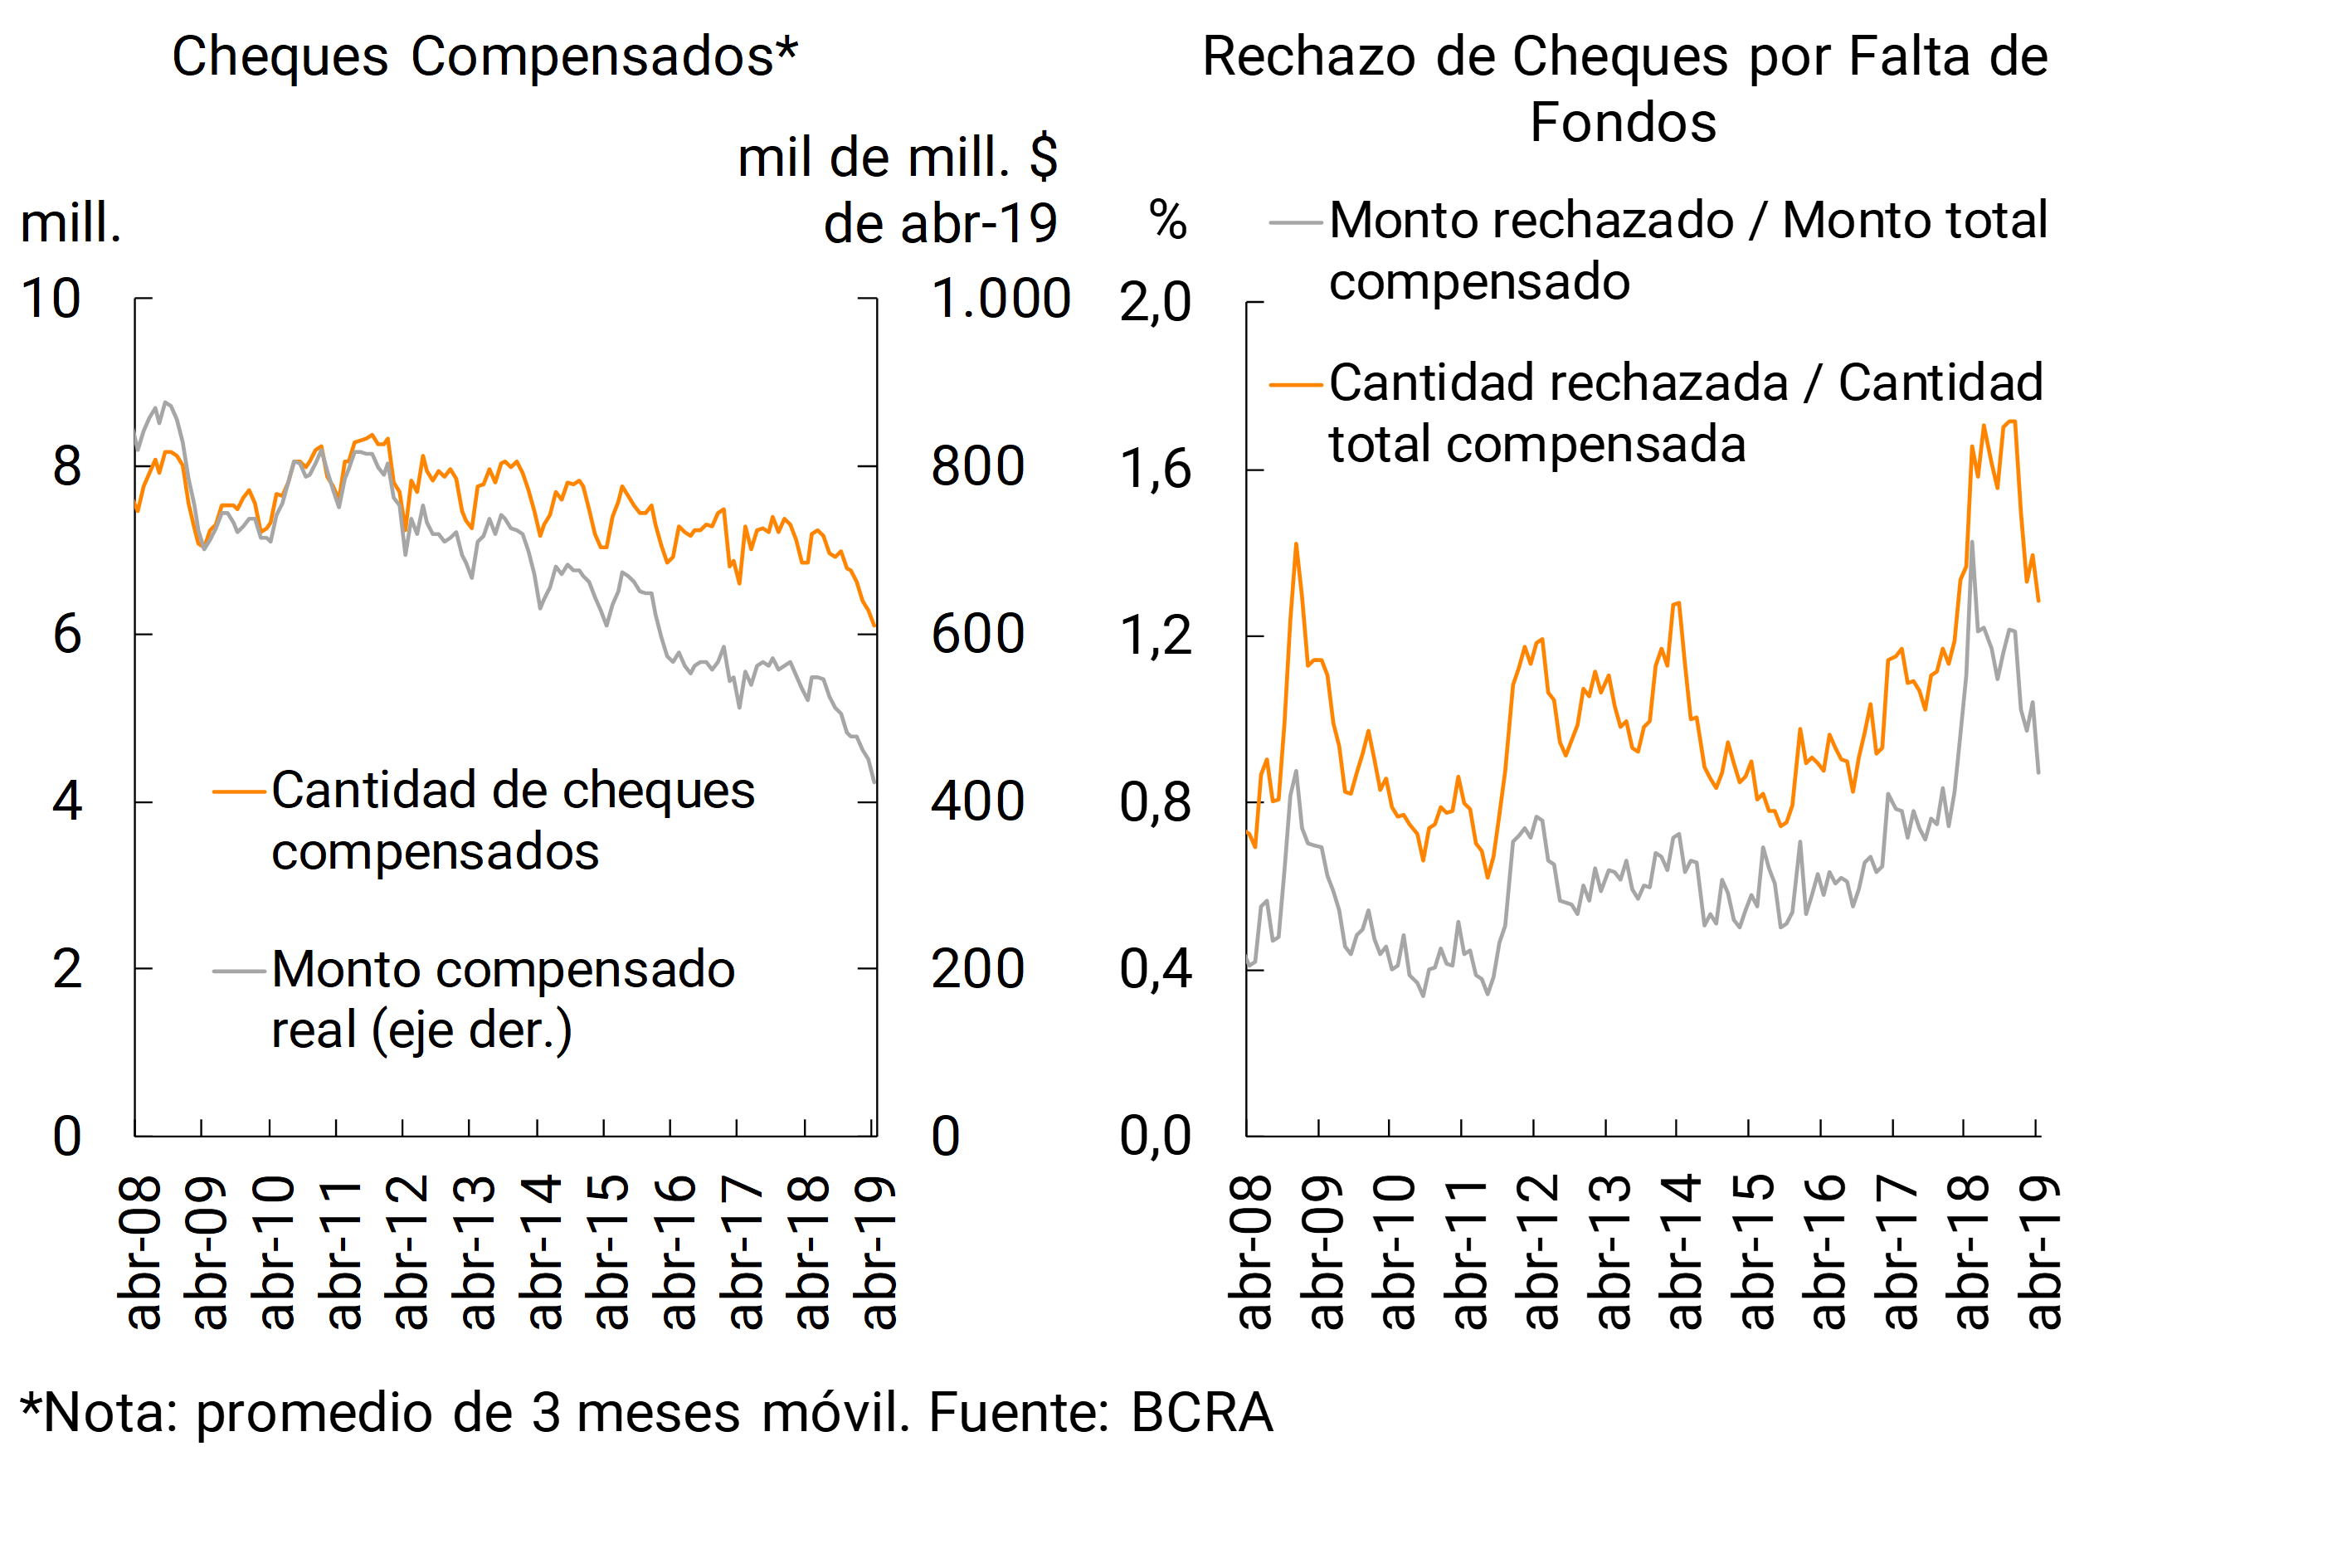
In relation to the operations of the National Payment System, the average daily real amount of immediate transfers increased in the month compared to March – the number of operations remained stable. In year-on-year terms, the amount and the real value of the month was higher than a year ago (see Graph 2). For its part, both the quantity and the cleared value of checks continued to fall in April. The rejection of checks due to lack of funds in terms of the total compensated fell in April (-0.17 p.p. in amounts, to a level of 0.87%), returning to values of a year ago (see Graph 3).
Graph 2 | Immediate Funds Transfers – Daily Average
Graph 3 | Check Clearing and Rejection
II. Deposits and liquidity
The balance of deposits in pesos of the private sector decreased 1.8% in real terms in April (+1.5% nominal). This performance was explained by those arranged in installments, while demand accounts increased slightly in real terms. Private sector foreign currency deposits grew 1.4% in April in source currency. Given the nominal decline in public sector deposits, the balance of total deposits fell by 2.5% in real terms in April.
In the last 12 months to April, private sector deposits in local currency decreased by 4.9% in real terms, with an increase in time deposits (+6.7% real YoY) partially offsetting the reduction in demand balances (-14.9% YoY in real terms). Private sector deposits in foreign currency expanded 13.1% in foreign currency compared to April 2018. In this context, the balance of total deposits grew 2.1% YoY in real terms.
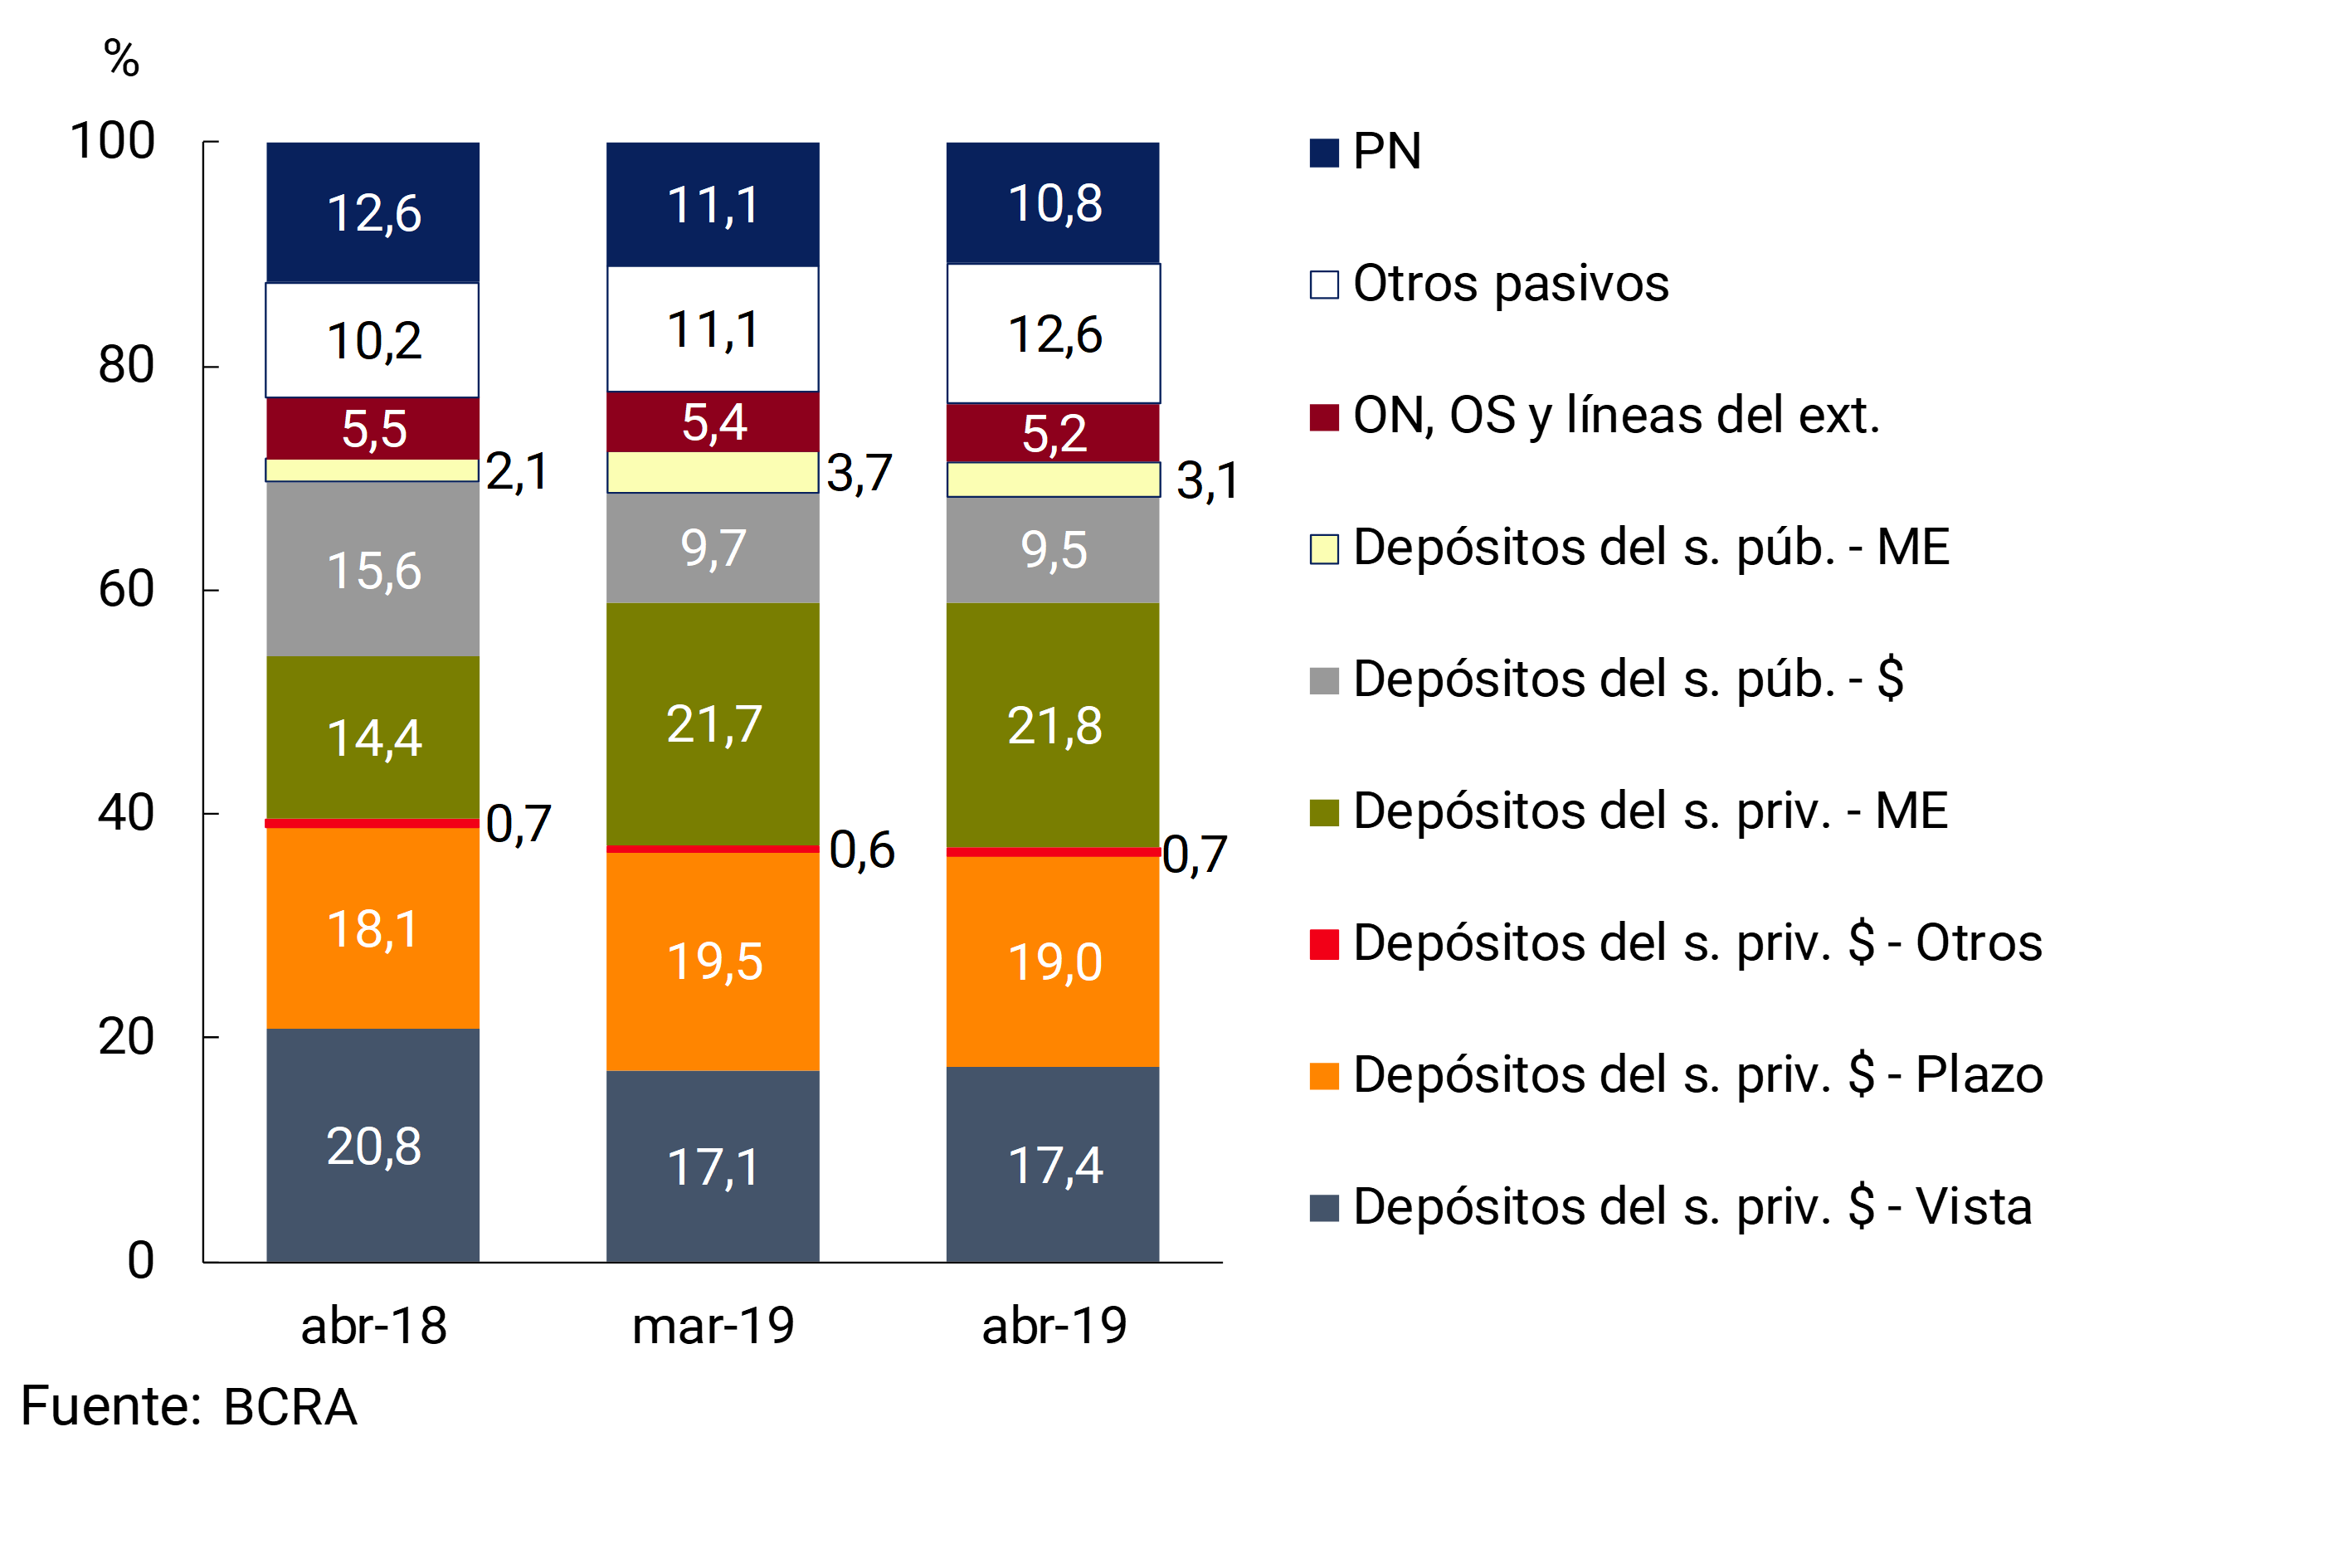
The relative importance of private sector deposits in the total funding of the financial system totaled 58.9% in April (no significant changes compared to March and +4.9 p.p. y.o.y.). In the last 12 months, placements in foreign currency and time deposits in pesos increased their weighting, to the detriment of demand accounts in pesos (see Chart 4).
Figure 4 | Total Funding – Financial System
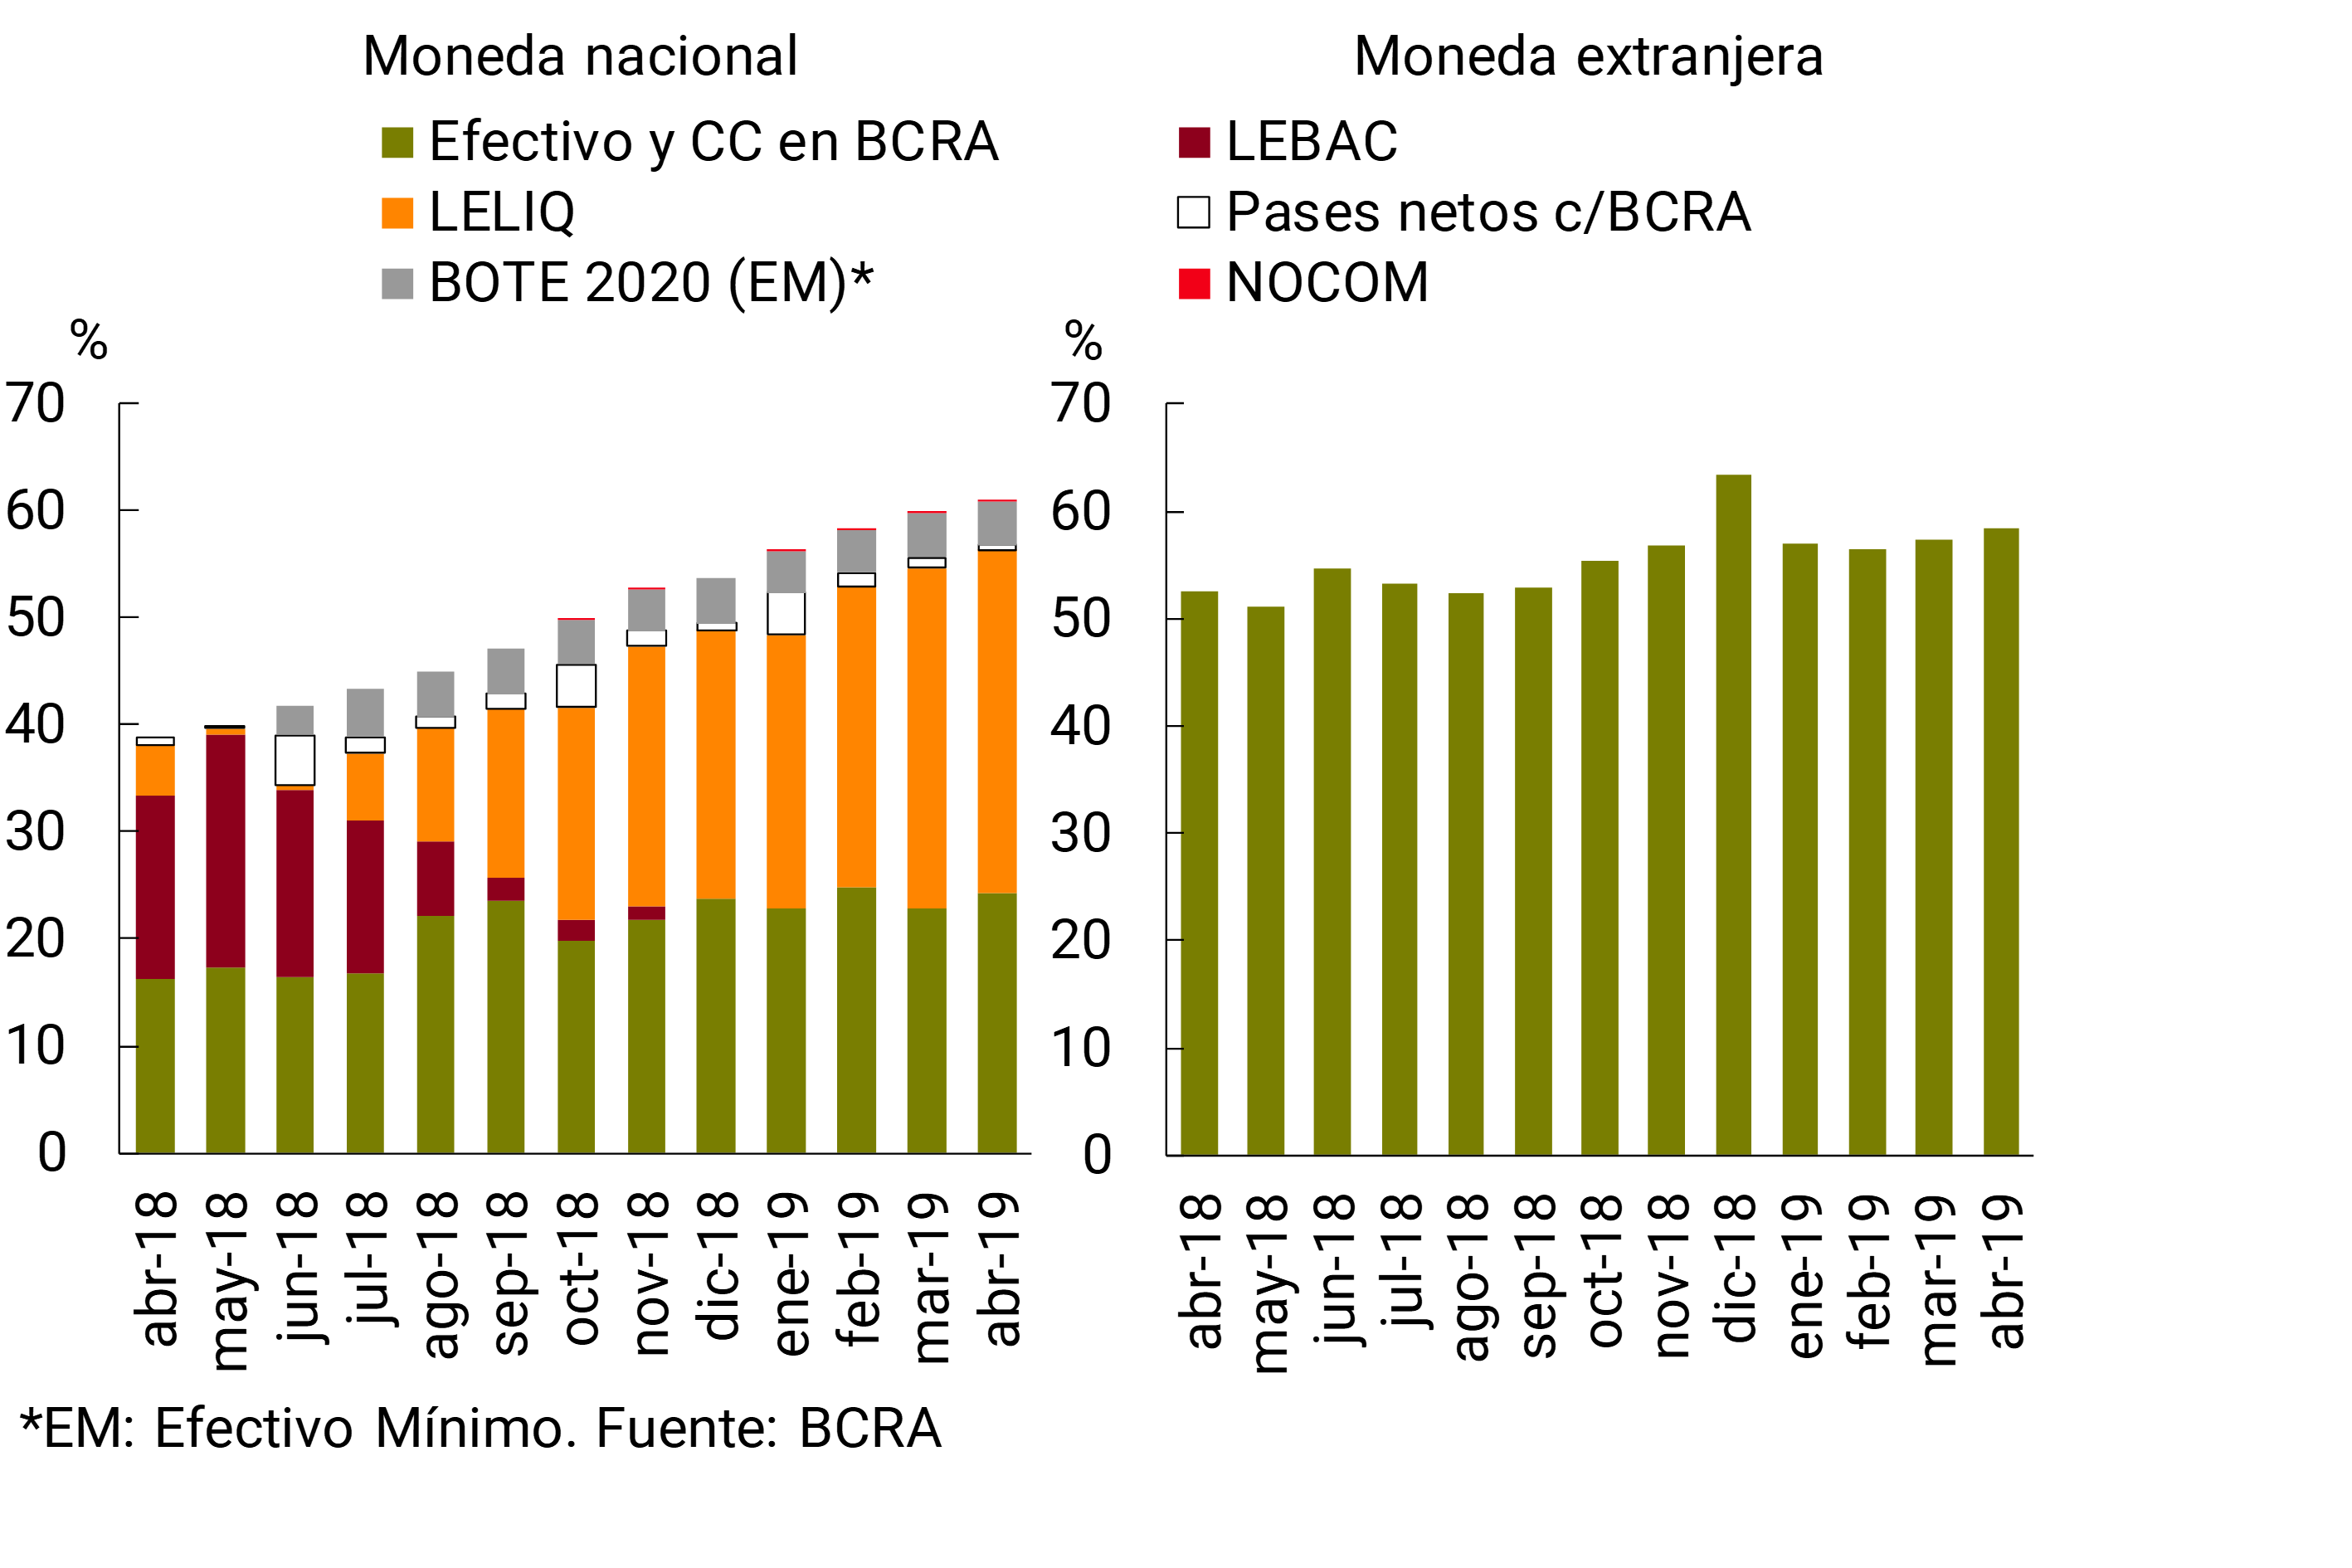
The liquidity indicators of the financial system increased again in April. The broad liquidity ratio2 stood at 60% of total deposits in the month (60.8% for items in pesos), 1.1 p.p. above the level recorded in March (similar value for the segment in national currency, see Chart 5). The monthly increase in liquidity was mainly explained by the higher holdings of cash and balances in current accounts of the entities in the BCRA. In a year-on-year comparison, the broad liquidity indicator grew 18 p.p. in deposits (+22 p.p. for the ratio in pesos). Liquid assets in foreign currency totaled 58.4% of deposits in the same denomination in the period (+1 p.p. and +5.8 p.p. compared to last month and April 2018, respectively).
Graph 5 | Liquidity of the Financial System
III. Credit and Portfolio Quality
In April, the balance of financing in national currency to the private sector fell by 2.3% in real terms compared to the previous month (+1% nominal). 3 This fall was widespread among all credit lines and in all groups of financial institutions. Credit in foreign currency to the private sector grew 0.9% in the period (in currency of origin, see Chart 6), with greater dynamism in credit cards.
Graph 6 | Private Sector Credit Balance by Currency
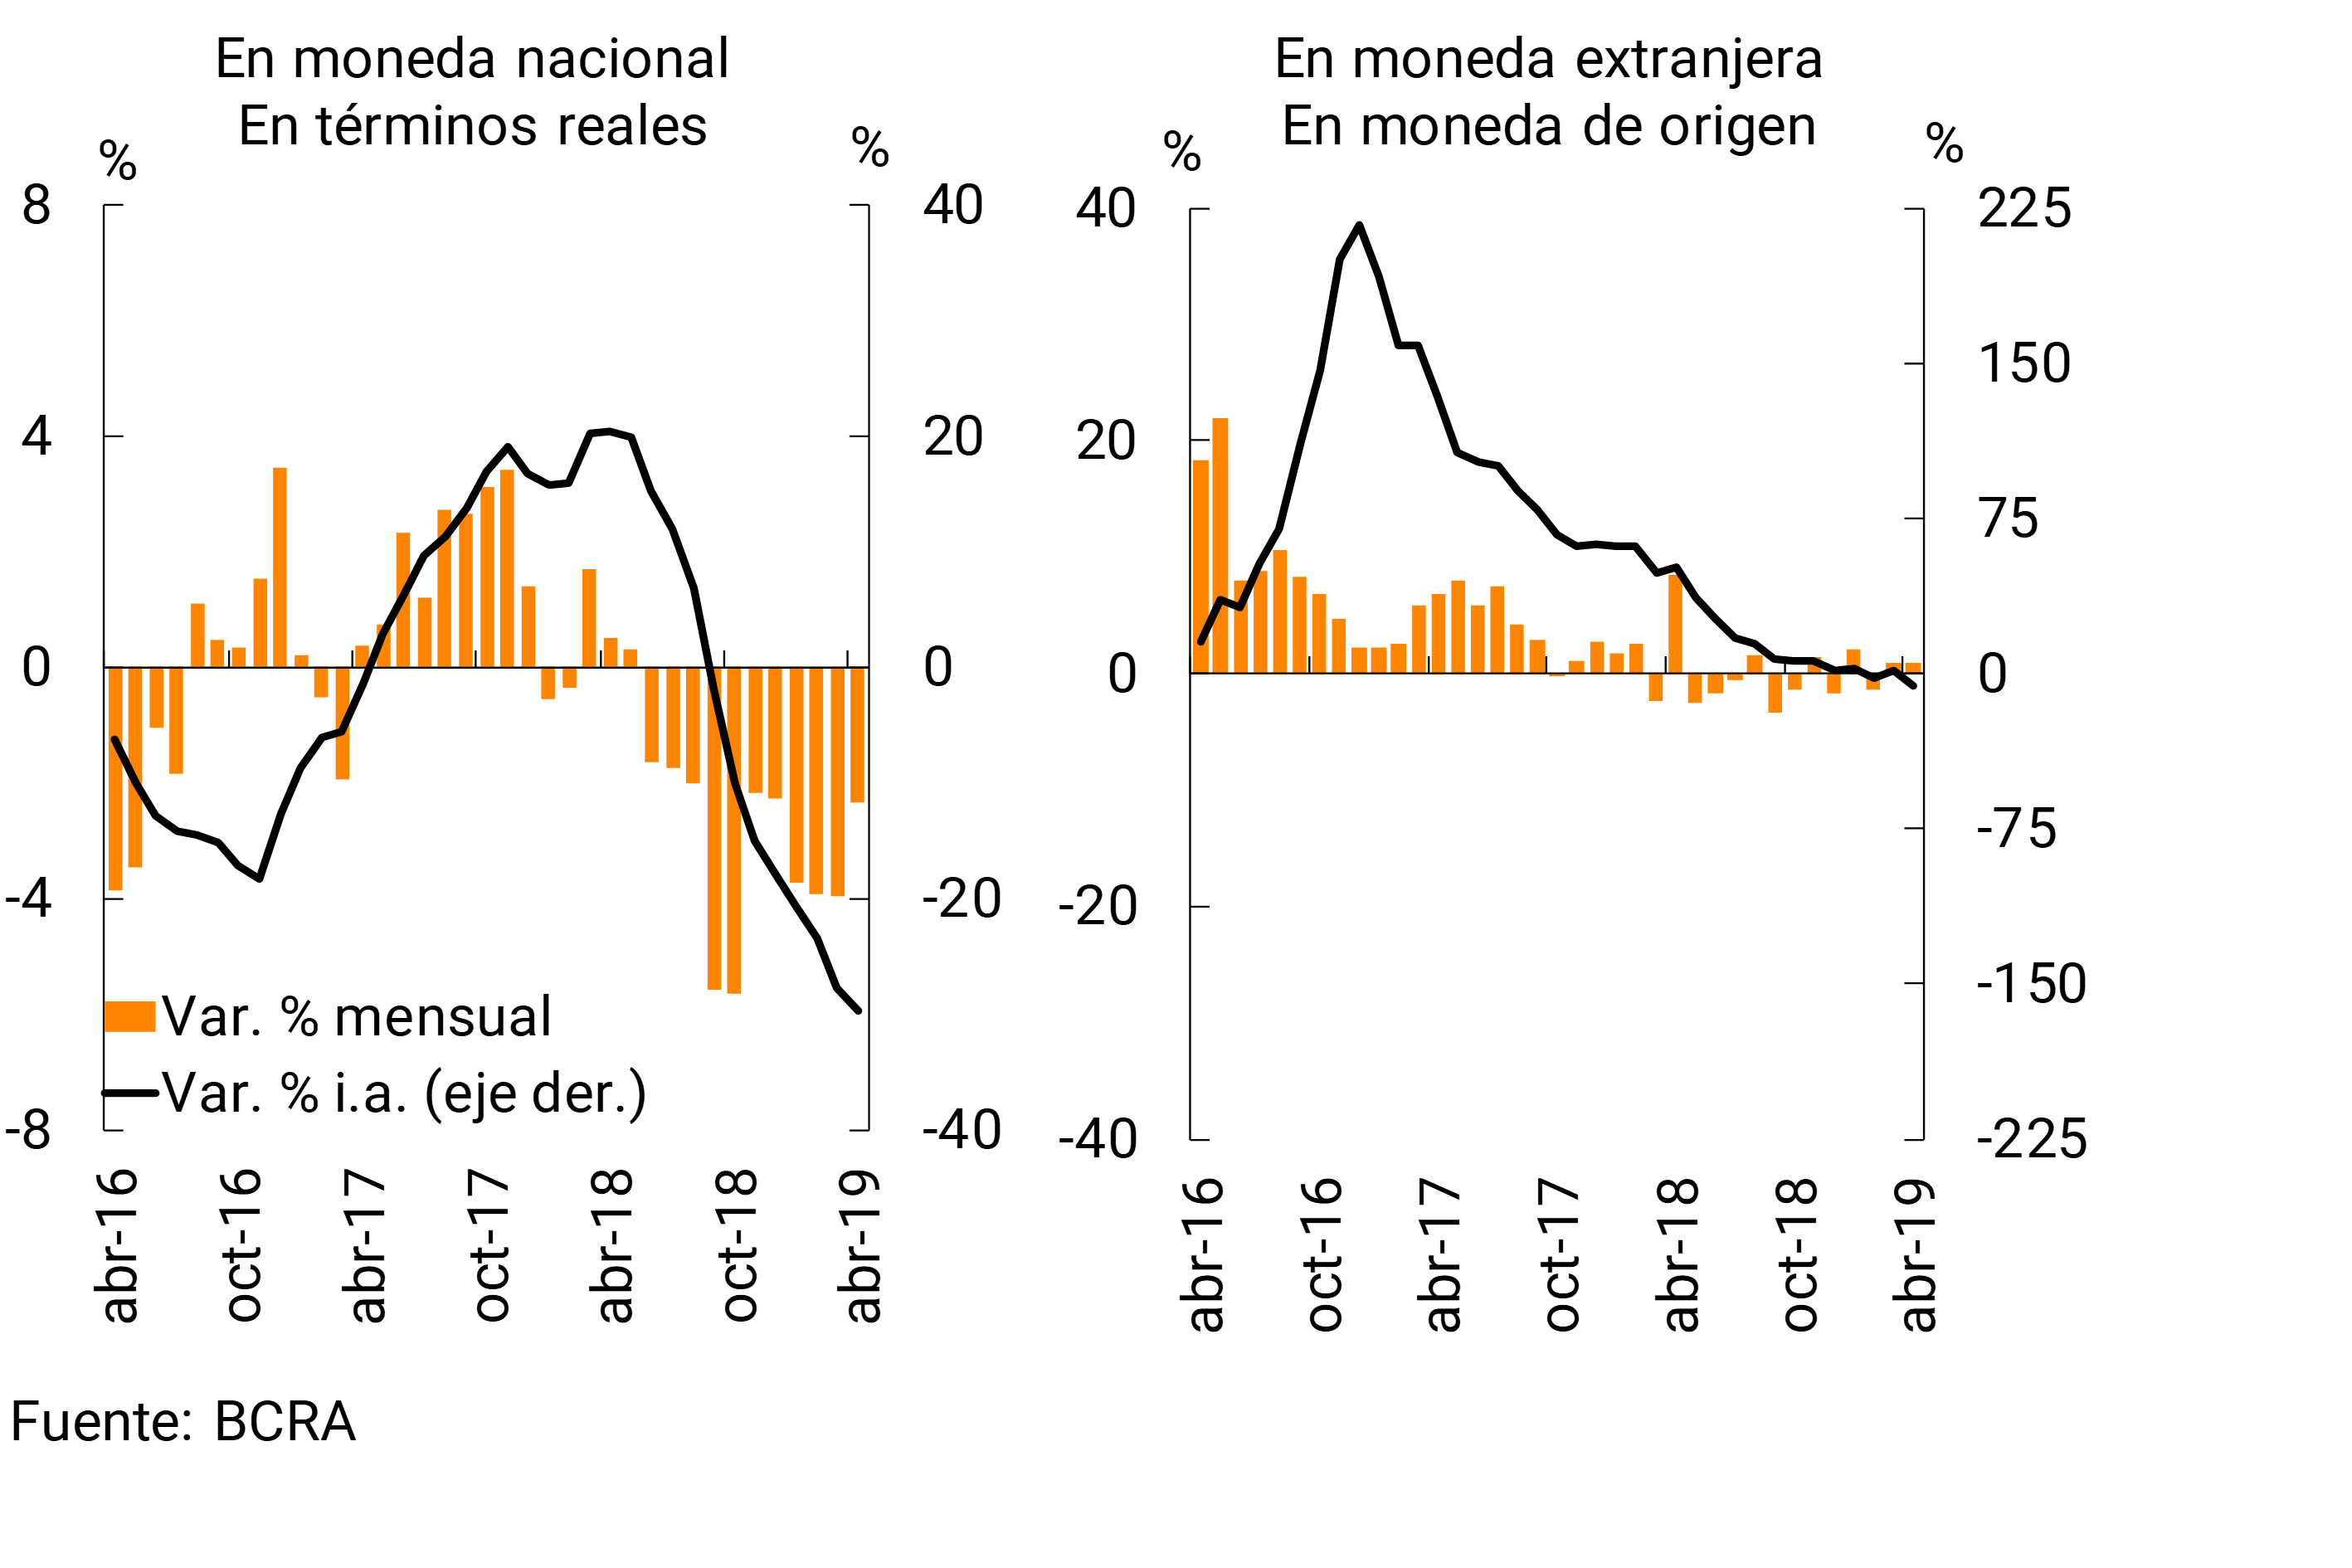
In year-on-year terms, loans in pesos to the private sector fell 29.8% in real terms, mainly due to the performance of commercial lines (documents, goods in financial lease and advances). Financing in foreign currency decreased by 5.7% YoY in source currency.
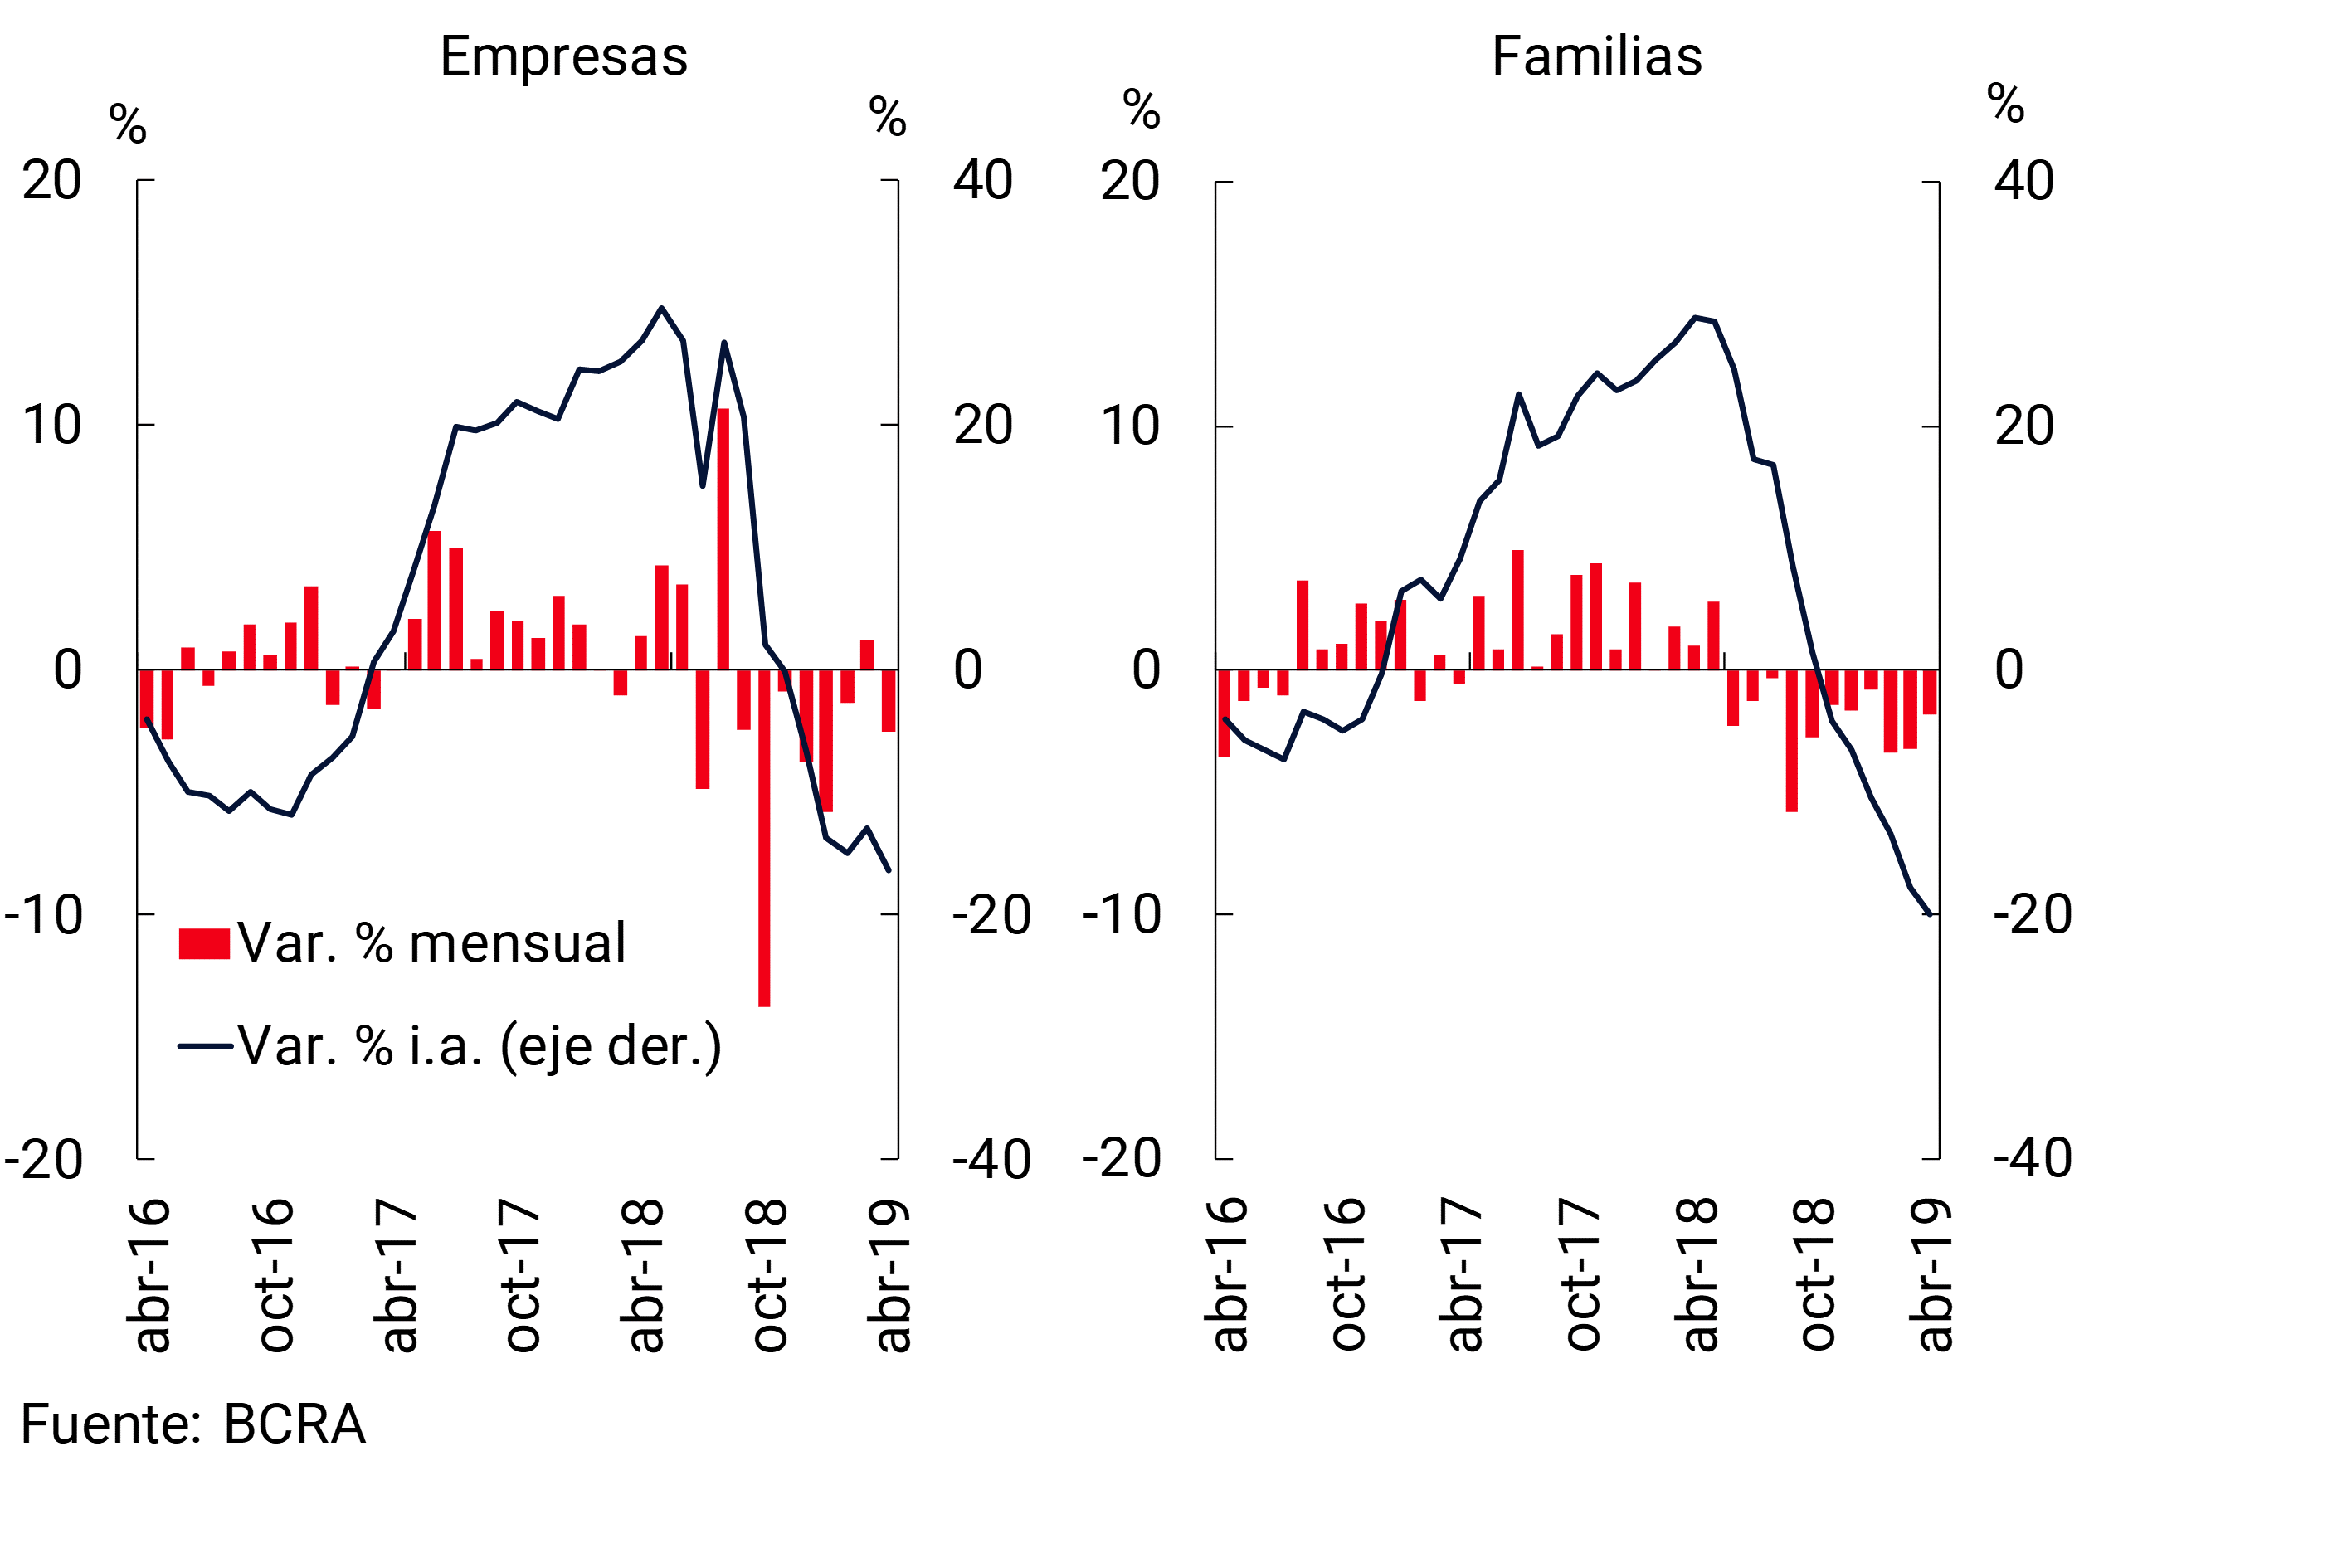
When disaggregated by sector, it can be seen that total credit to companies (in domestic and foreign currency) fell by 2.6% in real terms in the month (+0.8% nominal) and by 16.4% y.o.y. in real terms (see Graph 7). 4 Commercial and construction loans showed the largest relative year-on-year declines. On the other hand, financing to families fell 1.8% in real terms compared to the previous month (+1.6% nominal). In a year-on-year comparison, loans to households decreased 20% y.o.y. in real terms, mainly due to the performance of pledges and personal loans.
Figure 7 | Total Credit Balance to the Private Sector – Changes in Real Terms
The share of credit to the private sector in total banking assets fell slightly compared to the previous month (-0.4 p.p.), reaching 39% in April. In year-on-year terms, this ratio accumulated a fall of 9.9 p.p. at the aggregate level, mainly explained by private banks.
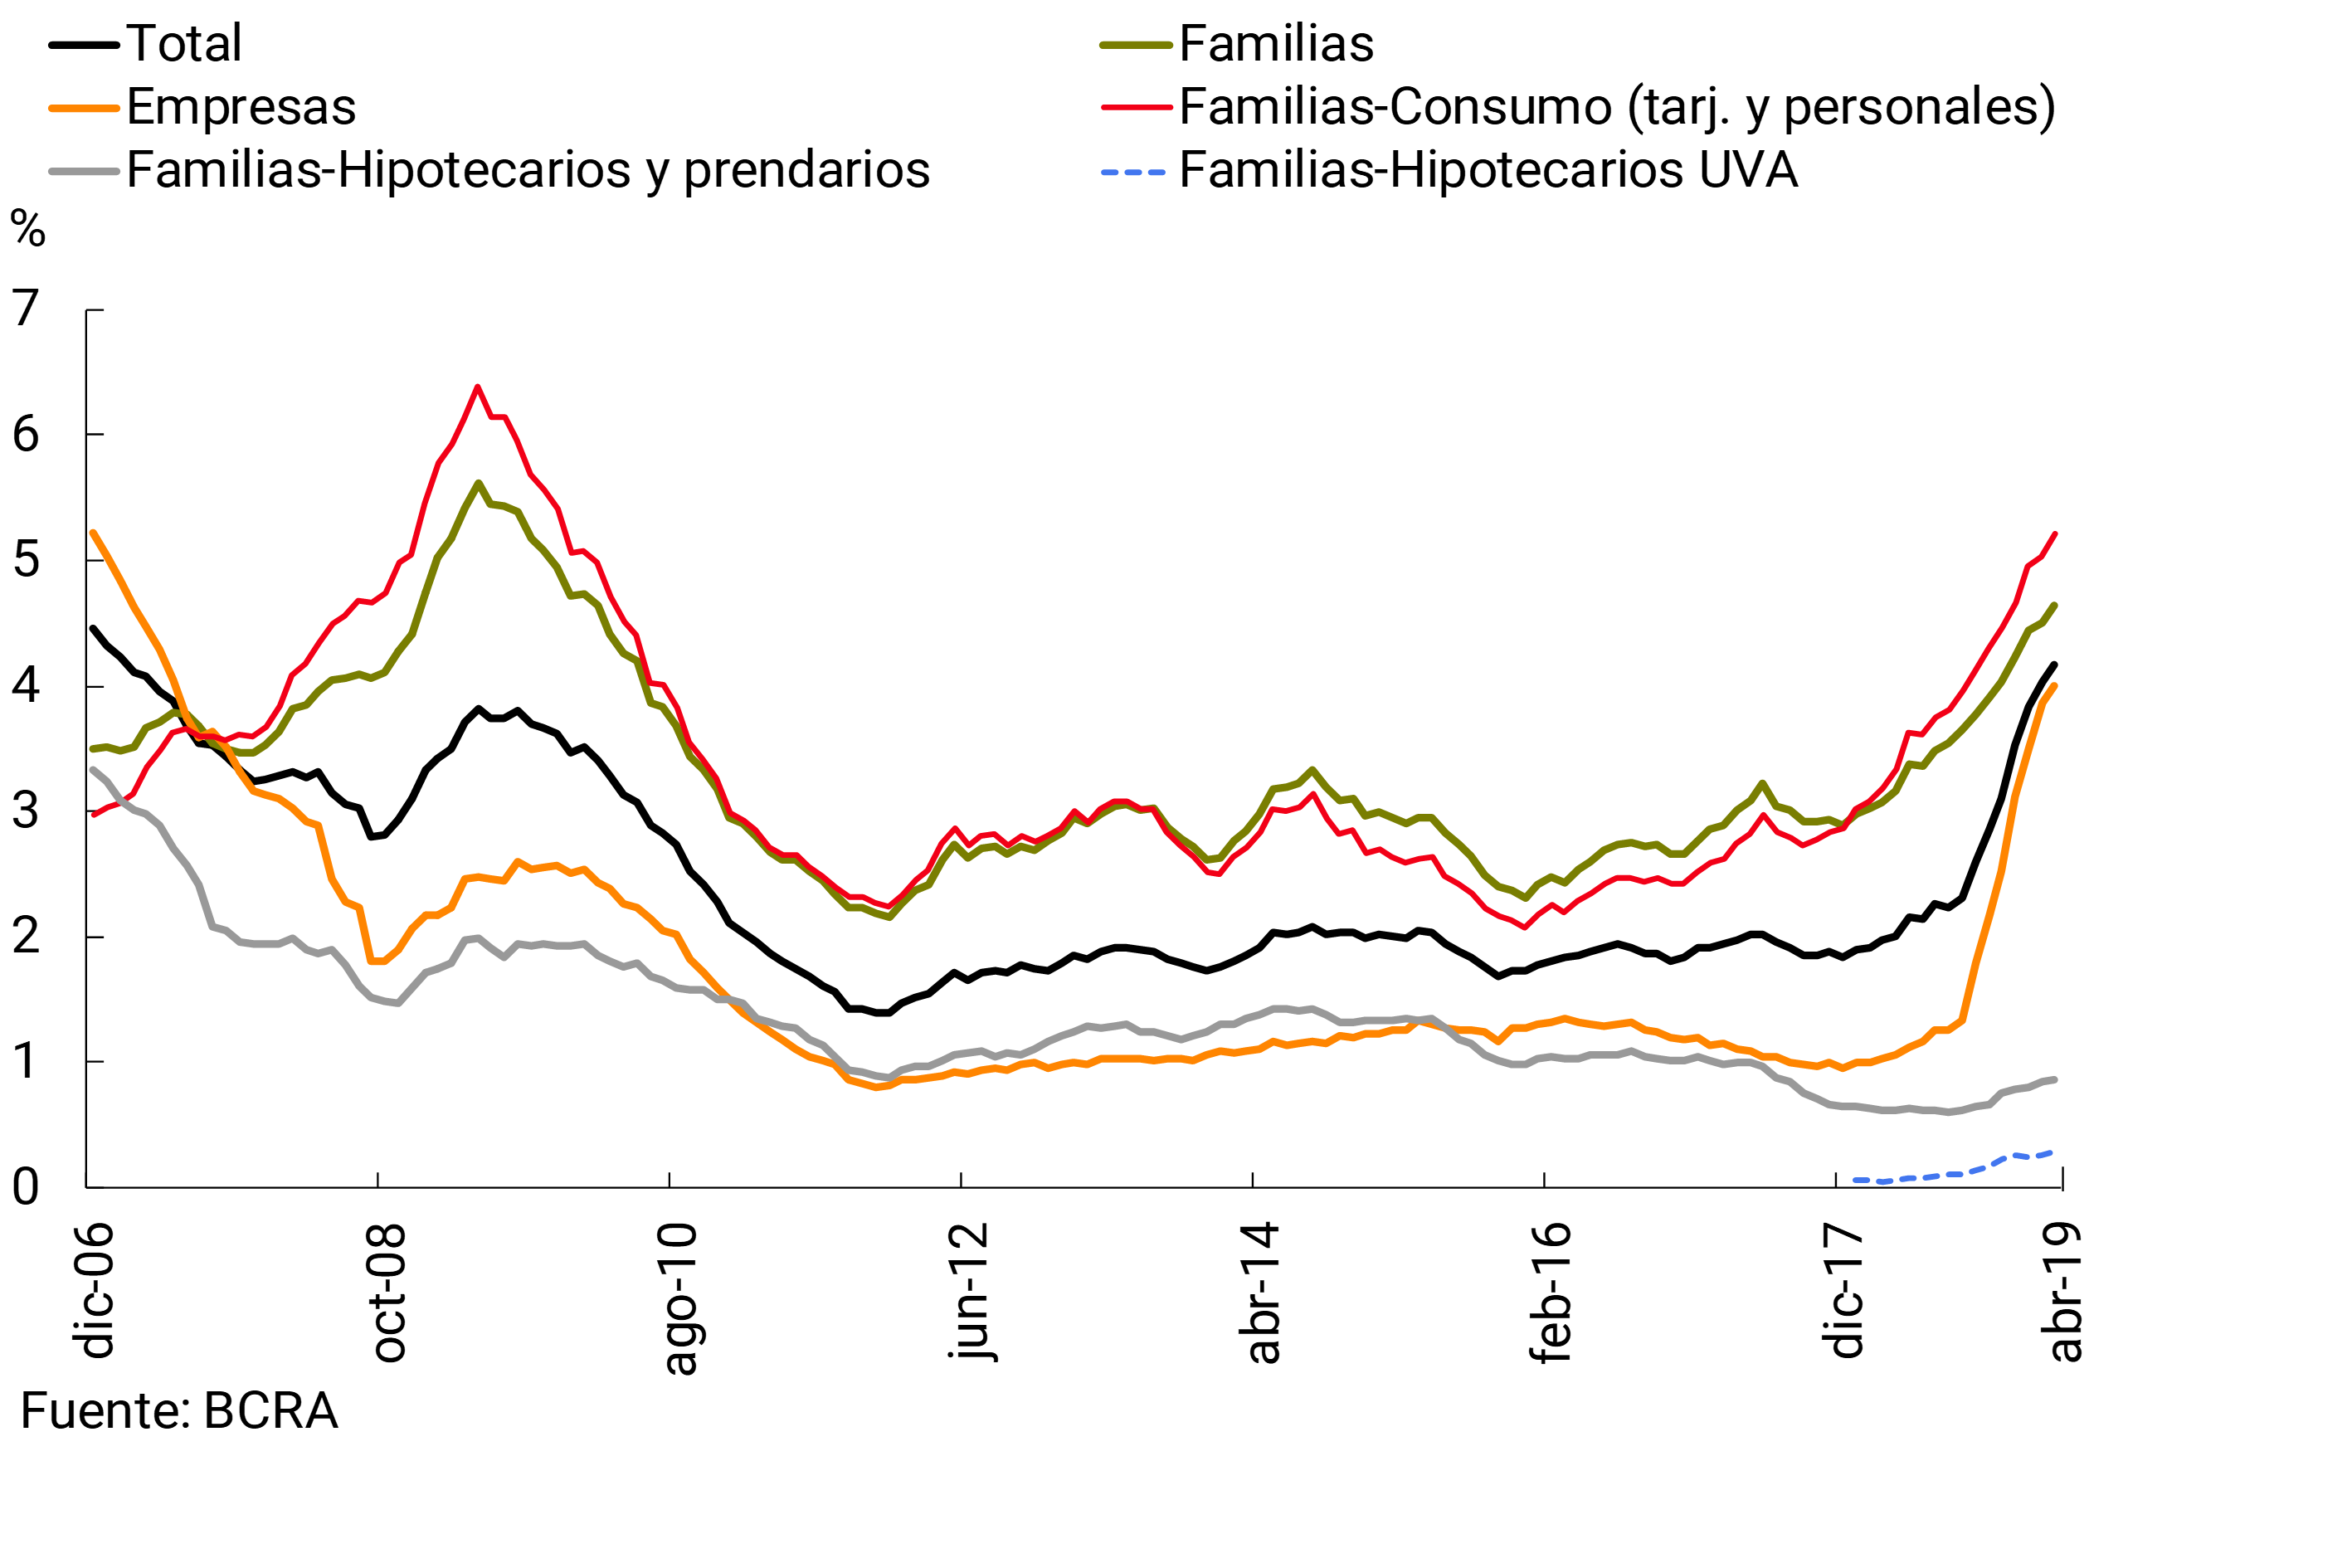
The non-performing loan ratio for loans to the private sector reached 4.2% in April, 0.1 p.p. higher than the previous month’s value and 2.2 p.p. above the level of a year ago (see Chart 8). Non-performing loans to companies accounted for 4% of the total portfolio (+0.1 p.p. compared to March and +2.9 p.p. y.o.y.), while non-performing loans to households stood at 4.6% in the month (+0.1 p.p. compared to March and +1.5 p.p. y.o.y.). Mortgage loans to households did not show significant changes in their irregularity ratio in the period (0.3% in the case of UVAs and 0.62% in the rest).
Figure 8 | Irregularity of Credit to the Private Sector – Irregular financing / Total financing (%)
In April, the estimated balance of forecasts attributable to loans in an irregular situation represented 75% of this portfolio, remaining largely unchanged from the previous month (see Chart 9). Meanwhile, the total accounting forecasts (those awarded to the regular and irregular portfolio) covered the entire irregular portfolio to the private sector.
Figure 9 | Forecasting of the Financial System
IV. Solvency
In April, the solvency indicators of the aggregate financial system did not show significant changes, remaining in a range of high values. In the month, capital integration totaled 15.7% of risk-weighted assets (RWA), slightly lower than in March and without relevant changes in a year-on-year comparison (see Chart 10). This level of integration continued to comfortably exceed the minimum regulatory capital requirement, representing 181% of the latter. Almost 90% of total integration continued to be accounted for by Tier 1 capital.
Figure 10 | Integration of Regulatory Capital
The financial institutions as a whole accrued nominal gains in April equivalent to 4.1% y/a of assets (ROA) and 38.6% y/y of equity (ROE) (see Chart 11). These gains were lower than in March (-1.6 p.p. of the asset). In the cumulative 12 months to April, the ROA of the financial system reached 4.5% of assets (+1.8 p.p. y.o.y.) and ROE 41.4% (+18.7 p.p. y.o.y.).
Figure 11 | Profitability of the Financial System
The sector’s financial margin reached 13% of assets in April. This level was lower than in March due to the decrease in securities gains, higher interest expenses and lower interest income; effects that were tempered by an increase in the positive CER adjustment and by an increase in positive contribution differences. In the accumulated 12 months to April, the financial margin represented 11.3% of assets, 0.9 p.p. more in a year-on-year comparison.
In April, earnings for services remained at 2% y/y. of assets. Taking into account the cumulative figure for 12 months, these net income totaled 2.1% of assets (-0.4 p.p. y.o.y.).
Bad debt charges fell in April to 1.6% y/y of assets (levels similar to the cumulative 12-month figure, +0.4 p.p.i.y.). Administrative expenses reached 6.3% y/y of assets in the month, 0.1 p.p. more than in March (6.2% of assets in the last 12 months, -0.7 p.p. y.o.y.).
References
1 Considering differences in balance sheet balance.
2 Availability, integration of minimum cash and BCRA instruments, in national and foreign currency.
3 Includes principal adjustments and accrued interest.
4 Information extracted from the Debtors’ Central (national and foreign currency). Loans to residents abroad are not included. Adjustments in principal and accrued interest are considered. Business financing is defined here as that granted to legal entities and commercial financing granted to individuals. On the other hand, loans to families are considered to be those granted to individuals, unless they are for commercial purposes.
Share on


