I. Recent measures1
In May 2018, it was established that the promoters and founders of financial institutions and those who exercise their control, may not have their income concentrated, directly or indirectly, in more than 75% in concession and/or supply contracts to the national, provincial, municipal and Autonomous City of Buenos Airesgovernments 2. This provision is in force for applications for authorization of new financial institutions, as well as for future negotiations of shares of financial institutions.
II. Activity
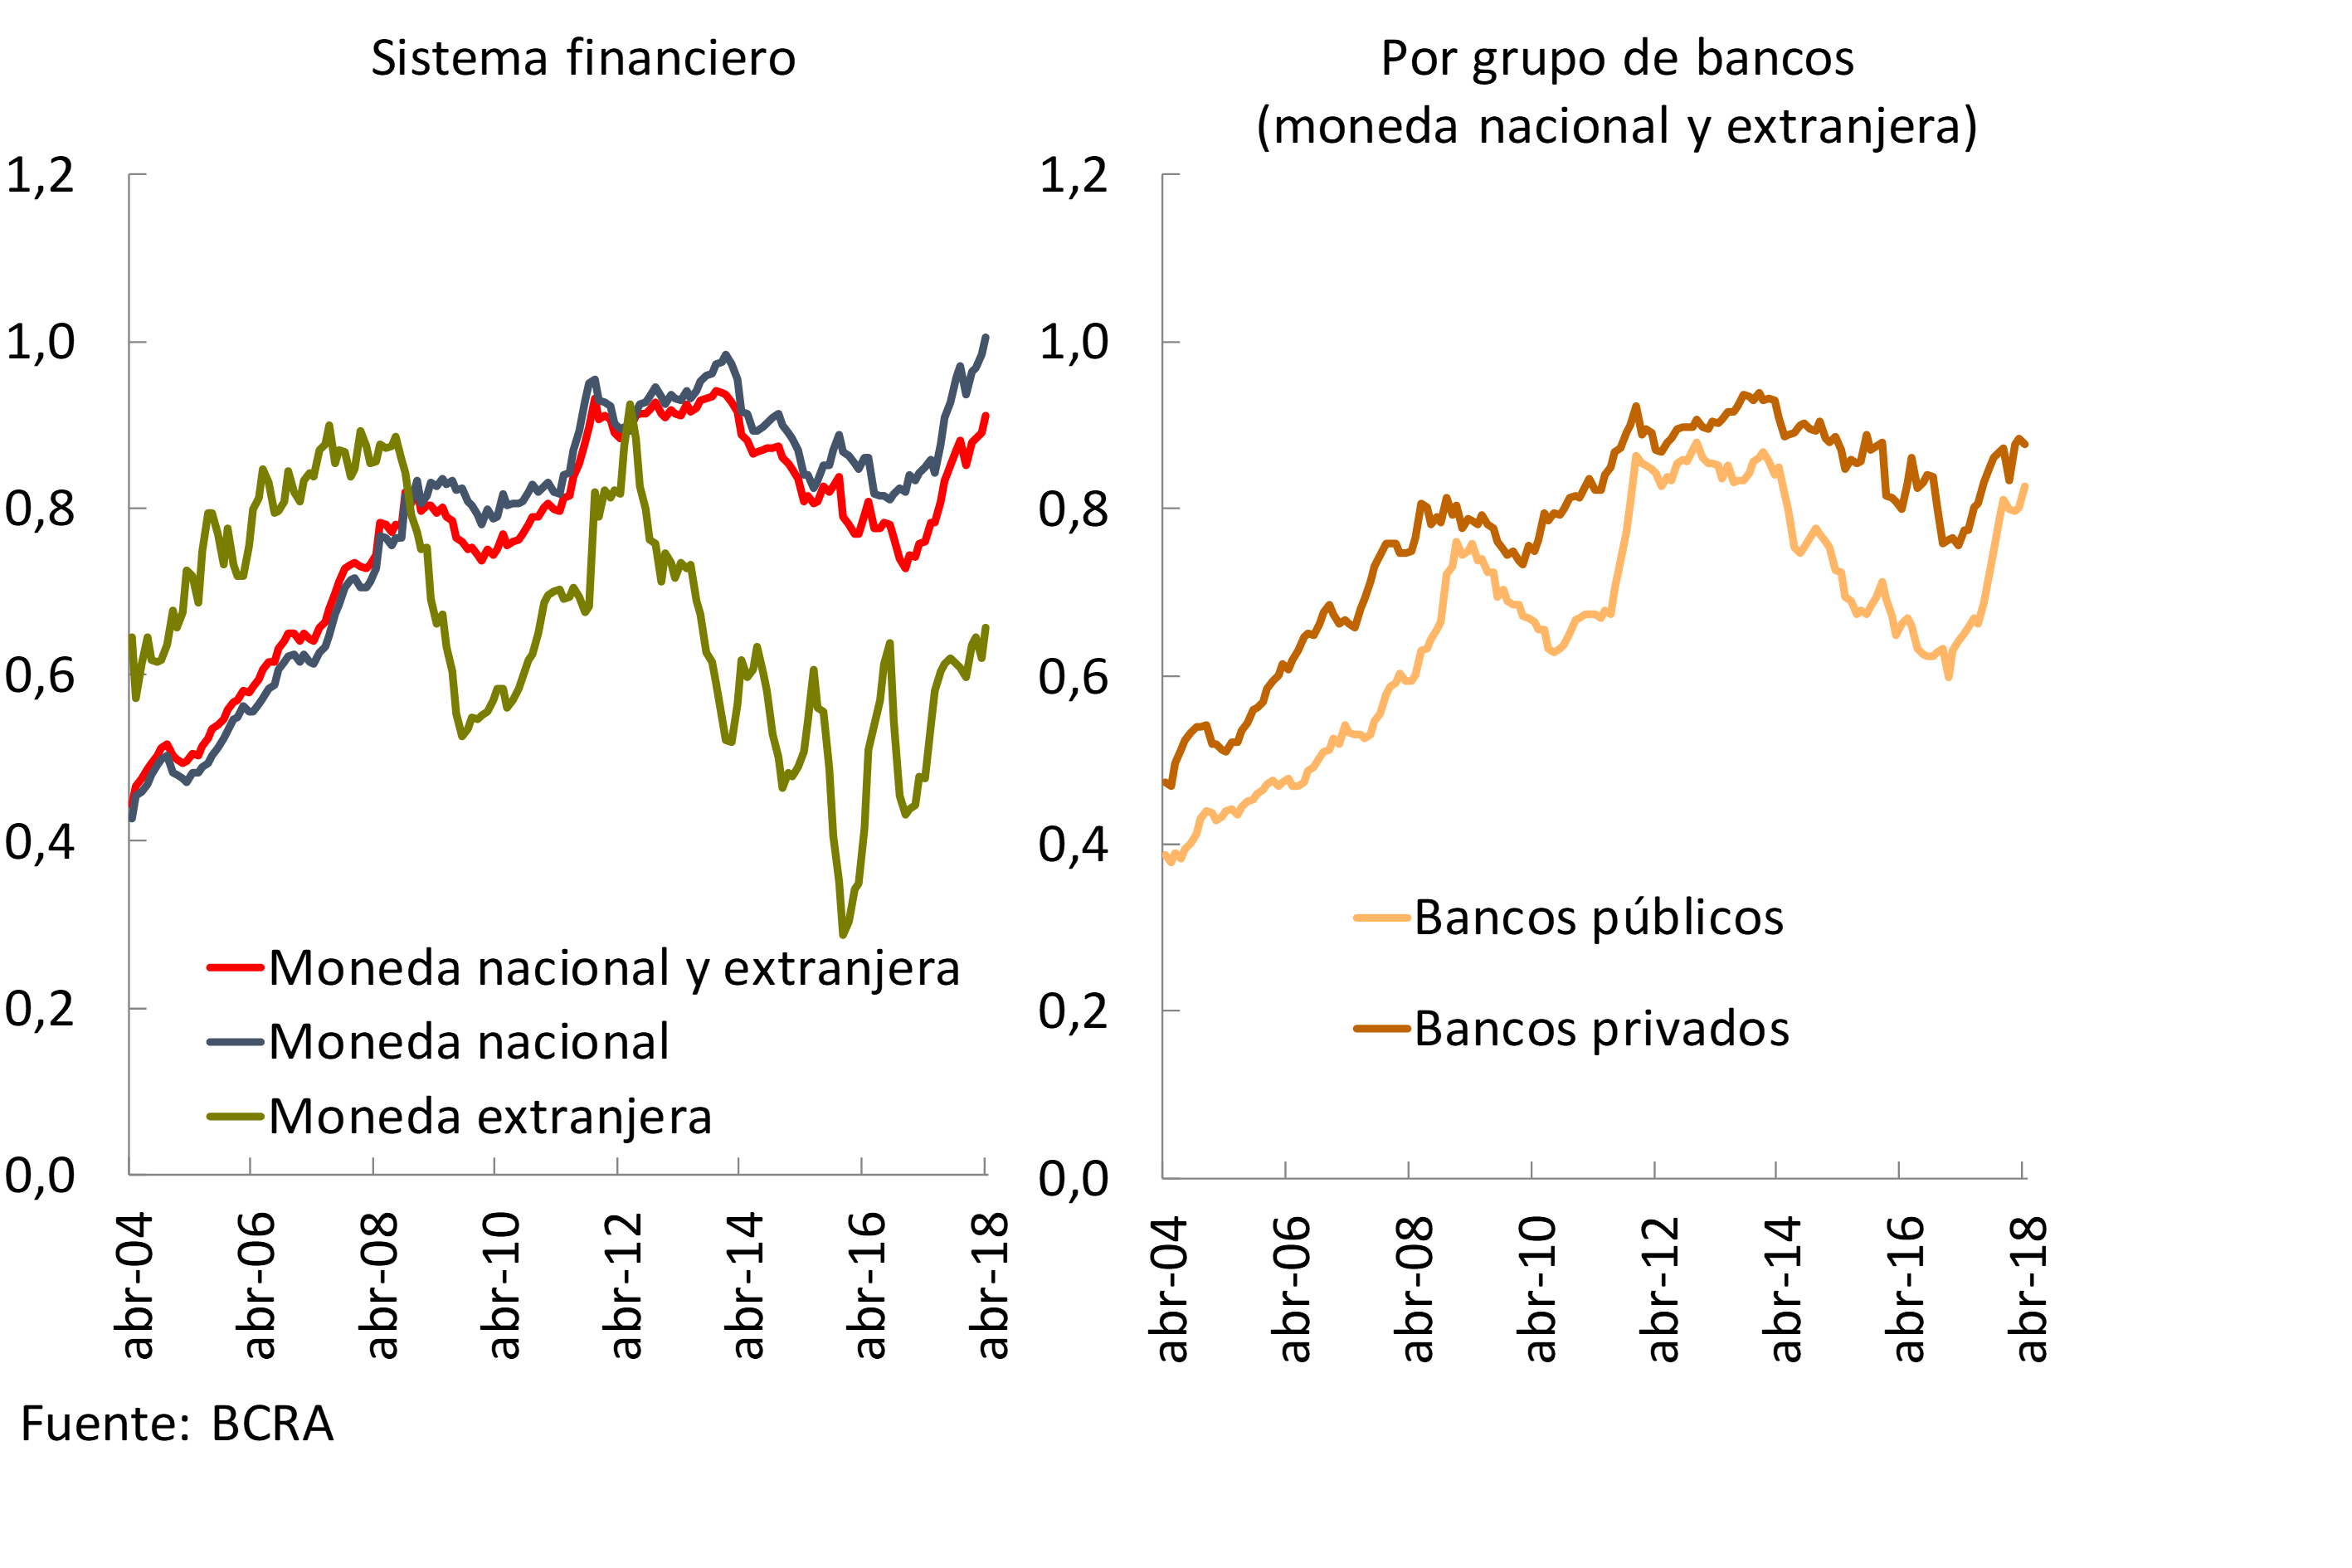
In line with the performance of recent months, in April credit to the private sector grew at a faster rate than deposits in this sector, both for the segment in domestic and foreign currency (see Chart 1). Given this evolution, the balance of financing to households and companies in national currency exceeded that of deposits in the same sector in the same denomination. In this context, net assets grew 0.6% in real terms in the month (12.8% real year-on-year -y.o.y.-).
Graph 1 | Loans in Deposit Terms – Balance Sheet Balances – Private Sector
Based on the estimate of the flow of funds3 for the month of April for the financial system, the decrease in the holdings of BCRA instruments ($51,400 million, mostly explained by private banks) was the most relevant source of resources in the national currency segment (see Graph 2). In addition, the increase in the balance of negotiable obligations (NBs)4 and deposits – both in the public and private sectors – were sources of funds in the period. These resources were channeled to increase credit to the private sector in pesos ($50,800 million) and, to a lesser extent, to the public sector. On the other hand, considering the flow of funds for foreign currency items, the increase in private sector deposits was the most prominent source of funding in April. Meanwhile, the monthly increase in financing to the private sector and liquidity were the most relevant applications of resources in the aforementioned currency.
Graph 2 | April 2018 Cash Flow Estimate – By Bank Group
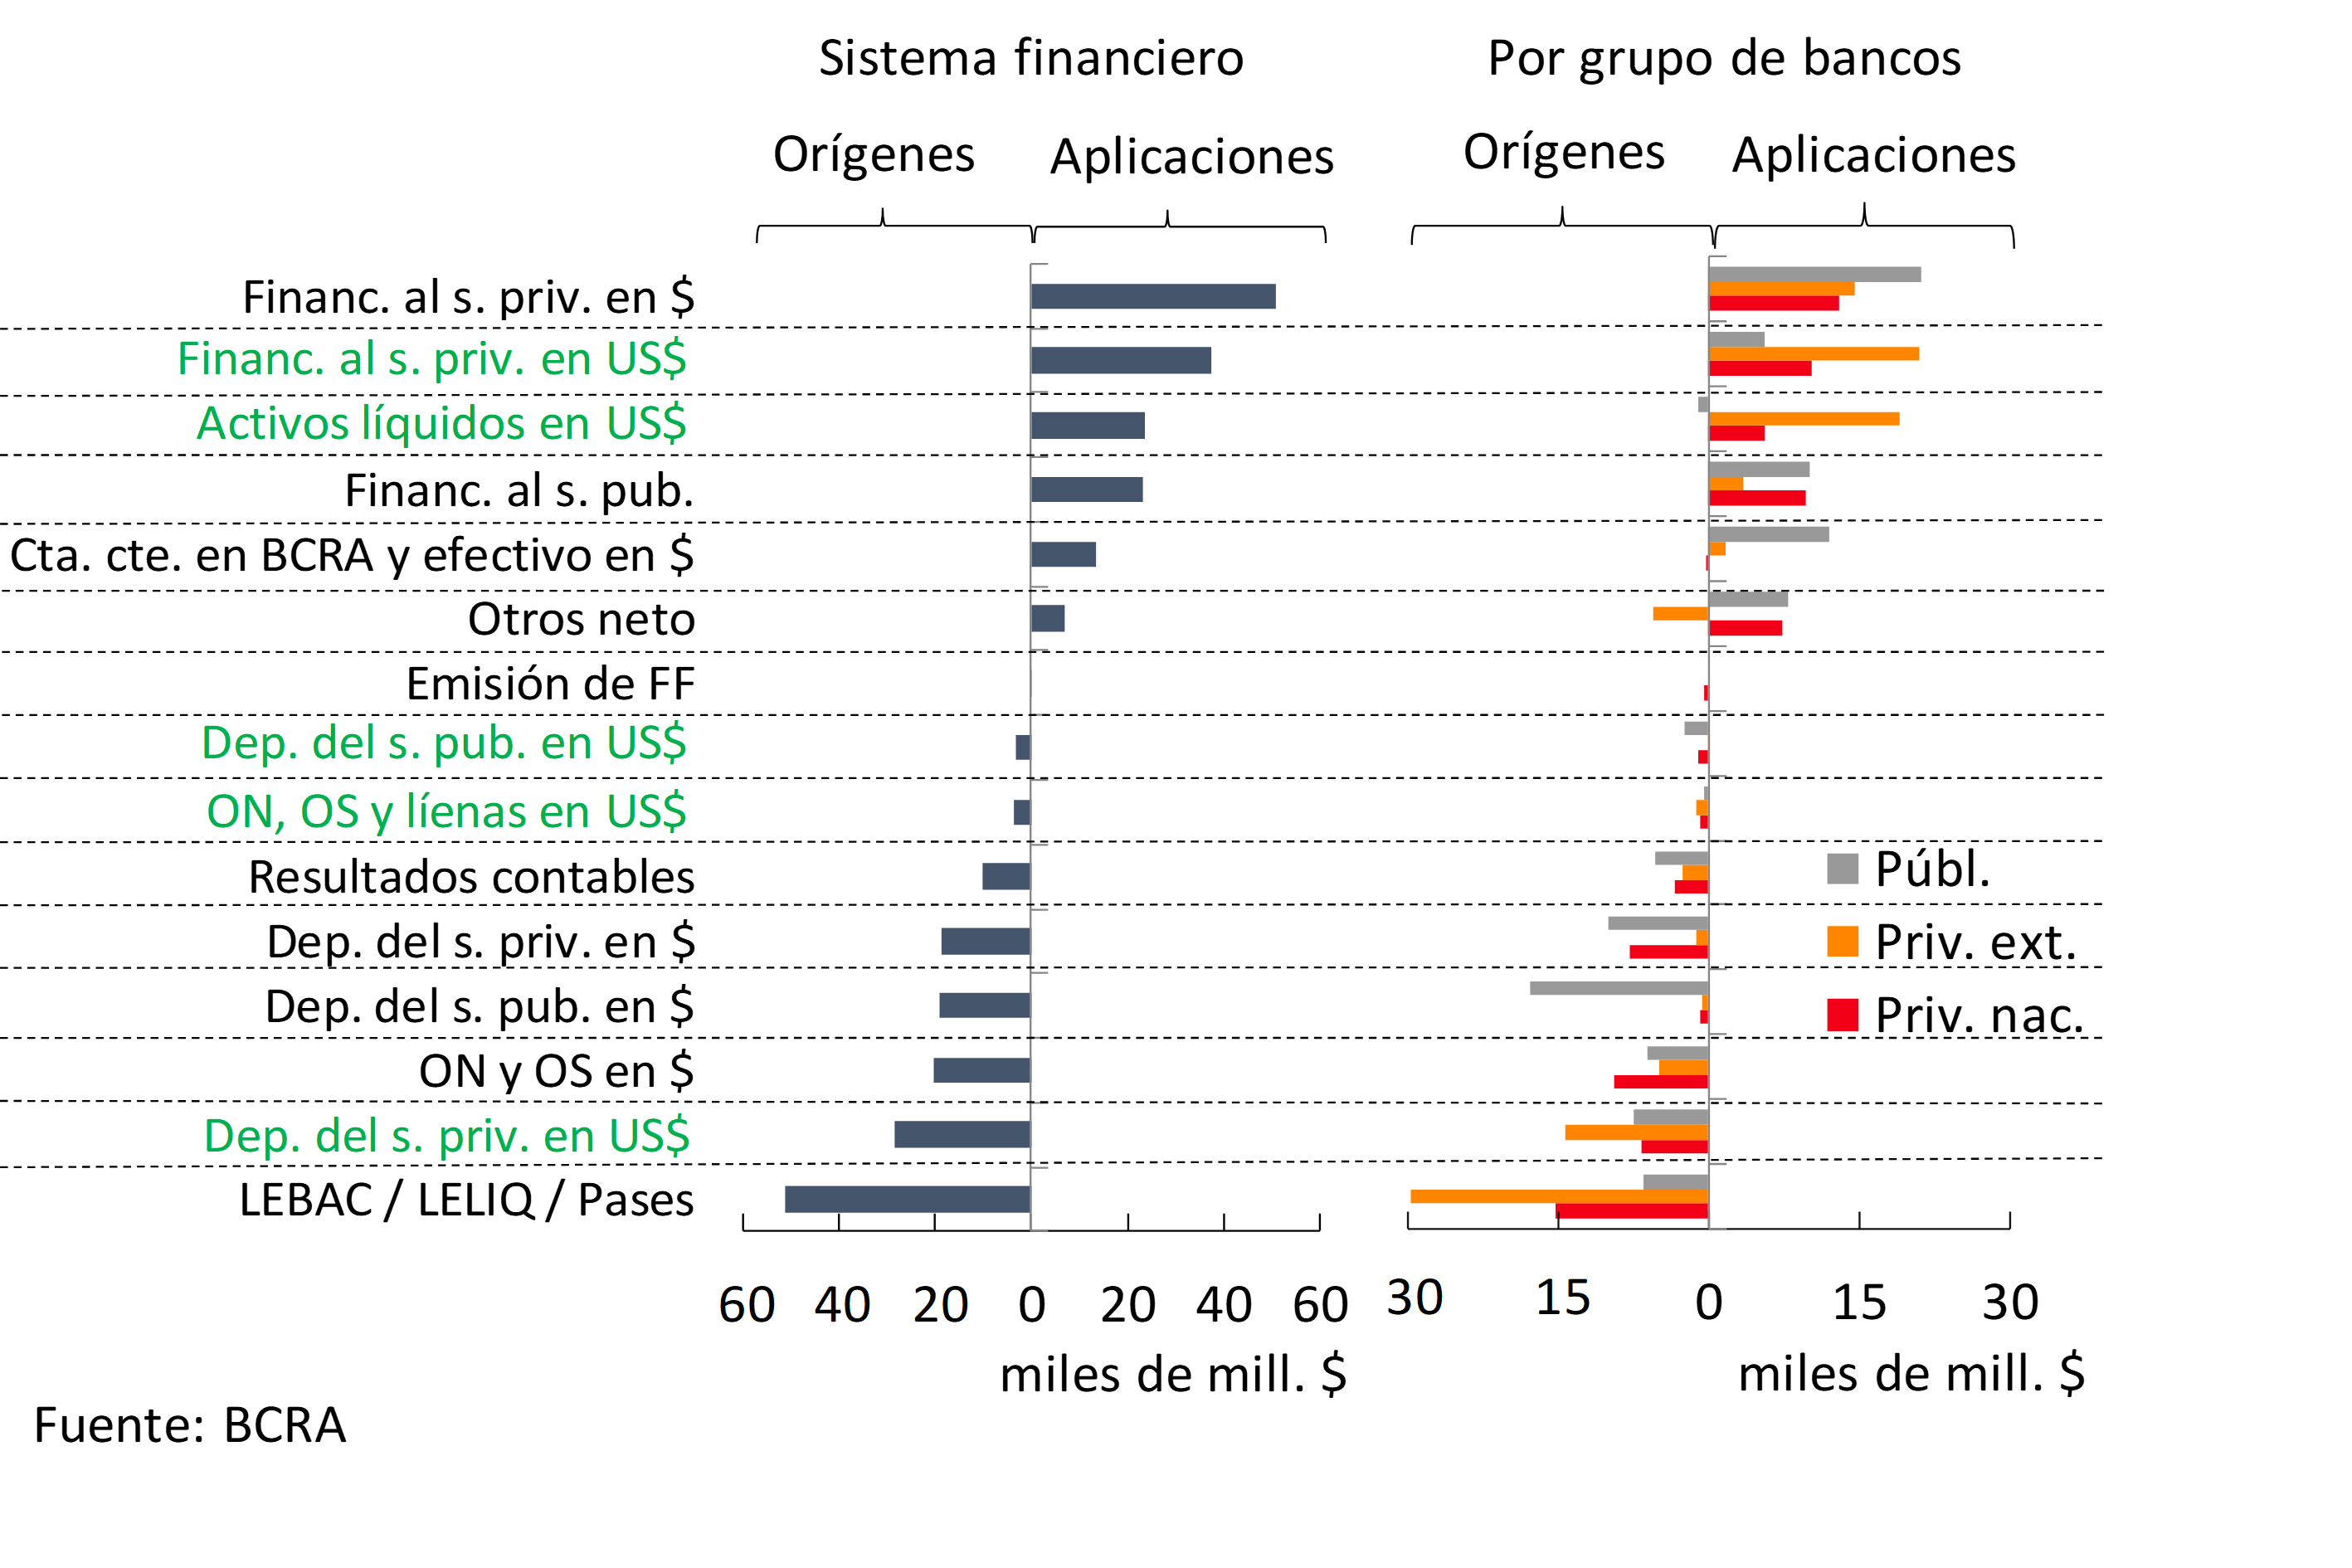
The increase in deposits in national currency of the public sector ($218,000 million) and credit to the private sector in the same currency ($151,000 million) were the most prominent origin and use of funds for banks in the first four months of 2018 (see Graph 3). Secondly, traditional financial intermediation in foreign currency with the private sector was highlighted.
Graph 3 | Estimated Cash Flow for the First Quarter – Sistema financiero

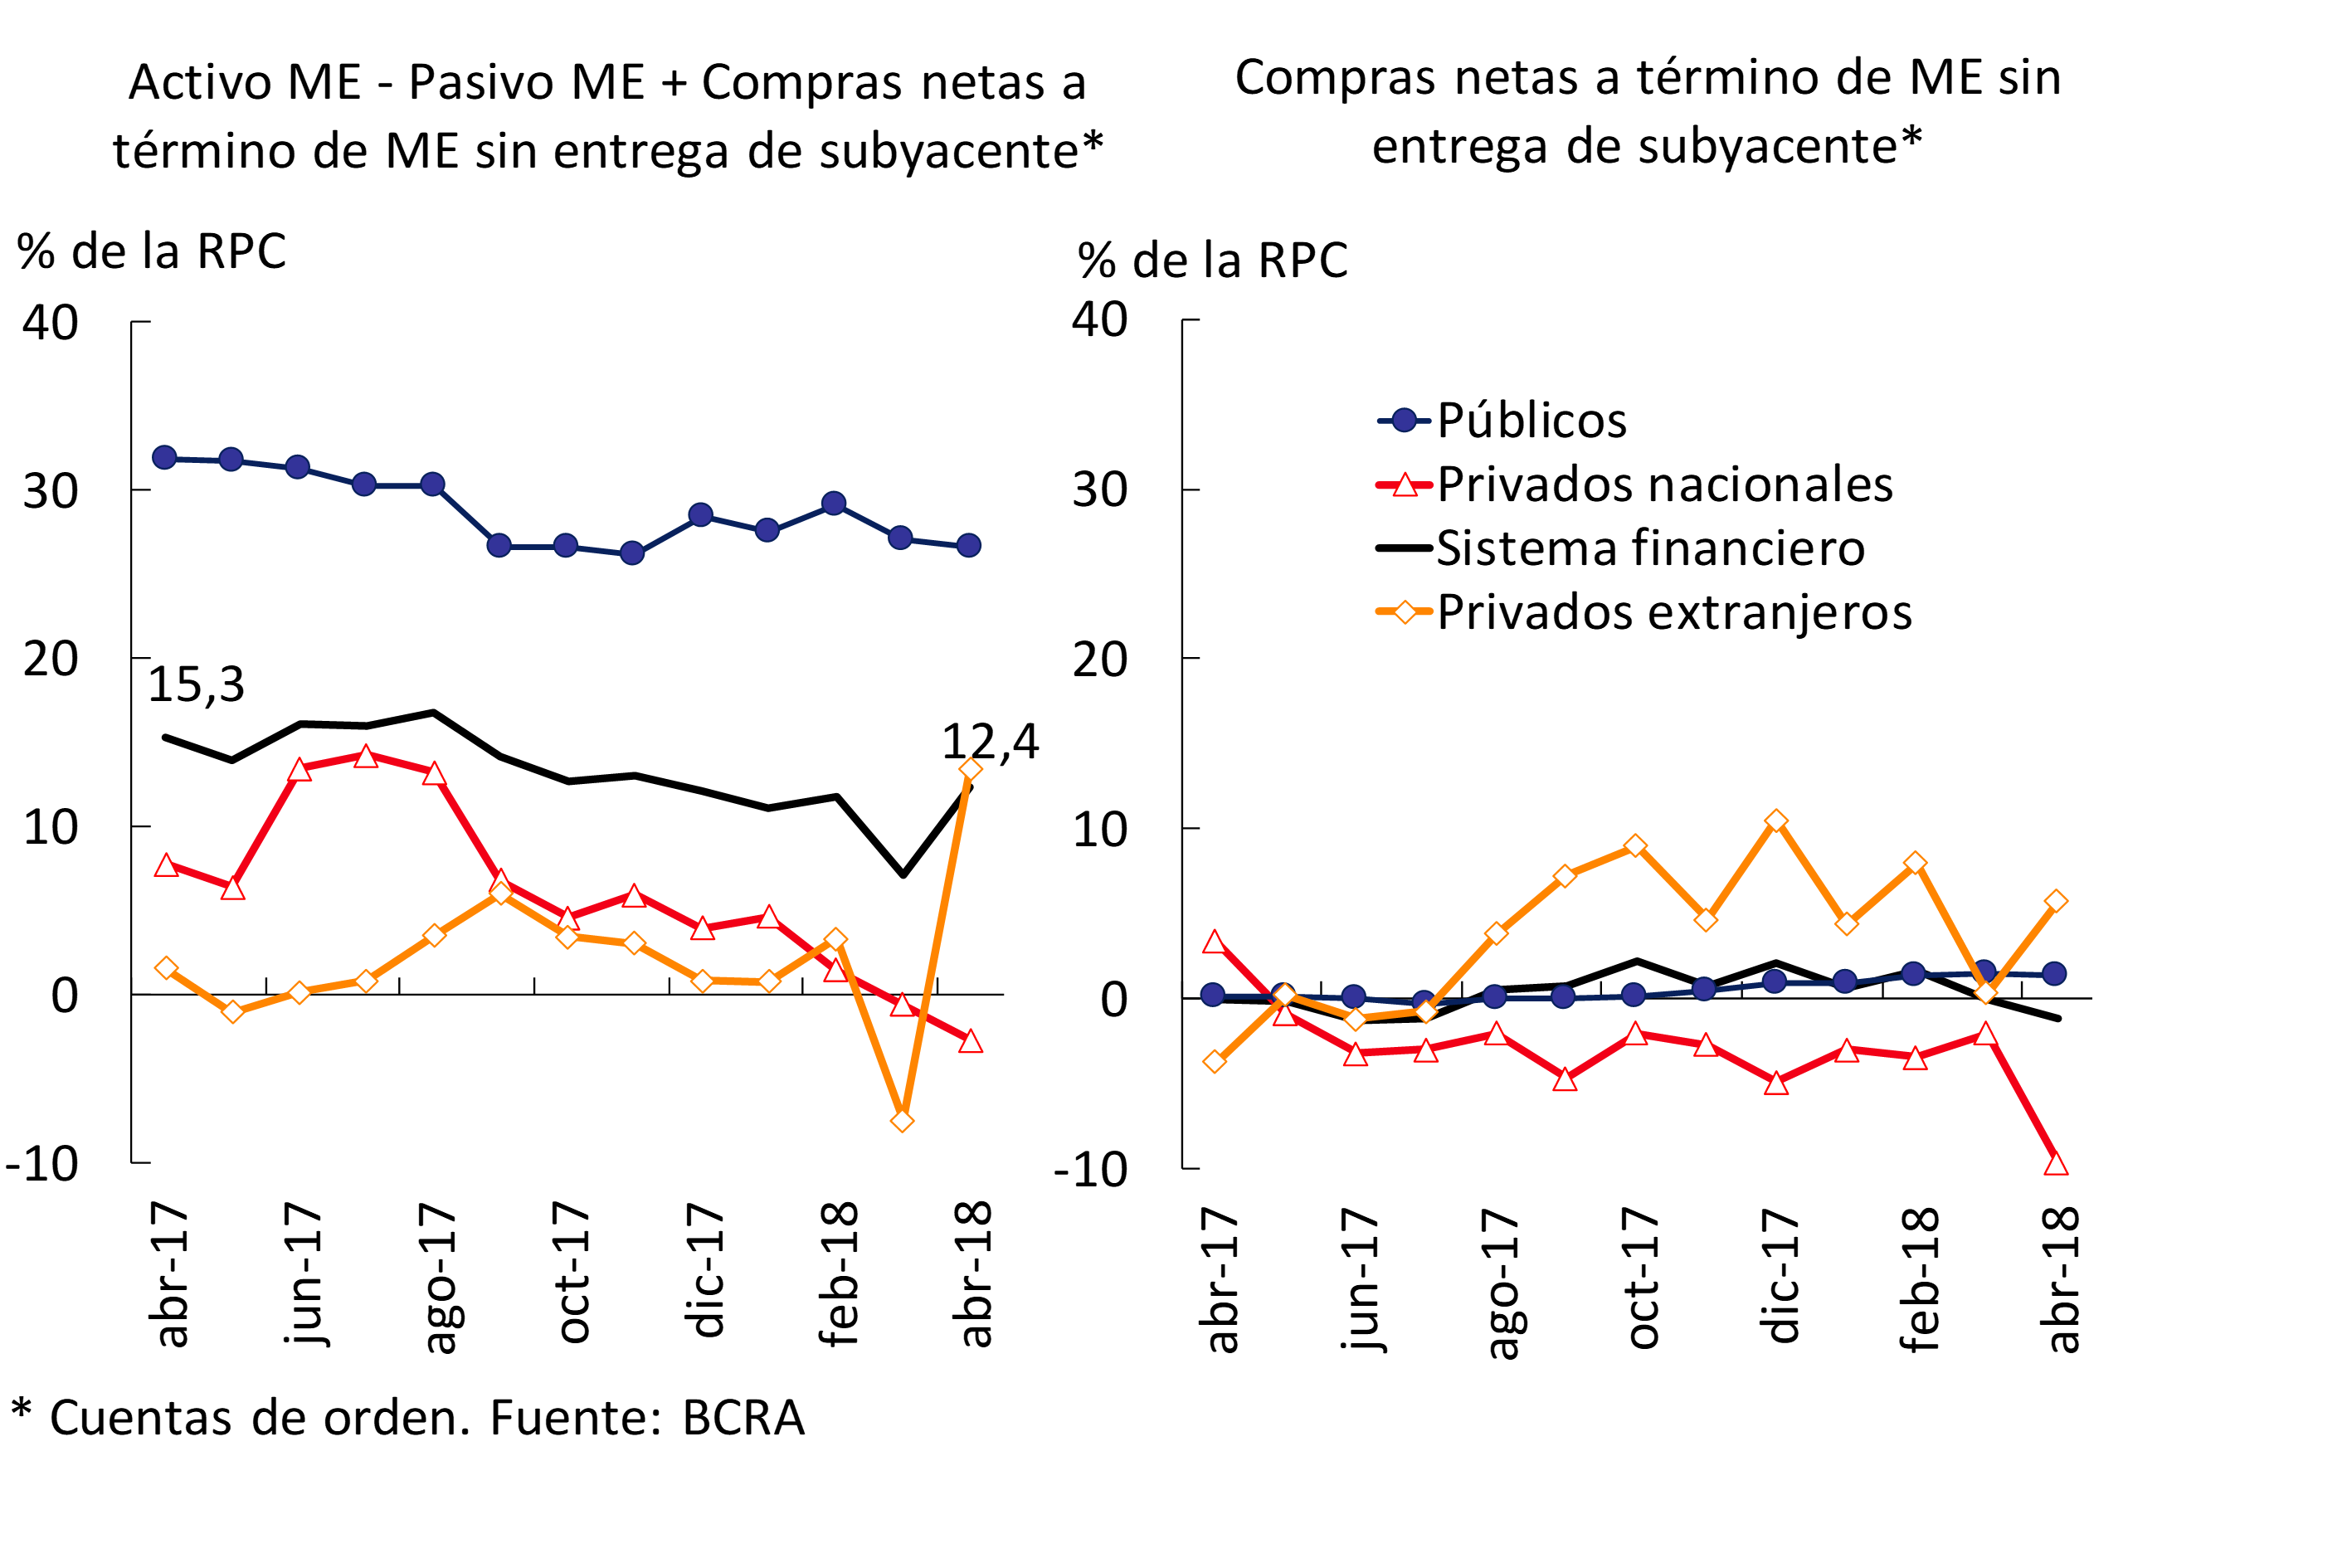
In terms of equity mismatches in the financial system, in April the spread between assets and liabilities that adjust for inflation and that which considers items in foreign currency increased. In the first case, the active mismatch of items adjusted by CER increased 2.7 p.p. of the Computable Patrimonial Liability (RPC) in the month to a total of 41.2%. Both the level and the growth of this difference are explained by the public banks. Meanwhile, the mismatch between assets and liabilities denominated in foreign currency was 5.3 p.p. in the PRC higher than in March, reaching 12.4% (see Chart 4). This performance was explained by foreign private banks, as the rest of the groups of financial institutions reduced their mismatch. It should be noted that the current foreign currency mismatch is well below the levels evidenced in recent years5.
Figure 4 | Foreign Currency Mismatch by Bank Group – As % of PRC
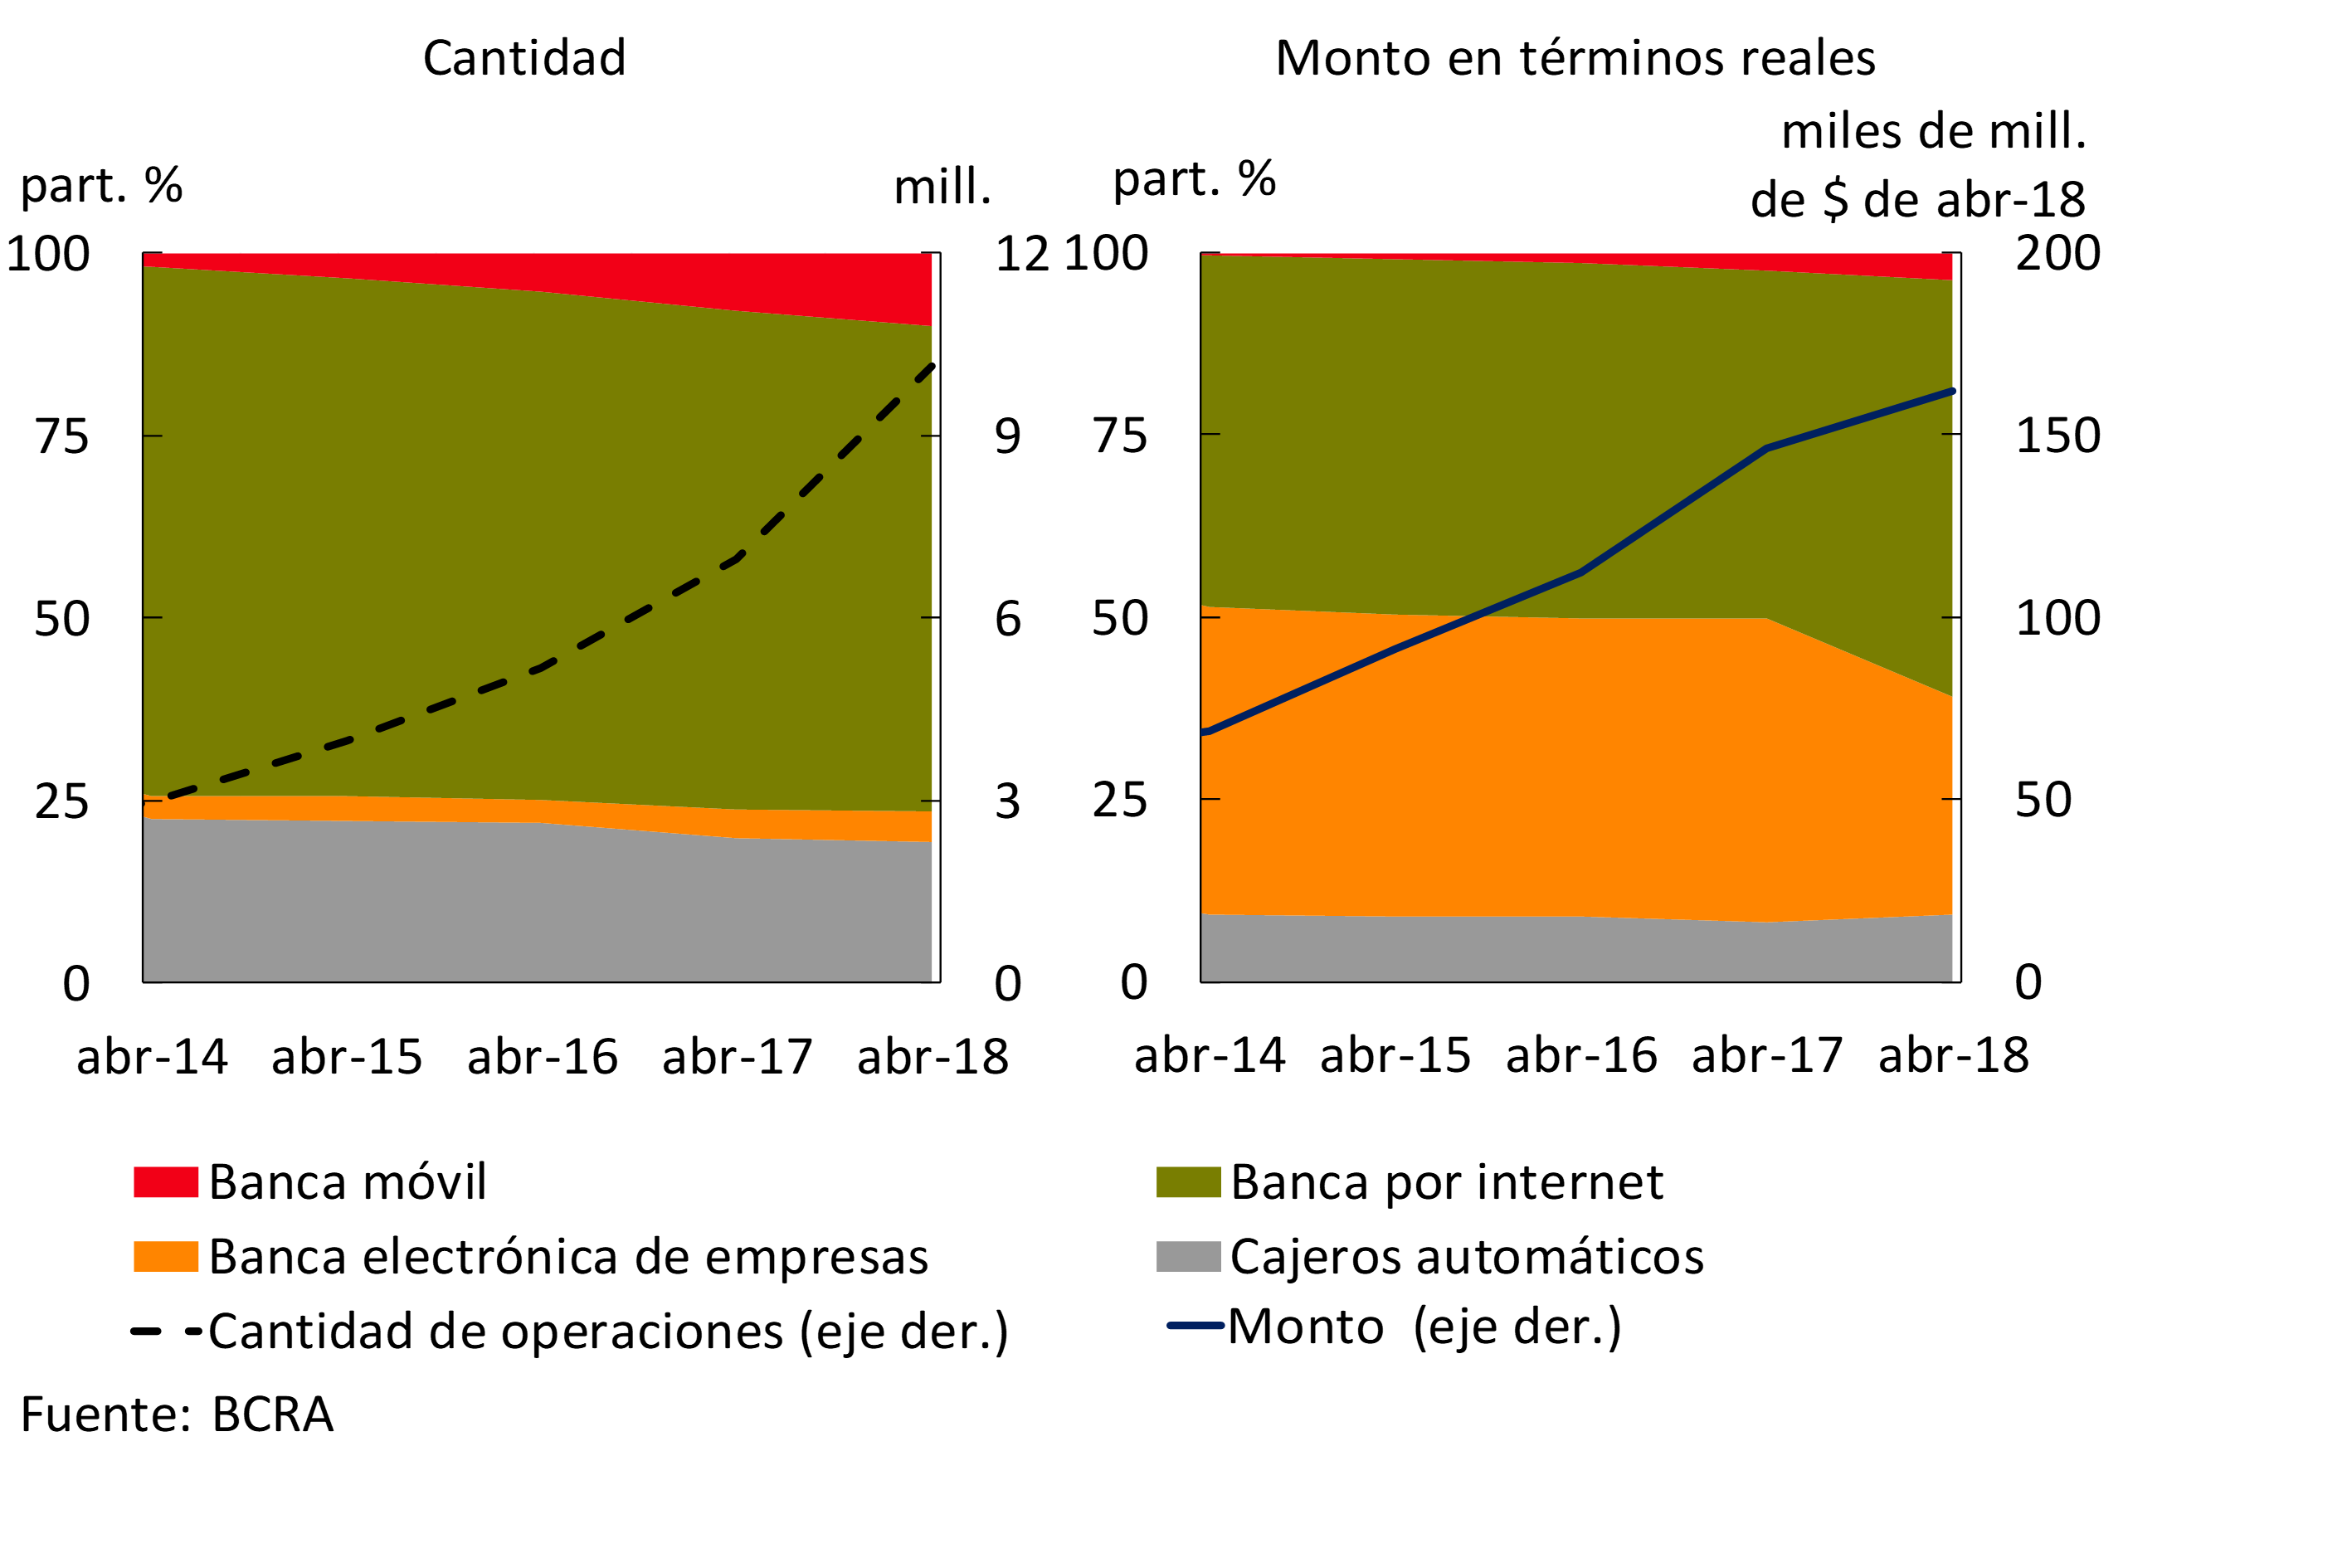
In April, transfers between third parties continued to increase, driven by those with instant credit. In the last twelve months, the traded value of immediate transfers grew 10.6% YoY in real terms and the amount processed 45.3% YoY. Among the various channels in which these transfers are made , it can be observed that the amount made via mobile banking gradually continues to gain share , while those corresponding to internet banking and ATMs fall, although they still only represent 10% of the total (see Graph 5). On the other hand, the amounts operated in this type of transfers are mostly made through internet banking and business banking.
Graph 5 | Immediate Channel Transfers of Funds
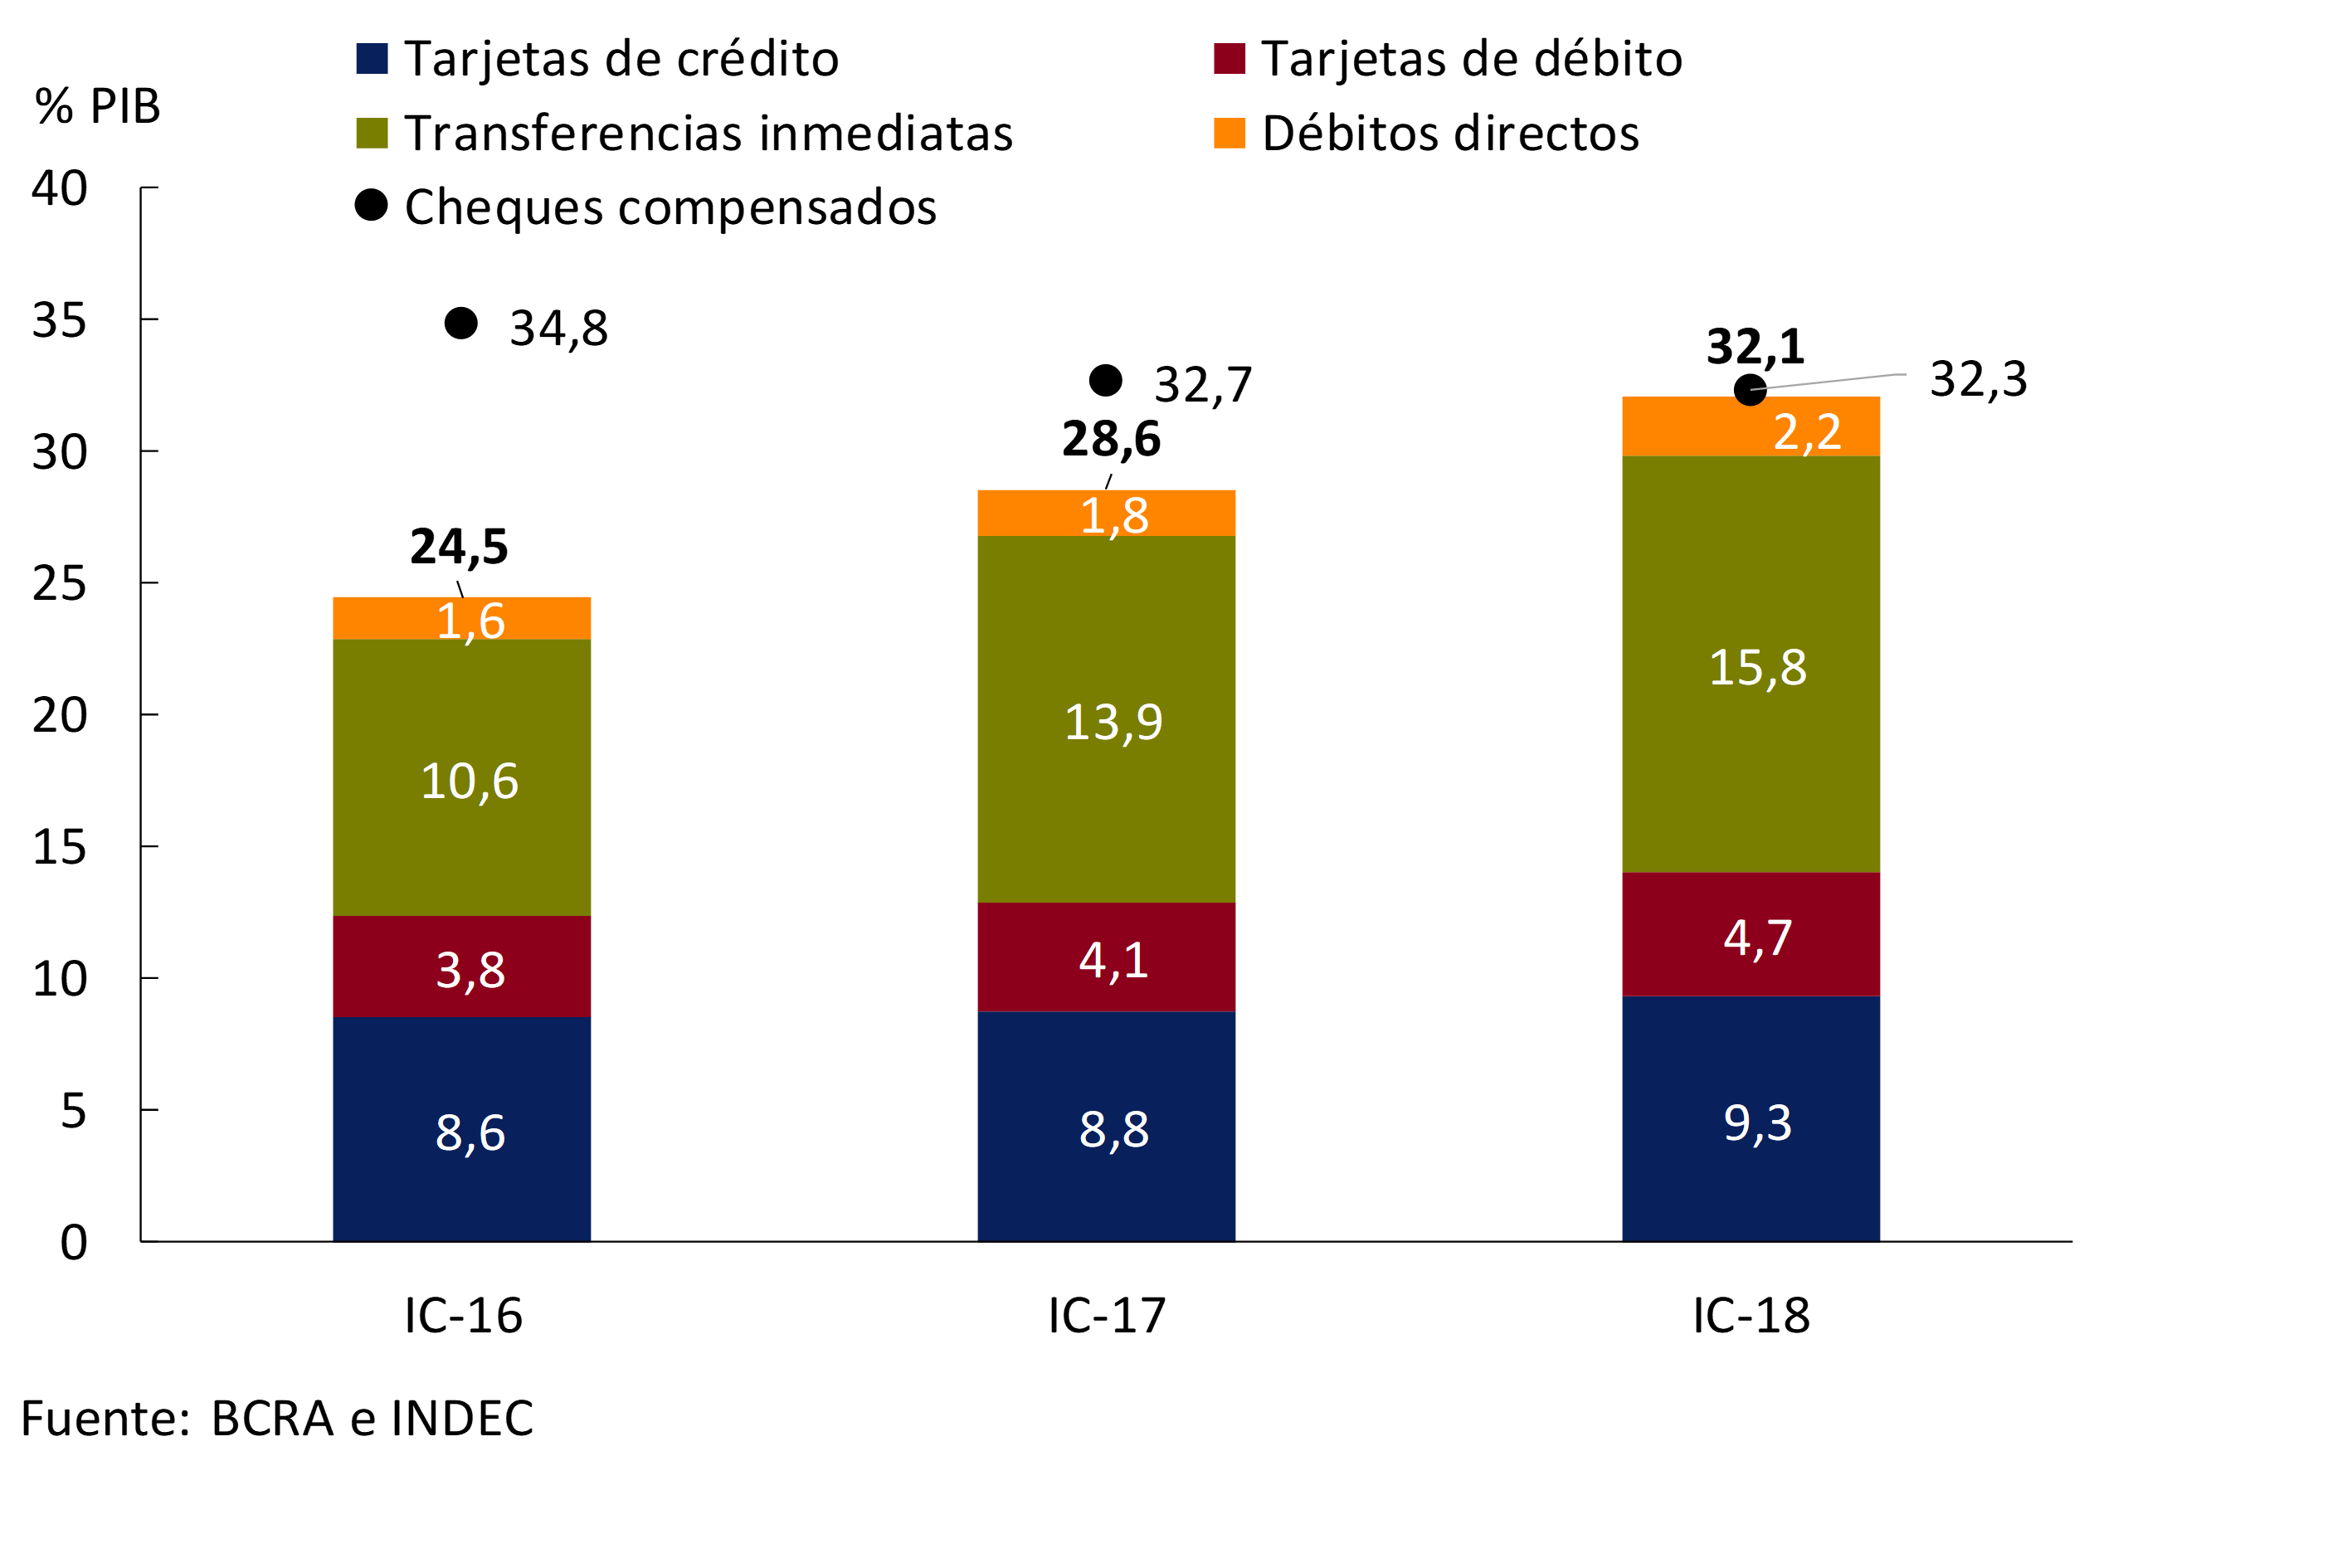
Although cleared checks grew slightly in April – both in securities traded and in amount issued – this payment instrument is gradually losing weight in the economy. In terms of GDP, in the last 2 years they reduced their participation by 2.5 p.p. to a total of 32.1%, with a sustained increase in electronic media (which verified an increase of 7.6 p.p. in GDP compared to the beginning of 2016) (see Graph 6). On the other hand, the rejection of checks due to lack of funds in relation to the total compensated increased in the month, showing levels higher than the average of recent years (1.4% for the number of checks and 1.1% for the values traded).
Graph 6 | Alternative Means of Payment to Cash – Annualized quarterly as a percentage of GDP
III. Deposits and liquidity
At the beginning of the second quarter of the year, total deposits in the financial system did not show any changes in magnitude in real terms, with an increase in public sector deposits (0.7% in real terms) compared to March, which was offset by a monthly decrease in private sector placements (-0.4% in real terms). In relation to this last segment, accounts in pesos – mainly those on demand – explained the monthly decrease, since placements in foreign currency grew in the period.
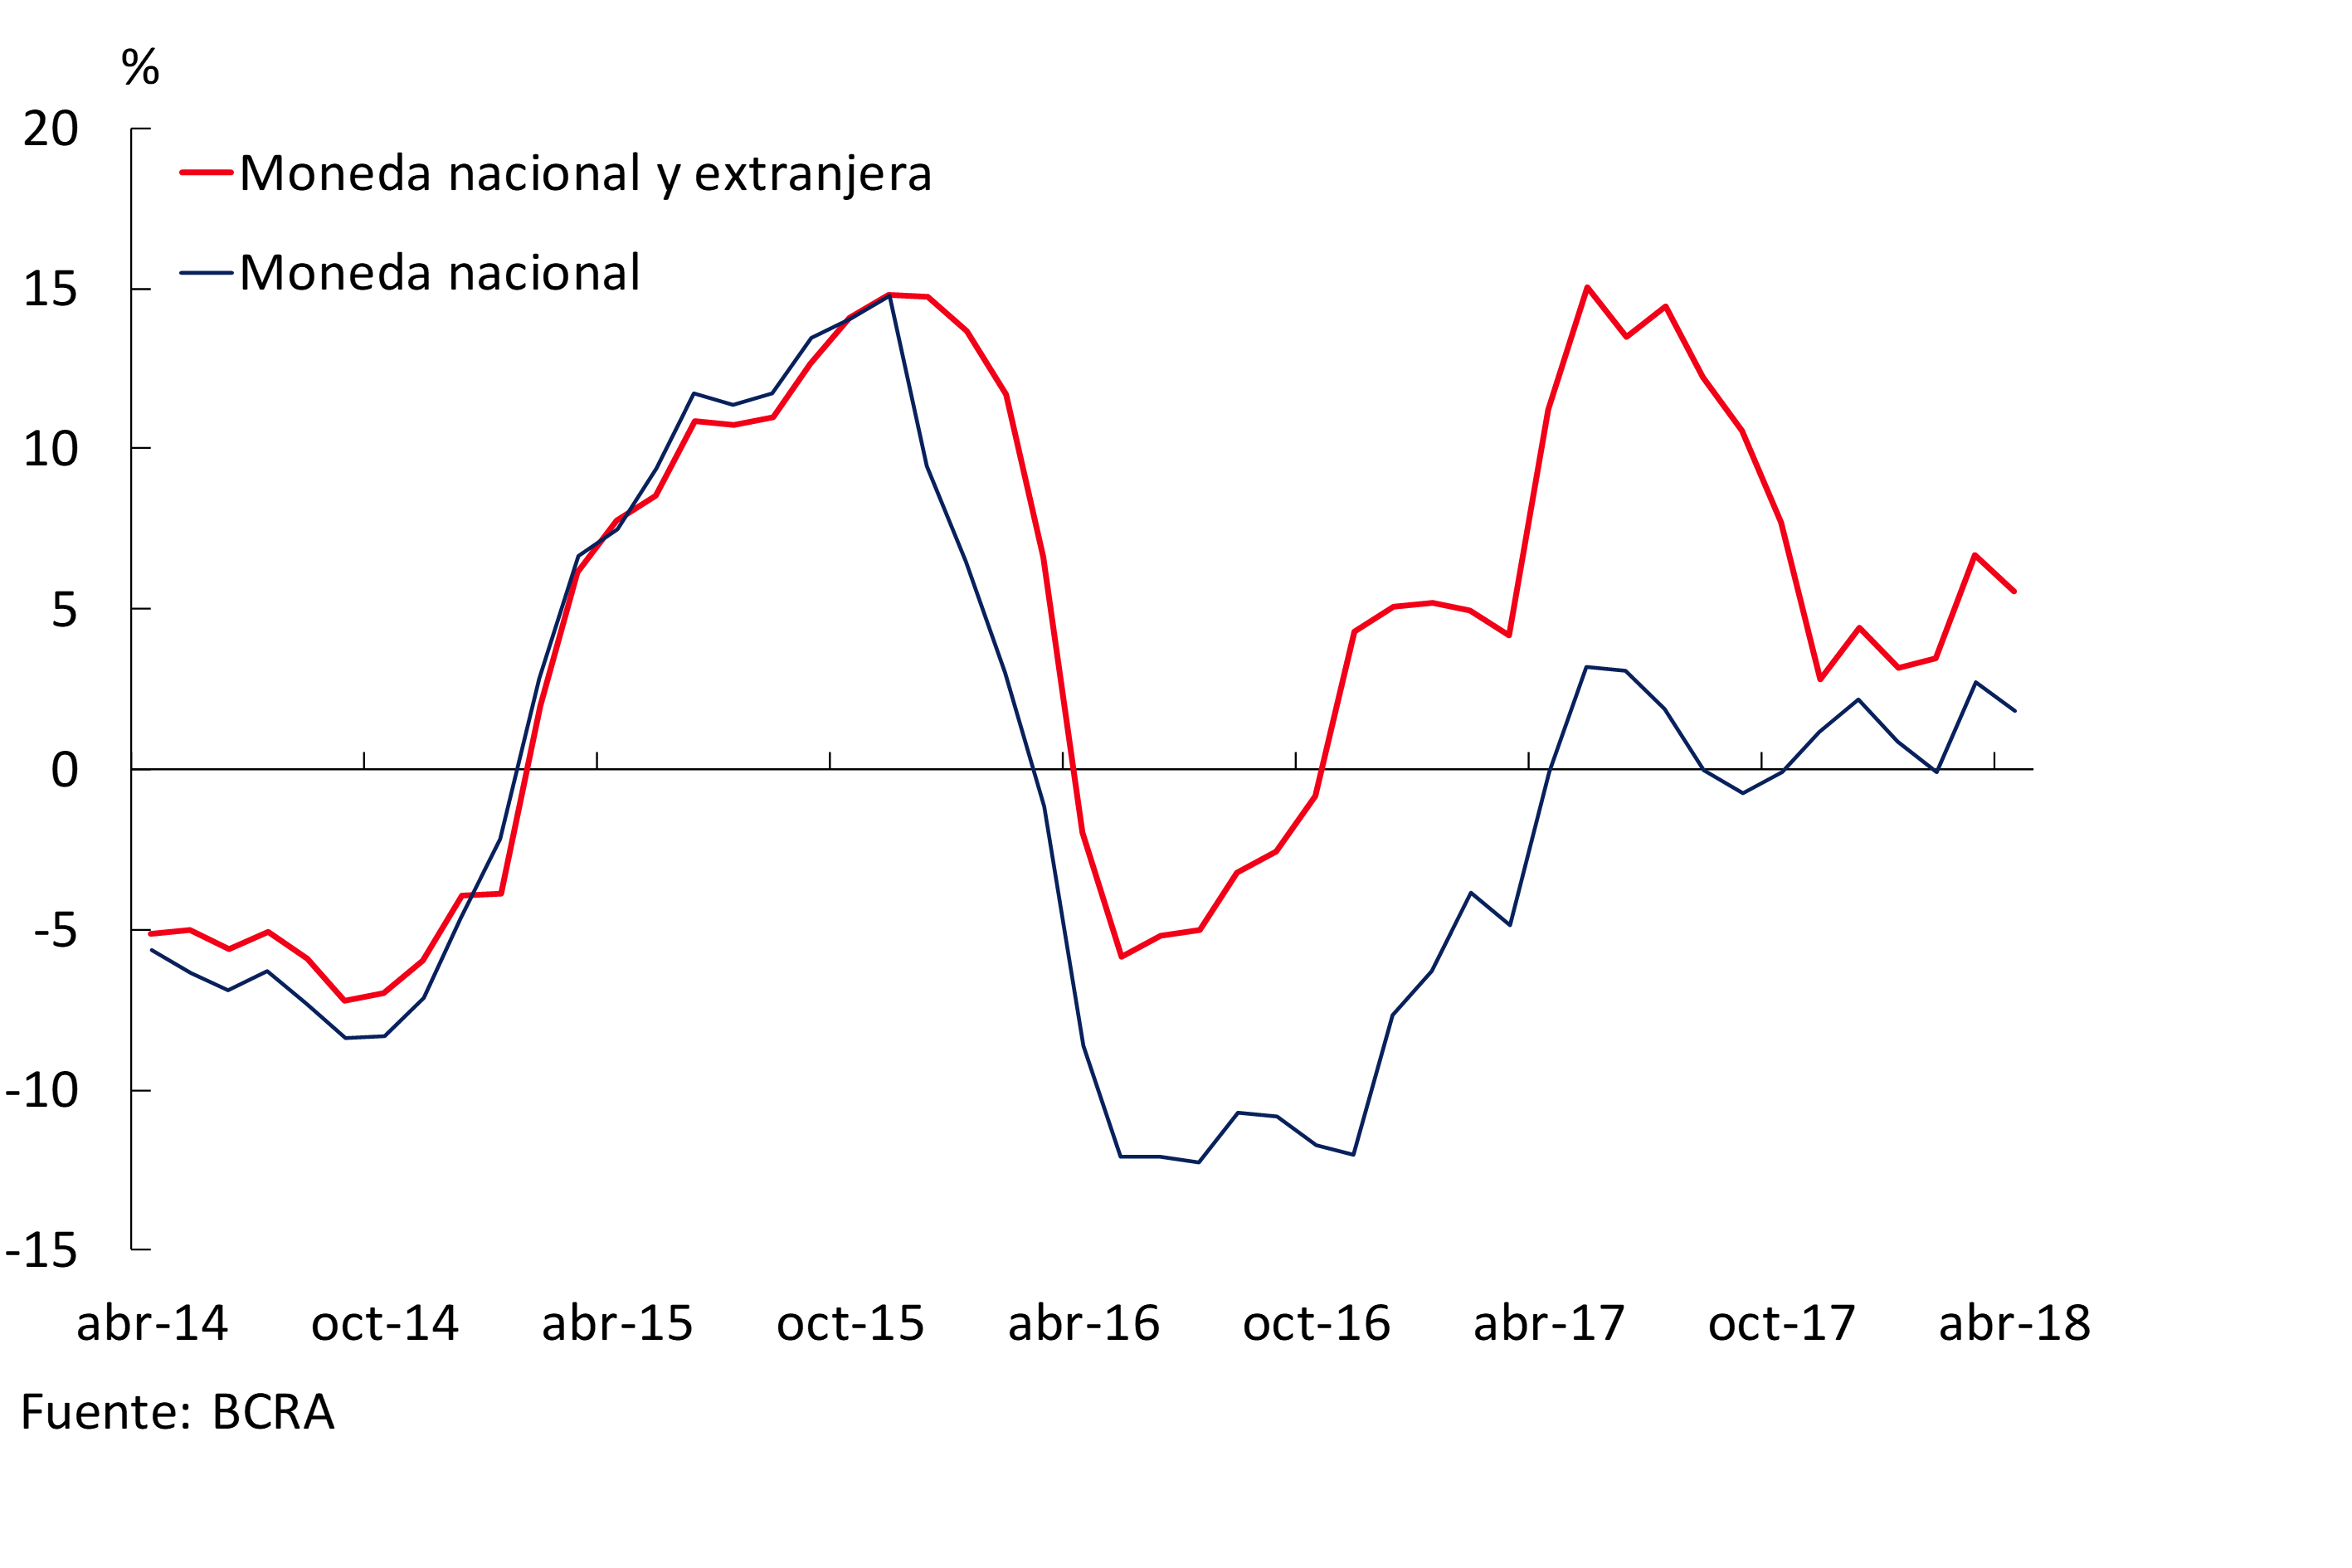
In year-on-year terms (y.a.), total deposits increased by 7.5% in real terms, driven by both the public sector (13.8% in real terms) and the private sector (5.5% in real terms). In the last twelve months, private sector placements in foreign currency increased by 9.7% – in foreign currency – and accounts in pesos grew by 1.8% in real terms (see Chart 7). The performance of private sector deposits was mainly led by public banks.
Figure 7 | Total Private Sector Deposits – Var. A.I. of the balance in real terms
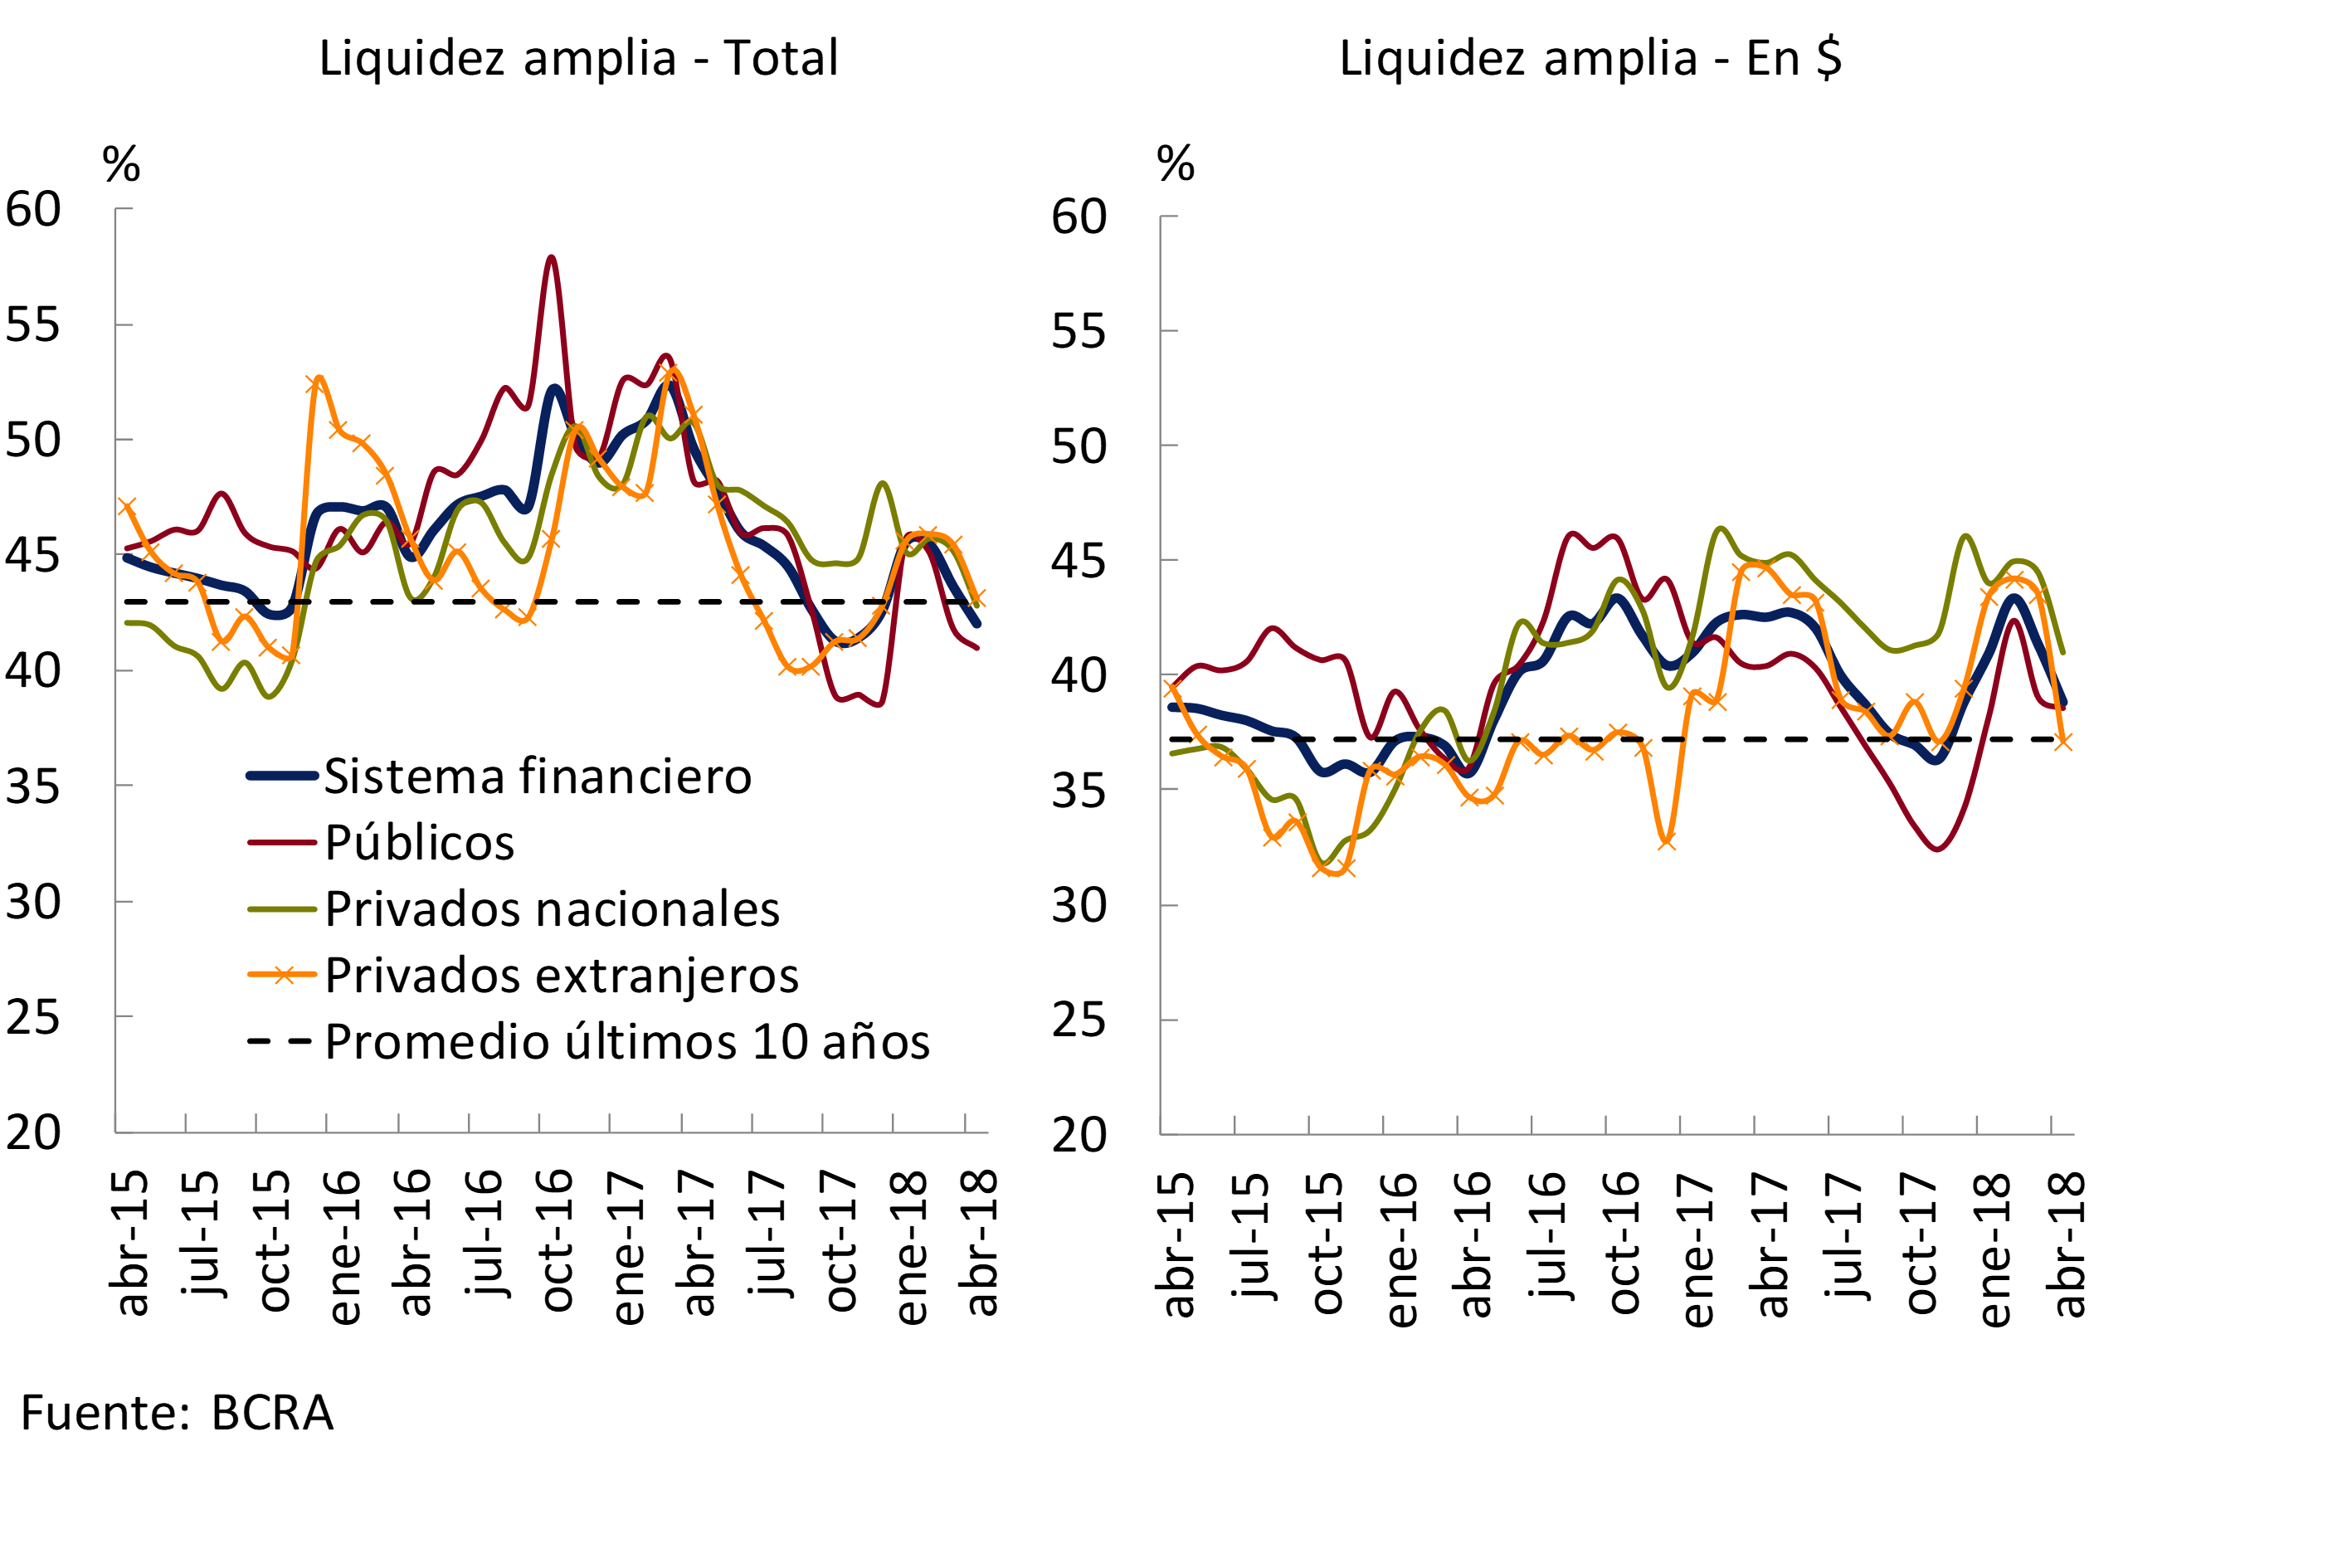
In April, bank liquidity indicators remained at elevated levels. Ample liquidity – considering items in domestic and foreign currency – fell 1.6 p.p. of deposits compared to March, totaling 42%. The monthly performance was explained by the lower holdings of BCRA instruments and was driven by private banks. On the other hand, the liquidity indicator that considers only the availabilities and the balance of the current accounts that banks have in the BCRA increased monthly by 0.7 p.p. of total deposits to around 24.5%. Compared to the same period last year, bank liquidity fell by 7.6 p.p. of deposits for the broad indicator and 5.5 p.p. for the strict indicator, although it is in line with the average of the last 10 years (see Graph 8).
Figure 8 | Ample Liquidity of the Financial System
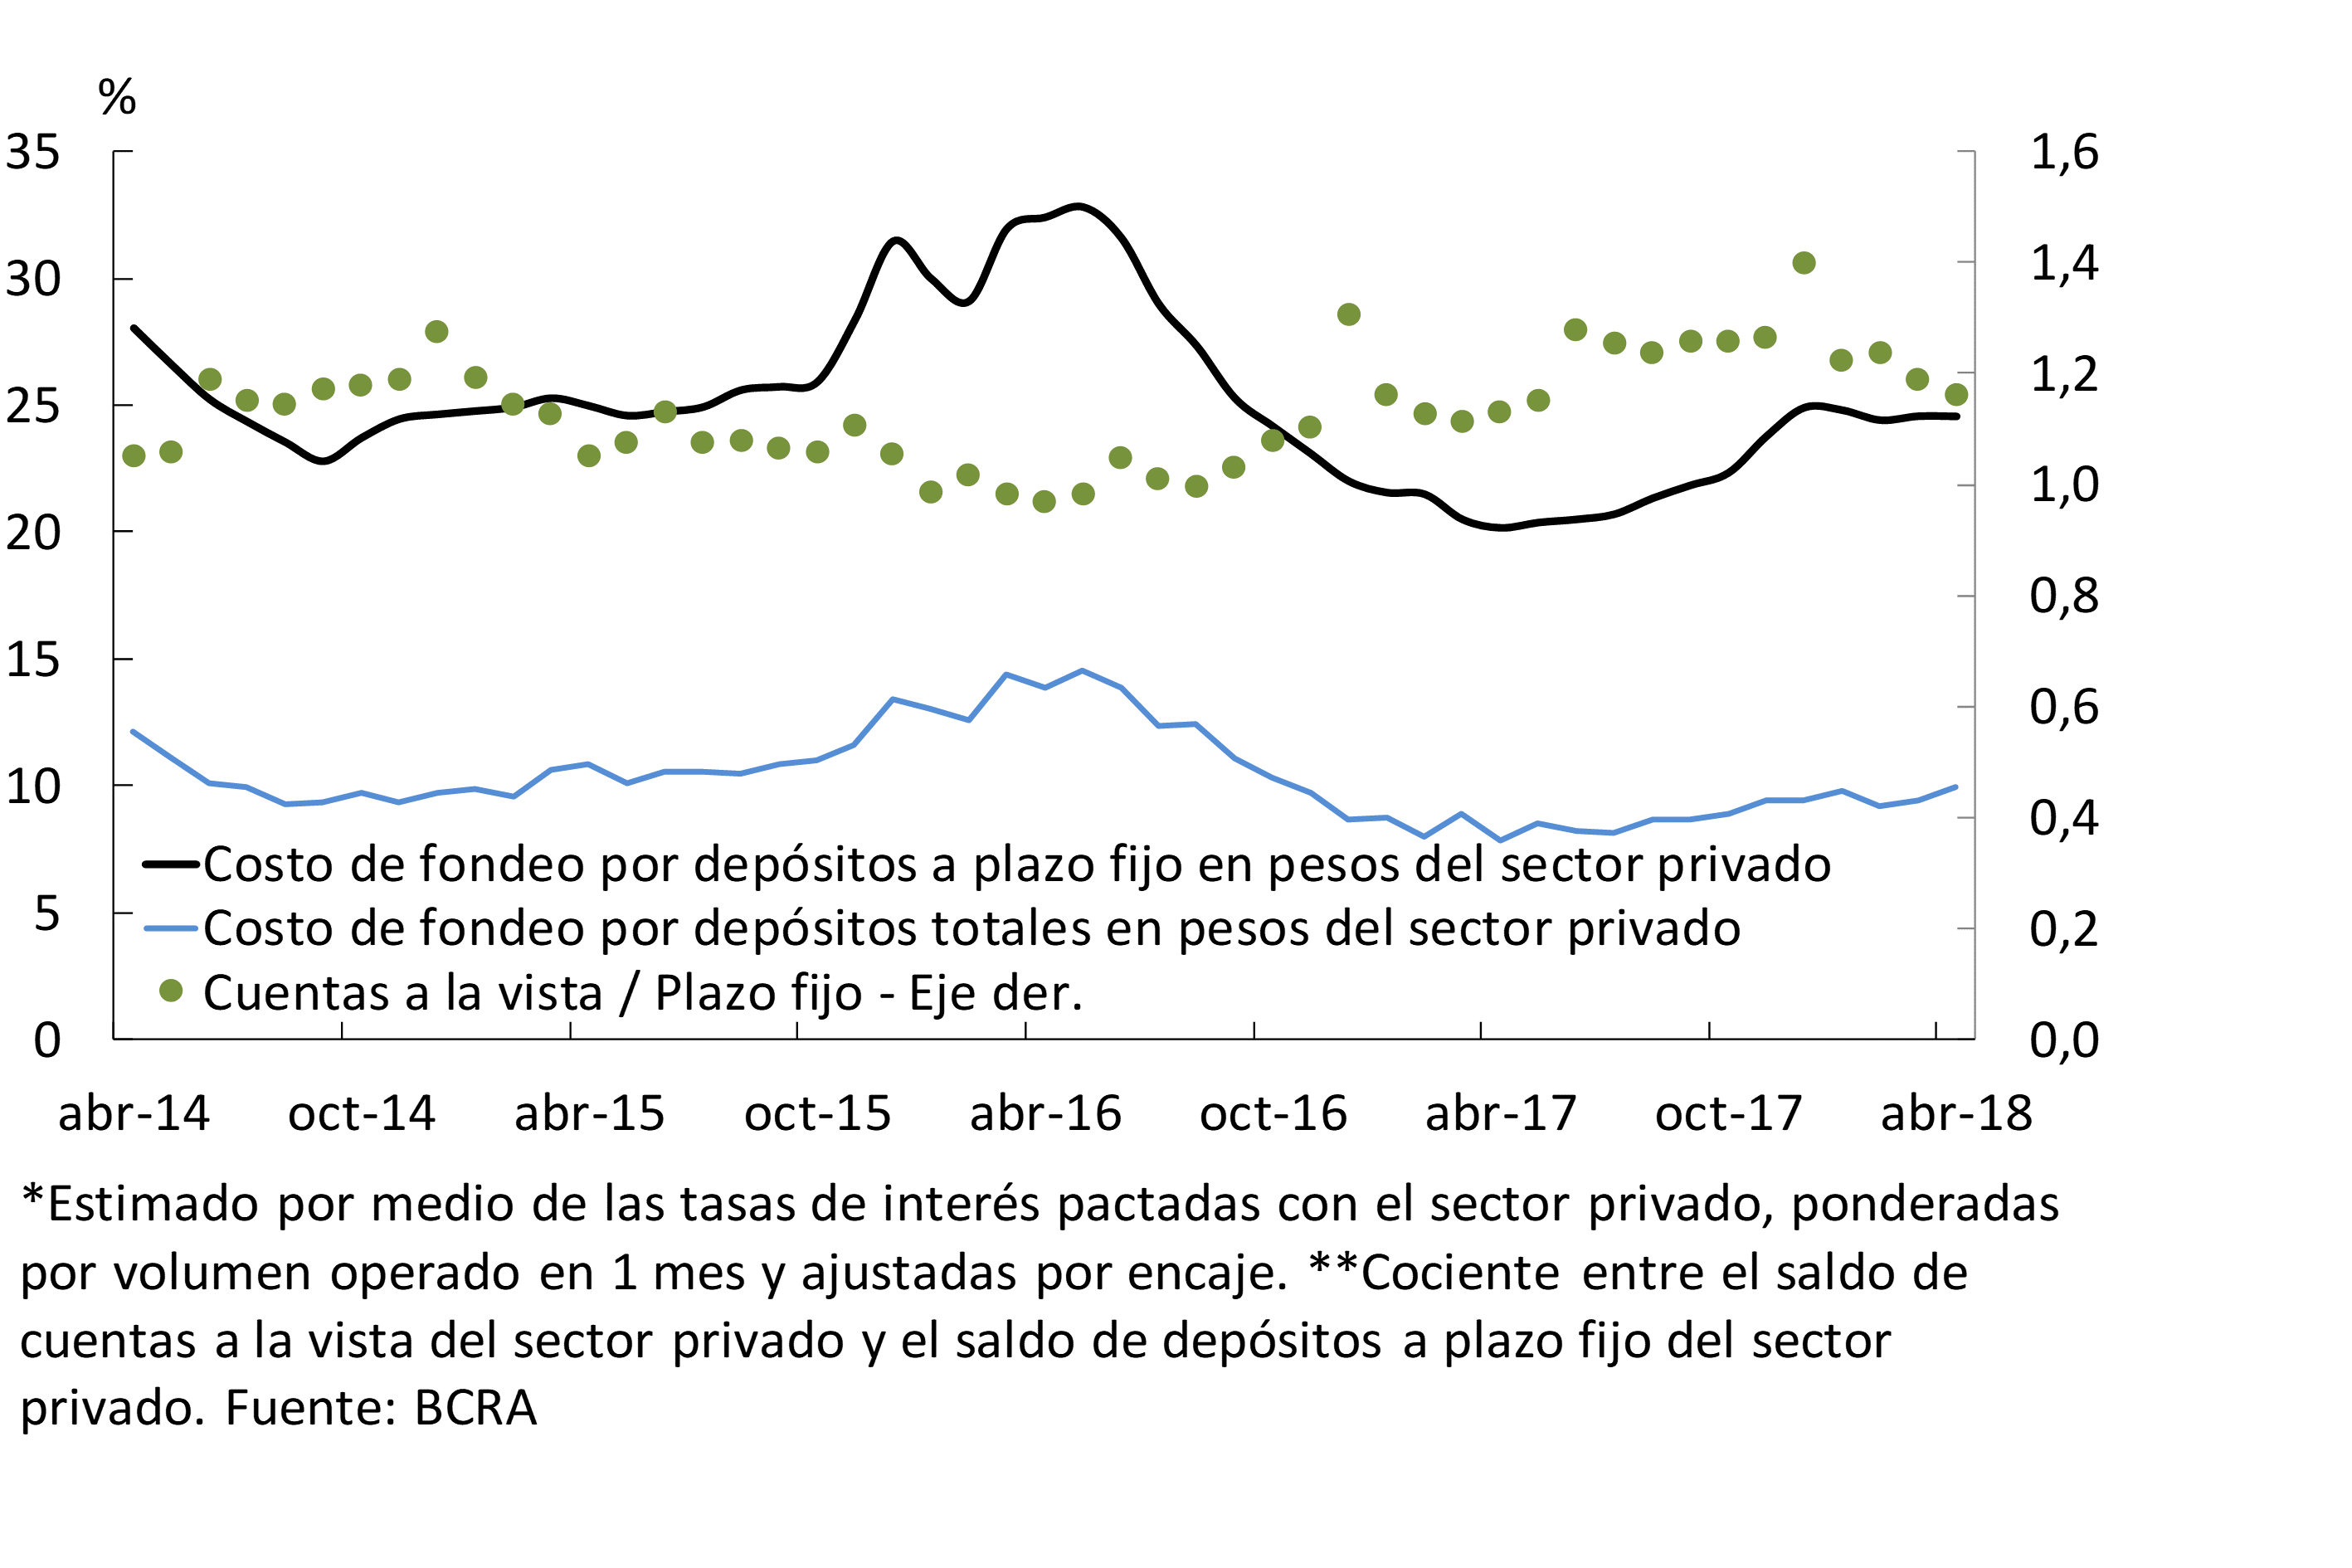
The funding cost for fixed-term deposits in national currency of the private sector remained unchanged in the month (see Chart 9). In this context, as the ratio between demand and time deposits in the private sector fell slightly in April, the total funding cost operated – by demand and time deposits in the private sector – increased slightly compared to March.
Figure 9 | Estimated Funding Cost for Private Sector Deposits in Pesos* and Ratio between Demand and Time Deposits**
IV. Financing
In April, the balance sheet of total financing to the private sector grew 2.1% when adjusted for inflation. The monthly dynamism of credit was greater in foreign private banks, in a context in which all groups of entities presented increases in loans. Financing lines in foreign currency increased 8.5%6 in the month, mainly due to export pre-financing. Meanwhile, loans in national currency increased 0.7% in real terms compared to March, with a greater relative increase in advances and mortgages.
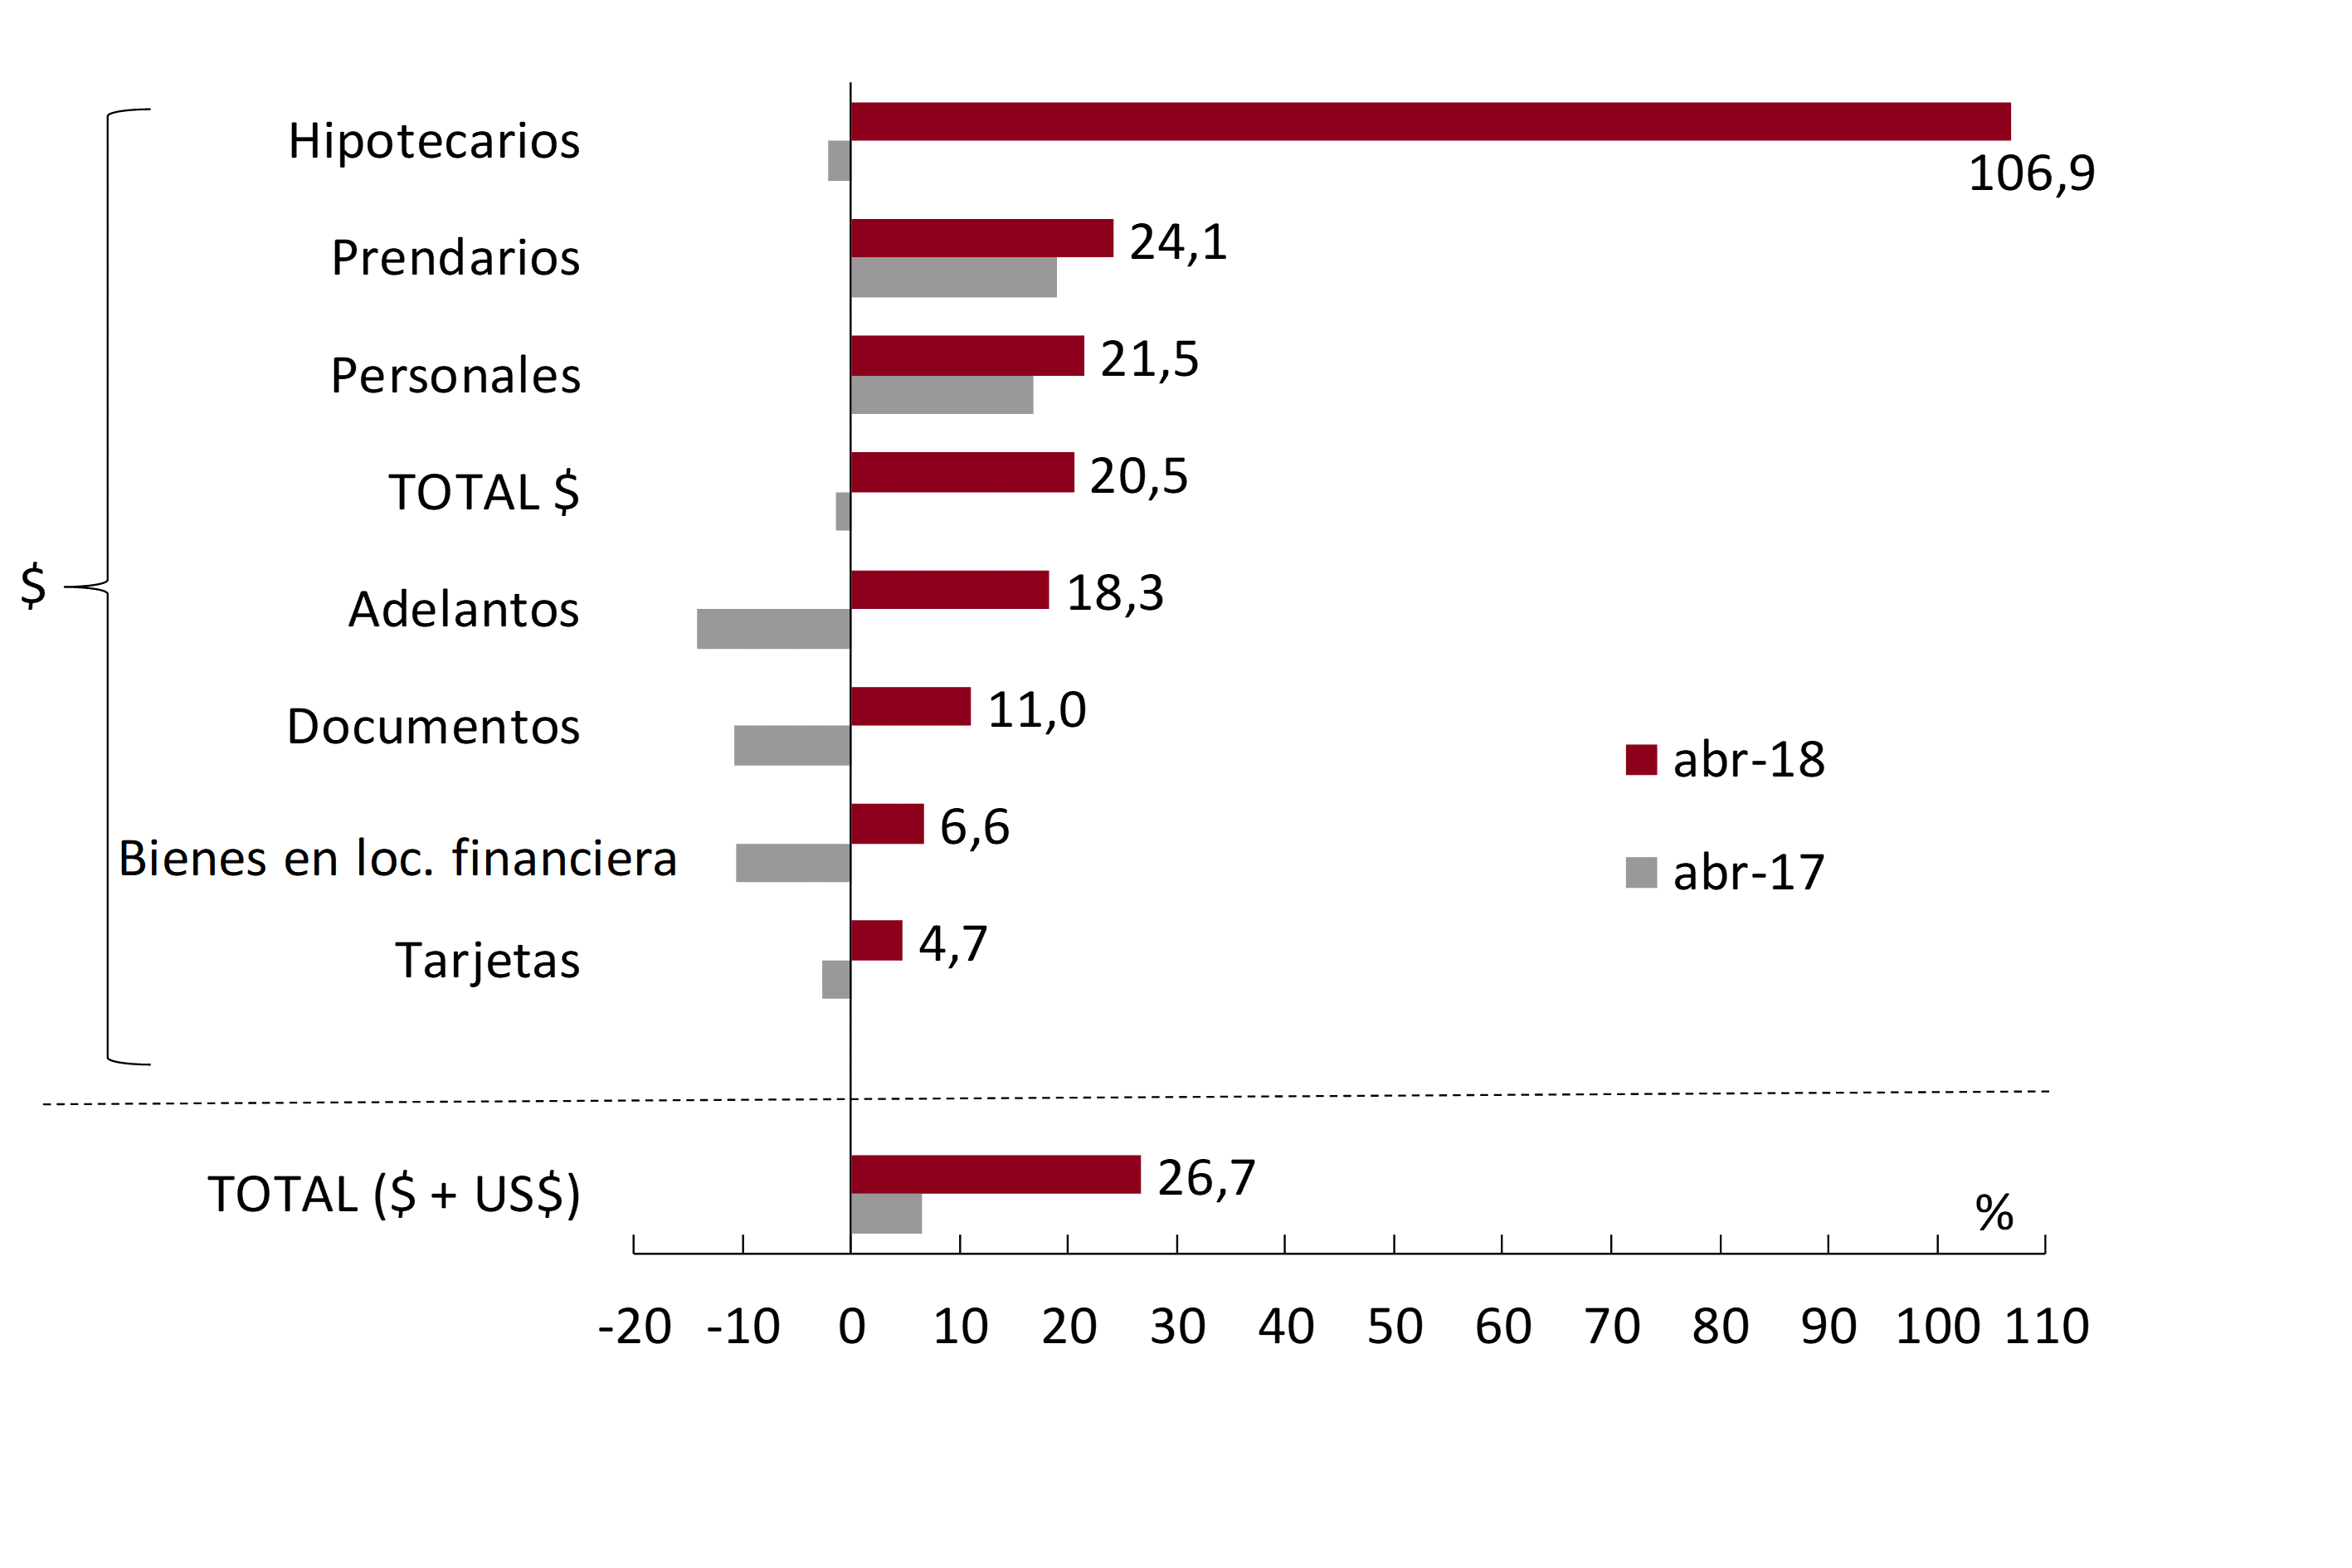
Considering the last twelve months, the total credit balance to the private sector in real terms increased 26.7% (see Chart 10). Financing in foreign currency accumulated an increase of 51% y.a.7 and loans in pesos grew 20.5% in real terms, with a greater dynamism in mortgages (see Graph 11).
Figure 10 | Total Credit Balance to the Private Sector in Real Terms
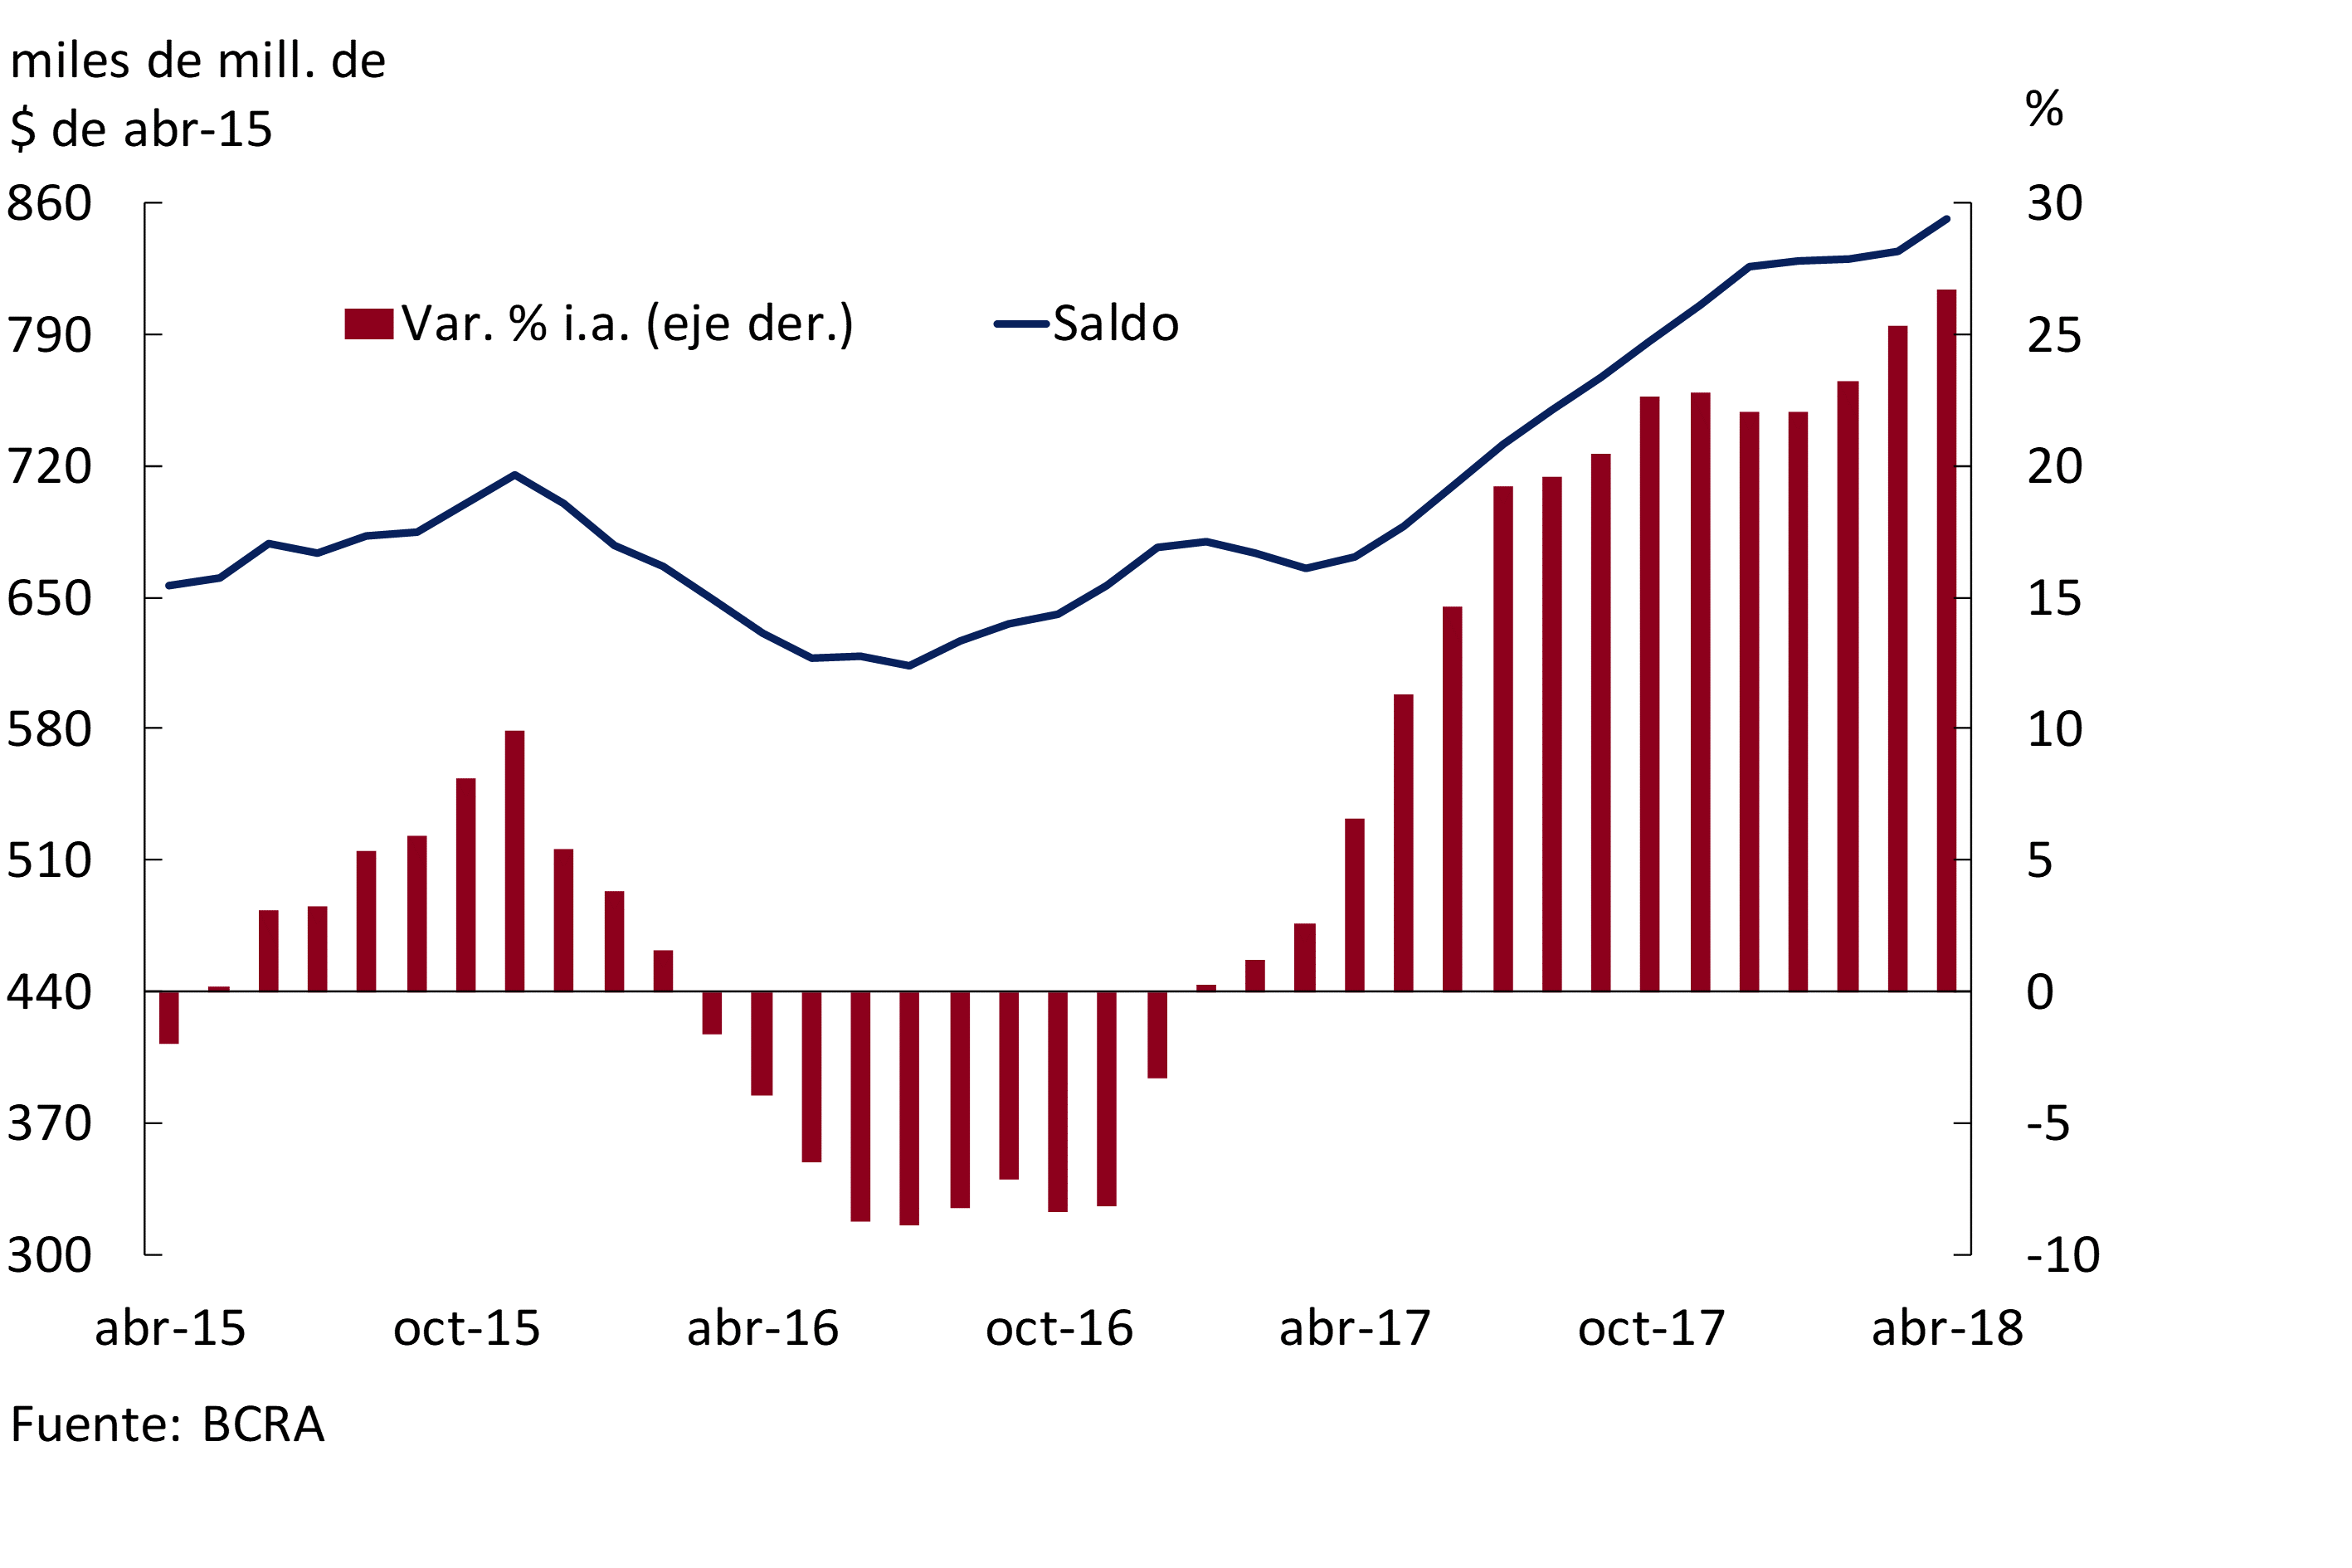
Figure 11 | Total Credit Balance to the Private Sector in Real Terms – Real Year-on-Year % Change
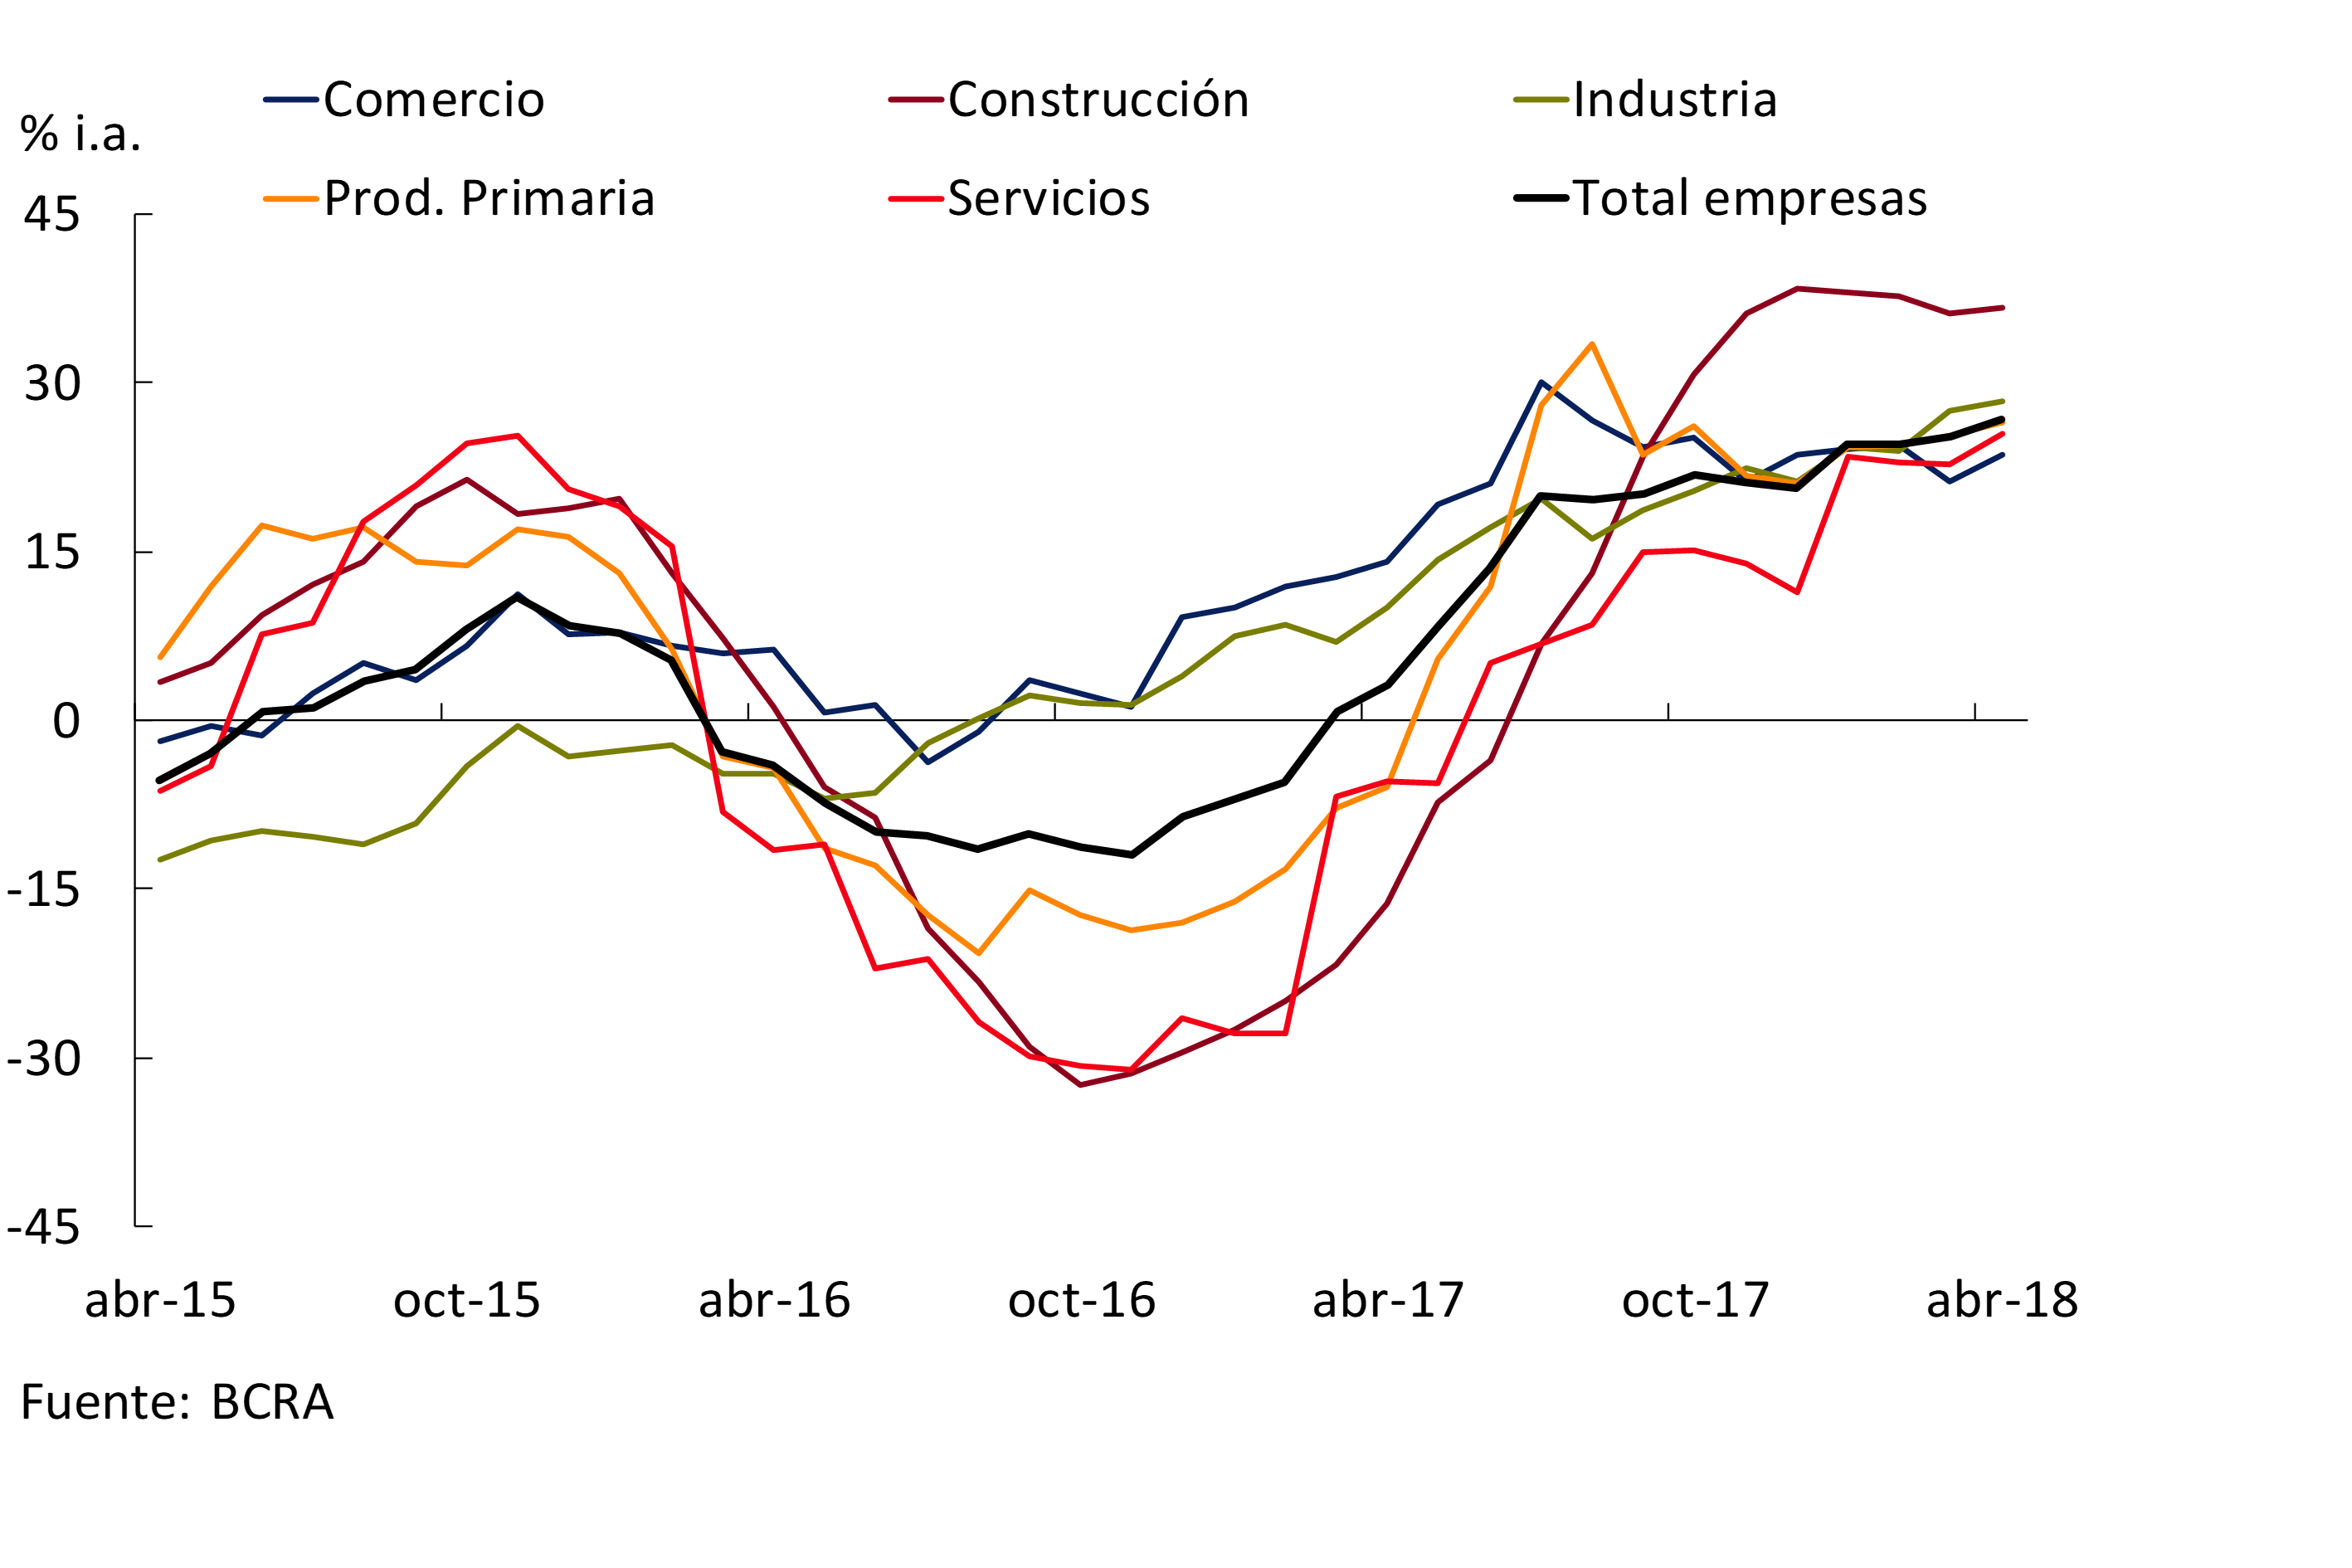
In the month, financing to companies8 grew 1.3% adjusted for inflation, a performance mainly explained by foreign private banks. In April, loans to industry, commerce and construction increased in real terms, while loans to primary production and service providers registered slight falls. In a year-on-year comparison, the balance of credit to companies increased 26.8% in real terms (see Graph 12), highlighting the dynamism of loans to construction.
Figure 12 | Total Credit Balance to Companies – Real Year-on-Year % Change
In April, the balance of credit to families9 increased 0.9% in real terms compared to March. The monthly growth was explained by public banks, while the rest of the financial institutions showed slight falls in real credit balances to this segment. In year-on-year terms, loans to households accumulated a growth of 28.7% when adjusted for inflation (see Chart 13).
Figure 13 | Total Credit Balance to Households – Real Year-on-Year % Change

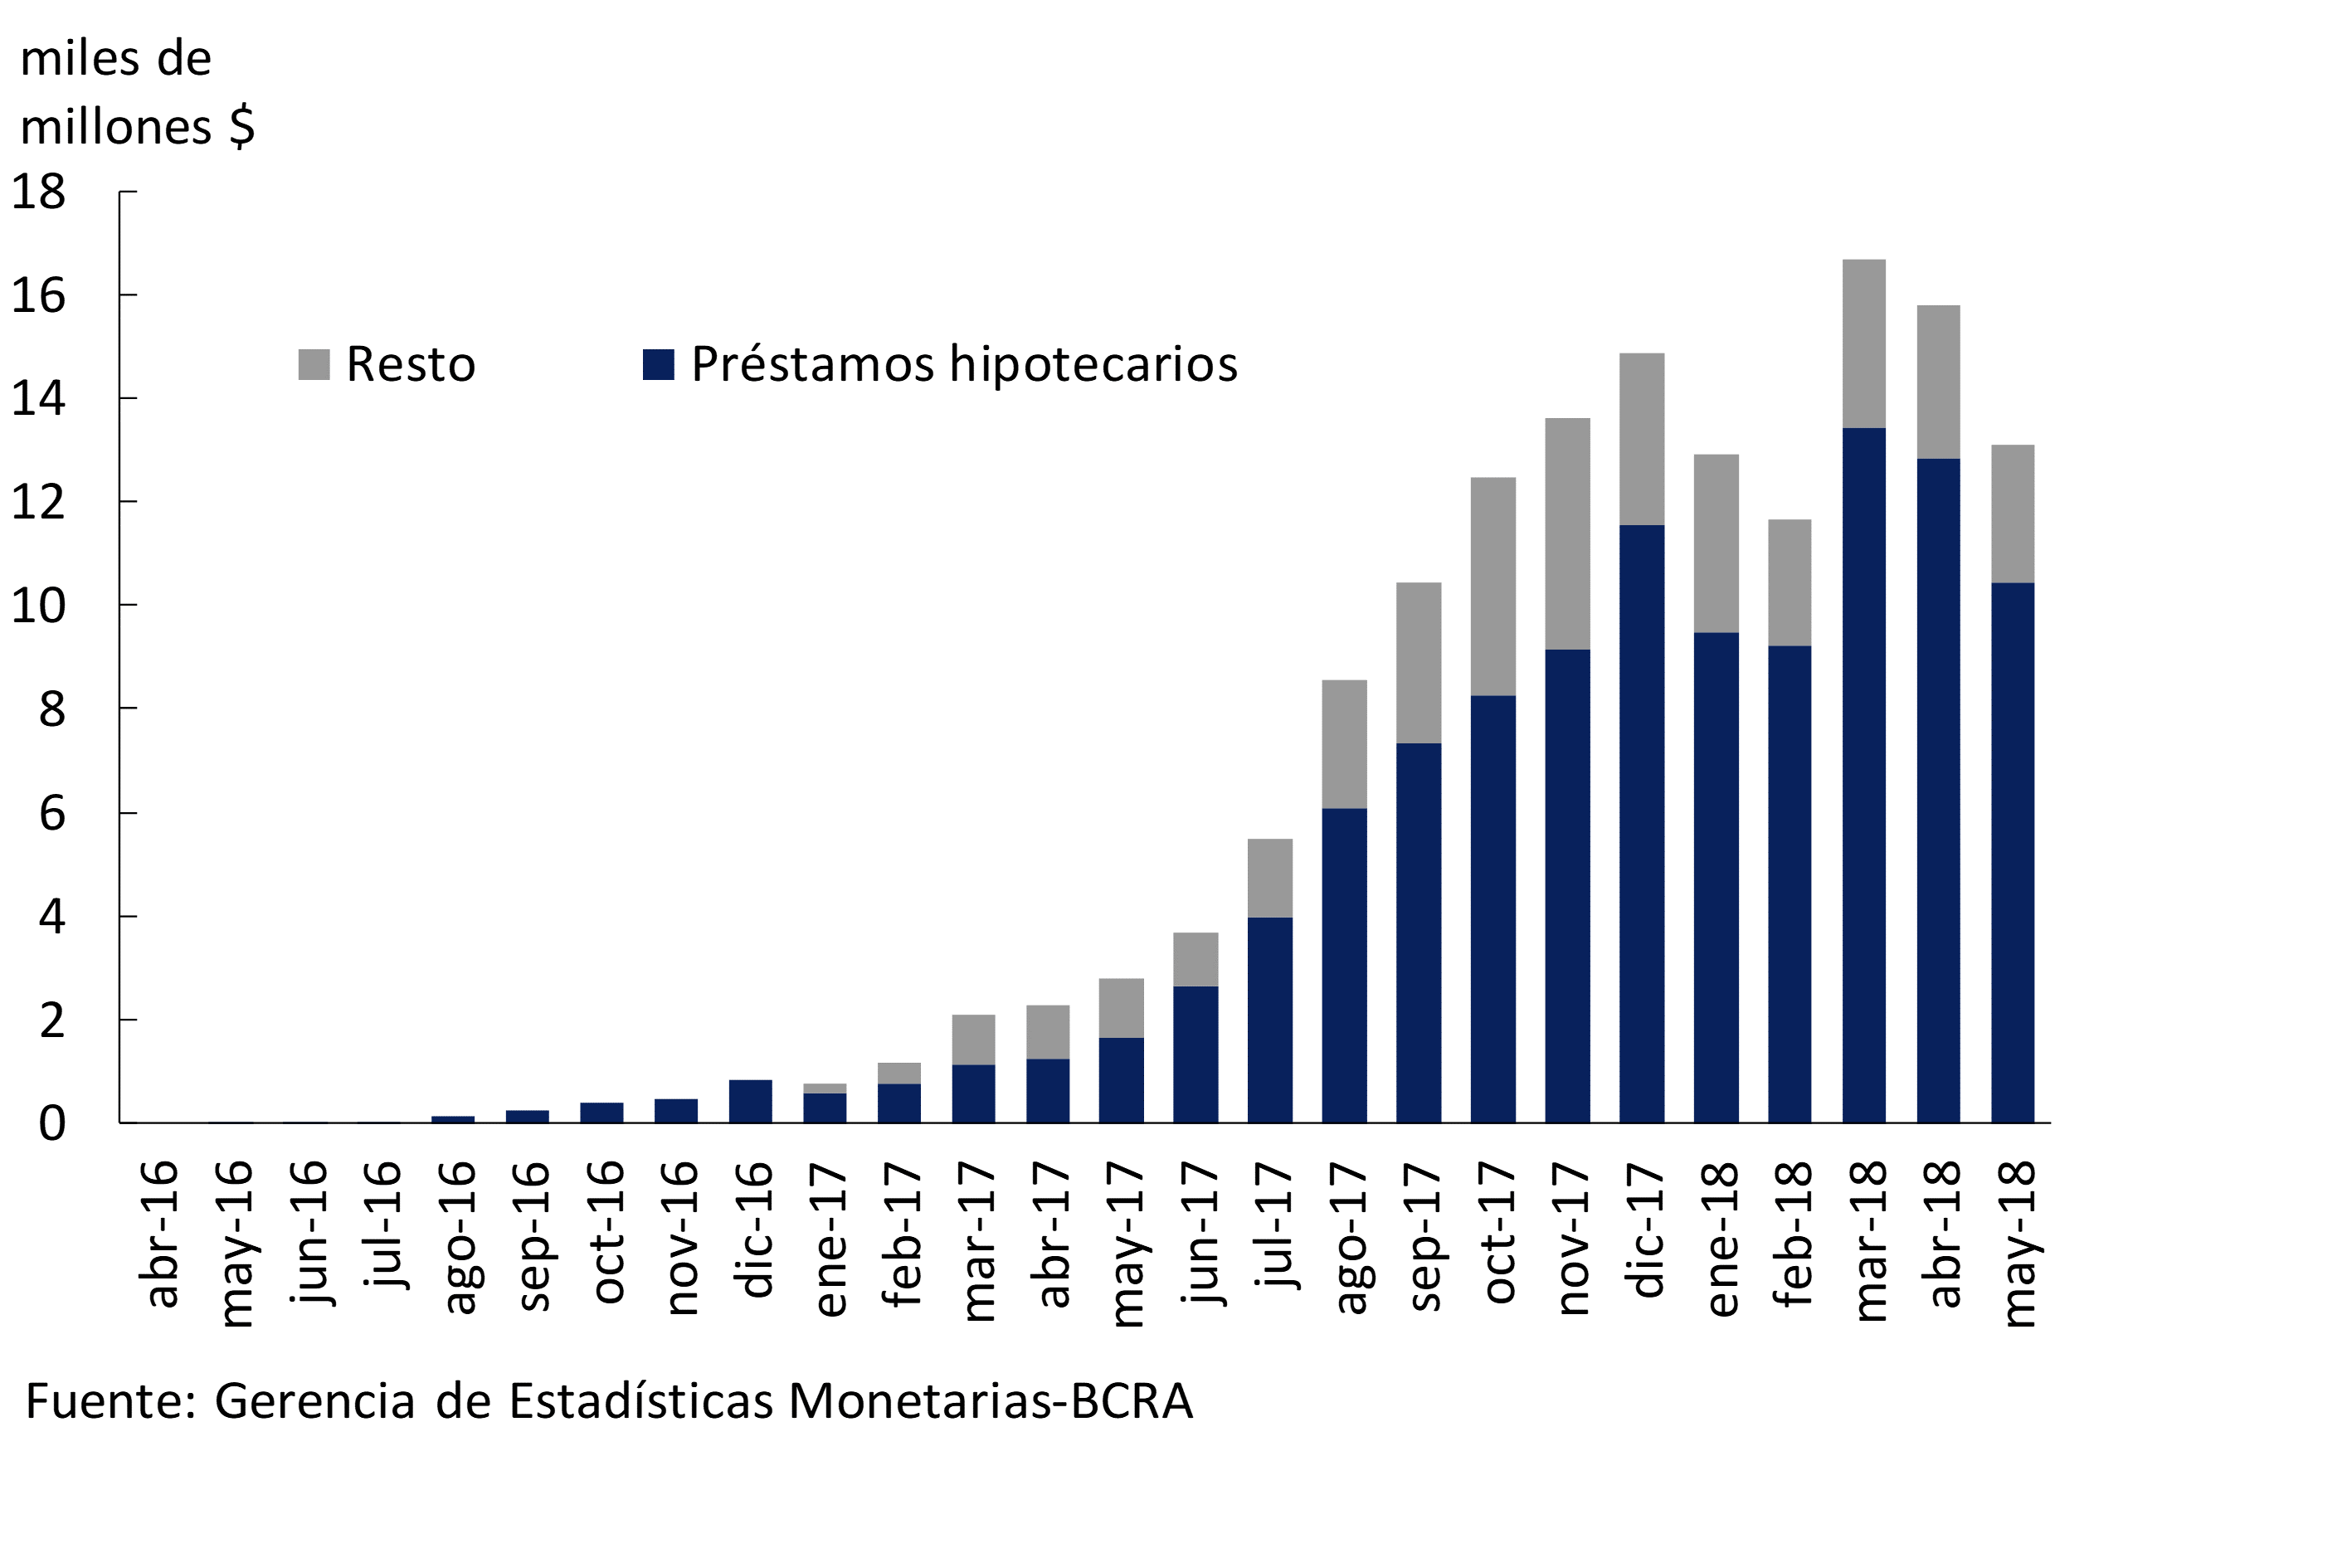
The volume of loans to the private sector in UVA was $13,082 million in May, showing a certain slowdown compared to previous months (see Graph 14). Of the total granted in the month, almost 80% corresponded to mortgage loans, 14% to personal loans and 6% to pledges. In April, the latest information available, the total balance of UVA loans stood at $156,200 million10, accounting for 8.3% of the total balance of financing to the private sector.
Figure 14 | UVA Financing – Amounts Granted
In April, nominal interest rates traded in pesos with the private sector11 showed a slight increase in all credit lines. The rates agreed on pledges showed the highest relative increases. In relation to the interest rates operated in UVA, in April the interest rate agreed for mortgages averaged 4.6%, slightly below last month. For its part, the interest rate on personal loans in UVA stood at 10.2%, 0.3 p.p. below the March record. Meanwhile, the average interest rate on UVA pledges remained at 11.9% in April.
V. Portfolio Quality
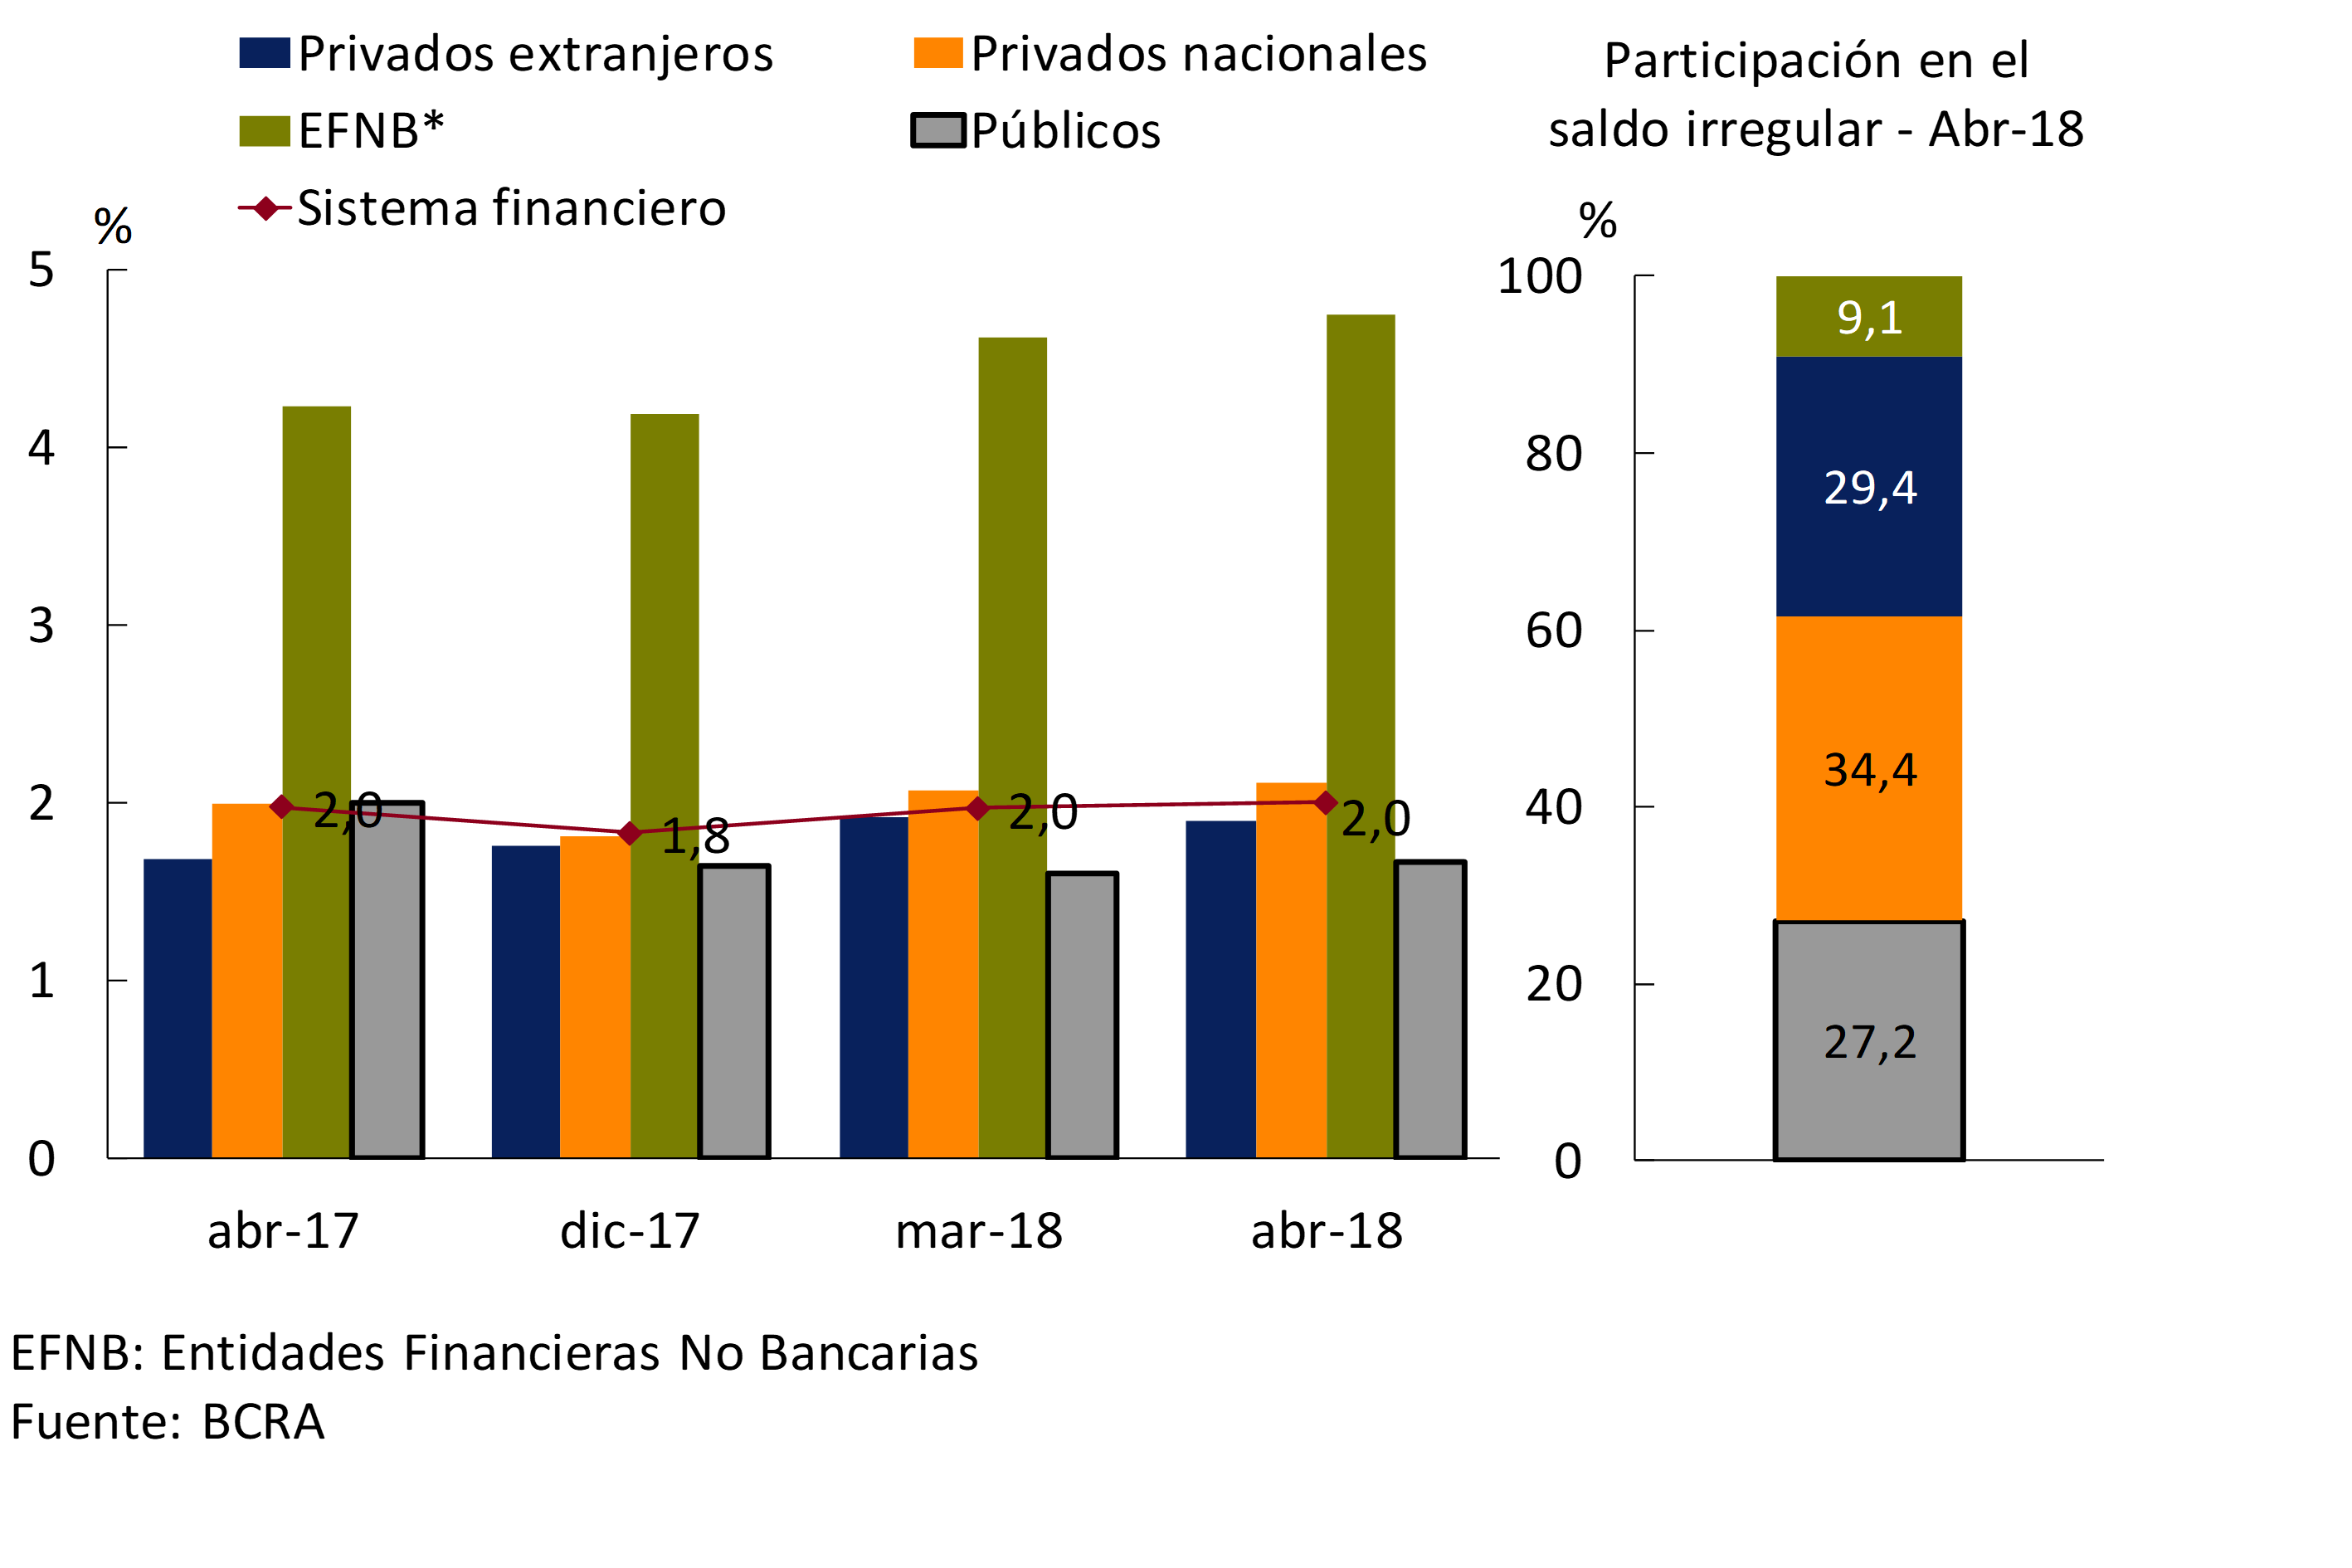
The NPL ratio for loans to the private sector remained around 2% in April, unchanged from last month and in a year-on-year comparison (see Chart 15). The year-on-year performance of the irregularity ratio was mixed among groups of financial institutions: it fell slightly in public banks and increased moderately in the other groups.
Figure 15 | Irregularity of Credit to the Private Sector – Irregular portfolio / Total financing (%)
In April, the default rate on loans to households increased slightly to 3.2% of this portfolio (see Chart 16). In the last twelve months, the irregularity ratio of credit to households accumulated an increase of 0.1 p.p., driven mainly by consumer financing lines (credit and personal cards12).
Figure 16 | Irregularity of Credit to the Private Sector – Irregular portfolio / Total financing (%)
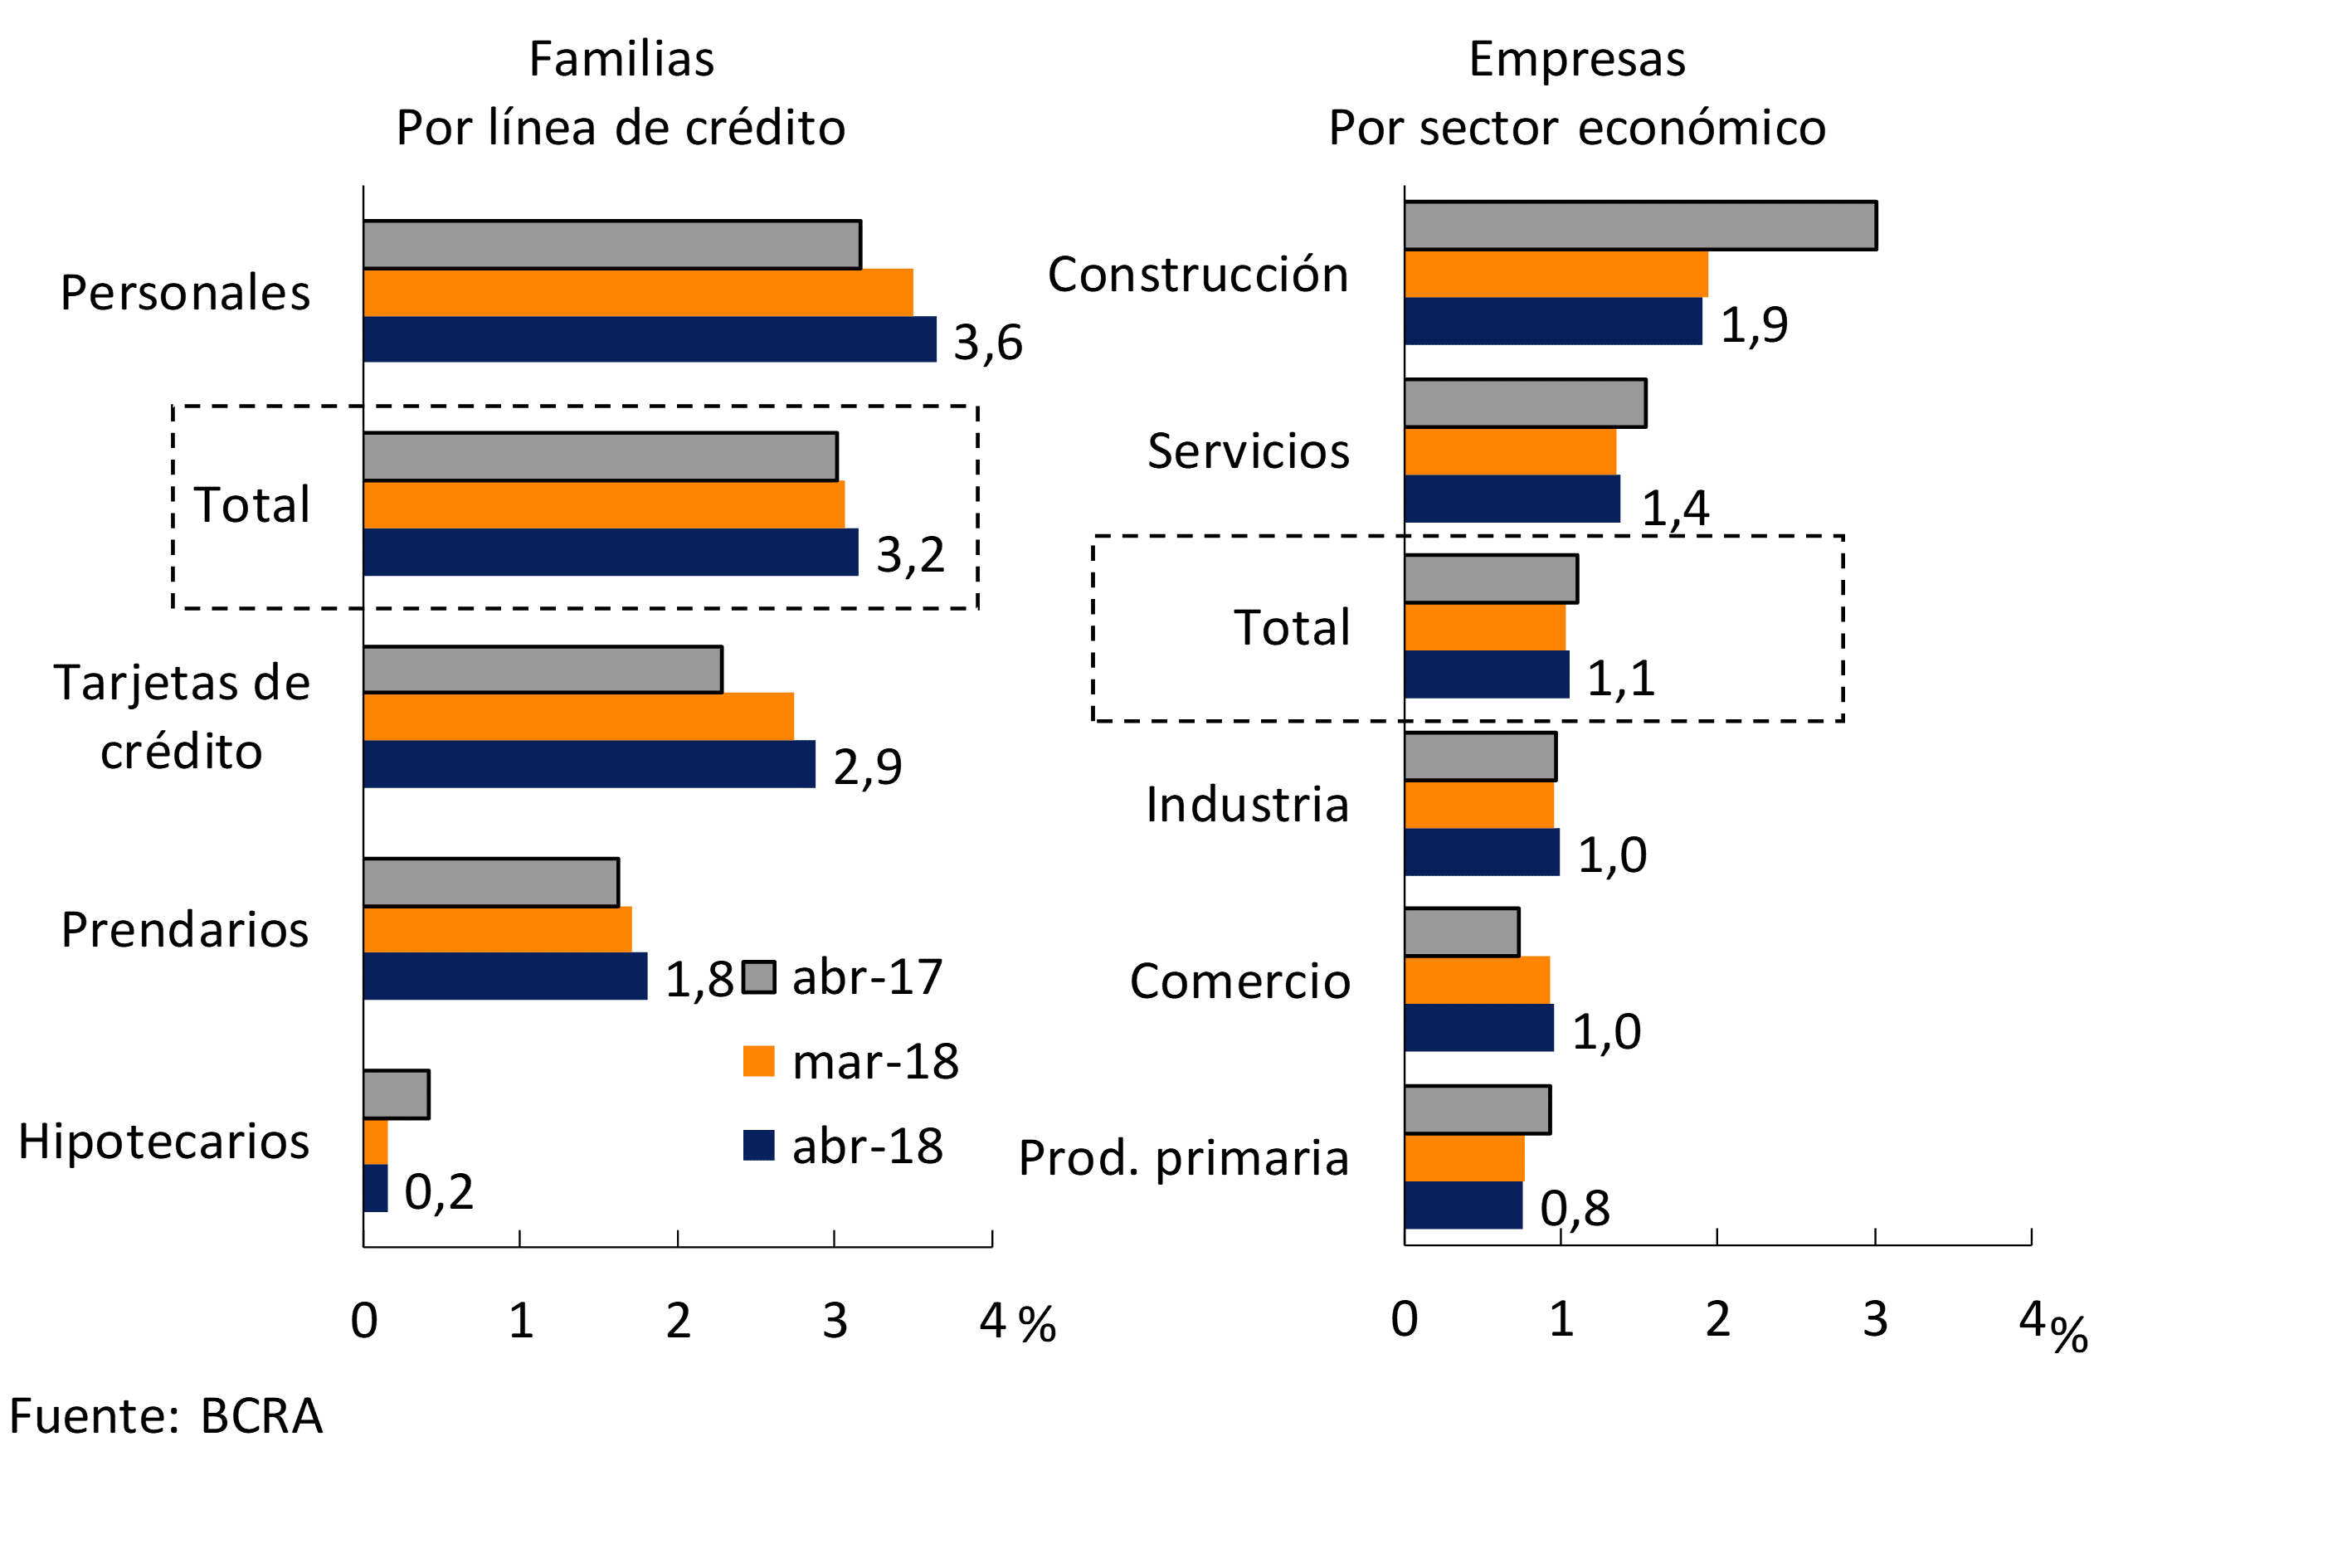
The NPL ratio of financing to companies stood at 1.1% in April (see Graph 16), without significant changes compared to last month’s figure and the level of a year ago. In the last twelve months, this indicator showed heterogeneous behaviors according to the productive branch to which credit was channeled: increases in trade, without significant changes in industry, and reductions in construction, primary production, and services.
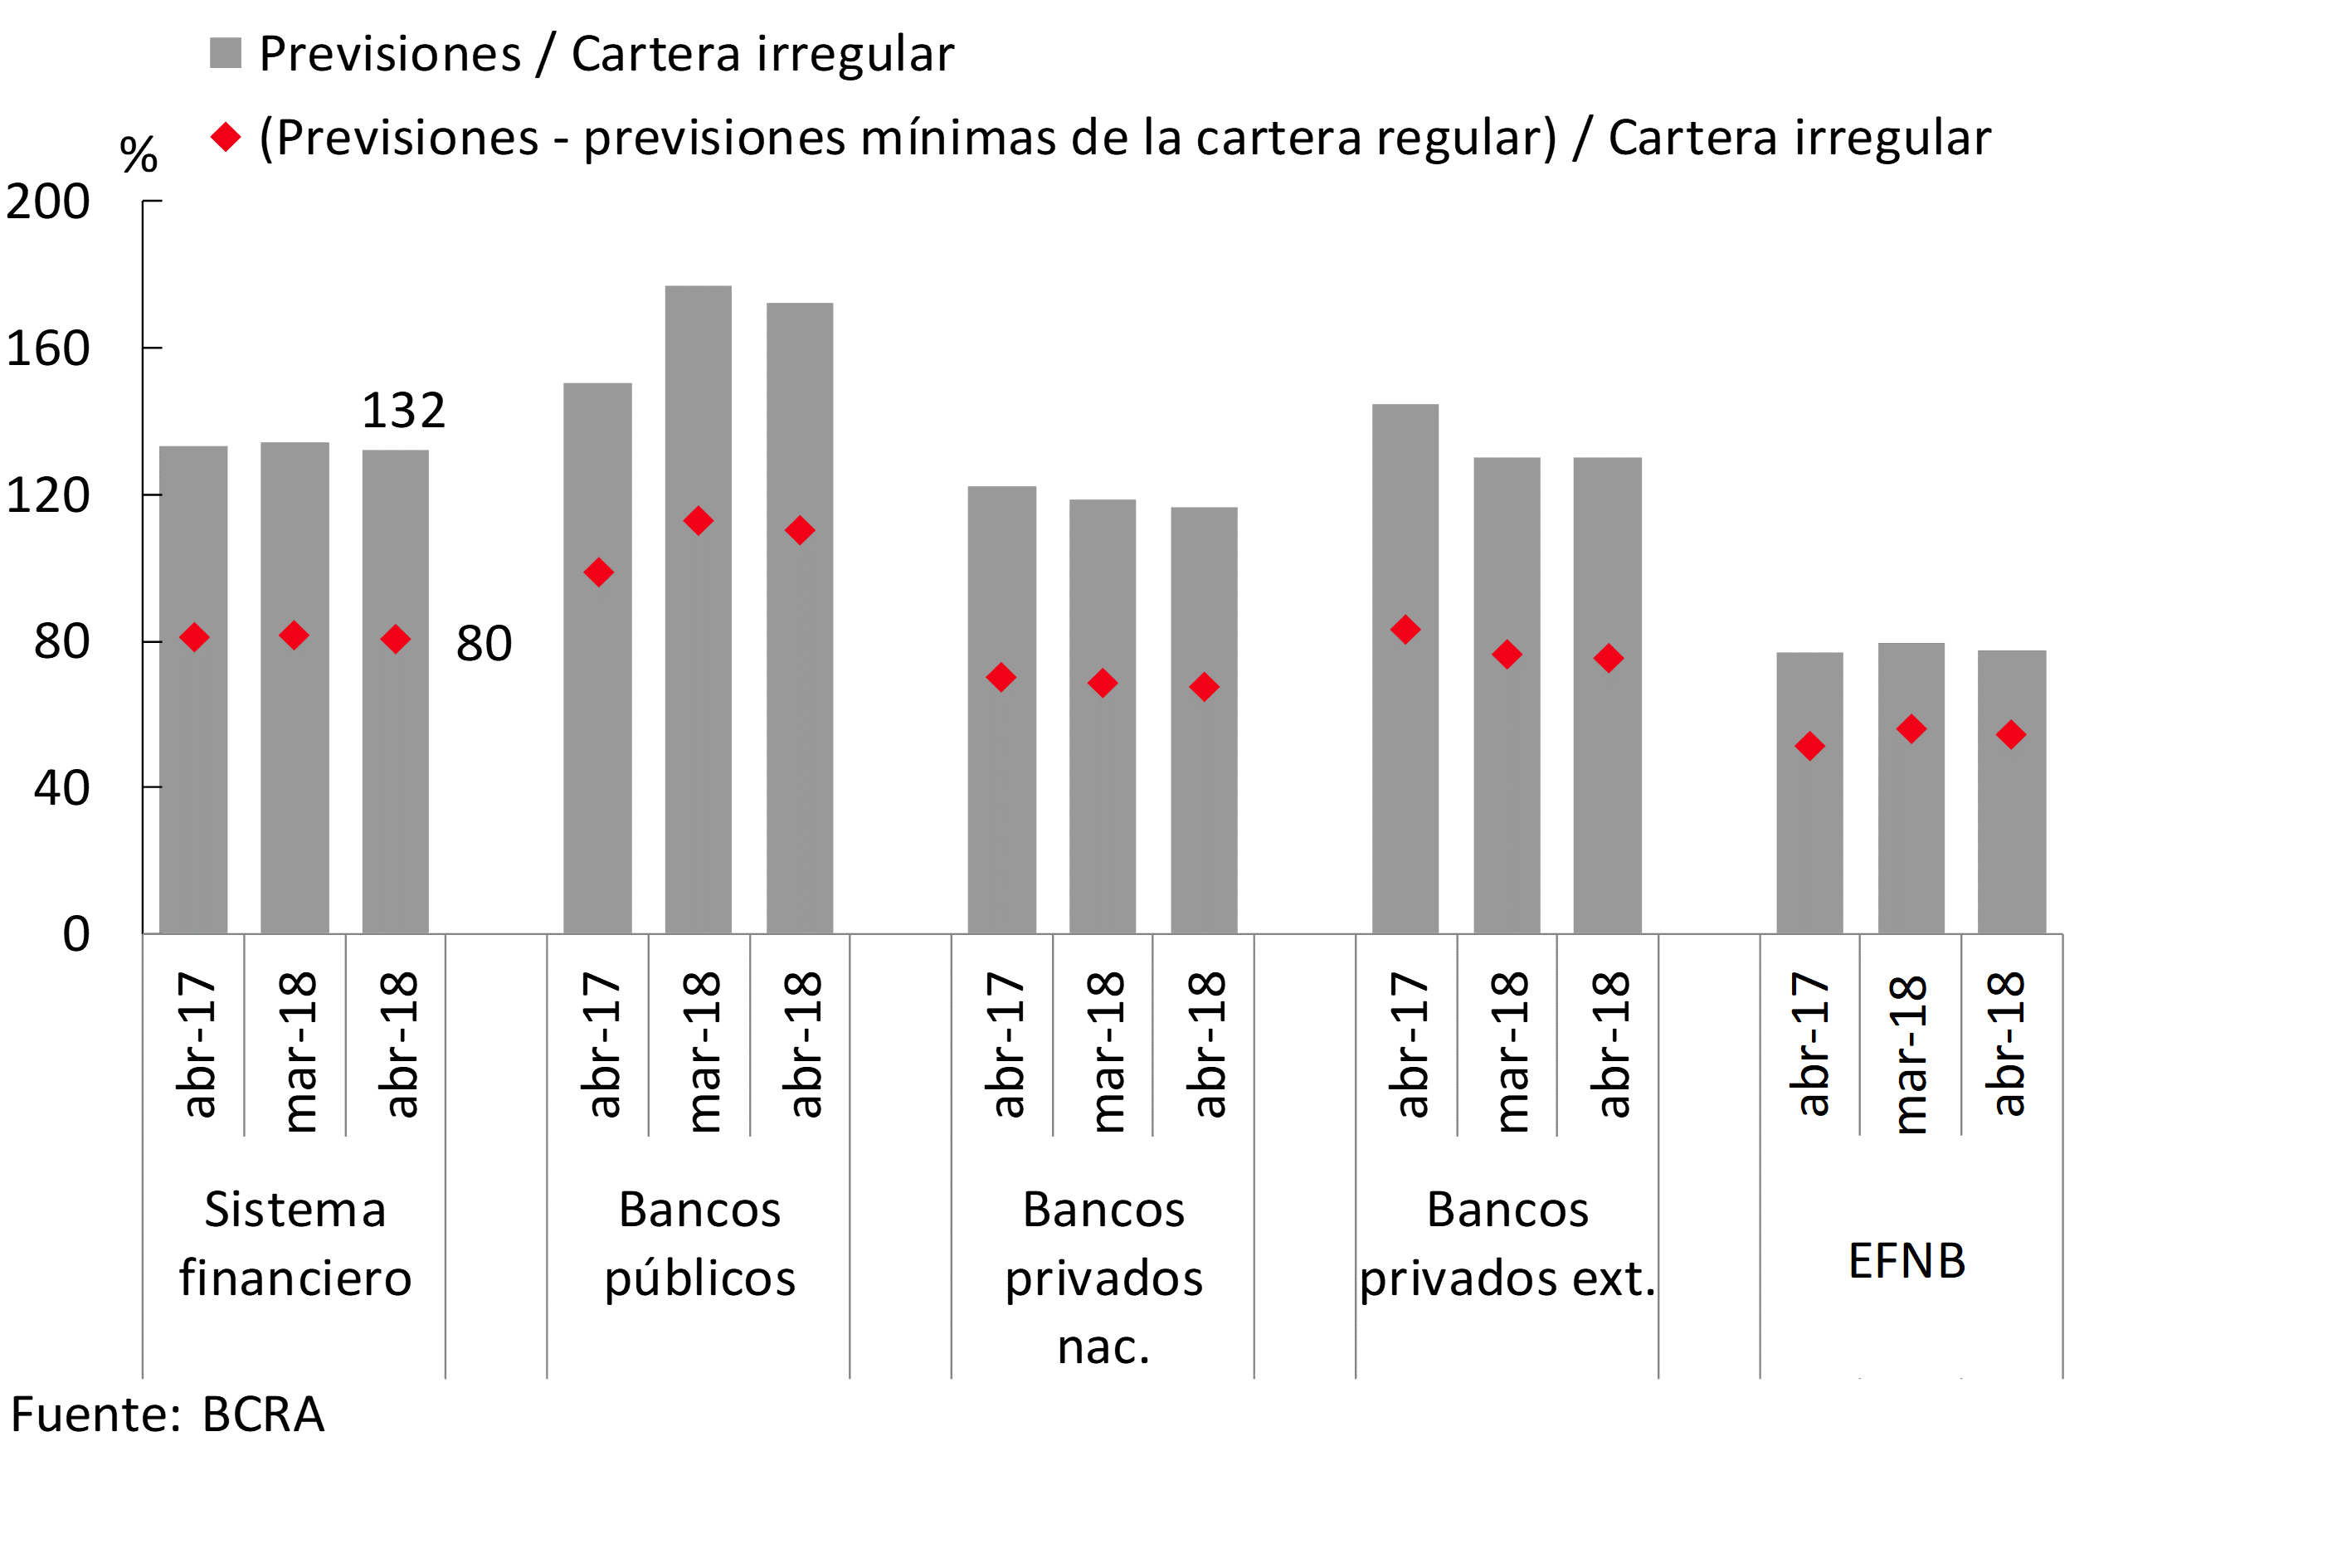
In this context, all banking groups continued to show high levels of forecasting, far exceeding the minimum regulatory requirement. In April, the balance of accounting forecasts in the financial system reached an amount equivalent to 132% of loans in an irregular situation (see Chart 17). In turn, if the minimum forecasts attributable to the portfolio in regular situation are excluded, this coefficient would stand at 80% in the period.
Figure 17 | Forecasts and Irregular Portfolio by Group of Financial Institutions
VI. Solvency
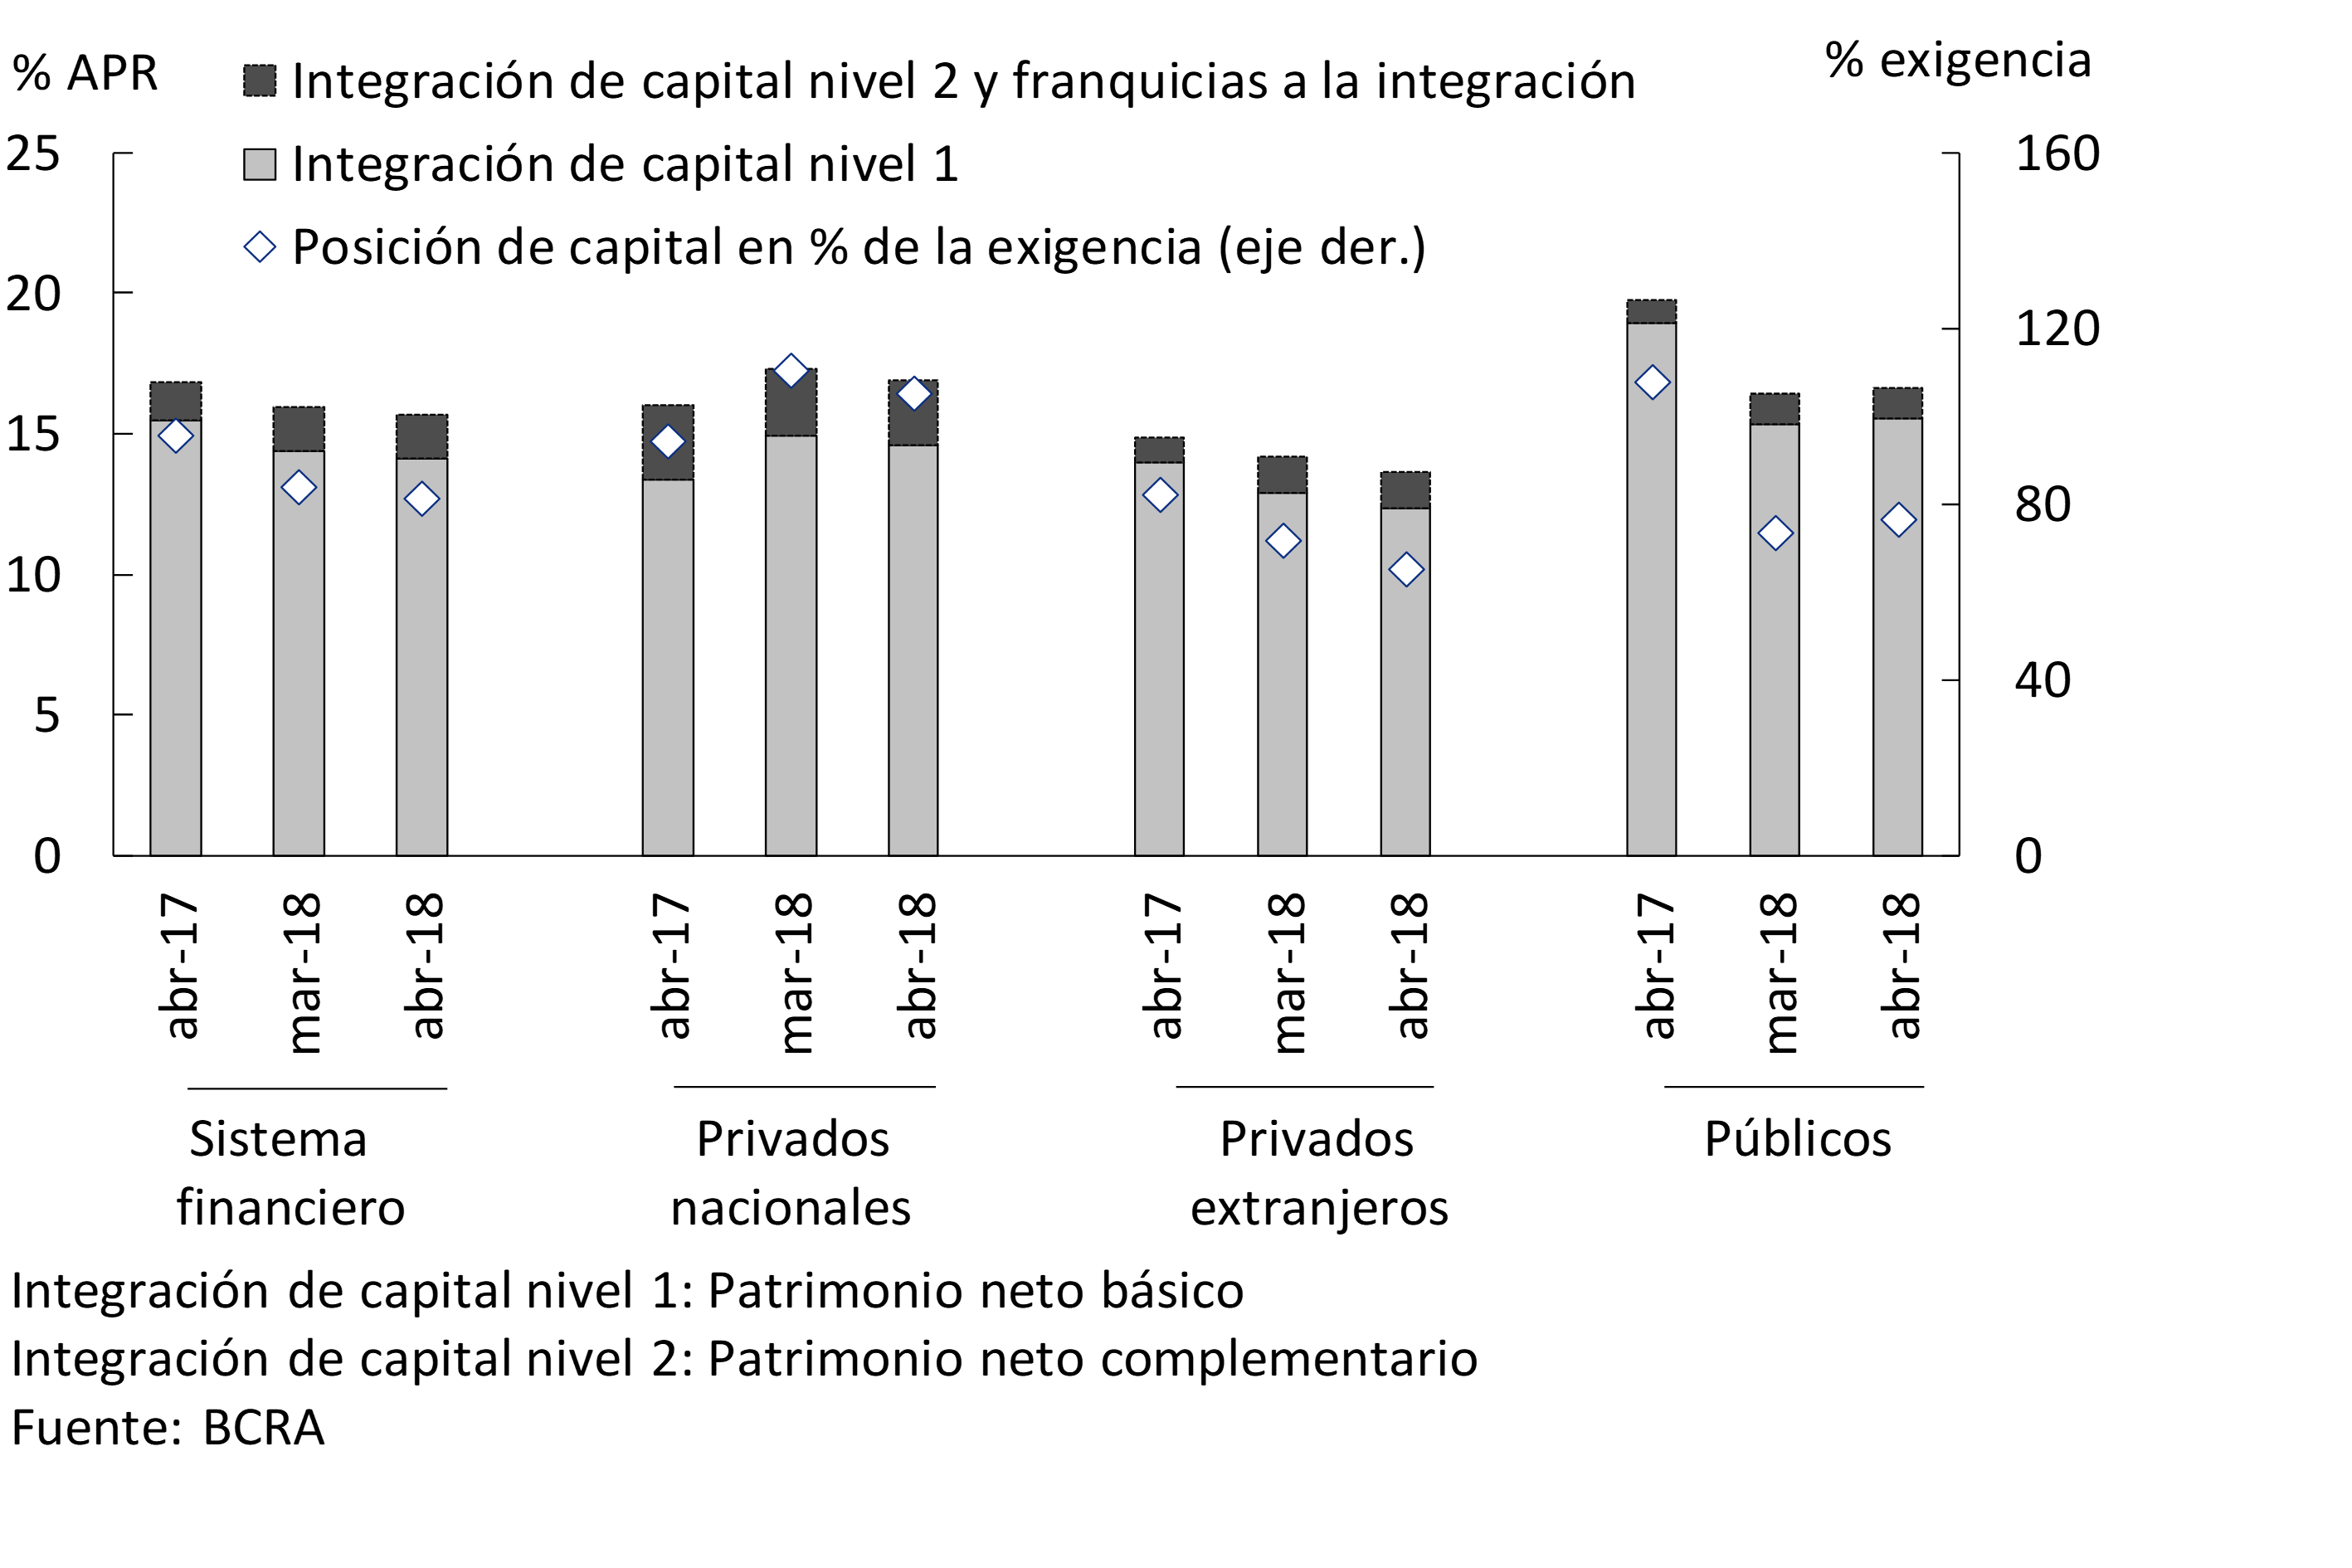
The aggregate solvency indicators for the banks as a whole did not show any changes in magnitude with respect to March, remaining at high levels. The capital with the highest capacity to absorb losses (Tier 1) represented 14.2% of risk-weighted assets (RWA) in the month (see Chart 18). The total integration of regulatory capital in the financial system totaled 15.7% of RWAs. For its part, the regulatory capital position – excess integration – stood at 81% of the minimum regulatory requirement. All bank groups continued to verify a surplus capital position.
Figure 18 | Integration and Excess Regulatory Capital (Position)
In April, the monthly earnings accrued by the financial system reached 3.2% annualized (y) of assets (26.9% yr. of net worth (ROE), increasing 0.7 p.p. compared to the previous month (see Chart 19). This increase was mainly explained by a reduction in administrative expenses and other expenditures13 (income tax and expenditures recorded in “other comprehensive income” (ORI). These effects were tempered by a monthly reduction in the financial margin. In April, private banks recorded positive monthly results for 2.6% of assets, while public banks obtained 4% of assets.
Figure 19 | Income Statement by Financial Institution Group

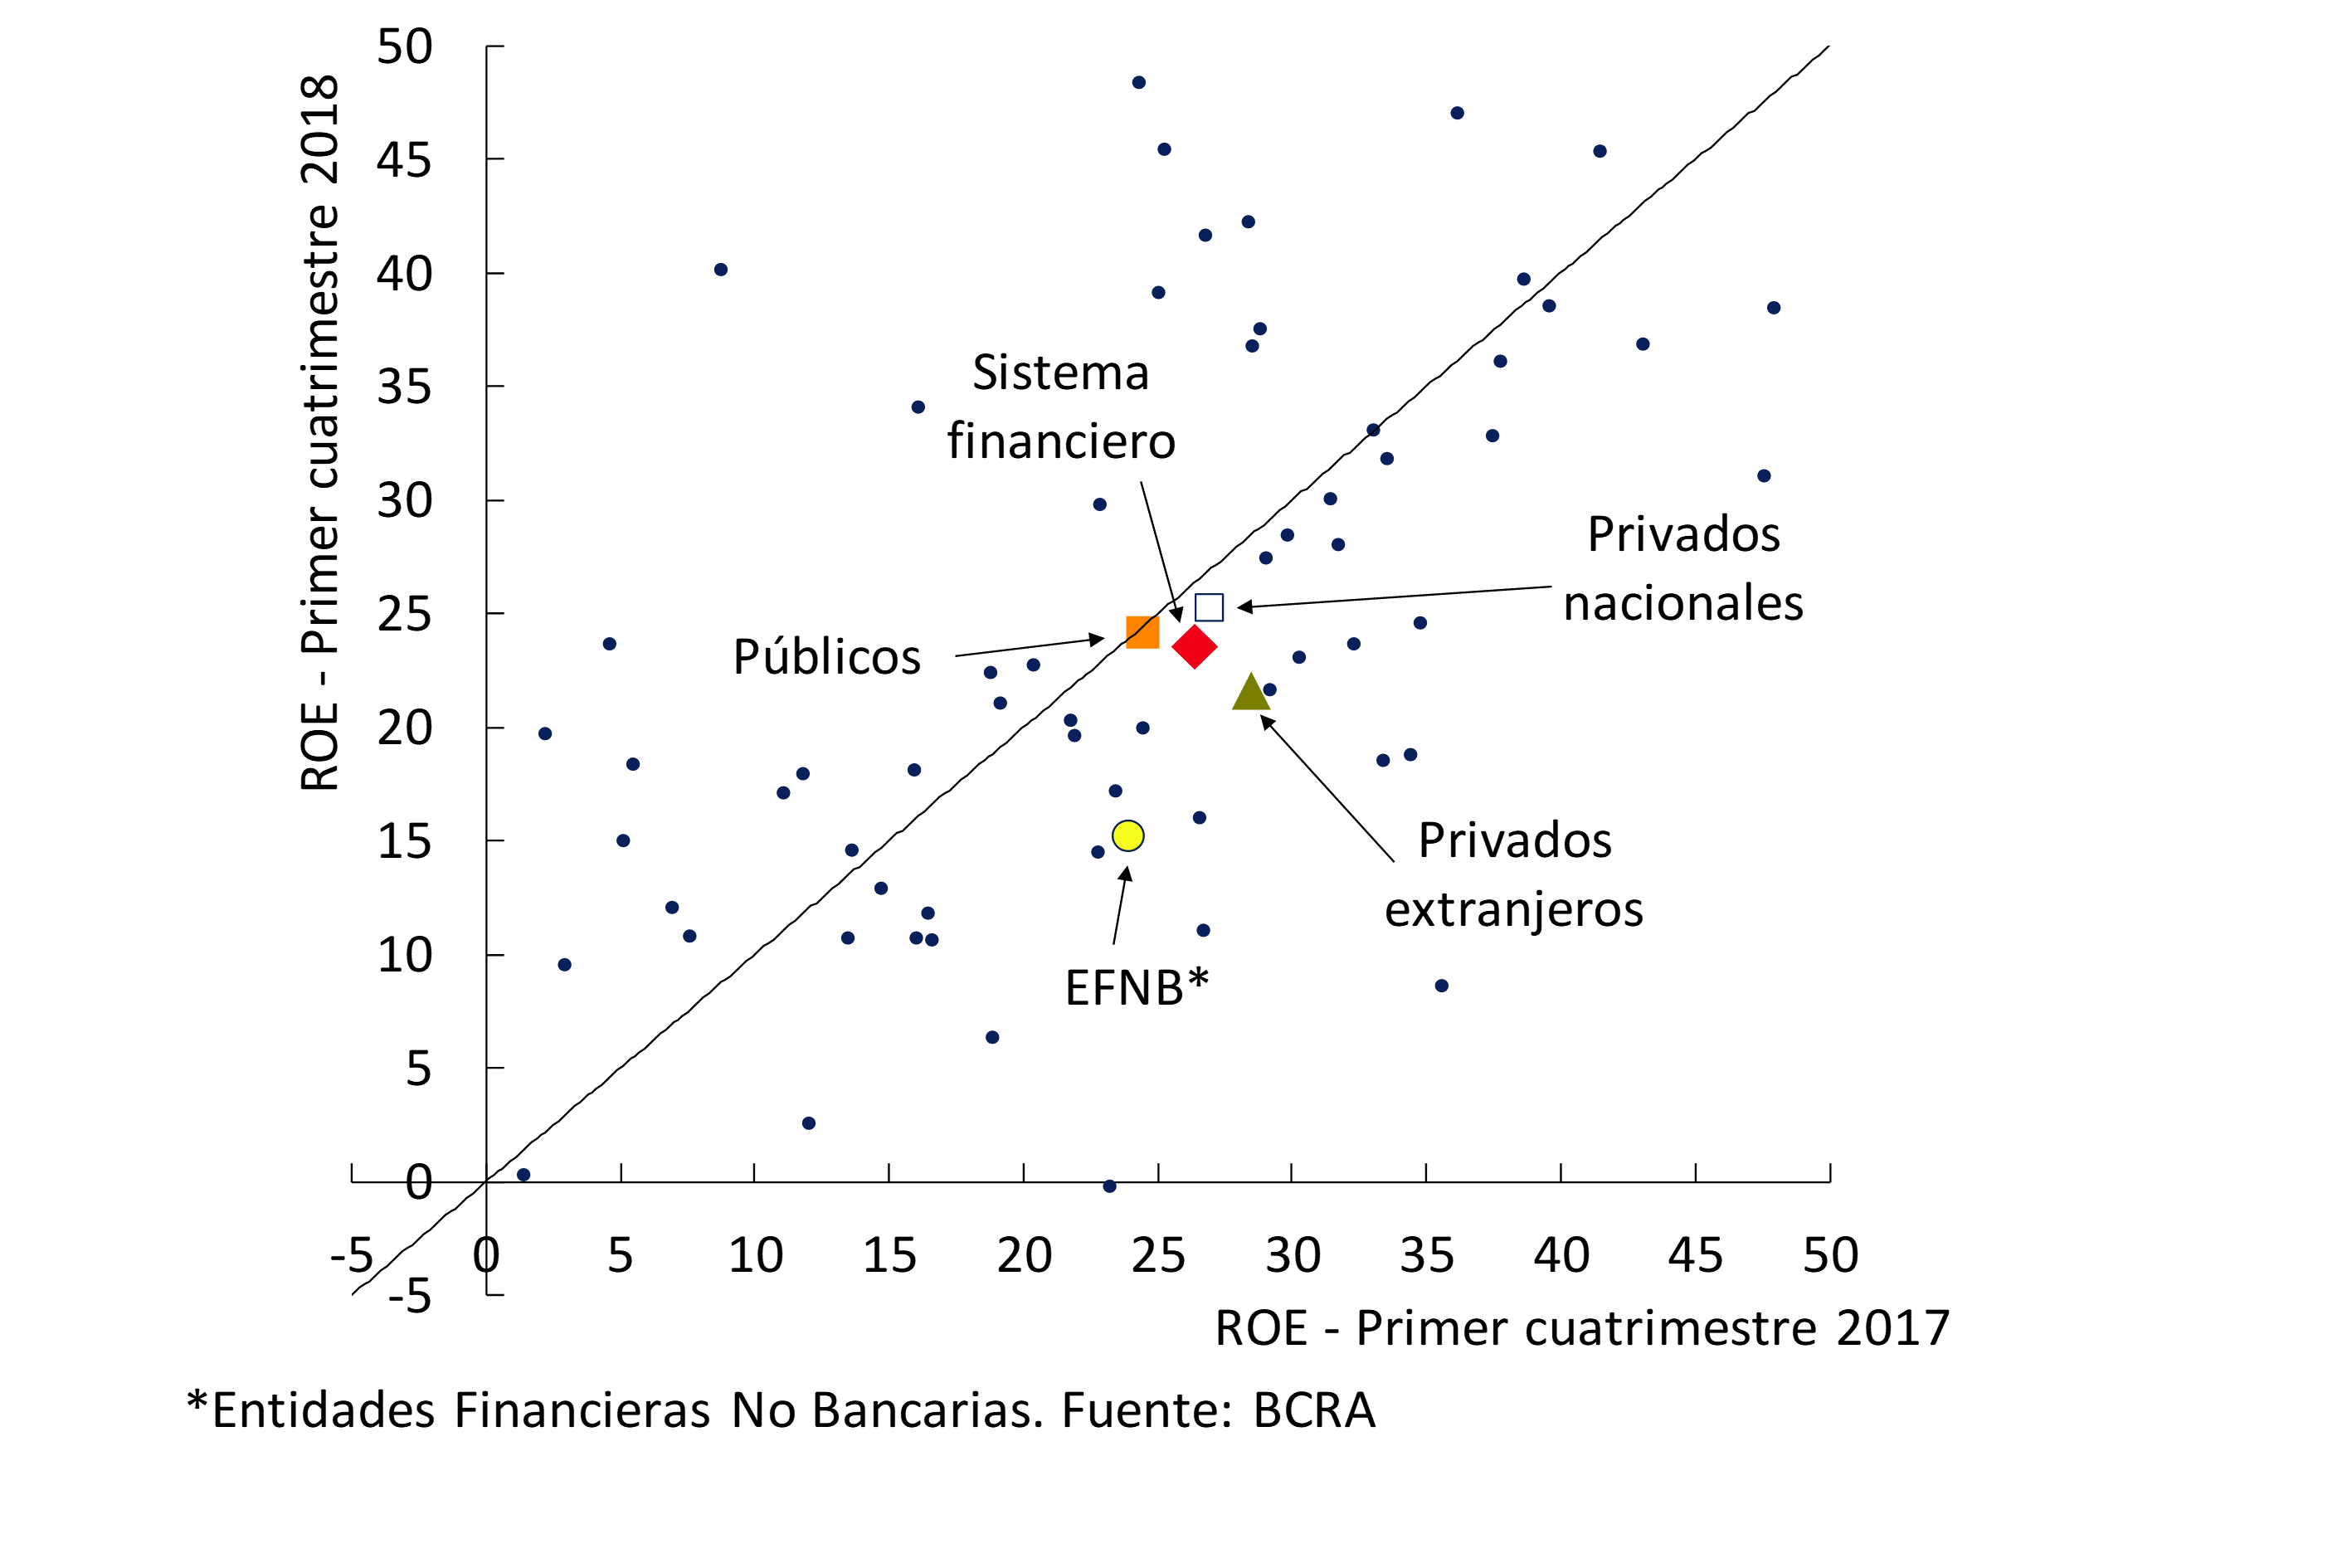
Considering the cumulative figure for the first four months of the year, the financial system recorded gains of 2.9% y/y of assets (23.5% y/y), similar in a year-on-year comparison (-2.9 p.p. y.o.y.). All groups of financial institutions showed a slight year-on-year reduction in the accumulated ROE for the first four months of the year, maintaining heterogeneity at the individual level (see Chart 20).
Figure 20 | Profitability of the Financial System – ROE
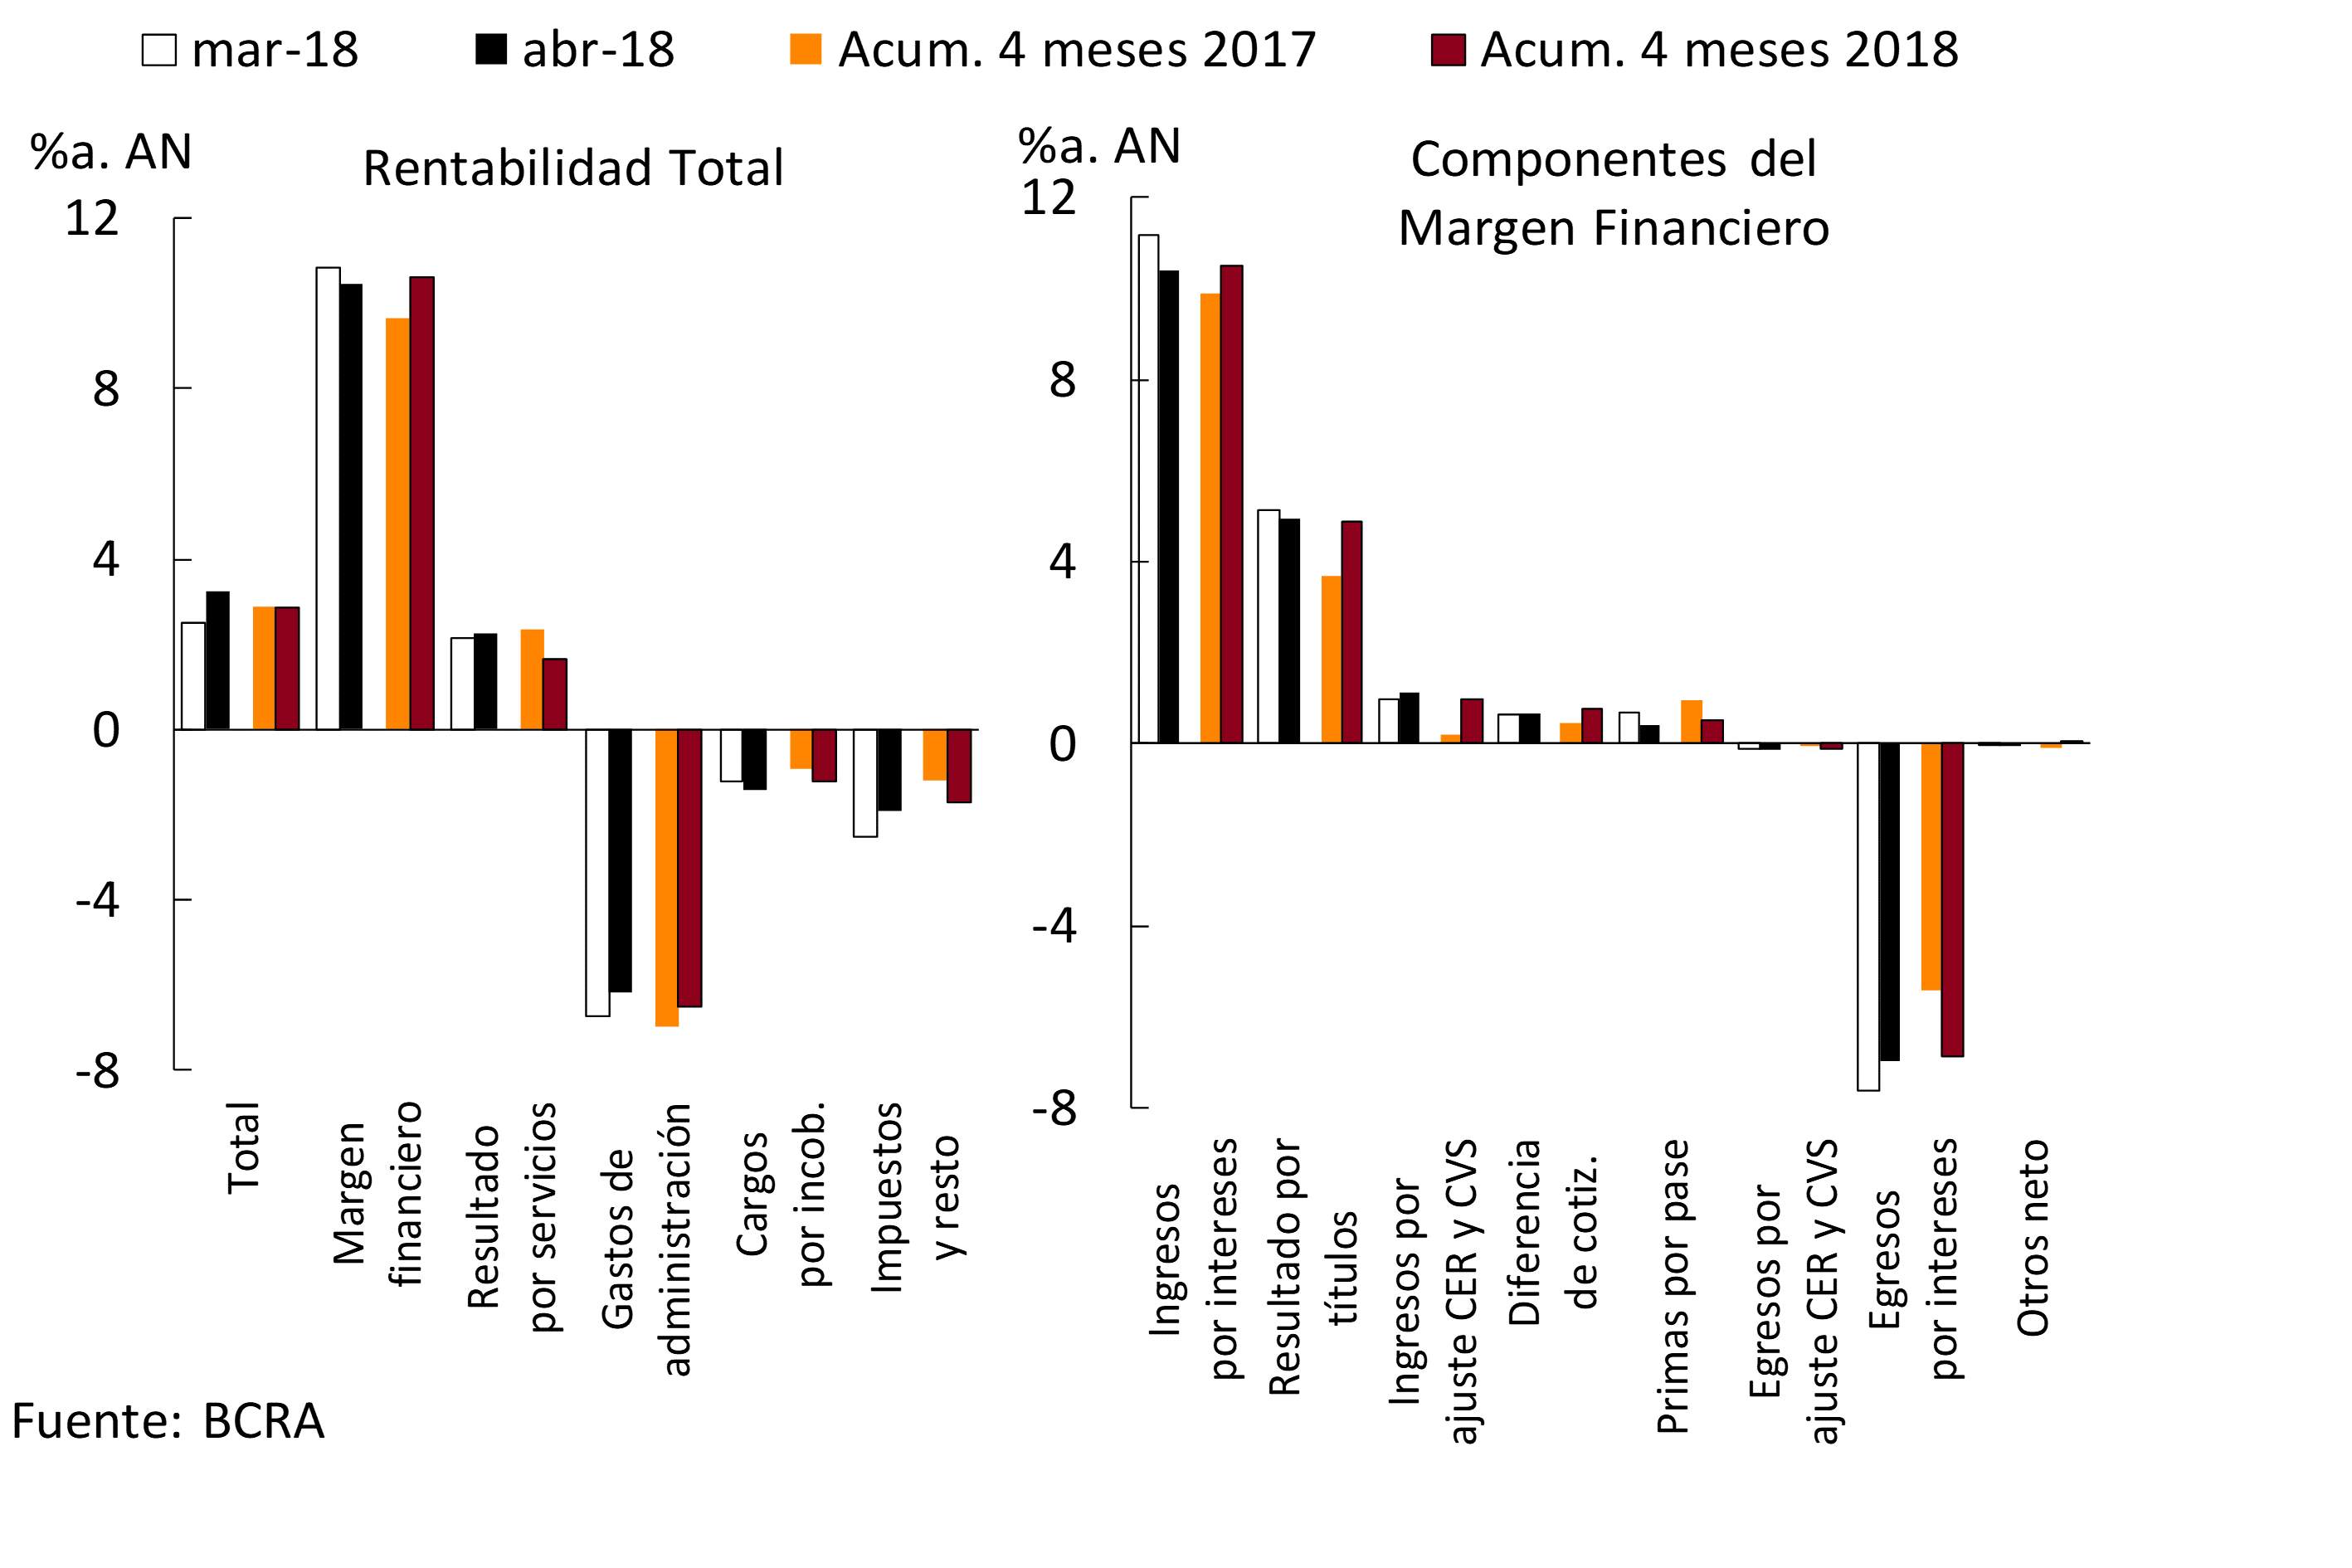
In the month, the financial margin totaled 10.4% y/a. of assets, falling 0.4 p.p. compared to March. This monthly reduction was mainly due to lower interest income, pass premiums and securities gains, effects that were partially offset by a reduction in interest expenses and an increase in the positive CER14 adjustment (see Chart 21). The accumulated financial margin in the first 4 months of 2018 represented 10.6% of assets, 1 p.p. more than in the same period of 2017. This increase was driven by higher gains from securities, CER15 adjustments, interest income and share price differences. These effects were partly offset by an increase in interest outflows and a reduction in pass premiums.
Figure 21 | Components of the Income Table – Financial System
Monthly results for services of the banks as a whole increased slightly, to represent 2.3% of assets in April. In the first four months of the year, net income from services totaled 1.6% y/y of assets, falling 0.7 p.p. in a year-on-year comparison (see Chart 21).
Charges for uncollectibility of the financial system were equivalent to 1.4% of assets, increasing 0.2 p.p. compared to March. In the first 4 months of the year, charges for uncollectibility totaled 1.2% of assets, 0.3 p.p. more than in the same period last year.
Administrative expenses totaled 6.2% of assets in April, falling 0.6 p.p. compared to last month. In the first four months of 2018, the sector’s administrative expenses stood at 6.5% of assets, decreasing 0.5 p.p. in a year-on-year comparison (see Chart 21).
Regulations
Summary of the main regulations of the month, implemented by the BCRA, related to financial intermediation activity. The effective date of the regulation is taken as a reference.
Communication A 6488 – 12/04/18
The rules on “Minimum security measures in financial institutions” are adapted in order to admit, under the supervision of persons authorized by the institutions, the use of mobile devices inside their operational houses for the sole purpose of promoting, installing and/or explaining how to use the mobile banking applications made available to their customers. The rules on “Minimum capital of financial institutions ” are modified, establishing that for the purposes of measuring the capital requirement for exchange rate risk, only guarantees granted will be taken into account for the measurement of the net open position in each foreign currency when their execution is considered safe and whose irrecoverability is highly probable.
Communication A 6489 – 12/04/18
The rules on “Minimum capital of financial institutions” are modified, increasing to €1 million the amount of exposure for MSMEs belonging to the agricultural sector to be considered retail portfolios, as long as they have coverage against climatic or meteorological risks that have an estimated probability of occurrence of at least once every 20 years and their amount reaches the entire balance of the aforementioned credit exposure in excess of $10 millions. It is provided in the rules on “Minimum provisions for risk of uncollectibility” that financing that has the aforementioned coverage for the entire balance is subject to the constitution of the minimum provision of the category immediately prior to the one to which they would have corresponded according to their classification.
Communication A 6494 – 20/04/18
The rules on “Time deposits and investments” are adapted in order to reduce from 180 to 90 days the minimum term of deposits and other term investments that are constituted in “Purchasing Value Units upgradable by “CER” – Law 25,827 (“UVA”)” and the one provided for the “Savings account in Purchasing Value Units upgradable by “CER” – Law 25,827 (“UVA”)”.
References
1 Reference is made to those measures of relevance to the financial system that were adopted since the date of publication of the previous Report on Banks.
3 Considering balance sheet balances
4 From the end of 2017 until the end of the first quarter of 2018, the placement of debt in national currency was one of the main sources of funding for banks. For more details, see Section No. 3 of the Financial Stability Report for the First Half of 2018.
5 For more details, see Financial Stability Report for the First Half of 2018.
6 Variation in currency of origin.
7 Variation in currency of origin.
8 Information extracted from the Central Debtors (includes both national and foreign currency). Loans to residents abroad are not included. Business financing is defined here as that granted to legal entities and commercial financing granted to individuals. On the other hand, loans to families are considered to be those granted to individuals, unless they are for commercial purposes.
9 See previous note.
10 Includes capital and adjustment of capital for the evolution of the CER.
11 It includes a fixed and repacable interest rate.
12 It is worth noting the performance of mortgage lines, with irregularity levels in the order of 0.2%, results that reach only 0.06% in the case of those denominated in UVA (since January 2018 detailed information on the situation of debtors with mortgage loans in UVA has been available).
13 Mainly registered by a public bank of magnitude.
14 It consists of an increase in income from this concept, partially offset by higher expenditures for this concept.
15 Idem, previous note.
Glossary
%a.: annualized percentage.
% YoY: Year-on-year percentage.
Liquid assets: availabilities (integration of “minimum cash” in current accounts at the BCRA and in special guarantee accounts and other concepts, mainly cash in banks and correspondent offices) plus the net credit balance for transfer operations of financial institutions against the BCRA using LEBAC and NOBAC.
Consolidated assets and liabilities: those arising from deducting transactions between entities in the system.
Net Assets (NA): Assets and liabilities are net of accounting duplications for pass-through, forward and spot transactions to be settled.
APR: Total Risk Weighted Assets.
BCBS: Basel Committee on Banking Supervision (BCBS).
Irregular portfolio: portfolio in situation 3 to 6, in accordance with the “Classification of Debtors” regime.
Credit to the public sector: Position in public securities (without LEBAC or NOBAC) + Loans to the public sector + Compensation to be received + Debt securities and Certificates of participation in financial trusts (with underlying public securities) + Miscellaneous credits to the public sector.
Credit to the private sector: loans to the non-financial private sector including accrued interest and CER and CVS adjustment and leasing.
Contribution differences: Results from the monthly update of assets and liabilities in foreign currency. The item also includes the results originated by the purchase and sale of foreign currency, which arise as a difference between the agreed price (net of the direct expenses originated by the operation) and the book value.
Miscellaneous: miscellaneous profits (including, but not limited to, gains on permanent shares, recovered loans and unaffected provisions) less miscellaneous losses (including, but not limited to, losses on permanent shareholdings, loss on sale or disposal of goods for use and amortization of business keys).
Equity exposure to counterparty risk: irregular portfolio net of provisions in terms of equity.
Administration expenses: includes remunerations, social charges, services and fees, taxes and amortizations.
IEF II-17: BCRA Financial Stability Report.
IPCBA: Consumer Price Index of the City of Buenos Aires.
CSF: Liquidity Coverage Ratio (LCR).
LEBAC and NOBAC: bills and notes issued by the BCRA.
LELIQ: BCRA liquidity bills.
LR: Leverage Ratio (LR).
Financial margin: Income minus financial expenses. It includes interest and securities earnings, CER and CVS adjustments, exchange rate differences and other financial results.
Mill.: Million or million, as appropriate.
IFRS: International Financial Reporting Standards.
ON: Negotiable Obligations.
ORI: Other comprehensive results.
OS: Subordinated Obligations.
Other financial results: rental income from financial leases, contribution to the deposit guarantee fund, interest on availabilities, charges for loan depreciation, premiums for the sale of foreign currency and other unidentified items.
PN: Net Worth.
p.p.: percentage points.
SME: Small and Medium Enterprises.
Consolidated profit: Results from permanent holdings in local financial institutions are eliminated. Available since January 2008.
Income from securities: includes results from public securities, temporary shares, negotiable obligations, subordinated obligations, options and other credits for financial intermediation. In the case of public securities, it includes the results accrued in terms of income, differences in share price, exponential increase based on the internal rate of return (IRR) and sales, in addition to the charge for forecasts for the risk of impairment.
Interest income: interest charged minus interest paid for financial intermediation, following the accrual criterion (balance sheet information) and not what is received. It includes interest on loans and deposits of government securities and premiums for passes.
Result for services: commissions charged minus commissions paid. It includes fees related to obligations, credits, securities, guarantees granted, the rental of safe deposit boxes and foreign and exchange operations, excluding in the latter case the results from the purchase and sale of foreign currency, the latter being accounted for in the “Differences in quotation” account. Expenses include commissions paid, contributions to the ISSB, other contributions for income from services and charges accrued from the gross income tax.
ROA: Final result as a percentage of net assets. In the case of referring to accumulated results, the average of the NA for the reference months is considered in the denominator.
SWEE: Final result as a percentage of equity. In the case of referring to accumulated results, the average net worth for the reference months is considered in the denominator.
RPC: Computable Patrimonial Liability. For more details, see Ordered Text “Minimum Capitals of Financial Institutions”.
TNA: Annual nominal rate.
US$: US dollars.
UVA: Unit of Purchasing Value.
ICU: Housing Units.
Share on


