I. Financial intermediation activity
Taking into account the most notable movements (in homogeneous currency) of the balance sheet of the financial system for items denominated in pesos, in September the balance of deposits – both private and public – of the financial system increased and financing to the private sector was reduced. On the other hand, in the month liquidity in the broad sense and financing to the public sectorincreased 1. On the side of the items in foreign currency, the variations of the main items presented (in currency of origin) similar directions to those observed in the items in pesos in the periodconsidered 2.
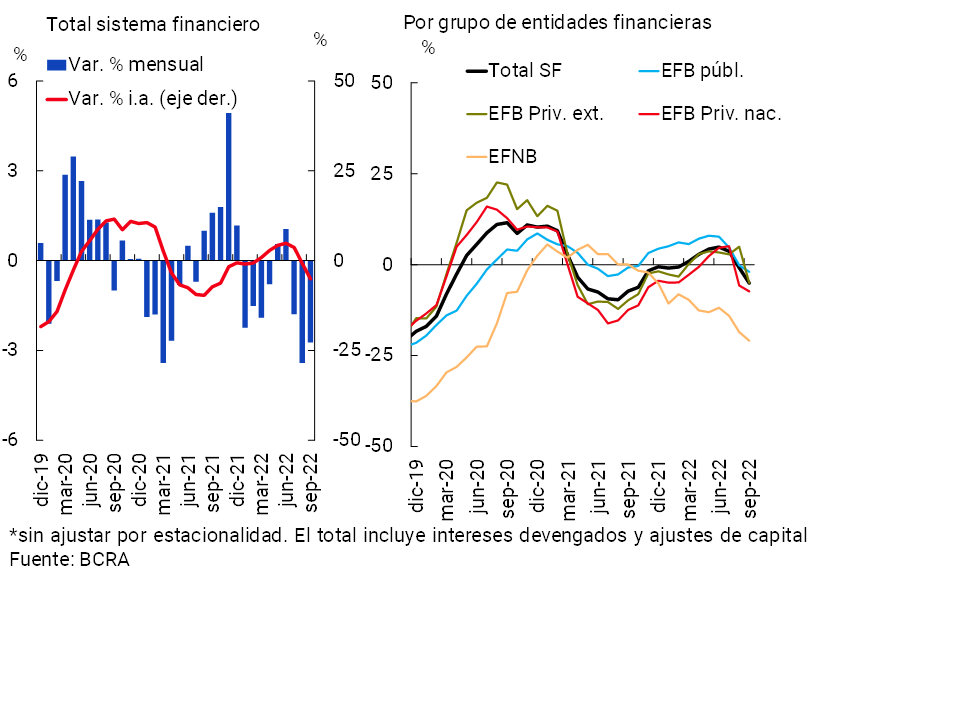
In September, the balance of credit in national currency to the private sector fell by 2.7% in real terms (+3.3% nominal), with falls in almost all credit lines (except for assets in financial leasing assets)3. In year-on-year terms, the balance of financing in pesos accumulated a decrease of 5.1% in real terms (+73.7% nominal, see Graph 1).
Graph 1 | Credit balance to the private sector in pesos
In real terms* – Financial system
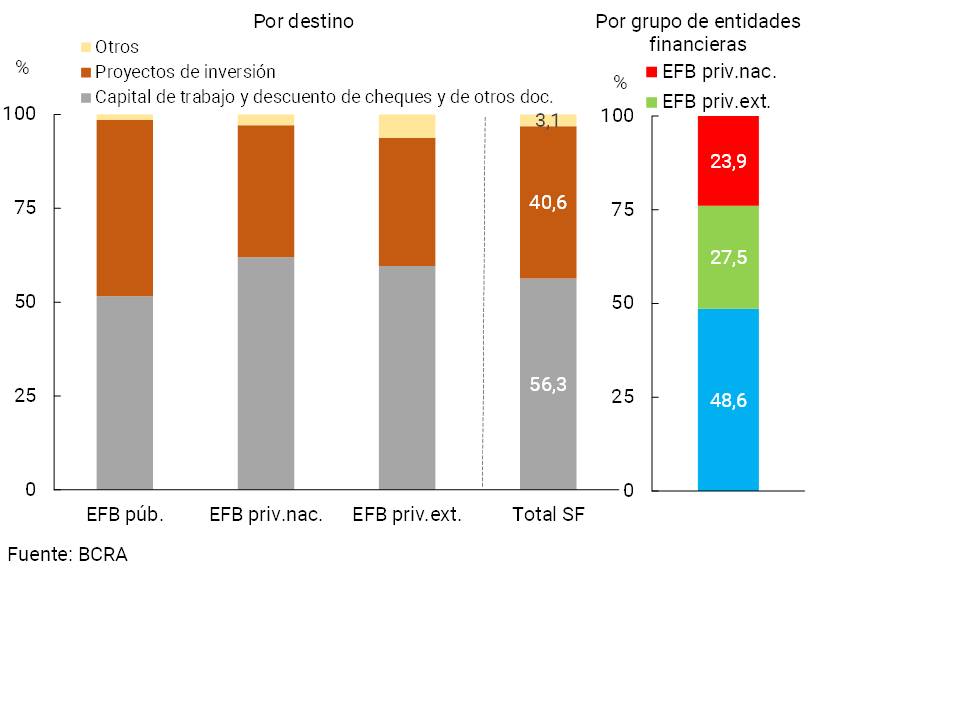
So far this year, the Financing Line for Productive Investment of MSMEs (LFIP) continued to consolidate itself as one of the main credit stimulus programs provided by the BCRA. From its implementation (in November 2020) to October 2022, almost $3.3 billion has been disbursed, benefiting more than 327,200 companies. As of September, it is estimated that the LFIP’s credit balance totaled more than $932,800 million, equivalent to 12.5% of the total credit balance to the private sector. Approximately 40.6% of the total estimated balance of the LFIP was channeled to financing investment projects (see Graph 2), with a greater participation of public financial institutions. As of October, a new LFIP quota began, with an extension until the end of March 2023, maintaining similar conditions to the existingones 4.
Graph 2 | Financing Line for Productive Investment (LFIP) of MSMEs
Share of estimated balance as of Sep-22
In addition, with the aim of consolidating Electronic Credit Invoices (EMCF) as a financing instrument for MSMEs, the BCRA launched the “Central Bank of Unpaid Electronic Invoices at Maturity (CenFIV)”. CenFIV will provide transparency to the operation and will generate a credit history, improving the traceability of this instrument5. The implementation of the CenFIV is in addition to the measures already provided by the Central Bank with the aim of expanding financing alternatives for MSMEs and, in the specific case of the FCEM, to increase and facilitate its use with a simpler operation and related to the daily practice of medium and small enterprises.
In September, the balance of credit to the private sector in foreign currency decreased 1.9% compared to the previous month6. In this context, the balance of total financing (in domestic and foreign currency) to the private sector accumulated a fall of 2.7% in real terms in the month (+3.4% nominal) and 9.4% in real terms in a year-on-year comparison (+65.8% y.o.y. nominal).
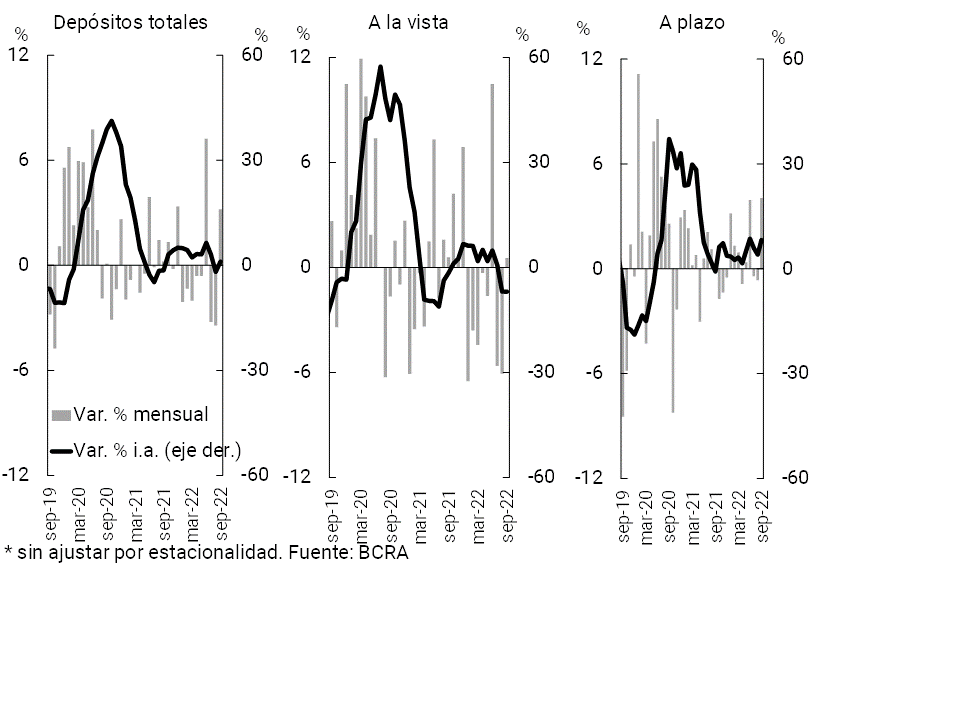
In terms of funding in the financial system, the balance of deposits in national currency of the private sector increased 3.2% in real terms in the month (+9.6% nominal, see Graph 3). Demand accounts increased 0.5% in real terms in the month (+6.8% nominal); while time deposits grew 4.1% in real terms (+10.5% nominal).
Graph 3 | Balance of private sector deposits in pesos
In real terms* – Financial system
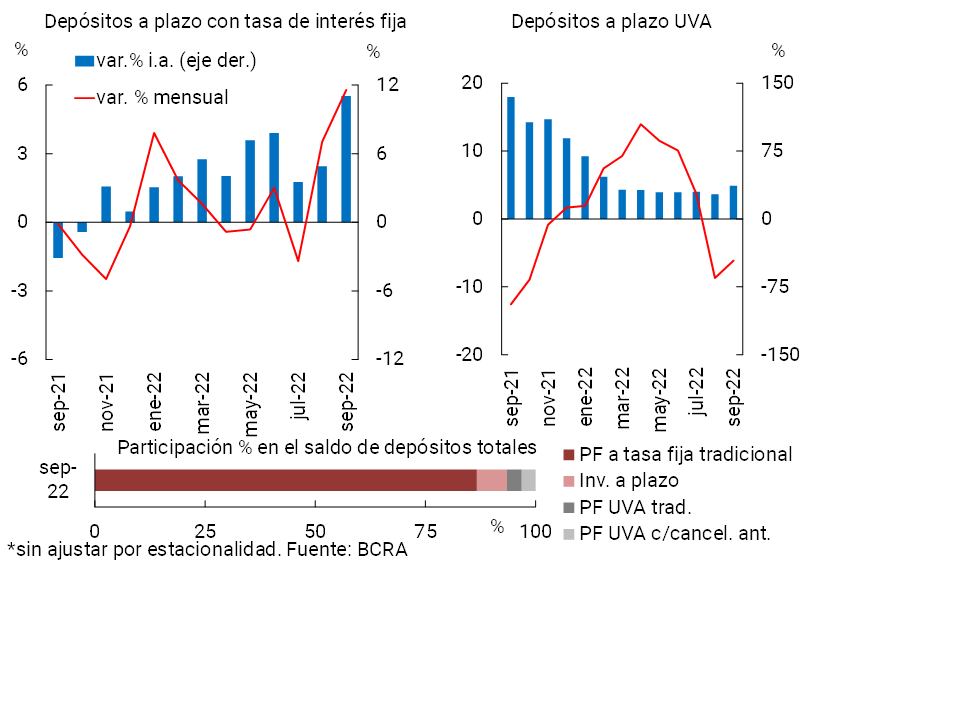
Within the framework of the process of normalization of the structure of interest rates, so far this year the BCRA has been calibrating the remuneration of savings in national currency in the financial system. In this context, in September traditional time deposits (at a fixed interest rate) increased 5.8% in real terms compared to August (+12.3% nominal) and 11% in real terms in year-on-year terms (+103.2% nominal y.o.y.) (see Chart 4). For its part, in the period the balance of deposits denominated in UVA decreased by 6.1% in real terms (-0.3% nominal), although they continued to show an increase in a year-on-year comparison (36.5% real y.o.y. or +149.9% y.o.y. nominal).
Figure 4 | Balance of fixed-term deposits of the private sector in pesos
In real terms* – Financial system
On the foreign currency side, in September the balance of private sector deposits in this denomination increased 2.6% in currency of origin, mainly explained by the performance of demand accounts. The balance of total private sector deposits (in domestic and foreign currency) increased by 3.1% in real terms compared to the previous month (+9.5% nominal), falling by 3.9% in real terms in year-on-year terms (+75.8% nominal YoY).
The balance of deposits in pesos of the private sector accumulated a slight increase in a year-on-year comparison to September (+1.1% real y.o.y. or +84.9% nominal y.o.y.), mainly due to the aforementioned performance of term placements. Deposits in pesos of the public sector increased 3.6% real y.o.y. (+89.6% y.o.y. nominal). As a result, as of September, the balance of total deposits in national currency considering all sectors grew 2.2% YoY in real terms (+87% YoY nominal). In this context, the balance of total deposits (currencies and sectors) fell by 2.7% YoY in real terms (+78% YoY in nominal terms) in the period.
II. Evolution and aggregate composition of the balance sheet
In September, the sector’s assets increased by 3.4% in real terms (+9.8% nominal), reflecting the increase in the balance of deposits in pesos (see previous section). The monthly performance was generalized among the groups of banking financial institutions. In a year-on-year comparison, total assets decreased by 1.4% (+80.3% nominal).
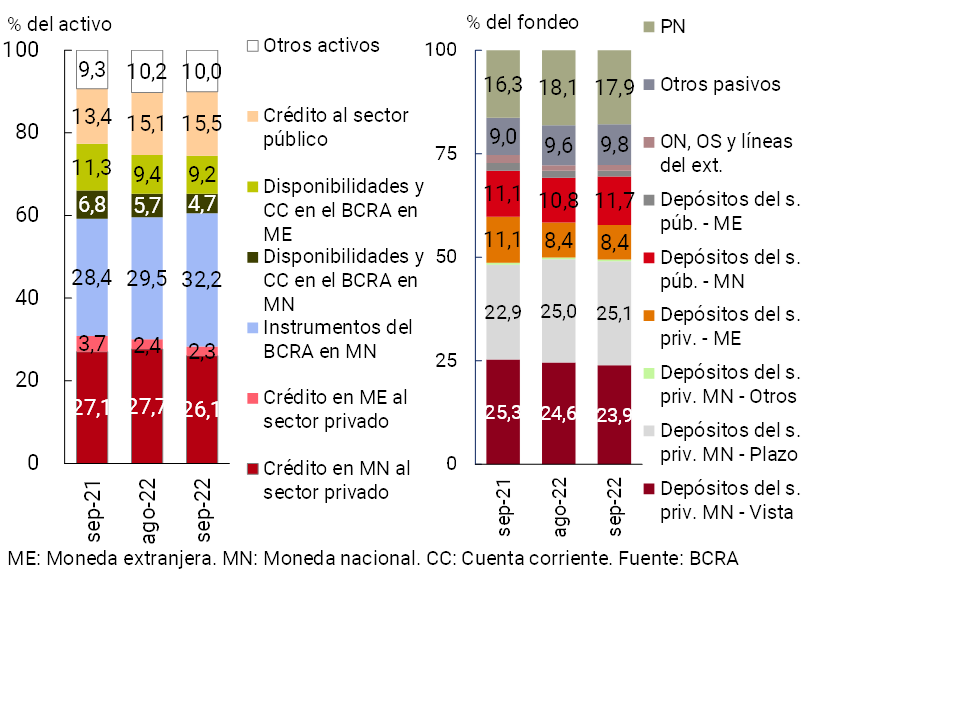
In terms of the composition of the total assets of the group of entities, in September the weighting of the balance of the BCRA’s instruments and credit to the public sectorincreased 7. On the other hand, credit to the private sector in pesos and current accounts in the same denomination that entities have in the BCRA were the main items that reduced their relative weight in the month (see Graph 5). In relation to the components of the total funding of the sector aggregate, in the month the weighting of deposits in pesos of the public sector increased, while the demand accounts in pesos of the private sector and net worth reduced their relative importance.
Graph 5 | Composition of assets and total funding
Financial system – Share %
In September, the estimated spread between assets and liabilities in foreign currency stood at 25.1% of regulatory capital at the systemic level (+0.1 p.p. monthly and +15.1 p.p. y.o.y.)8. For its part, in the month the estimated positive differential between assets and liabilities with capital adjustment by CER (or in UVA) totaled 57.6% of the PRC at the aggregate level (+3.7 p.p. monthly and -1.1 p.p. y.o.y.).
III. Portfolio quality
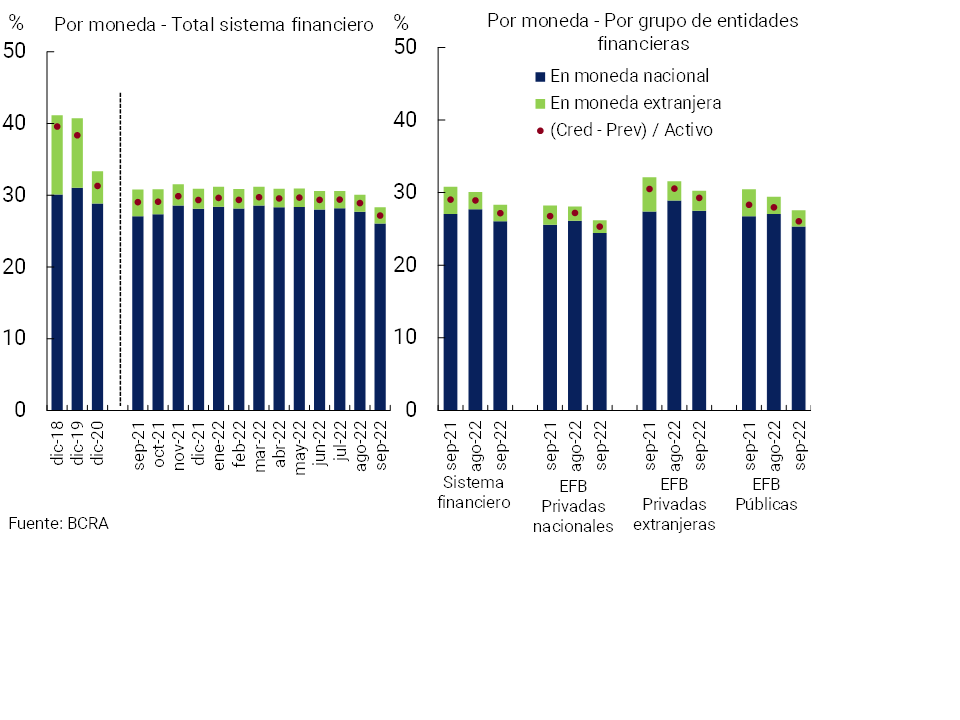
In September, the gross exposure of the financial system to the private sector (including domestic and foreign currency) fell by 1.8 p.p. of assets to 28.3% (-2.5 p.p. y.o.y.), in a context of a significant increase in assets9. This dynamic was generalized among the different homogeneous groups of banking financial institutions (see Graph 6). Regarding financing in pesos, this ratio stood at 26.1% in the period (-1.6 p.p. monthly and +1 p.p. y.o.y.), while the weighting of credit to the private sector in foreign currency in the total assets of the financial system stood at 2.3% (-0.1 p.p. monthly and -1.5 p.p. y.o.y.). The balance of credit to the private sector net of forecasts of the aggregate of entities represented 27.2% of assets in the month, 1.8 p.p. and 1.9 p.p. below the record of the previous month and the same period of 2021, respectively.
Graph 6 | Private Sector Credit Balance / Assets
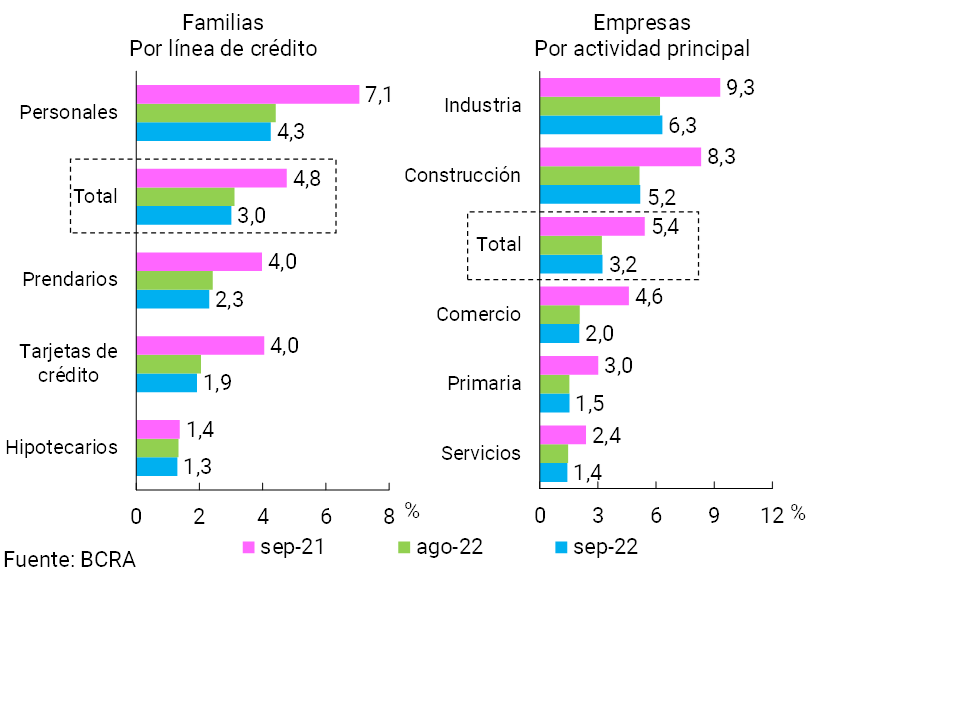
In September, the irregularity ratio of credit to the private sector of the financial system remained at 3.1%, with no significant changes compared to the previous month (see Chart 7). When distinguishing by credit segment, the non-performing loan indicator for households (personal loans and credit cards, see Chart 8) fell slightly during the month, while the quality of the corporate portfolio remained unchanged (performance disseminated among all economic sectors, see Chart 8). In year-on-year terms, the private sector NPL indicator fell by 1.9 p.p. at the systemic level (-1.8 p.p. in the family segment and -2.1 p.p. in the business segment).
Figure 7 | Irregularity ratio of credit to the private sector
By entity group and by debtor
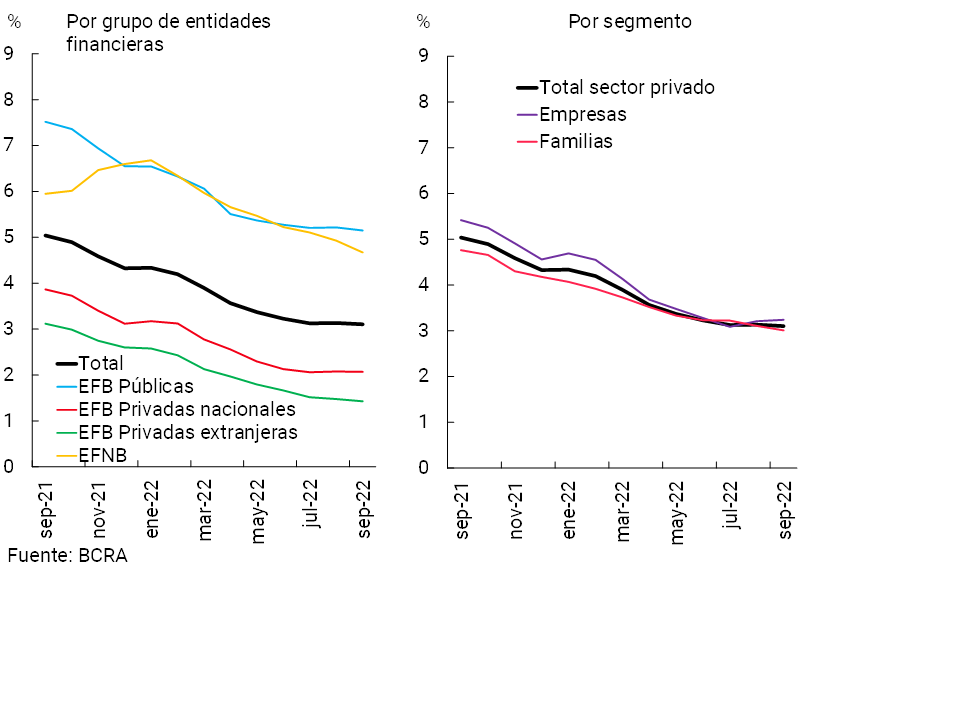
Chart 8: Private sector credit irregularity ratio
Per debtor
In the month, the forecast for the sector increased, reaching 4% of the total portfolio of the private sector (+0.2 p.p. monthly and -2 p.p. y.o.y.) and 128.8% of that in an irregular situation (+9.1 p.p. monthly and +18.1 p.p. y.o.y)10. In the period, the net forecasts of those that regulatorily correspond to the portfolio in situation 1 and 2 (following the criteria of the minimum regulatory forecasts for uncollectibility risk) were around 97% of the non-performing portfolio at the systemic level.
IV. Liquidity and solvency
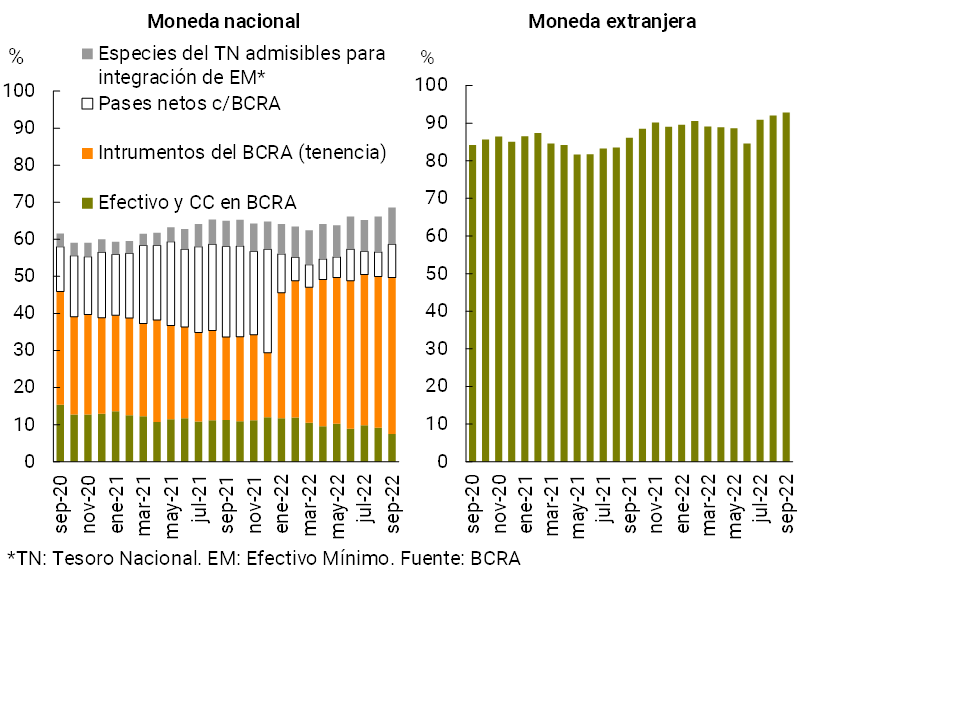
At the end of the third quarter, the sector’s liquidity indicators remained at historically high levels. As of September, broad liquid assets totaled 72.3% of deposits in the financial system, 2.5 p.p. more than in August (see Chart 9). The monthly increase in liquidity was reflected both in the segment in pesos (2.5 p.p. of deposits to 68.6%) and in foreign currency (3.7 p.p. of deposits to 95.7%). Regarding the composition of the liquidity of the financial system for items in national currency, between the end of the month the weighting of net passes with the BCRA and the holding of instruments of this Institution grew. In year-on-year terms, the broad liquidity ratio of all institutions increased by 3.5 p.p. of total deposits (+3.6 p.p. y.o.y. for the segment in local currency and +9.6 p.p. y.o.y. for items in foreign currency).
Graph 9 | Liquidity of the financial system
In relation to the solvency of the sector, in September the observed levels of the main monitored indicators increased (see Chart 10). The capital integration of the financial system – mostly composed of Common Equity Tier 1 capital – stood at 28.7% of risk-weighted assets (RWA) in the month, 0.8 p.p. more than in August and 2.3 p.p. higher in a year-on-year comparison. The capital position of the financial system (regulatory capital net of the minimum regulatory requirement) totalled 258% of the regulatory requirement in the period (+10.6 p.p. monthly and +33 p.p. y.o.y.) and 39.6% of the balance of credit to the private sector net of forecasts (+1.8 p.p. monthly and 6.3 p.p. y.o.y.).
Graph 10 | | Solvency indicators of the financial system
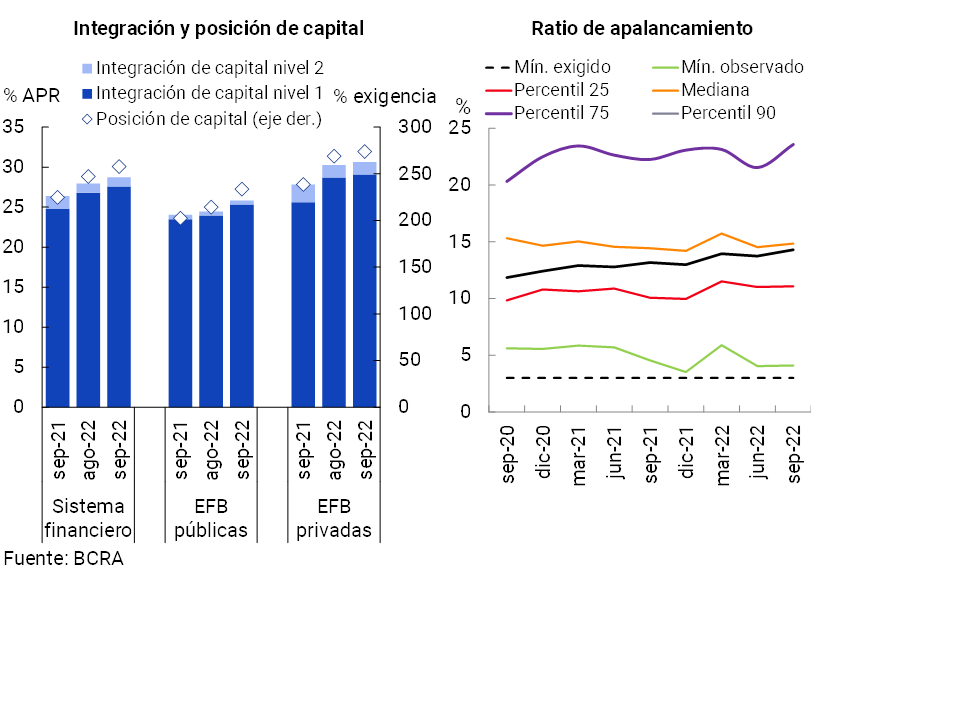
In the same vein, as of September, the leverage ratio – defined according to the guidelines recommended by the Basel Committee11 – reached 14.3% for the aggregate of entities, 0.6 p.p. more than in the middle of this year and 1.1 p.p. above the record for the same month in 2021. The level mentioned for this indicator is significantly above the value required in local regulations (see Graph 10).
Regarding the profitability of the sector, in the accumulated 9 months of 2022, the entities as a whole accrued gains in homogeneous currency equivalent to 1.5% of assets (ROA) and 9% of equity (ROE). These values were higher than those of the same period in 2021, although lower than those of that part of 2020 (see Graph 11).
Figure 11 | Comprehensive total profit in homogeneous currency of the financial system
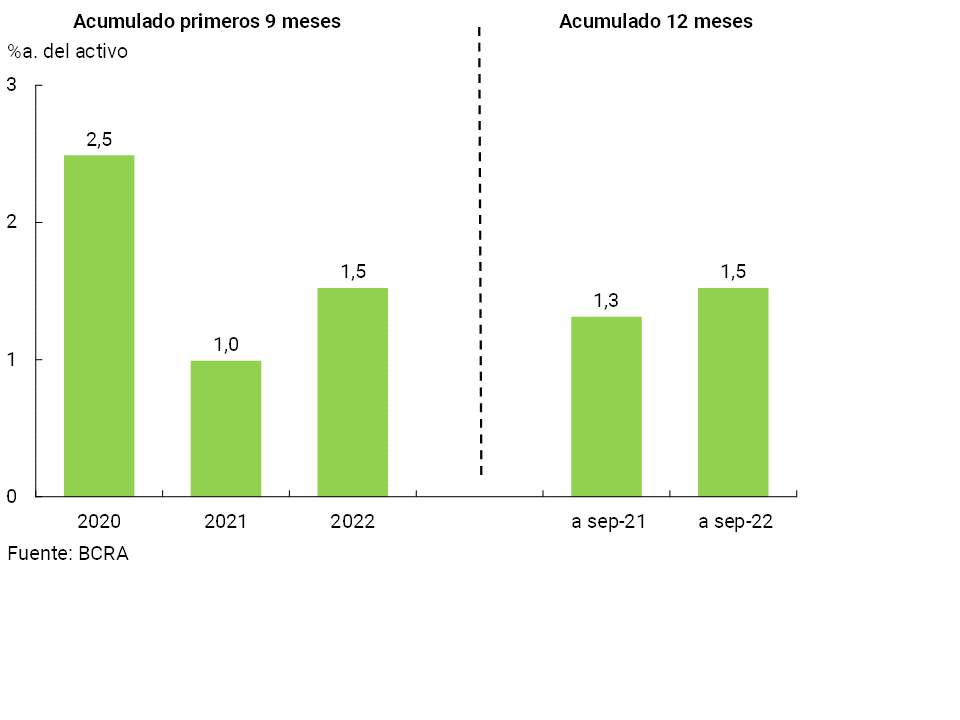
When considering the accumulated of the last 12 months to September, the ROA of the financial system reached 1.5% and ROE 9.1%, 0.2 p.p. and 0.7 p.p. more than in the same period a year ago (see Chart 11). In the year-on-year comparison, there were higher results for securities, which were partially offset by increases in interest paid expenses and losses due to exposure to monetary items.
V. Payment system
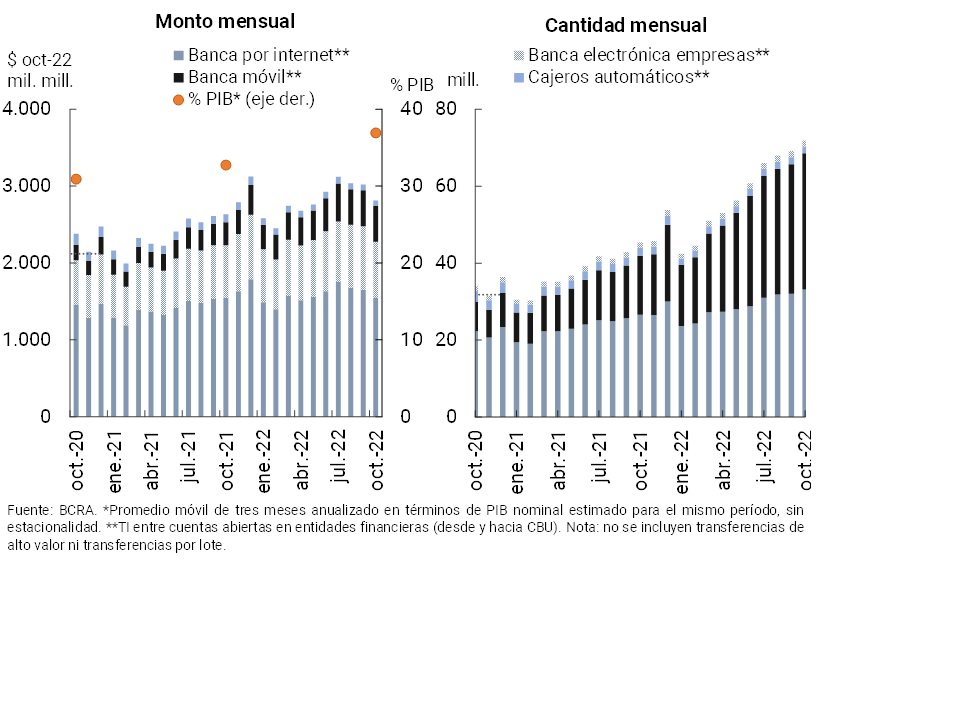
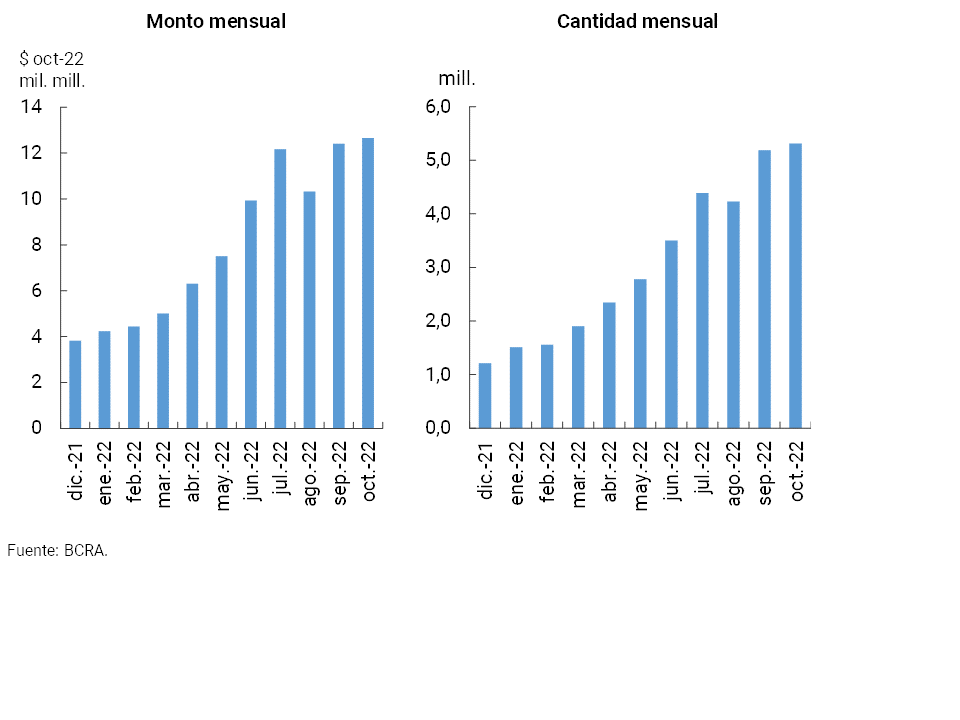
In October, immediate transfers (TI) between accounts opened in financial institutions via CBU12 increased compared to the previous month in amounts (+4%) and decreased in real amounts (-6.9%, see Chart 12). In year-on-year terms, these operations expanded 58.3% in quantities and 6.8% in real terms in amounts, highlighting the performance of transactions through Mobile Banking. Thus, Mobile Banking operations increased their relative share of total IT among CBUs to 49.4% in quantities (+15.6 p.p. y.o.y.) and 16.6% in amounts (+5.1 p.p. y.o.y.). It is estimated that as of October, IT among CBUs came to represent 36.9% of GDP13 (+4.2 p.p. compared to the same month of the previous year). During October, the average value of total IT between CBU reached $39,126.
Figure 12 | Immediate transfers between CBU (IT)
In October, transfer payments (PCT) initiated through interoperable QR codes increased compared to the previous month, both in amounts and in real amounts (+2.4% and +2% respectively, see Chart 13). During October, the average value of PCTs with interoperable QR was $2,38114.
Figure 13 | Payments with transfer (PCT) through interoperable QR codes
In September (latest available information) debit card transactions decreased compared to the previous month: 0.8% in amounts and 3.9% in real amounts, partly due to seasonal reasons. However, in year-on-year terms, debit card purchases grew (+21.6% in amounts and +5.2% in real terms). This year-on-year performance is associated with the increase in face-to-face operations, which increased their relative participation since the beginning of the year, accompanying the greater opening of the economy after the pandemic. It is estimated that the amount of debit card transactions in the last three months (annualized) represented 8.3% of GDP (0.5 p.p. more than in the same month of the previous year). During September, the average value of debit card transactions was $3,394.
In October, the clearing of checks decreased compared to the previous month, both in amounts (1.1%) and in real amounts (5.7%). However, compensation increased in year-on-year terms (+2.7% and 4.2%, respectively). This behavior was explained entirely by the performance of ECHEQs. In this way, operations through ECHEQs continued to increase their participation in the total clearing of documents to represent 32.3% in October in quantities (+11 p.p. y.o.y.) and 57.9% in amounts (+12.1 p.p. y.o.y.). It is estimated that the amount of checks cleared in the last three months (annualized) was equivalent to 26.9% of GDP (+1.5 p.p. y.o.y.). During October, the average value of physical and electronic check clearing operations was $258,150 and $743,000, respectively.
Finally, during October, the ratio of rejection of checks due to lack of funds in terms of the total compensated remained at moderate levels (0.75% in amounts and 0.59% in amounts), similar to those of the previous month and slightly higher in a year-on-year comparison.
Back to top
References
1 The monthly performance of ample liquidity was mainly explained by the increase in passes and LELIQ. In part, the monthly increase in these instruments reflected the BCRA’s sterilization needs in the face of the expansion of liquidity generated within the framework of the “Export Increase Program”, which allowed the liquidation of soybean exports at an exceptional and transitory exchange rate of $200 per dollar. For more detail, see “Monthly Monetary Report” for September 2022.
2 In addition, it should be mentioned that deposits with variable remuneration increased during the period according to the evolution of the exchange rate. These deposits (both demand and time) are available to the agricultural sector as long as foreign exchange settlements are made. In return for the increase in these deposits, in September the entities subscribed the BCRA’s Internal Bills in dollars and settleable in pesos for the Reference Exchange Rate (LEDIV) at a zero rate, an instrument designed to cover such positions. See Communication “A” “7557”.
3 Includes principal adjustments and accrued interest.
5 For more details see “Press Release” of 1/11/22.
6 Expressed in currency of origin.
7 For more details on the evolution of the BCRA’s instruments, see footnote 1.
8 Includes forward purchase and sale of foreign currency classified off-balance sheet. Liabilities include deposits in the agricultural sector that have variable remuneration depending on the evolution of the exchange rate.
9 For more details on the evolution of assets, see sections 1 and 2.
10 The increase in forecasting was mainly explained by the segment denominated in foreign currency.
11 The Basel coefficient is defined as the ratio between the highest quality regulatory capital and a broad measure of exposures.
12 Given the availability of information at the time of preparation of this Report, IT operations that include the participation of CVUs are not considered.
13 When considering annualized amounts of the last three months.
11 For more details see “Retail Payments Report – September 2022”.
Share on


