I. Financial intermediation activity
The intermediation activity of all financial institutions with the private sector fell slightly in July. Taking into account the main variations in the balance of the aggregate of the financial system for items in pesos—in homogeneous currency—,1 the balance of financing from the private and public sectors decreased during the month. On the other hand, there was a fall in the balance of public sector deposits and an increase in liquidity in the broad sense. On the other hand, considering the items in foreign currency – expressed in the currency of origin – in the period the balance of credit to the private sector was reduced and deposits in that sector increased. These changes were mainly offset by an increase in liquid assets in that denomination.
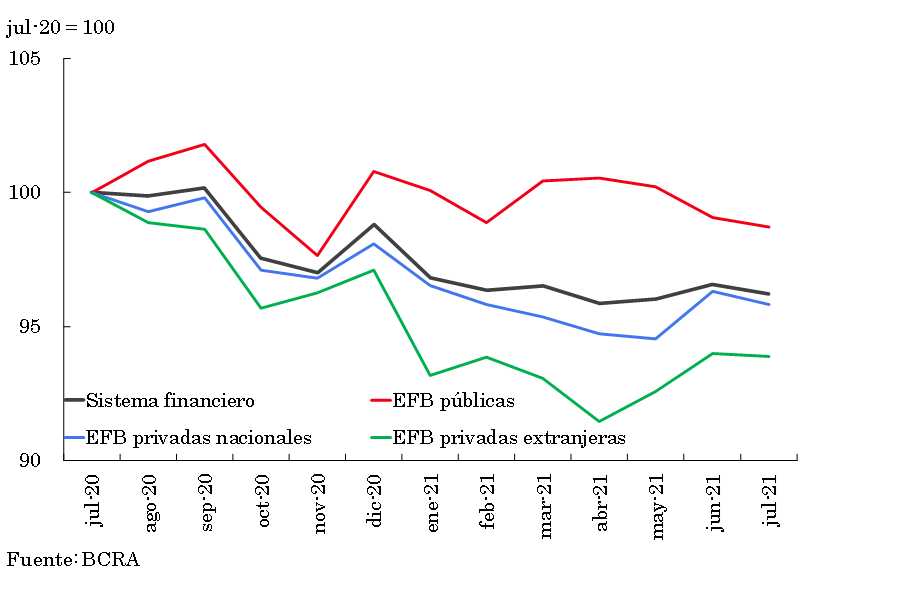
The balance of financing to the private sector in national currency fell by 0.7% in real terms in July (+2.3% nominal),2 with heterogeneous performances both in credit lines and in the different groups of financial institutions (see Chart 1). In year-on-year terms, the balance of credit in pesos to the private sector accumulated a 9.4% real fall (+37.5% nominal), driven mainly by private financial institutions. 3
Graph 1 | Credit balance to the private sector in pesos
In real terms*
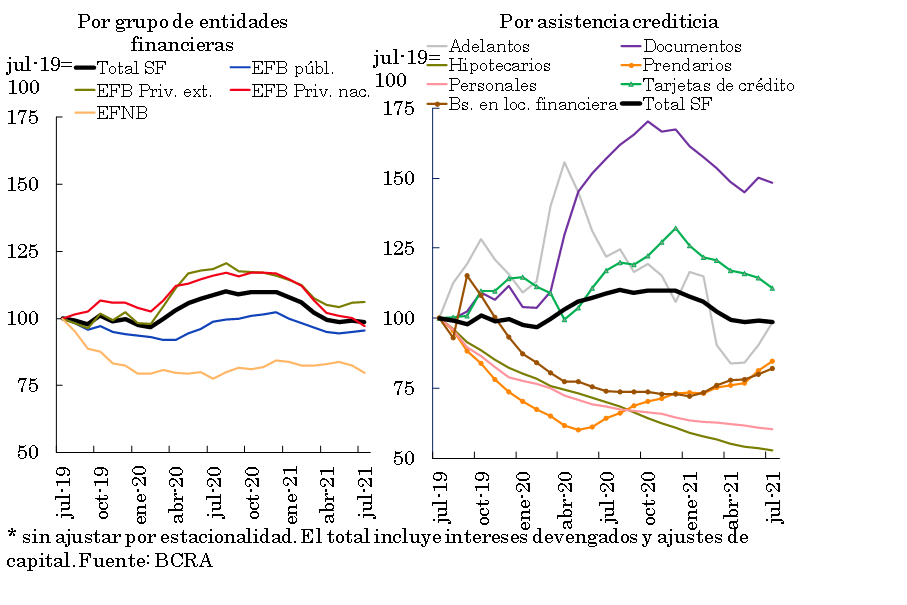
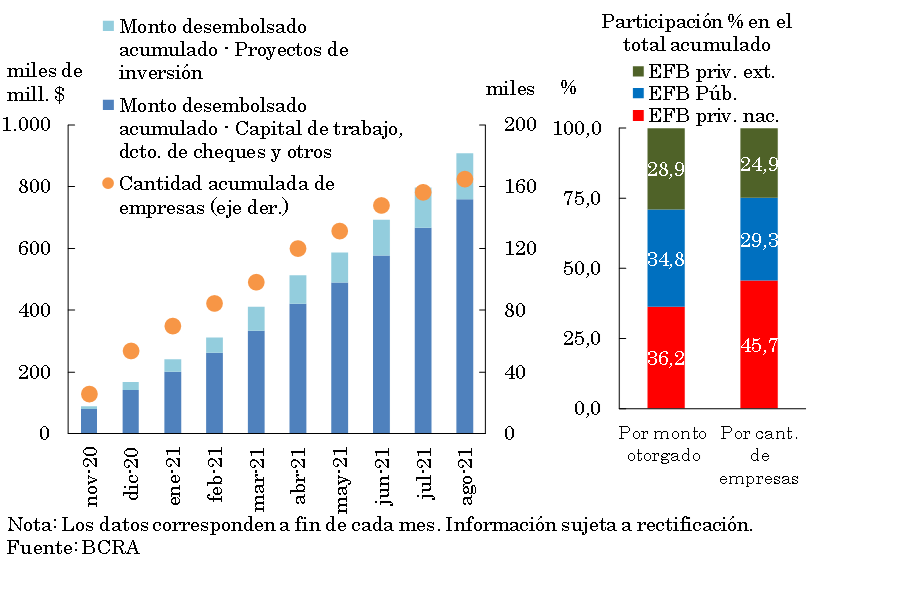
The Financing Line for Productive Investment (LFIP) for MSMEs4 continued to be one of the most widely used tools in the business segment, helping to temper the aforementioned dynamics of credit. Thus, from its launch (in October 2020) to August 2021 (latest available information) more than 165,000 companies accessed the LFIP, totaling disbursements of $908,751 million (See Graph 2). Domestic private financial institutions are the main drivers of this line (accounting for 36.2% of the total disbursed and 45.7% of the total number of companies benefited), followed by public entities (with 34.8% and 29.3% respectively) and by foreign private entities (with 28.9% and 24.9%). In general, it is observed that financial institutions have performed adequately within the framework of the scheme implemented for this line of credit promoted by the BCRA.
Graph 2 | Financing Line for Productive Investment (LFIP) of MSMEs
At the same time, within the framework of the line of financing at subsidized interest rates for companies registered in the “Emergency Assistance Program for Work and Production” (ATP),5 until the end of August, more than 20,900 loans have been granted for a total of $14,266 million.
With the aim of continuing to underpin the economic recovery process for Monotributistas and Self-Employed people, the “Zero Rate Credit 2021” Program was launched in August. The sum of money for each loan can reach up to $150,000. The total financial cost of these loans is fully subsidized, and they have a 6-month grace period for repayment (at the end of this period, their repayment will be made in at least 12 interest-free installments). 6 The financial institutions that grant these loans may reduce a part of their minimum cash requirement in pesos. It should be noted that through the Zero-Rate Loans7 implemented in 2020, approximately $66,510 million were granted (to which more than an additional $300 million are added, when considering the Zero-Rate Credits line Cultura). 8
In July, the balance of credit in foreign currency to the private sector decreased by 4.2% – in foreign currency – compared to the previous month. In this context, the balance of total loans (in domestic and foreign currency) to the private sector fell 1.5% in July (+1.5% nominal), accumulating a year-on-year fall of 12.4% in real terms.
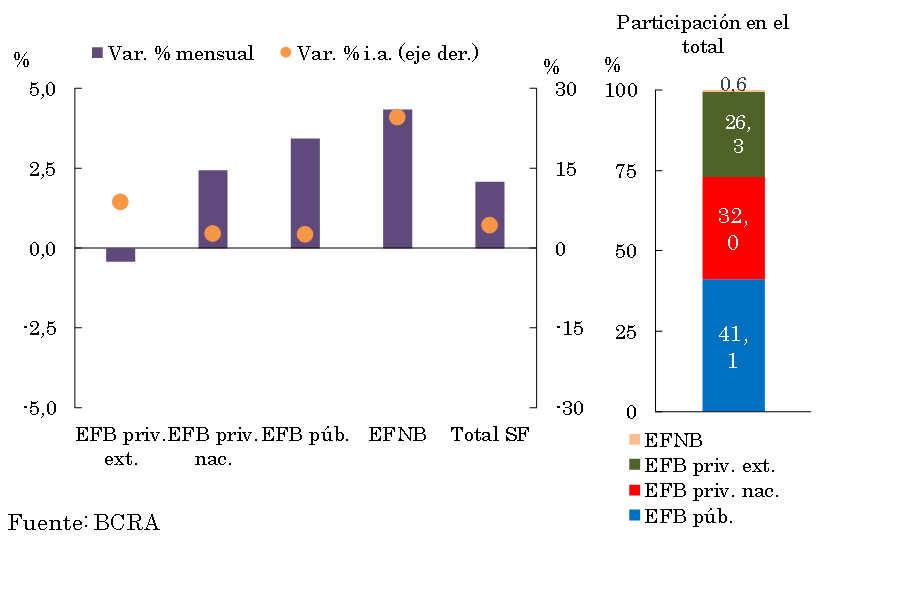
When considering the funding of the financial system aggregate, in July the balance of deposits in national currency of the private sector remained unchanged from last month (-0.1% real or +2.9% nominal) (see Chart 3). Demand accounts fell by 1.8% in real terms (+1.2% nominal), with a similar variation by group of banks and mainly explained by the performance of individuals. Meanwhile, in July, time deposits increased 2.1% in real terms (+5.1% nominal) compared to the previous month. The monthly performance showed greater relative dynamism in non-bank financial institutions and in public financial institutions (see Graph 4) and was reflected in both individuals and legal entities. Within fixed-term deposits, those in UVA increased 3.3% in real terms compared to June (5.1% in real terms for those with early cancellation and 2.4% in real terms for traditional deposits).
Graph 3 | Balance of private sector deposits in pesos
In real terms*
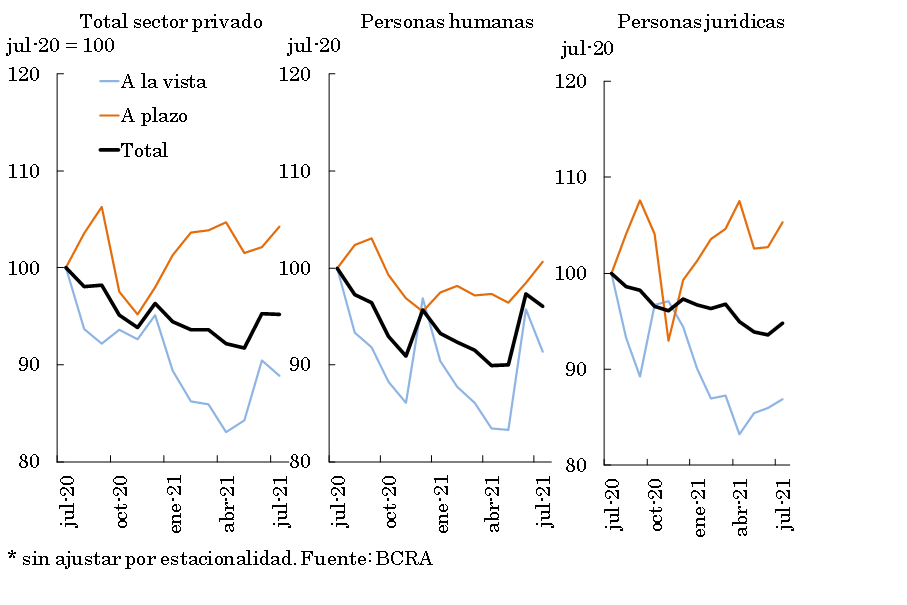
Figure 4 | Balance of private sector time deposits in pesos
– July 2021 – In real terms*
For its part, the balance of deposits in foreign currency of the private sector increased 0.8% – in currency of origin – in July. In this context, in the month the balance of total deposits (in domestic and foreign currency) of the private sector decreased 0.3% in real terms (+2.7% nominal).
In a year-on-year comparison, in July private sector deposits in national currency fell by 4.8% in real terms (+44.5% nominal). Disaggregated by segment, the balance of demand accounts accumulated a fall of 11.2% YoY in real terms (+34.8% YoY nominal), while time deposits increased by 4.2% YoY in real terms (+58.2% YoY nominal). For its part, the balance of public sector deposits in pesos increased 9.3% y.o.y. in real terms (+65.9% y.o.y. nominal). Thus, total deposits in pesos (including both sectors) decreased 2.1% real YoY (+48.7% YoY nominal). Considering both the private and public sectors and all currencies, the real balance accumulated a fall of 4.4% YoY (+45.2% YoY nominal).
II. Aggregate composition of the balance sheet
In July, the total assets of all financial institutions fell by 0.4% compared to the previous month, with a generalized fall among groups of financial institutions (see Chart 5). In year-on-year terms, the total assets of the financial system accumulated a decrease of 3.8% in real terms.
Graph 5 | Total Asset Balance
In real terms*
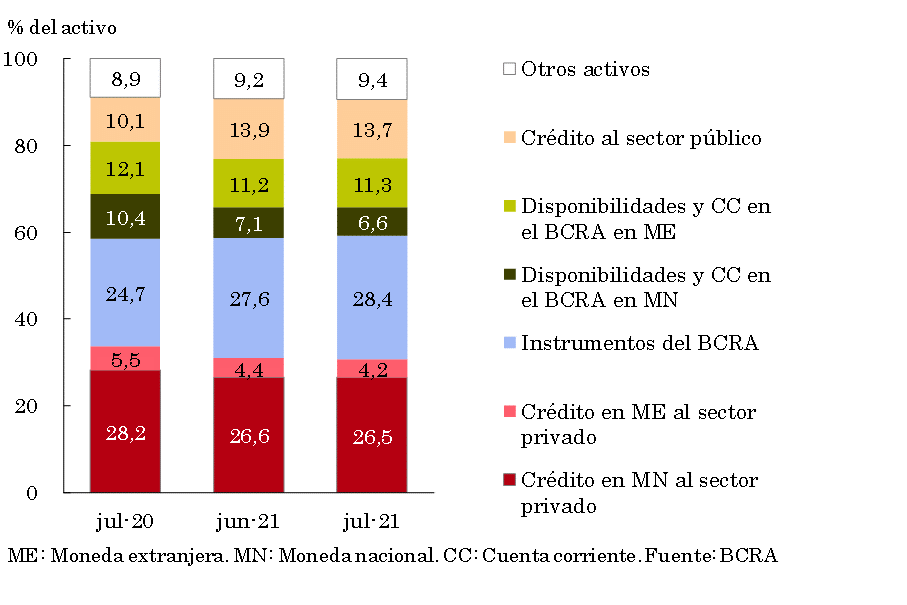
With respect to the components of the sector’s total assets, in July the holdings of BCRA instruments gained weighting (see Chart 6). On the other hand, the items that decreased the most relative importance within assets with respect to June were liquid resources in pesos deposited in current accounts with the BCRA, credit in foreign currency to the private sector and financing to the public sector.
Graph 6 | Composition of total assets
Financial system – Share %
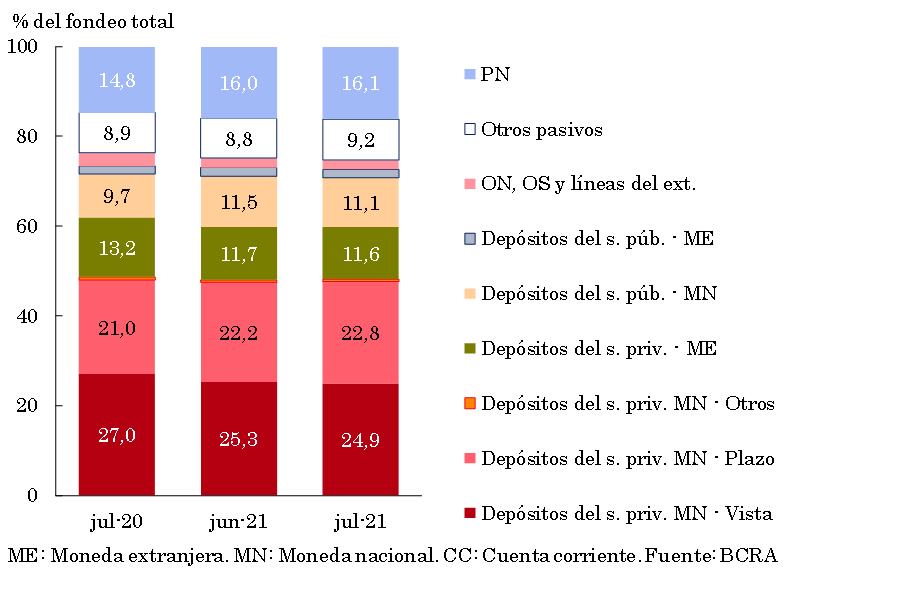
With regard to the composition of bank funding, in July the most notable movements at the systemic level were, on the one hand, the increase in the share of time deposits in national currency of the private sector, and on the other, the fall in the relative importance of demand accounts in pesos of this sector and of deposits in national currency of the public sector (see Chart 7).
Figure 7 | Total system funding composition
In % of total funding (liabilities + equity)
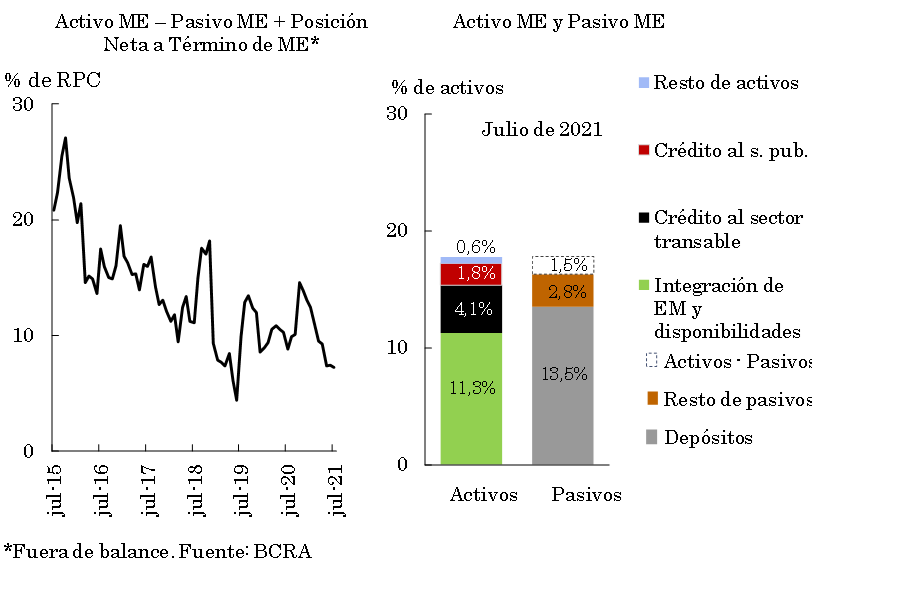
The foreign currency assets of all financial institutions accounted for 17.8% of total assets in July, decreasing 0.2 p.p. compared to June and 2 p.p. compared to the level of a year ago. Liabilities in the same denomination registered a similar performance (-0.2 p.p. monthly and -2.3 p.p. bv.), weighting 16.3% of total funding (liabilities and equity) in the period (see Chart 8). Also considering the forward purchase and sale of foreign currency – classified off-balance sheet – the spread between assets and liabilities in this denomination of the aggregate financial system represented 7.2% of regulatory capital in July, reducing both in monthly and year-on-year terms (-0.2 p.p. and -1.6 p.p. respectively).
Figure 8 | Foreign currency (ME) items on the balance sheet of the financial system
III. Portfolio quality
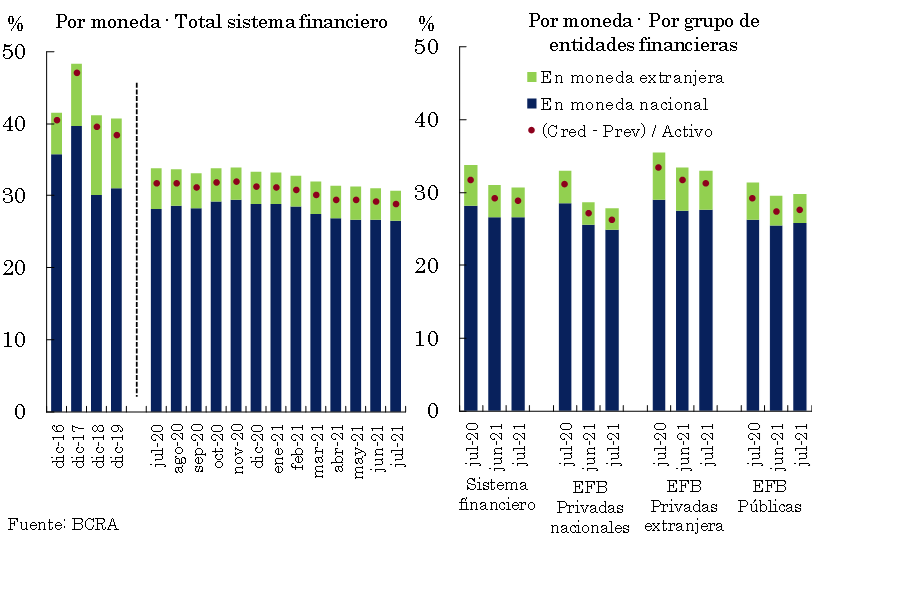
The gross exposure of the financial system to the private sector (including domestic and foreign currency) stood at 30.7% of total assets in July9, 0.4 p.p. less than the value recorded in the previous month (-3 p.p. y.o.y.). This ratio presented a heterogeneous monthly performance among the different groups of financial institutions, increasing in the case of public institutions and decreasing in private and non-bank institutions. The level of exposure to the private sector stood at 26.5% when considering only financing in pesos, slightly below the previous month (-1.6 p.p. y.o.y.) (see Graph 9). The share of credit to the private sector in foreign currency in total assets fell 0.3 p.p. in the month to 4.2%, remaining 1.4 p.p. below the July 2020 record.
Figure 9 |
To date, a financial relief measure remains in force for employers covered by the REPRO II program, which gives them the possibility of transferring to the end of the life of the credit the unpaid installments of the assistance taken. In this context, the non-performing ratio of credit to the private sector for the aggregate financial system amounted to 5.4% in July, 0.6 p.p. above the previous month’s figure (+0.4 p.p. y.o.y.), a generalized performance among the different groups of entities (see Chart 10). The dynamics of the irregularity ratio observed in recent months occur in a context in which the effects of the extraordinary measures taken in the context of the pandemic (temporary modification of classification parameters10 and the rest of the financial relief measures) on the credit situation of debtors are gradually losing weight.
Figure 10 | Irregularity of credit to the private sector
Irregular financing / Total financing (%)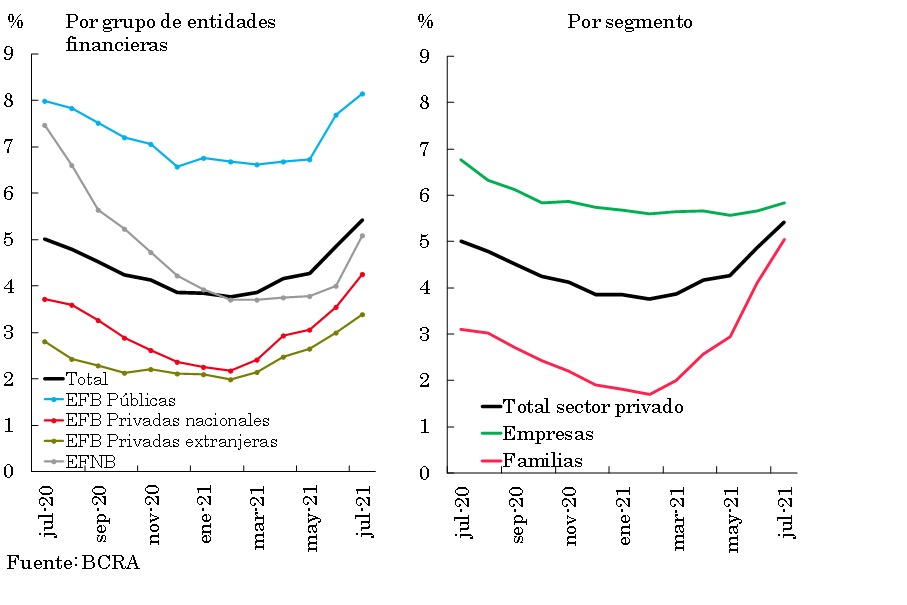
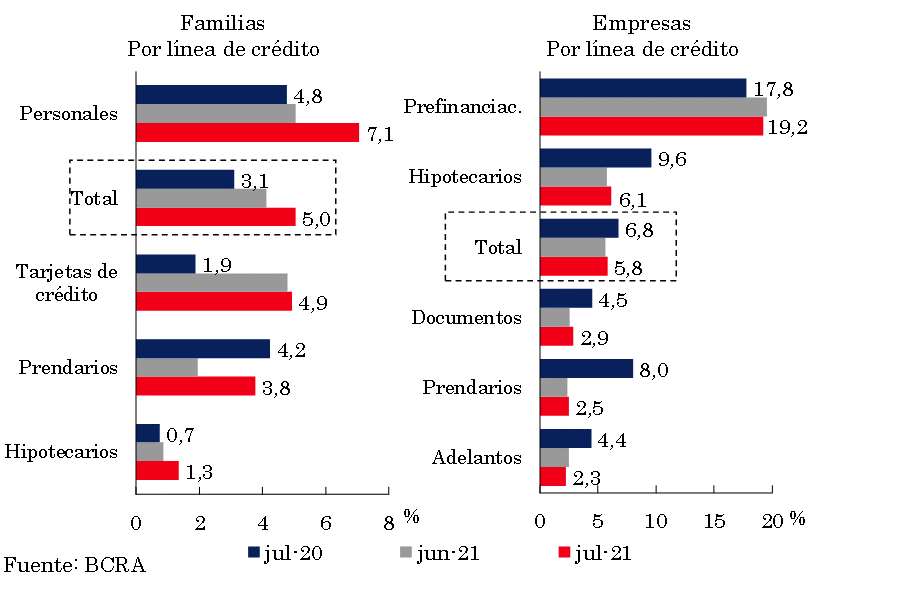
The irregularity of financing to households stood at 5% of this portfolio in July (see Graph 11), 0.9 p.p. above the level of the previous month (+1.9 p.p. y.o.y.). The monthly performance was mainly driven by personal loans and loans with real collateral. In turn, the non-performing loan indicator for companies stood at 5.8% in the period, 0.2 p.p. above the June figure (-0.9 p.p. y.o.y.).
Figure 11 | Irregularity of credit to the private sector
Irregular financing / Total financing (%)
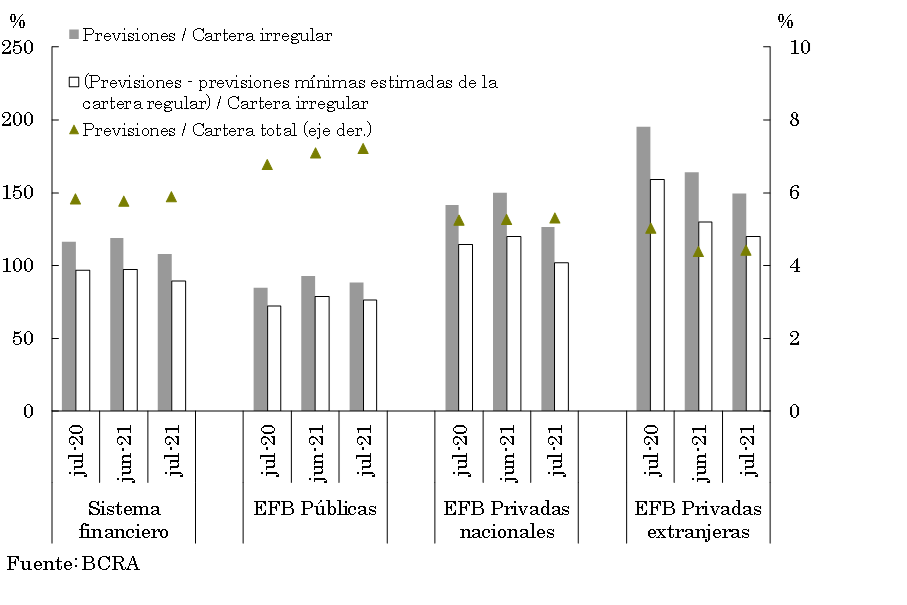
At the aggregate level, the forecasts represented 5.8% of total credit to the private sector in July, 0.2 p.p. above the previous month and in line with the July 2020 figure (see Chart 12). The total forecasts in terms of the irregular portfolio stood at 107.7% in the month (-11.5 p.p. monthly and -8.7 p.p. y.o.y.). On the other hand, the balance of regulatory forecasts attributable to the non-performing portfolio (following the criteria of the minimum regulatory forecasts for uncollectibility risk) represented 89.2% of this portfolio for the aggregate of entities in July.
Figure 12 | Credit to the private sector and forecasts
By Entity Group
IV. Liquidity and solvency
The liquidity indicators of the financial system increased in July. In the month, the broad liquidity ratio11reached 67.6% of deposits (64.1% for the segment in pesos and 83.2% for items in foreign currency, see Chart 13), 1.3 p.p. above the level recorded in June (+1.3 p.p. considering items in pesos and +1.5 p.p. for the segment in foreign currency). In terms of the components of ample liquidity, between the end of the month the weighting of net passes with the BCRA and of national public securities eligible for integration of minimumcash 12 increased, while the relevance of the current accounts that financial institutions have in this Institution and of the LELIQ balances decreased. 13 Compared to July 2020, broad liquid assets increased by 1.3 p.p. of total deposits at the systemic level.
Figure 13 | Liquidity of the financial system
In % of deposits
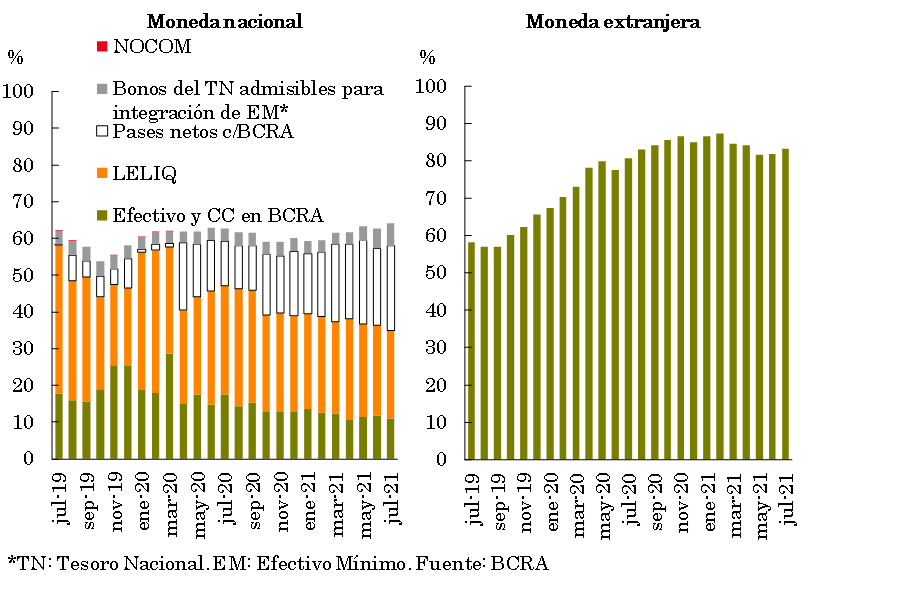
The high levels for liquidity indicators in relation to the average of the last 15 years are due in part to the effect of the sterilization of monetary issuance (through the placement of LELIQ and passes to financial institutions) carried out in 2020 after the issuance of pesos to assist the PEN in the programs that sought to moderate the adverse economic effects of the pandemic context.
In relation to international standards in terms of liquidity, at the beginning of the second half of 2021 the set of entities obliged to verify them continued to comfortably exceed the recommended minimums. In July, the Liquidity Coverage Ratio (LCR)14 amounted to 2.4 (median of the entities obliged to comply with this requirement15, see Chart 14), compared to a minimum required of 1 (in line with Basel standards). For its part, in June (latest available information) the Stable Net Funding Ratio (NSFR)16 totaled 1.9 for entities obliged to comply with this requirement. All entities exceeded the required minimum of 1 (in line with international recommendations). Local records for aggregate liquidity indicators (“LCRs” and “NSFRs”) are above the average for countries in the region (see Figure 15).
Figure 14 | Liquidity Coverage Ratio (LCR)
FALLAC/SENT*
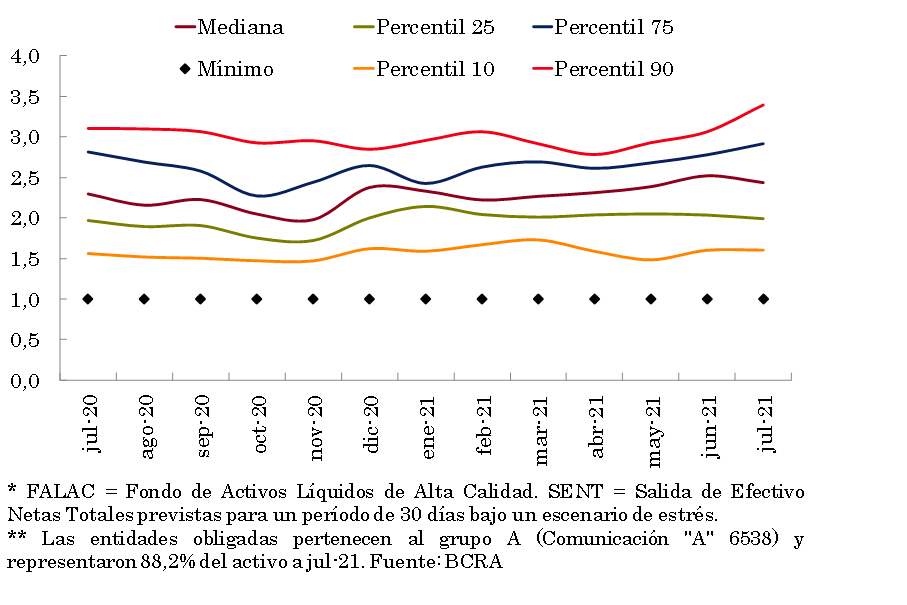
Figure 15 | Basel liquidity indicators
In real terms*
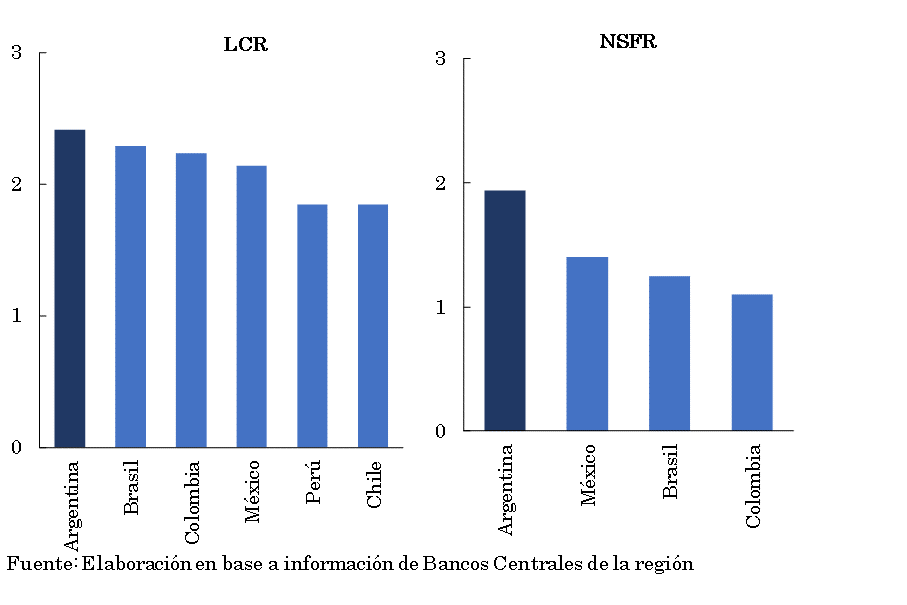
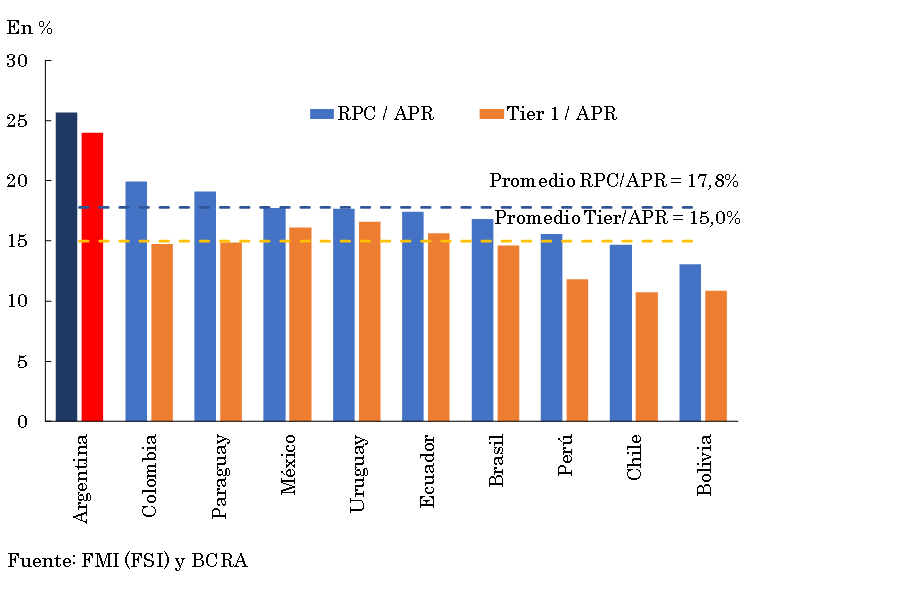
In relation to the solvency of the sector, the integration of regulatory capital (RPC) in terms of risk-weighted assets (RWA) in all groups of financial institutions increased in the month (see Chart 16). At the aggregate level, the PRC increased monthly by 0.2 p.p. of RWA, to 25.7% (+2.6 p.p. y.o.y.). More than 90% of the total capital integration is made up of Tier 1—with the greatest capacity to face eventual losses. In turn, the surplus capital position (PRC net of the minimum regulatory capital requirement in terms of the regulatory requirement) for the financial system as a whole stood at 211% in the month. These levels for aggregate solvency indicators exceed the average for Latin American countries (see Chart 17).
Figure 16 | Integration of regulatory capital
By financial institution group
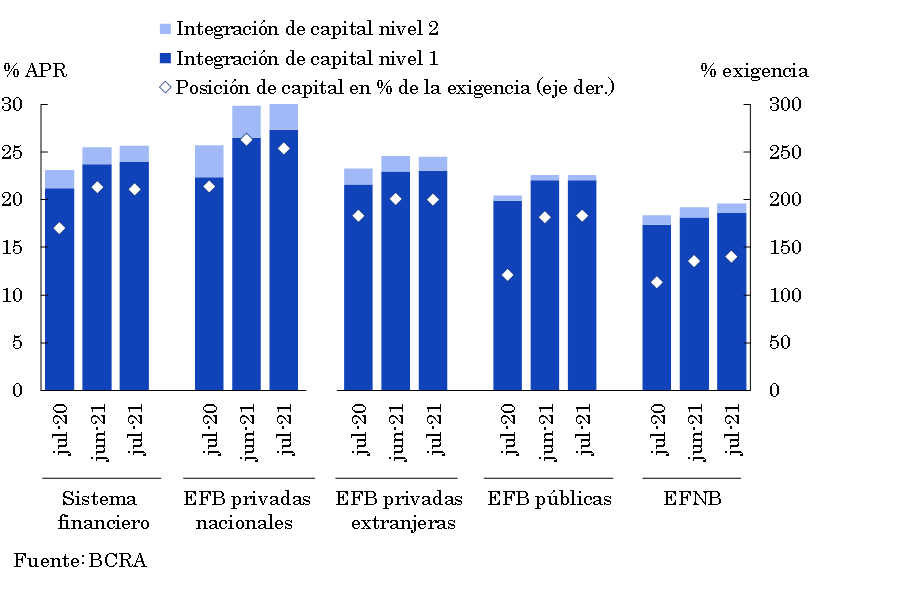
Figure 17 |Integration of regulatory capital
LATAM Comparison – Latest information available
The maintenance of high solvency ratios at the level of the aggregate financial system partly reflects the effect of the macroprudential regulations implemented by the BCRA, which have contemplated the suspension of dividend distributions by institutions in the context of the pandemic.
In addition, in July, at the aggregate level, the ratio between the surplus capital position and credit to the private sector net of forecasts17 stood at 31.9%, 7 p.p. above the record of a year ago (comfortably exceeding the average of the last 10 years —13.7%—).
In July, the financial system accrued a positive comprehensive total result in homogeneous currency, accumulating in the first 7 months of 2021 profits equivalent to 0.8% of assets and 5.1% of net worth (see Chart 18). Although some recomposition was observed in the sector’s profitability indicators at the margin, the cumulative record in 2021 was lower than that evidenced in the same period of 2020 (-2 p.p. and -13.5 p.p. in terms of assets and equity, respectively).
Figure 18 | Comprehensive total profit in homogeneous currency of the financial system
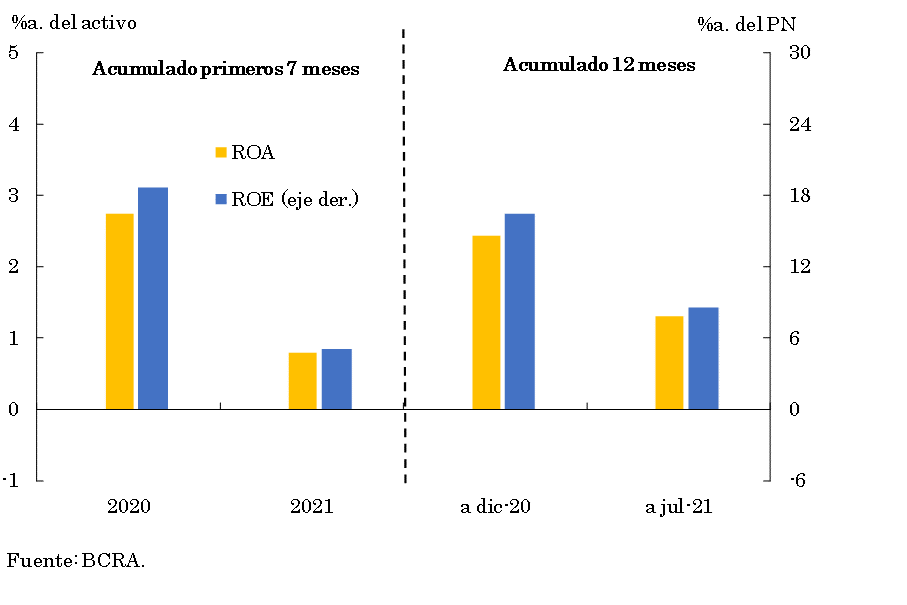
The year-on-year fall in ROA (or ROE) accumulated in 7 months was mainly explained by the effect of greater monetary losses, increase in the cost of funding for deposits in pesos, lower gains on securities18, reduction in interest income in pesos, greater weight of certain tax burdens, among other factors. This dynamic was partially offset by higher income from premiums for passes, lower income tax accruals, lower charges for uncollectibility and reduced administrative expenses, among others.
V. Payment system
So far in 2021, electronic means of payment have grown at a remarkable rate, accompanying the path of growing demand from the population – a process that deepened in the pandemic scenario – as well as the imposition of the measures opportunely implemented by the BCRA.
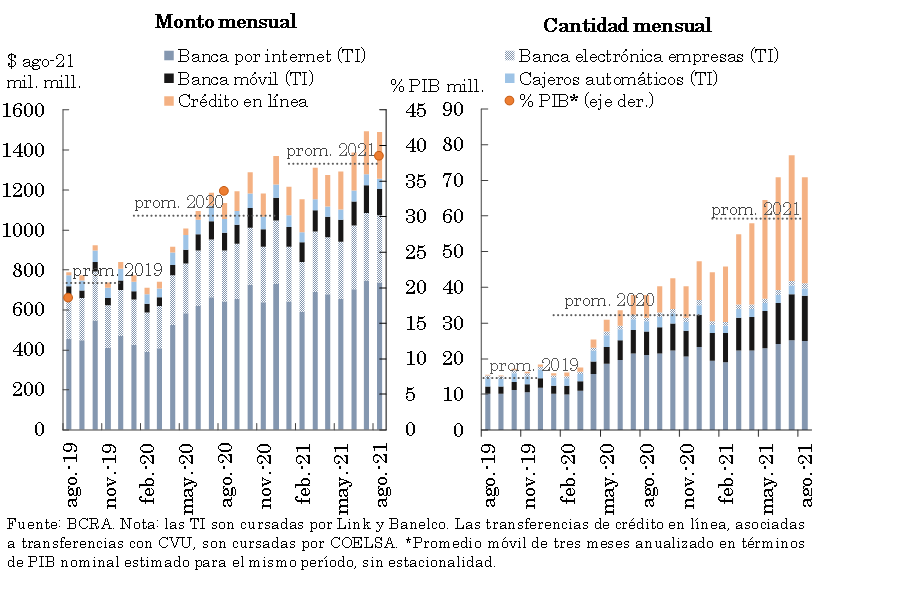
During August, partly due to seasonal reasons, online transfers (aggregate of immediate transfers and online credit) decreased compared to the previous month, both in amounts and in real amounts. In year-on-year terms, the number of online transfers in pesos increased by 86.8% and the amounts expressed in real terms grew by 29.6% (see Chart 19). This year-on-year dynamism was reflected both in online credit operations (365.1% YoY in amounts and 137.2% YoY in real amounts) and in immediate transfers (TI: 30.5% YoY in amounts and 18.9% YoY in real amounts), with the performance of Mobile Banking standing out among the latter (97% YoY in amounts and 51.1% in real amounts). 19
Figure 19 | Online Transfers: Immediate (TI) and Online Credit
In real terms*
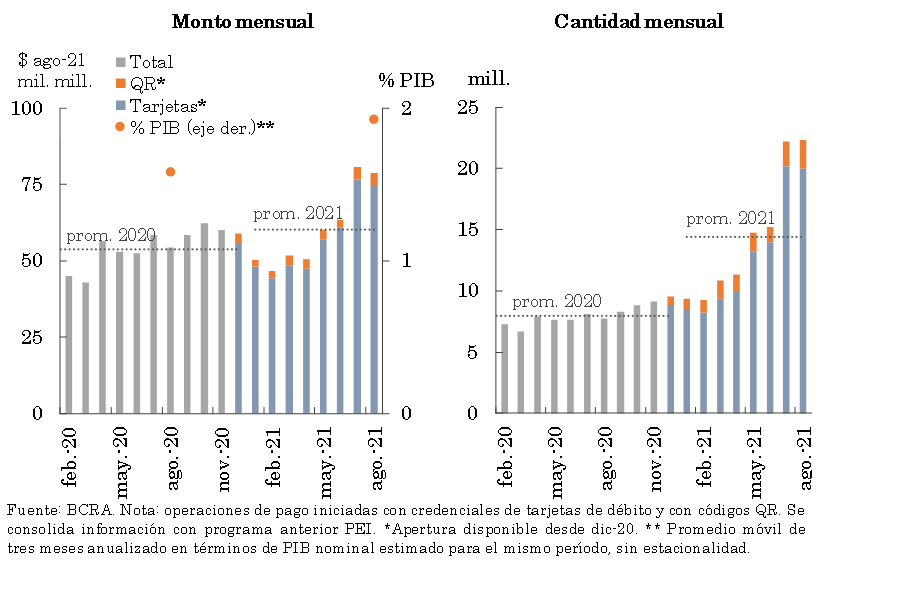
In August, the number of payments withtransfer 20 increased slightly, although the real amounts decreased when compared to July. In the month, payments initiated through QR codes showed a relatively greater dynamism than those made by card, although QR payments still account for a small portion of the total payments with transfers (10.4% in number of operations and 5.5% in amount). 21 Compared to the same month of the previous year, transfer payments (total) increased in amounts (187.4%) and in real amounts (45%, see Graph 20).
Figure 20 | Transfer payments
Initiation methods
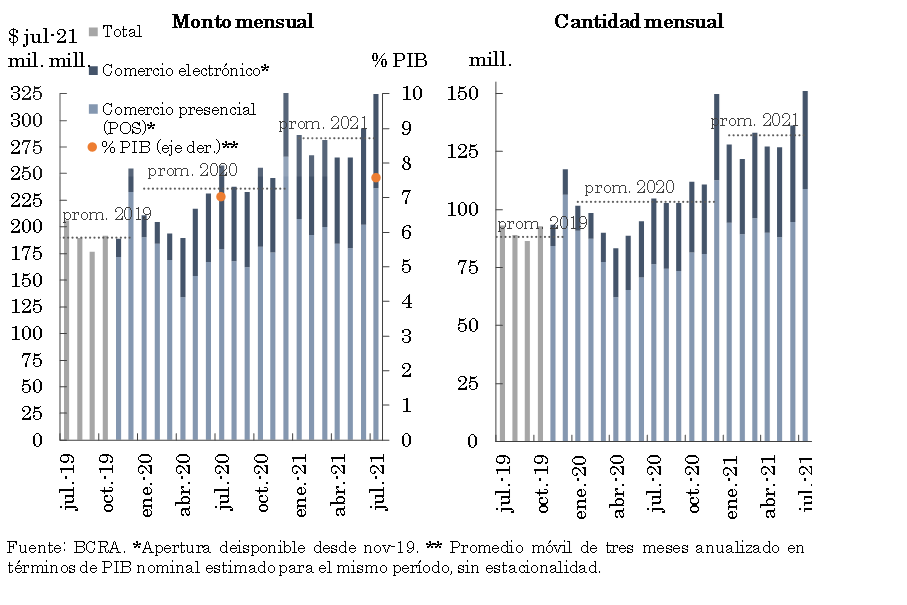
During July (latest available information) debit card operations increased compared to the immediately previous month both in amounts and in real amounts, within the framework of seasonal factors. Those carried out in person showed a better relative performance in the period, partly motivated by the process of reducing restrictions caused by the pandemic scenario (see Graph 21). In a year-on-year comparison, debit card operations grew in amounts (44.2%) and in real amounts (26.2%), a dynamic mainly explained by the electronic format (+48.4% in amounts and +13.4% in real amounts).
Figure 21 | Debit card transactions
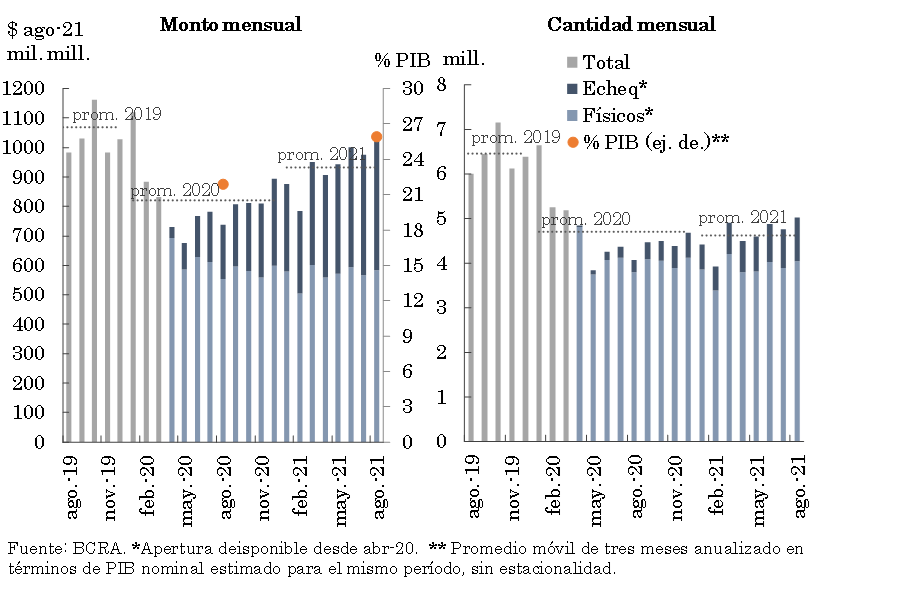
In August, the total clearing of checks increased monthly, both for amounts and real amounts, reaching levels above the 2021 average. In the month, the relative growth of ECHEQs compensation was greater than that observed in the physical format. Compared to the same month of the previous year, the clearing of checks (total) increased in quantities (23.1%) and in real amounts (39.7%), highlighting the contribution of ECHEQs, which in August represented 19.5% in quantities and 43.4% in amounts (see Graph 22).
Figure 22 | Check clearing
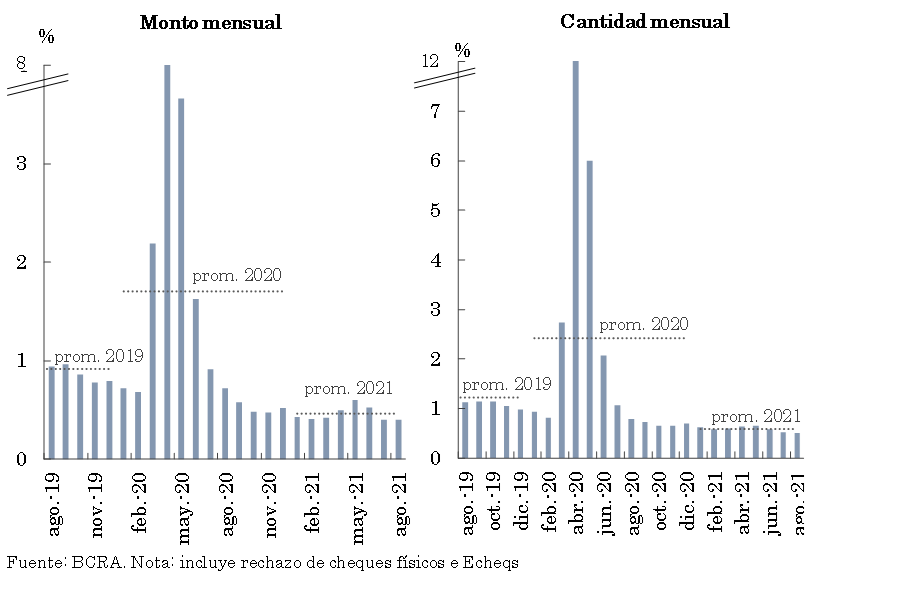
The rejection of checks due to lack of funds in relation to the total compensated remains at limited levels (see Graph 23). Specifically, in August there was a slight decrease in this indicator with respect to the amounts processed (-0.01 p.p. of the total compensated up to 0.5%), while it remained without significant changes in amounts (with a level of 0.4%). In this way, the current records were below the annual average and the one observed in the same month of the previous year.
Figure 23 | Bounce checks due to insufficient funds
References
1 Differences in balance sheet balances expressed in homogeneous currency. Information extracted from the Monthly Accounting Information Regime (July 2021last information available at the time of publication of this Report).
2 Includes principal adjustments and accrued interest.
3 Throughout the Report, when reference is made to groups of private (national and/or foreign) and public financial institutions, it corresponds to banking entities. Non-bank entities will be referred to as “EFNBs”.
4 For more details, see Ordered text “Line of financing for productive investment in MSMEs”.
5 See Communication “A” “7082” and Communication “A” “7102”.
6 See Communication “A” “7342” and Decree “512/2021”.
7 See Communication “A” “6993”.
8 See Communication “A” “7082”.
9 This ratio reached 29.2% of net of the forecast book balance.
10 See Communication “A” “6938”, Communication “A” “7107”, Communication “A” “7181”, Communication “A” “7245” and Point 2.1.1. of the Ordered Text “Financial Services in the Framework of the Health Emergency Provided for by Decree No. 260/2020 CORONAVIRUS (COVID-19)”.
11 Considers availability, integration of minimum cash and BCRA instruments, in national and foreign currency.
12 It should be recalled that in June the regulations that allow financial institutions to integrate with national public securities in pesos – as long as they verify certain conditions – what is admissible with LELIQ came into force. For more details, see Communication “A” “7290”.
13 The BCRA ordered that as of July, obligations to merchants for sales made through the use of debit and prepaid cards will be excluded from the minimum cash requirement (see Communication “A” “7318”). In addition, effective September, an increase was established in the maximum deduction for financing granted within the framework of the “Ahora 12” Program, which went from 6% to 8% of obligations in national currency (see Communication “A” “7334”).
14The LCR is an indicator that aims to ensure that financial institutions have an adequate availability of high-quality assets that can be converted into cash with little or no loss of value in the markets, in order to respond to their liquidity needs in a 30-day liquidity stress scenario. See Ordered Text —TO— “Liquidity Coverage Ratio”.
15Entities belonging to Group “A”, according to Communication “A” “6835”.
16 The NSFR seeks to ensure that entities have a stable term funding structure, in line with the terms of the businesses to which it applies. See TO “Stable Net Funding Ratio”.
17An indicator that illustrates the soundness of the financial system in the face of an eventual materialization of credit risk, which is very unlikely and of an extreme nature.
18Including those accounted for in ORI.
19 “Online credit” includes transfer transactions with instant accreditation associated with uniform virtual keys (CVU) that are processed through the Electronic Clearing House for Payment Methods (COELSA). Instant transfers (TI) are operations with instant accreditation whose administration corresponds to the Link and Banelco networks.
20Transfer payments represent a separate set of operations from online transfers. They correspond to payments initiated with debit card credentials and with open QR codes, while consolidating information previously presented as Immediate Electronic Payment (PEI).
21In relation to payments initiated through QR, the BCRA recently provided that all financial institutions must enable QR codes governed by the standards defined by the BCRA to enable QR codes for current accounts established in the rules on “Regulation of the bank current account” for natural or legal persons, and the PSPOCP for payment accounts held by legal entities, governed by the standards defined by the BCRA that allow them to receive payments by transfer. For more details see Communication “A” “7362”.
Share on


