I. Financial intermediation activity
Financial intermediation between all entities and the private sector fell during February, partly reflecting the seasonal effects of the period. According to the main differences in balances of the balance sheet of the financial system on items in pesos2, in February liquidity in the broad sense and financing to the private sector were reduced. On the other hand, there was a fall in the balance of deposits and an increase in credit to the public sector. Considering the items denominated in foreign currency – expressed in the currency of origin – the balance of credit to the private and public sectors fell during the period, a variation that was offset by a decrease in deposits and an increase in liquidity2.
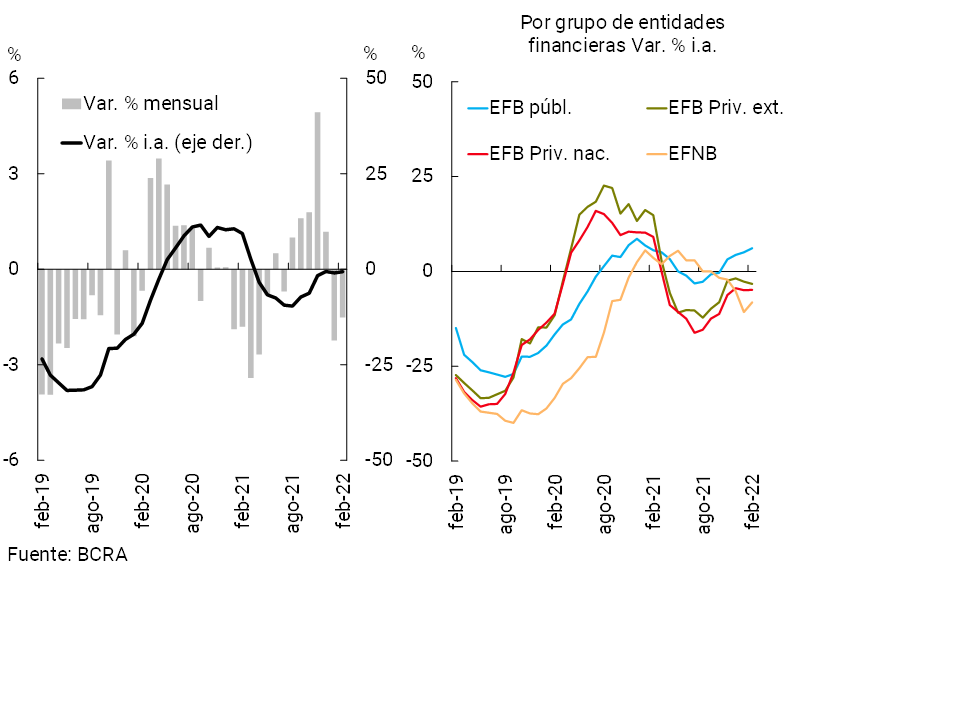
In February, the balance of credit to the private sector in pesos decreased by 1.5% in real terms (+3.1% nominal) (see Chart 1)3. When disaggregated by credit lines, heterogeneous behaviors were observed in the month: increases in advances and pledges, and decreases in the rest of the assistance. In this context, the real balance of credit to the private sector in national currency remained unchanged compared to the level observed a year ago (-0.7% real YoY or +51.2% nominal). Financing to the private sector channeled by public financial institutions verified increases in real terms, while decreases were observed in the rest of the groups of financial institutions.
Graph 1 | Credit balance to the private sector in pesos
In real terms* – Financial system
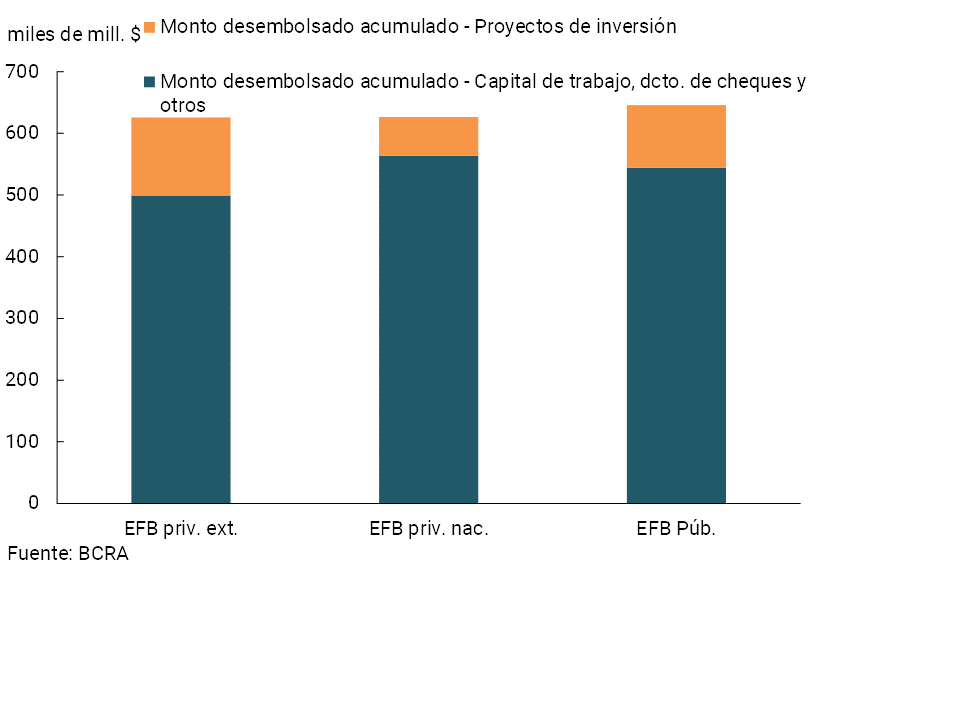
At the beginning of 2022, the Financing Line for Productive Investment (LFIP) for MSMEs continued to be the main instrument through which credit to small and medium-sized enterprises is promoted4. In this context, in March the BCRA extended the LFIP until the end of September 2022, maintaining preferential financial conditions for debtors (with interest rates of 35% TNA for investment projects and 45.5% TNA for the rest of the financing admitted) and regulatory exemptions for the financial institutions reached (in terms of reducing the minimum cash requirement)5. Through the LFIP, since its launch (in October 2020) and until the end of March 2022, nominal disbursements of $1.9 trillion have been accumulated (15.3% was channeled to investment projects), benefiting more than 230,600 companies. In terms of the accumulated funds of the LFIP, as of February a similar participation was observed from all groups of banks (see Graph 2).
Graph 2 | Financing Line for Productive Investment (LFIP) for MSMEs – March 2022
In February, the balance of credit to the private sector in foreign currency fell by 0.5% – in the currency of origin. In this context, the total balance of financing to the private sector (in domestic and foreign currency) accumulated a fall of 1.6% in real terms compared to the previous month (+3% nominal) and 5.3% in real terms in year-on-year terms (+44.1% nominal YoY).
Considering the results from the latest wave of the Credit Conditions Survey (ECC)6, the relatively weak performance of credit to the private sector observed at the beginning of 2022 occurred in a scenario in which financial institutions at the aggregate level tended to perceive a lower credit demand from the business sector at a general level compared to the end of 2021 (an evolution that was less intense in SMEs). and a demand that would not have shown changes of magnitude in the case of households. On the credit supply side, as stated by the group of participating entities, there were no changes of magnitude considering both the standards of credit granting and the main terms and conditions applied to the loans granted7.
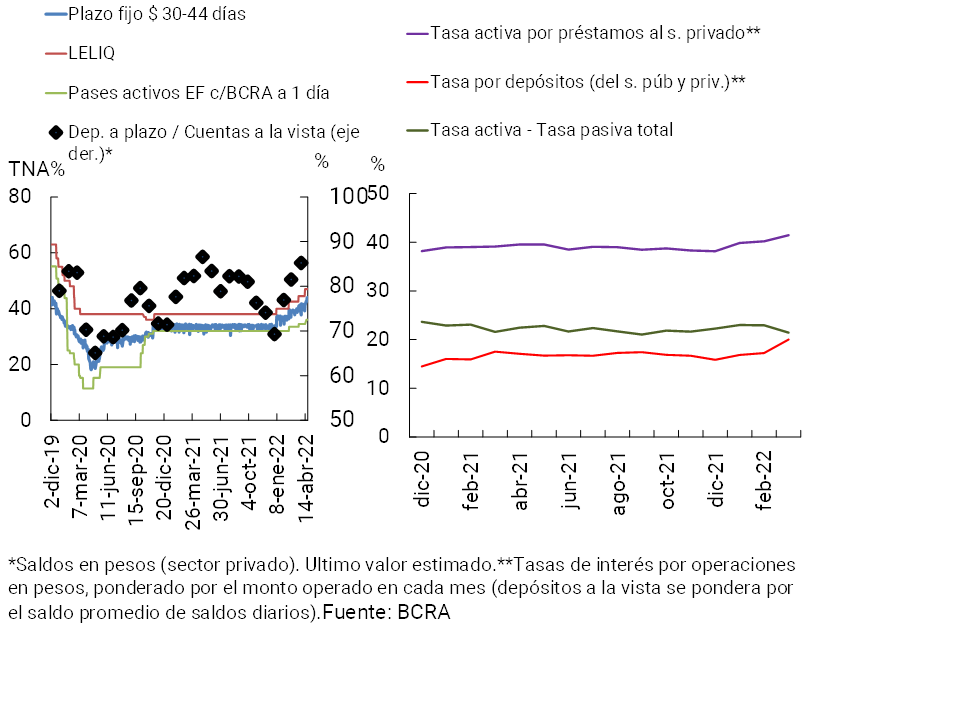
For its part, within the framework of the redesign of monetary policy instruments, in recent months a readjustment of interest rates has been observed. In particular, the BCRA recently ordered a new increase of 250 basis points in the interest rate of the 28-day LELIQ, going from 44.5% to 47% in TNA, which represents a TEA of 58.7%8. In addition, the minimum limits on interest rates on fixed-term depositswere increased again 9. The new floor was set at 46% TNA (57.1% TEA) for 30-day deposits of up to 10 million pesos from individuals, while for the rest of the private sector’s fixed-term deposits it was set at 44% TNA (54.1% TEA). Within the framework of these changes, so far this year there has been an increase in the average interest rates per amount operated by deposits in pesos (considering demand and time deposits) (see Chart 3). For its part, the BCRA pushed for interest rates on loans in pesos to remain at levels compatible with the development and needs of MSMEs, experiencing a somewhat more moderate increase in the first part of the year than that recorded in deposits10. Consequently, it is estimated that the differential between nominal lending (loans) and passive (deposits) interest rates operated for the segment in pesos experienced a slight decrease in the first part of 202211.
Graph 3 | Interest rates operated: levels and differentials – Operations in pesos – Financial system
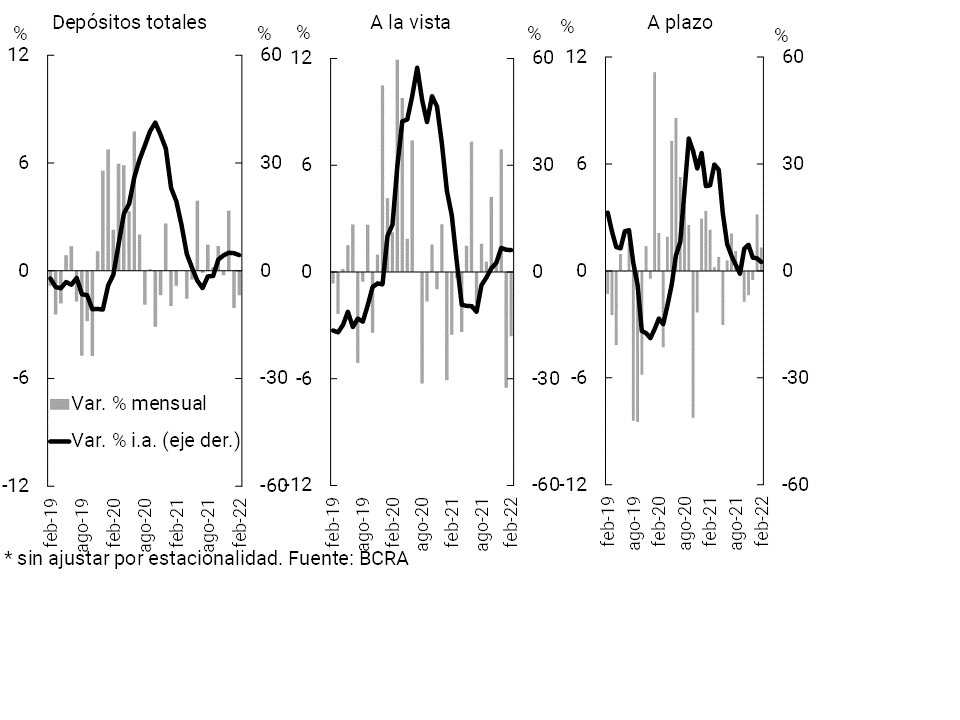
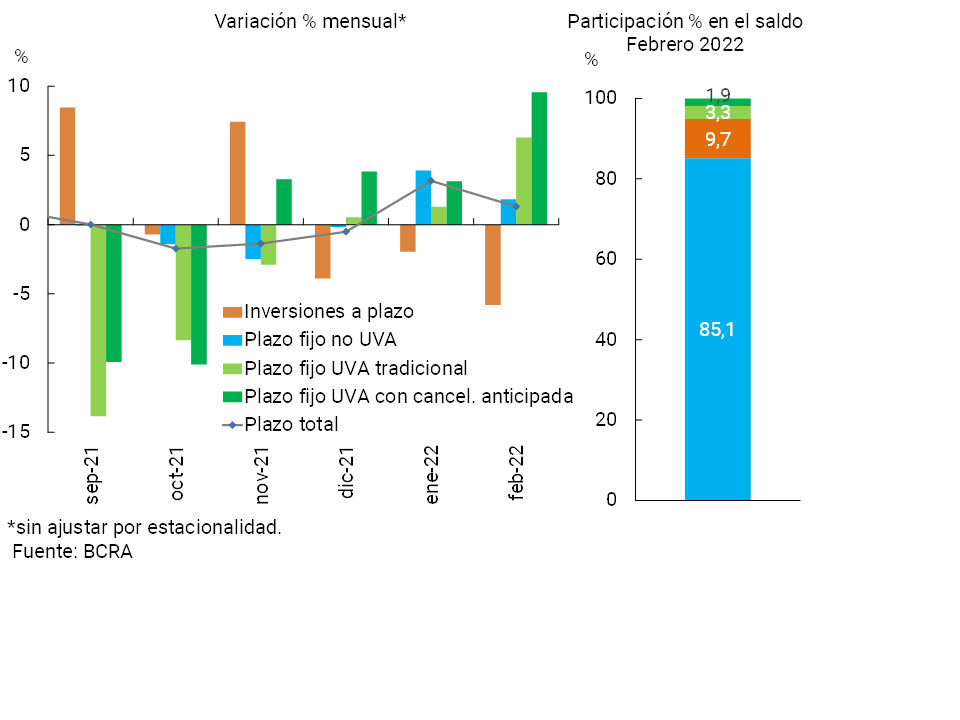
With regard to funding for all financial institutions, in February the balance of private sector deposits in national currency decreased by 1.4% in real terms (+3.3% nominal), mainly due to the performance of demand accounts (-3.6% in real terms or 0.9% in nominal terms). For its part, within the framework of the aforementioned increases in passive interest rates, the balance of private sector time deposits in national currency increased by 1.3% in real terms compared to the previous month (6.1% nominal) (see Chart 4). Within this segment, UVA deposits registered the highest relative monthly dynamism (9.6% in real terms for those with early cancellation and 6.3% in real terms for traditional deposits) (see Graph 5). Meanwhile, traditional fixed-term deposits increased 1.8% in real terms in the month for the aggregate of entities.
Figure 4 | Balance of private sector deposits in pesos
In real terms* – Financial system
Graph 5 | Balance of private sector time deposits in pesos in real terms
On the foreign currency side, in February deposits in this denomination of the private sector decreased 0.8% compared to January, driven mainly by the fall in time deposits. Thus, the balance of total private sector deposits (in domestic and foreign currency) fell by 1.6% in real terms in the period (+3% nominal).
In year-on-year terms, in February the balance of deposits in pesos in the private sector accumulated an increase of 4.3% in real terms (+58.8% nominal), with increases in demand accounts and time deposits. For their part, public sector deposits in pesos increased by 1.9% y.o.y. in real terms in the period. As a result, the balance of total deposits in pesos (considering both sectors) grew by 3.9% YoY in real terms. On a currency- and sector-wide basis, the balance of total deposits declined by 1% YoY in real terms.
II. Aggregate evolution and composition of the balance sheet
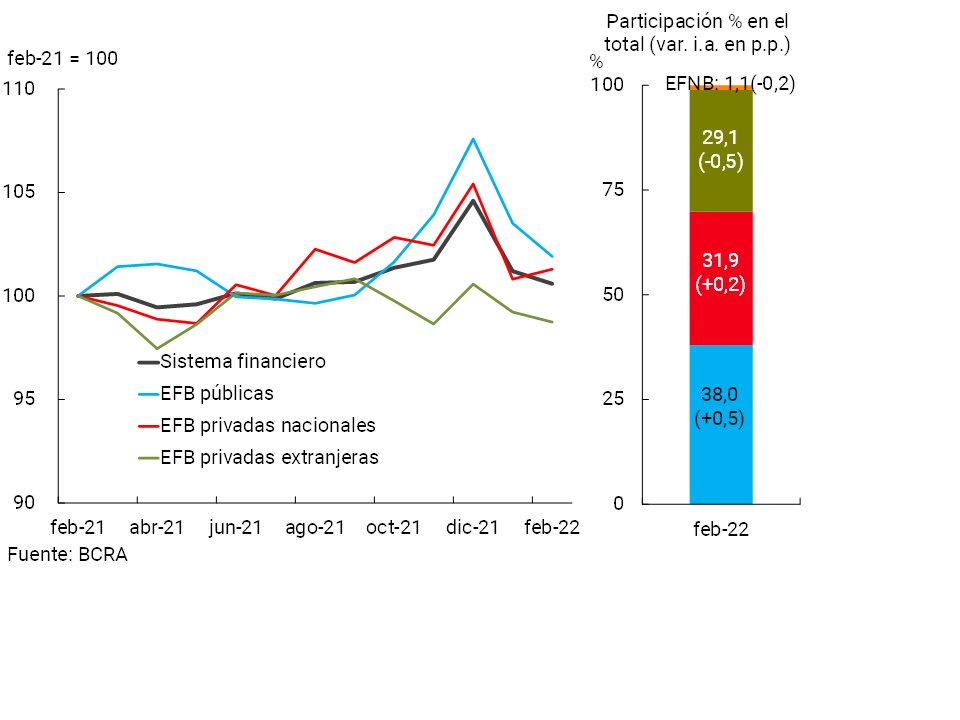
In February, the total assets of the aggregate financial system fell by 0.6% in real terms, explained by the performance of public and private foreign financial institutions (see Chart 6). Thus, total assets remained unchanged from the level of a year ago (+0.6% real YoY or +53.1% YoY nominal).
Graph 6 | Total assets of the financial system
In real terms
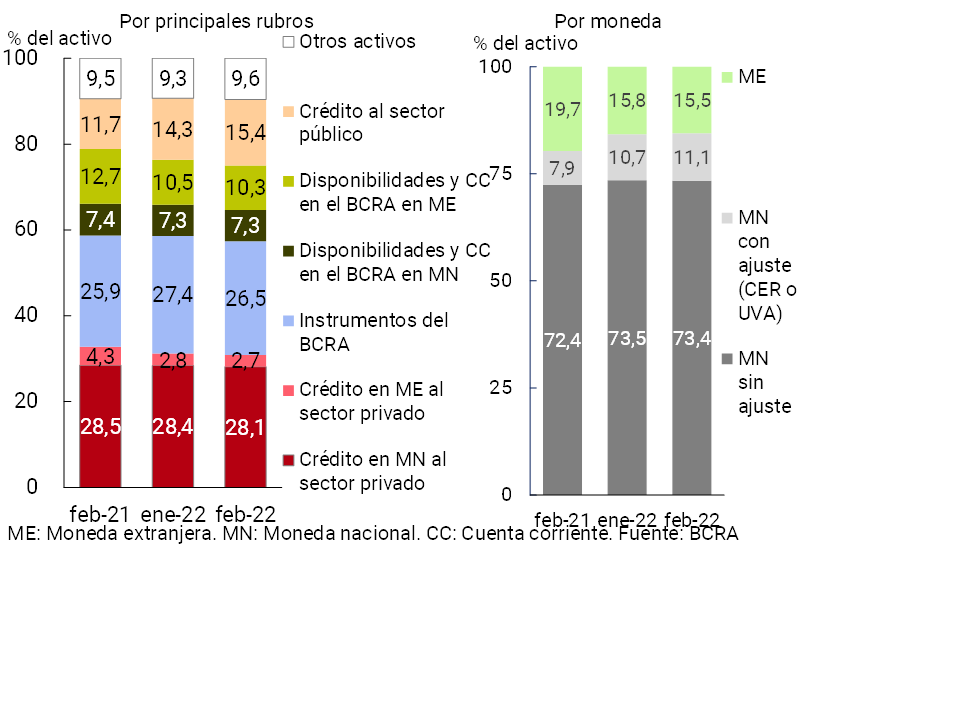
With regard to the composition of the total assets of all financial institutions, in February the relative share of the balance of credit to the public sector increased (see Chart 7), while the weighting of BCRA instruments and, to a lesser extent, of credit in pesos to the private sector decreased. In year-on-year terms, the relative importance of credit to the public sector and BCRA instruments increased and the share of credit to the private sector and foreign currency availability in assets decreased. On the other hand, when differentiating by currency in the month, the relevance of assets in national currency with CER adjustment increased and the share of assets in foreign currency decreased.
Figure 7 | Composition of total assets
Financial system – Share %
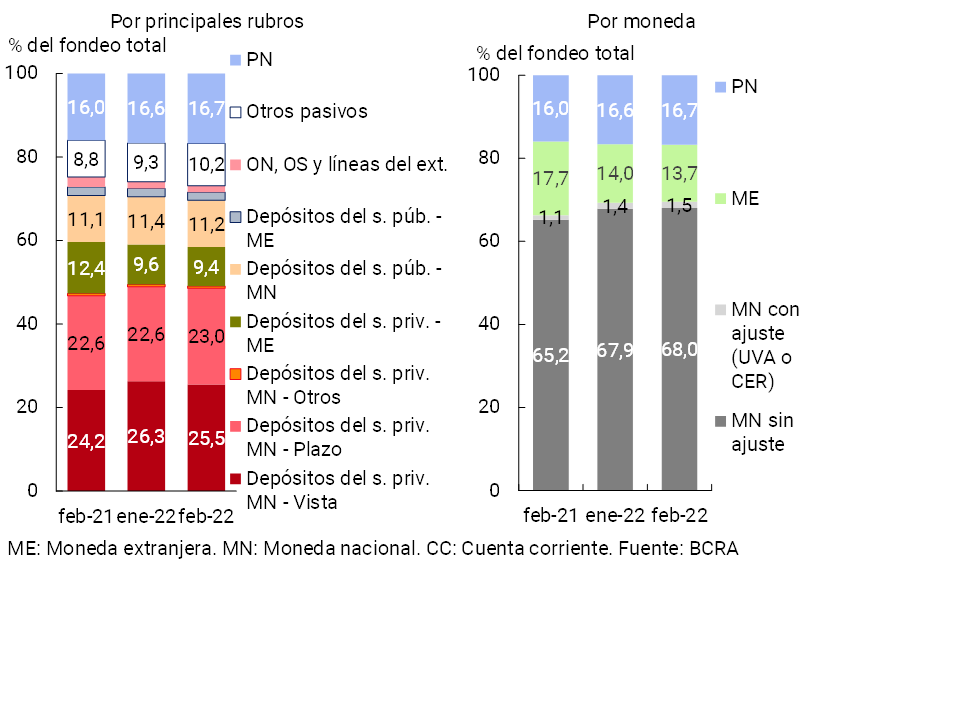
With respect to the main components of the total funding of the financial system, in February the relative weight of the private sector’s time deposits in pesos increased, reducing the relevance of demand accounts in pesos, private sector deposits in foreign currency, and public sector placements in national currency (see Chart 8). Compared to the same month in 2021, private sector deposits in national currency and net worth increased their weighting in total funding, while deposits of households and companies in foreign currency reduced their relative importance. On the other hand, when disaggregated by currency, items in foreign currency reduced their weighting in the total on a monthly basis, while those denominated in national currency slightly increased their relative weight in February.
Figure 8 | Total Funding Composition
Financial system – Share %
The financial institutions as a whole continued to register a moderate exposure to foreign currency items within the framework of the macroprudential regulations in force. In February, the positive spread between assets and liabilities in foreign currency12 of the financial system represented 11.8% of regulatory capital (see Chart 9), reducing slightly (-0.6 p.p.) with respect to the value of January and thus placing itself slightly above the level of February 2021 (+1 p.p.). On the other hand, it is estimated that the spread of items with a CER and/or UVA adjustment clause stood at 65.5% of regulatory capital in February, increasing both in monthly and year-on-year terms (+1.2 p.p. and +17.4 p.p. respectively).
Graph 9 | EM Assets – EM Liabilities + EM Forward Position — Financial System
III. Portfolio quality
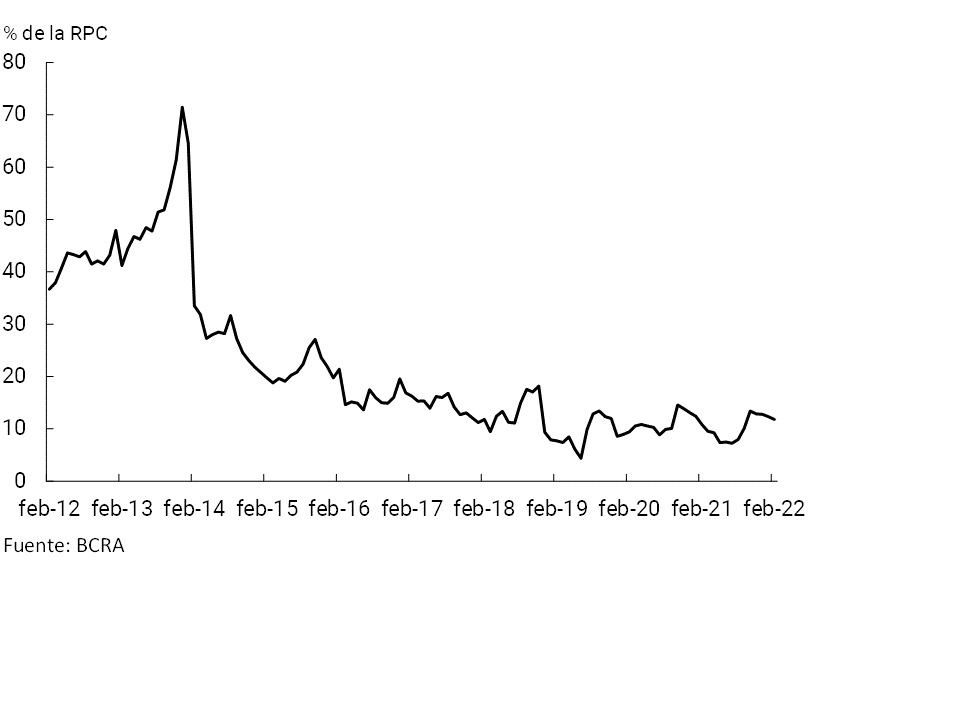
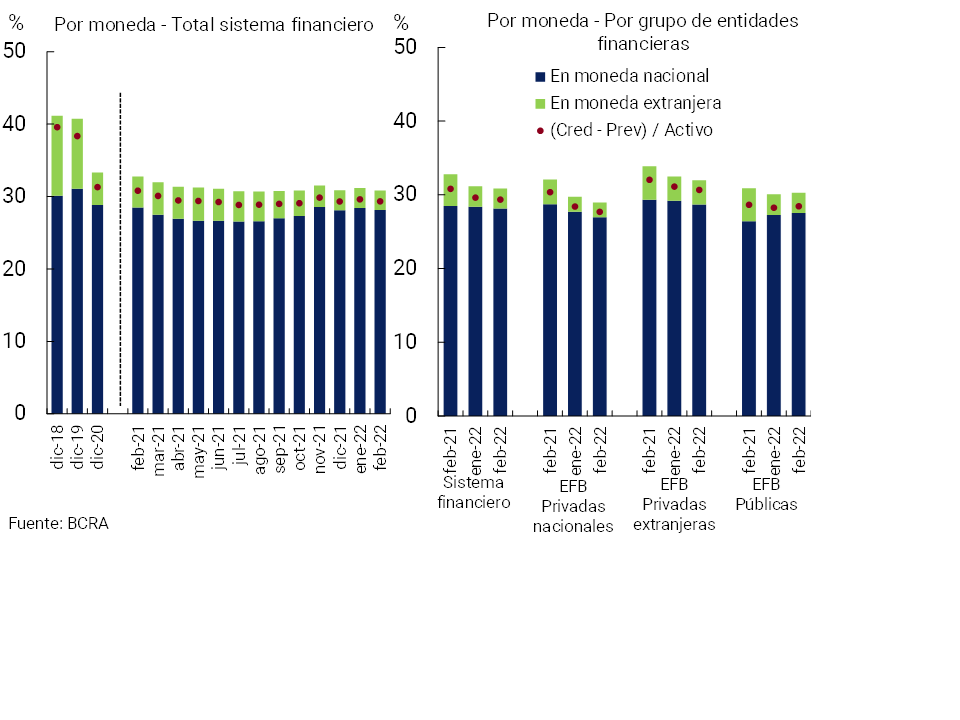
In February, the gross exposure of the financial system to the private sector (including domestic and foreign currency) stood at 30.9% of total assets,13, 0.3 p.p. below the previous month’s record (-1.9 p.p. y.o.y.). This decline was mainly driven by private financial institutions. If only financing in pesos is considered, the indicator stood at 28.1% in the period, 0.3 p.p. less than in January (-0.4 p.p. y.a.) (see Graph 10). The weighting of credit to the private sector in foreign currency in total assets fell slightly in the month to a total of 2.7% (-1.6 p.p. y.o.y.), constituting the lowest value in the last 6 years.
Figure 10 | Credit balance to the Private Sector / Assets
In February, the non-performing loan ratio to the private sector did not show significant changes (-0.1 p.p.), standing at 4.2% (+0.4 p.p. y.o.y.) for the aggregate of entities (see Graph 11). The performance of this indicator occurs in the context of targeting the financial relief measures opportunely implemented during the course of the pandemic14.
Figure 11 | Irregularity of credit to the private sector
Irregular financing / Total financing (%)
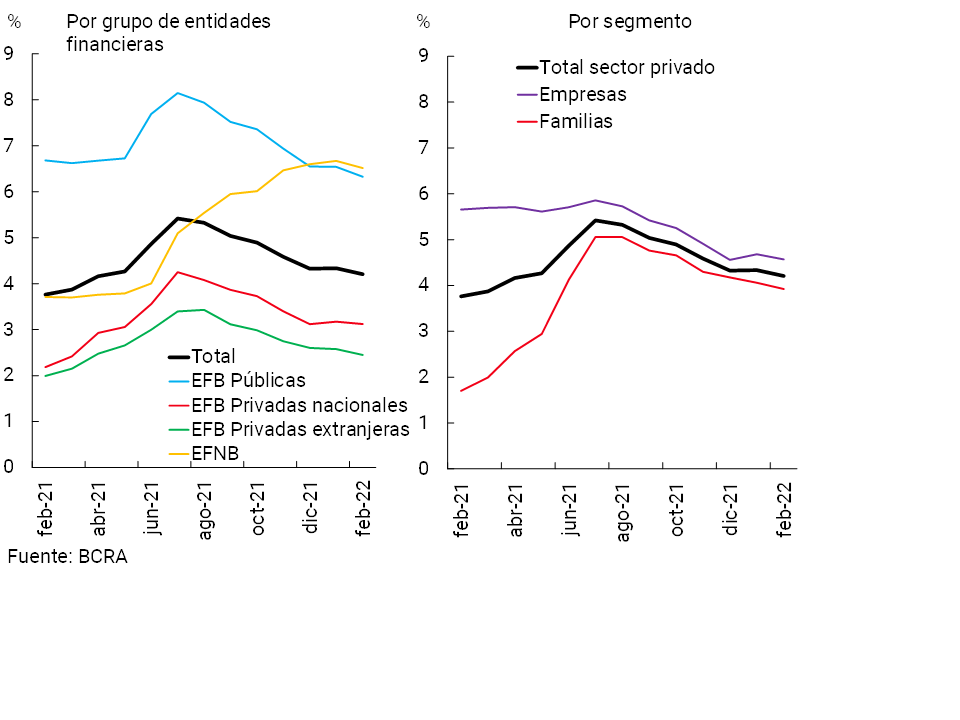
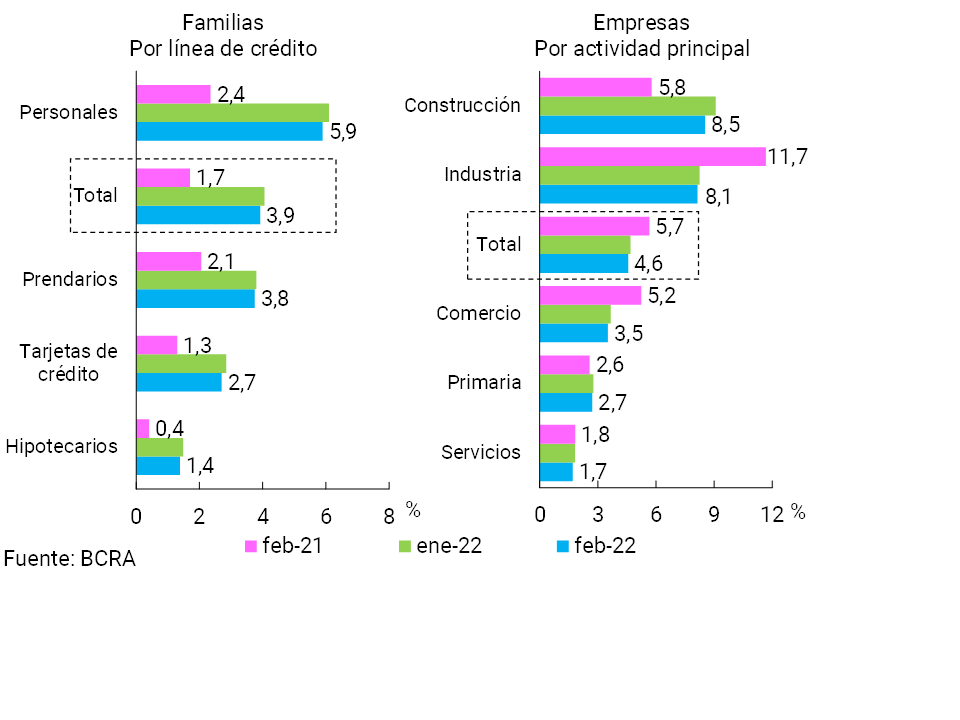
The irregularity ratio of credit to the private sector also did not change in magnitude considering the different homogeneous groups of financial institutions, as well as in the segments of loans to companies and households. In particular, in February the irregularity of financing to households stood at 3.9% of the total balance of loans to them (see Graph 12), with a slightly more marked reduction in consumer financing (personal and credit cards). In turn, the delinquency of loans to companies stood at 4.6% of financing to this segment in the period (variation of -0.1 p.p. monthly and -1.1 p.p. y.o.y.). Companies whose main activity belongs to the construction sector presented a slight decrease in the irregularity ratio.
Figure 12 | Irregularity of credit to the private sector
Irregular financing / Total financing (%)
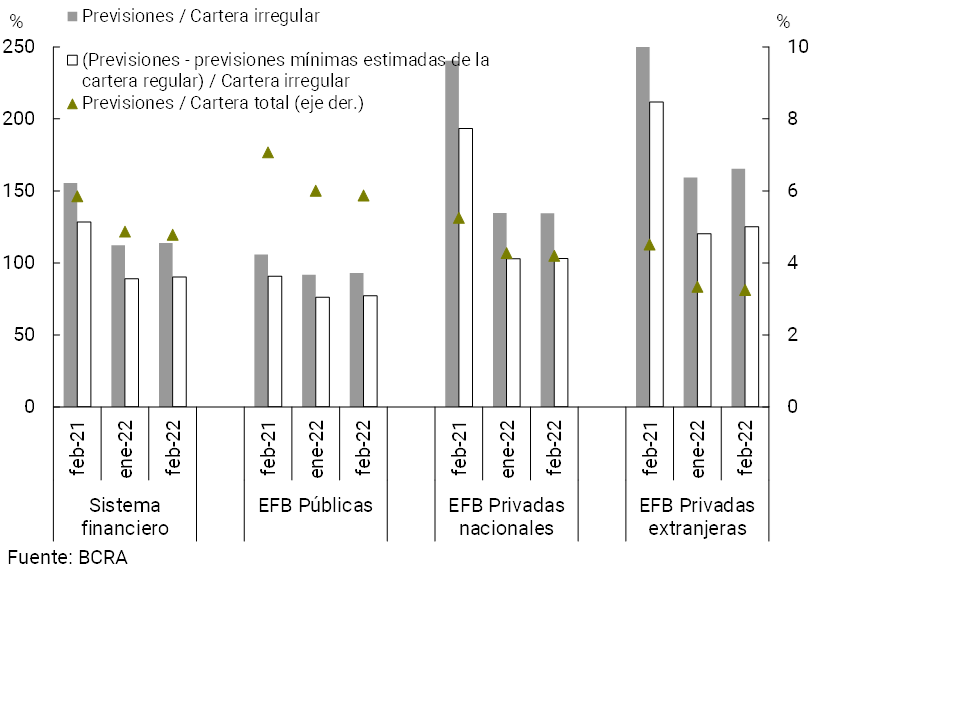
In February, the total forecasts of the aggregate financial system represented 4.8% of total credit to the private sector, slightly lower than January’s figure and 1.1 p.p. below the value of a year ago. The total forecasts continued to exceed the portfolio of irregular loans in February 2022 (see Chart 13). In particular, the forecast indicator in terms of the non-performing portfolio stood at 113.8% in the month at the systemic level (+1.5 p.p. monthly and -41.7 p.p. y.o.y.). For its part, in February the balance of regulatory forecasts attributable to the non-performing portfolio (following the criteria of the minimum regulatory forecasts for uncollectibility risk) represented 90.3% of said portfolio for the aggregate of entities.
Figure 13 | Credit to the private sector and forecasts
By Entity Group
IV. Liquidity and solvency
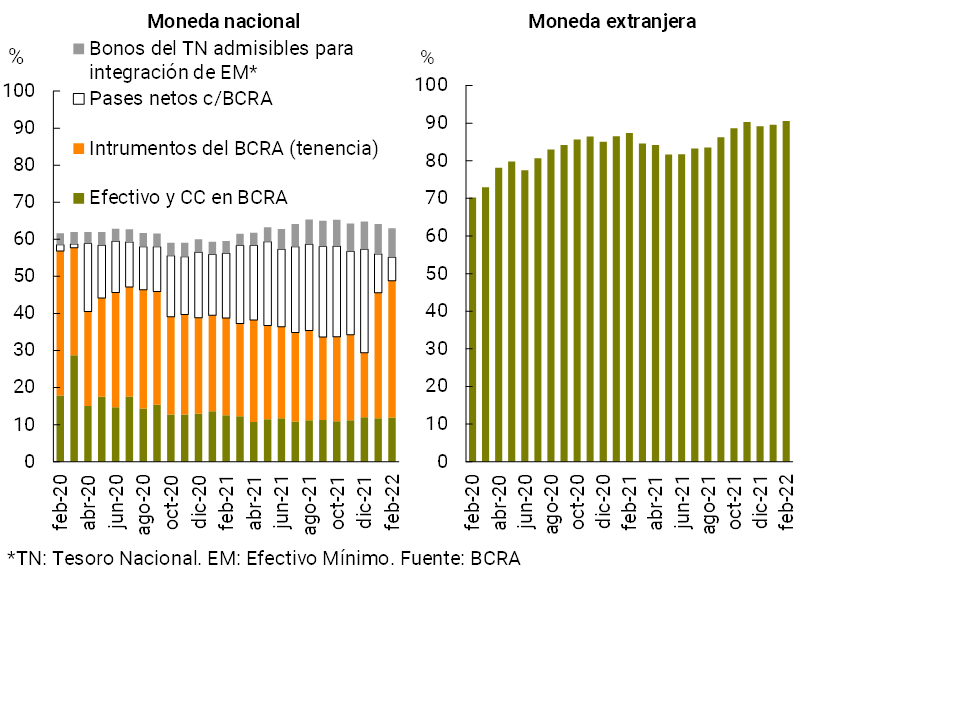
At the systemic level, liquid assets15 in terms of deposits fell in February, although they remained at high levels when compared to the average of the last 15 years. In the month, the broad liquidity ratio totaled 67.3% for the financial system (63% for items in domestic currency and 90.5% for the segment in foreign currency, see Chart 14), 0.9 p.p. less than the previous month (-1.1 p.p. for the segment in pesos and +1 p.p. for items in foreign currency). Within the framework of the regulatory changes introduced at the beginning of the year16, in February the composition of the liquidity in pesos of the financial system continued to change: an increase in the weighting of the holdings of BCRA instruments (mainly LELIQ and, to a lesser extent, NOTALIQ) and a decrease in the relevance of net passes with the BCRA17. Compared to the same month of the previous year, the broad liquidity indicator for financial institutions as a whole (in pesos and abroad) grew 2.3 p.p. of total deposits.
Figure 14 | Liquidity of the financial system
In % of deposits
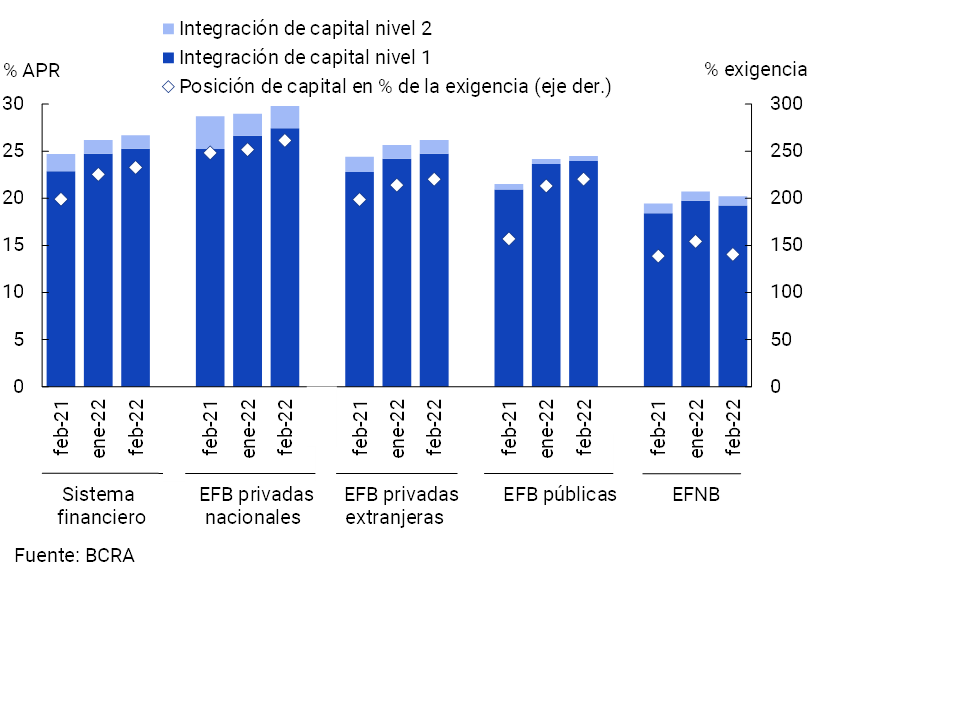
The sector’s solvency indicators increased in February. Capital integration (PRC) of the aggregate of entities stood at 26.7% of their risk-weighted assets (RWA), 0.5 p.p. above the level recorded in January (+2 p.p. y.o.y., see Chart 15). Almost 95% of the total regulatory capital continued to be accounted for by Tier 1 Capital, with a greater capacity to face potential losses. The excess capital position (RPC minus the minimum regulatory capital requirement) represented 232.8% of the regulatory requirement in the month at the aggregate level, 7.4 p.p. more than the previous month (+33.7 p.p. y.o.y.).
Figure 15 | Integration of regulatory capital
By financial institution group
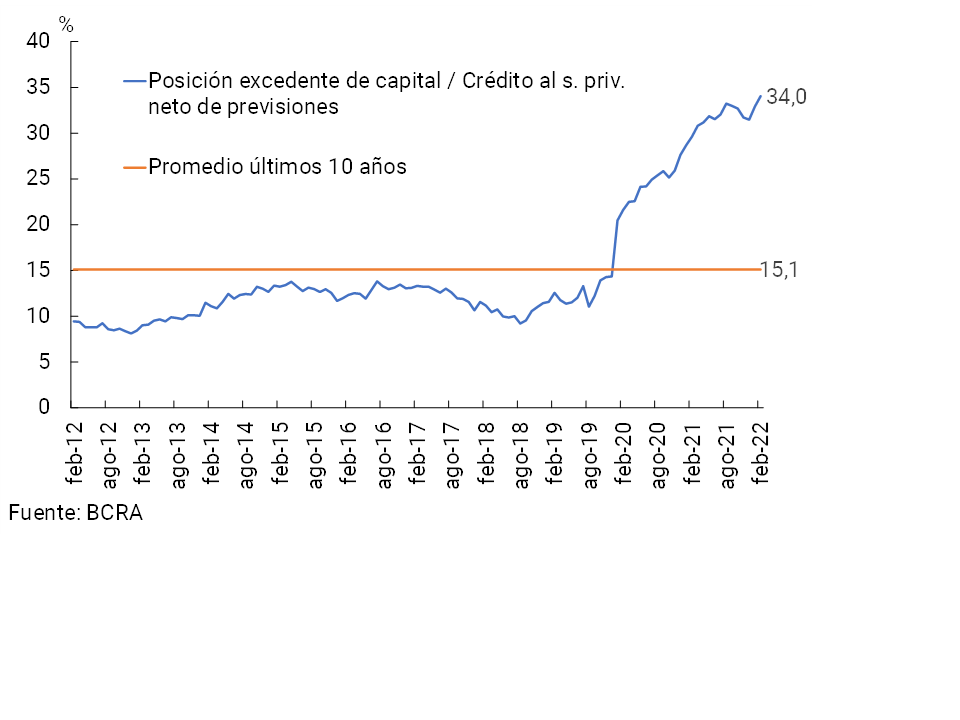
The ratio between the excess regulatory capital position and credit to the private sector net of forecasts stood at 34% for the sector as a whole in February (increasing slightly in the month and 4.4 p.p. y.o.y.), a level much higher than the average of the last 10 years —15.1%—(see Chart 16).
Figure 16 | Surplus capital position in terms of credit to the private sector net of forecasts
Financial system
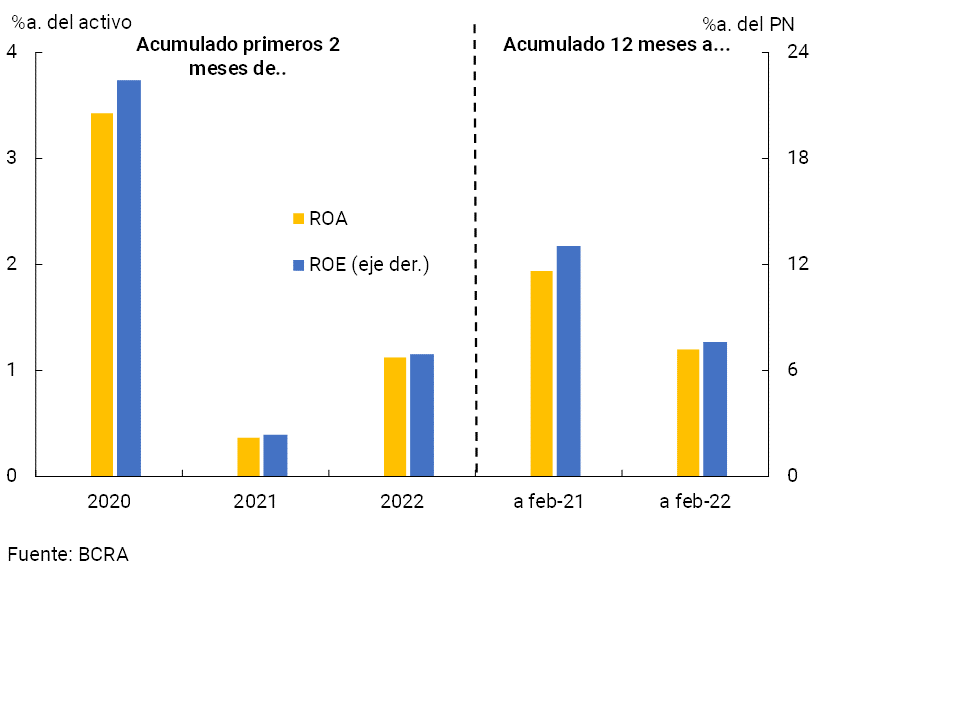
In February, the financial system presented positive profitability indicators, although lower than those of previous months. In the 12 months to February, the financial system’s comprehensive total results in homogeneous currency totaled 1.2% of assets (ROA) and 7.6% of equity (ROE), 0.7 p.p. and 5.4 p.p. lower in a year-on-year comparison, respectively (see Chart 17). This decrease occurred in a context of increases in the cost of funding for deposits and greater monetary losses, factors that were partly offset by higher income from pass premiums and lower charges for uncollectibility, among others.
Figure 17 | Comprehensive total profit in homogeneous currency of the financial system
The evolution of implicit interest rates (active and passive) and their differential makes it possible to monitor, at least to some extent, the possible effect that may occur on the balance sheet of the financial system – items in the income statement and the equity position – based on changes in the interest rates operated and in the evolution of the balances. Within the framework of the changes observed in the BCRA’s reference interest rates on February18, it is estimated that at the beginning of 2022 the system would not have shown any changes in magnitude with respect to the levels of nominal implicit interest rates -active and passive- at the end of 2021 (see Chart 18)19, 20. Thus, it is estimated that in the first two months of the year the implied active interest rate registered a slight increase, mainly associated with the holding of BCRA instruments. On the other hand, until February, the increase in interest rates on deposits in pesos and the greater weighting that these placements have been having in the total deposits, would not have been reflected in an increase in the cost of implicit funding for deposits in the same denomination, in a context in which there were also changes in the franchises for minimum cash.
Figure 18 | Estimated Implied Interest Rates (Annualized) – Segment in Pesos – Financial System
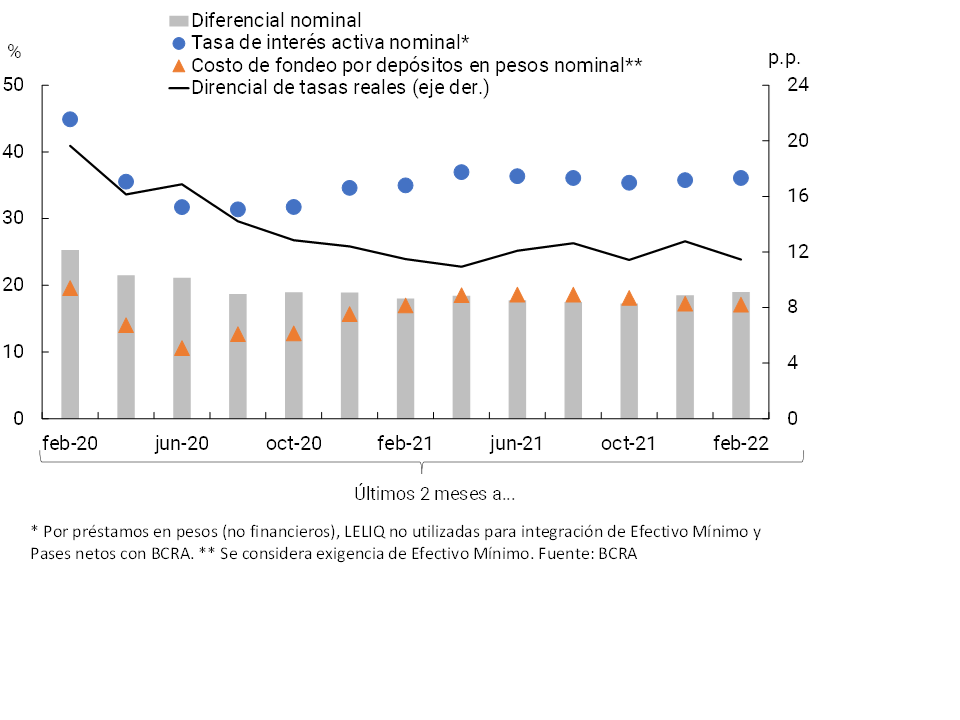
Notwithstanding the performance of nominal implied rates mentioned above, it is estimated that the differential between the real implied active rate and the real cost of implicit funding for deposits was reduced compared to what was verified at the end of 2021 for the aggregate of the sector (see Chart 18).
V. Payment system
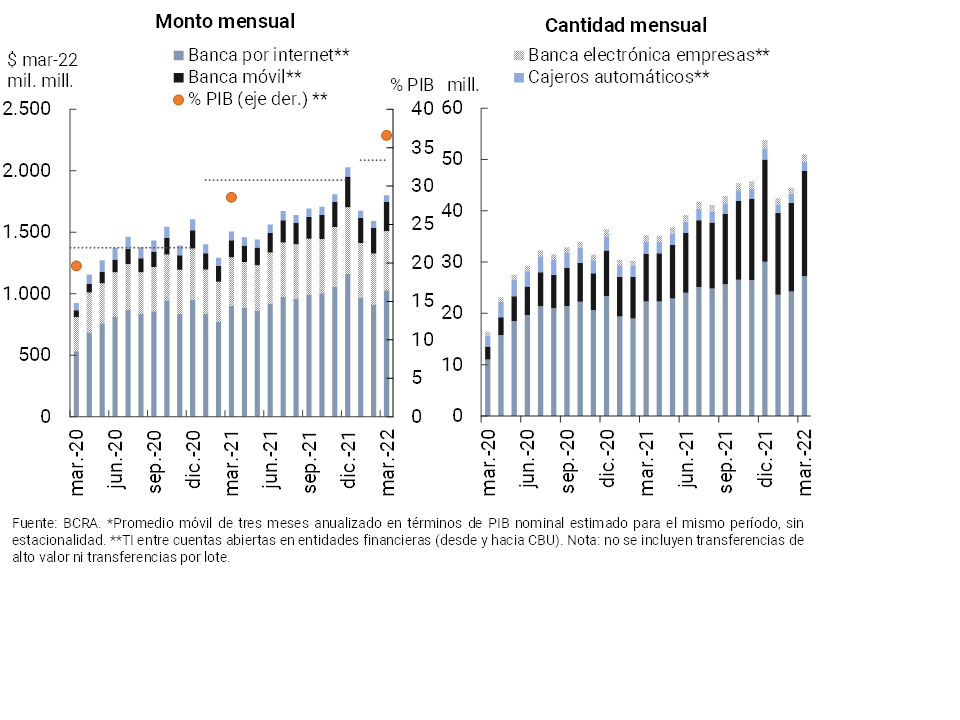
In March, immediate transfers (TI) between accounts opened in financial institutions via CBU21 increased compared to the previous month in amounts (+14.6%) and in real amounts (+13.2%, see Chart 19). In year-on-year terms, these operations expanded 44.8% YoY in quantities and 19.5% YoY in real amounts. In this year-on-year dynamic, the increase in transactions through Mobile Banking stood out. Thus, Mobile Banking operations increased their relative share to 40.2% in amounts (+13.9 p.p. y.o.y.) and 13% in amounts (+3.9 p.p. y.o.y.). It is estimated that in February, IT among CBUs came to represent 36.6% of GDP22 (+8 p.p. compared to the same month of the previous year)23.
Figure 19 | Instant Transfers (TI) between CBUs
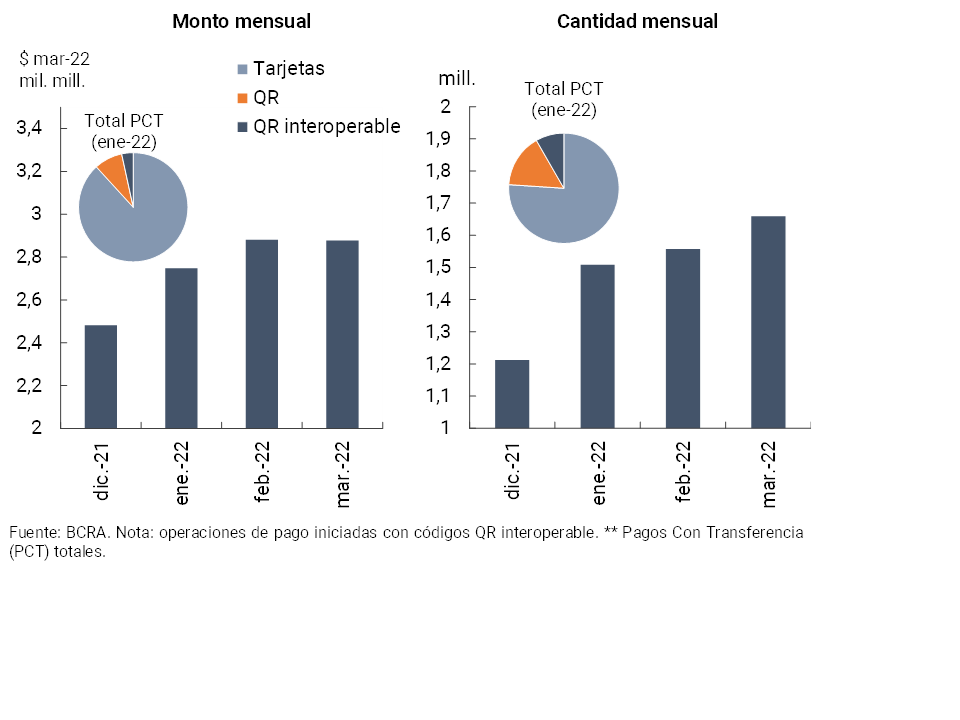
In March, transfer payments (PCT) initiated through interoperable QR24 increased from the previous month in amounts (6.5%) and remained without significant changes in real amounts (see Chart 20). Since the beginning of the full QR interoperability scheme, the number of operations accumulated as of March reached 6 million, equivalent to $10,327 million at March 2022 prices (resulting in an average of $1,725 per transaction). Thus, in January (latest available data), PTCs through interoperable QR codes accounted for 8% of the total PCT transactions and 3% of the total PCT transactions in quantities.
Figure 20 | Transfer payments (PCT) via interoperable QR
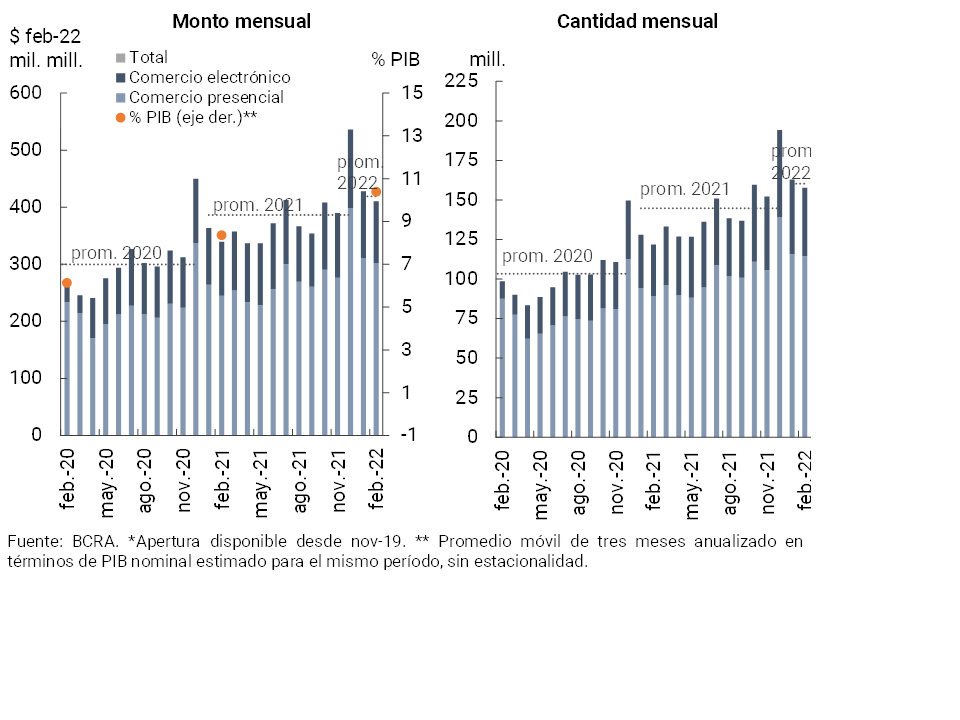
During February (latest available information) debit card transactions – face-to-face and electronic – decreased compared to January (see Graph 21), partly reflecting seasonal factors. However, in year-on-year terms, debit card transactions grew significantly (+29.5% in amounts and +20.9% in real terms). This behavior was reflected in both face-to-face and electronic operations25. Thus, it is estimated that debit card transactions accounted for 10.4% of GDP (2 p.p. more than in the same month of the previous year).
Figure 21 | Debit card transactions
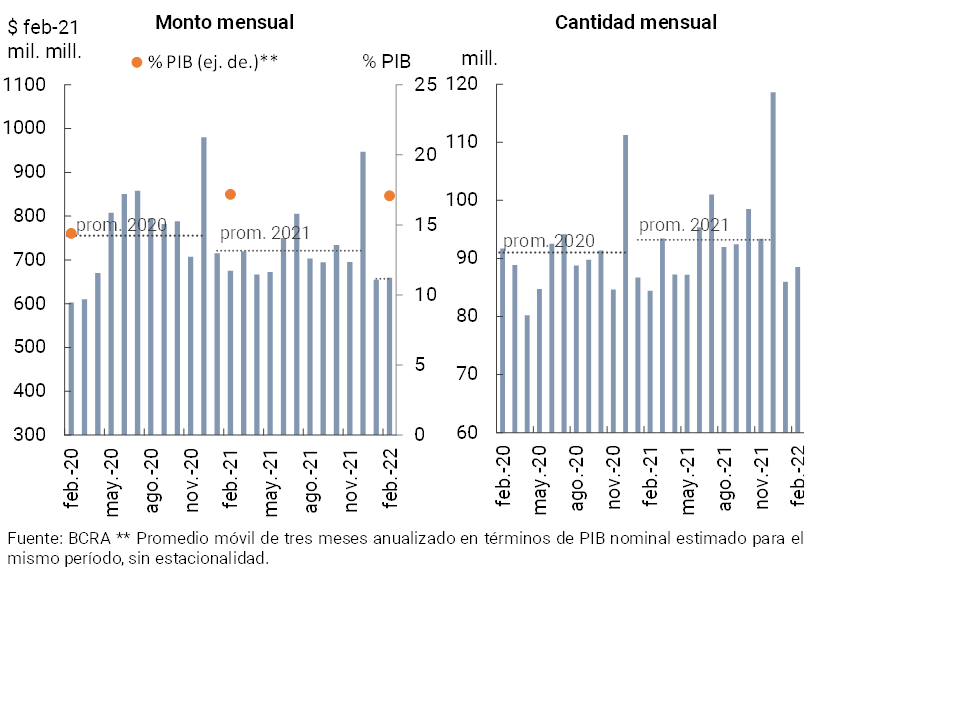
In February (latest available information), ATM withdrawals increased compared to the previous month in quantities (+3%) and in real amounts (+0.7%). In year-on-year terms, ATM withdrawals expanded 4.8% in quantities and decreased 2.4% in real amounts. It is estimated that in February the value of cash withdrawals via ATMs represented 17.1% of GDP26 (similar to the record for the same month of the previous year, see Graph 22)27.
Figure 22 | ATM cash withdrawals
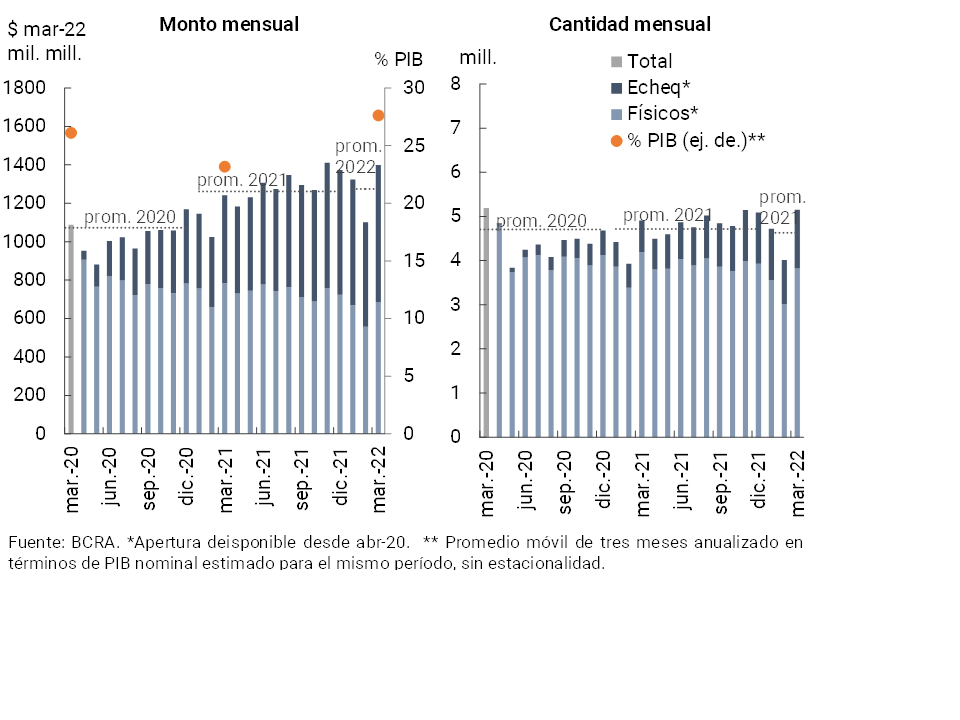
In March, the clearing of checks increased compared to the previous month (+28.4% in amounts and +27.1% in real terms). Compared to the same month of the previous year, the clearing of checks accumulated an increase of 5% in amounts and 12.6% in real amounts, an increase explained entirely by the electronic format (+87.1% in amounts and +55.6% in real amounts). Thus, during March, ECHEQs continued to increase their weighting in total compensation, to represent 25.8% in amounts (+11.3 p.p. y.o.y.) and 51% in real amounts (+14.1 p.p. y.a., see Graph 23). It is estimated that the amount of checks cleared in terms of GDP totaled 27.6% as of March (+5.6 p.p. y.o.y.).
Figure 23 | Check clearing
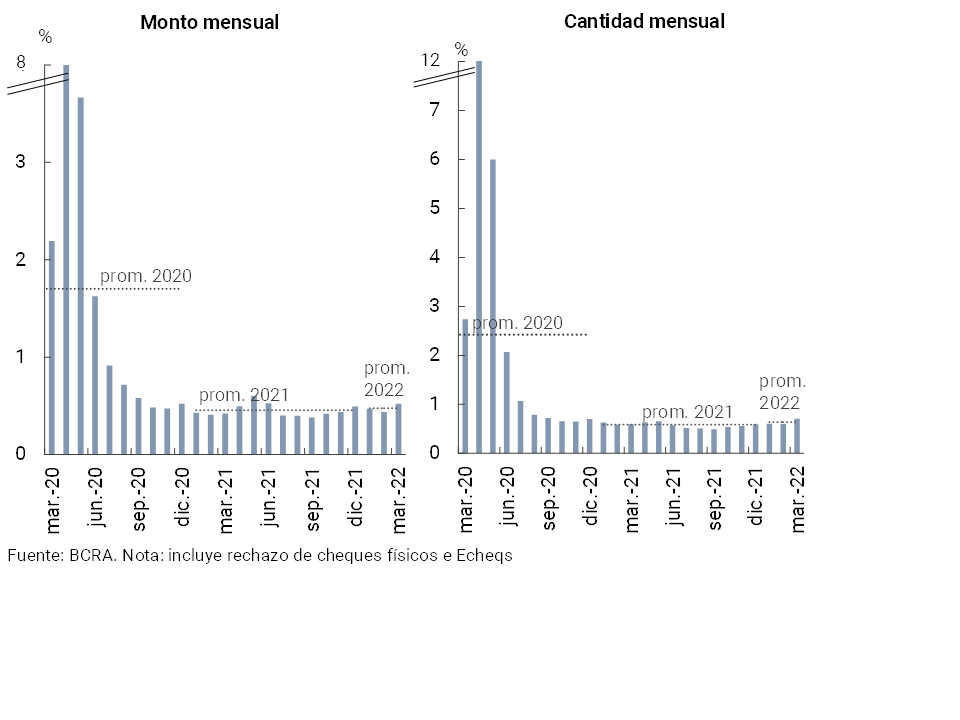
In March, the ratio of rejection of checks due to lack of funds in terms of the total compensated28 increased slightly compared to February (+0.11 p.p. to 0.7% in amounts and +0.08 p.p. to 0.5% in amounts, see Chart 24).
Figure 23 | Bounce checks due to insufficient funds
Back to top
References
1Differences in balance sheet balances expressed in homogeneous currency. Information extracted from the Monthly Accounting Information Regime for the Balance Sheet (February 2022, latest information available at the time of publication of this Report).
2Expressed in currency of origin
3Includes principal adjustments and accrued interest.
4For more details, see Ordered text “Financing line for productive investment in MSMEs”.
5For more details see, “Press release”, see Communication “A” “7475” and Communication “A” “7491”.
6See “Credit Conditions Survey (ECC)” first quarter 2022 edition.
7For the second quarter of the year, the banks surveyed under the CCP expect a certain upturn in perceived credit demand for the general level of companies and for most lines to households, while they do not expect to make significant changes in the factors of credit supply.
8 The interest rate of the LELIQ was modified 4 times since the beginning of 2022, reaching an increase of 9 p.p.
9see, “Press Release”, and Communication “A” “7491”
10Within the framework of the LFIP, so far this year the increase in interest rates for the financing of investment projects was relatively lower than that verified in the minimum rates for fixed terms.
11For more details of the estimated changes for the first part of the year in terms of implied interest rates (ratio between income flows and balance sheet balances), see section IV of this report.
12Includes forward purchase and sale transactions of foreign currency classified off-balance sheet.
13It reached 29.3% when netting the accounting balance of forecasts.
14See Communication “A” “6938”, Communication “A” “7107”, Communication “A” “7181”, Communication “A” “7245” and Point 2.1.1. of the Ordered Text “Financial Services in the Framework of the Health Emergency Provided for by Decree No. 260/2020 CORONAVIRUS (COVID-19)”.
15It considers availability, assets admitted for the integration of the Minimum Cash requirement and BCRA instruments, in national and foreign currency.
16 Regarding the redesign of monetary policy instruments. For more details, see “Report on Banks” for January 2022.
17In February, the NOTALIQ began to be tendered, although their weighting in terms of deposits is still limited. In turn, as of February, a modification of the franchise came into force on the requirement of minimum cash in pesos for entities participating in the Ahora 12 Program (going from 50% to 40% of the new financing channeled through this program, see Communication “”A” 7448″)
18Redesign of monetary policy instruments. For more details, see Graph 3 of section 1.
19Taking nominal implicit interest rates arising from the main assets and liabilities in national currency. For the calculation of implicit interest rates, concepts such as administrative expenses, tax expenses, cost of capital or other components associated with hedging for risks intrinsic to financial intermediation operations are not taken into account. In this estimate, implied interest rates are constructed by accumulating flows over the last 2 months and annualized
20For a detailed account of the recent evolution of interest rates and the perception of the banks participating in the “CCP” on the terms and conditions of the loans for the first part of the year, see section 1 of this Report.
21Given the availability of information at the time of preparation of this Report, IT operations that include CVU participation are not considered.
22When considering annualized amounts of the last three months
23Within the framework of the positive performance of IT, with a growing relevance of the segment where accounts in payment service providers are involved (from and/or to CVU), the BCRA reinforced measures to improve the security of digital wallets (“Press release 24-Feb-22″).
24Within the framework of the Transfers 3.0 scheme and based on the boost received from the BCRA regulations, the interoperability of operations initiated with QR codes was provided (for more information, see the “November 2021” edition of the Banking Report).
25The greater openness of the economy due to the relaxation of the measures adopted during COVID-19 corresponds to a greater relative dynamism in face-to-face operations.
26When considering annualized amounts of the last three months.
27These values are in line with the historical average of 15.7% since March 2016.
28Consider physical checks as well as electronic checks.
Share on


