I. Financial intermediation activity
According to the main variations in the balance of the aggregate financial system on items in national currency1, the real balance of financing to the public and private sectors fell during the month. On the other hand, there was an increase in liquidity in the broad sense and a decrease in the real balance of private sector deposits. On the other hand, among the items in foreign currency in the period, private sector deposits increased, a movement that was mainly offset by an increase in financing to the public sector2, 3.
The balance of credit to the private sector in national currency decreased by 0.8% in real terms in April (+5.2% nominal), with heterogeneous performances among credit assistance4. Compared to March, there were increases in the real balance of advances and pledges, and decreases in the rest of the financing lines.
Notwithstanding the monthly performance, in a year-on-year comparison, the balance of credit in pesos to the private sector accumulated an increase of 2.8% in real terms (+62.3% nominal y.o.y.). The dynamics of financing in pesos to the private sector in the last twelve months was mainly explained by public financial institutions (see Chart 1) and, to a lesser extent, by foreign private banks.
Graph 1 | Credit balance to the private sector in pesos
In real terms*
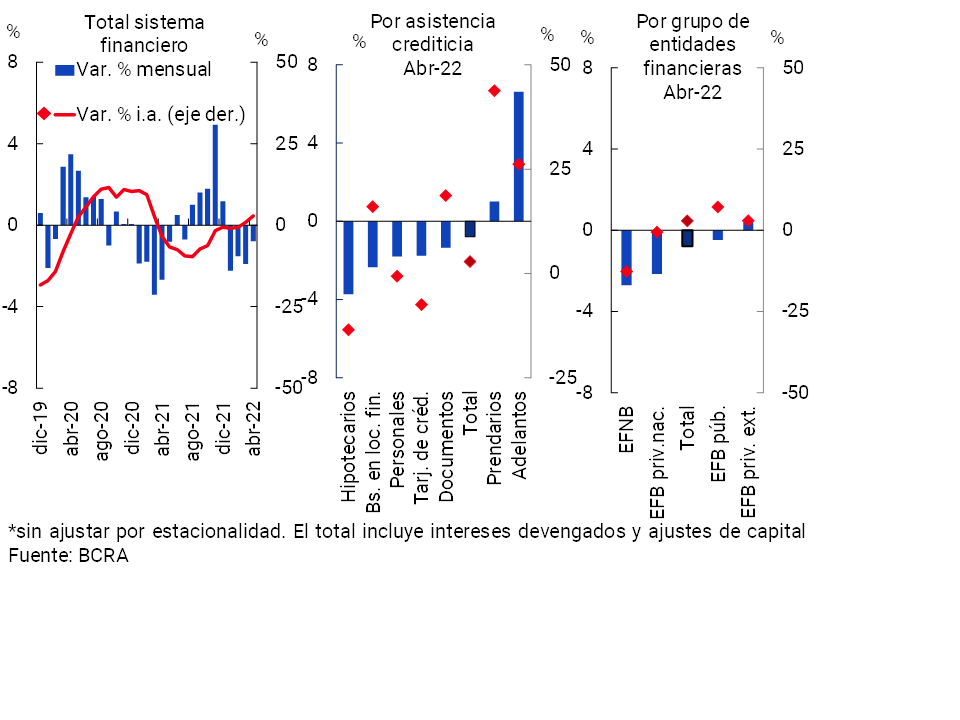
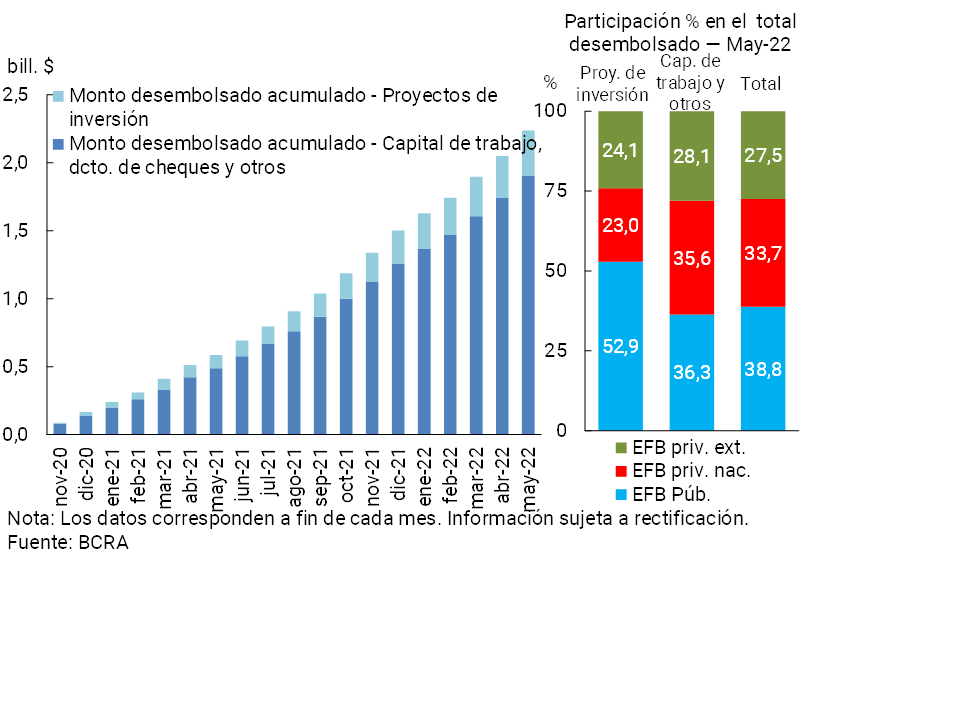
The year-on-year increase in bank financing in pesos was mainly reflected in collateral and commercial credit lines: advances, documents and leasing. This positive performance of commercial loans has been driven in part by the stimulus measures – with a focus on small and medium-sized enterprises – implemented by the BCRA. In particular, as of April, the “2022 quota” for the Financing Line for Productive Investment of MSMEs (LFIP) came into force, preserving a set of favorable relative conditions for firms and benefits for participating banks5. In the first two months of the “2022 quota” (information at the end of May 2022), a total of $341,419 million were disbursed among some 38,677 companies. It is estimated that the accumulated disbursements in these two months through the LFIP were equivalent to 21.2% of the amount of loans operated in pesos at a fixed interest rate and re-negotiated by legal entities in the period (15.1% of the amount operated in pesos by the private sector). In line with this positive development of the LFIP, it should be considered that in the last wave of the Credit Conditions Survey (ECC), the financial institutions consulted expected an increase in the demand for credit perceived for the general level of companies and for SMEs in particular for the second quarter of 20226. With more perspective, since the launch of the LFIP (November 2020) and until May 2022, more than $2.2 trillion has been disbursed in nominal terms (see Graph 2), channeled among approximately 269,300 companies. It is estimated that, although the largest proportion of LFIP resources was allocated to working capital loans, about 37% of the current current balance corresponds to financing of investment projects (with a longer term).
Graph 2 | Financing Line for Productive Investment (LFIP) of MSMEs
In relation to the foreign currency segment, in April the balance of credit to the private sector also fell7, causing the balance of total loans (in domestic and foreign currency) to the private sector to show a decrease of 1% in real terms compared to March (+5% nominal) and 3.7% in year-on-year terms (+52.1% nominal y.o.y.).
On the side of aggregate funding in the financial system, in April the balance of deposits in pesos of the private sector decreased by 0.6% in real terms (+5.3% nominal) (see Chart 3). This performance was explained by the behavior of both demand accounts and time deposits.
Graph 3 | Balance of private sector deposits in pesos
In real terms* – Financial system
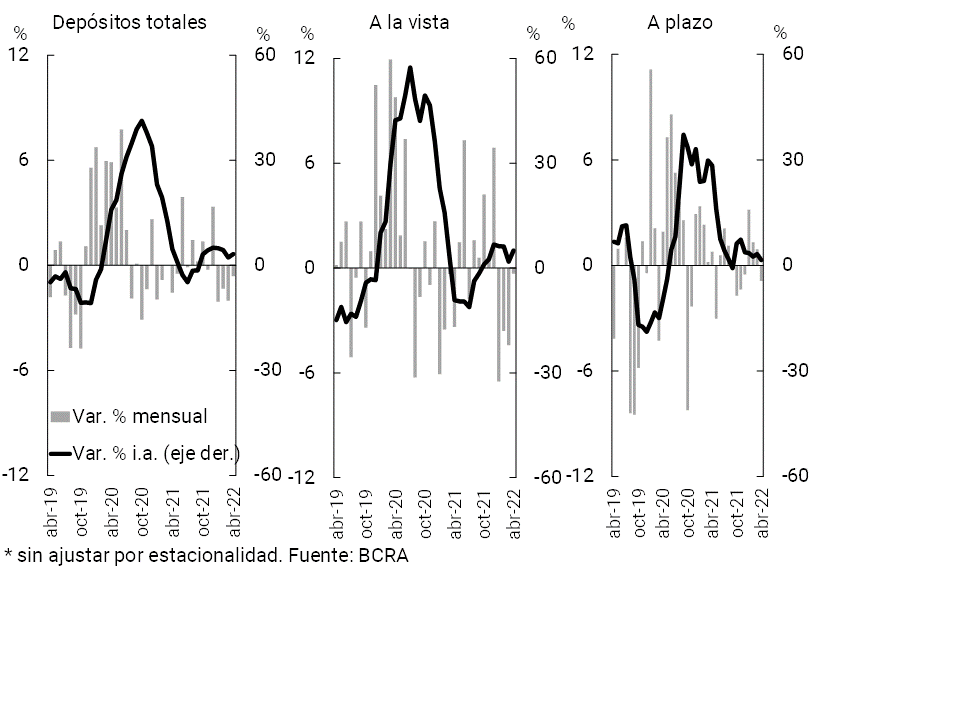
Despite the performance of deposits in the month, time placements in UVA continued to show outstanding dynamism, being an option for safeguarding the real value of depositors’ savings in the context of higher inflation given the international scenario: placements with early cancellation increased 21.3% in real terms in the month. while traditional contracts increased 9.7% in real terms (see Graph 4). Thus, UVA time deposits in the private sector accounted for 6.4% of the balance of time deposits in pesos in April, increasing 1.5 p.p. in a year-on-year comparison.
Figure 4 | Balance of private sector time deposits in pesos
In real terms*
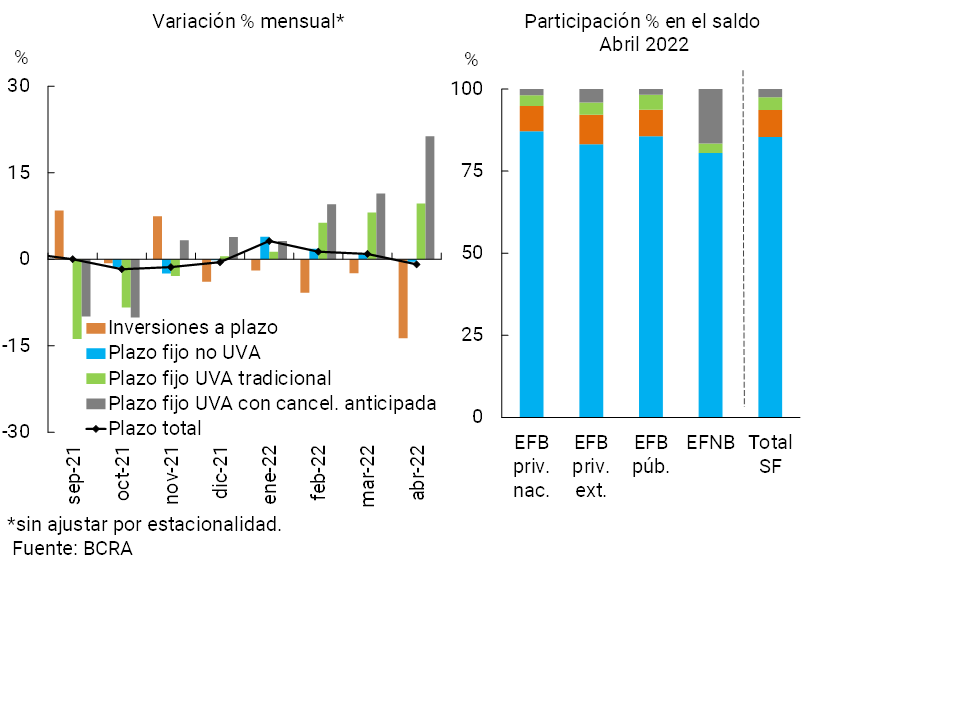
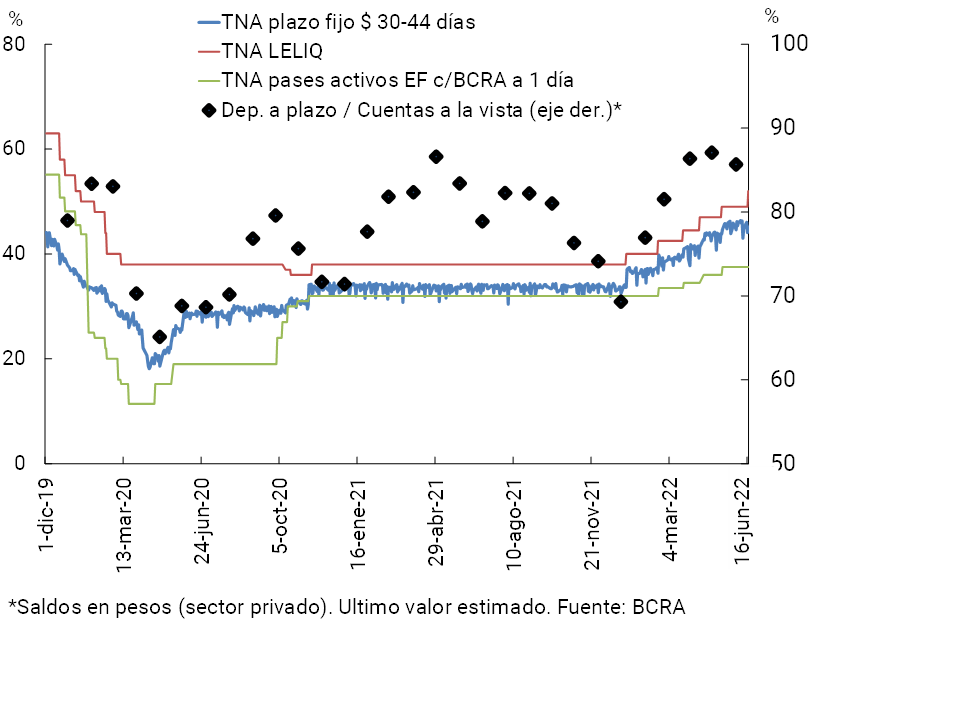
Compared to the end of 2021, total private sector deposits in pesos with a fixed term accumulated an increase of 7.9% in real terms8. This improvement was boosted by the increases in minimum nominal interest rates ordered by the BCRA with the aim of continuing to boost savings in national currency (see Chart 5)9.
Graph 5 | Balance of private sector deposits in pesos
In real terms* – Financial system
For its part, the balance of deposits in foreign currency of the private sector increased slightly in the month (+0.5% in source currency). Thus, total private sector deposits – in domestic and foreign currency – fell slightly compared to March (-0.8% real or +5.2% nominal).
In a year-on-year comparison, the balance of deposits in pesos of the private sector accumulated an increase of 3.2% in real terms (+62.9% nominal), explained both by the demand segment and by time placements (see Chart 3). Meanwhile, public sector deposits in national currency were reduced. Thus, the balance of total deposits in national currency (public and private sector) remained without significant changes compared to that recorded 12 months ago. Considering total deposits (currencies and sectors), the real balance fell by 4.4% YoY in real terms (+50.8% YoY in nominal terms).
II. Aggregate evolution and composition of the balance sheet
The size of the balance sheet (total assets) of the financial system aggregate did not change in magnitude in April 2022 (see Chart 6), while in year-on-year terms it registered a reduction (-2.3% real; +54.2% nominal YoY). This performance was widespread among all groups of financial institutions.
Graph 6 | Total assets of the financial system
In real terms
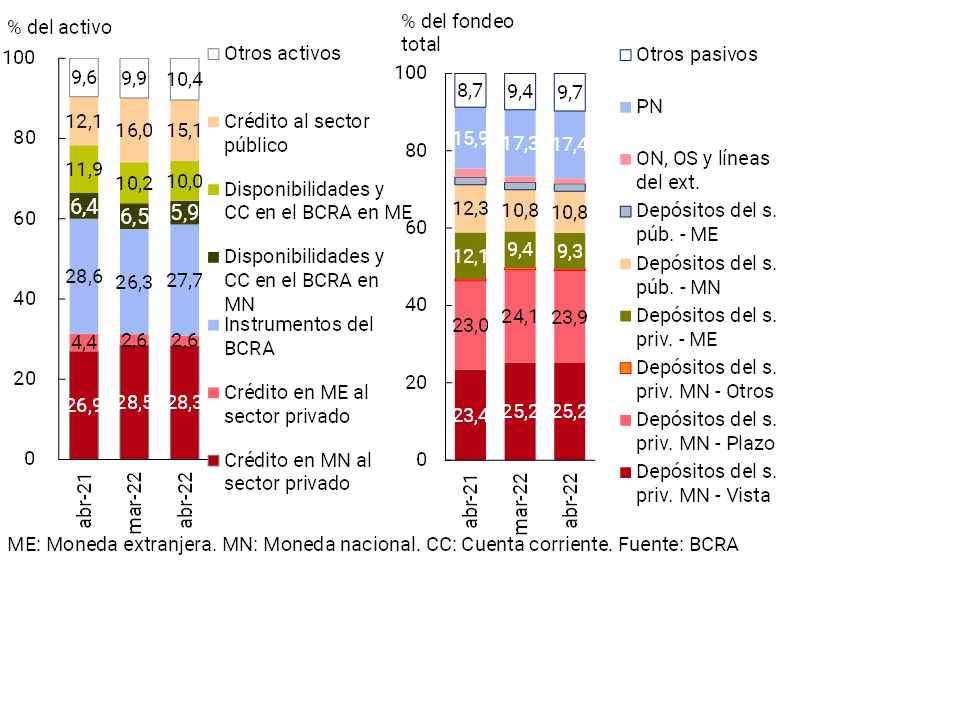
In relation to the composition of the total assets of the aggregate financial system, in April the relative weight of the holdings of BCRA instruments increased (see Chart 7). On the other hand, the remaining items reduced their asset weighting. Regarding the composition of total funding at the aggregate level, in general terms there were no variations in magnitude in the month (see Graph 7). Deposits in pesos from the private sector continued to account for almost half of the total funding of all financial institutions.
Figure 7 | Composition of assets and total funding
Financial system – Share %
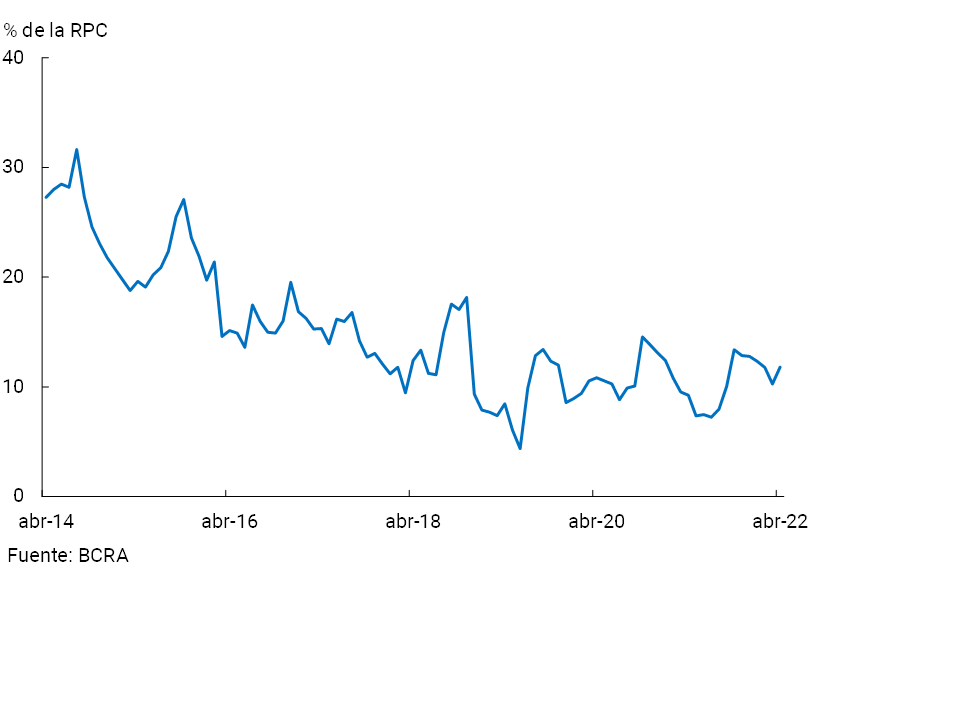
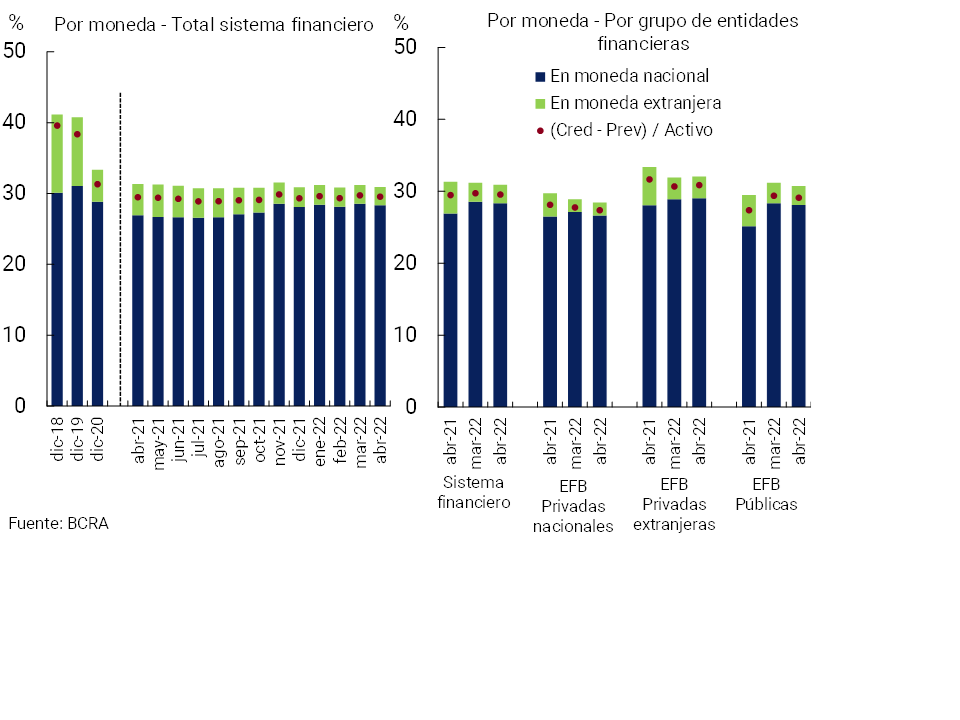
So far this year, the exposure of the balance sheet of the aggregate financial system to items in foreign currency remained at limited levels within the framework of the macroprudential regulations in force. The spread between assets and liabilities of all financial institutions in foreign currency10 represented only 11.8% of regulatory capital in April, increasing slightly compared to last month and to the level of a year ago (+1.5 p.p. and +2.6 p.p., respectively; see Chart 8). This level remained below the local average recorded in the last 8 years (14.9%).
Figure 8 | Asset ME – Liability ME + Forward Position ME
III. Portfolio quality
The gross exposure of the financial system to the private sector (considering domestic and foreign currency) remained historically low and declining in April 2022 (see Chart 9), both in the segment in pesos and in foreign currency. In this context, the total credit balance to the private sector net of forecasts for the aggregate of entities represented 29.6% of assets in April.
Figure 9 | Credit balance to the Private Sector / Assets
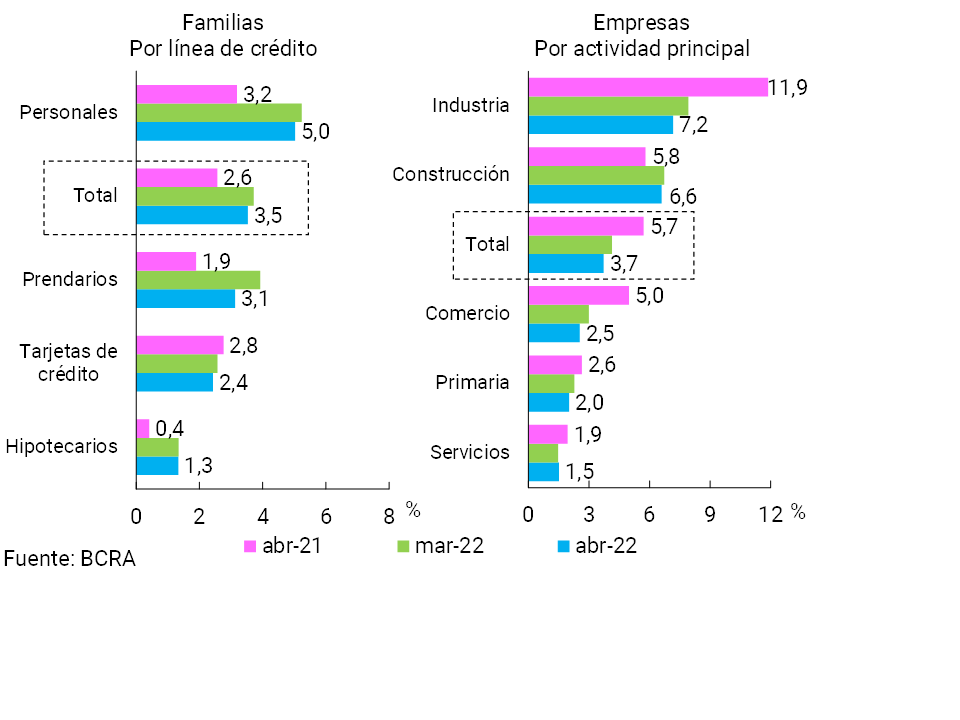
In a context of recovery of economic activity in most segments of activity, the irregularity ratio of credit to the private sector fell by 0.3 p.p. compared to March to 3.6% for the aggregate of system11. The monthly decrease in delinquencies was verified in all groups of financial institutions and debtors (see Graph 10). In particular, in April the non-performing loan ratio to companies fell by 0.4 p.p. on a monthly basis to 3.7%, a trend reflected in all economic sectors (see Chart 11). Similarly, non-performing loans to households decreased by 0.2 p.p. in the month to 3.5%, a generalized performance among the different credit assistance (see Graph 11).
Figure 10 | Irregularity of credit to the private sector
Irregular financing / Total financing (%)
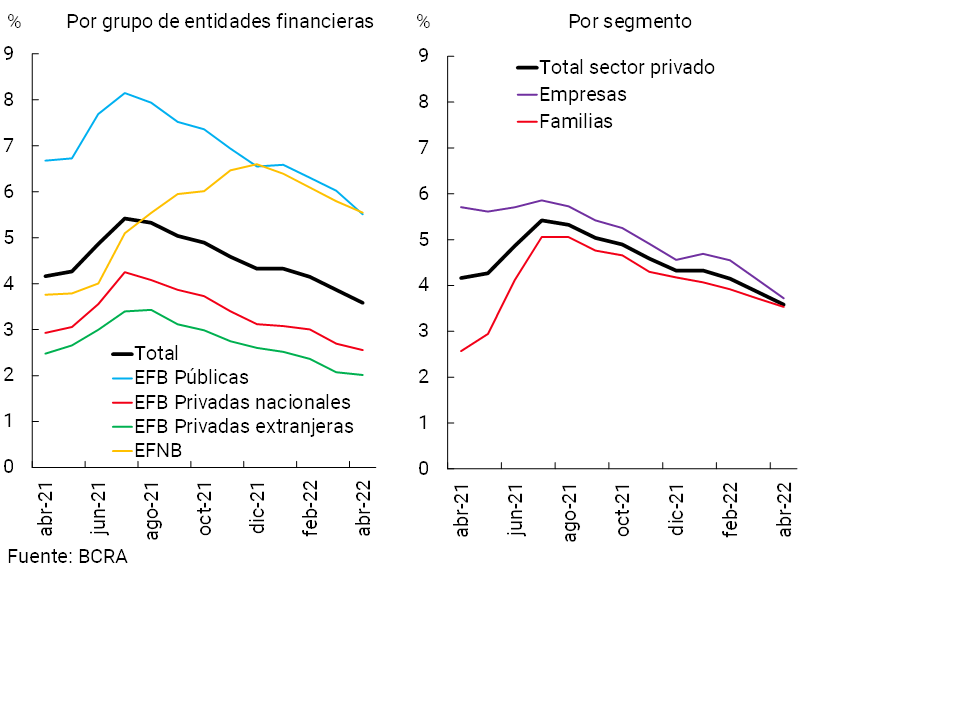
Figure 11 | Irregularity of credit to the private sector
Irregular financing / Total financing (%)
With the decrease recorded in April, the pattern observed since August last year in the non-performing ratio of credit to the private sector (fall of 1.8 p.p.) is consolidated. This dynamic occurred in a context of recomposition of economic activity reflected in most productive sectors, which made it possible to focus and subsequently discontinue the financial relief measures that had been implemented in the context of the pandemic12.
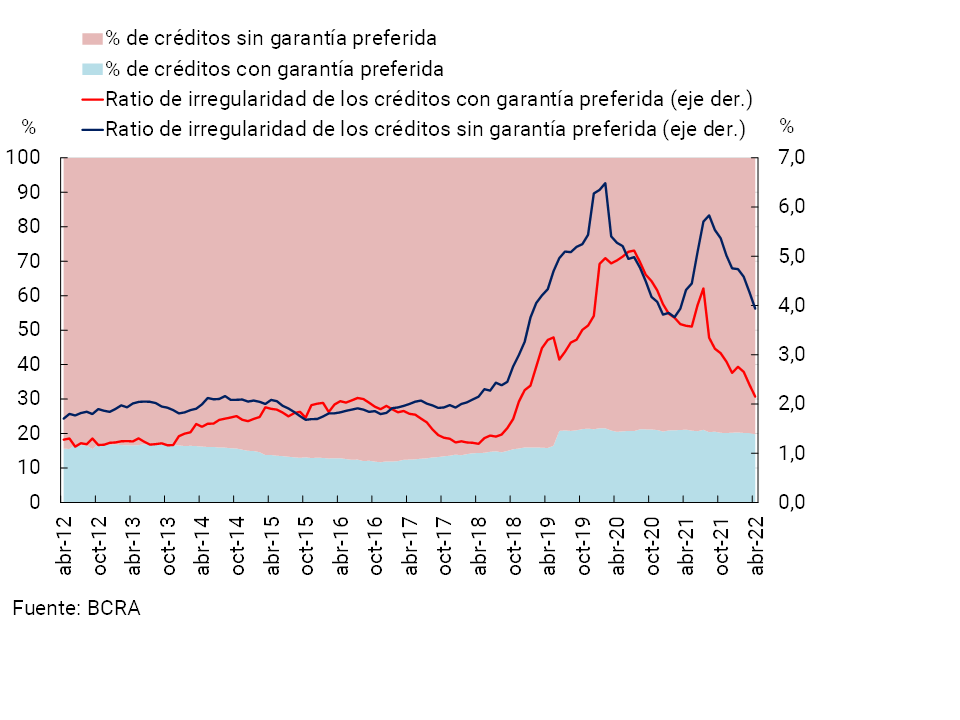
At the systemic level, in April the proportion of financing to the private sector covered with some type of guarantee13 represented 19.8% of the total (16.4% average value of the last 10 years), 0.4 p.p. and 1.4 p.p. below the record of last month and the same period of the previous year, respectively. The NPL ratio of financing with such guarantees at the aggregate level totaled 2.1% in the month (-0.2 p.p. monthly and -1.4 p.p. y.o.y., see Graph 12), while the irregularity of the rest of the private sector portfolio (without preferred collateral) stood at 3.9% in the period (-0.3 p.p. monthly and -0.4 p.p. y.o.y.).
Figure 12 | Financing to the private sector covered by guarantees
Financial system
The sector’s forecast continued at comfortable levels at the beginning of the second quarter. In April, the forecasts of the institutions as a whole represented 4.3% of the total portfolio of loans to the private sector (-0.3 p.p. monthly and -1.5 p.p. y.o.y.) and 118.9% of those classified as in an irregular situation (+3.3 p.p. monthly and -19.9 p.p. y.o.y.)14. In the period, the balance of regulatory forecasts attributable to the non-performing portfolio (following the criteria of the minimum regulatory forecasts for uncollectibility risk) totaled 90.2% of said portfolio at the systemic level.
IV. Liquidity and solvency
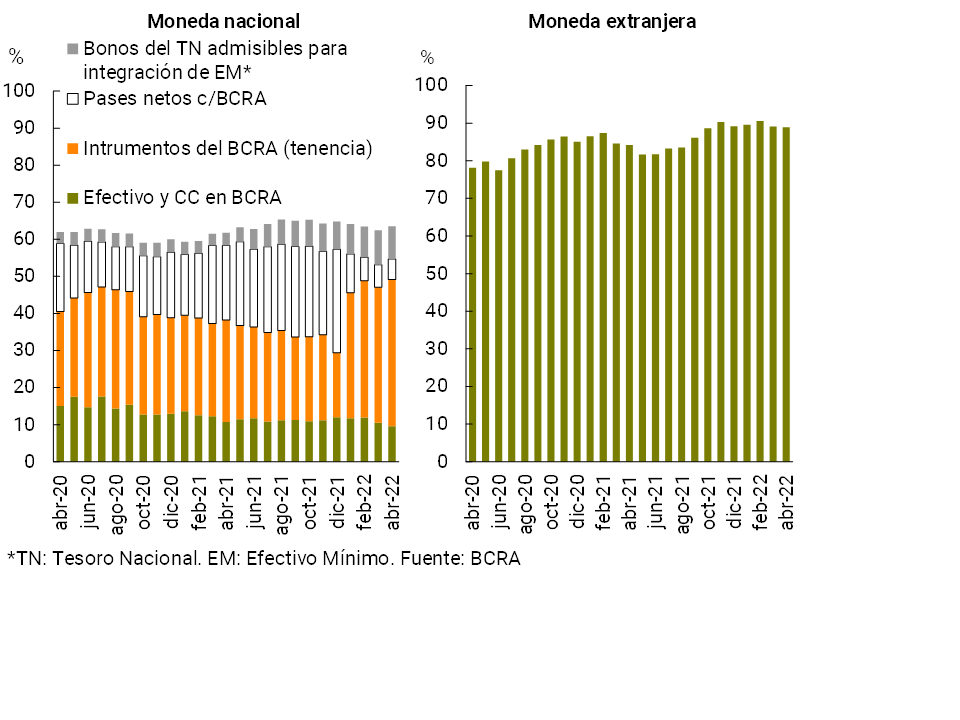
The liquidity indicators of the financial system remained at historically high levels at the beginning of the second quarter. In April, ample liquidity15 totaled 67.5% of total deposits, 0.8 p.p. more than in March. Disaggregated by currency, the broad liquidity ratio stood at 63.5% for items in pesos and 88.9% for items in foreign currency (+1 p.p. and -0.2 p.p. compared to the previous month’s record, respectively, see Chart 13). In terms of the composition of liquidity in national currency, the relative importance of BCRA instruments increased during the month. 16, 17 In the last 12 months to April, the liquidity in the broad sense (in pesos and abroad) of the financial system increased by 1.4 p.p. of total deposits.
Figure 13 | Liquidity of the financial system
In % of deposits
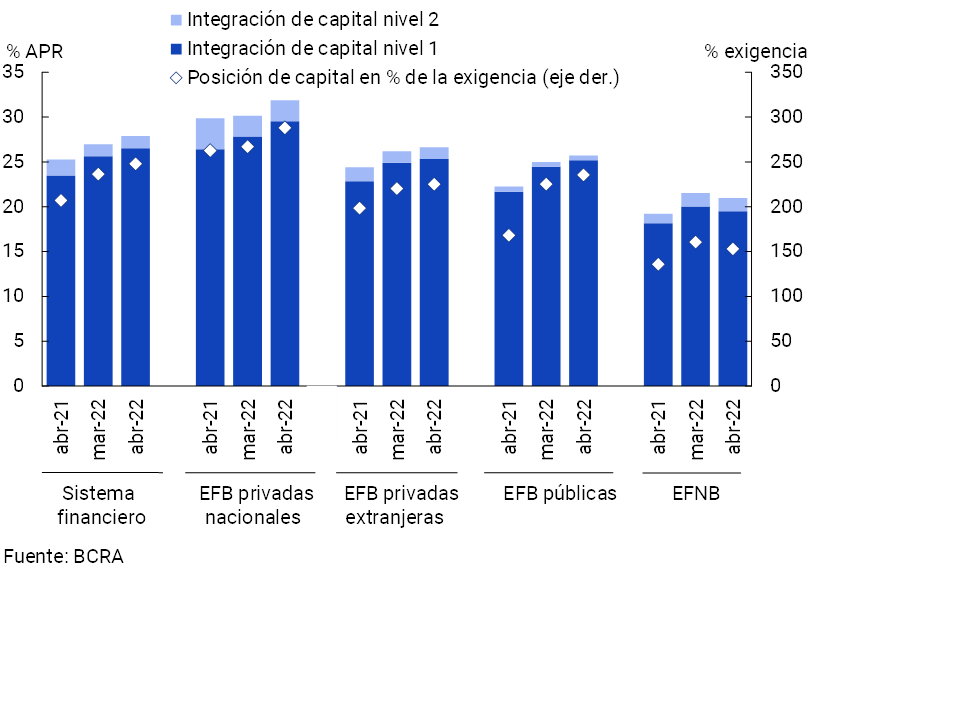
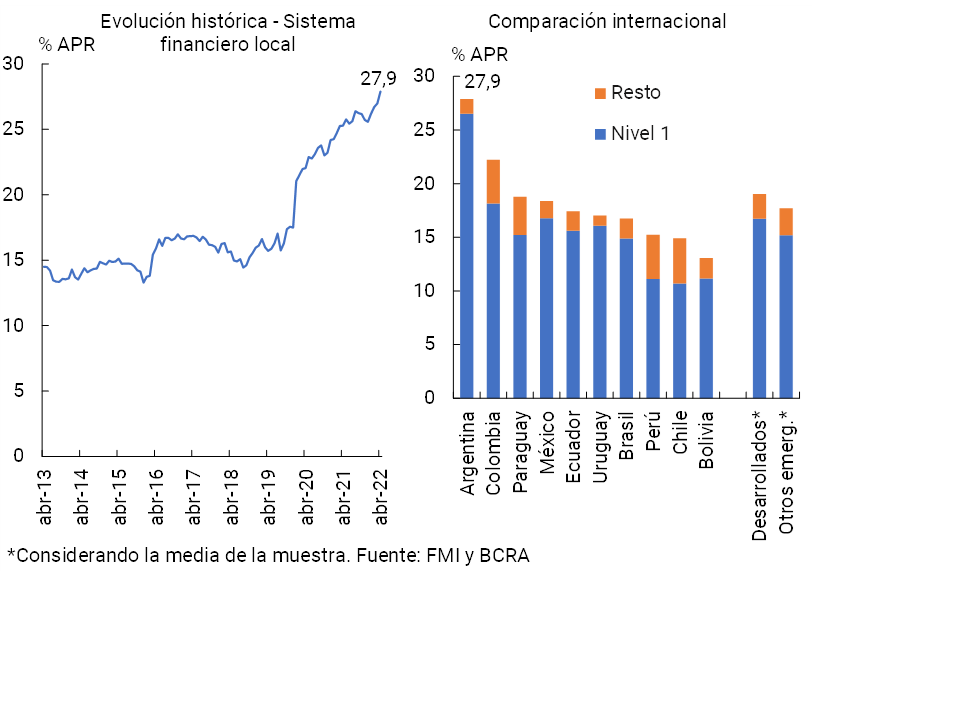
In terms of the sector’s solvency, capital integration (CPR) of the aggregate of entities stood at 27.9% of risk-weighted assets (RWA), 0.9 p.p. above the March level (+2.6 p.p. y.o.y., see Chart 14). Regarding the composition of the PRC, more than 95% was explained by the Level 1 segment, with a greater capacity to absorb potential losses. The capital position – excess capital integration in terms of regulatory requirements – totalled 248% of the regulatory requirement in April at the aggregate level, 11.4 p.p. more than the previous month (+40.8 p.p. y.o.y.). In turn, in April, excess regulatory capital represented 35.7% of the balance of credit to the private sector net offorecasts 18 at the systemic level, well above the average of the last 10 years —15.5%—.
Figure 14 | Integration of regulatory capital
By financial institution group
These solvency levels presented by the sector are high, both from a historical perspective and in comparison with other economies. For example, the capital integration ratio in terms of RWAs of the local financial system is among the highest in the region, also exceeding the average of a sample of other emerging and developed countries (see Chart 15)19. Part of the increase in solvency indicators verified by the sector in recent years was driven by the accrual of positive results, as well as by the macroprudential policies adopted by this Institution in a timely manner to preserve systemic soundness. In particular, in 2020 and 2021, the possibility of distributing dividends to financial institutions was suspended. At the beginning of 2022, the BCRA ordered the gradual normalization of this situation, accompanying the process of recovery of economic activity after the shock of the COVID-19 pandemic20.
Figure 15 | Integration of regulatory capital
Regarding the sector’s internal capital generation, so far in 2022 the profitability indicators of the group of entities were at positive levels (see Chart 16). In the first four months of the year, the total comprehensive results in homogeneous currency for the aggregate financial system totaled 1.1% annualized (y.) of assets (ROA) and 6.4% y. of net worth (ROE), exceeding the records observed in the same period of 2021, below those verified at the beginning of 2020.
Figure 16 | Comprehensive total profit in homogeneous currency of the financial system
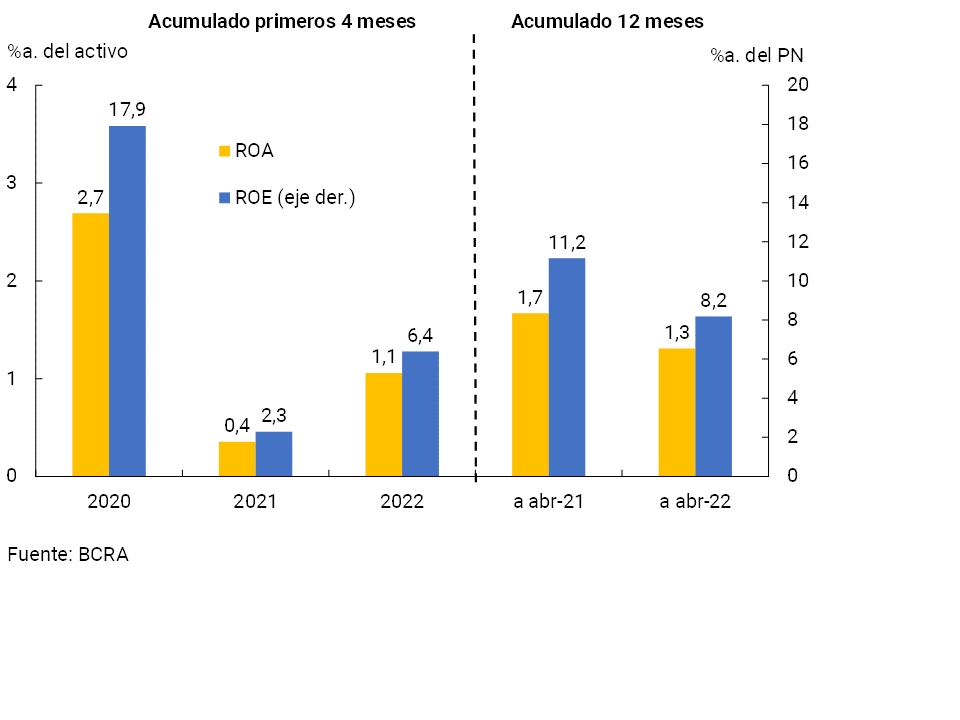
Considering the accumulated of the last 12 months to April, the ROA of the financial system stood at 1.3% and ROE at 8.2%, being 0.4 p.p. and 3 p.p. lower in a year-on-year comparison, respectively (see Chart 16). This reduction mainly reflected the effects of increases in the cost of funding for deposits and greater monetary losses (effect of inflation on balance sheets), factors that were partly tempered by higher income from premiums for passes and securities21, among others.
V. Payment system
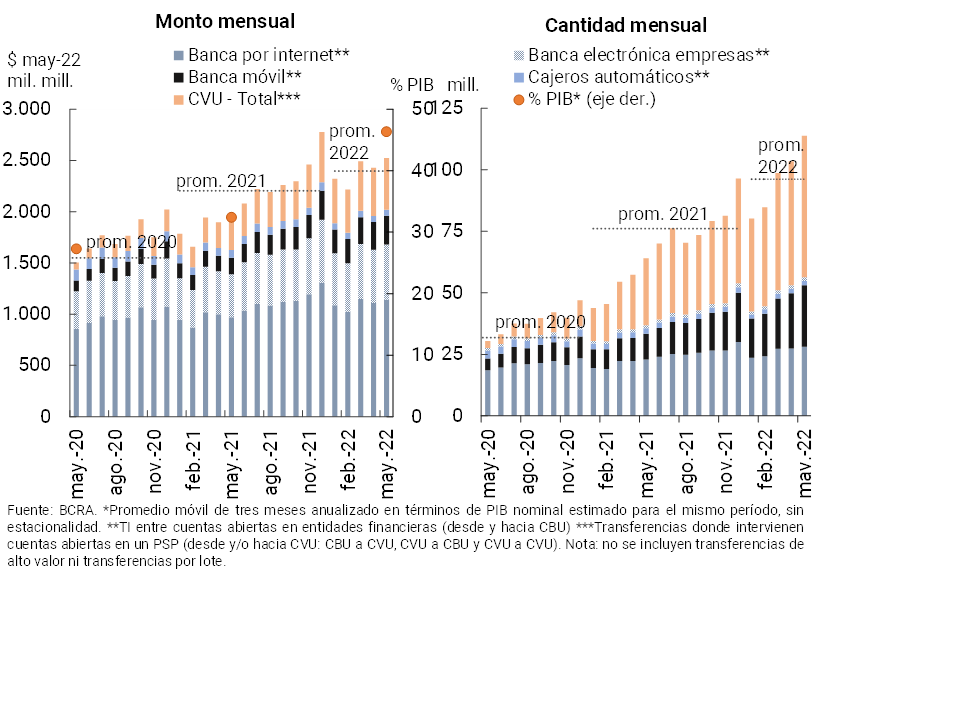
In May, immediate transfers (TI) increased compared to the previous month: 10.1% in amounts and 3.9% in real amounts. In year-on-year terms, these operations continued to show significant dynamism: growth of 77.8% YoY in quantities and 31.9% YoY in real amounts. The year-on-year performance was driven both by transactions between accounts opened in financial institutions via CBU (53.1% YoY in quantities and +24.2% YoY in real amounts)22 as well as by transactions involving accounts in payment service providers (PSPs) from and/or to CVU (+111% YoY in amounts and +75.3% YoY in real amounts)23, which increased their share among TIs: up to 50.6% in quantities (+8 p.p. y.o.y.) and 20% in amounts (+5 p.p. y.o.y.). It is estimated that in May IT represented an amount equivalent to 46.3% of GDP24 (+13.9 p.p. compared to the same month of the previous year, see Graph 17).
Figure 17 | Instant Transfers (TI)
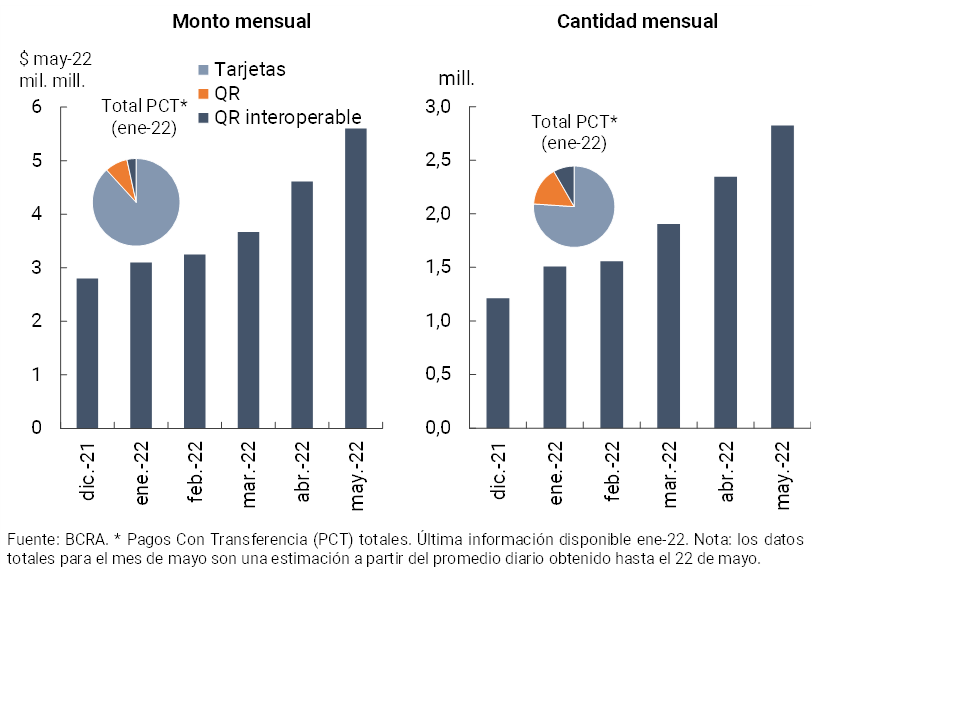
In May, transfer payments (PCT) initiated through interoperable QR codes25 increased significantly compared to the previous month: 20.3% in amounts and 21.3% in real terms in amounts, see Chart 18. Since the beginning of the full QR interoperability scheme (end of November 2021), the cumulative amount of operations under this modality reached 12.5 million as of May, equivalent to $25,408 million at May 2022 prices (resulting in an average of $2,023 per transaction).
Figure 18 | Payments by transfer (PCT)
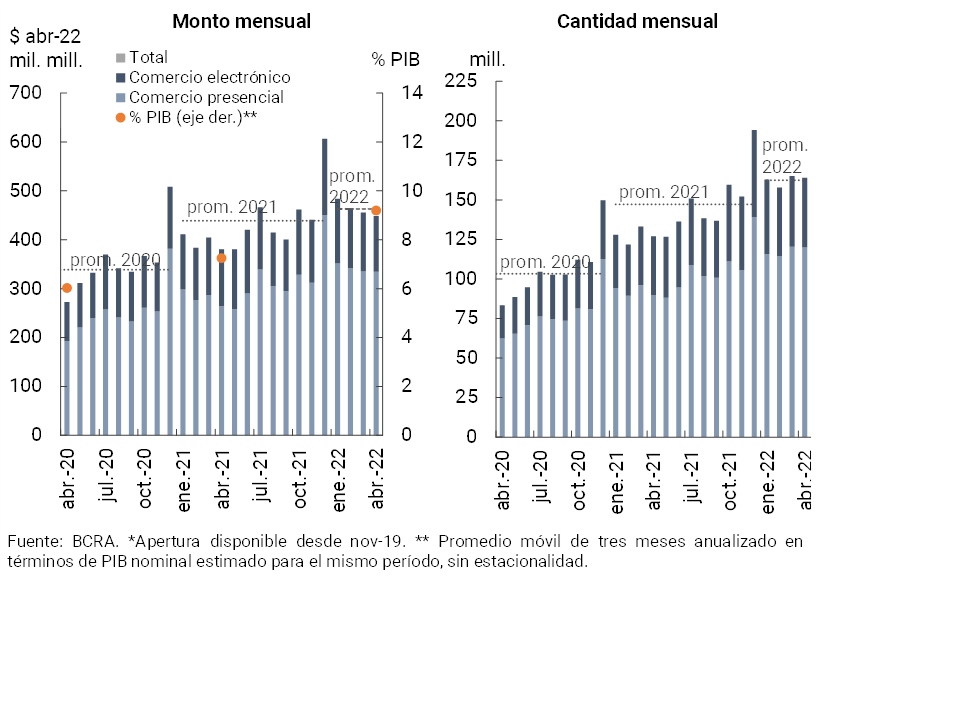
During April (latest available information) debit card transactions decreased compared to the previous month, partly associated with seasonal reasons. However, in year-on-year terms, debit card transactions grew significantly (+29.2% in amounts and +17.9% in real terms in amounts, see Chart 19). This behavior was reflected in both face-to-face and electronic operations26. Thus, it is estimated that debit card transactions represented 9.2% of GDP (2 p.p. more than in the same month of the previous year).
Figure 19 | Debit card transactions
In real terms*
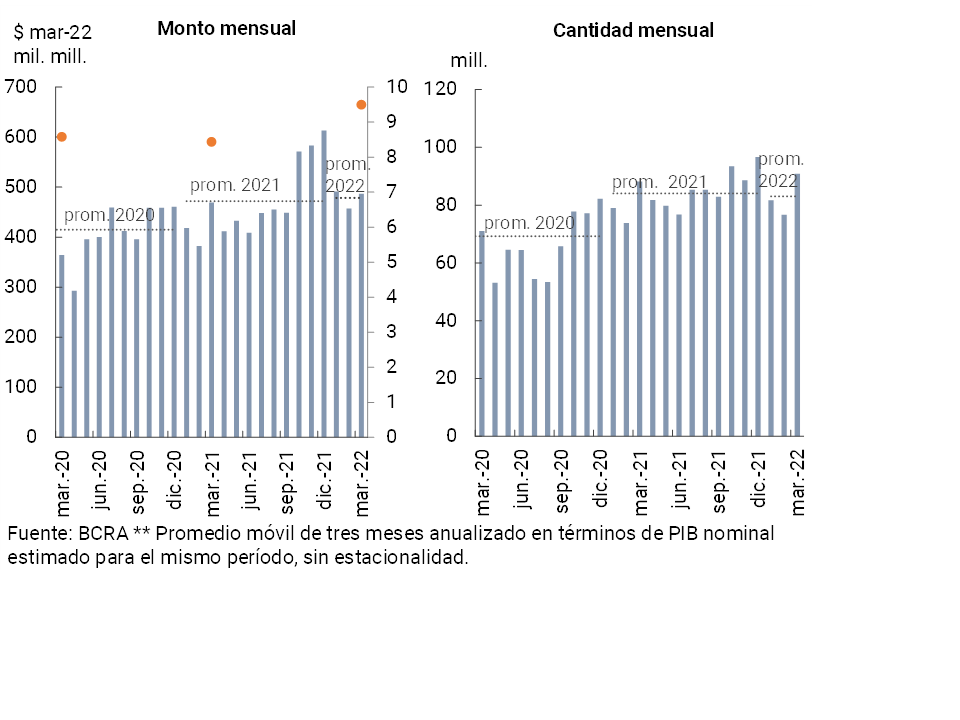
With respect to credit card operations, during March (latest available information) there was a significant increase, associated in part with seasonal factors. In year-on-year terms, credit card transactions increased by 3% YoY in quantities and 3.7% YoY in real terms (see Chart 20). Thus, it is estimated that credit card transactions totaled about 9.6% of GDP (2 p.p. more than in the same month of the previous year).
Figure 20 | Credit card transactions
In May, the clearing of checks increased compared to the previous month (+17.1% in amounts and 16% in real amounts), enabling a year-on-year variation of 15.4% in amounts and 18.4% in real amounts. The year-on-year growth in compensation is entirely due to the performance of the electronic format (+86.7% in quantities and +57.9% in real amounts). Thus, the ECHEQs continued to increase their weighting in total compensation: in May they represented 27.5% in quantities and 52.7% in real amounts (see Graph 21). It is estimated that in the period the amount of cleared checks was equivalent to 28.8% of GDP (+5.5 p.p. y.o.y.).
Figure 21 | Check clearing

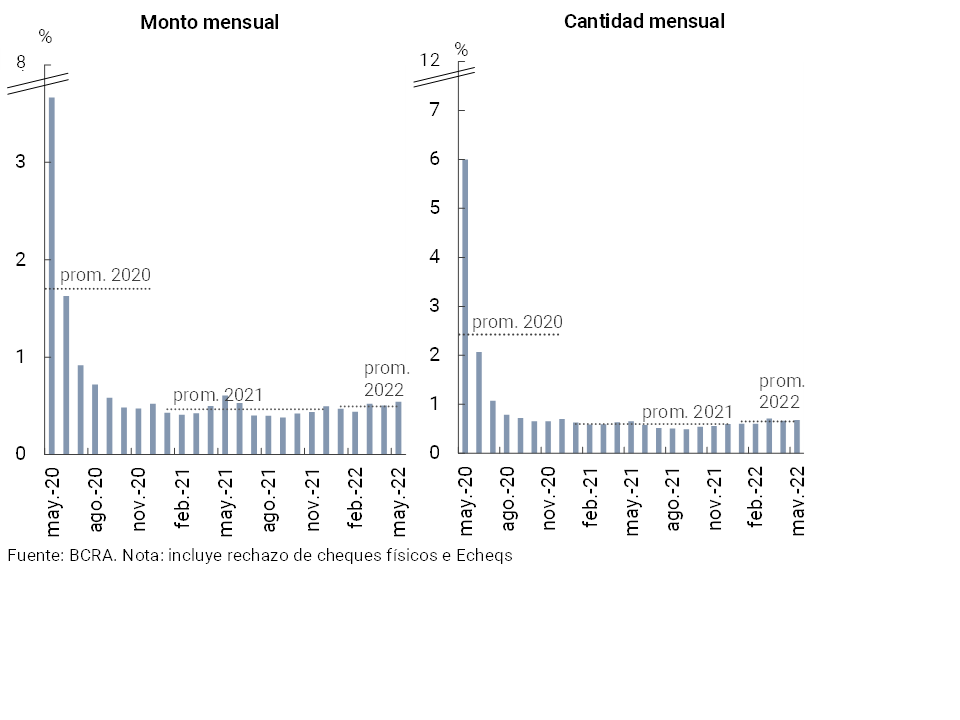
In May, the ratio of rejection of checks due to lack of funds in terms of the total cleared27 increased slightly compared to the previous month (up to 0.7% in amounts and 0.5% in amounts, see Chart 22), remaining in a limited range of values, similar to the average of 2021 and the beginning of 2022.
Figure 22 | Bounce checks due to insufficient funds
Back to top
References
1 Differences in balance sheet balances expressed in homogeneous currency. Information extracted from the Monthly Accounting Information Regime for the Balance Sheet (April 2022, latest information available at the time of publication of this Report).
2 In part due to the placement of dollar-linked securities carried out by the Treasury in the month.
3 Expressed in currency of origin.
4 Includes principal adjustments and accrued interest.
5 For more details, see Ordered text “Financing line for productive investment in MSMEs”.
6 For more detail, see, “ECC Results for the First Quarter of 2022.”.
7 Change in currency of origin influenced by the transfer of loans in an irregular situation (fully provisioned) to off-balance sheet items made by a financial institution (see more details in the Portfolio Quality Section).
8 The increase so far this year was reflected both in the UVA segment (+36.4% real) and in those arranged in pesos at a traditional fixed rate (+6.2% real).
9 For 30-day deposits of individuals, the minimum guaranteed interest rate was set at 53% TNA (68% TEA) as of mid-June. For the rest of the private sector’s fixed-term deposits, the floor was set at 50% TNA (63.2% TEA). This increase in the minimum interest rates of fixed terms accompanied the rise in LELIQ’s 28-day interest rates on six occasions, going from 38% (45.4% TEA) in December 2021 to 52% TNA (66.4% TEA) in mid-June.
10 Includes forward purchase and sale transactions of foreign currency classified off-balance sheet.
11 As observed in March, part of the fall in the NPL indicator would be influenced by the transfer of corporate debt in foreign currency classified in situation 5 (irrecoverable) to off-balance sheet items. It is worth mentioning that these movements do not have an impact on the statement of income or the income statement of the financial system, as they are fully forecasted assets.
12 See Communication “A” “6938”, Communication “A” “7107”, Communication “A” “7181”, Communication “A” “7245”, Communication “A” “7497” and Point 2.1.1. of the Ordered Text “Financial Services in the Framework of the Health Emergency Provided for by Decree No. 260/2020 CORONAVIRUS (COVID-19)”.
13 Guarantees are constituted by the assignment or guarantee of rights with respect to securities or documents (Preferred “A”), and by real rights over assets or commitments of third parties (Preferred “B”) that ensure that the entity will be able to dispose of the funds for the cancellation of the obligation contracted by the client. For more details see, “Ordered Text of Guarantees”).
14 The monthly evolution of these indicators reflects the effect of the accounting movements detailed in footnote 11.
15 It considers availability, assets admitted for the integration of the Minimum Cash requirement and BCRA instruments, in national and foreign currency, all in terms of total deposits.
16 Within the BCRA’s instruments, it is worth noting the growth in the month of NOTALIQ’s holdings, although its weighting in terms of deposits in pesos is limited (slightly above 5% as of April).
17 During the month, certain regulatory changes took place in terms of minimum cash. In particular, in April it was established that the reduction of the minimum cash requirement in pesos is equivalent to 34% (previously 30%) of the balance of financing of investment projects within the framework of the “Financing Line for the productive investment of MSMEs” (see Communication “A 7491”).
18 This ratio reflects the significant capital coverage of the sector as a whole against a possible materialization of credit risk (extreme and very unlikely).
19 If the Tier 1 capital integration ratio is considered as a percentage of RWA, the same conclusions are reached.
20 In 2022, entities can distribute up to 20% of the accumulated profits until December 31, 2021, in twelve consecutive monthly installments (see Communication “A 7421”).
21 It includes those accounted for in the ORI.
22 Regarding transfers between accounts opened in financial institutions via CBU, in the last twelve months the relative increase in transactions through Mobile Banking stood out (+139.5% YoY in amounts and +73.9% YoY in real amounts). In particular, within them, the performance of those operations carried out through digital wallets linked to public banks was even more marked. In April (latest available information), in a year-on-year comparison, operations through BNA+ increased 486.8% YoY in quantities and 372.3% in real amounts, while DNI Account increased its operations by 215.8% YoY in quantities and by 145.3% YoY in real amounts. In this context, the BCRA continued to promote the development of digital wallets, which may allow customers to register accounts provided by other financial institutions (for more information, see “Press Release of May 19, 2022”).
23 Considering the different channels, in May the average amount of each transaction reached almost $370,343 in business electronic banking, $40,706 in internet banking, $33,187 in ATMs, $11,211 in mobile banking and $8,786 in CVU.
24 When considering annualized amounts of the last three months.
25 Within the framework of the Transfers 3.0 scheme, a registry of interoperable wallets was established (for more information, see “BCRA Communication “B” 12333″)
26 The greater openness of the economy due to the relaxation of the measures adopted during COVID-19 corresponds to a greater relative dynamism in face-to-face operations.
27 Consider physical checks as well as electronic checks.
Share on


