I. Financial intermediation activity
The financial system’s intermediation activity with the private sector continued to increase in October, both in the domestic and foreign currency segments.
According to the differences in the balance sheet balances of all entities on the items in pesos – in homogeneous currency – in October the most important sources of resources were the increase in the balance of deposits (all sectors) and the reduction in credit to the public sector. On the side of the most relevant fund applications, the real balance of credit to the private sector and liquid assets (mainly LEFI) increased in the period. With respect to foreign currency items, loans and deposits also increased in October (partly explained by the effect of the Asset Regularization Regime) as well as bank liquidity.
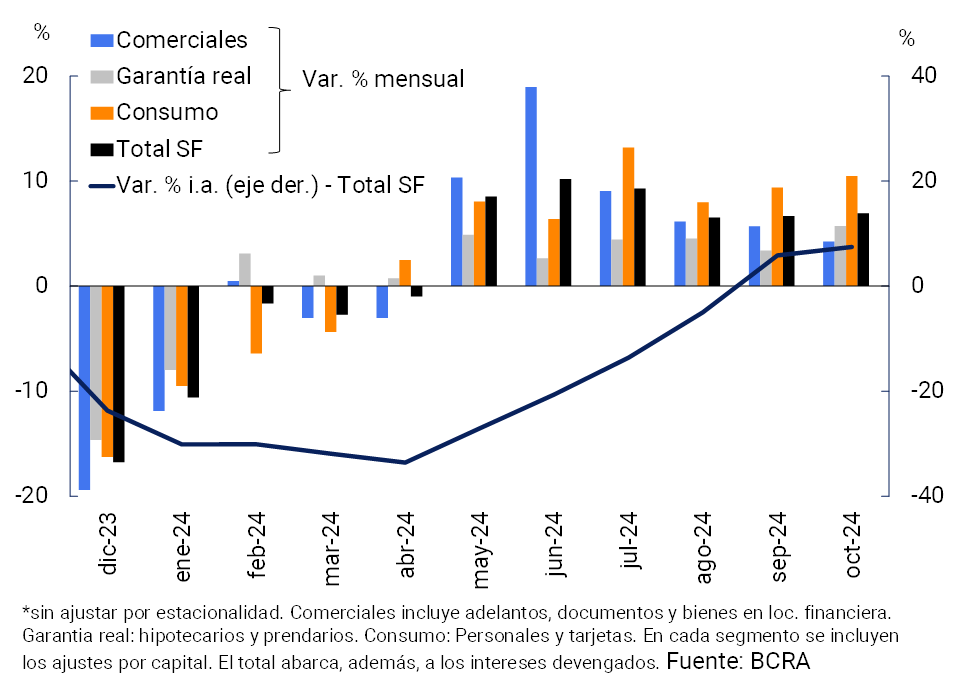
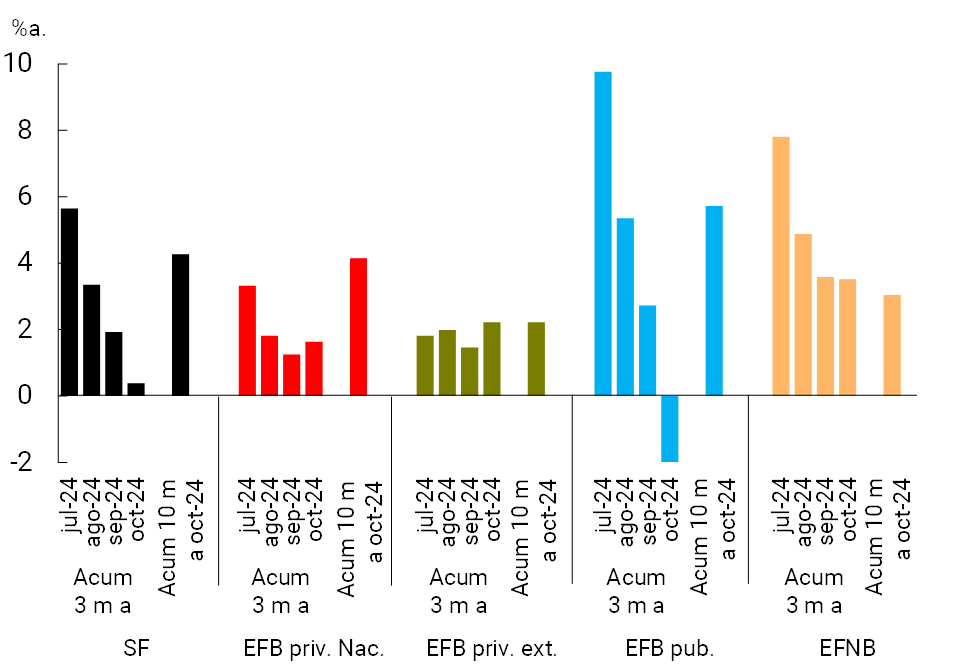
The real balance of credit in national currency to the private sector increased 6.9% in October. The monthly performance was mainly boosted by consumer lines (influenced in part by the seasonality in credit card financing), in a framework in which all credit segments showed increases. The monthly increase in credit was verified in all groups of financial institutions (see Graph 1)1. As a result of the positive evolution of recent months (58.9% real increase since the end of April, when credit began to grow), the real balance of financing in pesos to the private sector increased by 7.5% YoY.
Graph 1 | Balance of credit to the private sector in pesos
Changes in real terms*
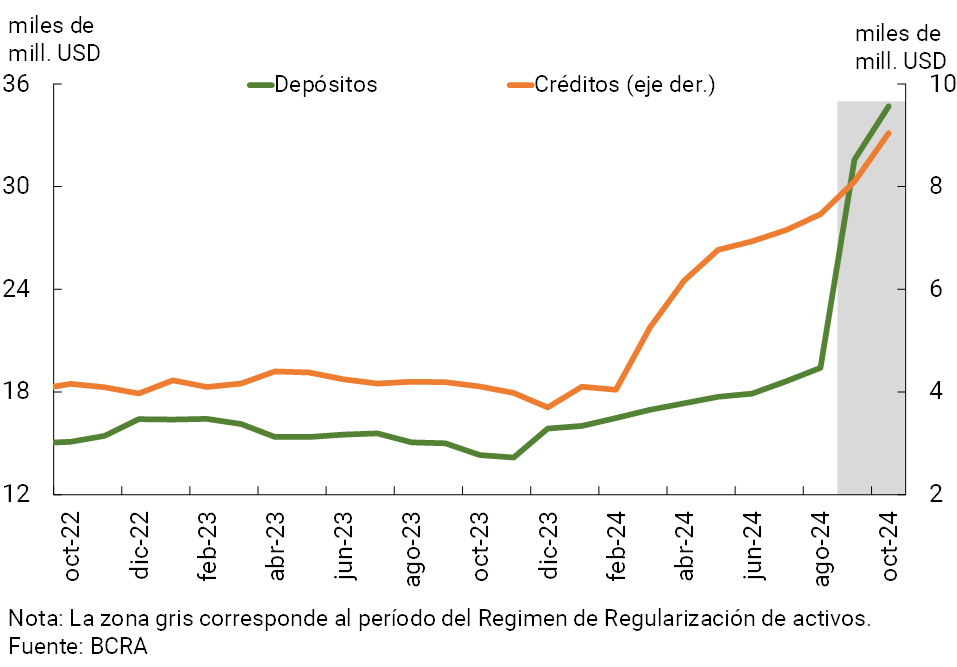
On the side of the segment in foreign currency, in October the balance of financing to the private sector increased 11.6% compared to the previous month —in currency of origin— (see Chart 2). The dynamics in the period were mainly explained by the commercial segment (export pre-financing and documents).
Graph 2 | Financial intermediation with the private sector in foreign
currency In source currency
In this scenario, the total financing balance (in domestic and foreign currency) to the private sector increased by 7.5% in real terms in October, with increases in both the business and household segments (see Chart 3)2. In a year-on-year comparison, the real balance of total credit to the private sector accumulated a growth of 15.8% YoY.
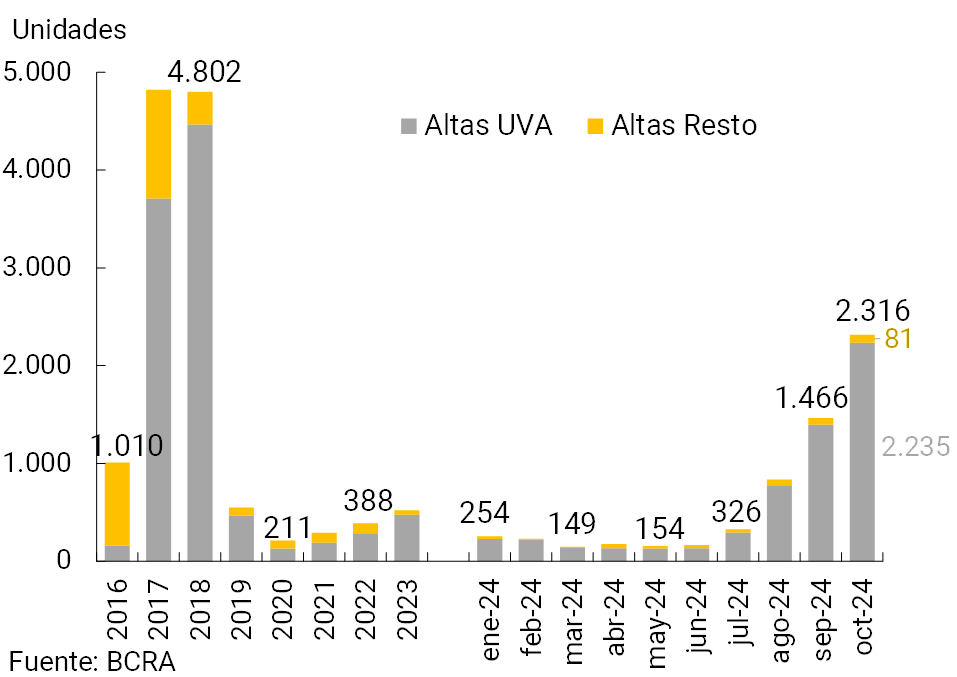
The real balance of mortgage credit continued to gradually accelerate its monthly growth rate in October, increasing 4.7% between peak times of the month – including principal and adjustment of UVA loans. It is estimated that the financial institutions as a whole incorporated more than 2,300 new mortgage debtors in the month (“registrations” of mortgages of individuals), far exceeding the “registrations” that, on a monthly average, were registered in the last 5 years (see Graph 4). Almost all mortgage loans were arranged at UVA.
Graph 3 | Real balance of total credit to the private sector*
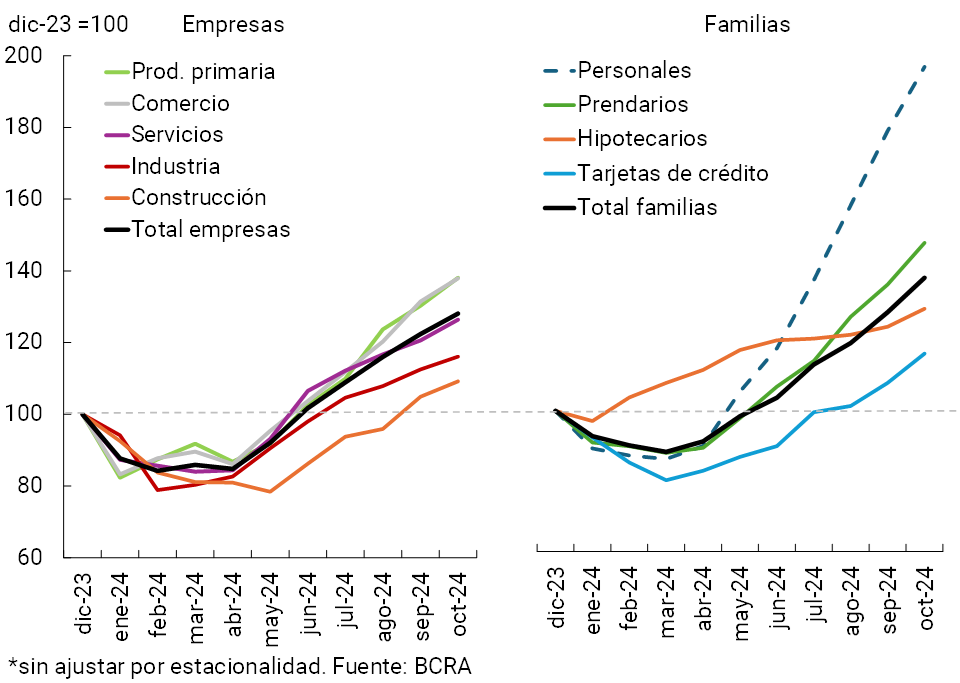
Figure 4 | Estimation of mortgage “registrations” (individuals)
Financial system
With respect to the funding of all financial institutions, in October the balance of deposits in pesos of the private sector increased by 3.7% in real terms (-22.9% y.o.y. in real terms; see Graph 5). Time deposits grew 7.6% in real terms between the end of the month, mainly driven by fixed-rate placements in pesos. Demand accounts grew 0.6% in real terms in the period.
Graph 5 | Balance of private sector deposits in pesos
Changes in real terms*
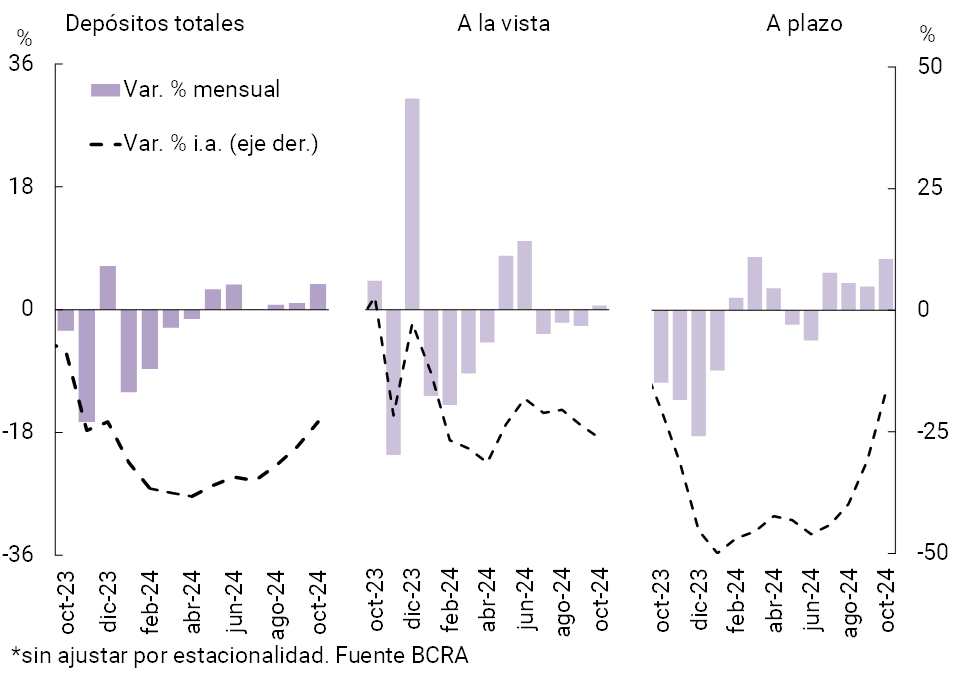
Under the Asset Regularization Regime, the balance of deposits in foreign currency of the private sector increased by 9.8% (in currency of origin) in October. Based on the performance of the last two months, in October the balance of deposits in foreign currency doubled the record of a year ago (see Graph 2). The balance of total deposits (all sectors and currencies) increased by 4% in real terms in the period (-1.5% real y.o.y.).
II. Evolution and aggregate composition of the balance sheet
In October, the balance sheet of the financial system continued to expand based on the inflow of resources in the form of deposits, both in pesos and in foreign currency3. The balance of total assets of the sector grew 2.6% in real terms in the month, a generalized performance among groups of financial institutions. Thus, the total assets of the banks as a whole stood at a level very similar to that of October 2023 in homogeneous currency (+0.4% YoY in real terms), after 13 consecutive months of year-on-year declines.
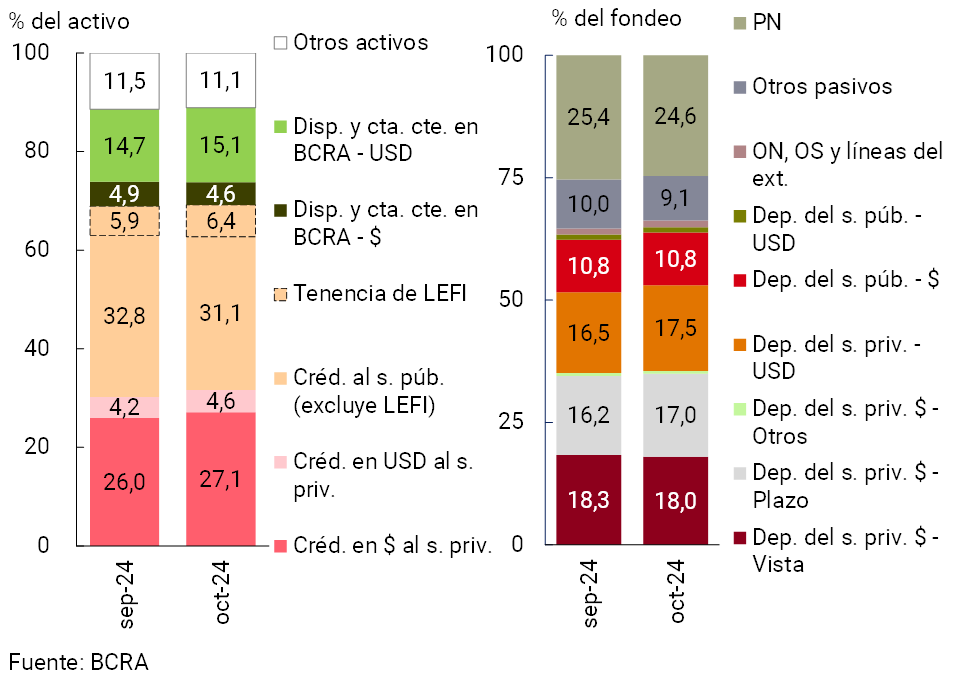
With respect to the main components that make up the total assets of the group of entities, in the month the share of credit in pesos to the private sector increased, while the weighting of financing to the public sector was reduced (see Chart 6). In relation to the most relevant items of total funding, time placements in pesos4 and deposits in foreign currency5 of the private sector increased their relevance in the month, while net worth decreased its relative importance in the total.
Graph 6 | Composition of assets and funding Financial
system – Participation %
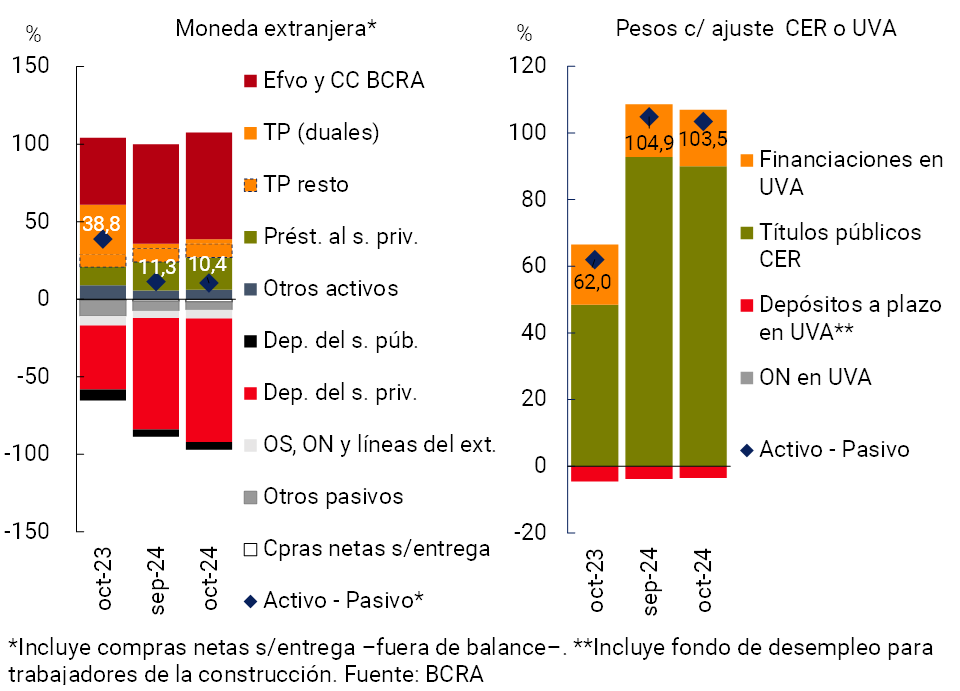
In a month in which the financial system’s foreign currency assets and liabilities increased (see Chart 6 and Section I), the estimated spread between these items narrowed slightly, to 10.4% of the PRC for the sector aggregate (-28.4 p.p. y.o.y., see Chart 7).6 On the other hand, it is estimated that the differential between items in pesos that have capital adjustment by CER (or that are agreed in UVA) totaled 103.5% of the sector’s PRC in the month, 1.4 p.p. below the September record (+41.4 p.p. y.o.y.).
Figure 7 | RDiferential Difference Between Assets and Liabilities
In % of PRC
III. Portfolio quality
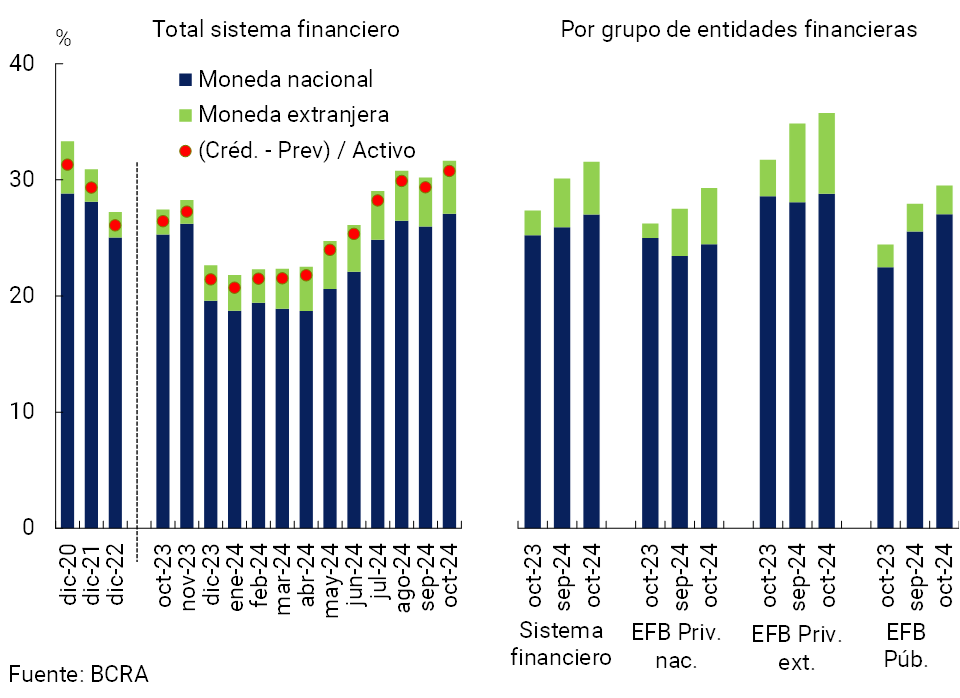
In the month, the balance of credit to the private sector expanded relatively more than the total assets of the financial system, leading to a 1.4 p.p. increase in gross exposure (including domestic and foreign currency) of assets to 31.6% (+4.2 p.p. y.o.y.).7. The monthly performance was generalized among the different groups of financial institutions (see Graph 8). When considering exclusively financing in pesos, the indicator amounted to 27.1% in the period (+1.1 p.p. monthly and +1.8 p.p. y.a.), while the ratio for foreign currency totaled 4.6% (+0.3 p.p. monthly and +2.4 p.p. y.o.y.). If the balance of forecasts is deducted from the aggregate of entities, credit to the total private sector (domestic and foreign currency) represented 30.8% of assets in the month.
Figure 8 | Credit balance to the private sector in terms of assets
By group of financial institutions
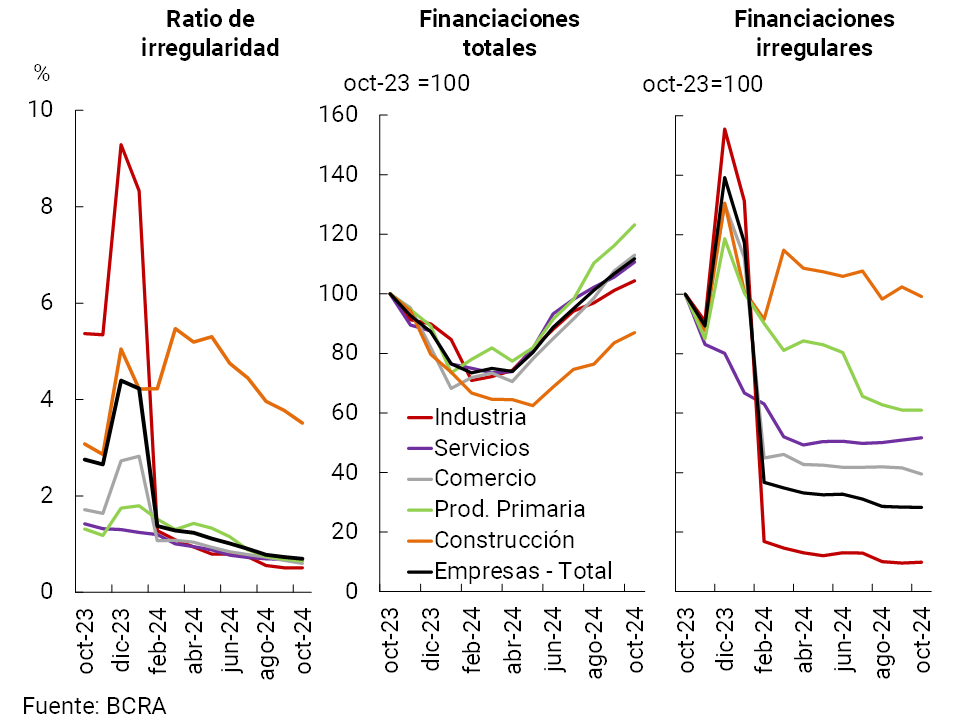
The non-performing loan ratio to the private sector fell slightly in October to 1.5% at the systemic level. The monthly performance of this indicator was mainly explained by the segment of loans to households, whose NPL ratio stood at 2.5%, slightly below the level recorded in September. Except for lines with mortgage guarantees – which maintained their non-performing loans at low levels without significant changes – in the month there was a slight generalized decrease in the irregularity ratios of the different credit assistance to families (see Graph 9). The indicator of the quality of the corporate loan portfolio remained stable in October, at around 0.7%. With the exception of construction loans (which account for only 2.8% of the balance of credit to firms), the relative levels of irregularity in the rest of the economic sectors remained limited and close to the average (see Graph 10)8.
In October, the total balance of forecasts of the financial system represented 181.7% of the irregular portfolio of the private sector, 9.7 p.p. and 53.8 p.p. more than in September and the same period of 2023, respectively. The net forecasts of those attributable to the portfolio in situation 1 and 29 (following the criteria of the minimum regulatory forecasts for uncollectibility risk) stood at 113.4% of the portfolio in an irregular situation for the financial system in the period, increasing 6.8 p.p. compared to last month and 21.6 p.p. y.o.y.
Figure 9 | Irregularity of credit to households
In real terms — Financial system
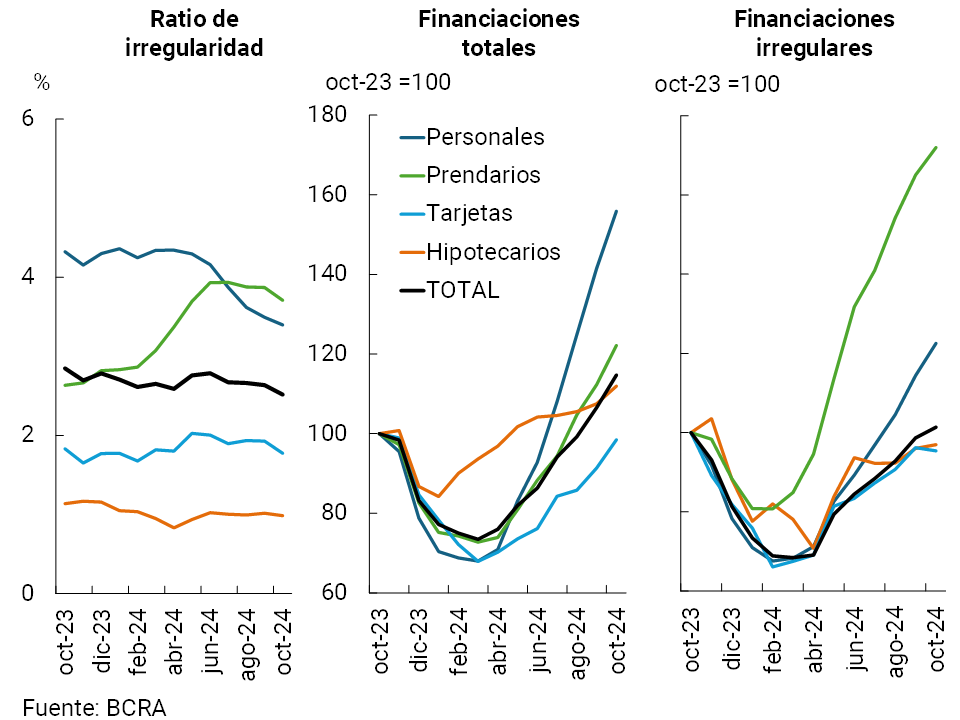
Figure 10 | Integration of regulatory
capital By group of financial institution
IV. Liquidity and solvency
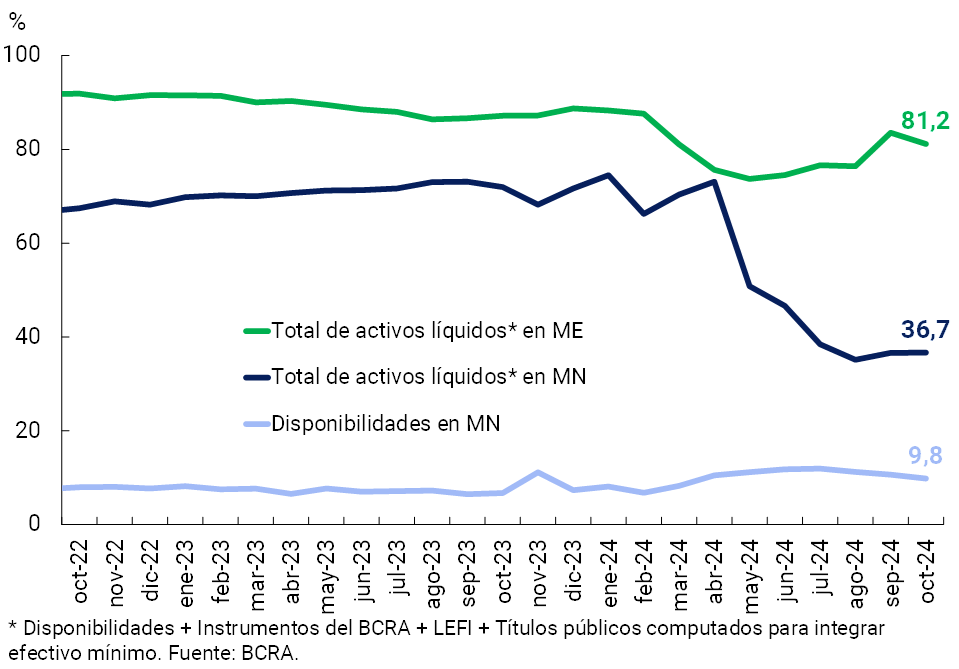
In October, ample liquidity in national currency in the financial system accounted for 36.7% of deposits in pesos, in line with the previous month’s record (+0.1 p.p. monthly and -35.3 p.p. y.a., see Chart 11)10 11. The liquidity ratio for the foreign currency segment stood at 81.2% of deposits in this denomination at the systemic level, 2.4 p.p. less than at the end of September (-6 p.p. y.o.y.).
Figure 11 | Liquidity
indicators Financial system – As % of deposits in each denomination
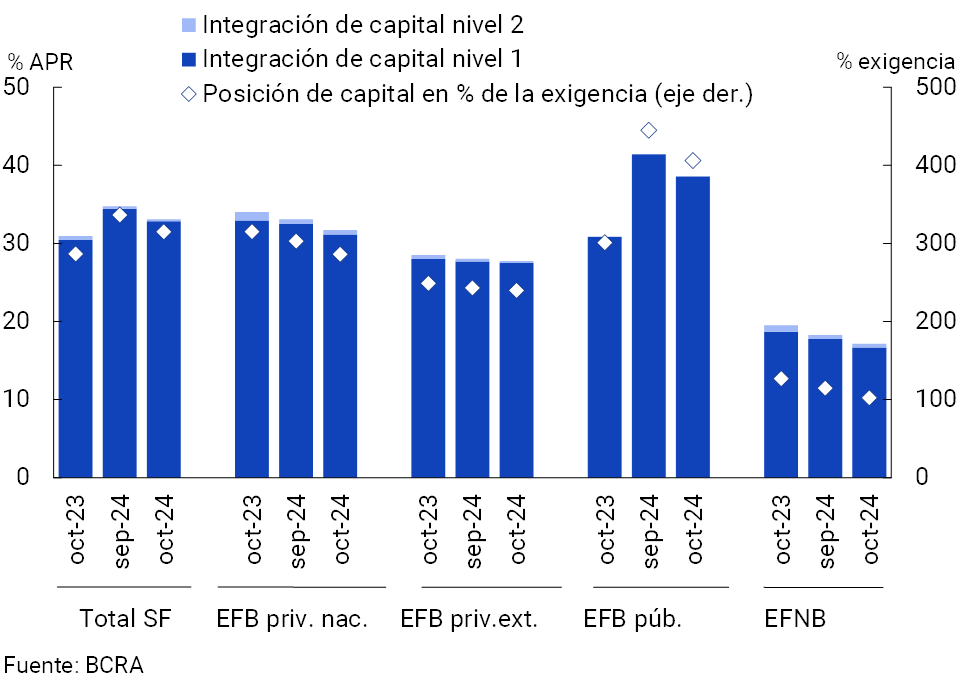
In October, capital integration (CPR) of all institutions accounted for 33.1% of risk-weighted assets (RWA), 1.7 p.p. less than last month (generalized decline among the different groups of institutions, see Chart 12). This performance reflected the effect of a 1.4% real monthly decline in the PRC combined with a 3.6% real increase in RWAs (in line with credit expansion to the private sector). In this context, the excess of regulatory capital in the financial system amounted to 315% of the regulatory requirement and 53% of the balance of credit to the private sector net of provisions.
Figure 12 | Capital Integration
In October, a reduction in the profitability indicators of the financial system continued to be verified. In the last 3 months to October, the total comprehensive profit in homogeneous currency of all entities was equivalent to 0.4% annualized (a.y.) of assets (ROA)12. The gradual decline in this indicator in recent months was mainly explained by the group of public banks (see Chart 13) and, to a lesser extent, by national private banks and by the EFNBs13. In perspective, when considering the cumulative result in 10 months of 2024, public banks have the highest positive ROA record, followed by national private banks. In this context, so far this year, the results – comprehensive and measured in homogeneous currency – accumulated by the aggregate of entities were equivalent to 4.3% of assets (+0.4 p.p. y.o.y.)Question 14.
Figure 13 | Cumulative ROA (3 and 10 months)
By financial institution group
V. Payment system
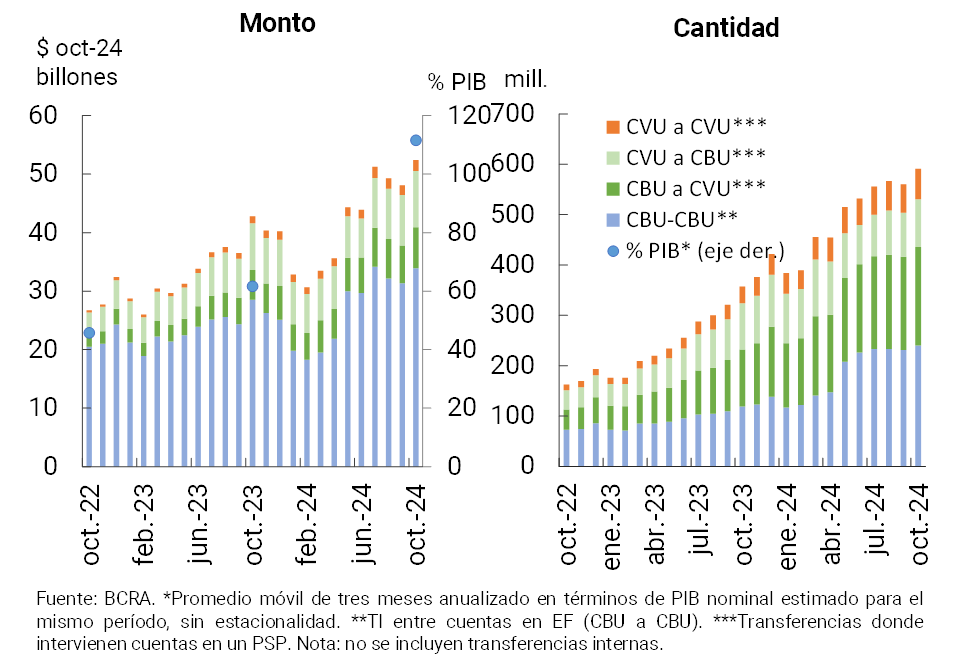
In October, immediate transfers (TI) grew both in amounts (5.4%) and in real amounts (8.5%). In the last twelve months, IT expanded significantly: 65.4% in quantity and 24.2% in real amounts (see Graph 14). The year-on-year performance was mainly driven by transactions between bank accounts (from CBU to CBU) and, to a lesser extent, by transactions between accounts in payment service providers (from CVU to CVU)15 16. In the last 12 months, IT significantly increased its weight in the economy, representing approximately 111.6% of GDP (+49.9 p.p. y.o.y.).
Figure 14 | Instant Transfers (TI)
In the month, Payment with Transfer (PCT) operations through QR codes grew 12.7% in amounts and 14.3% in real amounts. In year-on-year terms, these operations accumulated an increase of 144.2% in quantities and 103.5% in real amounts. Although they start from limited levels, it is estimated that PCTs with QR grew 0.4 p.p. of GDP in the last year to total 1.5%.
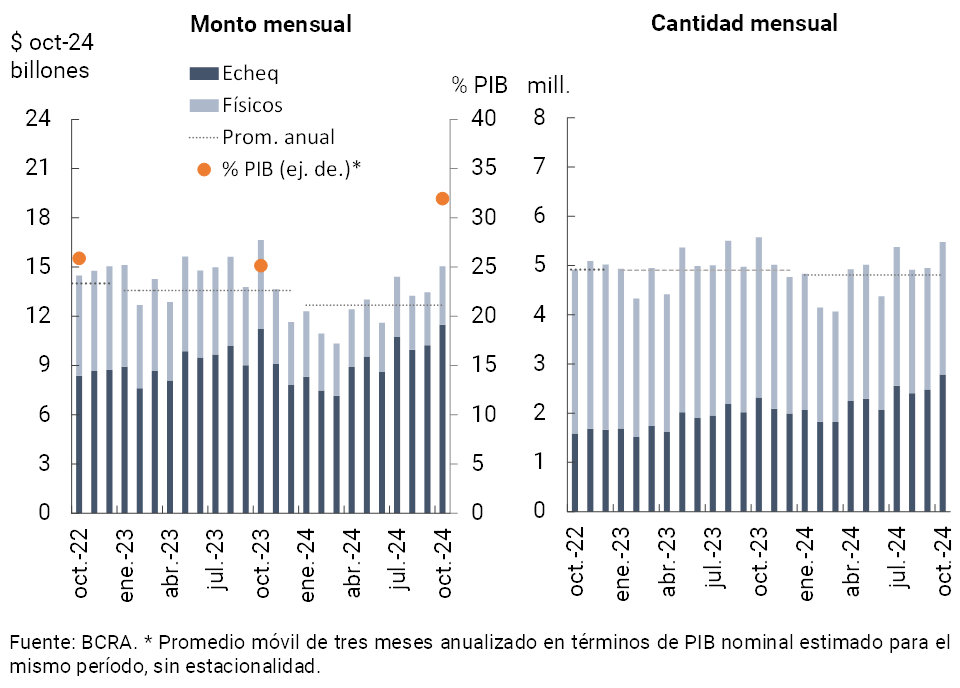
In October, the clearing of checks grew: 10.7% in amounts and 11.8% in real amounts (see Graph 15)17. In the month, the electronic modality -ECHEQs- continued to gain prominence, representing 50.8% and 76.3% of the total number and amount of checks operated in October. In the last 12 months, check clearing has increased its weight in the economy, representing approximately 32% of GDP (+6.8 p.p. y.o.y.).
Figure 15 | Check clearing
On the other hand, the ratio of rejection of checks due to lack of funds (measured in terms of the total compensated) presented a mixed performance in the month, a slight reduction (-0.02 p.p.) in amounts, to 0.65% and a slight increase (+0.05 p.p.) in amounts, to 0.47%. Both ratios were slightly higher than the average so far in 2024.
References
1 Includes principal adjustments and accrued interest.
2 Financing to companies is defined here as that granted to legal entities and commercial financing granted to natural persons. On the other hand, loans to families are considered to be those granted to individuals, unless they are for commercial purposes.
3 As last month (see September 2024 Banking Report), the increase in private sector foreign currency deposits was verified under the Asset Regularization Regime.
4 In a context where Money Market Mutual Funds adjusted their portfolio, migrating from interest-bearing demand deposits to term placements.
5 Within the framework of the “Asset Regularization Regime”.
6 Includes off-balance sheet foreign currency forward purchase and sale transactions. Liabilities include deposits that have variable remuneration depending on the evolution of the exchange rate – associated with the Export Increase Programme – and LEDIV are included in assets. For more details on the intermediation and mismatch of foreign currency in the financial system, see Box 6 of the Financial Stability Report (FSR) of December 2024.
7 While the denominator (total assets) increased 2.6% in real terms in the month, the numerator (credit balance) increased 7.5% in real terms compared to September.
8 A complementary indicator to analyze the transition of the credit rating of debtors between different periods is the Estimated Probability of Default (PDE). In October, the EDP for credit to the private sector stood at 1.6%, falling slightly compared to last month. This monthly reduction in the PDE was mainly explained by the performance of credit to households. The EDP is defined as the proportion of the credit balance that, having been in a regular situation (category 1 and 2) in month T-3, becomes irregular (categories 3, 4 and 5) in month T. For more detail, see Section 3.1 of the December 2024 Financial Stability Report (FSR).
9 Balance of debt in a regular situation.
10 Considers availabilities (cash and current account at the BCRA), fiscal liquidity bills (LEFI), pass operations against the BCRA, holding of BCRA instruments and the balance of the types of public securities that the entities compute as integration of Minimum Cash.
11 When additionally considering the holding of LECAP with a residual term of less than 3 months, the broad indicator of systemic liquidity in national currency would reach 42.7% of total deposits in October.
12 ROE for the last 3 months amounted to 1.5%a.
13 It should be considered that in October a bank of magnitude readjusted the valuation criteria – in accordance with its business model – of part of its portfolio of public securities, leading to a one-off loss.
14 In the year to date, the ROE of the financial system reached 16.3% (-3.8 p.p. y.o.y.). It should be considered that in a year-on-year comparison, the leverage of the financial system (Assets/NP) was reduced: from 5.3 times to 3.8 times, when considering the numerators and implicit denominators for the calculation of the ROA and ROE of 10 months. That is, the sign of year-on-year changes for ROA does not necessarily correspond to the sign of year-on-year changes in ROE.
15 In year-on-year terms as of October, the number of transfers between CVUs increased 82.2% (54.3% in real amounts), while those between CBUs grew 101.5% (21.4% in real amounts). On the other hand, operations between CBU and CVU registered an increase of 73% year-on-year (38.2% in real amounts), while those between CVU and CBU grew more moderately, 3.3% year-on-year (15.4% in real amounts).
16 In October, the average value of immediate transfers (TI) was $86,600 (being $82,180 for the average of 2024, at October values).
17 In October, the average amount of cleared checks was $2.7 million ($1.3 million in the physical format and $4.1 million in ECHEQs). The average monthly value for 2024 for the total compensated amounted to $2.6 million, at October prices.
Share on


