Summary
1. Monetary policy: assessment and outlook
In recent months, global economic activity has slowed and the risks of a recession have increased. Inflation remained at record levels compared to recent decades despite the contractionary bias that sustained monetary policy in most countries. In this environment of less economic dynamism, the prices of agricultural raw materials and metals returned to their levels prior to the war in Ukraine. Financial conditions for developing countries became more adverse: the U.S. dollar tended to appreciate while the yield on financial assets of advanced countries rose and the risk differential of emerging countries increased, implying higher external financing costs for the latter. Going forward, the outlook will continue to depend on the extent to which contractionary monetary policies will affect economic activity and global financial stability and on the ability of China’s COVID-0 policy to disrupt the normal functioning of global value chains.
Economic activity in Argentina continued to expand during the second quarter. Despite the impact of the lower harvest due to drought conditions on agricultural production, GDP grew 1% s.e. Although the leading indicators for July and August indicate a slowdown in growth during the third quarter, it is estimated that activity will resume its growth path in the latter part of the year and at the beginning of next year, in a context of lower financial volatility and greater exchange rate stability. In this macroeconomic environment, the BCRA maintained its credit policy focused on productive development. The Productive Investment Financing Line (LFIP) continued to be the main tool used to channel productive credit to MSMEs under favorable conditions. Since its implementation, and until August 2022, loans granted under the LFIP accumulated disbursements of approximately $2.87 trillion. At the end of August, approximately 300,000 companies had accessed loans under the LFIP. The average balance since the renewal of the LFIP, with data available as of July, stood at $875,000 million, which represented about 38% of commercial loans and 16% of total credit to the private sector. It should be noted that the validity of this line was recently renewed until March 31, 2023, under conditions similar to that of the previous renewal.
The incipient downward trend in monthly inflation rates that had been observed in May and June was interrupted in July when prices rose 7.4% monthly (+2.1 p.p. compared to June). In this sense, there were price increases in a large number of goods and services simultaneously, with a level of dissemination and coordination that is usually only verified in episodes of jumps in the official exchange rate. This inflationary acceleration occurred in an environment of intense financial volatility that led to greater exchange rate uncertainty and, consequently, an increase in inflation expectations. The year-on-year inflation rate also rose to 78.5% in August.
In this context, the BCRA adopted a series of measures to address financial volatility and contain inflation. Primarily, and in line with the policies enunciated last December in the “2022 Objectives and Plans”, reference interest rates were raised on several occasions, accelerating the normalization of monetary policy to converge towards positive real interest rates, with the aim of preserving exchange rate and financial stability. Thus, the interest rate of the 28-day LELIQ remained at 75% n.a. (107.3% e.a.), which implied an increase of 26 p.p. since the previous report. Likewise, it was sought that investments in domestic currency also tend towards positive real returns, reinforcing the transmission channel of monetary policy through the increase of the minimum regulated rates on term placements. Since the end of June, the floor for placements of individuals for up to $10 million increased 22 p.p. to 75% n.a. (107.1% y.a.), while for the rest of the term placements the minimum guaranteed rate rose 16.5 p.p. to 66.5% n.a. (91.1% y.a.).
It is worth remembering that, in an economy like Argentina’s, with a relatively small credit channel, the rise in interest rates acts mainly by encouraging savings in pesos. Its anti-inflationary action therefore largely involves contributing to exchange rate and financial stability, and must be complemented with other economic policy instruments to reduce inflationary inertia.
At the same time, the BCRA sought to reduce financial volatility by using its ability to intervene through open market operations, reaffirming its commitment to operate on the yield curve of public debt in local currency. The BCRA arranged its participation in the secondary market for securities issued by the National Government as of July with a residual term of more than 15 days, buying at rates similar to those of the last auctions, plus a maximum spread of 2%. This action was complemented by a deepening of coordination efforts with the Ministry of Economy of the Nation so that the BCRA’s interest rate structure presents reasonable spreads with National Treasury bills. The BCRA seeks to gradually converge in the medium term towards managing the economy’s liquidity through open market operations (OMA) with Treasury bills and other short-term securities denominated in local currency. This type of mechanism is similar to that used in other countries and is a convenient alternative to reduce the quasi-fiscal cost of monetary policy. To achieve this, the local capital market must assume an increasing importance in the financing of economic actors, the public and private sectors.
On the exchange rate front, the BCRA continued to calibrate the rate of change of the nominal exchange rate so that it is in line with domestic inflation, with the aim of maintaining adequate levels of external competitiveness. The latter was complemented by the improvement of the current regulatory framework in the foreign exchange market, seeking to promote an efficient allocation of foreign currency. Among the measures to encourage foreign exchange income, the policy aimed at the sale of the soybean harvest stood out. The “Export Increase Program” recently came into force, which promotes the liquidation of soybean exports and their by-products between September 5 and 30 from an exchange rate of $200 per dollar. The oilseeds and cereals sector liquidated US$5,300 million through this mechanism at the close of this report. For the demand for foreign currency, the validity of the exchange regulations that favor stability was extended, and exceptions and particular regulatory frameworks were incorporated for the payments of imports linked to certain productive activities, with the aim of responding to the extraordinary needs of foreign currency to meet energy imports, among other measures.
Having recently reached agreement at the technical level between the IMF and the Argentine authorities on the second review of the Extended Facilities Program, at the close of this report its approval by the executive board of the multilateral credit agency was still pending. The review updated local macroeconomic performance in an adverse international context, maintained the existing primary deficit targets of 2.5% of GDP in 2022 and 1.9% of GDP in 2023 and the reserve accumulation targets for the 2022-2023 biennium, for a cumulative amount of US$9,800 million. The monetary policy framework that the BCRA has been implementing since the beginning of the year was also reaffirmed, with a focus on an interest rate policy that ensures nominal returns in line with inflation and a path of the official exchange rate that preserves the levels of external competitiveness of the economy. Likewise, a structural agenda is consolidated that includes actions to strengthen the BCRA’s balance sheet, design a roadmap for the gradual relaxation of exchange controls, and other aspects of the National Government’s policy such as the fight against tax evasion and money laundering, including efforts to promote information exchanges and international cooperation mechanisms.
After the increase in the monetary policy interest rate, the successful exchange of short-term instruments of the public debt, the initiatives aimed at consolidating the process of reducing the fiscal deficit and monetary financing, and the new price agreement programs, both the National Government and the BCRA will continue to adopt measures to lower inflation. As for the BCRA, it will conduct its monetary policy by adjusting interest rates to keep them in positive territory in real terms and without granting net transitory advances to the National Treasury for the remainder of the year, remaining below the target committed to the IMF, managing liquidity to preserve monetary balance and maintaining the crawling peg exchange rate scheme to preserve external competitiveness.
2. International Context
Global economic activity continued to slow from the previous IPOM, increasing risks of a recession, while inflationary pressures have intensified. The rise in interest rates in advanced countries has increasingly impacted financial activity and conditions, while high energy prices persist, accentuated by the war in Ukraine. The partial revival of supply and recessionary risk have pushed agricultural commodity and metal prices back to their pre-conflict levels. Global supply chains are tending to normalise, but their continuity depends to a large extent on the evolution of COVID-19 in China, where mobility restrictions have been maintained throughout the year.
In response to inflation, most central banks in advanced countries have accentuated the contractionary bias of monetary policy. Developing countries face more adverse financial conditions: not only have advanced-country asset yields risen and the US dollar appreciated, but the risk spread of emerging countries has also widened. This tightening has negatively interacted with commodity prices. Going forward, the outlook will continue to depend on how persistent high inflation is, and the extent to which monetary tightening affects global economic activity and financial stability.
2.1. COVID-19: milder new wave, but the risk of restrictions in China continues due to their global economic impact
Since the last IPOM, a new global wave of COVID-19 infections has taken place, driven by the BA.4 and BA.5 subvariants of the Omicron strain. It was far from reaching the severity of the one that began last December with the emergence of the Omicron variant, both in terms of its intensity and duration and the number of deaths.
In this new phase of the spread of the disease, the curve of global infections reached a peak of 7.75 million per week at the end of July, more than doubling those recorded fifty days ago. Since then, the weekly number of infected people globally began to fall, reaching around 3.14 million at the end of September, returning to the lows recorded at the beginning of the current wave (see Figure 2.1). Deaths from COVID-19 increased throughout this phase, going from 9,200 accumulated in seven days at the beginning of June to a maximum of 17,700 (+92%) in the first half of August, and then falling back to 10,600 deaths per week so far in September.
Figure 2.1 | New cases and deaths from COVID-19
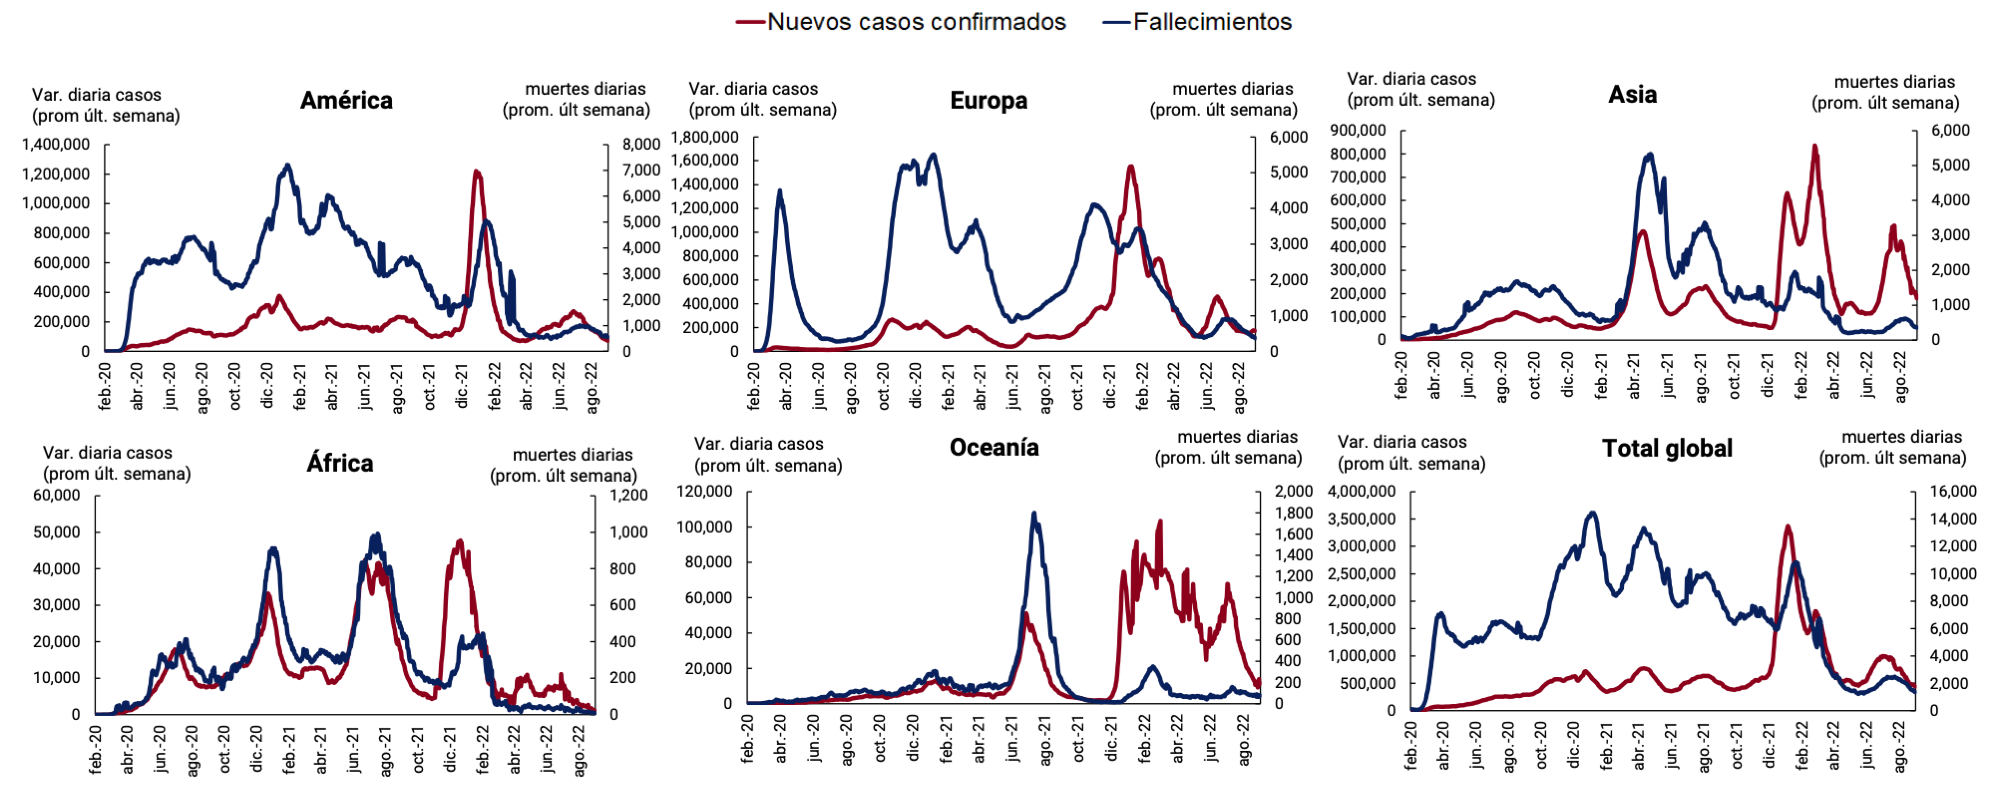
Source: BCRA based on data from the World Health Organization.
The recent spread of the Coronavirus was initially driven by Europe, North America and South America. Subsequently, when these regions reached their peaks in mid-July, new cases in Asia began to accelerate significantly, led by Japan and South Korea, becoming the epicenter of the wave. Having reached their maximum values in the first half of August, weekly infections in Asia began their decline, adding to the trend that the rest of the regions had been exhibiting for a month.
Globally, the mortality rate consolidated at levels close to 0.25%, much lower than those recorded during 2021, which exceeded 1.5% for almost the entire year, with maximums of 2.7%. These values reflect the effectiveness of vaccines and progress in immunization campaigns. In fact, information from September shows that 67.68% of the world’s population has received at least one dose and 62.22% the complete initial schedule. However, wide gaps in coverage remain between high- and upper-middle-income countries and low-income countries. In the former, between 74% and 79% of its population is fully vaccinated while, in the latter, they barely reach 17%. The differences are even more marked when comparing booster doses, which are very important to face the new variants of the Coronavirus. High-income countries have applied 57 doses per 100 inhabitants, upper-middle-income countries 48 and low-income countries only 1.30 per 100 inhabitants.
During July and early August, China experienced a rise in cases, reaching a peak of 21,000 weekly infections in mid-August. These values are well below the 185,000 that it registered in the wave it experienced last April and are very low in relation to its population. However, after the relaxation of mobility restrictions in the second quarter, following its COVID 0 policy, the government increased restrictions again weeks ago in several major cities, whose effect on the global economy is still difficult to measure.
2.2. The global economy showed a slower pace of expansion in the second quarter, with a further downward revision of growth forecasts for this year
During the second quarter, the three factors that affected the global economy in the first months of 2022 were maintained, with varying intensity: the war in Ukraine, with its impact on economic activity and commodity prices; the restrictions on mobility in China to deal with the pandemic, with its effect on international trade and global supply chains; and, with increasing weight, the contractionary monetary cycle of the US Federal Reserve (Fed), with its consequences on economic activity and global financial conditions.
In the United States, output fell again in the second quarter (-0.2% qoq/s), surprising market forecasts that foresaw a return to growth (see Figure 2.2a). Investment in inventories was the main factor behind the GDP contraction, followed by residential investment and government spending. Business fixed investment and household consumption grew, but at a slower quarterly rate, while net trade made a positive contribution for the first time in two years. This dynamic generated a debate about whether the US economy would have entered a recession: it meets the technical criterion of two consecutive quarters of falling GDP, but the labor market continues to be strong, with non-agricultural job creation well above pre-pandemic levels (528 thousand new jobs in July compared to an average of 164 thousand in 2019) and the unemployment rate at a minimum level that is not it had been recorded since the end of the sixties (3.5% in July).
In China, GDP felt the full impact of the COVID 0 policy, with a sharp contraction in the second quarter (-2.6% QoQ/S), while in the United Kingdom, the economy also fell after four quarters of expansion (-0.1% QoQ/S) (see Figure 2.2a). On the other hand, growth remained in the euro area (+0.8% quarter-on-quarter s.e.), although with a more negative outlook for the coming months due to doubts about the supply of Russian energy, in Brazil (+1.2% quarter-on-quarter s.e.), and returned in Japan with the reopening of the economy in the face of the drop in COVID-19 cases (+0.9% quarter-on-quarter s.e.). Two and a half years after the start of COVID-19, the aforementioned economies, except China, have not managed to exceed their pre-pandemic levels by more than 3% (see Figure 2.2b).
Figure 2.2 | Evolution of GDP in selected countries (real GDP without seasonality)
to. Quarterly % change
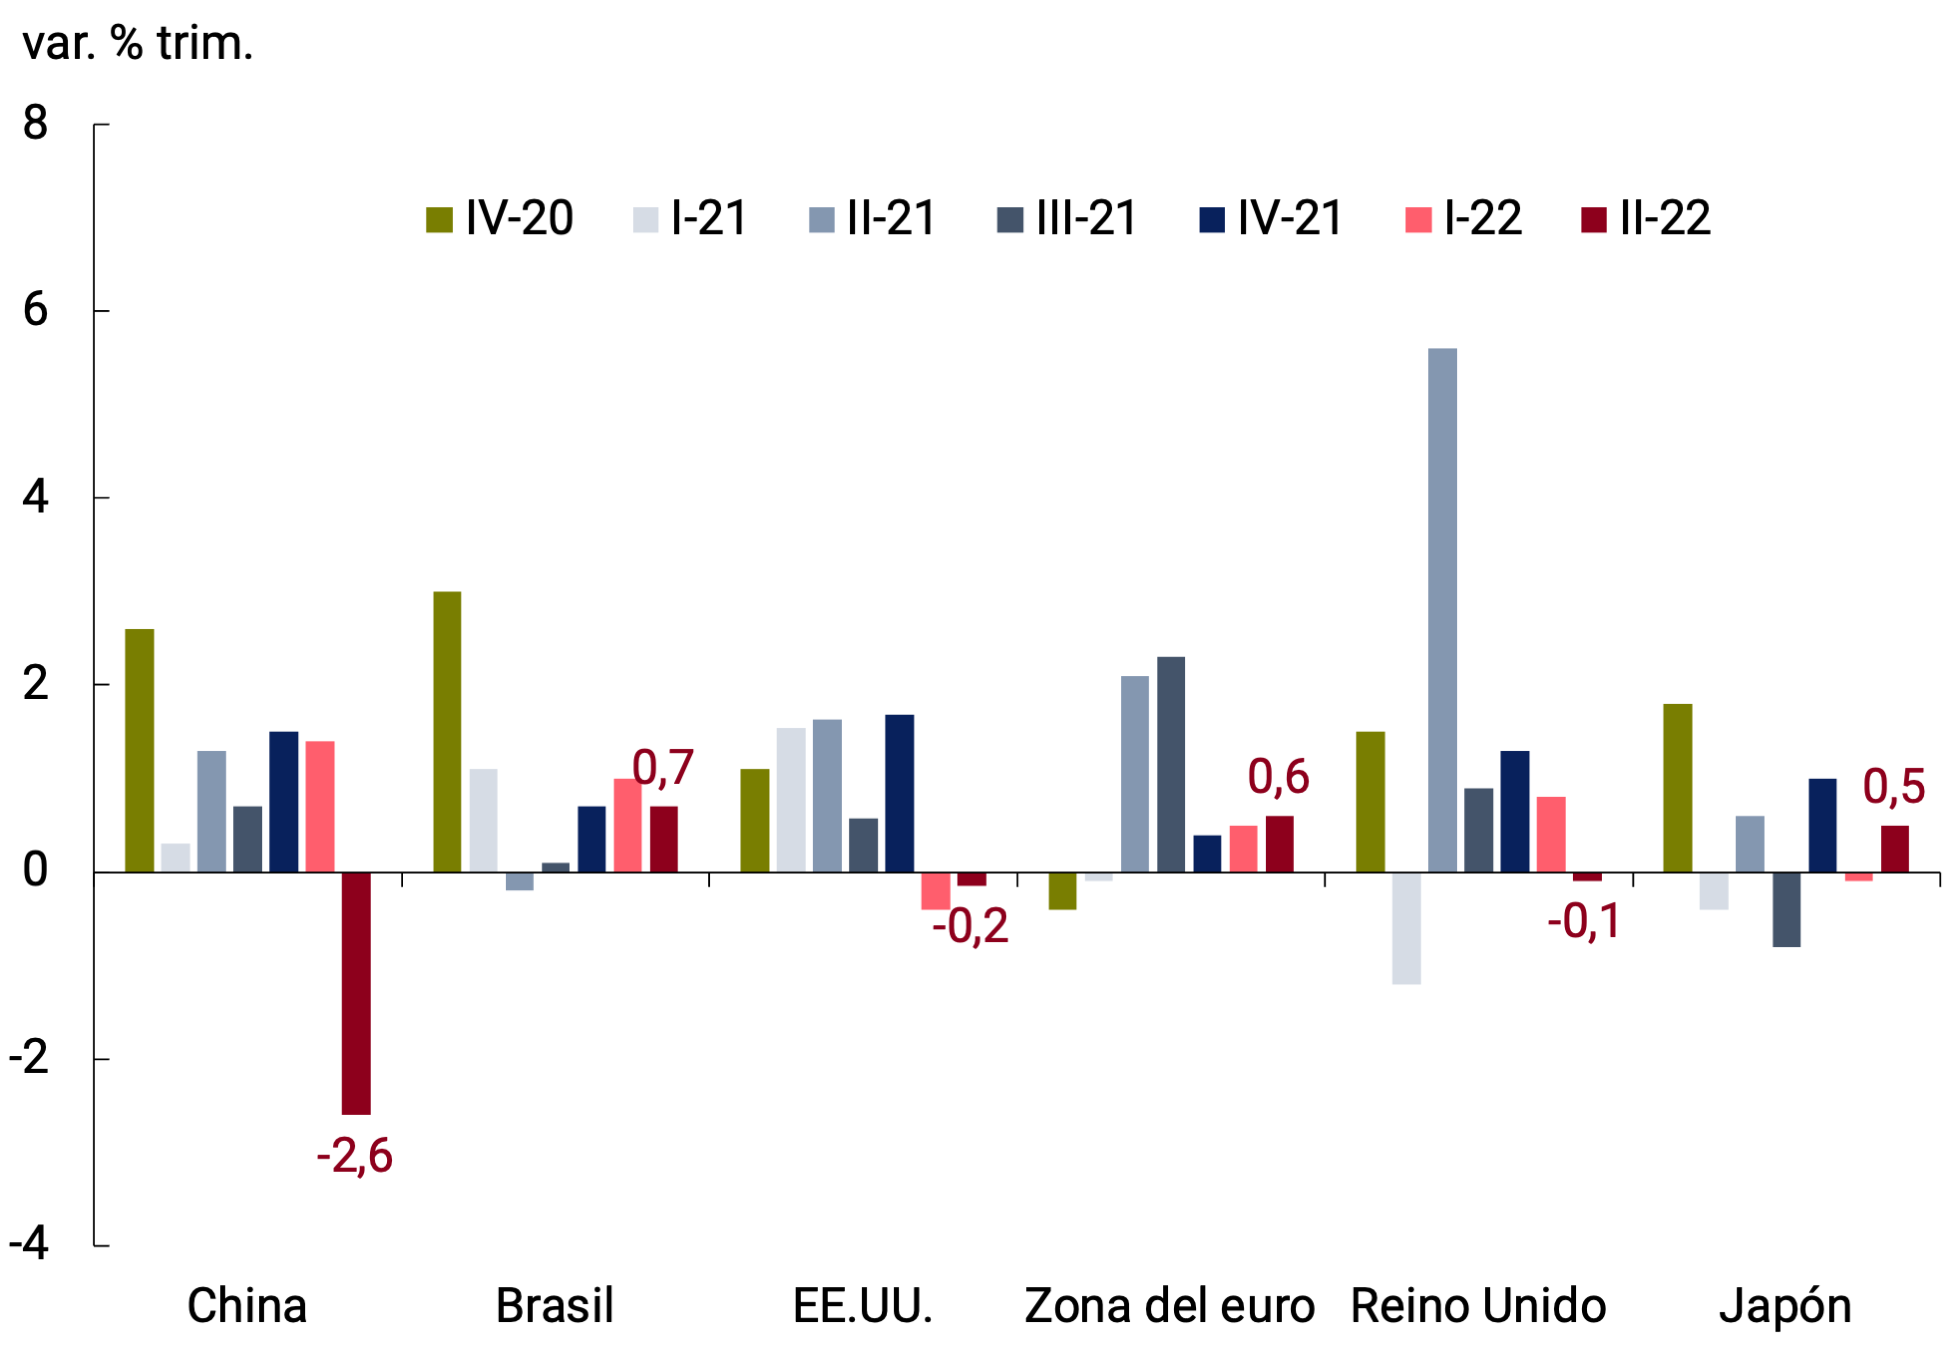
b. In levels, 4th. Quarter 2019=100
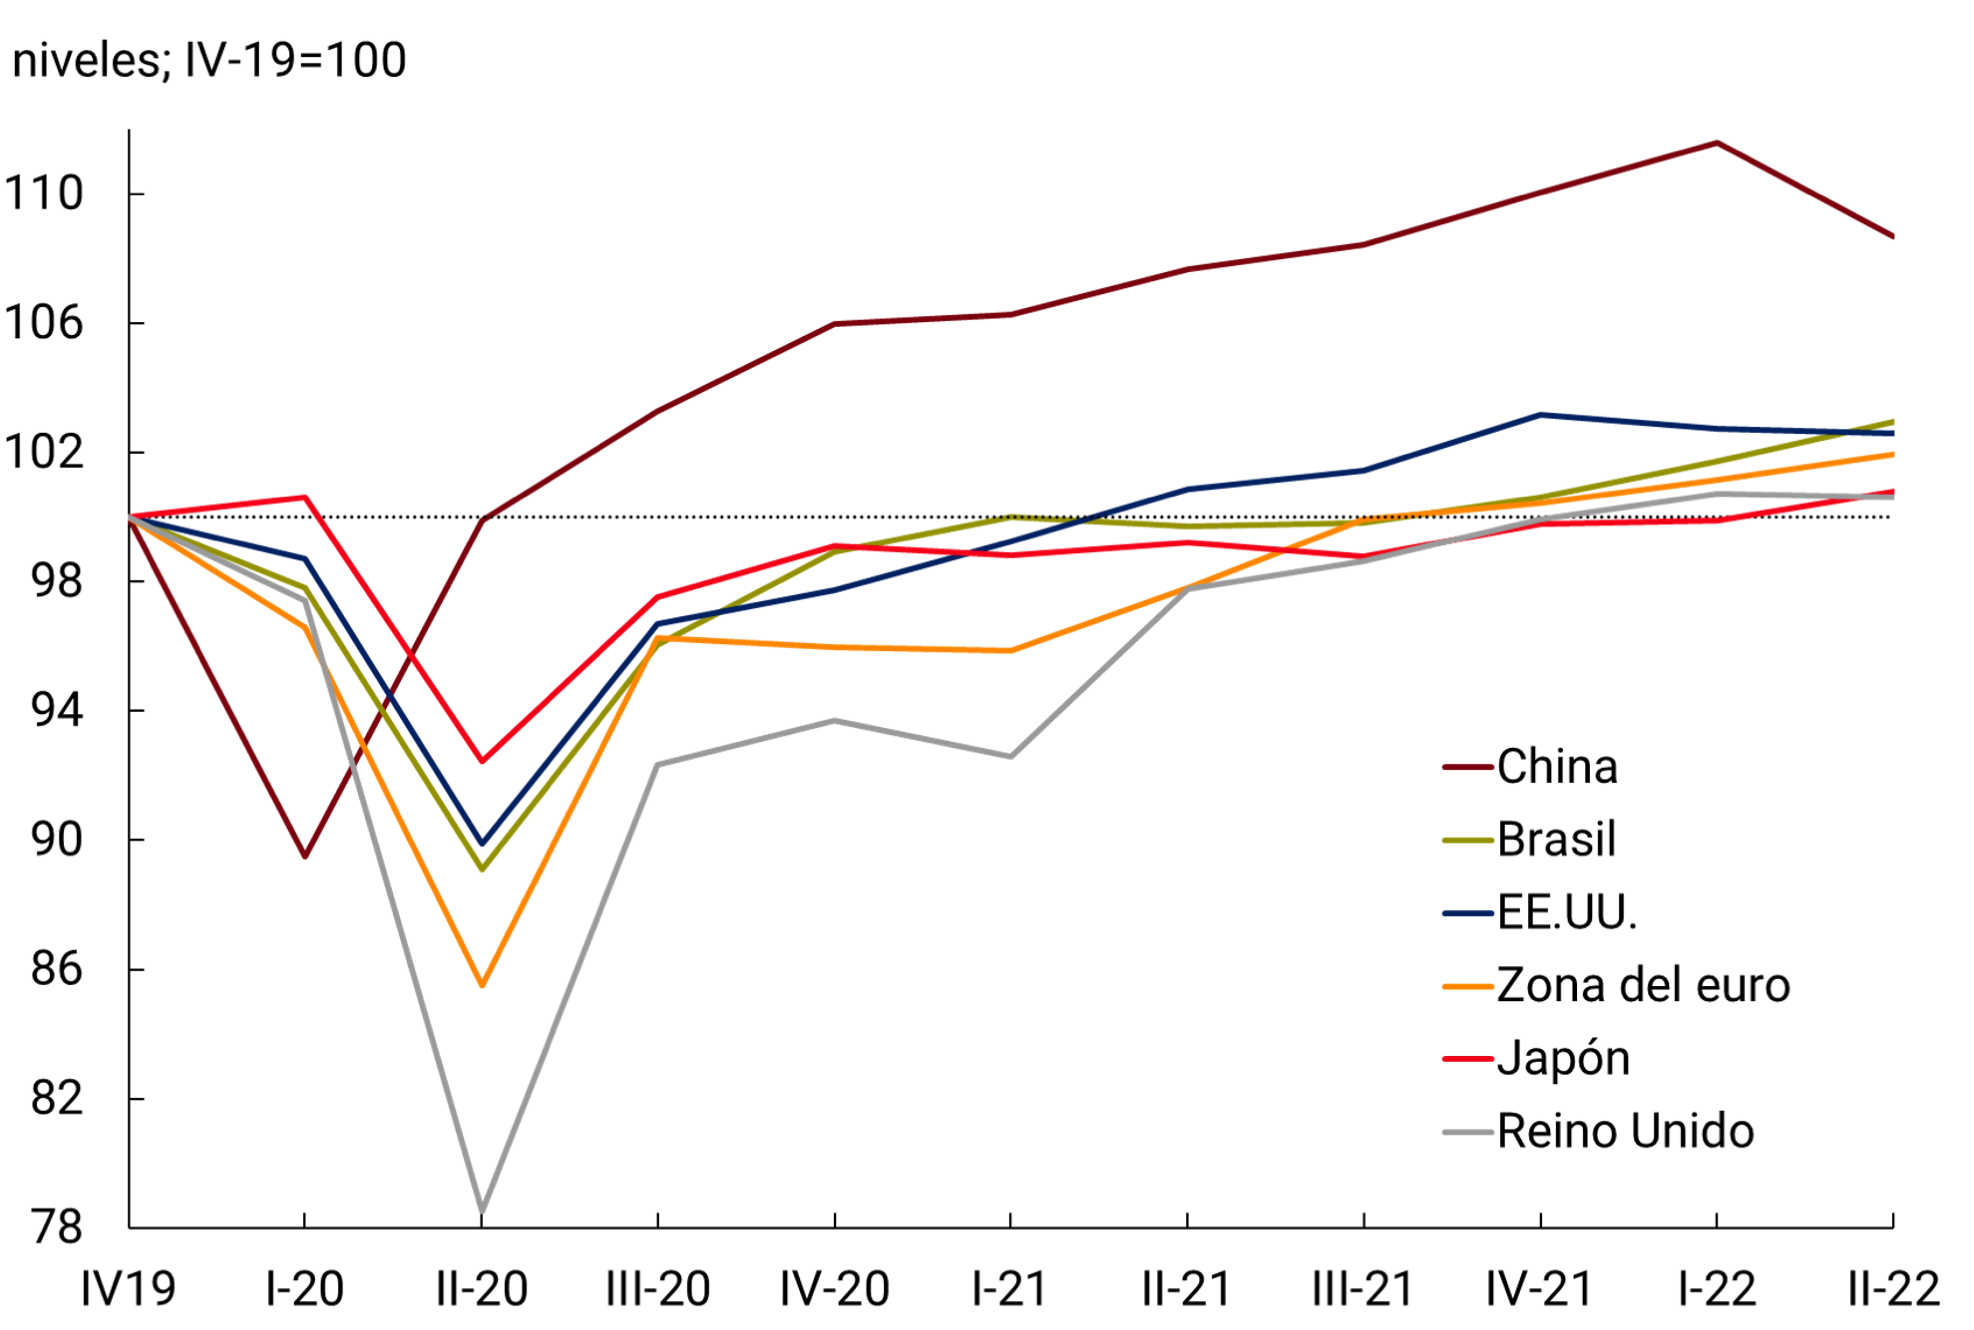
Source: BCRA based on data from national statistics institutes.
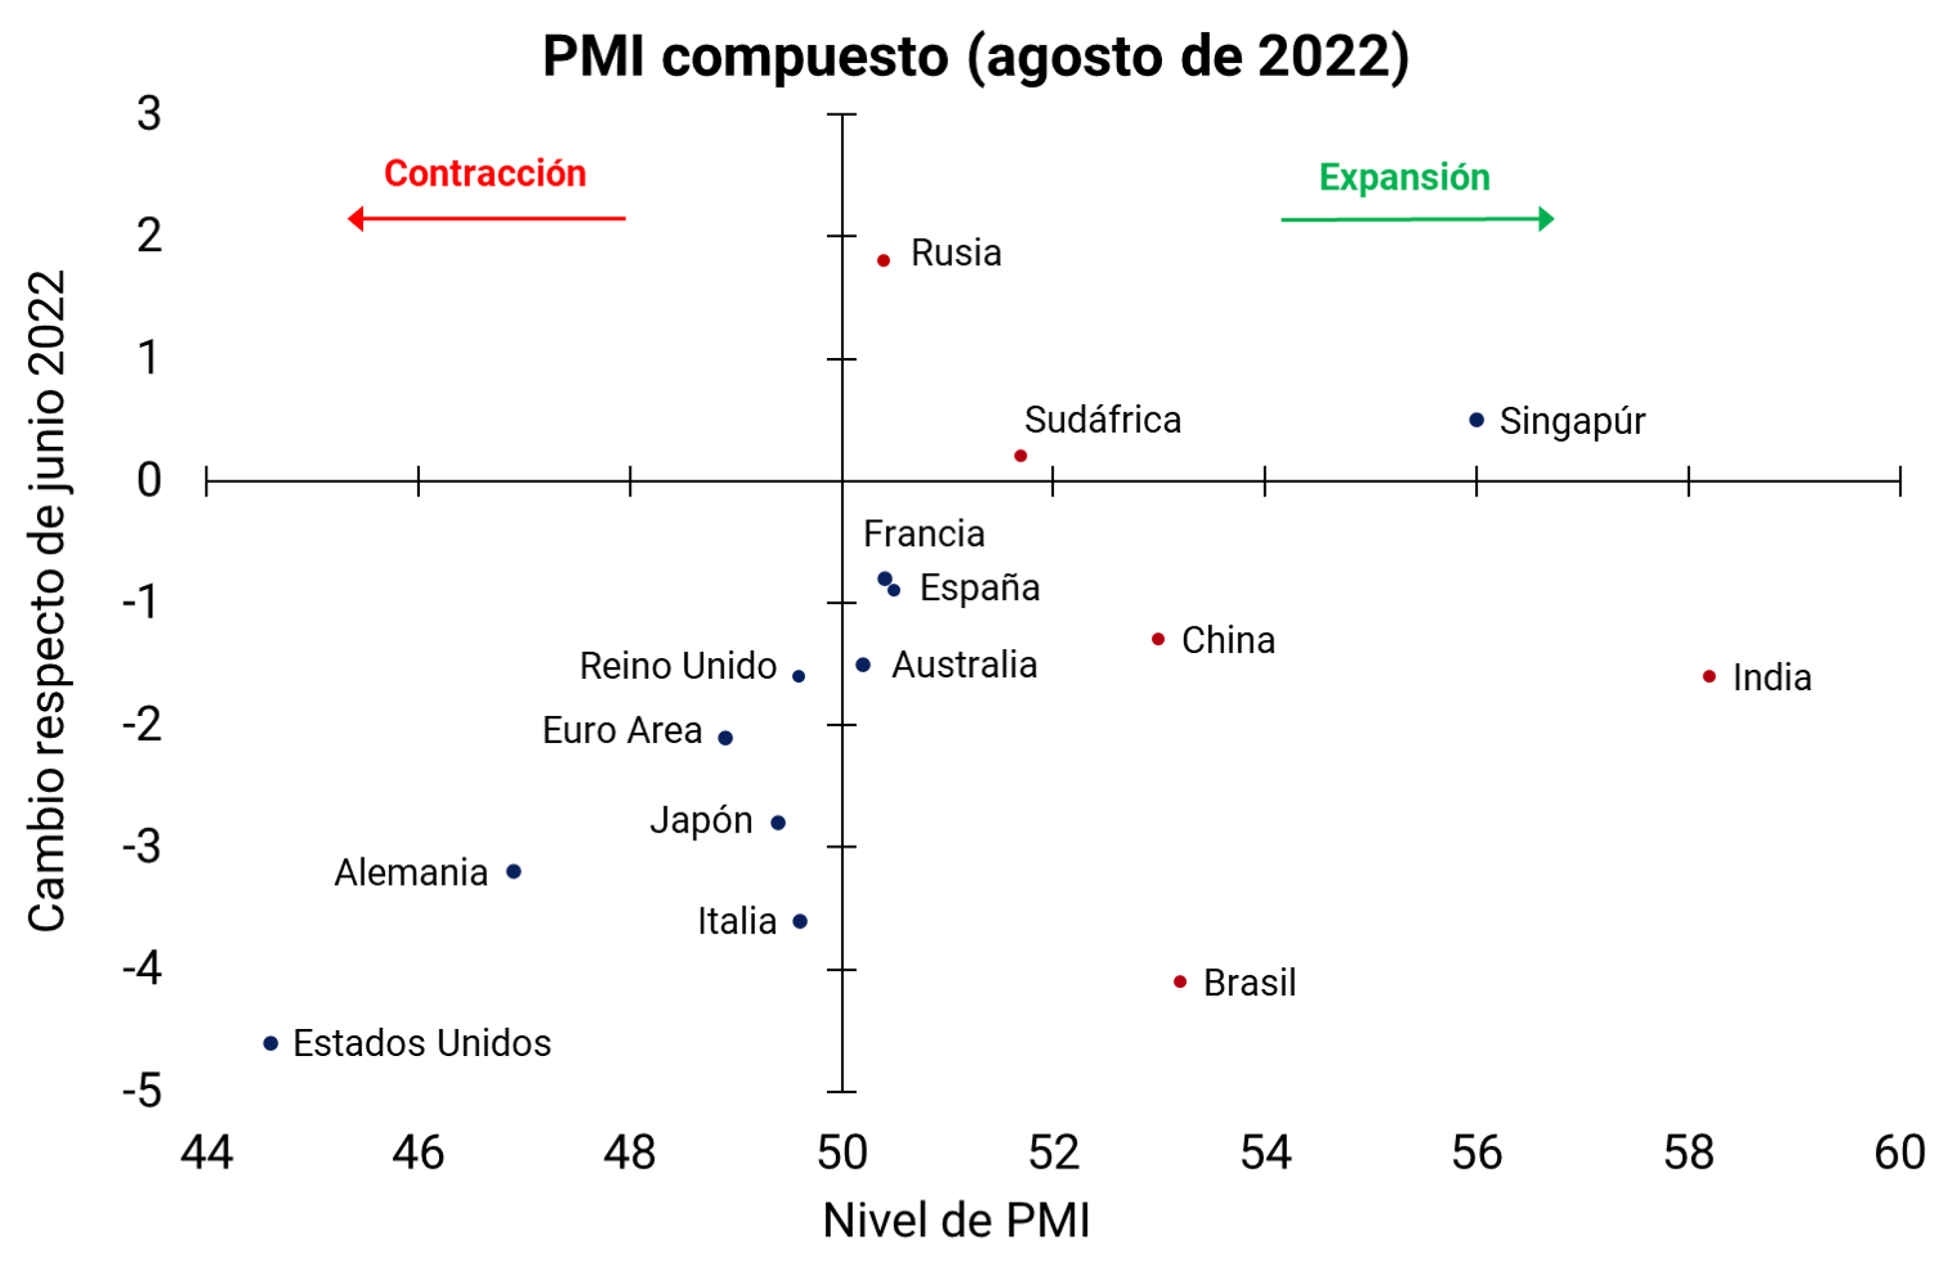
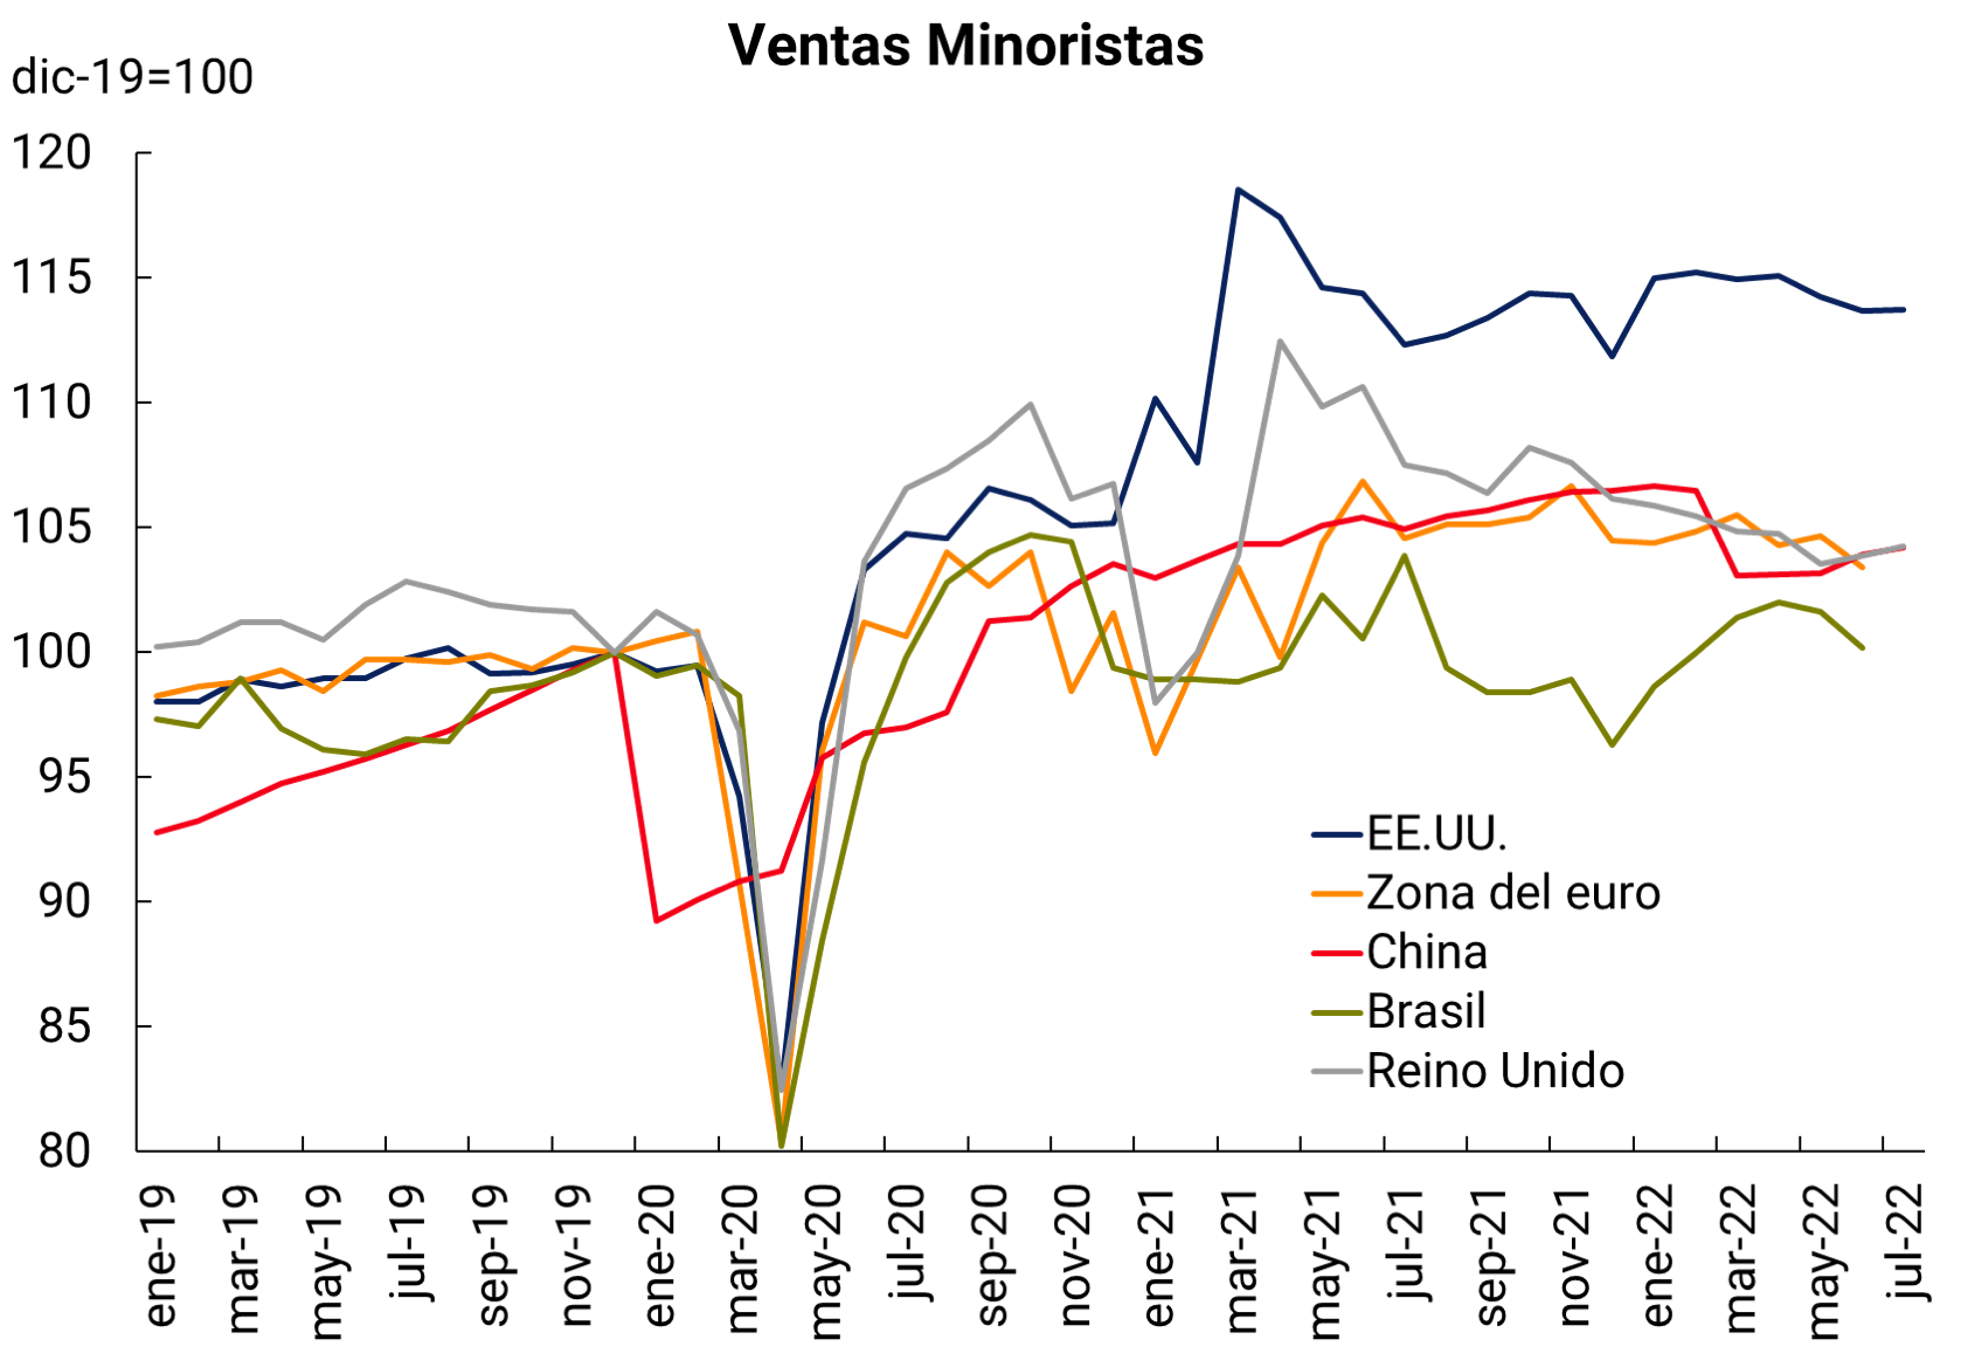
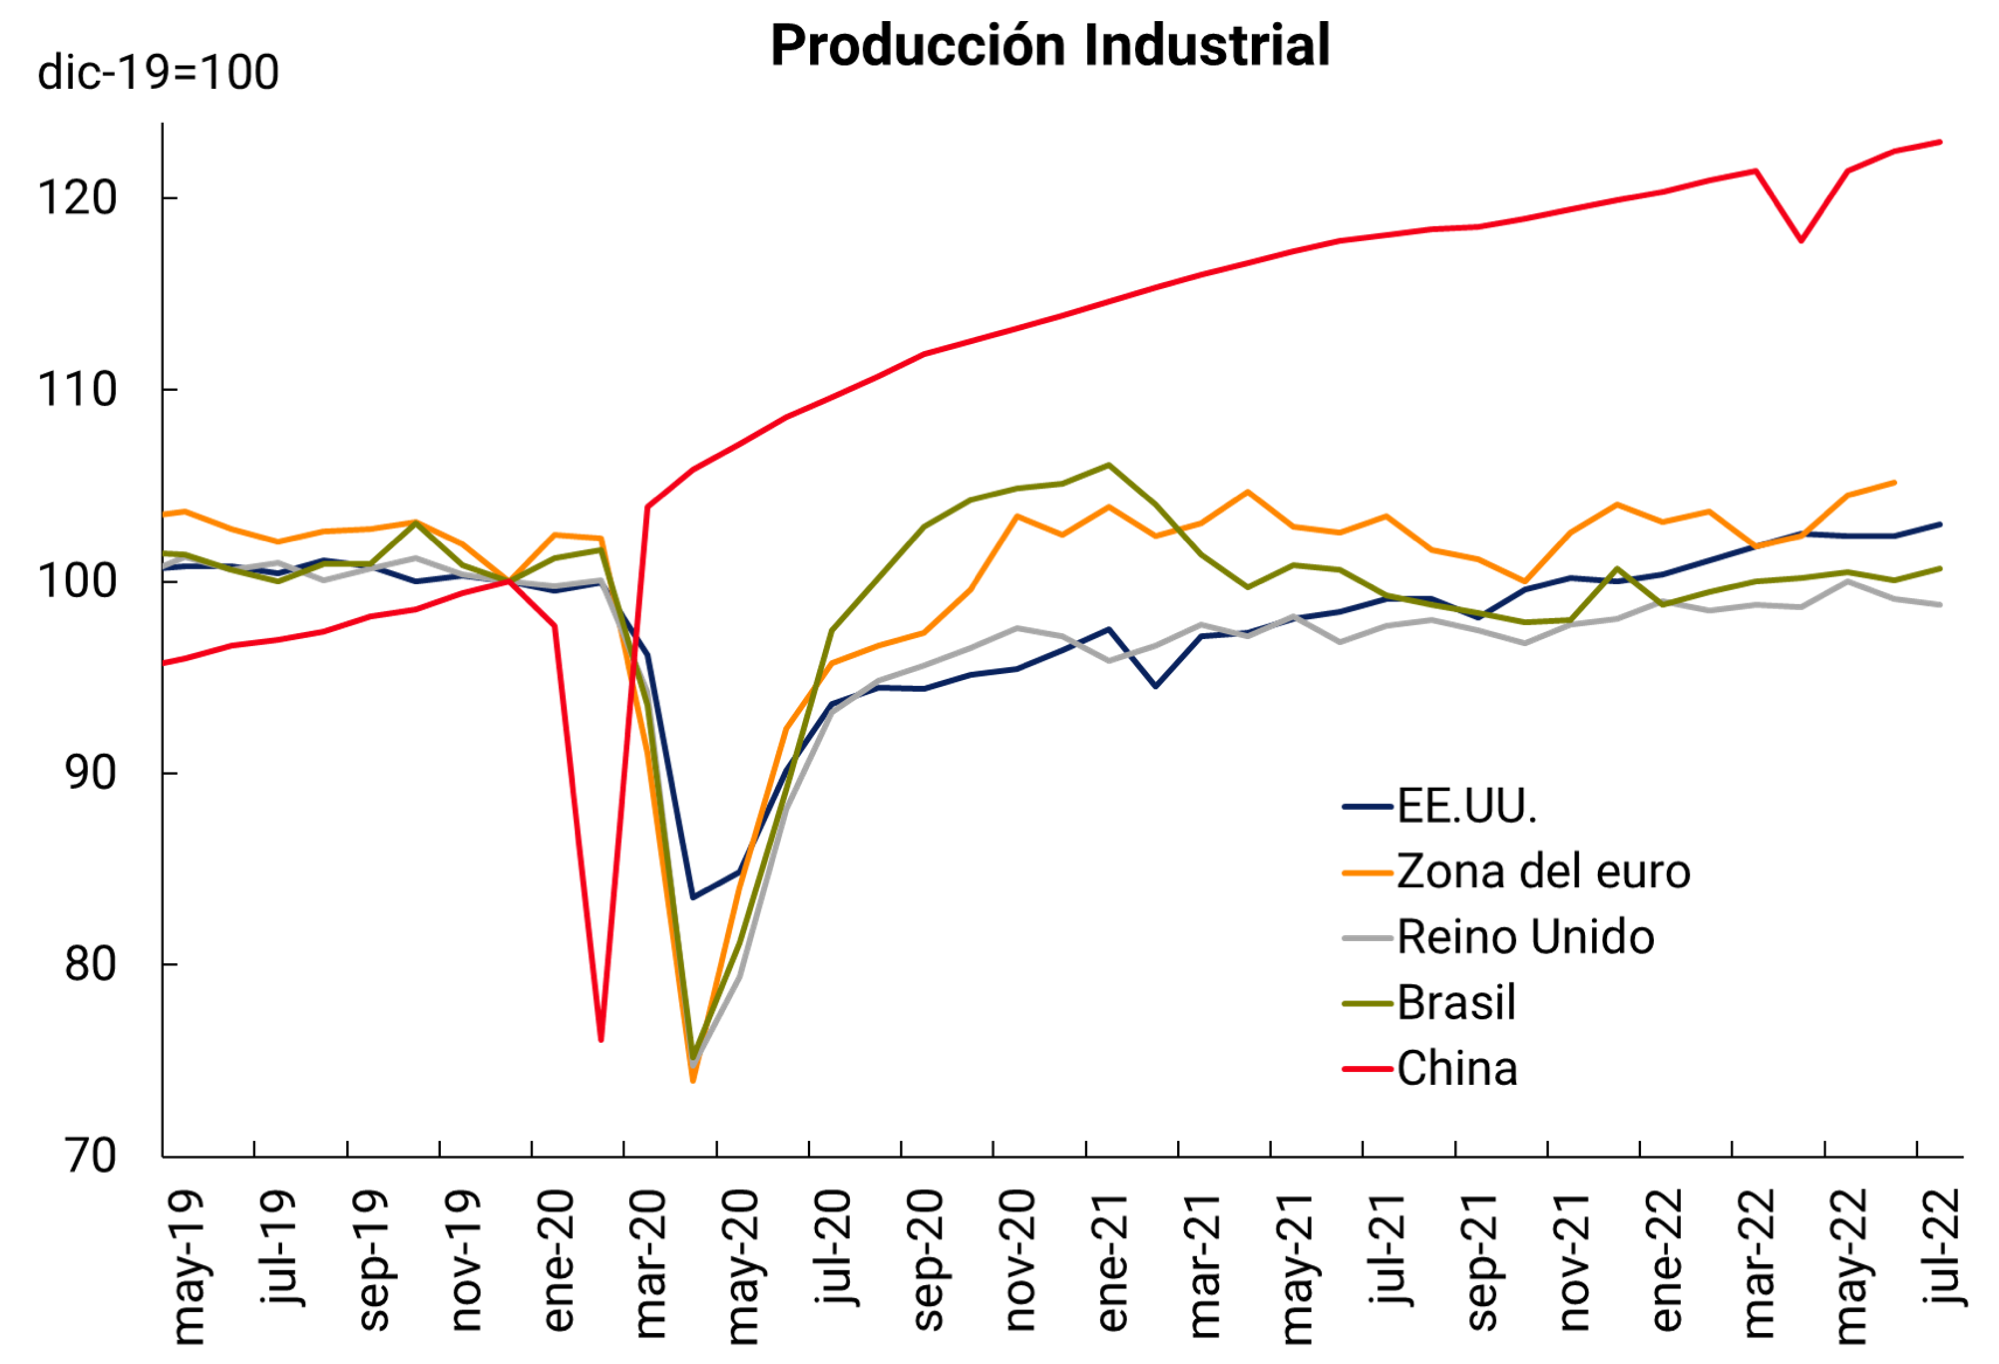
The main forward-looking indicators suggest lower global economic activity in the third quarter. Starting in June, consumer confidence continued to fall in the euro area, the United Kingdom, and the United States, reaching historic lows in July, while purchasing managers’ indicators (PMIs) continued to decline in July and August, moving into the economic contraction zone (below 50) mainly in advanced countries (see Figure 2.3). 1 Industrial production fell in the United Kingdom and the euro area in July and in the United States in August (see Figure 2.3). In China, although the economy showed signs of recovery in July and August with the easing of mobility restrictions during the drop in cases that took place in June, activity indicators show less dynamism than that recorded in the months prior to the second quarter. The particular tightening of restrictions since August in response to the increase in infections is likely to weaken the performance of the economy.
Figure 2.3 | Figure 2.3 | Activity indicators
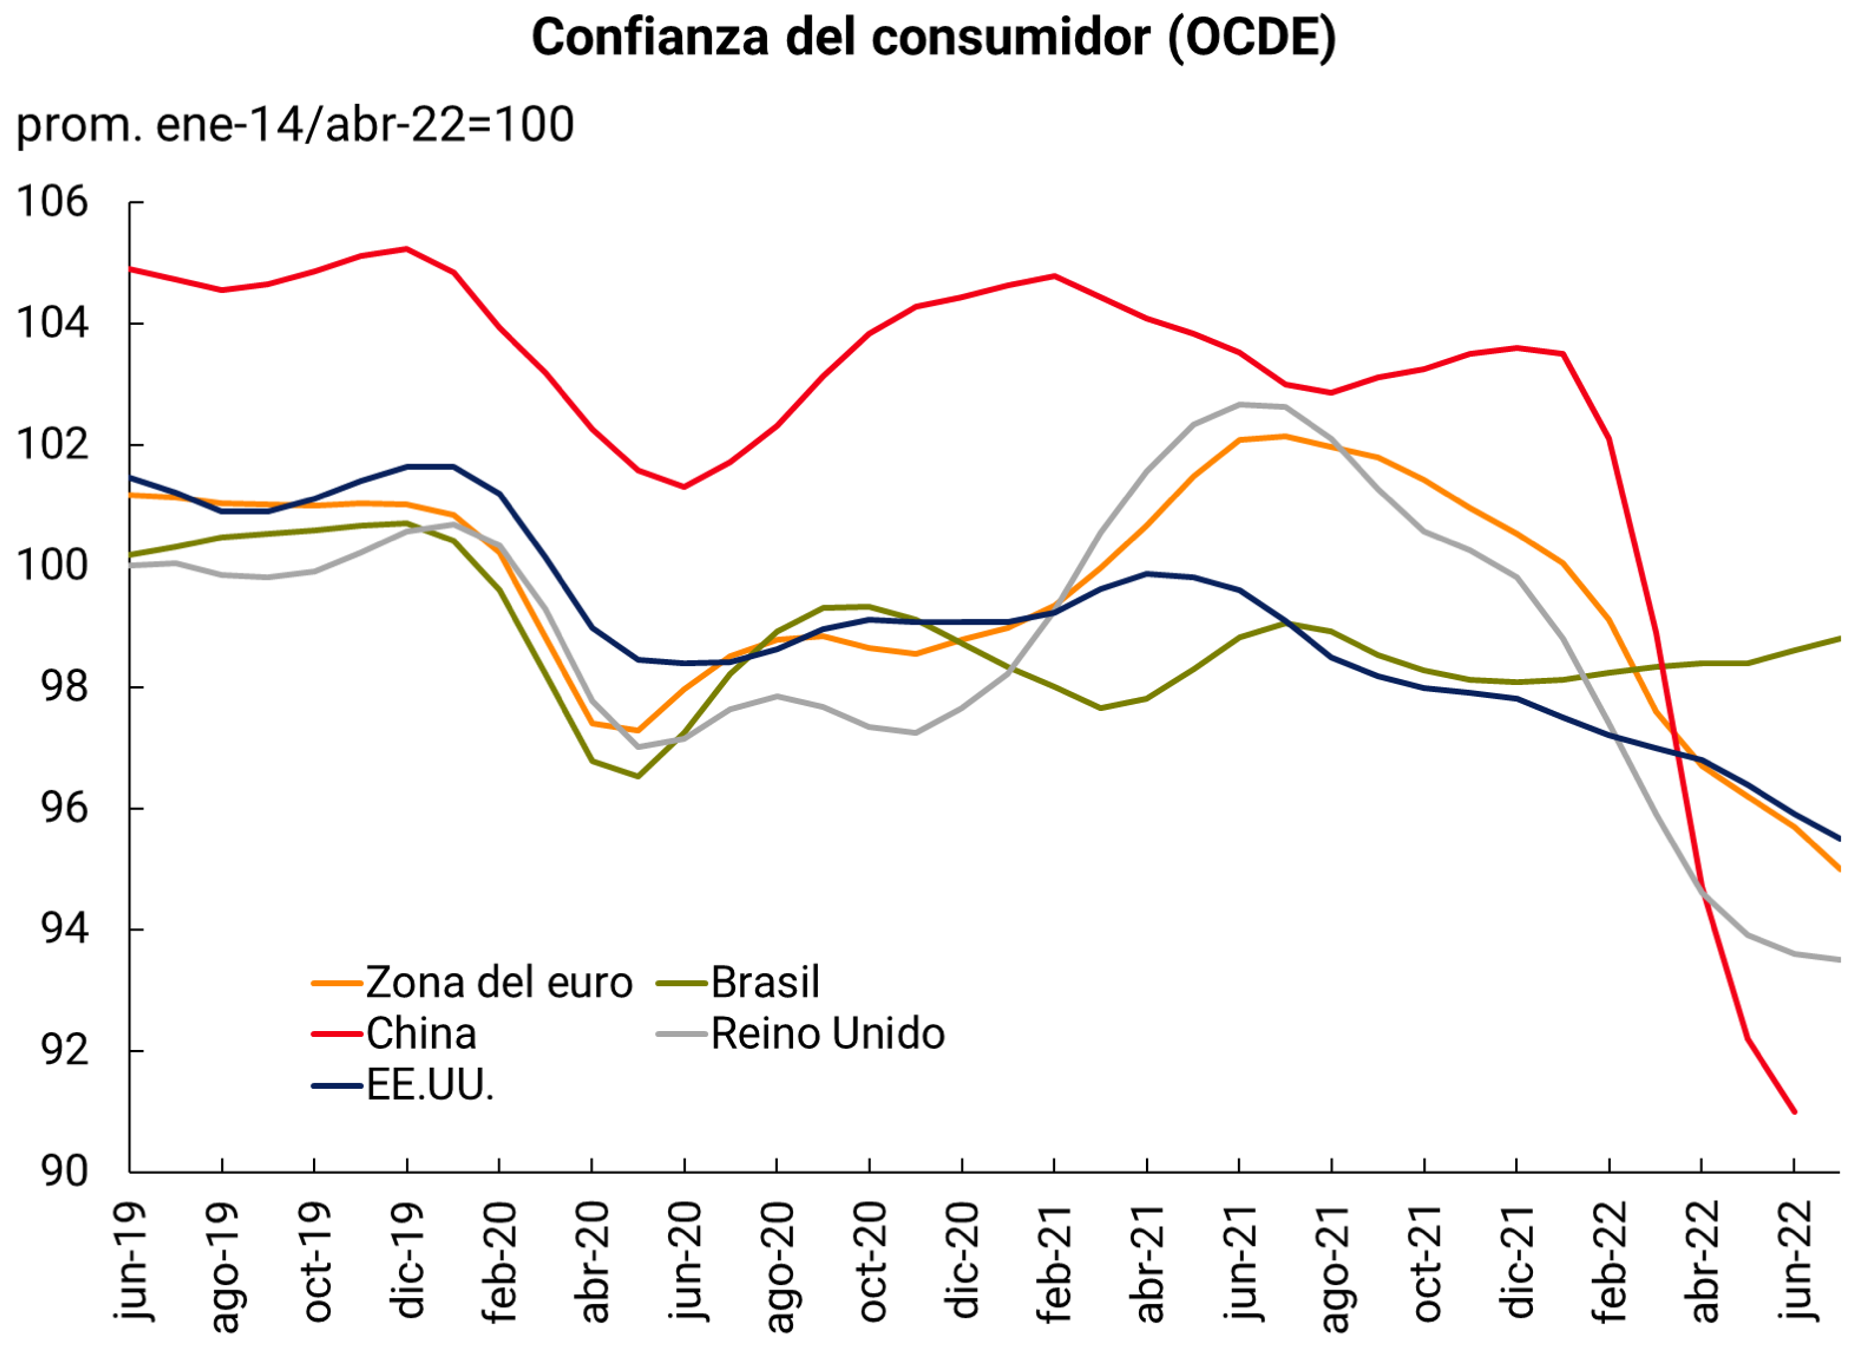
Source: BCRA based on data from IHS Markit, OECD, Trading Economics and Bloomberg.
Global growth forecasts continued to decline. Like the World Bank in June, the IMF lowered its global growth projection for this year from 3.6 percent in April to 3.2 percent in its July report (see Table 2.1). According to the international organization, lower growth earlier this year, the reduction in household purchasing power and contractionary monetary policy prompted a downward revision of 1.4 p.p. in the United States for 2022. In China, new lockdowns and the deepening of the real estate crisis have caused growth to be revised downwards by 1.1 p.p. While in Europe, significant downgrades in forecasts reflect the side effects of the war in Ukraine and tighter monetary policy. In 2023, the IMF expects anti-inflationary monetary policy to have an impact on activity levels, with global output growing by just 2.9% (with a downward revision of 0.7 p.p.). The market consensus also agrees in forecasting lower global activity for the rest of the year. On the other hand, the IMF raised its global inflation forecast due to food and energy prices, as well as persistent supply chain imbalances, and forecasts that it will reach 6.6% in advanced economies and 9.5% in emerging market and developing economies this year: upward revisions of 0.9 and 0.8 p.p., respectively.
Table 2.1 | Economic activity projections 2022-2023
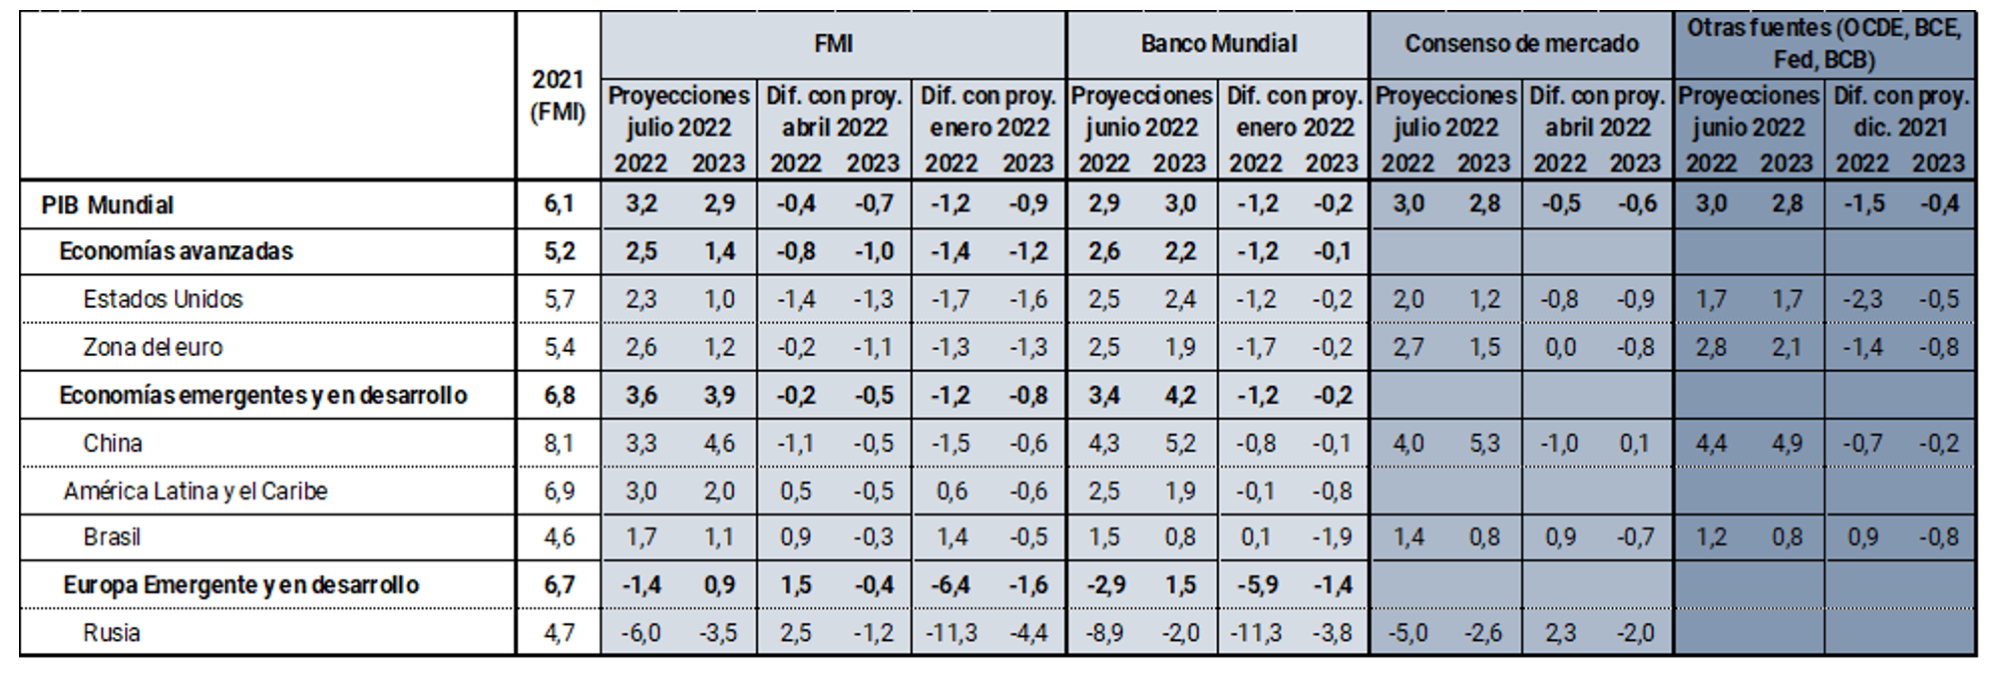
Source: IMF (WEO), World Bank, Reuters (market consensus) and other sources: OECD (world and China), European Central Bank (euro area), US Federal Reserve (United States), Central Bank of Brazil – Focus Survey (Brazil).
2.3. Inflation at record levels in recent decades drives the continuity of contractionary policies
The factors that have driven inflation in recent months remain: the increase in commodity prices accentuated by the war and COVID-19 outbreaks in certain parts of China that affected global value chains. In this context, the monetary authorities continued to take contractionary measures, although with a different speed between developed and emerging countries.
Figure 2.4 | Inflation and monetary policy rates of major advanced economies
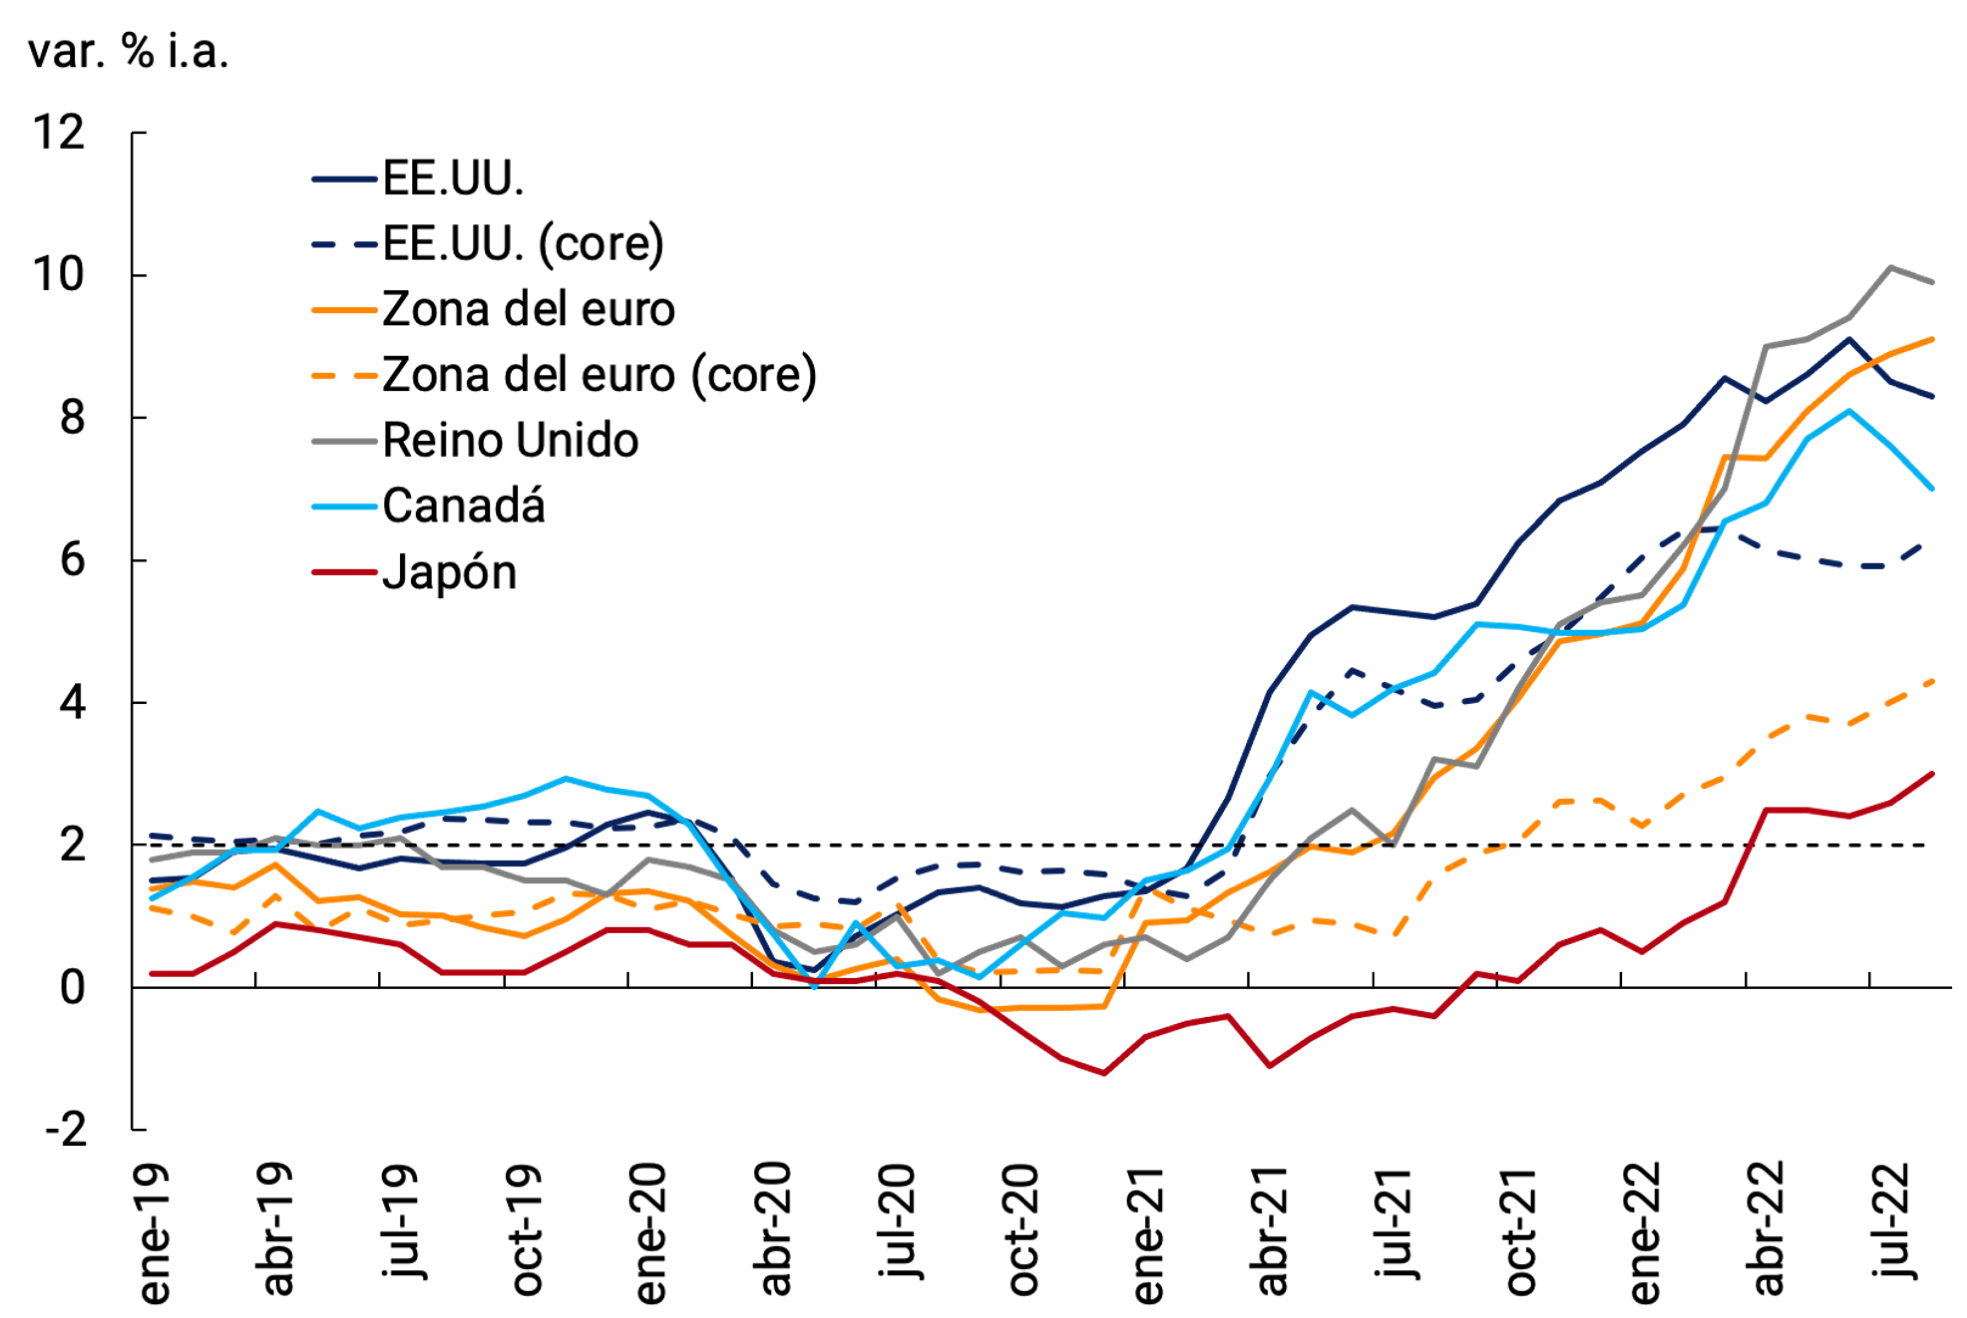
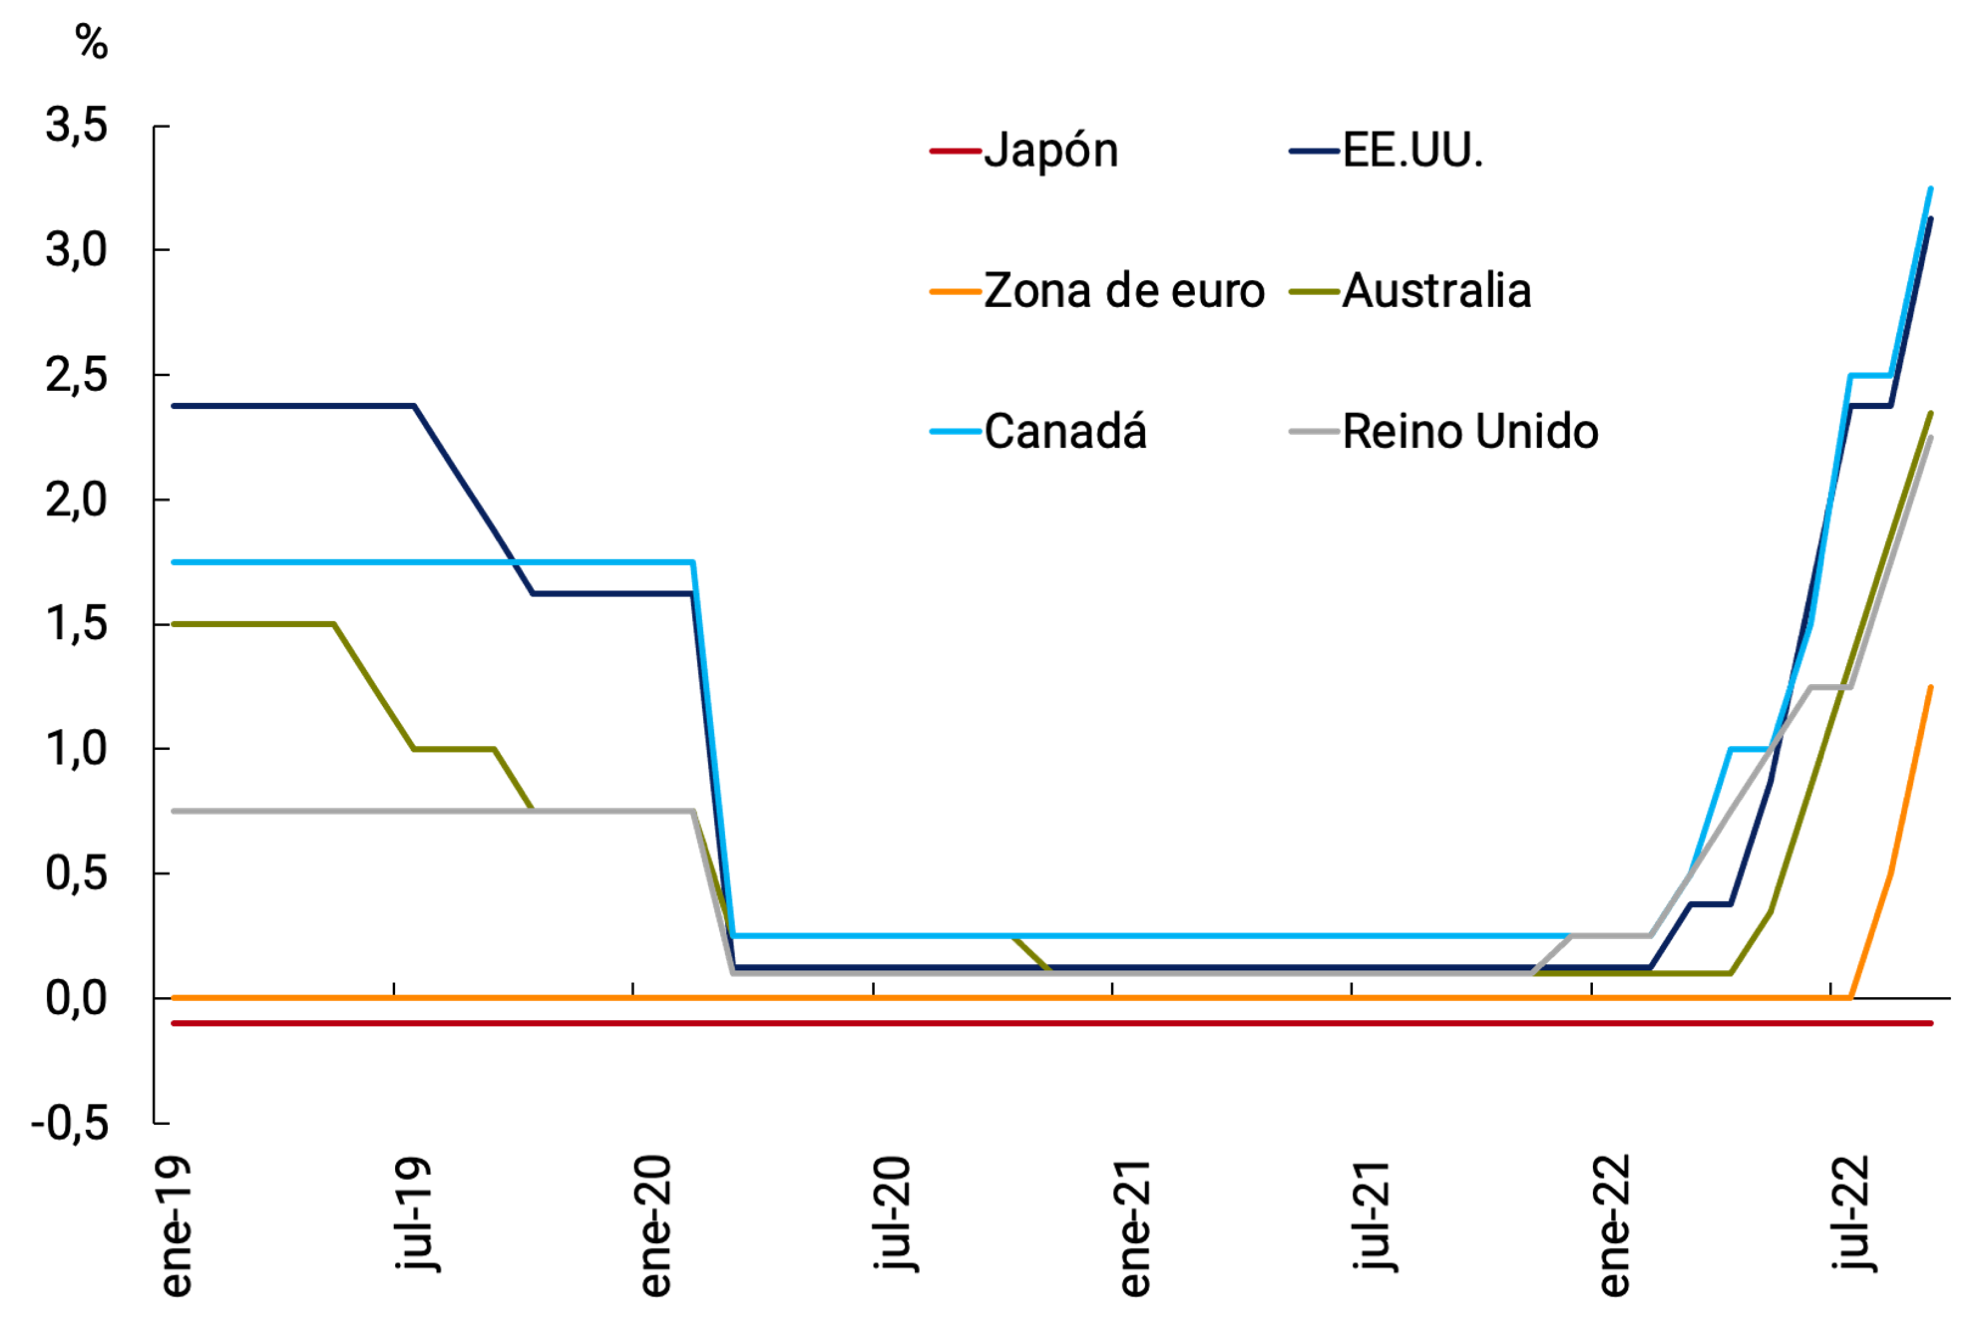
Source: BCRA based on data from the respective central banks.
Inflation rates in the major advanced countries remain very high (see Figure 2.4). Inflation in the US stands at 8.3%, in the euro area at 9.1%, in the UK at 9.9%, in Japan at 3.% and in Canada at 7%. Inflation reached record values in recent decades in Europe (the most affected by the war in Ukraine), and for the rest of the advanced countries there is a slowdown at the margin, except in Japan. Core inflation continued to rise with second-round effects in Europe and the US.
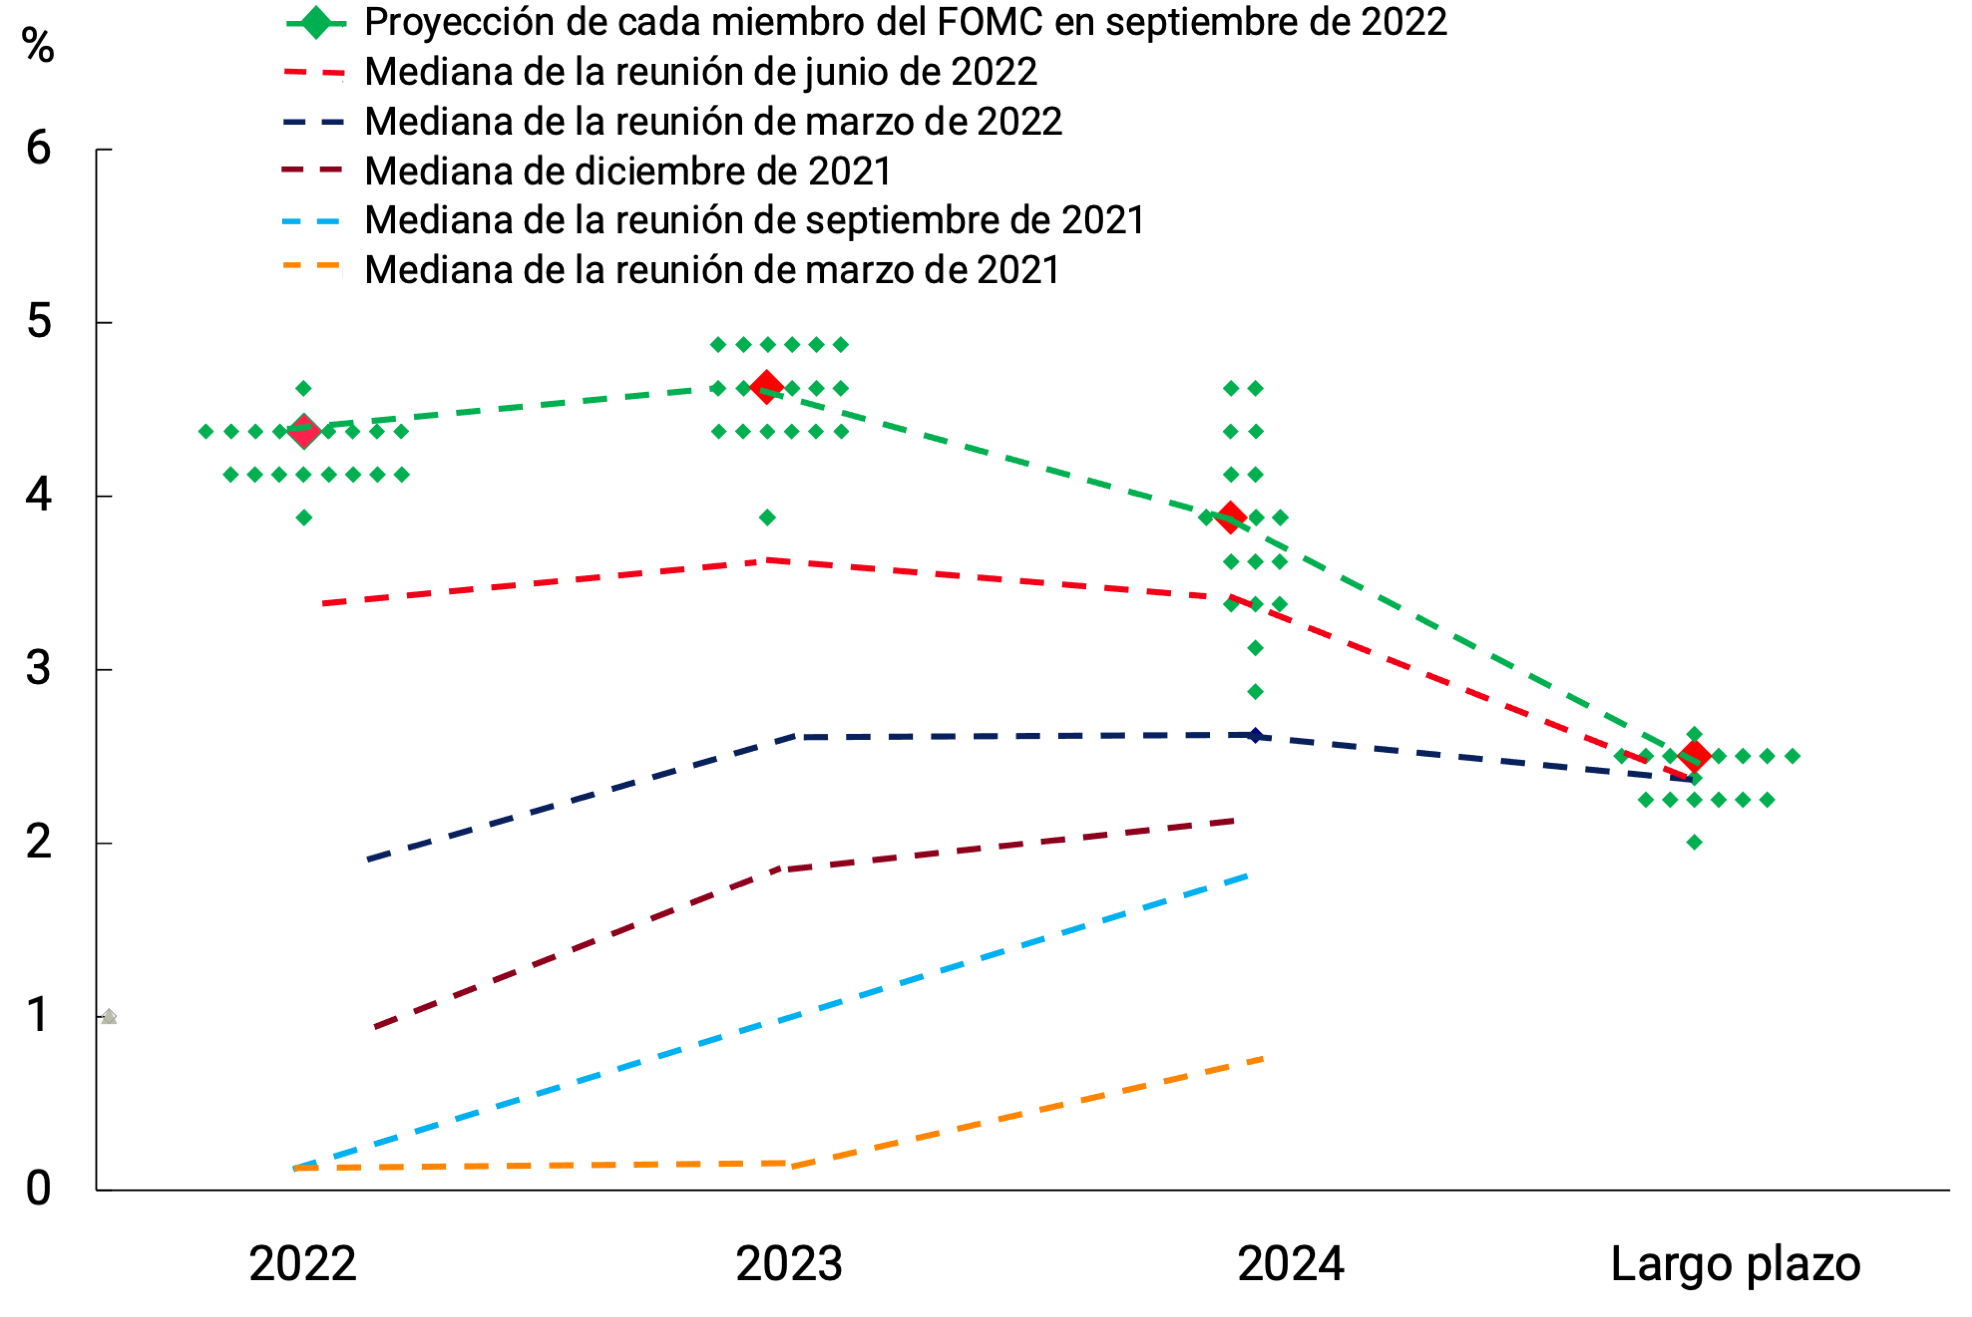
Figure 2.5 | Fed Fed Funds Rate Target Projection
to. Fed projection
b. Market Projection
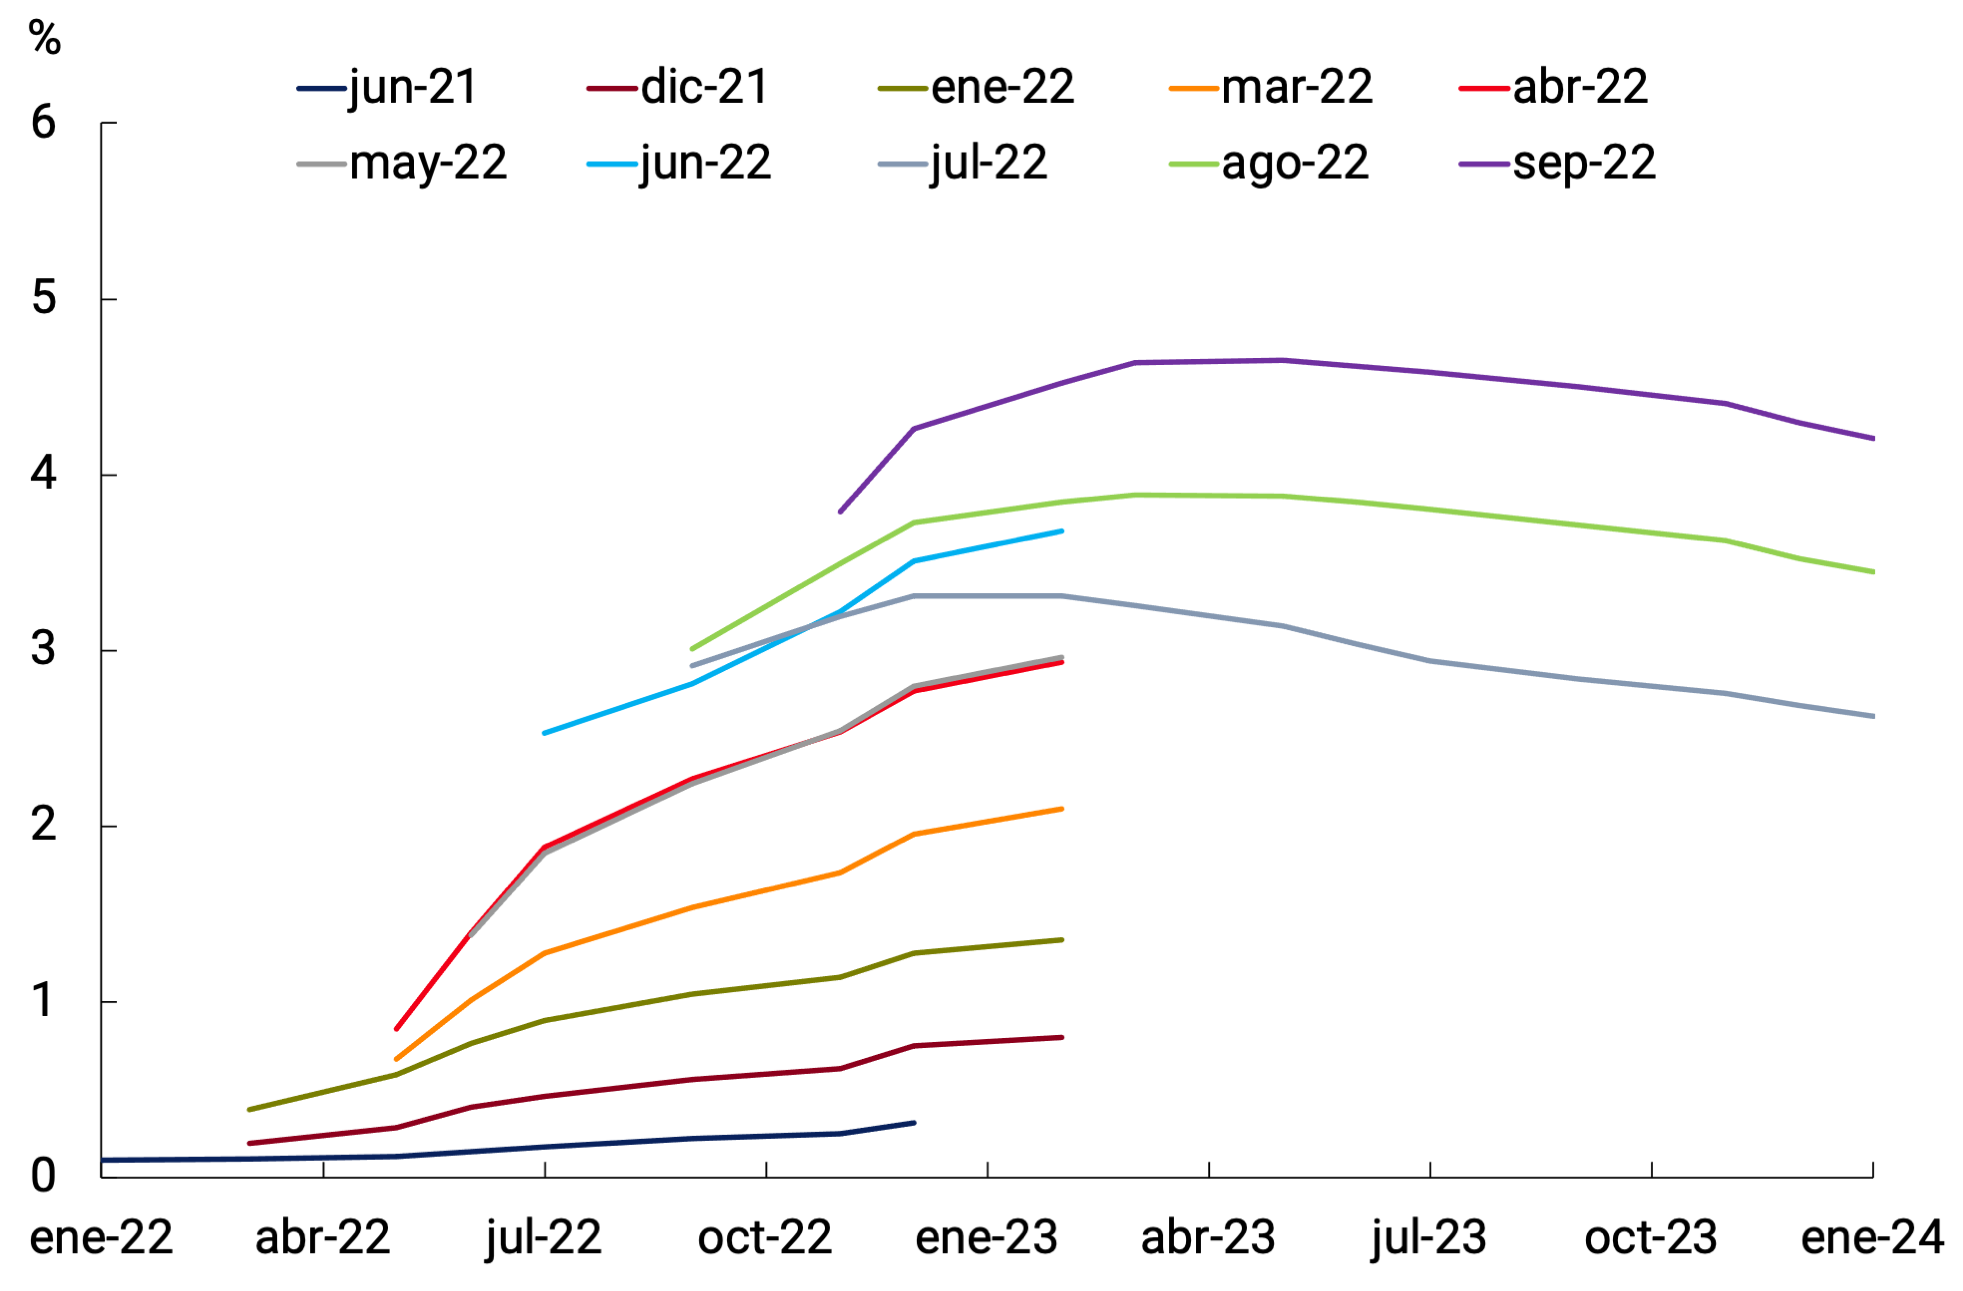
Source: BCRA based on data from the US Federal Reserve and Bloomberg.
Against this backdrop, most central banks in advanced economies accelerated the pace of their contractionary measures. The U.S. Federal Reserve (Fed) increased its monetary policy interest rate (MPR) by 0.75 p.p. for the third consecutive time. Along with this, in one of the speeches widely followed by the market (Jackson Hole symposium), the Fed chairman took a very contractionary stance that impacted the Fed’s MPR futures curve. The same happened with the Fed chairman’s speech after the announcement of the increase in the MPR for September (see Figure 2.5). In addition, since September (as it had announced months ago) the Fed accelerated the pace of reduction of its assets to a speed that is at least three times higher than it reached in mid-2019 (prior to the liquidity problem in the treasury bond market, see Figure 2.6).
Figure 2.6 | U.S. Federal Reserve Asset
Source: US Federal Reserve
The European Central Bank (ECB) ceased, after eight years, to have the rate of its deposit facility in negative territory, raising it by 1.25 p.p. (0.5 p.p. at the July meeting and 0.75 p.p. at the September meeting), in the same magnitude as its MPR, and the rate of its lending facility, with further increases of at least 0.5 p.p. expected in the coming meetings. In July, it had ended its asset purchase program. But at the same time, the Transmission Protection Instrument (TPI) was approved: the ECB will be able to make purchases in the secondary market of bonds issued in jurisdictions whose financing conditions deteriorate without being justified by the fundamentals of the country’s economy. The scale of TPI purchases will depend on the severity of these risks and will not be restricted ex ante.
Meanwhile, the Bank of England raised its MPR (known as the bank rate) for the seventh consecutive time to 2.25%, its highest level since 2009. The Bank of Canada raised its MPR by one percentage point to 3.25%. The Bank of Japan was the only exception, as it continued its expansionary monetary policy (see Figure 2.4).
The inflation rate in emerging economies continued to rise and the monetary authorities of these economies continued to take contractionary measures, with the exception of Turkey. In the particular case of Latin American economies, inflation also reached record levels in decades, with the exception of Peru and Brazil, which registered a slight drop in the margin (in the latter case after a tax cut), but remains at levels well above the inflation target. In this context, the region’s central banks were no exception. Those that had started raising their MPR earlier and whose inflation fell (Brazil and Peru) paused or slowed down the implementation of contractionary policies (Brazil and Peru, in that order), while those that started later maintained very significant levels of increases in their MPR (see Figure 2.7).
Figure 2.7 | Inflation rate (left) and monetary policy (right) of emerging economies in Latin America
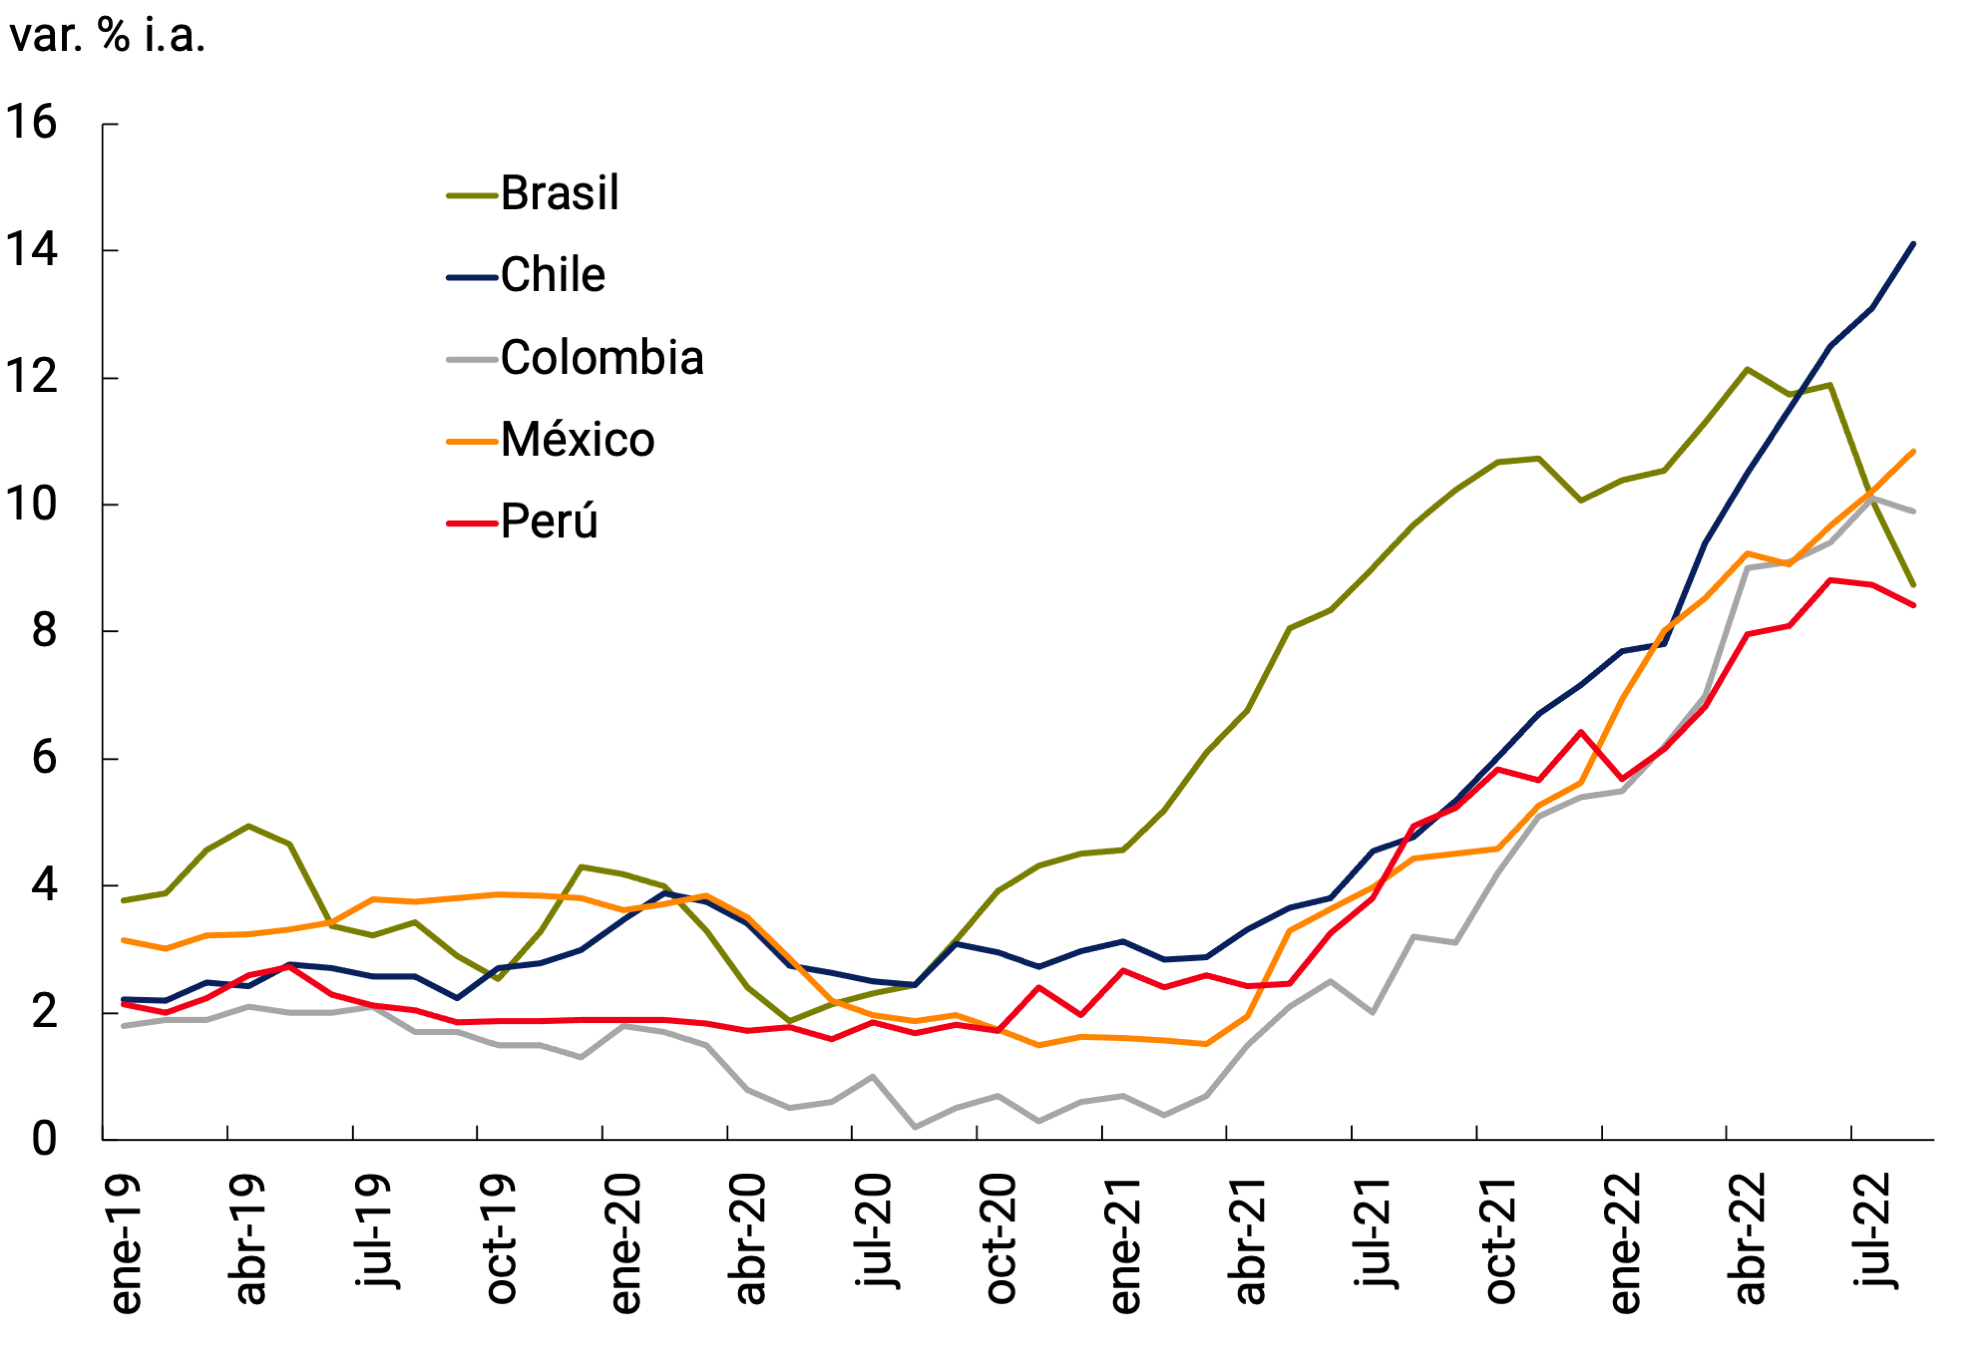
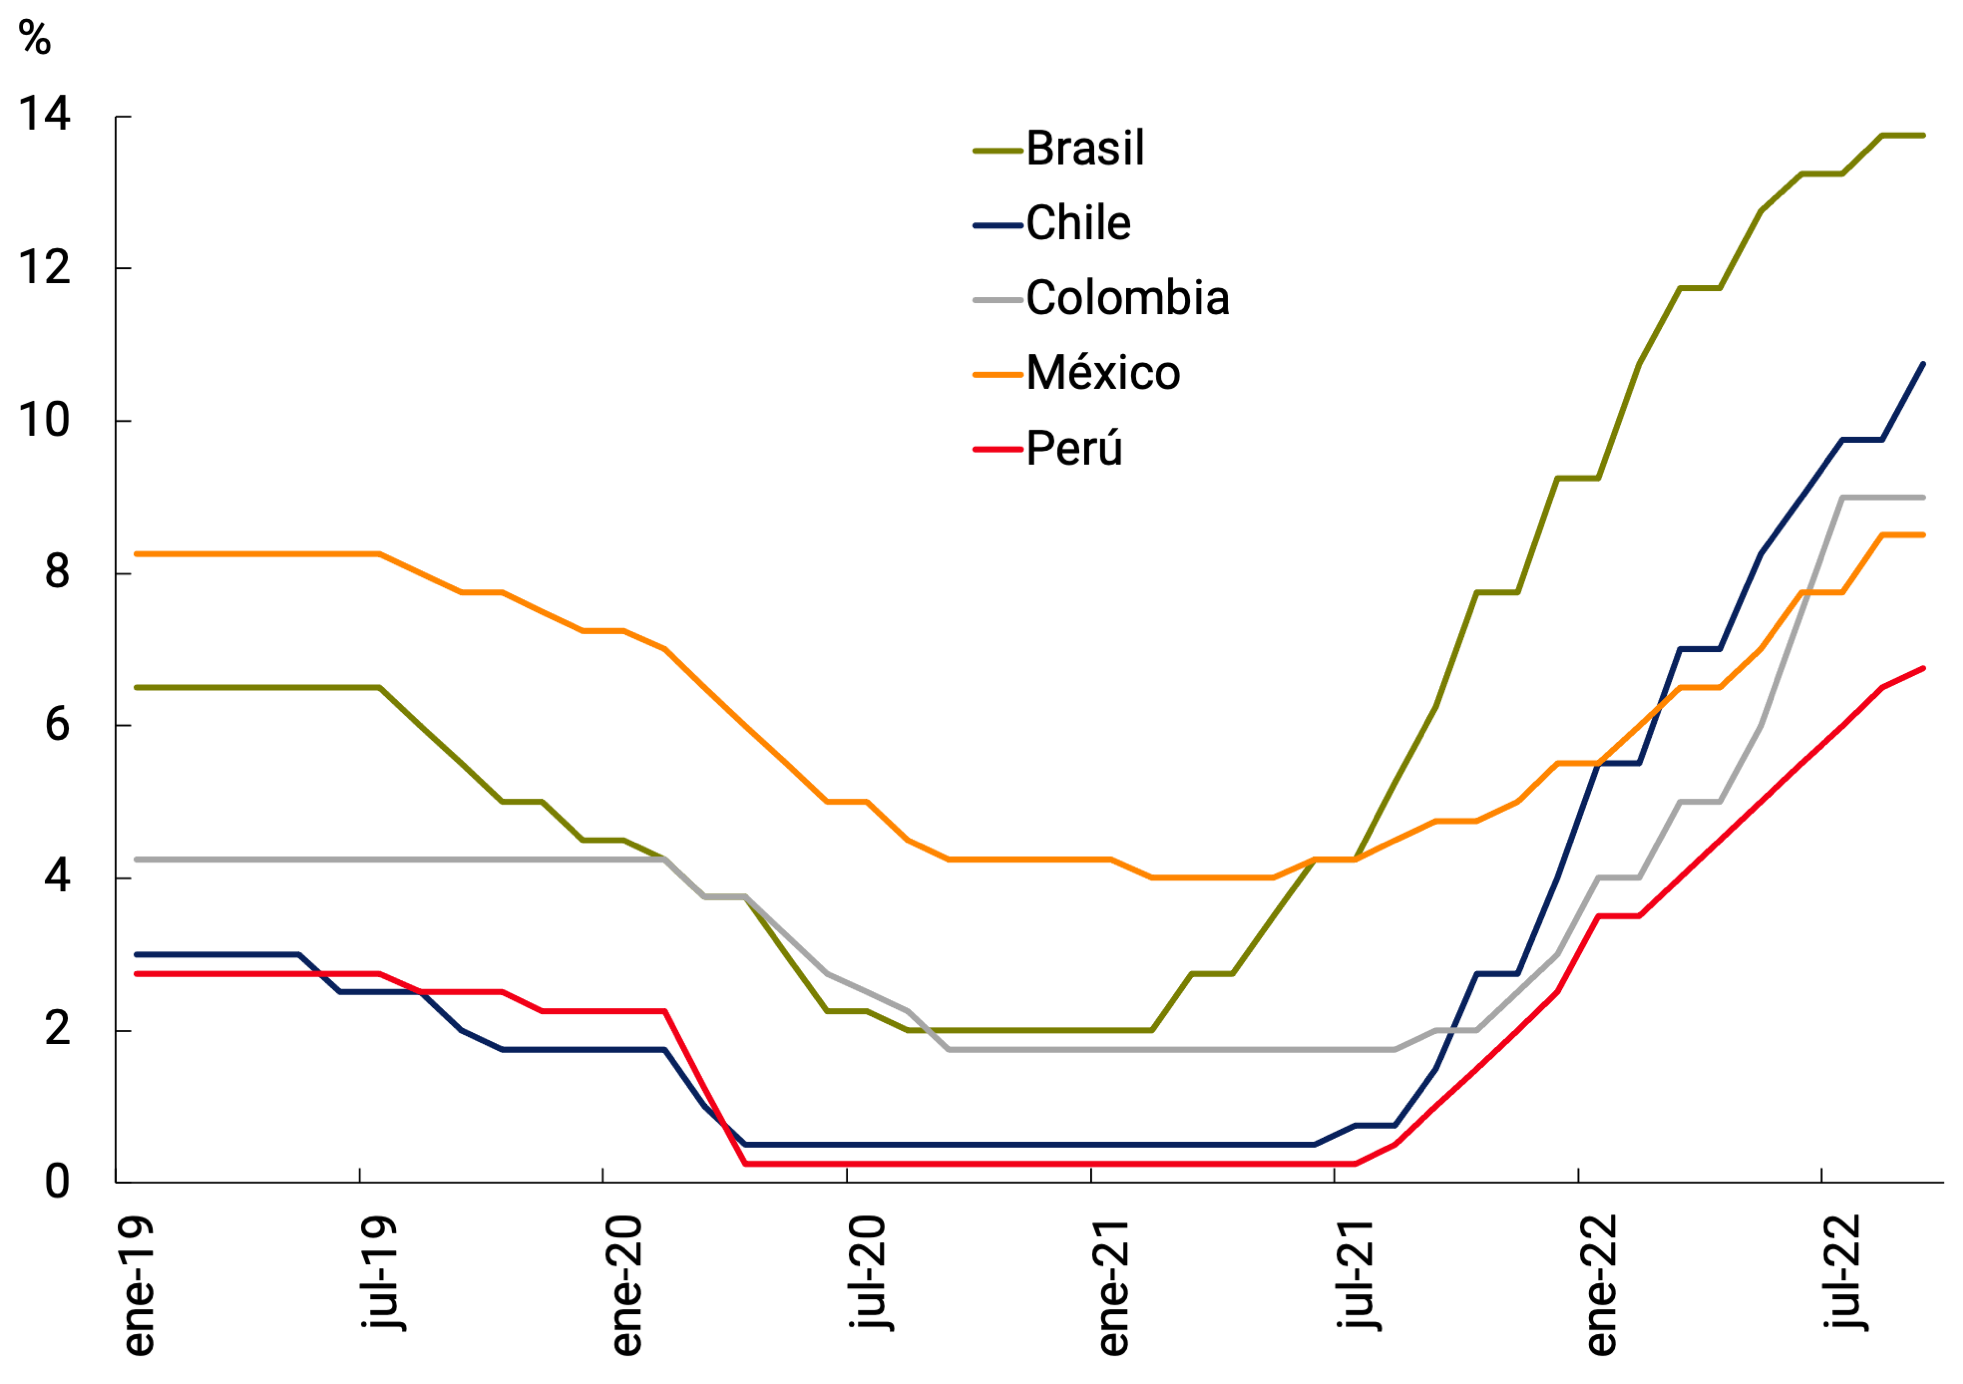
Source: BCRA based on data from official statistics institutes and the Central Bank of Brazil.
In the case of Chile, its central bank, in order to facilitate the adjustment of the Chilean economy to changing internal and external conditions, decided to implement a program of foreign exchange intervention and preventive provision of liquidity in dollars, for an amount of up to US$25,000 million from July 18 to September 30, 2022. In the case of foreign exchange intervention, he announced: 1) sale of spot dollars for an amount of up to US$10,000 million; 2) sale of foreign exchange hedging instruments for an amount of up to US$10,000 million; and 3) a currency swap program for an amount of up to US$5,000 million. Towards the end of September, the monetary authority announced that the foreign exchange intervention program had achieved its objectives, and, therefore, it will reduce its intervention in that market.
2.4. Global financial conditions tighten
The markets performed determined by expectations of interest rate movements by the central banks of advanced countries, especially the Fed. Since the end of June, the stock markets began to rise, anticipating less monetary tightening in the face of the risk of a recession, and already discounting interest rate cuts in 2023. In the face of clarifications from the Fed, marking that this scenario was unrealistic, the stock markets returned to a downward trend. Both Europe’s S&P 500 and Stoxx 50 are down 20% for the year (see Figure 2.8a).
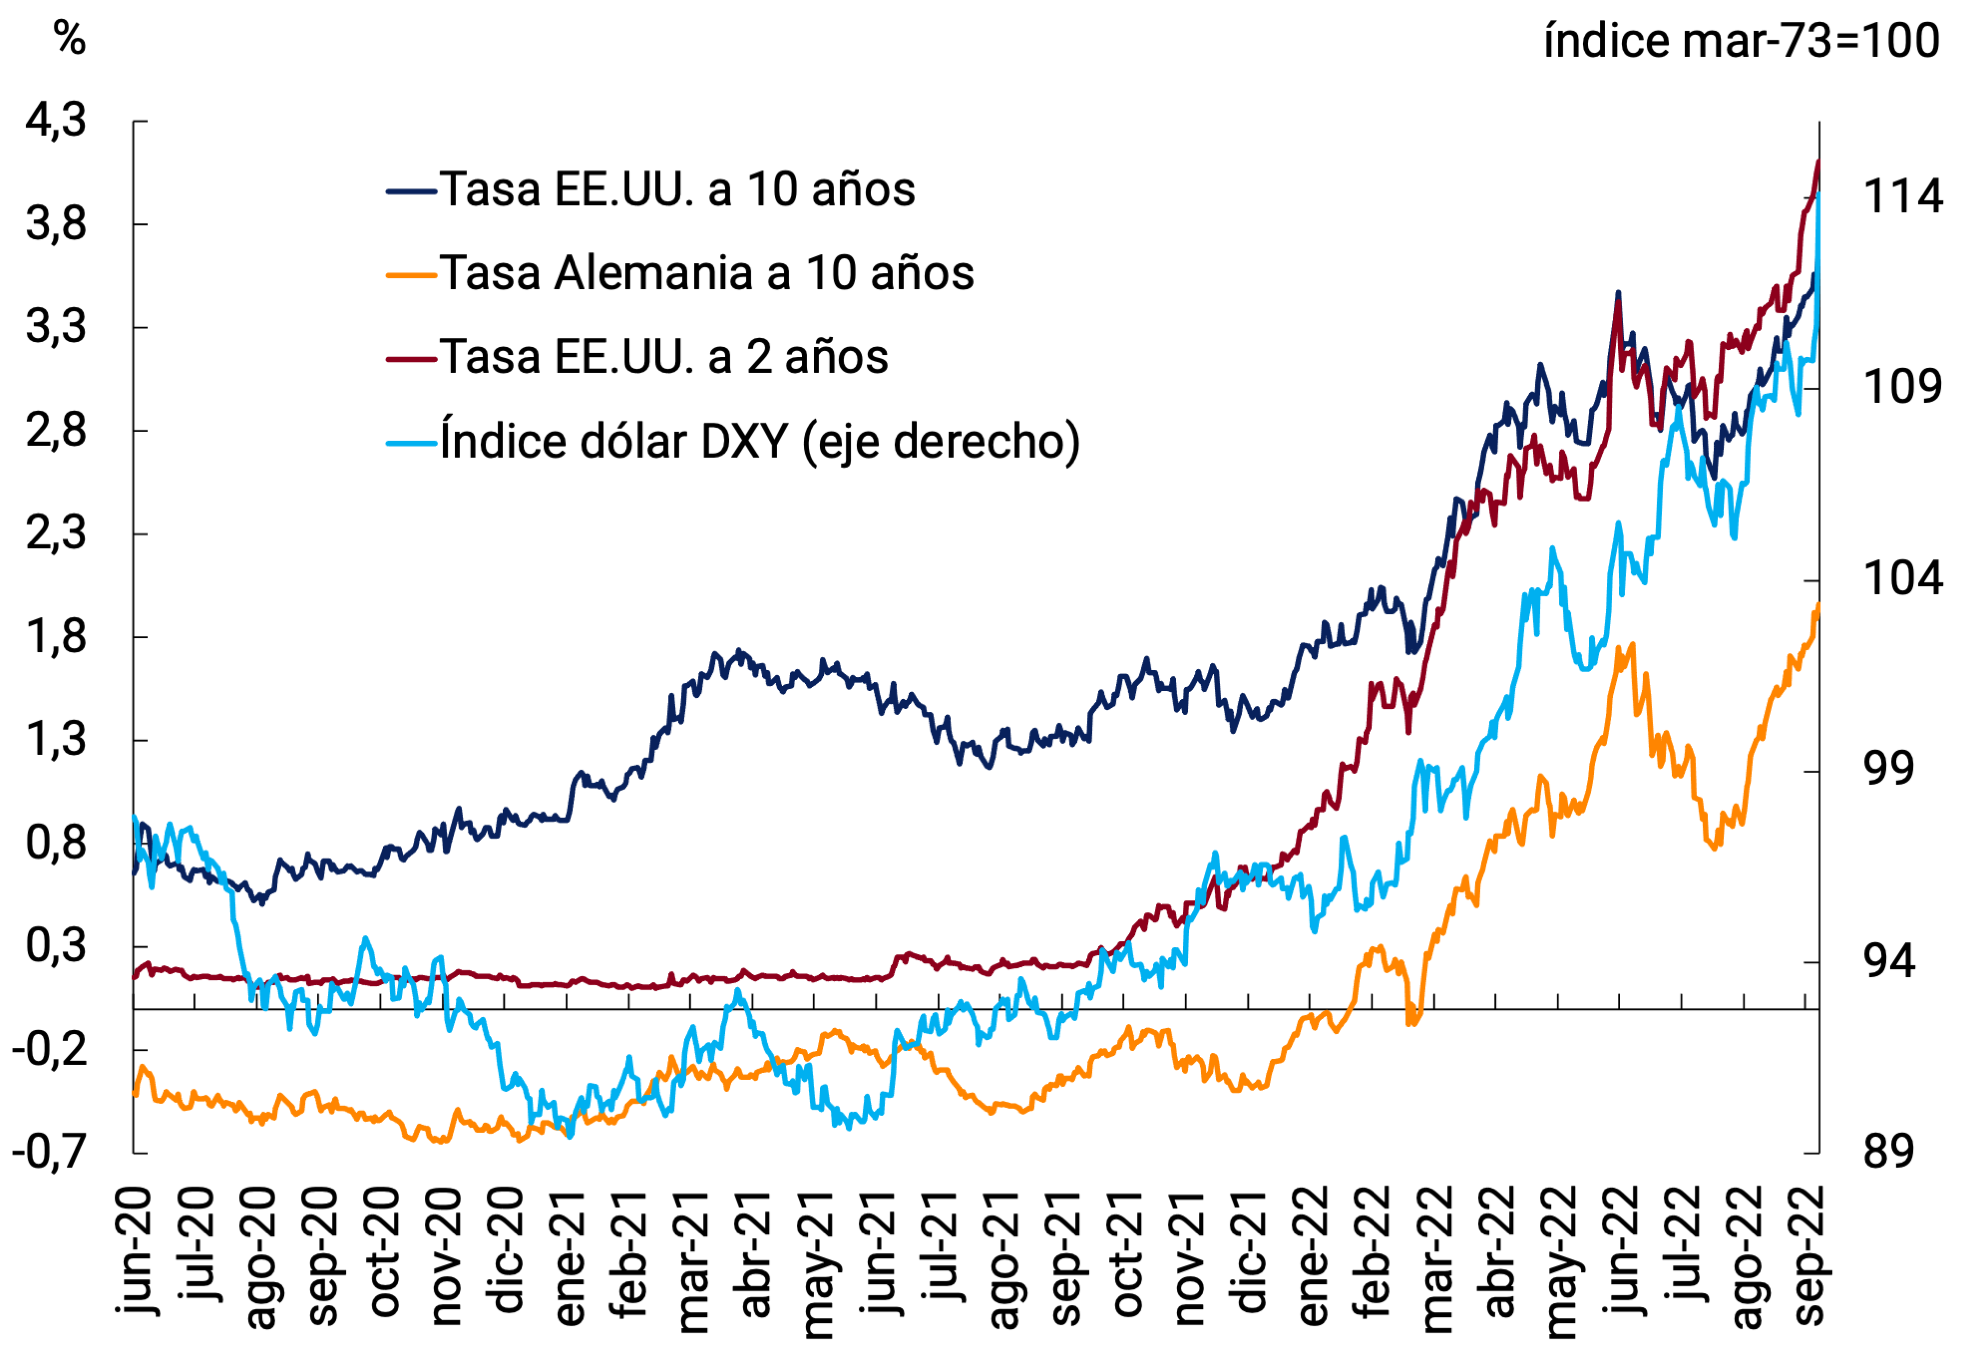
As a mirror of the aforementioned movements, interest rates on 10-year bonds, both in the US and Germany, fell on expectations of less tightening by central banks, only to rise again in recent weeks. Thus, the 10-year rate of the US stands at 3.69%, 105 bps above the previous IPOM close. The US dollar continued to appreciate, setting highs against the yen and the euro. Against a basket of currencies, the dollar appreciated 16% for the year, reaching its highest level in 20 years (see Figure 2.8b). All of the above implies tougher financial conditions for developing countries.
Figure 2.8 | Asset
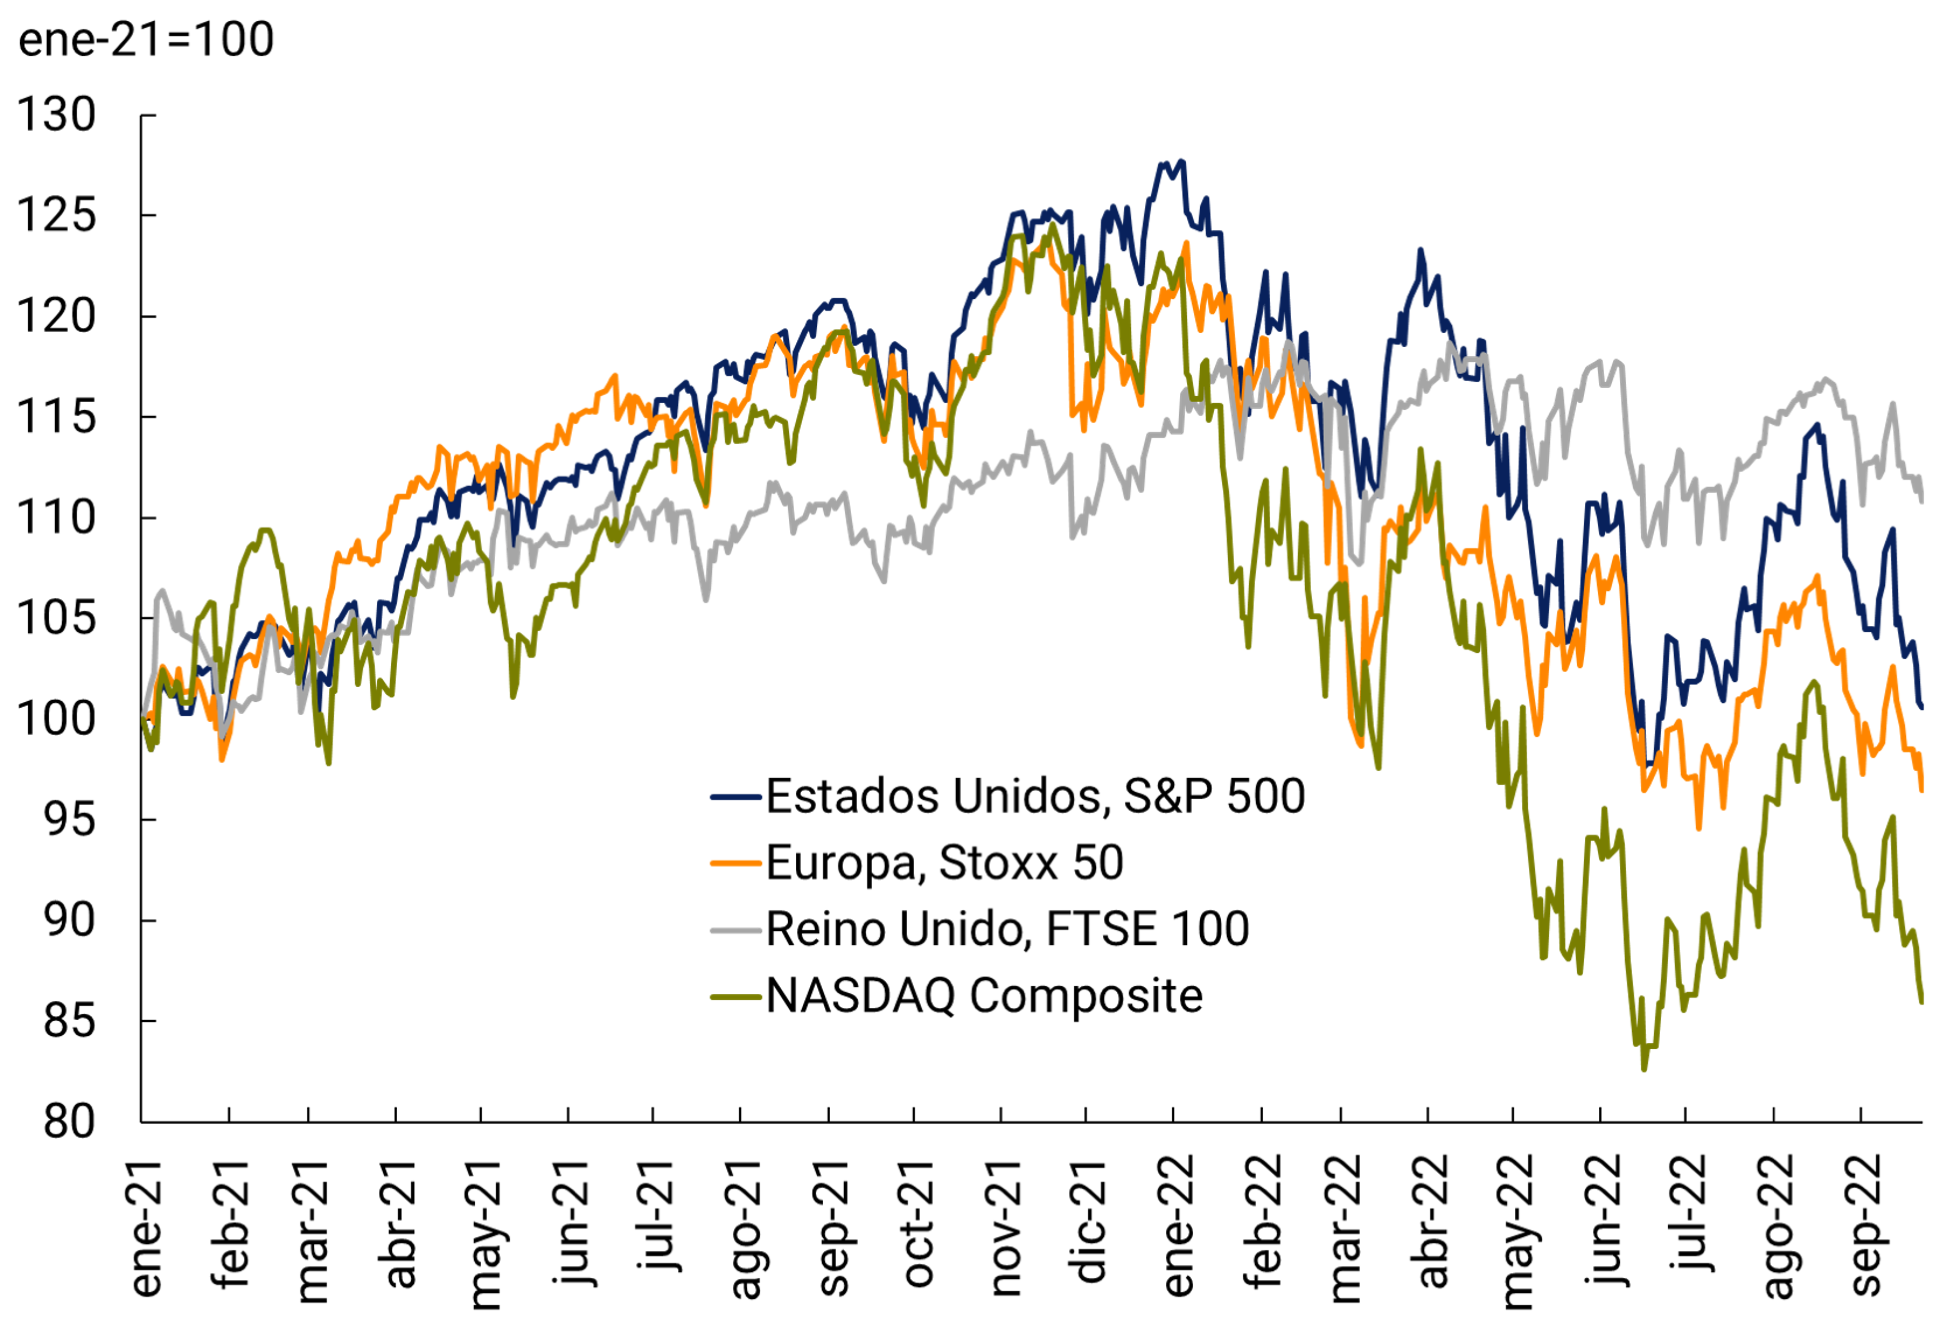
index
Source: BCRA based on Bloomberg data.
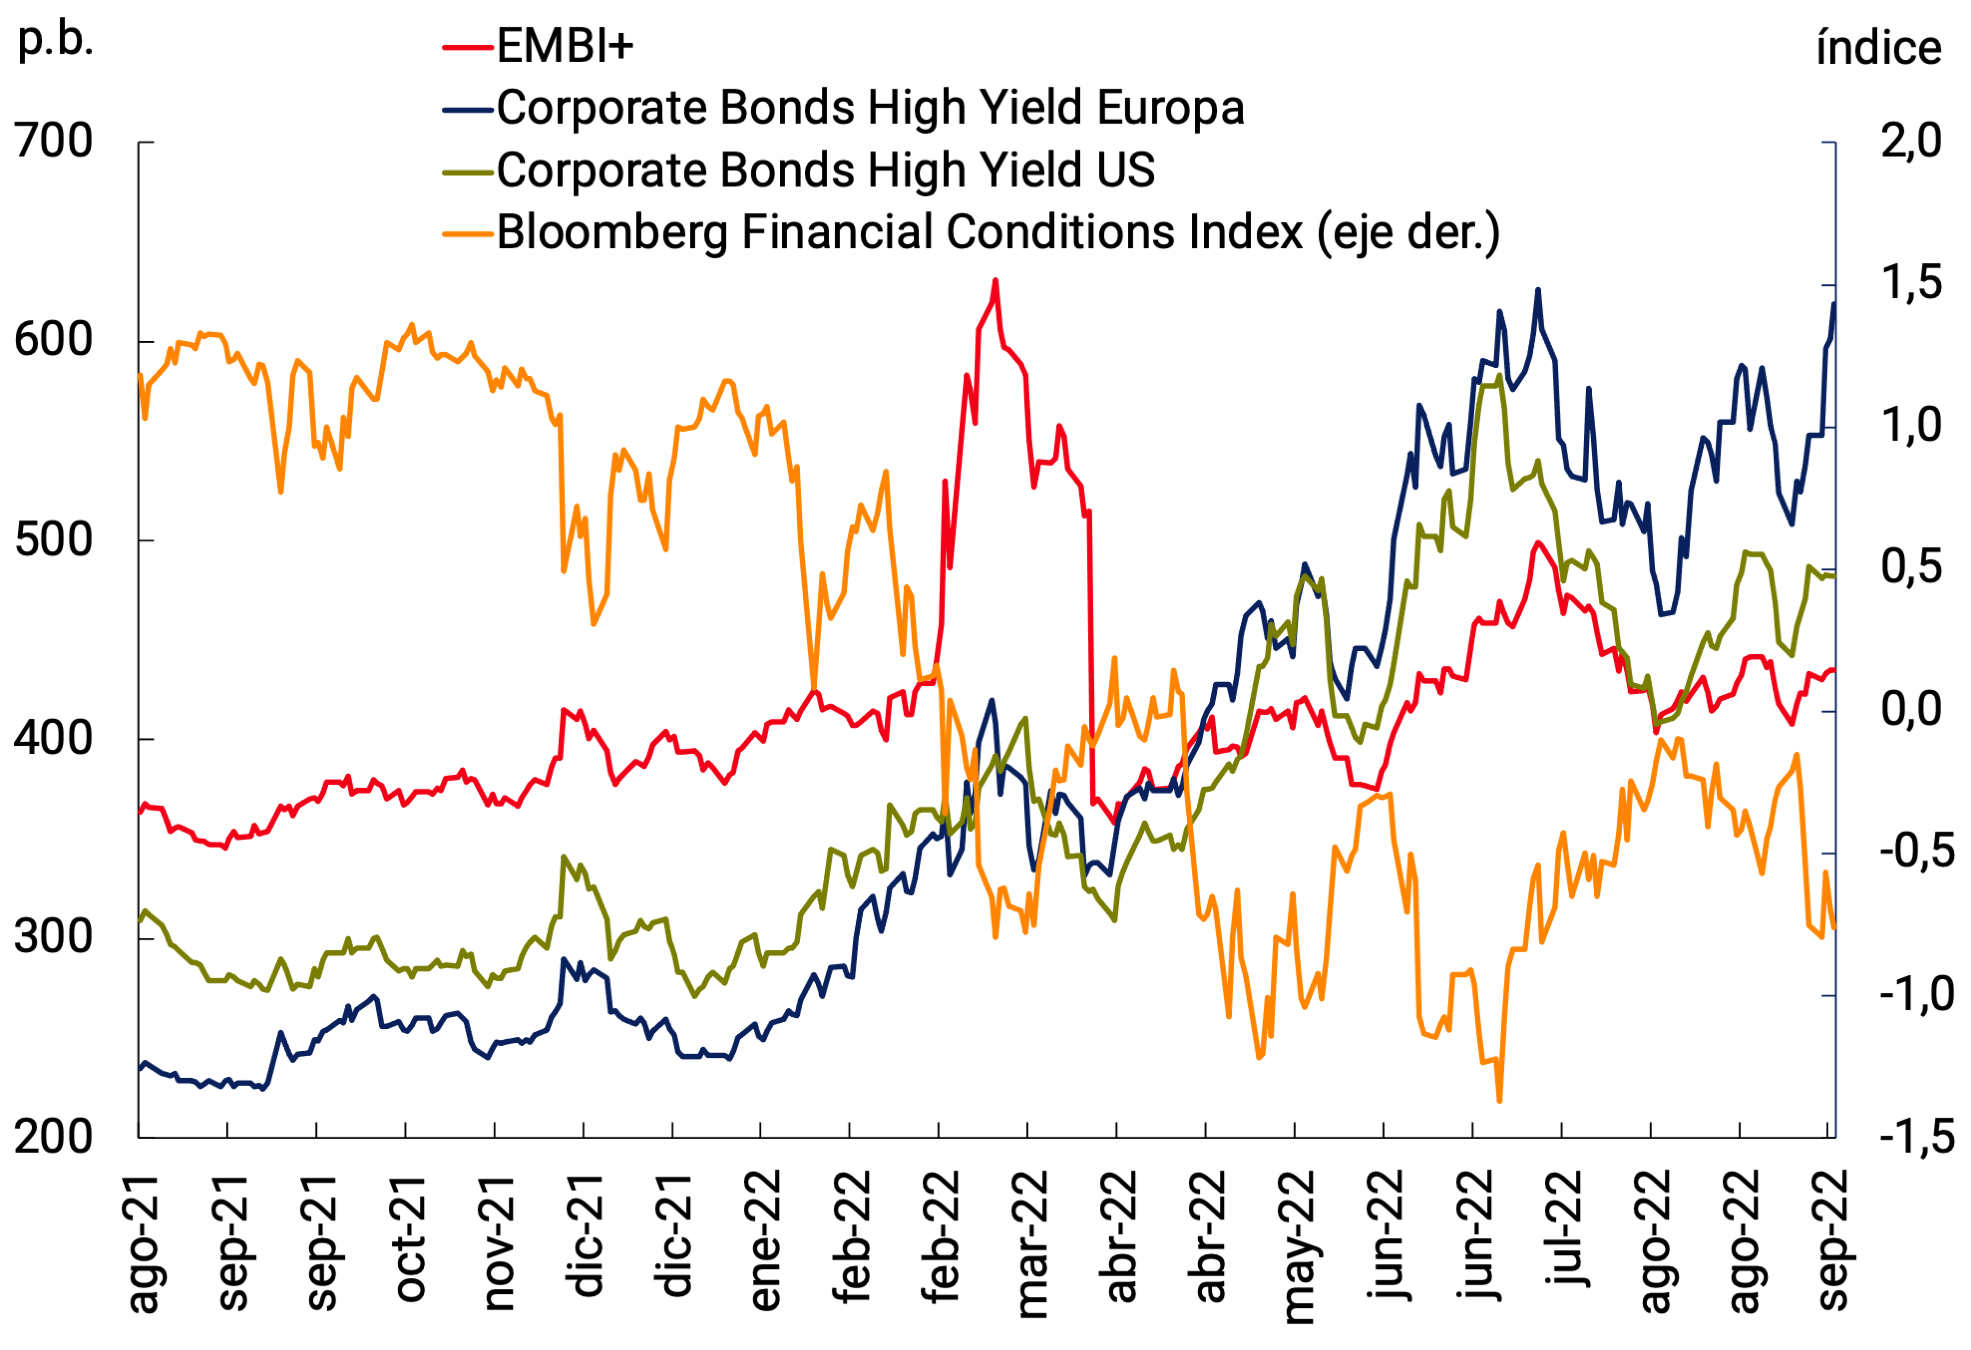
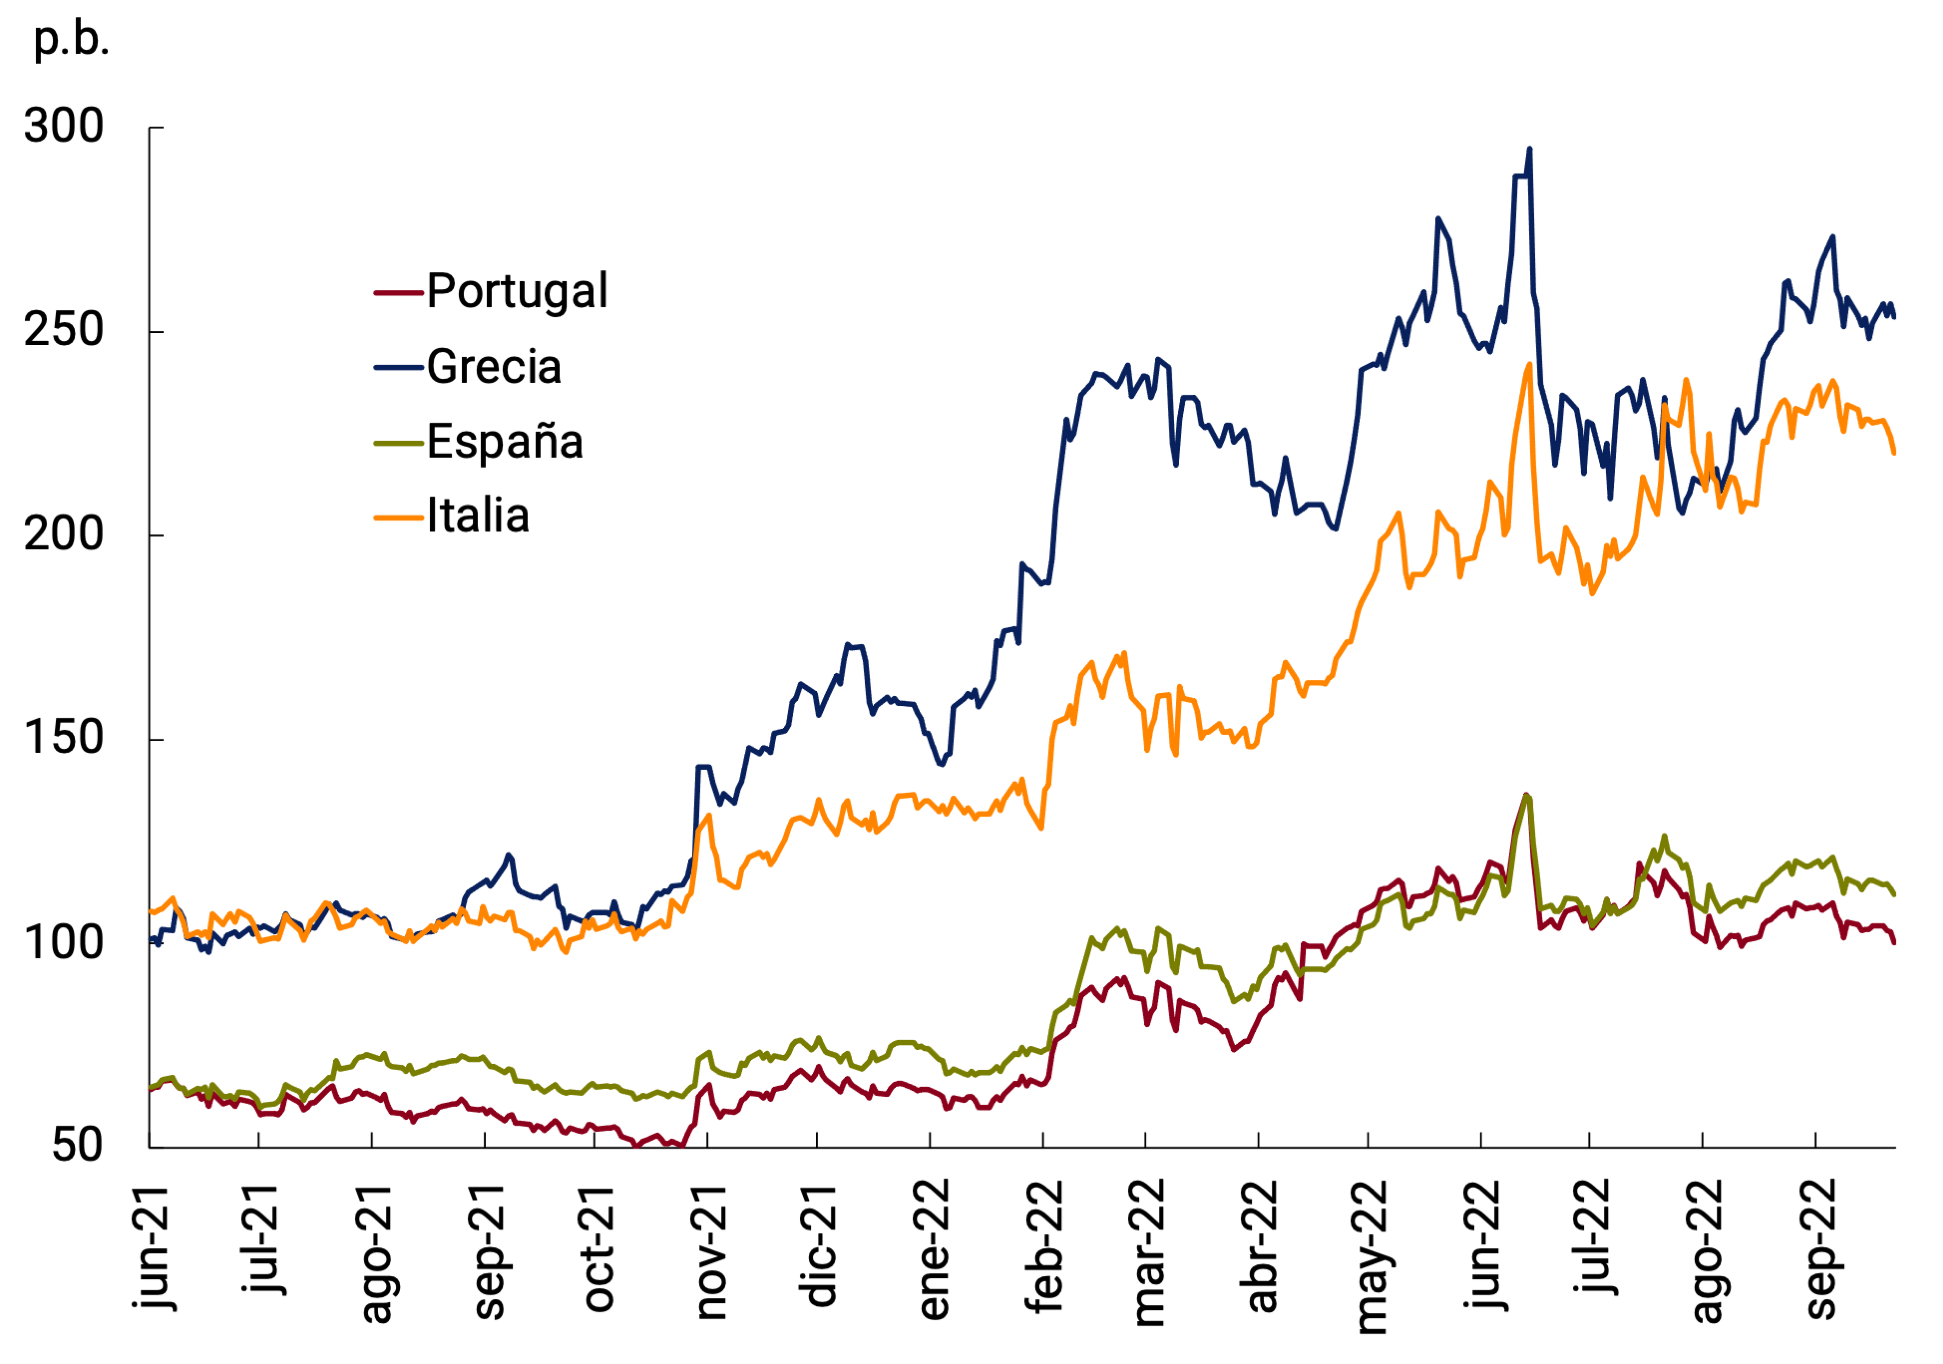
This further tightening was reflected in the returns on developing-country financial assets, with increases in sovereign spreads (as measured by the EMBI+) and also in assets that are substitutes for developing-country assets in investment portfolios, such as advanced-country high-yield corporate bonds (see Figure 2.9a). Capital outflows from emerging countries continued in the quarter. In addition, bond yields of riskier European countries rose (see Figure 2.9b), prompting the ECB to take steps to control it (see previous section).
Figure 2.9 | Asset Markets
to. Risky Asset Returns
b. Yields on European government securities
Source: BCRA based on Bloomberg data.
2.5. Commodity prices fell sharply in the last quarter except for energy
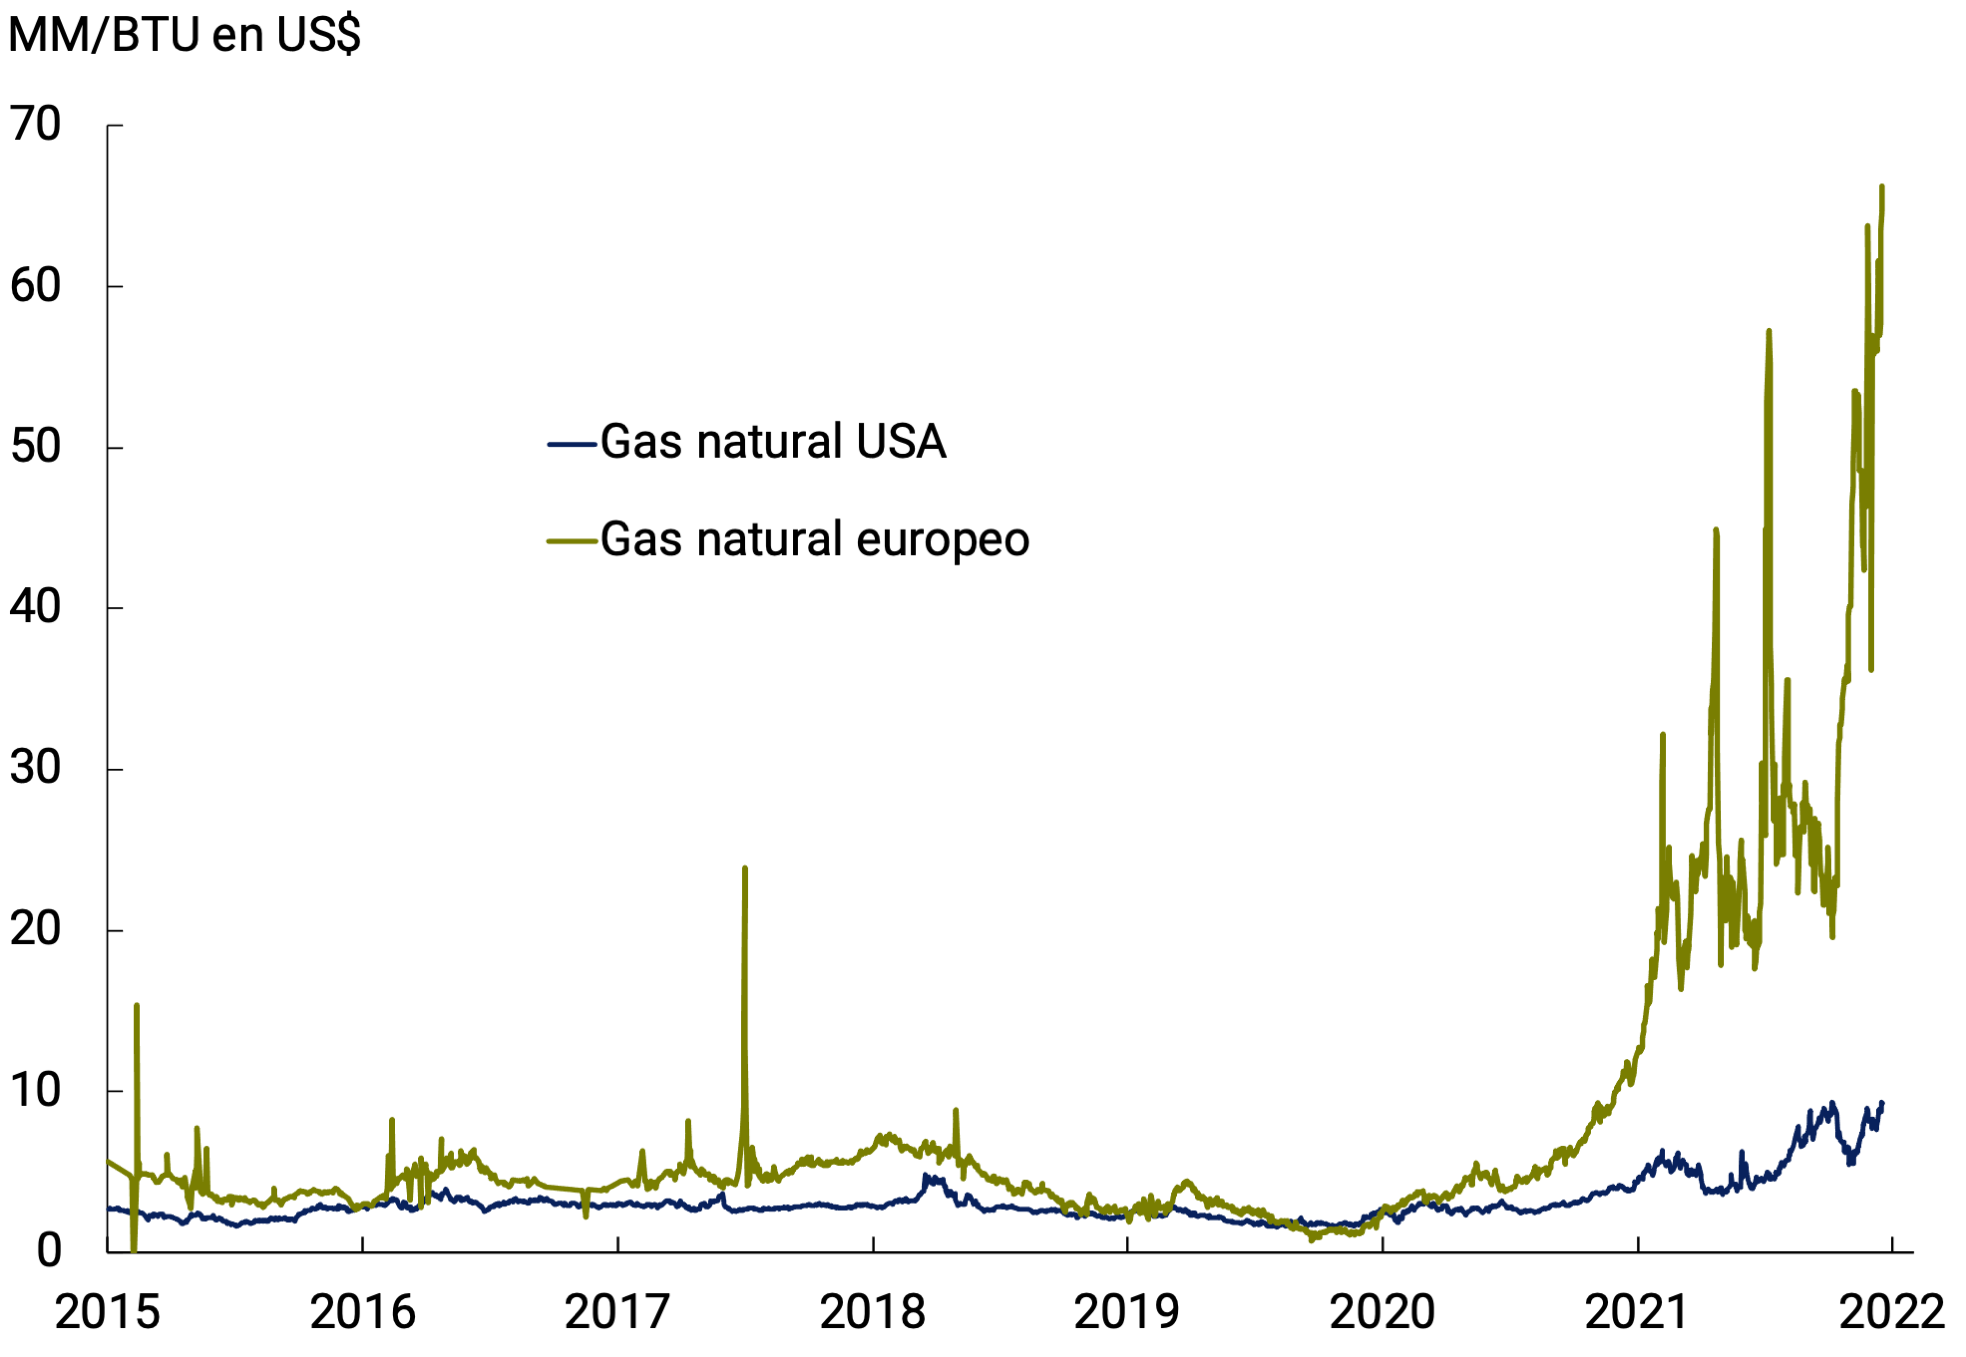
Commodity prices tended to return to pre-war levels, mainly affected by the risk of a global recession. Energy commodities were an exception, and continued to suffer from the volatility derived from the conflict. WTI crude oil had three consecutive months of decline, after having reached US$116 per barrel on May 30, currently trading at US$83 due to fears of a global economic slowdown that could be generated by the Fed’s interest rate hike, hurting fuel demand. A hotter-than-usual summer in Europe, the sanctions imposed on Russia and the latter’s decision to provide only 20% of the usual gas supply through the Nord Stream pipeline had a strong impact on both the level and volatility of the gas price, which reached a record price of US$66 billion BTU on August 18 in the European wholesale gas market in the United States. Bass. This price differential with the North American market led to a redirection of gas exports from the United States, where the domestic price reached a 15-year high of US$8.78 per MM BTU on August 22 (see Figure 2.10a).
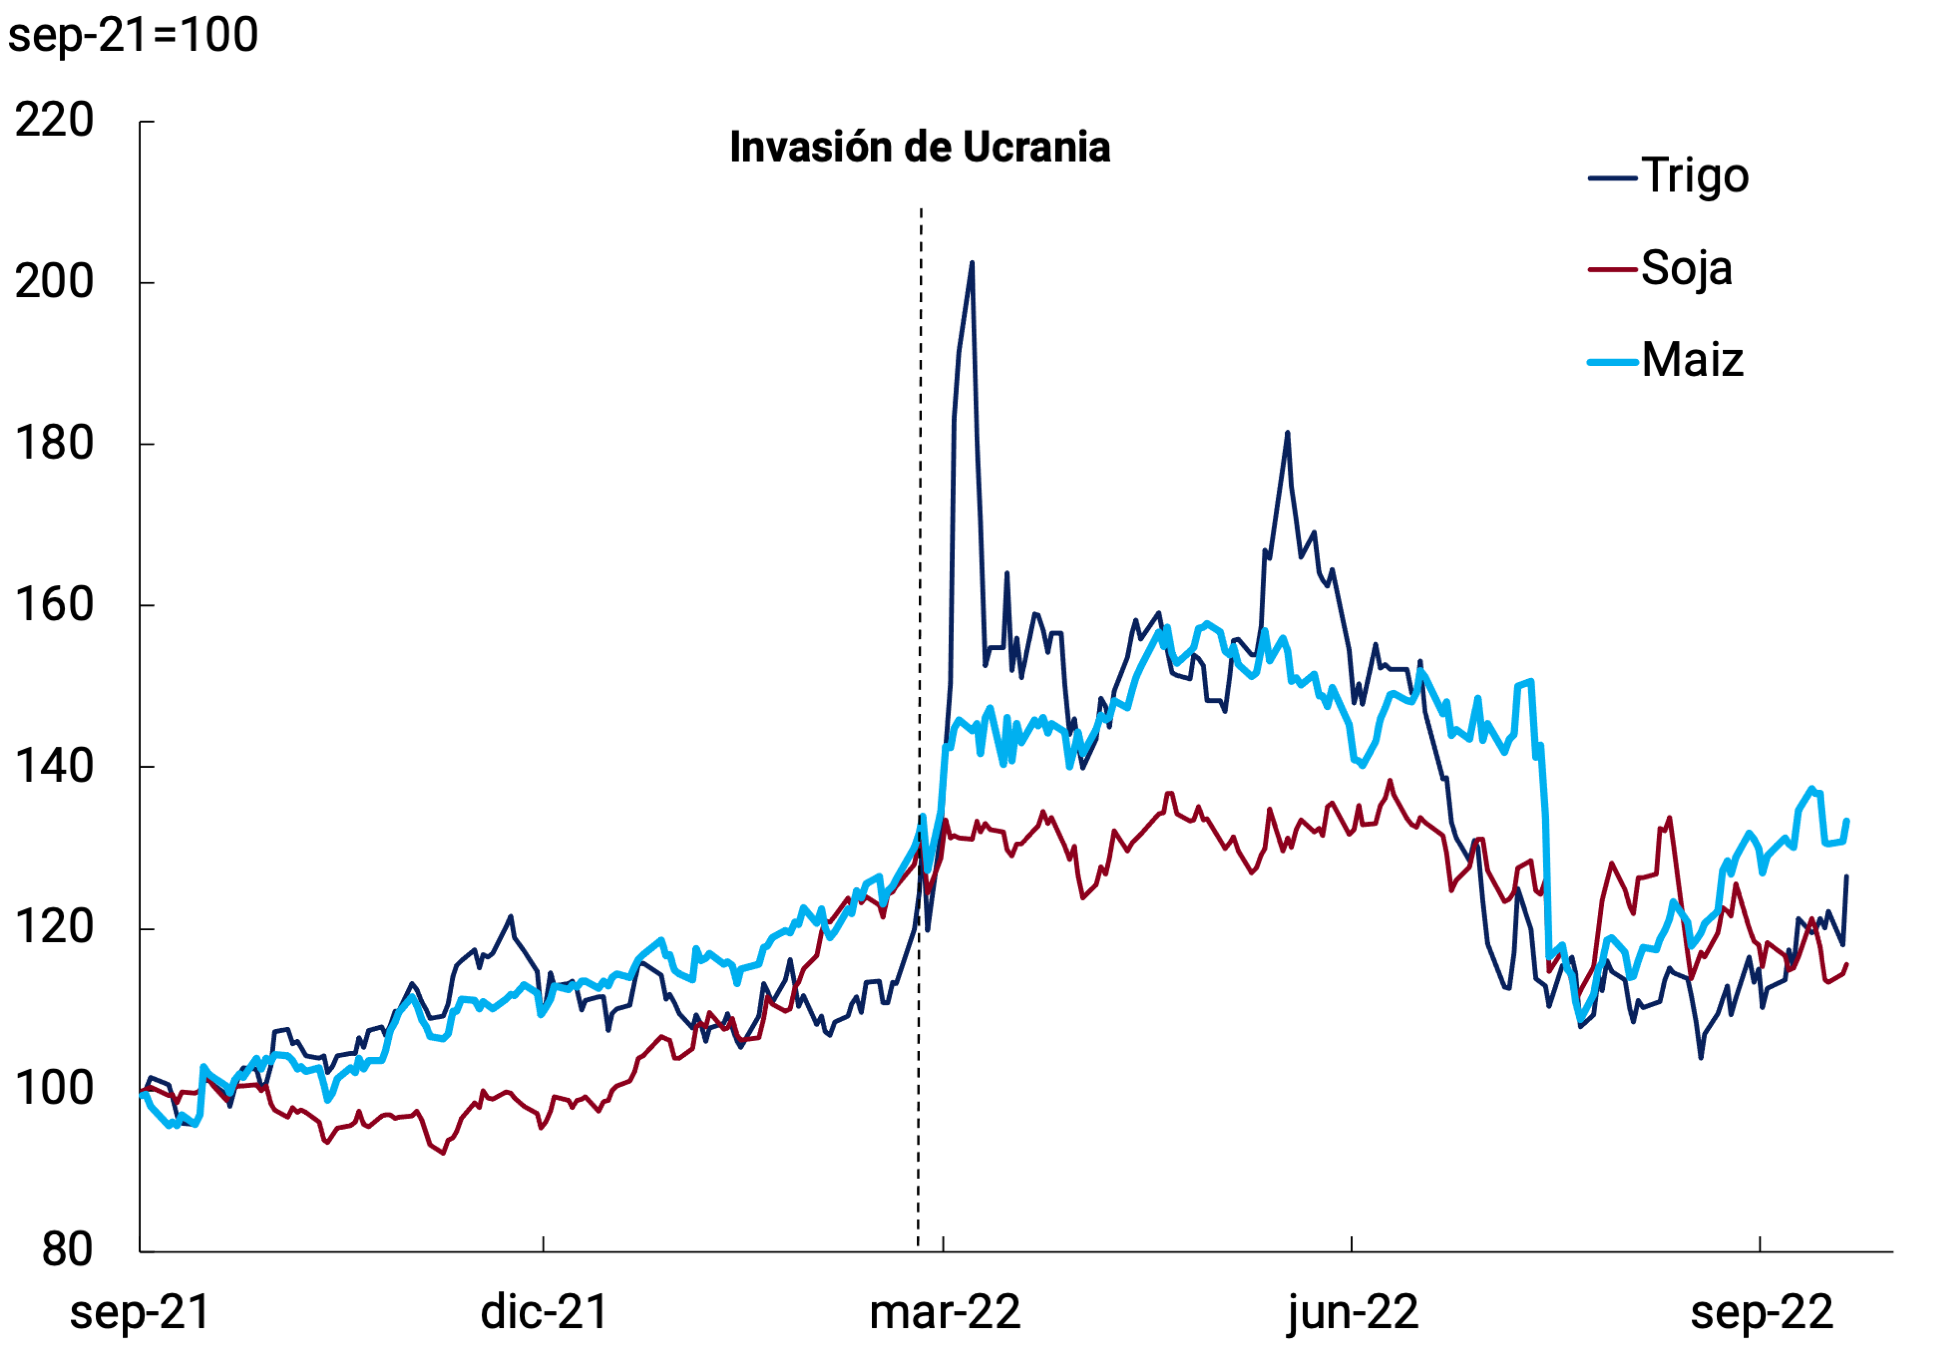
Following the agreement reached between Russia and Ukraine under the auspices of the UNon July 22, the 20 million tons of Ukrainian grain that had accumulated in ports since the conflict began began to be gradually released. Wheat and corn, which reached US$523 and US$321 per tonne respectively at the height of the conflict, are currently trading at US$327 and US$272 per tonne, bringing the prices of both cereals back to values at the beginning of the year, prior to the conflict in Ukraine. Soybeans, on the other hand, decreased in price in the last quarter after several countries revised their production forecasts towards record harvests, such as Russia, or simply higher, such as in the United States. In addition, demand did not generate enough pressure on the price due to uncertainty about the world economy. Soybeans are currently trading at US$543, which represents February values of this year (see Figure 2.10b). Going forward, the entry of grains into the international market that have accumulated in Ukrainian port silos since the invasion began on February 24 could be a determining factor in avoiding a new price rise. On the other hand, the price of energy commodities , particularly gas, could have structural or long-term repercussions, providing greater volatility, which could persist even after the end of the war.
Figure 2.10 | Selected Commodity Prices
to. Natural gas price
b. Price of corn, wheat and soybeans
Source: BCRA based on Bloomberg data.
2.6. In summary
The global economy has slowed, and the risks of a recession have increased. At the same time, rising inflation has triggered a more pronounced monetary contraction in advanced countries, while developing countries had already been raising interest rates. Global financial conditions are more adverse for emerging countries (higher rates, appreciated dollar and higher risk spreads); and interact with commodity prices that are at levels prior to the war, except for the sharp rise in energy. Although global supply chains are becoming regularized, their continuity depends on the evolution of the pandemic in China. The balance of risks points to lower global activity and tighter financial conditions, depending on how much monetary policy continues to tighten in advanced economies in the face of persistent inflation.
Back to top
3. Economic Activity and Employment
In the second quarter of 2022, GDP grew above expectations at the beginning of the year. The activity of the non-agricultural sectors as a whole more than compensated for the negative impact that the lack of rainfall caused on the economic performance of the soybean and corn complex.
As expected, the particularly dynamic sectors during the first half of 2022 have been the services that had fallen the most during 2020 and that as a whole have already managed to recompose their pre-pandemic levels. Also noteworthy is the evolution of some primary activities such as Mining and Fishing, which far exceed the highs of the end of 2017, and those of Industry, Commerce and Construction, which were the ones with the greatest impact on the post-pandemic recovery.
From the point of view of demand, the investment rate reached an all-time high and some acceleration was observed in the growth rate of private consumption, which was lagging behind.
With a statistical drag of 5.3 percentage points (p.p.) left by the growth observed in the second quarter, the growth of economic activity would have stopped in July and August, in a context of greater financial volatility and inflationary acceleration. It is expected that the set of monetary and fiscal policy measures recently adopted within the framework of the goals committed to the IMF will strengthen macroeconomic stability and improve the perception of risks to fiscal sustainability, a necessary condition for resuming the path of economic growth.
3.1. Economic activity grew above expectations during the second quarter of 2022 and deteriorated from July with the increase in financial volatility
GDP registered a growth of 1% quarterly without seasonality (s.e.) in the second quarter (6.9% y.o.y.), significantly above the estimates of the main market analysts, who expected a fall of 0.7% according to the median of the REM corresponding to the June survey. This deviation from expected growth was mainly explained by the outstanding performance of those services that had been greatly affected by the pandemic and the less damage compared to what was estimated three months ago, of the drought on agricultural production.
In a particularly challenging local and international context, July saw an increase in volatility in financial markets and heightened fears about the future of economic policy. The Monthly Estimator of Economic Activity (EMAE) remained stagnant in July at the level of the previous month. Compared to the same month in 2021, it increased in July by 5.6% y.o.y., while in the January-July average the accumulated growth was 6.4%.
It should be noted that, in July, both the Leading Activity Indicator (ILA-BCRA) and the activity indicator prepared by the OECD – based on Internet searches through Google – had shown deteriorations3. In August, the leading indicators showed a contraction compared to July, so a deterioration in the performance of activity during the third quarter is expected compared to the second quarter (see Figure 3.1).
Figure 3.1 | Monthly indicators of economic
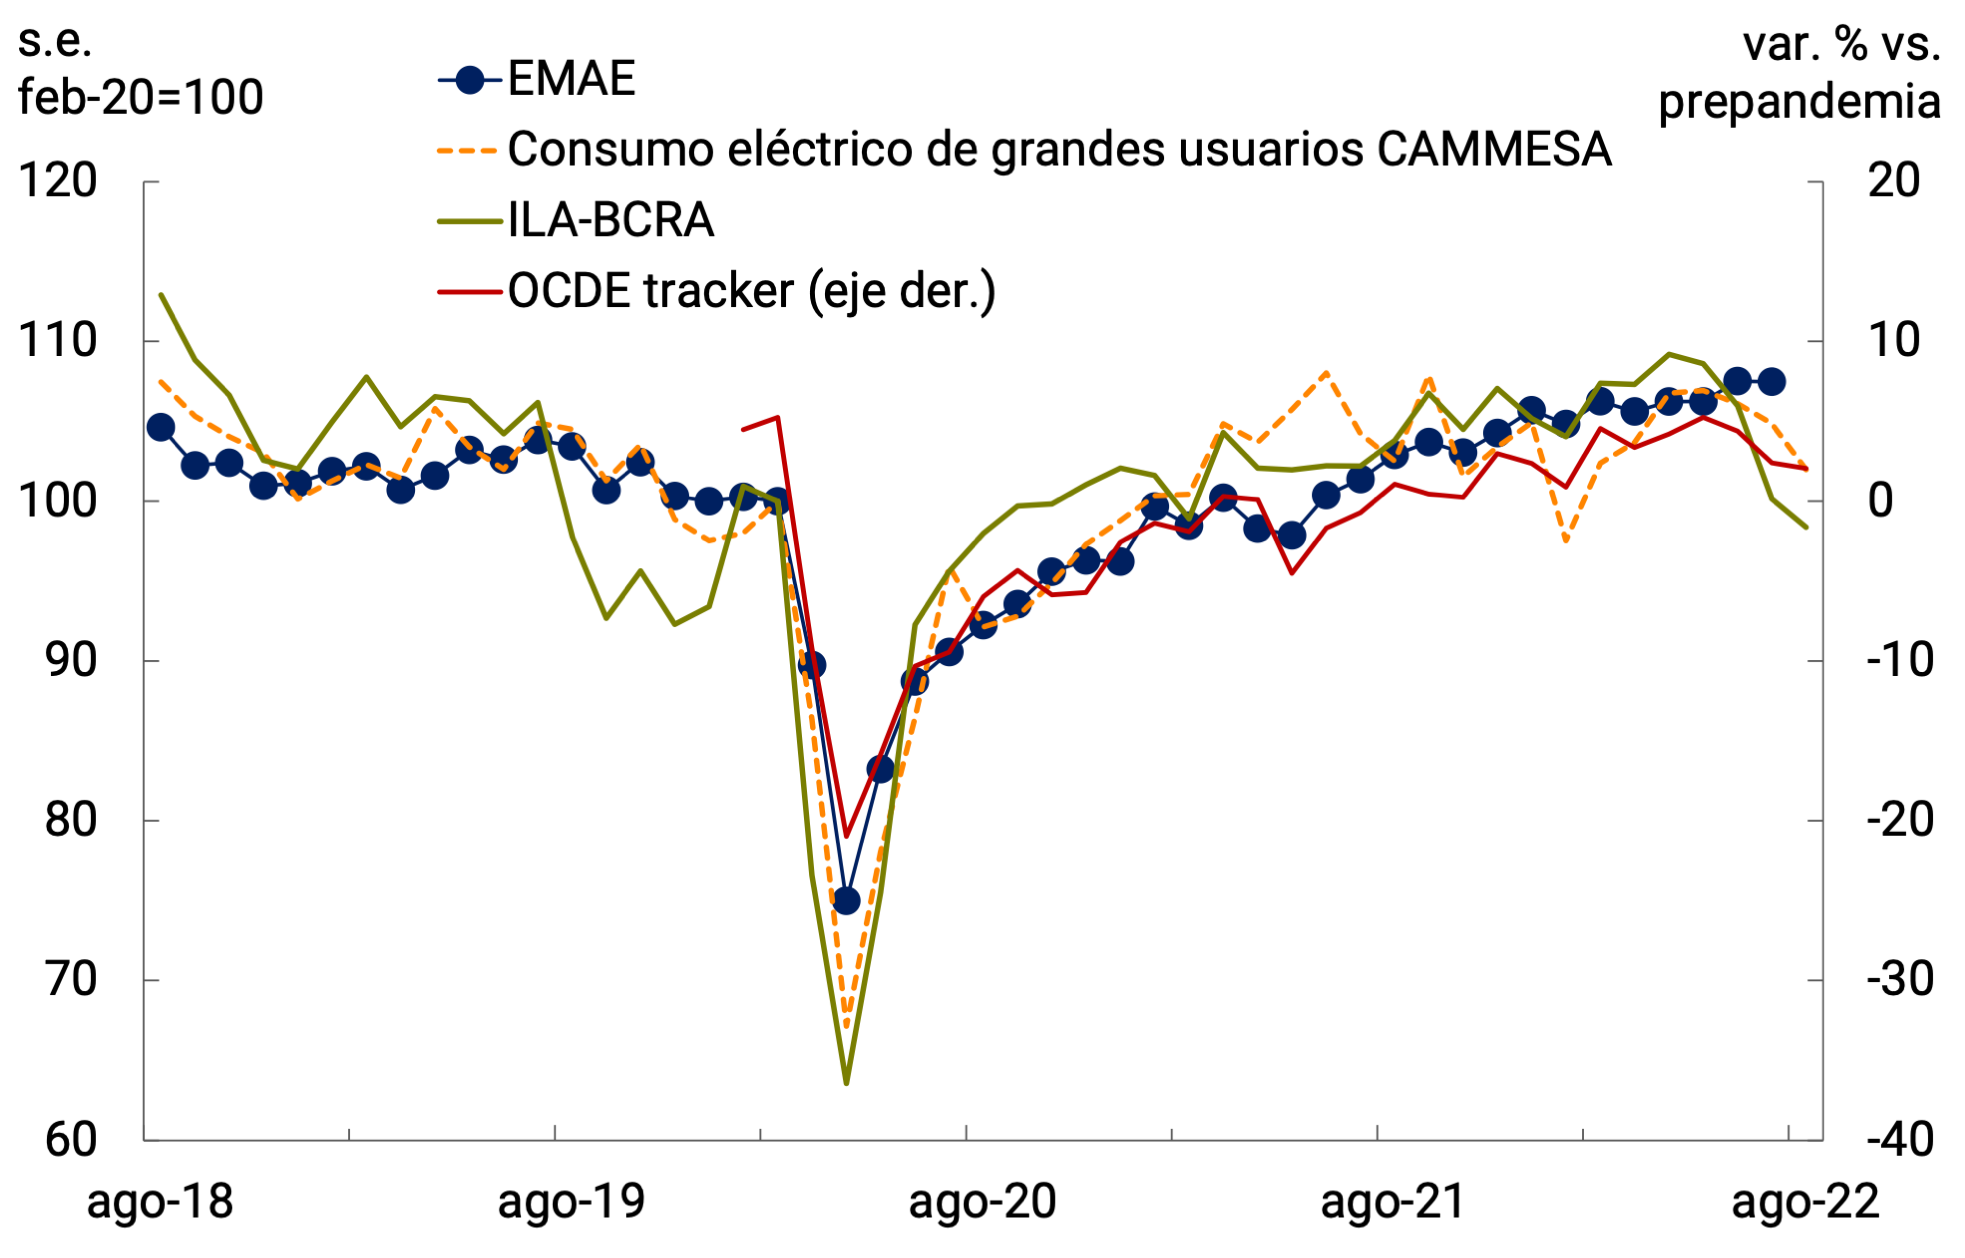
activity
Source: BCRA based on data from INDEC, CAMMESA and OECD.
The investment rate was at its highest since 1993 in the second quarter while private consumption responded to the increase in the wage bill
From the point of view of expenditure, the increase in GDP of 1% qoq s.e. during the second quarter of 2022 was explained by the performance of domestic demand – total domestic expenditure on consumption and investment – which continued to increase significantly (2.8% qoq s.e.) mainly due to the effect of investment4, which registered a 7.8% qoq increase s.e. (18.8% y.o.y.) and contributed 1.6 p.p. to the quarterly variation of the Product. Private Consumption grew 1.8% quarter-on-quarter (10.7% YoY) and Public Consumption, 0.2% quarter-on-quarter (5.3% YoY). The external sector was neutral in terms of its contribution to the quarterly variation in GDP during the second quarter of 2022. Exports of goods and services, which had been declining, increased 3.5% qoq s.e. (9.3% y.o.y.) while imports attenuated their rate of increase to 2.9% qoq s.e. (23.1% y.o.y.).
In historical perspective, the investment rate measured at constant prices and calculated on seasonally adjusted series stood at 22.3% of GDP in the second quarter of 2022, the highest since the first quarter of 1993. As for Private Consumption, the level of the second quarter was lower than the maximum of the fourth quarter of 2017 (-6.3% s.e.) and was similar to that observed at the beginning of 2019 (see Figure 3.2).
Figure 3.2 | Level of Private Consumption and Investment
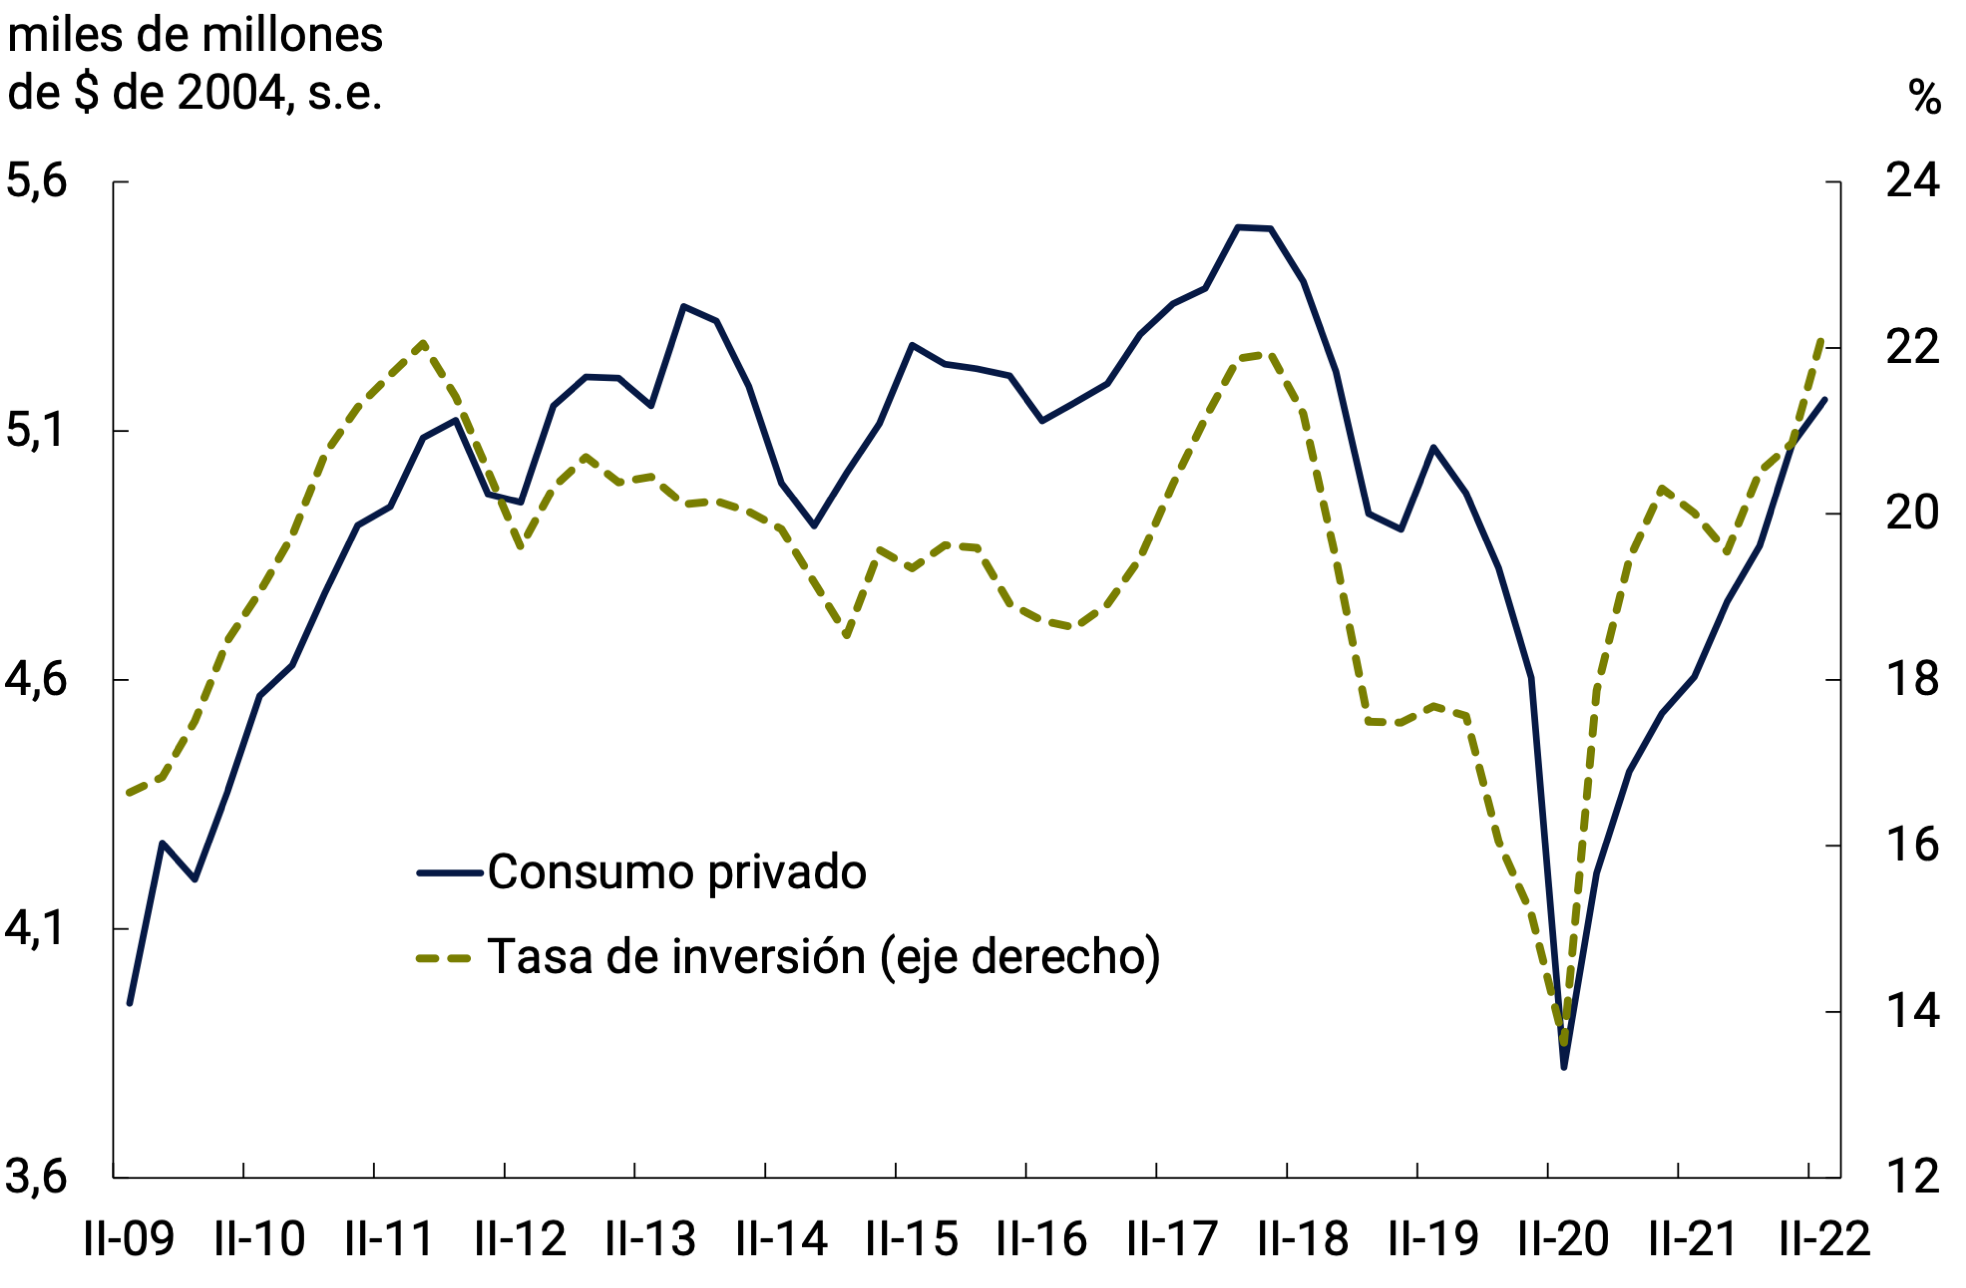
Rate
Source: BCRA based on INDEC data.
It is worth mentioning that consumption-savings decisions and consequently the savings-investment identity, were strongly altered with respect to their traditional determinants, both during the worst moment of the pandemic and in the subsequent recovery. From the second quarter of 2020 to the fourth quarter of 2021, National Income grew above Total Consumption measured in real terms5, i.e. an increase in Gross National Savings was observed that supported the increase in Consumption in 2022 (see Figure 3.3 and Section 2 / The post-pandemic recovery in the main economies of South America).
In 2021, the recovery in total consumption had been driven by the mass of non-wage income. The collapse in consumption during the worst moment of the pandemic – the second quarter of 2020 – was also fundamentally explained by the drastic fall in this mass of income, highlighting that the magnitude of the real fall in the Remuneration of Salaried Work (RTA) in that period of confinement was lower than that observed in the fourth quarter of 2018 and the first quarter of 2019. With data for the first quarter of 2022 and estimates for the second, the RTA, which accounts for the evolution of both employment and wages, would have increased at an average rate of 67% y.o.y., similar to that of national income, while total consumption increased 77.6% y.o.y. in nominal terms and implicit prices of private consumption increased 62% y.o.y.
Figure 3.3 | National Income and Total
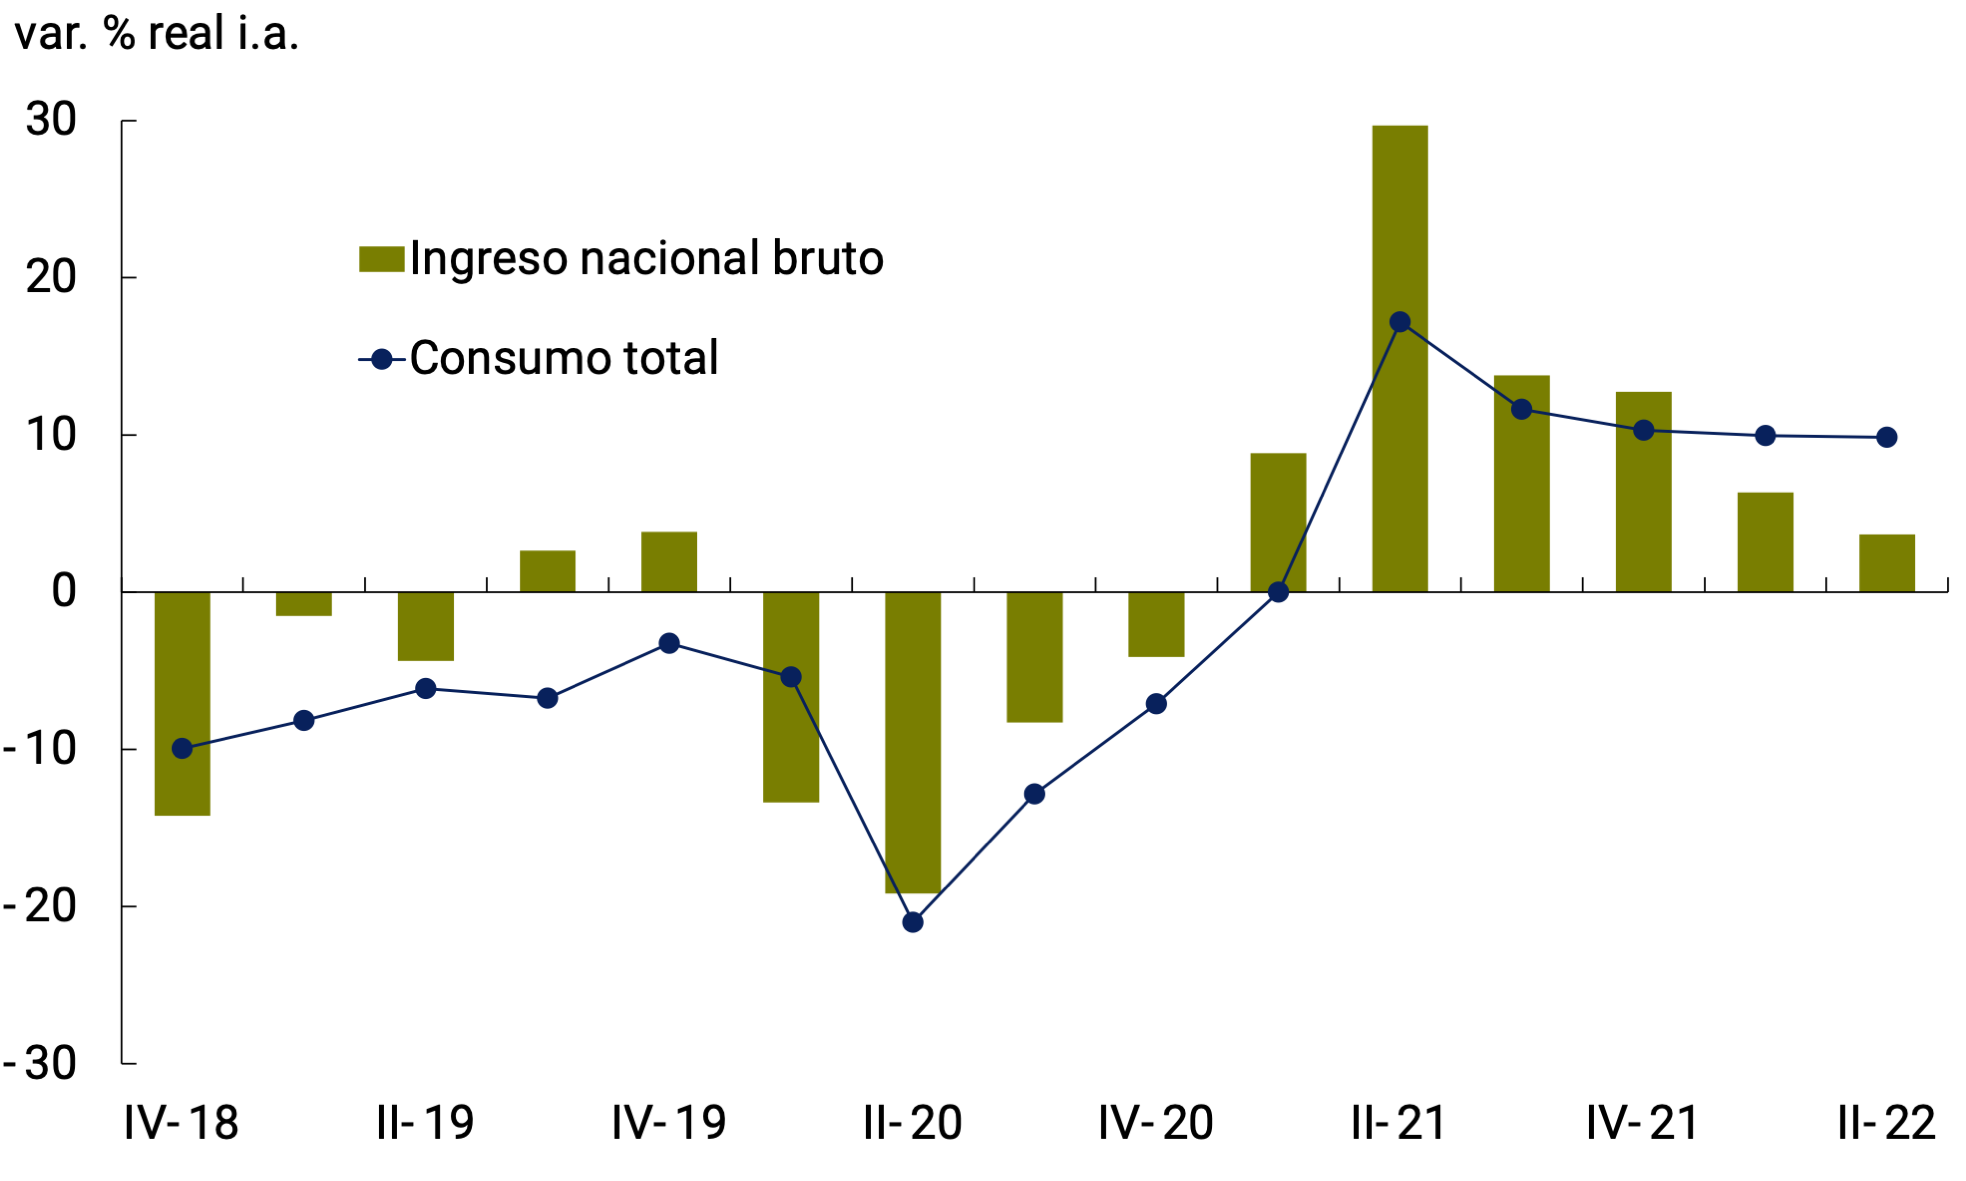
Consumption
The deflator of Income and Total Consumption used is the IPI of Private Consumption.
Source: BCRA based on INDEC data.
This performance of national savings was reflected in the external accounts. The Current Account deteriorated over the course of 2022 in a context of less favorable terms of trade, and a negative contribution of Net Exports to the change in Output during the third quarter is expected (see Chapter 4. External Sector).
3.1.2. Several productive sectors exceeded the maximum levels of activity at the end of 2017, while industry and commerce have grown the most compared to the pre-pandemic period
In the second quarter of 2022, services once again showed a better economic performance than goods. Overall, the goods-producing sectors grew 1% quarter-on-quarter (4% y.o.y.) while services grew at a rate of 1.4% qo-o-y (8.5% y.o.y.).
The recent economic performance of the group composed of those services that had had more difficulties in operating normally during the confinement period, which was close to the level recorded in February 2020, stands out. This set of sectors is closely associated with the social mobility that cultural, recreational and leisure activities entail, sports, personal care, among others, and are the ones that showed the greatest dynamism during the last months. The rest of the productive sectors remained at levels very close to the highs of late 2017, around 9% above the pre-pandemic level (see Figure 3.4).
Figure 3.4 | Services most affected by the pandemic and the rest of the EMAE*
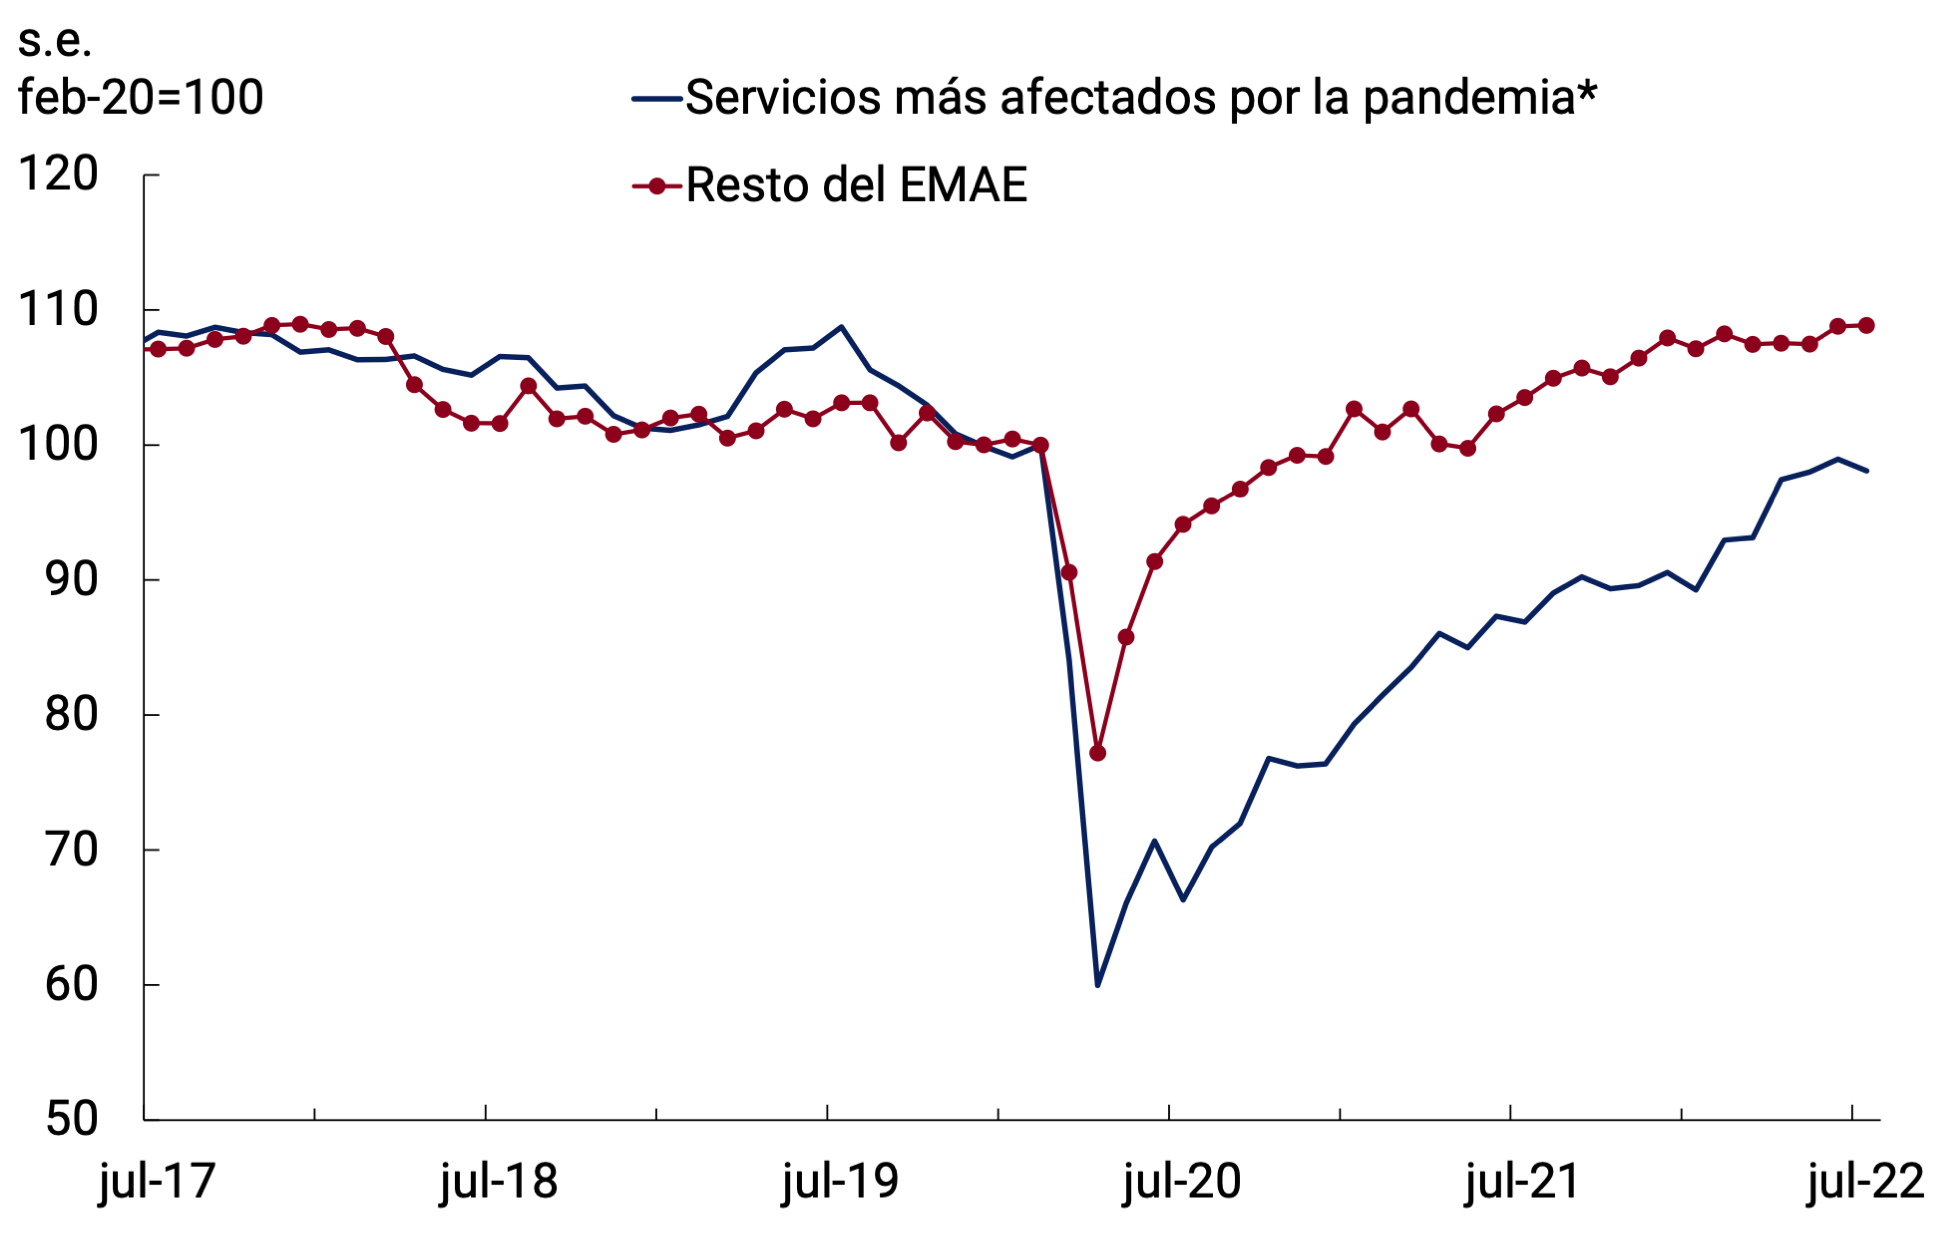
Transport and communications, Hotels and restaurants and Other community services.
Source: BCRA based on INDEC data.
When looking at the seasonally adjusted level of activity of each productive sector during the second quarter of 2022, compared to that corresponding to the fourth quarter of 2017 and also to the quarter prior to the start of the pandemic (the fourth quarter of 2019), a great heterogeneity is observed in the behavior of aggregate supply. where 8 of the 16 items that make up GDP exceeded the maximums reached in the fourth quarter of 2017 (see Figure 3.5).
Figure 3.5 | Level of sectoral activity compared
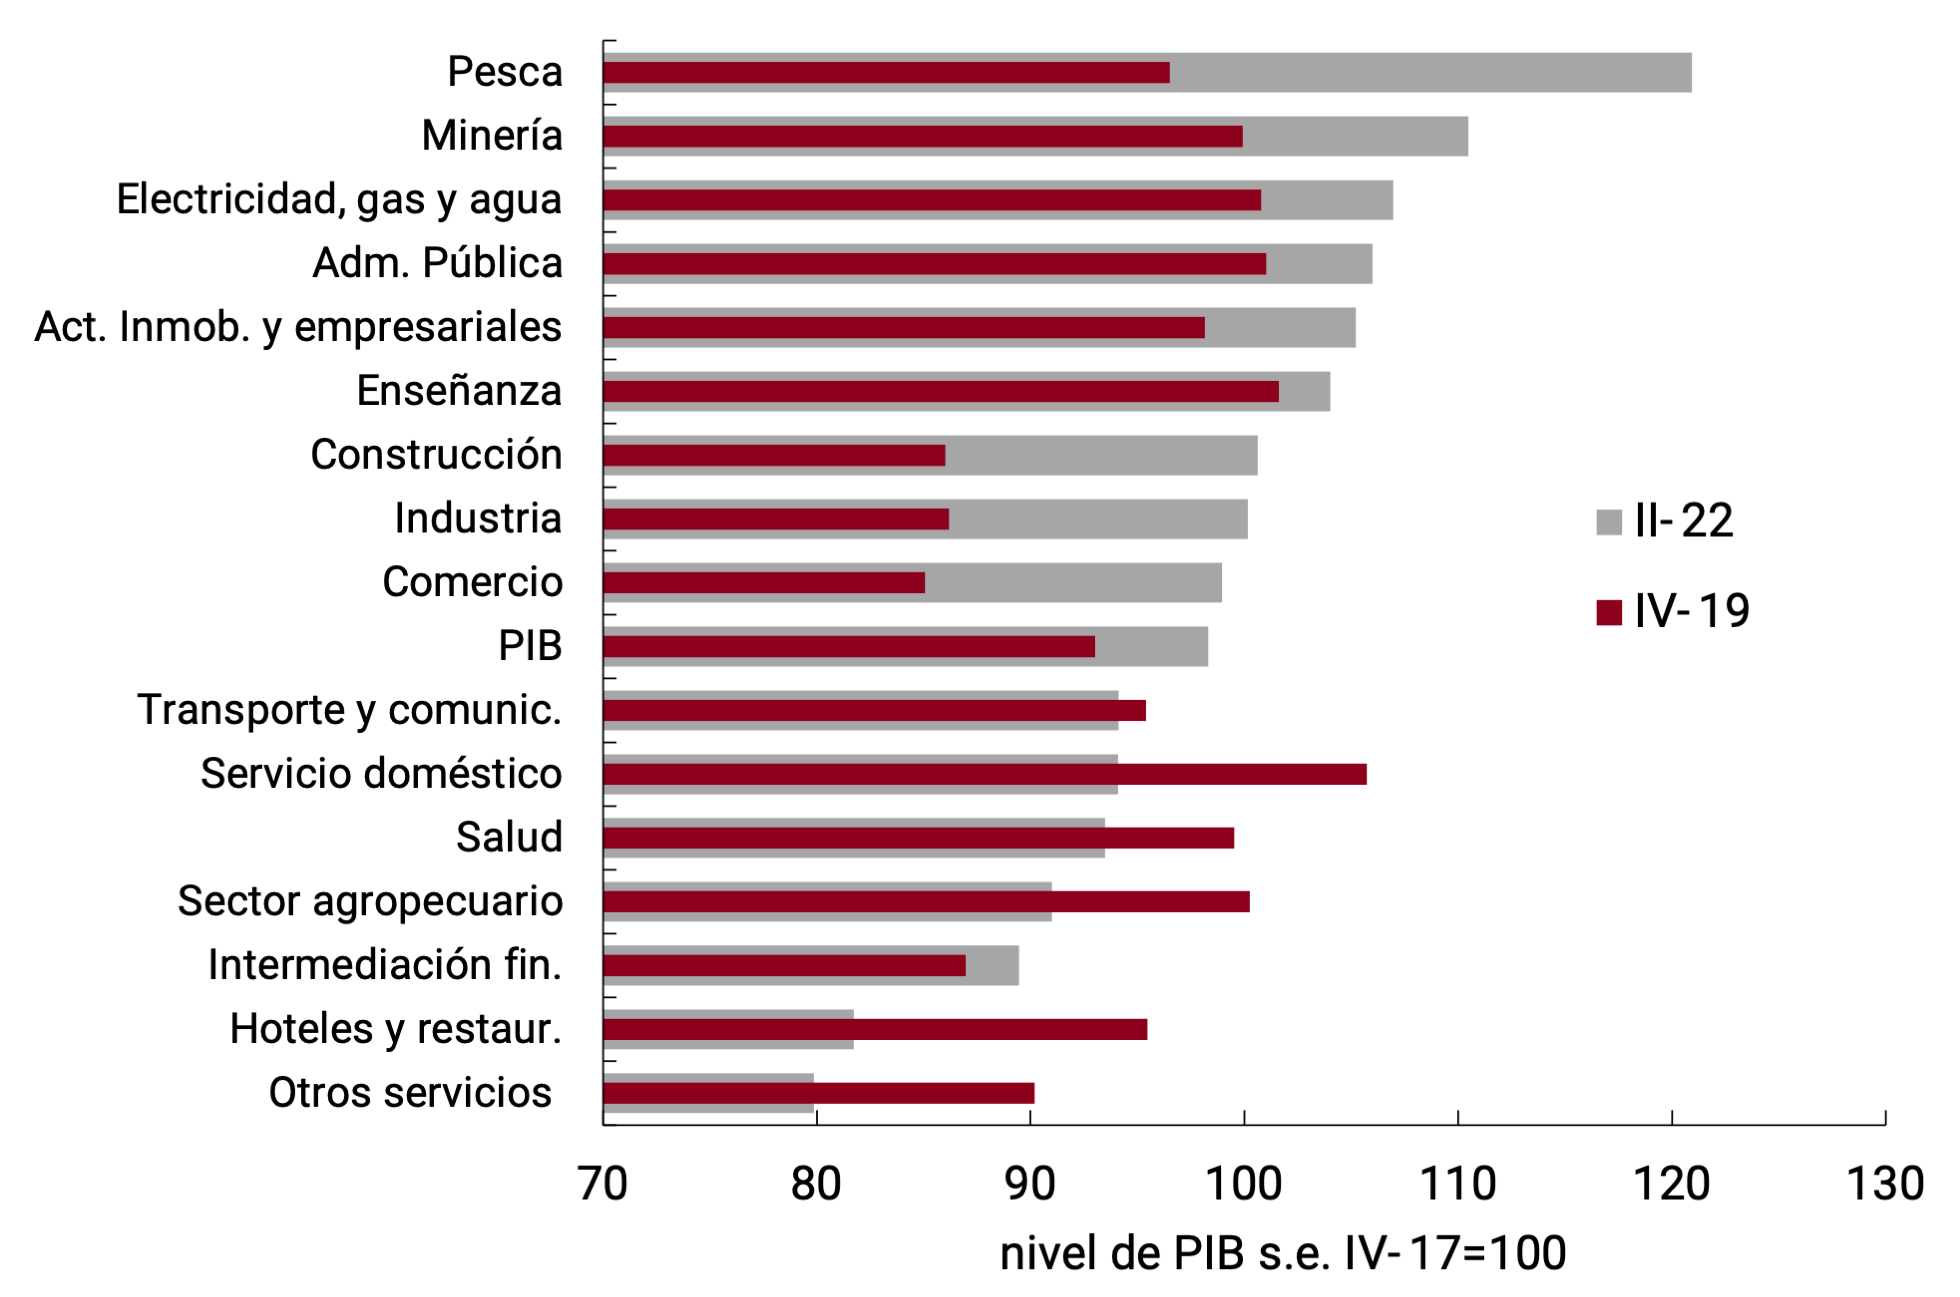
Source: BCRA based on INDEC data.
The segments with the highest economic growth with respect to those two periods were Fishing and Mining – driven by the activity of Vaca Muerta – which exceeded their levels at the end of 2017 by more than 10%. Industry and commerce, two very relevant sectors with high demand for employment, reached the maximum levels of 2017 and have the particularity of presenting the highest rates of increase compared to the pre-pandemic (16.2% and 16.3% s.e., respectively). Particularly in the second quarter of 2022, both items presented increases of more than 3% quarterly s.e.
As for those most affected by the pandemic, both Other Community Services and Hotels and Restaurants continue to operate still far from the levels of activity recorded at the end of 2017 despite the strong improvements exhibited in the most recent months. The drought-affected agricultural sector, domestic service and health also show an unfavourable trajectory compared to these maximums.
3.1.3. The labour market maintained its growth rate during the second quarter of 2022
According to data from the Permanent Household Survey (EPH), in the second quarter of 2022 both the employment rate (44.6%, +3.1 p.p. y.o.y.) and the activity rate (47.9%, +2.0 p.p. y.a.) showed significant growth compared to what was observed in the first quarter of 2022 and were at the highest value since the beginning of the new EPH series in the second quarter of 2016. For its part, the open unemployment rate stood at 6.9%, piercing the 7.0% recorded in the previous two quarters and reaching its lowest value since 2016 (see Figure 3.6).
Figure 3.6 | Main labor
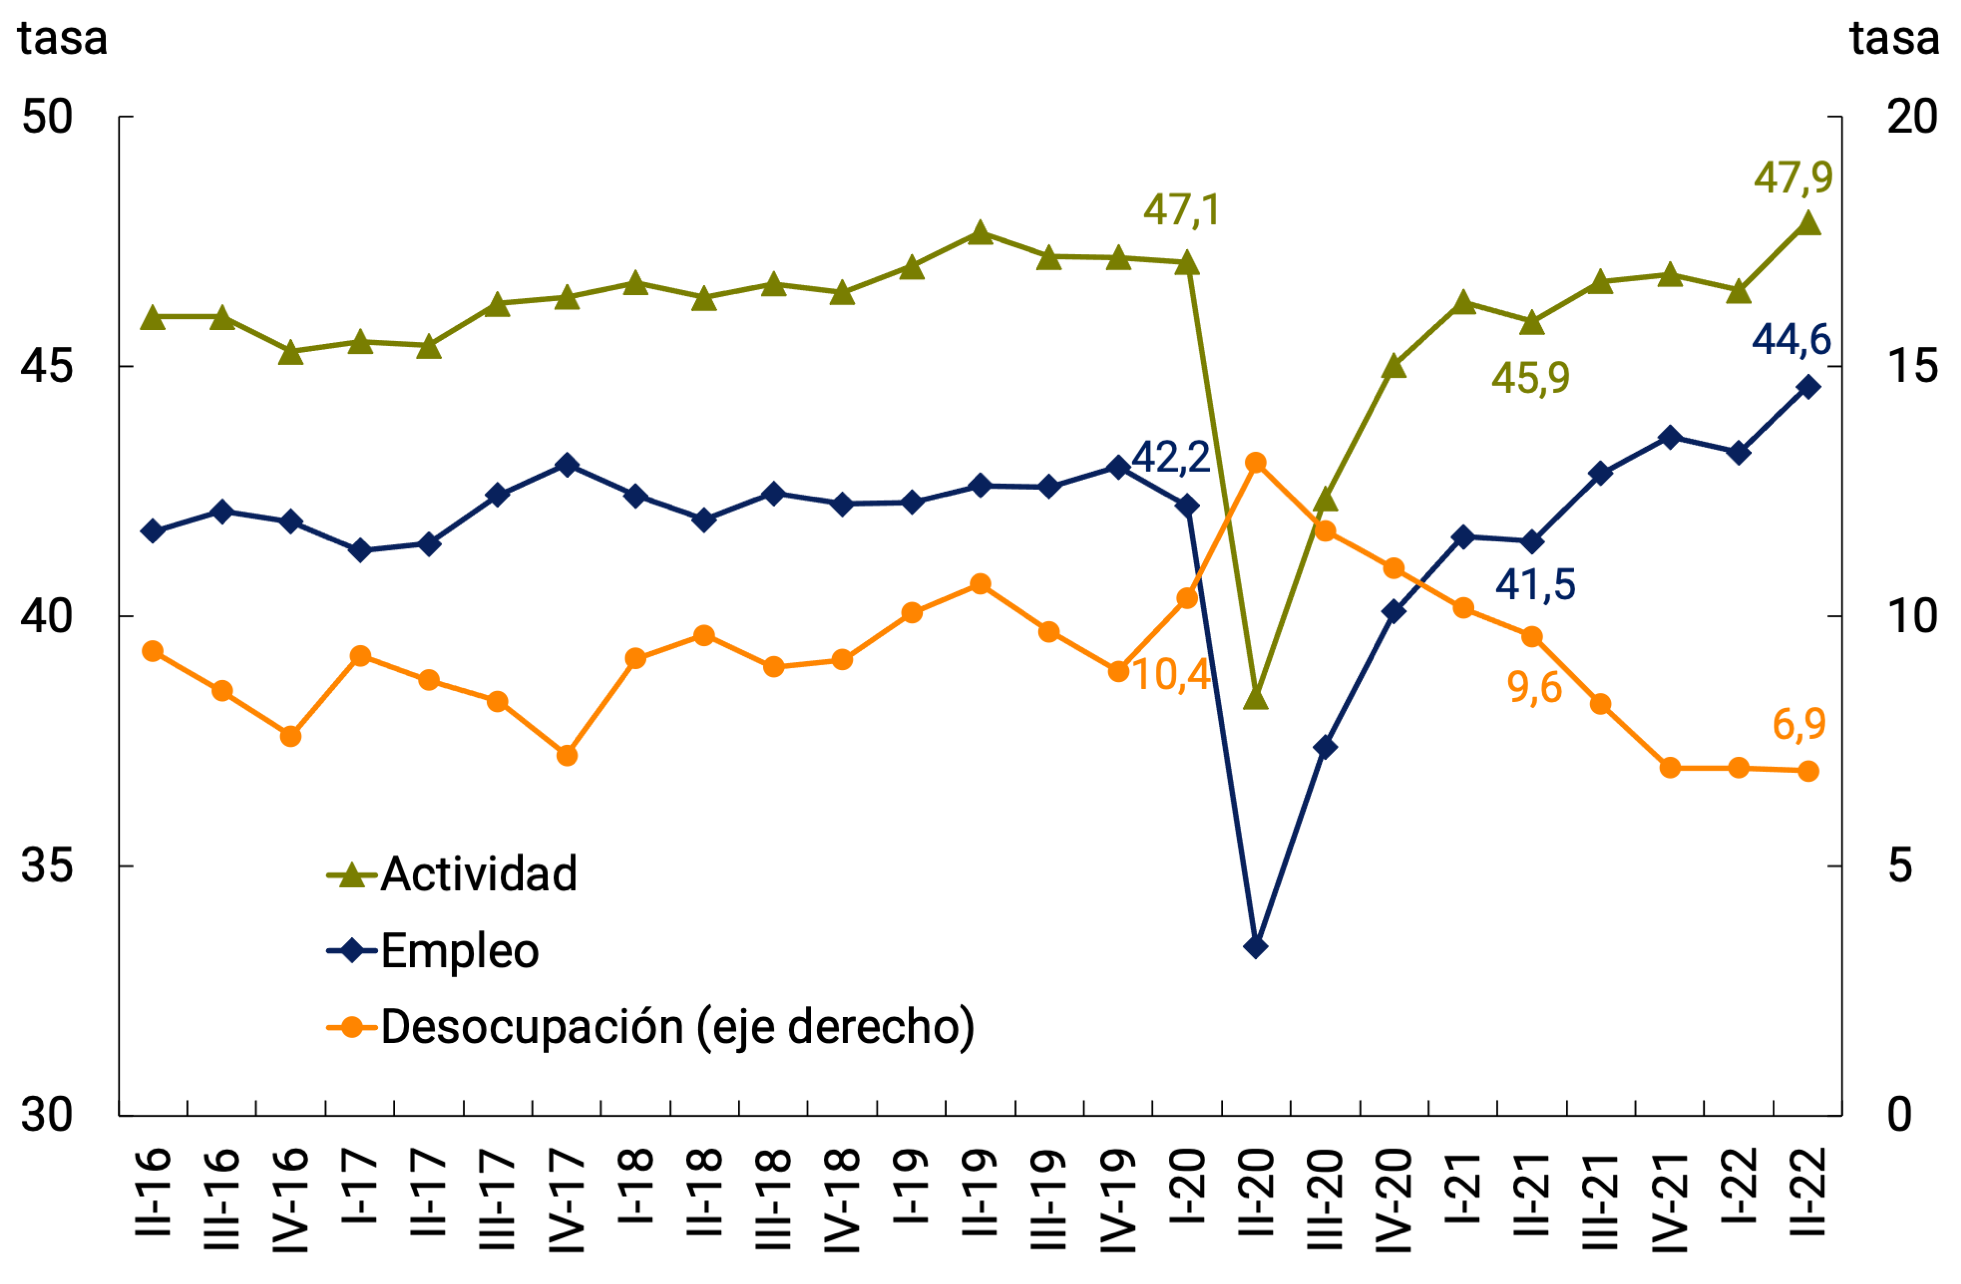
market rates
Source: BCRA based on data from EPH (INDEC).
As for the evolution of the different occupational categories, self-employment remained relatively stable compared to the previous two quarters. The “employers” category recovered, after two sharp declines in the immediately preceding quarters, but has not yet managed to return to pre-pandemic levels. Within salaried employment, formal workers6 remained stable compared to the previous quarter, while informal workers7 grew for the fourth consecutive quarter, becoming the most dynamic labor category in the last two years (see Figure 3.7). These trajectories have led to a composition of employment in which the less formal categories have begun to gain greater weight to the detriment of registered salaried employment.
Figure 3.7 | Evolution of employment by job category and by age group and gender
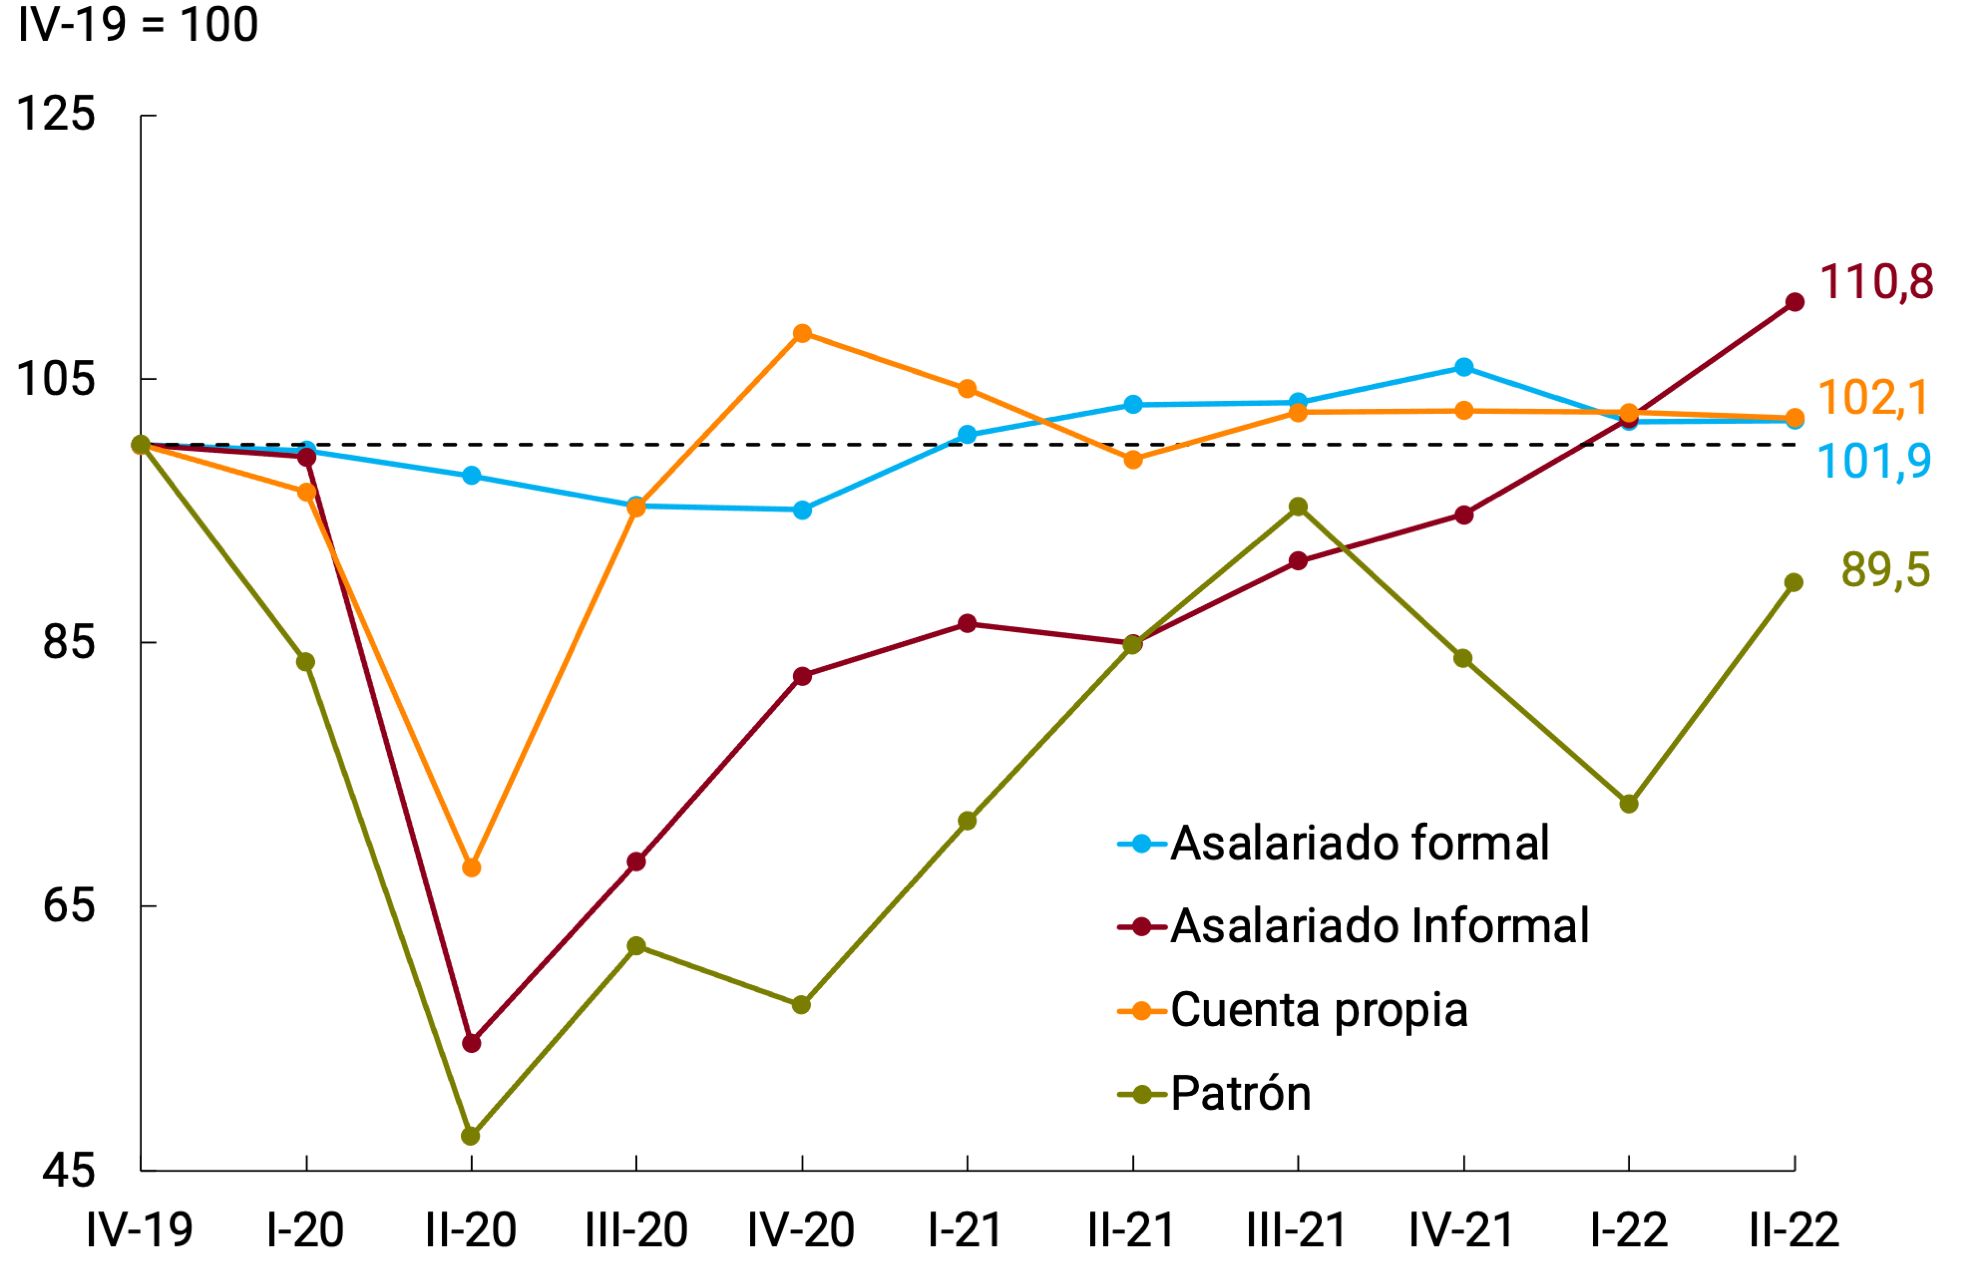
Source: BCRA based on EPH data (INDEC).
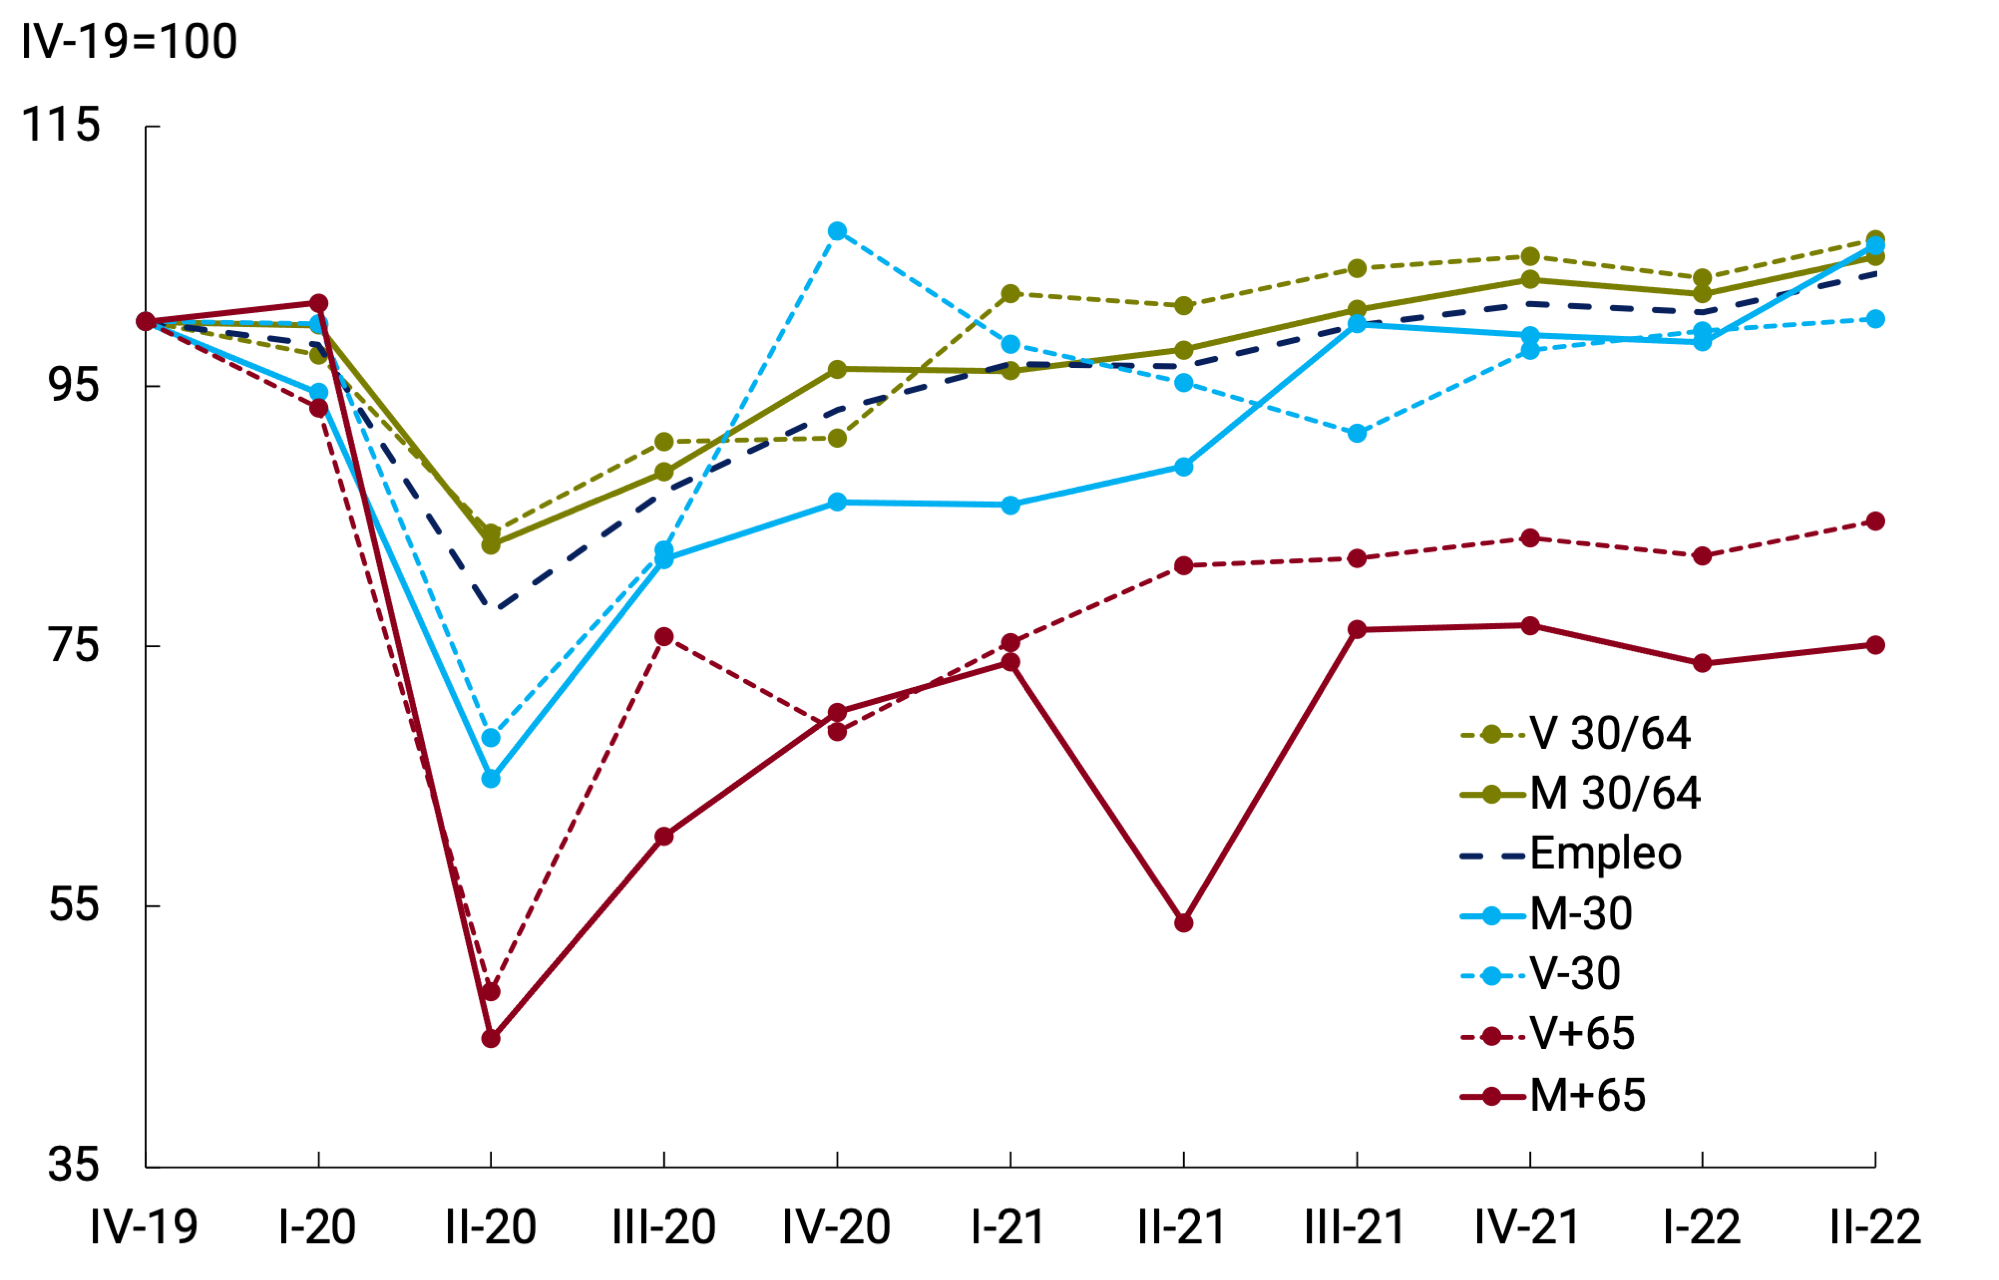
With regard to the age range and gender, it continues to be observed that the category of people over 65 years of age, both women and men, is the only one that has not yet managed to recover after the impact of the pandemic. In the case of young people (under 30 years of age), women showed a good performance in the second quarter of 2022, significantly exceeding the levels of the fourth quarter of 2019, while men are at that level. Both women and men between 30 and 64 years of age who had previously exceeded the pre-pandemic level showed a favorable evolution during the second quarter of 2022.
According to the Ministry of Labor, Employment and Social Security (MTEySS), registered employment continued to grow during the second quarter of 2022, accentuating the process that began in June 2020. In this way, total registered employment (without social monotax) continues to be around historical maximum levels. The pace of expansion during the second quarter of 2022 remained relatively stable compared to previous quarters, expanding at 0.3% per month on average (see Figure 3.8).
Figure 3.8 | Total registered employment (without social monotax)
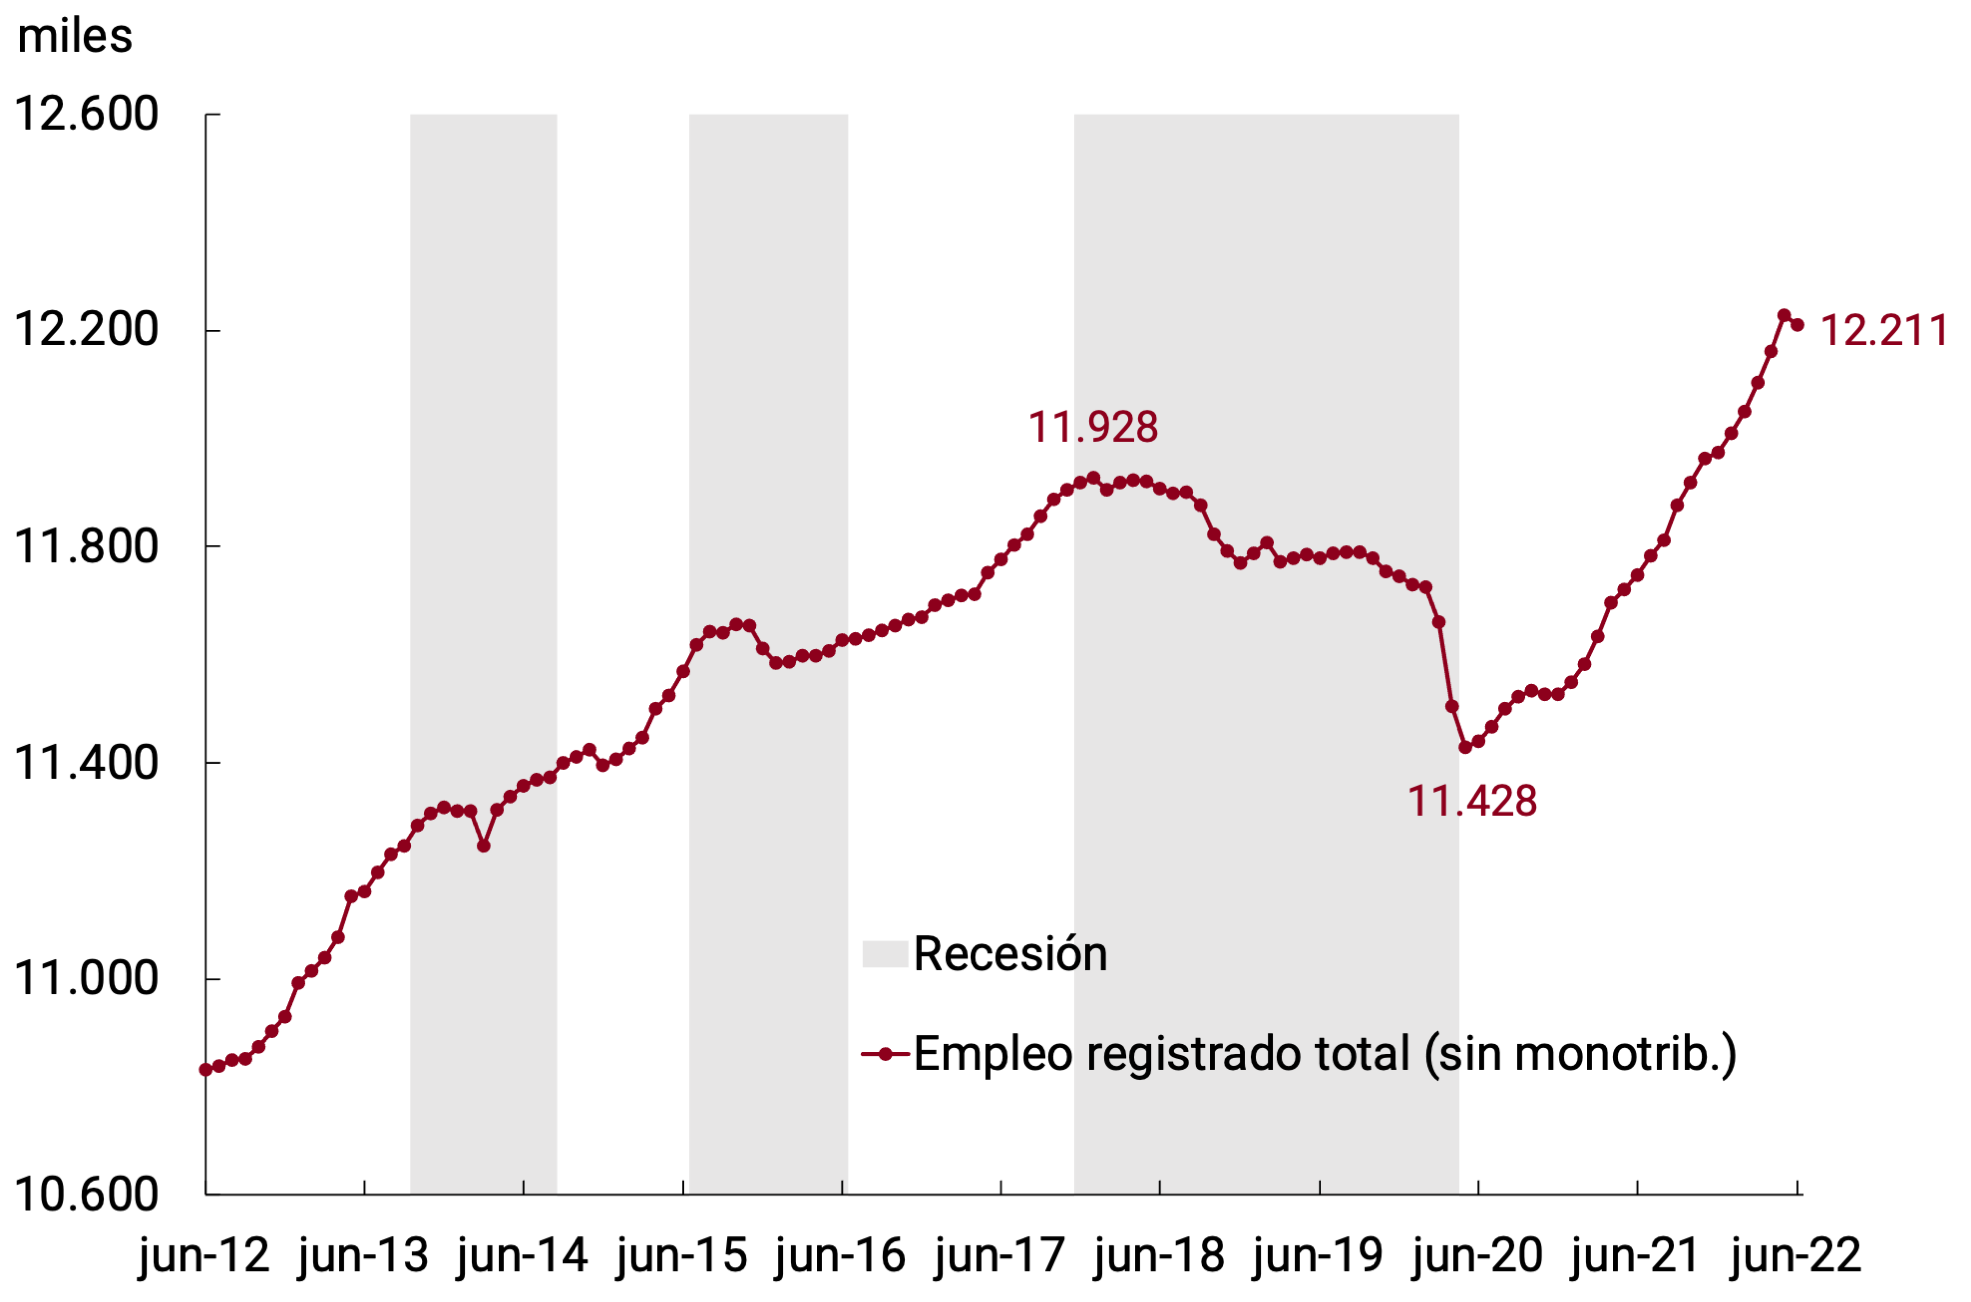
Source: BCRA based on data from MTEySS.
During the second quarter of 2022, the rise in registered employment was mainly driven by private registered salaried employment (0.5% s.e. monthly average). Public employment, for its part, maintained the average monthly growth rate compared to the previous quarter (0.1% s.e.), although moderating the speed of expansion achieved in 2021 (0.3% s.e.; see Figure 3.9). Self-employment (self-employed and single-payers) reduced the growth rate to 0.1% s.e. (0.8% s.e. during the first quarter). This decrease was explained entirely by a one-off drop in single-payers during the month of June (-2.9% s.e.), which in turn was more than offset by an increase in social single-payers.
Figure 3.9 | Public, private, private and self-employed
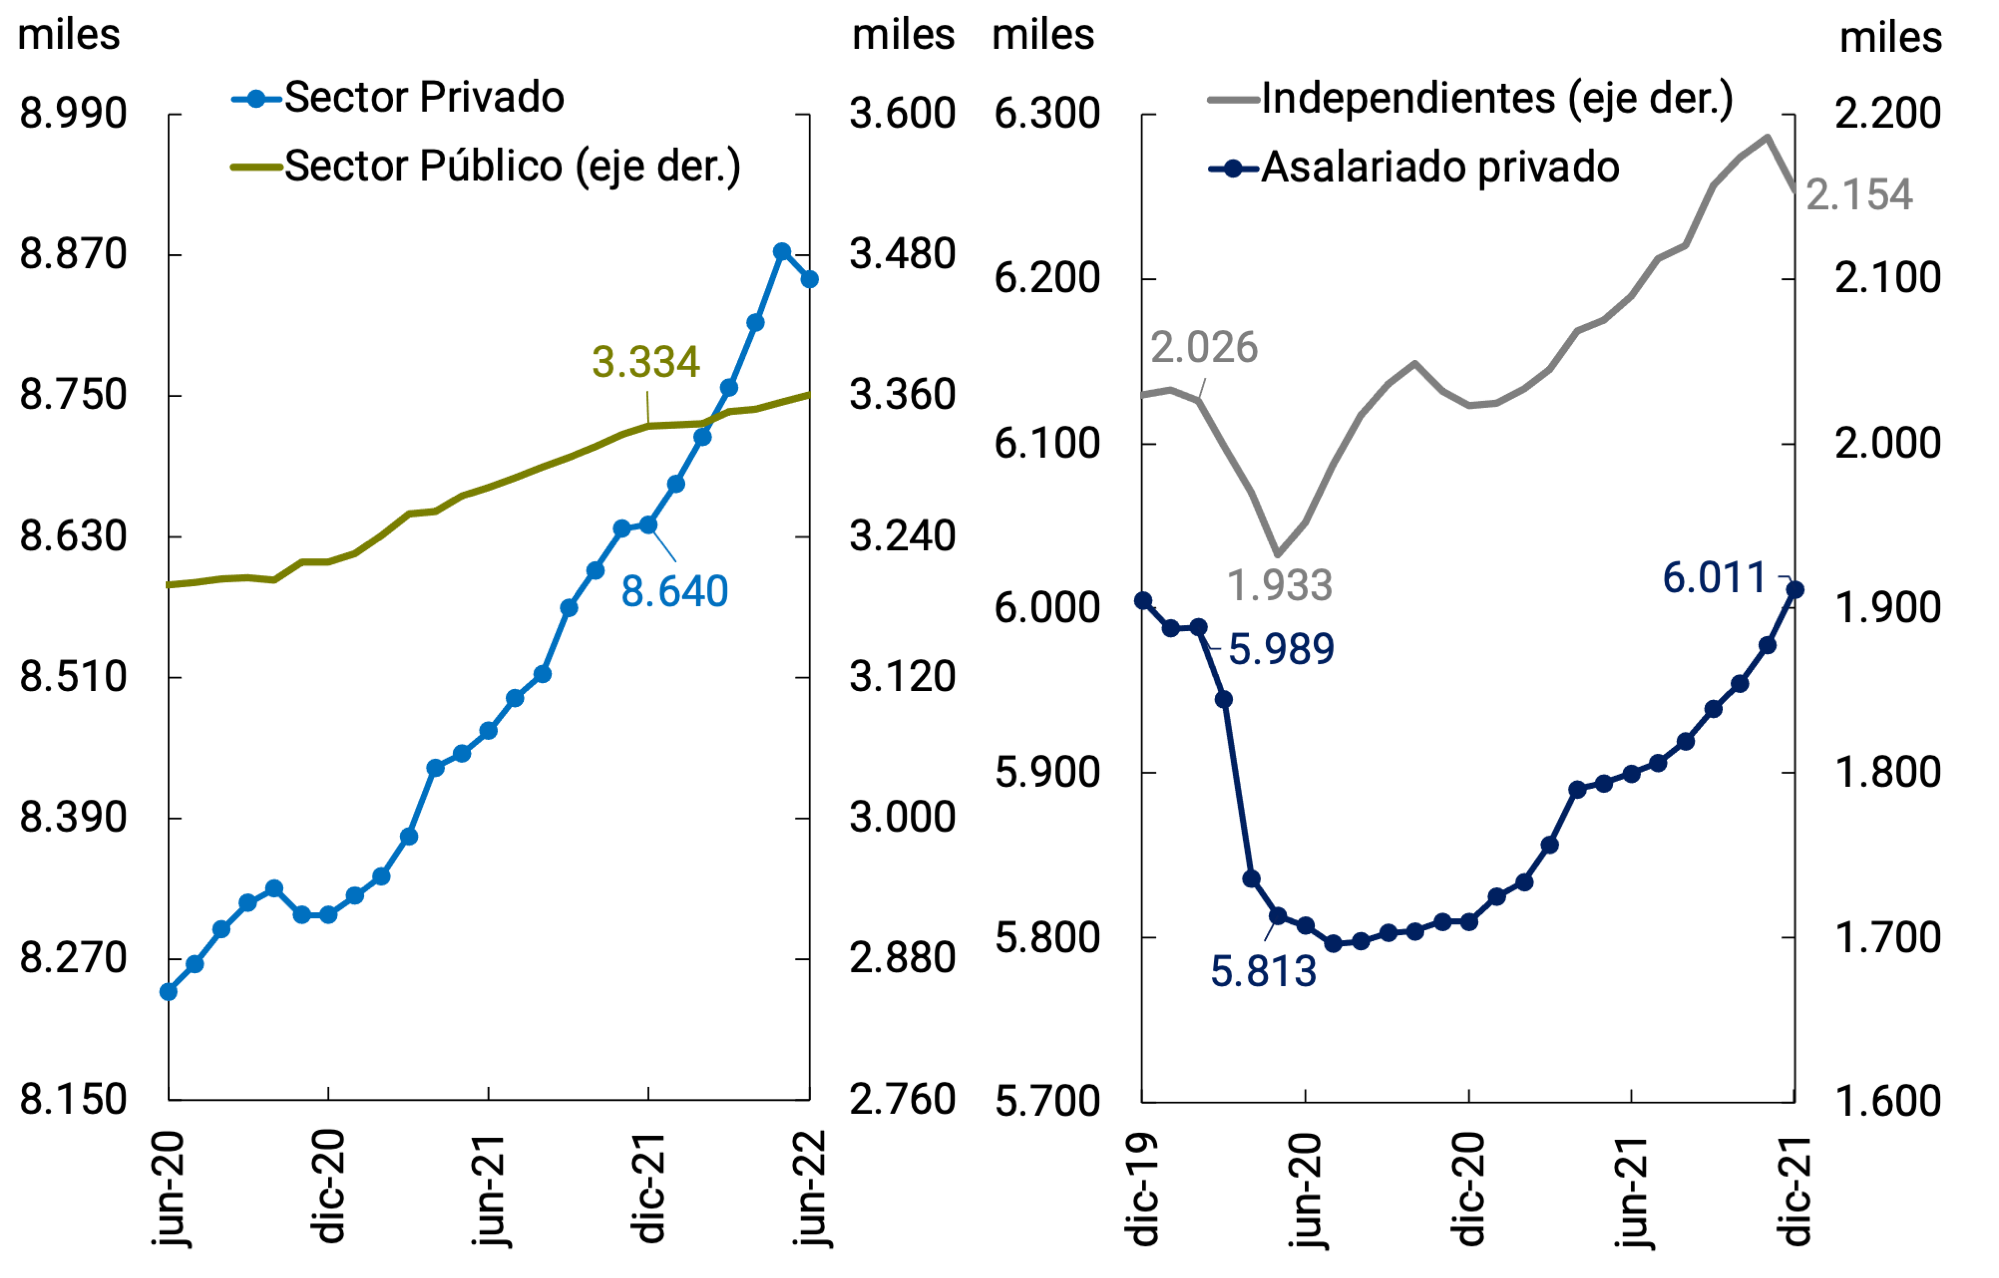
employment
Source: BCRA based on data from MTEySS.
The growth in private salaried employment between March and June 2022 has been widely disseminated both regionally and sectorally: it has grown in 22 of the 24 provinces and in 11 of the 14 sectors surveyed. In turn, it is possible to distinguish, as in the previous quarter, a strong dynamism in branches such as Hotels and restaurants (6.2% s.e. acum.) and Construction (4.4% s.e. acum.). However, taking into account pre-pandemic levels, it is observed that the Hotels and Restaurants sector, as well as Community, Social and Personal Services and Agriculture, have recovery potential both in terms of activity and staff hiring. On the other hand, in the sectors that have already recovered in terms of activity, the growth in registered salaried employment has occurred to a lesser extent (see Figure 3.10).
Figure 3.10 | Activity and Registered Employment. Percentage
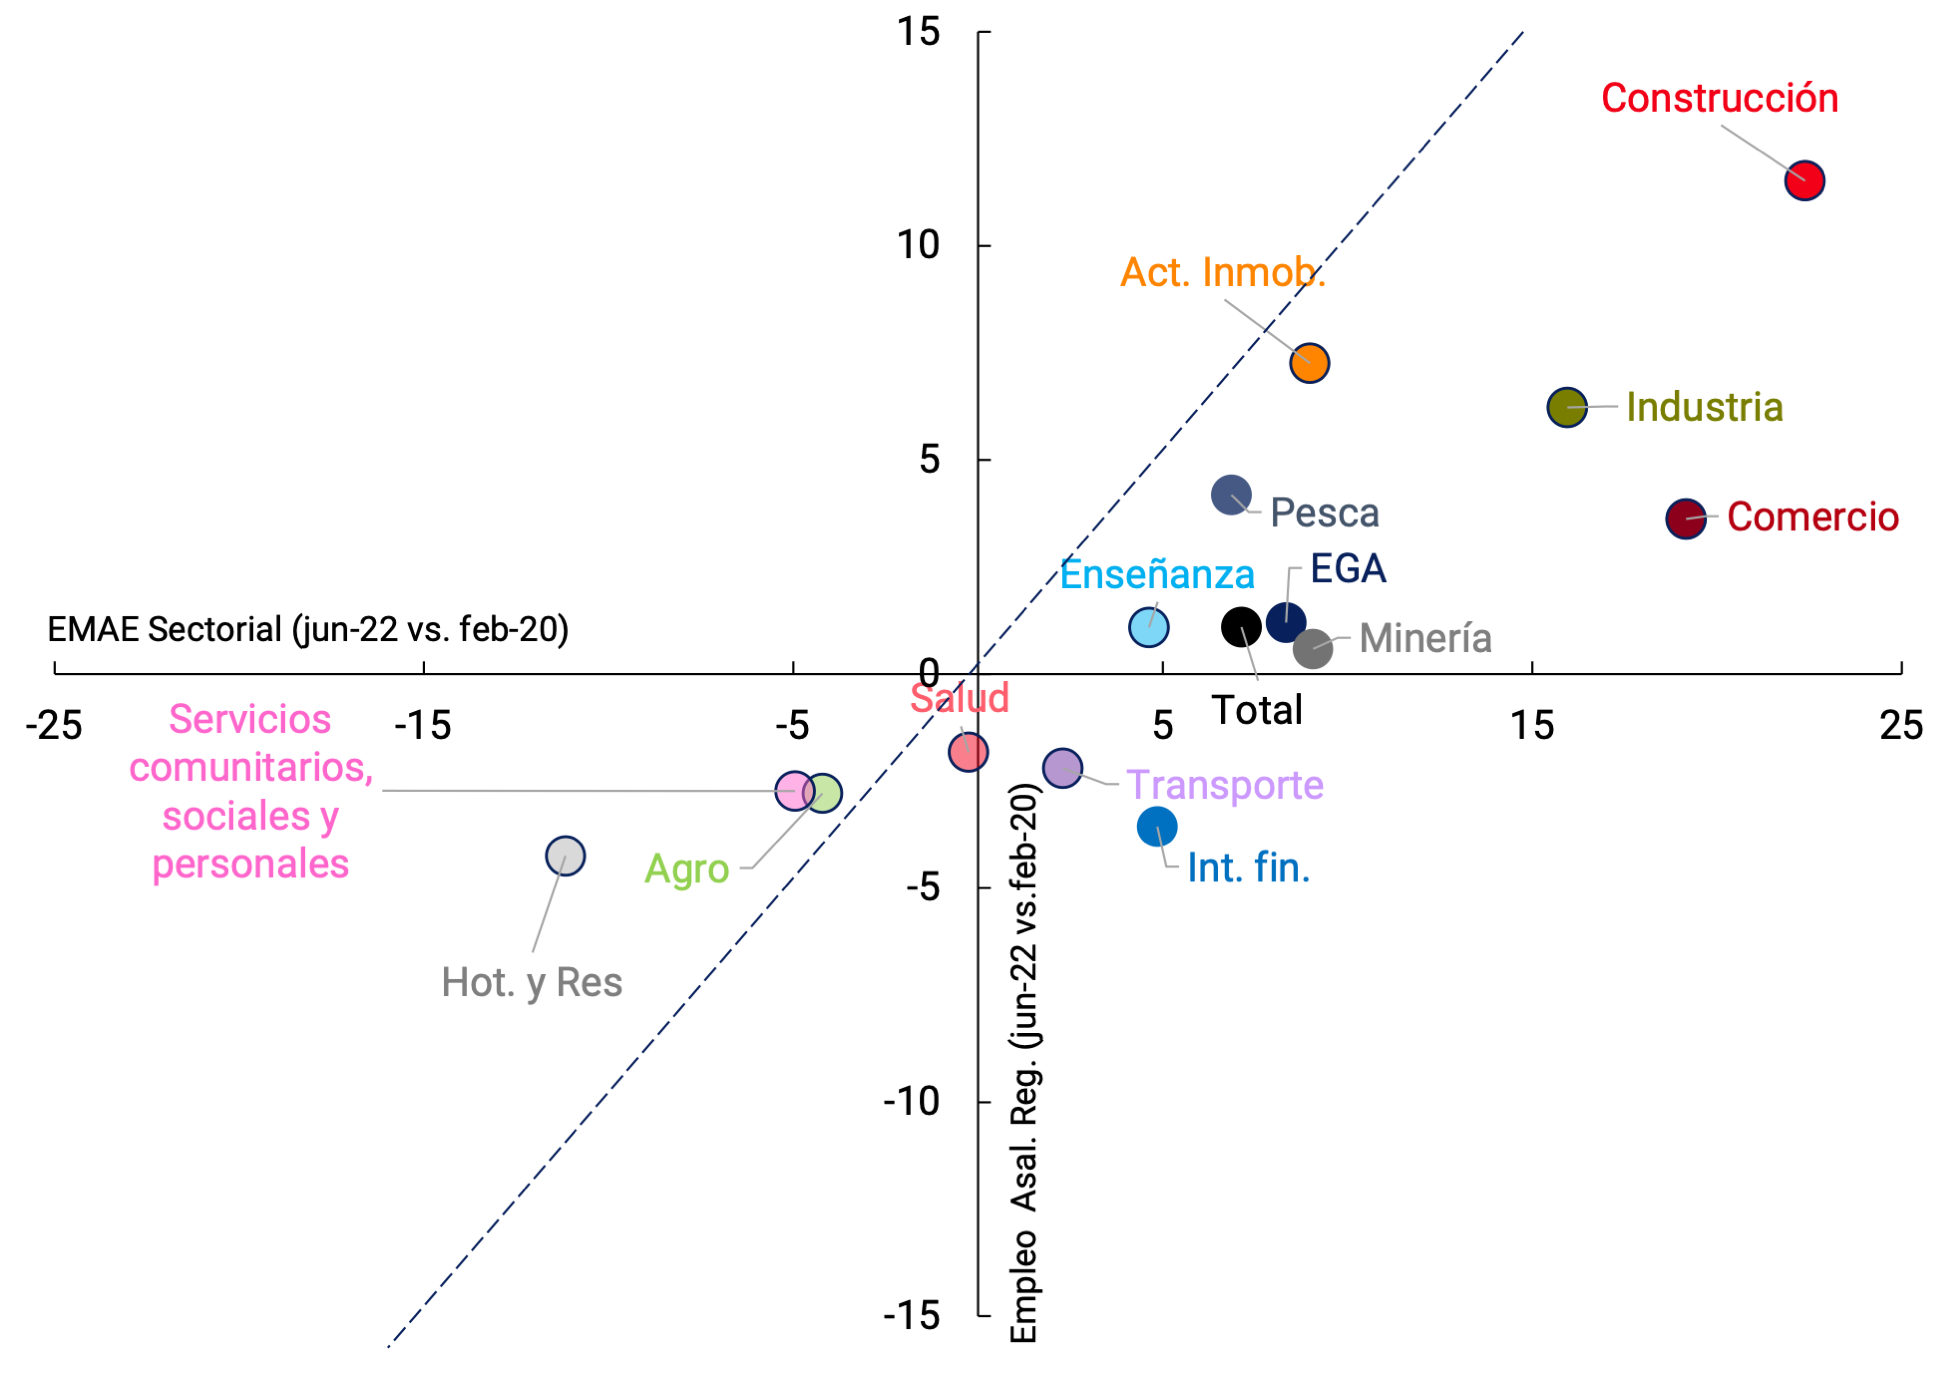
changes
Source: BCRA based on data from MTEySS and INDEC.
The Labor Indicators Survey (EIL) as of July 2022 ratified the positive trend in net hiring expectations that began in February 2021, chaining 18 consecutive months of positive values. On the other hand, suspensions, after a sharp reduction during 2021, remained at levels within the historical average and the rate of layoffs remains in a limited range, although it showed a slight increase during July probably associated with the end of the double severance benefit.
3.2. Perspectives
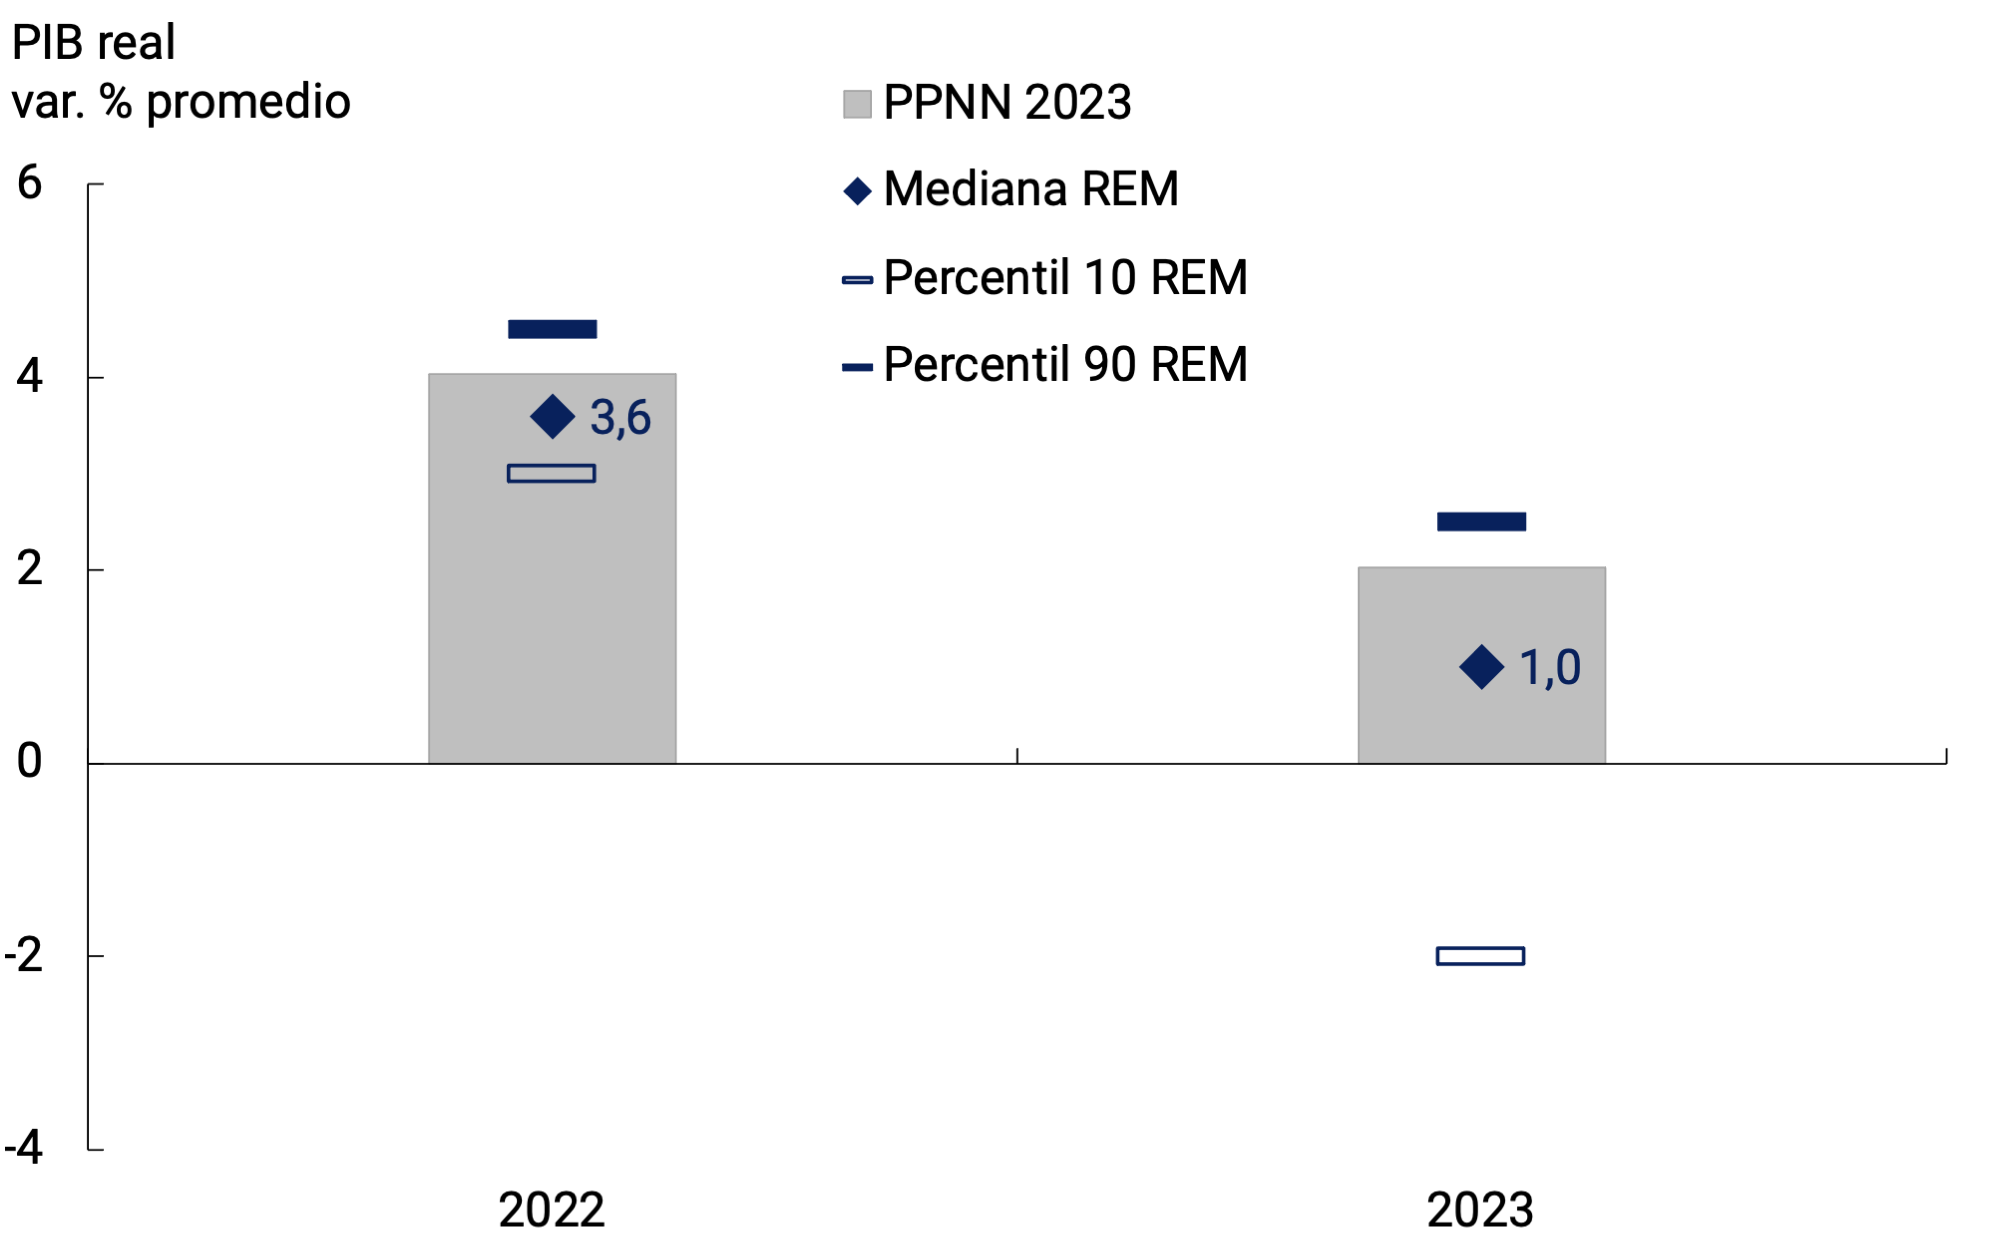
After recovering by an average of 6.5% YoY in the first half of the year, the growth of economic activity stopped in July and growth expectations for the rest of the year deteriorated. According to the median of the estimates of the Market Expectations Survey (REM) at the end of August 2022, specialized analysts pointed to falls in economic activity of 1.1% and 1.2% quarter-on-quarter s.e. for the third and fourth quarters of this year, respectively. Implicitly, this forecast implies that the economy would start next year with a negative statistical drag (-1.3 p.p.). Thus, after successive upward corrections in line with the publication of official data, the economic growth forecast for the 2022 average stood at 3.6% annually and 1% for 2023 (see Figure 3.11).
Figure 3.11 | Economic growth prospects 2022 and 2023
Source: REM-BCRA and draft National Budget Law 2023
At the international level, growth prospects contemplate a slowdown in the coming months, associated with the systematic reduction of monetary stimuli by advanced economies and the continuation of bottlenecks in some supply chains, as a result of geopolitical conflicts and health policies implemented in China. This scenario continues to put pressure on external financing costs for emerging countries and on international commodity prices, such as energy, which remain at historically high levels despite the downward correction of recent months (see Chapter 2. International Context).
The economic policy measures recently implemented linked to the strengthening of reserves, fiscal ordering, and the preservation of savings in pesos will allow macroeconomic stability to continue to be strengthened. In the same sense, the construction and commissioning of the first section of the Néstor Kirchner gas pipeline will contribute more in the medium term, which will allow significant savings in foreign currency and will demand more job creation.
A context of greater stability will favor investment, while the institutionality of wage negotiations—which contributes to sustaining the real income of families—combined with the low level of unemployment will reinforce consumption levels. Thus, economic activity is expected to regain dynamism from September and during 2023, despite the uncertainty typically associated with election years and the challenge of reducing the current high levels of inflation. This scenario is reflected in the 2023 National Budget Bill (PPN-23, see Section 4 / Main aspects of the 2023 National Budget Bill), which shows growth of 4% for this year and 2% for 2023, within the range contemplated in the agreement with the IMF (between 3.5% and 4.5%).
Back to top
4. External Sector
In the second quarter of 2022, in a context of trade flows at record levels (measured in current dollars, but with falls in quantities) the economy operated with a current account deficit, mainly due to a sharp deterioration in the terms of trade. In the July-August two-month period, previous trends deepened: increases in import prices that exceed those of exports and falls in traded volumes. In this context, the current account deficit is expected to be sustained in the third quarter of the year, and that it will only return to positive values in the fourth quarter.
The evolution of exports and imports of goods, added to the dynamics of commercial debt for these concepts, resulted in a net result in the exchange market for goods of US$10,989 million in the first eight months of 2022, decreasing by 13% compared to what was observed in the same period of the previous year. Additionally, net outflows were recorded through the foreign exchange market for services, interest and other financial transactions for US$11,463 million, while entities made purchases for US$64 million. For its part, the BCRA had a neutral result in its interventions in the foreign exchange market and made net payments through the Local Currency System (SML) for US$536 million.
The operations in the foreign exchange market and the BCRA’s SML, together with the decrease in the prices of the assets that make up the international reserves in relation to the U.S. dollar, which resulted in a decrease of about US$2,196 million, brought the level of international reserves to US$36,734 million at the end of August. which represented a drop of US$2,928 million below its value at the end of 2021. However, based on the incentives generated by the “Export Increase Program”, the oilseeds and cereals sector liquidated US$5,300 million through this mechanism at the close of this report. The rebound in liquidations in the sector allowed the BCRA to buy some US$3,300 million in the foreign exchange market during the month of September.
Within the framework of the Extended Facilities Program (EFP) with the IMF, the accumulation of Net International Reserves for June 2022 was slightly lower than the established target, mainly due to the lower revenues of International Organizations compared to those projected. However, in line with the commitments assumed, the accumulation of reserves under the established measurement guidelines will be US$9,800 million during 2022 and 2023. The construction of the Néstor Kirchner gas pipeline would contribute to this objective, which will allow energy imports to be replaced in the winter of 2023.
4.1. In the second quarter of 2022, the economy operated with a current account deficit for the second consecutive period
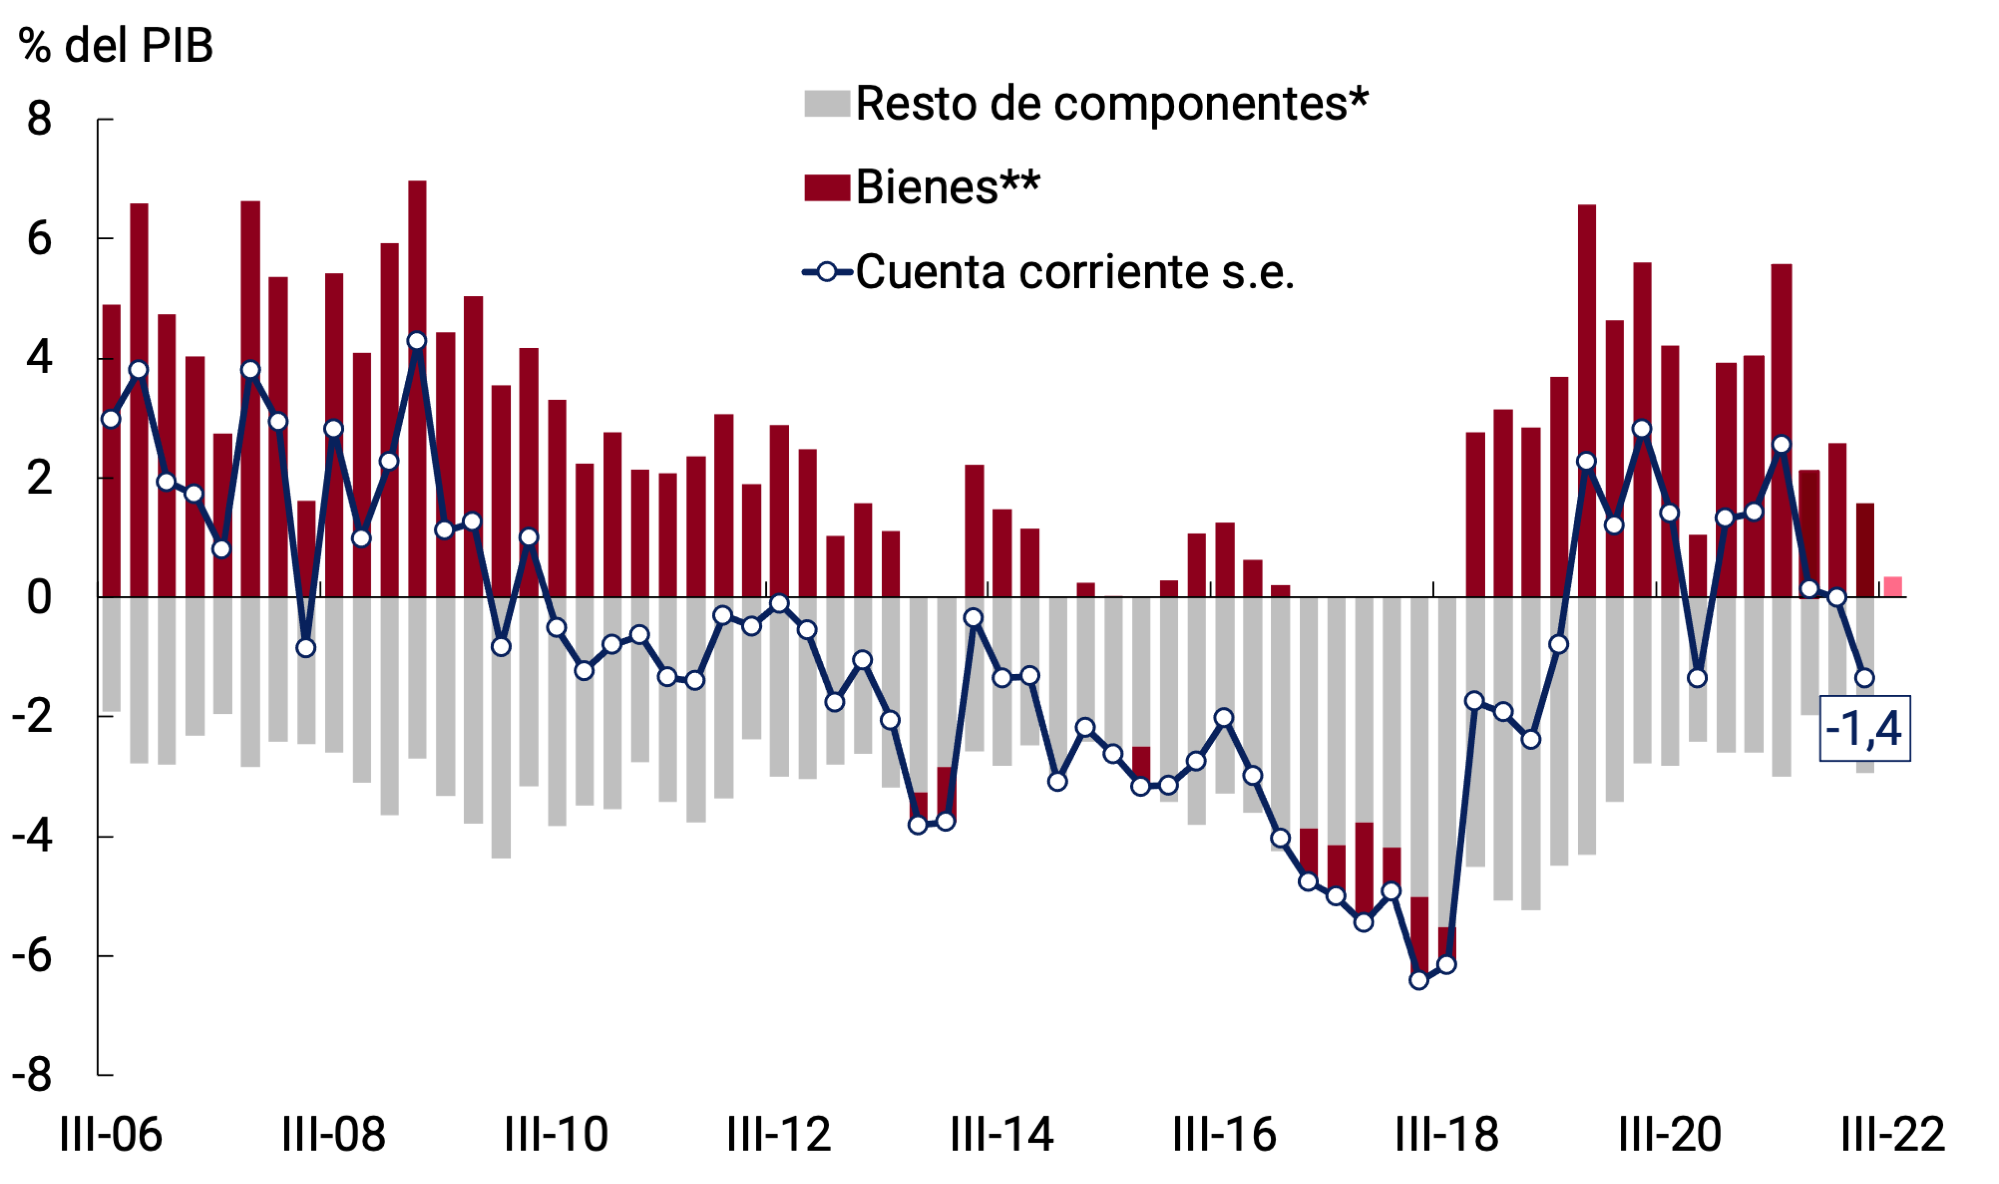
In the second quarter of 2022 (latest official data available) the Argentine economy recorded a current account deficit of US$894 million – equivalent to 1.4% of GDP in seasonally adjusted and annualized terms. The sharp deterioration in the terms of trade of goods compared to the first quarter was the main reason behind the larger current account deficit.
In the July-August 2022 two-month period, the trade balance of goods deepened its dynamics. In this context, the seasonally adjusted current account would have remained in negative territory in the third quarter of 2022 (see Figure 4.1).
Figure 4.1 | Seasonally adjusted current account. Annualized
values
* Includes accounts: primary income services and secondary income.
** III-22: data up to August 2022.
Source: BCRA based on INDEC data.
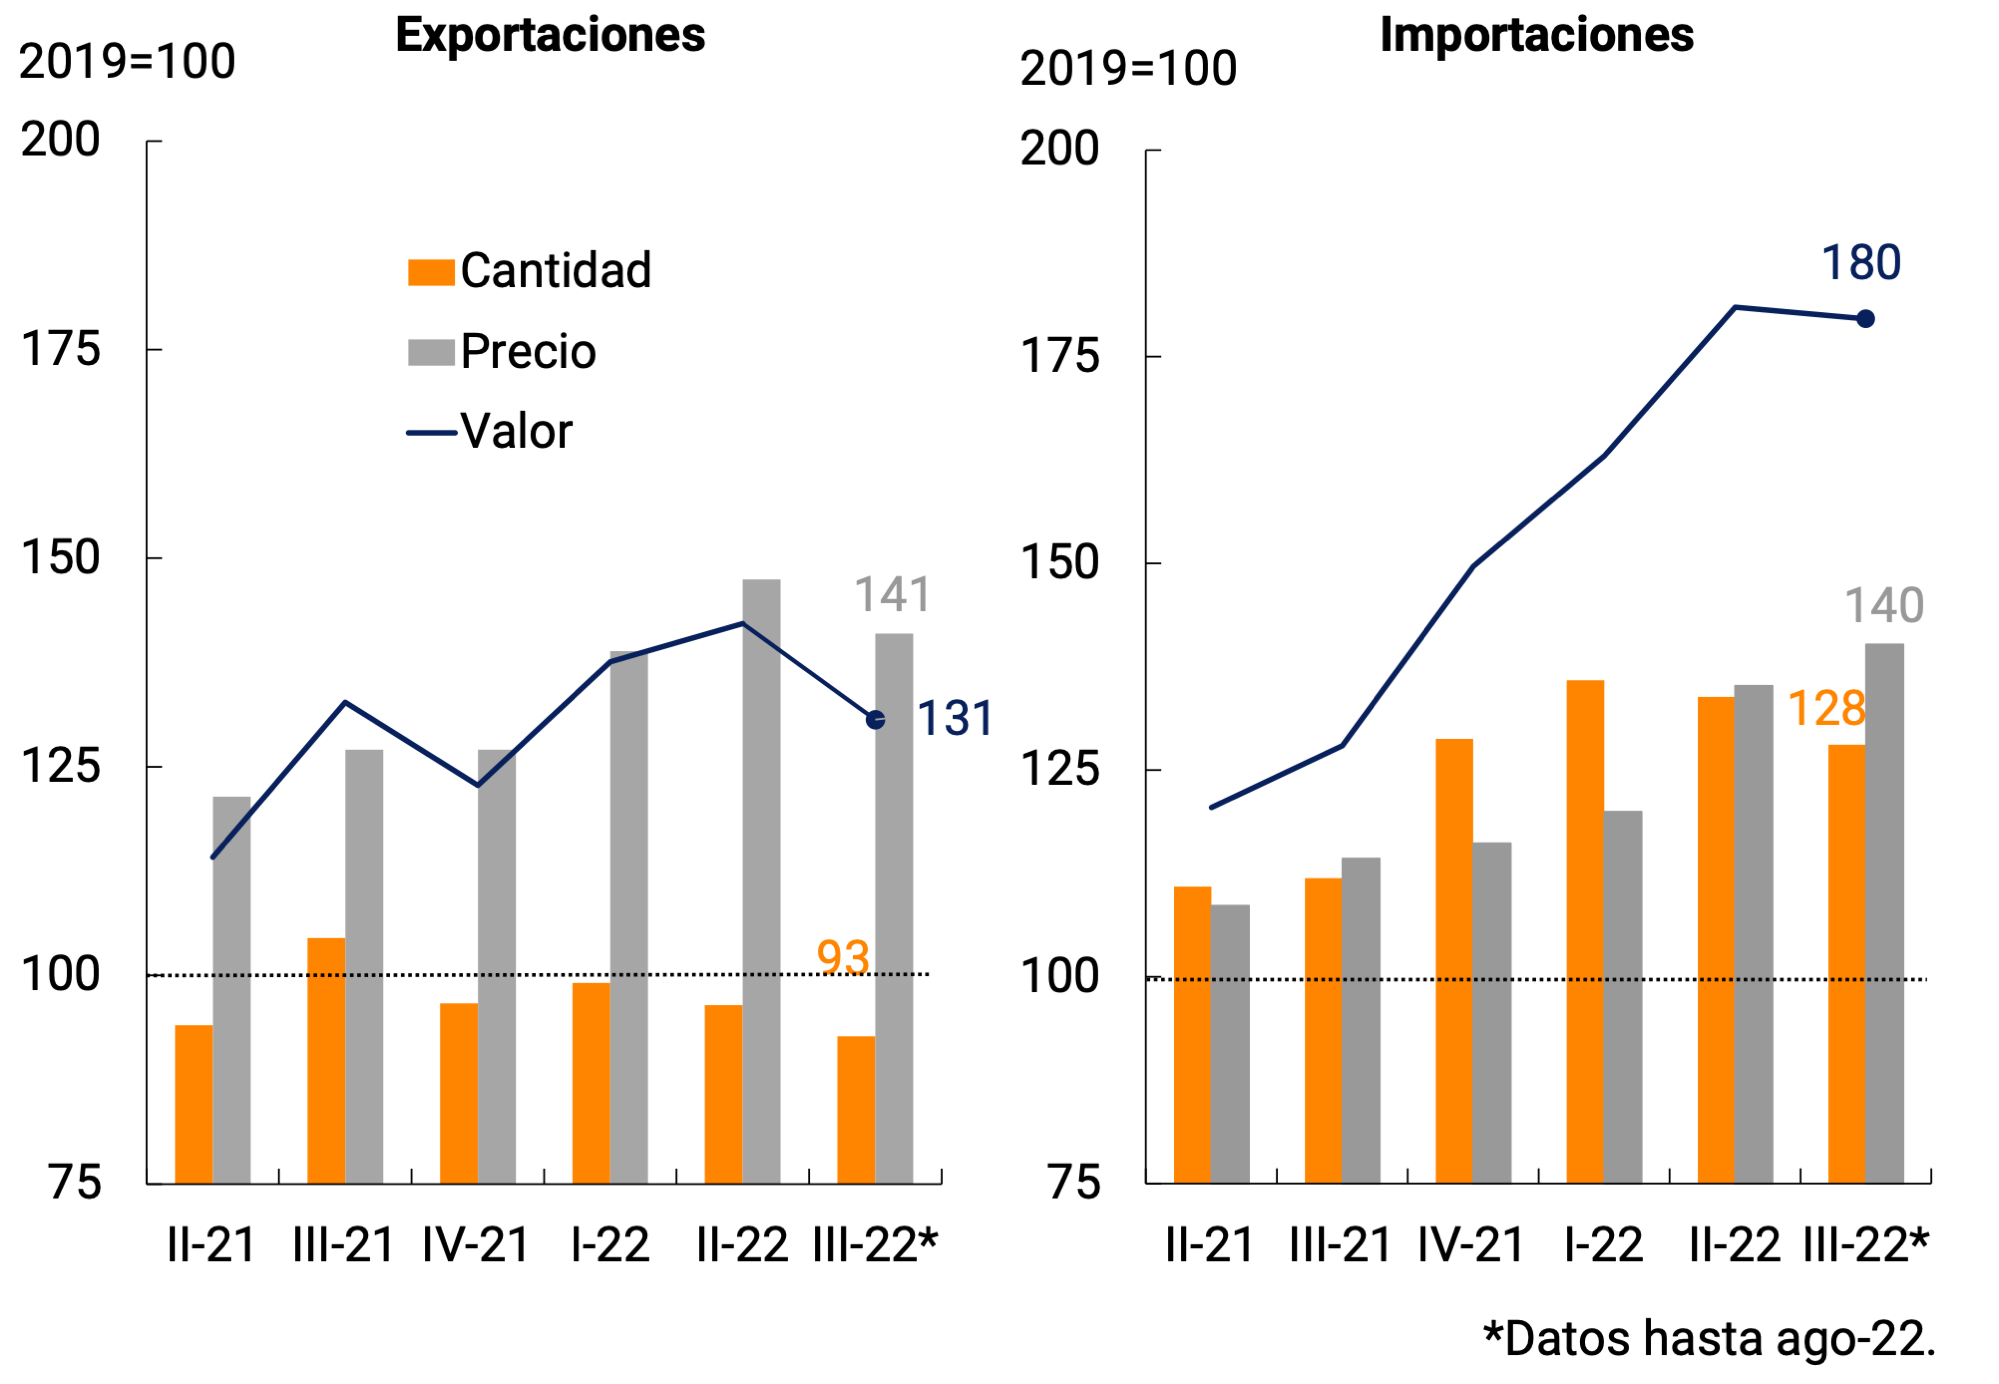
Between April and June 2022, the exported values of seasonally adjusted goods reached US$23,142 million (Free on Board (FOB)) at current prices, which represented an increase of 3.3% compared to the level recorded in the first quarter of 2022. This evolution was mainly due to the performance of export prices, which grew 5.9% s.e. in this period. On the other hand, the quantities exported of goods fell 2.5% s.e. In the July-August two-month period, the fall in volumes was compounded by a decline in export prices.
On the other hand, in the second quarter of 2022, seasonally adjusted imports of goods totaled US$22,225 million (CIF) at current prices, 11.0% higher than the first quarter of the year. This performance of imported values was explained exclusively by the increase in prices (12.7% QoQ, s.e.), since the quantities showed a slight decline (see Chart 4.2). In the July-August two-month period, this dynamic was maintained, with price increases and falls in quantities.
Figure 4.2 | Trade in goods. Seasonally
adjusted series
* Data up to August 2022.
Source: BCRA based on INDEC data.
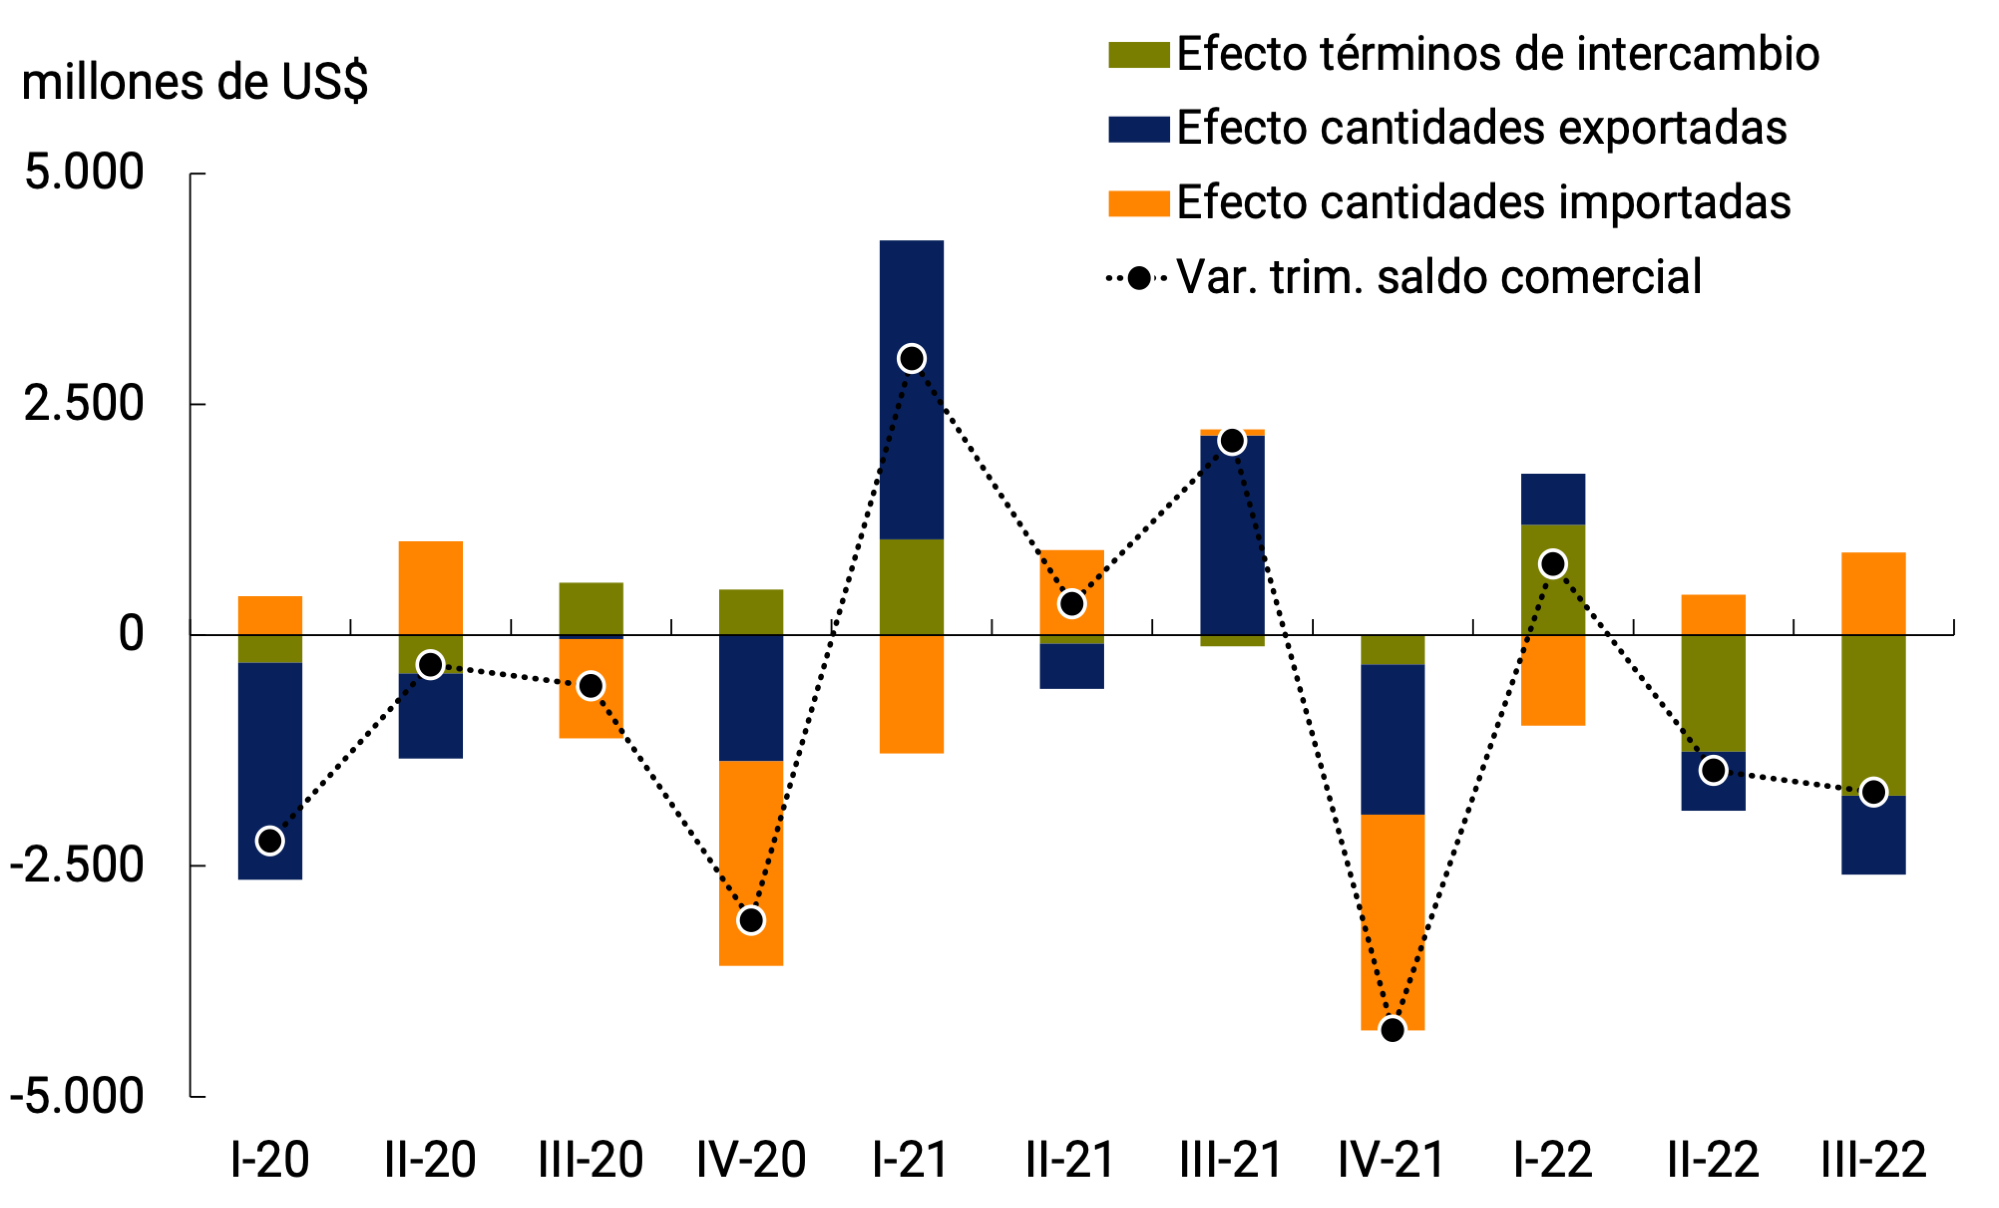
As a result of the recent evolution of exports and imports, the seasonally adjusted average monthly trade surplus went from US$794 million in the first quarter of 2022 to US$306 million in the second quarter, reaching a deficit of US$261 million in the July-August two-month period. The deterioration in the terms of trade accounted for US$2,999 of the US$3,164 cumulative fall in the trade balance in the last two quarters (see Figure 4.3).
Figure 4.3 | Factors of quarterly change in the trade balance of goods*
* FOB-CIF balance adjusted for seasonal factors. III-22 equiv a bimestre jul-ago trimester.
Source: BCRA based on INDEC data.
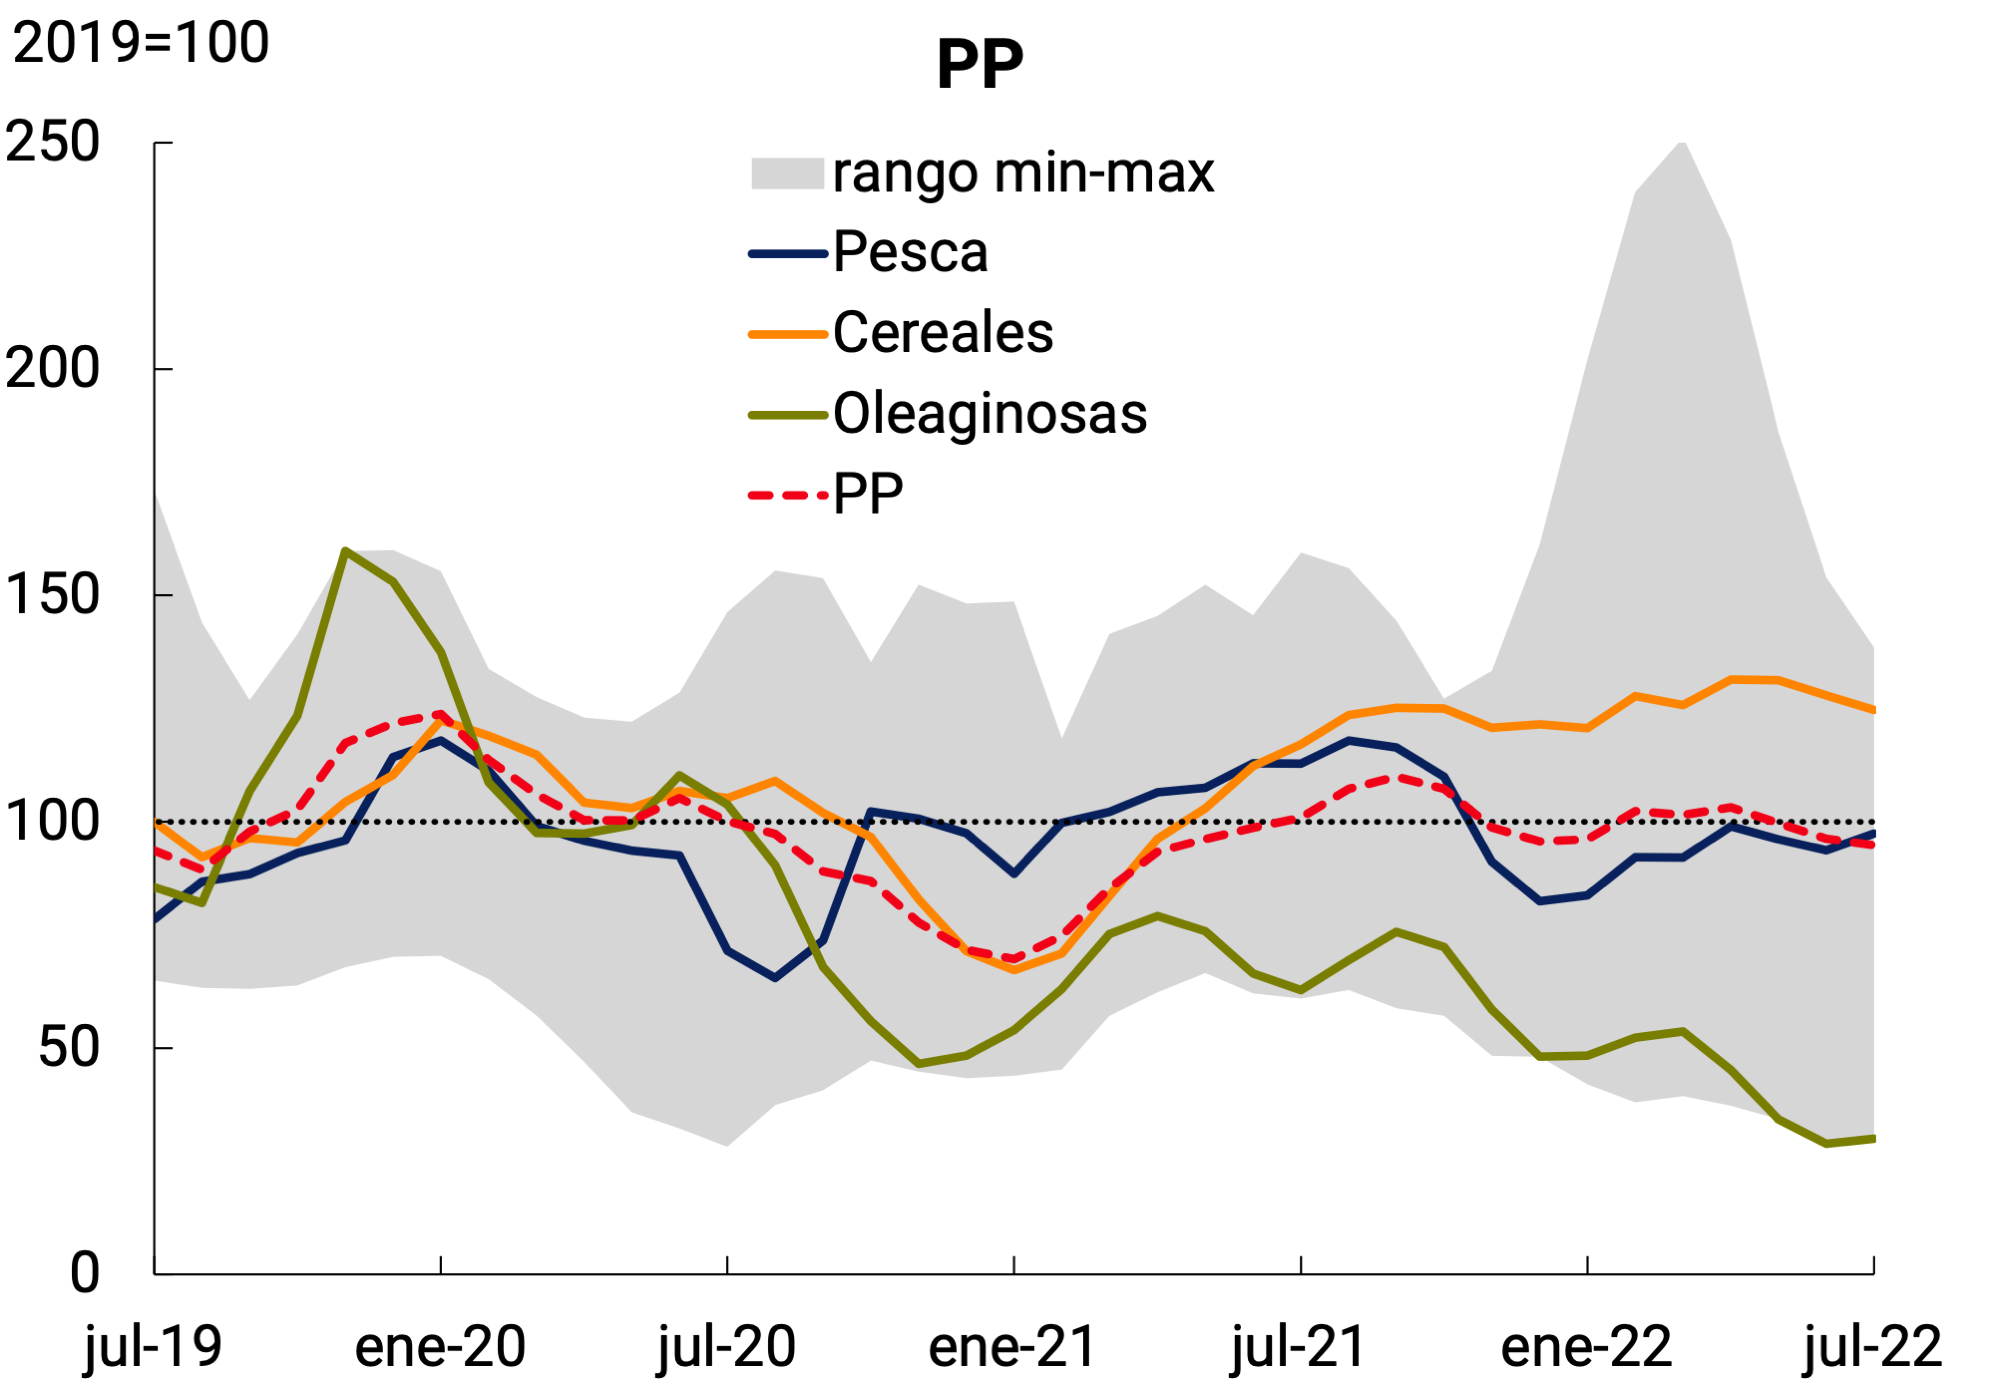
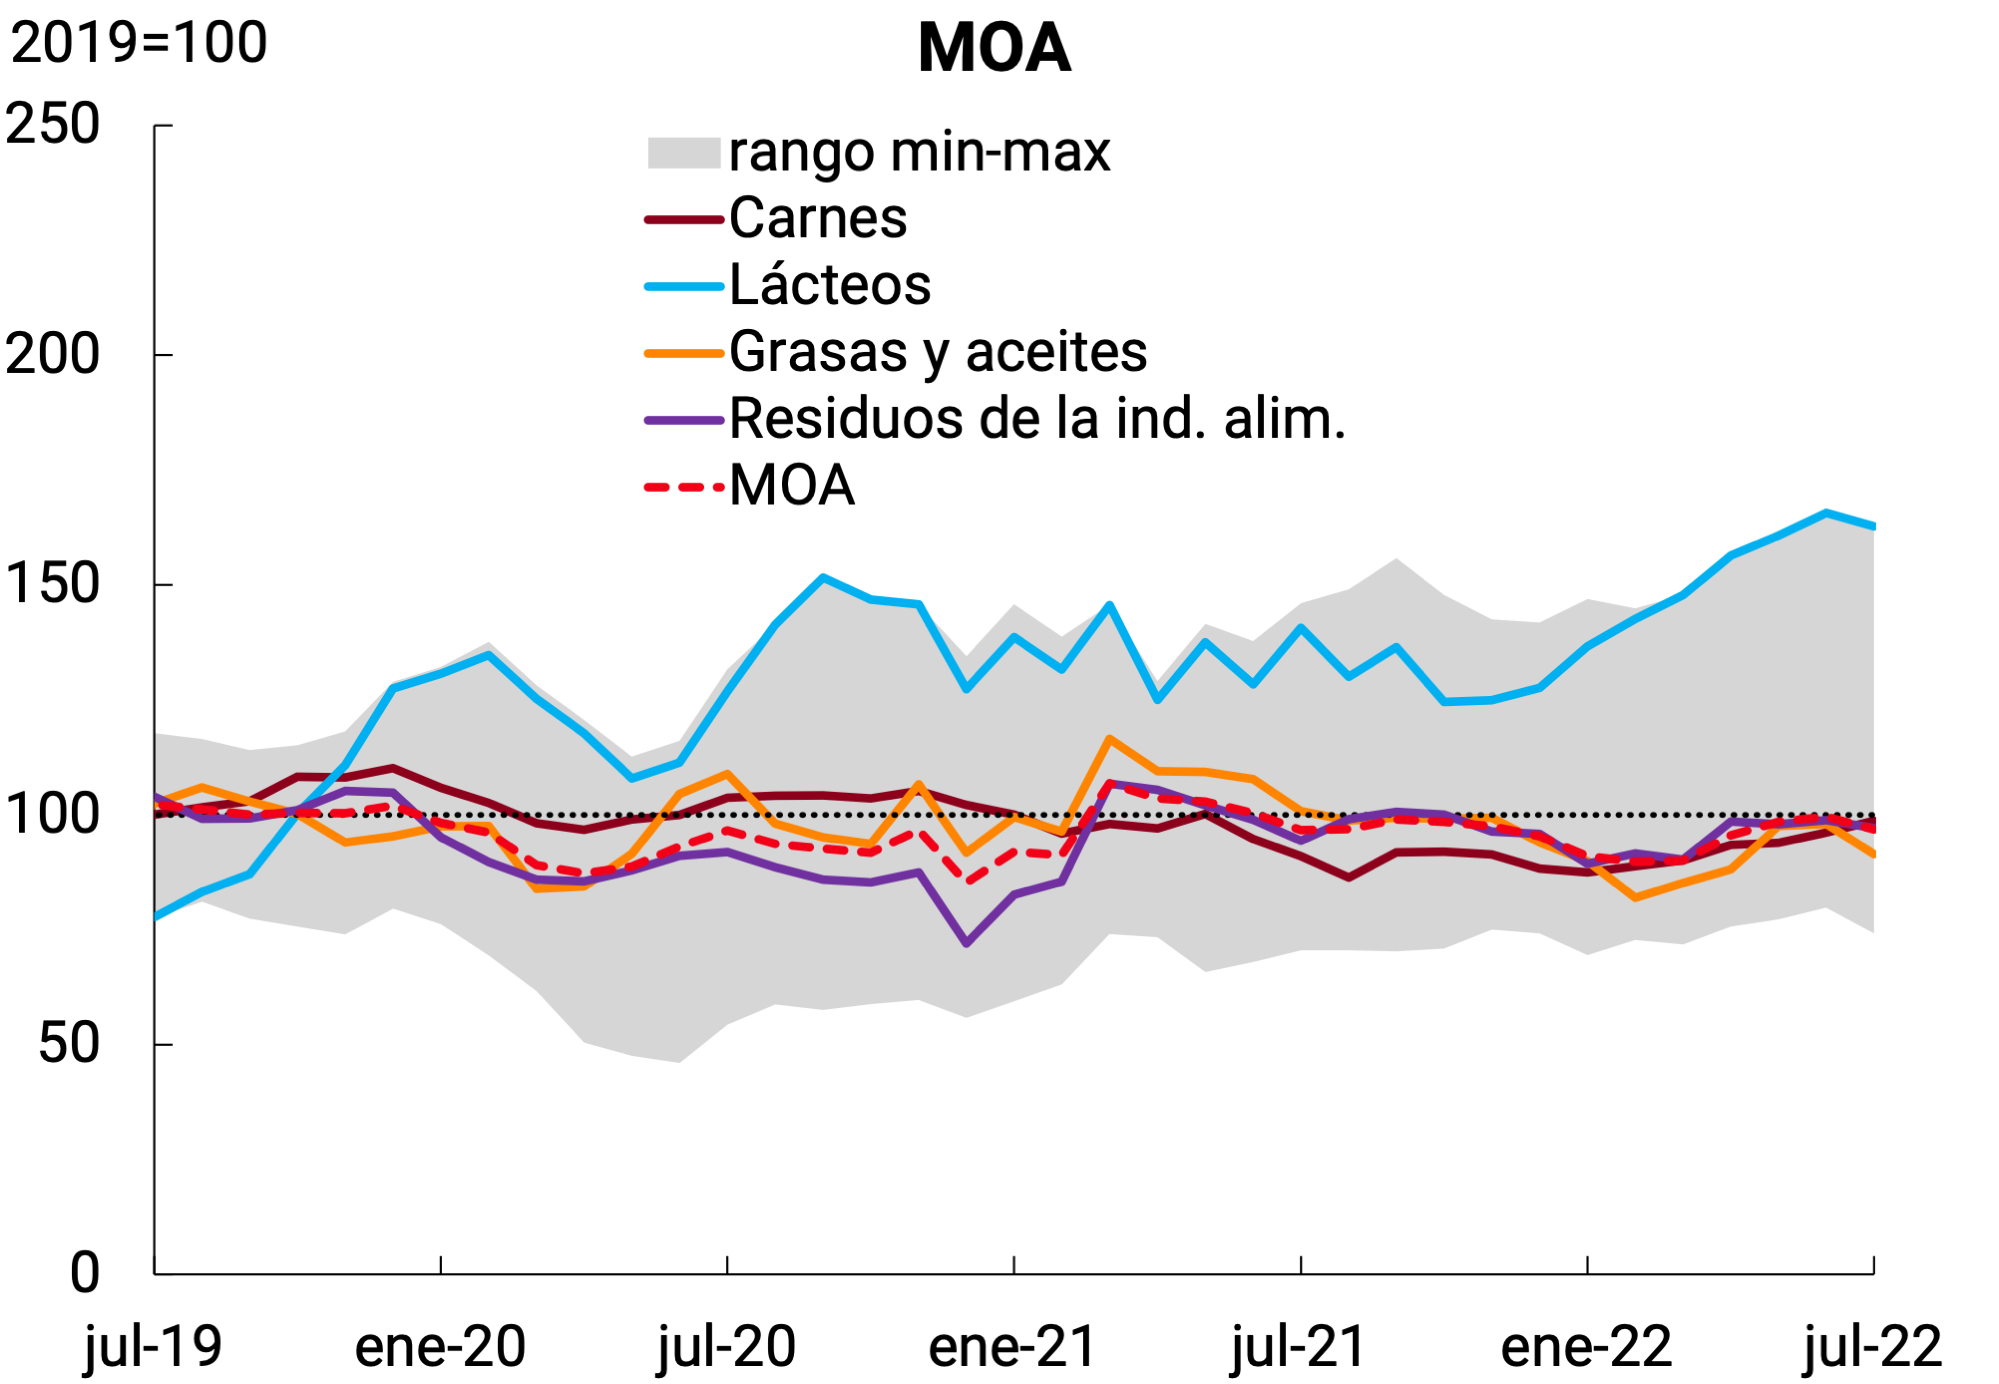
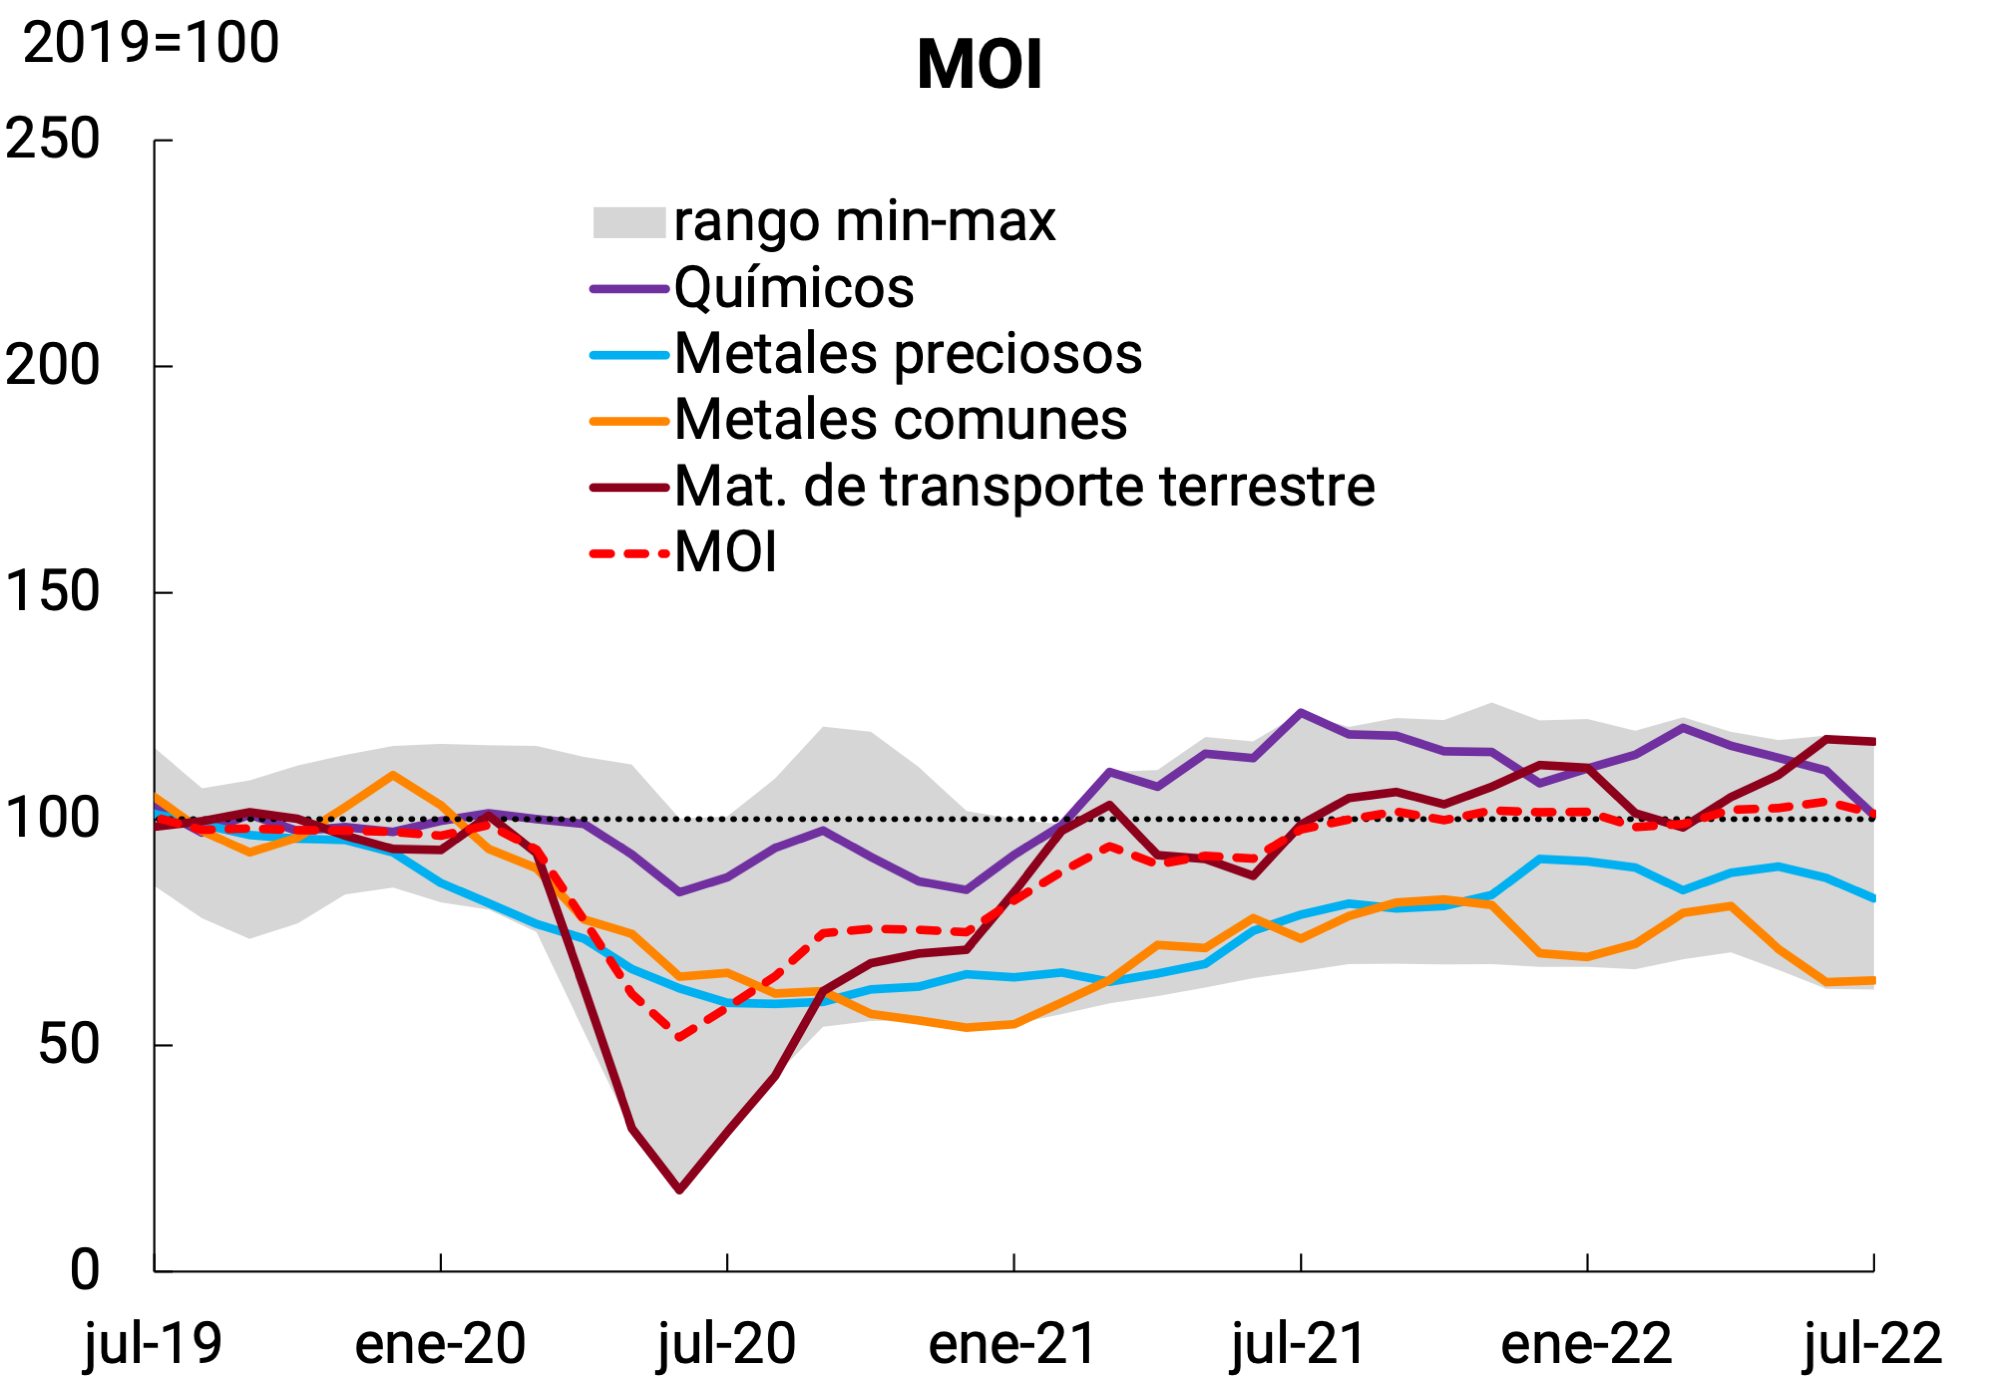
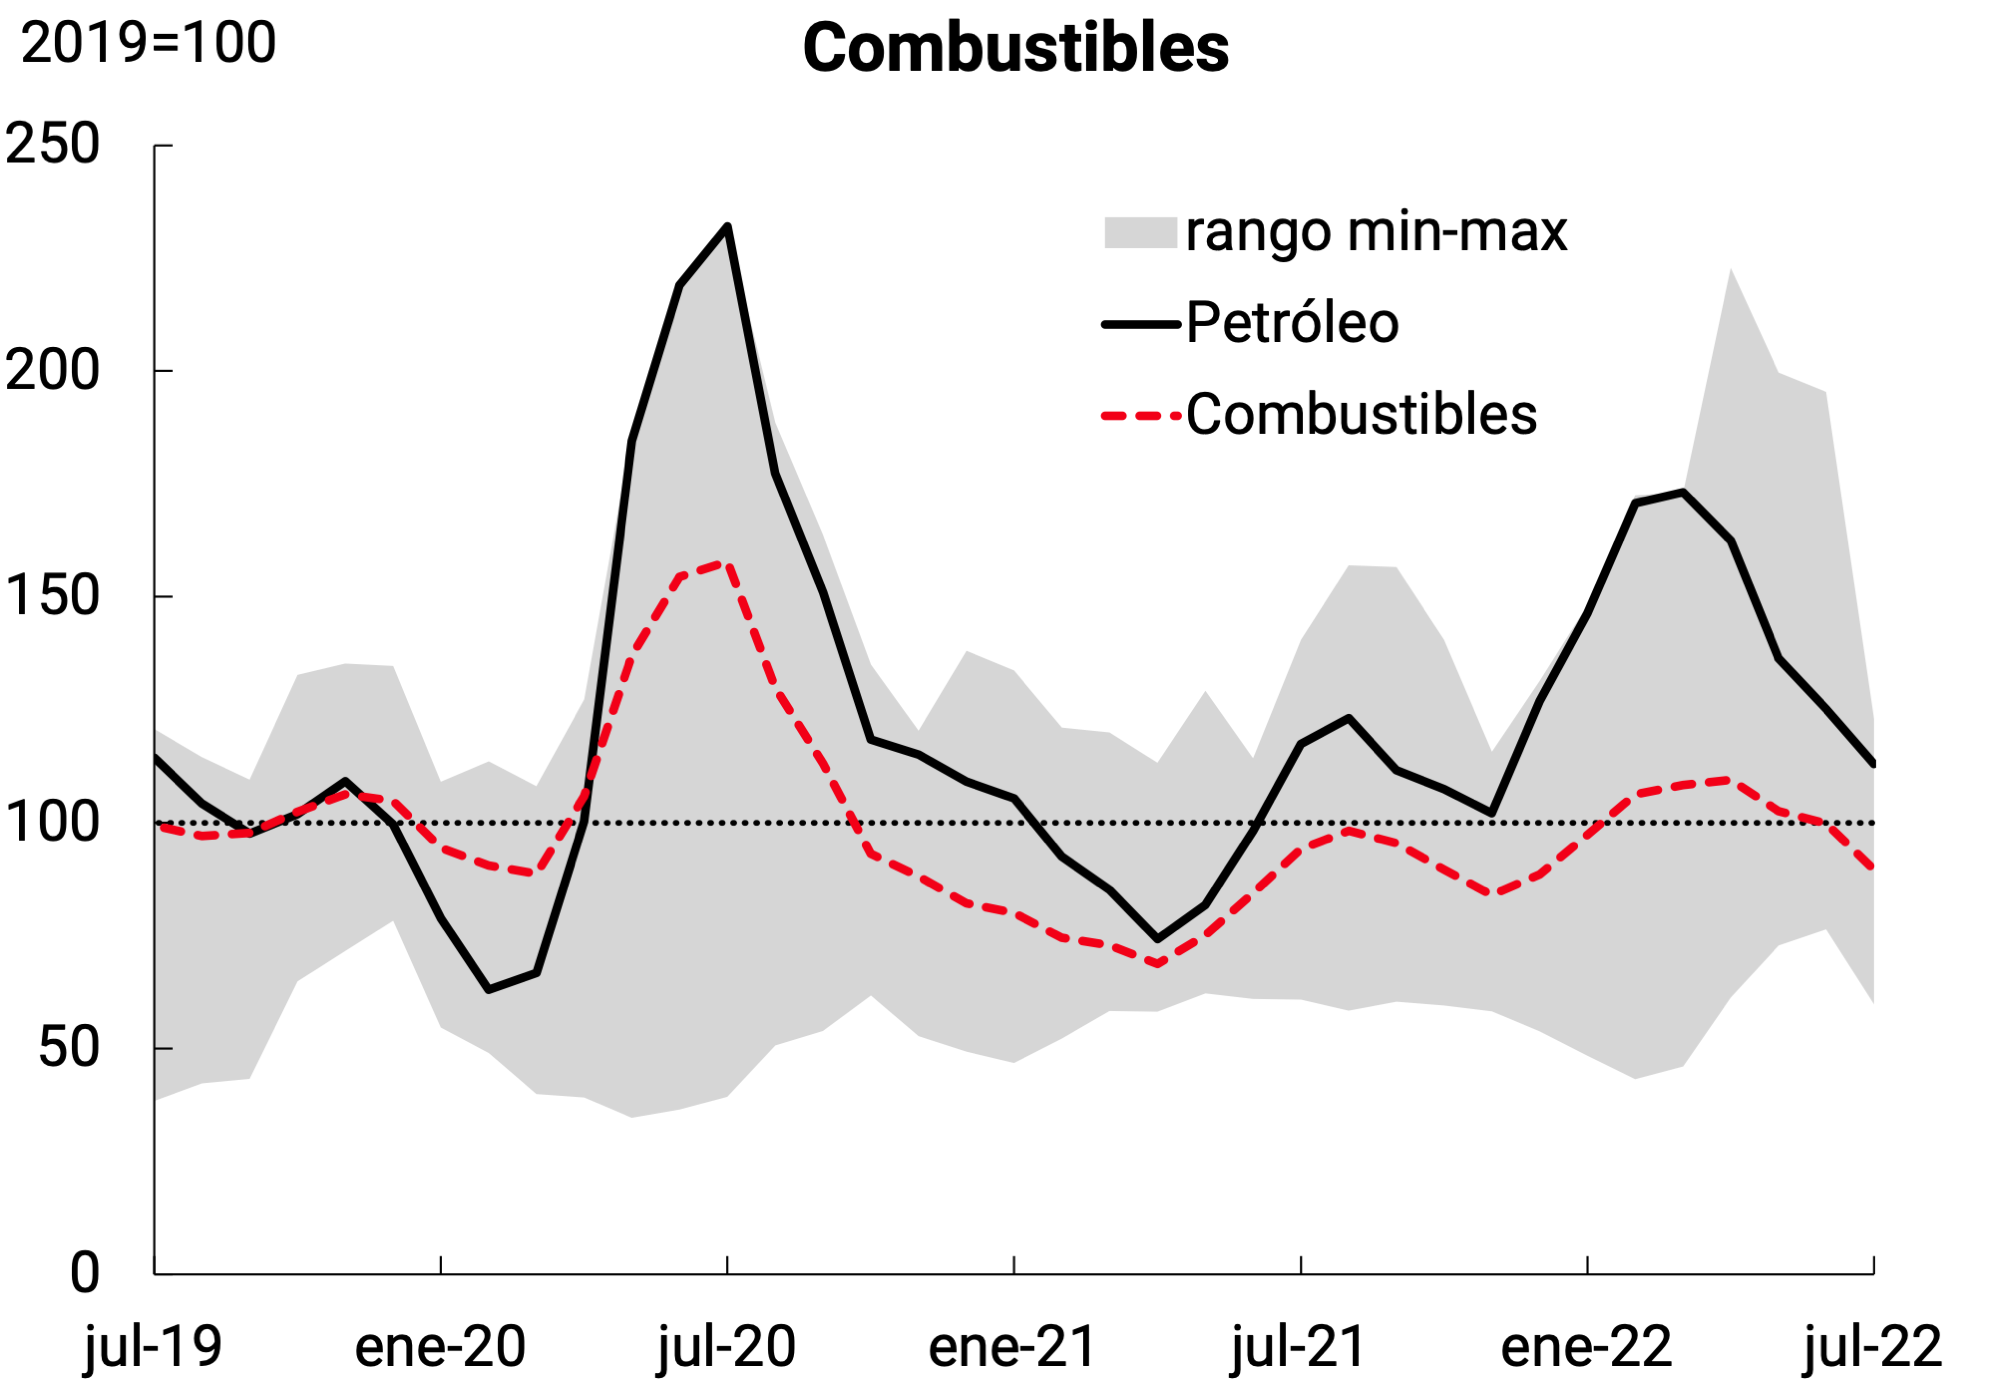
Two of the four main export items had increases in exported volumes in the second quarter of 2022. In the case of Manufactures of Agricultural Origin (MOA, +11% qq. s.e.), the growth was very widespread (13 of 14 grouped showed increases), with higher shipments of soybean derivatives standing out for their incidence, after a very weak first quarter. The exported quantities of Manufactures of Industrial Origin (MOI) increased 5% quarter. s.e., mainly underpinned by higher vehicle exports. On the other hand, shipments of Primary Products (PP) fell (-5% qoq. s.e.), with a strong negative incidence of oilseeds, in particular, soybeans. Finally, the quantities exported of Fuels and Energy (S) fell 8% s.e. in the quarter, affected by a decline in shipments of crude oil, the main category of the category (see Figure 4.4).
Figure 4.4 | Quantities exported. Seasonally
adjusted series Mobile Avg. 3 months
Source: BCRA based on INDEC data.
Box. Vehicle exports
One of the sectors that contributed to the growth of MOIs was the automotive industry, which has a high relevance in terms of value-added exports in addition to the creation of formal jobs.
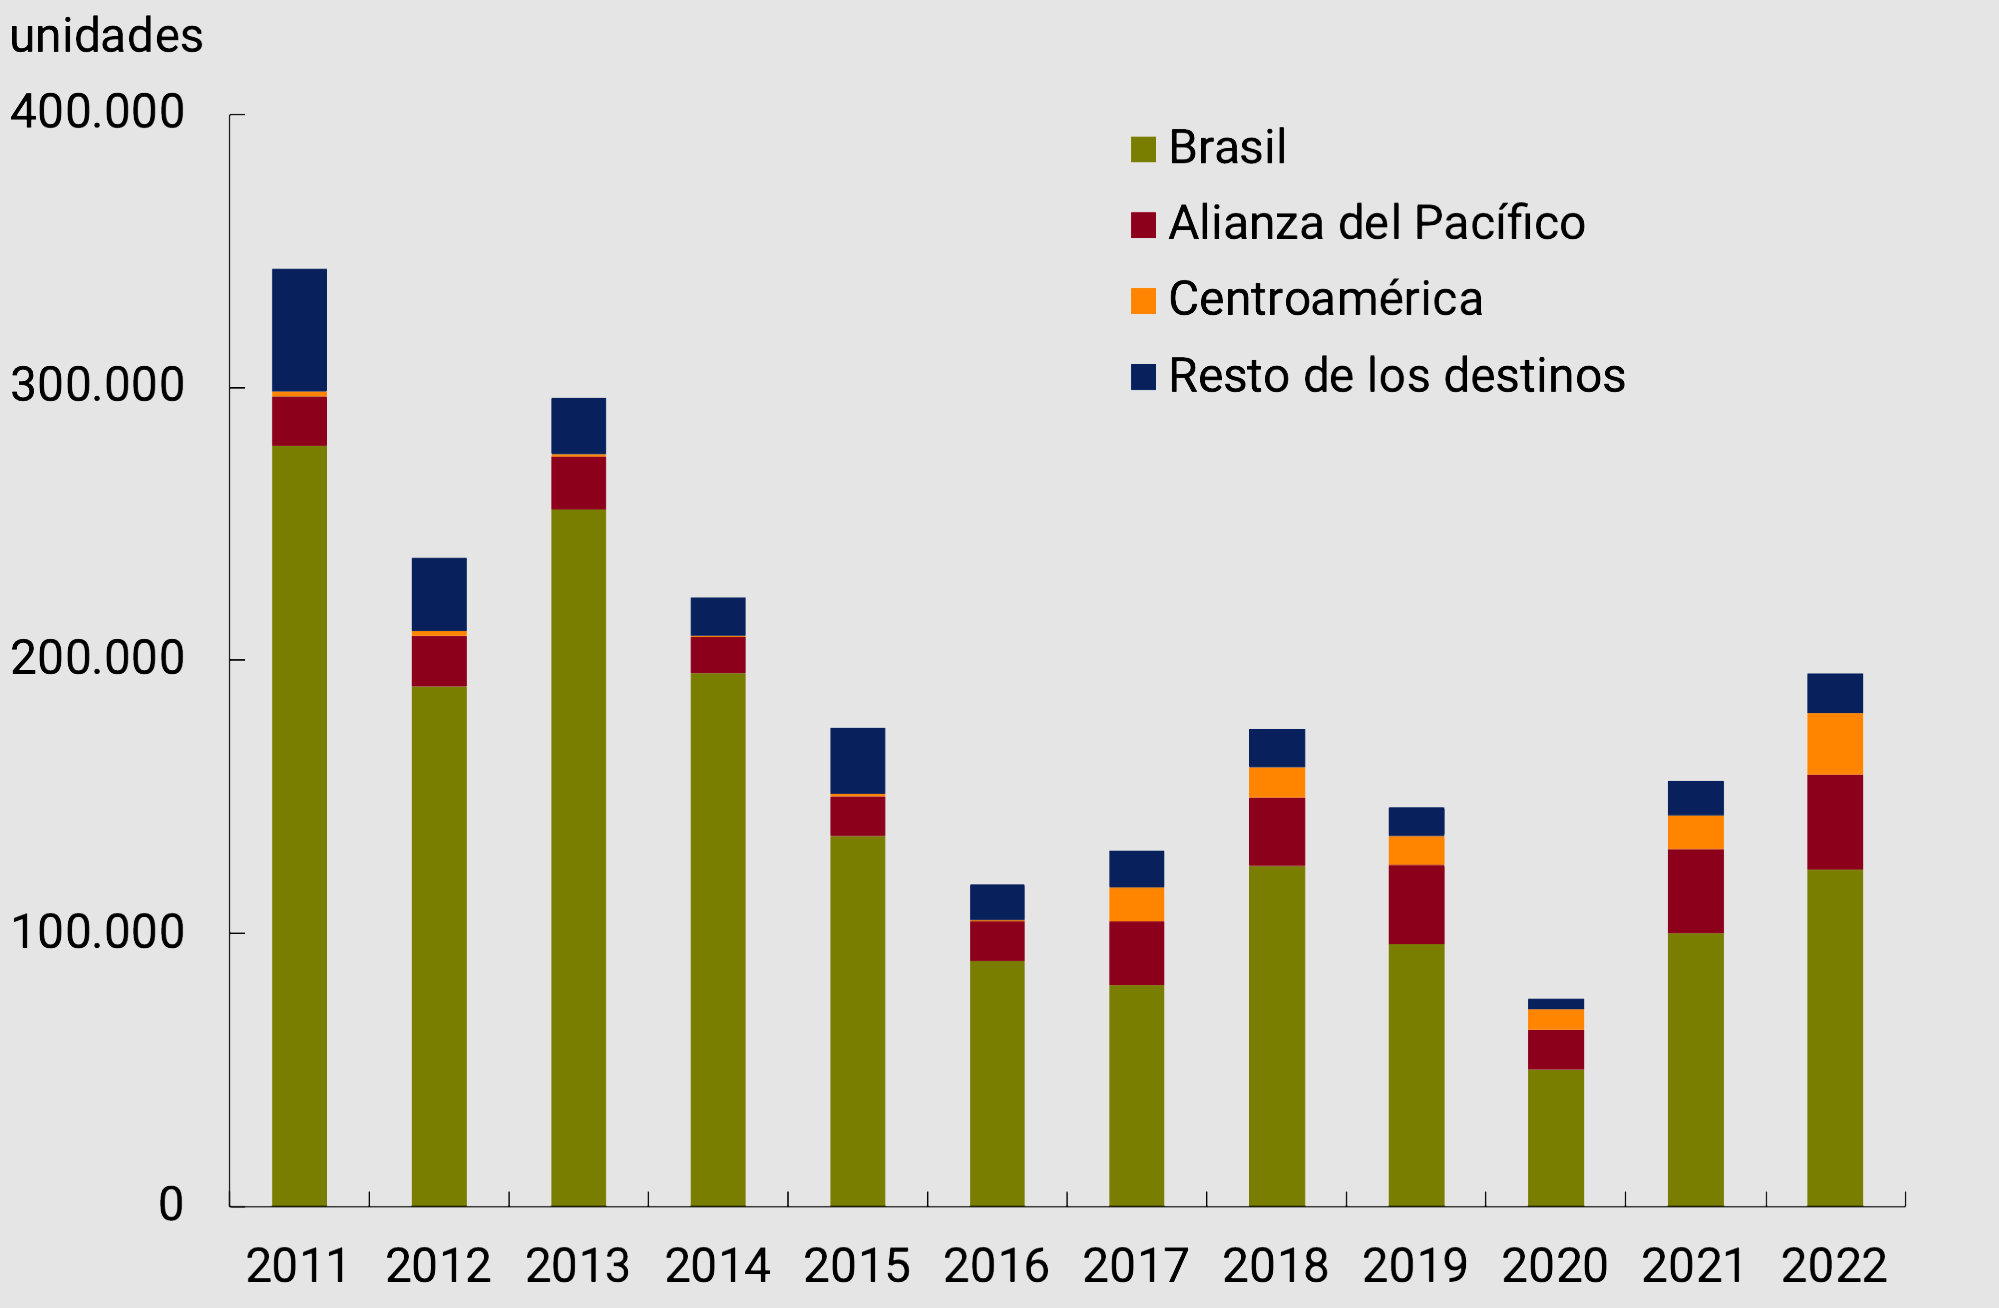
In the first 8 months of the year, a total of 195,385 vehicles were exported, which represents 25% more than what was accumulated in the same month of 2021 and 250% more than what was exported in the same period of 2020 (see Figure 4.5).
Figure 4.5 | Vehicles exported by main destinations
January-August of each year
Source: ADEFA.
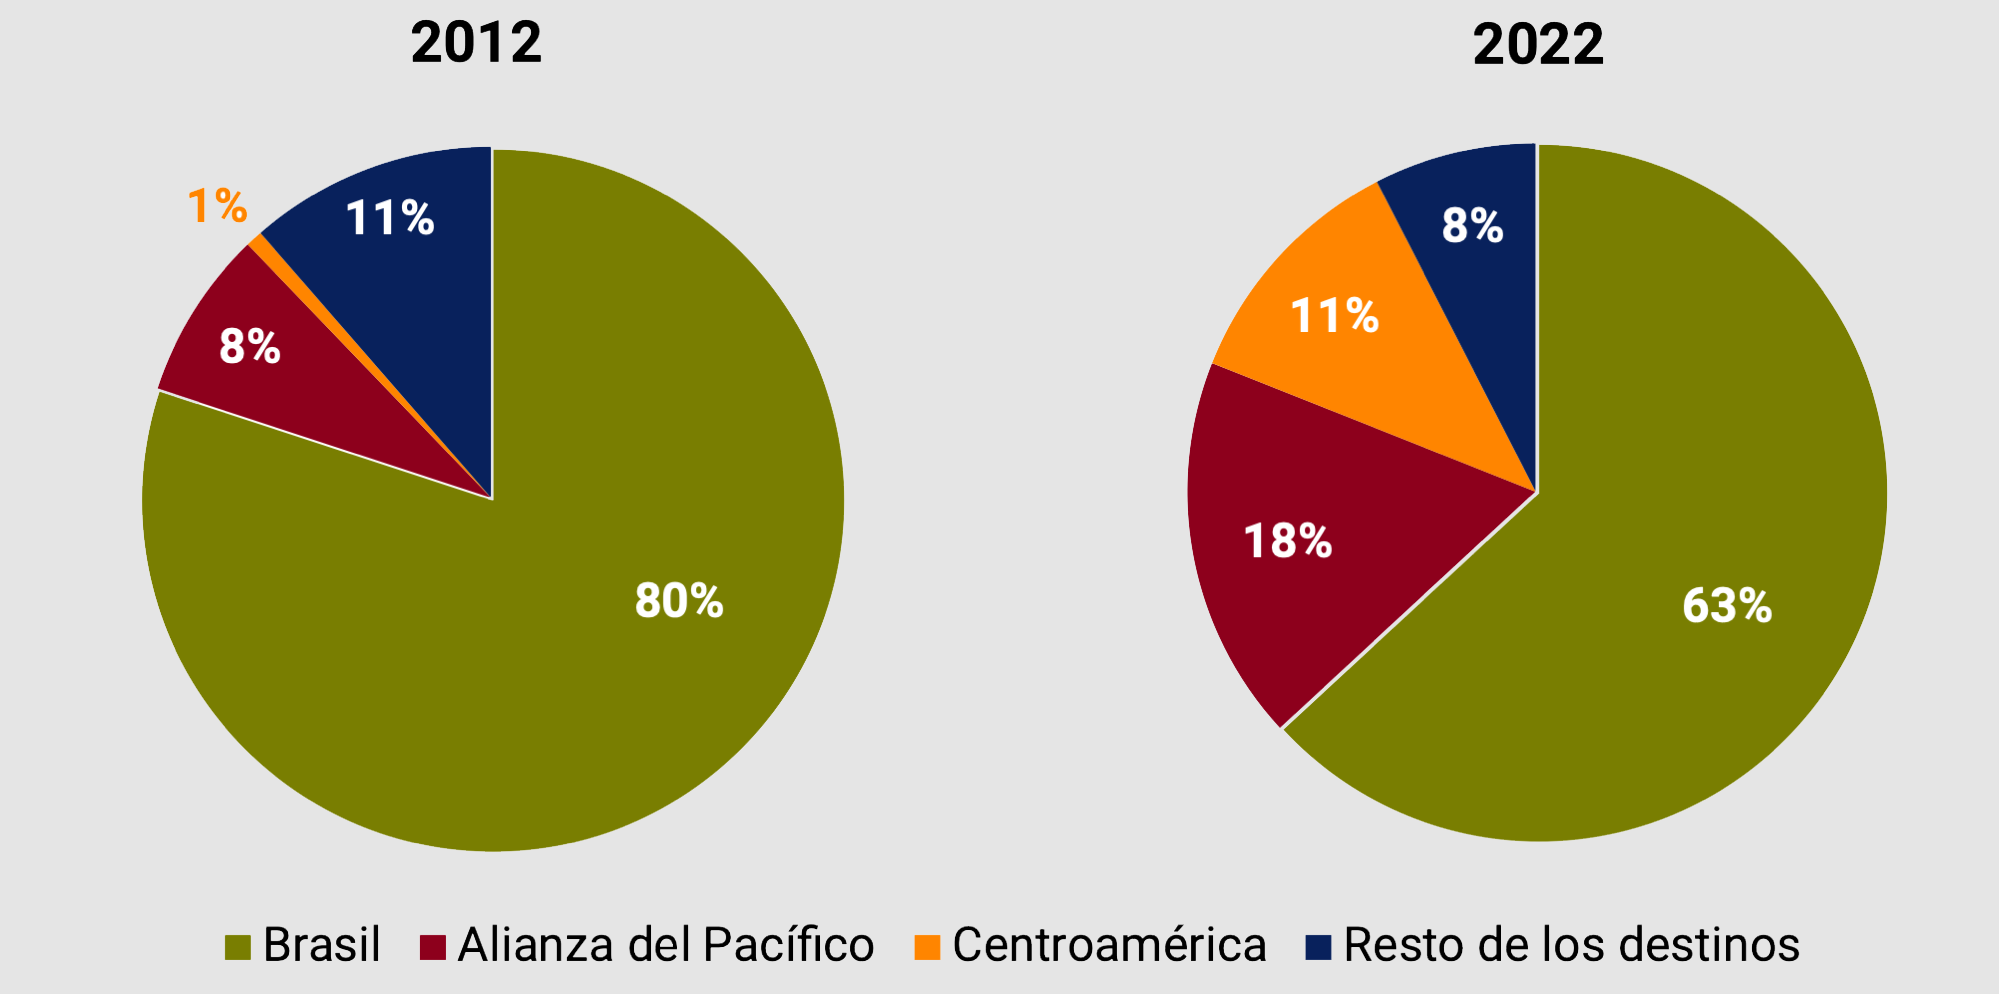
In conjunction with this aggregate growth, there is also a greater diversification of export markets, characterized by a more than proportional growth of the Central American destination (84% YoY). This is a positive aspect since it diversifies risks and removes dependence of the automotive industry with respect to the economic situation and commercial decisions made by Brazil, which continues to be the main export destination of the sector (see Figure 4.6).
Figure 4.6 | Share of the main vehicle
export destinations
Source: BCRA based on data from ADEFA.
This diversification of destinations occurred simultaneously with a change in the purchasing pattern of Brazil, our main buyer, which is tending to acquire fewer imported vehicles due to a policy of promotion of its national industry. In this line, a framework of growth opportunities was generated for new markets with high potential, mainly in the utility vehicle segment, in which Argentina is competitive internationally.
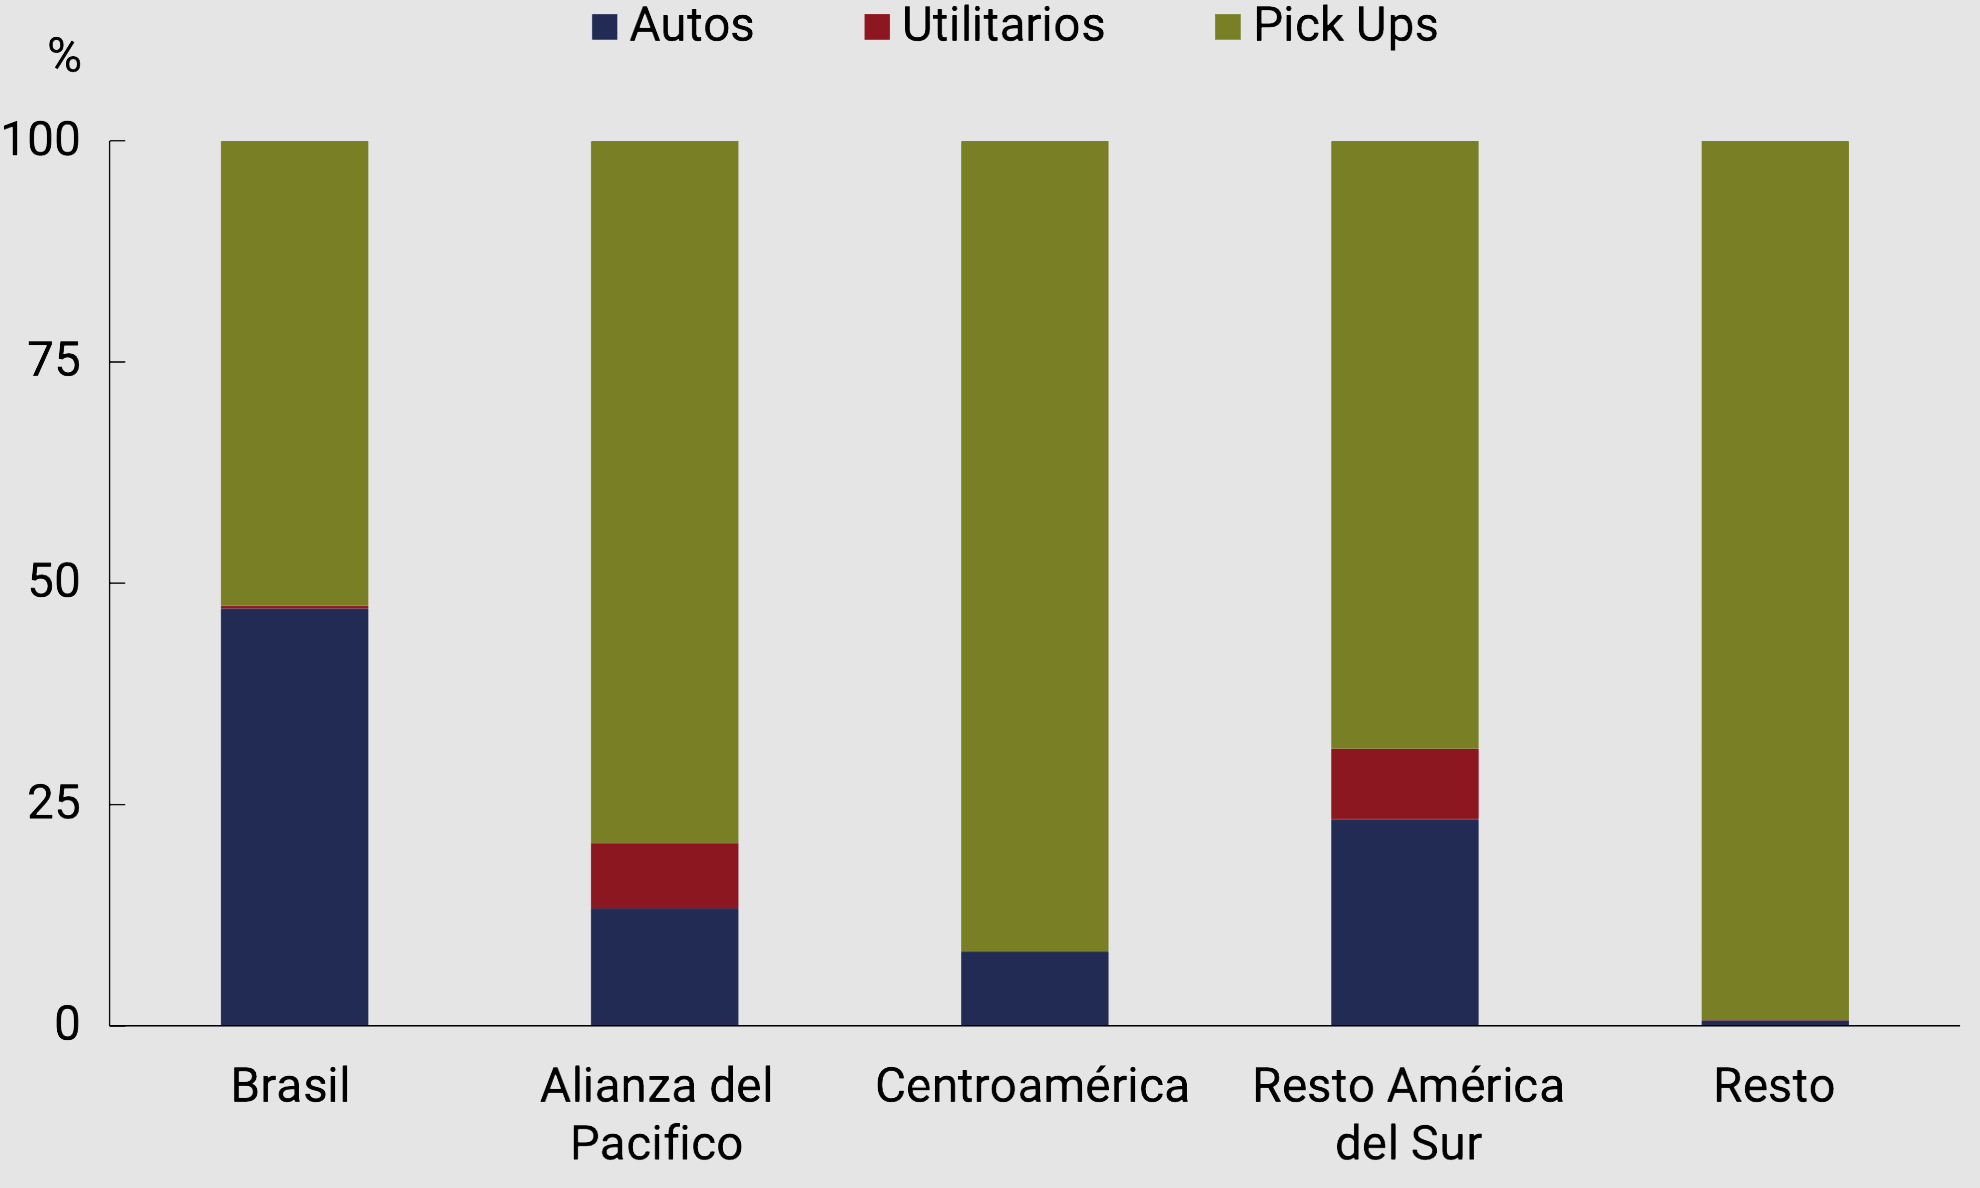
The automotive industry shows, among its main characteristics, a strong specialization towards the export of pick-ups, especially to Central America and the rest of the world where its share exceeds 90%. Shipments to Brazil are more distributed with a greater participation of private passenger vehicles, although in this case Mercosur’s corporate supply strategies of multinational firms located on both sides of the border seem to have an impact. Finally, exports of utility vehicles are concentrated to countries of the Pacific Alliance and the rest of South America (see Figure 4.7).
Figure 4.7 | Vehicle exports by type and destination
Source: BCRA based on data from ADEFA.
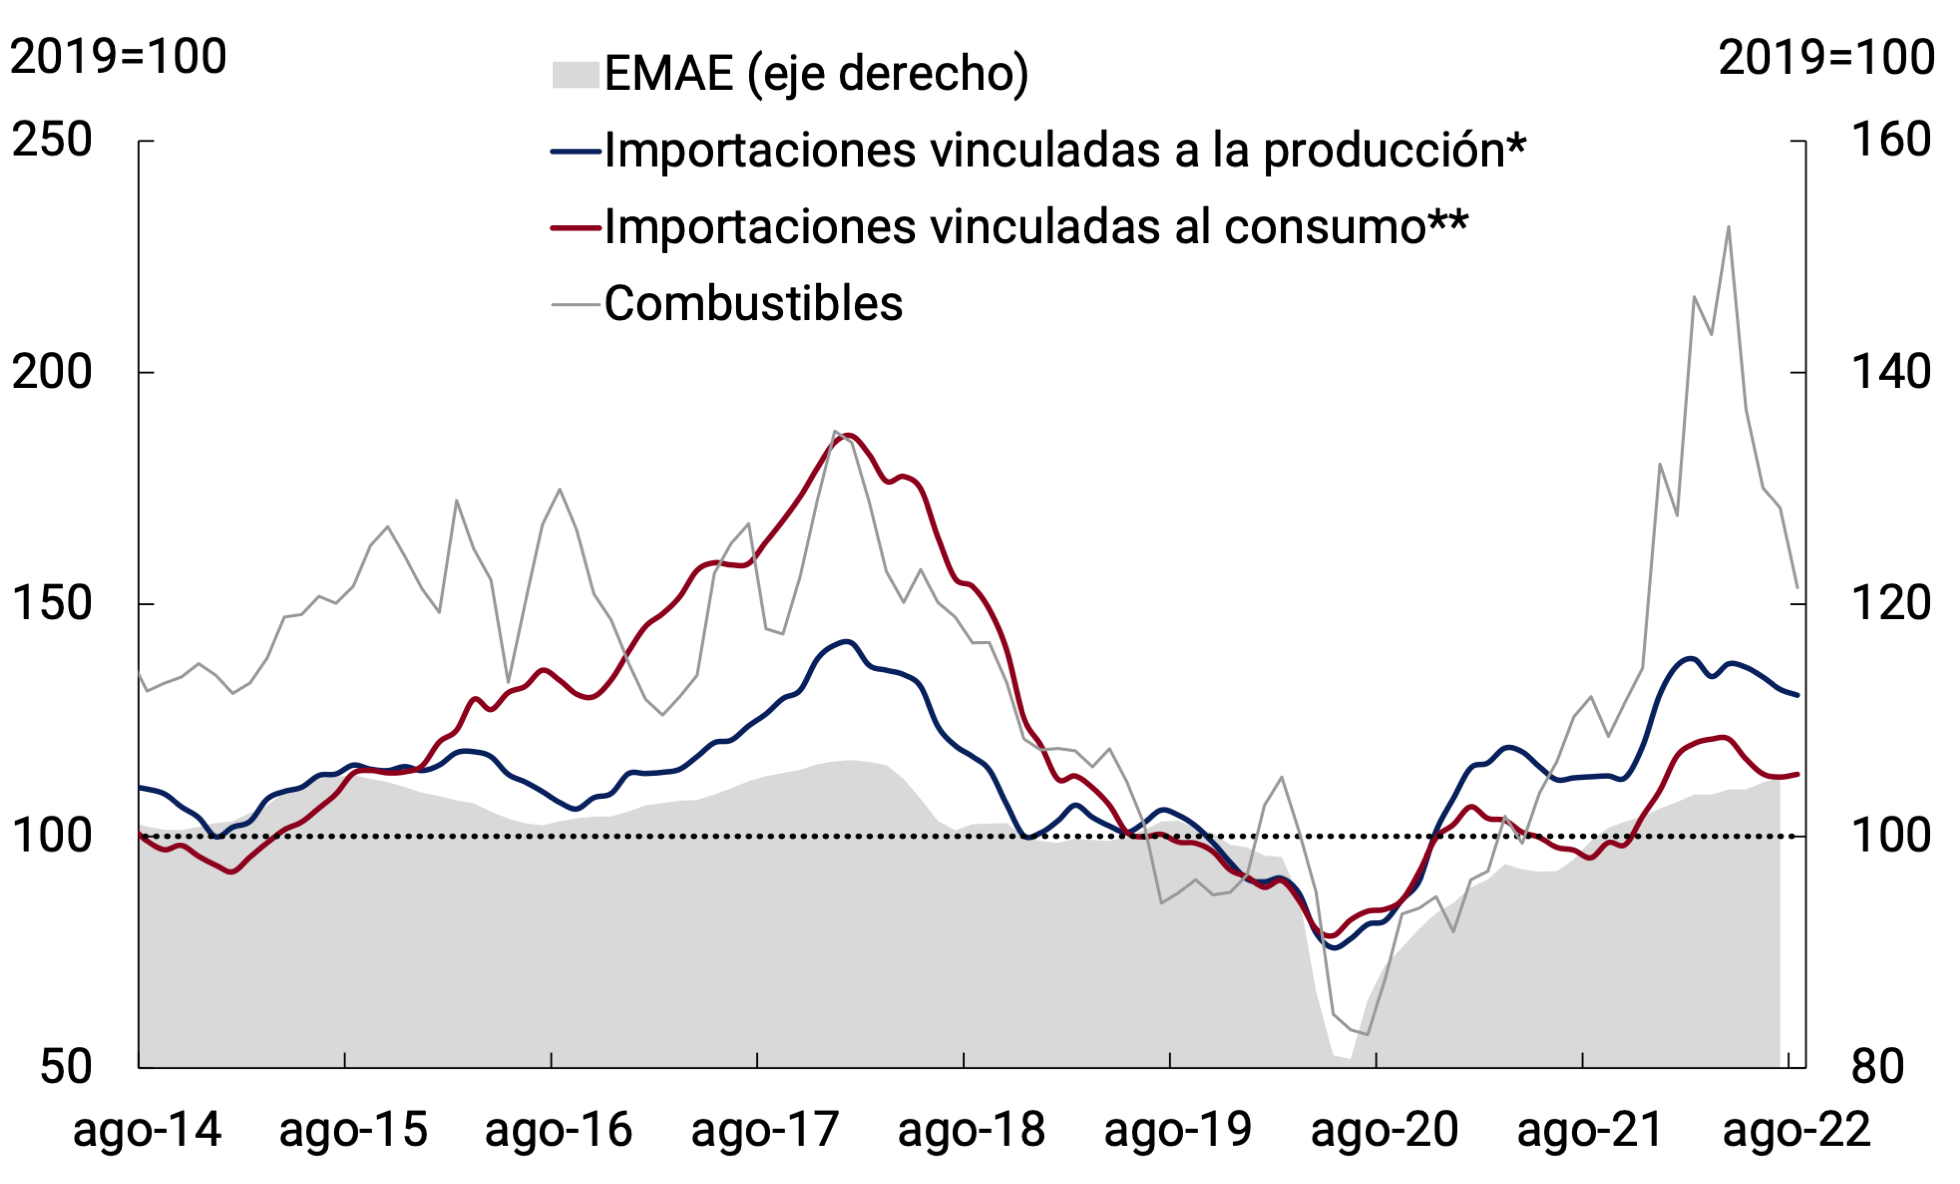
For their part, the imported quantities of goods have exhibited a generalized downward trend since March 2022. Since then, and adjusting for seasonal factors, the cumulative falls were 42% in the case of fuels, 13% in the case of goods directly associated with consumption, and 7% in those related to production (see Figure 4.8). In the first case, the calculation of the recent fall was influenced by the high level reached by purchases of fuels produced in the first months of the year (see Section 3 / Energy Trade Balance). The recent decline in the imported volumes of goods associated with production led the group to a level similar to that recorded in July 2017, when the level of economic activity was similar to the current one.
Figure 4.8 | Quantities imported. Seasonally
adjusted series
* Includes imports of capital goods and their parts of intermediate goods.
** Includes imports of consumer goods and vehicles.
Source: INDEC.
4.3. So far in 2022, the BCRA’s purchases in the foreign exchange market accumulated US$3,300 million, underpinned by the Export Increase Program
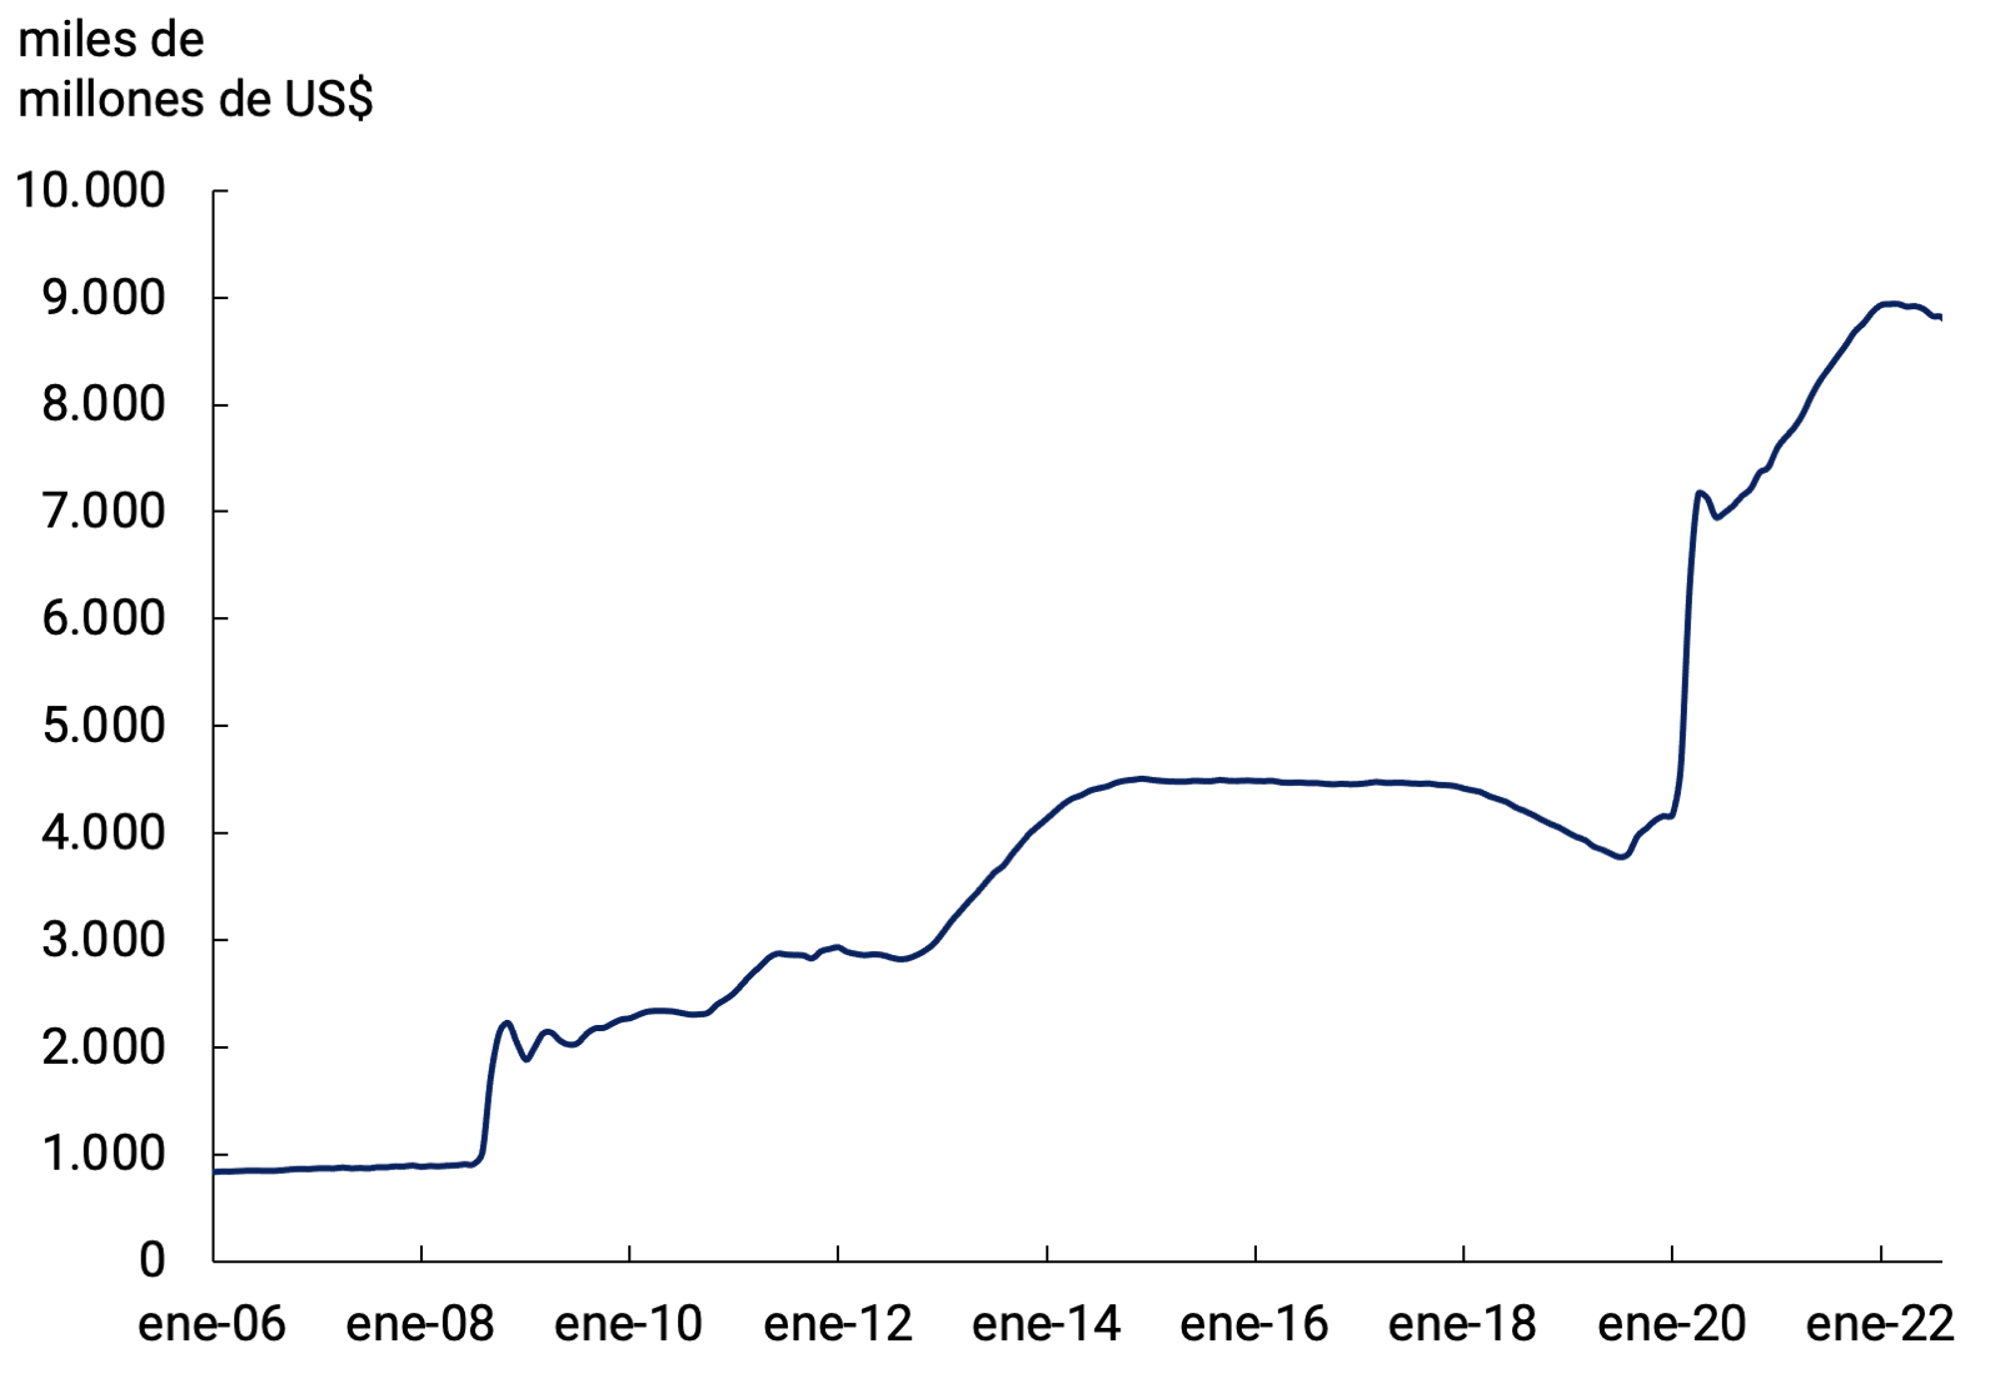
During the first eight months of 2022, exporters recorded revenues from exports of goods of about US$59,100 million. For its part, exports of goods totaled about US$59,500 million, so a slight decrease in external debt for advances and pre-financing of about US$400 million is estimated. Thus, the ratio of this type of indebtedness to exported securities is reduced to 6.2% and represents the lowest ratio verified since December 2006 (see Figure 4.9).
Figure 4.9 | Assets. Exports and external debt for exports
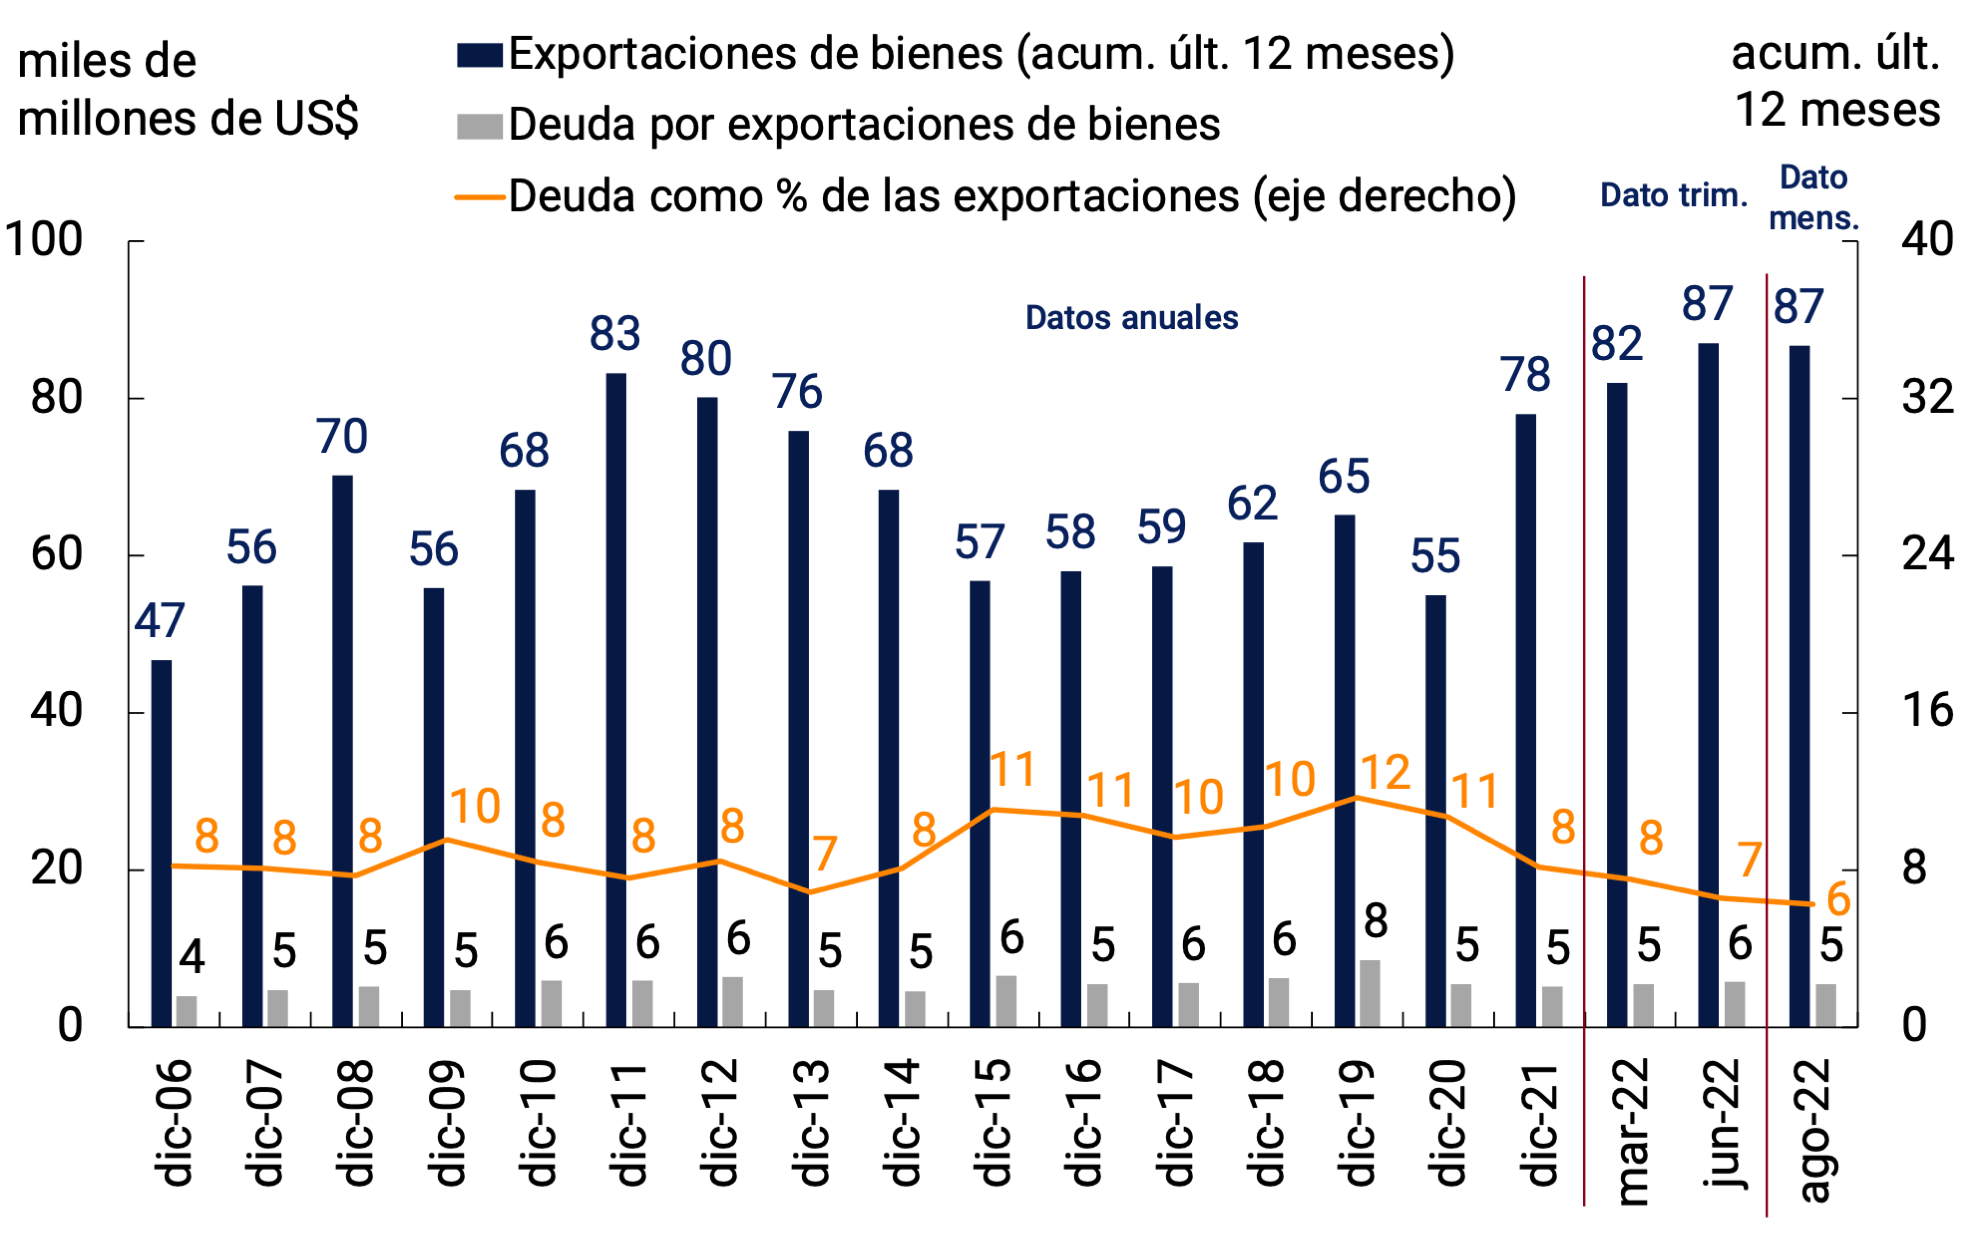
Note: Debt of Jul-22 and Aug-22 estimated based on accrual data and cash.
Source: BCRA based on INDEC data and own data.
During 2020, the BCRA established a series of regulations that aim to promote the allocation of foreign currency more efficiently, with an impact on both the evolution of private commercial and financial debt. These rules were maintained throughout 2021 and continued to be refined throughout 2022. In this context, during the first eight months of 2022, payments for imports of goods through the foreign exchange market for around US$48,100 million were about US$6,150 million below FOB imports for the period, which would imply a rise in foreign debt for this concept. Thus, the ratio of external debt to the level of imports rose in August 2022, reaching 35% (see Figure 4.10).
Figure 4.10 | Assets. Imports and external debt for imports
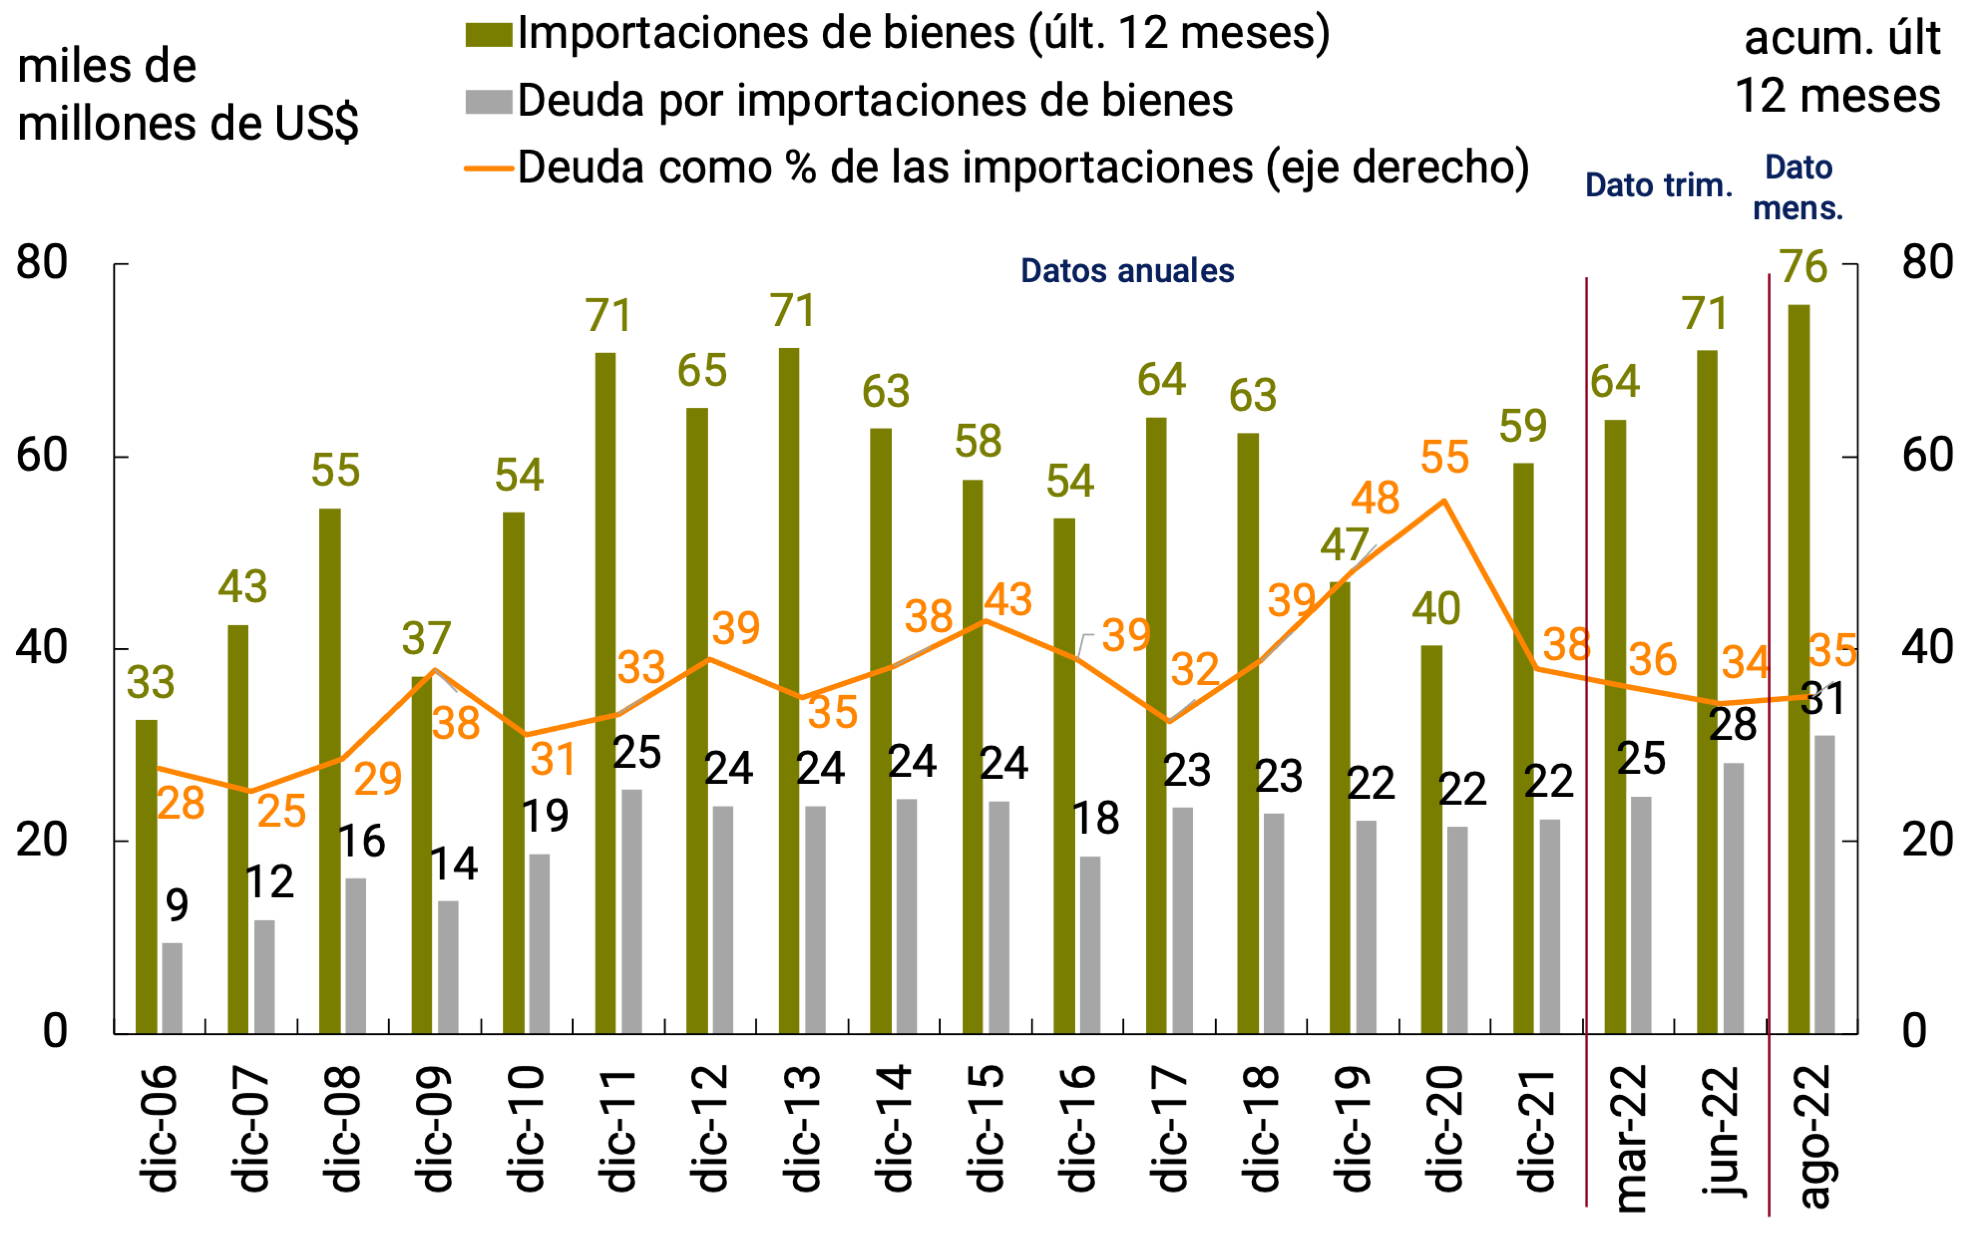
Note: Debt of Jul-22 and Aug-22 estimated based on accrual data and cash.
Source: BCRA based on INDEC data and own data.
The aforementioned evolution of trade in goods and trade debt for exports and imports of goods, resulted in a net result for goods in the foreign exchange market of US$10,989 million in the first eight months of the year, higher by about US$5,000 million than the result of the FOB trade balance of the same period and exhibiting a fall compared to the previous year (13% y.o.y.).
With regard to financial debt, and as part of the current regulatory framework mentioned above, in September 2020, Communication “A” 7106 established the guidelines under which private sector companies could initiate a process of refinancing their respective external liabilities, which would allow their maturity profile to be adapted to the guidelines required for the normal functioning of the foreign exchange market. This communication, which reached certain capital maturities between 15-Jan-20 and 31-Mar-21, was extended by Communication “A” 7230, covering maturities from then until the end of 2021. Likewise, Communication “A” 7422 extended the term of the maturities until 30-Jun-22 and Communication “A” 7466 did so until 31-Dec-22.
In this context, the renegotiations recorded during the first eight months of 2022 had an impact on lower net purchases in the foreign exchange market of about US$1,470 million compared to the original maturities for that same period, accumulating lower net payments of about US$4,000 million since its inception. It should be noted that in the first eight months of 2022, net cancellations represented only 26% of the maturities reached, with almost three-quarters of the maturities of securities and financial debts being refinanced.
As for the BCRA’s result in the foreign exchange market in the year to August, the entity’s purchases and sales were offset, while International Reserves fell by US$2,928 million in the same period.
The variation in International Reserves up to August was explained by the decrease in the valuation of assets by about US$2,196 million, the fall in the foreign currency holdings of the entities by about US$1,700 million and sales in the Local Currency System by US$528 million. These movements were partially offset by the net inflows of foreign currency debt of the National Government of about US$1,500 million (net income of the IMF of about US$3,500 million and net payments of other debt in foreign currency of US$2,000 million).
It should be noted that in addition to the measures implemented since July10 aimed at encouraging sales and settlement in the foreign exchange market of agricultural products, on September 5 was added the creation by Decree 576/22, of the “Export Increase Program” through which an exchange rate of $200 for every US$1 was established until September 30. for exports of soybeans and their derivatives.
Based on the incentives generated by this program, the oilseeds and cereals sector liquidated US$5,300 million through this mechanism in the foreign exchange market at the close of this report. The upturn in liquidations in the sector allowed the BCRA to buy some US$3,300 million in the foreign exchange market during the month of September (see Figure 4.11).
Figure 4.11 | Exchange market. Result
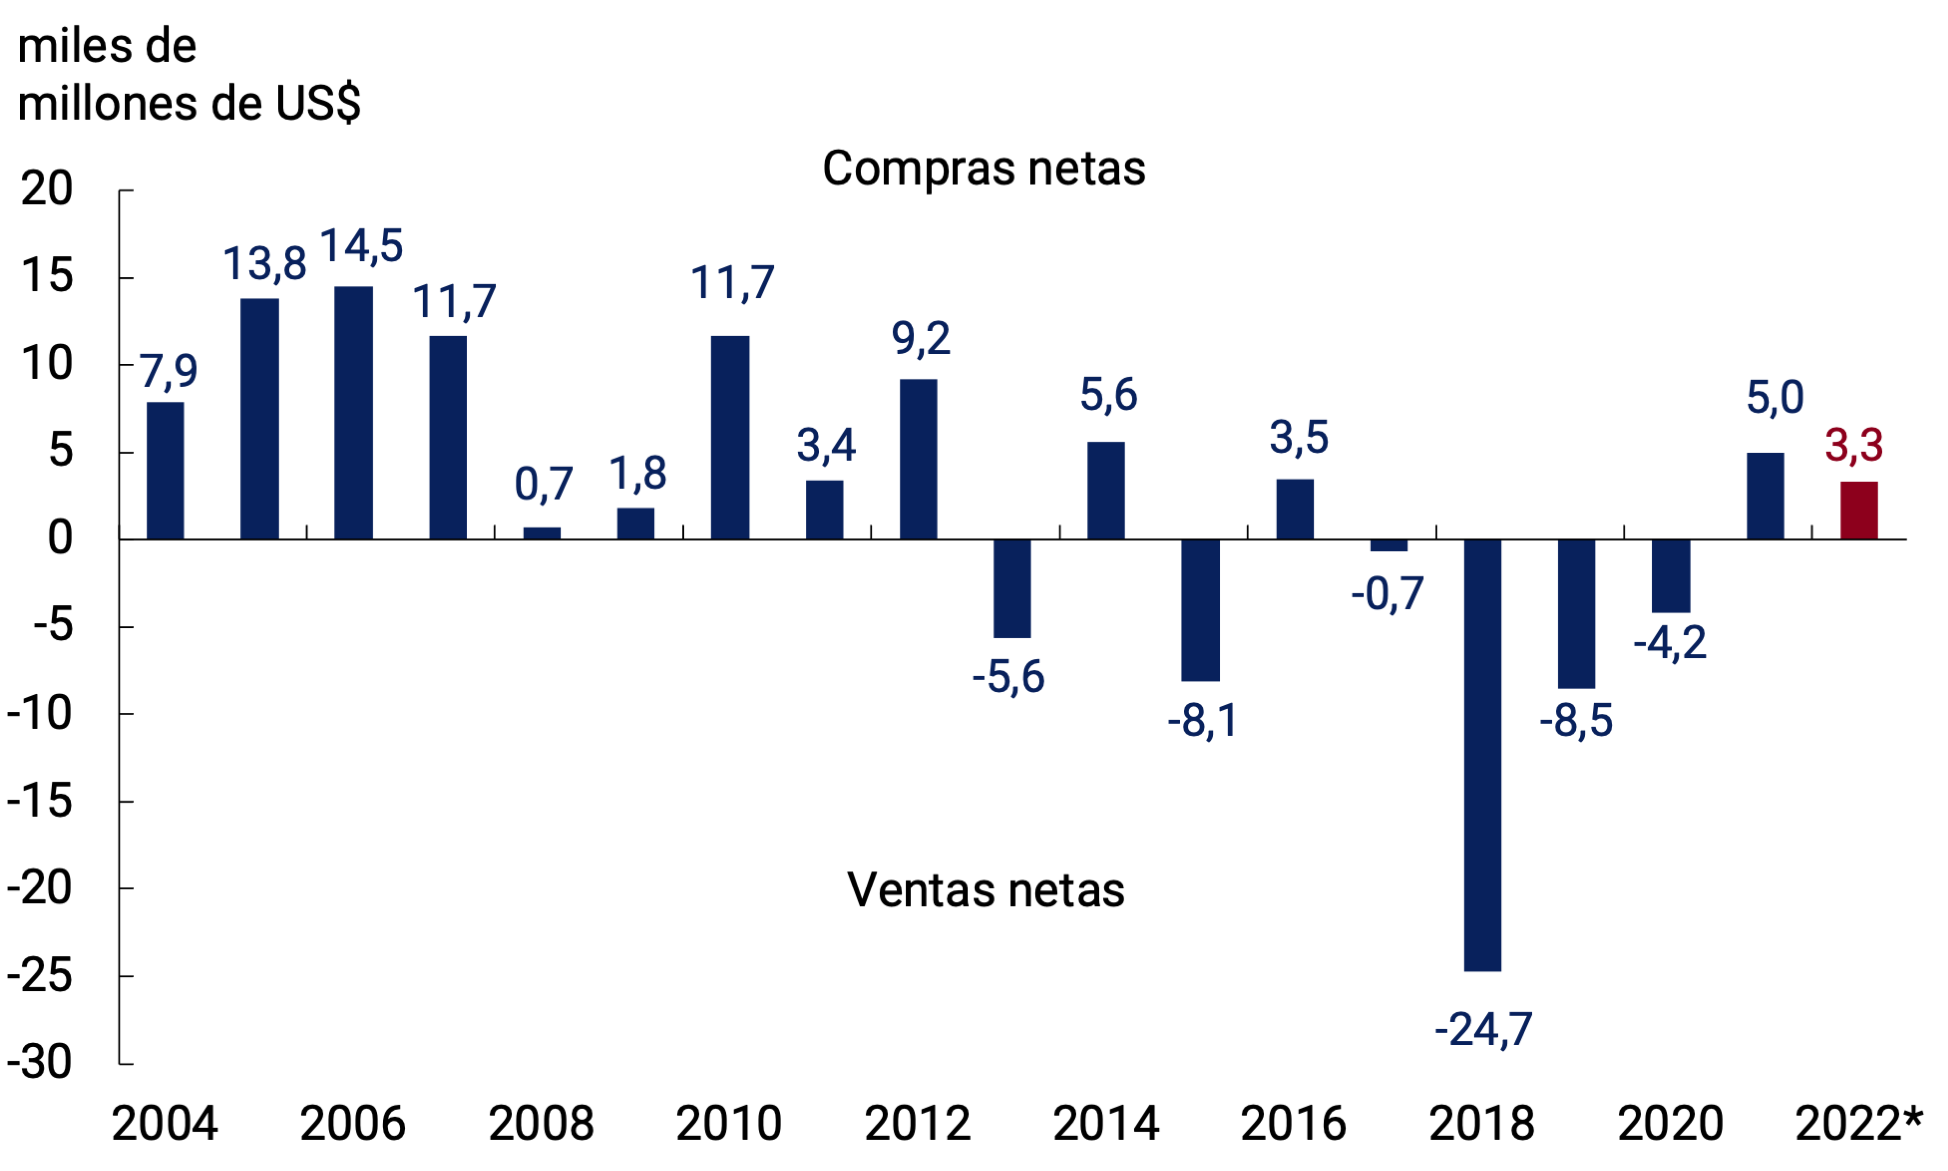
*Data as of Sep 20-22.
Note: joint cumulative result of the BCRA and the National Treasury in the foreign exchange market.
Source: BCRA.
4.4. Perspectives
For the year 2022, the economy is expected to register a trade surplus in goods for the fourth consecutive year, within the framework of a managed floating exchange rate policy. Meanwhile, the current account balance would return to positive territory in the fourth quarter of the year. For next year, the growth in agricultural production, particularly soybeans, and the commissioning of the Néstor Kirchner gas pipeline at the end of June 2023, which will reduce fuel imports, will contribute to the strengthening of the trade surplus of goods and, consequently, to the accumulation of International Reserves.
The international context will continue to play a leading role in the risk matrix of the external sector of the Argentine economy. The speed with which central banks in advanced economies tighten their monetary policy in response to high inflation in their economies (in a context in which a worsening of bottlenecks in some global value chains resulting from China’s COVID 0 health policy cannot be ruled out), It will affect the growth of our trading partners and the prices of raw materials in general. On the other hand, the duration and potential escalation of the war in Ukraine will influence the evolution of the global cost of energy and the terms of trade of our economy.
The BCRA will continue to prudently manage foreign exchange regulations in order to adapt them to the needs of the situation, favoring monetary and exchange rate stability. Along these lines, on September 8, 2022, the provisions of Communication “A” 7532 were extended until the end of the year, to allow time for the normalization of foreign trade, which, in order to respond to the extraordinary needs for foreign currency to meet energy imports and in order to sustain the economic growth and development of SMEs, the import financing system was extended for one quarter to those made under Non-Automatic License and to the import of services. Likewise, it was decided in coordination with him, at that time, the Ministry of Productive Development to expand the tariff positions of goods equivalent to those produced in the country that will have access to the market from 180 days and that of luxury goods that will be able to access from 360 days.
Going forward, and to the extent that macroeconomic conditions allow, exchange rate regulations will be made more flexible, with the aim of maintaining in the medium and long term a set of macroprudential regulations compatible with the dynamization of capital flows aimed at the real economy.
Back to top
5. Public Finance
In July and August, revenues grew above primary expenditures, in contrast to what happened during the first half of 2022. Thus, the primary fiscal result on a cash basis of the National Non-Financial Public Sector (NFPS) accumulated in the last 12 months to August a deficit balance equivalent to approximately 2.9% of GDP and remained at levels lower than those of the end of 2021 (3.0% of GDP), a value that had already been significantly lower than that observed during 2020 (6.4% of GDP). For its part, the NFPS financial deficit represented 4.5% of GDP in the same period. The Ministry of Economy reaffirmed the fiscal path compatible with an annual NFPS primary deficit of 2.5% of GDP for 2022, without modifying the target originally set within the framework of the program with the IMF.
In the July-August two-month period, collection grew 79.3% YoY (+2.8% YoY in real terms). Economic growth and improved employment and wages contributed to this tax performance. Taxes associated with foreign purchases maintained a high dynamism, while export duties had a more limited advance in the margin. On the side of tax resources, measures were implemented that will contribute to achieving the proposed fiscal objective. Advances on Income Tax for corporations were brought forward and the collection on account of this tax on foreign currency transactions for the purchase of banknotes and for outbound tourism expenses or through the use of cards increased. The “Export Increase Program” was also created to stimulate the commercialization of soybeans, with an effect on the collection of duties in September.
On the expenditure side, the budget appropriations were adjusted in order to reflect the execution currently projected and the freezing of the personnel of the National Public Administration including decentralized public companies was reinforced. Likewise, measures were provided to segment the rates of public services (electricity, gas and water), which will generate savings in the associated subsidies. Meanwhile, a program began to be implemented that will seek the gradual incorporation into private sector jobs of current beneficiaries of social plans. For its part, priority was given to expenses related to the construction of the Vaca Muerta-Salliqueló “Néstor Kirchner” gas pipeline, which will contribute to generating significant savings in the future.
The fiscal targets established within the Extended Facilities Program (PFE) with the International Monetary Fund (IMF) for the second quarter of the year were met. In turn, the National Government sent the Draft Budget Law for 2023 to the National Congress, adapting it to the current conditions of the macroeconomic context, foreseeing convergence to a primary deficit for next year of 1.9% of GDP, in line with the current agreement with the IMF.
At the beginning of June, in a context of greater financial volatility at the international and local levels, tensions were generated in the sovereign debt market in pesos. The extraordinary intervention by the BCRA in the secondary public debt market to preserve financial stability, the successful implementation of a short-term debt swap and the increase in rates implicit in the auctions of the demanded instruments managed to stabilize the market. The financing strategy made it possible to obtain net funding of about $1.5 billion in the first eight months of the year. The stock of National Public Debt at the end of August13 , 2022 represented approximately 80% of GDP, exhibiting a reduction of about 9.6 p.p. compared to the end of 2019.
5.1. National tax collection strengthened national tax revenues by sustaining its growth in real terms during the second quarter and early third quarter
National tax collection increased 75.7% during the second quarter of 2022 compared to the previous year (see Figure 5.1), which meant a real growth of 9%. With data up to August, during the third quarter collection advanced 79.3% y.o.y. (+2.8% y.o.y. in real terms). The performance of taxes between April and August responded to the consolidation of the economic recovery and the improvement in wages and formal employment. Taxes associated with foreign purchases made real progress while export duties were reduced: grain quantities were impacted by lower agricultural supply due to drought and the commercial decisions of sector actors, while prices fell at the margin.
Figure 5.1 | Contribution to the growth of national tax
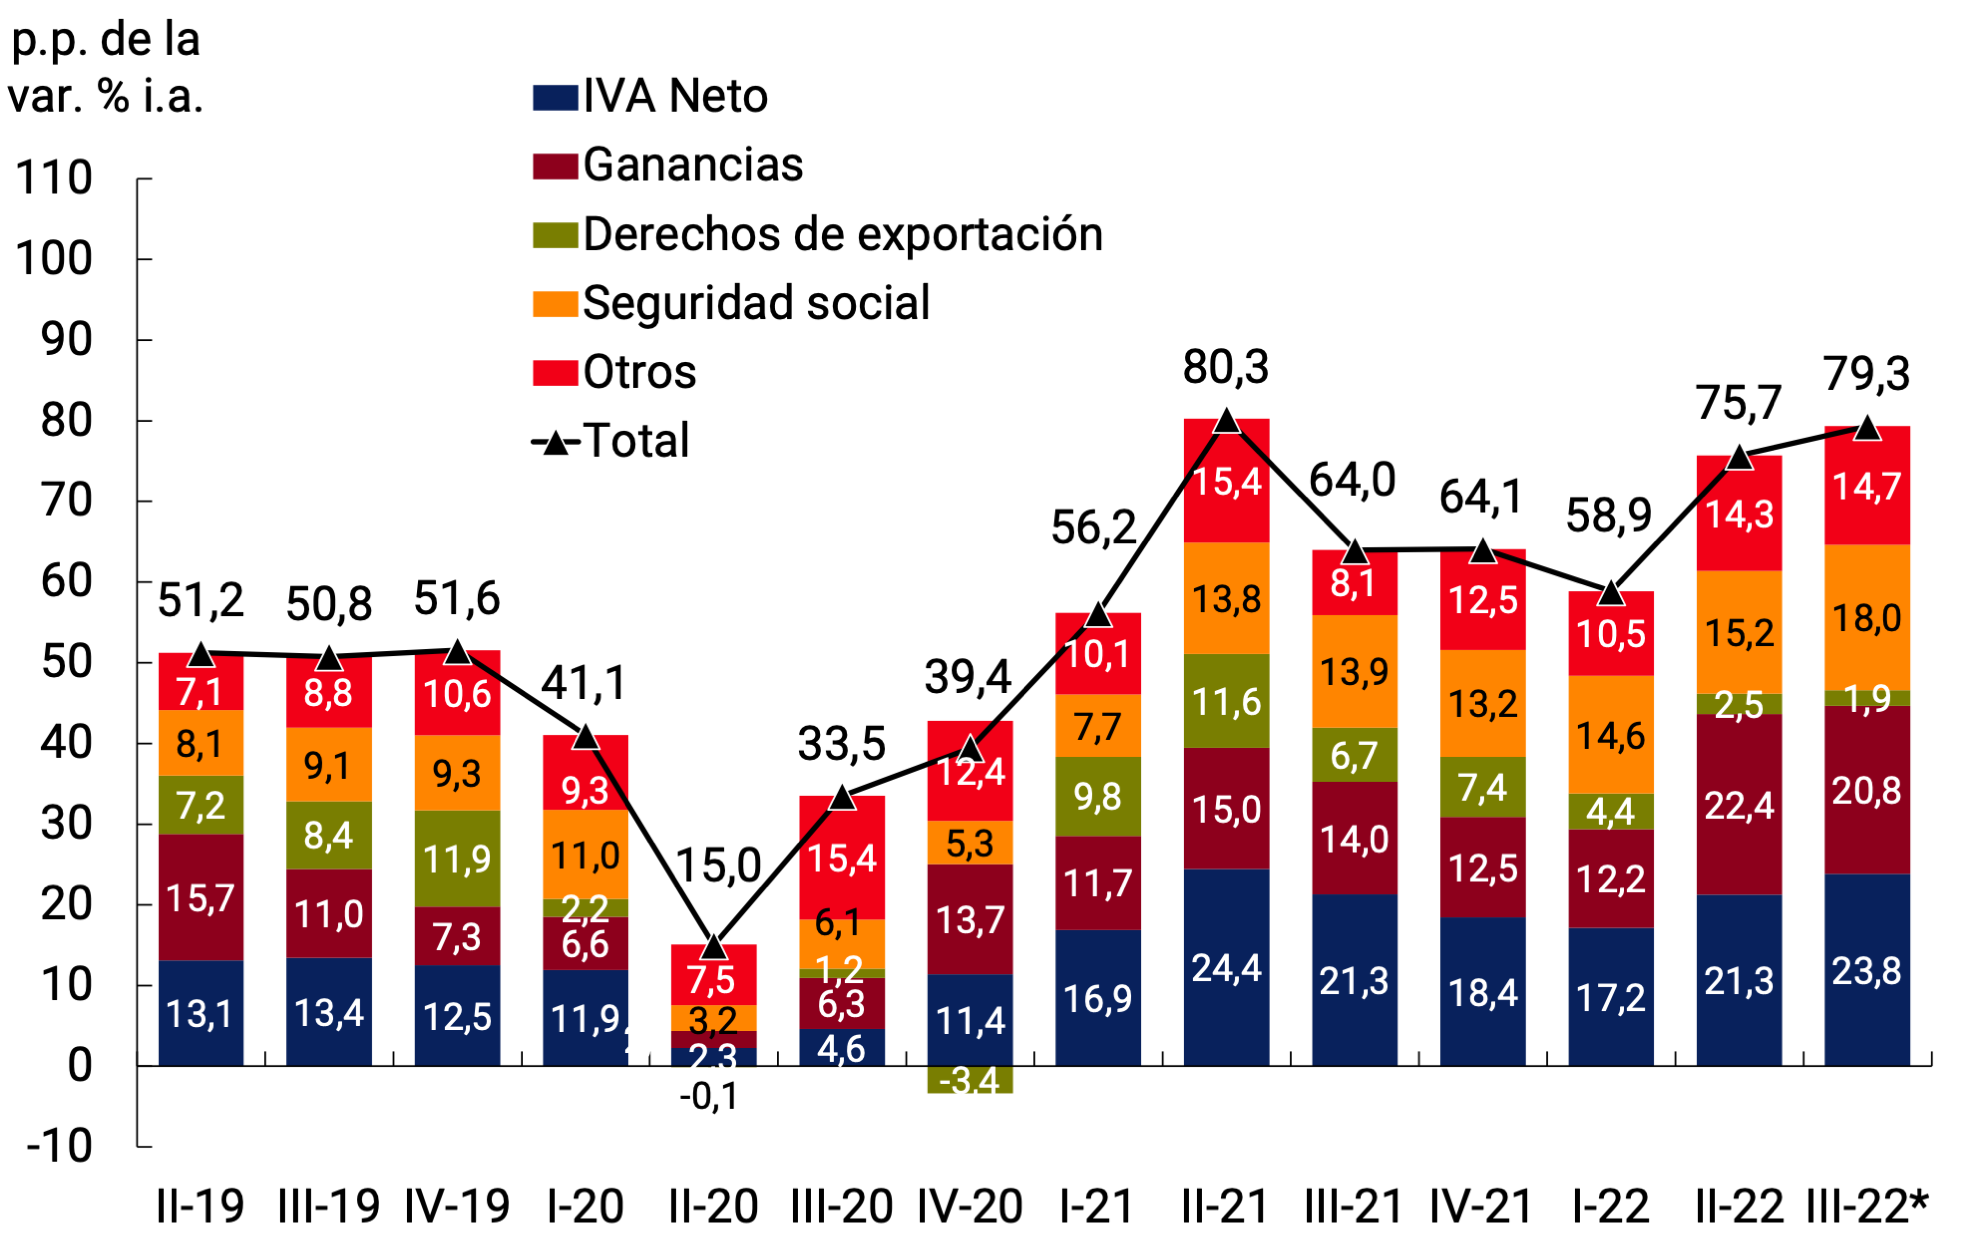
collection
* Data as of Aug-22.
Source: BCRA based on AFIP data.
The vast majority of taxes related to the domestic market (Value Added Tax (VAT), Profits, among others) continued to show a good performance between the end of the second and the beginning of the third quarter due to the maintenance of the recovery of economic activity. Net VAT grew 73.6% YoY in the second quarter and 84.4% YoY with partial data in the third. On the other hand, the Tax on credits and debits in bank accounts advanced 71.2% YoY and 83.8% YoY in the second and third quarters to August, respectively. The exemption to the Health sector operated negatively on this tax until June. The income tax showed great dynamism: it grew 100.1% YoY between April and June and 97.9% YoY between July and August. This is explained by improvements in the labour market, as well as by better results of companies with a balance sheet closure in December 2021 compared to the previous period. Likewise, an increase of 10 percentage points (p.p.) in the withholding on account of taxes on Income and Personal Assets for the consumption of foreign currency for travel and expenses abroad14.
Other taxes continued to show a more irregular advance: Internal Taxes grew 54.3% YoY between April and June and 80.7% YoY between July and August, while Fuels advanced only 30.5% YoY and 9.0% YoY in the same periods, mainly due to the delay in updating the tax. On the other hand, Personal Assets advanced 64.9% YoY and 41.4% YoY in the second and third quarters, respectively, affected in part by a high base of comparison due to different temporality in maturities in 2021 and 2022.
Social security resources, driven by improvements in the labour market (see Chapter 3. Economic Activity and Employment), both due to increases in registered employment and improvements in the real formal wage, had an increase of 77.1% y.o.y. between April and June and 80.2% between July and August. It is worth adding that these resources were negatively impacted by the measures taken by the National Government – in force until June 2022 – which reduced employer contributions in the health sector, to the critical sectors contemplated in the REPRO program and to companies located in the provinces of the Norte Grande.
Import duties and the statistical tax showed a joint increase of 67.4% y.o.y. during the second quarter and 90.7% y.o.y. in the third. This behavior was explained by higher imported values (see Chapter 4. External Sector). Finally, export duties had a more limited performance: +25.7% YoY between April and June and +22.8% YoY between July and August, in a context of drought that affected agricultural production, which was partly offset by the favorable international context for international prices of the main export products and the recovery of external demand. However, these prices were reduced at the margin. Effective during the month of September, the Export Increase Program15 was created to stimulate the commercialization of soybeans, with an effect on the collection of duties. The program also seeks to improve the reality of producers, help regional economies and strengthen reserves.
Figure 5.2 | Real national tax collection seasonally adjusted
*Data as of Aug-22.
Source: BCRA based on data from the Ministry of Economy and INDEC.
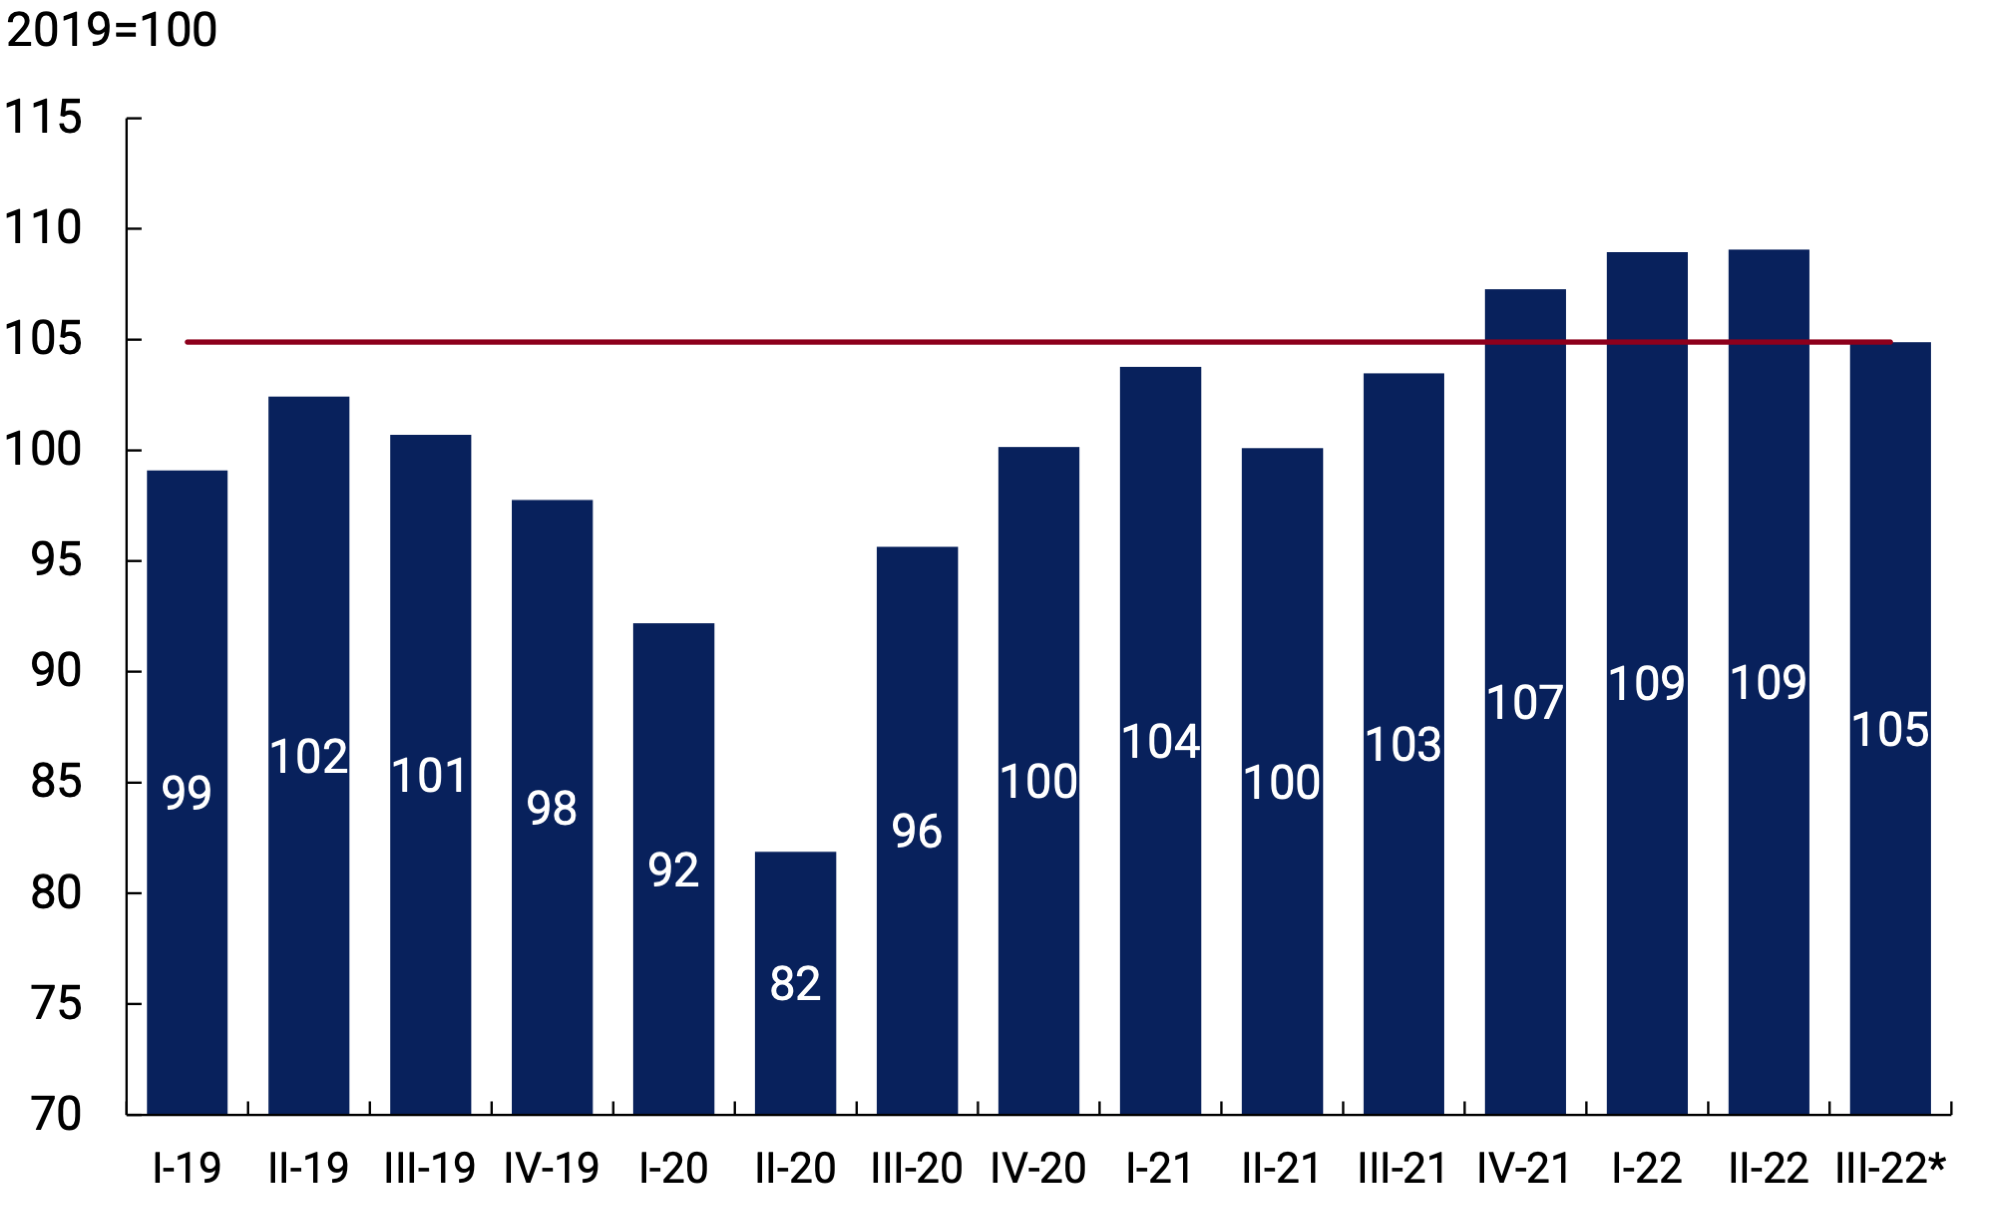
In real terms, seasonally adjusted national tax collection grew 0.1% in the second quarter of 2022 and fell 3.8% during the third quarter with partial data to August. In any case, this indicator was 5.0% above the level shown in 2019 between July and August (see Figure 5.2). This performance reflects the maintenance of the consolidation of tax revenues after the adverse effects of the COVID-19 pandemic. It should be noted that in relation to 2019, the tax structure had been modified at the end of 2019, mainly from the creation of the PAIS Tax, the changes in the export duty rates and on the Personal Property Tax, as well as the revision of the tax reform promoted during 2017 that affected social security resources. All this explains a higher real collection.
The evolution of tax revenues allowed the total revenues of the National Non-Financial Public Sector (NFPS) to increase in nominal terms by 63.6% YoY in the second quarter (+1.8% YoY in real terms) and 78.3% YoY in the third quarter (+2.2% YoY in real terms, with partial data as of Aug-22). The performance of resources was positively influenced by the higher record of property income linked to the primary issuances of public securities in 202216 and negatively by the record of non-tax income from the Solidarity and Extraordinary Contribution to help mitigate the effects of the pandemic during 2021 as of May. Net of these effects, funds would have shown a nominal increase of 75.7% YoY in the second quarter and 77.3% YoY in July and August. Tax and social security revenues increased by 70.5% YoY in the second quarter and 76.6% YoY in the third quarter with data as of August.
Meanwhile, tax collection in all provinces showed a similar behavior to that observed at the national level. According to the partial information available, in the second quarter of the year the nominal advance of own tax resources would have shown an increase of around 70% y.o.y., while at the beginning of the third quarter it would have expanded by about 80% y.o.y.
5.2. The fiscal order had a positive impact on the results of July and August
In line with the provisions of the Ministry of Economy in the sense of ordering the public accounts to comply with the current budget, during July and August public revenues grew above primary spending, reaffirming a fiscal path compatible with an annual deficit of the NFPS on a cash basis of 2.5% of GDP.
Among other measures, the freezing of the staff for all sectors of the National Public Administration was reinforced, reaching this limitation to decentralized public companies. Likewise, the current budget appropriations17 were adjusted in order to reflect the execution currently projected, seeking to contribute to the fulfillment of the fiscal order objective. In addition, measures were provided to segment the rates of public services (electricity, gas and water), which will generate savings in the associated subsidies. Meanwhile, a program began to be implemented that will seek the gradual incorporation into private sector jobs of current beneficiaries of social plans. On the other hand, priority was given to expenses related to the construction of the gas pipeline that will contribute to generating significant savings in the future.
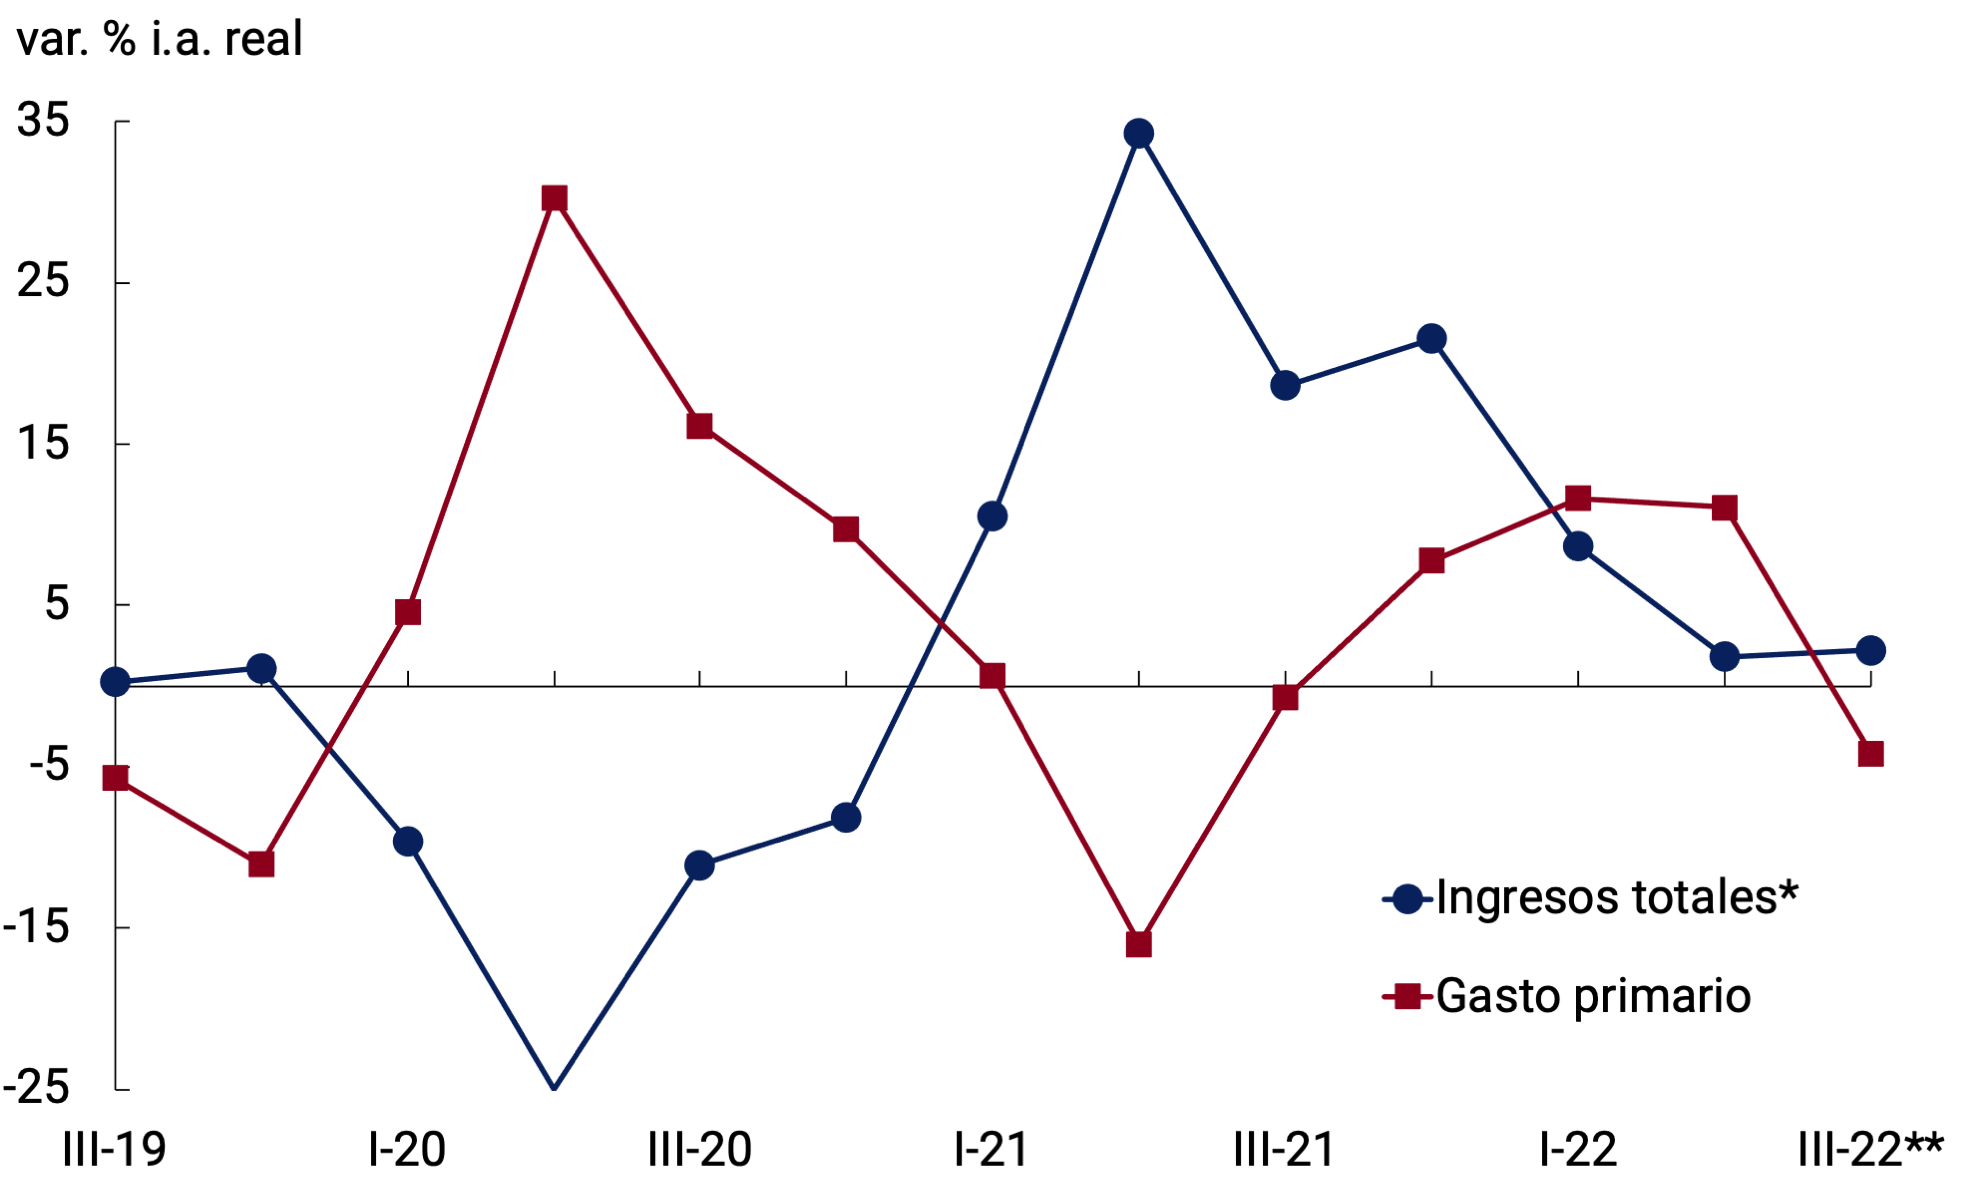
Thus, NFPS primary expenditure exhibited a nominal increase of 67.5% y.o.y. during the third quarter of 2022 —with data as of Aug-22—, 11 p.p. below the nominal advance of revenues in the same period. Therefore, during the third quarter, real primary expenditures would be contracting 4.2% compared to the same period in 2021, after having an expansion of 11.1% real y.o.y. in the second quarter (see Figure 5.3).
Figure 5.3 | NFPS
Real Primary Income and Expenditures
* Net of Special Drawing Rights (SDR) Allocation in Sep-21.
** Data as of Aug-22.
Source: BCRA based on data from the Ministry of Economy and INDEC.
Real spending advanced during the second quarter, compared to a year ago, mainly driven by social benefits, salaries and capital spending. This evolution reflected the National Government’s impulse to implement extraordinary reinforcements of household incomes in the face of the impact of the acceleration of the general price level. As of the third quarter of the year, the measures announced in relation to the ordering of public accounts began to take effect. The reduction in primary public expenditure in real terms in the months of July and August was proof of this.
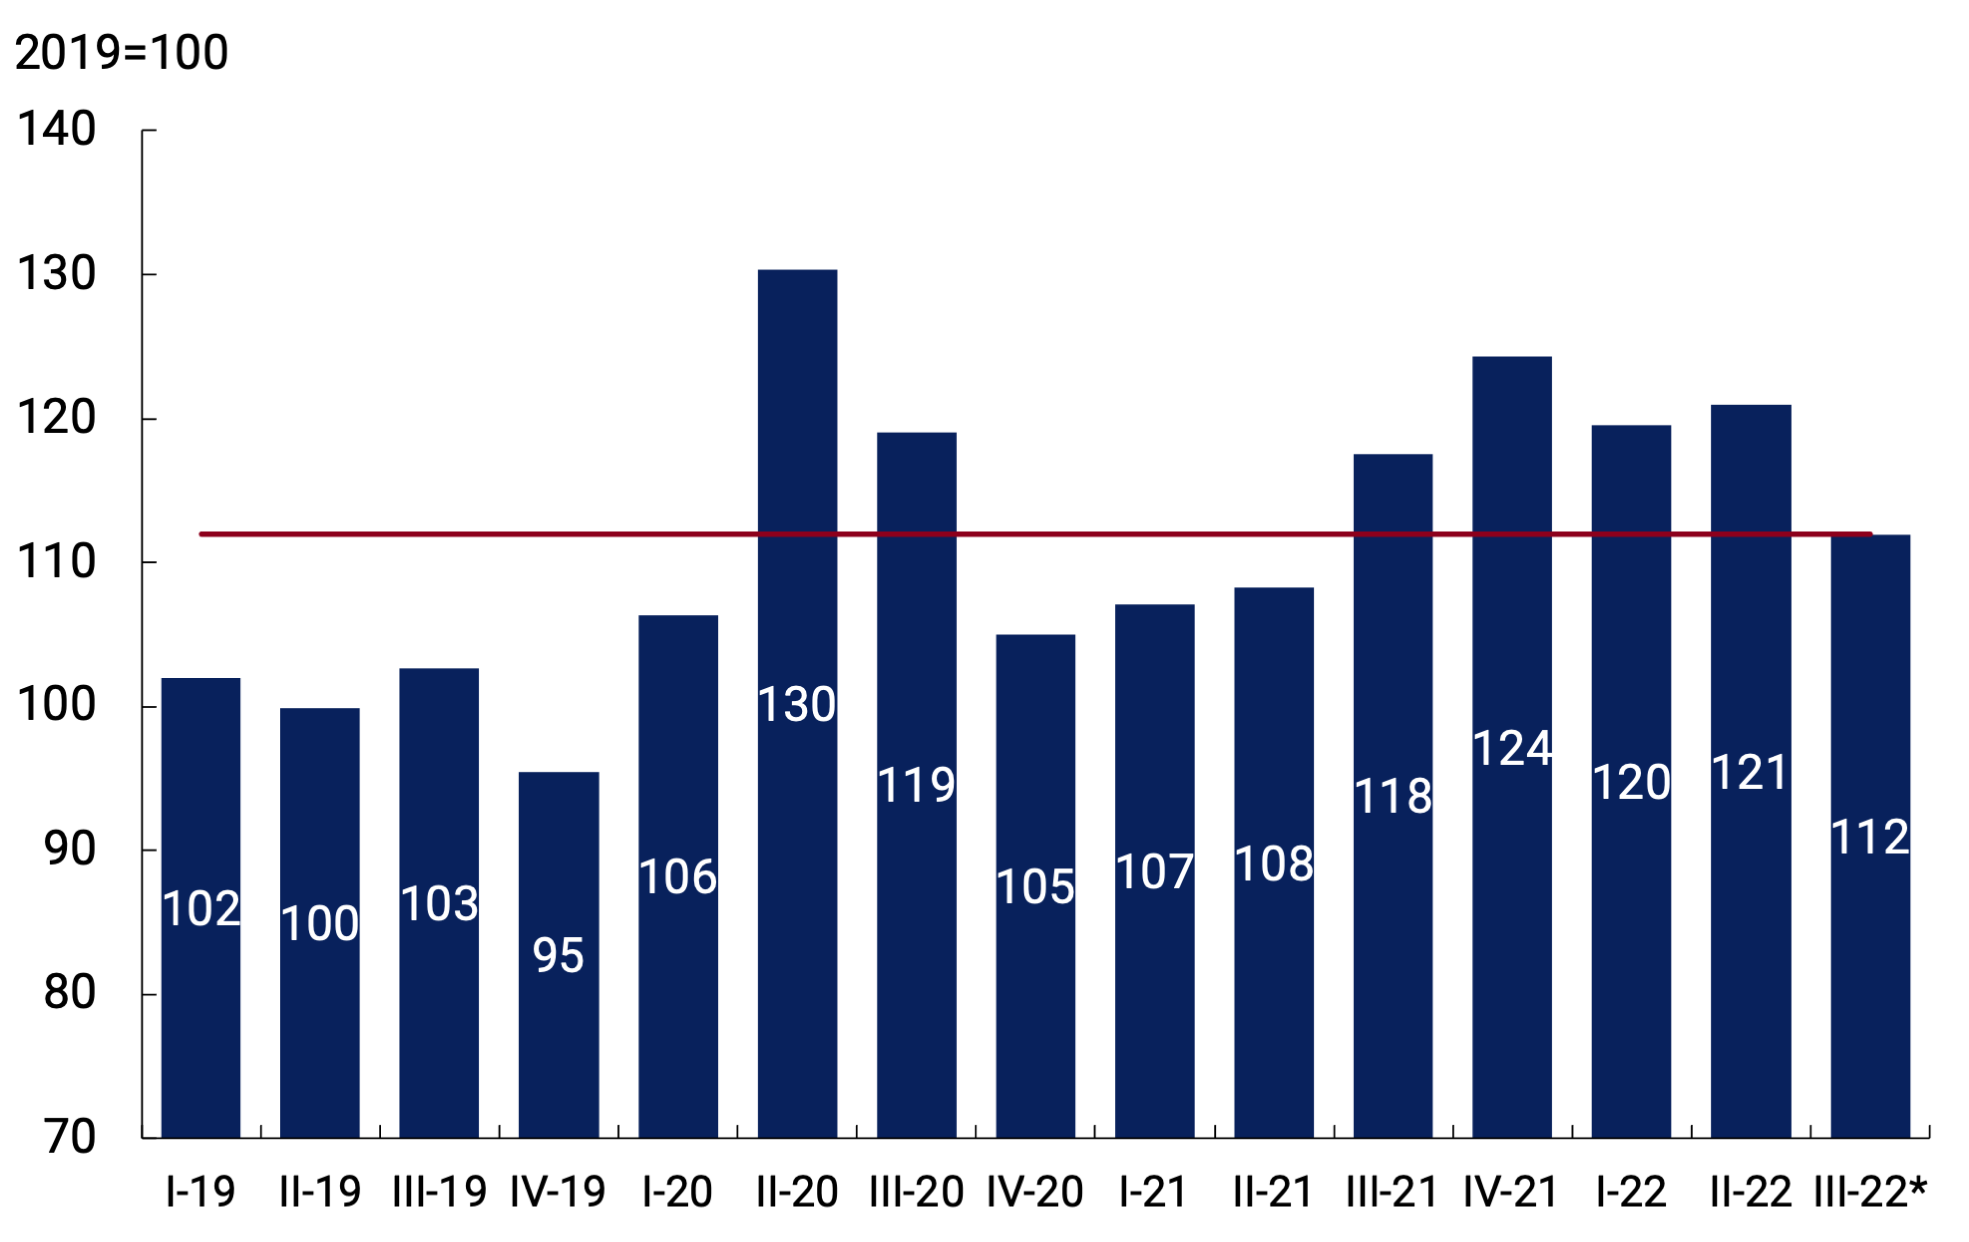
In this sense, seasonally adjusted real primary expenditure contracted compared to the previous two quarters. However, it is still 12% above the average for 2019 (see Figure 5.4).
Figure 5.4 | Real seasonally adjusted primary expenditure of the NFPS
*Data as of Aug-22.
Source: BCRA based on data from the Ministry of Economy and INDEC.
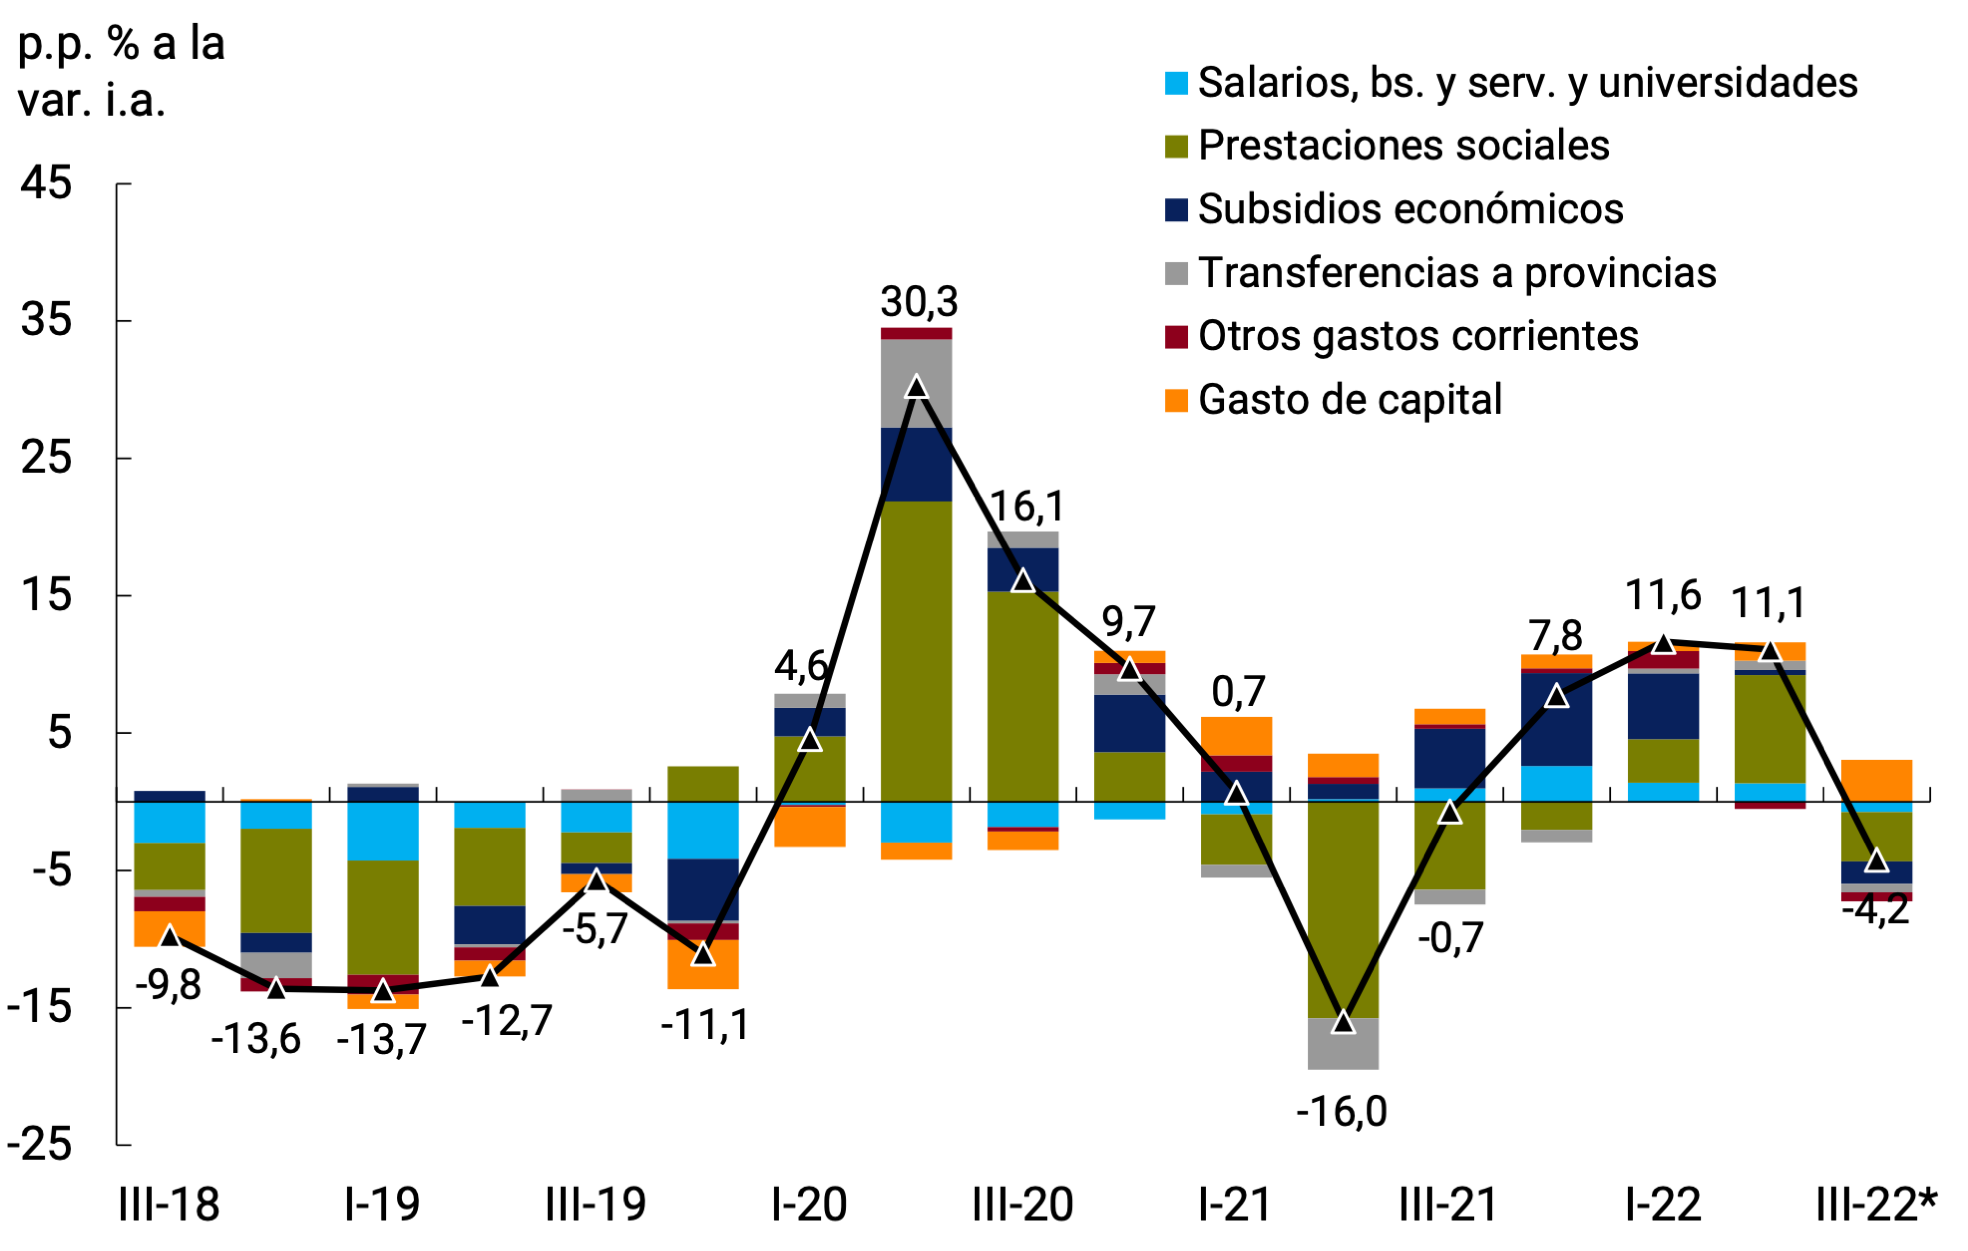
Among the main items of expenditure that explain this evolution during the third quarter are social benefits and expenditures on economic subsidies (see Figure 5.5). Expenditure on social benefits had increased by 13.7% y.o.y. in real terms in the second quarter, especially driven by expenditures on transfers in aid to people due to the income reinforcement policies carried out by the National Government to protect and improve the purchasing power of households in the face of rising food prices.
Figure 5.5 | Contribution to real growth of NFPS
primary expenditure
*Data as of Aug-22.
Source: BCRA based on data from the Ministry of Economy and INDEC.
Pension benefits (retirements and pensions) increased by 4.4% YoY in real terms in the second quarter of the year and would have contracted by 3.6% YoY during the months of July and August, without taking into account the reinforcement of income paid in those months to those who receive lower benefits. This behavior is influenced by the fact that the Pension Mobility Law18 established a variation of 62.7% y.a. in salaries as of June, 1.3 p.p. lower than the accumulated inflation during the same period. In September, the more than 7 million people who are holders of retirements and pensions will have received their pension benefits with the increase of 15.53% corresponding to the third quarterly increase in the year provided for by the Pension Mobility Law19. Along with this increase, a monthly reinforcement of $7,000 will be paid in the months of September, October and November for more than 6 million retirees, pensioners, and pensioners. The quarterly increase also includes family allowances, including the Universal Child Allowance (AUH) and Pregnancy Allowance, impacting the income received by almost 9 million children and adolescents. As for the remaining social benefits, these expenditures had a reduction in real terms during July and August, after a strong real boost in the second quarter (36.7% YoY).
The Empower Work, Food Benefit and Progress programs continue to be the three main policies for assistance to the population in vulnerable situations, with coverage of 1.3 million, 2.4 million and 1.5 million benefits, respectively. It is worth noting the increase in the amounts of the benefit received by the beneficiaries of the Empower Work program due to the advance to August of the 45% increase in the SMVM initially planned for December and the 21% increase between September and November, to which were added bonuses of $6,000 in April and $11,000 in August. Regarding the Food Benefit, in May the amounts were increased by 50%, standing at $9,000/$13,500/$18,000 depending on 1/2/3 or more dependent children. In relation to the Progresar program, since December 2021, coverage was extended to young people from 16 to 17 years old, until then limited to the 18 to 24 age group, and the amount of scholarships was increased by 50%, in addition to an extra sum of $1,000 per month for connectivity. On the other hand, in August, the minimum amount of the scholarship for all lines of the program was raised from $6,400 to $7,400 and the “Training and certification in foreign languages” Program was created for scholarship recipients of the Progresar and the Manuel Belgrano Strategic Scholarships. The program will offer courses and at the end of them the beneficiaries will receive a bonus of $6,000.
In addition, with the creation of the Export Increase Fund20, it is envisaged that an extraordinary non-contributory monetary benefit of national scope will be implemented to ensure adequate food for people in situations of extreme vulnerability, in addition to programmes that stimulate the production and development of small and medium-sized producers and regional economies. Also recently, the Bridge to Employment21 Program was created, which aims to gradually transform social, educational, and employment programs into quality registered work with a federal criterion; improve employability and the generation of new productive proposals and promote the full social inclusion of those people who are in a situation of social and economic vulnerability. Individuals and employers in the private sector that hire new personnel will be able to allocate for 12 months the monetary allocation of social, educational or employment programs on account of the payment of remuneration, and may benefit from the 100% reduction of employer contributions financed by the National Treasury.
On the other hand, the rising costs of energy and fuels – as a result of the war in Ukraine – and the higher domestic costs of electricity production due to the lower contribution of hydroelectric generation (in a context of low rivers due to drought), led to economic subsidies explaining a growing portion of primary expenditure during the first half of the year. This increase in participation was due to a greater extent to the increase in expenditure associated with energy subsidies than to subsidies for public passenger transport.
With regard to electricity and gas tariffs, once the subsidy segmentation processwas completed 22, a scheme for the gradual removal of subsidies was regulated, defining three segments of users, classified by the Ministry of Energy according to objective criteria. Those with higher incomes will pay the full cost of electricity and natural gas services. There will be a harmonization process and the subsidy removal will be carried out in three stages, so that people within this segment will find themselves paying the full cost of energy at the beginning of next year. Secondly, for the lower-income segment, energy increases may not exceed 40% of the increase in the Wage Variation Coefficient (CVS) of the previous year and those who have a “social tariff” will keep the subsidy in its entirety. Finally, for middle-income users, the subsidized tariff will remain in force up to consumption of 400 kWh per month, in the case of electricity, and above that limit, they will begin to pay the full rate for incremental consumption. In the case of gas, the subsidy reduction will be made by region, based on climatic differences and distribution costs, as well as seasonality. With these measures, savings in the energy subsidies item are expected to be quite limited for 2022 but around 0.7% GDP in the case of 2023.
Items associated with remuneration (including transfers to National Universities) increased in real terms by 8.2% YoY in July and August (+9.6% YoY during the second quarter), while expenditure on goods and services and other current expenditures fell sharply, 36.4% YoY. It should be noted that this last item includes expenditures associated with the purchase of vaccines against COVID-19 during 2021 and expenses associated with the organization of the National Census in 2022, among others. On the other hand, current transfers to theprovinces 23 fell in real terms during the months of July and August (-18.3% YoY) after having boosted their rate of increase in the first half of the year (+10.6% YoY in real terms during the first quarter and 21.2% YoY in real terms in the second quarter).
Capital spending, in line with the definition of priorities set out to sustain the recovery of economic activity, grew 21.0% YoY in real terms during the second quarter and 53.7% YoY in July and August. Among these investments, the prioritization of the work of the new Néstor Kirchner gas pipeline carried out by Energía Argentina (formerly IEASA) and, to a lesser extent, that carried out by the Railway Infrastructure Administration (ADIF) stands out. With regard to Capital Transfers to the Provinces, the increase in the Trust Fund for Social Housing, the Water Infrastructure Trust Fund and the Fund for Socio-Urban Integration stands out.
Figure 5.6 | Fiscal result of the NFPS
Accumulated 12 months
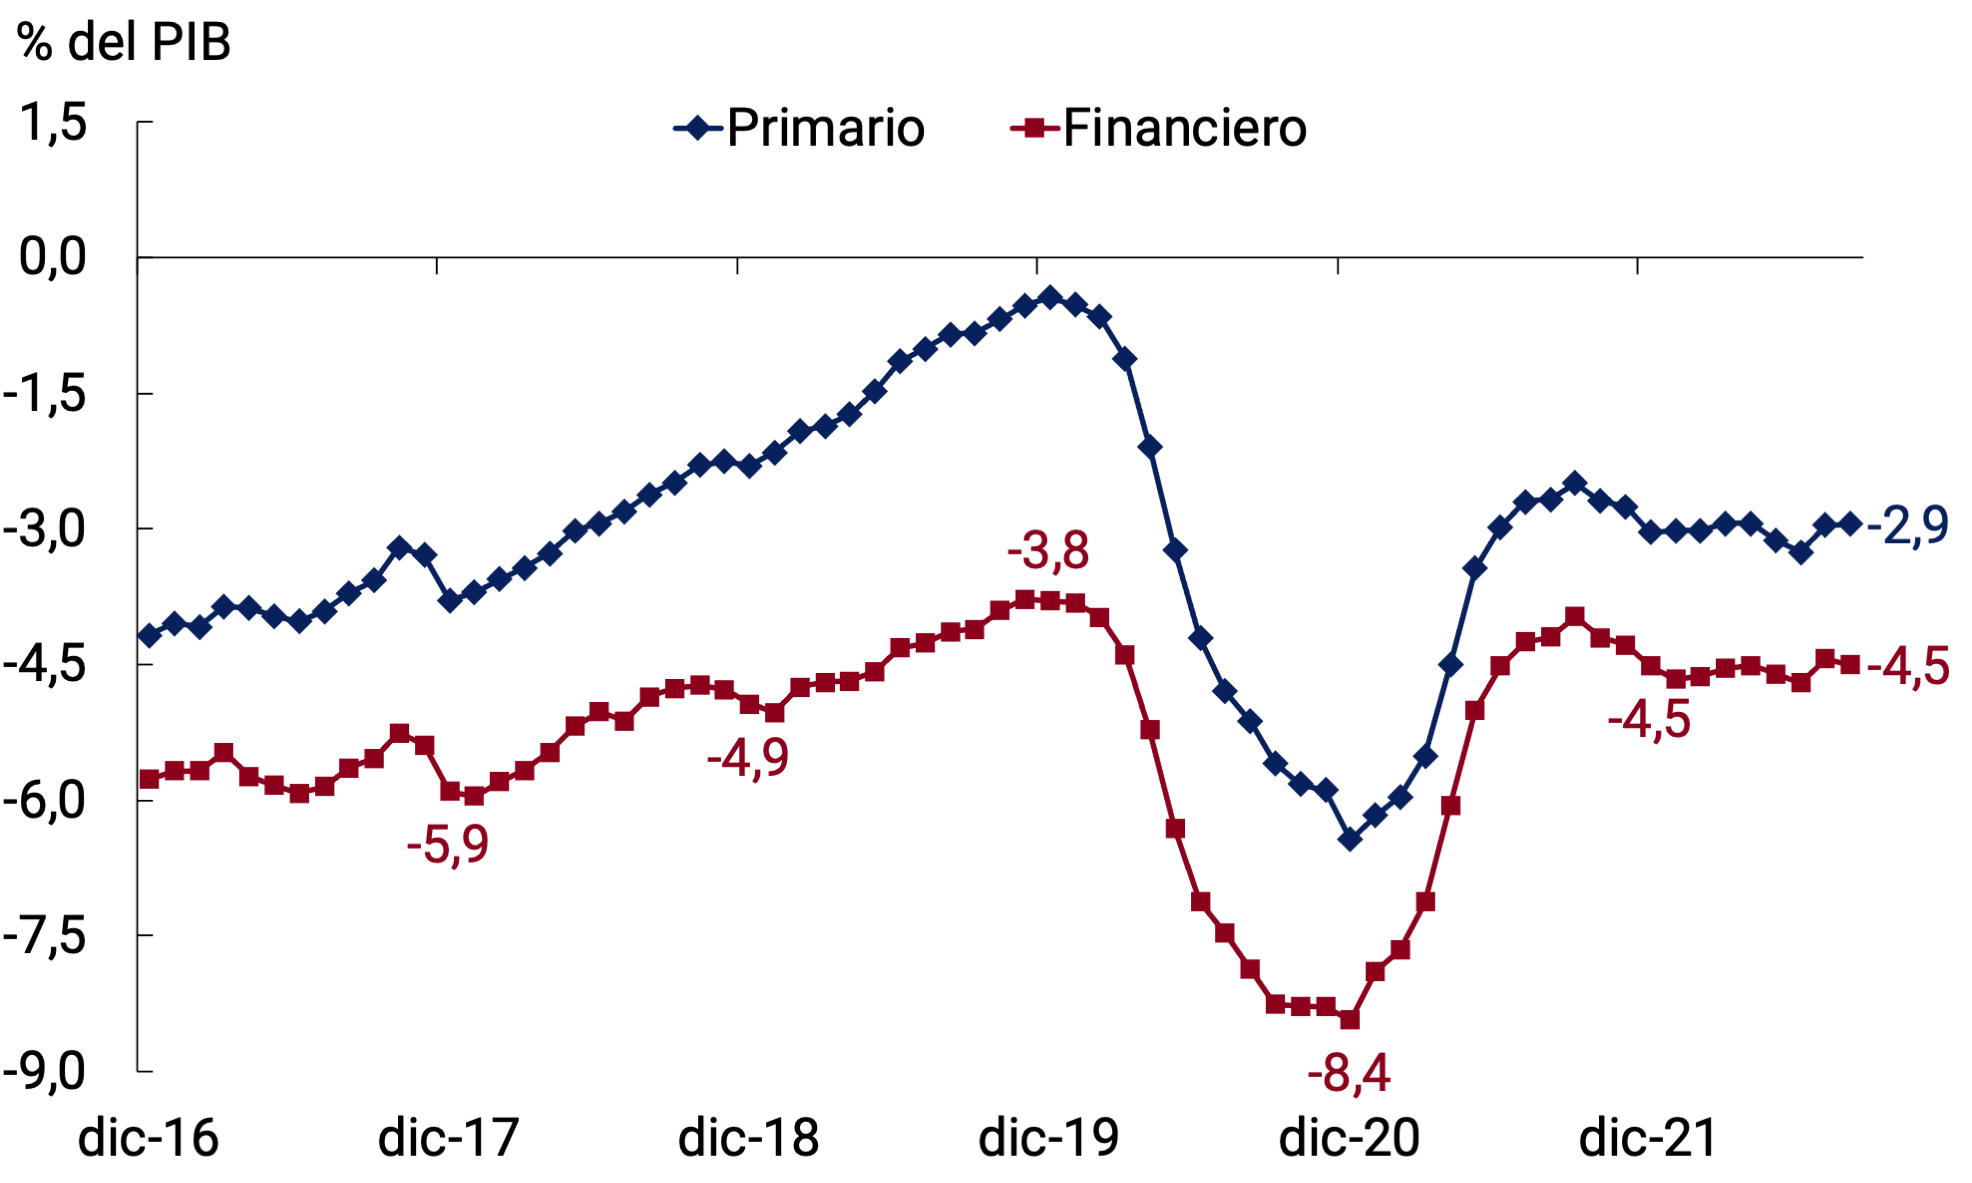
Note: the allocation of Special Drawing Rights (SDRs) of the IMF for $427,400 million in Sep-21 are excluded among the Income.
Source: BCRA based on data from the Ministry of Economy and INDEC.
Considering that in the first eight months of 2022 NFPS revenues grew 68.7% YoY (4.3% YoY in real terms), and that primary expenditures advanced 72.9% YoY (+7.1% YoY in real terms), the primary deficit of NFPS accumulated in the year is approximately 1.3% of GDP, around2.9 % of GDP 24 in the last 12 months (see Figure 5.6). For its part, the financial deficit of the accumulated NFPS stood at 2.3% of the estimated GDP of 2022, approximately 4.5% considering the last 12 months.
The fiscal strategy allowed the fulfillment of the NFPS primary result target established within the Extended Facilities Program (PFE) with the International Monetary Fund (IMF) for the second quarter of the year. In the first eight months of 2022, if the annual limit for the calculation of income from property income linked to primary issuances of public securities, equivalent to 0.3% of GDP (established for the purposes of the policy objectives contained in the Economic Program consistent with a primary deficit target of 2.5% of GDP), is considered, the primary deficit of the NFPS was $1.1 trillion (-1.3% of GDP). In turn, the National Government sent the Draft Budget Law for 2023 to the National Congress, adapting it to the conditions of the current macroeconomic context, contemplating convergence to a primary deficit for next year of 1.9% of GDP after a deficit balance of 2.5% of GDP this year (see Section 4 / Main aspects of the 2023 National Budget Bill).
5.3. After overcoming an episode of volatility in the sovereign debt market, the Treasury regained access to financing in the domestic market
At the beginning of June, an event of financial volatility took place that generated tensions in the sovereign debt market in local currency. The extraordinary intervention by the BCRA in the secondary public debt market to preserve financial stability, the successful implementation of a short-term debt swap and the increase in rates implicit in the auctions of the demanded instruments managed to stabilize the market.
So far in 2022, the TN achieved a refinancing of 139.2% of principal and interest services, which implied a net financing of approximately $1,530,005 million. It should be noted that, in the accumulated months of July, August and September, a significant refinancing of 217.7% of principal and interest services was obtained, which implied a net financing of approximately $881,177 million.
Issuances of public debt instruments so far in the third quarter were mainly concentrated in discount bills and securities adjustable by reference stabilization coefficient (CER), while, to a lesser extent, securities adjusted to the evolution of the dollar and at a variable rate were placed.
The length of maturities of instruments issued at a discount increased, while that of those tied to the evolution of the CER decreased at the margin. This situation was mainly driven by the increase in the interest rate, which, considering discount bills as a reference, went from granting an average APR of 57% in June to remunerating with an average APR of 83% in September.
For its part, during the months of June, July and August 2022, voluntary debt conversion operations were carried out, which significantly decompressed the profile of short-term maturities. The latter was of greater importance since it managed to decompress most of the maturities of August, September and October 2022 by granting in exchange dual instruments (tied to the greater evolution between inflation and exchange rate) which mature in June, July and August 2023.
So far in 2022, and in line with the budgetary forecasts under the agreement with the IMF, the net financing of the NT included, in addition to the financing obtained in the tenders of market instruments and by the net disbursements of the IMF and other international financial institutions, the net transfer of $620,051 million of Transitory Advances (AT) of the BCRA. It is worth noting the net cancellation of $10,000 million of AT in August and the commitment by the Ministry of Economy not to make additional requests from this source for the rest of 2022.
With the aim of developing the local peso debt market, the participation of the 2021 Aspiring Market Makers continued to be strengthened, and short-term investments continued to be offered to the Mutual Funds (FCI) from the auctions of Treasury Liquidity Bills (LELITES; very short-term and highly liquid instruments intended exclusively for subscription by FCI).
The stock of National Public Debt at the end of August 2022 reached approximately US$381,070 million and represented about 78.5% of GDP, exhibiting a reduction of about 11 p.p. compared to the end of 2019.
Back to top
6. Pricing
After the acceleration of the general price level during March (6.7%) and April (6.0%), which had been driven mainly by the rise in international commodity prices, monthly inflation rates began to fall gradually in May and June (5.2% on average). This slowdown was most marked in the Core category (from 6.7% in April to 5.1% in June). The second quarter of the year thus ended with an average monthly inflation of 5.5% (+0.4 p.p. compared to the previous quarter). However, the incipient downward trend in monthly inflation rates was interrupted in July as a result of an increase in local financial volatility, greater exchange rate uncertainty, and the consequent increase in inflation expectations.
In this context, price increases occurred in a large number of goods and services simultaneously, with a level of diffusion and coordination that is usually only verified in episodes of jumps in the official exchange rate. As a result, the inflation rate rose sharply in July to 7.4% on a monthly basis (+2.1 p.p. compared to June), reaching the highest figure since April 2002. In August, monthly inflation (7.0%) fell compared to the previous month, although it remained at a higher level than that observed in June, to a certain extent due to the carry-over effect of increases that occurred in July. The year-on-year inflation rate also rose to 78.5% in the eighth month of the year.
The National Government and the BCRA adopted a series of measures to face financial volatility and contain inflation. The BCRA intervened in the secondary market for debt in pesos and repeatedly raised the monetary policy interest rate. Policies were also implemented to consolidate the process of reducing the fiscal deficit in order to reduce monetary financing needs, to encourage the liquidation of exports in order to strengthen the BCRA’s international reserves, and in addition, agreements were reached on reference prices on some sets of goods and services. The first results have been a recovery in the prices of bonds in domestic currency, an increase in the level of international reserves and a reduction in the exchange rates implicit in the quotations of public securities.
For the rest of 2022, a gradual reduction in core inflation is expected in response to greater exchange rate stability, which would contrast with an acceleration in seasonal and regulated prices, especially in September and October. The gradual approach envisaged for the process of reducing core inflation contemplates certain factors that would operate in the opposite direction, such as high inflation expectations, bringing forward and concentrating wage parity agreements, and possible second-round effects of updates to public service and fuel rates.
The National Government and the BCRA will continue to adopt measures to lower inflation, anticipating a context of greater domestic financial stability. The BCRA will conduct its monetary policy by adjusting interest rates to keep them in positive territory in real terms, without granting financial assistance to the National Treasury for the remainder of the year, managing liquidity in an adequate manner to preserve monetary equilibrium and giving continuity to the crawling peg exchange rate scheme to maintain external competitiveness.
6.1. In a context of increased financial volatility, there were widespread and simultaneous price increases that raised the inflation rate in July and August
After the acceleration of the general price level during March (6.7%) and April (6.0%), which had been driven mainly by the rise in international commodity prices as a result of the war in Ukraine, monthly inflation rates began to gradually decline in May and June (5.2% on average). This slowdown was most marked in the Core category (from 6.7% in April to 5.1% in June). However, the second quarter of the year ended with an increase in the general level of inflation of 5.5% monthly average (+0.4 p.p. compared to I-22), explained by the evolution of the Core category 5.7% (+1.0 p.p.). The Seasonal category (5.1%, -2.8 p.p.) showed a slowdown, as typically happens in the second quarters, while Regulated prices maintained a similar pace to that of the first quarter (5.0%, +0.2 p.p.). Year-on-year inflation in the second quarter rose to 61.0% (+8.2 p.p. compared to I-22). The incipient downward trend in monthly inflation rates observed between April and June was interrupted in July as a result of an increase in local financial volatility, greater exchange rate uncertainty, and the consequent increase in inflation expectations (see Figure 6.1).
Figure 6.1 | CPI. Monthly and quarterly evolution of the General
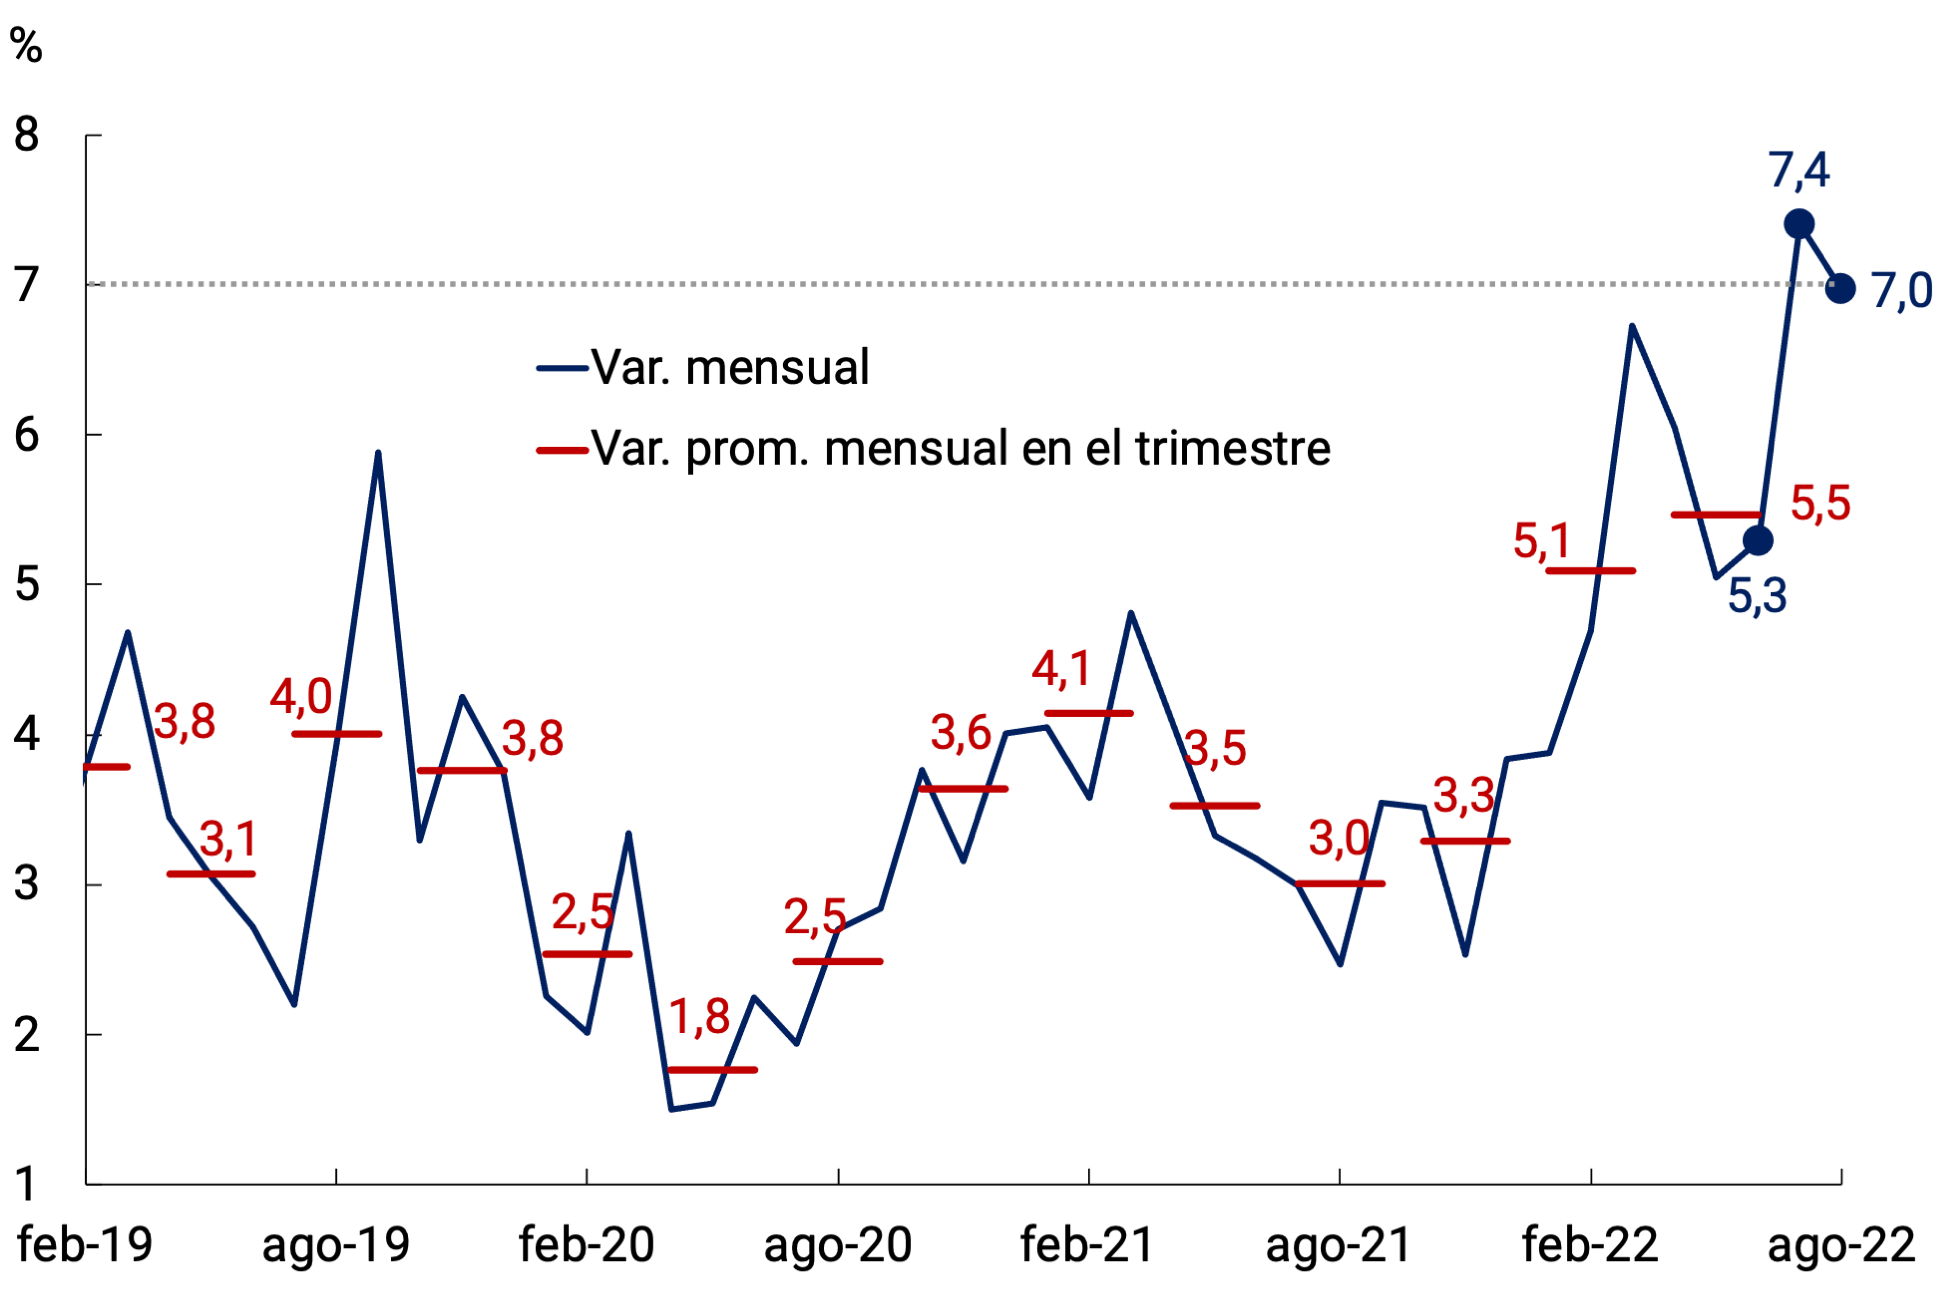
Level
Source: BCRA based on INDEC data.
In the first weeks of June, there were sharp falls in the prices of public debt bonds in domestic currency, which led to the intervention of the BCRA in order to stabilize its quotations in the secondary market (see Section 5 / BCRA intervention in the peso debt market). Then, at the beginning of July, there were significant increases in the exchange rates implicit in the quotations in the financial markets. In this context of greater exchange rate uncertainty and the consequent increase in inflation expectations, price rises were observed in a large number of goods and services simultaneously, with a level of dissemination and coordination that is usually verified only in episodes of jumps in the official exchange rate. As a result, the inflation rate registered a pronounced increase in July to 7.4% monthly (+2.1 p.p. compared to June), reaching the highest figure since April 2002. In August (7.0%), monthly inflation fell slightly, although it remained at a higher level than that observed in June, to some extent due to the carry-over effect of increases in July (see Figure 6.2). The year-on-year inflation rate also rose to 78.5% in August.
Figure 6.2 | CPI. Percentage of grouped according to magnification range*
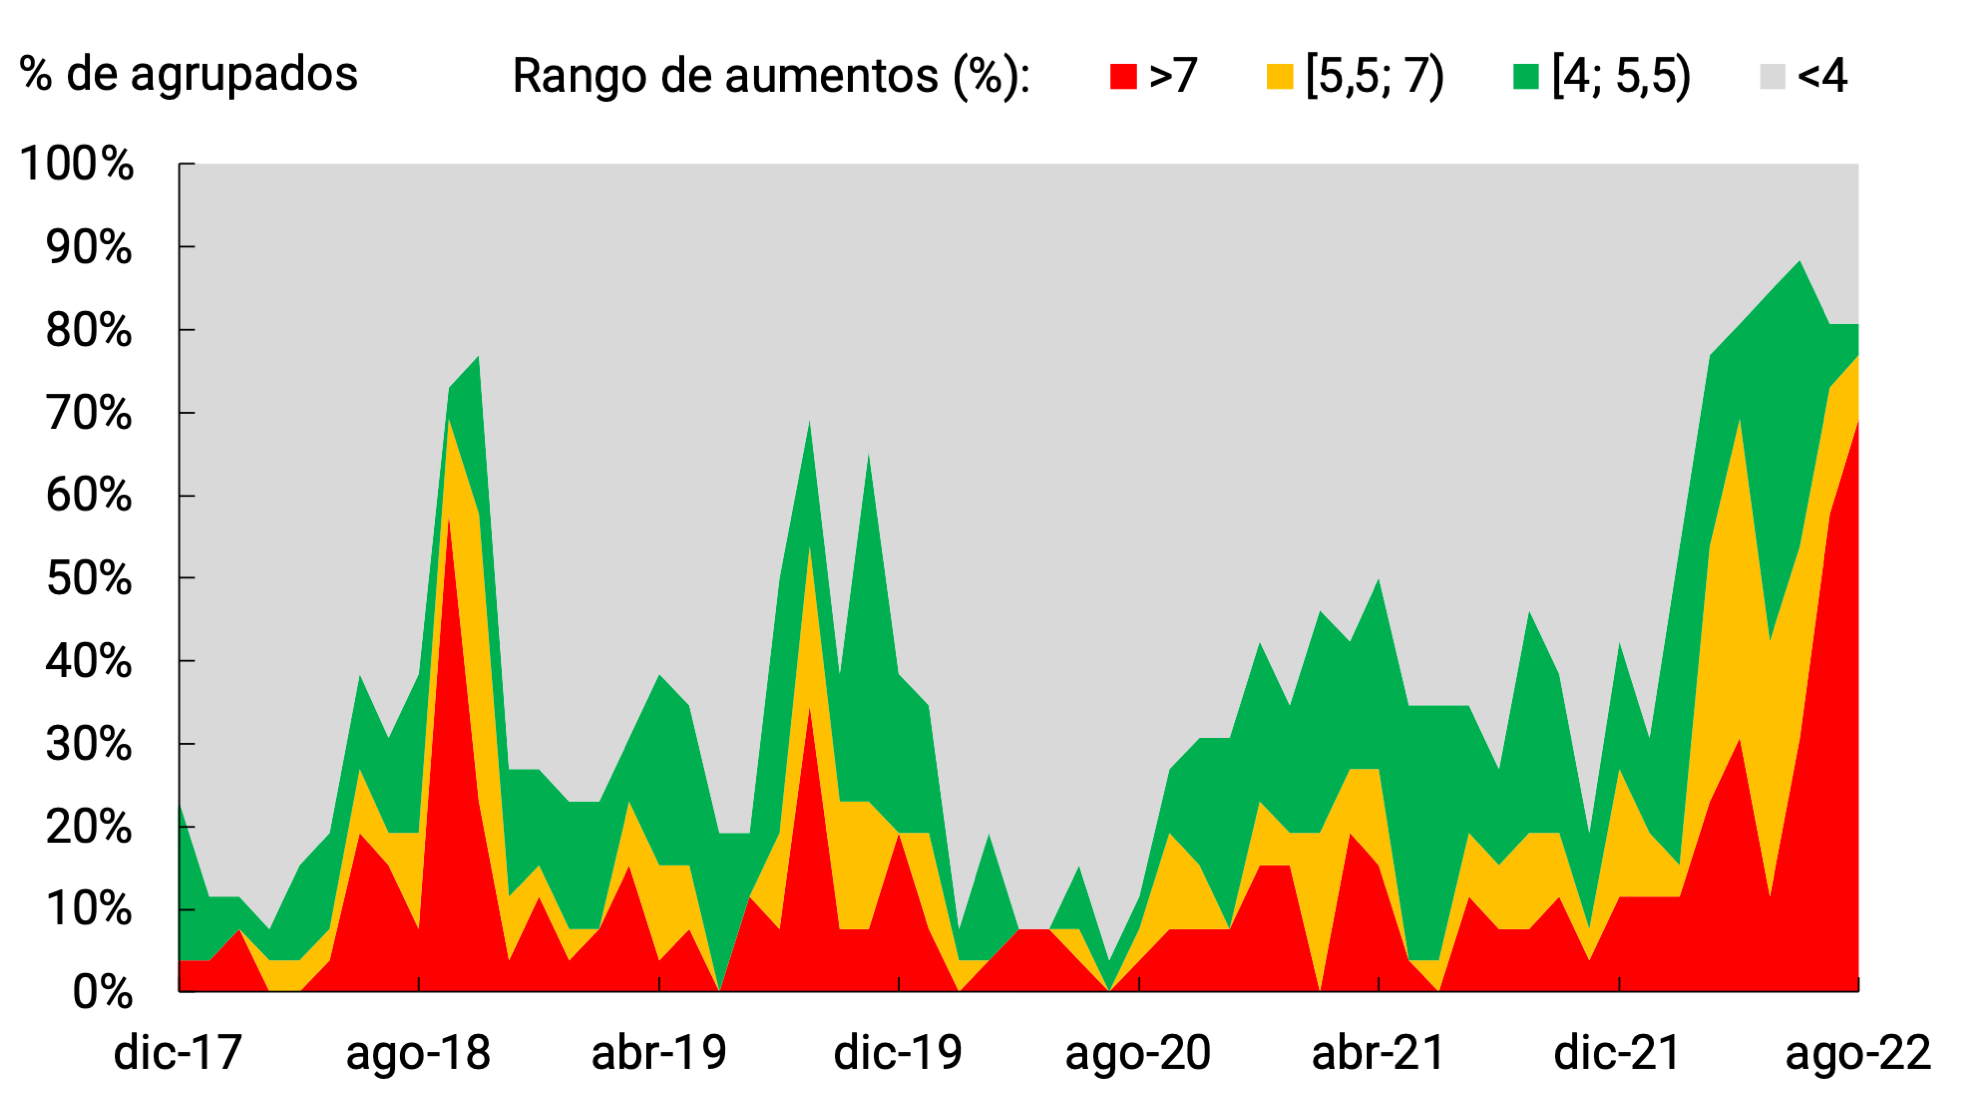
*Prepared based on CPI information considering the greater openness available. 26 groups were used, 9 of which belong to the Food and non-alcoholic beverages division. The series of Electricity, Gas and Other Fuels, Communication and Education were excluded.
Source: BCRA based on INDEC data.
The increase in inflation in July compared to June occurred both in the Core category (7.3%, +2.2 p.p.), with a higher incidence in the general level, and in Seasonal (11.3%, +4.7 p.p.). The acceleration of prices was widely spread among the goods and services that make up both categories, in the case of Seasonal goods there was a strong increase (around 30%) in services associated with tourism, higher than that typically observed in July during the winter recess. The reduction in monthly inflation in August (7.0%, -0.4 p.p. compared to July) was mainly explained by the slowdown in seasonal prices (8.7%, -2.6 p.p.), after the exceptional increase in July. For its part, the Regulated category maintained a relatively stable rate of increase during the June-August period (5.6% in July-August, +0.1 p.p. compared to June; see Figure 6.3).
Goods (7.4% average July-August, +2.2 p.p. compared to June) contributed to a greater extent than services in the acceleration of inflation in July and August compared to June. At the CPI divisions, among those made up entirely of goods, Food and non-alcoholic beverages (6.6% monthly average, +1.9 p.p. compared to June) was the one with the greatest contribution to the acceleration due to its greater relative weight, followed by Clothing and footwear26 (9.2% monthly average, +3.4 p.p.), with strong increases even in July, a month in which they typically remain stable within the framework of settlements due to the change of season. For its part, the Alcoholic Beverages and Tobacco division did not accelerate compared to June, but maintained a high rate of increase (6.7%, +0.0 p.p.). Among those grouped by goods, which belong to other divisions, the acceleration in Vehicle Acquisition (7.0%, +2.7 p.p.) and Newspapers, newspapers and magazines (10.4%, +5.7 p.p.) stood out. On the other hand, Medicinal products, appliances and equipment for health (5.7%, -1.4 p.p.) slowed down in the July-August period compared to June, as a result of the agreement between the Government and companies in the pharmaceutical sector27.
Figure 6.3 | CPI. Seasonal, Regulated and goods and services Core
Contributions in p.p. to the average monthly
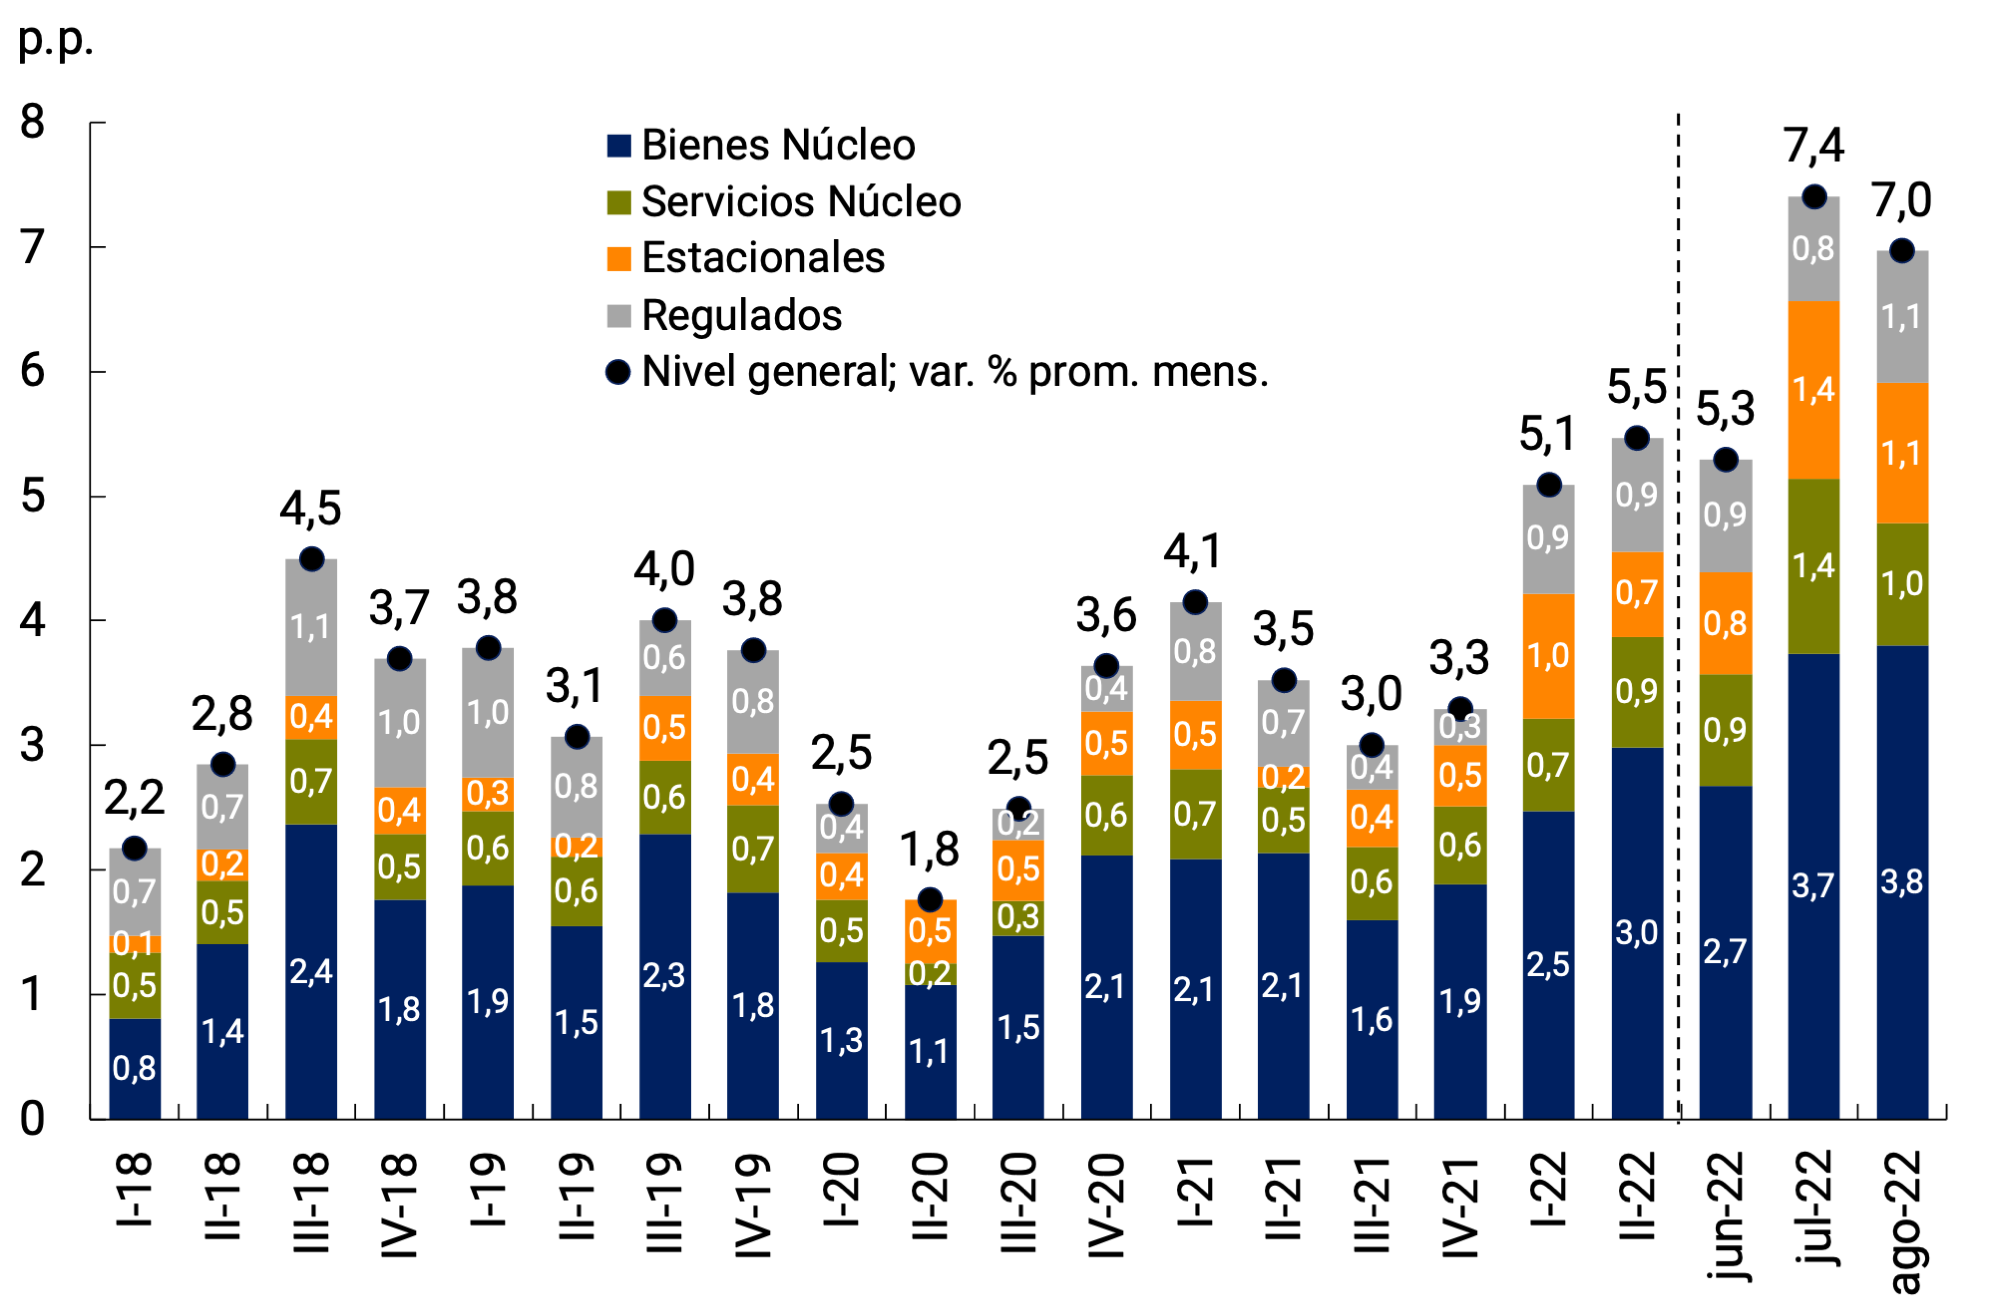
variation
Source: BCRA based on INDEC data.
In food, the highest rate of increase during July and August was verified in vegetables (monthly average 11.7%, +1.5 p.p.), fruits (8.8%, +8.3 p.p.) and packaged goods (7.9%, +2.7 p.p. compared to June). Among packaged foods, there was a widespread increase, with the largest increases in the grouped Sugar, sweets and others (11.2%, +4.9 p.p.), Oils, fats and butters (9.5%, +2.4 p.p.) and Milk, dairy products and eggs (8.3%, +3.9 p.p.; see Figure 6.4).
Figure 6.4 | CPI Food and non-alcoholic
beverages Contributions in p.p. to the average monthly variation by component
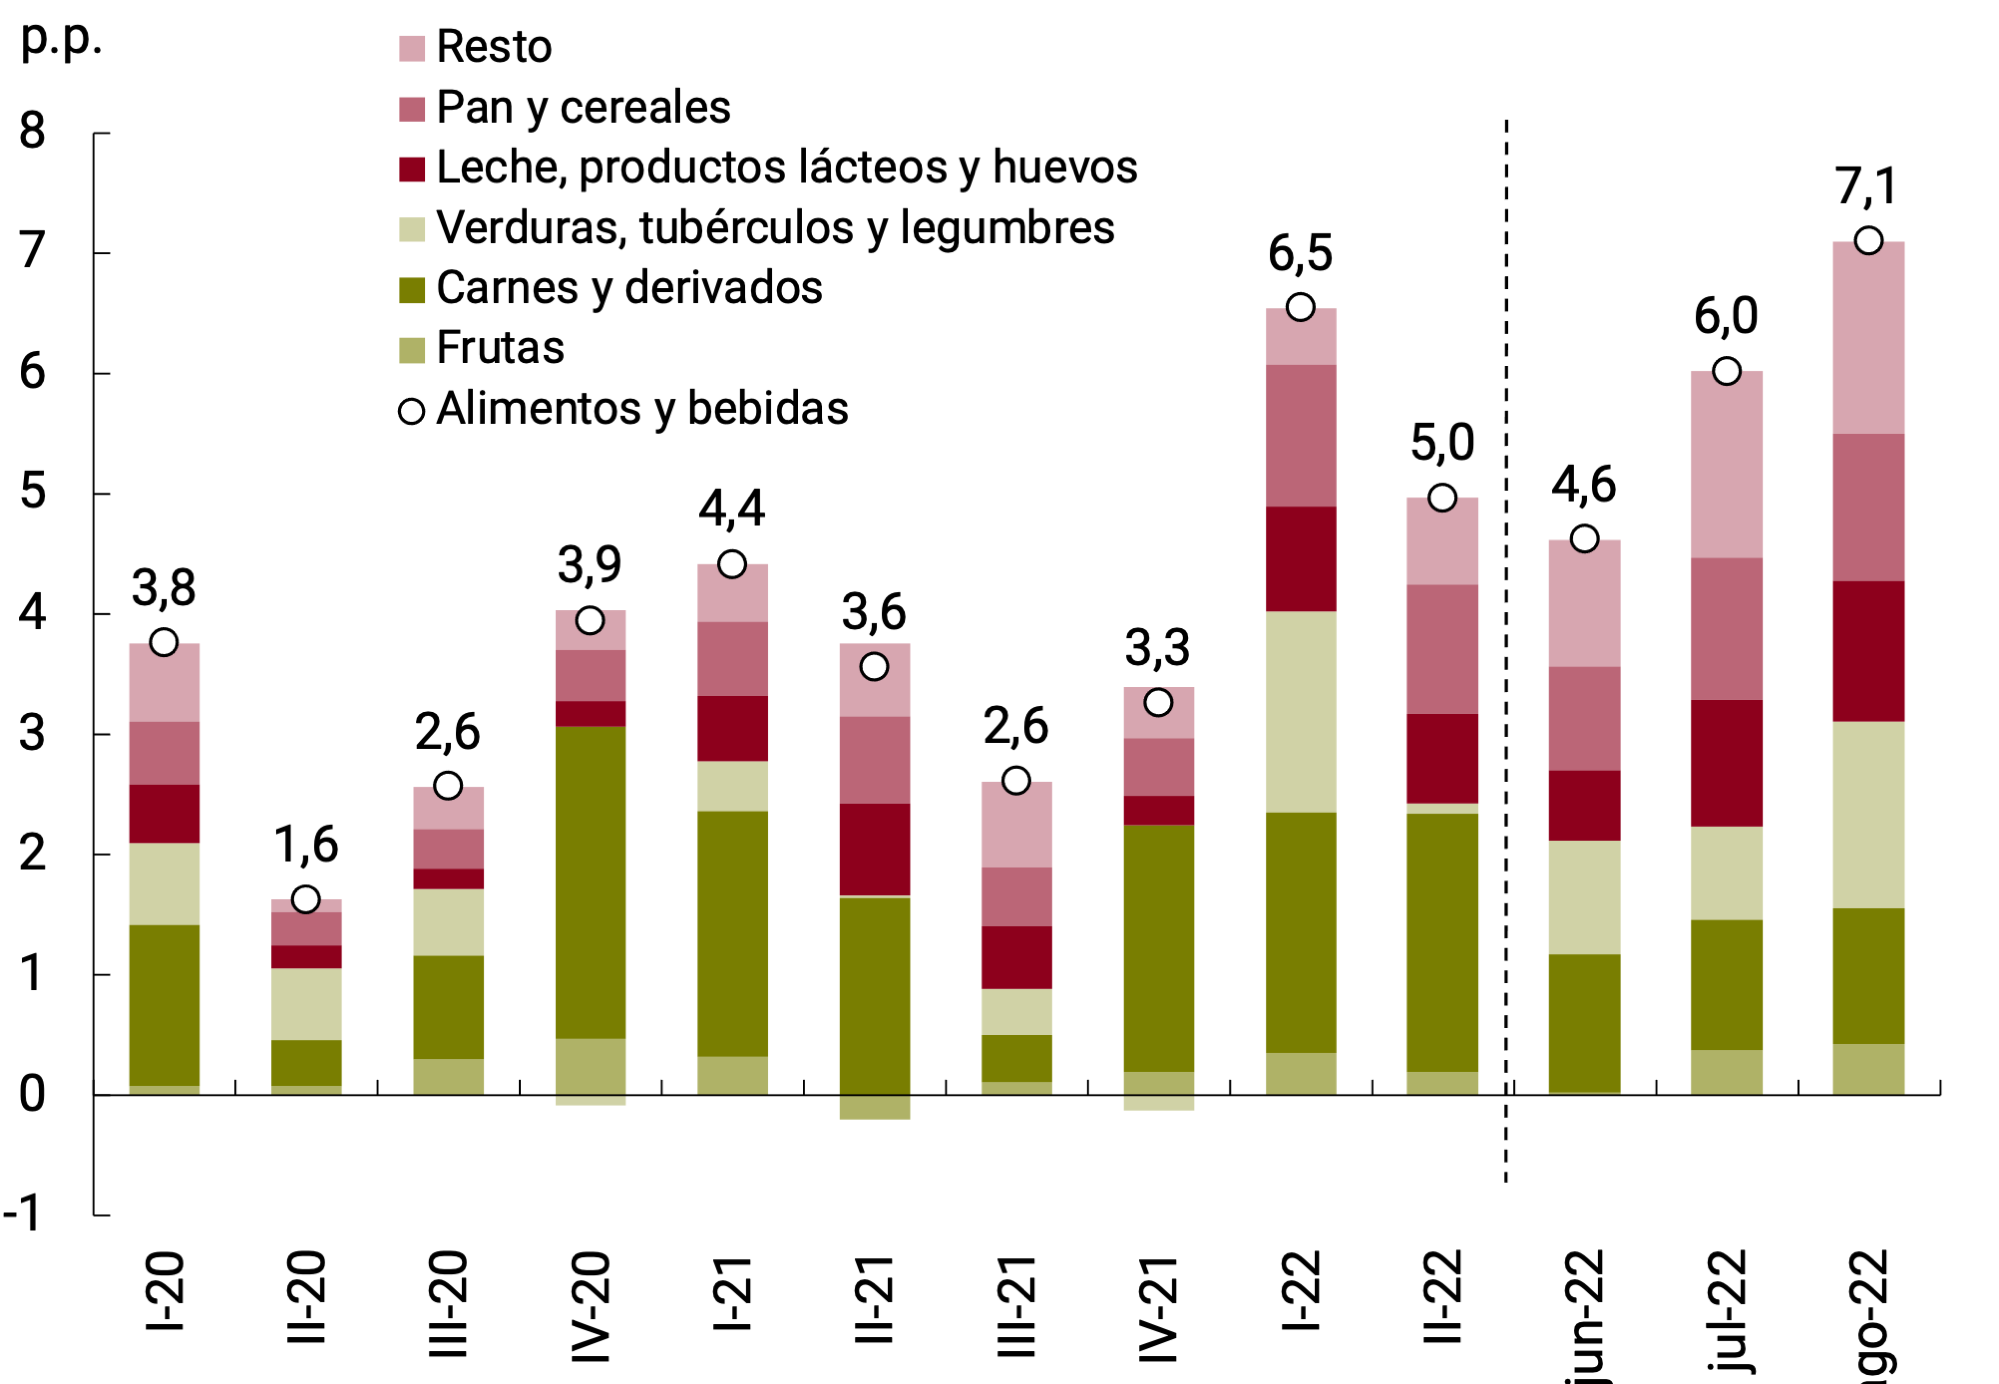
Source: BCRA based on INDEC data.
In contrast, Meats and derivatives maintained relatively limited increases in the July-August two-month period (3.1%, stable compared to June). This grouping of the CPI would also have shown relatively moderate increases in September, although somewhat higher than those of previous months, according to high-frequency data on wholesale prices measured by the Steer Index of the Agricultural and Livestock Market (INMAG; see Figure 6.5). Beef prices, which are heavily weighted in the CPI, tend to follow a seasonal behavior, with more limited average increases during the months corresponding to the second and third quarters and significant accelerations towards the end of each year and the beginning of the next.
Figure 6.5 | Monthly evolution of retail and wholesale
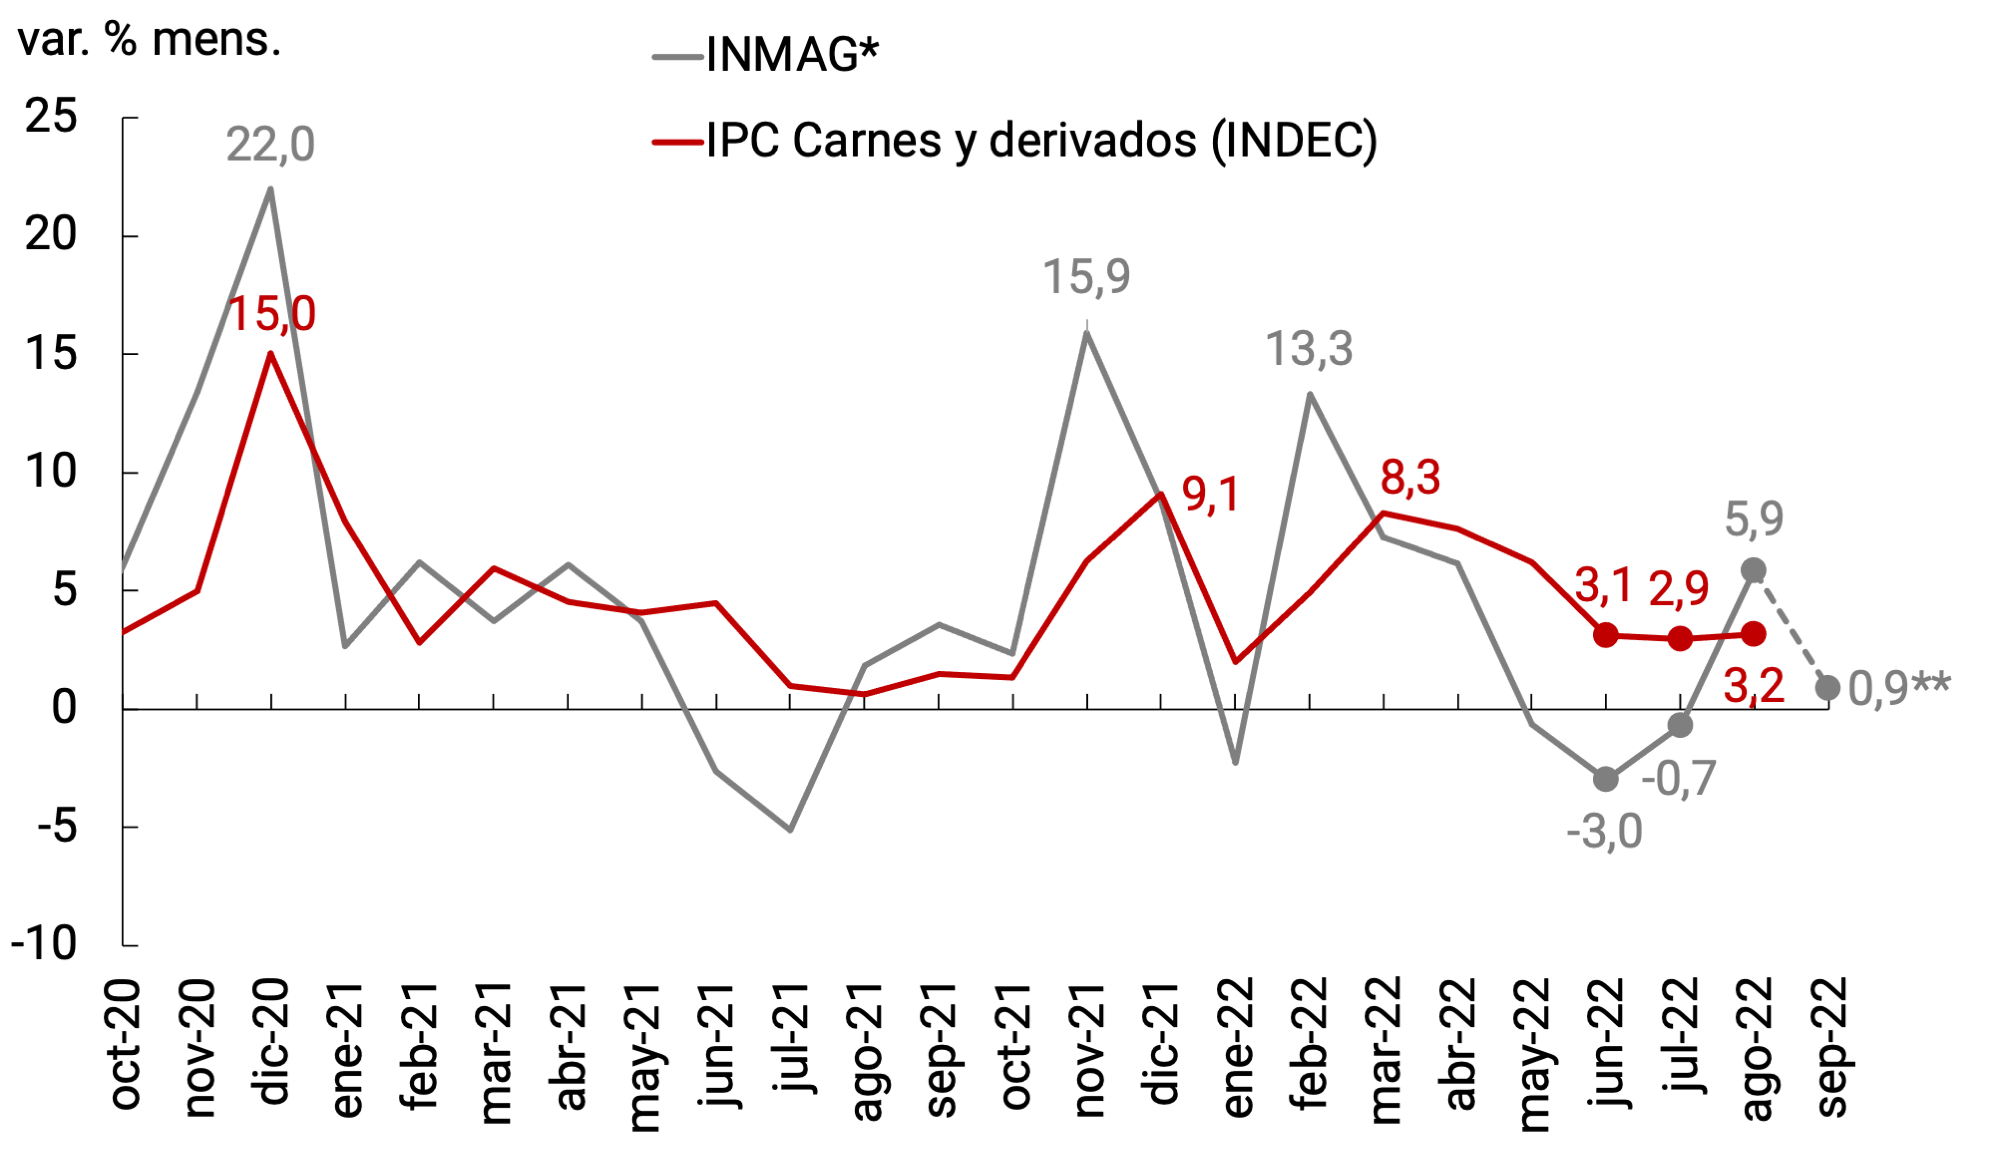
meat prices
* Steer Index of the Cañuelas Agricultural and Livestock Market (ex Liniers Market).
** Sep-22: Average 19 days of Septembercvs average 19 days of August.
Source: BCRA based on data from INDEC and the Cañuelas Agricultural and Livestock Market.
Services also increased their rate of increase in the July-August two-month period compared to June, growing at a slightly lower rate than that of goods (6.6% monthly average in the two-month period; +1.1 p.p. compared to June). At a more disaggregated level, the acceleration was spread among private services while public services slowed their rate of increase compared to June.
The factors that triggered the increase in inflation in goods also affected unregulated private services, to which were added seasonal issues associated with the winter recess in July. In fact, the28 Hotels showed an exceptional increase of approximately 51.1% in July and although they were later corrected downwards during August (-1.2%), they averaged an estimated variation of 22.2% in the two months (+14.1 p.p. compared to the increase in June). The Restaurants and meals away from home group, with a high weighting among services, averaged an 8.2% monthly increase in the two months (+2.0 p.p.), an acceleration partly explained by the increase in food prices. Recreational and cultural services showed a similar trend, with increases of around 9.0% in the two months (+4.7 p.p.). Unlike what was observed in most private services, the aggregate of Housing rent and related expenses maintained a relatively limited and lower rate of increase than in June (4.4%; -1.0 p.p. compared to June), mainly due to a lower impact of the salary brackets of the paritarias of the personnel in charge of buildings on the expenses.
Regarding the acceleration of regulated private services, the incidence of the Education division stood out, which rose 5.5% monthly average in the July-August two-month period (+3.5 p.p. compared to the June variation), driven mainly by increases in private school fees. Telephone and internet services, although they registered moderate increases, contributed to the acceleration of total services by averaging a 4.3% monthly increase in the two months, while in June they had remained constant compared to the previous month. Finally, prepaid expenses slowed down compared to June, increasing 7.5% monthly average in the two months (-2.8 p.p.).
On the other hand, public services subject to government regulation averaged lower increases in the July-August two-month period than in June and continued to grow below the general level. In this group, the increases in public transport stood out, which verified an average increase of 6.5% in the two months considered (-1.9 p.p. compared to June), mainly reflecting the increases authorized in trains and buses in GBA as of August 129. The increase in the running water supply service in GBA30 and other regions of the country between July and August also had an impact. On the other hand, the Electricity, gas and other fuels grouped had a lower rate of increase in the two months considered (2.9%, – 6.8 p.p. compared to June). This moderation is largely due to the fact that the tariff tables for electricity31 and natural gas32 had registered increases in June in comparative terms higher than those of July and August, although they will increase again more significantly from September as of the framework of the tariff segmentation underway.
6.2. Wholesale prices rose at a faster rate than retail prices during the July-August two-month period
Registering a similar evolution to that evidenced by retail prices, the wholesalers captured by the Domestic Wholesale Price Index (IPIM) slowed down between April and June after the international price shock that impacted in March, although they averaged a higher rate in the second quarter than in the first quarter (5.3% in the II-22, +0.4 p.p. compared to I-22; see Figure 6.6). In this way, they continued to maintain average increases lower than those verified by retail goods (5.6%). The downward trend in the monthly records of the IPIM was interrupted in July (7.1%), as in the case of the CPI, affected by the increase in financial volatility and exchange rate uncertainty observed in June and early July. In August, the IPIM, unlike the CPI, accelerated to 8.2% (+1.1 p.p.) driven by the increases in Primary and Imported Products, while Manufactured Products maintained a similar rate of increase to that of July. It is important to note that the greatest correlation between the monthly variations of the IPIM and the CPI is verified contemporaneously.
Within the IPIM, the higher rate of expansion during the second quarter mainly reflected the acceleration of Manufactured Products, the category with the highest weighting in the index, which rose 5.6% on a monthly average (+1.0 p.p. compared to I-22). Among the other categories, the average monthly increase in electricity (13.4%, + 8.4 p.p.) stood out, which mainly reflected the update of the average rates set by ENRE to the distributors Edenor and Edesur for the period May-July33. Imported products (3.5%, +1.1 p.p.) also accelerated, for the fourth consecutive quarter, influenced by the higher rate of change in the nominal exchange rate and the carry-over effect of the increases in international prices in March and April. On the other hand, Primary Products moderated their average rate of increase in the second quarter (4.0%, -2.4 p.p.), with a slowdown in Agricultural Products and a higher rate of increase in Crude Oil and Gas. The significant acceleration of the IPIM in July and August compared to June was disseminated among the main components, highlighting the incidence of manufactured products. Particularly in the August variation, the contribution of agricultural products was highlighted due to the strong increases in fruits and vegetables (see Figure 6.6).
Figure 6.6 | Evolution and contributions of the IPIM and the nominal
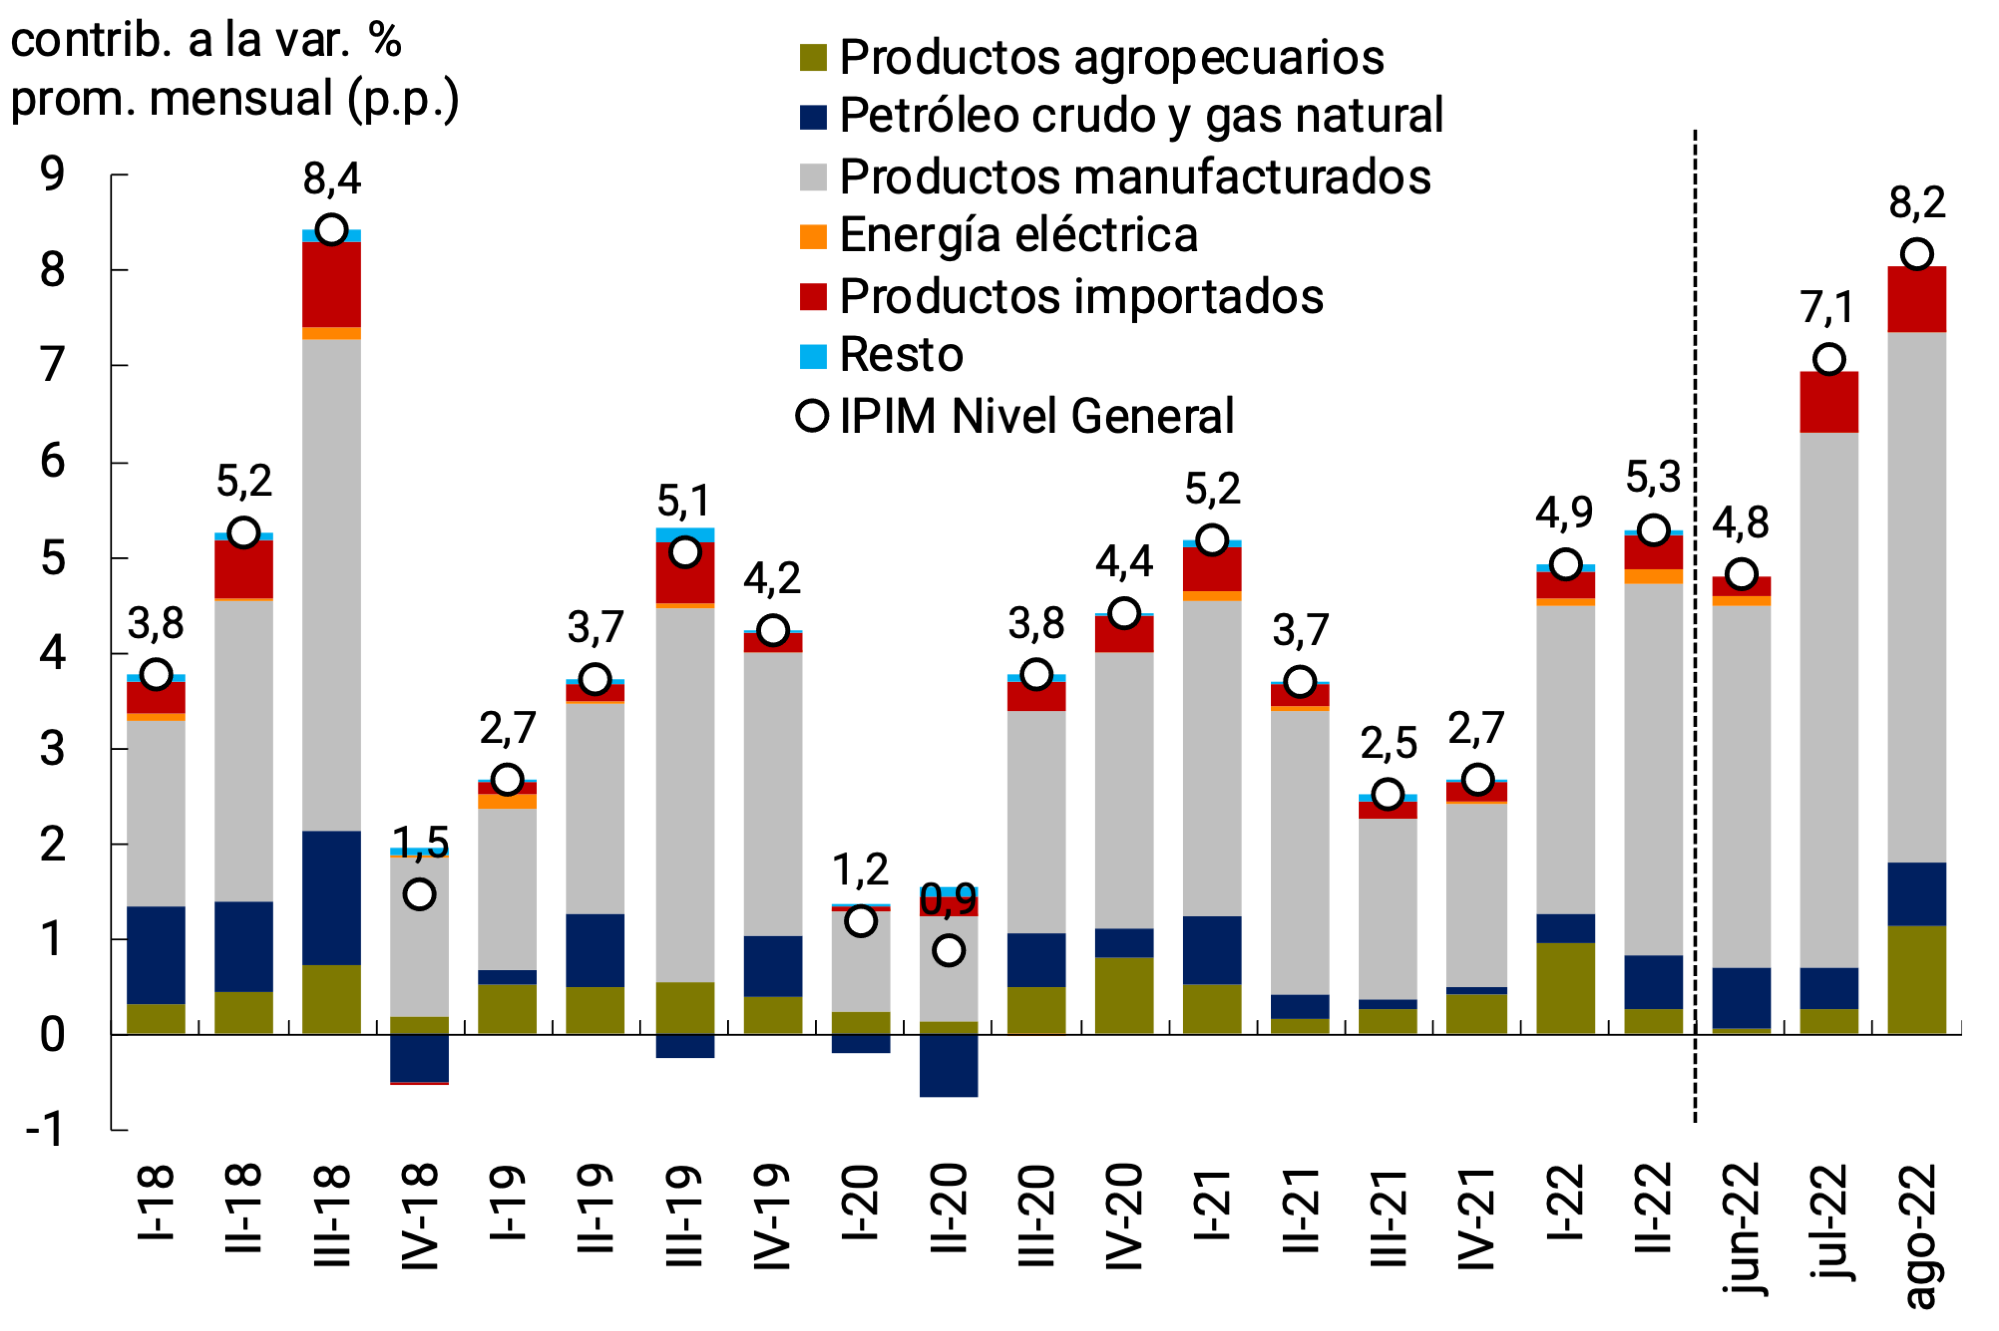
exchange rate Source: BCRA based on INDEC data.
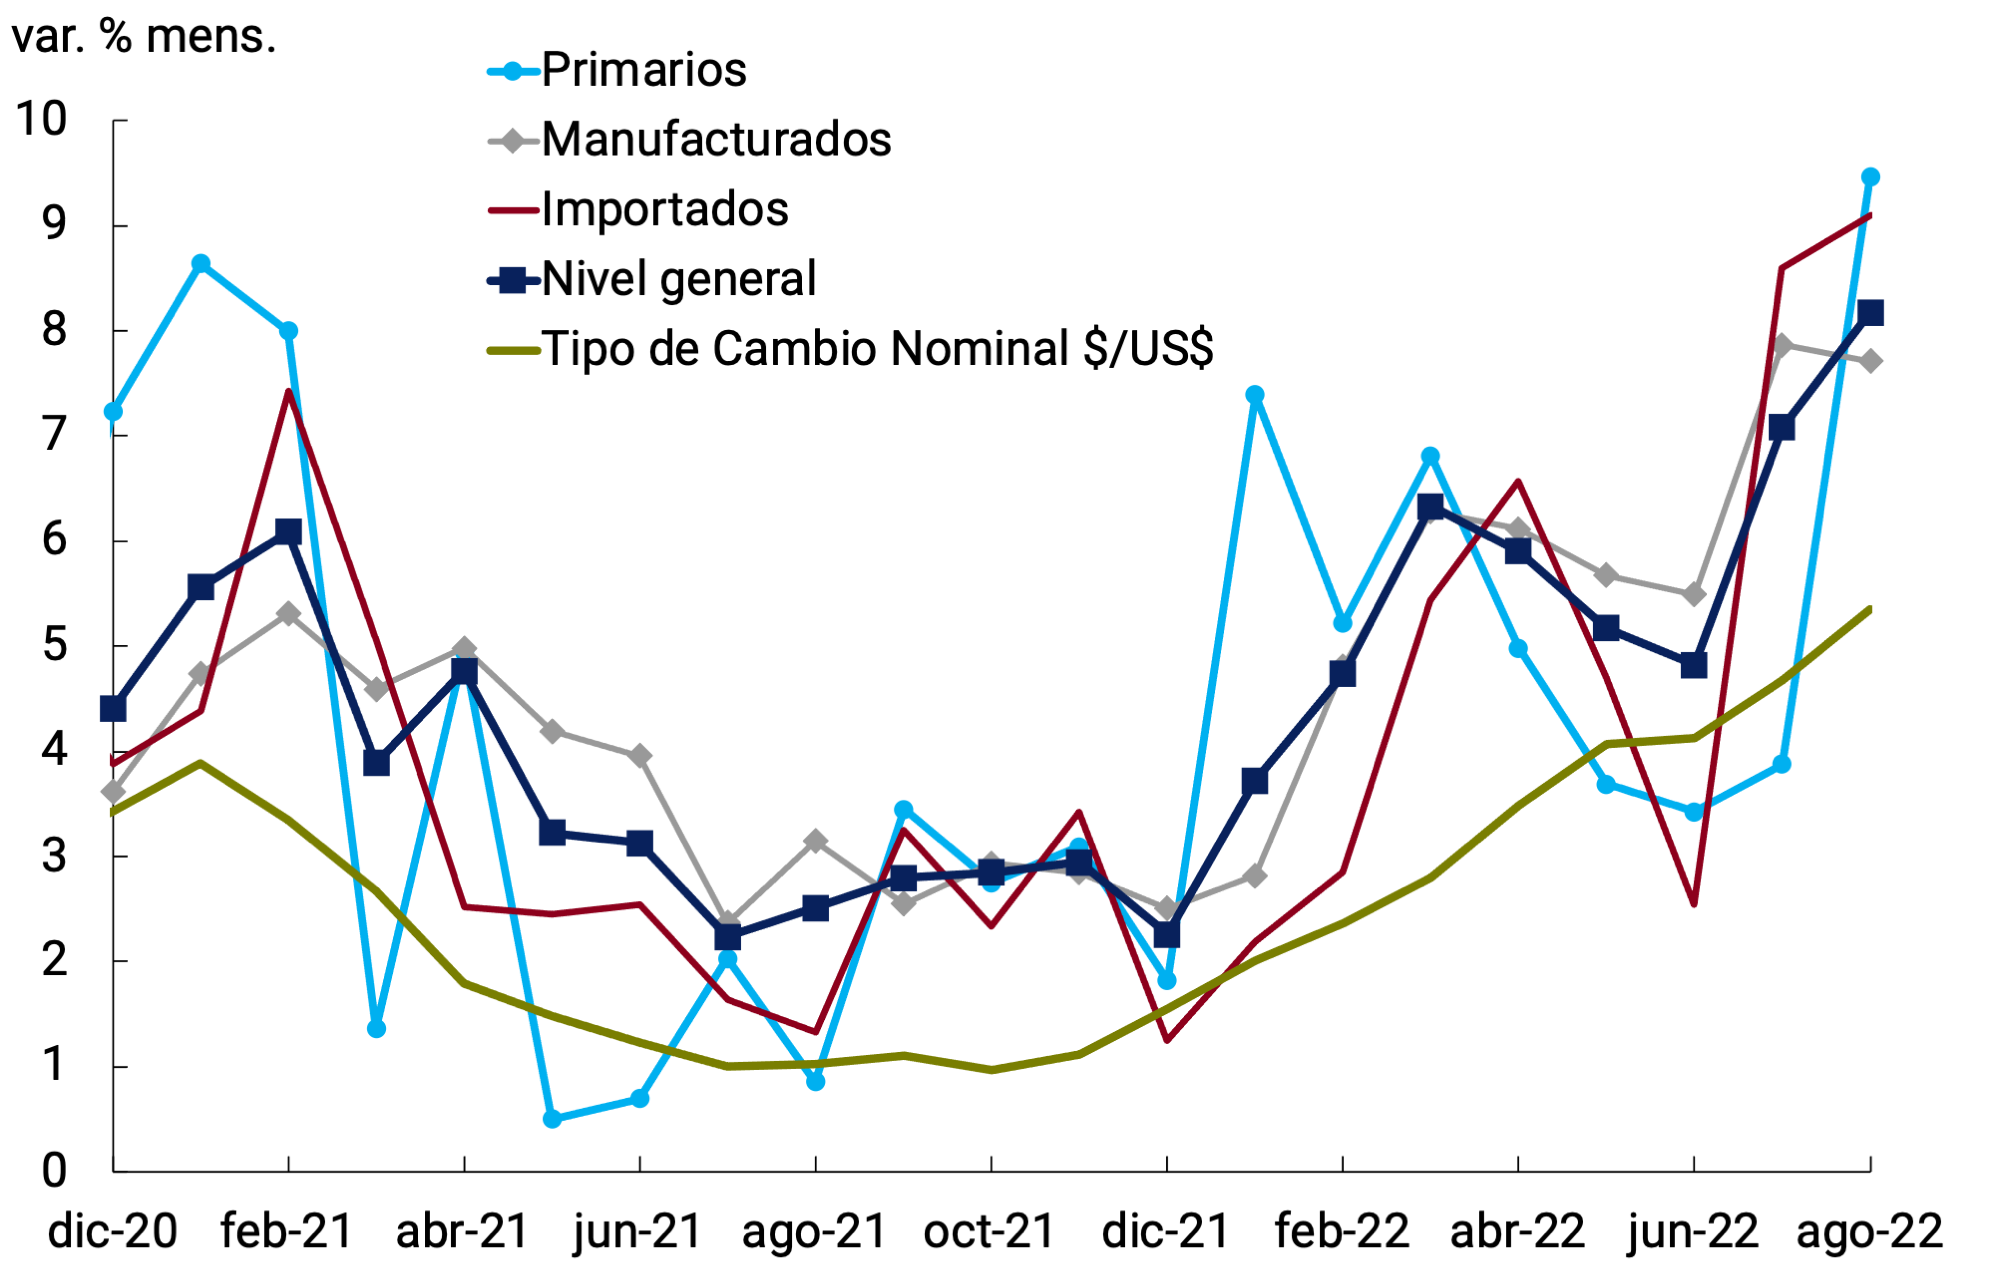
Source: BCRA based on data from INDEC and Communication A 3500.
On the other hand, construction costs measured by the ICC (Construction Cost Index) also increased their rate of expansion in the second quarter to 5.1% monthly average (+1.1 p.p. compared to I-22), an acceleration that was spread among its categories. Materials increased their rate of increase to 4.7% on a monthly average (+1.1 p.p.), while the Labor component averaged an increase of 5.4% (+1.1 p.p.), reflecting the entry into force of relatively larger parity brackets during this period (see Figure 6.7). So far in the third quarter, construction costs showed a new acceleration, with increases of 6.8% in July and 7.2% in August. In those months, significant increases were evident in the prices of materials, in general expenses—reflecting the impact of the authorized increases in gas and electricity—and in wage costs, due to the effect of the new tranches agreed in the sector’s parity, especially in August.
Figure 6.7 | Construction costs
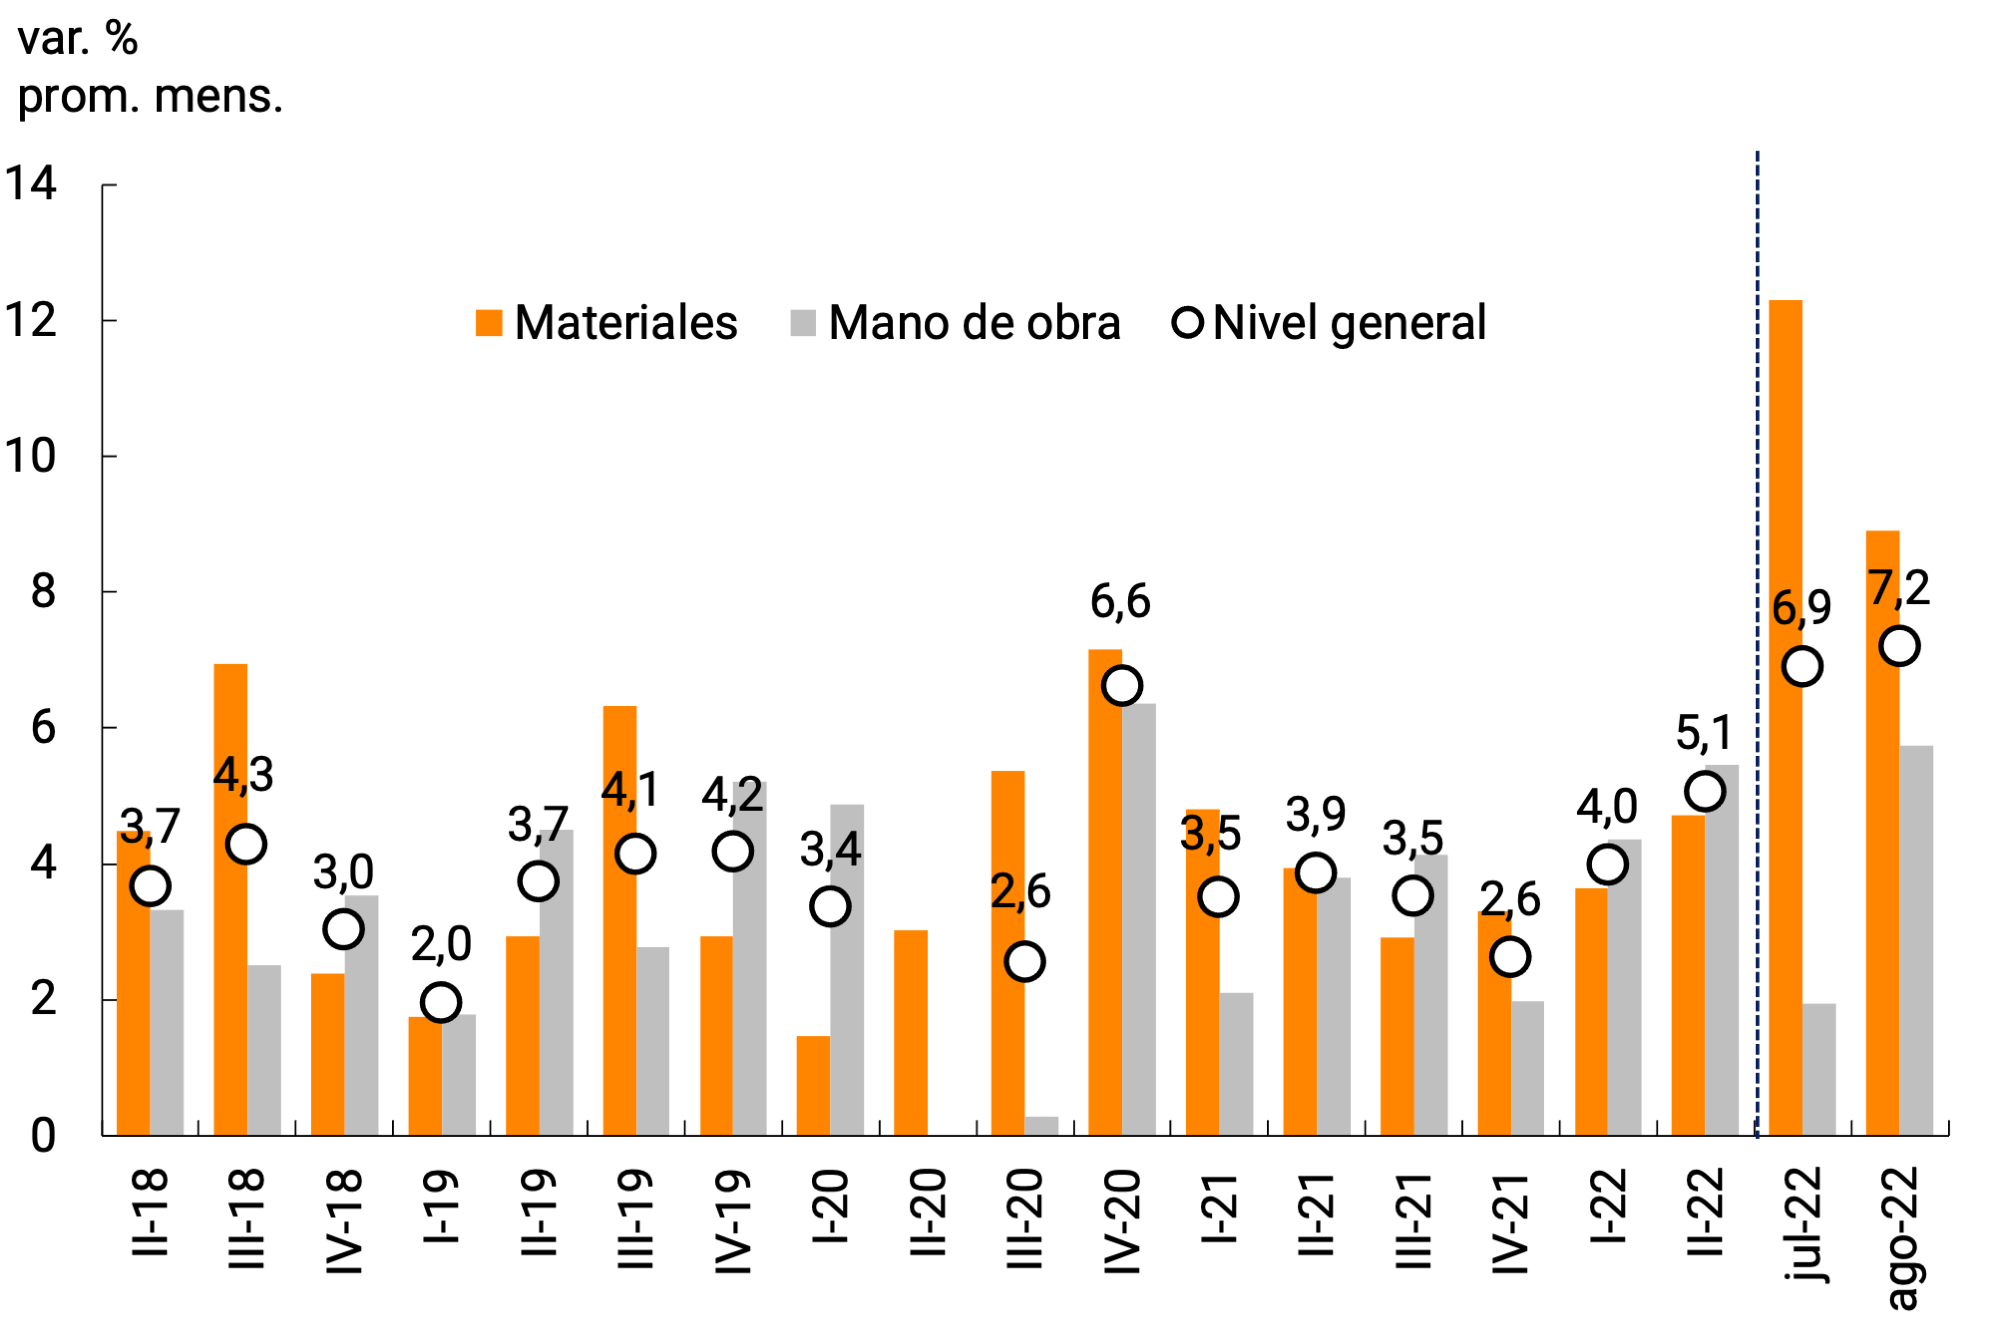
Source: BCRA based on INDEC data.
6.3. The year-on-year inflation rate continued to rise, highlighting the rise in Seasonal goods and services
The year-on-year inflation rate at the retail level increased so far this year to 78.5% YoY in August, the highest since Dec-91 and 27.6 p.p. above the December 2021 figure (50.9% YoY). This upward trend was observed in the three main categories that make up the CPI. The year-on-year variation of Seasonal Items rose to 111.5% in August, far exceeding those of the rest of the categories. Core inflation reached 78.4% YoY and continues to be slightly higher than the year-on-year variation of the General Level. Regulated goods and services (59.7% y.o.y. in August), although they have also been accelerating so far this year, make up the category whose relative prices have deteriorated again so far in 2022. For its part, year-on-year wholesale inflation (73.9% in August) verified a similar trajectory, increasing in recent months, although with rates lower than those of the CPI so far this year, after the opposite situation occurred in 2021 (see Figure 6.8).
Figure 6.8 | Retail (CPI) and wholesale prices (IPIM)
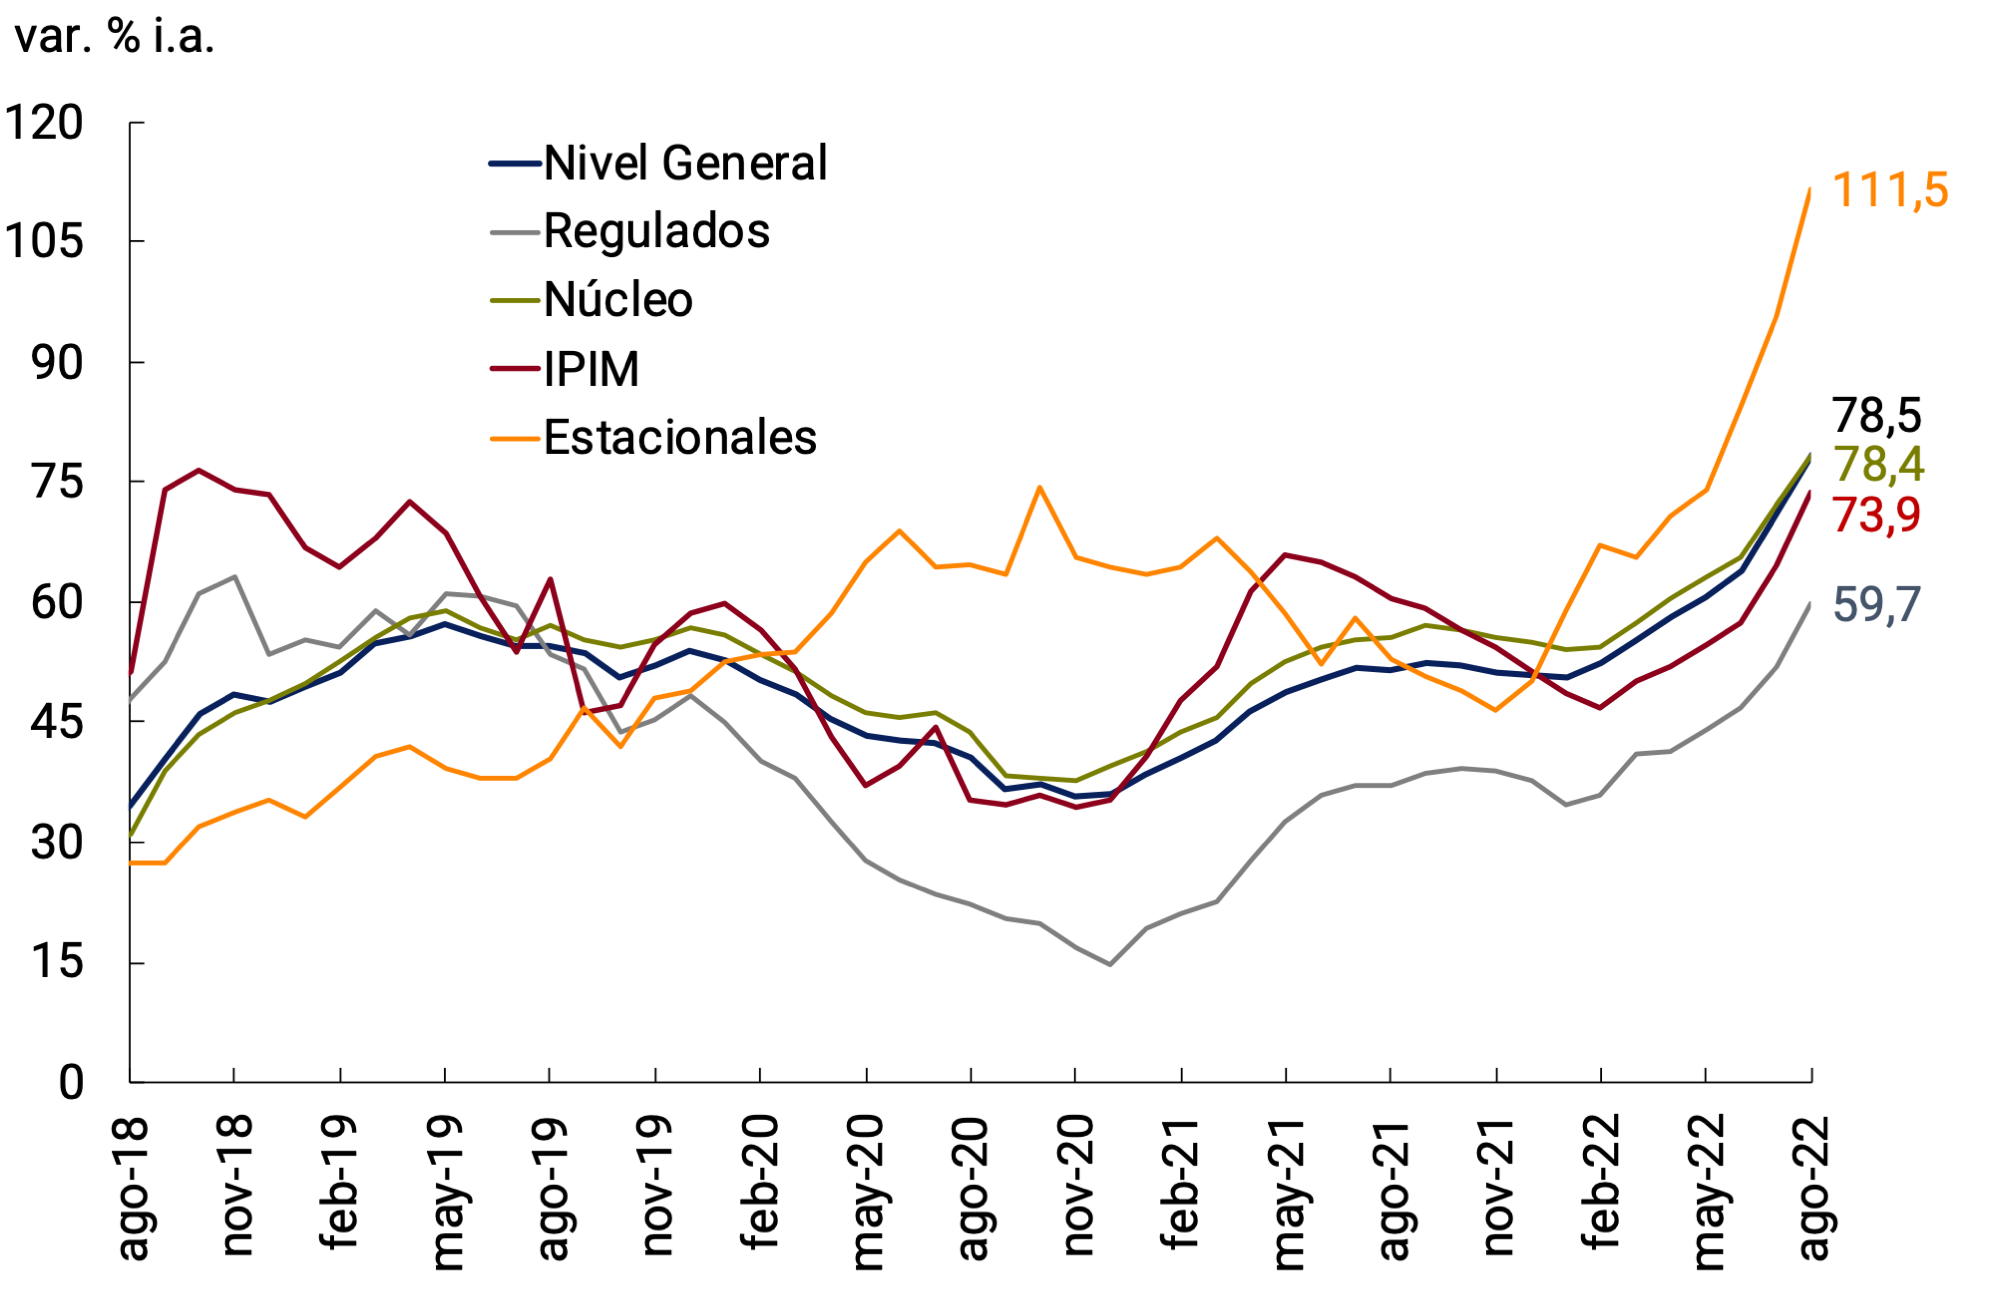
Source: BCRA based on INDEC data.
Regarding accumulated retail inflation so far in 2022, it reached 56.4% (equivalent to an average monthly rate of 5.7% for the first 8 months of the year), and exceeded the inflation reached during all of 2021 (50.9%). Despite its relatively low weighting in the CPI, a significant part of the acceleration of the General Level was explained by the higher rate of increase in the Seasonal category, which in the first 8 months of 2022 averaged a monthly increase of 7.4% (76.4% accumulated in 2022). Different episodes contributed to explain this evolution, among which the significant increases in vegetables and fruits in the first two months of the year associated with climatic issues, the strong increases in services associated with tourism in the face of the recovery of the sector, especially during the recent winter recess, and the successive increases of great magnitude in the prices of clothing. These increases, partly atypical, contributed throughout the year to explain the increase in the relative price of seasonal products compared to the rest of the categories, reaching maximum levels since the current CPI was published (see Figure 6.9).
Figure 6.9 | Relative price of the Seasonal
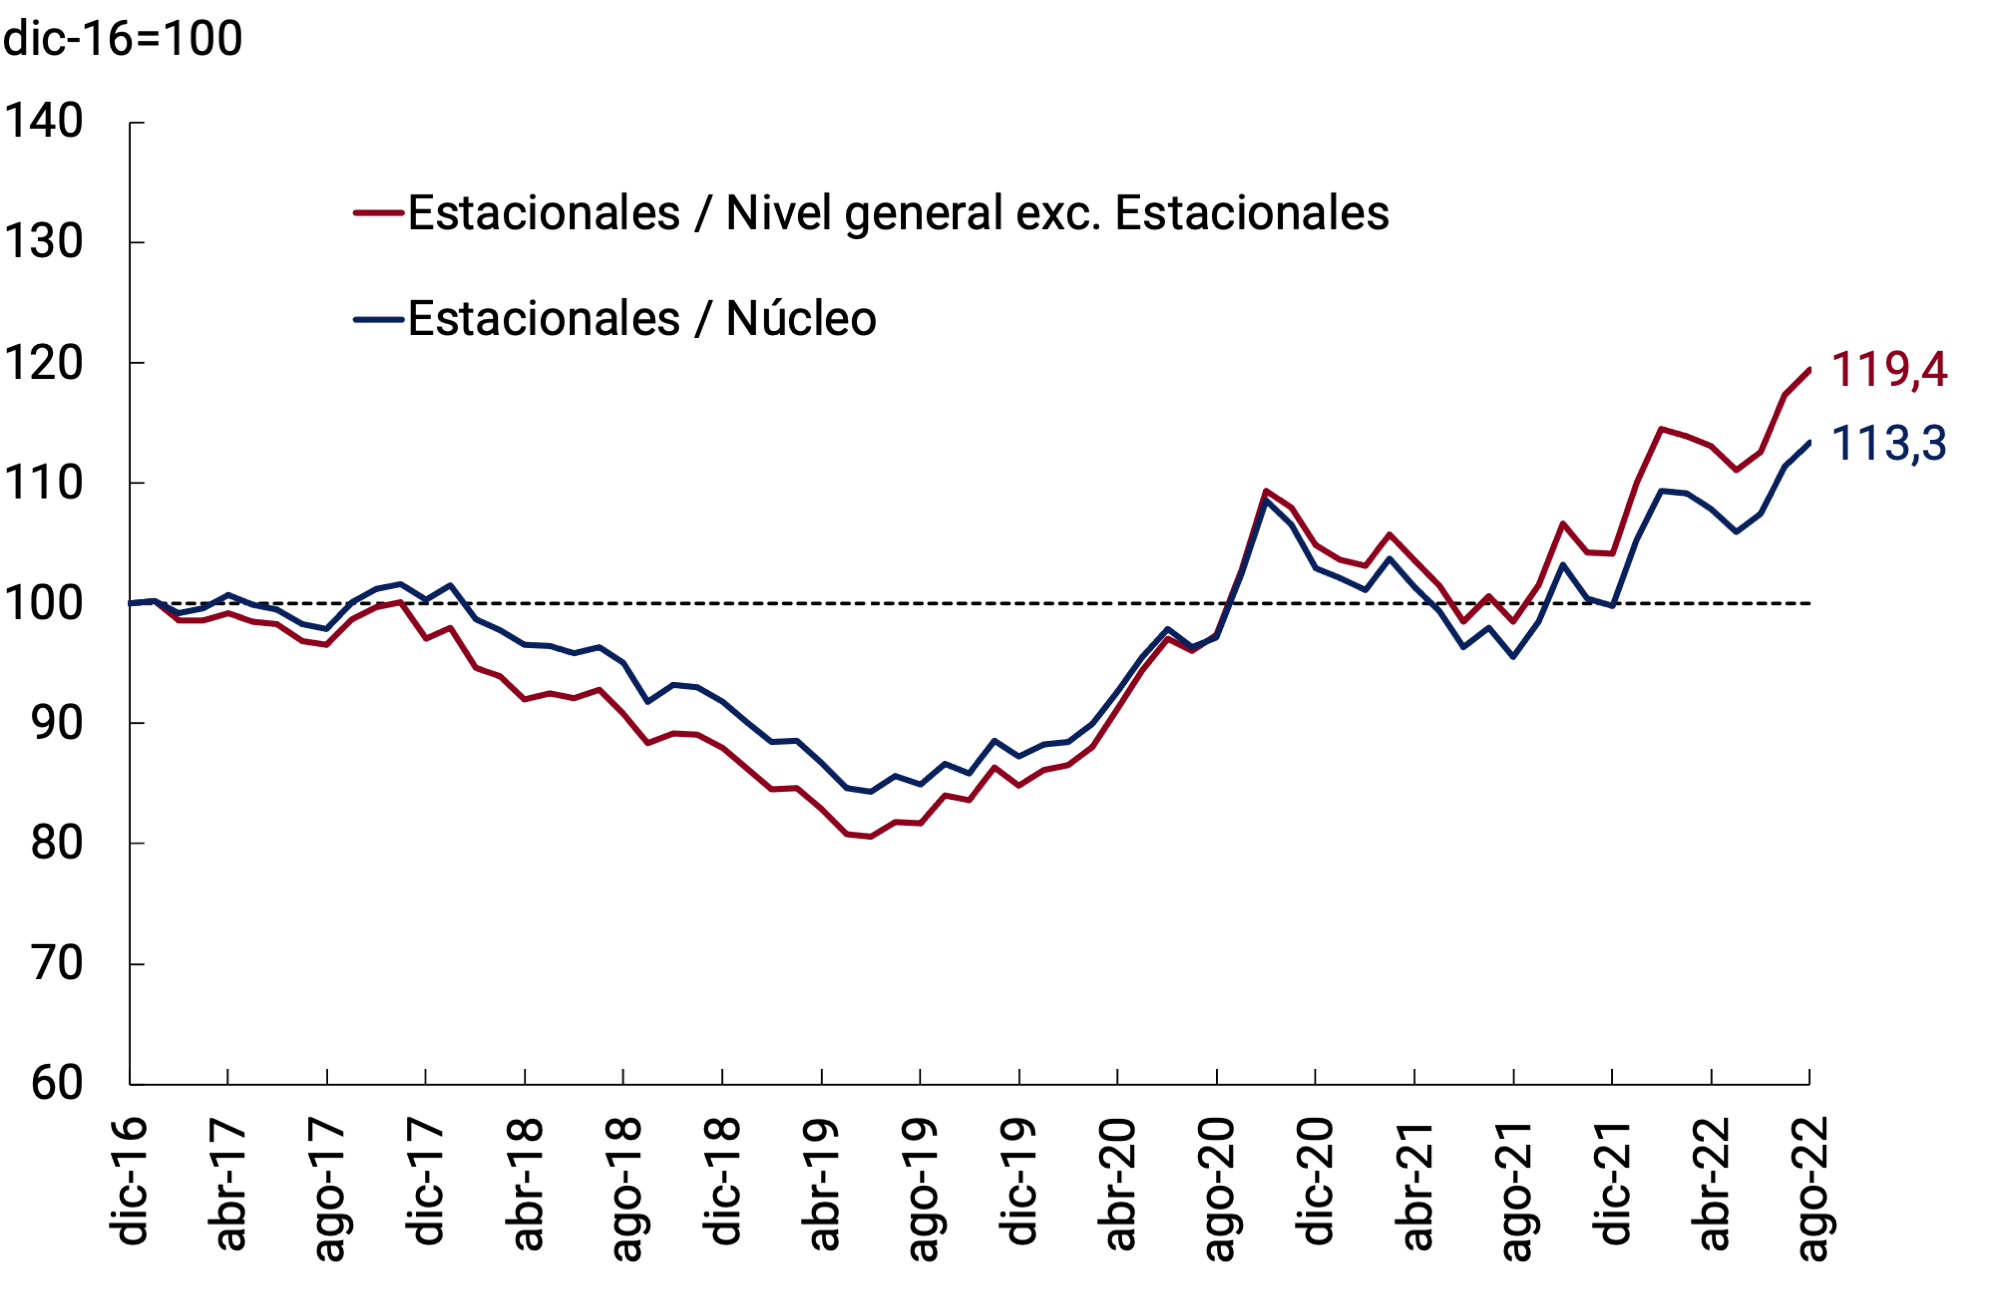
category
Source: BCRA based on INDEC data.
6.4. Perspectives
After the increase in inflation verified in July, the National Government and the BCRA adopted a series of measures to face financial volatility and lower inflation. The BCRA intervened in the secondary market for debt in pesos and repeatedly raised the monetary policy interest rate. Policies were also implemented to consolidate the process of reducing the fiscal deficit and monetary financing, to encourage the liquidation of exports in order to strengthen the BCRA’s international reserves, and in addition, agreements were reached on reference prices on some sets of goods and services. The first results have been a recovery in the prices of bonds in domestic currency, an increase in the level of international reserves and a significant reduction in the exchange rates implicit in the quotations of public securities.
Core inflation is expected to be gradually reduced as of September, accompanying the process of improvement in the financial situation and the reduction of exchange rate uncertainty as a result of the measures implemented. However, an acceleration is expected in the Seasonal and Regulated categories that would largely offset the drop in core inflation during September and October. Seasonal prices tend to increase their rate of increase in these months compared to June, especially in clothing and tourism. In relation to the Regulated category, in September the first stage of the path of updating the tariff tables for residential consumption of natural gas and electricity that follow the household segmentation criteria defined by the Ministry of Energy will impact, while the second and third stages will impact in November of this year and January 2023, respectively 34. In addition to the update of energy rates, increases were announced in public transport that would be added to the usual increases in the rest of the regulated ones.
The gradual reduction of core inflation takes into account certain factors that give persistence to the inflationary process: possible second-round effects of updates to public service and fuel rates, bringing forward and concentrating wage parity agreements, and high inflation expectations. For their part, the analysts participating in the Market Expectations Survey (REM) predict that, after the decline in inflation observed in August, the monthly rates of change of the CPI General Level would fall progressively in the short term and would be closer to the figure for June of this year (see Figure 6.10).
Figure 6.10 | Monthly inflation expectations (REM Aug-22)
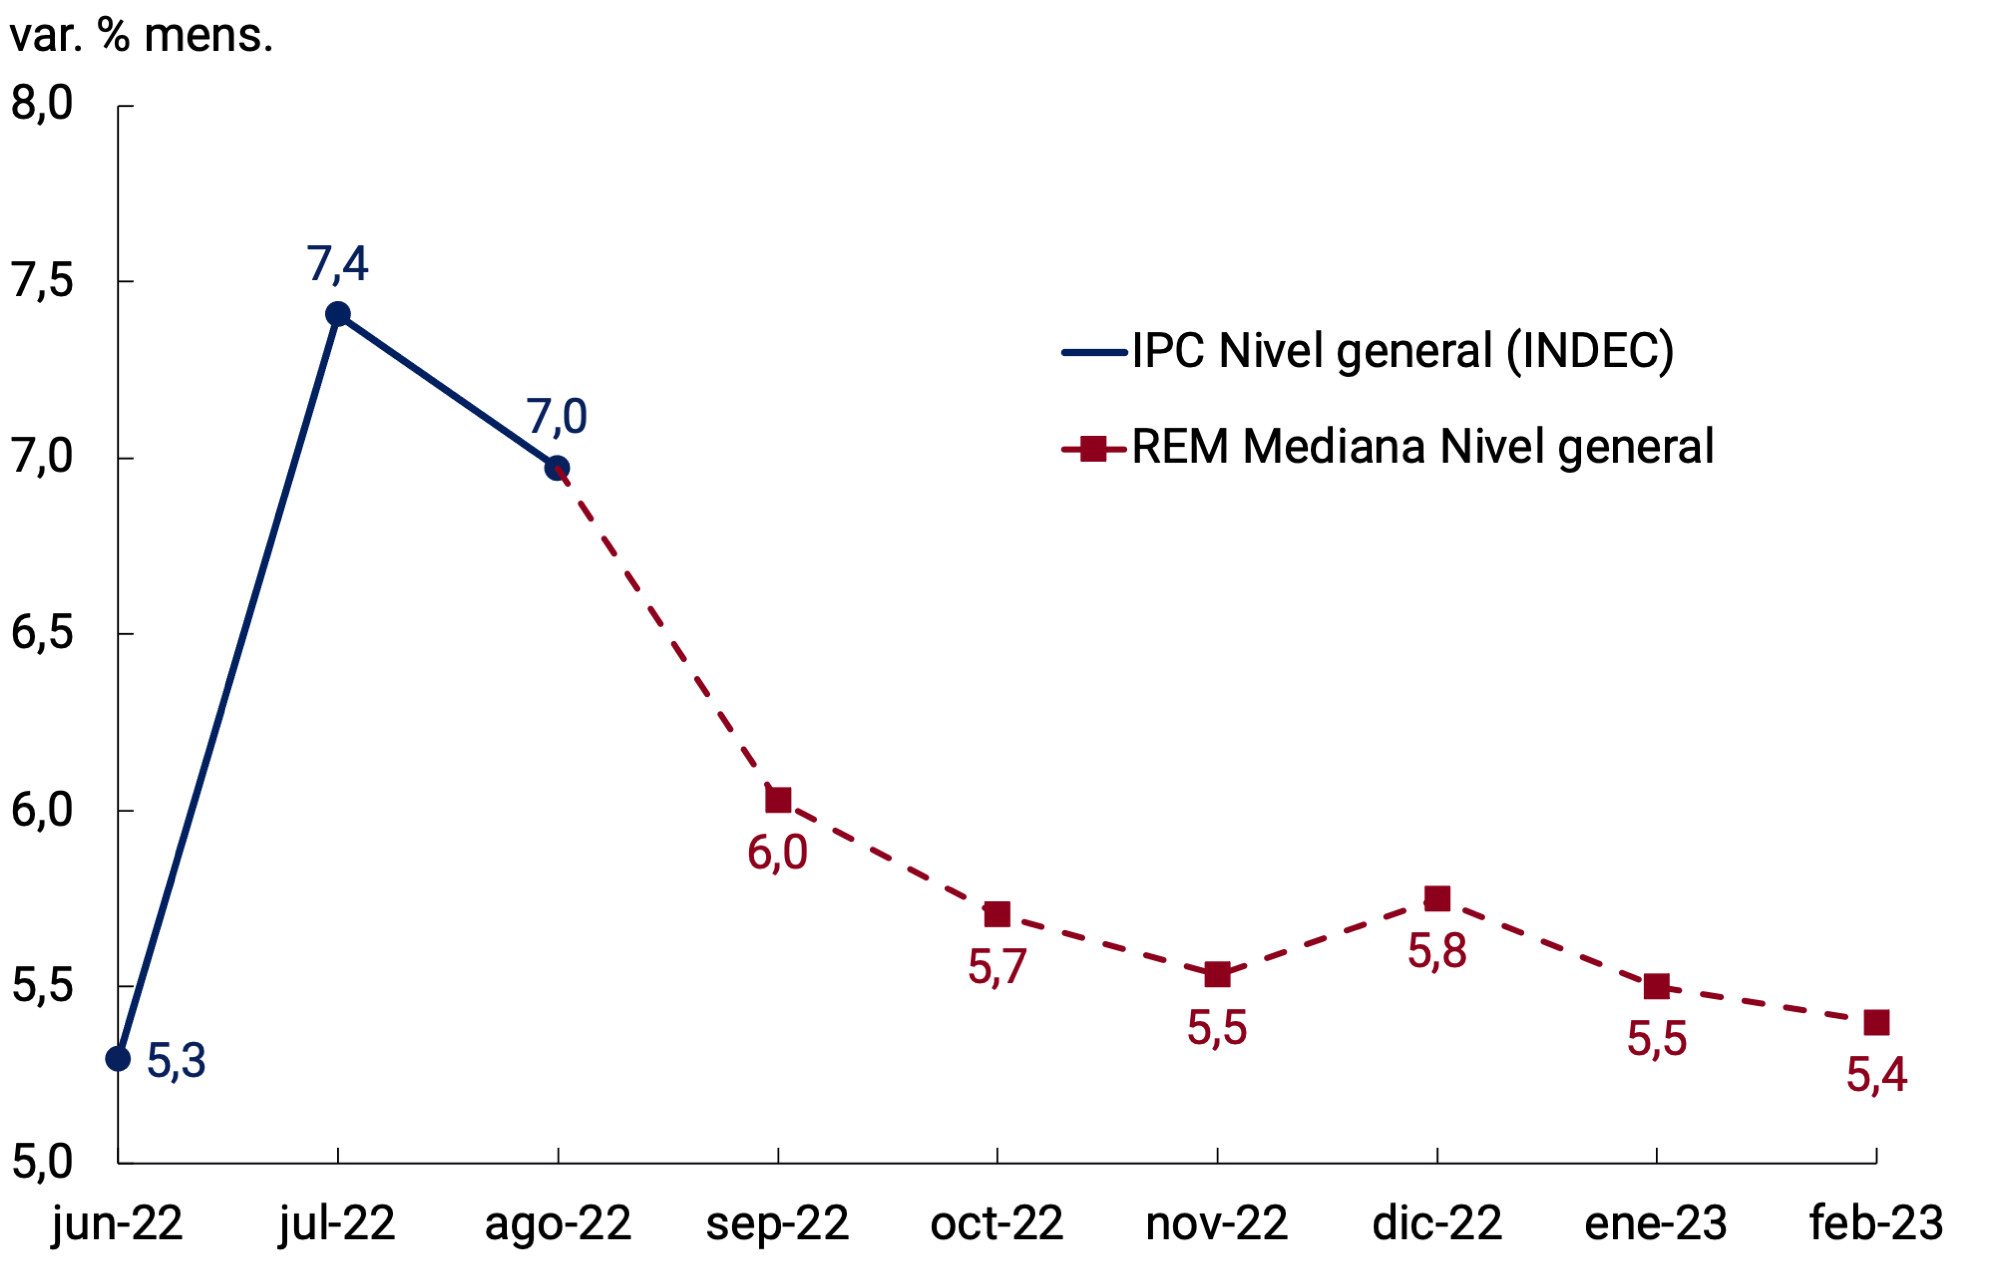
Source: BCRA based on data from INDEC and REM-BCRA (Aug-22).
After the increases in the monetary policy interest rate and the initiatives aimed at consolidating the process of reducing the fiscal deficit and monetary financing, both the National Government and the BCRA will continue to adopt measures to lower inflation in anticipation of a context of greater domestic financial stability. As for the BCRA, it will conduct its monetary policy by adjusting interest rates to keep them in positive territory in real terms and without granting financial assistance to the National Treasury for the remainder of the year, managing liquidity to preserve monetary balance and maintaining the crawling peg exchange rate scheme so as not to lose external competitiveness.
Back to top
7. Monetary Policy
The BCRA continued to calibrate its monetary policy to adapt it to a changing macroeconomic environment. Economic activity moderated its growth rate; meanwhile, the inflation rate accelerated again in the middle of the year. On top of inflationary inertia, transitory factors were added that boosted prices, among which greater local financial volatility stands out. In particular, with regard to the domestic financial market, towards the end of the second quarter a scenario of high volatility was observed in the peso debt market.
This context led the BCRA to advance more intensively in the implementation of the policies set out last December in the 2022 Objectives and Plans35. Reference interest rates were raised on several occasions to gradually bring them to positive levels in real terms, with the aim of guaranteeing exchange rate and financial stability. On the other hand, the BCRA used its capacity to intervene through open market operations, in order to promote greater liquidity, depth and transparency of the sovereign debt markets, tending to greater financial stability. In particular, the monetary authority sought to reduce financial volatility, reaffirming its commitment to operate on the yield curve of public debt in local currency, ensuring that yields in the secondary market do not exceed those arising from primary auctions.
Finally, on the exchange rate front, the rate of change in the nominal exchange rate continued to be gradually adjusted in order to maintain adequate levels of external competitiveness. The latter was complemented by the improvement of the current regulatory framework of the foreign exchange market, seeking to promote an efficient allocation of foreign currency and enhance the accumulation of international reserves.
In order to consolidate a path of gradual lowering of inflation that is consistent with the sustainability of public finances and the external sector, the BCRA will maintain a prudent administration of monetary aggregates, sterilizing any surplus liquidity, in order to avoid imbalances that directly or indirectly threaten the disinflation process.
7.1. The BCRA continued to calibrate its policies to the new macroeconomic environment
7.1.1. The BCRA accelerated the process of raising the benchmark interest rates
In line with its 2022 Objectives and Plans, the BCRA accelerated the process of raising interest rates on monetary regulation instruments. In an economy like Argentina’s, with a relatively small credit channel, the rise in interest rates acts mainly by encouraging savings in pesos. Its anti-inflationary action largely involves contributing to exchange rate and financial stability, and must be complemented by other economic policy instruments to reduce inflationary inertia.
The BCRA currently conducts its monetary policy through the interest rate of the 28-day Liquidity Bills (LELIQ), this being the main instrument of monetary policy. Thus, since the end of June, the interest rate has been raised three times. The interest rate on the 28-day LELIQ remained at 75% n.a. (107.3% y.a.), which implied a rise of 23 p.p. in the period (see Chart 7.1). The interest rate on 1-day passes stood at 70% n.a. (101.2% y.a.) and that of active passes at 95% n.a. (158.3% y.a.). Finally, the interest rate of the LELIQ with a 180-day term was set at 83.5% n.a. (101.2% y.a.) and the fixed spread of the NOTALIQ was raised, also to 180 days, currently standing at 8.5 p.p.
Figure 7.1 | Monetary
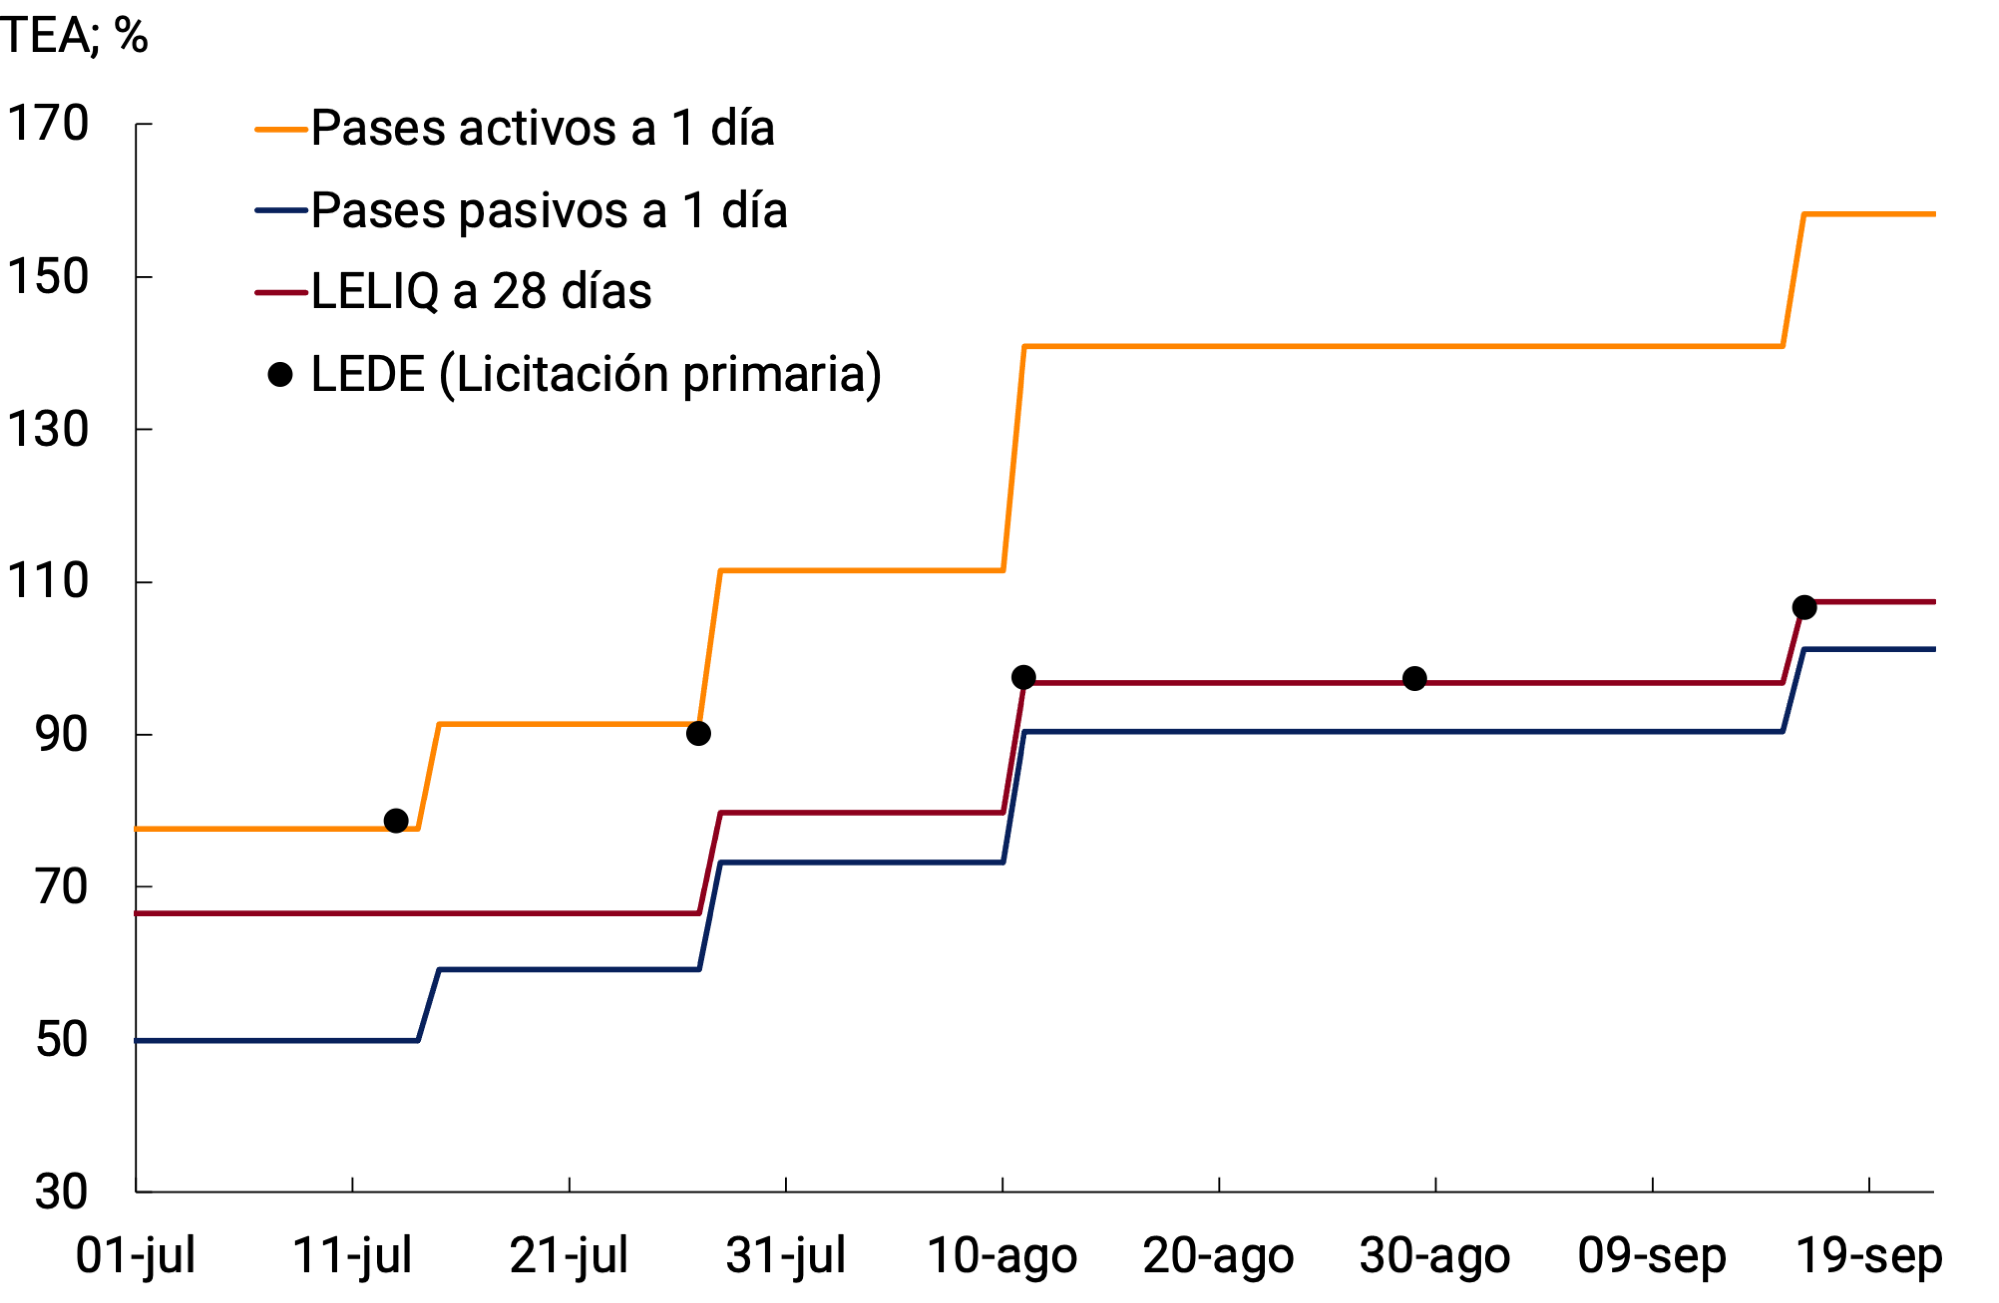
policy interest rates
Source: BCRA.
This action was complemented by a deepening of coordination efforts with the Ministry of Economy of the Nation for the construction of an interest rate curve for public instruments36. Thus, the interest rate of the shortest instrument of the last National Treasury auction, the Discount Bill (LEDE) maturing on January 31, 2023, was tendered in the primary market with a rate of 83.4% n.a. (106.6% e.a.), in line with the 28-day LELIQ rate of the BCRA.
7.1.2. The BCRA managed its liabilities to avoid imbalances in the money market
The BCRA’s monetary assistance to the National Treasury, through the Transitory Advances, remained within the limits established in the Extended Facilities Program (PFE) agreed with the IMF. Thus, the cumulative primary expansion of the public sector in terms of GDP was among the lowest in recent years, representing only 0.8% of GDP (see Figure 7.2). It should be noted that for the rest of the year the National Treasury committed not to use the remaining balance of transitory advances.
Figure 7.2 | Primary issuance linked to the National Treasury*
Accumulated as of August of each year
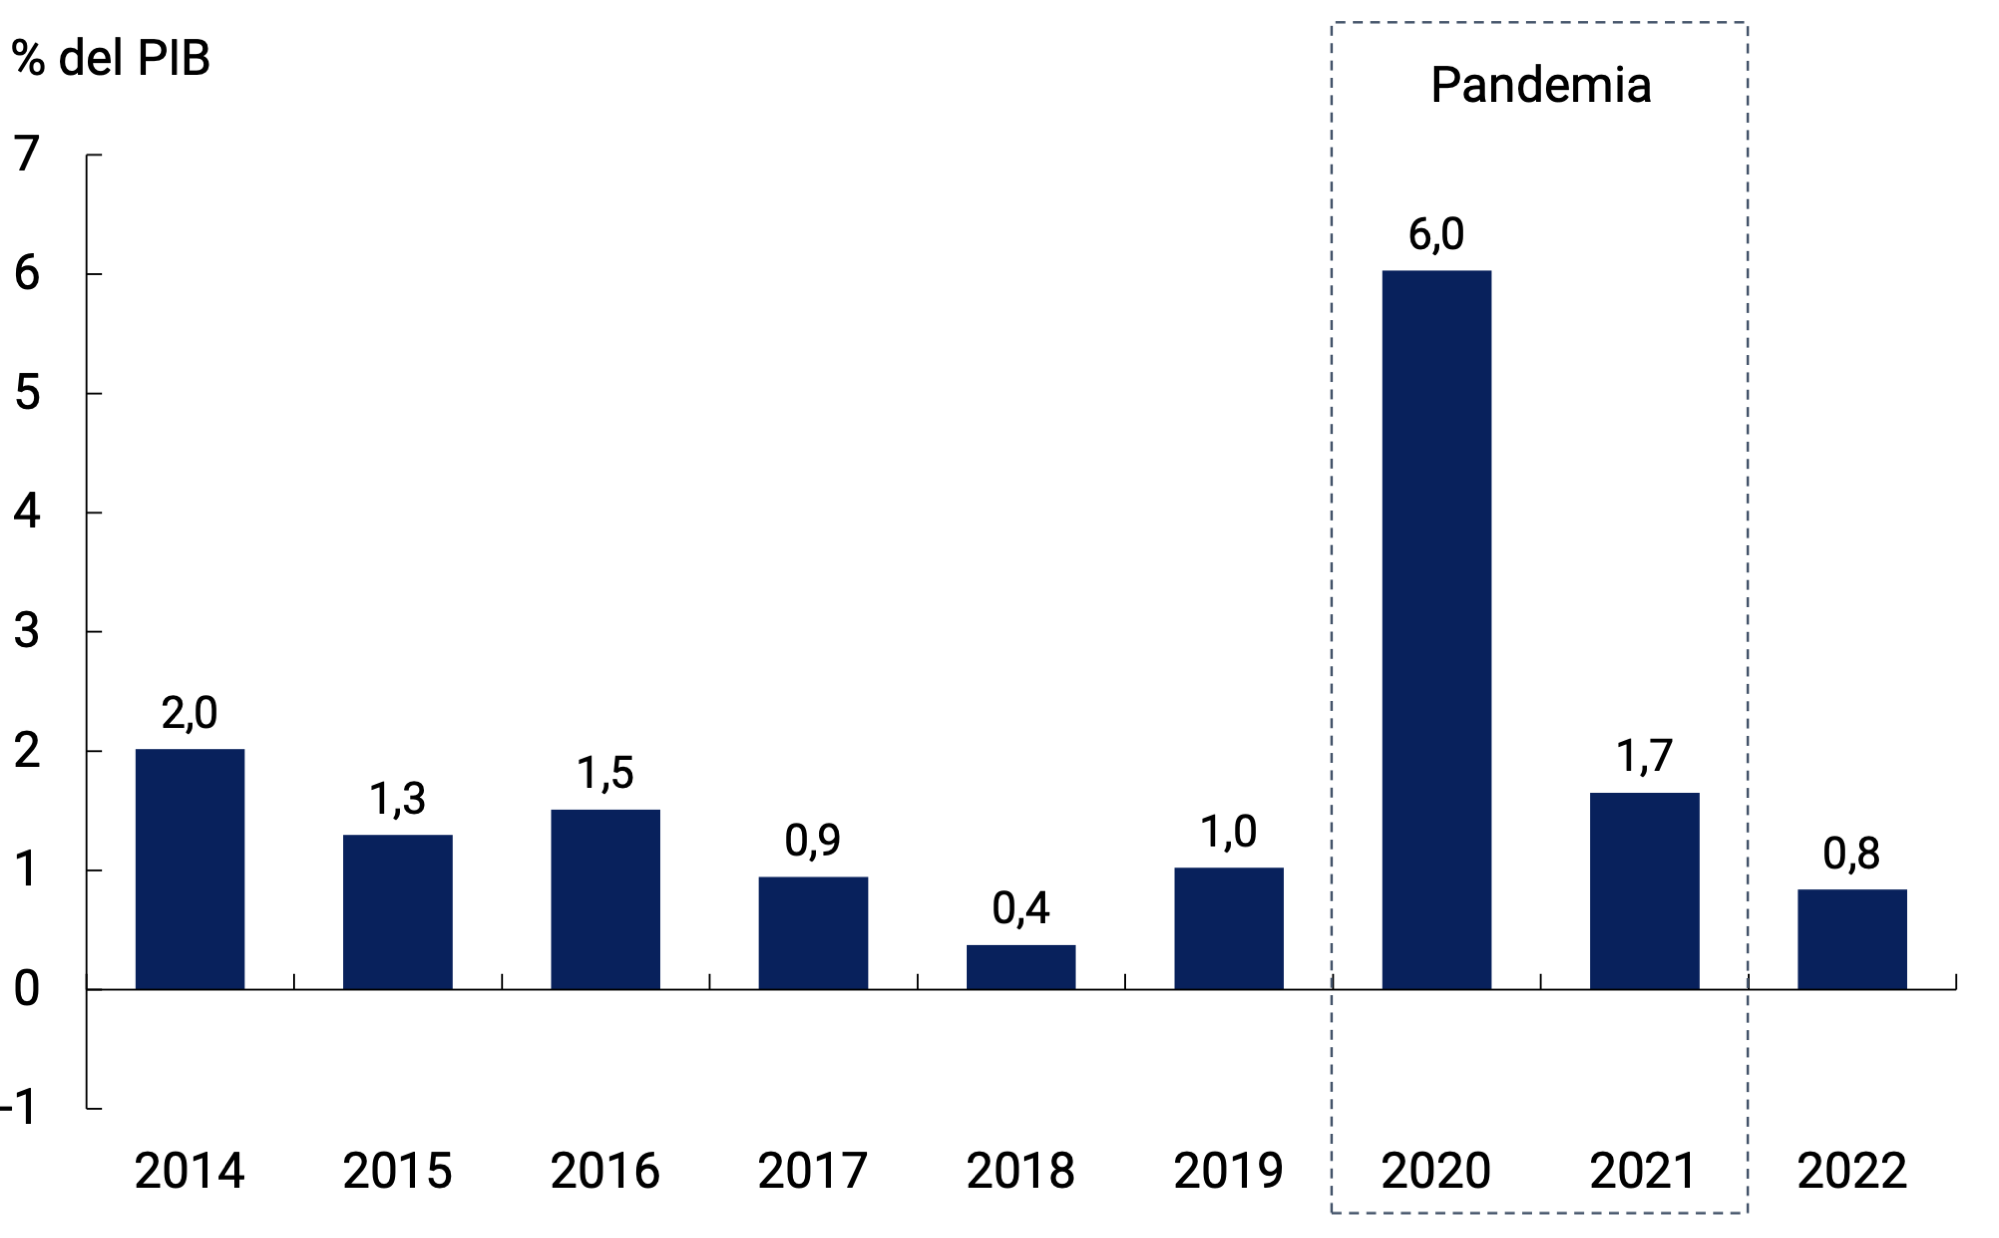
* Includes transfer of profits and transitory advances.
Source: BCRA.
Between June and July, greater volatility was observed in prices in the secondary market for public debt, which led the BCRA to intervene in the market in order to stabilize the prices of Treasury instruments. In this way, the monetary authority reaffirmed its commitment to operate on the yield curve of public debt in local currency, ensuring that returns in the secondary market remain in a reasonable relationship with those determined in the framework of the Treasury’s primary tenders and tending towards a medium-term strategy that allows monetary policy to be conducted using open market operations (see Section 4 / Intervention of the BCRA in the peso debt market).
Also with the aim of limiting financial volatility in the public securities market, the BCRA implemented a liquidity window for this type of instrument in the portfolio of Mutual Funds (FCI). Likewise, it began to offer financial system entities a put option on National Government securities, awarded as of July 2022 and maturing before December 31, 2023.
Operations in the secondary market led to an expansion of the liquidity of the system, which was ultimately channelled into monetary regulation instruments. Thus, between the end of the second quarter and the beginning of the third quarter, there was an increase in the balance of interest-bearing liabilities. These operations would have a limited impact on the BCRA’s balance sheet, since the Treasury securities were acquired under price and yield conditions that are more favorable than those of the interest-bearing liabilities issued to manage the quantity of money. The stock of interest-bearing liabilities of the BCRA reached a value of 8.3% of GDP in August, placing it 2.4 p.p. below the maximum reached during 2018 (see Figure 7.3).
Figure 7.3 | Remunerated Liabilities of the BCRA in terms of GDP
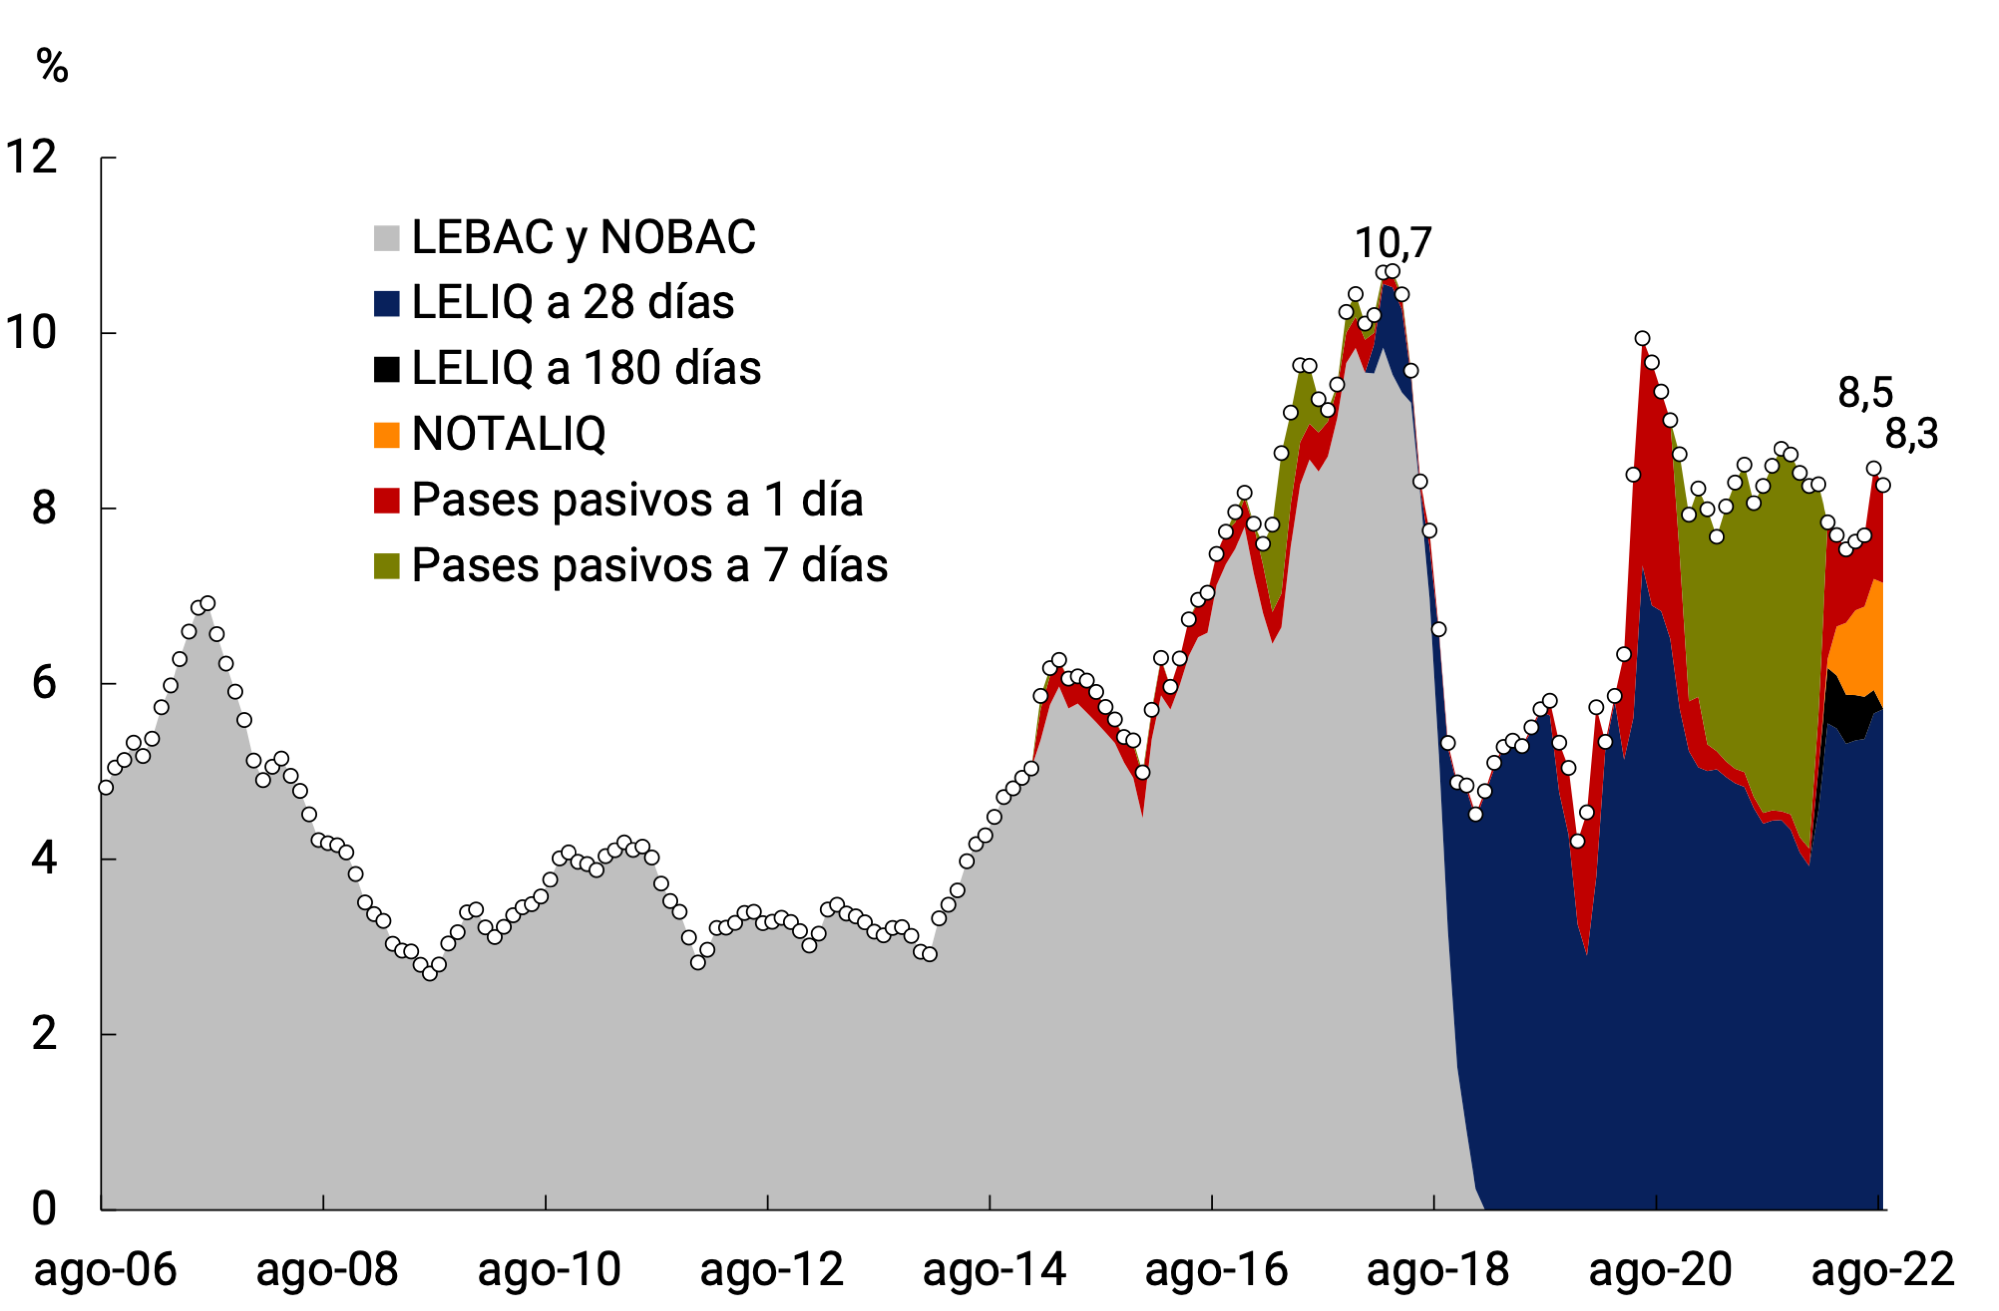
Source: BCRA.
In August, interest-bearing liabilities were made up of around 69% by LELIQ with a 28-day term, 17.3% by NOTALIQ and only 0.1% of the total by LELIQ at 180 days. The rest corresponded to 1-day passive passes (around 13.5% of the total). Thus, the average residual term of the monetary regulation instruments (LELIQ, Pases and NOTALIQ) stood at approximately 26 days on average for August, almost tripling the record for December 2021. Finally, towards mid-September, bills were signed for the first time in dollars and settled in pesos at the reference exchange rate (LEDIV)37.
Currently, the holdings of the BCRA’s interest-bearing liabilities are practically entirely in the hands of financial institutions38. Thus, the monetary policy instruments of the Central Bank are almost entirely in the hands of institutions regulated by the monetary authority itself, fulfilling exclusively their role of liquidity management. These instruments also play a central role as counterparts to a substantial portion of Argentines’ savings. The Central Bank promotes the development of the capital market to channel these savings, but while progress is being made in this direction, the returns on liabilities are what allow financial institutions to remunerate savers while preserving the value of their savings.
In this regard, and with the aim of strengthening the monetary policy transmission channel, a process of simplification of the minimum cash scheme was initiated (see Box. Simplification of the minimum cash scheme). Likewise, and in the same sense, since mid-August the BCRA began to offer 1-day passive passes to Mutual Funds (FCI). The interest rate at which these passes are remunerated is equivalent to 75% of that of passive passes for financial institutions39. These measures are in addition to the current scheme of minimum interest rates for fixed-term deposits in pesos in the private sector.
All these dynamics had an impact on the Monetary Base, both in the second and third quarters. Thus, in the second quarter a slight expansion of the monetary base was observed. Public sector operations, open market operations with public securities, and the net purchase of foreign currency from the private sector contributed positively to the expansion of the aggregate and were partially offset by the contractionary effect of the increase in interest-bearing liabilities. So far in the third quarter, the expansion due to market interventions and the net purchase of foreign currency were partially offset by the rest of the factors, which contributed negatively to growth. Despite the nominal increase in the Monetary Base verified in recent months, adjusted for seasonality and at constant prices, it continued to contract and stands at historically low levels. Thus, in the last twelve months it has accumulated a real fall of around 18%. Similarly, in terms of GDP, at the end of August the Monetary Base would stand at 5%, a figure around the lowest values since 2003 (see Figure 7.4).
Figure 7.4 | Historical evolution of the monetary
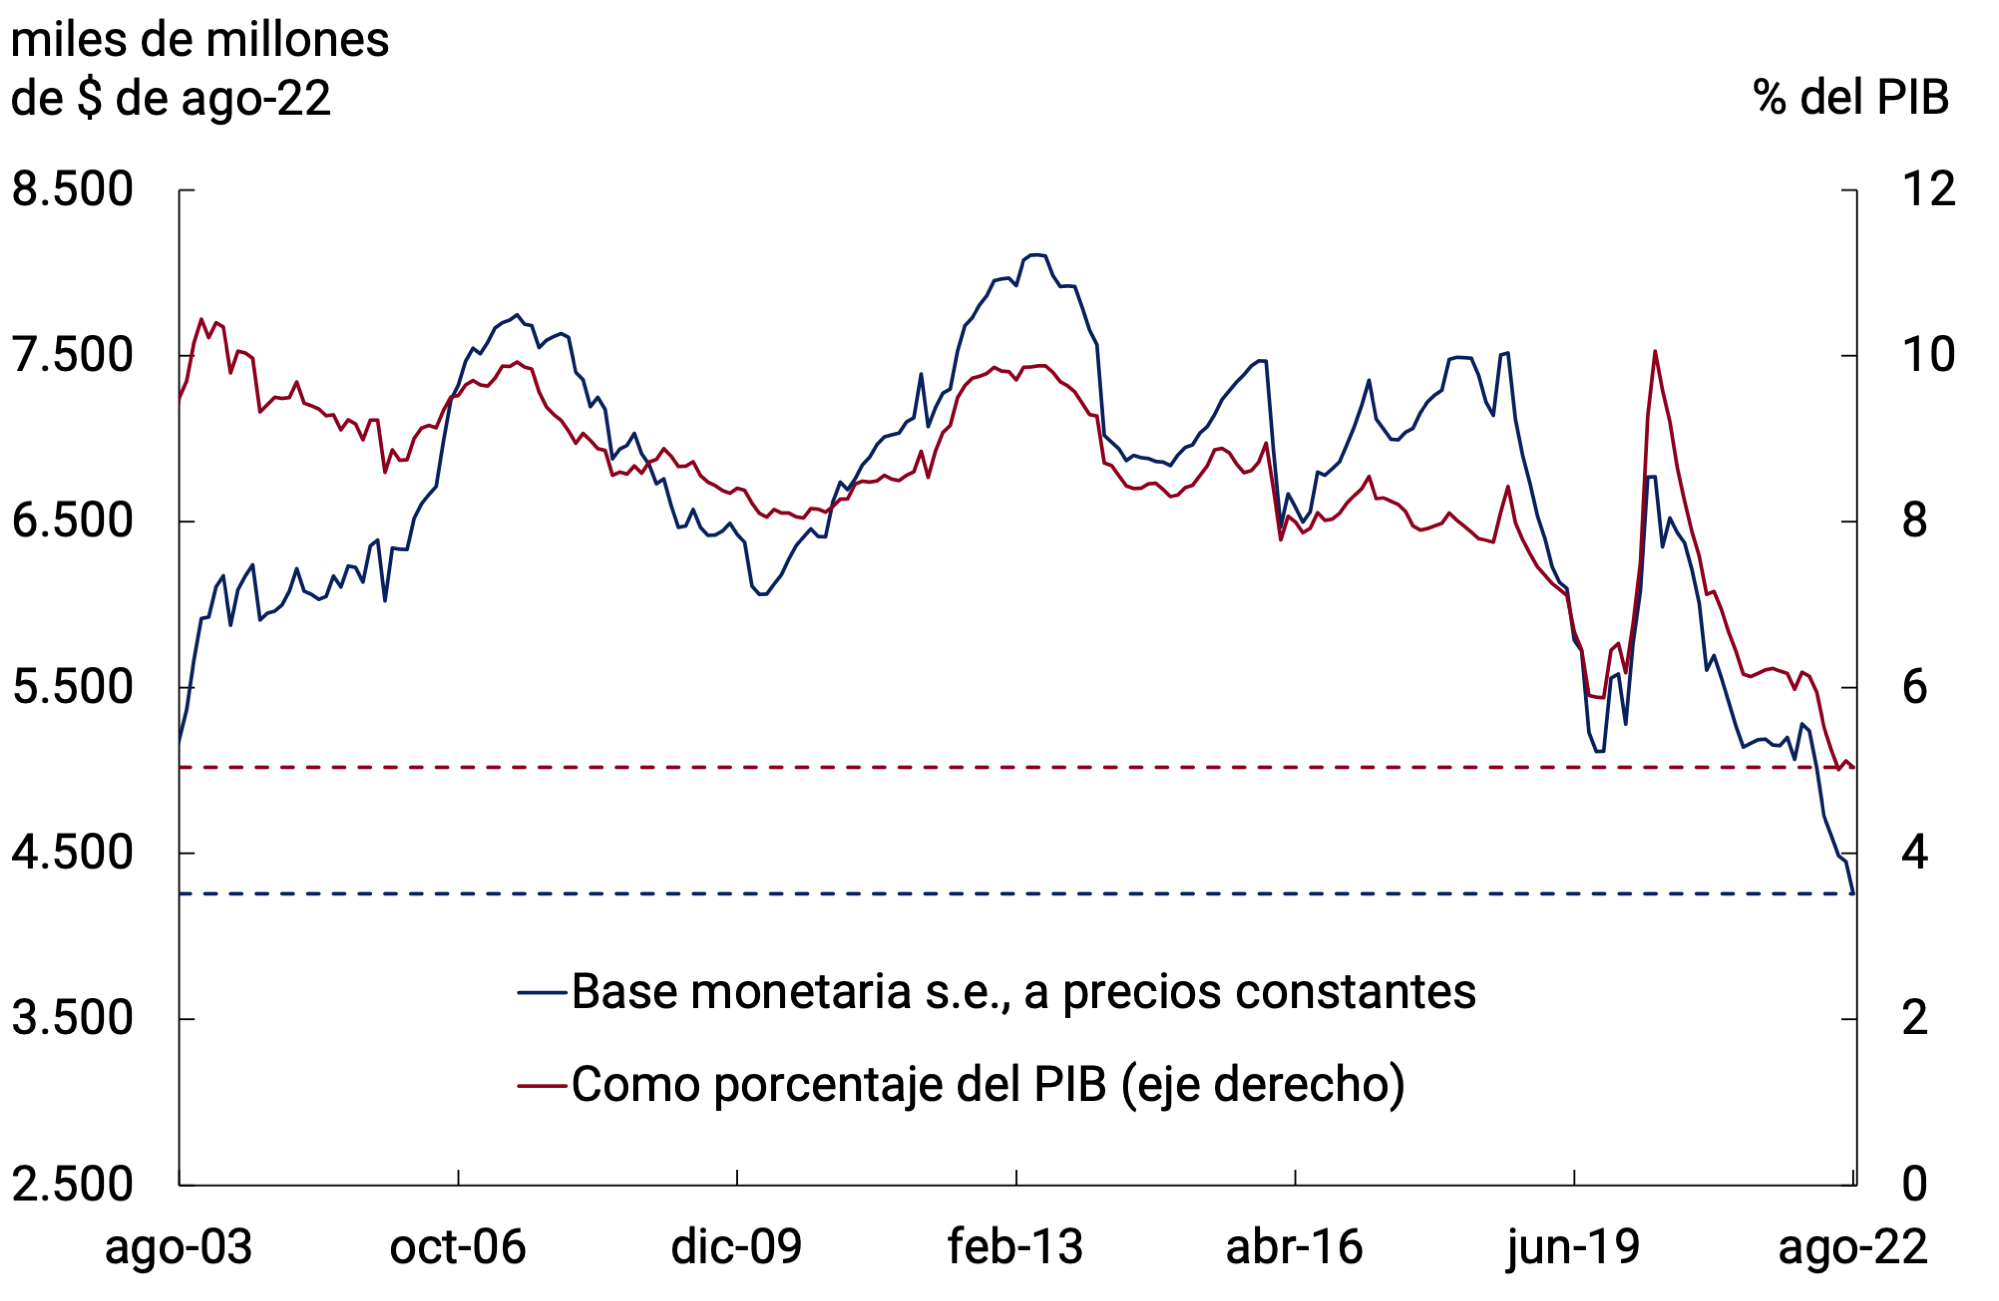
base
Source: BCRA.
Box. Simplifying the minimum cash scheme
In June, the Board of Directors of the BCRA ordered a simplification of the Minimum Cash Regime in pesos (REfMin) to strengthen the transmission channel of monetary policy, which will come into force as of October40.
The simplification contemplates a reduction in the number of deductions, maintaining those that favor productive credit to Micro, Small and Medium-sized Enterprises (MSMEs) and household consumption financing. In addition, the demand rates applied to the items included in the REfMin are recalibrated, so that the monetary effect is neutral.
Specifically, only the franchises associated with the following will be maintained: 1) The share of loans granted to MSMEs over the total, 2) Financing corresponding to the “AHORA 12” Program, 3) Credits included in the “Financing Line for Productive Investment of MSMEs” (LFIP) and 4) Loans granted to individuals and/or MSMEs not reported in the “Central Bank of Debtors of the Financial System” (CENDEU), under certain conditions.
On the other hand, as of October, the franchises associated with: financing within the framework of the health emergency due to COVID-19, financing for the “Zero-Rate Credits”, “Subsidized Rate Loans for Companies” and “Zero-Rate Loans Culture” programs, loans to MSMEs not reported in the “Central of Debtors of the Financial System” (granted until 04/01/2021), will be eliminated. the growth rate in the use of electronic means through demand accounts held by individuals, the evolution of ECHEQ and FCE MSMEs, and the operation of ATMs41. In addition, as of January 2023, the deductible for cash withdrawals made through ATMs will be eliminated42.
In addition, the distinction in minimum cash rates between Group “B” and Group “C” entities43 will be eliminated, as well as the differentiation based on the categorization of localities for financial institutions. 44
This initiative is part of the 2022 Objectives and Plans, allowing compliance with one of the structural reference parameters contained within the extended facilities program with the IMF. The BCRA will continue to evaluate the advisability of making further modifications to the RefMin depending on the situation, taking into account its functions of prudential regulation and monetary policy instrument, and taking into account the capital and liquidity positions of financial institutions.
7.2. Dynamics of the demand for monetary balances
7.2.1. Transactional means of payment in terms of GDP remained at a level similar to that verified prior to the start of the pandemic
The45 transactional means of payment continued to fall in real terms and without seasonality, at an average rate of 3.5% between July and August. This behavior was explained both by the working capital held by the public and by non-interest-bearing demand deposits. Thus, in August, private transactional M2 recorded a year-on-year contraction of 13.3% at constant prices.
In terms of Output, means of payment would have stood at 8.3% in August, among the lowest records in the last 15 years. The working capital held by the public reached a minimum and demand deposits are at values similar to those of the average of recent years. The relative higher demand for demand deposits is explained by the rise of electronic means of payment (see Figure 7.5).
Figure 7.5 | Means of payment in terms of GDP
Series without seasonality
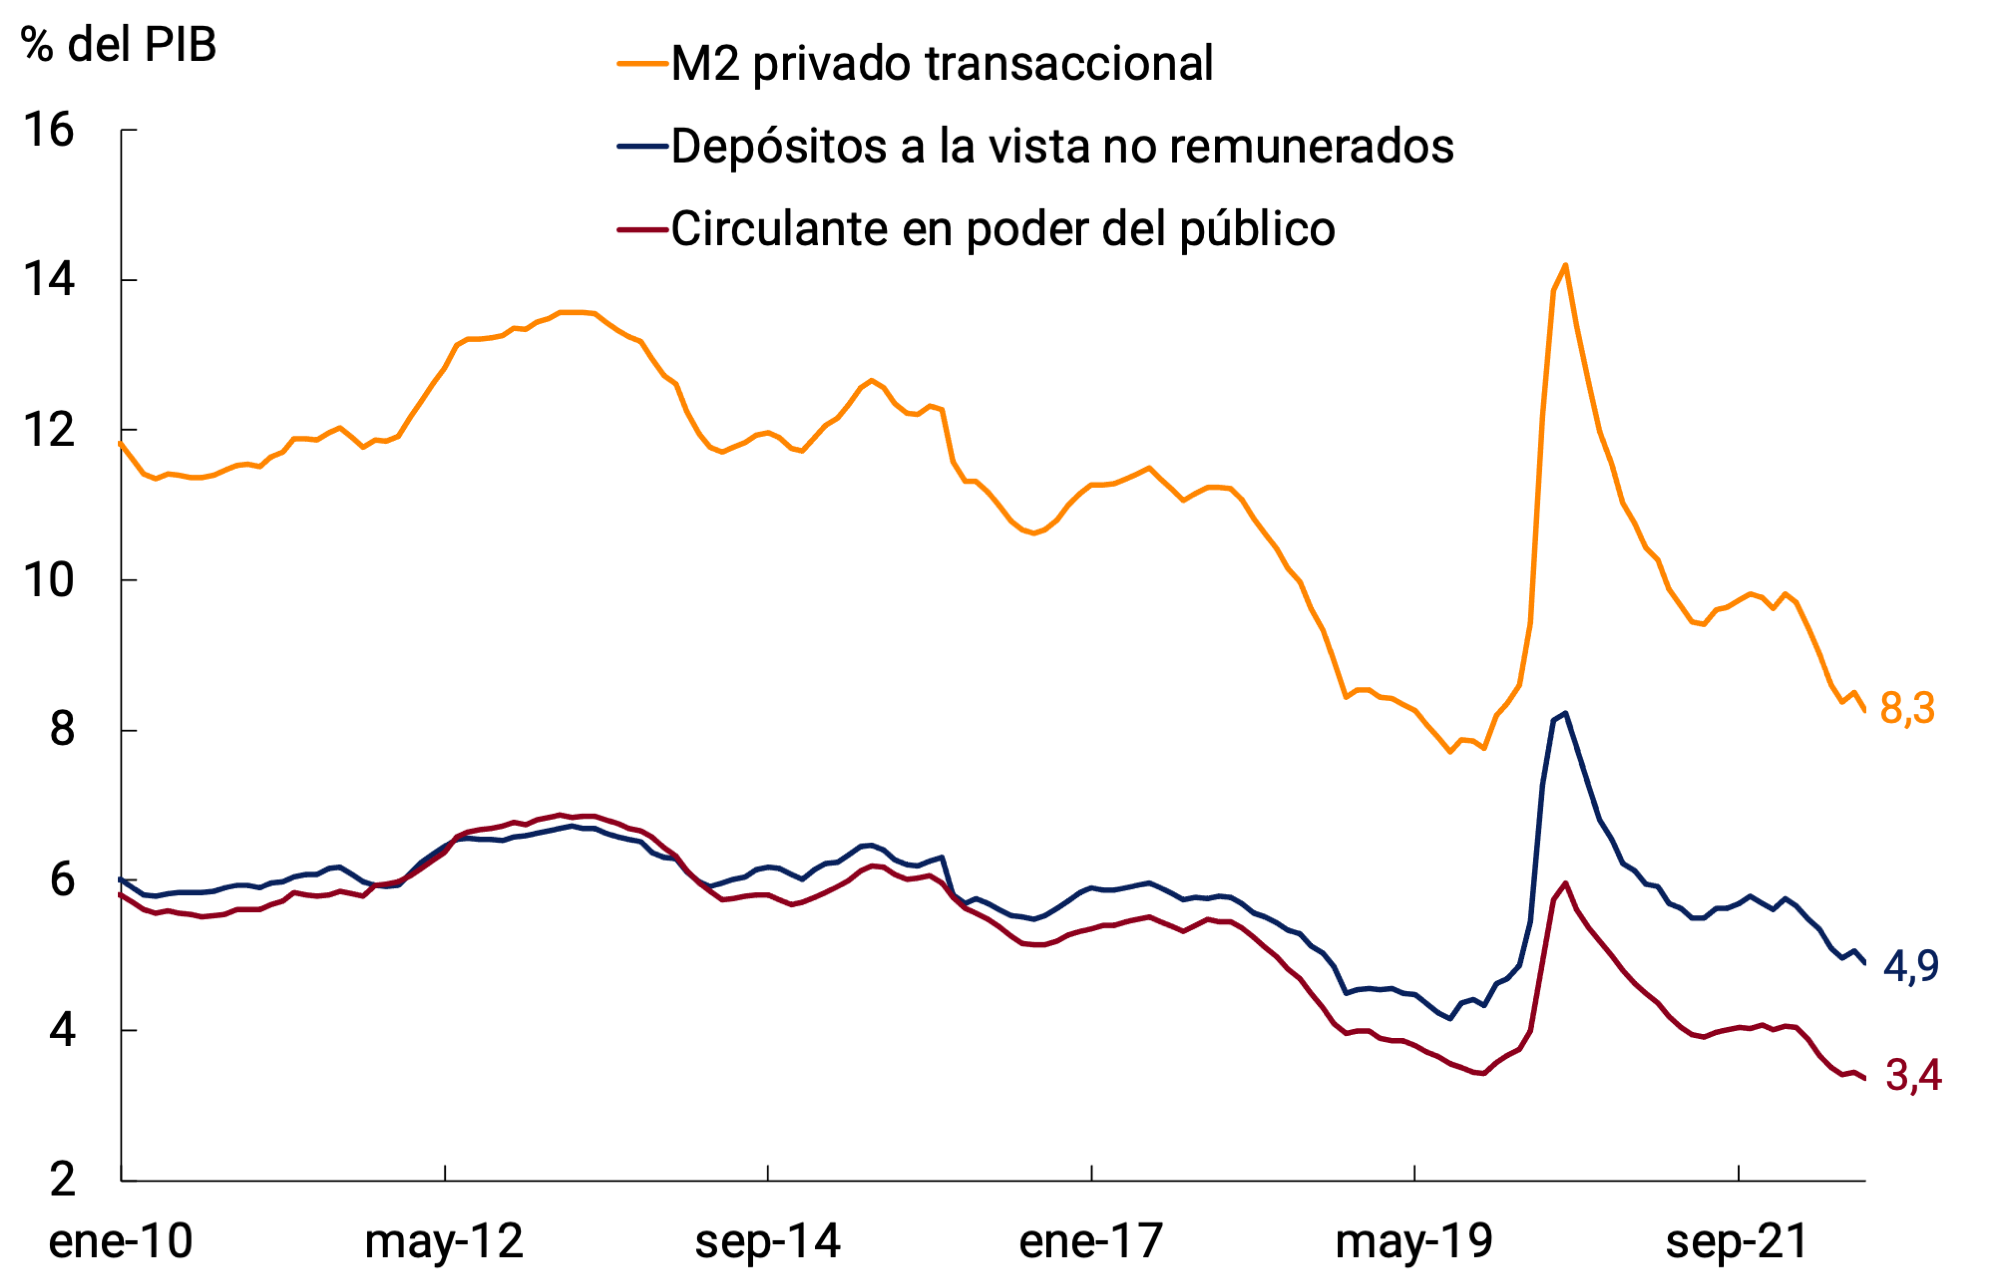
Source: BCRA.
7.2.2. With the rise in reference interest rates, the BCRA also raised the minimum yield on savings instruments in pesos to shore up their demand
The Board of Directors of the BCRA raised the minimum guaranteed interest rates on fixed-term deposits, given the acceleration of inflation and in line with its 2022 Objectives and plans. Thus, since the end of June, the floor for placements of individuals for up to $10 million increased 22 p.p. to 75% n.a. (107.1% y.a.). For the rest, the minimum guaranteed rate rose 16.5 p.p. to 66.5% n.a. (91.1% y.a.). Short-term market rates increased in the period under analysis, in a context of a rise in the 1-day pass rate and the reopening of the pass window for FCI. Thus, the interest rate paid by interest-bearing demand deposits increased by 21 p.p. between the end of June and mid-September, reaching 56.2% n.a. (75.3% y.a.).
Higher rates increased the opportunity cost of holding non-interest-bearing balances, partly explaining the real fall in private transactional M2. These funds were channeled to interest-bearing instruments46, with the FCI Money Market (FCI MM) standing out. The latter opted for relatively liquid instruments, with an increase in their relative share of the portfolio. Thus, between July and August, interest-bearing demand deposits at constant prices and without seasonality expanded at an average monthly rate of 5.4%.
Fixed-term deposits in pesos of the private sector registered relative stability, in real and seasonally adjusted terms, in the same period. However, these remained around their highs in recent years (see Figure 7.6). As a GDP ratio, they increased by 0.4 p.p. compared to June and would stand at 6.7%, also around their highest records in recent years.
Figure 7.6 | Fixed-term deposits in pesos of the private
sector At constant prices and without seasonality
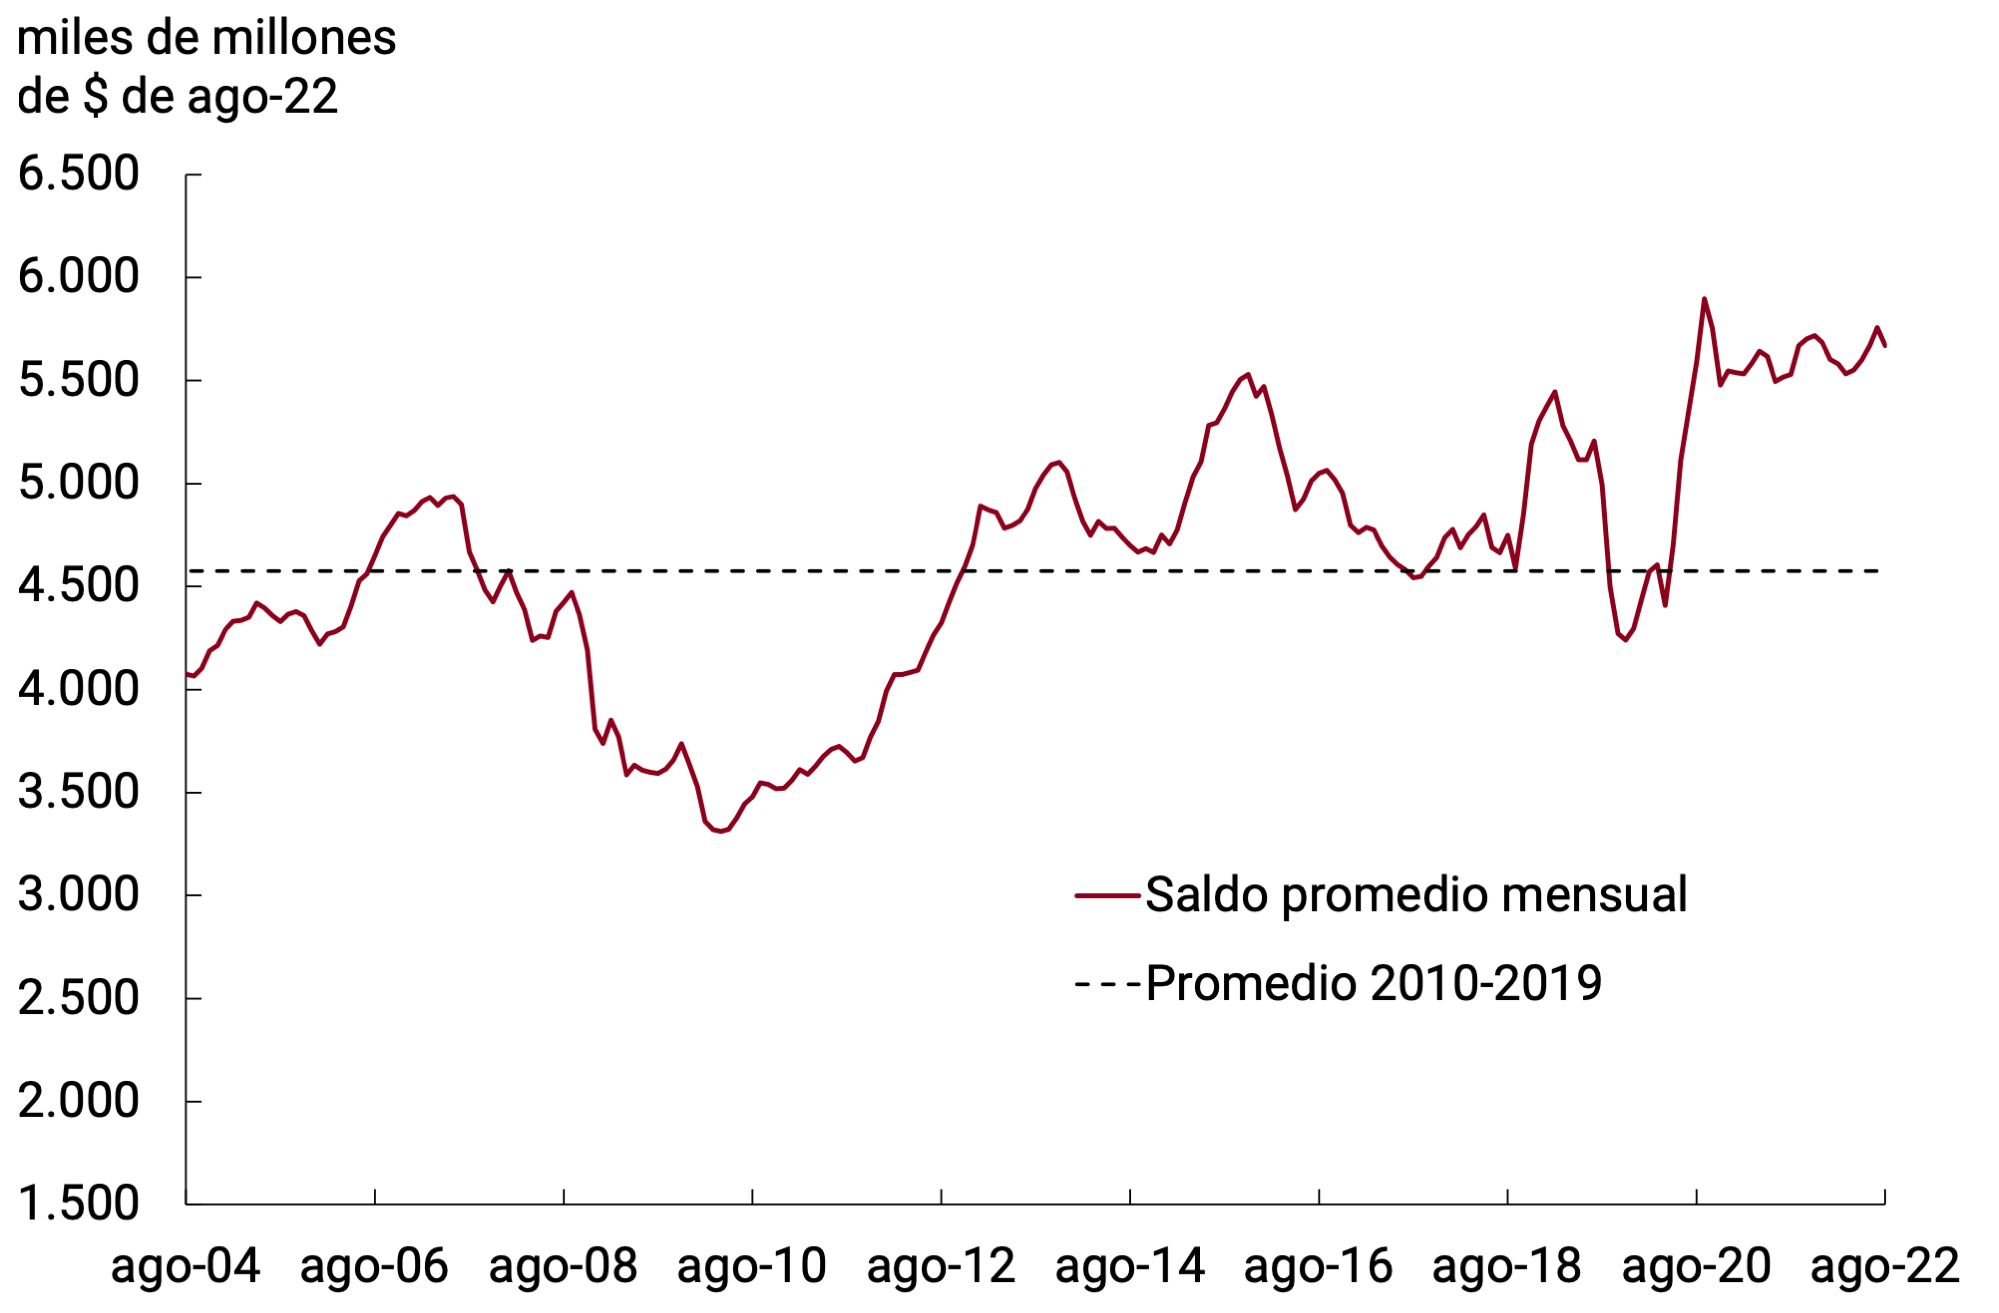
Source: BCRA.
Time deposits of individuals of less than $10 million exhibited a slight drop in real terms between July and August. The rest of the deposits of the non-financial private sector47 increased in the period, almost entirely offsetting the dynamics of the former. Within the latter, Financial Services Providers (FSPs) stood out, and in particular the FCI MM, which represent approximately 90% of this category.
Time deposits with UVA adjustment showed an average monthly growth of 0.5% s.e. real between July and August. However, this average growth corresponds to a rise in July that was partially offset by a drop in August (see Figure 7.7). The decrease observed in the eighth month of the year could be associated with the lower relative performance of these placements given the interest rate hikes promoted by the BCRA and the prospect of a moderation in the inflation rate. At the end of August, the balance of these deposits was $394,000 million (7% of total time deposits).
Figure 7.7 | Private Sector UVA Time DepositsAt Constant Prices
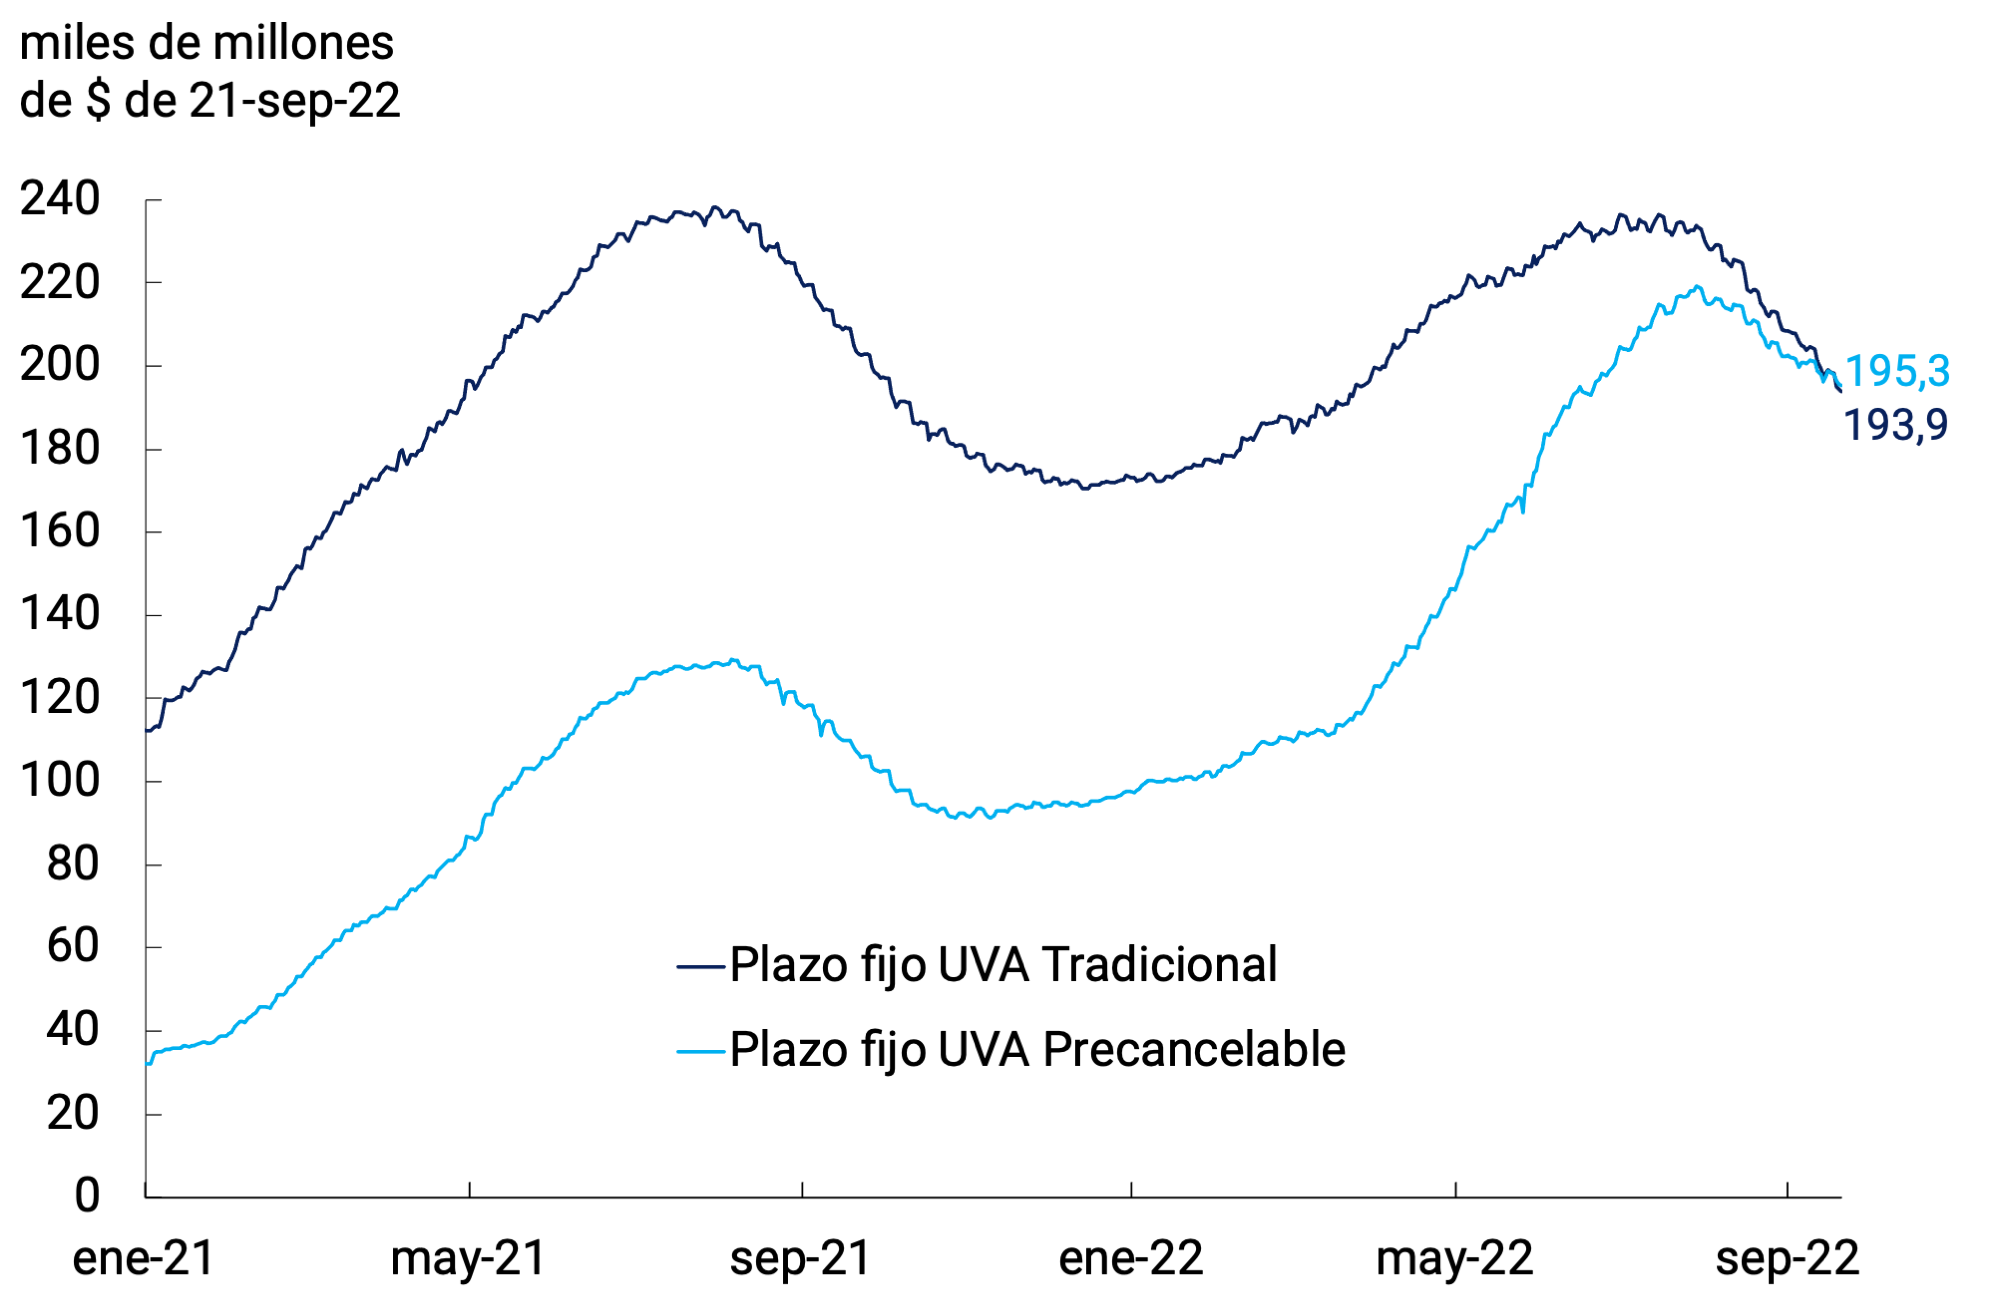
Source: BCRA.
All in all, the broad monetary aggregate M3 private48 registered an average monthly decrease of 1.1% s.e. at constant prices considering the months of July and August (-4.6% y.o.y.). As a Product ratio, this monetary aggregate stood at 16.8%, which implied a fall of 1.3 p.p. compared to the end of last year.
7.3. Credit policy continued to focus on productive development
The continuity in the process of recovery of economic activity, although at a more moderate pace, allowed the BCRA to maintain its credit policy focused on productive development. The Productive Investment Financing Line (LFIP) continued to be the main tool used to channel productive credit to MSMEs under favorable conditions. 49
Since its implementation, and until August 2022, loans granted under the LFIP accumulated disbursements of approximately $2.87 trillion (see Figure 7.8). This implied relative stability in real terms between July and August. At the end of August, approximately 300,000 companies had accessed loans under the LFIP. The average balance since the renewal of the LFIP, with data available as of July, stood at $875,000 million, which represented about 38% of commercial loans and 16% of total credit to the private sector. It should be noted that the validity of this line was recently renewed until March 31, 2023, under conditions similar to those of the previous renewal. 50
Figure 7.8 | Financing granted through the Productive Investment Financing Line (LFIP).
Cumulative amounts
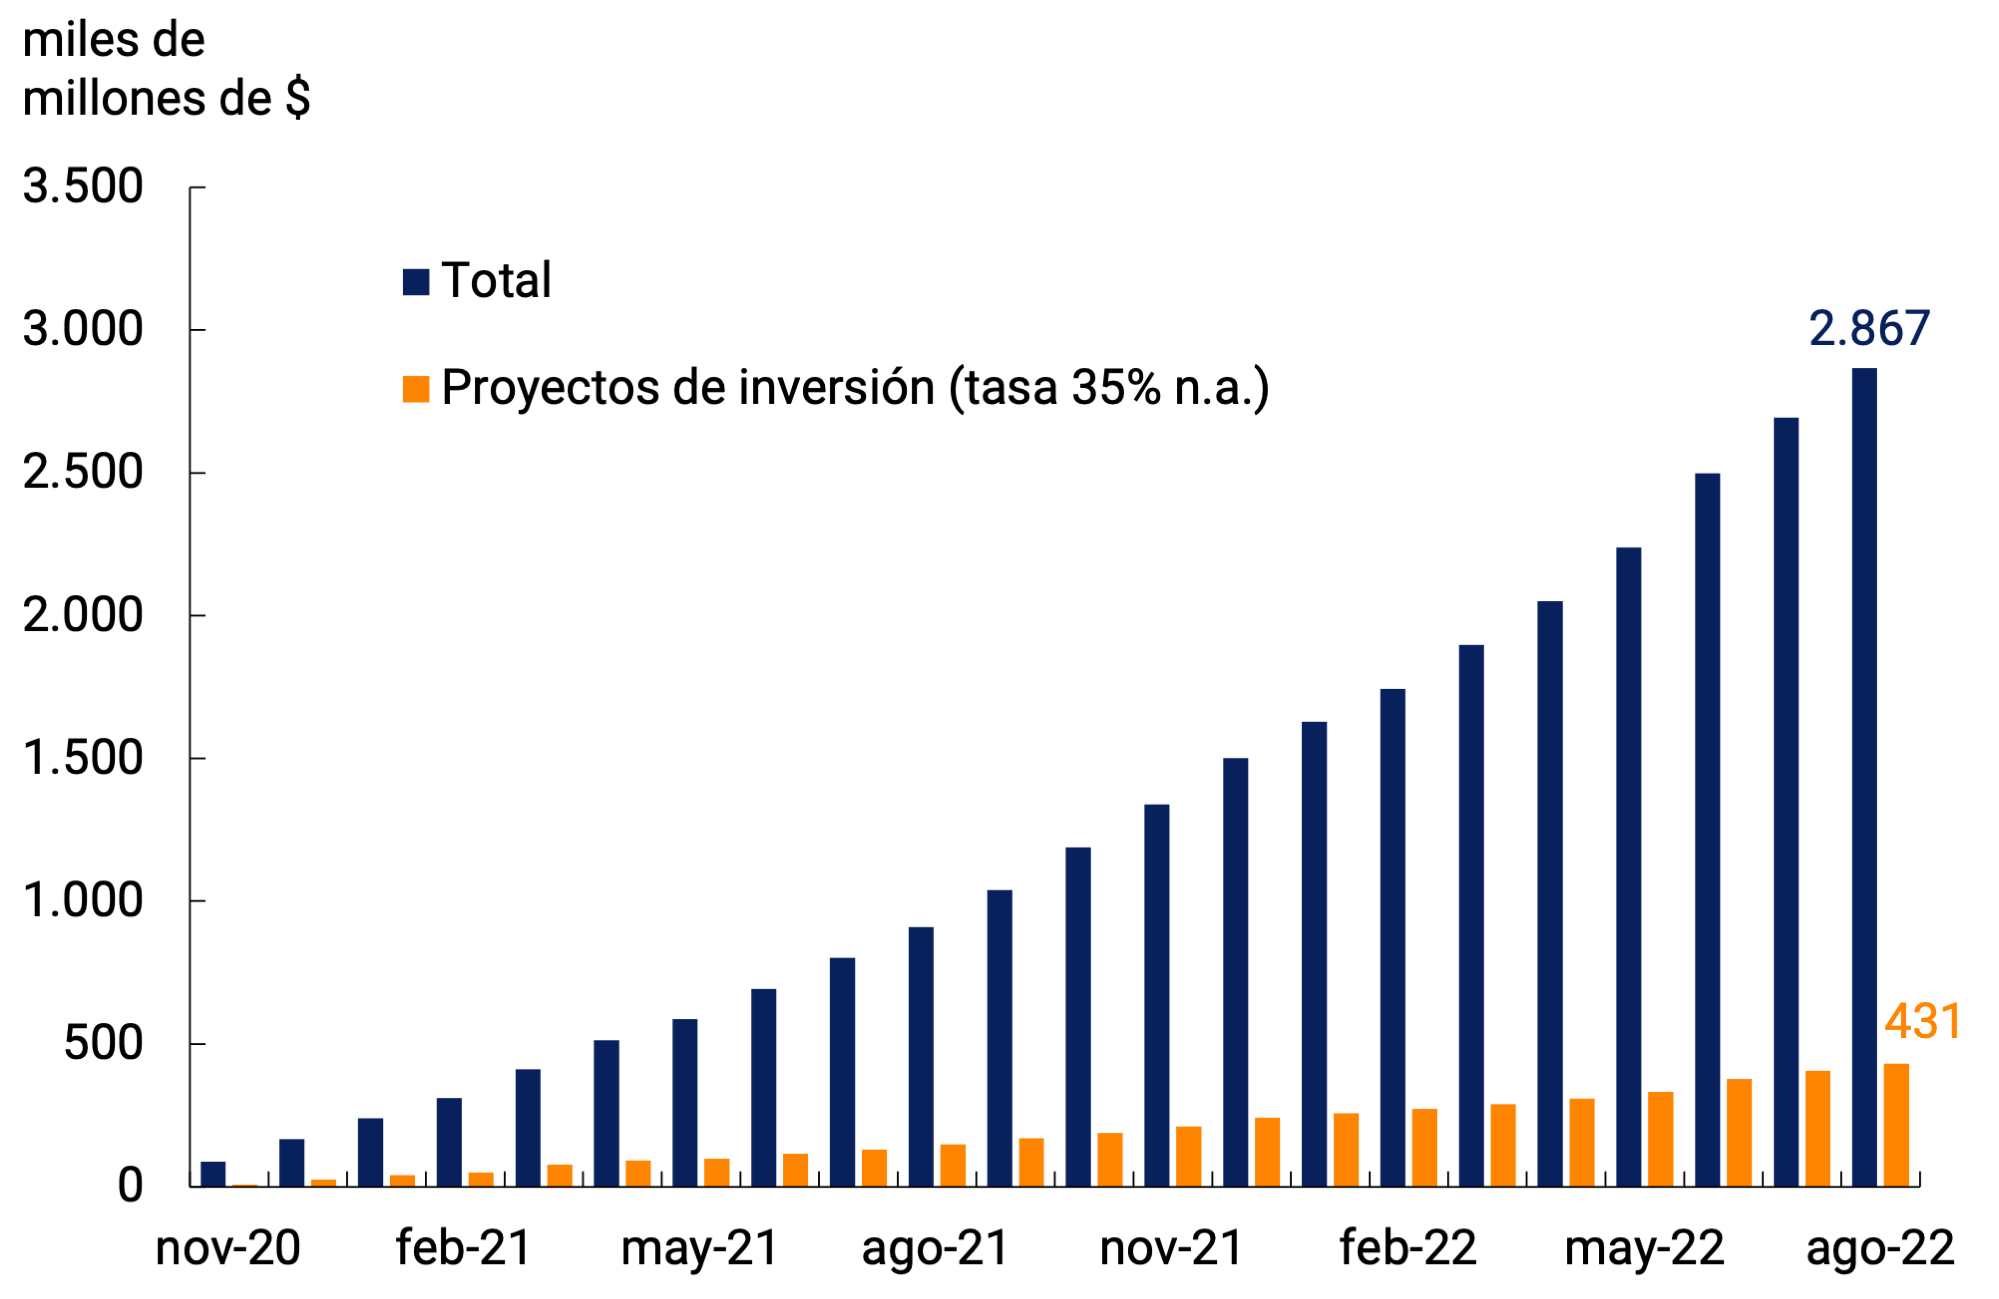
Source: BCRA.
So far in the third quarter, commercial loans exhibited an average contraction of 0.9% per month s.e. at constant prices, although they are 9.3% above the record of a year ago. Within commercial loans, all lines fell measured at constant prices and without seasonality. However, this decrease was more marked in the case of signature-only documents.
When we analyze the composition of commercial loans by type of debtor, it can be seen that loans to MSMEs at constant prices and without seasonality remained stable between July and August, in line with what happened with the LFIP. Thus, in year-on-year terms, credit to MSMEs expanded by approximately 25% (see Figure 7.9). Meanwhile, financing for large companies registered a slight average monthly contraction in the period (-0.9% s.e.) while exhibiting a drop of around 10% compared to a year ago.
Figure 7.9 | Commercial loans to the private sector by type of debtor
Estimated balance at constant prices
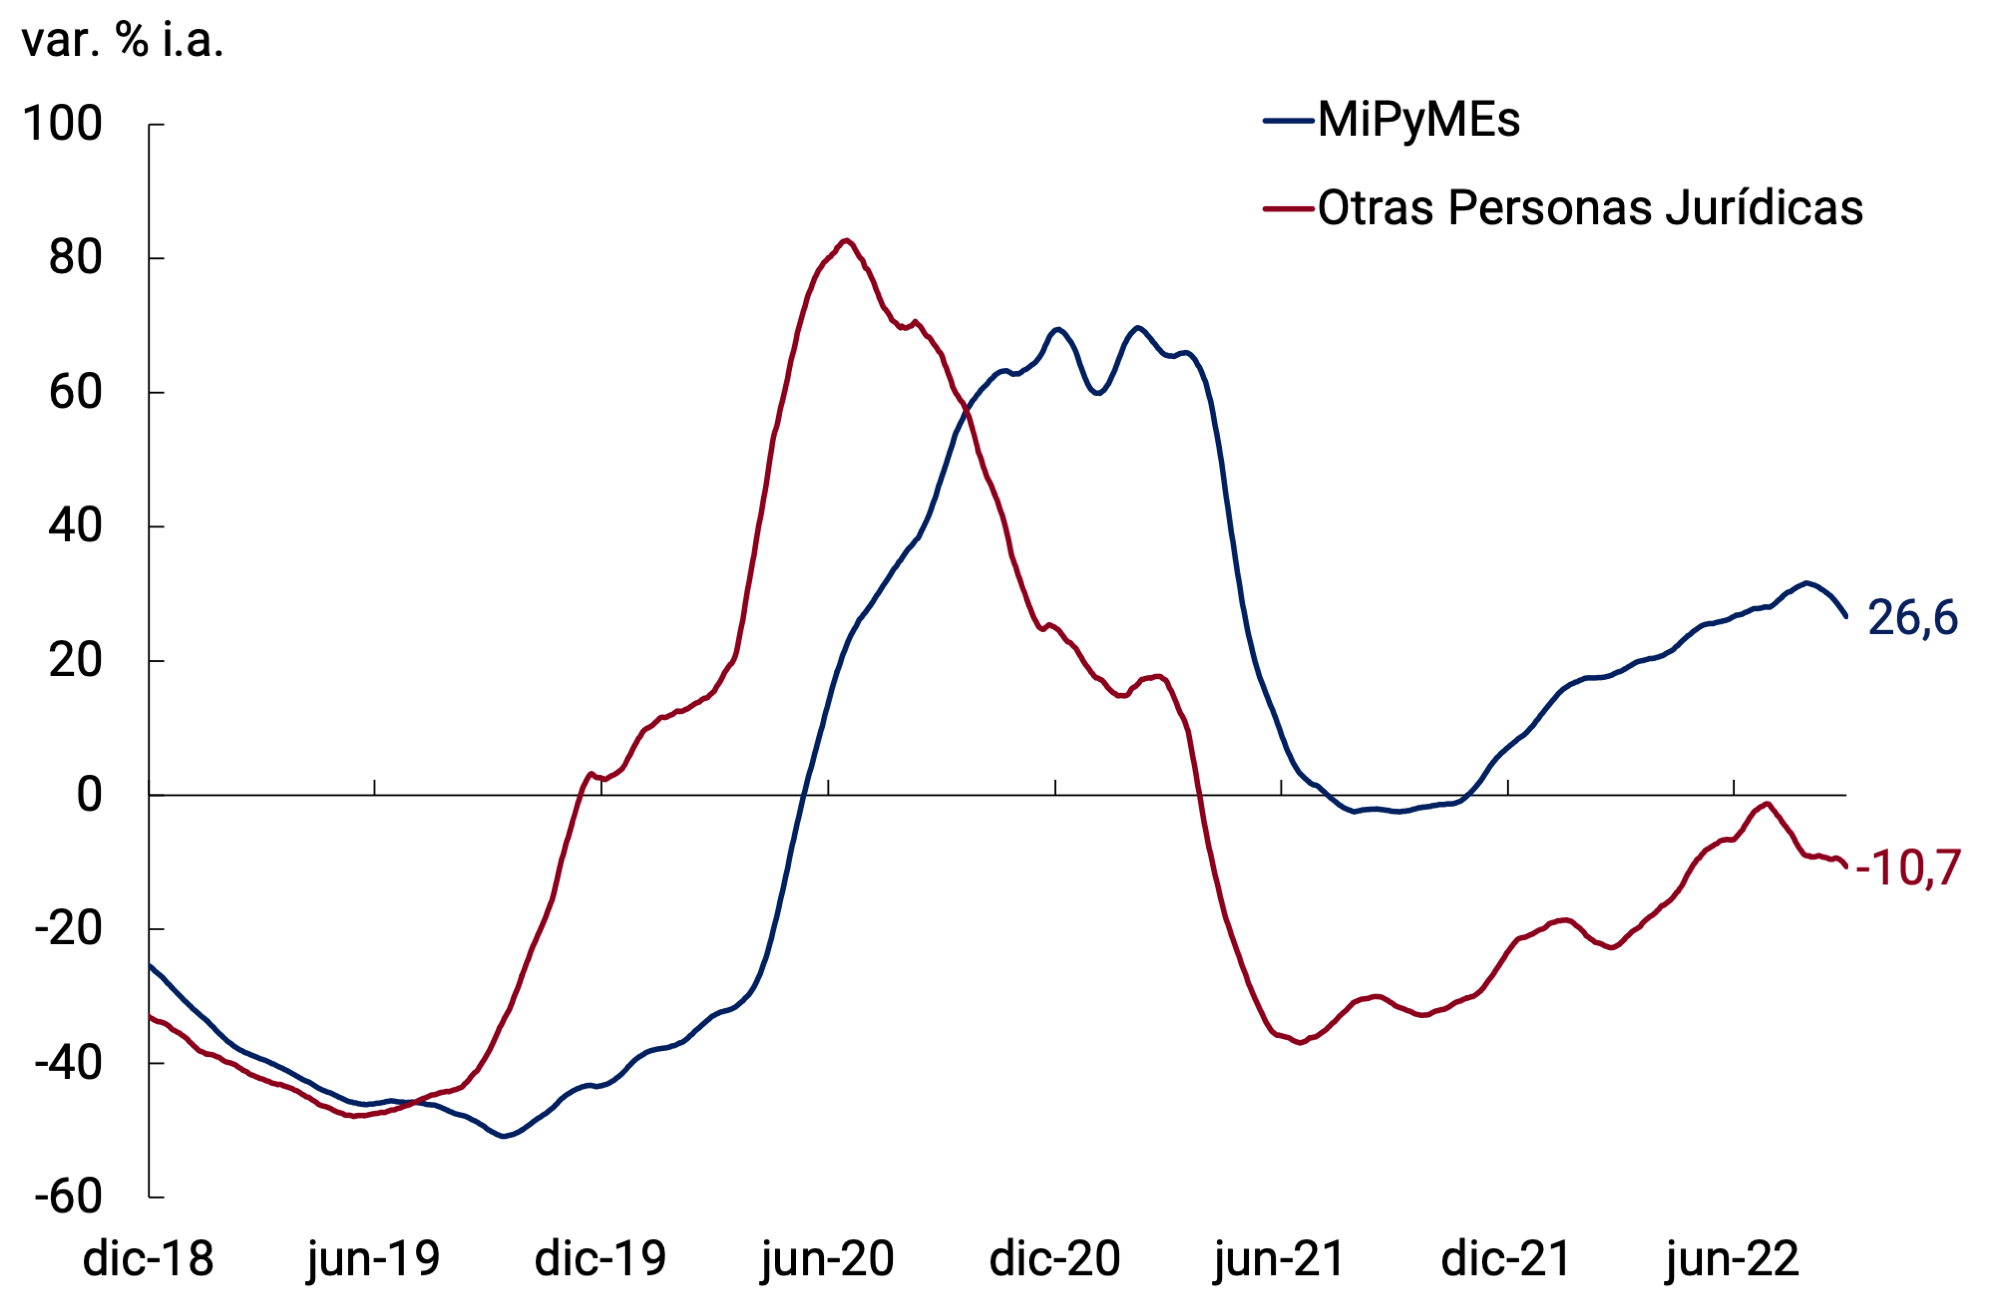
Source: BCRA.
As for the lines with real guarantee, collateral loans contracted in the period at an average monthly rate of 0.9% s.e. at constant prices between July and August. However, in the last twelve months they accumulated an expansion of 29.8%. For its part, the balance of mortgage loans fell at an average rate of 3.6% s.e. per month in real terms, registering a contraction of 19.8% y.o.y. in August.
Among loans associated with consumption, financing granted through credit cards showed an average monthly decrease of 1.9% s.e. at constant prices and are 7.5% below the level of a year ago. Something similar happened with personal loans, whose average monthly rate of change in the July and August quarter was -2.4% s.e. real and -7.5% year-on-year in August.
However, in real and seasonally adjusted terms, loans in pesos to the private sector exhibited an average monthly drop of 1.5% between July and August and practically did not vary compared to a year ago. In terms of GDP, bank financing in pesos to the private sector amounted to 6.8% in August (see Figure 7.10).
Figure 7.10 | Loans in pesos to the private sector as a percentage of GDP
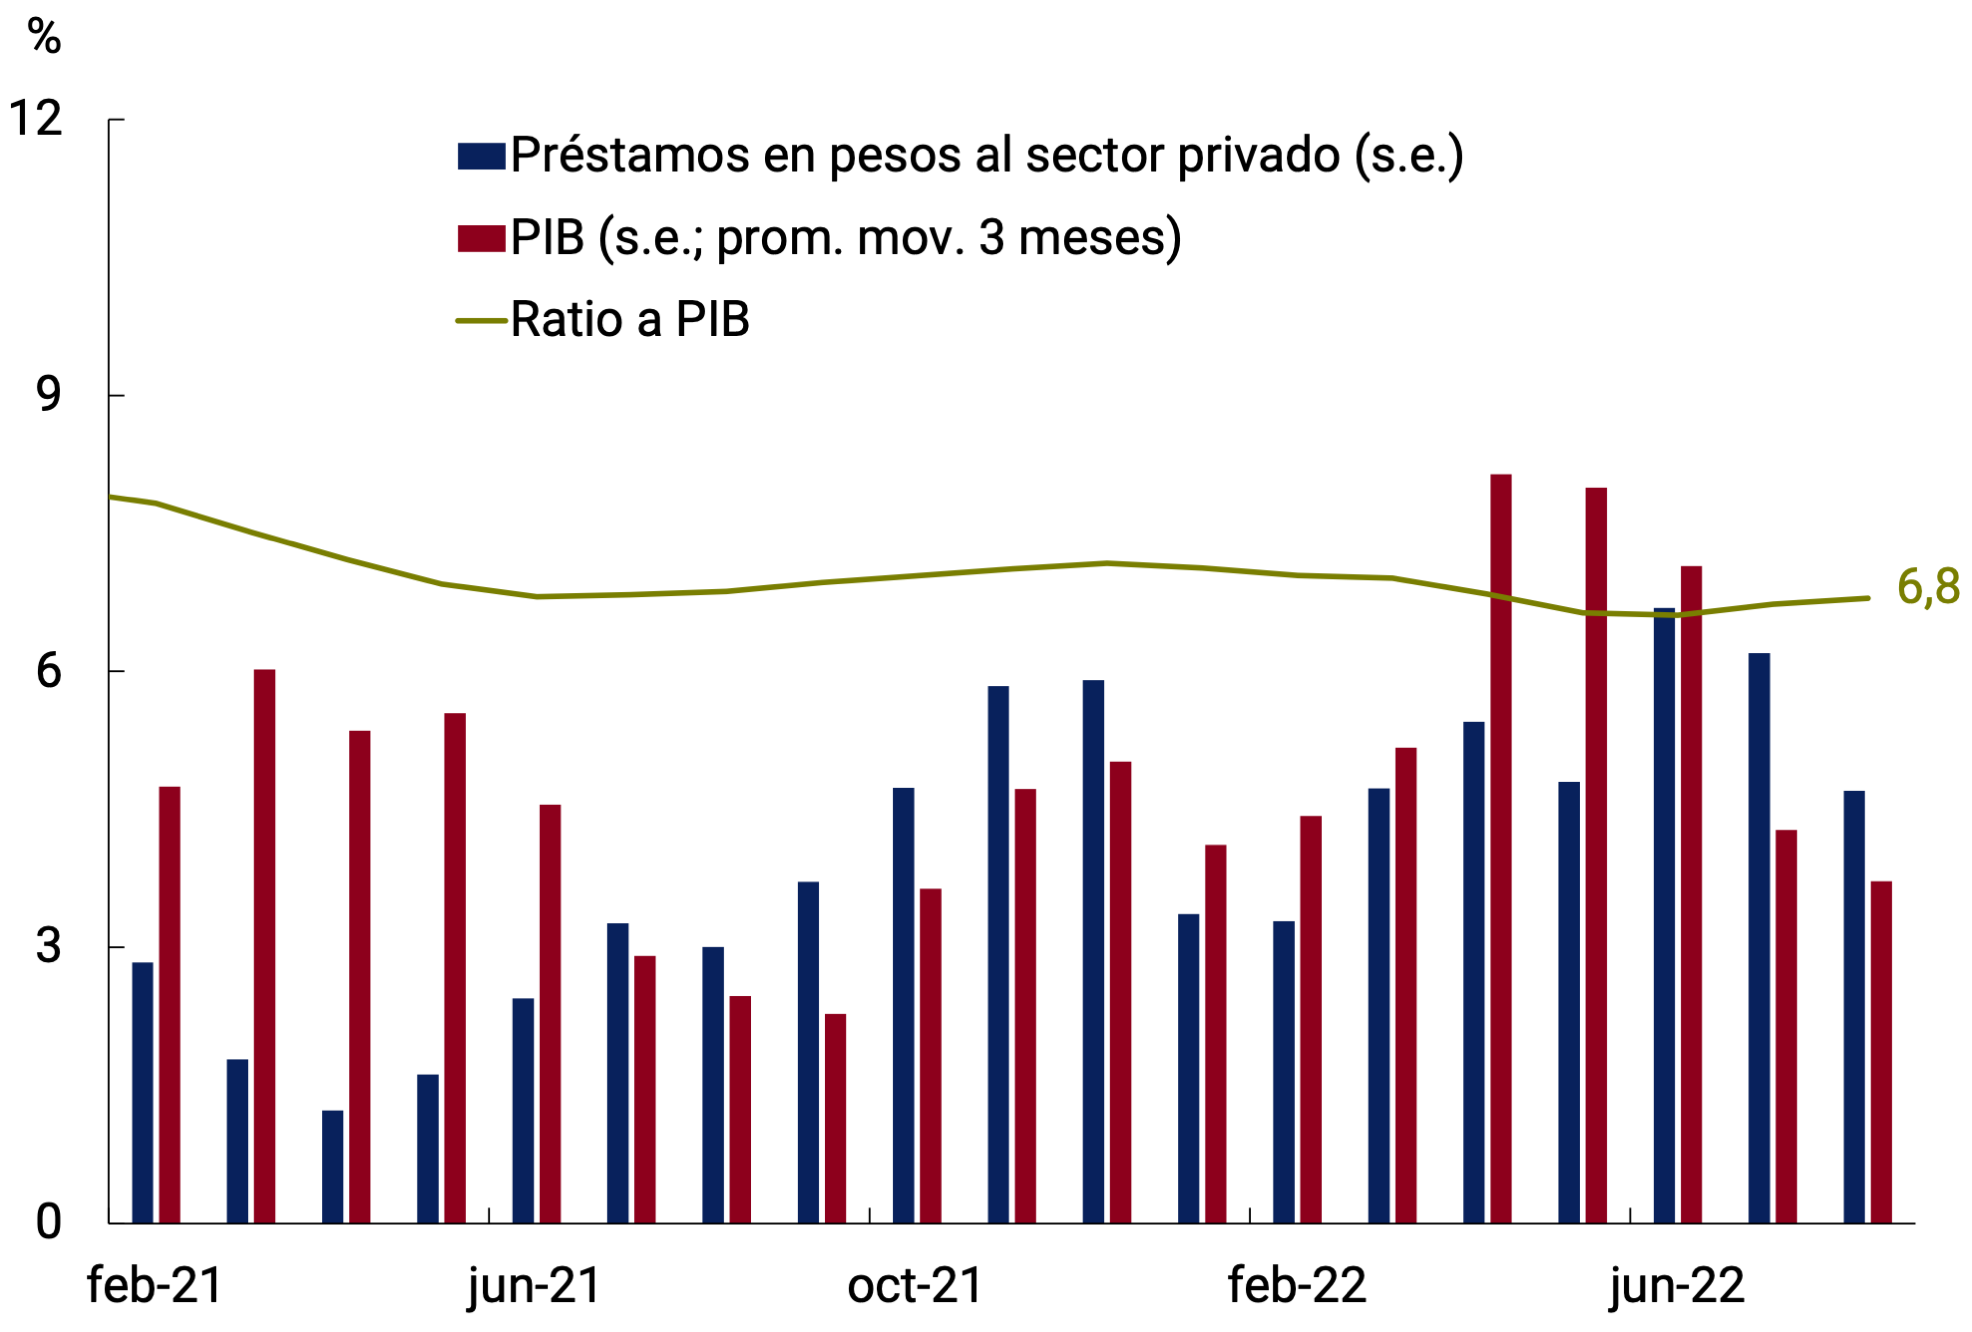
Source: BCRA.
7.4. Exchange rate policy continued to be adapted to meet the needs of the situation
In recent months, the BCRA has continued to gradually adjust the daily variation in the exchange rate within the framework of the current managed floating regime, in order to maintain adequate levels of external competitiveness (see Figure 7.11). In this way, it sought to strengthen the position of International Reserves, based on the genuine income of foreign currency from the external sector.
Figure 7.11 | Monthly variation in the nominal
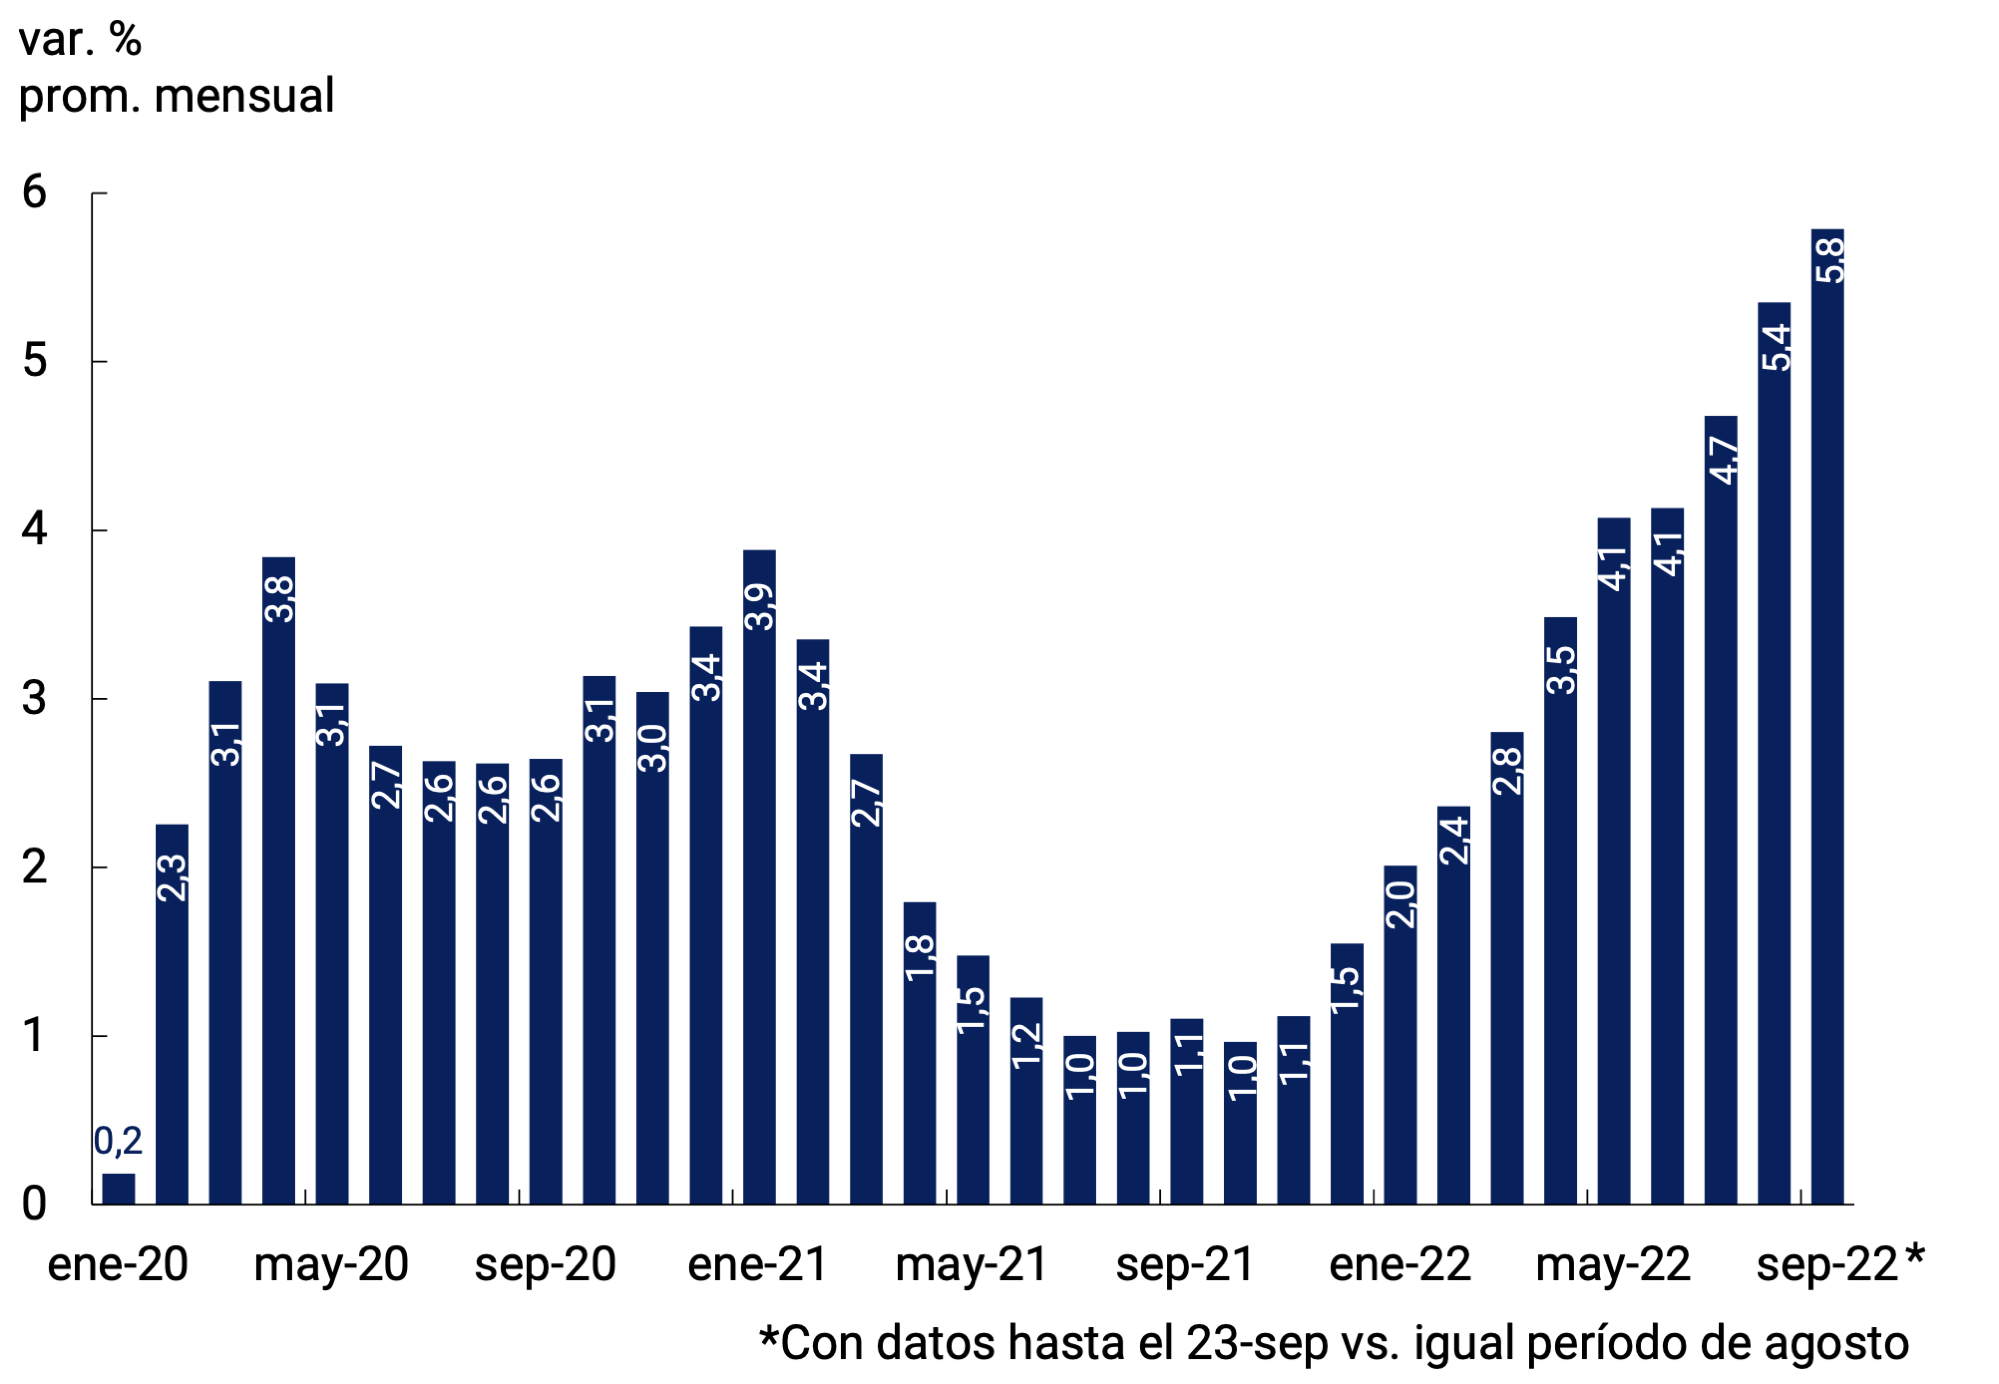
exchange rate
Source: BCRA.
At the same time, the regulatory framework of the foreign exchange market continued to be adapted to the needs of the situation, in order to preserve monetary and exchange rate stability. 51 To increase the supply of foreign currency, progress was made in various lines of action. Among these are the policies aimed at the sale of the soybean harvest. Although this policy has been changing in recent months, the “Export Increase Program” is currently in force. 52 This program will allow exports of soybeans and their by-products to be settled between September 5 and 30 at an exchange rate of $200 per dollar. In addition, those producers who have sold more than 85% of their 2021/22 harvest will be enabled access to the programs that are created for the 2022/23 campaign. For other sectors exporting goods, they will be allowed until November of this year, to access demand accounts with adjustment based on the reference exchange rate, for those who advance by at least 30 days with respect to the period determined for each sector. Also linked to the supply of foreign currency, the liquidation requirement for individuals and legal entities linked to the knowledge economy was relaxed, subject to compliance with a series of requirements.
A series of measures were also taken to improve efficiency in the allocation of foreign currency, including: the incorporation of exceptions and particular regulatory frameworks for imports linked to certain productive activities, with the aim of responding to the extraordinary needs for foreign currency to meet energy imports, promoting the development of SMEs and sustaining economic growth; it was also allowed that beneficiaries of pension income can collect them in a bank account owned by them abroad; The collection on account of the income tax or on personal assets (as applicable) was raised from 35% to 45% for payments registered by credit card in foreign currency abroad53; the possibility of financing in installments the purchases of products or services from abroad and consumption in duty-free stores was restricted; and, finally, access to the foreign exchange market for the purchase of foreign currency and the performance of transactions with securities and securities with settlement in foreign currency was limited to beneficiaries of subsidies in public services54 and to legal entities that have sold soybeans within the framework of the Export Increase Program.55
The BCRA’s International Reserves stood at US$36,075 million as of September 23, 2022, reflecting a reduction of US$6,711 million compared to the end of June (see Figure 7.12). The dynamics of these months were impacted by payments to said agency for a total of US$5,015 million (US$4,563 principal and US$452 interest), which were faced, in part, with the second disbursement of the PFE in force that took place at the end of June. Other debt payments of the National Government, the losses on valuation of net foreign assets and the fall in the current account balances in the BCRA of financial institutions also had a negative impact. Finally, net purchases of foreign currency from the private sector were in positive territory, driven towards the end of the period by the liquidation of foreign currency from the soybean sector, partially offsetting the rest of the factors.
Figure 7.12 | International Reserves
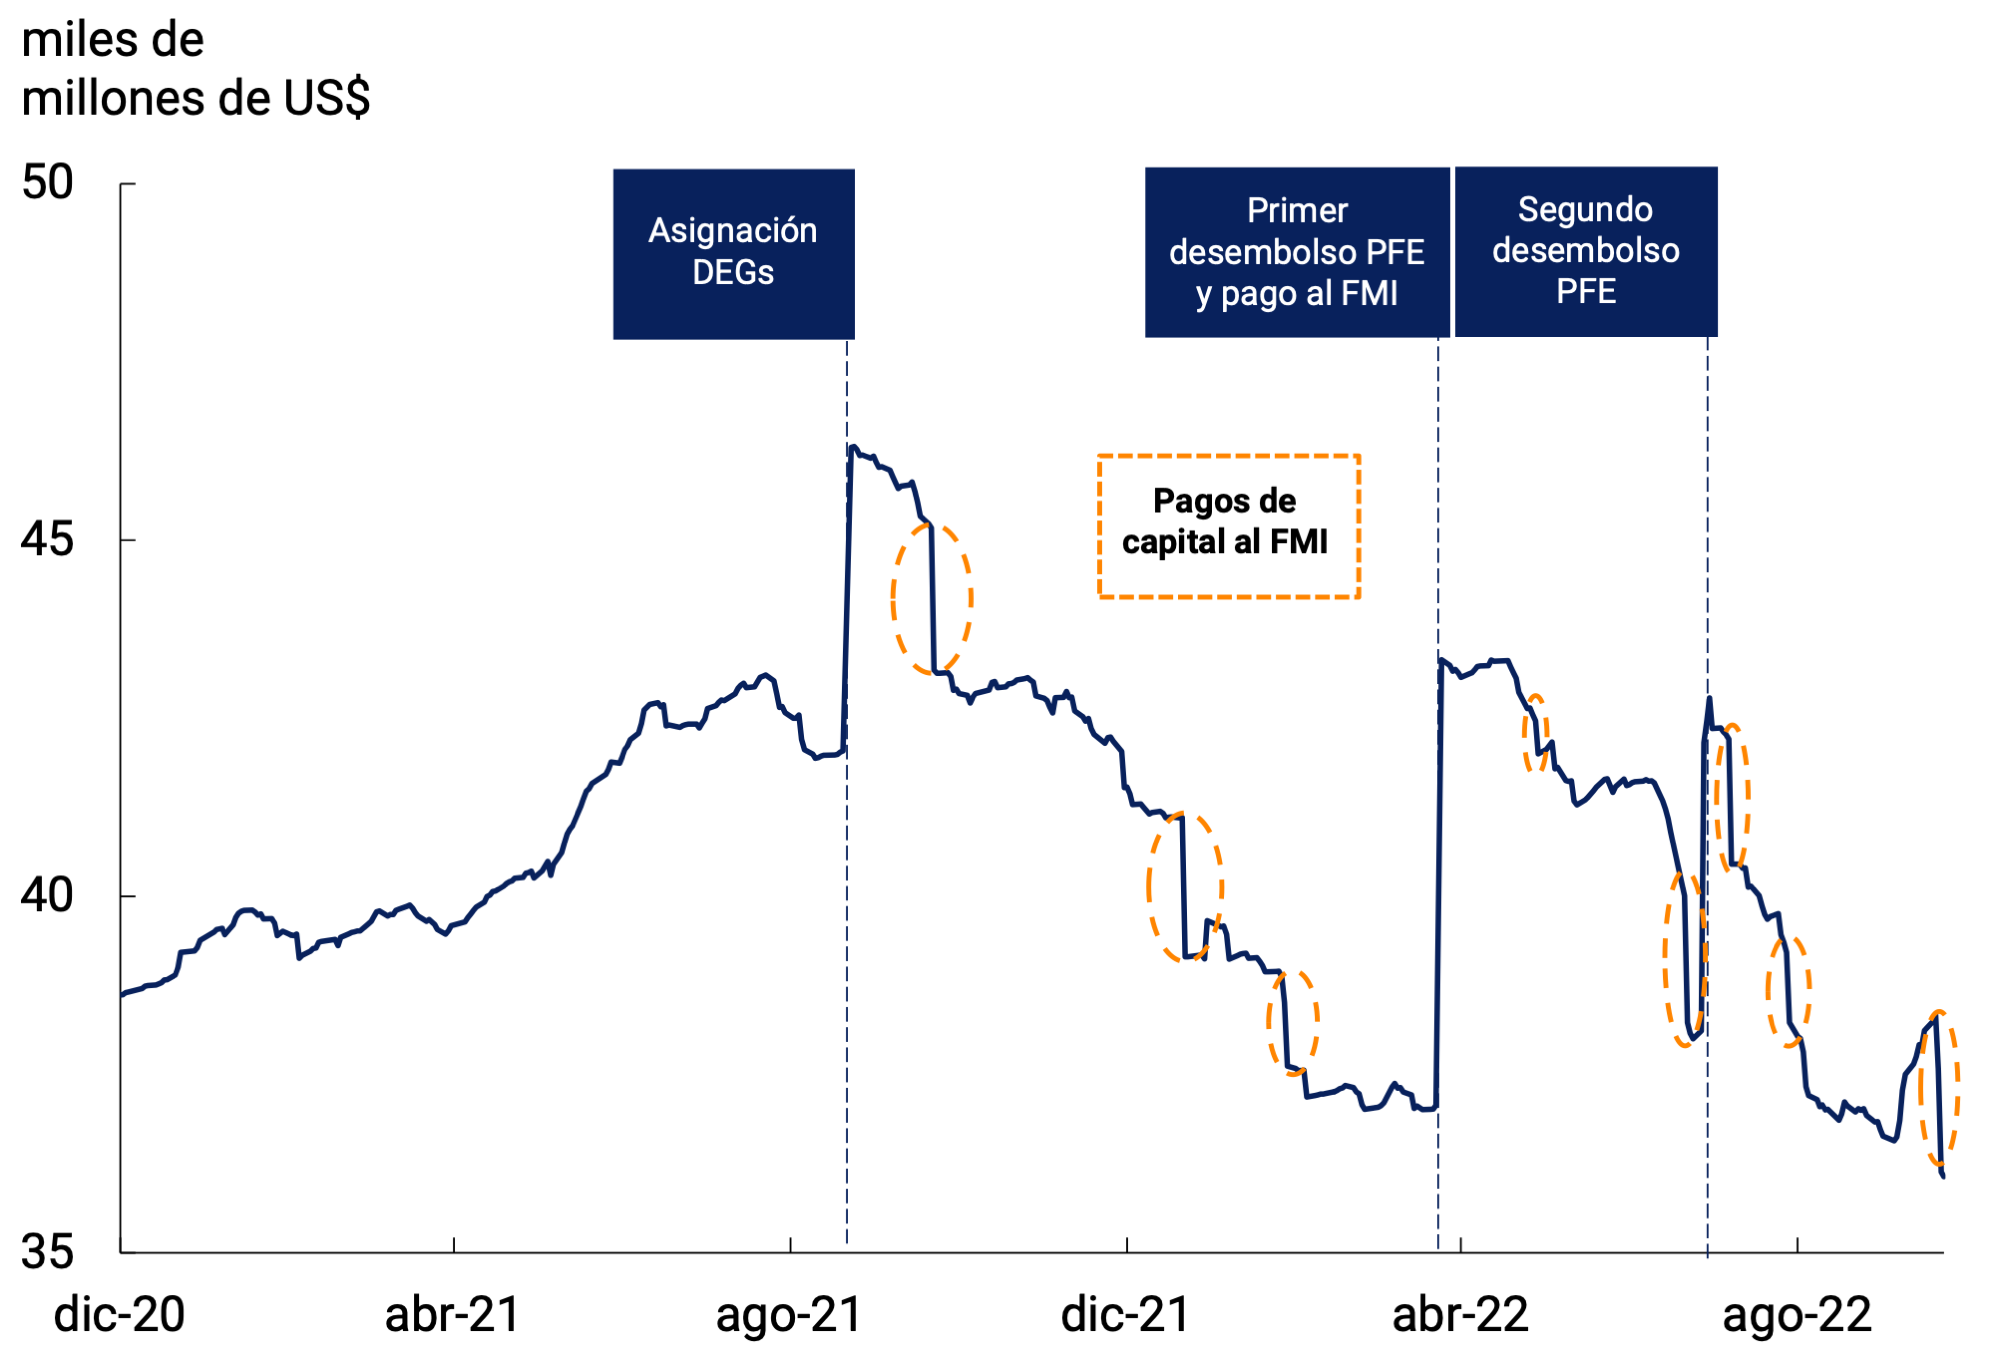
Source: BCRA.
7.5. Monetary policy outlook for the remainder of the year
Volatility in the local financial market, among other factors, led to higher inflationary pressures in the last two months. In this scenario, the BCRA’s intervention in the secondary market was essential to stabilize the prices of Treasury instruments. To deepen this line of action, the BCRA seeks to gradually converge towards managing the economy’s liquidity through open market operations (OMA) with Treasury bills and other short-term securities denominated in local currency. This type of mechanism is similar to that used in other countries and is in line with what is expressed in the Memorandum on Economic and Financial Policies within the framework of the current program with the IMF, where this reform is considered a convenient alternative to reduce the quasi-fiscal cost of monetary policy. To achieve this, the local capital market must assume an increasing importance in the financing of economic actors (public and private).
The BCRA will continue to calibrate its policies with the aim of lowering the inflation rate. In terms of interest rates, it will continue to monitor the macroeconomic situation and calibrate the reference interest rates within the framework of the monetary policy normalization process, paying special attention to the past and prospective evolution of the general price level and the dynamics of the exchange market, always with the objective of tending towards a path of returns that allows safeguarding the value of investments made in instruments denominated in domestic currency and to consolidate exchange rate and financial stability.
Exchange rate policy will continue to be aimed at preserving adequate levels of external competitiveness and enhancing the accumulation of international reserves. The BCRA will continue to gradually adjust the rate of change in the nominal exchange rate in order to maintain adequate levels of external competitiveness. The BCRA will continue to carry out prudent management of the current regulatory framework in order to preserve monetary and exchange rate stability. To the extent that macroeconomic conditions allow, regulations will be relaxed, with the aim of maintaining in the medium and long term a set of macroprudential regulations compatible with the dynamization of capital flows oriented to the real economy.
In the medium term, sustained growth in economic activity and a moderation in the inflation rate will lead to greater demand for real money balances. After two years in which the Central Bank exceptionally assisted the Treasury to face the needs arising from dealing with the pandemic, without access to external financing and with a domestic capital market in reconstruction, the progress made by the National Government in the peso debt market and the prospects for external financing by multilateral and bilateral organizations pose a scenario with a significant reduction in financial assistance to the Treasury. In this new stage, it is expected that the monetary sterilization effort will be reduced. This will favor the demand for the monetary base to be provided by the interest associated with the BCRA’s interest-bearing liabilities and, potentially, by a reduction in its stock. However, the BCRA will maintain a prudent administration of monetary aggregates, sterilizing any surplus liquidity, in order to preserve monetary balance.
Back to top
Section 1 / Today’s global economy and the stagflations of the 1970s and 1980s
The global economy faces stagflation risks (see Chapter 2. International Context), with downward revision of growth forecasts and upward revision of inflation. This situation is reminiscent of what happened during the two oil crises of the seventies of the last century.
In the first of these crises, in October 1973 the Organization of Arab Petroleum Exporting Countries (OPEC) established an oil embargo on the United States for its support of Israel in the Yom Kippur War that led to an increase in the international price of oil. In March 1974, the embargo was officially lifted, but prices remained high.
The second oil crisis was associated with the Iranian revolution, which began in early 1978 and ended a year later, when Shah’s reign collapsed and Sheikh Khomeini took control as grand ayatollah of the Islamic republic. Iranian oil production declined sharply. Fears of further disruptions spurred speculative hoarding, which increased demand for oil, and put upward pressure on its price.
The current episode presents some differences with the shocks of the seventies. The effect of the war in Ukraine on food and energy prices was added to the previous upward trends from the post-COVID-19 recovery, which includes a demand component (due to the reduction of mobility restrictions) and a supply component related to the problems that the pandemic generated in global supply chains (with an increase in international freight prices and shipping times). delay in the delivery of goods). In this episode, the price of oil (Brent) registered a smaller impact, with a maximum increase in June of this year of 62% compared to December 2021, while in the first oil shock it almost quadrupled between September 1973 and January 1974 and in the second it almost tripled between the end of 1978 and the end of 1979 (see Graph 1.a). Added to this, in the current case, is a strong impact on the price of natural gas, particularly in Europe, due to the supply cut off by Russia. In the case of agricultural commodities and metals, the shock generated by the conflict in Ukraine reached similar price increases in the initial months, particularly if compared with the 1973 episode, but is showing a lower persistence for the moment than in the episodes of the 1970s (see Figures 1.b and 1.c).
Graph 1 | Commodity prices
a. Brent Oil
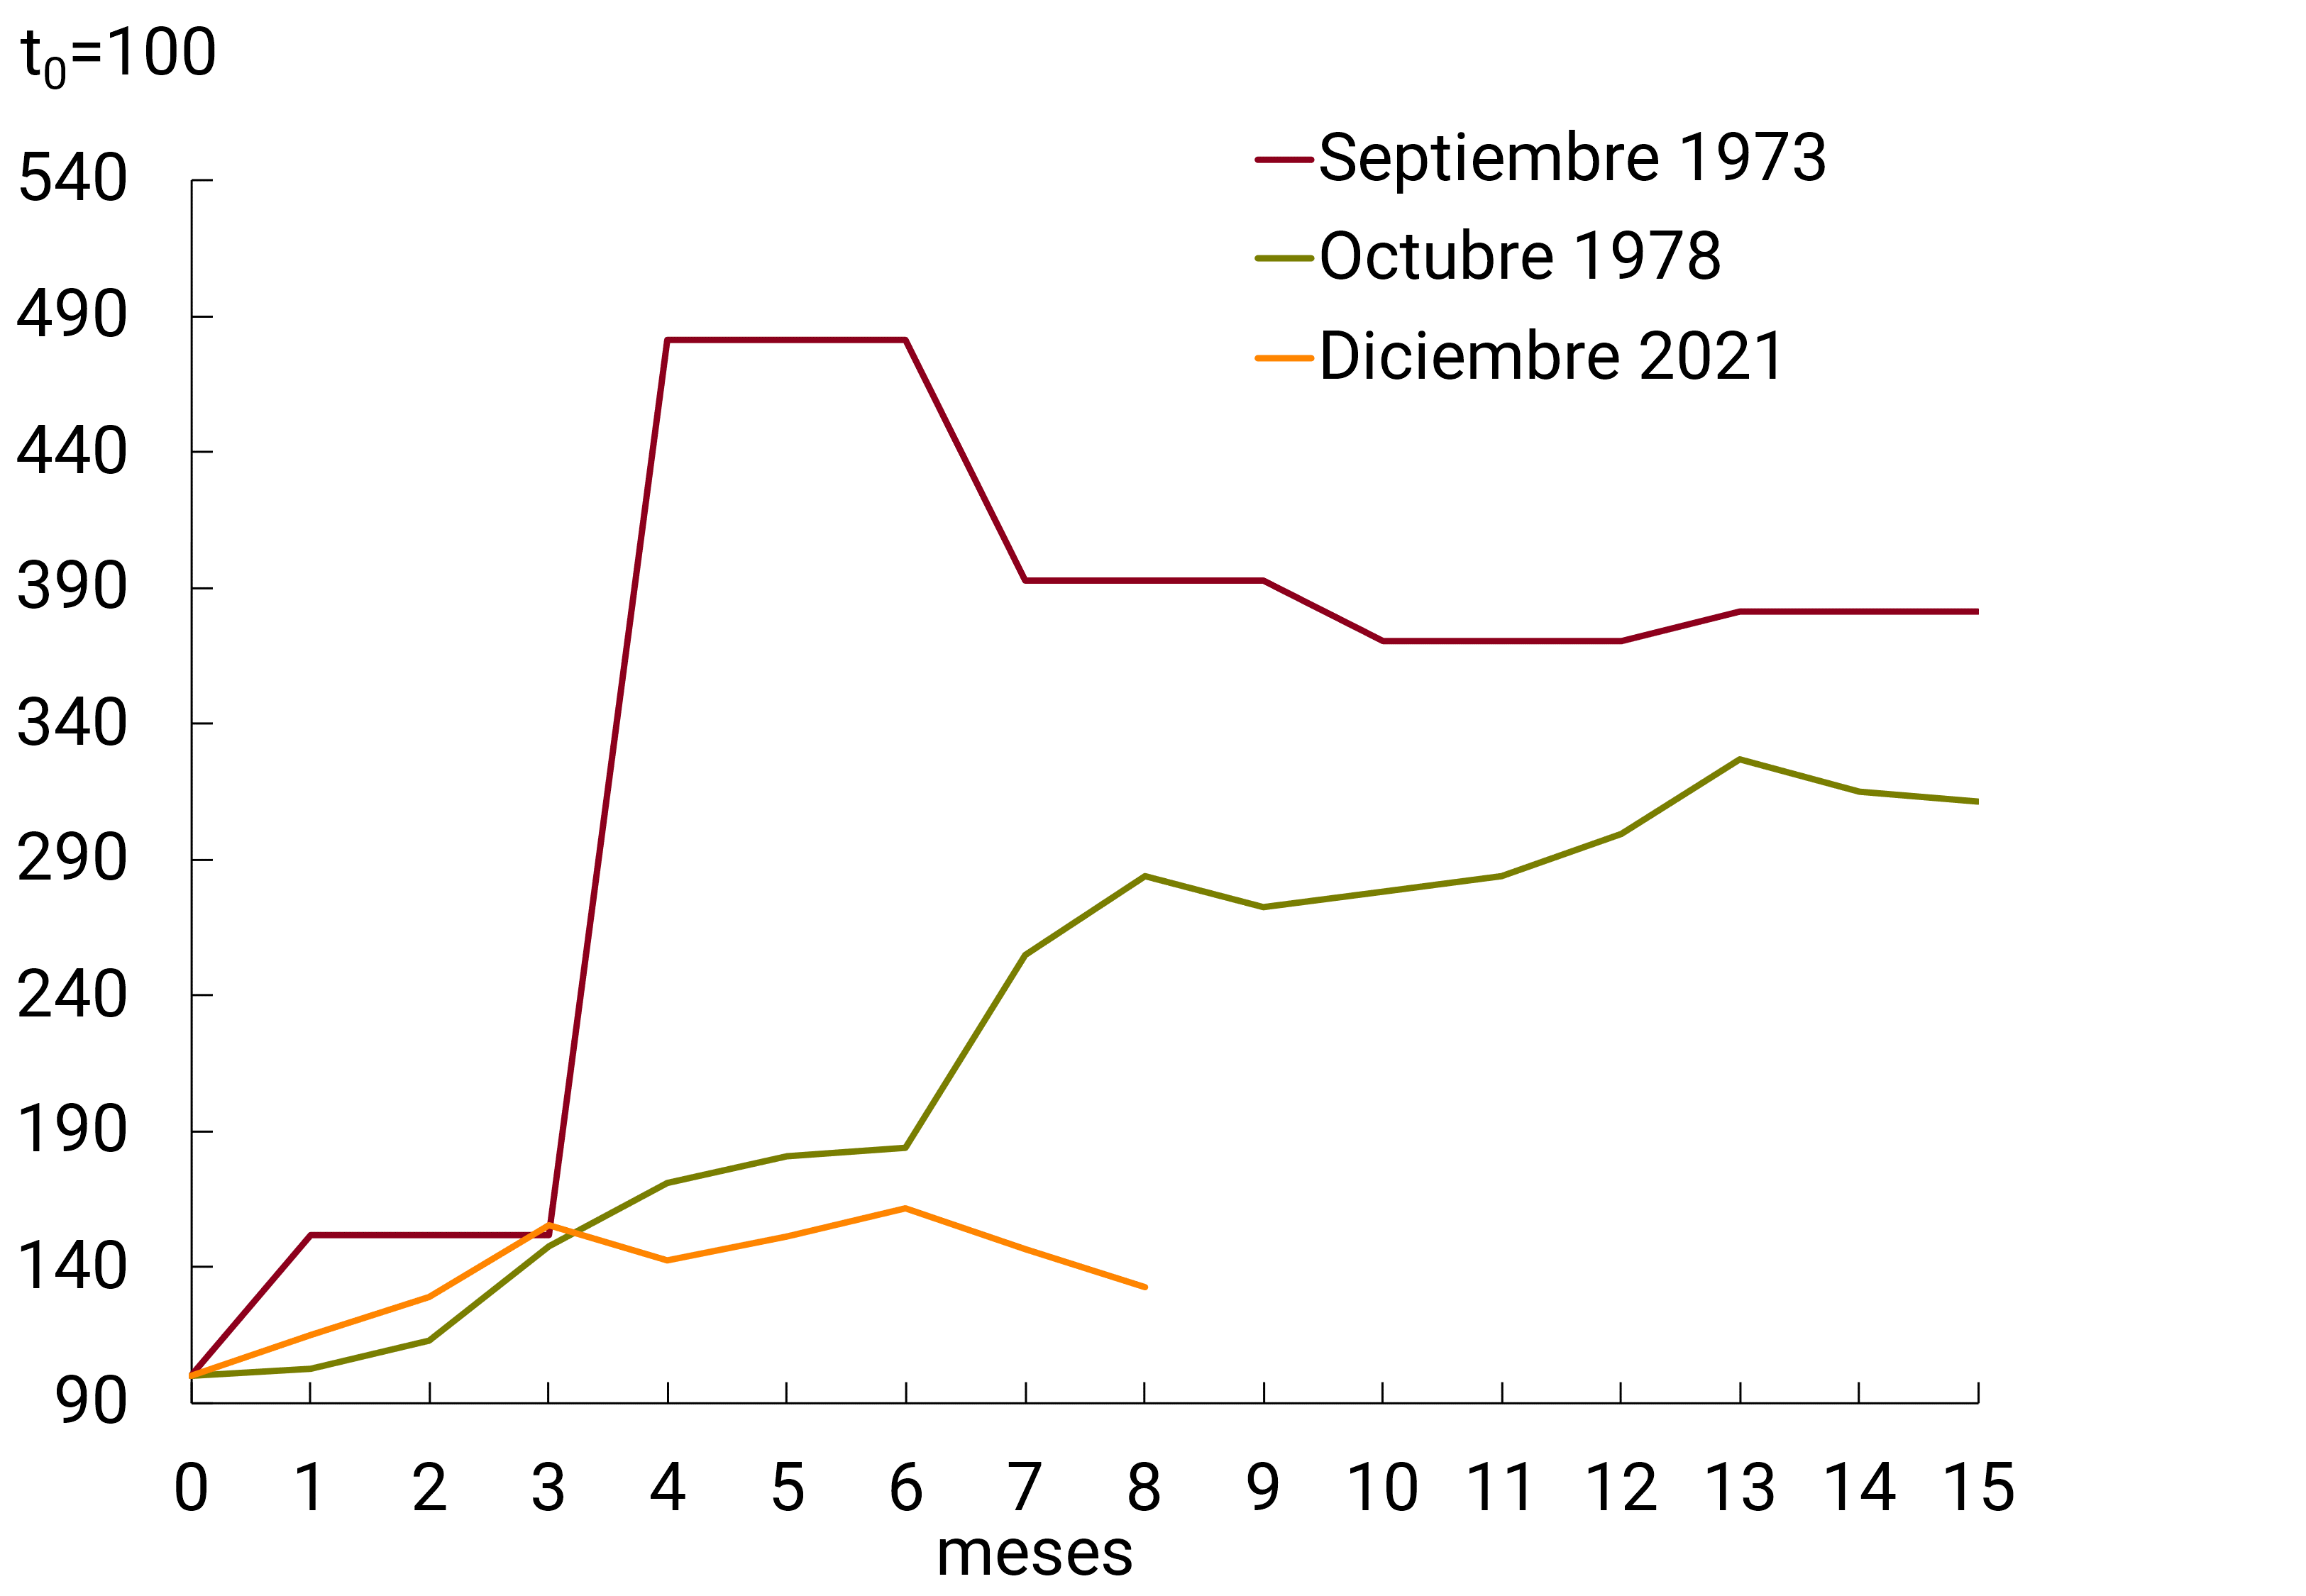
b. Food
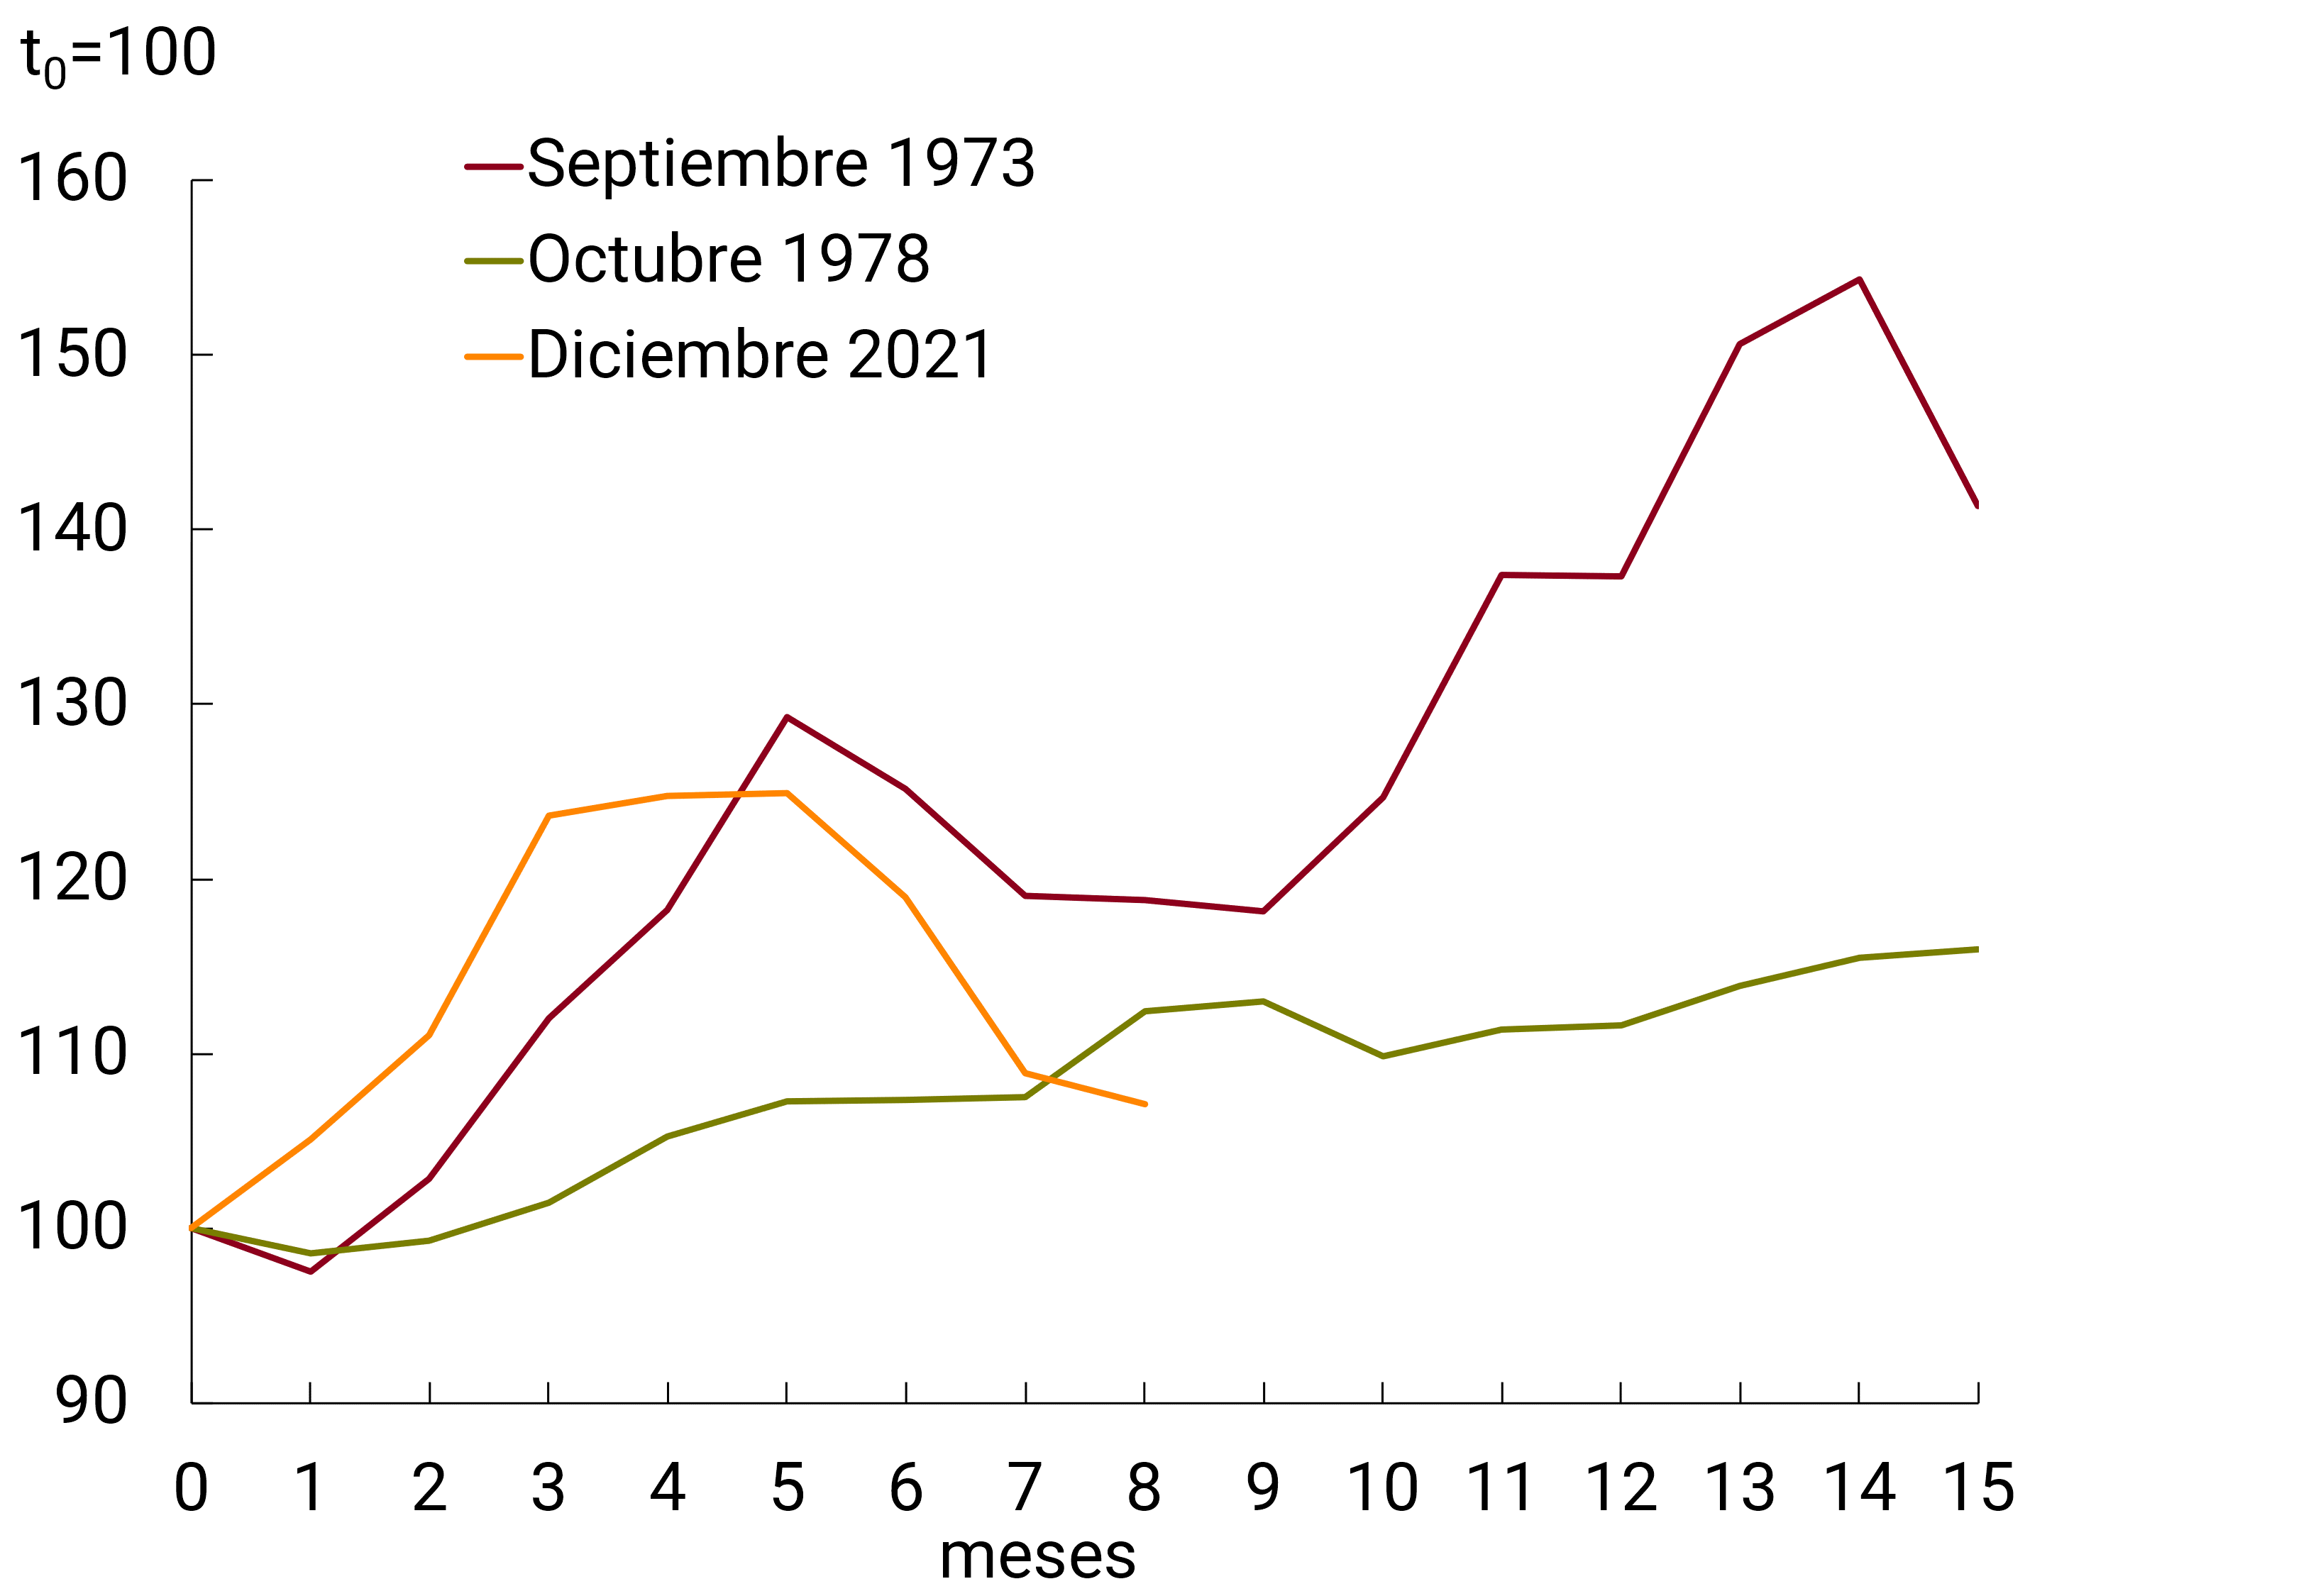
c. Metals
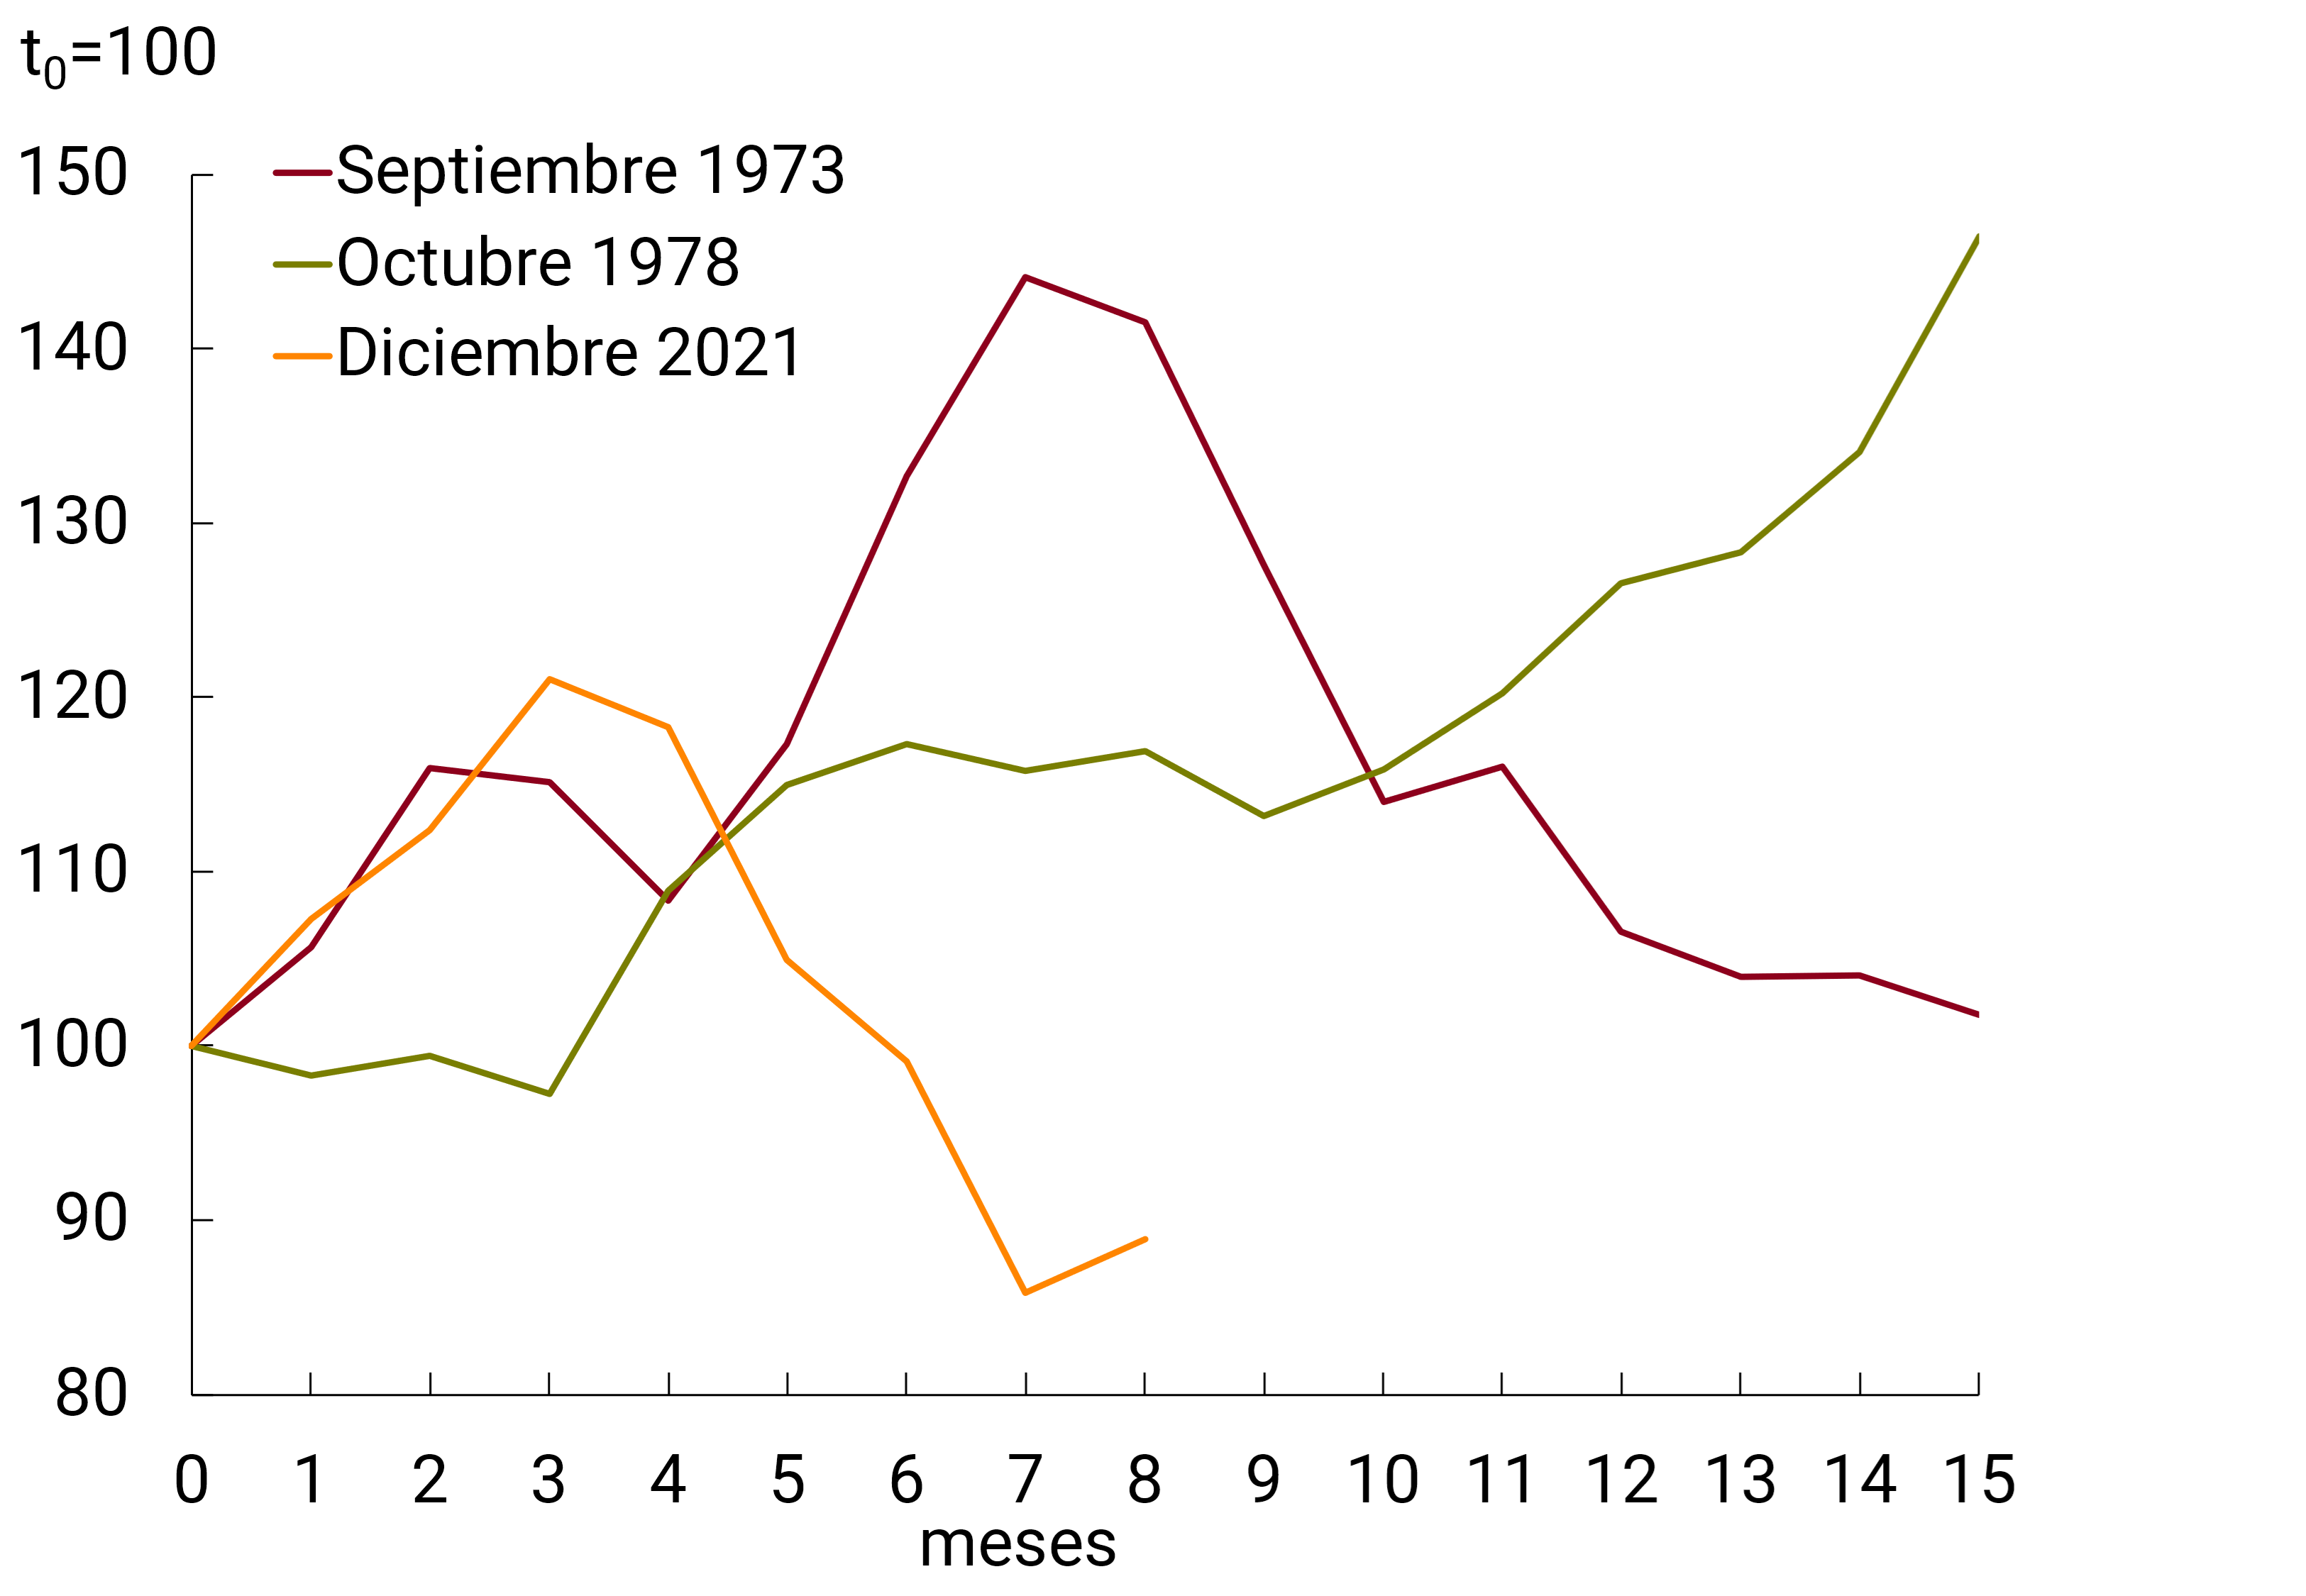
Source: BCRA based on data from the World Bank.
The previous inflationary context was also different. The 1973 crisis followed several years of rising global inflation (especially since 1967), signs that inflation expectations were becoming unanchored. All of the above may have contributed to the increase in the price of oil spreading to other goods and services. In a sample of advanced countries (the United States, the United Kingdom, Germany, France, and Japan), the average inflation rate up to 1967 was 2.8% per year (see Graph 2), while from 1967 to 1972, the average year-on-year inflation rate rose to 4.6%. After the increase in oil prices (which reached a maximum variation of 381% in the case of Brent), there was an average of 10.7% year-on-year inflation between 1973 and 1975, reaching its worst record of 14.7% (November 1974, see Graph 2).
Graph 2 | Inflation rate and interest rate of selected
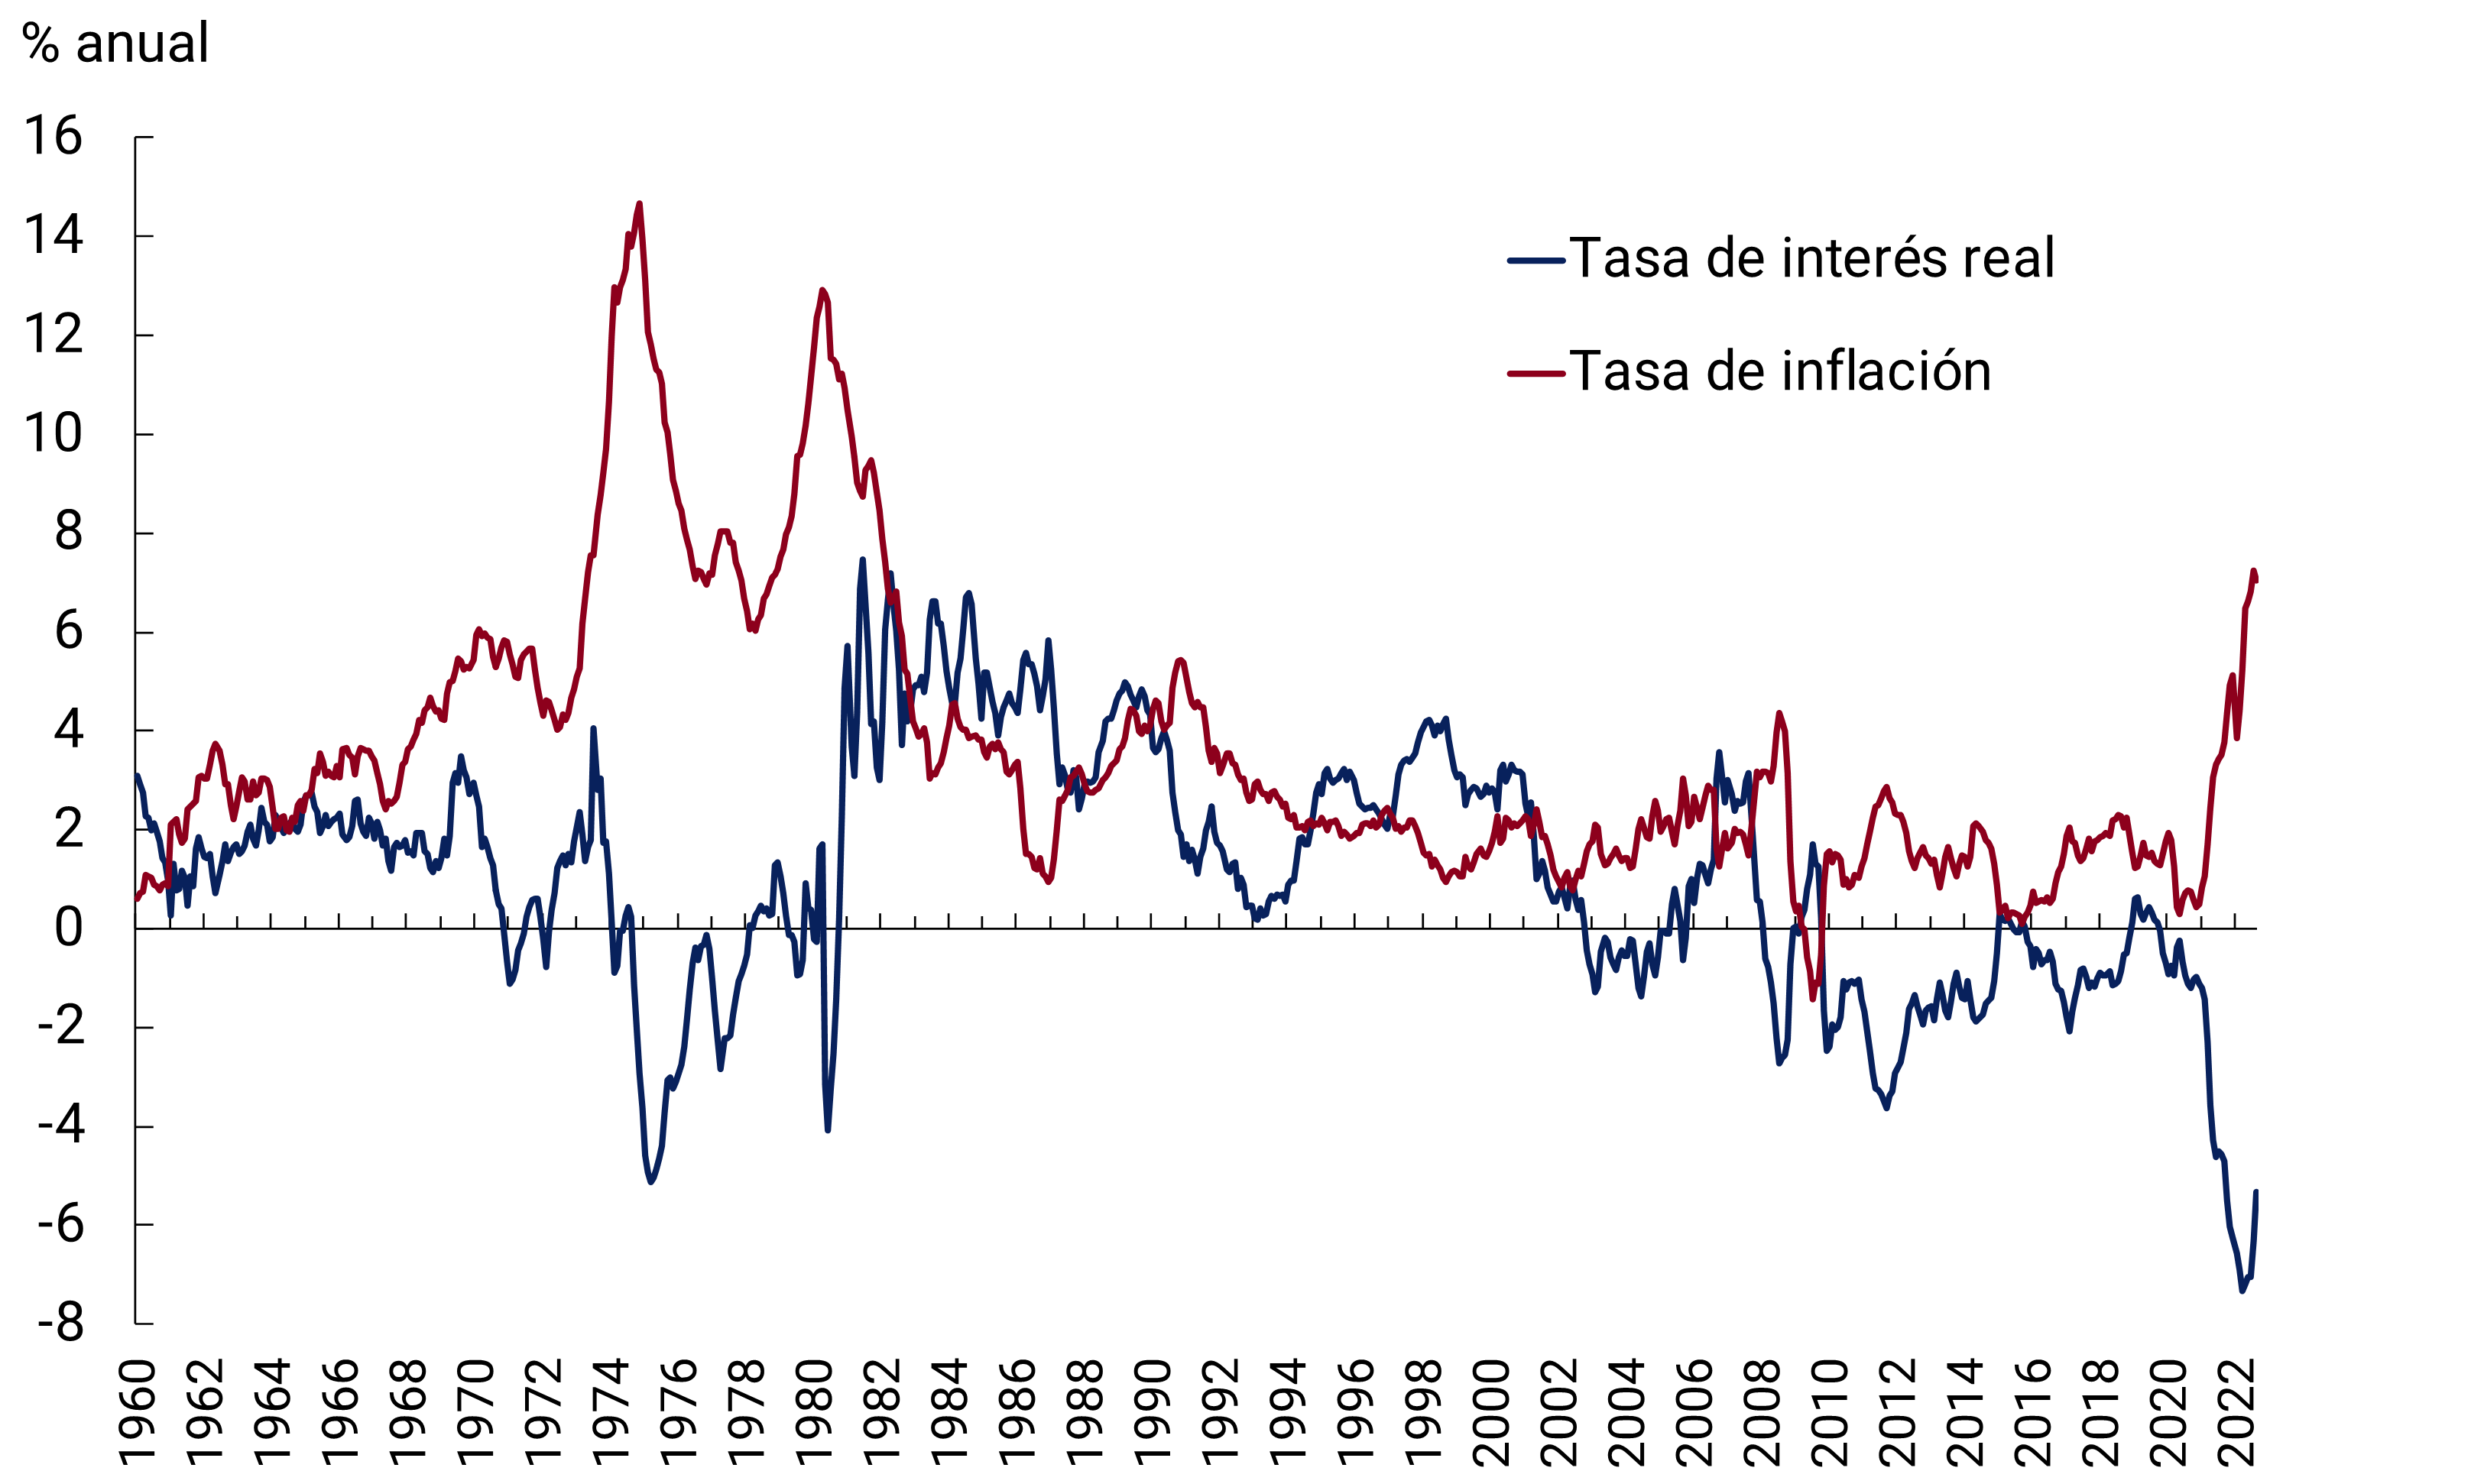
advanced countries
Source: BCRA based on data from the Fed and Bank of England.
Global inflation was also higher in the run-up to the 1979 oil crisis. The annual inflation of the average of selected advanced countries was 7.2% between 1976 and 1978, while after the oil shock (with a maximum increase in the price of Brent oil of 228%) the average inter-annual inflation reached 10.5% between 1979 and 1980, reaching 12.9% at its worst moment (April 1980). The average ex-post real interest rate went from -0.8% before the shock (1976-78) to -0.1% during the shock (1979-80), reaching a peak of 7.5% during the most contractionary phase of monetary policy in June 1981, which partly led to the debt crisis of the 1980s.
In the current episode, the average inflation of the selected advanced countries prior to the increase in commodity prices stood at 1.3% year-on-year (for the period from October 2008 to December 2019). On the other hand, the bias of monetary policy, measured by the ex post real interest rate, was more expansionary at the beginning of the current episode, influenced by the measures adopted to address the recessionary impact of the COVID-19 crisis, with a real monetary policy rate of -4.7% in 2021 (without taking into account the expansionary effect of unconventional monetary policy). clearly more negative than in the two shocks of the seventies where it was -1% and -0.1%, respectively (see Graph 2).
In any case, the average inflation rate for the group of selected advanced countries is currently at 7%, below the average inflation of both oil crises. Several factors could explain this dynamic. The smaller size and persistence of the commodity price shock generated by the invasion of Ukraine and the current lower intensity of energy use are factors that play in favor of a lower impact on the inflation rate. In addition, inflationary expectations are better anchored in the current episode, after two decades of low inflation, with mandates from the monetary authorities that place greater emphasis on price stability, show greater clarity regarding the instruments used and have a greater development of communication strategies than in the past. Along with this, among other factors that also help to anchor inflation today are the trends of deregulation of labor markets and trade liberalization, together with the effects of globalization.
The shocks of the 1970s also had consequences on the performance of economic activity. The first slowed down the strong post-war growth, which came at an average rate of 5% per year. The economies of the United States and the United Kingdom fell in 1974 and 1975, in Germany and France GDP slowed in 1974 and contracted in 1975, and in Japan it fell in 1974 and grew well below the pre-crisis rate in 1975. The impact of the second shock, coupled with contractionary monetary policy in several of these countries to deal with rising inflation, led to a sharp slowdown or fall in GDP, depending on the country considered, in the period 1980-1982 (see Chart 3).
Graph 3 | Real GDP of selected
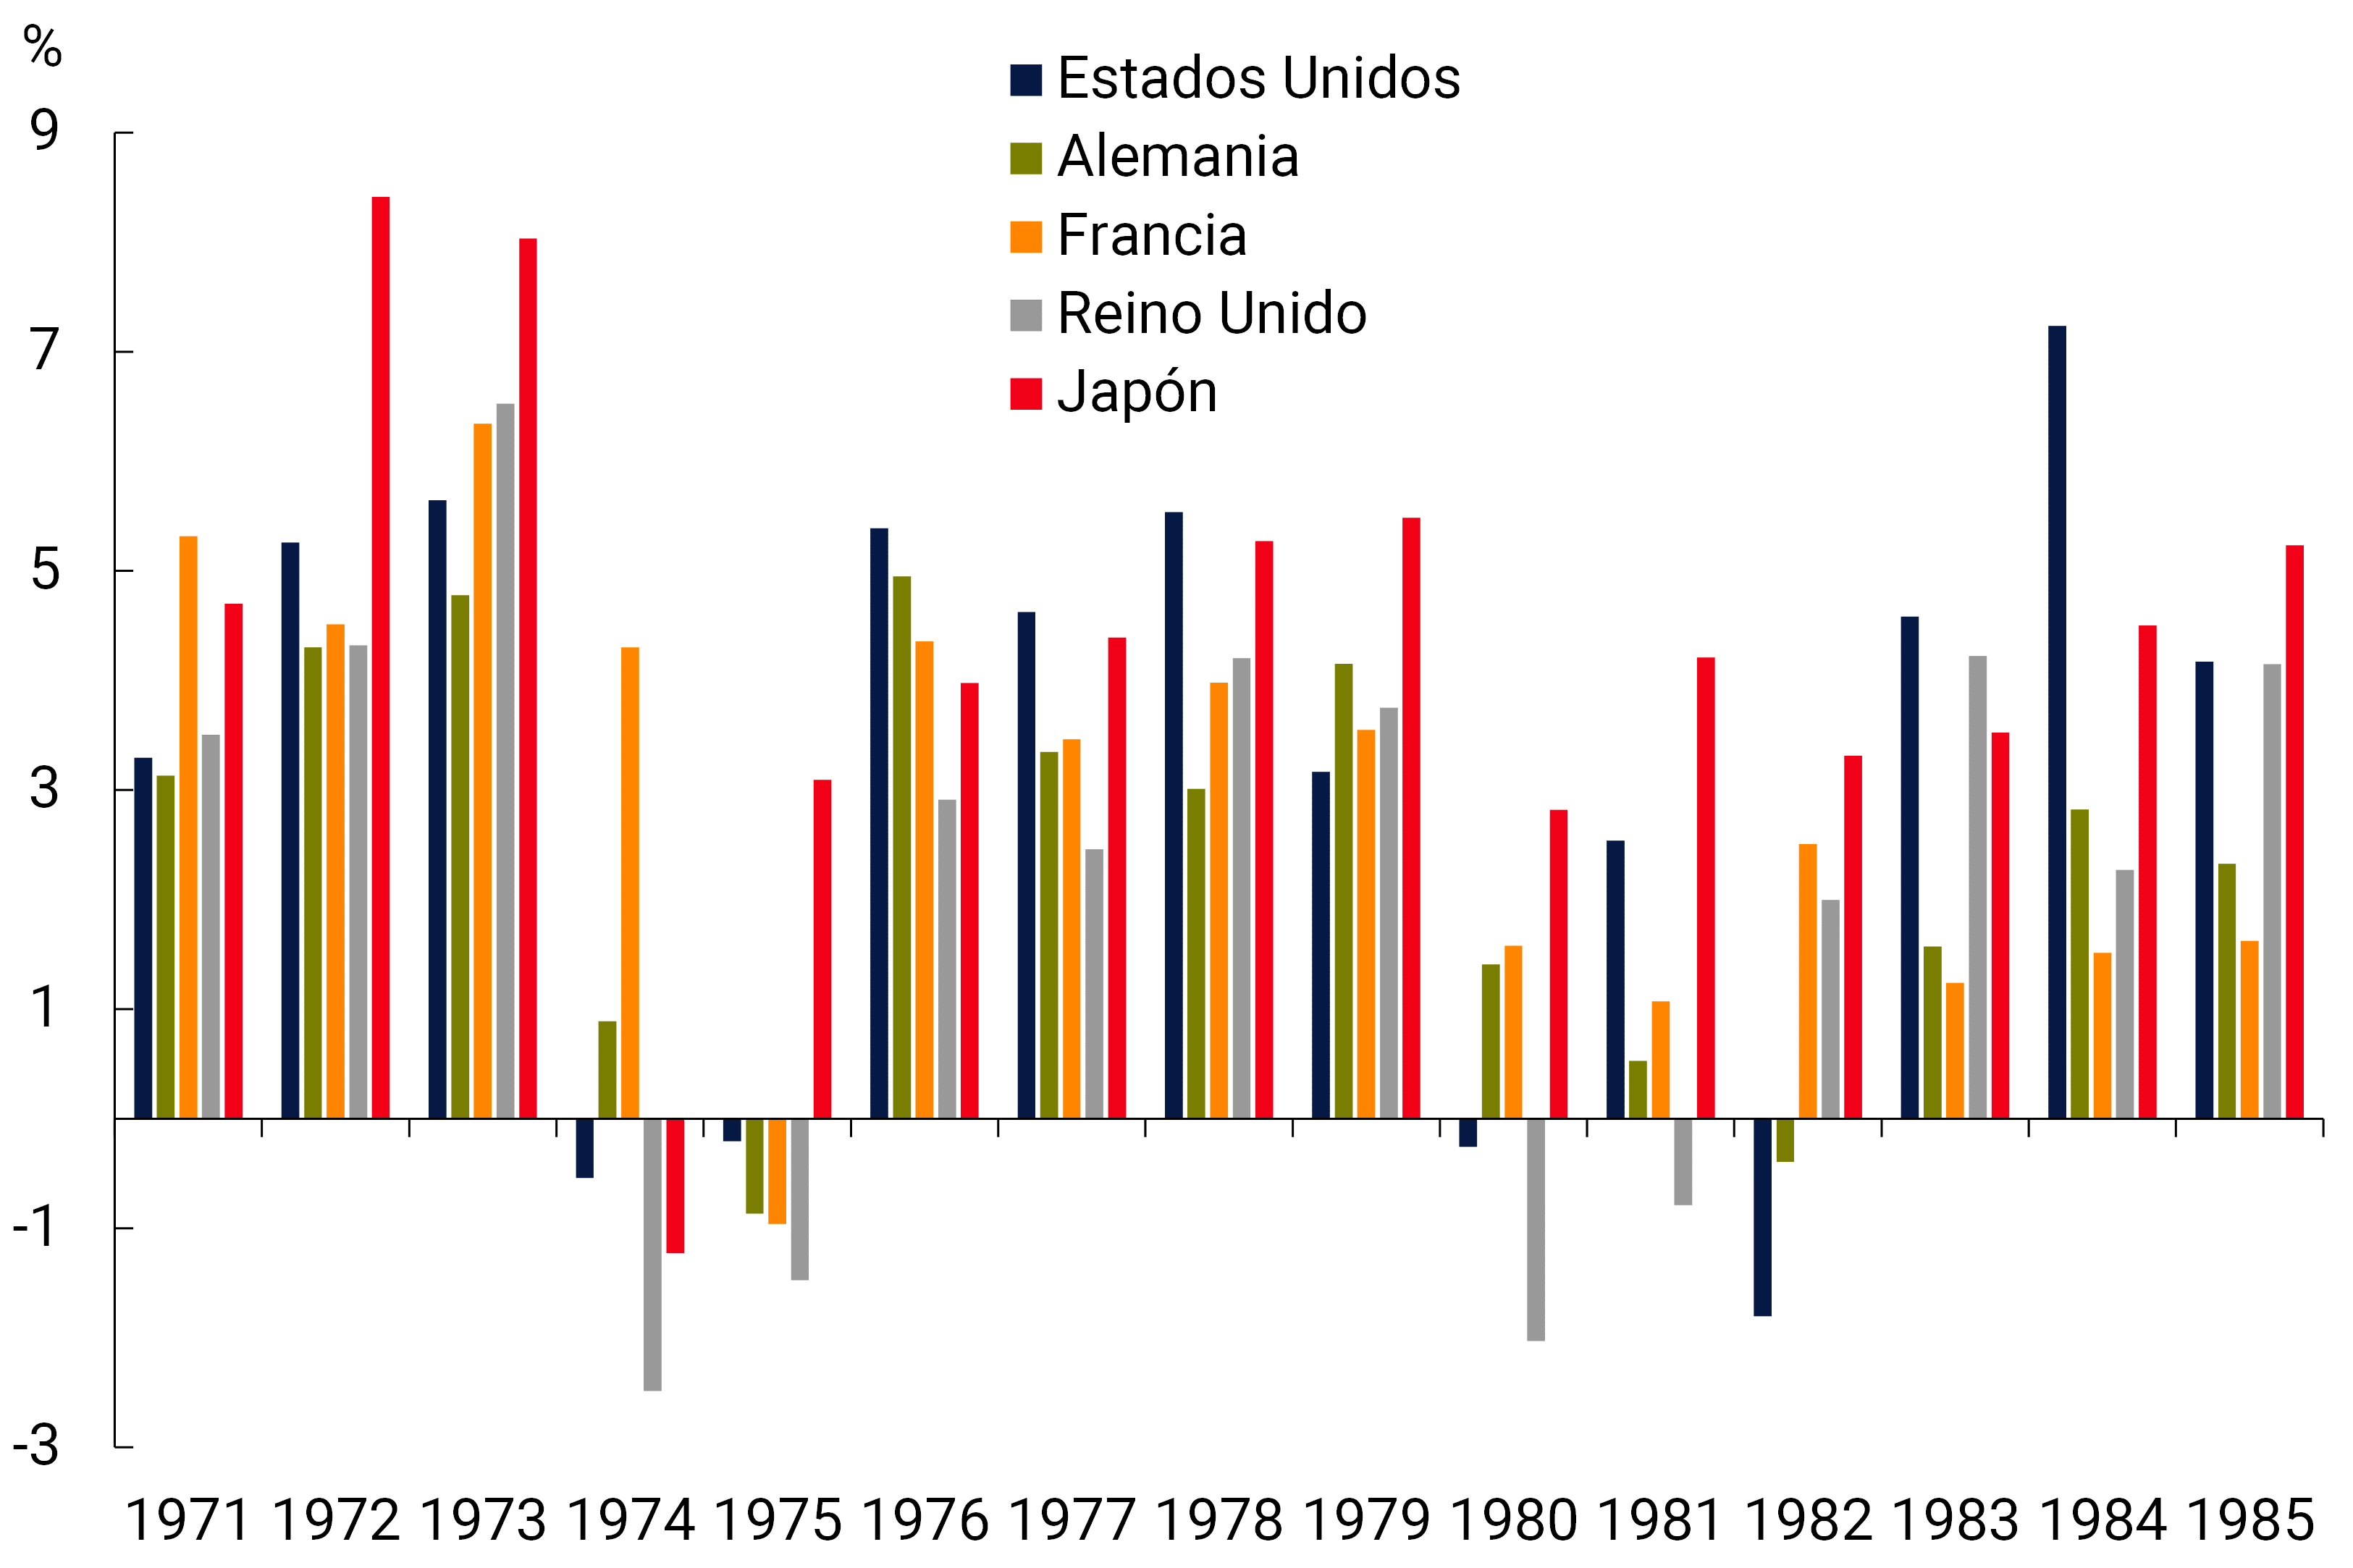
advanced countries
Source: BCRA based on data from the Fed.
In the current episode, there has so far been lower overall growth in the second quarter of the year, with, for example, quarterly declines in GDP in the United States, China and the United Kingdom, and a broad-based downward correction of the global growth outlook for this year from 4% in the January forecasts to 3% in July forecasts (see section 2.2). In any case, the dynamics of the global economy are currently guided by several simultaneous factors, which adds an additional difficulty to the comparison with those of the seventies. Thus, the impact of the war in Ukraine is compounded by the restrictions on mobility in China to deal with the pandemic, with its effect on international trade and global supply chains; and, with a growing weight, the contractionary monetary cycle of advanced countries, particularly the United States with its consequences on economic activity and global financial conditions.
Back to top
Section 2 / The post-pandemic recovery in South America’s main economies
For more than two years since the beginning of the COVID-19 pandemic, socioeconomic conditions in Argentina, Brazil, Chile, Colombia and Peru were very disparate. However, these economies, which are the largest in South America, managed to recompose previous levels of activity and have done so in a synchronized manner. This section presents, in broad strokes, some nuances that distinguish the post-pandemic recovery in each of them.
With data available as of July 2022, the level of economic activity in Colombia (which led the recovery) was 12.4% s.e. above that observed in February 2020 and that of Brazil, which experienced the least relative progress in the period, 4.4% above. In the case of Argentina, economic activity was 7.5% above pre-pandemic levels (see Graph 1).
Graph 1 | Monthly activity in the main economies of South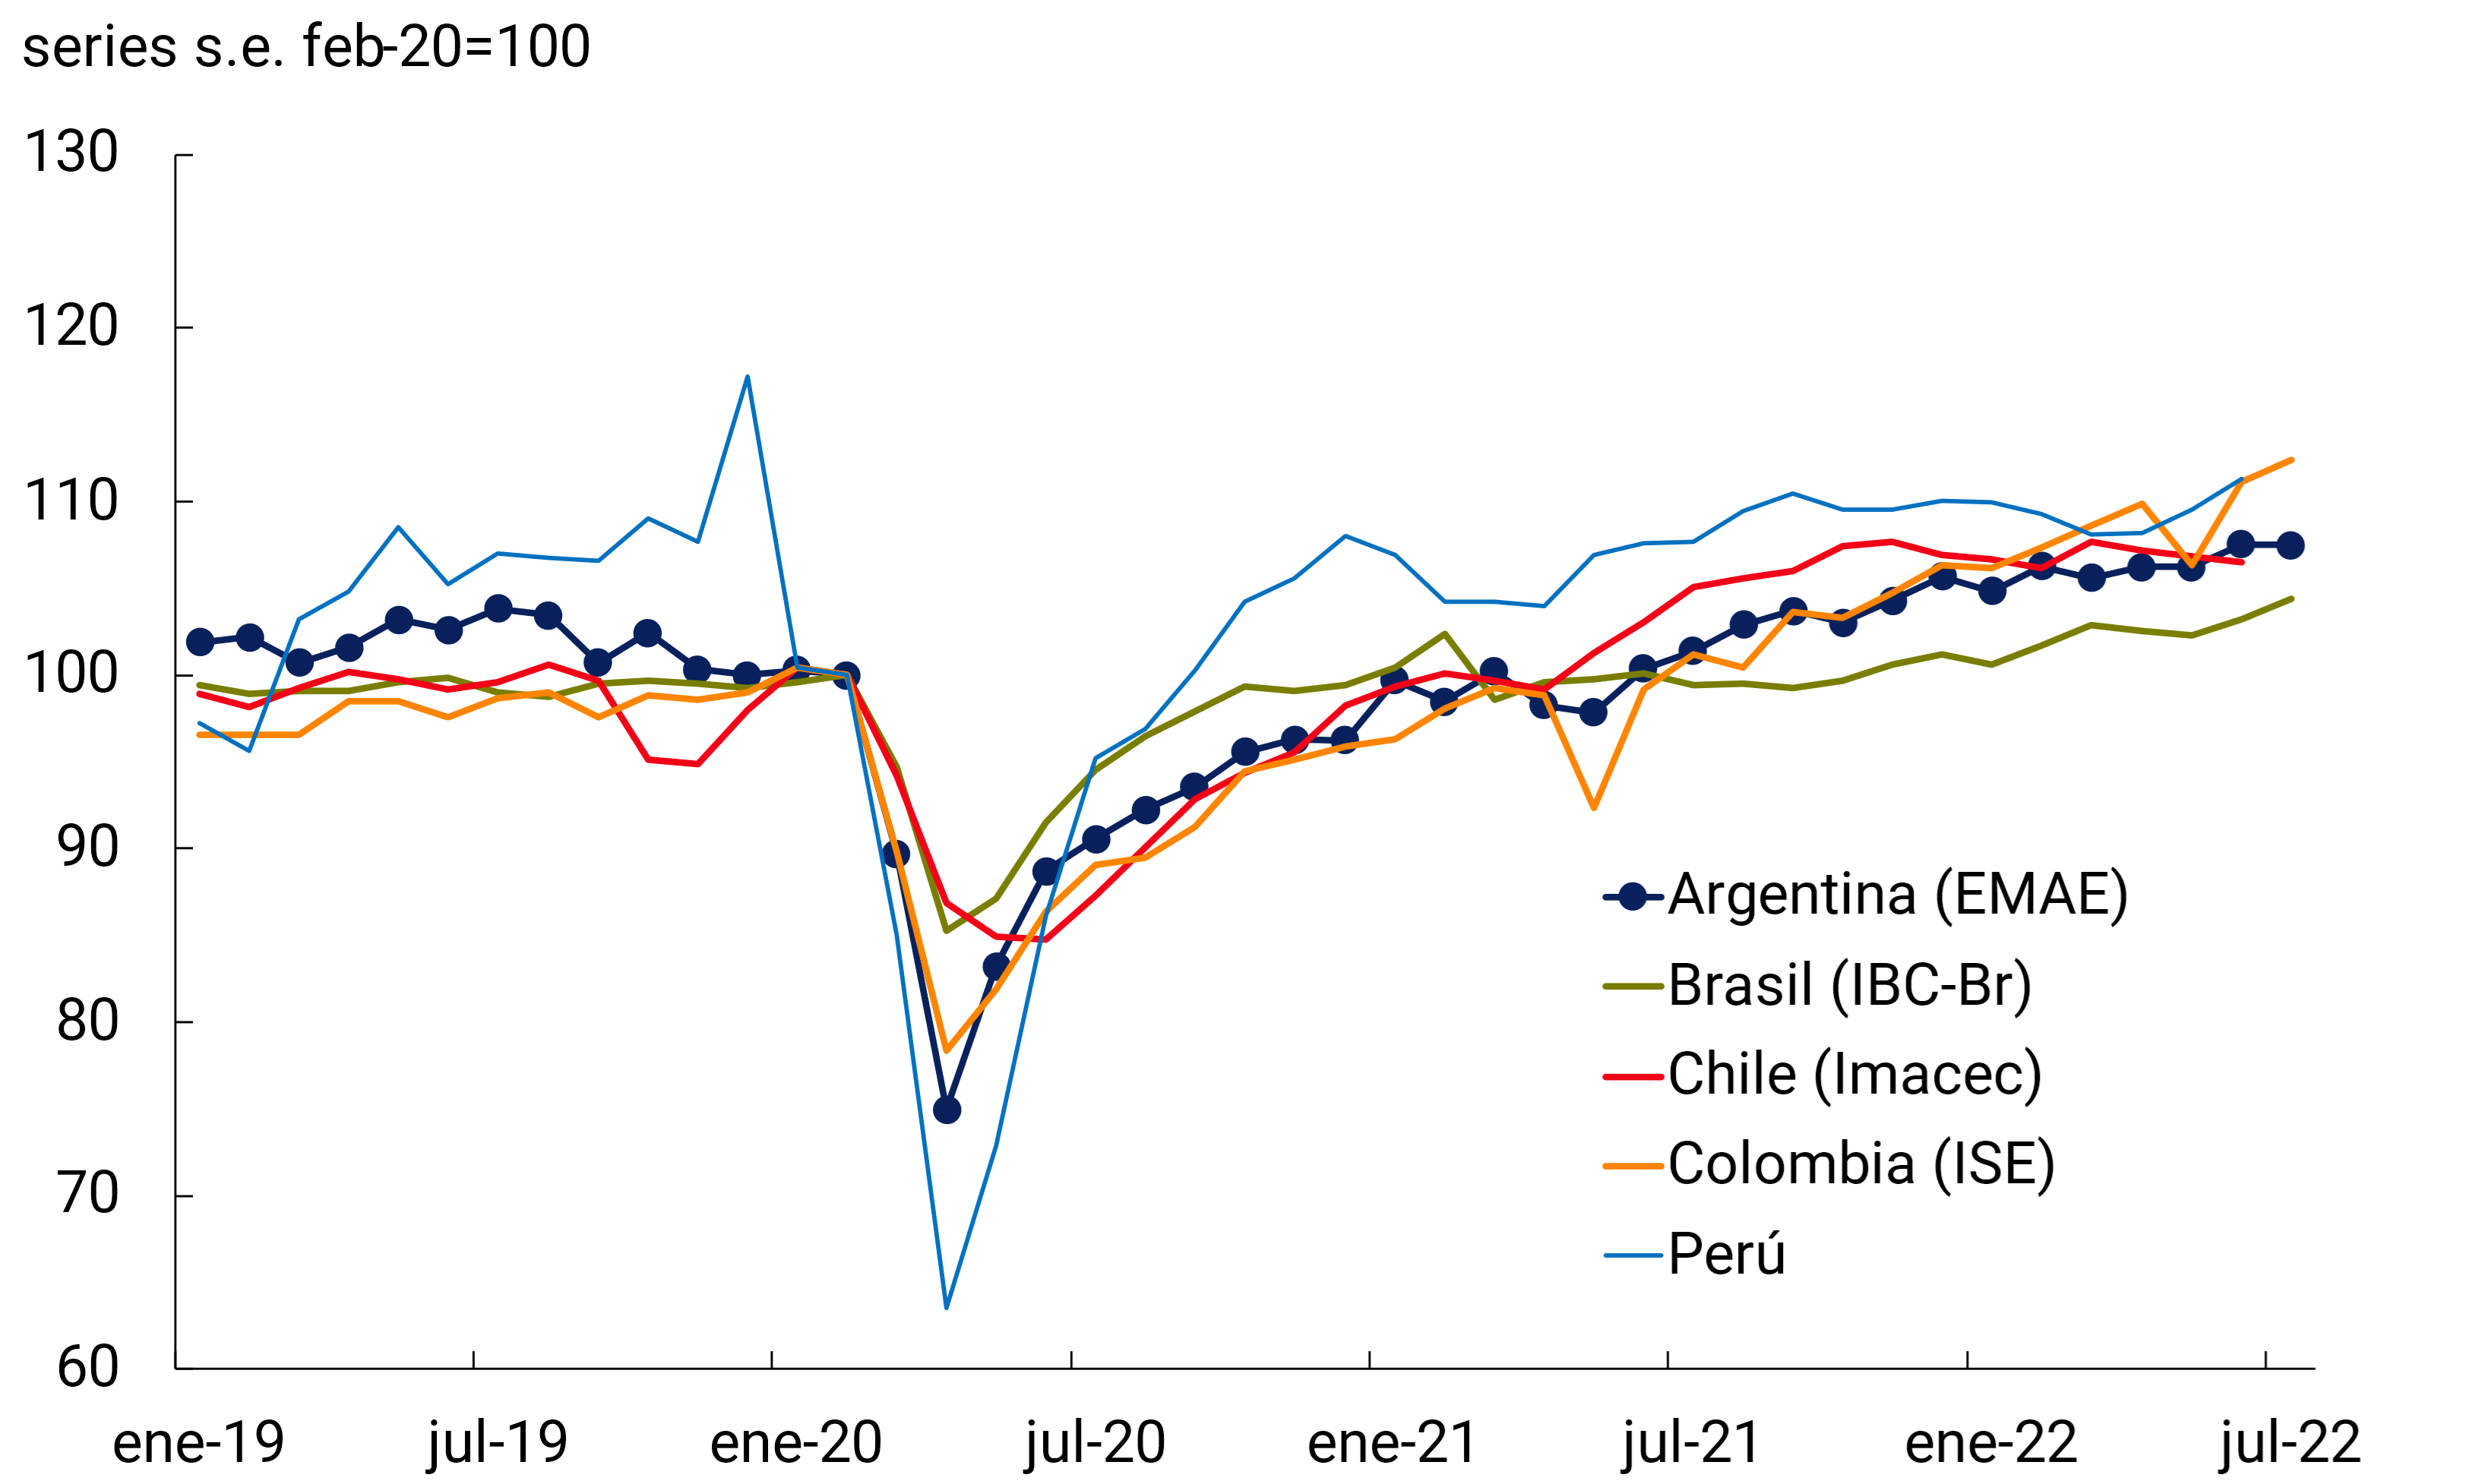
America
Source: BCRA based on data from INDEC, Central Bank of Brazil, Central Bank of Chile, Bank of the Republic (Colombia) and National Institute of Statistics and Informatics (Peru).
From the point of view of supply, in addition to the differential impact of the bottlenecks caused by the pandemic and which affected some value chains due to the lack of key inputs on a global scale, the divergences in terms of the recovery of the activity of the productive sectors are associated with the relative prices in force in each of the selected countries. the policies implemented and their productive structures, among other common determinants. The most notable differences have to do with industrial performance and the provision of services.
In the case of value added by industry, Argentina leads the recovery, with an increase in industrial GDP of 16.2% s.e. accumulated in the second quarter of 2022 compared to the last quarter of 2019, prior to the pandemic. The economy with the lowest relative industrial growth was Brazil, with an increase of 2.6% s.e. in the same period. As for total services, characterized by a greater relative intensity in the use of labor, the economy that led the increase was Chile, which accumulated 15.2% s.e. and the one that grew the least, Peru, rising by 2.3% s.e. during the same period. In our country, in the second quarter of 2022, the supply of total services exceeded the level of the fourth quarter of 2019 by 4.4% s.e. (see Graph 2).
Graph 2 | Main economies of South America. Selected productive sectors
GDP manufacturing industry
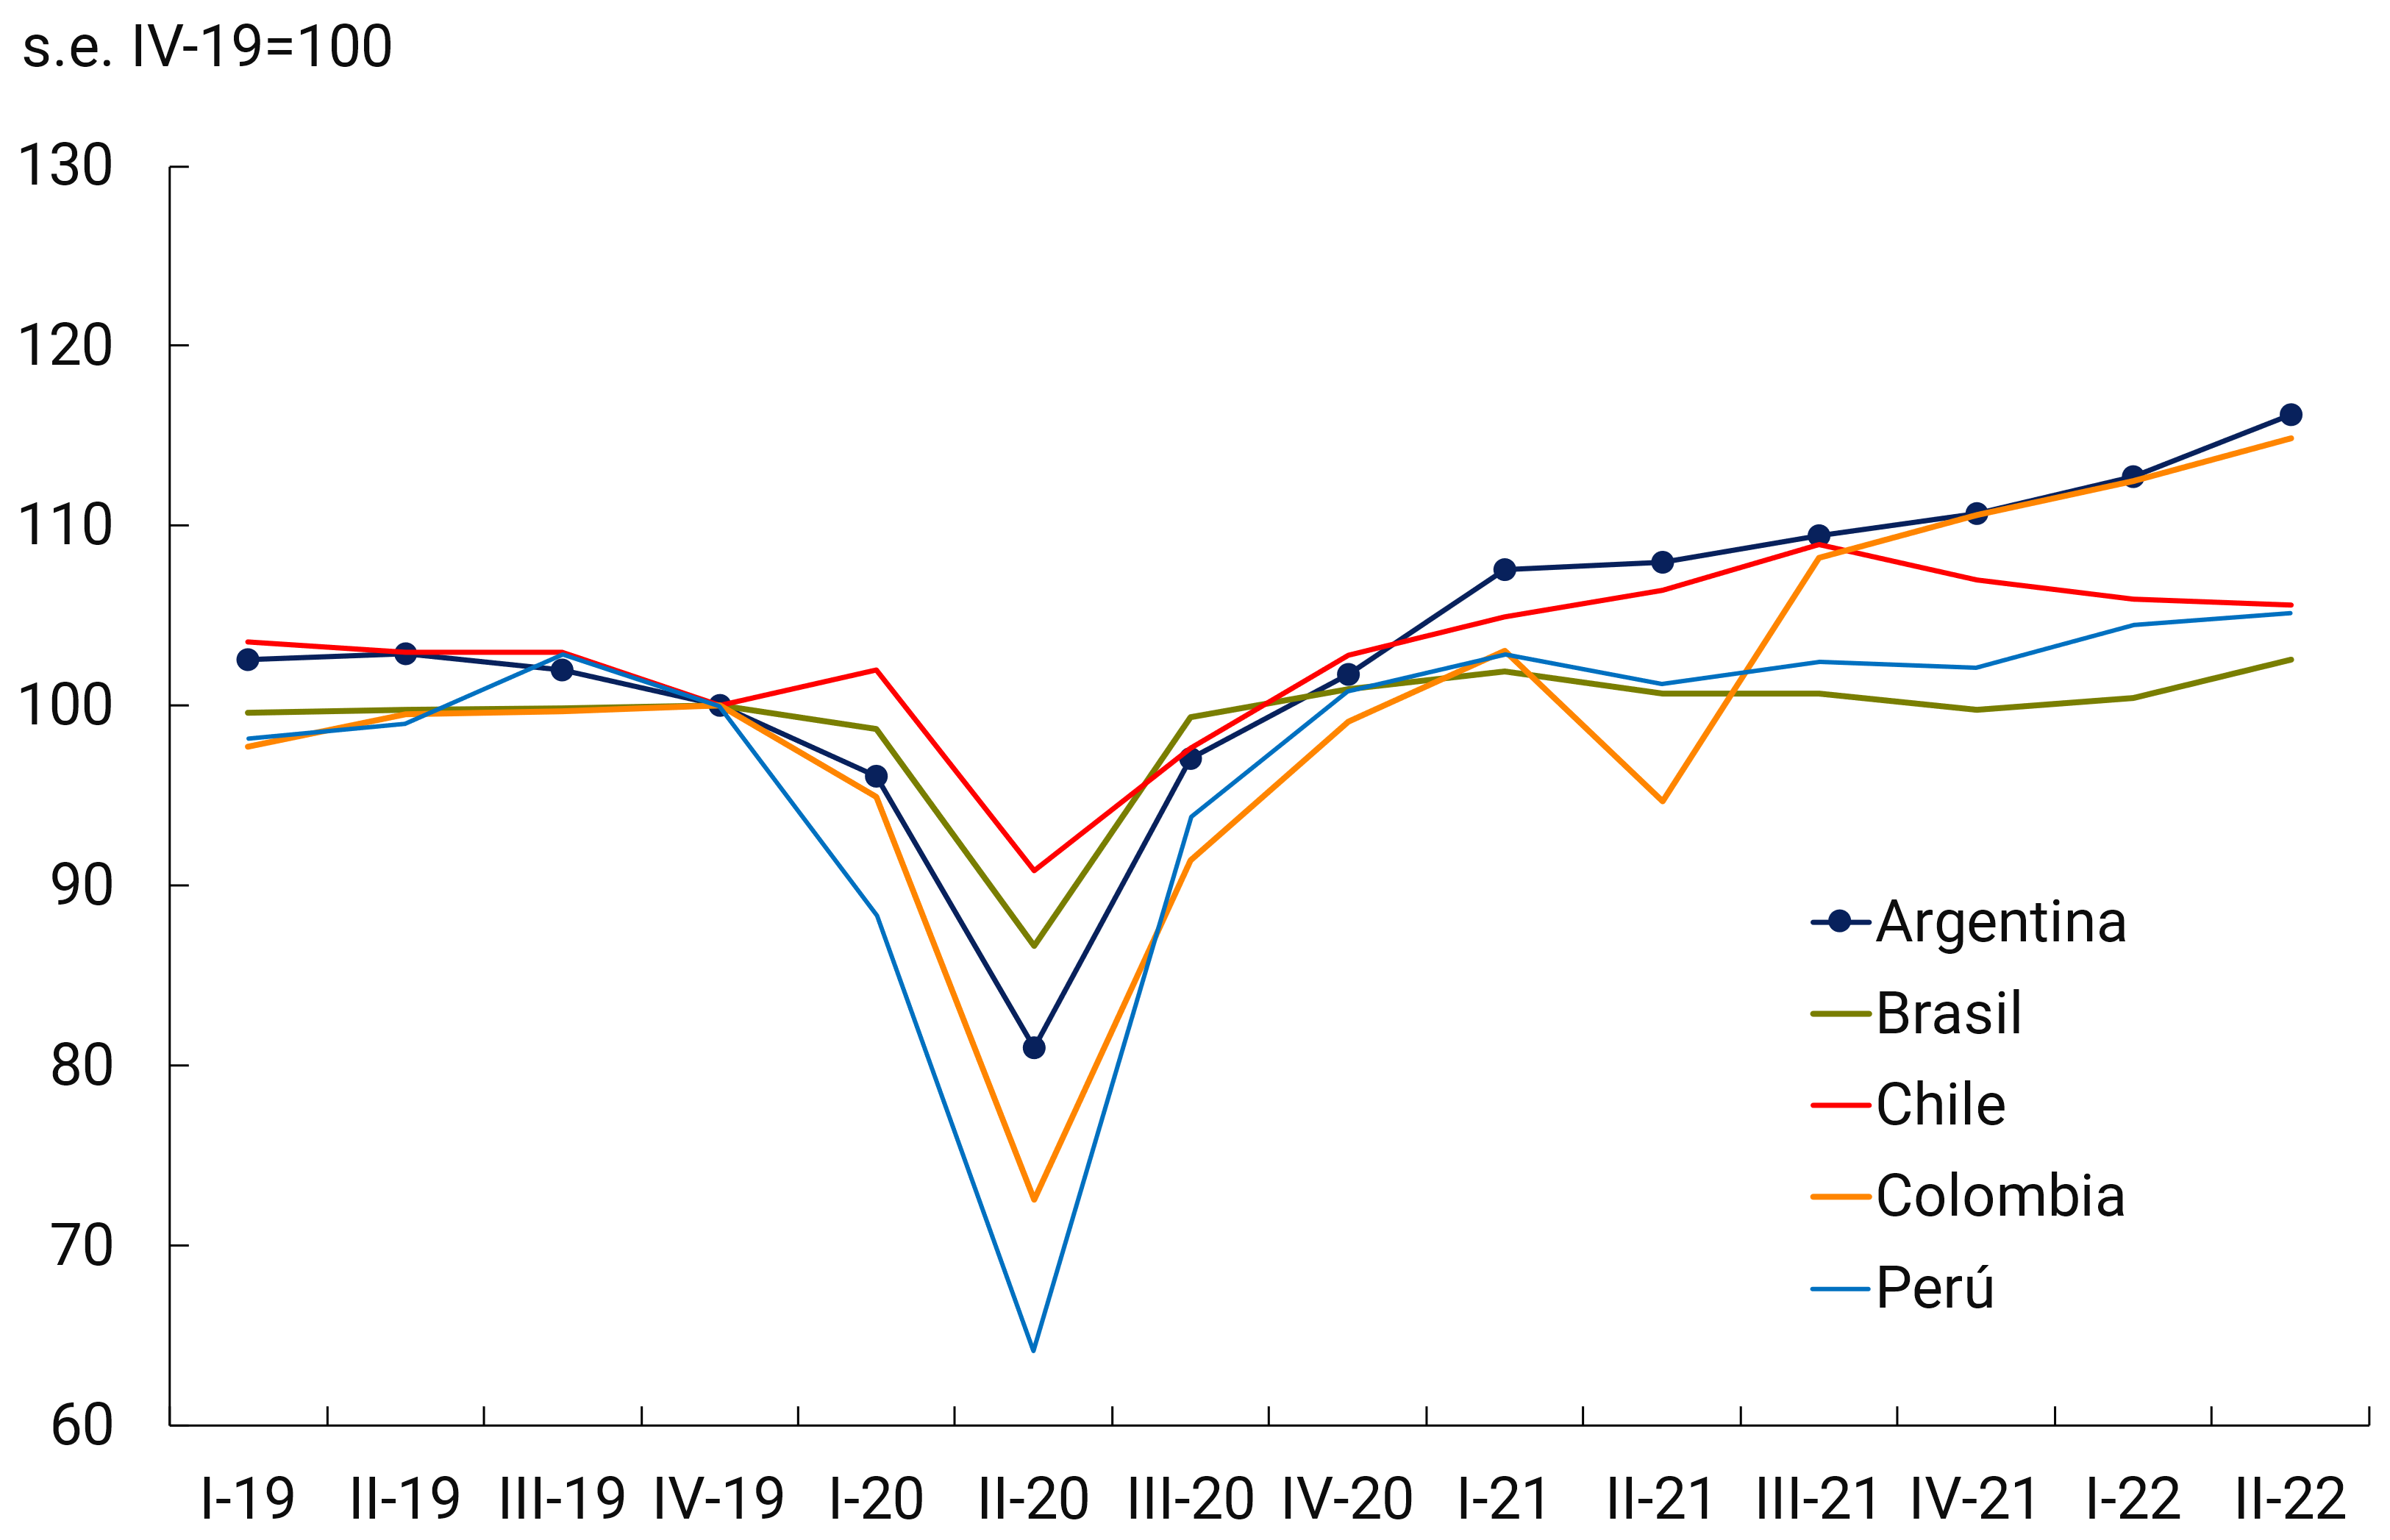
GDP total services
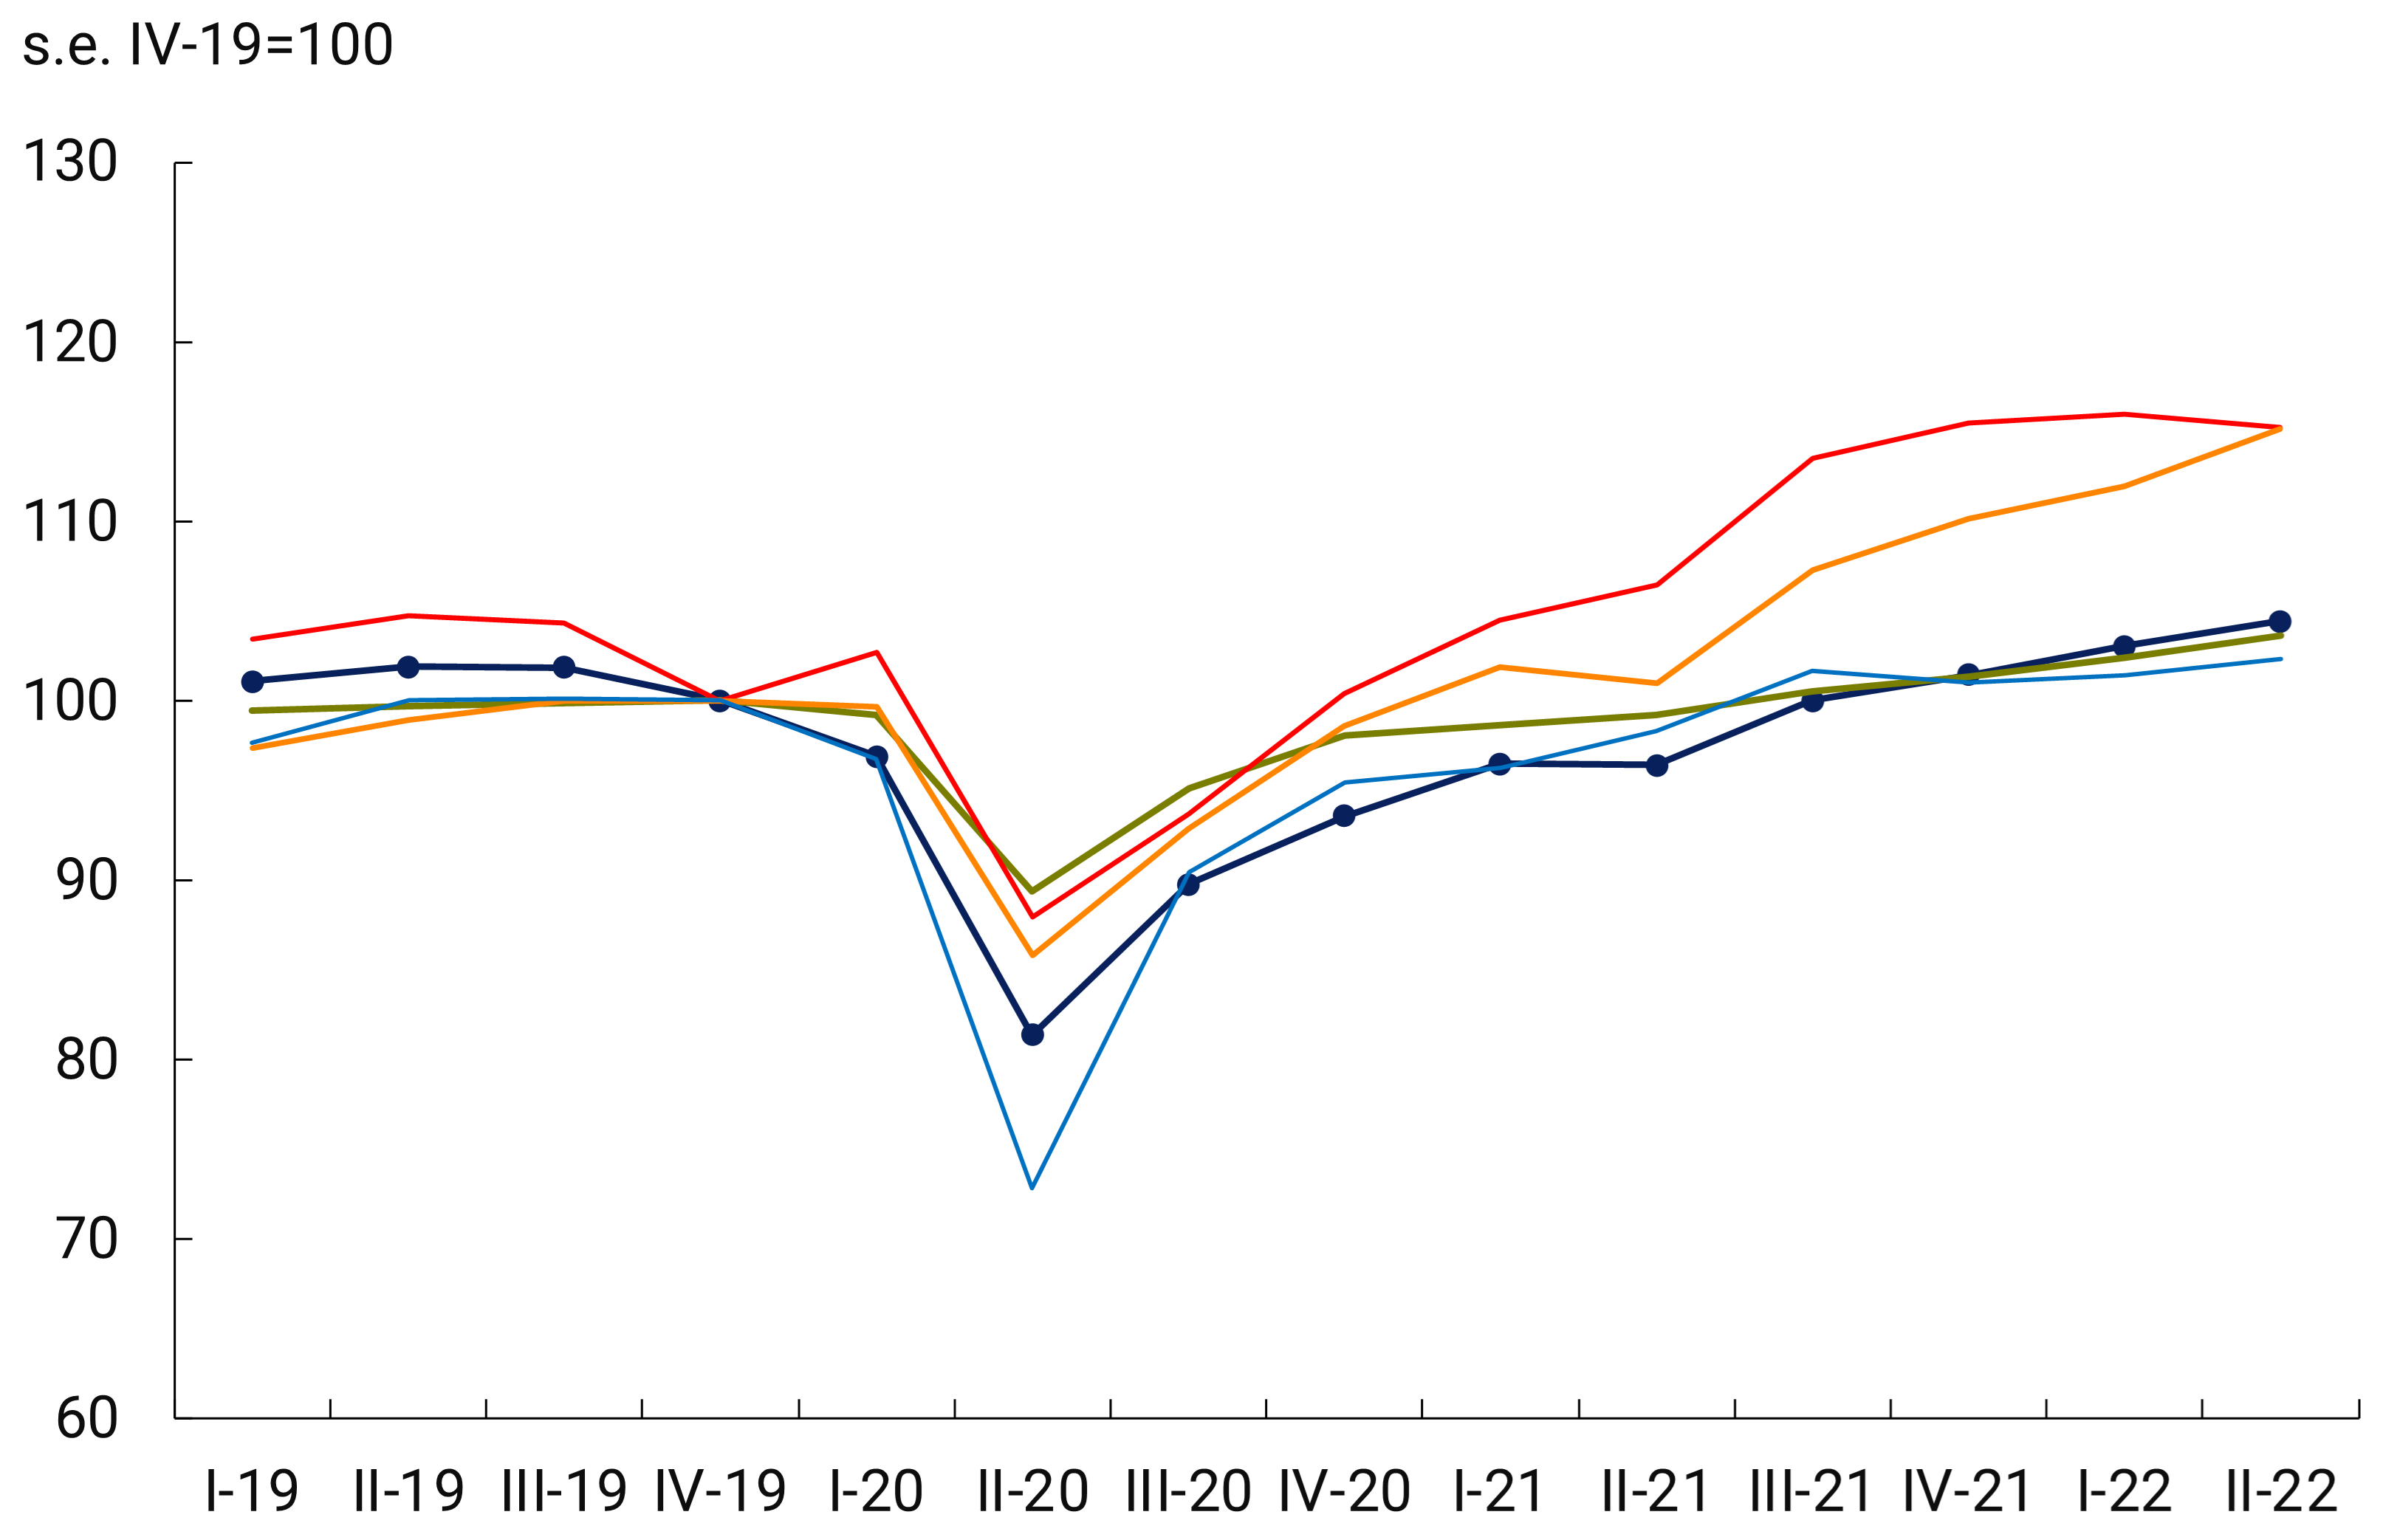
Source: BCRA based on data from INDEC, Brazilian Institute of Geography and Statistics, Central Bank of Chile, National Administrative Department of Statistics (Colombia) and National Institute of Statistics and Informatics (Peru).
Among the main components of demand in each country, different trajectories can be observed in both the recovery of total consumption and investment, where there is the greatest divergence between these countries. While in Argentina consumption grew 7.9% s.e. between the second quarter of 2022 and the fourth quarter of 2019, above Brazil and Peru, gross domestic fixed investment grew at 46.5% s.e.8, being the most dynamic of the group of selected countries, particularly from the fourth quarter of 2021. The economies with the highest relative increase in consumption were Chile and Colombia, although in the case of Colombia the growth in private and public consumption was to the detriment of investment, which is still 6% below pre-pandemic levels (see Graph 3).
Graph 3 | Main components of aggregate expenditure in the selected
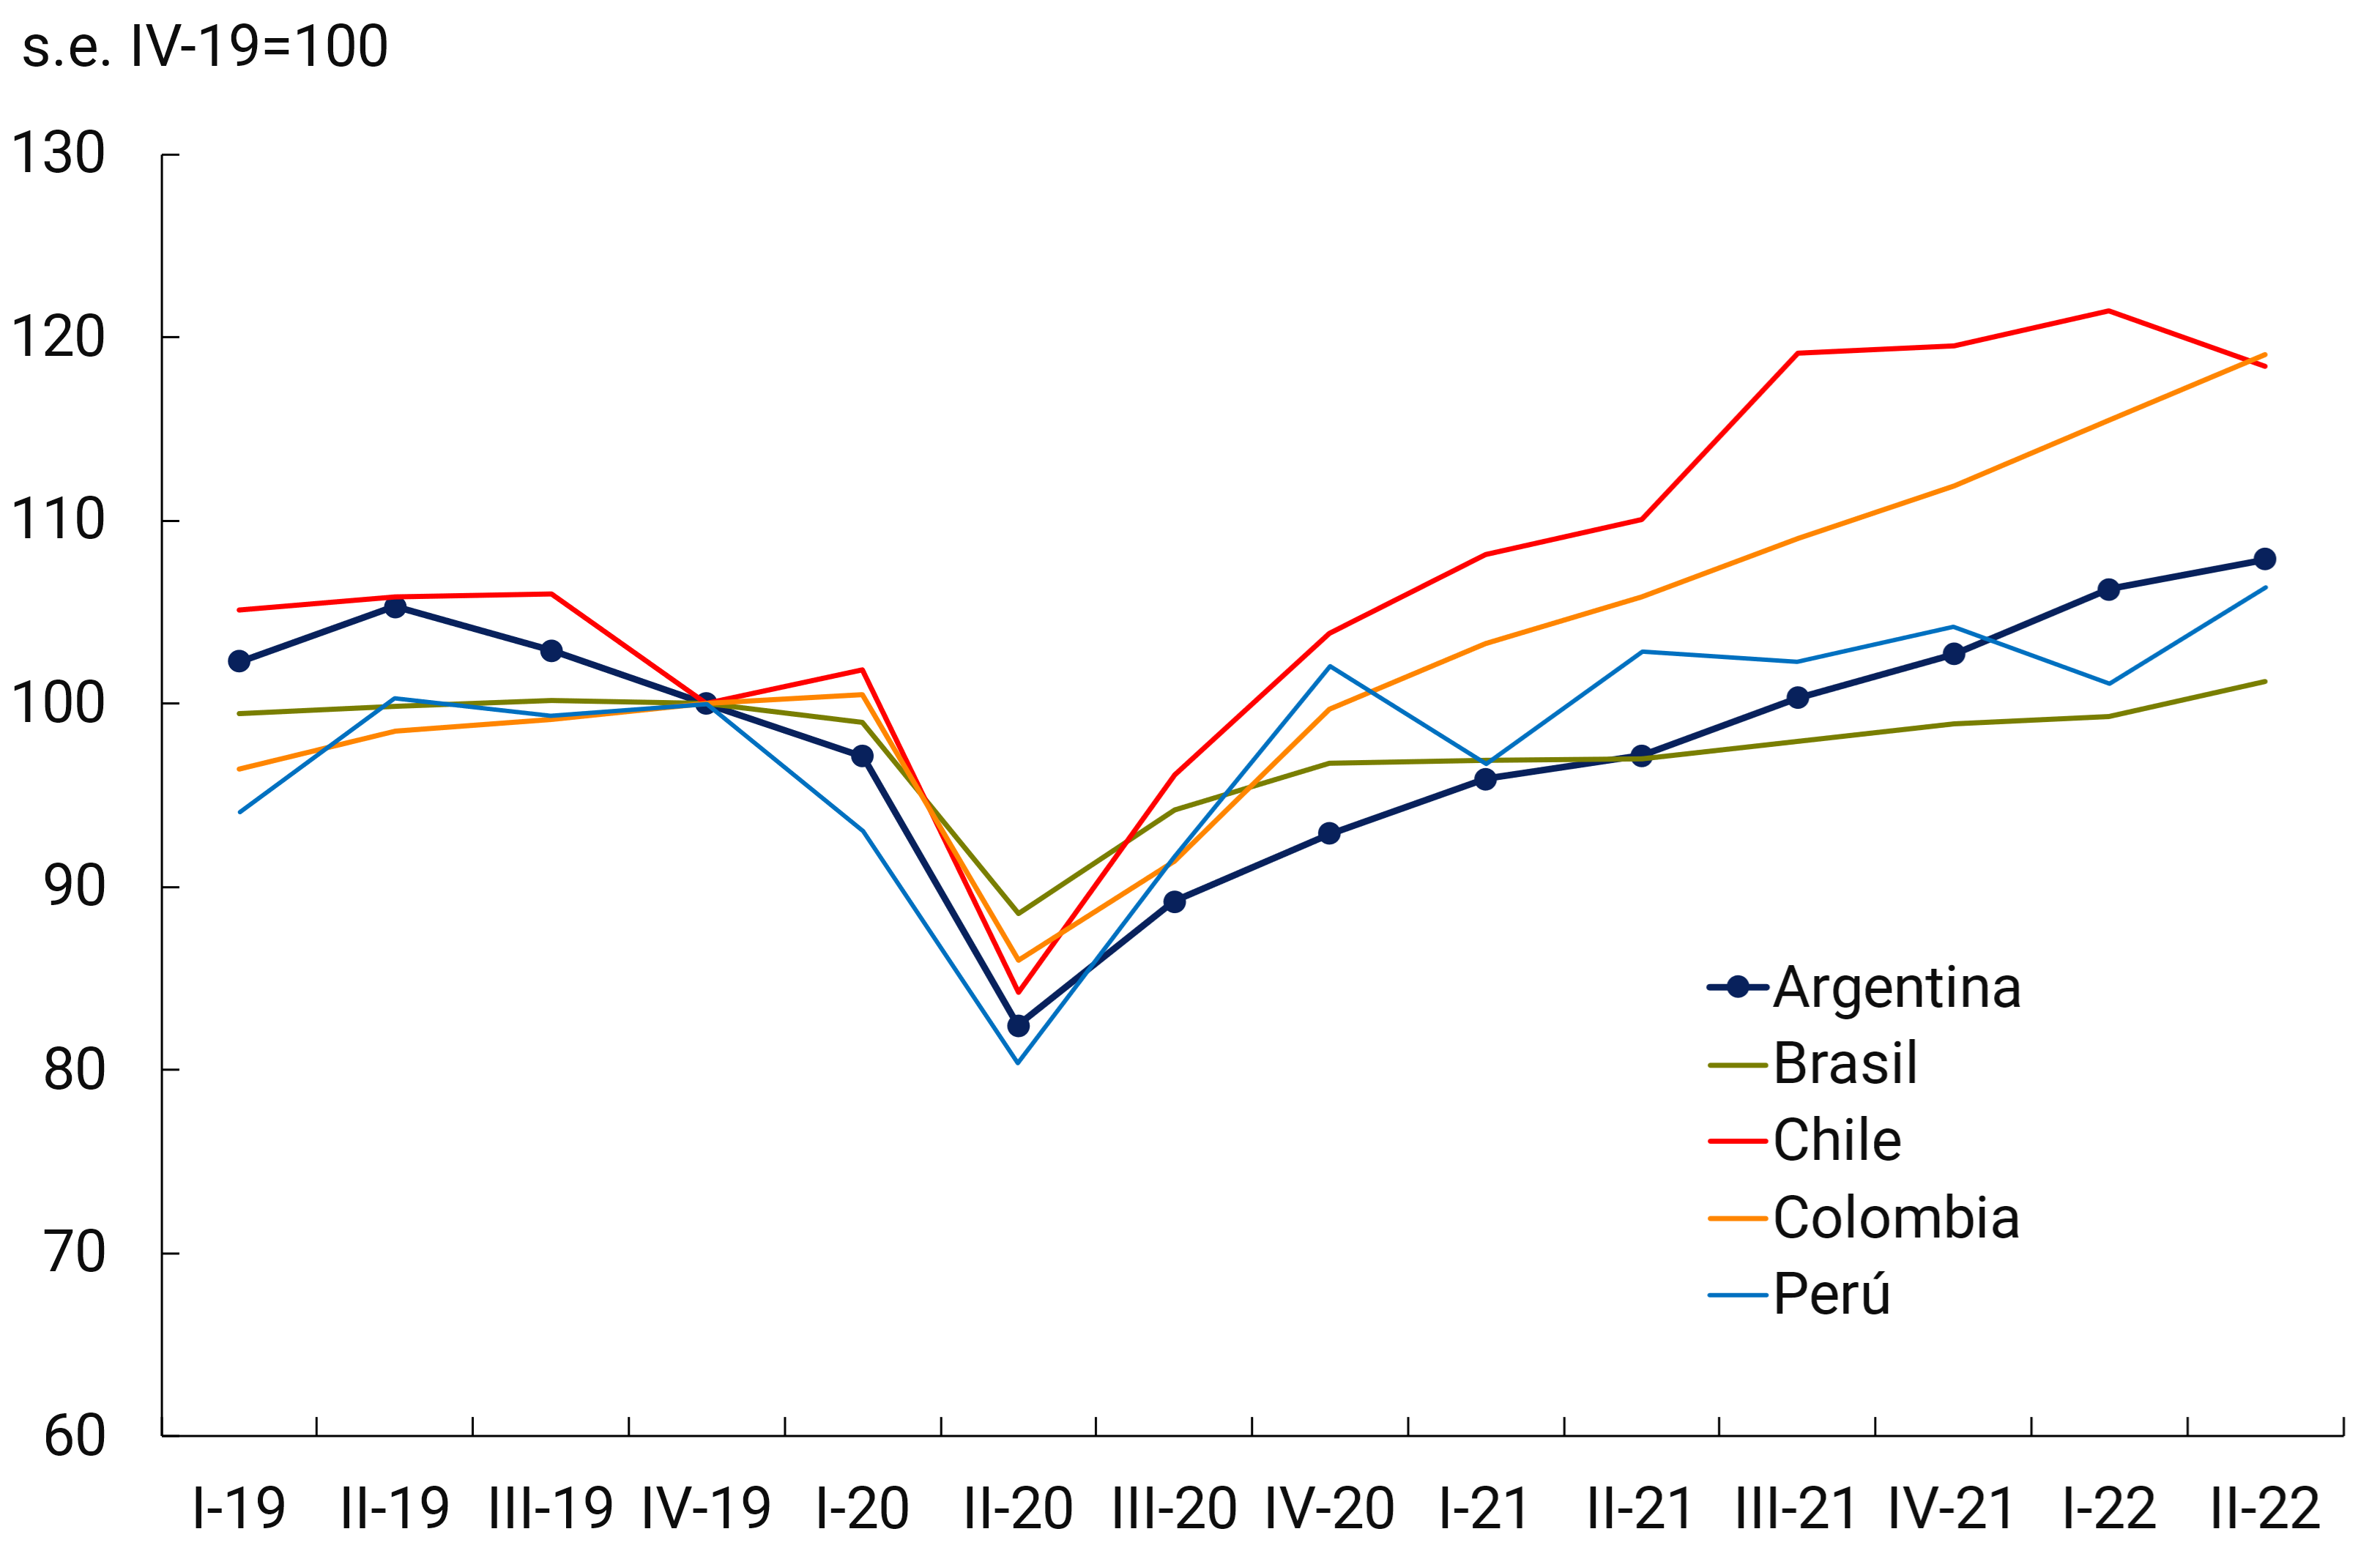
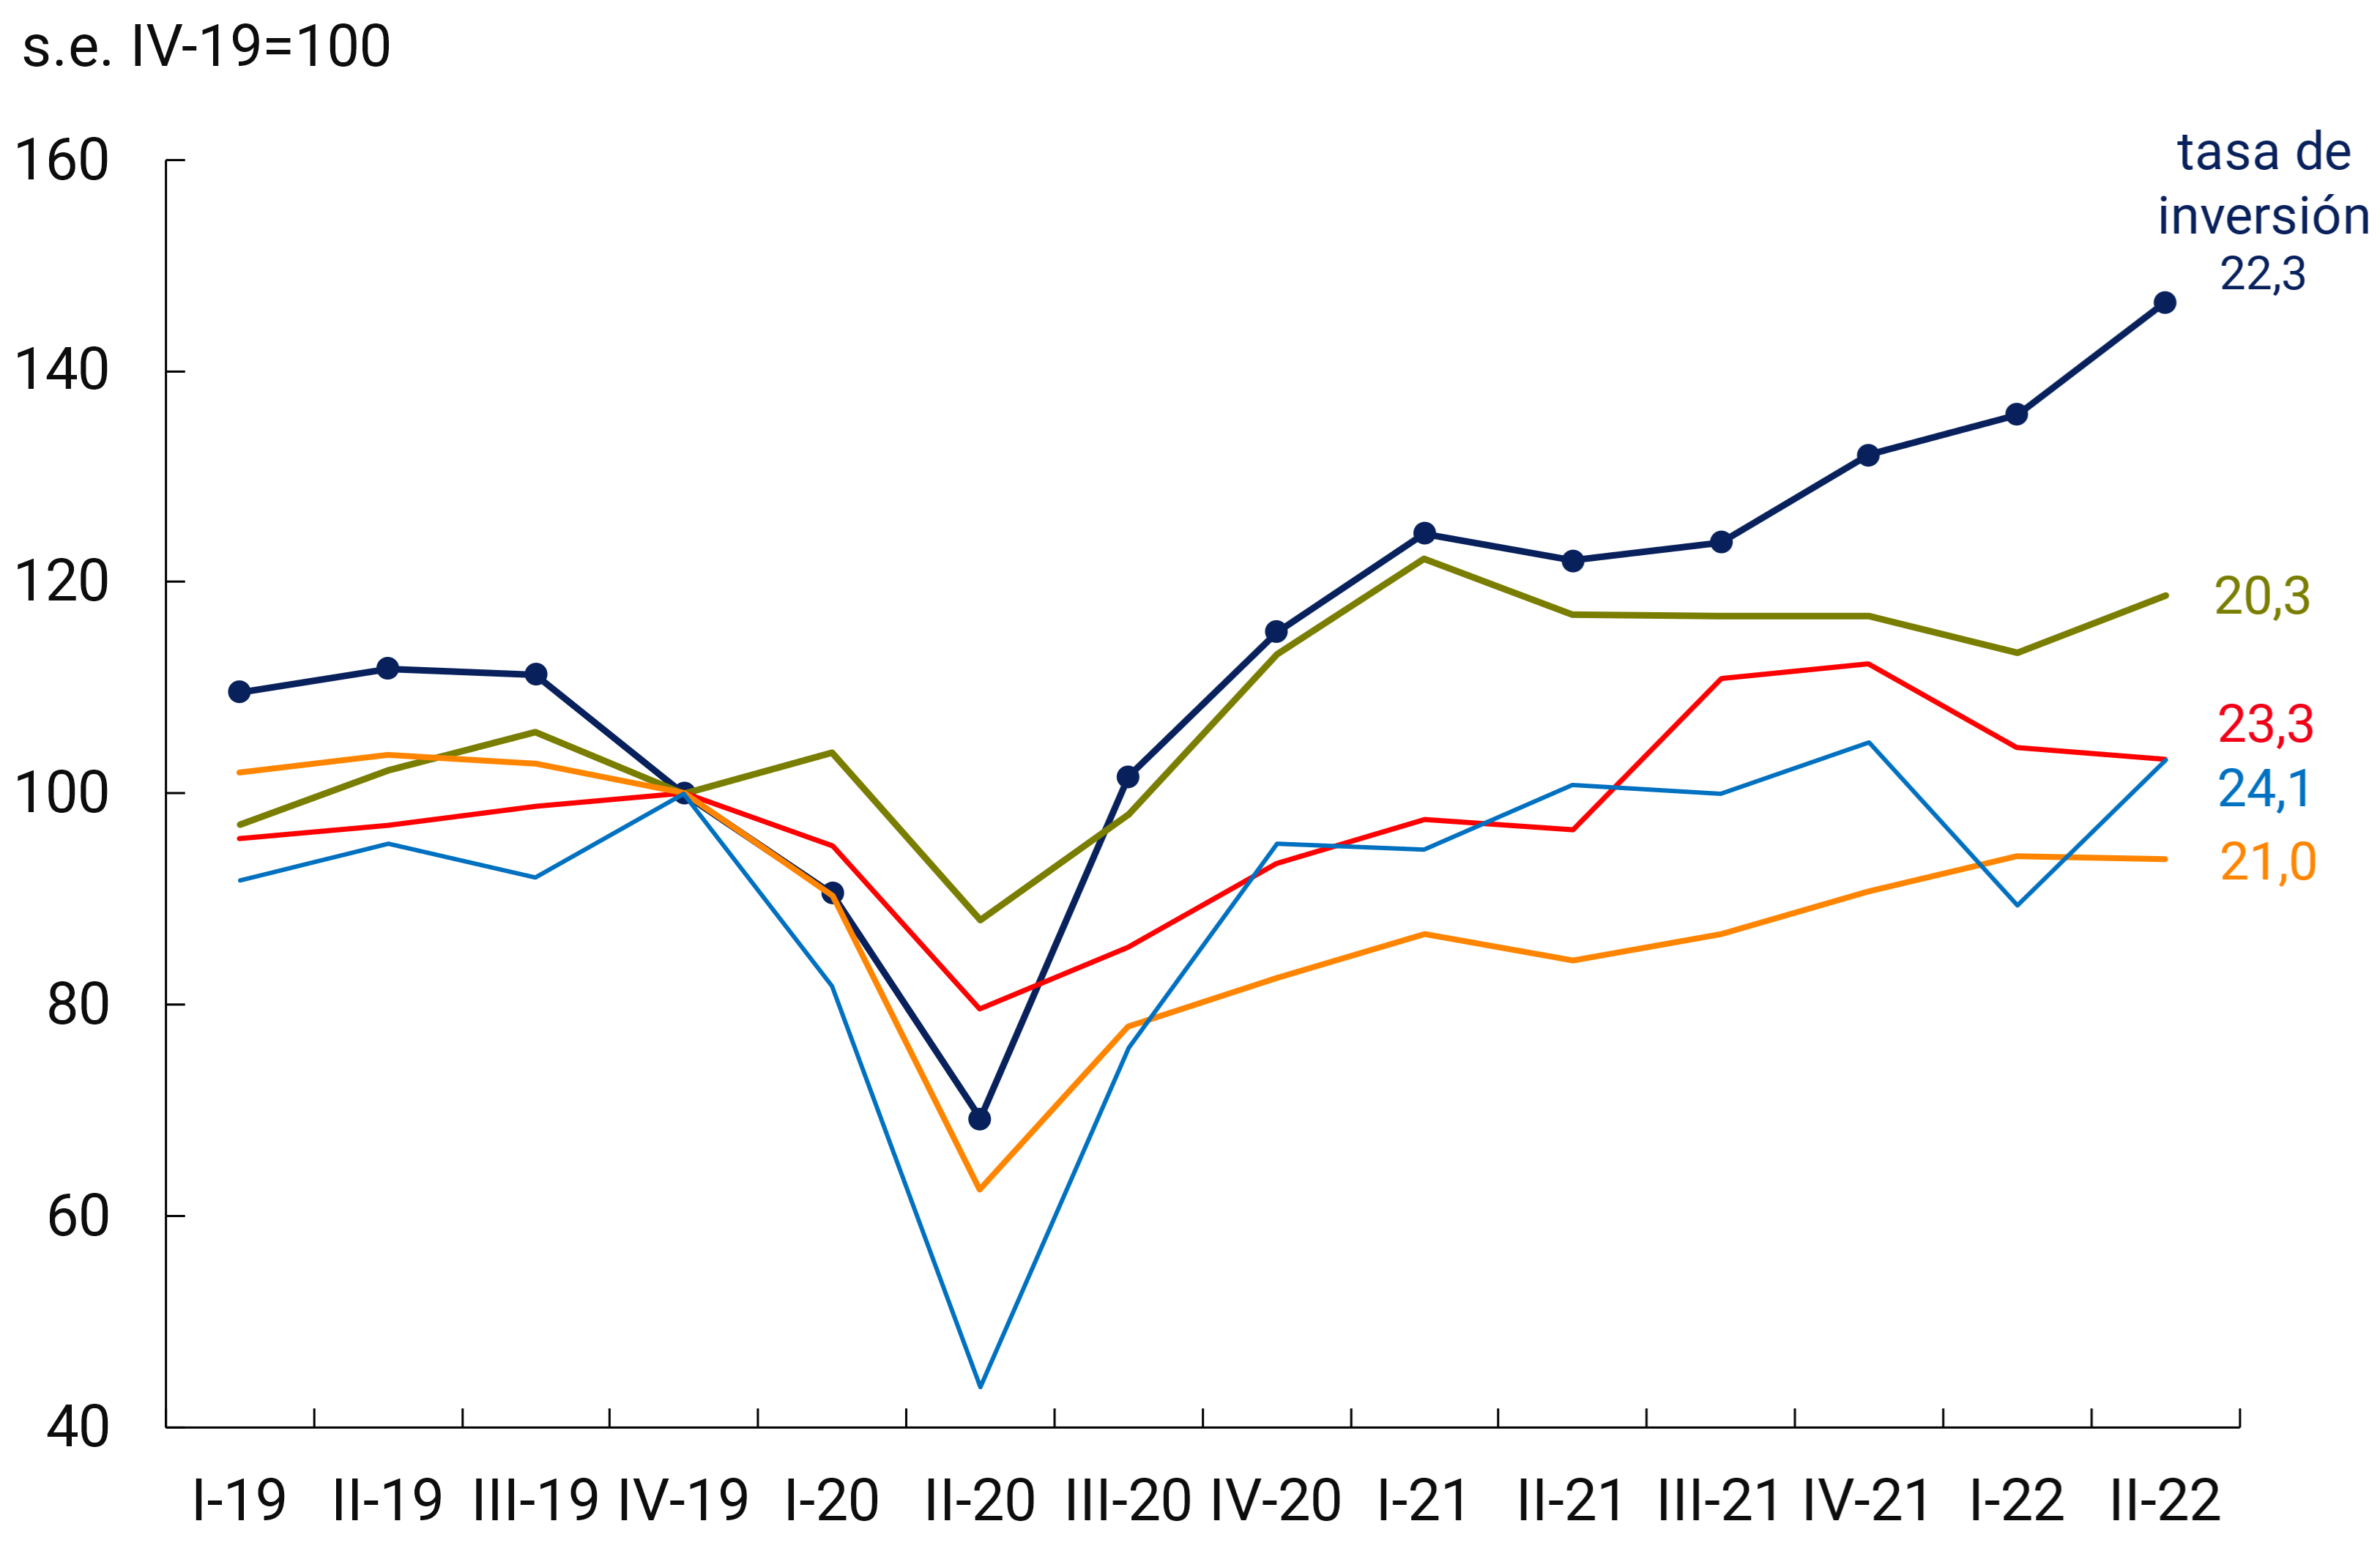
Source: BCRA based on data from INDEC, Brazilian Institute of Geography and Statistics, Central Bank of Chile, National Administrative Department of Statistics (Colombia) and National Institute of Statistics and Informatics (Peru).
These aggregate spending behaviors hide private consumption/savings decisions, affected by the changes in habits introduced by the pandemic, beyond the differences in terms of the margins of access to external financing and degrees of financial mobility in each country. In the case of Argentina, investment performance has a correlation in gross national disposable savings9 that increased markedly from the economic crisis of 2018 to 2021 inclusive and that is interrupted in 2022, due to the fall in disposable income and the deterioration of the terms of trade with the rest of the world. In Brazil, the pandemic encouraged a more moderate rise in national savings that still does not seem to be altered. For the rest of the countries analyzed, on the other hand, savings exhibited a relatively more stable trend in the years prior to the pandemic, with falls in 2021 that would be reversed this year (see Chart 4).
Figure 4 | Gross national savings of the selected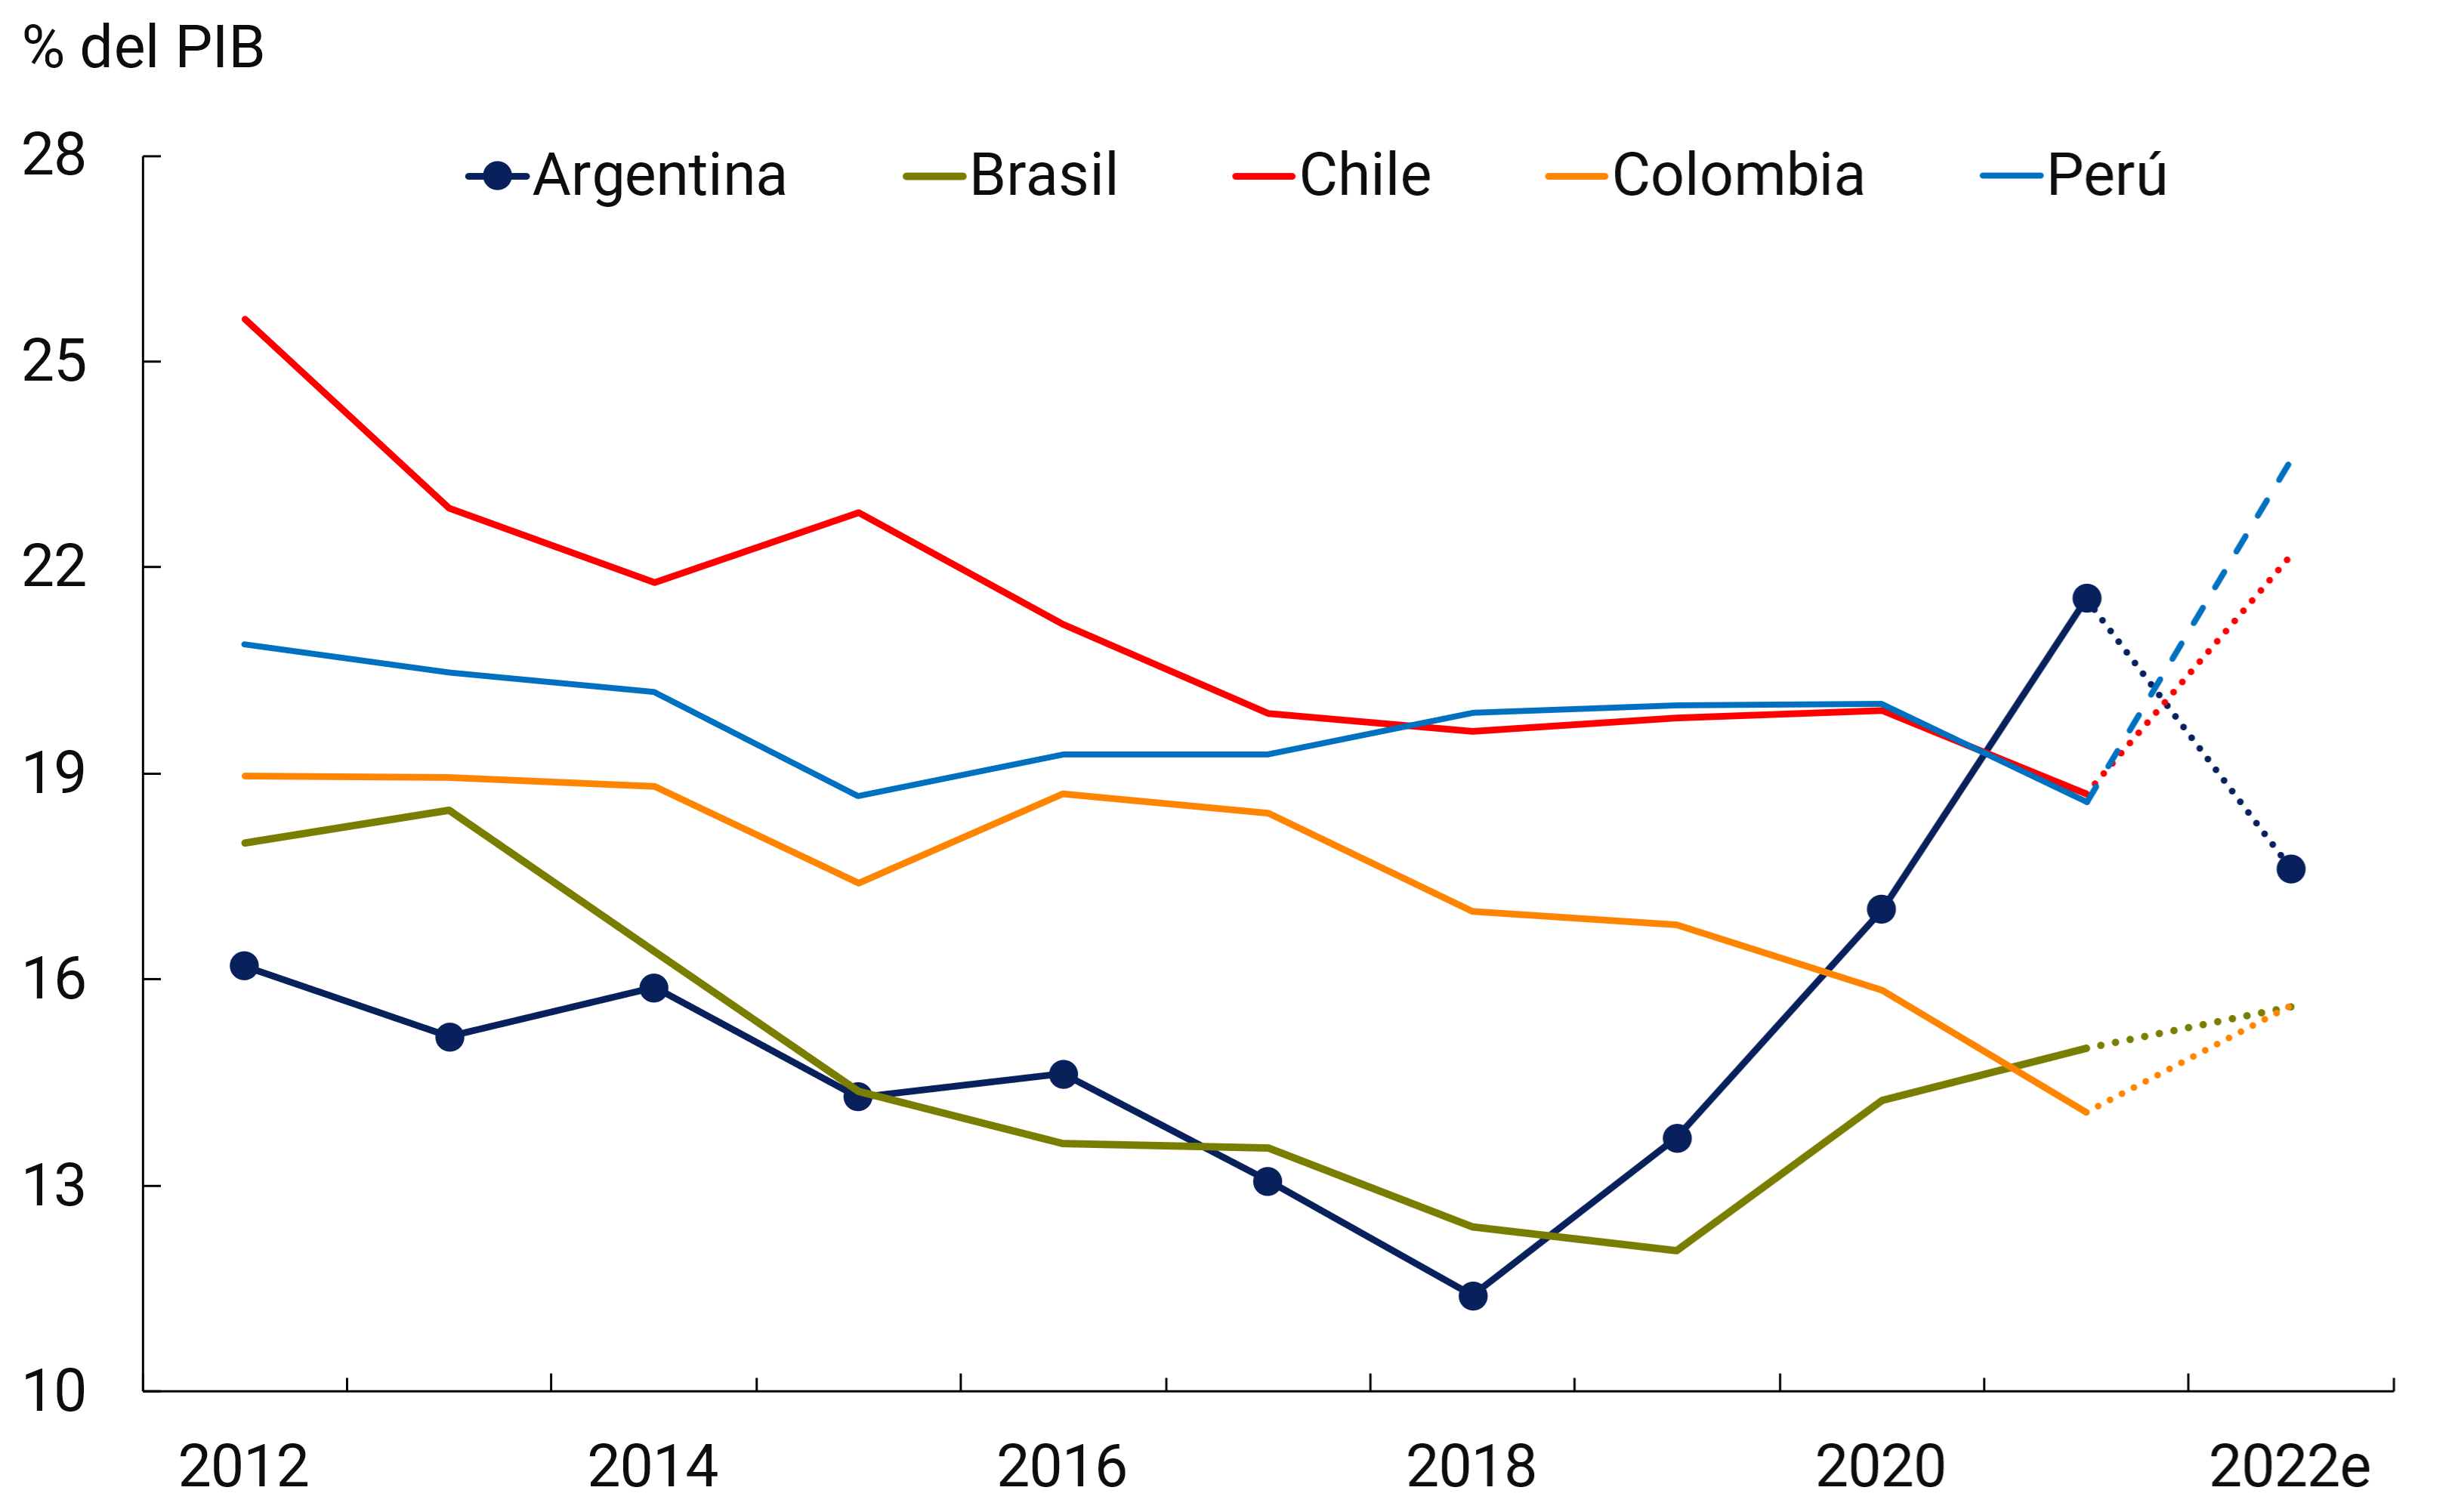
economies
e: Estimated.
Source: BCRA based on data from INDEC and IMF.
On the external front, the imbalances expected for these economies for the current year are deteriorating and tend to be close to those observed in 2019, with the exception of Brazil. This constitutes the main economic policy challenge for these countries, taking into account the still adverse international context they are facing, in particular due to the prolongation of the Russia-Ukraine conflict, which has a negative impact – although to varying degrees – through the trade channel, commodity prices and the financial channel. with the tightening of global financial conditions (see Chart 5).
Graph 5 | Current Account of the Balance of International Payments Selected
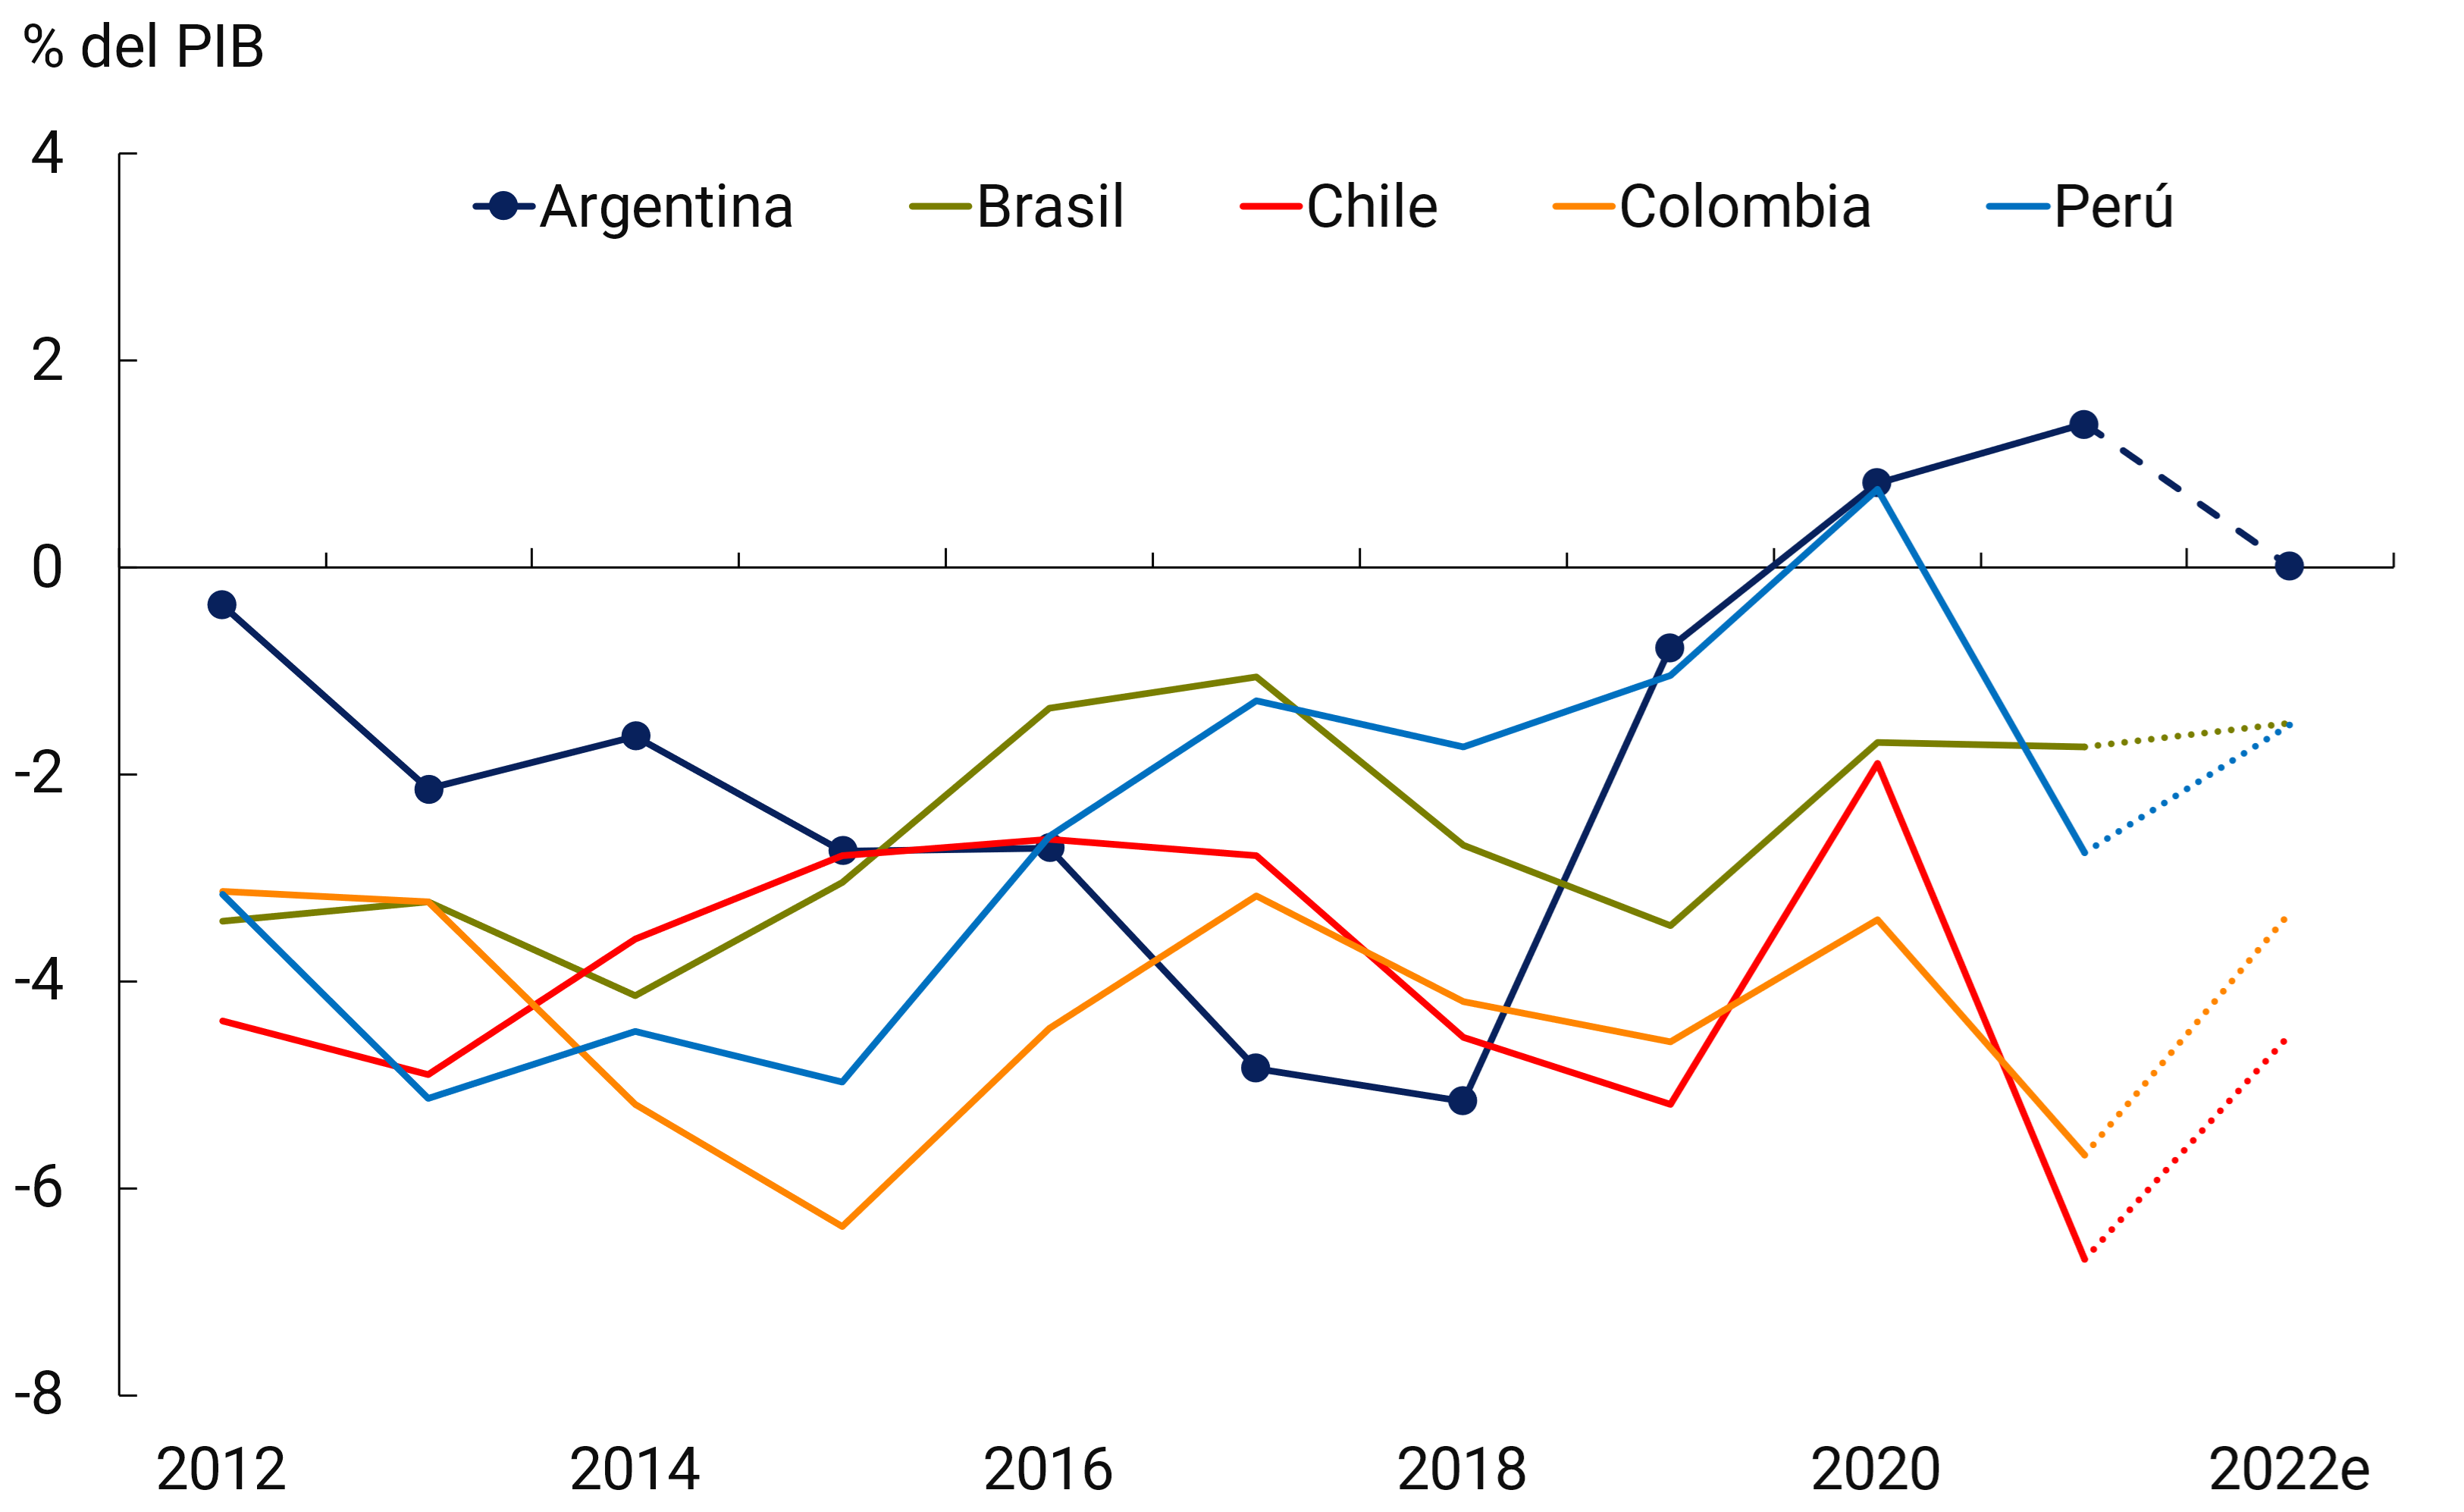
countries
e: Estimated.
Source: BCRA based on data from INDEC and IMF.
In conclusion, the performance of the Argentine economy after the pandemic was around the average of what was observed in the main countries of Latin America. Although there was a notable development in investment among the drivers of the recovery (and of the manufacturing industry on the supply side), Argentina evidenced in the last 5 years one of the most significant processes of correction of its gross national savings rates, showing that it is on a path with important challenges to face a process of sustainable economic growth.
Back to top
Section 3 / Energy trade balance
In the first eight months of the year, the trade balance11 due to the exchange of fuels and electricity with the rest of the world resulted in a deficit of US$5,248 million for the Argentine economy. This is the largest negative record for this concept since 2014. More than half of the deterioration in the total trade surplus of goods so far in 2022 can be explained exclusively by the energy balance (see Chart 1).
Graph 1 | Trade balance of goods
First 8 months of each year
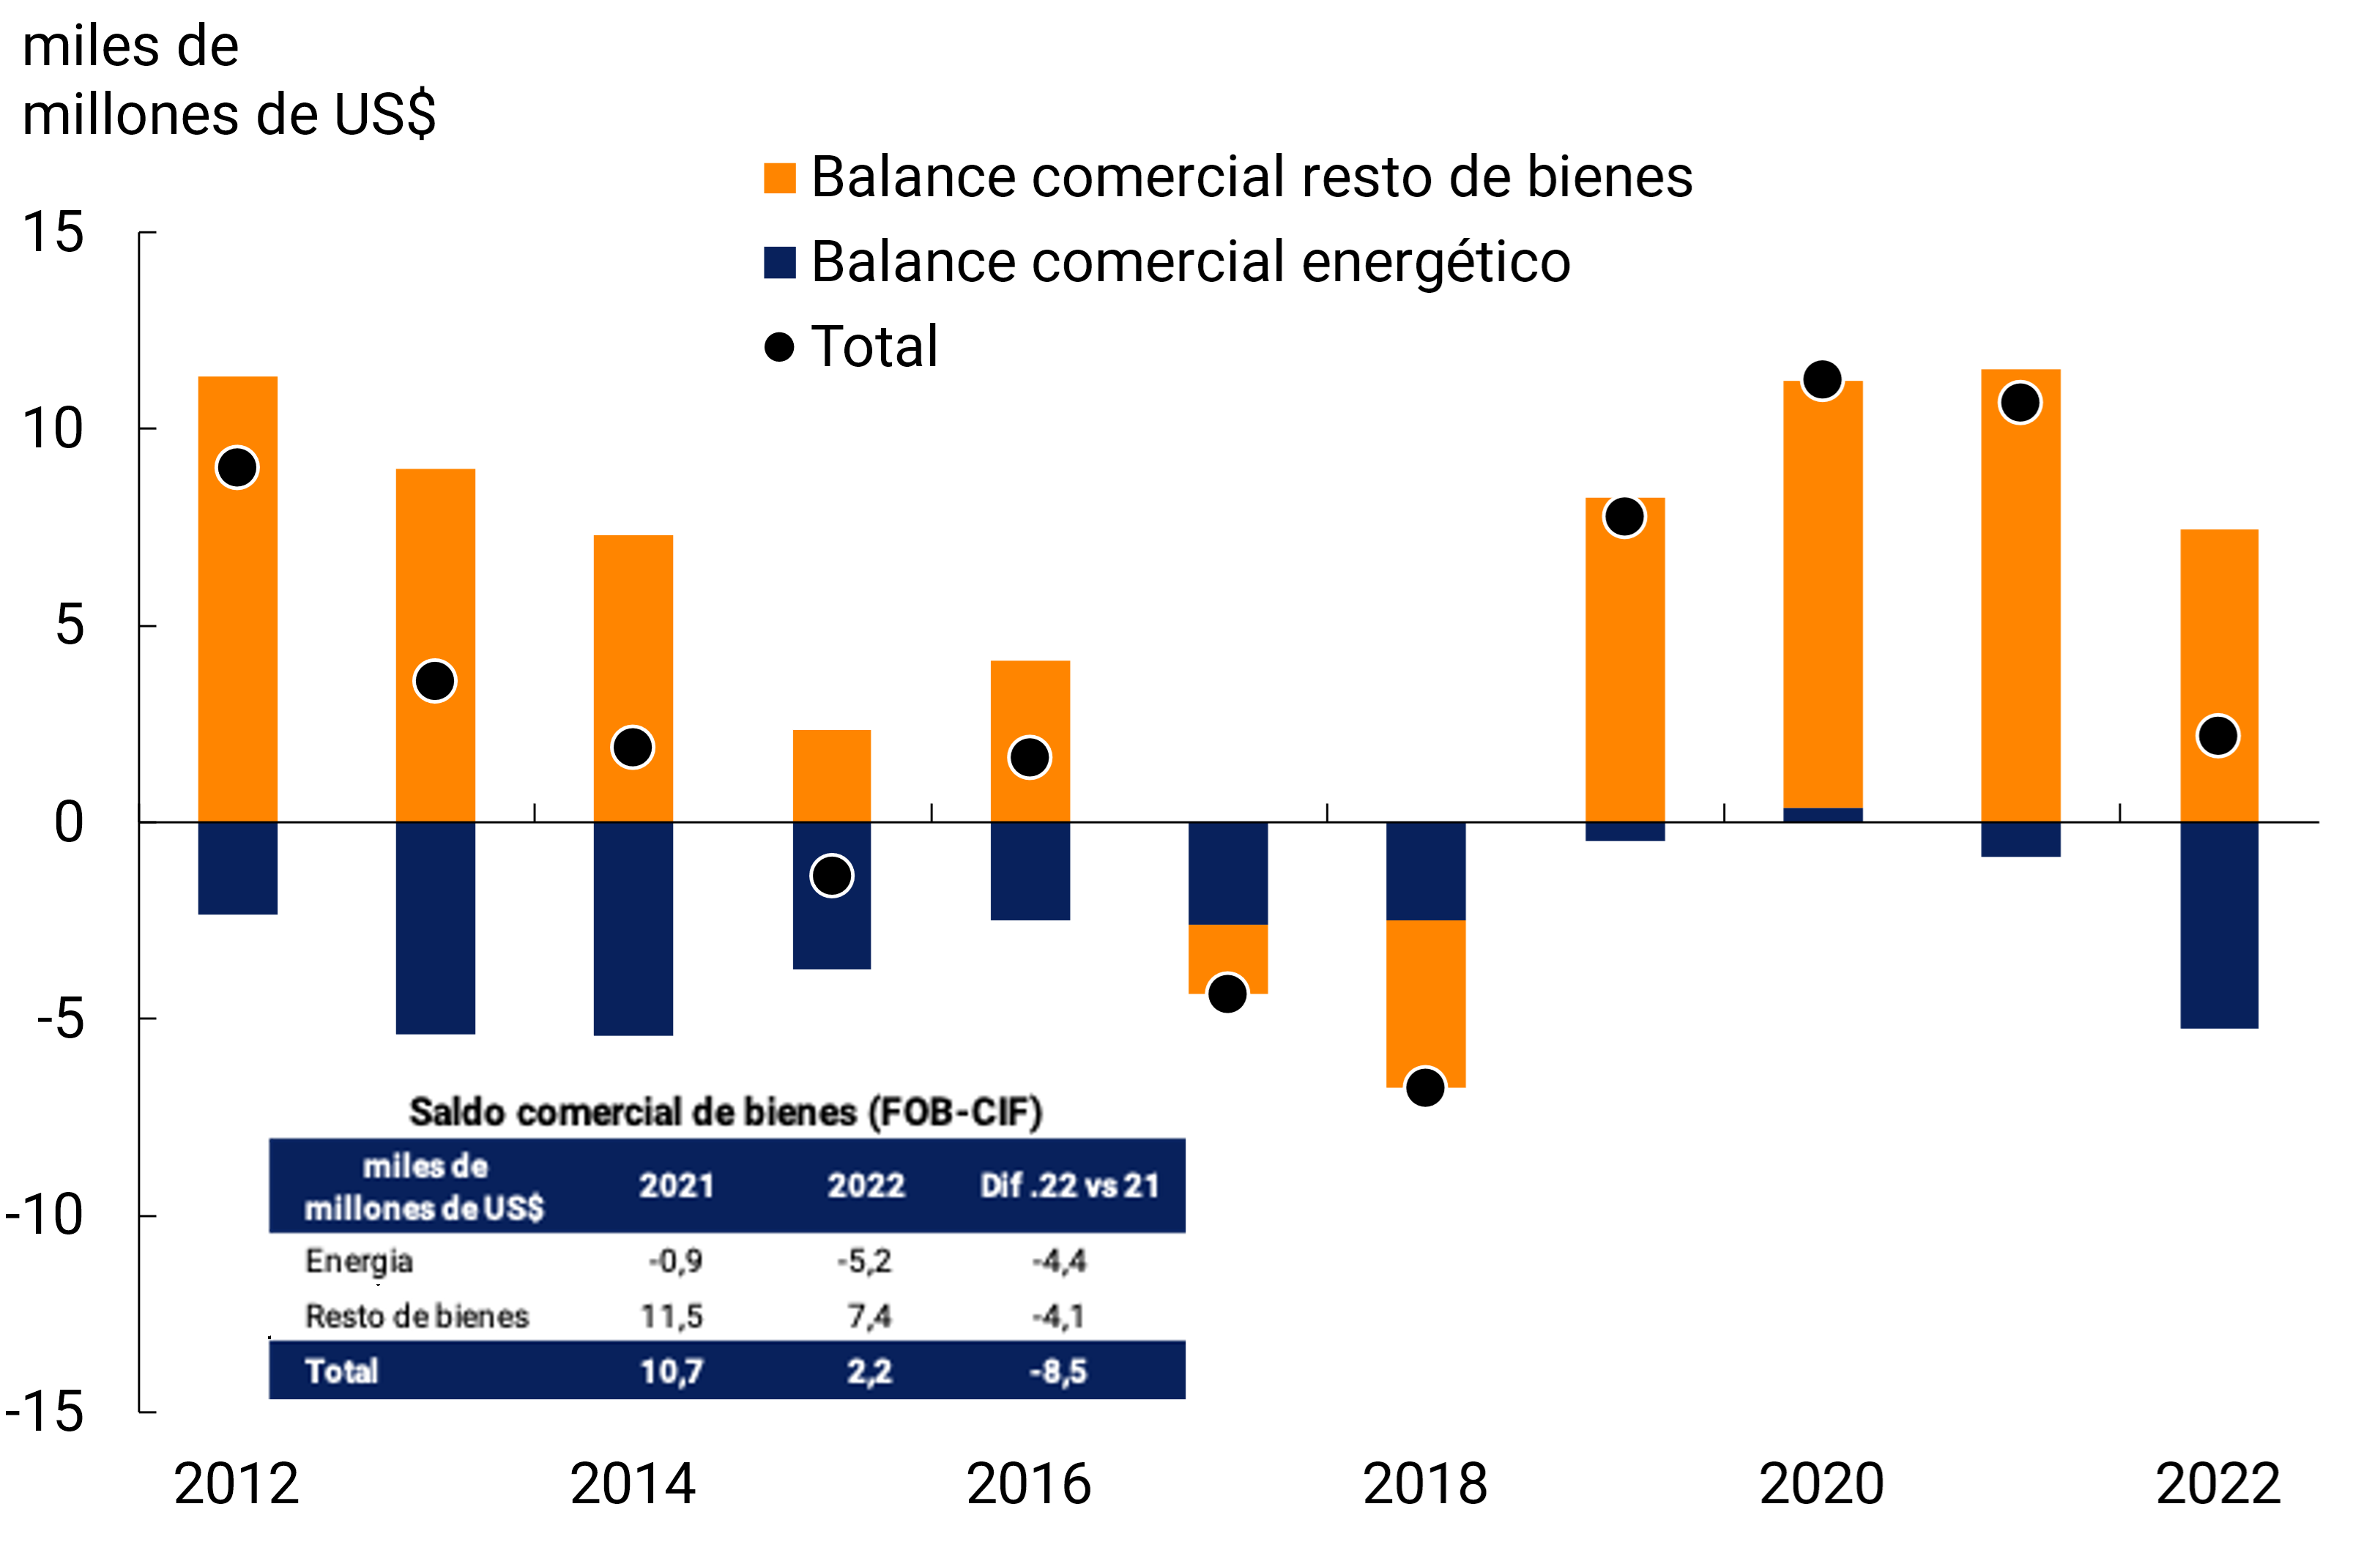
Source: INDEC.
The increase of more than US$4,400 million in the energy trade deficit compared to the same period in 2021 is explained by a much greater increase in imports than in fuel exports, both in price12 and in quantity. Accumulated exports in the last 12 months to August 2022 were US$7,463 million, the highest value in the last 13 years. The volumes exported of the main product of the sector, crude oil, have been on a growth trend of almost 5 years, supported by the exploitation of the unconventional resources of Vaca Muerta. Even so, the growth of imports was much higher (see Graph 2).
Graph 2 | Fuel
trading First 8 months of 2022
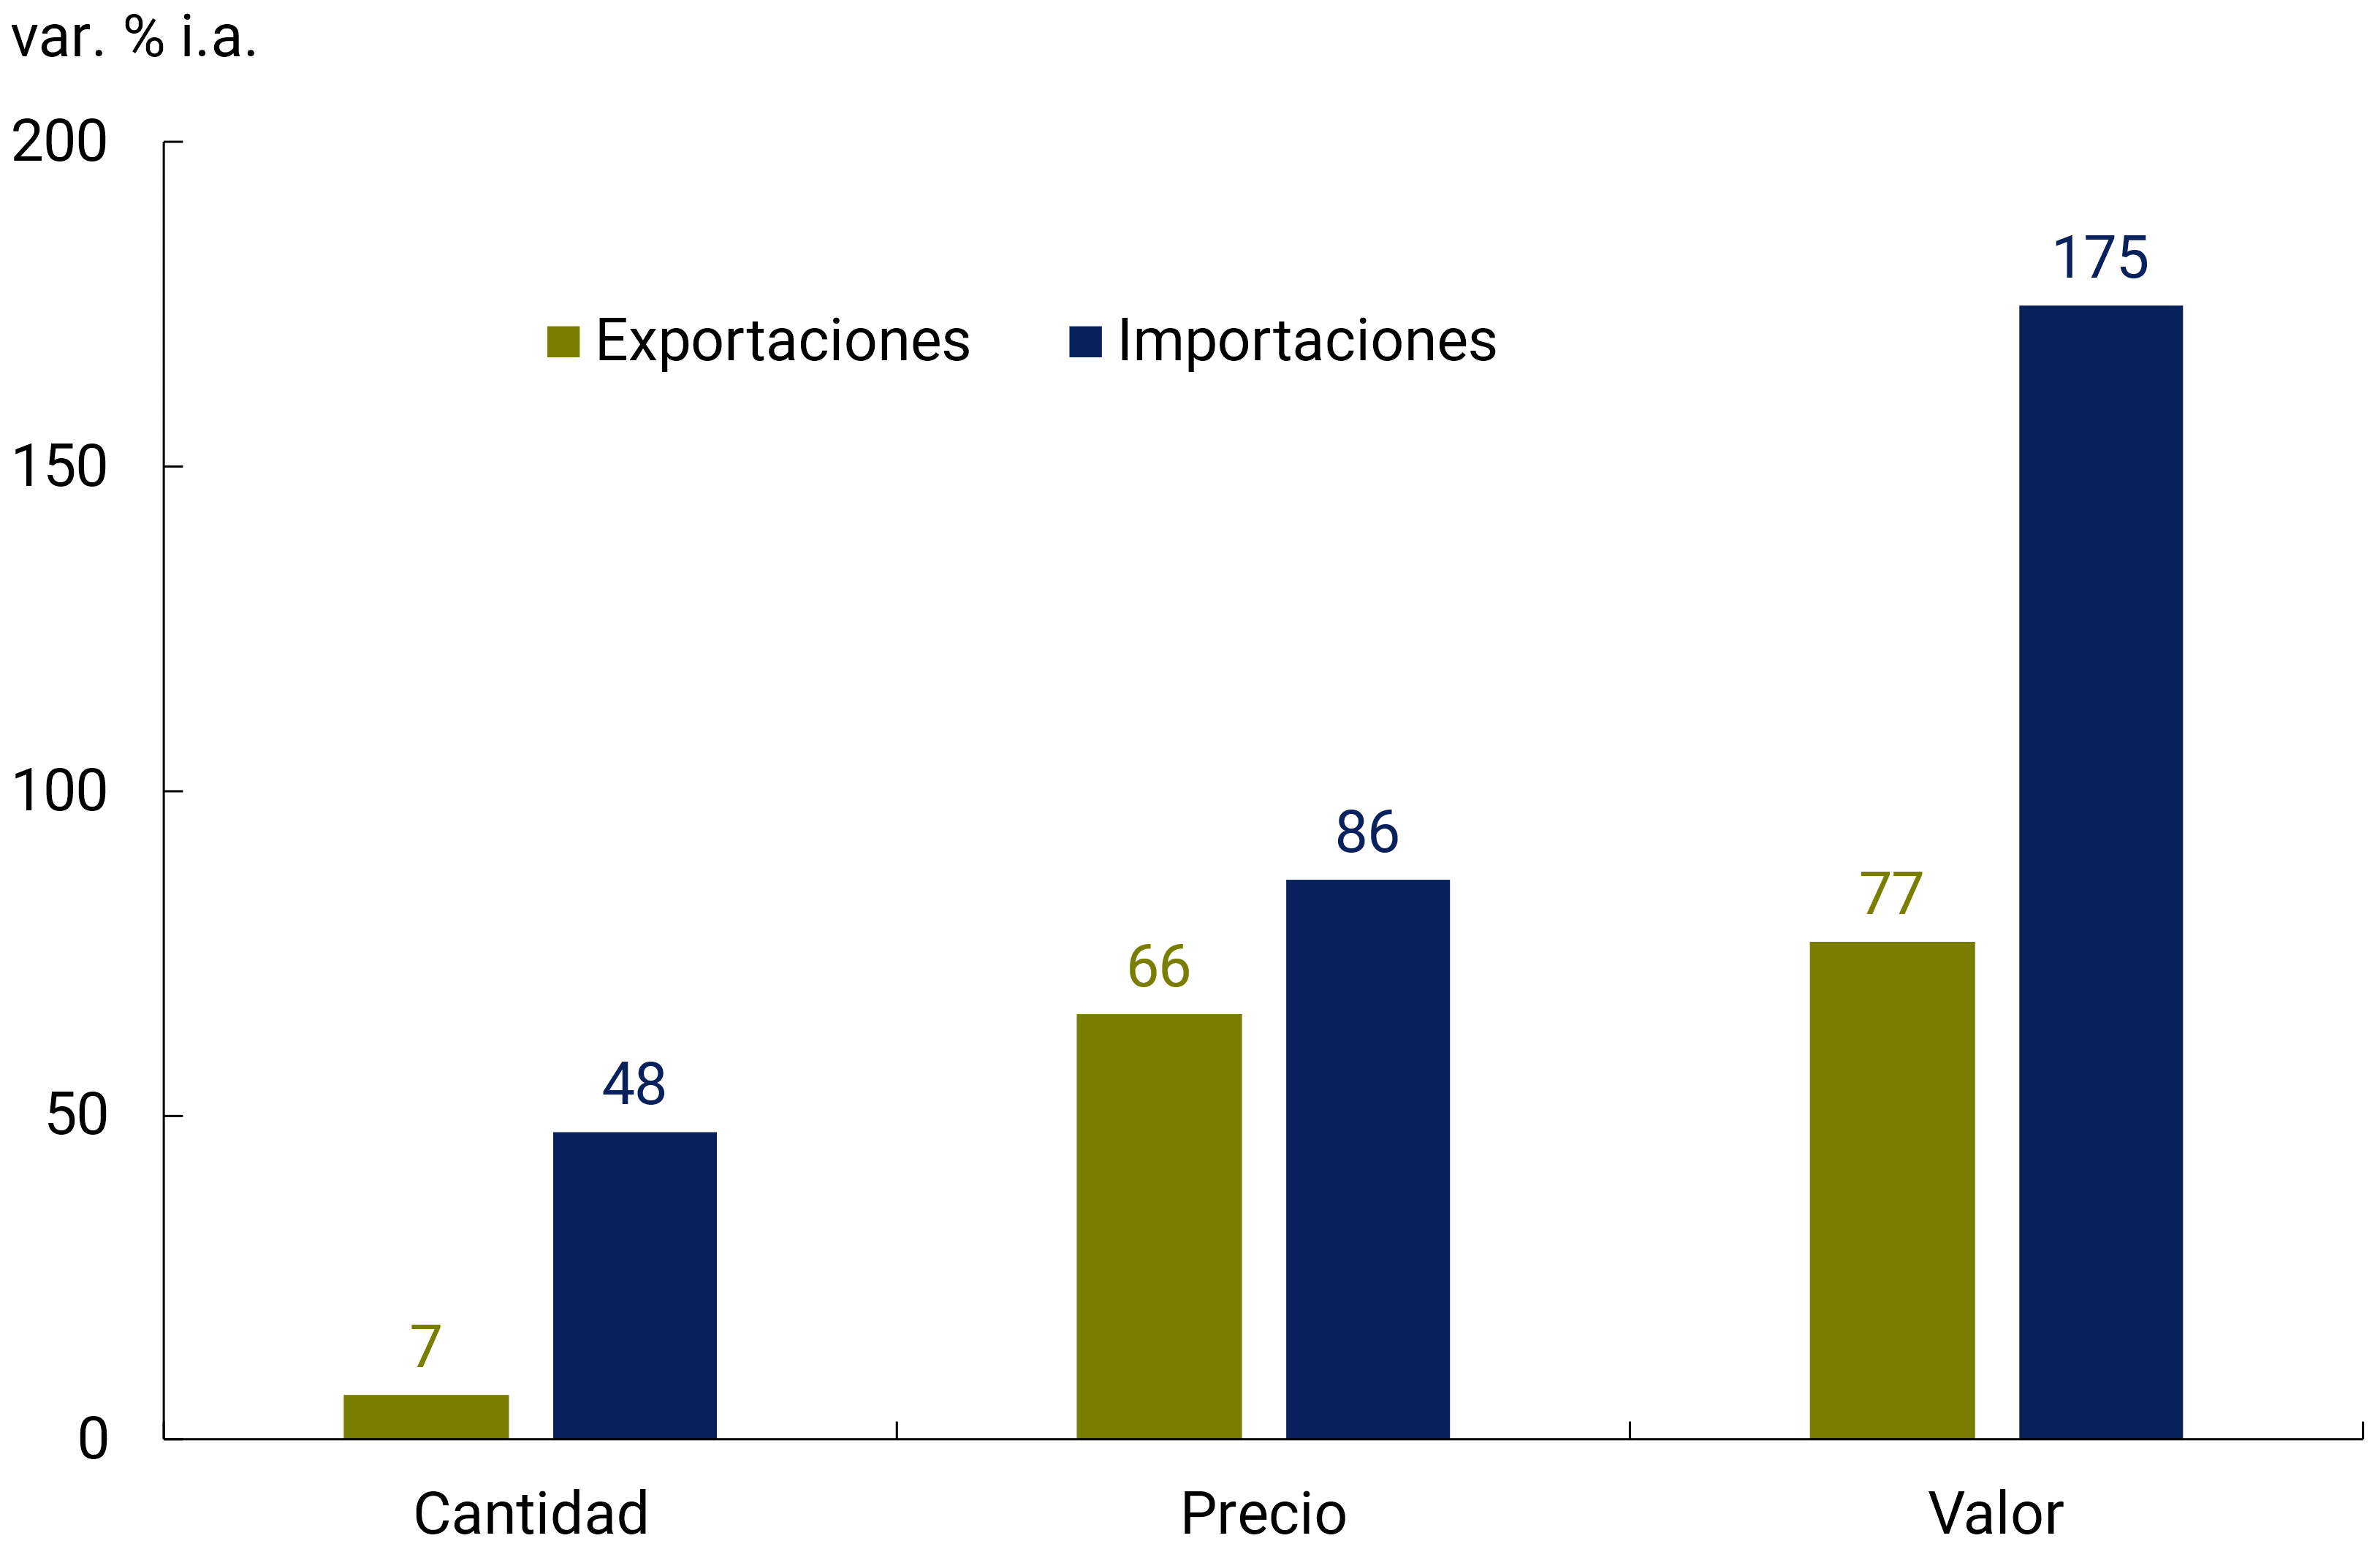
Source: INDEC.
The dynamics of prices were strongly influenced, albeit asymmetrically, by the international context, which is crossed by the war in Ukraine and the repercussions on the global energy market derived from Western sanctions on Russia and the repeated interruptions in Russian gas supplies to Europe in response. Compared to just 1 year ago, in August 2022 the average price of Brent oil had risen 41%, natural gas in the United States 117%, liquefied natural gas in Asia 87% and liquefied natural gas in Europe, the epicenter of the conflict, 354%. Current prices are also high compared to the pre-pandemic period (see Graph 3).
International fuel prices
Brent Oil
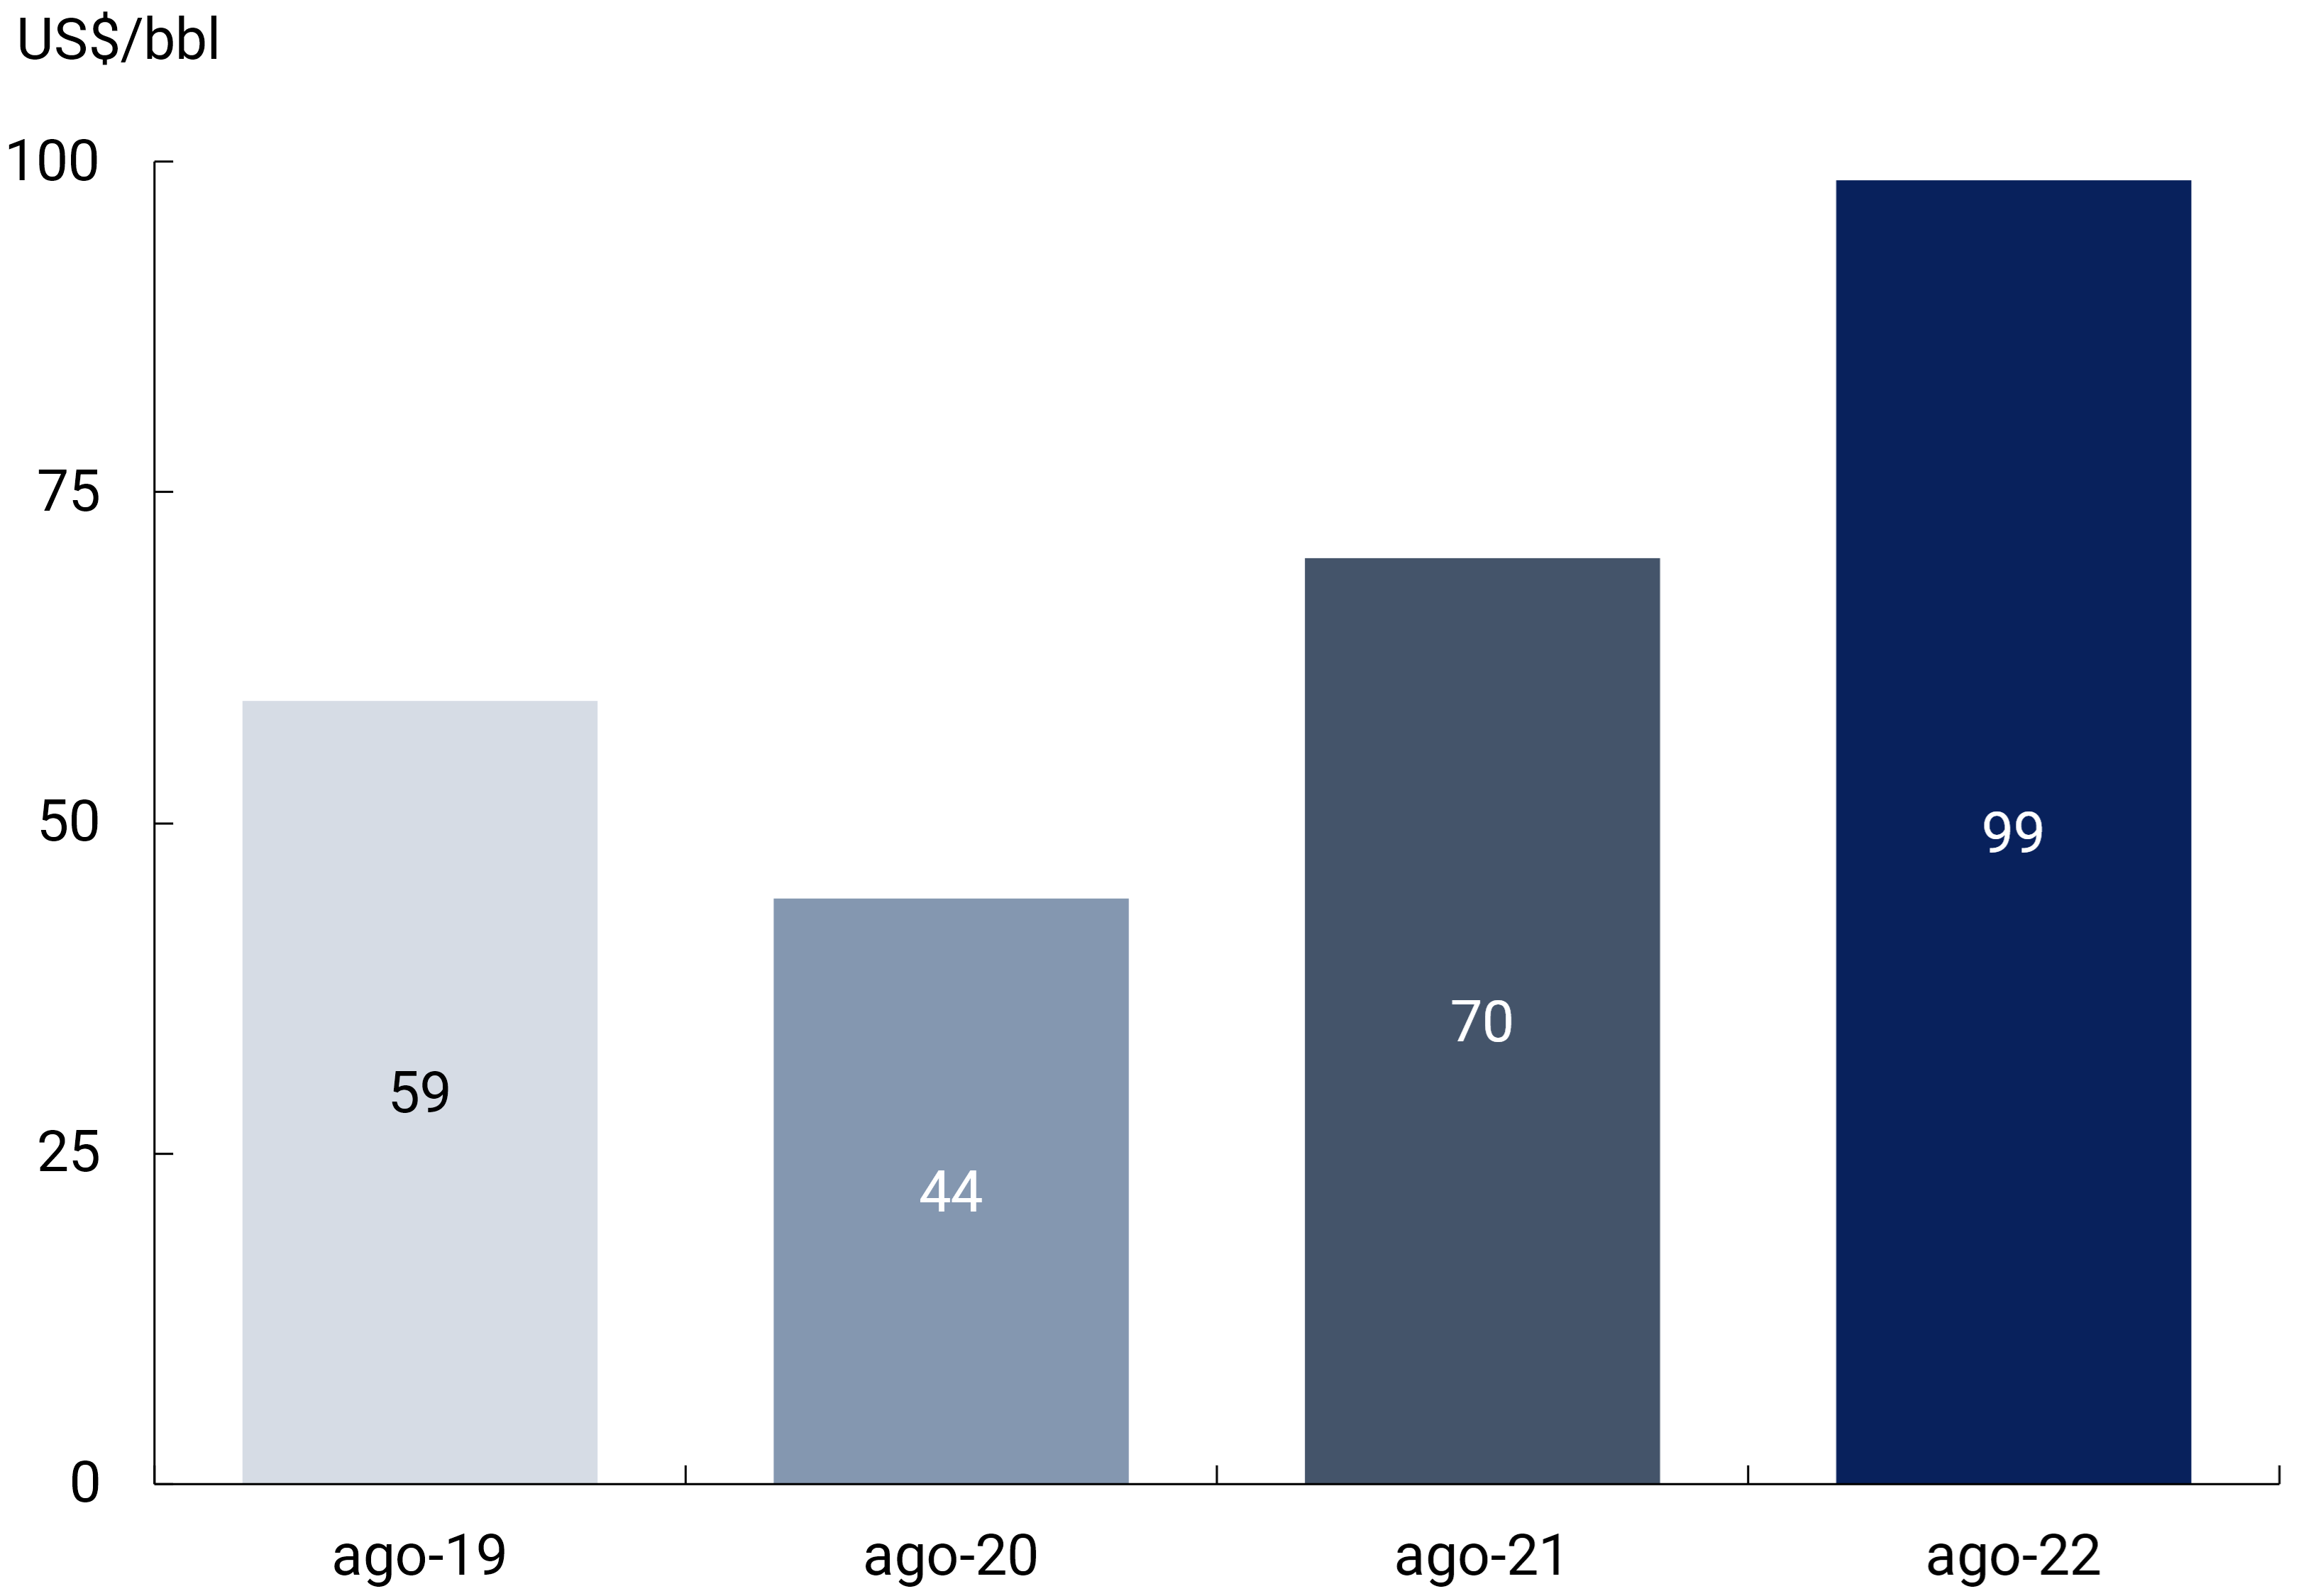
U.S. Natural Gas (Henry Hub)
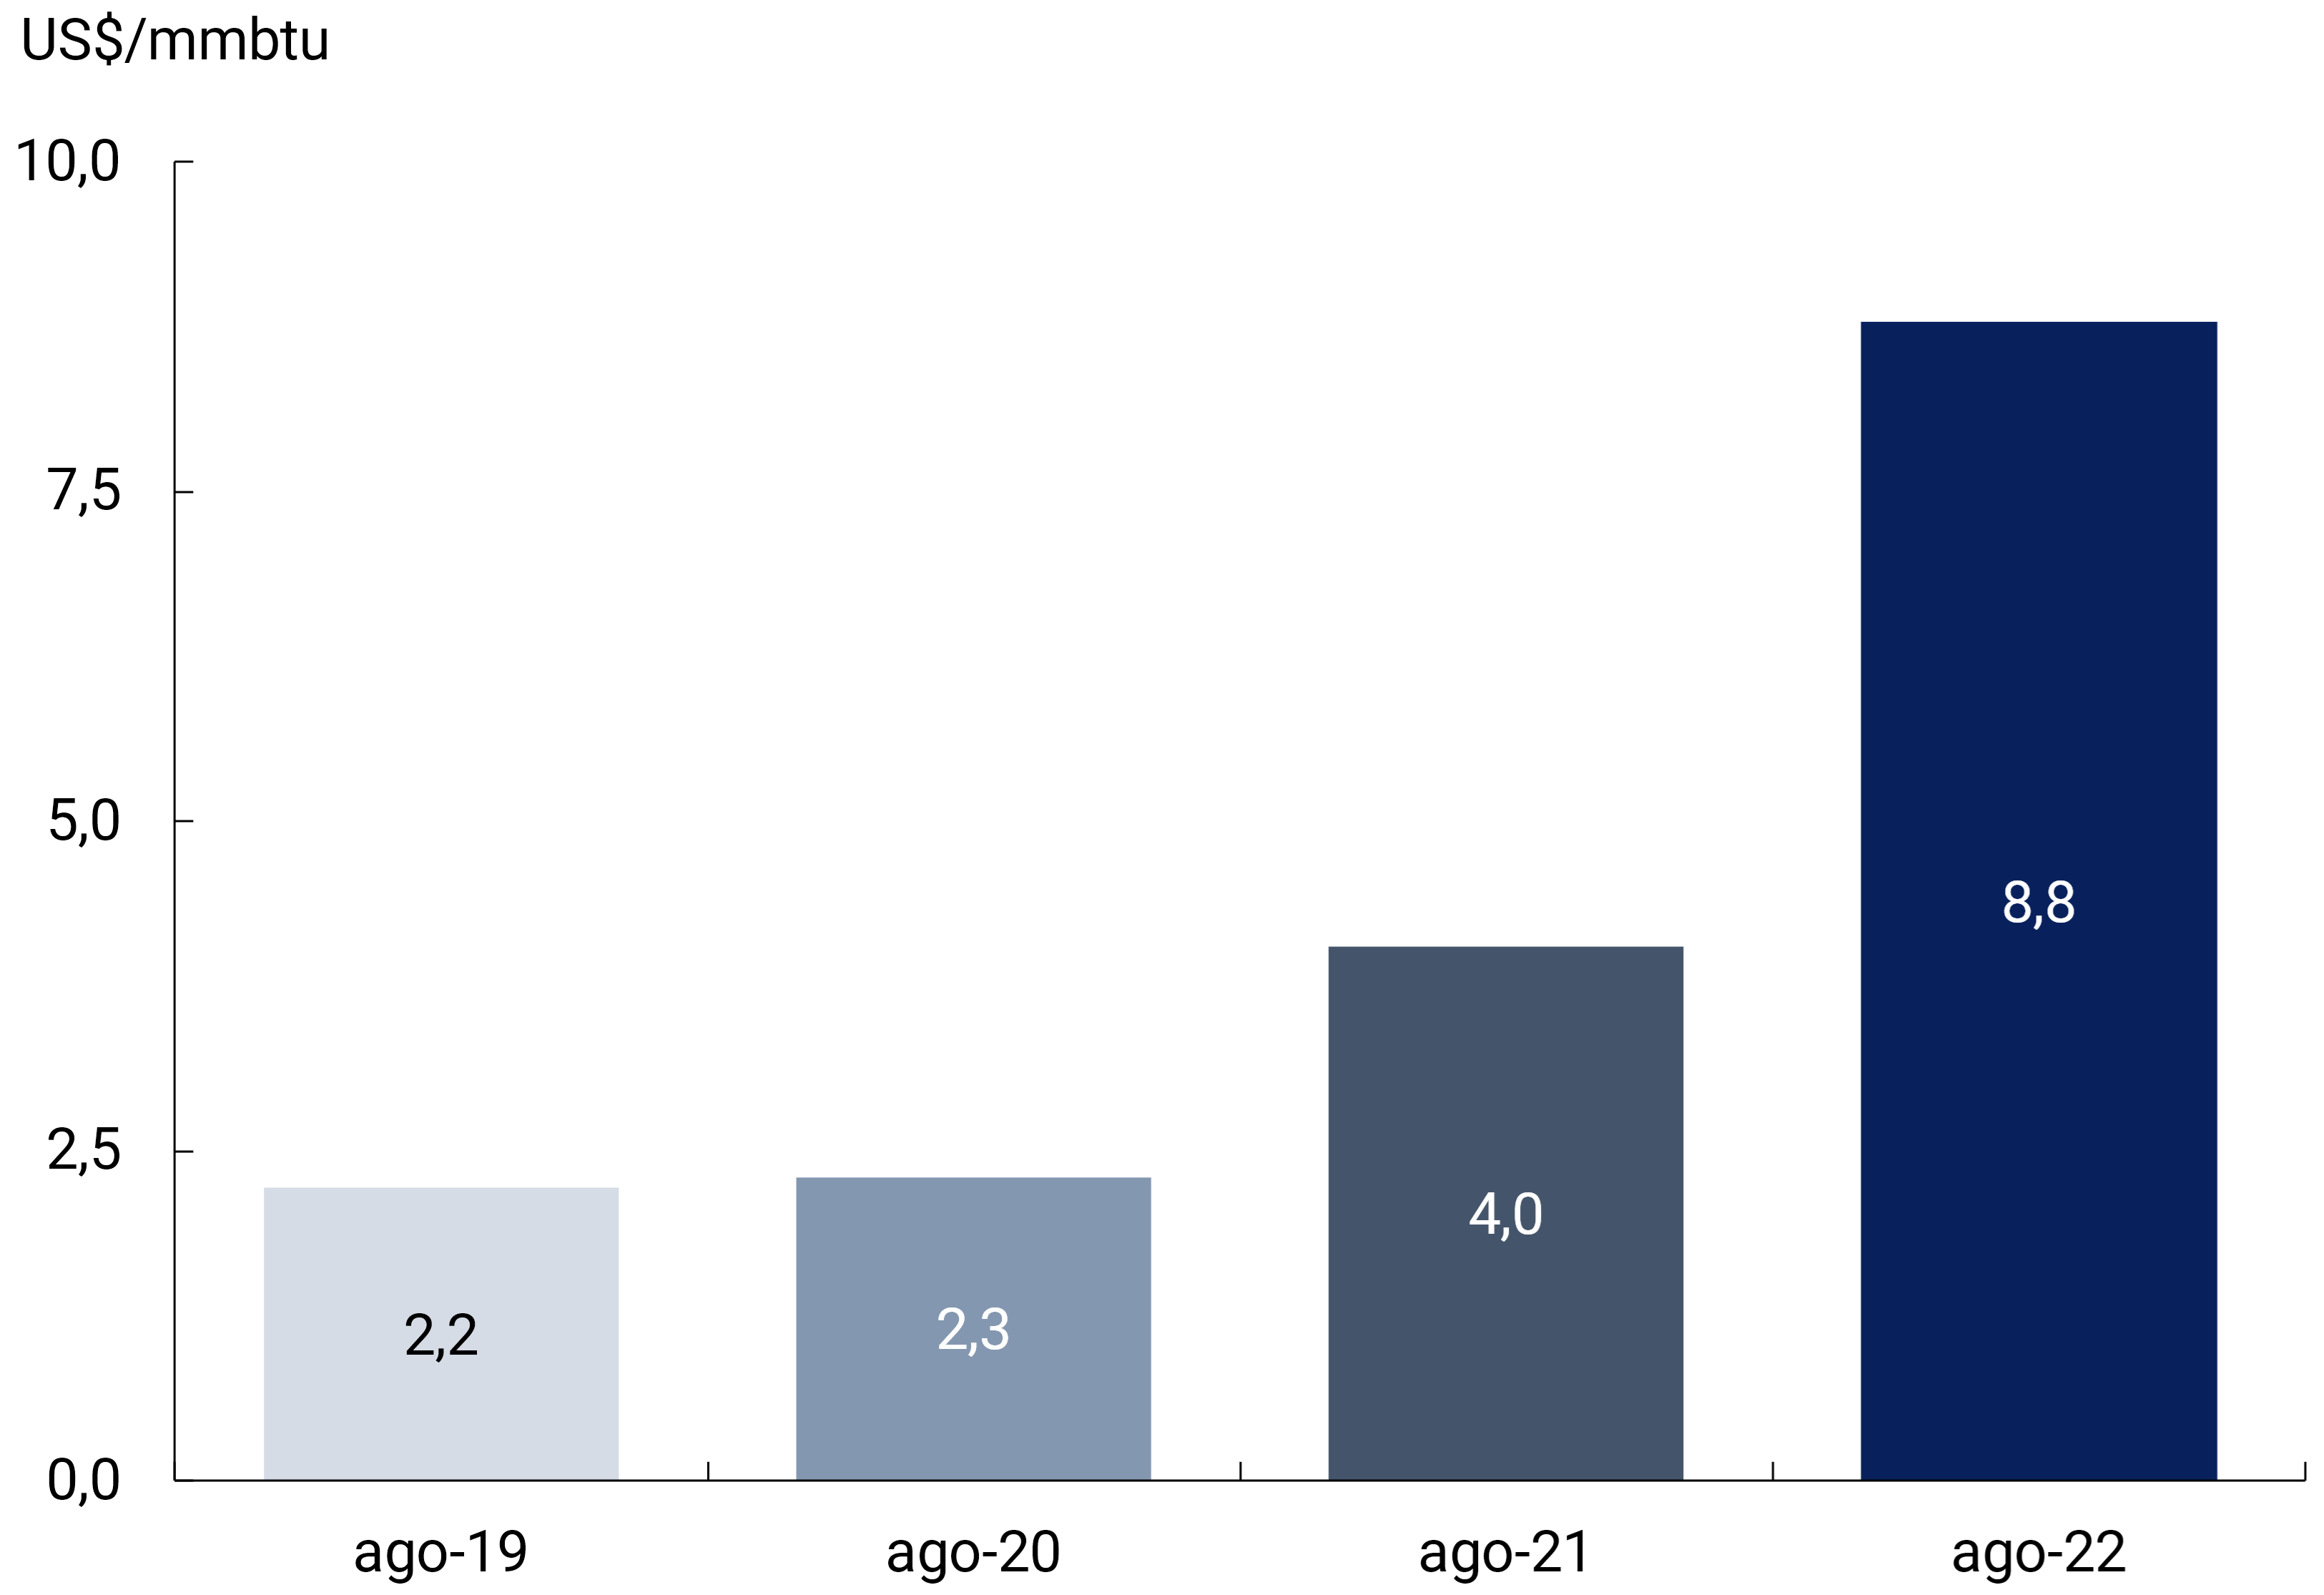
Liquefied natural gas Asia (CIF Japan)
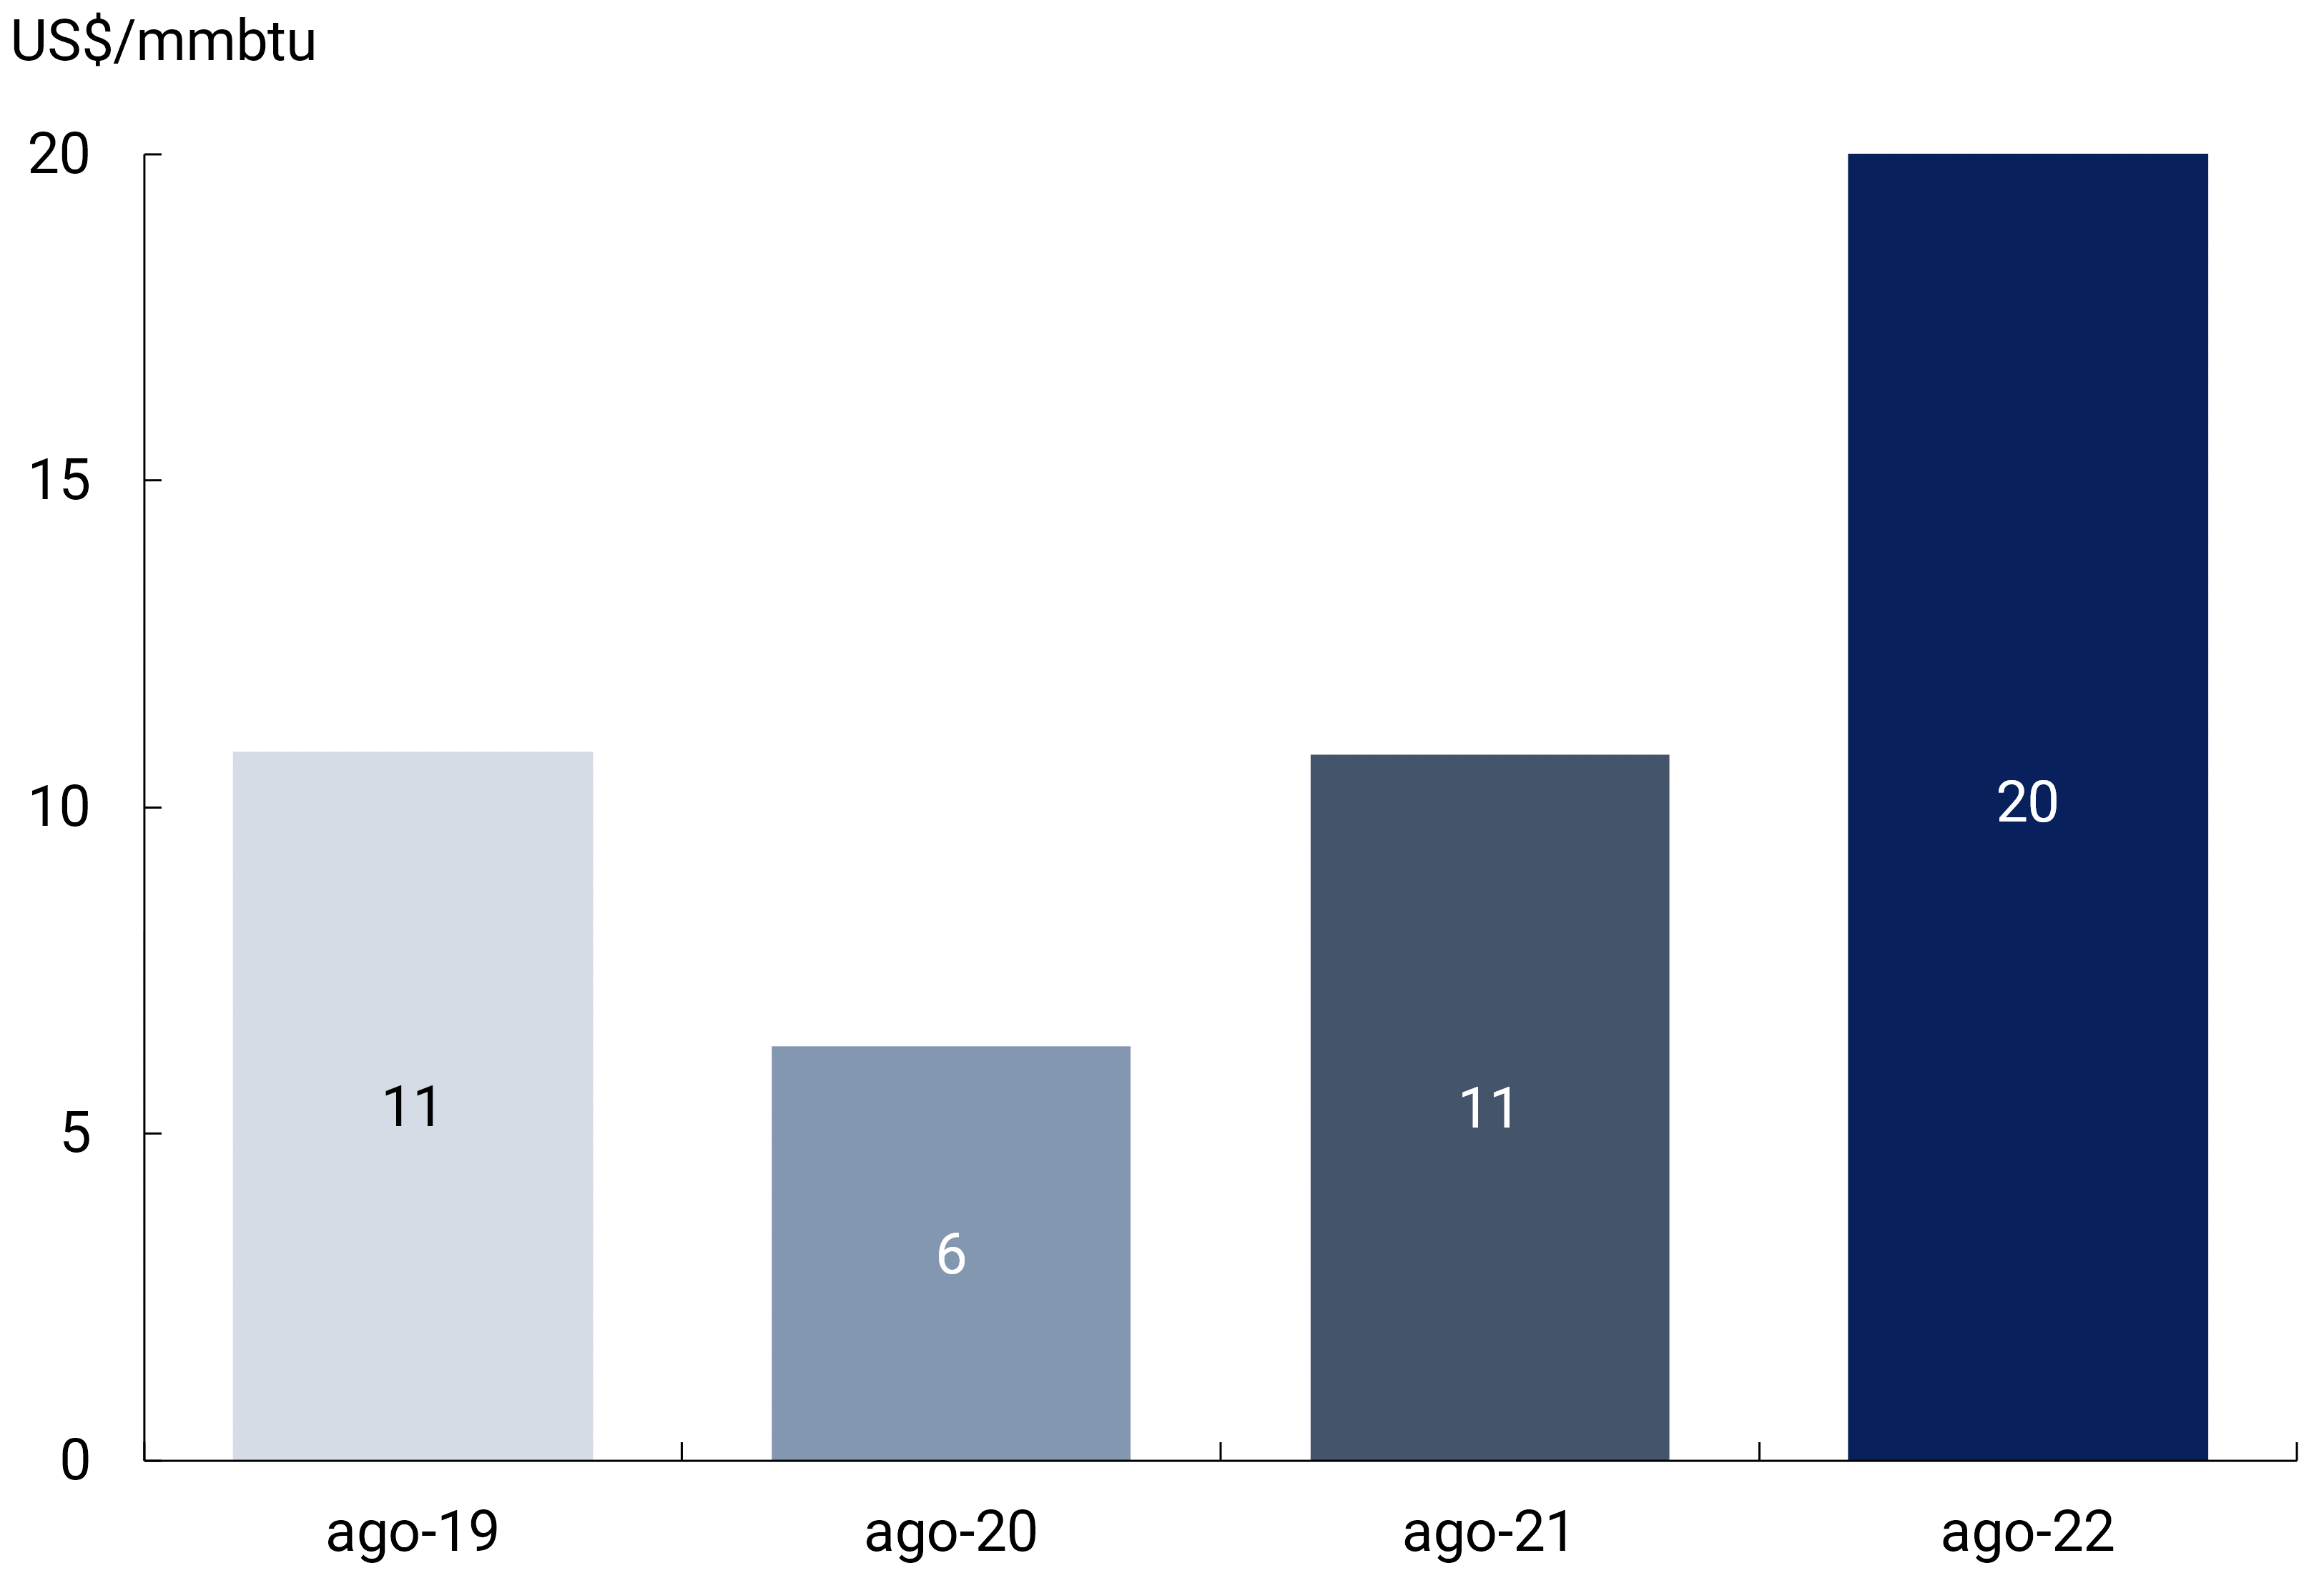
Liquefied natural gas Europe (Netherlands, TTF)
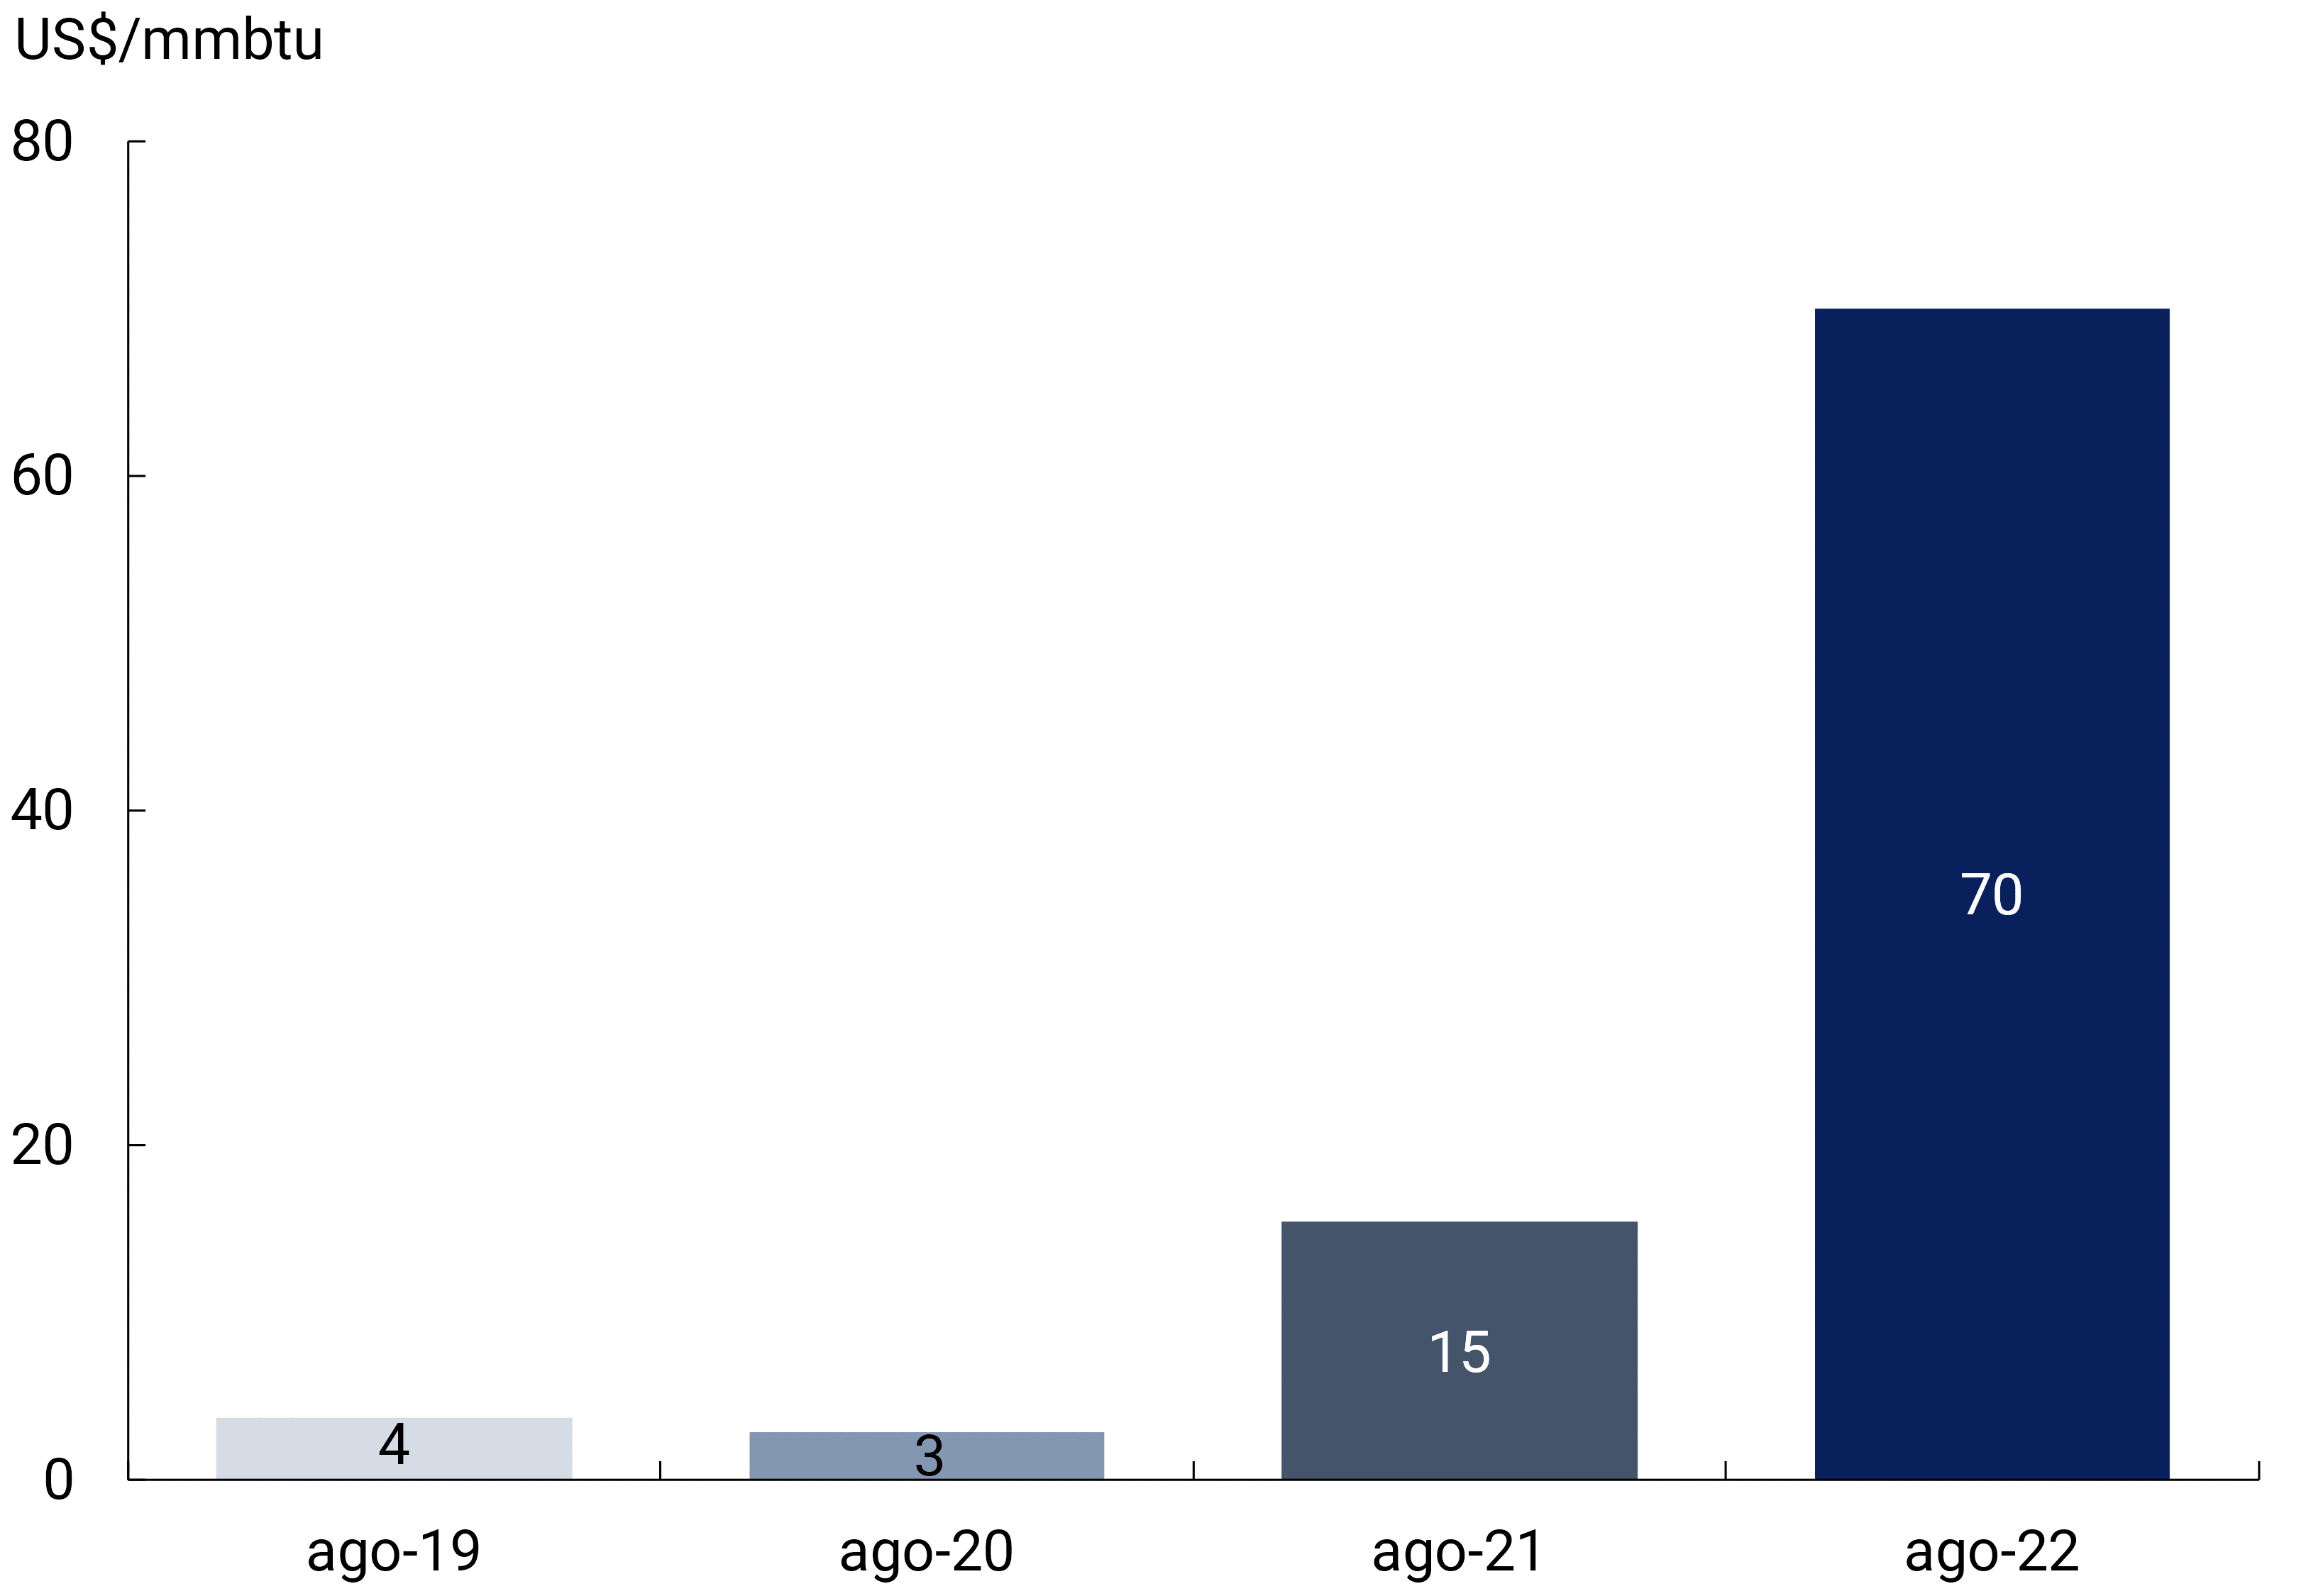
Source: World Bank.
In the case of imported quantities, a series of exogenous factors had an influence that operated in the same direction: increasing the demand for imports. In a context of economic growth and recovery of total energy consumption in the country, the very low flow of water in the country’s main reservoirs led to a sharp drop in supply via hydroelectric generation. Second, our main supplier of natural gas, Bolivia, is experiencing a trend drop in gas production, and, consequently, in the supply available for export to Brazil and Argentina. These two energy sources had to be replaced by thermal energy. Third, the exceptional rise in the cost of liquefied natural gas led the energy authorities to opt for a combination of the import basket that is more biased towards liquid fuels (gas oil and fuel oil), whose energy yields are lower. Finally, in the post-pandemic period, total domestic gas production grew at a slower rate than energy demand. The sum of all of the above was reflected in a sharp increase in the quantities of fuels imported so far this year (see Graph 4).
Figure 4 | Imports of fuels and electricity
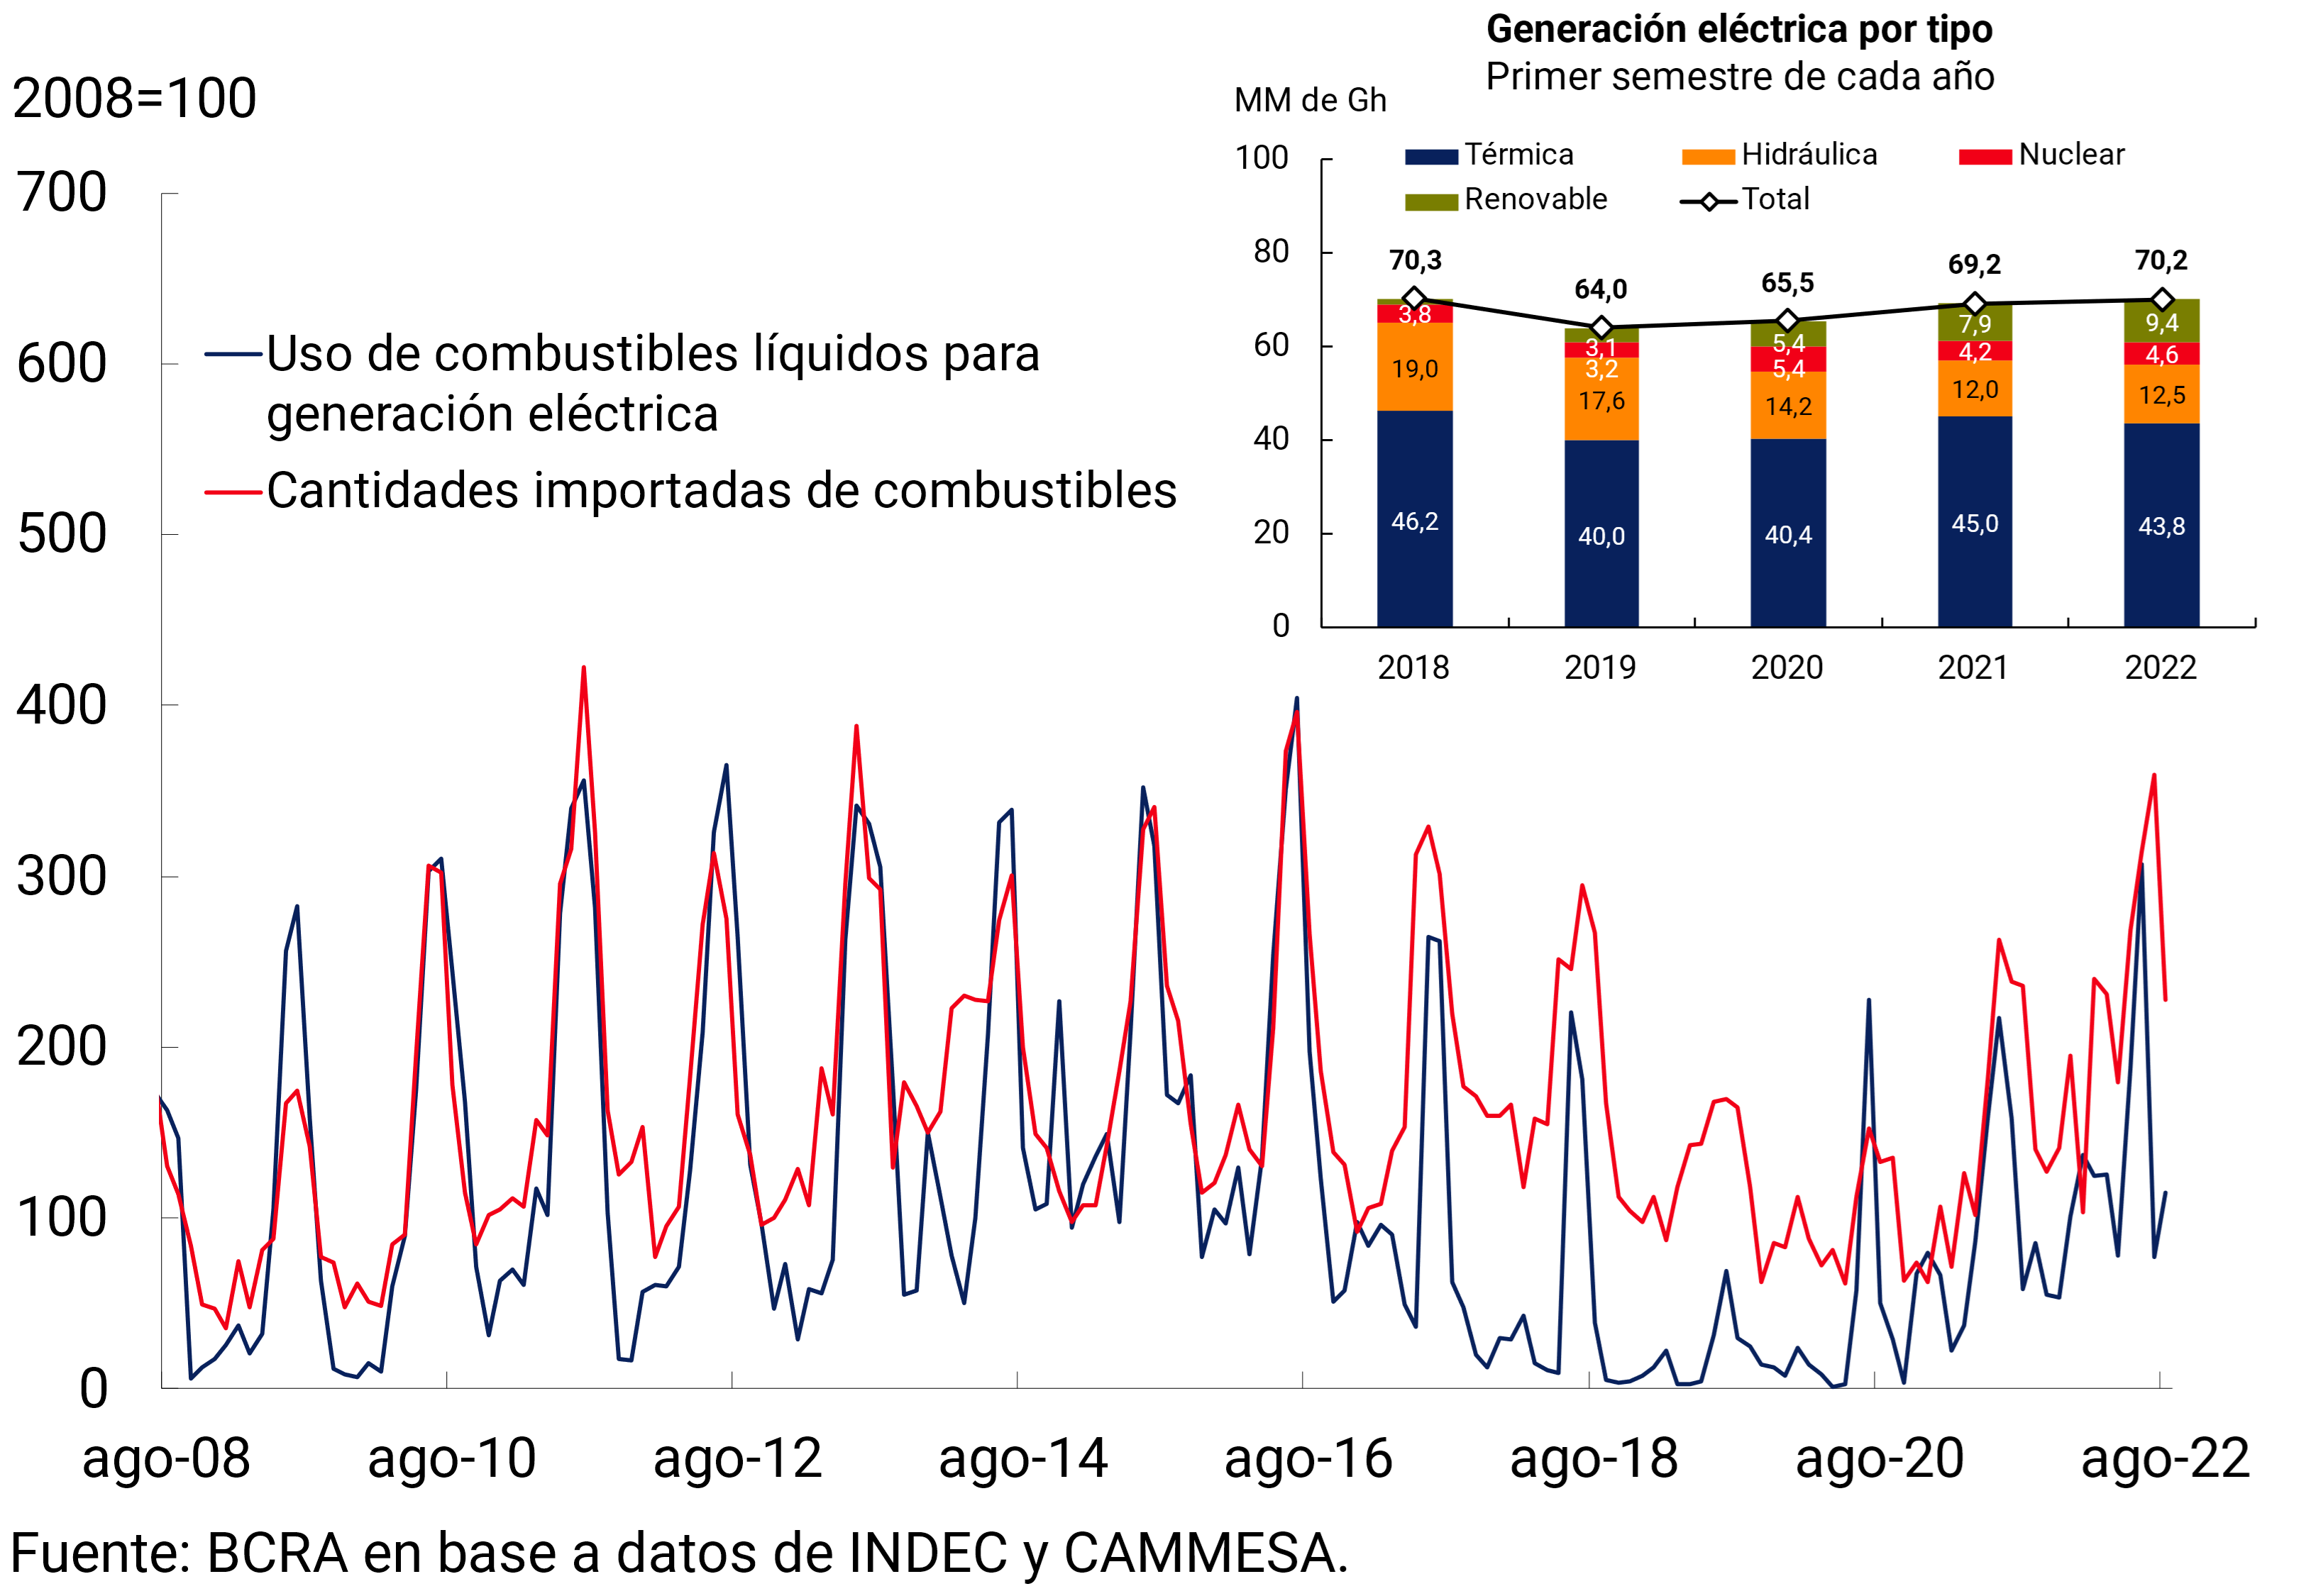
generation
Source: BCRA based on data from INDEC and CAMMESA.
A reduction in the energy trade deficit is expected for 2023 both due to the continued rise in the quantities exported and also due to lower demand for imports. The latter would be influenced by a partial recovery of hydroelectric generation given the higher water levels observed in the main rivers in recent months, and, above all, the commissioning scheduled for the end of June 2023 of the first section of the Néstor Kirchner gas pipeline that will link Tratayén (Neuquén) with Saliqueló (Buenos Aires), with a supply capacity of 11 million cubic meters per day, equivalent to 65% of the daily average of liquefied natural gas imported from May to June of this year.
Back to top
Section 4 / Main aspects of the 2023 National Budget Bill
On September 15, the Executive Branch submitted the message of the 2023 National Budget Bill (PPN-23) to the National Congress. The project seeks to strengthen macroeconomic stability, the recomposition of the purchasing power of revenues and the strengthening of the domestic market, while promoting an ordering of public accounts that will reduce the monetary financing of the public sector and lead to a situation of inter-temporal fiscal solvency.
The macroeconomic assumptions included in the PPN-23 contemplate a growth of the economy of 4.0% in 2022 and 2.0% annually for the period 2023-2025. The expected expansion will be disseminated among the components of demand, highlighting advances of 7.1% in exports and 2.9% in investment on average for 2023.
The PPN-23 projects exports of goods and services of US$105,550 million (+2% YoY) and imports of US$93,203 million (-2.7% YoY) for 2023, resulting in a surplus of the balance of goods and services of US$12,347 million. The year-on-year inflation stipulated in the bill decreases with respect to current records to 60% y.o.y. by December of next year. Finally, the exchange rate in December 2023 is estimated to be $269.9/US$ (see Table 1).
Table 1 | PPN 23 Main macroeconomic
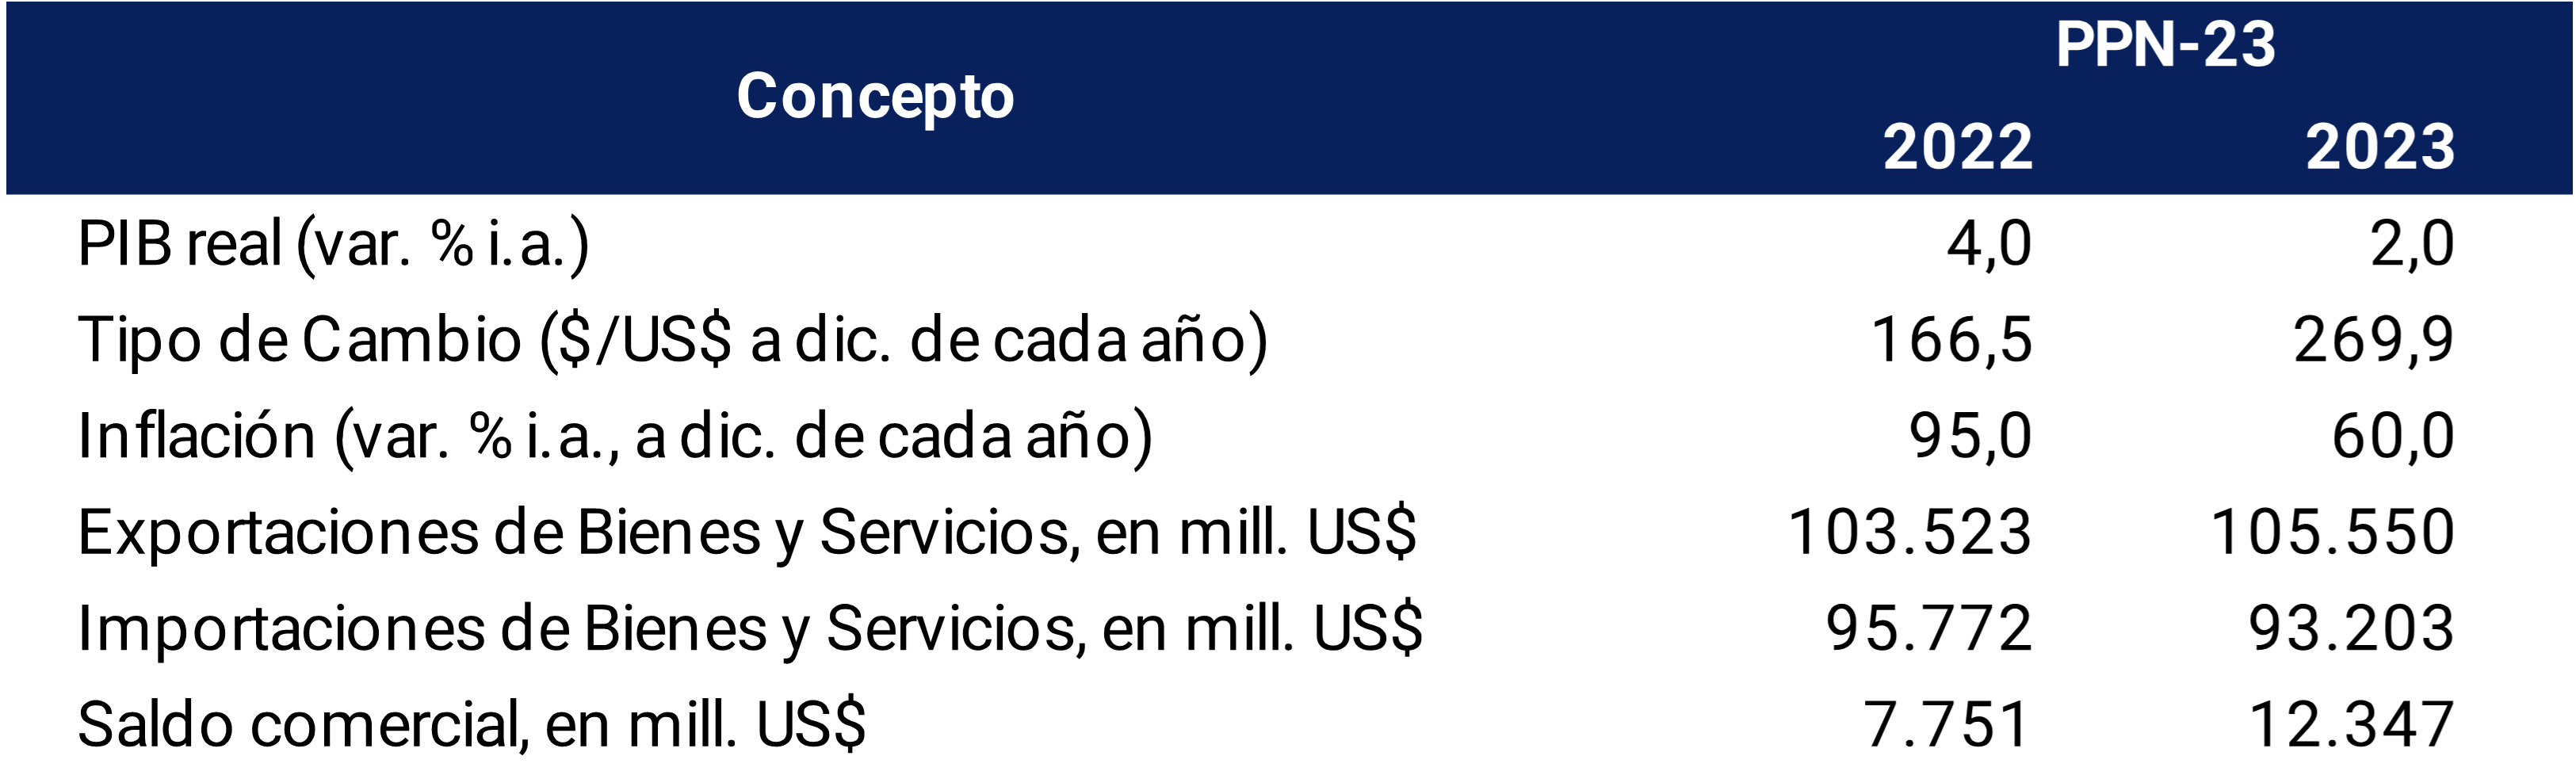
assumptions
Source: BCRA based on the 2023 National Budget Bill.
On the fiscal front, the document estimates that national tax collection will reach $35.0 billion in 2023, which implies an increase of 78.6% y.a. compared to the projection for 2022; it would be driven mainly by net VAT (+80.7% YoY), Social Security resources (+83% YoY), Income Tax (78.3% YoY) and Tax on Credits and Debits in Bank Accounts (+81.5% YoY). In this way, the Collection would represent 23.77% of GDP in 2023, 0.18 p.p. less than in 2022. This collection performance would boost the NFPS’ tax resources to 76.2% YoY in 2023. Total NFPS revenues would total $24.8 billion and represent 16.8% of GDP (-0.4 p.p. vs. the provisions of the PPN-23 for the end of 2022; see Graph 1).
A salient aspect of the bill is related to the creation of an Argentine Investment and Production Incentive Regime through which people will be able to voluntarily declare to the AFIP their holdings in foreign currency, both in the country and abroad, that had not been previously declared.
The declared funds must be used only to the transfer of foreign currency for the payment of imports destined for production processes. The PPN-23 establishes a special tax that will be determined on the value of the holding that is declared expressed in national currency at the time of entry into the special account. The tax rates vary between 5%, 10% and 20% depending on the date of entry of the return (90, 91 to 180, 181 to 360 days, respectively).
On the other hand, the PPN-23 contemplates a moderate acceleration in the growth rate of NFPS primary expenditures, going from a growth of 66.1% YoY to 69.2% YoY next year, totaling $27.7 trillion (18.8% of GDP; -1.2 p.p. YoY; see Graph 1). The year-on-year reduction in primary expenditure is mainly concentrated in current transfers. The main item that would drive the growth of primary expenditures would continue to be that of Social Security benefits, which would grow by 81.1% y.a. in 2023 and represent 40% of total primary expenditure. Meanwhile, capital expenditure is expected to maintain a high dynamism in 2023, growing 88.7% and representing 1.6% of GDP (+0.1 p.p. vs. 2022).
Graph 1 | NFPS
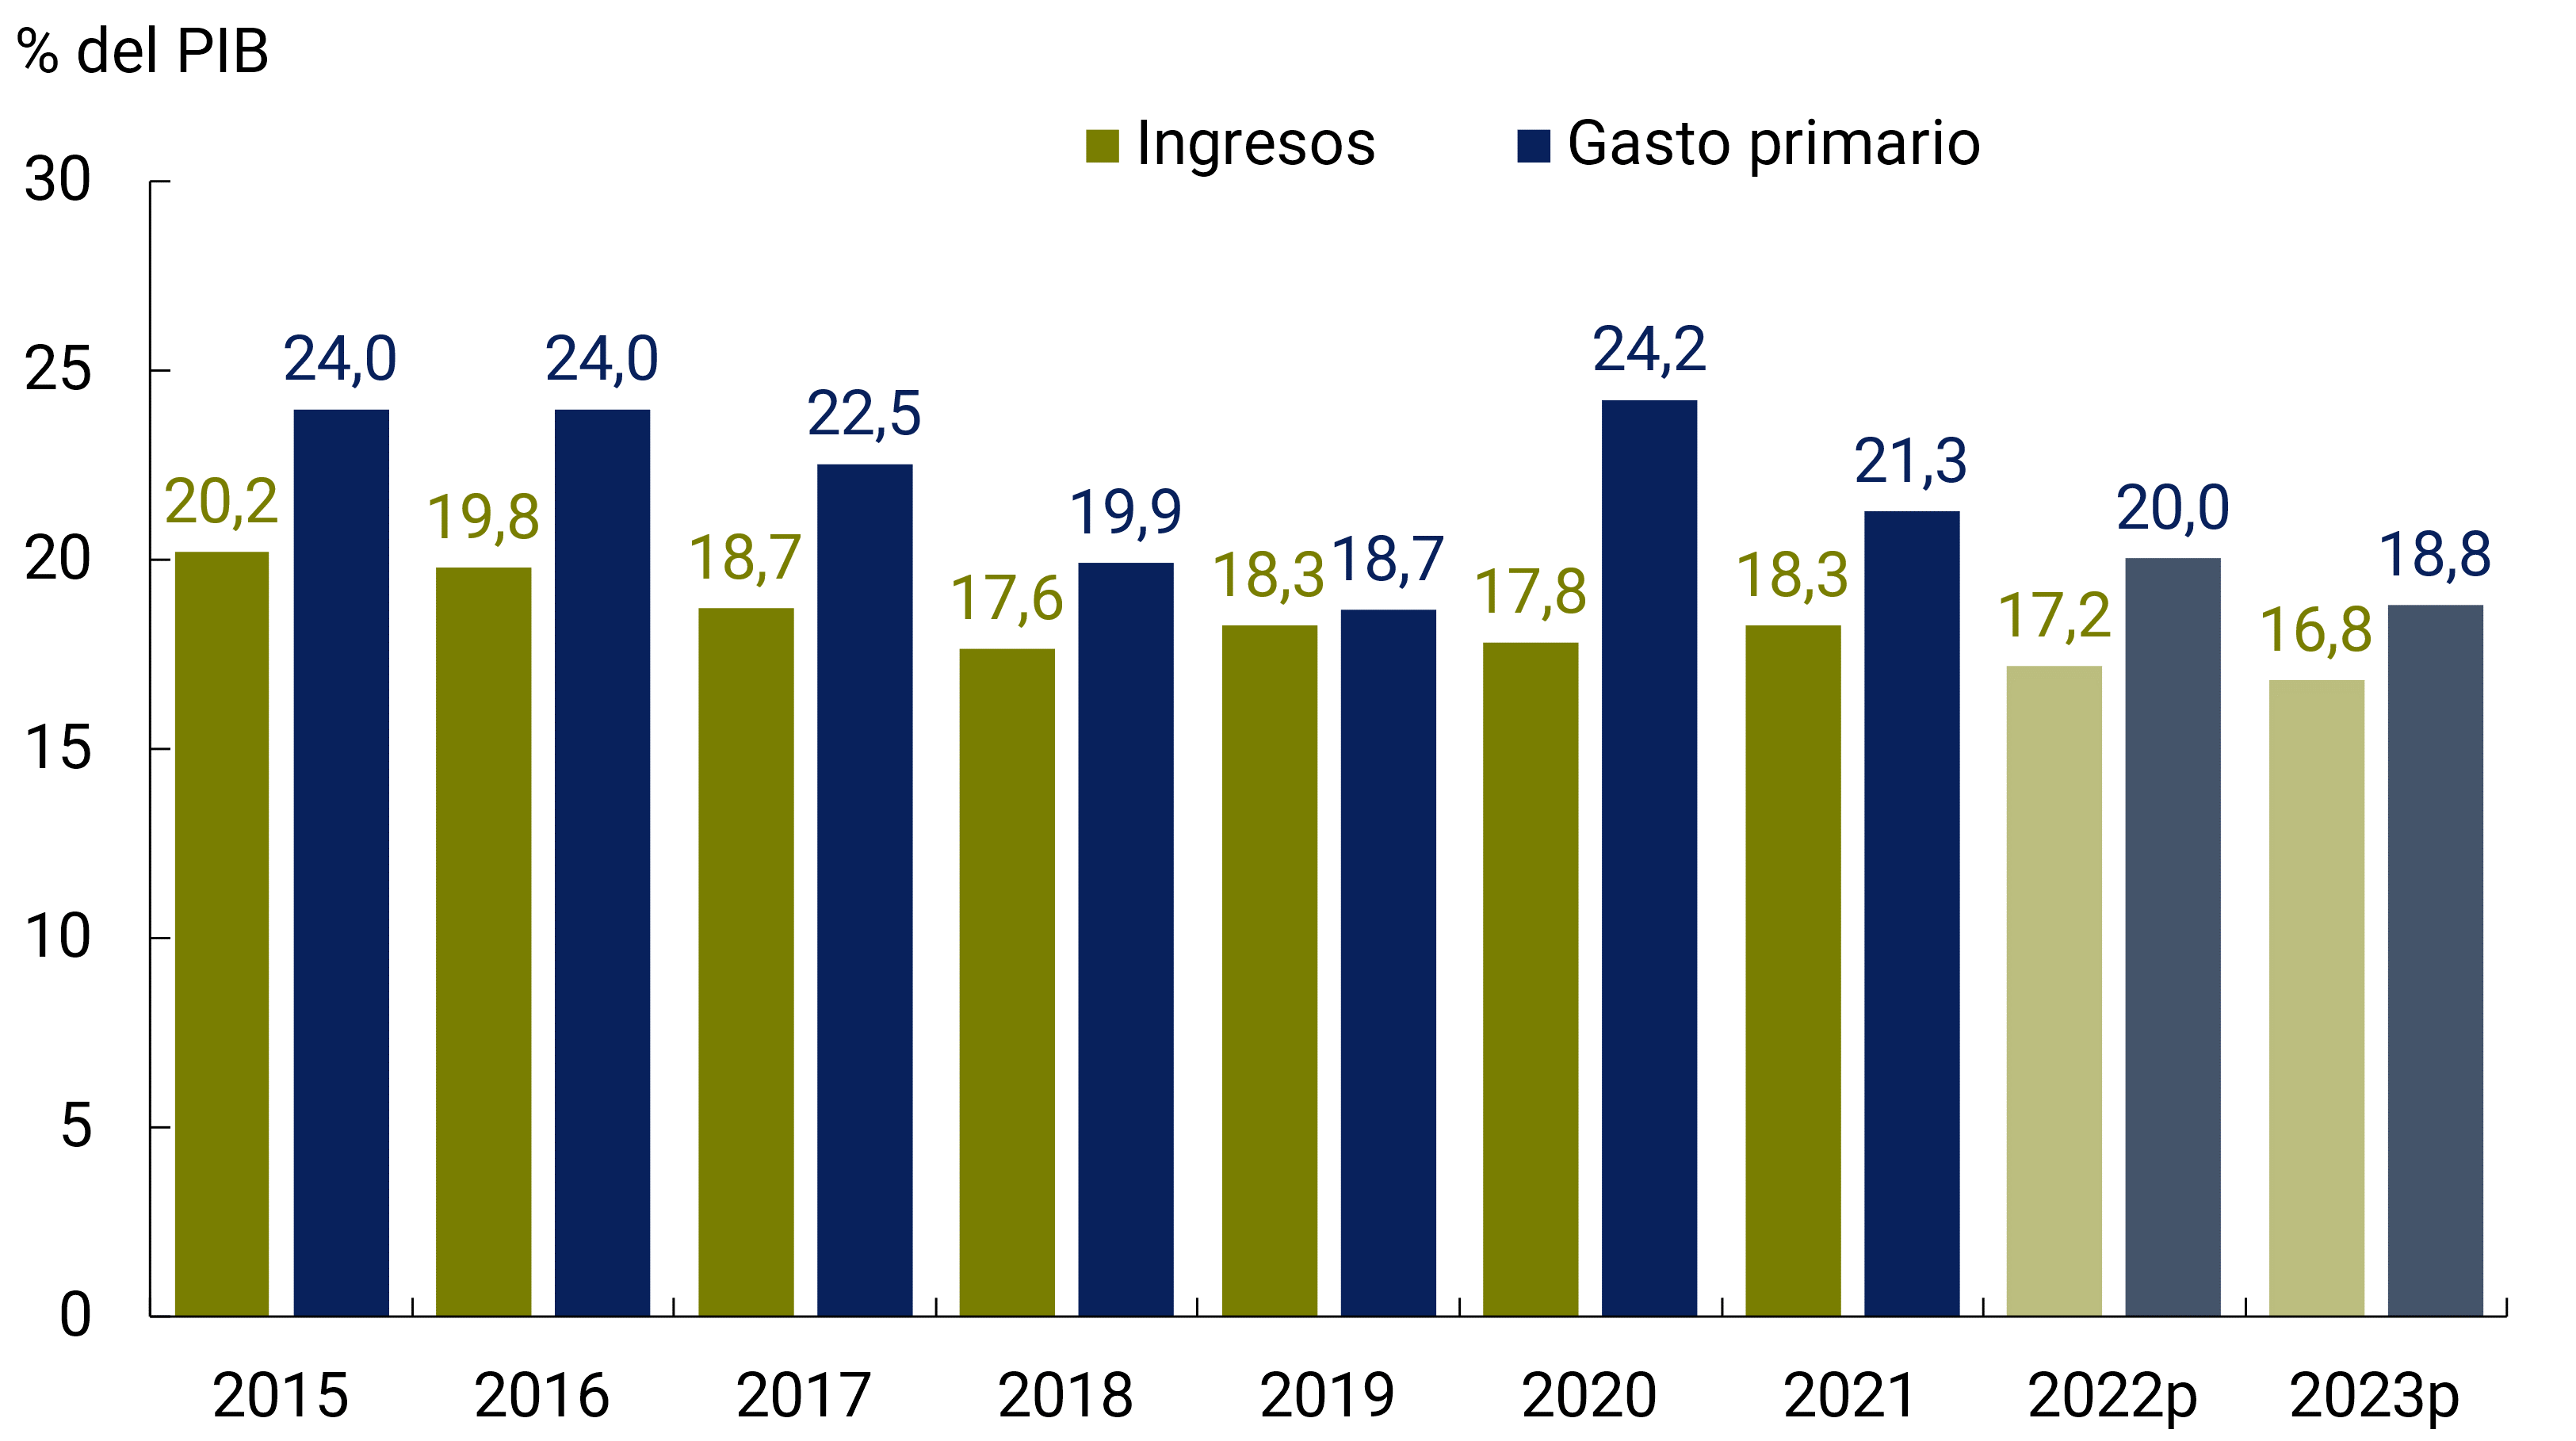
primary revenue and expenditure
p: Projected.
Note: Until 2021 case base. Since 2022, on an accrual basis. In 2022, income does not include income from placements that are accounted for the target with the IMF up to 0.3% of GDP. In 2021, SDR allocation of $427,400 million was deducted from revenues.
Source: Ministry of Finance, National Budget Bill 2023 and INDEC
As a result of the dynamics of revenues and expenditures, it is estimated that in 2023 the NFPS will present a primary deficit of $2.9 trillion (2% of GDP). This primary accrual result would be compatible with a primary deficit on a cash basis of 1.9% of GDP, in line with what was expected in the agreement with the IMF. Interest with private, bilateral, and public financial organizations considered for next year would total $2.6 trillion (1.8% of GDP). Thus, the PPN-23 forecasts a financial result of the NFPS deficit of $5.5 trillion for next year (3.8% of GDP; see Graph 2). Thus, the financial deficit, without accounting for the IMF’s SDR allocation in 2021, would be at the lowest level since 2015, a level similar to that observed in 2019.
Graph 2 | Results of the National Non-Financial
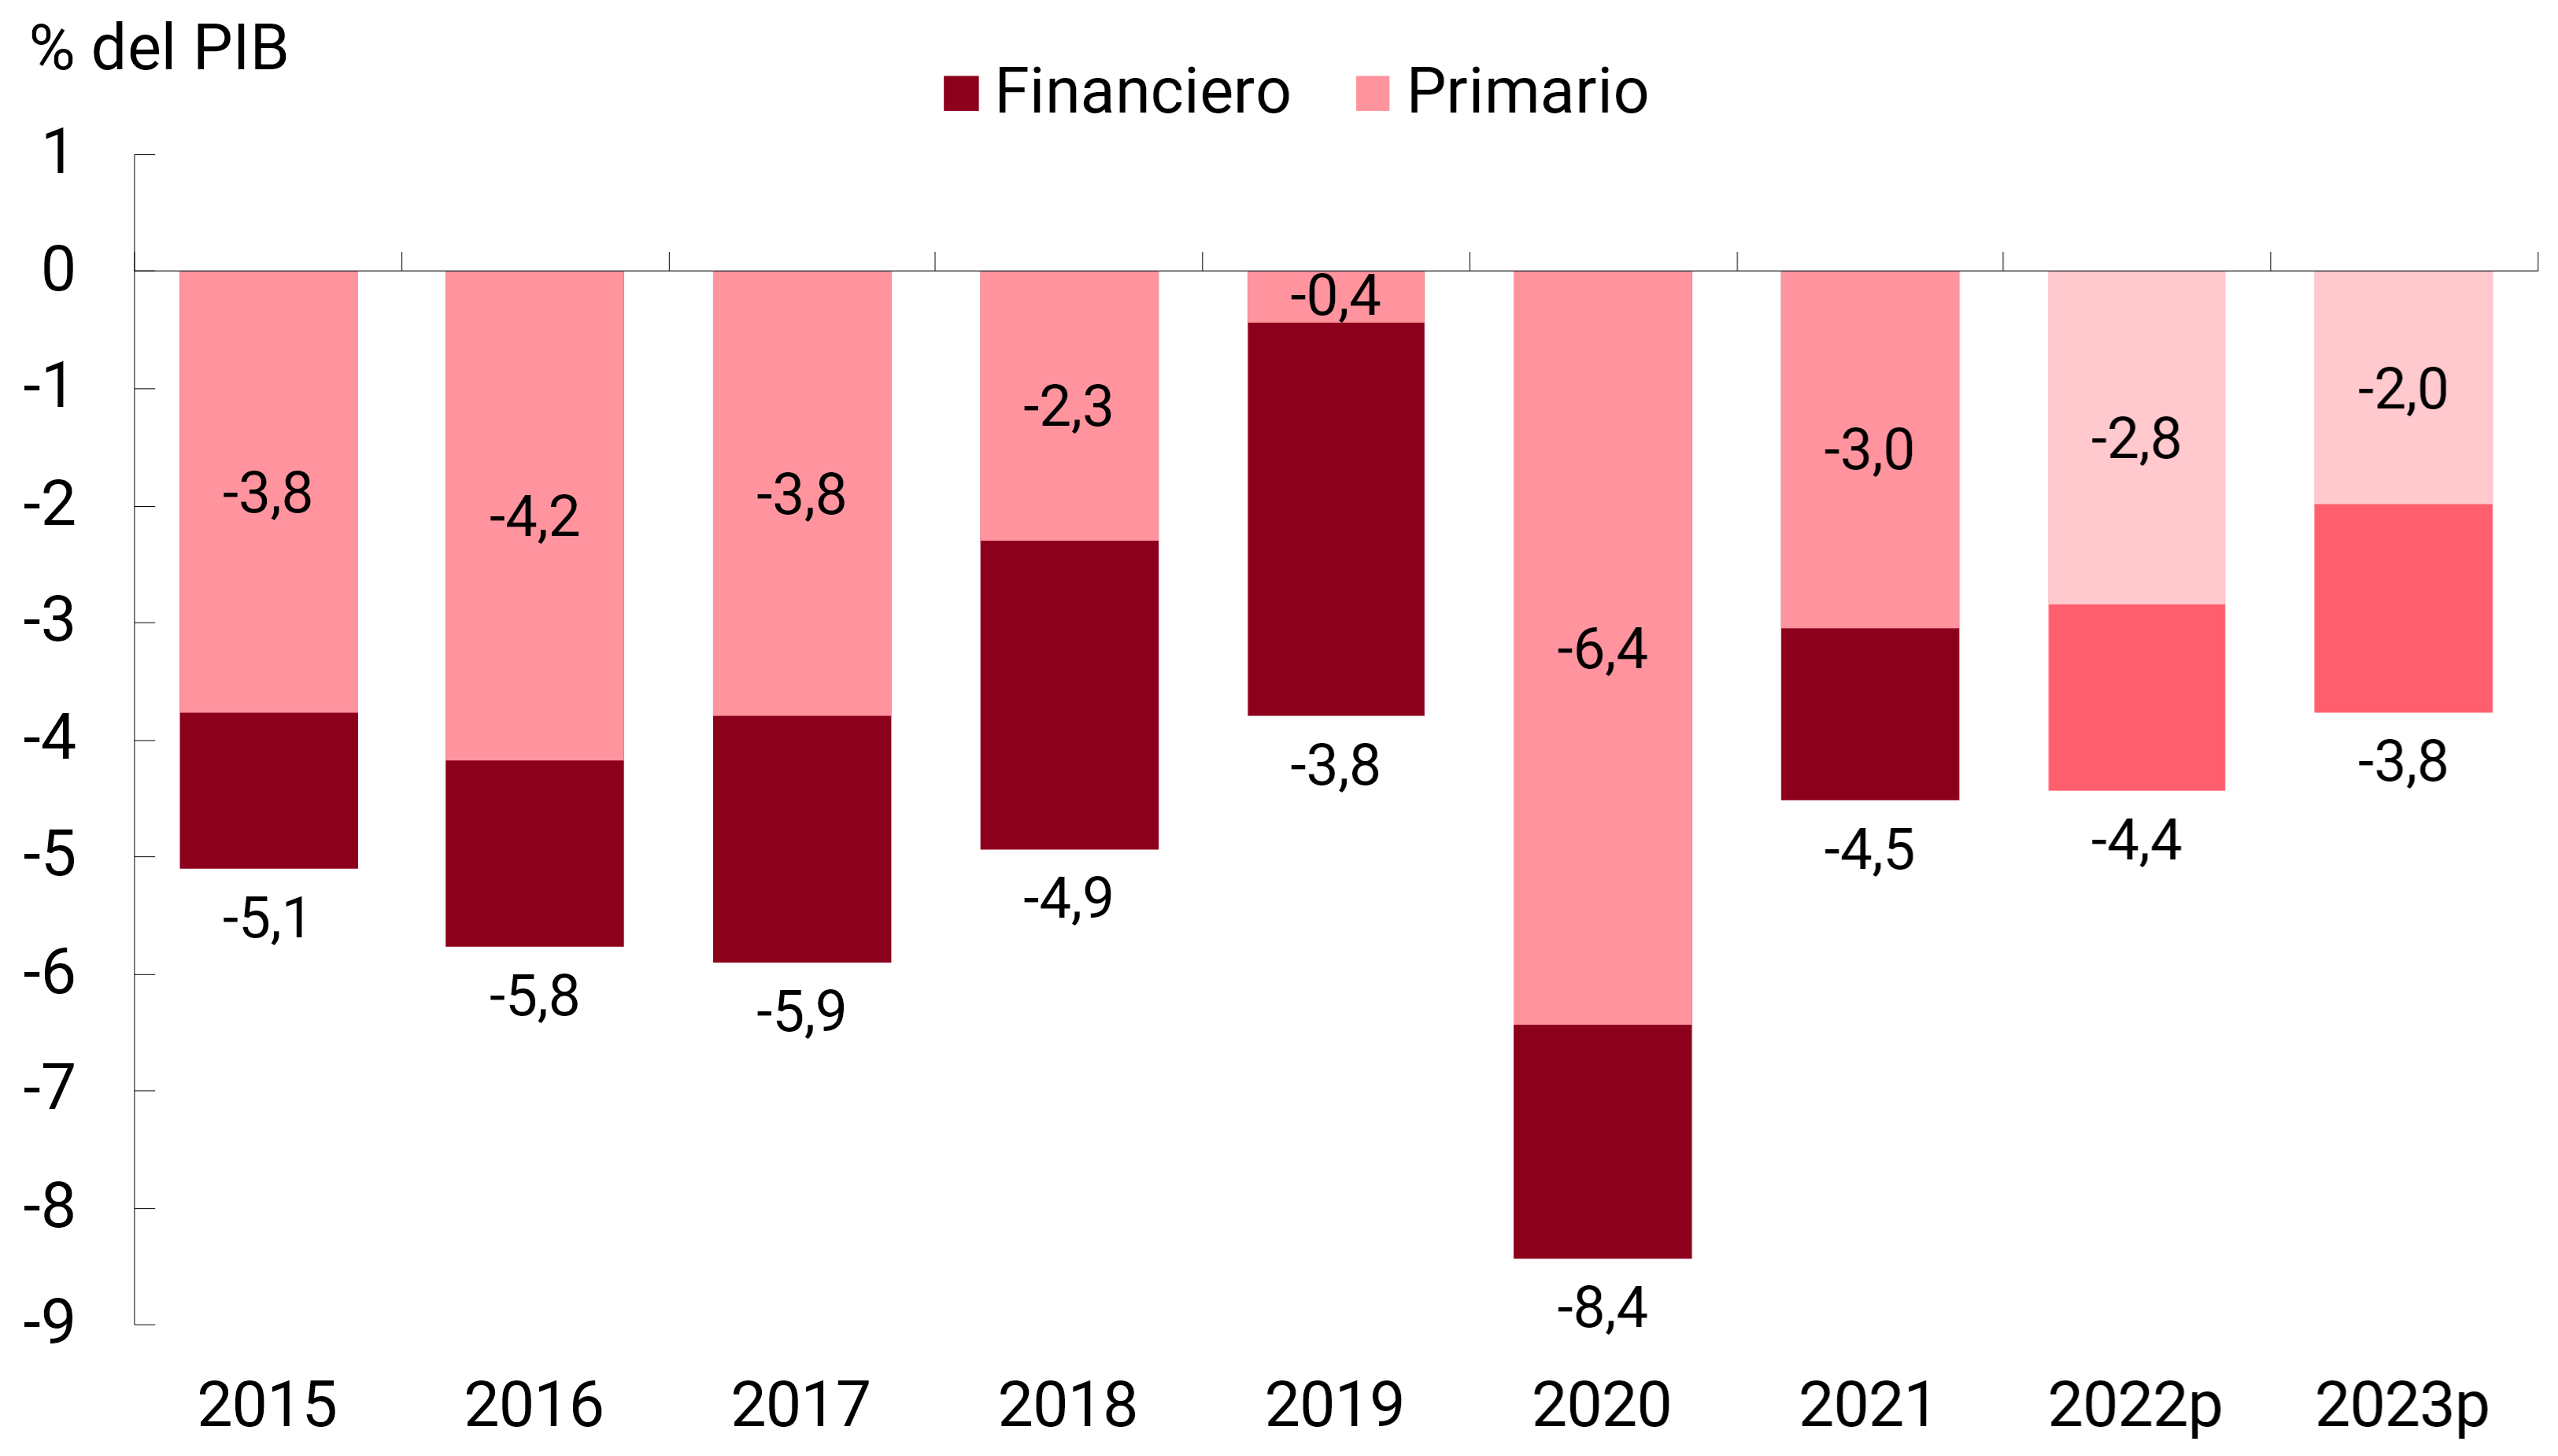
Public Sector
p: Projected.
Note: Until 2021 case base. Since 2022, on an accrual basis. In 2022, income does not include income from placements that are accounted for the target with the IMF up to 0.3% of GDP. In 2021, SDR allocation of $427,400 million was deducted from revenues.
Source: Ministry of Finance, National Budget Bill 2023 and INDEC.
As for the financing of the National Public Administration, the PPN-23 contemplates total needs for the equivalent of 5.5% of the Product. These needs would be financed from net placements with securities and bills in national currency for 4.7% of GDP25, net Transitory Advances from the BCRA to the National Treasury for 0.6% of GDP and the rest from net financing in foreign currency (which includes the positive balance of multilateral, bilateral and other organizations).
Table 2 | Net financing of the National Public Administration (PPN-23)
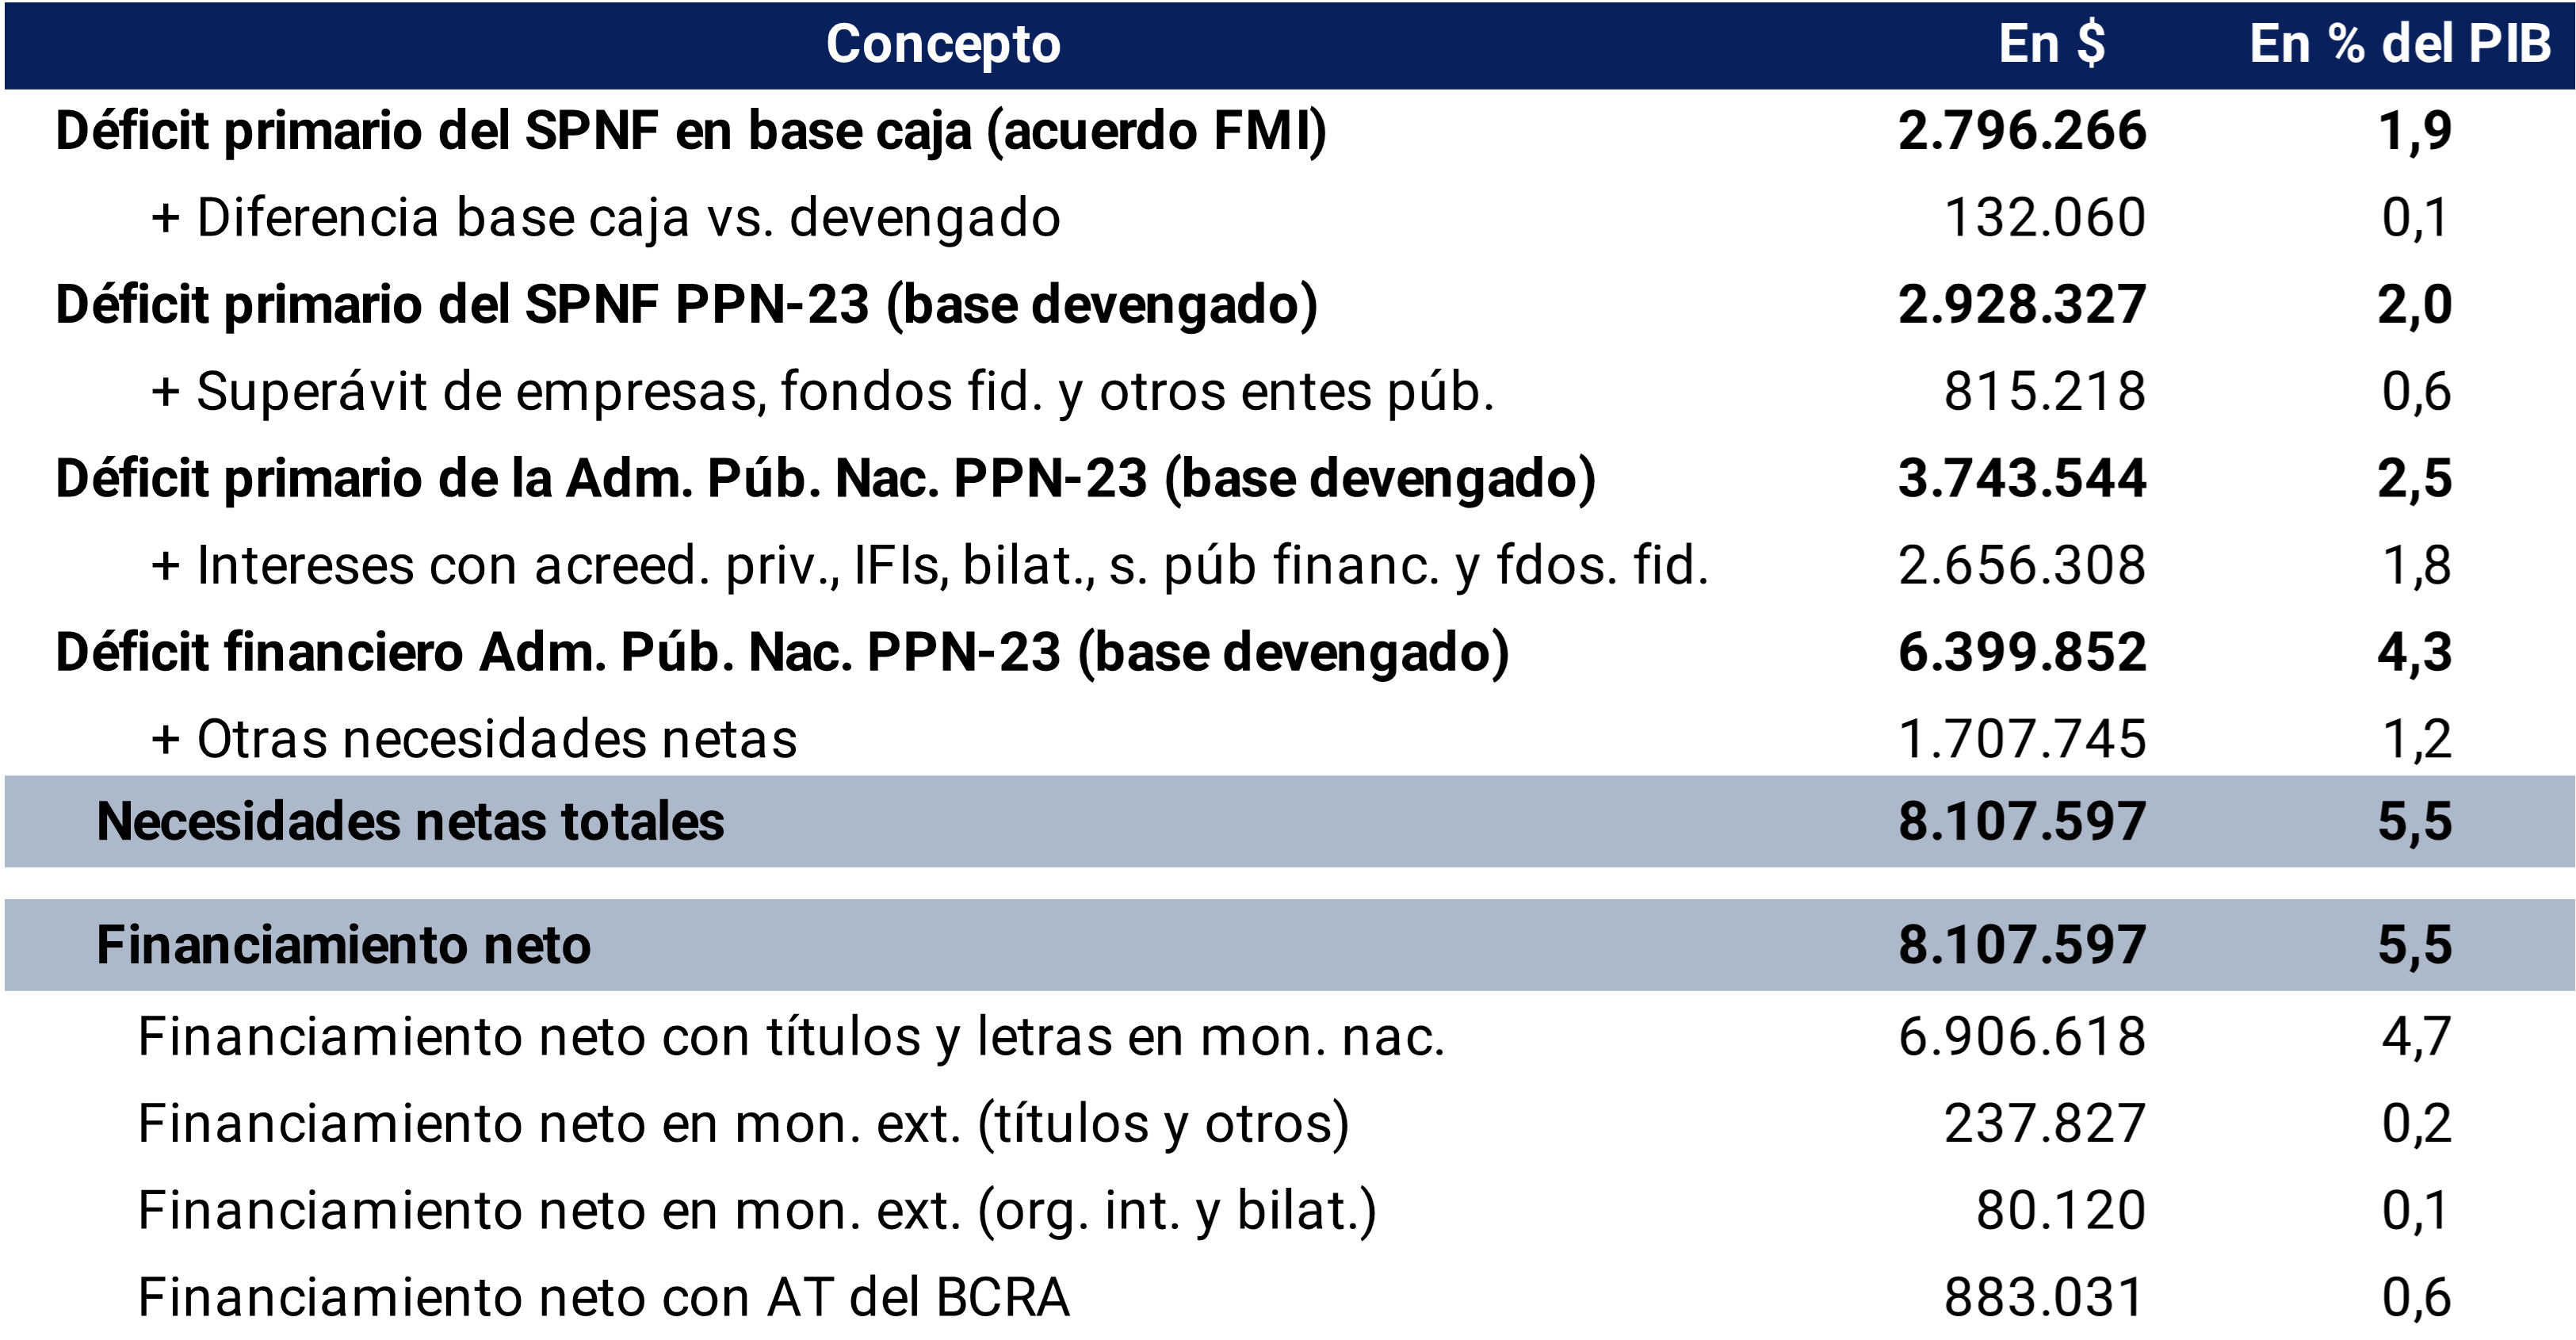
Source: BCRA based on the 2023 National Budget Bill.
Back to top
Section 5 / BCRA Intervention in the Domestic Currency Debt Market
The BCRA set in its objectives and plans to establish a path for the monetary policy interest rate in order to tend towards positive real returns on investments in local currency, in order to preserve monetary and exchange rate stability. To this end, the BCRA is currently conducting its monetary policy through changes in the interest rate of the 28-day Liquidity Bill (LELIQ), a reference instrument for monetary policy. Likewise, so that financial institutions can calibrate their short-term liquidity, they have a passive and active pass window available. Also, in the current environment of high levels of savings in the financial system and reduced credit depth, the BCRA manages structural bank liquidity through the periodic auction of its instruments (LELIQ and NOTALIQ).
In the medium term, the BCRA seeks to gradually converge towards managing the economy’s liquidity through open market operations (OMA) with Treasury bills and other short-term securities denominated in local currency, as is the case in other countries and in line with what is expressed in the Memorandum of Economic and Financial Policies within the framework of the current program with the International Monetary Fund (IMF). where this reform is considered a convenient alternative to reduce the quasi-fiscal cost of monetary policy. Pursuing this objective requires greater liquidity, depth and transparency of sovereign debt markets.
Recently, a scenario of high volatility was faced in the secondary market for debt in pesos, which led to the yield of Treasury instruments being located outside their macroeconomic fundamentals. In this context, the BCRA used its capacity to intervene through OMAs, in order to stabilize the sovereign debt markets, in order to preserve financial stability.
Specifically, at the beginning of June there was a dismantling of positions in National Government securities, which resulted in a marked drop in their price. In fact, it was the most significant price drop since the one recorded during the Primary, Open, Simultaneous and Mandatory Elections (PASO) of August 2019. The segment of securities with CER adjustment was the one that showed the largest drop (see Graph 1). Thus, Treasury bonds adjusted by CER registered a contraction of 10.6% in the span of two days, followed by sovereign bills with CER adjustment, whose price fell 4.4%. On the other hand, short-term fixed-rate bills saw a smaller drop (-0.6% accumulated between June 8 and 9).
Graph 1 | Evolution of the price of government
securities Weighted average daily variation by amount traded
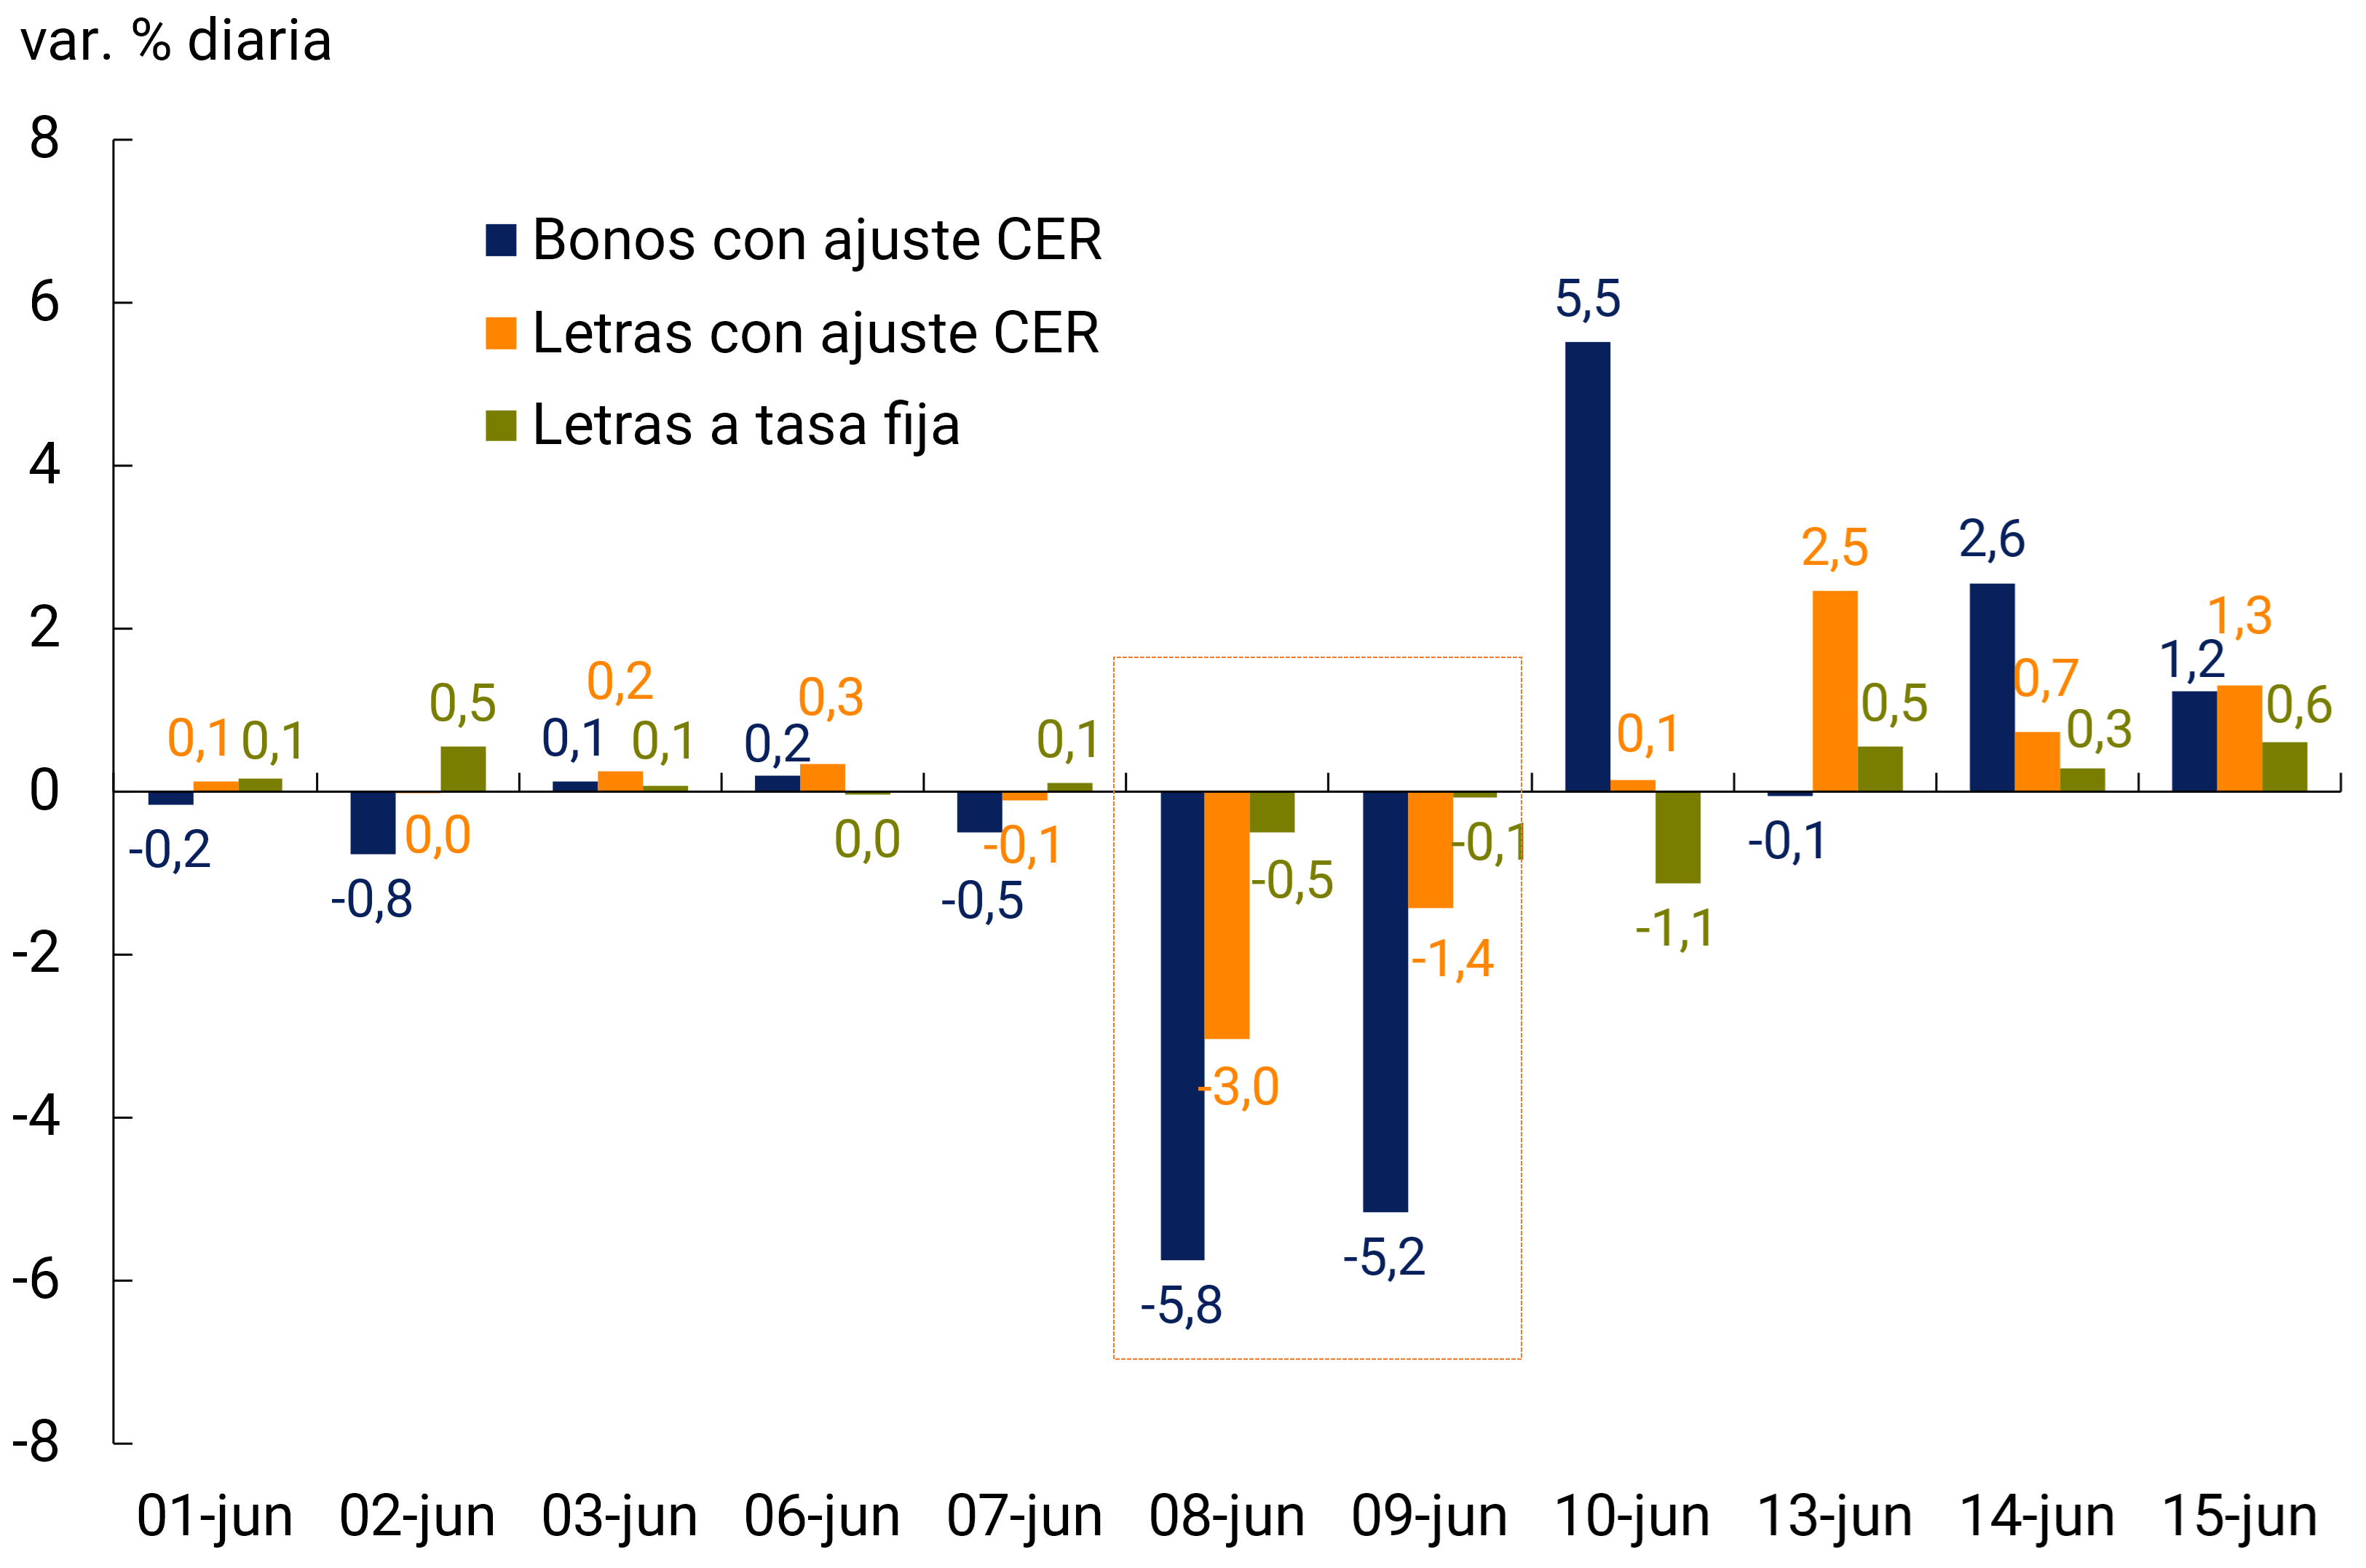
Source: BCRA.
Among the bonds and bills with CER adjustment, it can be observed that the shortest term species were those that presented the lowest declines and the fastest recoveries (see Graphs 2 and 3). In the days following June 8, a partial reversal of the dynamics in the price of public debt securities was observed, which was temporarily interrupted in the middle of the month, to end July with values higher than those observed at the beginning of June.
Graph 2 | Price of National Treasury Bonds with CER
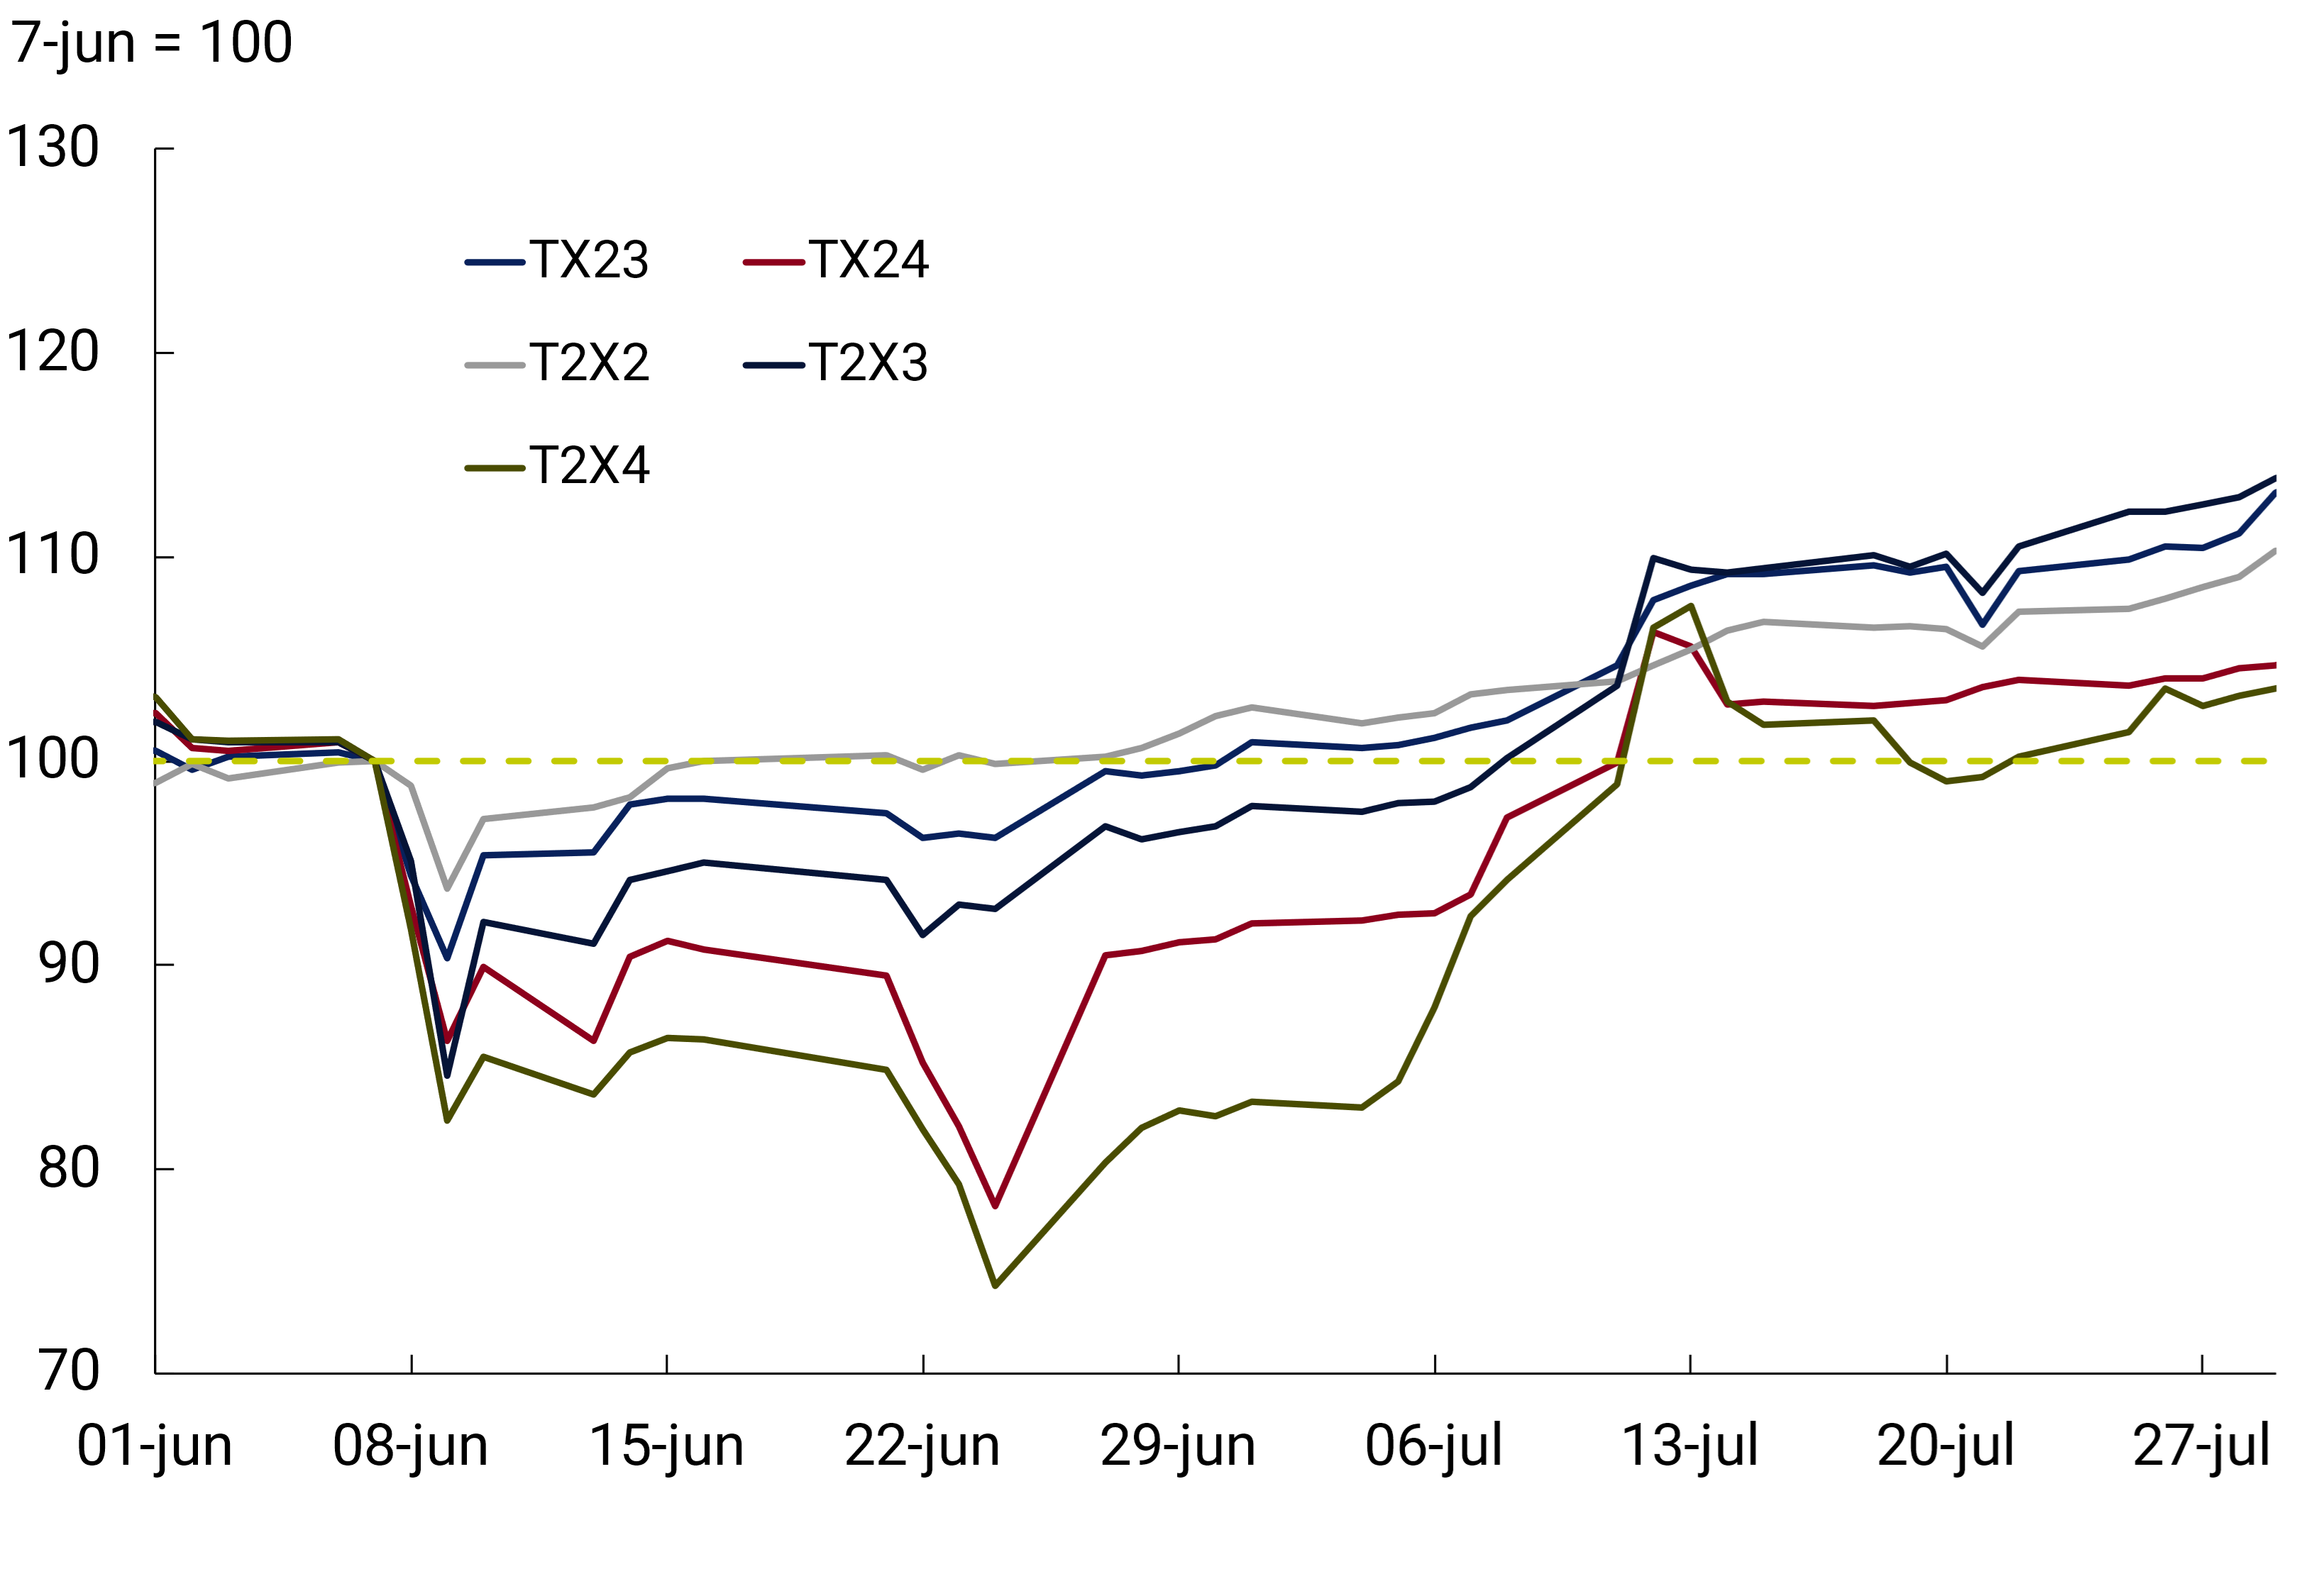
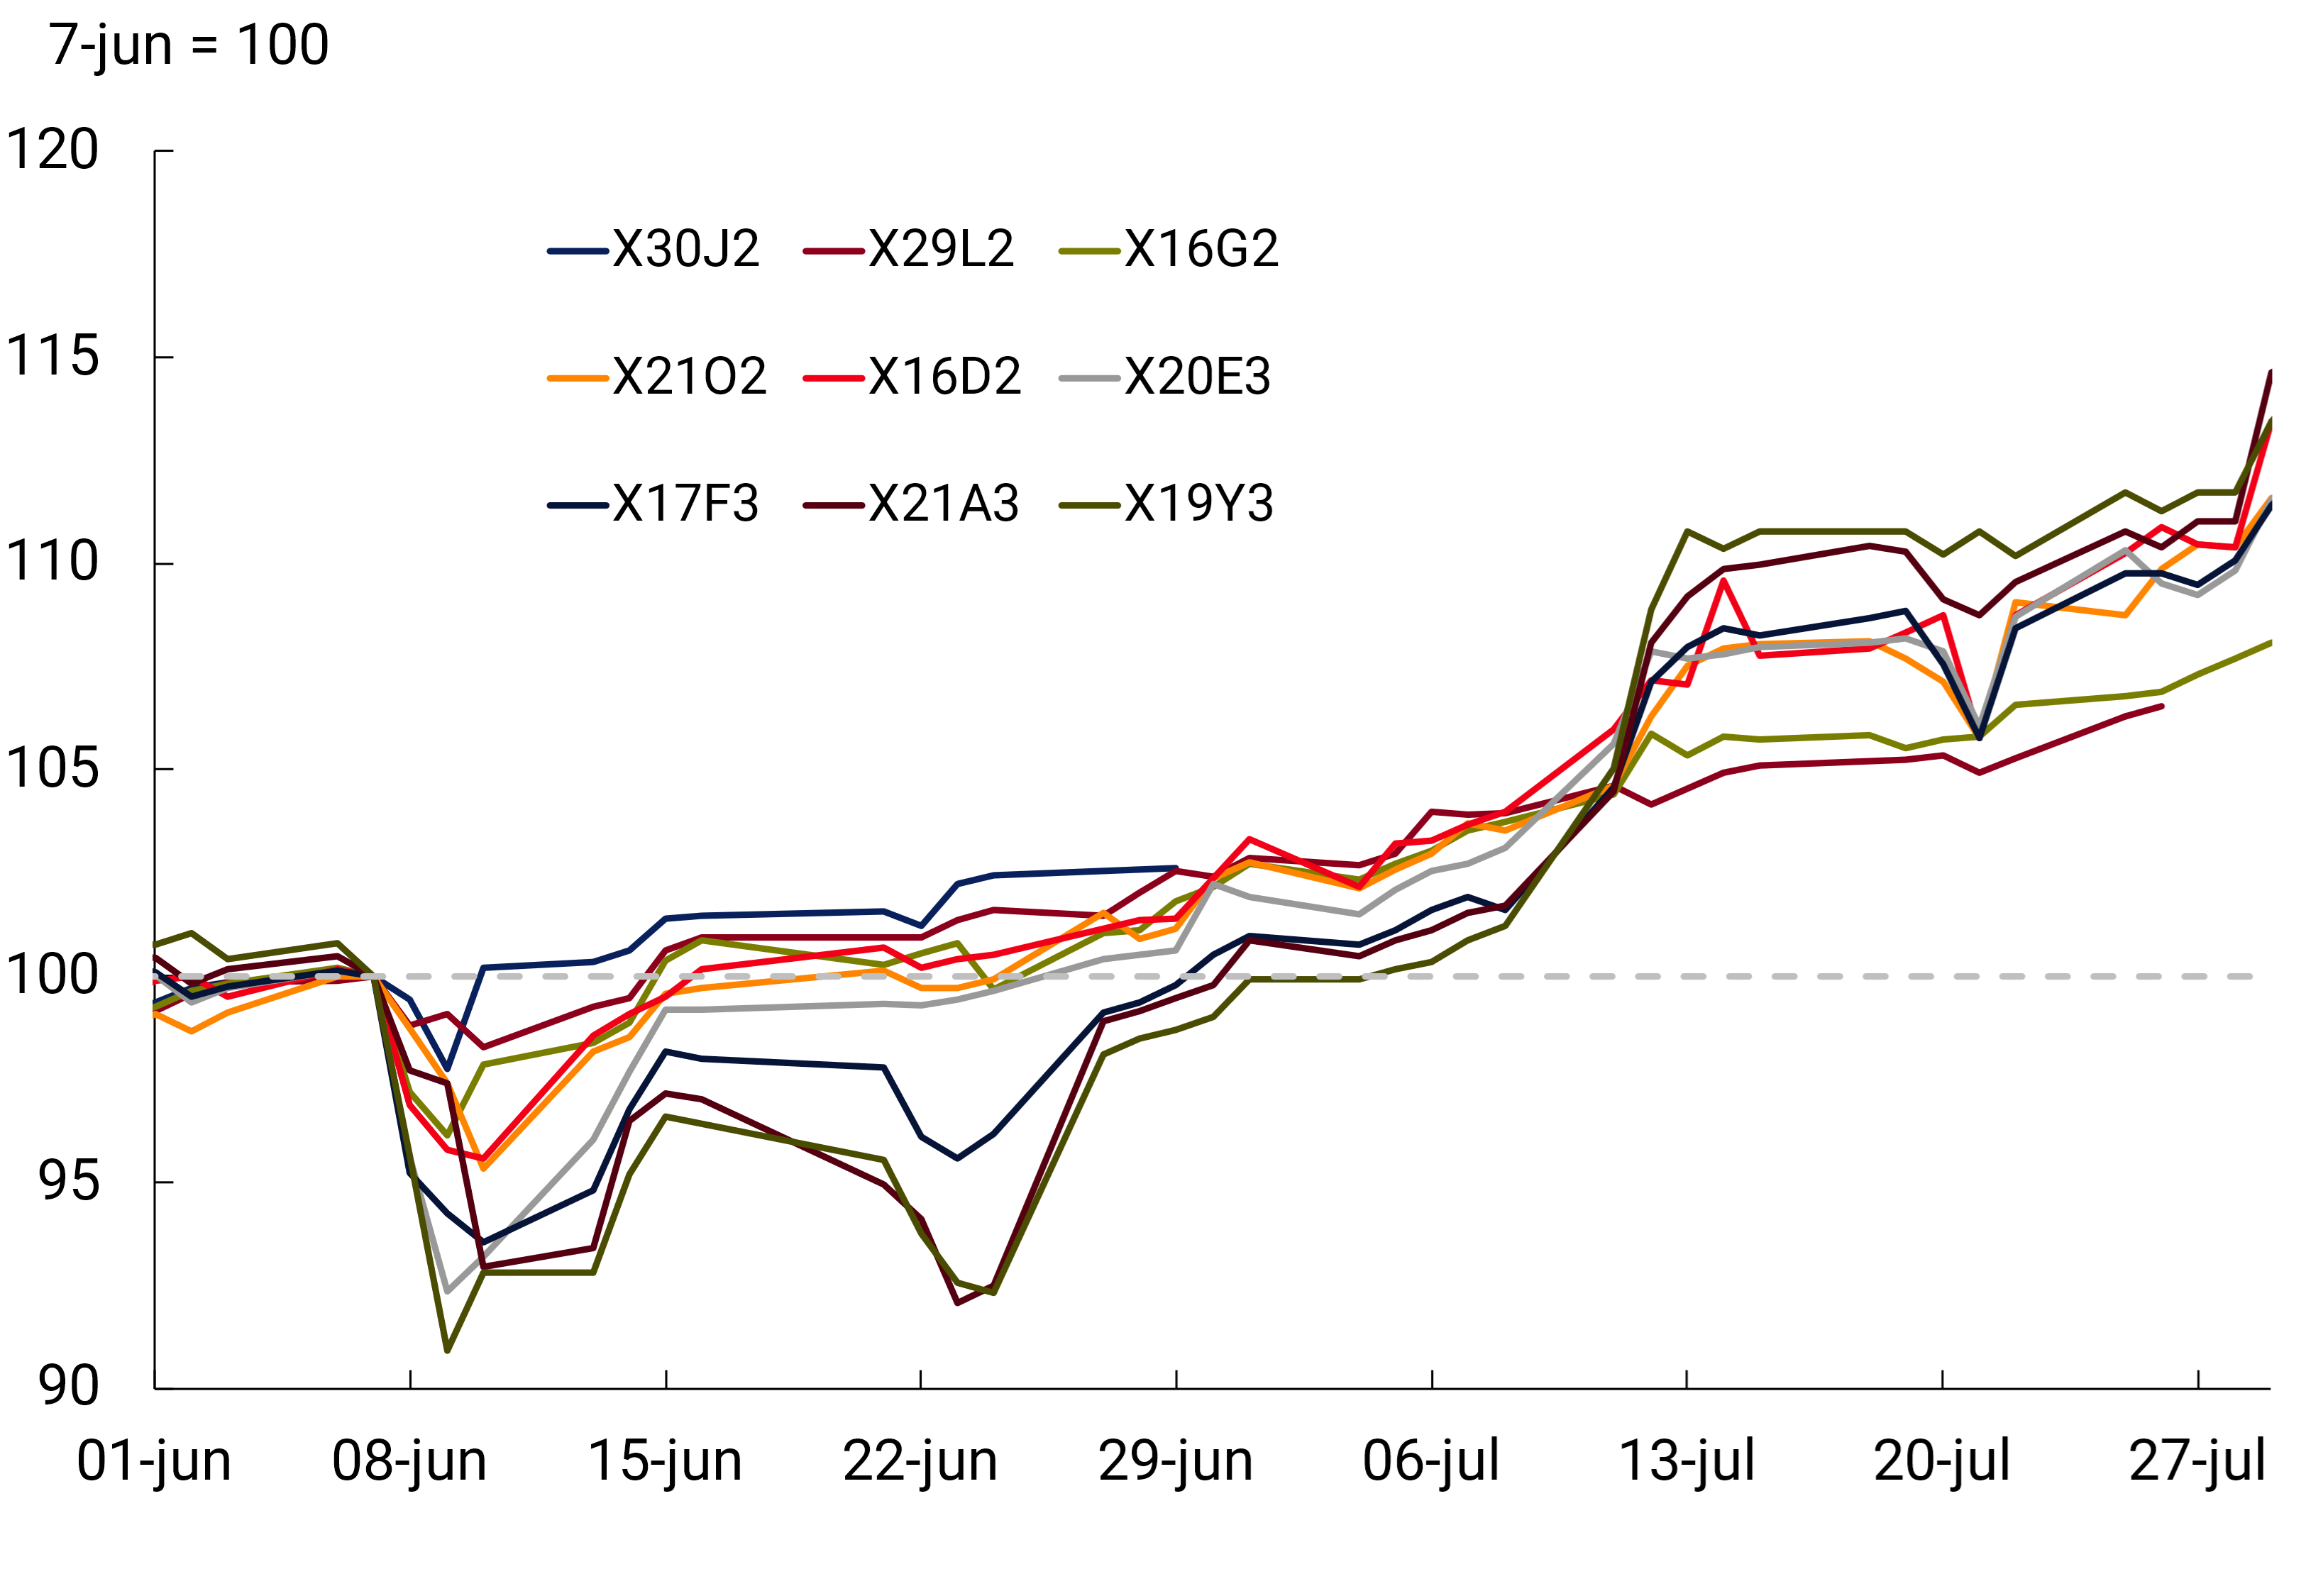
adjustment
Source: BCRA.
The initial fall in the price of Treasury instruments was reinforced by the portfolio decisions of agents who held shares in Mutual Funds for Mutual Funds (FCI RF) that further pushed down prices (see Chart 4). This liquidity was channeled mostly into Money Market Mutual Funds (FCI MM). Unlike what happened with prices, which quickly reversed the downward trend, the redemptions of FCI MM shares continued throughout June and during the first days of July.
Figure 4 | Cumulative evolution of net redemption subscriptions by type of FCI
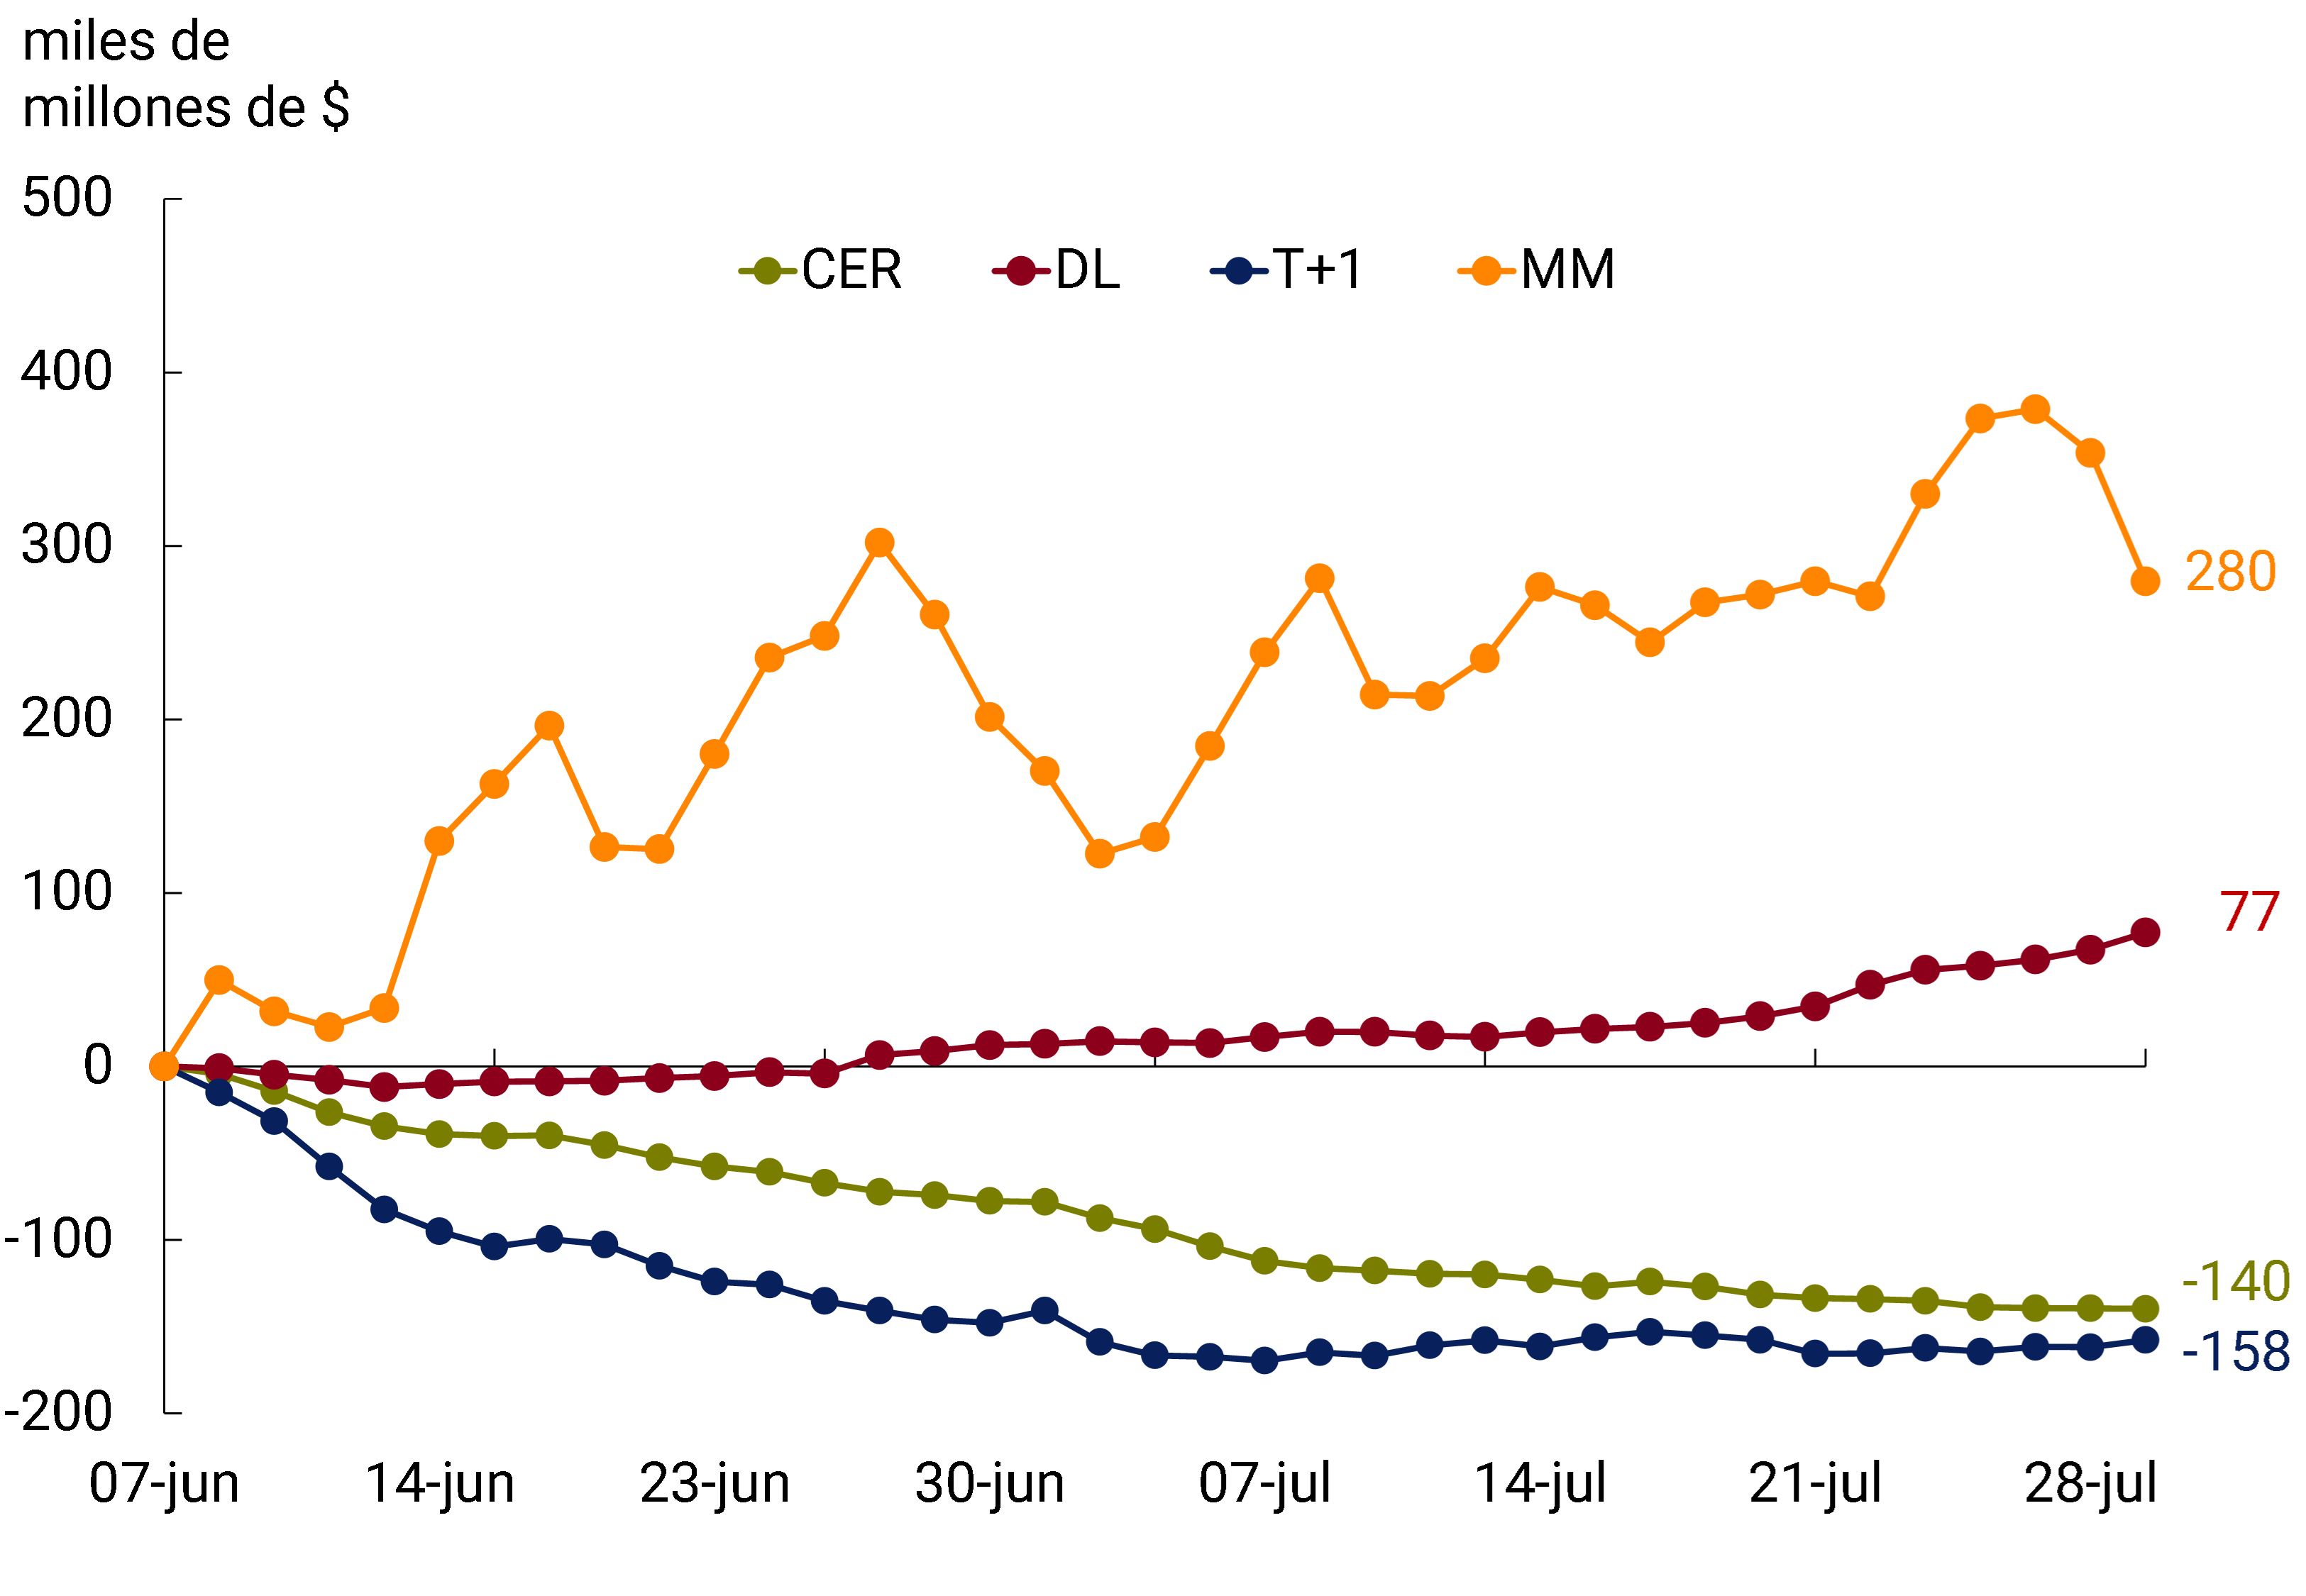
Source: BCRA.
Faced with this scenario, the monetary authority sought to reduce volatility in the prices of Treasury instruments, reaffirming its commitment to operate on the yield curve of public debt in local currency and ensuring that yields in the secondary market remain in a reasonable relationship with those determined within the framework of the Treasury’s primary auctions. In this sense, the BCRA arranged its participation in the secondary market of securities issued by the National Government as of July with a residual term of more than 15 days, buying at rates similar to those of the last auctions, plus a maximum spread of 2%. In this way, the monetary authority managed to reverse the marked increase in the interest rate curve (see Charts 5 and 6).
Graph 5 | Interest Rate Curve of National Treasury Bonds with CER
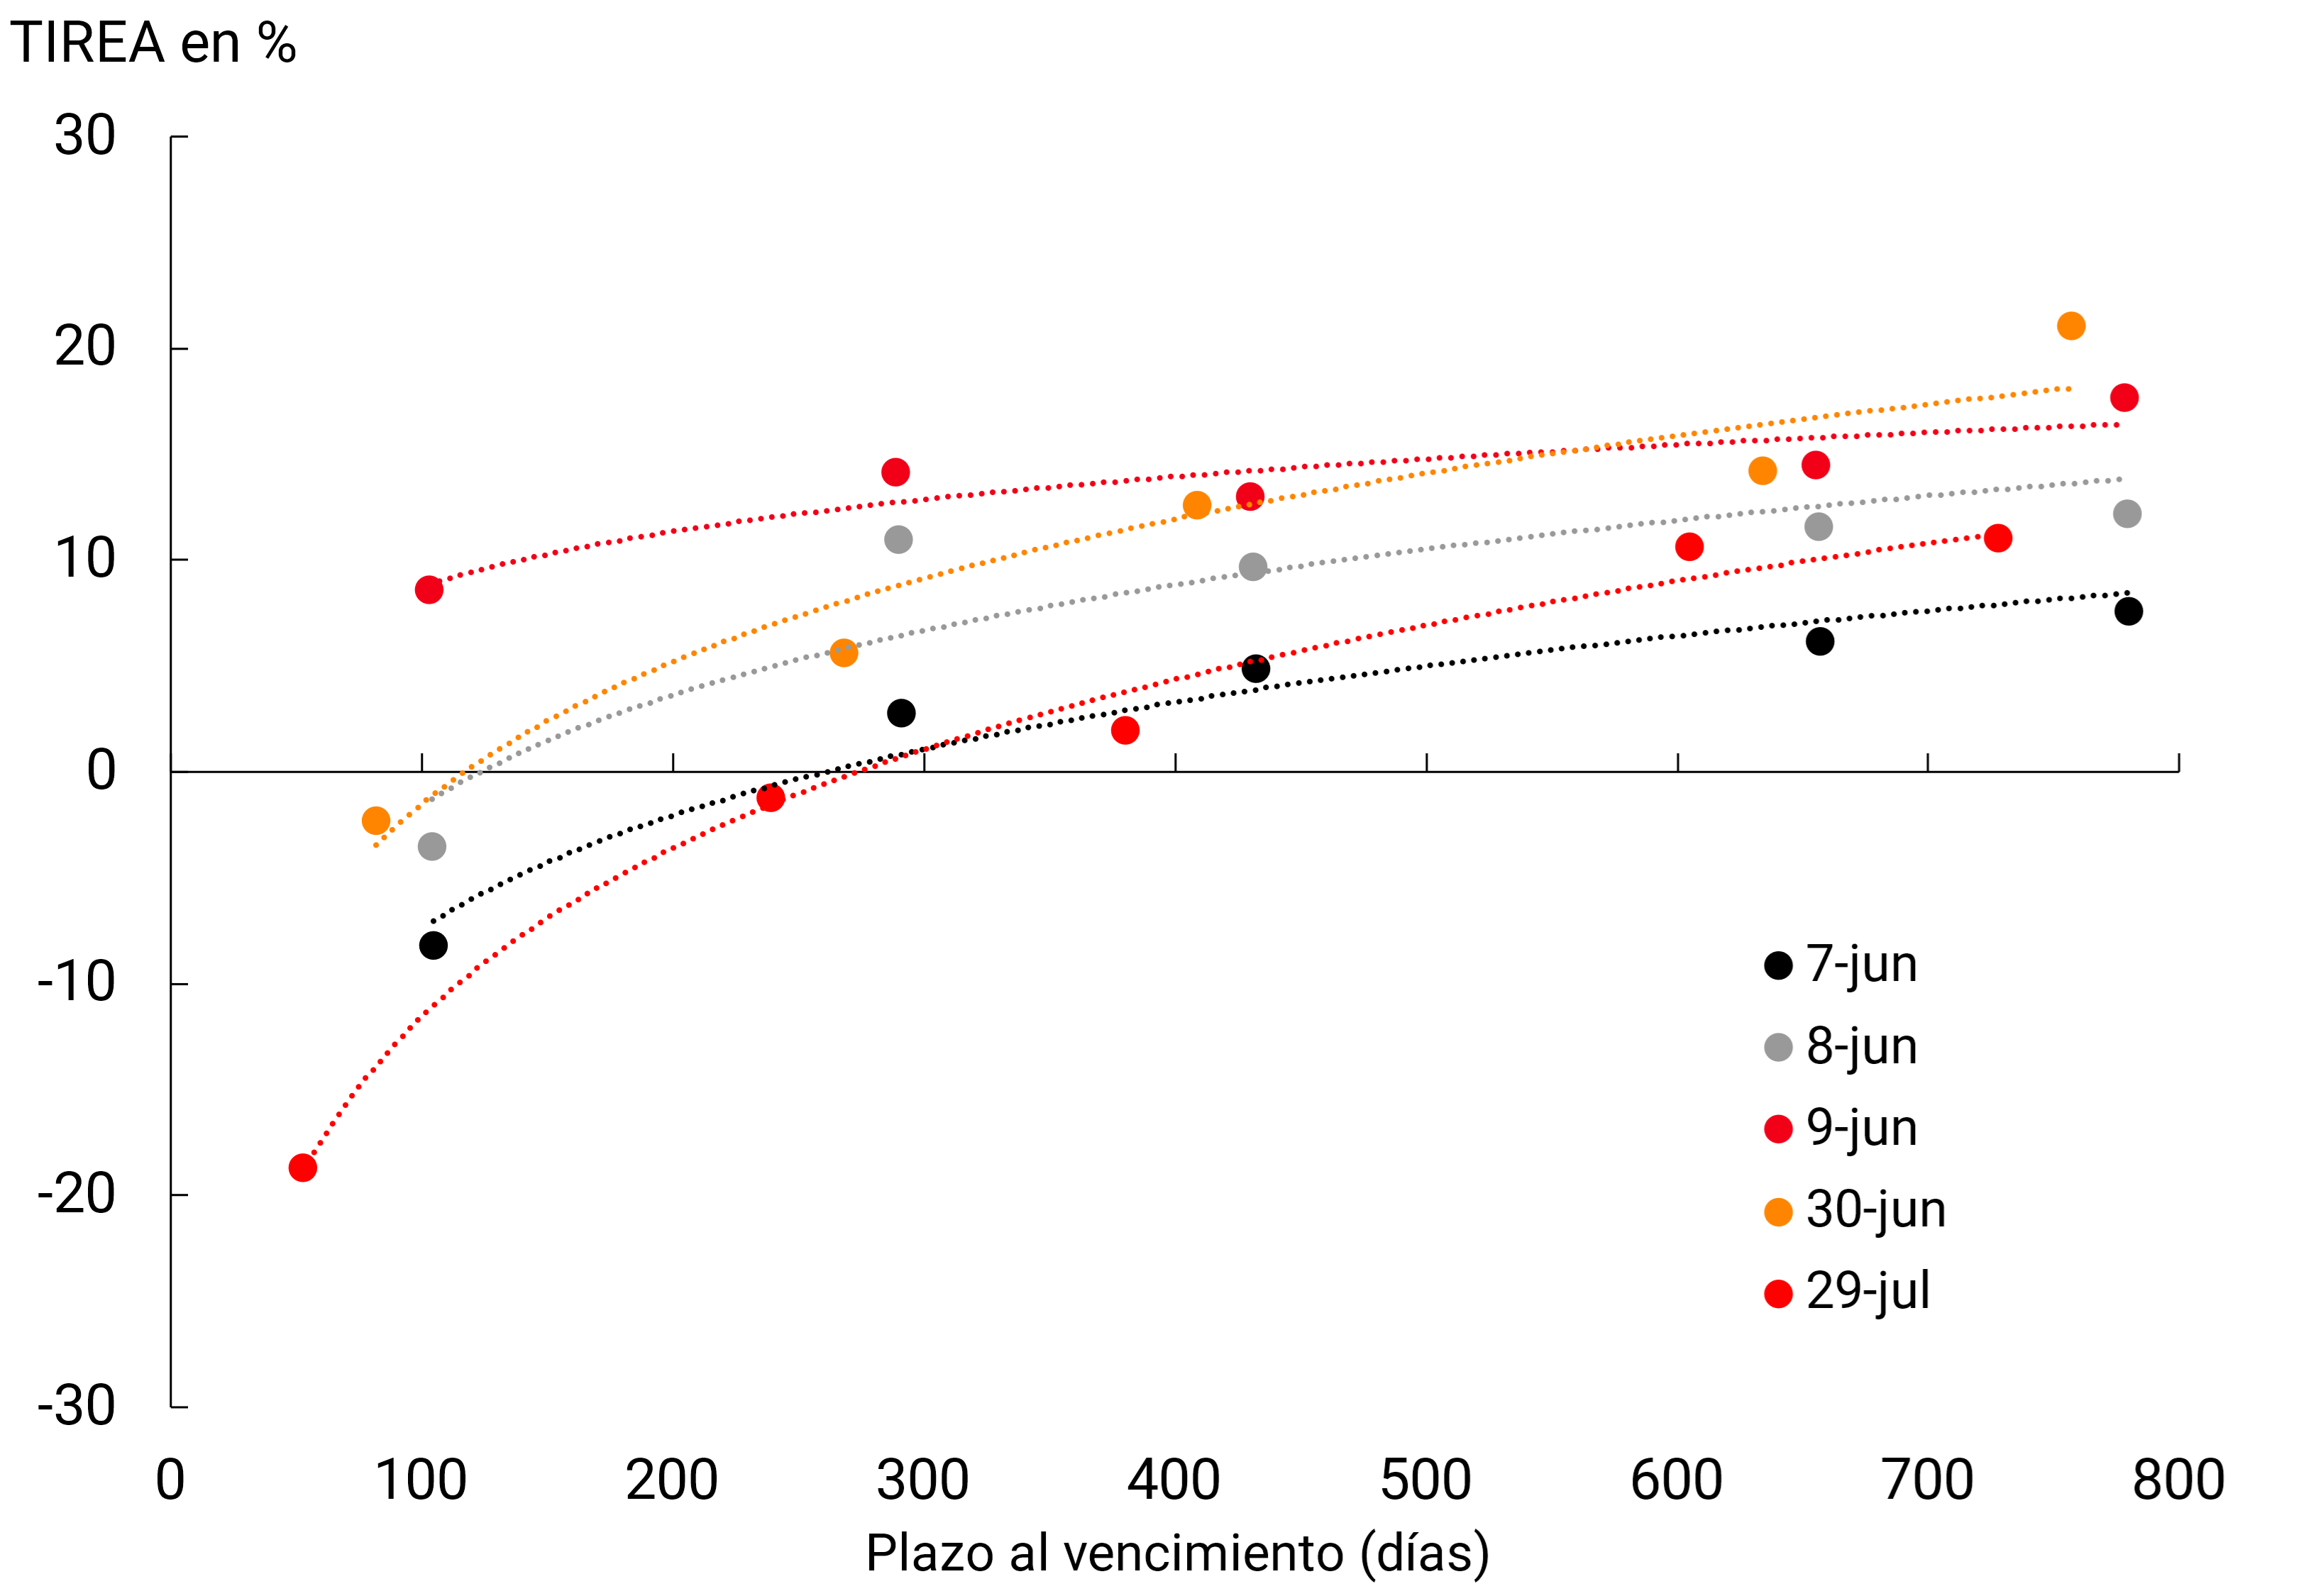
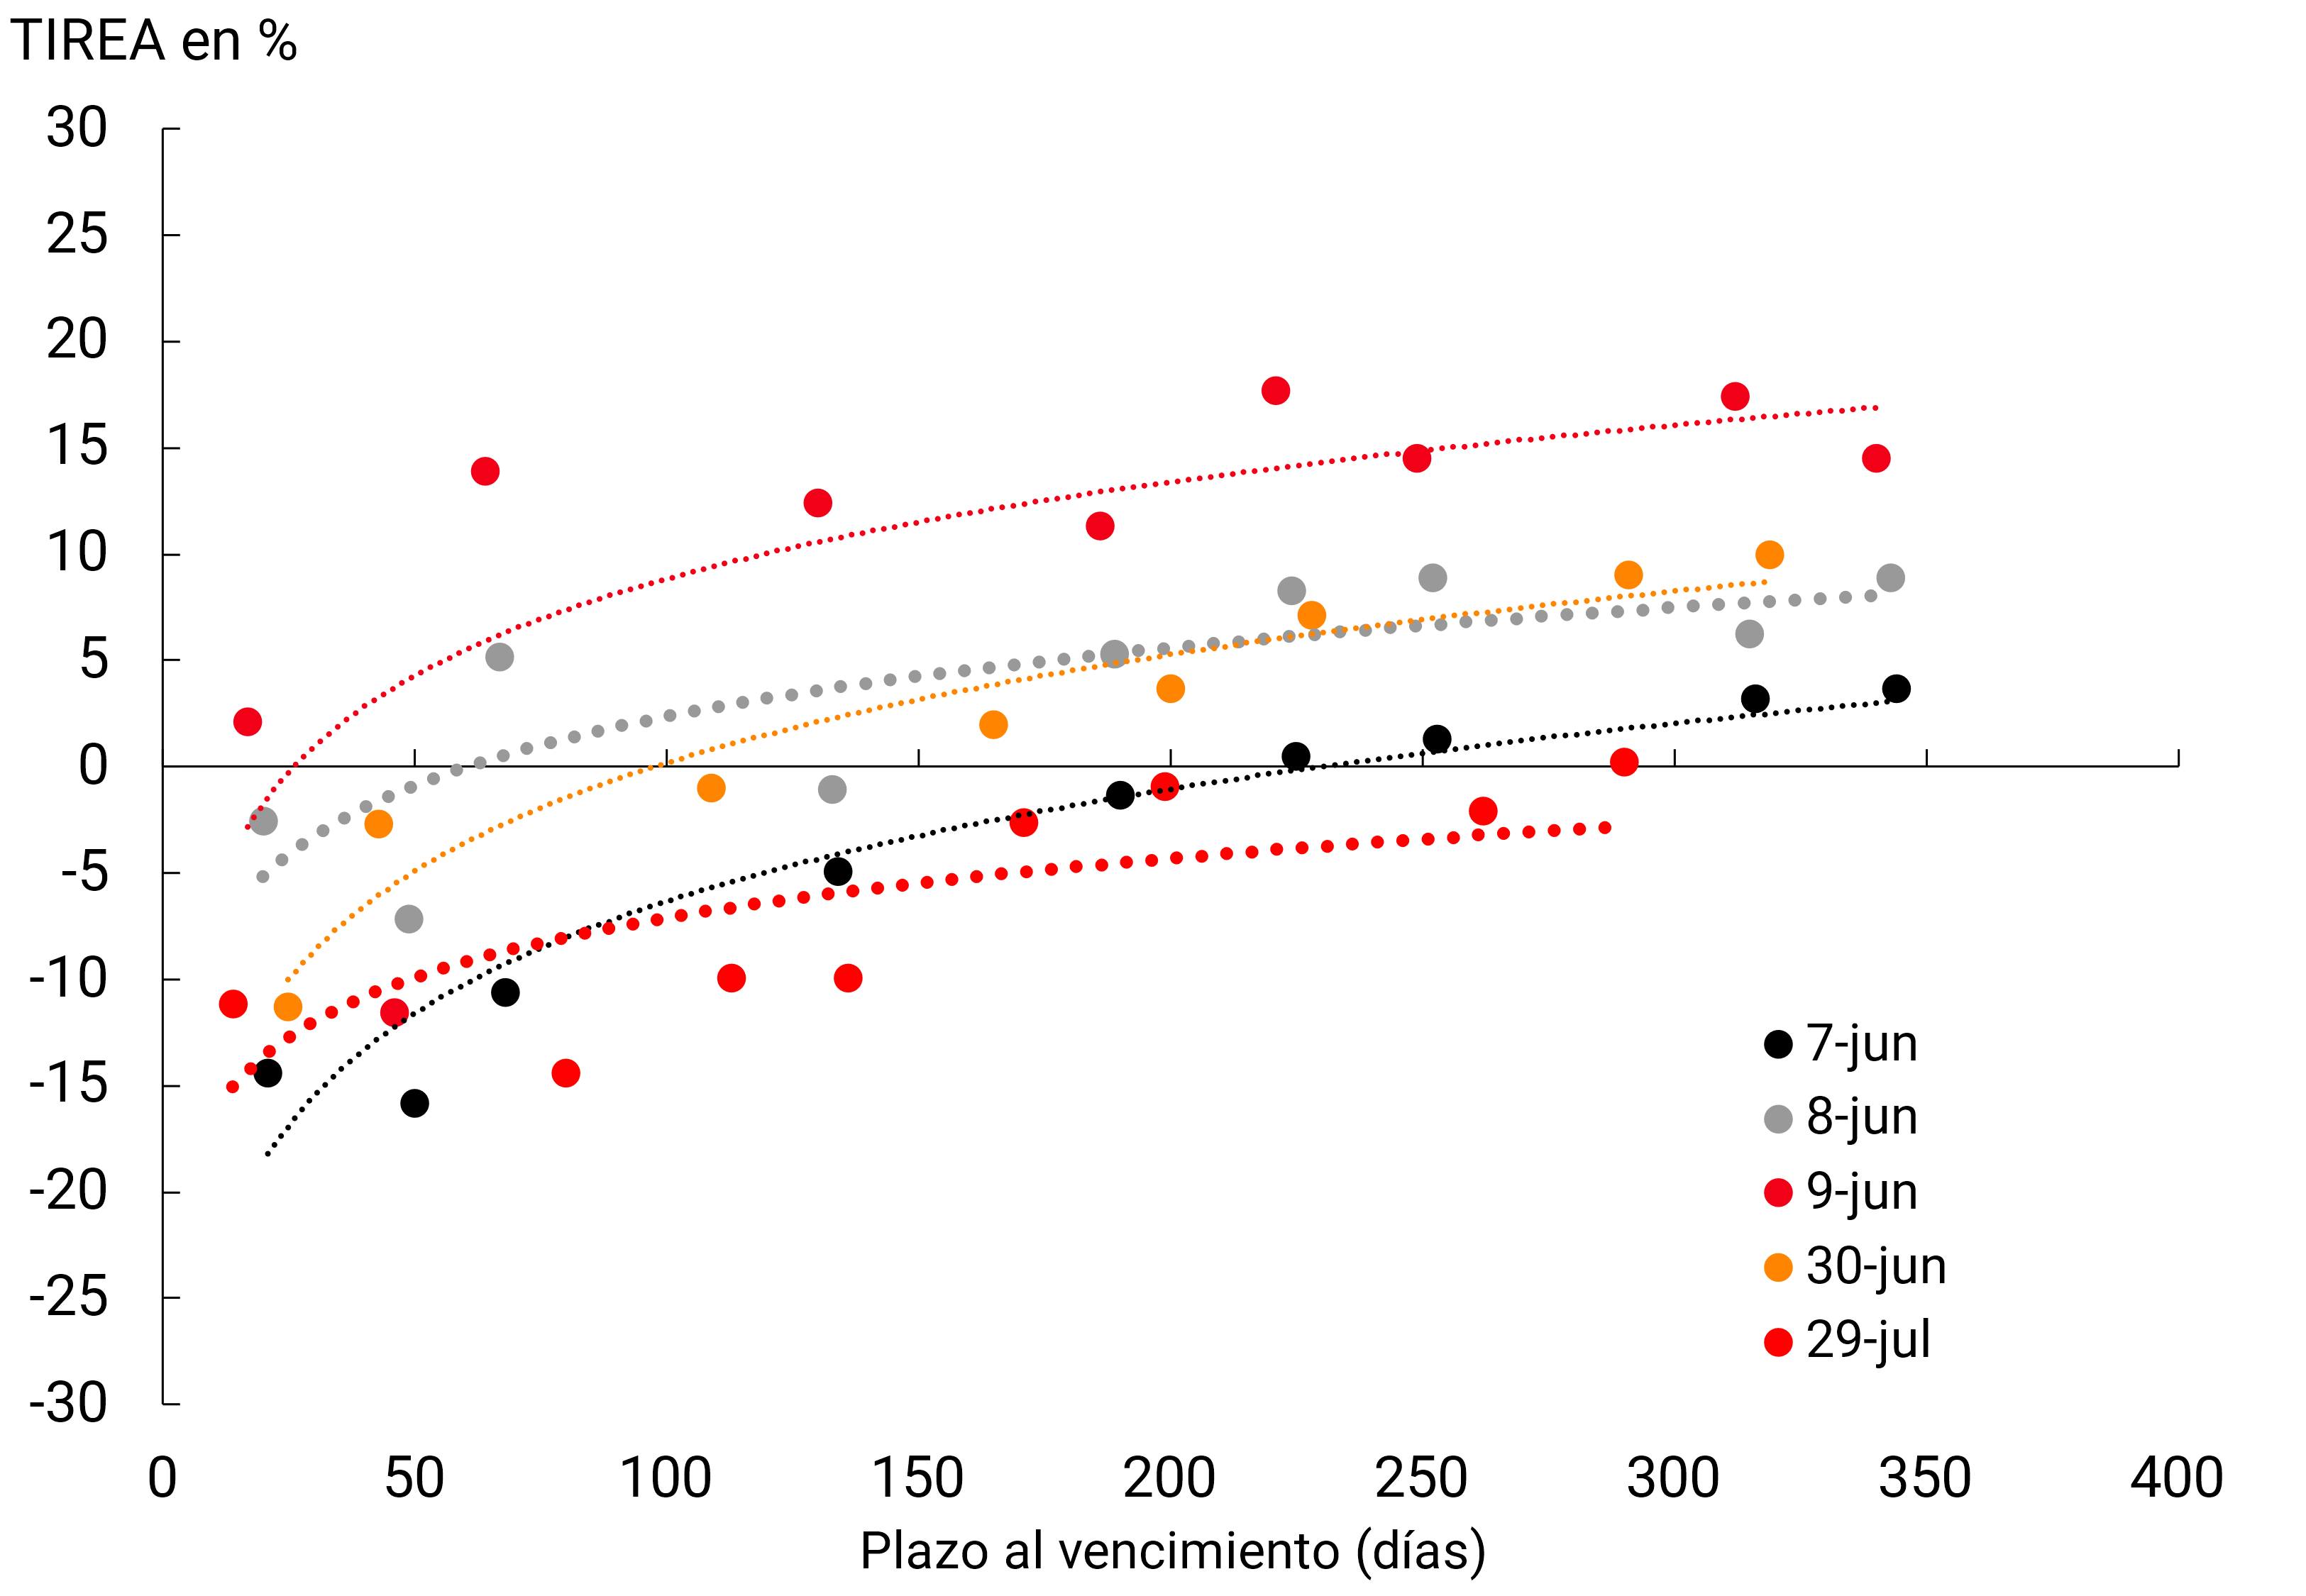
Source: BCRA.
The purchases of public securities by the BCRA amounted to about $1,290,000 million between June 9 and September 27, although most of them were mainly concentrated in the month of June and in the first days of July. It should be noted that the expansion of liquidity generated by these operations was largely sterilized through the monetary regulation instruments held by the BCRA.
Going forward, the BCRA will continue to monitor the secondary market for public securities and the evolution of their prices in relation to primary auctions, participating to limit their volatility, consistent with the current interest rate structure. In this way, it aims to prevent the yield of these securities from being located outside their macroeconomic fundamentals, which could alter the normal mechanisms of monetary policy transmission.
This action implies a deepening of coordination efforts with the Ministry of Economy of the Nation so that the BCRA’s interest rate structure presents reasonable spreads with National Treasury bills. To this end, the Board of Directors of the Central Bank decided to incorporate as a reference for the design and decisions of monetary policy the interest rate of short-term Treasury Bills (currently Discount Bills (LEDES) with maturities of 60-90 days). This decision is part of the strategy to (i) tend to a structure of positive interest rates in real terms, taking as a reference the main financial assets of the economy, (ii) strengthen the public debt market in pesos so that it achieves depth and liquidity and (iii) gradually advance in the use of Treasury instruments as monetary policy instruments.
Back to top
Glossary
ADEFA: Association of Automotive Manufacturers of the Argentine Republic.
AFCP: Portland Cement Manufacturers Association.
AFIP: Federal Administration of Public Revenues.
AMBA: Buenos Aires Metropolitan Area.
ANSES: National Social Security Administration.
ASPO: Social, Preventive and Mandatory Isolation.
AUH: Universal Child Allowance for Social Protection.
BADLAR: Buenos Aires Deposits of Large Amount Rate (interest rate paid for fixed-term deposits of more than one million pesos in the 30 to 35-day bracket by the average of banking entities).
BCRA: Central Bank of the Argentine Republic.
BOAT: National Treasury Bond.
CABA: Autonomous City of Buenos Aires.
CAME: Argentine Confederation of Medium Enterprises.
CAMARCO: Argentine Chamber of Construction.
CAMMESA: Compañía Administradora del Mercado Mayorista Eléctrico Sociedad Anónima.
ECLAC: Economic Commission for Latin America and the Caribbean.
CER: Reference Stabilization Coefficient.
S Fuels and Energy.
DECNU: Decree of Necessity and Urgency.
DISPO: Social, Preventive, and Mandatory Distancing.
EIL: Survey of Labor Indicators.
EMAE: Monthly Estimator of Economic Activity.
EMBI+: Emerging Markets Bond Index Plus.
EPH: Permanent Household Survey.
EUR: Euros.
Fed: Federal Reserve of the United States.
FAITHFUL: Latin American Economic Research Foundation.
IMF: International Monetary Fund.
FSB: Financial Stability Board.
G20: Group of 20.
GBA: Greater Buenos Aires.
A.I.: Year-on-year.
IBIF: Gross Fixed Domestic Investment.
ILA: Leading Indicator of Economic Activity.
INDEC: National Institute of Statistics and Censuses.
National CPI: Consumer Price Index of national coverage released by INDEC.
CPI BA: Consumer Price Index of the Autonomous City of Buenos Aires.
IPIM: Internal Wholesale Price Index.
IPOM: Monetary Policy Report.
ISAC: Synthetic Construction Indicator.
VAT: Value Added Tax.
LELIQ: Letrax de Liquidez of the Central Bank of the Argentine Republic.
M2: Banknotes and coins + quasi-currencies in circulation + current accounts in $ and savings accounts in $.
MSMEs: Micro, small and medium-sized enterprises.
Mens: monthly/monthly.
MOA: Manufactures of Agricultural Origin.
MOI: Manufactures of Industrial Origin.
MTEySS: Ministry of Labour, Employment and Social Security.
N.A.: Annual nominal.
NEA: Northeast Argentina.
NGFS: Network for Greening the Financial System.
NOA: Northwest Argentina.
OECD: Organization for Economic Cooperation and Development.
P.B.: Basic points.
P.P.: Percentage points.
Q: Projected.
COUNTRY: Tax for an Inclusive and Supportive Argentina.
EAP: Economically Active Population.
PFE: Extended Facilities Program.
GDP: Gross Domestic Product.
PMI: Purchasing Managers’ Index. Index of surveys to purchasing managers.
PP: Primary products.
SMEs: Small and medium-sized enterprises.
REM: Survey of Market Expectations of the BCRA.
s.e.: Series without seasonality.
NFPS: National Non-Financial Public Sector.
TNA: Annual Nominal Rate.
Trim.: Quarterly / Quarter.
US$: US dollars.
UTDT: Torcuato Di Tella University.
UVA: Unit of Purchasing Value.
Var.: Variation.
WEO: World Economic Outlook prepared by the IMF.
References
1 The Purchasing Managers’ Index is constructed through surveys of purchasing managers and executives of companies in the manufacturing and service sectors. The questions asked are related to, for example, production, new orders, employment, stocks, delivery times, among others, and must be answered in relation to the situation with respect to the previous month (in terms of whether they increased, decreased or remained the same). For each variable, the index is the sum of the percentage of responses that indicated “increases” and half of the percentage of responses “no change.” The indices range from 0 to 100, with a level above 50 indicating a growth in the variable compared to the previous month, and below 50 indicating a contraction.
3 In the case of the ILA-BCRA, it should be noted that in July the indicator met all the criteria required to indicate the beginning of a recessionary phase: it fell for the third consecutive month, the diffusion of growth of the components of the ILA stood at 47.5% in the 4-month moving average, while the accumulated depth in the last 6 months changed sign and stood at –11%. The purpose of this indicator is to anticipate the turning points of the EMAE, from a recovery or expansion phase to a recession or vice versa, when certain requirements are met that have to do with the diffusion, duration and depth of economic cycles. For more methodological details of the ILA, see Section 3 / BCRA’s Leading Index of Economic Activity published in the IPOM corresponding to January 2017.
4 Gross fixed capital formation, is composed of Construction and Durable Production Equipment (which includes Machinery and Equipment and Transportation Equipment, of national and imported origin).
5 National Income (gross at market prices) is GDP minus gross remuneration to factors from abroad plus current transfers from abroad. Total Consumption is the sum of Private Consumption and Public Consumption. National Income minus Total Consumption is equal to Gross National Savings.
6 Salaried employees with retirement discount.
7 Salaried employees without retirement discount.
8 Due to the increase in all its components: 28.1% s.e. Construction, 82.9% s.e. durable equipment of national origin and 64.8% s.e. durable equipment of imported production.
9 Calculated as Gross National Disposable Income at market prices (GDP at current prices minus Net Factor Income from abroad plus Net Current Transfers from abroad) minus Total Effective Consumption at market prices (private and public).
10 A new instrument was created that allowed producers to make a demand deposit in financial institutions with variable daily remuneration depending on the evolution of the A3500 exchange rate, known as the link dollar, for up to 70% of the value of the sale of grains and allowed them to form freely available foreign assets for the remaining 30%. Likewise, the issuance of a Dollar Bill was approved, aimed at stimulating the entry of external funds for pre-financing of large exporters, to provide a yield of SOFR plus 0.9 to the foreign currency entered by this mechanism that are deposited in local accounts in foreign currency, extending the terms for the settlement of these funds up to 180 days. In addition, access to dollar-linked demand accounts was enabled for exporters who anticipate the settlement by more than thirty days with respect to the term determined for each sector.
11 The FOB (Free on Board) valuation criterion is adopted for exports and CIF (Cost, Insurance and Freight) for imports. This is the exposure criterion used by INDEC for the preparation of the monthly report on Argentine Trade Exchange (ICA).
12 The implicit price index of imports of goods is of the Paasche type, which means that its variations are sensitive to changes in the basket of goods. The same applies to exports. The higher proportion of liquid fuels in the 2022 import basket, to the detriment of, for example, natural gas from Bolivia, with the former having a higher unit value, is behind the sharp increase in the implicit price index of fuel imports in 2022.
13 Preliminary data.
14 General Resolution 5232/2022.
15 Decree 576/2022.
16 These are reopenings of inflation-linked financial instruments originally issued in previous periods whose effective value exceeds the nominal value at the time of placement. According to the Ministry of Economy, in order to meet the NFPS’ primary deficit fiscal target of 2.5% of GDP, an annual limit will be established for the calculation of income from property income linked to the primary issuances of public securities equivalent to 0.3% of GDP (a magnitude similar to that recorded in this concept during 2021).
17 Administrative Decisions No. 826/2022, No. 879/2022 and No. 880/2022.
18 The increases in the last year were 12.12% in Jun-21, 12.39% in Sep-21, 12.11% in Dec-21, 12.28% in Mar-22 and 15.00% in Jun-22. In this way, they totaled an increase of 58.6% y.o.y. in Mar-22, 3.5 p.p. more than the accumulated inflation in 12 months to Mar-22. year.
19 The minimum pension will amount to $43,353. With the monthly bonus of $7,000 it totals a sum of $50,353 and accumulates a 73.3% increase in the year. The amount of the reinforcement will gradually decrease to $4,000 for those who have incomes of up to 2 minimum salaries. For its part, the amount of the Universal Child and Pregnancy Allowance will go from $7,332 to $8,471. Likewise, a reinforcement of family allowances per child was provided for the months of September, October and November for dependent workers with family incomes of up to $131,000, who will receive a total amount of $20,000 per month for each dependent child, instead of the $10,126 they were receiving since October last year (family allowance + supplement).
20 Decree 576/2022.
21 Decree 551/2022.
22 Decree 332/2022.
23 This performance was verified despite the fact that since the beginning of 2021, the transfers associated with the creation of the Fund for the Fiscal Strengthening of the Province of Buenos Aires (Decree 735/2020) began to be budgeted.
24 Contemplating the annual limit for the calculation of income from property income linked to the primary issuance of public securities equivalent to 0.3% of GDP for the purposes of the policy objectives contained in the program with the IMF.
25 The budget contemplates a net financing of about 2.7% of GDP by the private sector.
26 On September 22, the Ministry of Commerce reached an agreement with representatives of the Argentine Industrial Chamber of Apparel (CIAI) to return prices to September 5 and keep them stable until December 1, reaching up to 60 brands in the sector.
27 The agreement announced on July 19, 2022 was agreed between the Ministry of Health of the Nation, the Secretariat of Domestic Trade and representatives of the pharmaceutical sector with the aim of favoring the population’s access to medicines and consists of the maximum increase for the following 60 days of up to 1 point below the general CPI of the previous month for all medicines that are marketed to through pharmacies, including over-the-counter pharmacies. For its application, the prices in force on June 30, 2022 were taken as a basis (see the following link). This agreement was then extended until November 18, 2022.
28 The variation in the Hotels group was estimated based on data published by INDEC for the Restaurants and Hotels division, excluding the Restaurants and Meals Away from Home group. According to the IPCBA, the monthly variation of accommodation services was 35.5% in July and 0.2% in August.
29 Resolution No. 514/2022 Ministry of Transport.
30 Resolution No. 91/2022 Ministry of Public Works.
31 In GBA, the increases were authorized by Resolution No. 172/2022 and 171/2022 ENRE, in June there were also increases in other regions of the country.
32 Resolution No. 208/2022 to 216/2022 ENARGAS.
33 Resolution No. 145/2022 and 146/2022 ENRE.
34 RESOL-2020-8-APN-MDS. The $6,000 (RESOL-2020-26-APN-MDS) then exceeded the value of the Basic Food Basket of an Equivalent Adult.
35 For an amount of $10,000, then 75% of the Minimum Living and Mobile Wage, the IFE was paid in April 2020, based on the provisions of Decree 310/2020, again in June, in accordance with Decree 511/2020 and for the last time in August, as of Decree 626/2020.
36 The bonus of $3,100 for each son or daughter was paid between March and April 2020.
37 CFue created by Decree 332/2020 and was paid over the 9 rounds that the program had until December 2020, plus a remainder in the first months of 2021. The State was responsible for the payment of 50% of the salary, on account of the payment of the salaries of the affected personnel, up to $33,750, which was the equivalent of two Minimum, Vital and Mobile Salaries.
38 Physical-Financial Execution of the National Administration Budget.
39 Through Decree 376/2020, in April, the minimum was raised to $6,000 and the maximum to $10,000.
40 The RePro grants subsidies to workers in companies and geographical areas in crisis, in order to supplement the basic remuneration paid by the employer through a fixed monthly non-remunerative sum and for a period of up to 12 months.
41 The benefit granted to each recipient was agreed with the following scheme: a) non-critically affected persons: up to $9,000; b) critical: up to $12,000 (by transitory provision it will be $18,000); and c) health sector: up to $18,000. Currently, the amount of the assistance, which is paid for three months, is equivalent to 50% of the total remuneration of each active worker up to a maximum of fifty percent 50% of the value of the SMVyM in force at the time of requesting the assistance. To receive the allowance, workers must not have a total remuneration greater than four times the current SMVyM.
42 The National Program for Socio-Productive Inclusion and Local Development “Empower Work” unifies the Hacemos Futuro and Complementary Social Wage programs into a single initiative.
43 Decree 711/2021 amends the Socio-Productive Inclusion and Local Development Programmes “Empower Work” and the Labour Insertion Programme of the Ministry of Labour, Employment and Social Security, with the aim of converting the different assistance benefits for unemployed people or those with precarious jobs into a stimulus for the hiring of their holders in the form of salaried employment registered in the private sector.
44 RESOL-2021-655-APN-MDS of May 2021.
45 According to Decree 218/2021, an extraordinary payment of $1,500 was made in April and another of $1,500 in May. Subsequently, decrees 481/21 and 855/21 established extraordinary payments of $5,000 in August and $8,000 in December, respectively.
46 Decree 261/2021.
47 Decree 719/2021.
48 According to Decree 216/2022, the amount of the “income reinforcement” benefit will be $18,000 to be made in two payments of $9,000 in May and June 2022.
49 The amounts received for families with one child came to represent $9,000, $13,500 for families with two children and $18,000 for those with three or more children (RESOL-2022-371-APN-MDS).
50 The new stage of the +Precios Cuidados program launched in April increased the number of items included in it to 1,357 and incorporated 473 products from the entry into force of the private wheat trust (000 flour and dry noodles).
51 Unregulated private services refer to services excluding electricity, gas and other fuels, public transportation, prepaid medical expenses, telephone and internet, and education.
52 On 16-Jun-22, Decree 332/2022 was published, which establishes the segmentation of electricity and natural gas tariffs by network, dividing users into 3 scales: Higher income (level 1), Lower income (level 2) and Medium income (level 3). In the first case, subsidies will be removed during the year so that users pay the full rate by the end of 2022. In the case of lower-income users, they will pay the Social Tariff, and the increase may not exceed 40% of the CVS of the previous year. Finally, the rates of middle-income users will be increased to 80% of the CVS of the previous year. In this way, after the March increases, the rates of levels 2 and 3 will not show any more increases in the rest of 2022.
53 On December 30, 2020, a Memorandum of Agreement was signed between the companies in the agro-export sector of oils grouped in the Chamber of the Oil Industry of the Argentine Republic and the Center of Cereal Exporters (CIARA CEC) and the Ministries of Agriculture, Livestock and Fisheries and of Productive Development for the formation of a private trust in order to guarantee the domestic supply of oils and ensure fair and reasonable prices for the domestic market. The trust consists of a compensation system through which agents operating in the soybean and sunflower market and are registered in the Single Registry of the Agri-Food Chain (RUCA) make contributions of funds that are calculated according to the Affidavits of Foreign Sales of the products subject to contributions. The beneficiaries are economic actors who carry out the transformation of bulk oil in the country into final consumption products for supply in the domestic market that adhere to the trust. As for the products subject to compensation, they are “Packaged Oils” and “Refined Oils”. At the request of joint resolution No. 1/22, the continuity of this system was set until January 31, 2023.
54 This cumulative fall so far this year presents a heterogeneous behavior in the months, with a systematic fall until April and a reversal in May.
55 Recently, and in line with the rise in monetary policy rates, the lending rate for investment projects was increased to 42% n.a. and the working capital rate to 52.5% n.a.
56 Recently, the rate of financing granted through Ahora 12 was raised to 42% n.a. for financing in three, six and twelve installments.
59 Communication “A” 7469 and Communication “A” 7471.
61 Communication “A” 7488, Communication “A” 7507, Communication “A” 7516 and Communication “A” 7528.
62 Decree 277/2022 of the National Executive Branch.
66 On this occasion, calculated on the average of private sector deposits in March 2022.
69 Cryptoassets are a type of privately issued digital asset that relies on cryptography and distributed ledger technology (DLT) for transaction verification. The first crypto assets, such as Bitcoin, were issued in their own unit of account and are not the liability of any entity. Although they have attracted growing interest as a speculative investment vehicle, data on their use in the conduct of legal transactions are scarce. Its high volatility and the unregulated nature of its market raises significant consumer protection concerns. New variants such as stablecoins (designed with the purpose of maintaining a stable value with respect to a basket of assets) have, however, the potential to function as a substitute for money in their traditional functions and, depending on their degree of adoption, also pose potential risks to macro-financial stability (IMF –2022–).
70 By way of example, it should be noted that in the case of our country, the number of new accounts created to enable the payment of the IFE and ATP programs aimed at mitigating the negative impacts of the pandemic on the income of families and firms was around 5 million, which made it possible for 95% of the adult population to access bank accounts and payment service providers. A similar, even more pronounced development was verified in Brazil where the number of accounts grew by about 50 million in 2020 alone to reach a coverage of 96% of the adult population.
71 On the other hand, in addition to these factors of a more structural nature, it should be borne in mind that in a context marked by the uncertainty caused by the pandemic, the precautionary demand for cash has tended to increase temporarily in the last period, even in advanced economies. In the latter, the coexistence between a lower transactional use of cash and a greater demand for it for hoarding reasons – something that in the literature has been called the “banknote paradox” – is a phenomenon that had already been verified as a result of the lower opportunity cost of working capital holdings associated with the validity of very low nominal interest rates in the period of the post-global financial crisis.
72 This is not necessarily the situation in all cases. For example, as mentioned in footnote 2, levels of financial access (measured as the number of bank and payment accounts in relation to the total adult population) are currently very high in Brazil and in our country. However, despite this high coverage, in some circumstances the lack of knowledge regarding their existence or their conditions of use implies a low effective use of these digital media.
73 Interoperability is the technical, operational, and legal compatibility between payment mechanisms and systems that allows users and providers to carry out transactions without the need to participate simultaneously in these multiple systems (CPMI –2016–).
74 In other countries of the region, there are also SMPRs with more limited coverage and uses for the time being (with clearing mechanisms operated by and owned by the private financial sector).
Share on


