Summary
1. Monetary policy: assessment and outlook
The external context has become more complex in the last three months. The deepening of the war in Ukraine pushed up international food and energy prices and undermined the dynamism of global economic activity. Higher inflationary pressures led to a cycle of monetary tightening in advanced economies that was more pronounced than expected at the beginning of the year. The increase in global interest rates pressured the values of financial assets listed on the world’s main stock exchanges, generated a global appreciation of the dollar and increased the risk of capital outflows from emerging countries. For developing countries, and in particular those in Latin America, different perspectives for growth and inflation opened up depending on whether upward pressures on commodity prices and the consequent real appreciation of exchange rates continue; or, if the appreciation of the dollar results in lower commodity prices and more depreciated real exchange rates.
The Argentine economy continued to consolidate its recovery process that began in 2021 and continued to operate at levels higher than pre-pandemic levels, with increases in the investment rate. This improvement in economic activity was accompanied by a recovery in registered employment, which is at an all-time high. After a first quarter of growth, GDP is expected to contract slightly during the second quarter due to the impact of the drought conditions that affected the main soybean and corn producing areas during the summer and then resume its growth path in the second half of the year. to close 2022 with an expansion of around 4%. In this context of continuity in the process of recovery of economic activity, the BCRA focused its credit policy on the most lagging sectors and on the financing of productive development and structural change. The Productive Investment Financing Line (LFIP) continued to be the main tool used to channel productive credit to MSMEs under favorable conditions. The average balance of financing granted between October 1, 2021 and March 31, 2022 through the LFIP reached $670,000 million.
In March 2022, inflation accelerated significantly, reaching a monthly rate of 6.7%, a very high record in historical terms. This increase was mainly observed in the Core category, and within it, in the value of food, driven by the increases in international commodity prices as a result of the war in Ukraine. This external shock affected Argentina in the context of a recovering economic activity and with a previous high inflationary inertia. After the maximum reached in March for the General Level, the May data confirmed the slowdown in inflation that had begun in April, with a significant drop in the Core category. However, inflationary records remain at high levels, in part due to the existence of formal and informal indexation mechanisms that contribute to increasing the magnitude and persistence of the shock.
Faced with this scenario, the monetary authority continued its process of normalization of the policy interest rate and the rest of the economy’s interest rate structure, seeking to move towards an interest rate path that allows safeguarding the value of investments made in instruments denominated in domestic currency and avoiding pressures in the foreign exchange market. without affecting the economic recovery underway. At the close of this edition, the interest rate of the LELIQ with a 28-day term amounted to 52% n.a. (66.5% y.a.), with a total increase of 14 p.p. since the beginning of the year. Likewise, the floor for the interest rate of fixed terms of individuals accumulated an increase of 19 p.p. for the segment between $1 and $10 million and 16 p.p. for the segment of less than $1 million so far this year, currently standing at 53% n.a. for both types of placements (68% e.a.). For the rest of the private sector’s fixed-term deposits, the minimum guaranteed rate accumulated a rise of 16 p.p. to 50% n.a. (63.2% y.a.).
In order to contain the impact of the acceleration of prices, the National Government decided to mitigate the loss of purchasing power of income of people without formal income and/or in a situation of socioeconomic vulnerability. Likewise, the increase in energy prices had a negative impact on public finances. The increased financing needs were met using a multiplicity of sources, including monetary financing. Thus, so far this year, monetary assistance to the Treasury in terms of GDP was at a level similar to that of the years prior to the pandemic. On the other hand, during June, in the face of an increase in volatility in global and local financial markets, the BCRA intervened in the secondary market of public securities with the aim of recomposing the Treasury’s curve in pesos, in a context of excessive and unjustified price volatility that could compromise financial stability. The counterpart of these operations was an expansionary effect on the monetary base, offset by operations to sterilize excess liquidity. However, the seasonally adjusted monetary base at constant prices is at historically low levels and in terms of GDP reached a record low in April. The BCRA will maintain a prudent administration of monetary aggregates, sterilizing any surplus liquidity, to avoid imbalances that directly or indirectly threaten the disinflation process.
Going forward, the National Government and the BCRA will continue to adopt measures to lower inflation. In this sense, the current policy scheme within the framework of the agreement with the IMF will consolidate a framework of macroeconomic certainty, thus helping to limit expectations of an increase in the exchange rate and inflation. Recently, the IMF and the Argentine authorities reached an agreement at the technical level on the first review of the Extended Facilities Program. The review focused on evaluating the performance since the approval of the agreement, contemplating the impact of the war in Ukraine on the Argentine economy and identifying policies that allow its effects to be mitigated. With the aim of strengthening macroeconomic stability, it was agreed to keep the annual targets related to the primary fiscal deficit, monetary financing and net international reserves established in March unchanged, changing their quarterly trajectory. After meeting all the program’s quantitative targets for the first quarter of 2022, the agreement on the first review was approved by the IMF’s executive board.
The BCRA will continue to calibrate monetary policy based on the observed and prospective evolution of the general price level and will continue to carry out actions to align its monetary policy with the BCRA’s Objectives and Plans for 2022, in which the authorities established as a goal to set the path of the policy interest rate towards positive real returns on investments in local currency.
2. International context
The global economy continues to feel the impact of the war through higher food and energy prices and a slowdown in activity. Higher inflationary pressures have led to a cycle of monetary contraction that was more pronounced than expected a few months ago in advanced economies. And COVID-19 outbreaks, although localized, implied new restrictions in China, hampering trade flows.
This has led to a reduction in the global growth forecast for this year of 1 p.p. on average compared to what was expected before the war; only commodity exporting countries would grow somewhat more than expected at the close of the previous IPOM. Meanwhile, inflation is reaching levels not seen in decades in advanced countries, leading their central banks to bring forward and accentuate interest rate hikes, while contracting the money supply generated in response to the pandemic. Developing countries, which had already shown higher inflation since 2021, continued to raise interest rates. The combination of higher inflation and lower growth is more costly for these countries because: they had been recovering more slowly than the advanced countries; food has a greater weight in its consumption basket; and face more unfavorable financial conditions.
Higher international interest rates put pressure on stocks and bonds, and generate a global appreciation of the dollar. They also present the risk of capital outflows from emerging countries. For growth and inflation in developing countries, and in particular in Latin America, different perspectives open up depending on: whether commodity prices continue to rise, and this is associated with an appreciation of the real exchange rate (which compensates for inflationary pressures); or a more appreciated dollar puts downward pressure on commodity prices, while the real exchange rate depreciates. It will also be key whether monetary policy in the US and Europe can reduce inflation without hurting growth in larger economies too much or destabilizing global financial conditions.
2.1. COVID-19 cases continue to decline, but focus on China impacts international trade
COVID-19 cases continued to decline sharply from a record 24 million weekly at the end of January 2022 and stand at 3.4 million weekly cases at the end of June, with 9 thousand deaths. As a result, the death rate for cases 10 days ago reached a low of 0.27% (up from more than 2.5% in March 2021). Along with the increase in cases in January and then in early April, global mobility was reduced; it is currently recovering and is already on average above 80% of its pre-pandemic level (see Figure 2.1).
Figure 2.1 | New global confirmed cases and deaths from COVID-19 and the mobility normality

index
Source: BCRA based on data from WHO and The Economist.
During March and April, cases rose in Europe (mainly Germany and France) and Asia (Japan and Korea). Since mid-March and due to its COVID-0 policy, China carried out a strict quarantine in the city of Shanghai for 65 days, impacting international trade due to its importance as an Asian port (other cities such as Beijing had more limited restrictions).
Vaccination campaigns continue: 65% of the world’s population has received at least one dose, although the gap between countries remains. The percentage of the population fully vaccinated in low-income countries is more than 8 times lower than in high-income countries; and while high-income countries have more than 45 booster doses per 100 inhabitants, low-income countries have applied less than 0.4 (see Figure 2.2).
Figure 2.2 | Evolution of vaccination campaigns by country
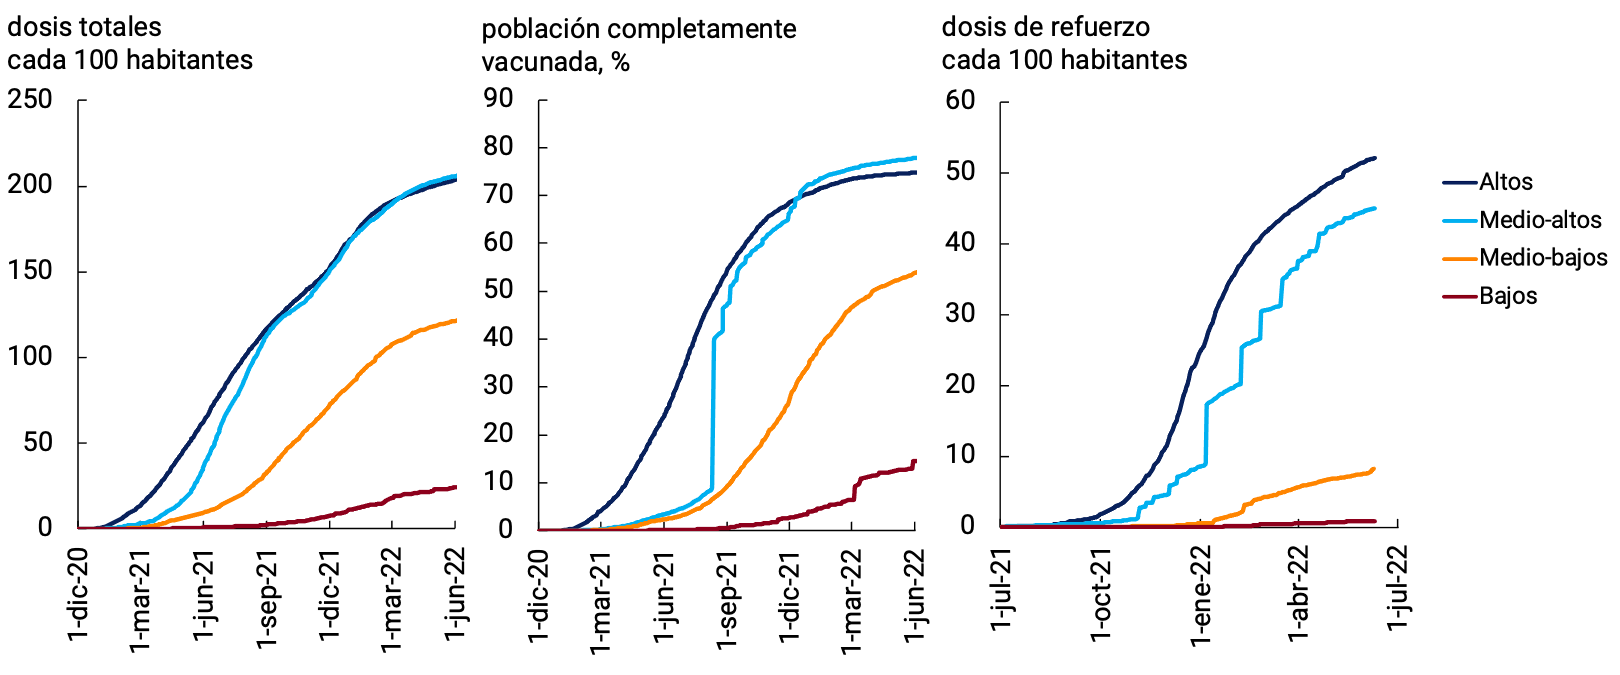
groups
Source: BCRA based on WHO data.
2.2. The global economy slowed in the first quarter and growth forecasts for this year were lowered
The war generated uncertainty and a sharp rise in the price of raw materials, leading to prospects of higher inflation and lower global growth. The expectation and the subsequent start of a more aggressive contractionary cycle by the US Federal Reserve (Fed) tightened global financial conditions. Finally, restrictions in key cities in China impacted international trade and global supply chains.
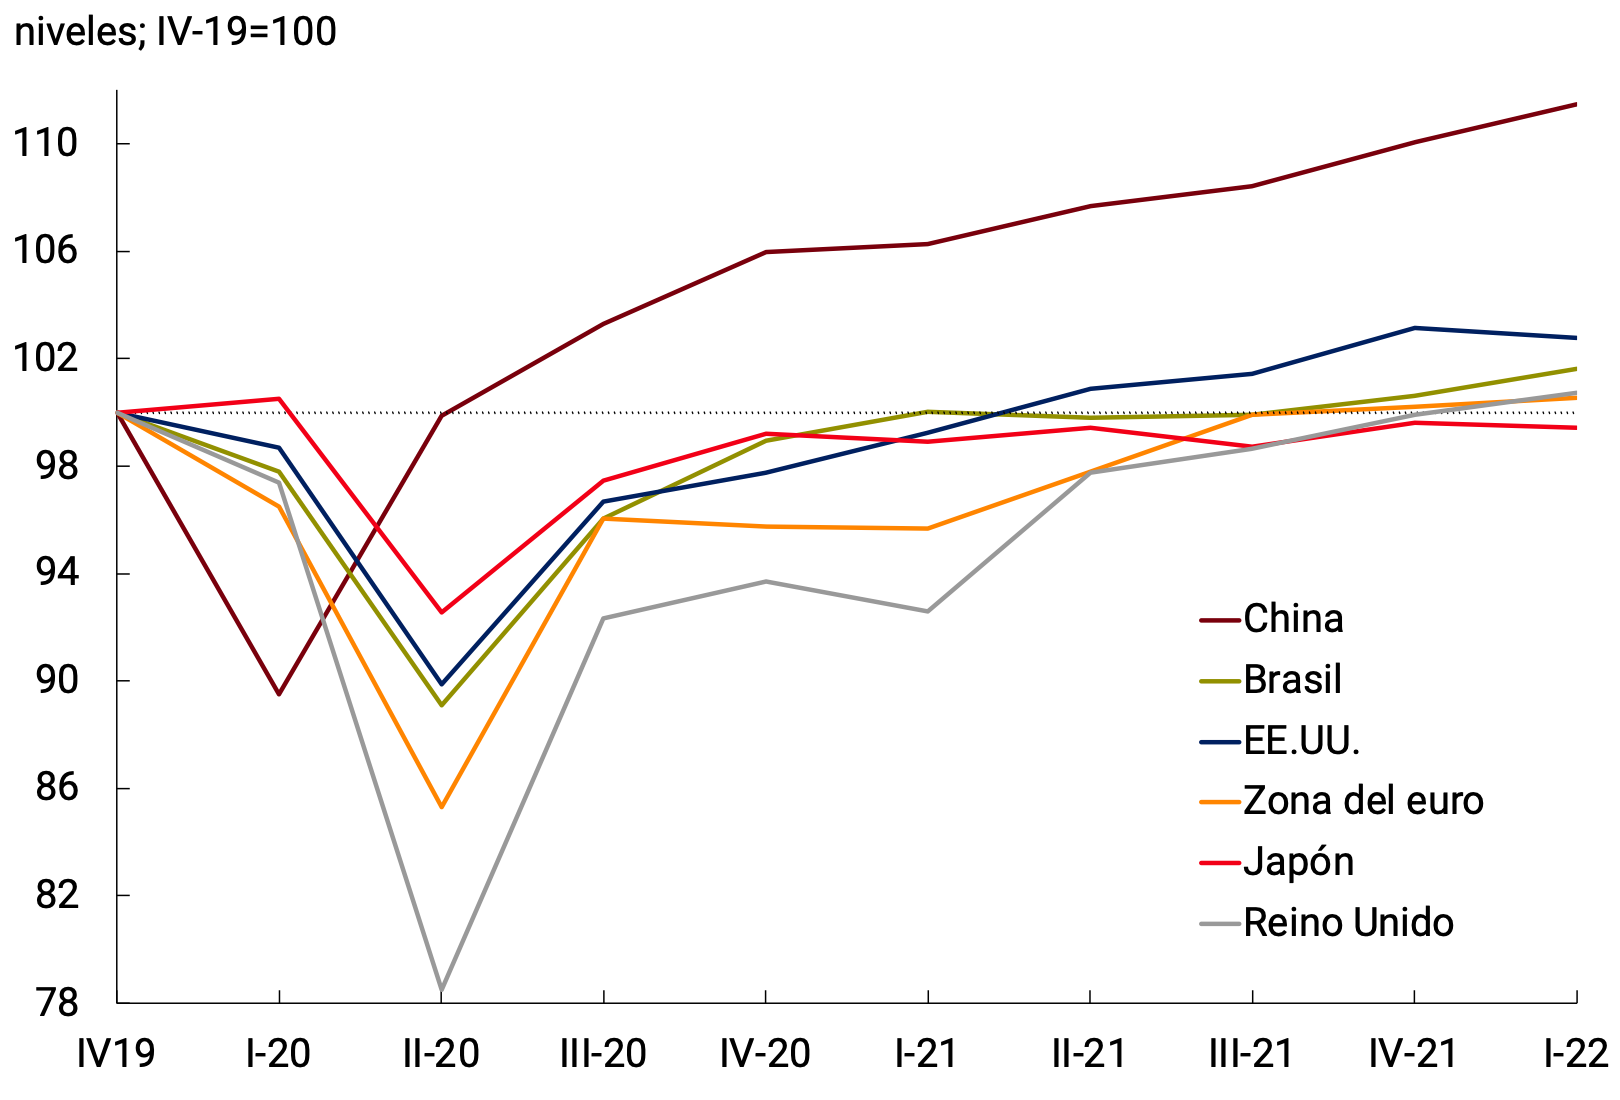
Thus, in the first quarter of the year, a slowdown in the main world economies is generally observed, with lower quarterly growth rates in China and the United Kingdom and falls in activity in the United States and Japan. On the other hand, activity in the euro area accelerated slightly, but with a poor performance of household consumption, government spending and fixed investment. The Brazilian economy showed a higher quarterly growth rate, driven by private consumption and exports (see Figure 2.3).
Figure 2.3 | Evolution of GDP in selected countries (real GDP without seasonality)

Source: BCRA based on data from national statistics institutes.
Monthly indicators suggest that the global slowdown continued at the start of the second quarter. From March onwards, consumer confidence, retail sales, the purchasing managers’ indicator (PMI) and industrial production in the euro area and the United Kingdom fell, reflecting uncertainty and rising energy prices (see Figure 2.4)1.
In China, mobility restrictions led to contractions in retail sales, industrial production and the PMI, only surpassed in recent months by those recorded when the pandemic broke out in early 2020. In May, the effects of a relaxation of restrictions began to be felt, with a partial recovery in activity indicators.
In the United States, the fall in GDP in the first three months of the year was due to a decrease in inventories, exports and public spending; but private consumption and private fixed investment accelerated. For the second quarter, activity is expected to grow again, although at a slower pace than that observed in 2021. Retail sales and industrial production were strong in April but weakened in May, the purchasing managers’ indicator trended down from March, and consumer confidence hit a multi-year low in June (see Figure 2.4).
Figure 2.4 | Activity indicators
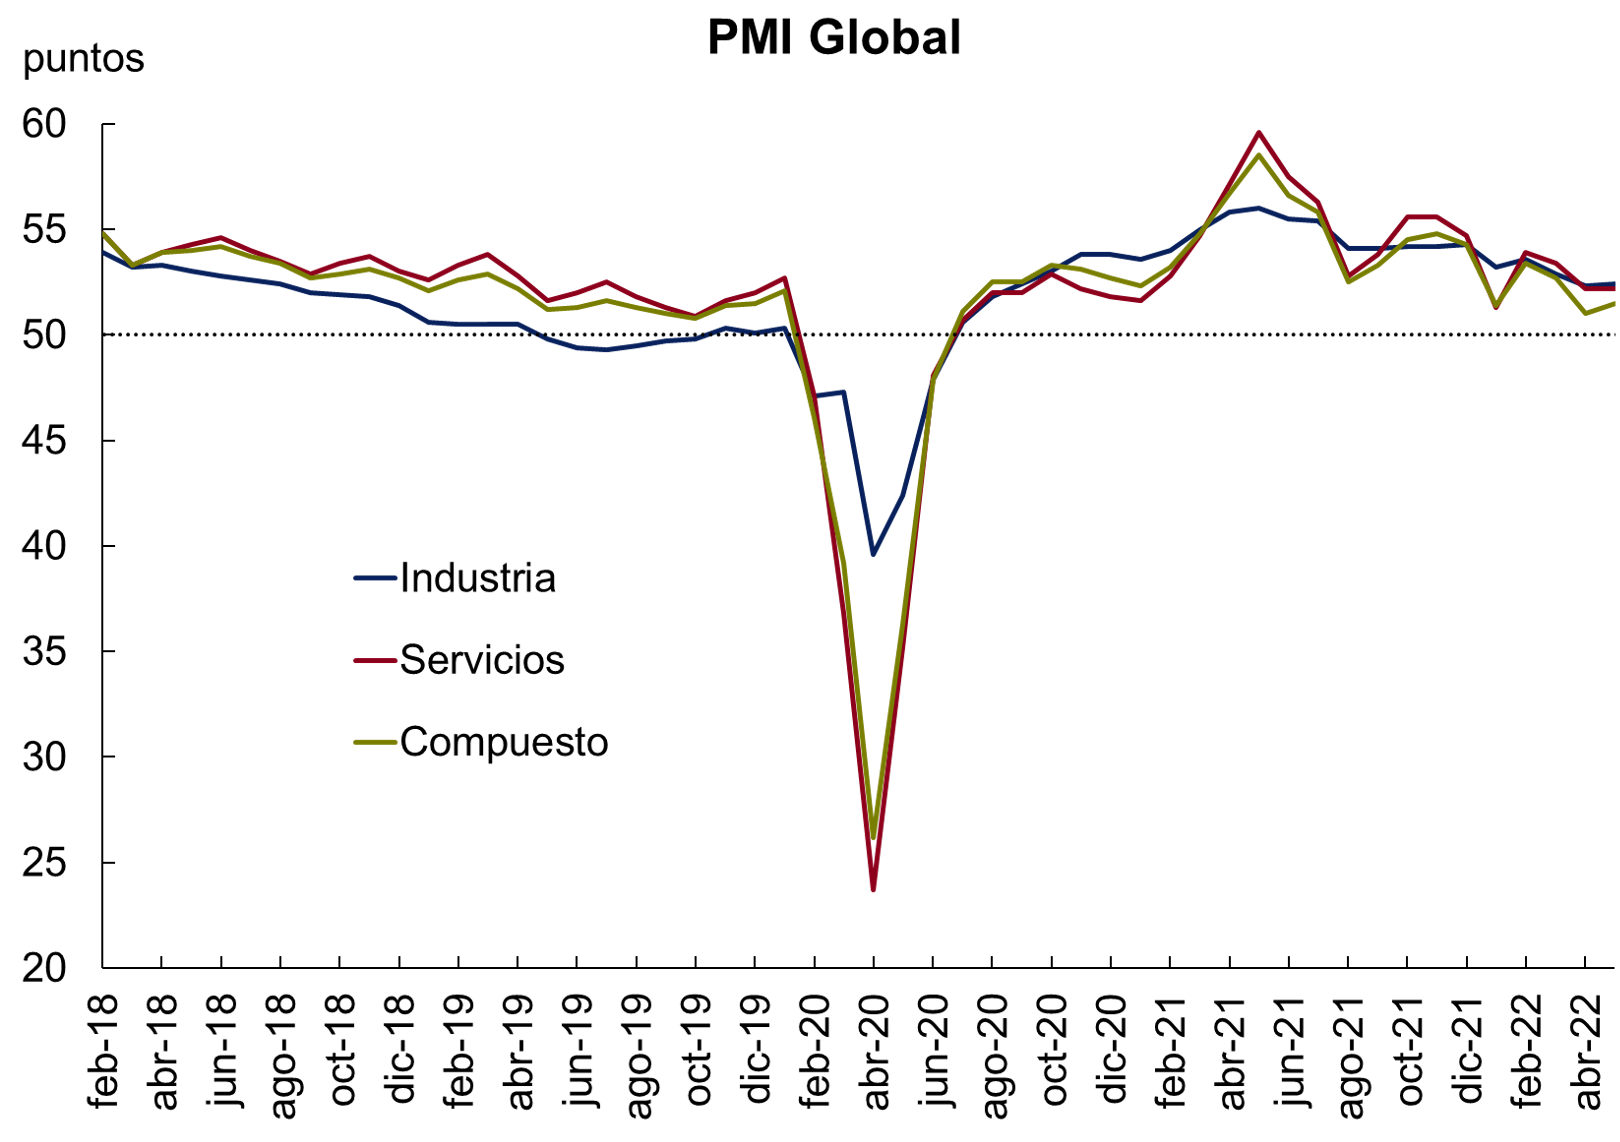

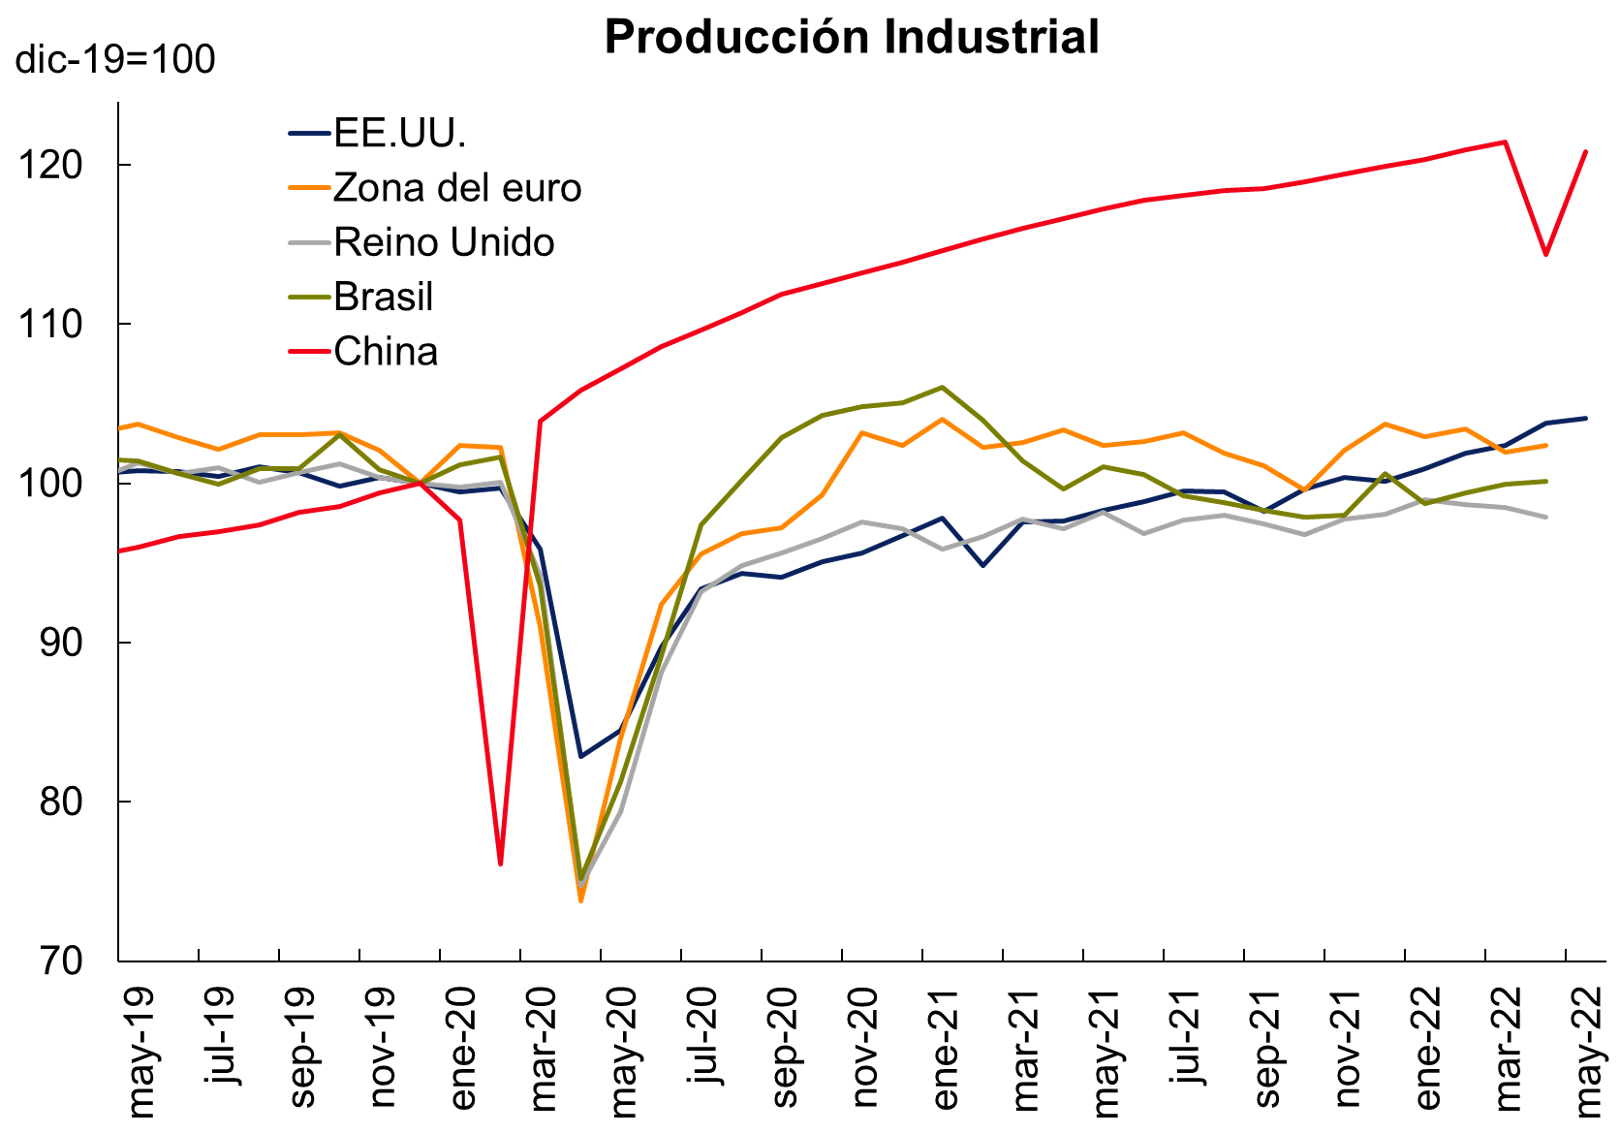

Source: BCRA based on data from IHS Markit, OECD, Trading Economics and Bloomberg.
Global growth forecasts continued to be lowered, although they still point to growth for this year. The IMF and World Bank lowered the global growth projection by 1 percentage point on average for 2022 (to 3.6% and 2.9%, respectively) and by 0.2 p.p. for 2023. This reflected the direct impact of the war in Ukraine and economic sanctions on Russia, with sharp contractions expected for these economies this year. The second largest contributor to the reduction in global growth was the European Union due to the indirect impact of the conflict. Growth forecast for China and the United States this year is also lower, reflecting the impact of COVID-0 restrictions on mobility and tighter monetary policy, respectively, while forecasts for only some commodity-exporting emerging economies improved (see Table 2.1). In particular, the strong downward correction of the growth of the U.S. economy for this year that the Fed presented after its June meeting (1.7% for 2022, down 2.3 p.p. compared to the forecast at the end of last year) was highlighted. Other bodies, such as the European Central Bank and the OECD, and the market consensus also agree with the lower optimism expected for global economic activity this year.
Table 2.1 | Economic activity projections 2022-2023

Source: IMF (WEO), World Bank, Reuters (market consensus) and other sources: OECD (world and China), ECB (euro area), Fed (United States), BCB – Focus Survey (Brazil). (1) April 2022. (2) May 2022.
2.3. Central banks are taking contractionary measures at a pace unprecedented in recent decades, in the face of rising inflation
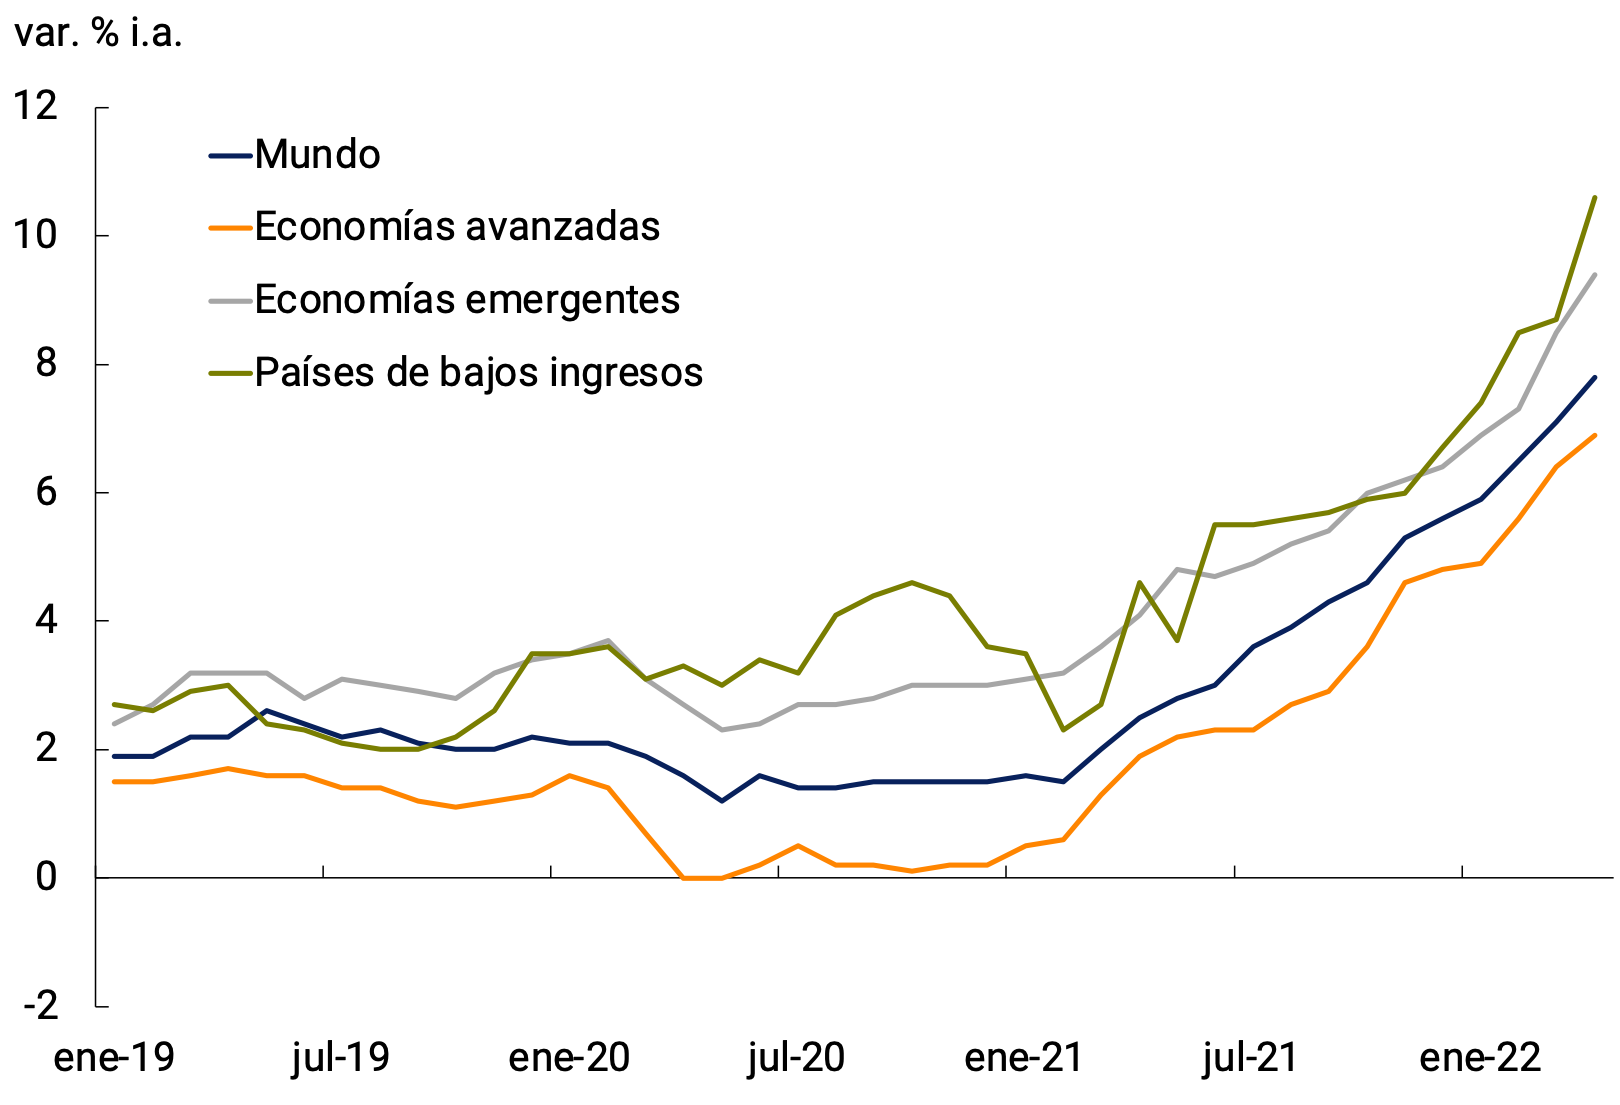
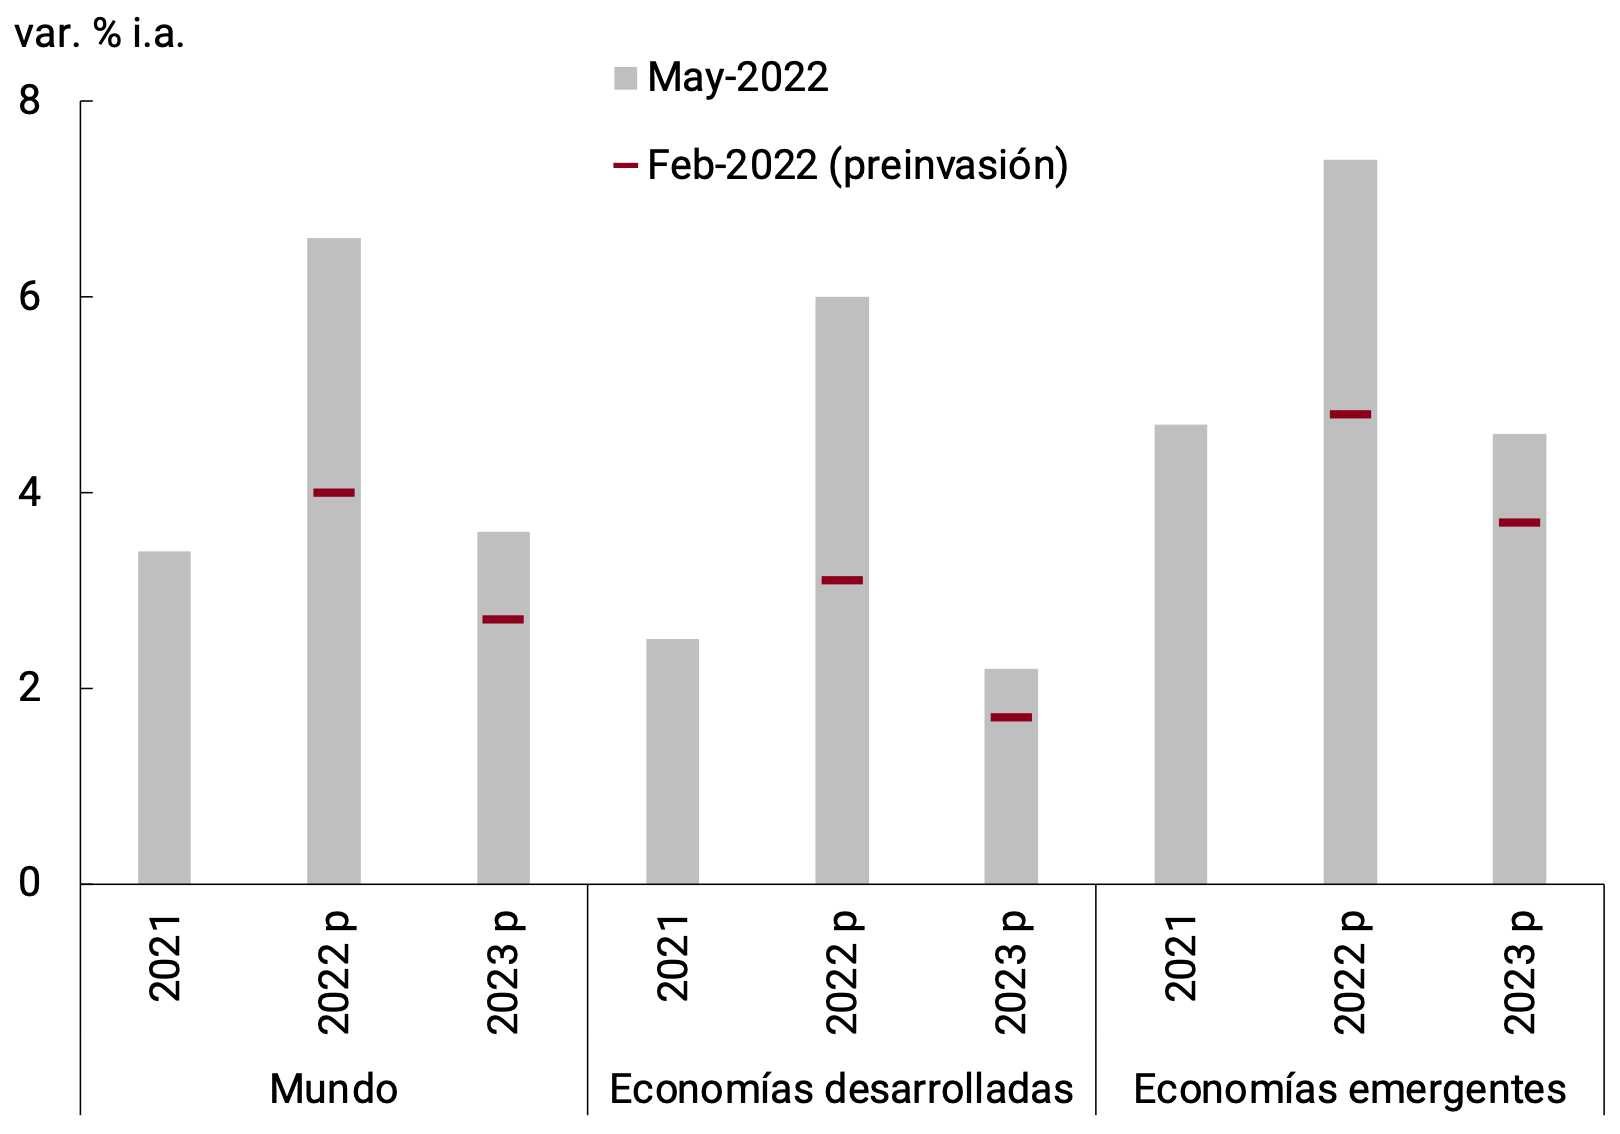
The war accentuated inflationary pressures, which have reached multi-decade records and in many cases several times above countries’ targets. Global inflation is estimated at 7.8% YoY in April; if it closed 2022 at that figure, it would be the highest value since 1996 (see Figure 2.5). In response, the most aggressive monetary policy rate hike (MPR) in recent decades was consolidated, first in developing economies, now in advanced economies. This impacts the whole world, but more so in developing countries because: 1) they are taking longer to recover; 2) food prices have a greater weight in their consumption baskets; 3) the rise in the MPR of developed countries presents the risk of capital outflows and depreciation of their currencies.
Figure 2.5 | Inflation rate by country group and inflation expectations
Source: World Bank.
p: Projected.
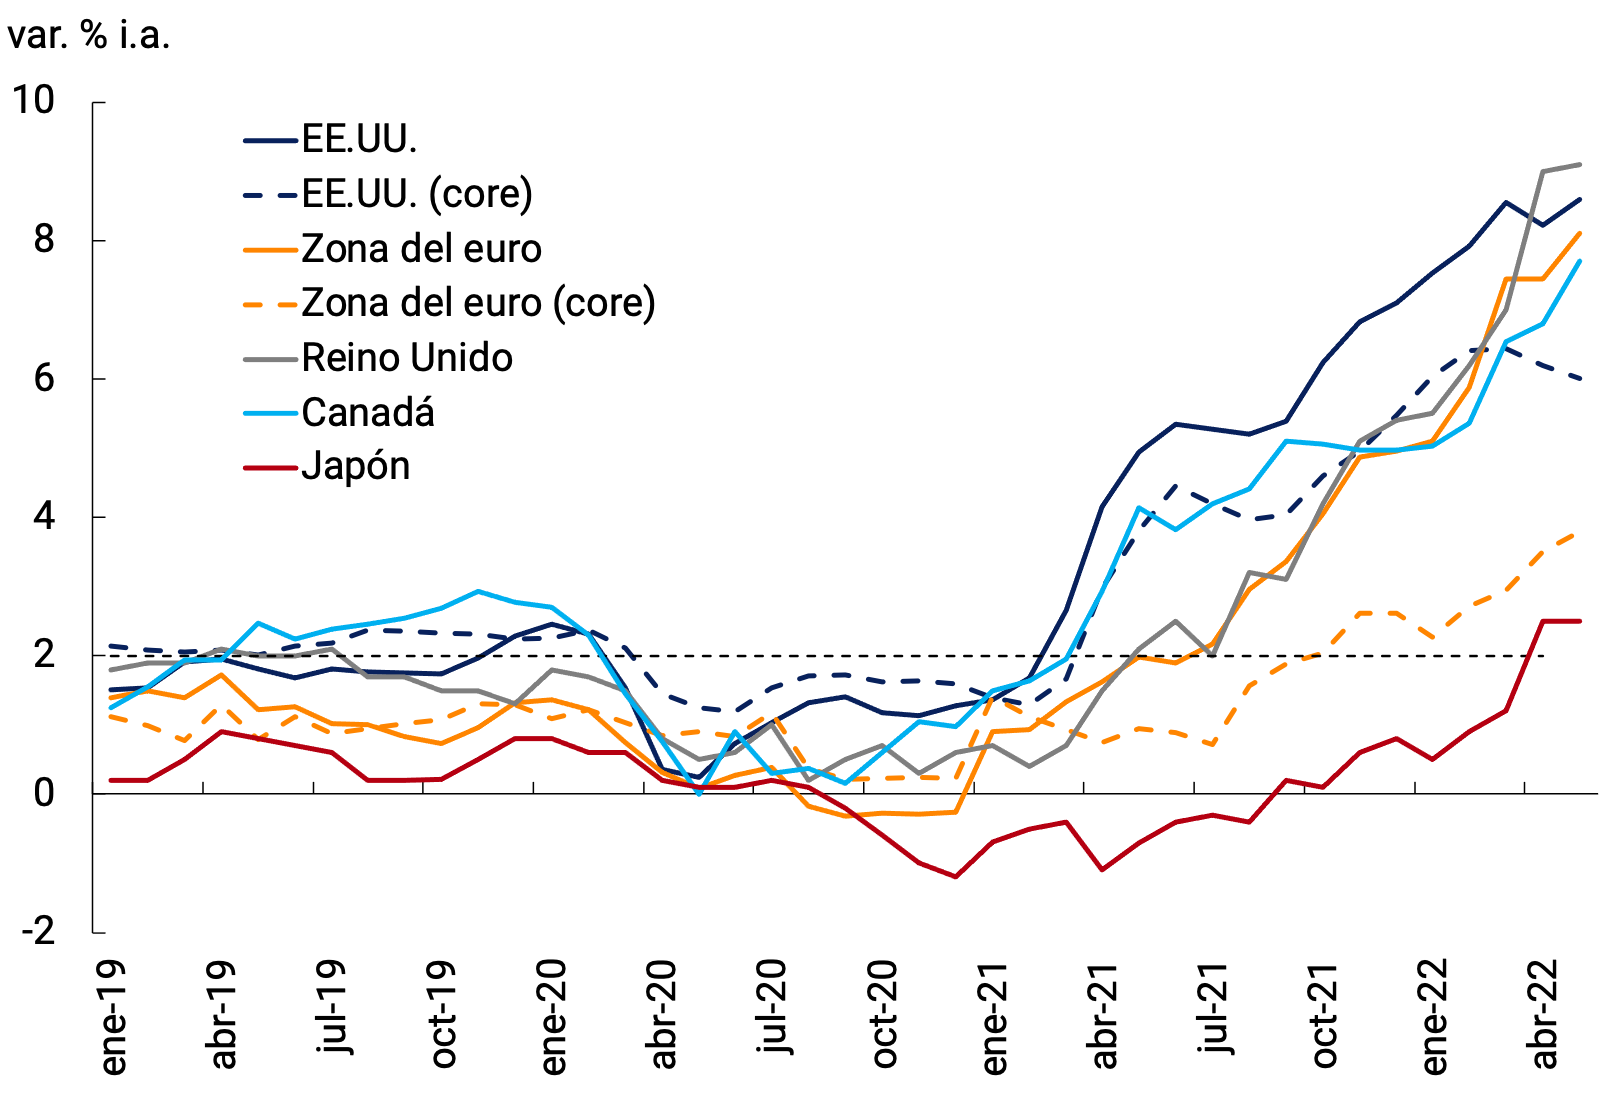
In the US, inflation rose to 8.6% in May (the highest rate since December 1981); in the euro area, to 8.1% (the highest rate since the emergence of the monetary union); in Canada, to 6.8% (the highest inflation since 1990) and 9.1% in England (an all-time high of the current measurement). Even Japan, with decades of low inflation, went from 1.1% deflation twelve months ago to 2.5% inflation in May (the highest since 2015). This dynamic is becoming more widespread beyond food and energy in the US and the euro area (see Figure 2.6).
Figure 2.6 | Inflation rates and monetary policy interest rates
Source: BCRA based on data from the respective central banks.
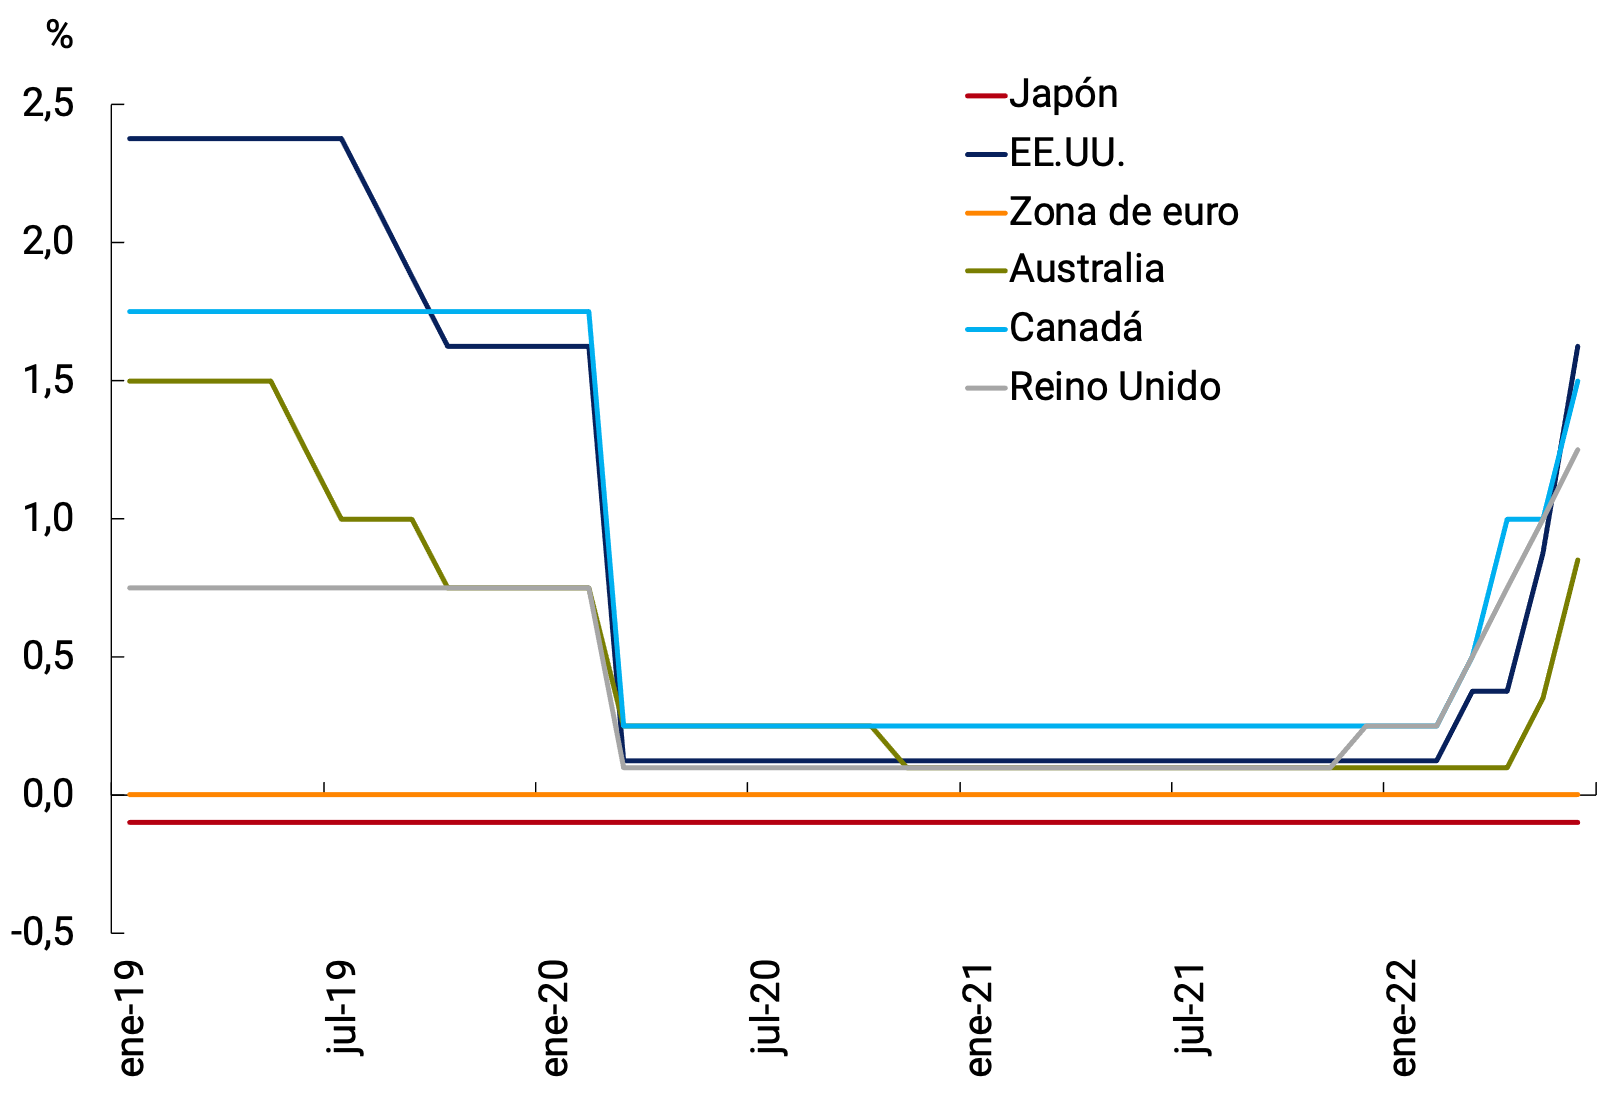
The monetary authorities of developed countries, which until a year ago had practically no increase in their policy interest rates (MPRs), changed their outlook in a very short time (see Figure 2.7a). The Fed increased its MPR by 1.5 p.p. so far in 2022; The last of these increases was 0.75 p.p., the first of such magnitude since the beginning of 1994. Moreover, according to the Fed’s own projections, increases of at least an additional 1.75 p.p. are expected (see Figure 2.7a). The latest market projections foresee an increase in the MPR of up to 3.2 p.p. in 2022, which, if materialized, would be the largest monetary contraction in ten months since 1989 (see Figure 2.7b).
Figure 2.7 | Fed Fed Funds Rate Target Projection
to. Fed projection
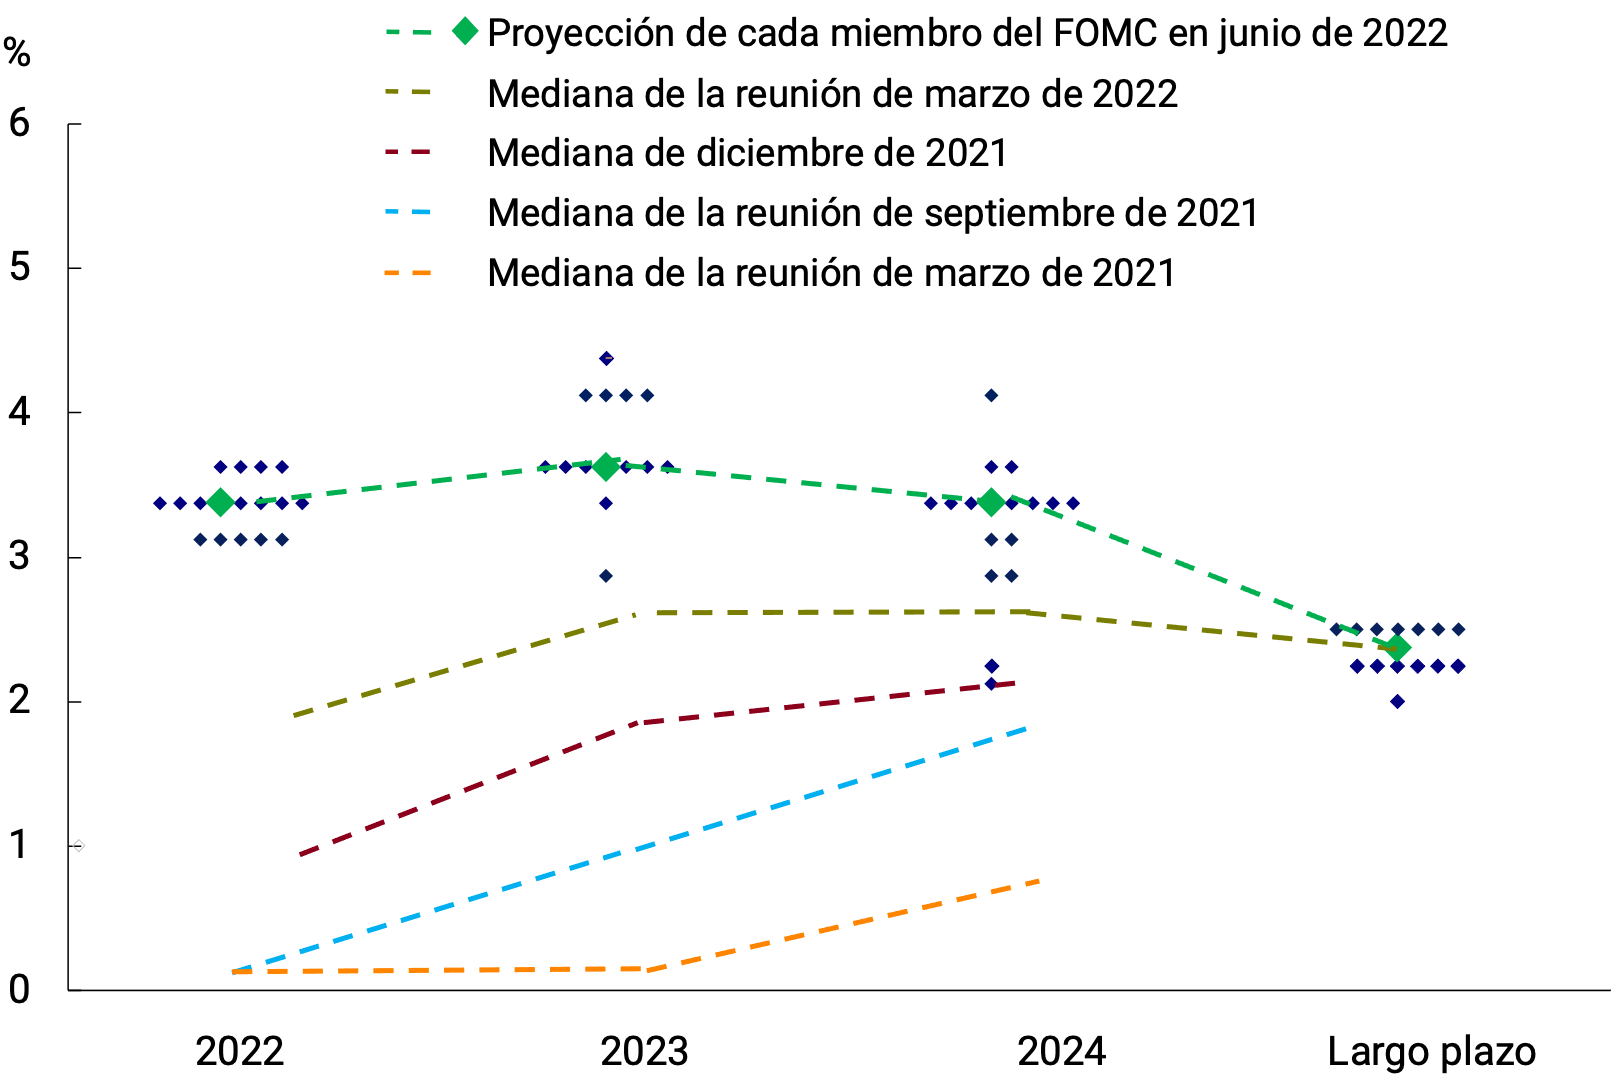
b. Market Projection
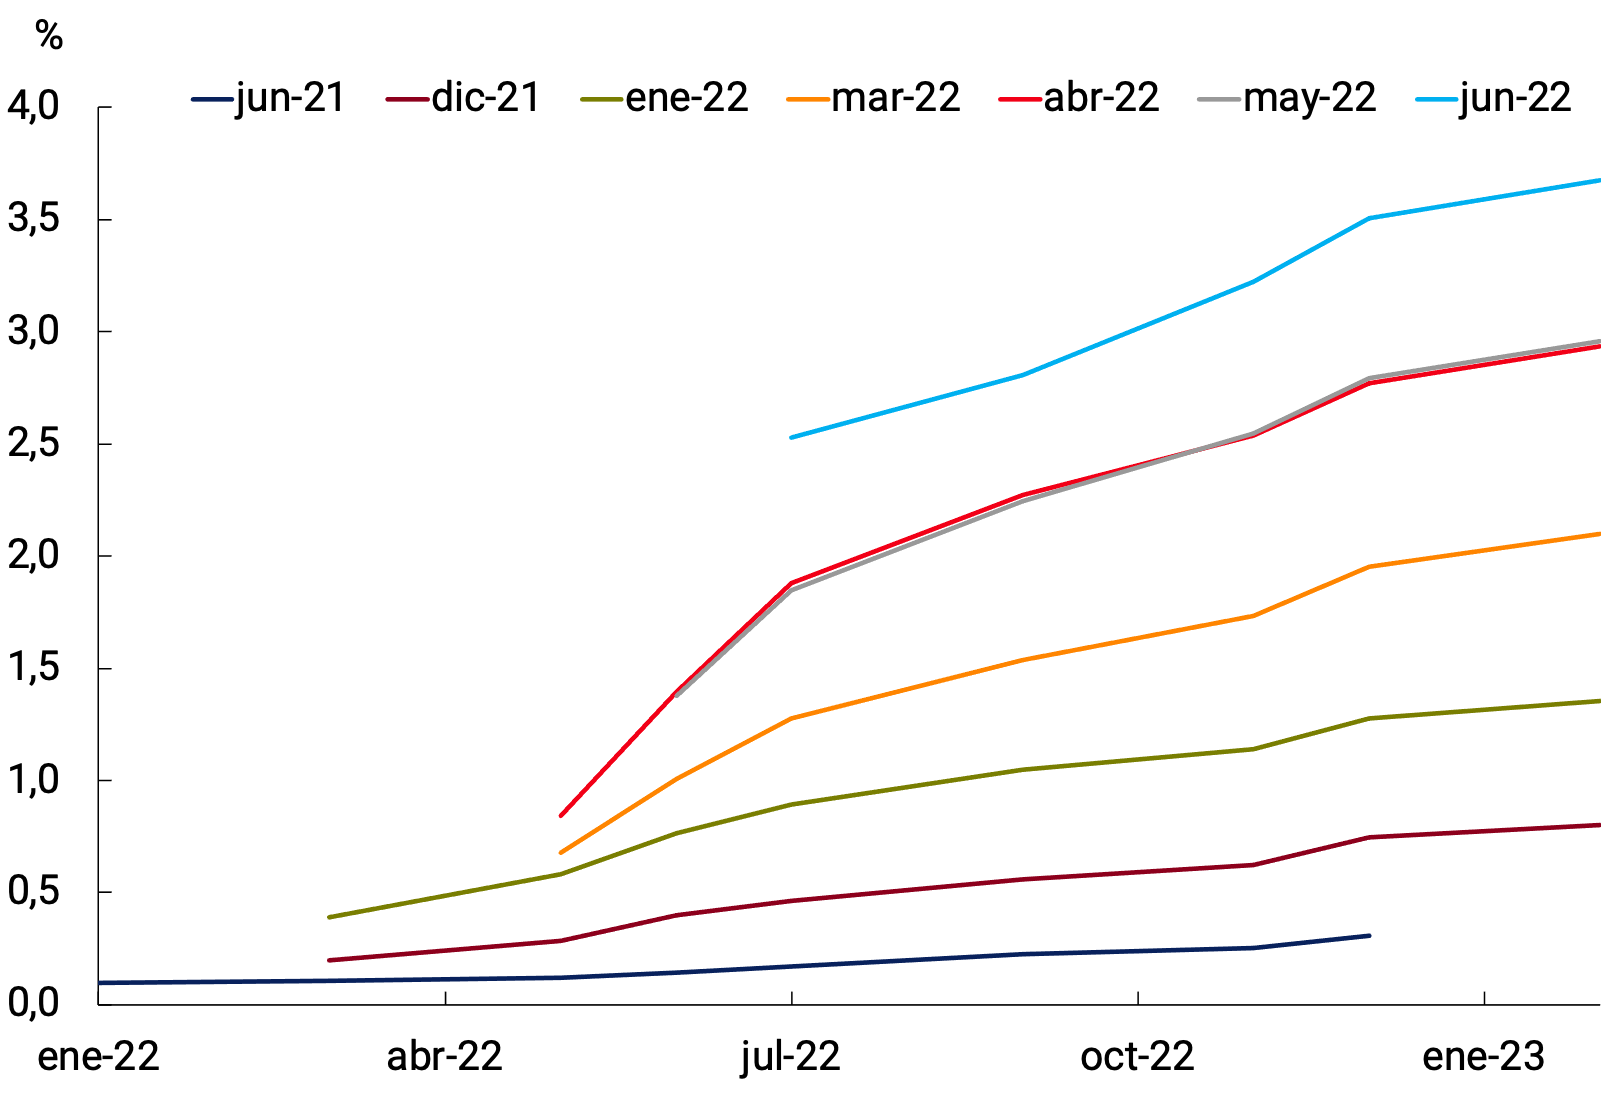
Source: BCRA based on data from the US Federal Reserve and Bloomberg.
In addition, since June of this year, the Fed has begun to reduce its assets on its balance sheet at a rate that will be at least three times higher than the previous reduction (since September, when the rate of reduction increases, see Figure 2.8). This would have repercussions on the liquidity of the U.S. Treasury bond market (and eventually the global one). Other developed countries also took (or will take) contractionary measures, in some cases well ahead of schedule until recently. The European Central Bank (ECB) will end its quantitative easing program in July and start raising rates in that month, it announced.
Figure 2.8 | U.S.

Federal Reserve Asset
Source: US Federal Reserve
Developing countries have also been recording inflation rates several times above their pre-war targets. In fact, in Latin America it has been at higher levels than the rest of the emerging countries. And the greater weight of food in the CPI basket in the region gives this rise a greater regressive bias (see Figure 2.9).
Figure 2.9 | Share of food in the CPI

baskets Source: official national statistical institutes.
Against this backdrop, major central banks in the region and other developing countries continued to raise MPRs, with record levels of increases in Brazil and Chile (see Figure 2.10). So did those of some East Asian economies that had so far kept MPRs unchanged, including India, South Korea, Singapore, the Philippines and Malaysia. The responses also included fiscal and revenue policy measures (see Section 1 / Fiscal measures against the inflationary impact of raw materials).
Figure 2.10 | Inflation rates and monetary policy interest rate

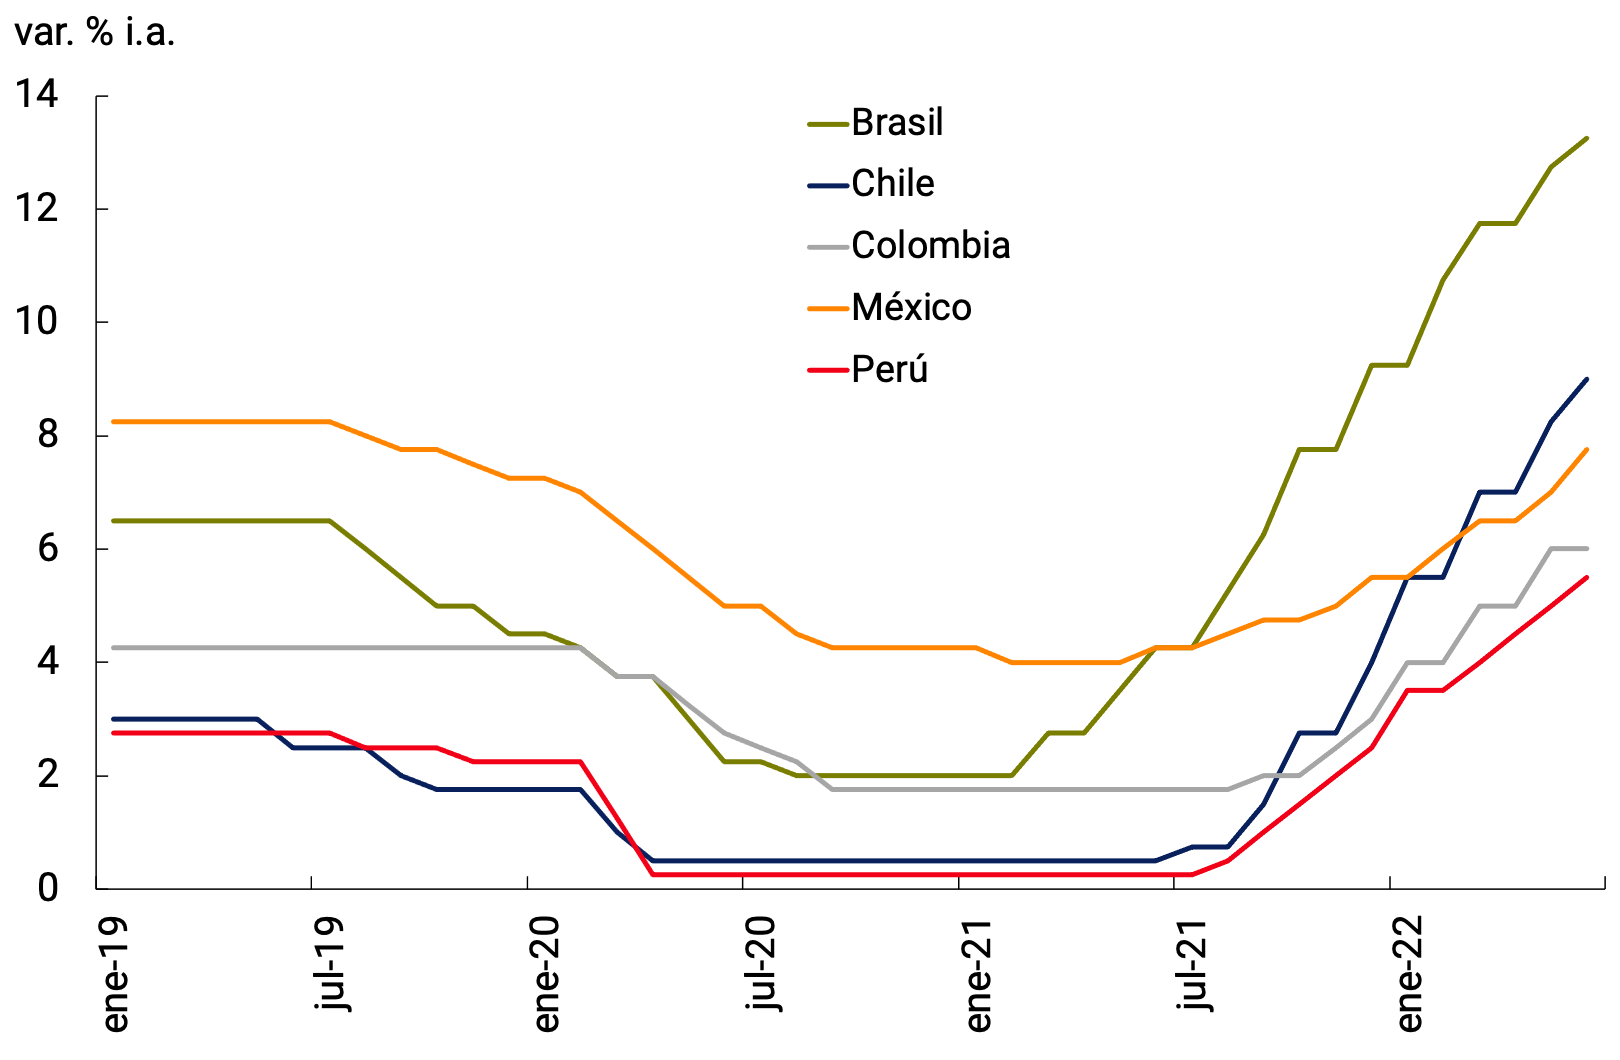
Source: BCRA based on data from official national statistics institutes and the Central Bank of Brazil.
Box. Real Exchange Rate and Commodity Price in Latin America
A key element for the inflationary and activity dynamics in Latin America will be the relationship between the exchange rate and commodity prices. During the “commodity supercycle” in the 2000s, higher commodity prices tended to be accompanied by an appreciation of the real exchange rate, softening the impact on inflation. However, during the pandemic, the opposite happened: higher commodity prices along with exchange rate depreciation (see Figure 2.11). It is unclear which of these effects will prevail in the near future: whether the exchange rate will offset or amplify the impact; and whether commodity prices will continue to rise due to supply disruptions or decline in the face of a more appreciated U.S. dollar.
Figure 2.11 | Commodity prices and real exchange rate in selected
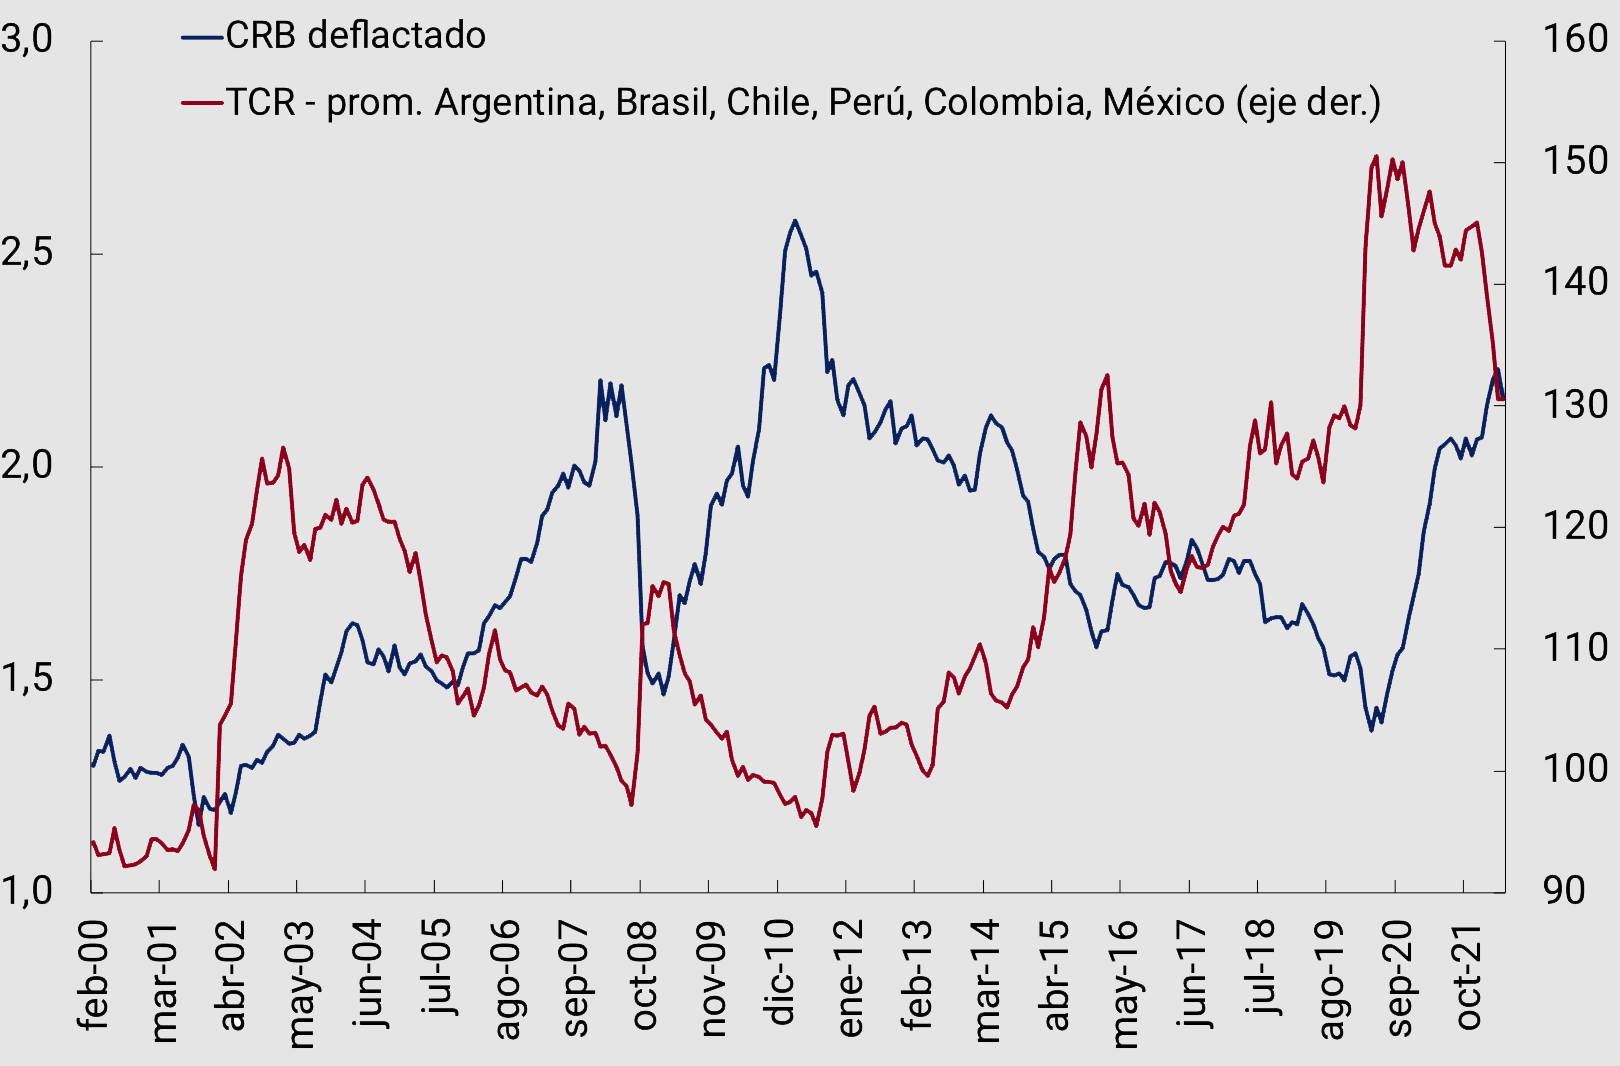
Latin American countries
Source: official national statistics institutes and Bloomberg.
Indeed, evidence shows that the U.S. dollar is inversely correlated with commodity prices. In this way, commodity-exporting countries are simultaneously affected through trade and financial channels, through higher international interest rates, lower global liquidity, and appreciation of the U.S. dollar, all of which tend to increase the sovereign spreads of emerging economies, and weaken commodity prices at the same time (Bastourre, Carrera et al., 2012). This last effect must be weighed against the impact on commodity prices of the war.
2.4. Global financial conditions tighten
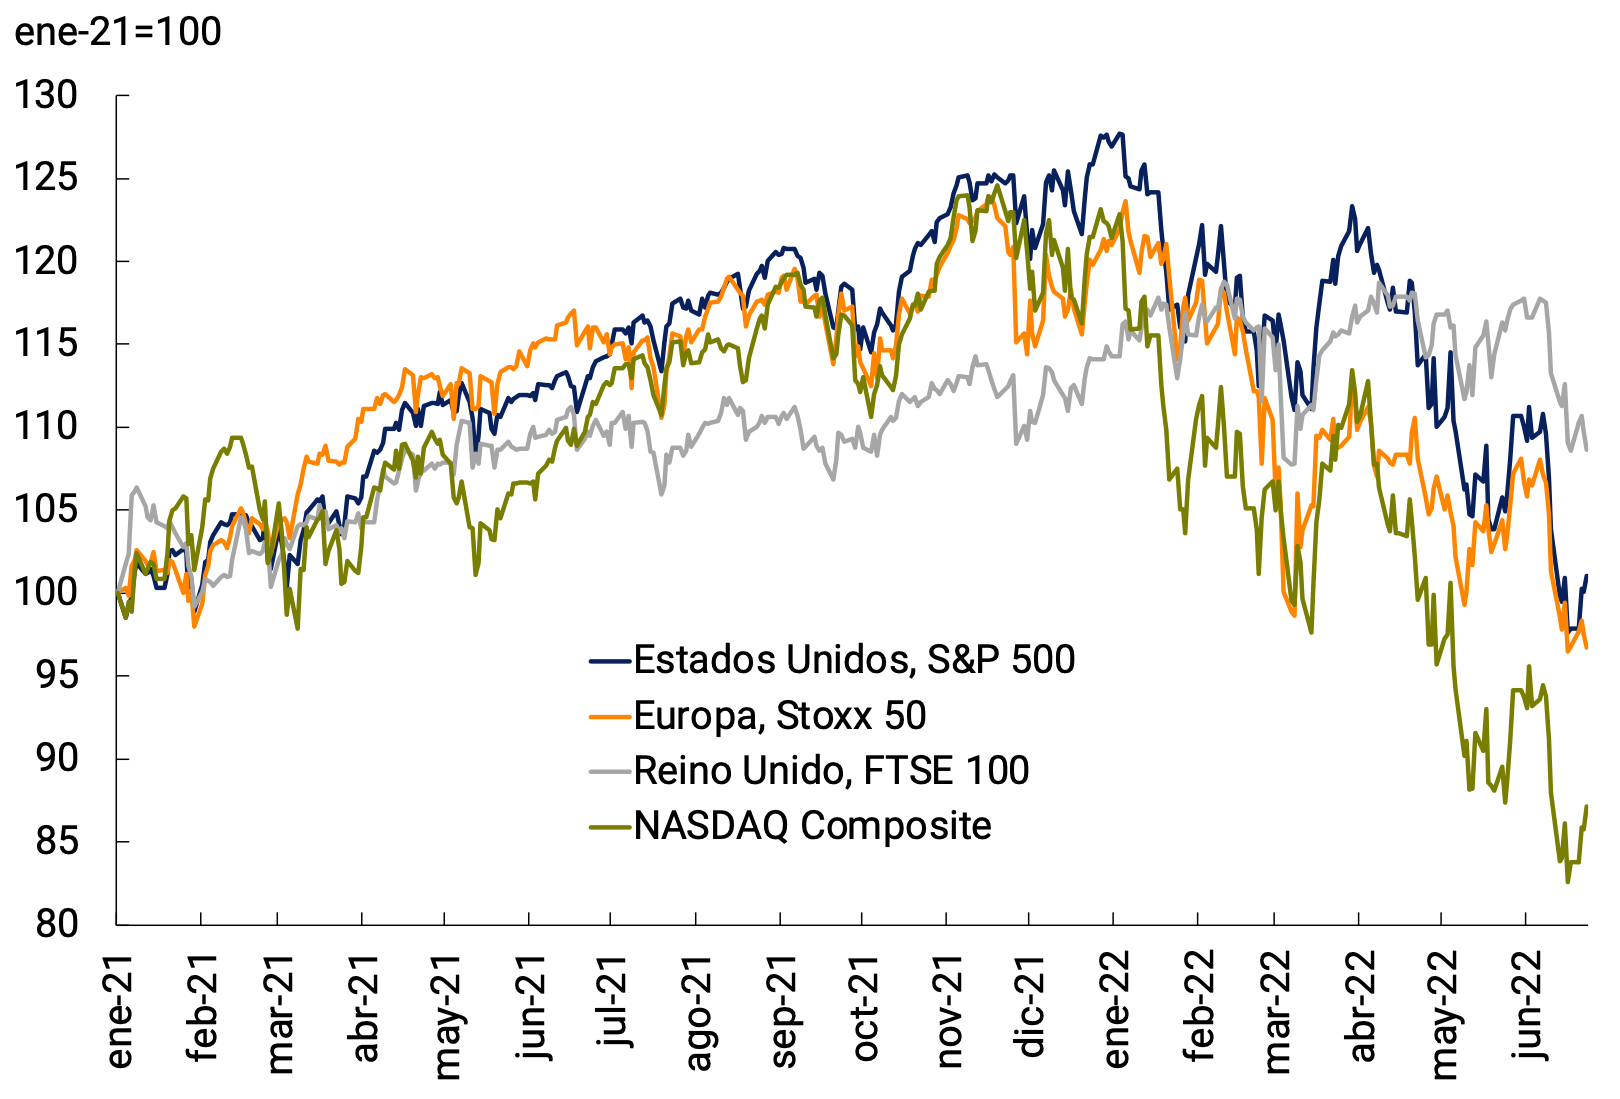
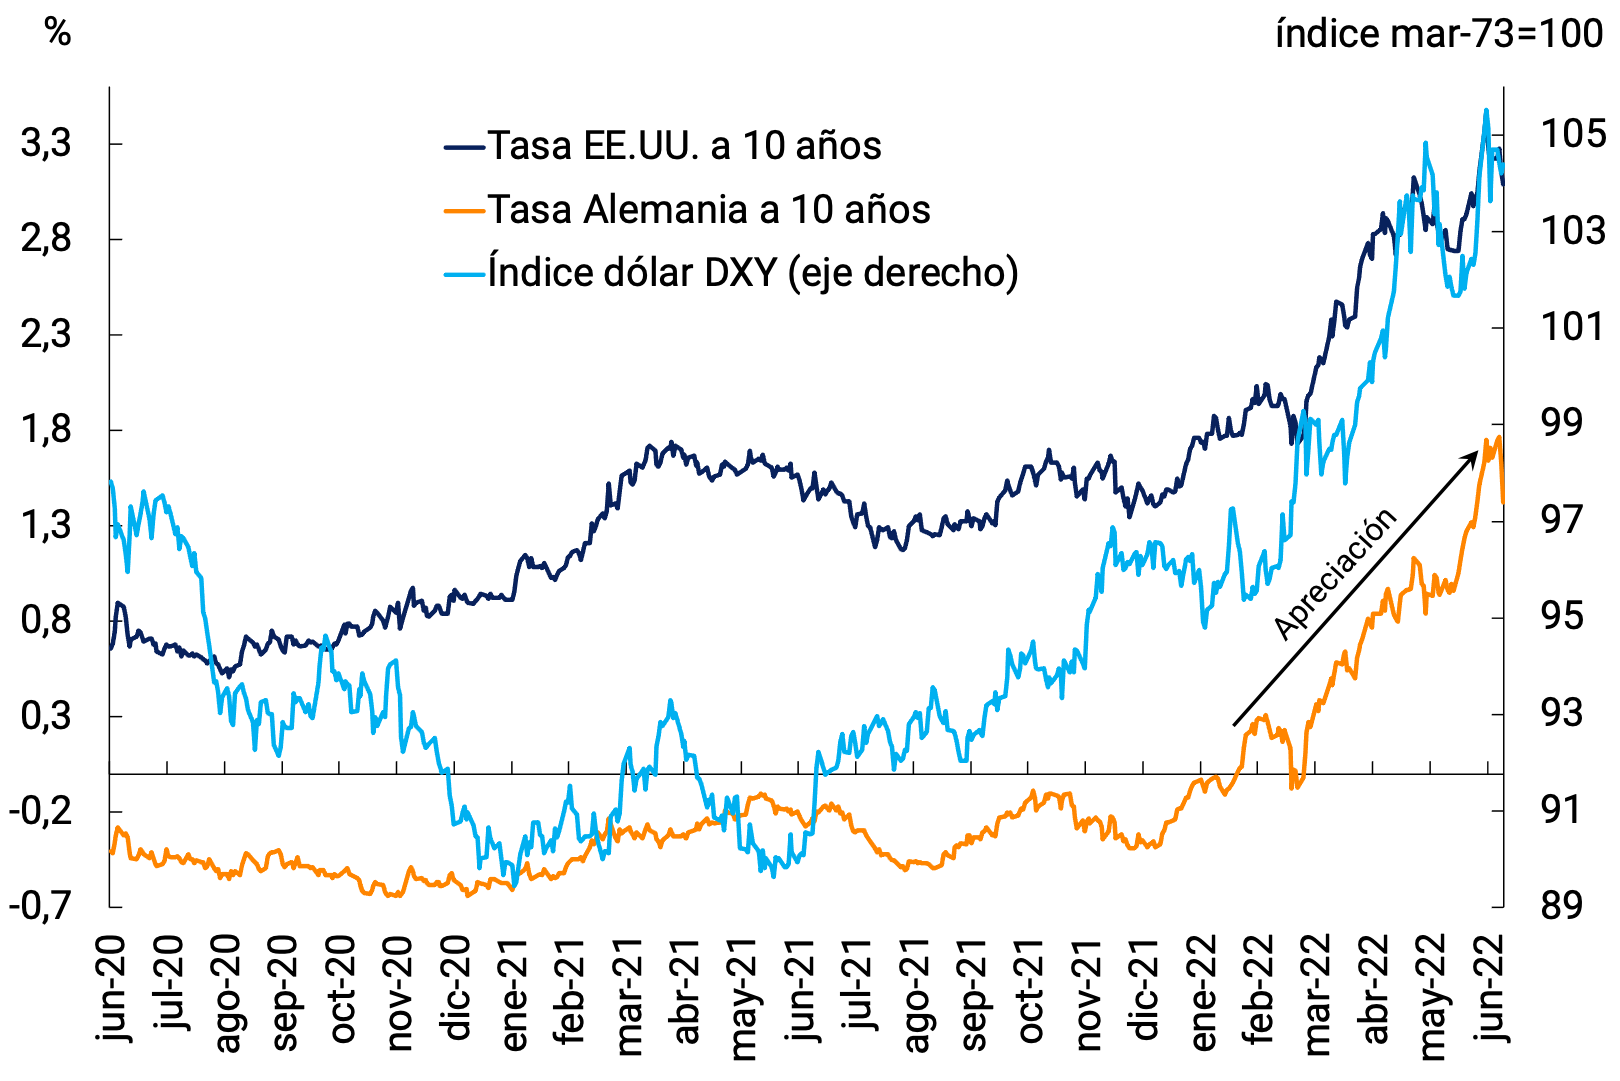
The aggressive increases in the MPR had an impact on bonds, stocks and currencies. On the one hand, the rates of government bonds of advanced countries rose. The 10-year U.S. Treasury bond rate rose sharply to more than 3 percent (see Figure 2.12b), up 158 basis points for the year. The German 10-year bond rate has also risen. Meanwhile, the prices of riskier assets such as stocks continued to fall and, particularly, those of technology companies, which had had more significant increases in recent years. Thus, the S&P 500 is 21% below the maximum and the Nasdaq, with a greater component of technology companies, is 30% below. In Europe, the Stoxx 50 loses 20% of its value for the year (see Figure 2.12a).
In addition, the positive policy rate differential between the United States and the other advanced countries favored the movement of funds to the United States. The multilateral dollar appreciated by about 6% from the previous IPOM (see Figure 2.12b), while the euro and, especially, the yen registered their lows in decades.
Figure 2.12 | Asset
marketsa. Stock
indicesb. Yields on government securities and dollar index
Source: BCRA based on Bloomberg data.
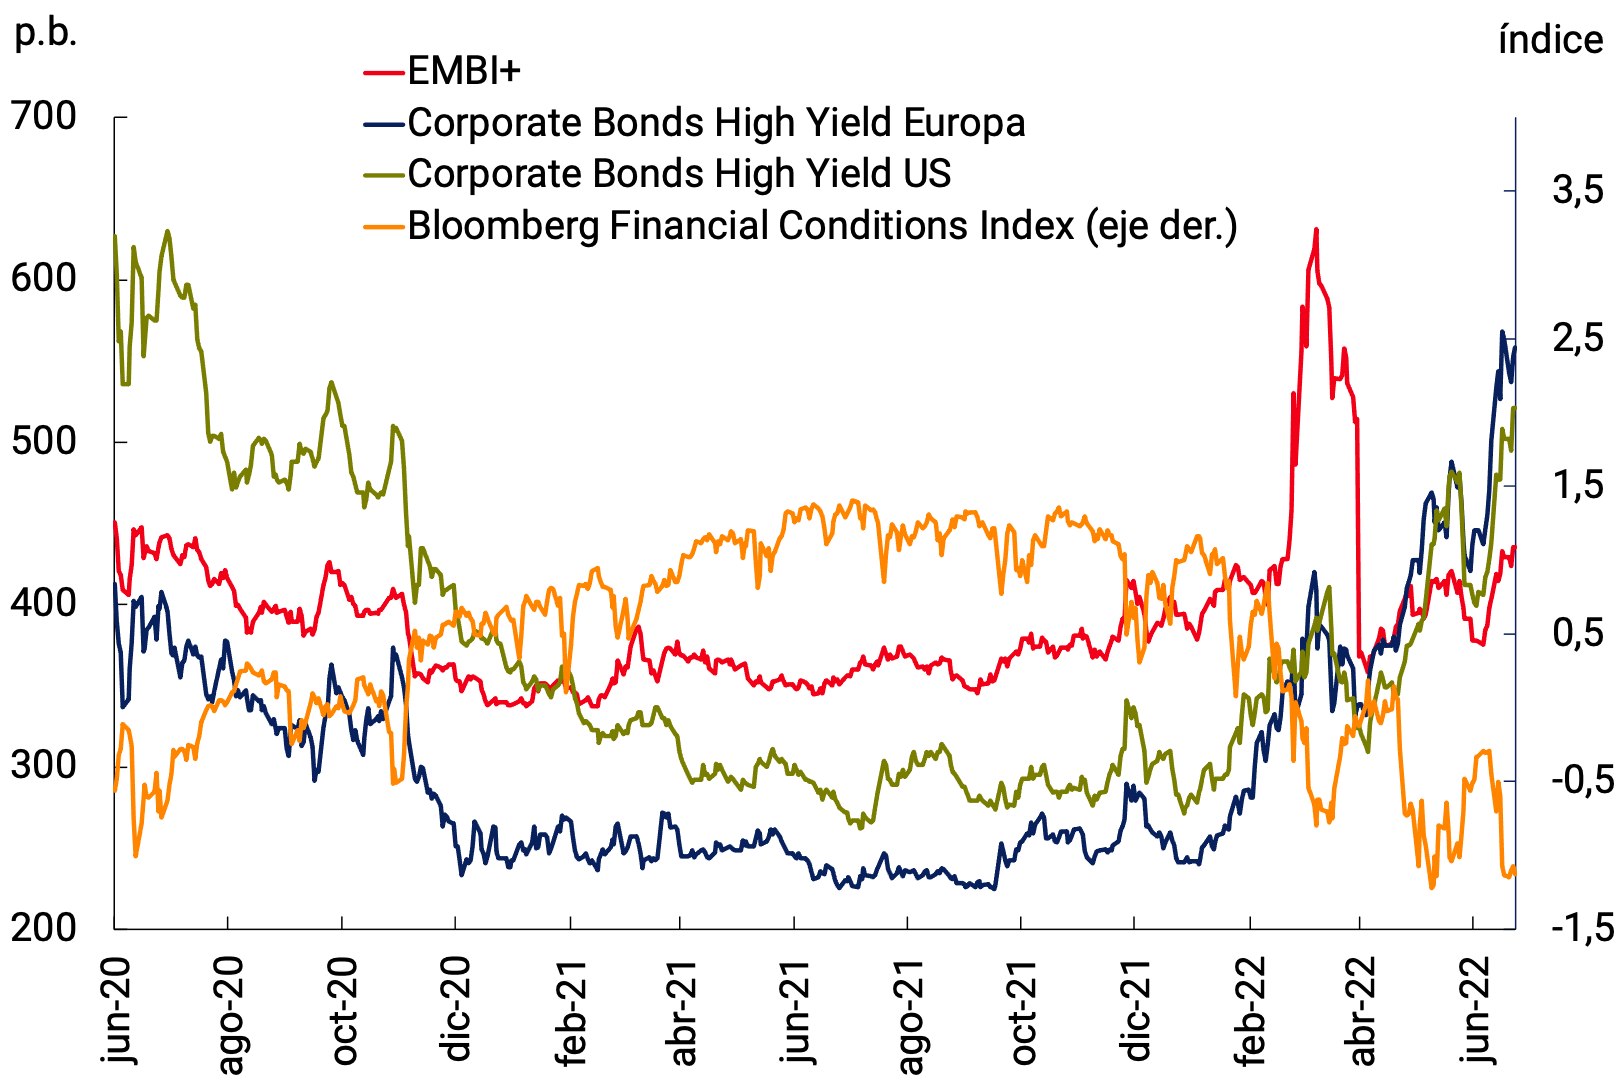
The effects of the war in Ukraine and mobility restrictions in China put further downward pressure on risk assets. Along with a sharp decline in the Financial Conditions Index in the United States (see Figure 2.13a), both interest rates on high-yield corporate bonds in advanced countries and spreads on sovereign bonds in emerging countries rose. Capital flows to emerging countries have suffered outflows since the beginning of the war (although with a period of inflows during mid-March and early April). All of this implies more unfavourable financial conditions for emerging and developing countries.
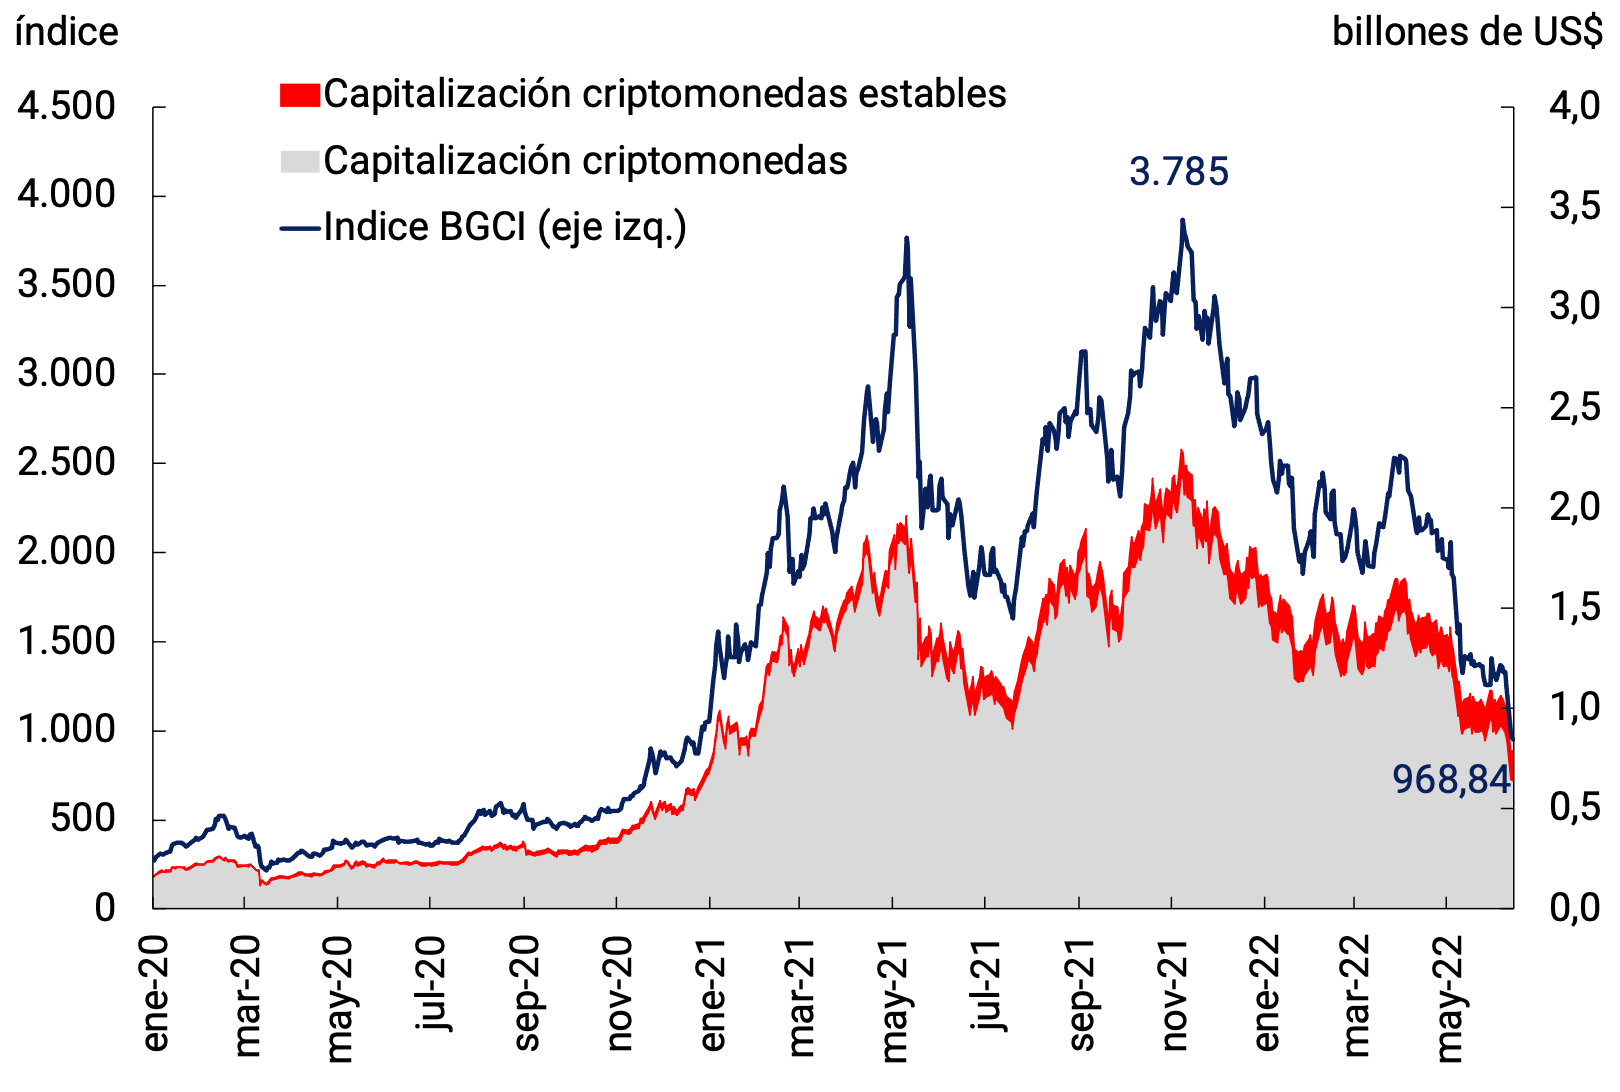
With the fall in risk assets, cryptocurrencies also suffered falls, showing that they are not “safe haven assets”. The market capitalization of eight cryptocurrencies and four “stablecoins” has shrunk by 70% since mid-November; while the prices of these assets are 75% lower (see Figure 2.13b)2.
Figure 2.13 | Asset Markets
to. Risky Asset Returns
Source: BCRA based on Bloomberg data.
b. Cryptocurrencies
Source: BCRA based on data from Bloomberg and CoinMetrics.
2.5. Commodity prices continue to rise, impacting the currencies of their exporters
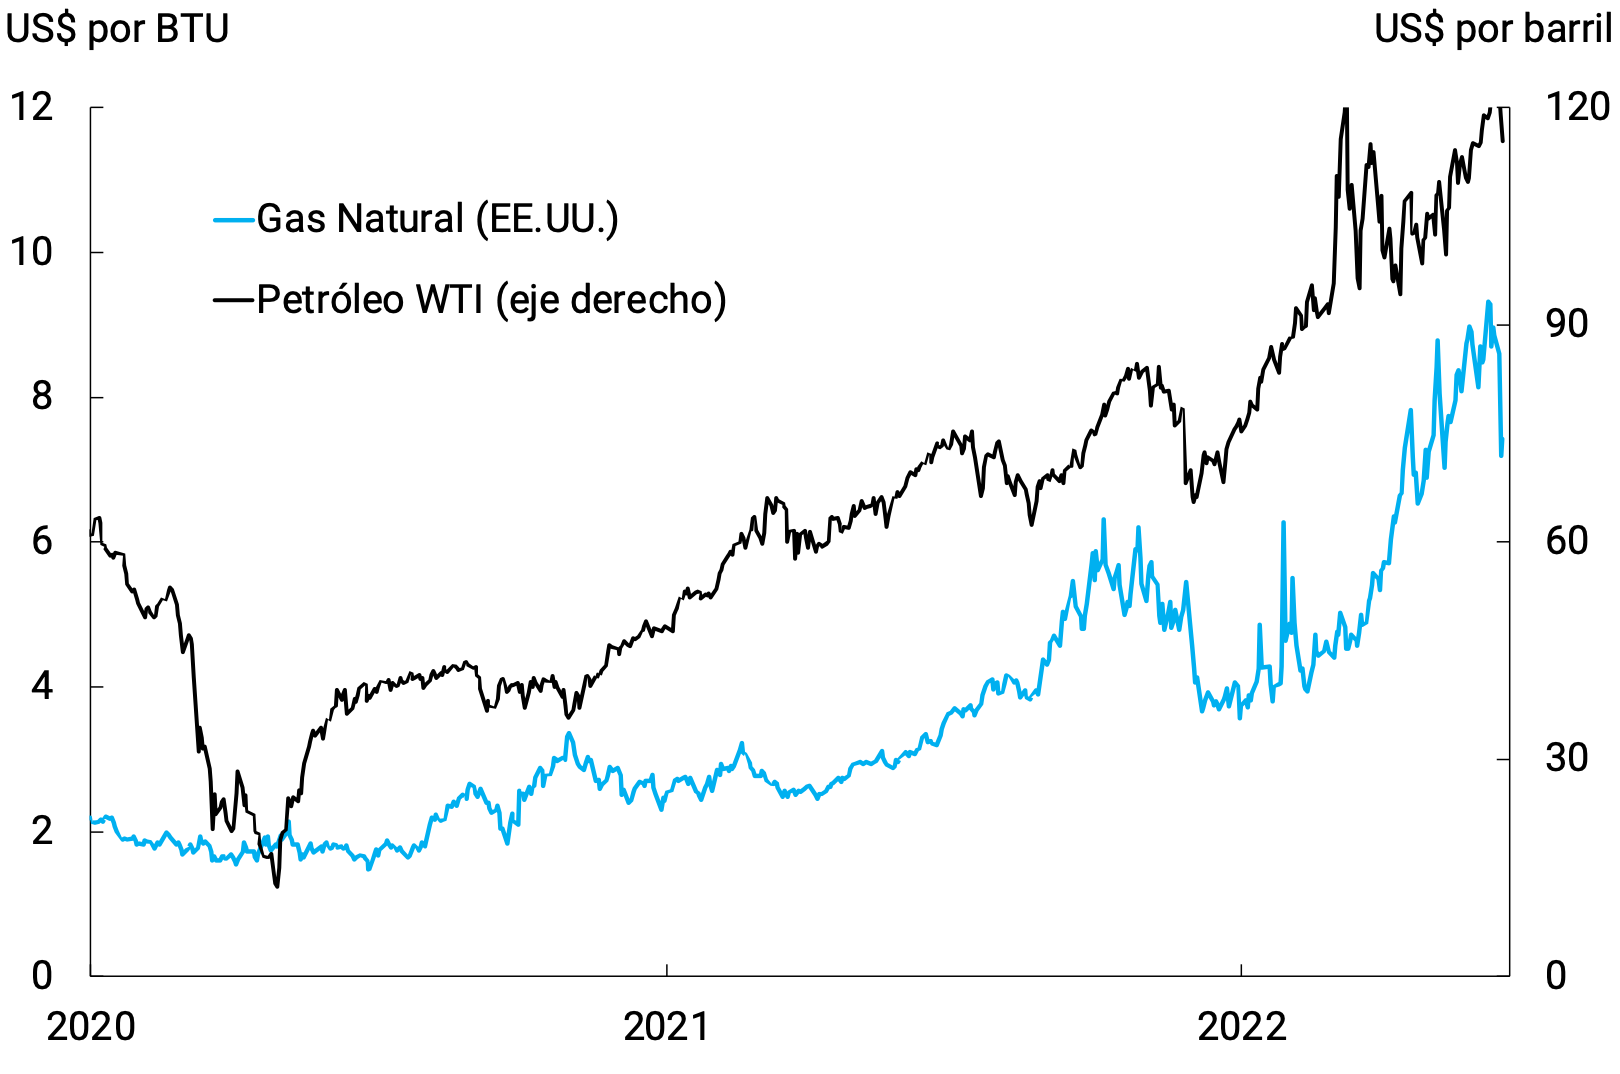
The sanctions imposed on Russia continued to have a strong impact on both the level and volatility of the price of oil, which reached US$119 per barrel on June 8 (WTI). At the end of May, the European Union agreed to ban the import of Russian oil, starting in December on crude oil and two months later on refined products: it bans all crude oil that arrives by ship and leaves out those that arrive by pipeline, thus reaching almost 90% of the oil imported from Russia. The price of gas was also affected after Russia imposed payment for gas in rubles instead of euros. Several European countries saw their supplies cut off during April and May as they did not meet the requirement. Thus, gas imports from the US grew, reaching a price of US$9.45 per BTU, the highest in 14 years (see Figure 2.14).
Wheat continued to feel the impact of the conflict: approximately 20 million tons of Ukrainian grain have accumulated in ports since shipping was halted. In addition, India vetoed wheat exports. Currently, it is trading at around US$370 per tonne, almost 20% above pre-conflict prices. Soybeans rose to US$649 per tonne on June 9, a 14-year high. Indonesia’s decision to ban the export of palm oil also affected the price of soybeans and currently stands at around US$600 per tonne (see Figure 2.14).
Figure 2.14 | Energy and food raw materials

Source: BCRA based on Bloomberg data.
The currencies of emerging countries have faced differentiated situations according to their status or not as exporters of raw materials. Those of countries such as Brazil, Peru, Mexico, and Colombia (mainly commodity exporters) performed better than those of Eastern European nations and oil-importing countries in Asia.
The main Latin American currencies had been appreciating since the end of last year (gray bars in Figure 2.15). After the beginning of the conflict and depending on whether or not the country was an exporter of energy-related commodities, differentiated effects were noted compared to other emerging countries (blue bars). Subsequently, when a more aggressive view of the Fed’s rate hike was consolidated, most of the countries in the sample faced depreciating pressures.
Figure 2.15 | Evolution of the currencies of selected

emerging countries
Source: BCRA based on Bloomberg data.
2.6. In summary
The global economy is feeling the simultaneous impact of the war, the evolution of the pandemic and the more aggressive interest rate hike cycle. For emerging and developing economies, the latter implies more adverse global financial conditions and the risk of increased capital outflows. A key dilemma for Latin America is whether a combination of higher commodity prices coupled with pressures on the appreciation of its currencies will prevail; or the impact of the rate hike in central countries, with downward pressure on commodity prices and currency depreciation. The first case would imply a more favorable growth and inflation trajectory than the second. In any case, several of Argentina’s trading partners would show lower growth this year than expected a few months ago.
3. Economic Activity and Employment
In the first quarter of 2022, economic activity continued to strengthen the process of economic reactivation and growth that began in 2021, after the progressive normalization of social mobility, and continued to operate at levels higher than pre-pandemic levels. This growth took place even in the context of a third wave of COVID-19 in the country, with limited and transitory impacts on the level of activity given the progress of the vaccination process and in a context of accelerating inflation affected by adverse weather conditions in the country and by sharp increases in international prices. This improvement in economic activity was accompanied by a recovery in total registered employment which, although it continued to present some sectoral heterogeneity, its level is at an all-time high.
In this context, the National Government continued to implement policies aimed at economic growth, promoting strategic sectors to enhance production chains, the modernization of industry and the promotion of regional economies in order to increase exports. Likewise, in the face of higher inflation – particularly in food – the National Government temporarily implemented income reinforcement measures, mainly aimed at the most vulnerable sectors. For its part, the BCRA continued to contribute to the growth process through the extension of credit lines linked to productive development (LFIP), through which it seeks to stimulate production.
With data for the first quarter, economic activity has a statistical drag of 4.1 percentage points of growth for this year. The BCRA expects that the services that were most affected by the pandemic will continue to recompose their activity levels. However, in the second quarter the Product will show a fall compared to the first due to the impact of the drought conditions that affected the main soybean and corn producing areas during the summer, with indirect effects on other sectors associated with this activity. The evolution of GDP during the rest of the year will continue to be conditioned by the risks associated with a less favourable international scenario and tensions in the energy market, while new epidemiological threats at the global level cannot yet be ruled out.
3.1. In the first quarter of 2022, domestic demand continued to increase, mainly explained by greater dynamism in private consumption
In the first quarter of 2022, GDP increased 0.9% qoq s.e. (6% y.o.y.) and was 4.4% s.e. above its level in the last quarter of 2019 (see Figure 3.1). Domestic demand – total domestic expenditure on consumption and investment, measured at constant 2004 prices – exceeded its pre-pandemic level by 10.5% s.e. and increased 2.9% quarter-on-quarter s.e., mainly due to the performance of private consumption, which recovered 3.2% quarter-on-quarter (9.3% y.o.y.) and contributed 2.2 p.p. to the variation in output, while public consumption increased 0.7% s.e. (6.5% y.o.y.). Investment5 continued to show great dynamism and registered a 3.3% quarter-on-quarter increase (12.7% y.o.y.). For its part. External demand for goods and services, at constant prices, decreased by 2.3% quarter-on-quarter to 9.3% y.o.y., while imports increased by 7.6% qoq-o-y (28.1% y.o.y.; see Chart 3.2). Thus, the external sector had a negative contribution to the seasonally adjusted quarterly variation of GDP of 2.4 p.p. during the first quarter.
Figure 3.1 | GDP and components of demand

Source: BCRA based on INDEC data.
The Investment Rate (measured at constant prices and seasonally adjusted) stood at 20.9%, the highest level since II-18 and above the 17.2% average of 2019. The recovery of investment after the shock caused by Covid-19 was mainly explained by the increase in real expenditure on Durable Production Equipment, which accumulated a 60.5% increase since IV-19 in seasonally adjusted terms, representing 59% of total investment in I-22. Investment in construction, on the other hand, accumulated an increase of 16.8% s.e. in the same period (see Figure 3.2).
Figure 3.2 | Investment levels and rate

Source: BCRA based on INDEC data.
It is expected that, in line with the information on the commercial exchange of goods from INDEC available as of May, for the second quarter the negative impact of net exports of goods and services on the quarterly variation of the Product will be reduced. It should be noted that, with data up to May, the quantities exported of goods registered a monthly fall (-3.3% s.e.) while the imported volumes of goods increased 0.3% in seasonally adjusted terms (see Chapter 4. External Sector).
3.2. Among the productive sectors, services were the ones with the greatest contribution to growth so far in 2022
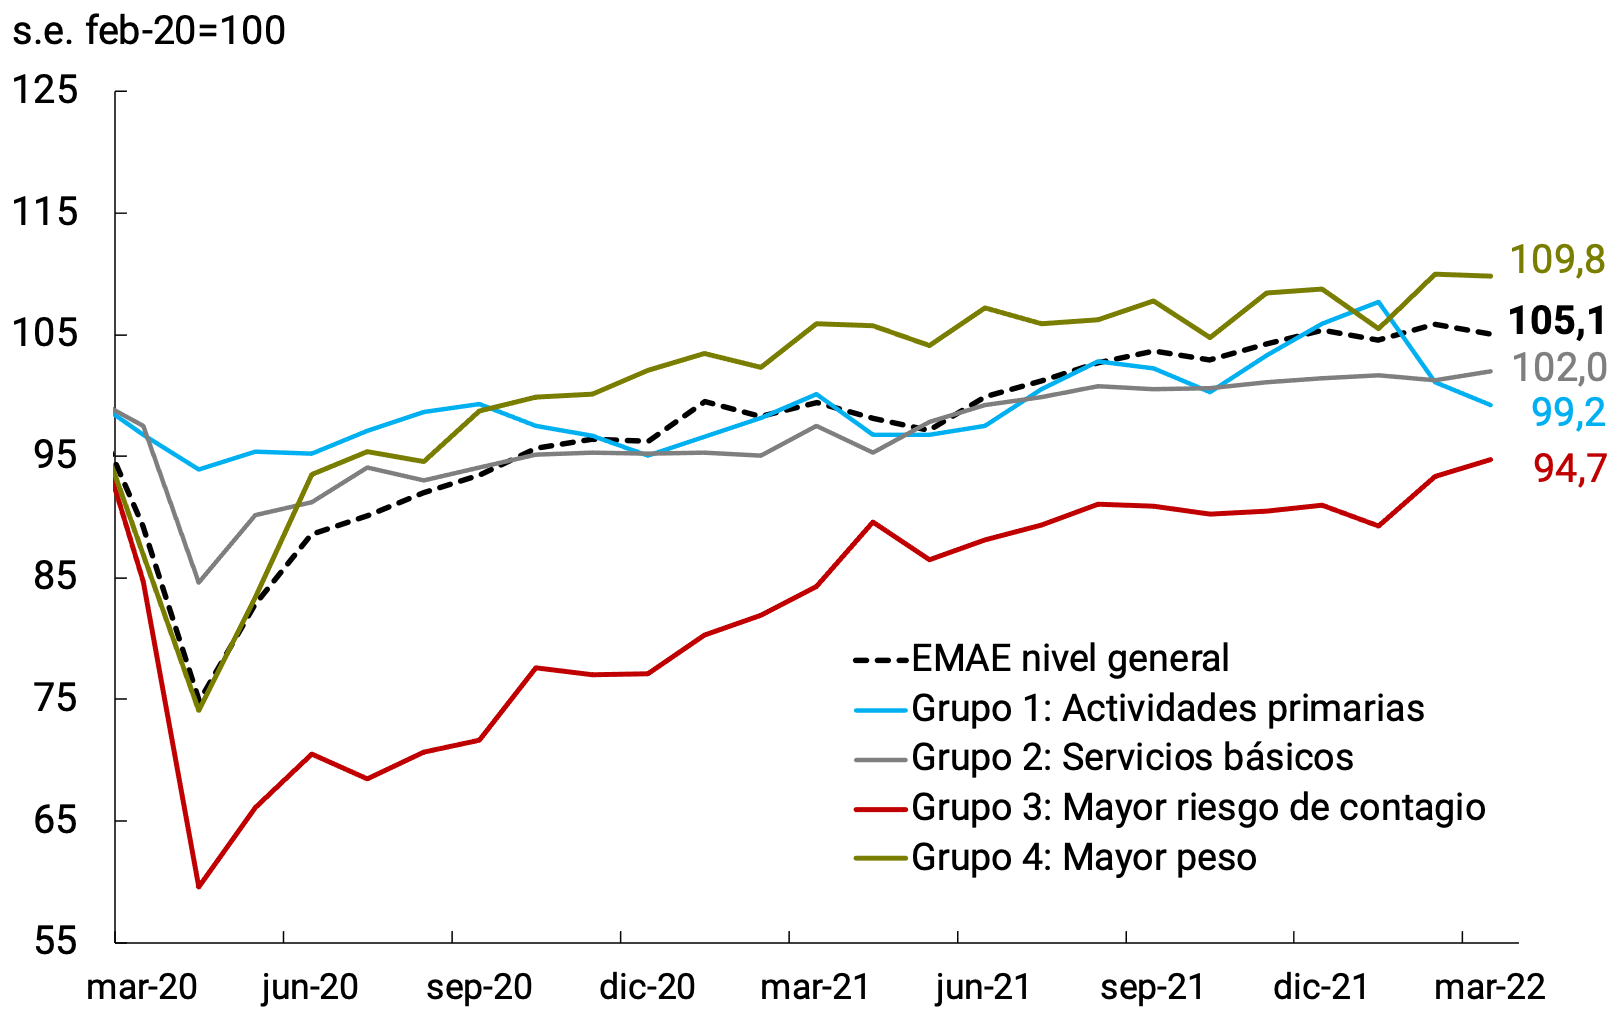
In line with what was anticipated in the previous IPOM, during the first quarter of this year services were the ones with the greatest contribution to the quarterly variation of GDP (1.3 p.p. on the var. % s.e. of GDP). Among them, those in the group of services with “Most risk of contagion” – made up of Hotels and restaurants, Transport and communications and Other community services – stand out, which are still lagging behind the rest of the sectors that make up the EMAE. In March, the value added by this set of services – which accounts for 13% of GDP – was still 5.3% s.e. below its pre-pandemic level (see Figure 3.3).
Figure 3.3 | Economic activity by groups of productive
sectors
Source: BCRA based on INDEC data.
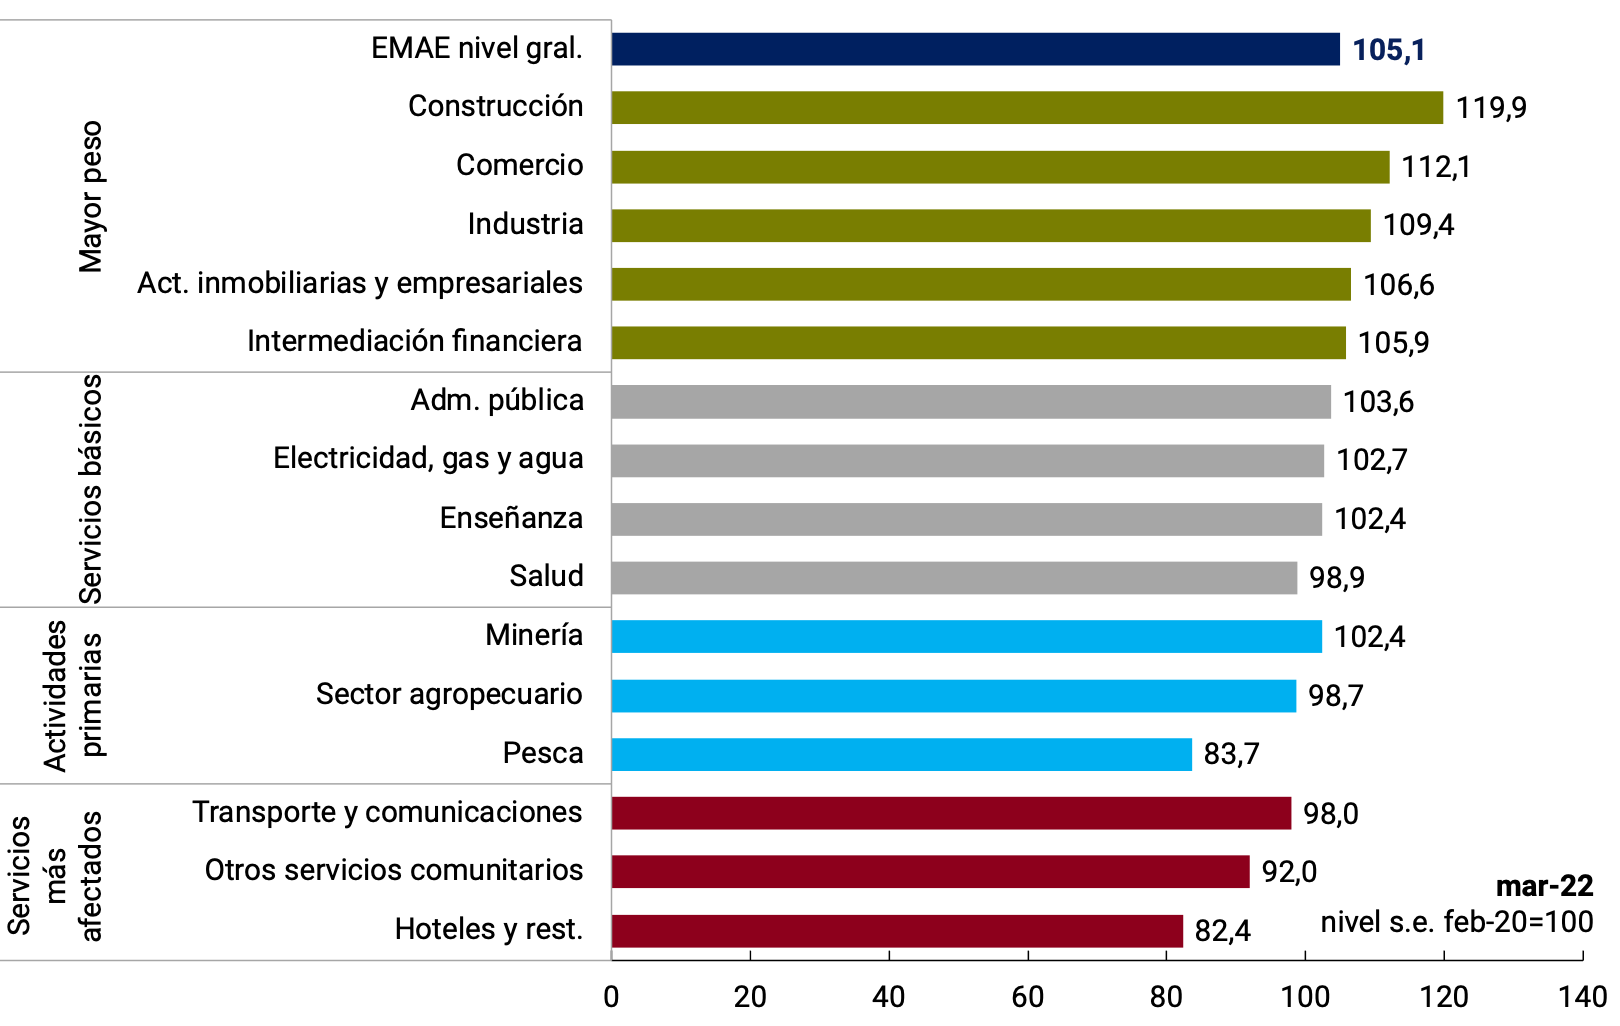
Although the post-pandemic recovery of the productive sectors has been widespread, there is still great heterogeneity regarding the level of activity at which each of them operates. Among the goods-producing sectors, Construction and Industry were the most dynamic, registering a cumulative increase of 19.9% and 9.4% s.e., respectively, between March 2020 and March 2022. In those two years, the joint contribution of these two sectors to the recovery of activity. was 2 p.p. Among services, Trade stands out, which rose 12.1% s.e. in the same period and contributed another 1.5 p.p. Hotels and restaurants are the services lagging behind: they would have to grow by 17.6% s.e. to recover the level of activity they recorded in February 2020 (see Figure 3.4).
Figure 3.4 | Post-pandemic recovery of sectoral
economic activity
Source: BCRA based on INDEC data.
3.3. During the second quarter, economic activity would contract temporarily mainly due to the impact of the drought on the coarse harvest
It is expected that in April and mainly in May, the Monthly Activity Estimator (EMAE) will account for the negative impact of the drought, when the negative results of the soybean and corn harvests are imputed to the Value Added by the Agricultural Sector (see Box below).
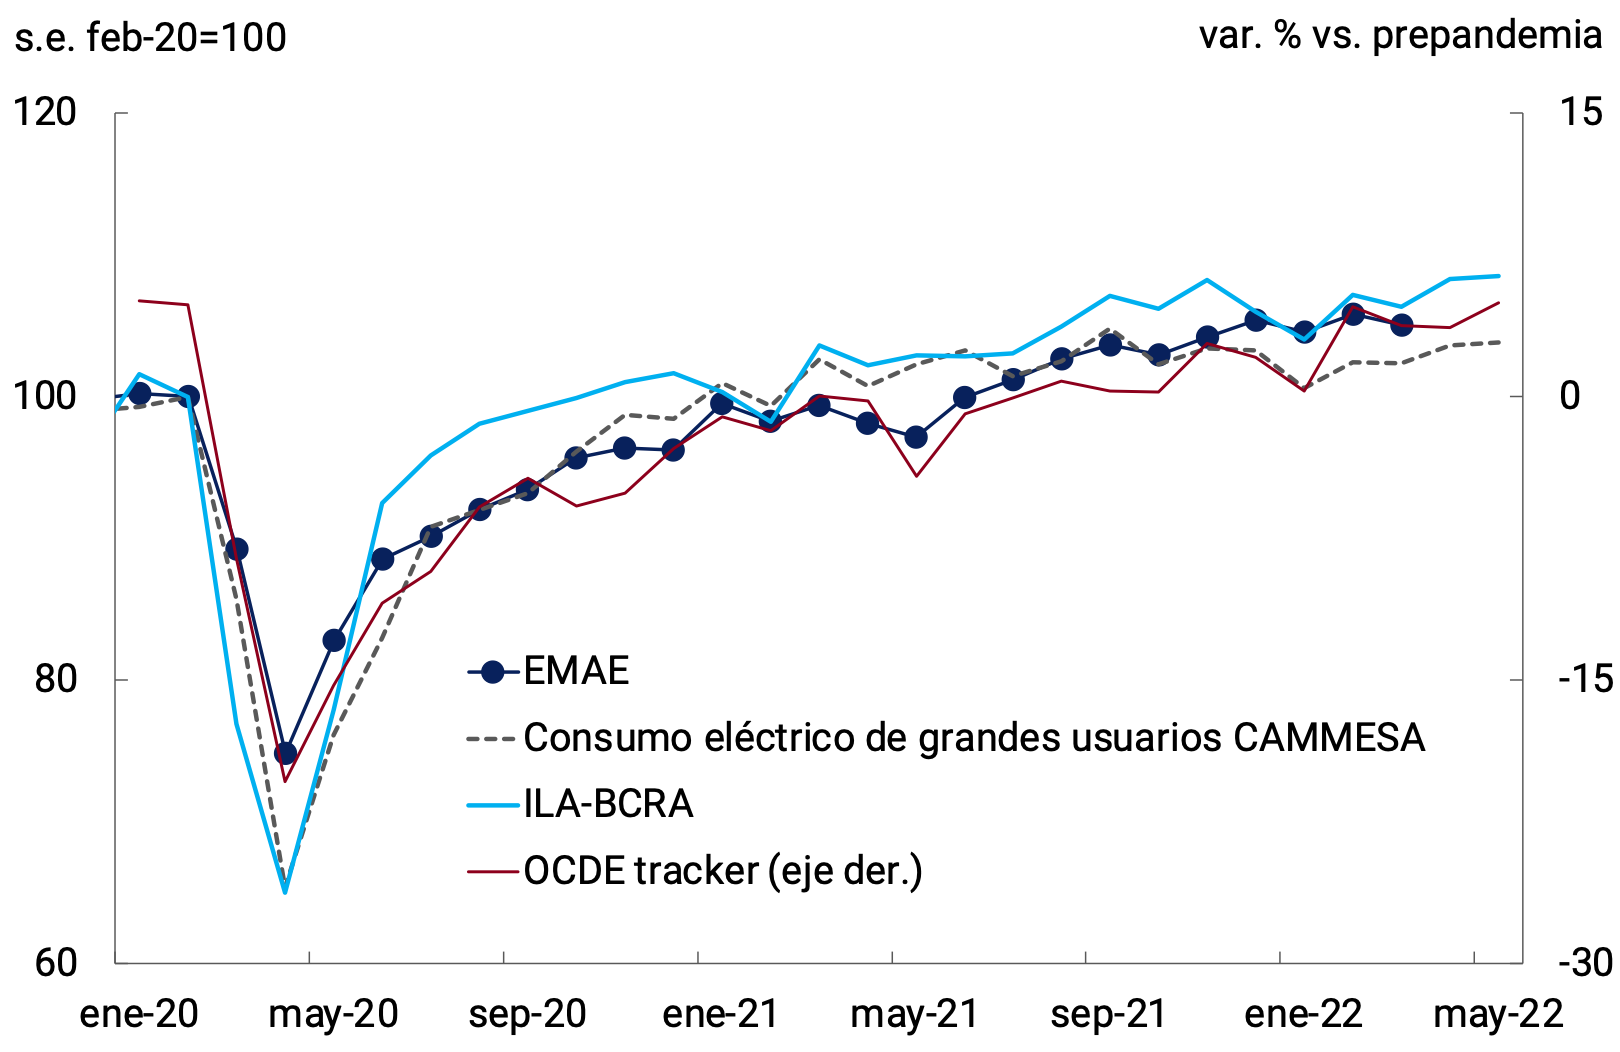
The set of leading indicators available for both April and May show that the activity of the rest of the productive sectors (excluding the agricultural sector) would have grown: the normalized and seasonally adjusted electricity demand of the large users of CAMMESA increased 1.2% monthly s.e. in April and 0.2% monthly s.e. in May, while the OECD indicator – based on Internet searches – widened its difference with respect to the pre-pandemic trajectory to 3.8% in April and 5.3% in May, after being 3.1% above the same trend in March. For its part, the ILA-BCRA6 showed a strong rise in April (1.9% monthly) and increased again in May (see Figure 3.5).
Figure 3.5 | Monthly indicators of economic
activity
Source: BCRA based on data from INDEC, CAMESA and OECD.
Box. The Value Added by the agricultural sector in 2022
Agricultural production would total 139.6 million tonnes in the current campaign, very similar to that recorded in the previous one (0.1%) but with falls in corn (-5.8% y.o.y.) and soybeans (-4.3% y.o.y.) offset by an increase in the production of wheat (25.6% y.o.y.) and the rest of the crops (7.3% y.o.y.). It should be noted that the joint production of soybeans, corn, wheat and sunflower accounted for 91.4% of total agricultural production in the 2020-2021 campaign.
These results respond to the drought conditions observed in the main productive areas during the summer, particularly in January – a significant month for determining the yields of prime soybeans, because it is the stage where most of the filling of the grains takes place and is when the crop critically needs water. The Useful Water map in the profiles of the entire country presented as of January 31, 2022 a relatively more deteriorated picture than the previous year in some areas of southern Santa Fe and Córdoba and in a large part of Corrientes, Formosa and Chaco; although better conditions in the north and center of the province of Buenos Aires. Conditions were much more favorable in the core zone compared to January 2018, when a severe drought was recorded with a strong impact on the coarse harvest7.
This year, the total planted area remained practically stable compared to the two previous seasons, with substitutions between the types of crops: less area planted with soybeans (-3% y.o.y.) and more area allocated to the rest of the crops, especially corn (6.2% y.o.y.). Soybean production has been showing a downward structural trend, with an uninterrupted reduction in the area planted since 2016. Since 2015, the only year in which soybean production registered an increase was in 2019, when it recovered from the extreme drought of 2018. Thus, compared to 2016, the area planted with soybeans lost 4.4 million hectares, of which 78% was used for corn (see Figure 3.6).
Figure 3.6 | Monthly indicators of economic activity

Source: Ministry of Agriculture, Livestock and Fisheries.
Regarding the evolution of livestock, the indirect indicators corresponding to the first quarter show deteriorations in poultry and pork meat production along with improvements in both meat and beef milk production.
With the data available to date and considering the previously mentioned agricultural production assumptions, a determined evolution for animal husbandry (whose main proxy is beef production) and for the rest of agricultural production, it is estimated that the GDP of the agricultural sector would present a fall of 2.7% during 2022. This fall will be concentrated in the second quarter, when the result of the coarse harvest is imputed, so a contraction of agricultural GDP of around 5.1% y.o.y. is expected, with a direct impact of -0.8 p.p. on the year-on-year variation of GDP in the second quarter of 2022. In seasonally adjusted terms, the GDP of this sector will register a lower contraction than that observed in previous episodes of drought, although it will still have a high negative impact (close to -1.5 p.p.) on the variation in GDP during II-22, which would result in a fall in activity of between 0.3 and 0.9% s.e. compared to the first quarter. To this would be added the indirect effects on industry, transport, commerce and other services associated with agricultural activity.
3.3.1. The labour market continued on the growth path during the beginning of 2022
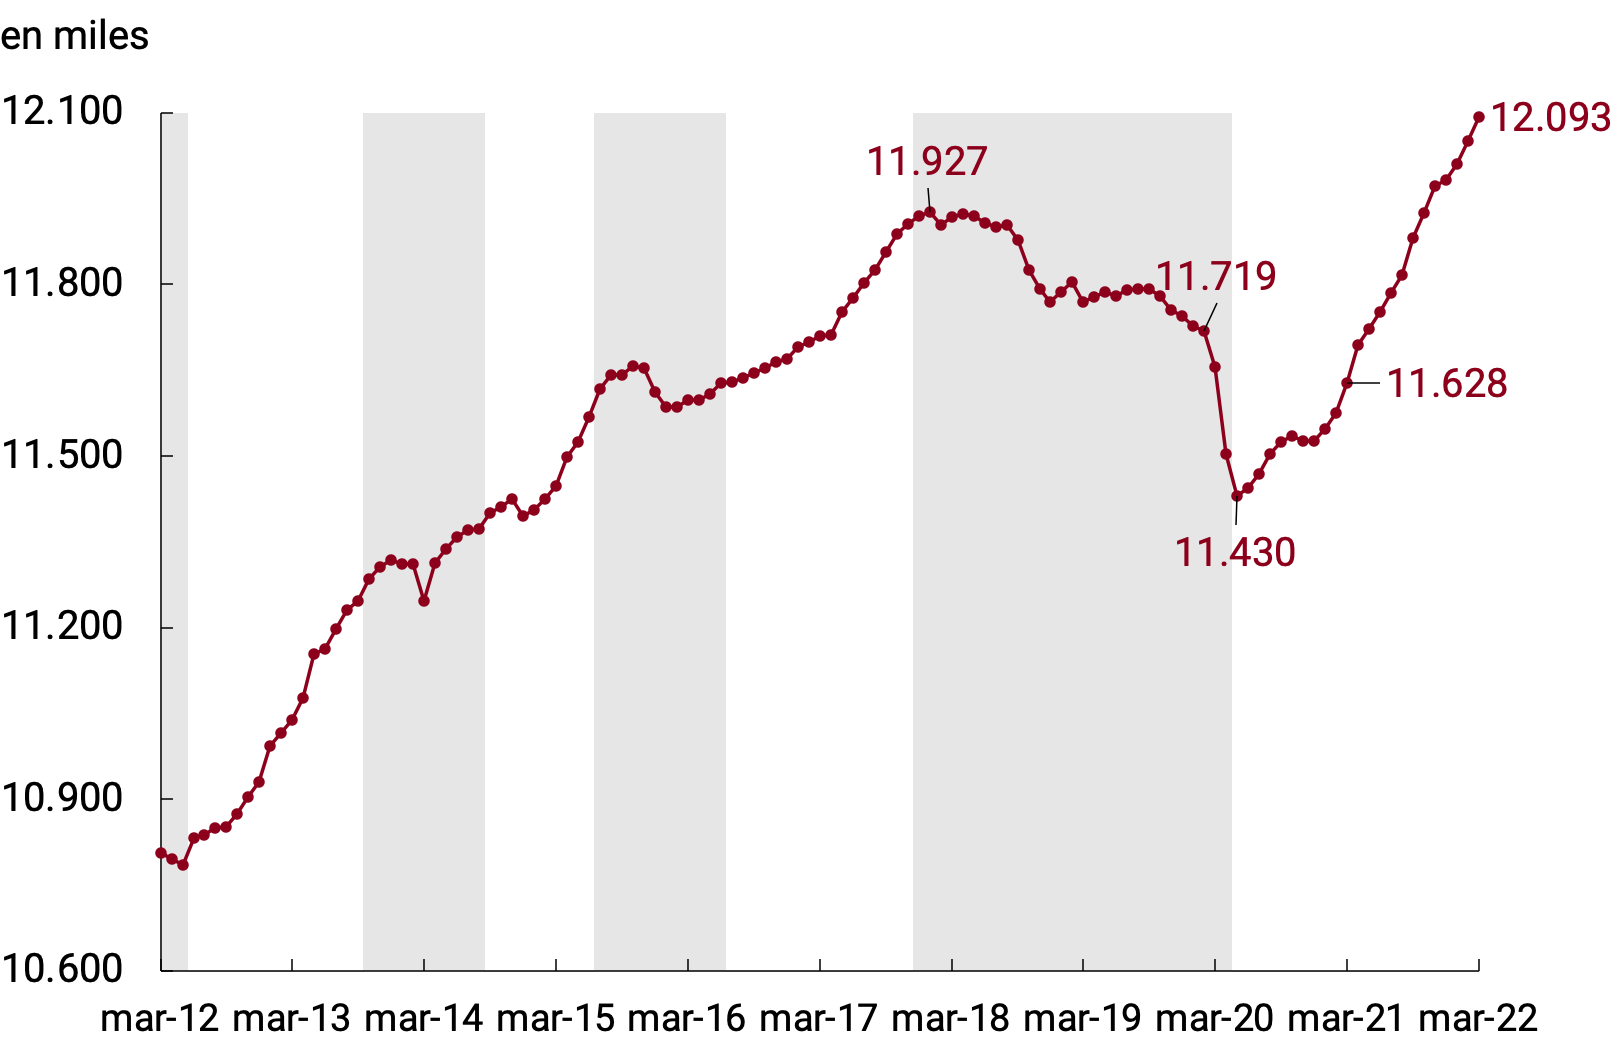
According to the Ministry of Labor, Employment and Social Security (MTEySS), registered employment continued, during the beginning of 2022, the growth path that began in June 2020. Thus, with data as of March 2022, total registered employment (without social monotax) continues at historic highs and chained 15 consecutive months of growth. The pace of expansion during the first quarter of 2022 maintained the dynamics evidenced since the beginning of 2021, growing at 0.3% per month on average (see Figure 3.7).
Figure 3.7 | Total
registered employment
Source: BCRA based on MTEySS data.
During the first quarter of 2022, the increase in total registered employment was mainly driven by self-employment (2.3% accumulated) and private registered salaried employment (1.0% accumulated). Public employment, on the other hand, moderated its growth rate, accumulating 0.1% in the first three months of 2022 (see Figure 3.8).
Figure 3.8 | Public, private, private and self-employed

employment
Source: BCRA based on data from MTEySS.
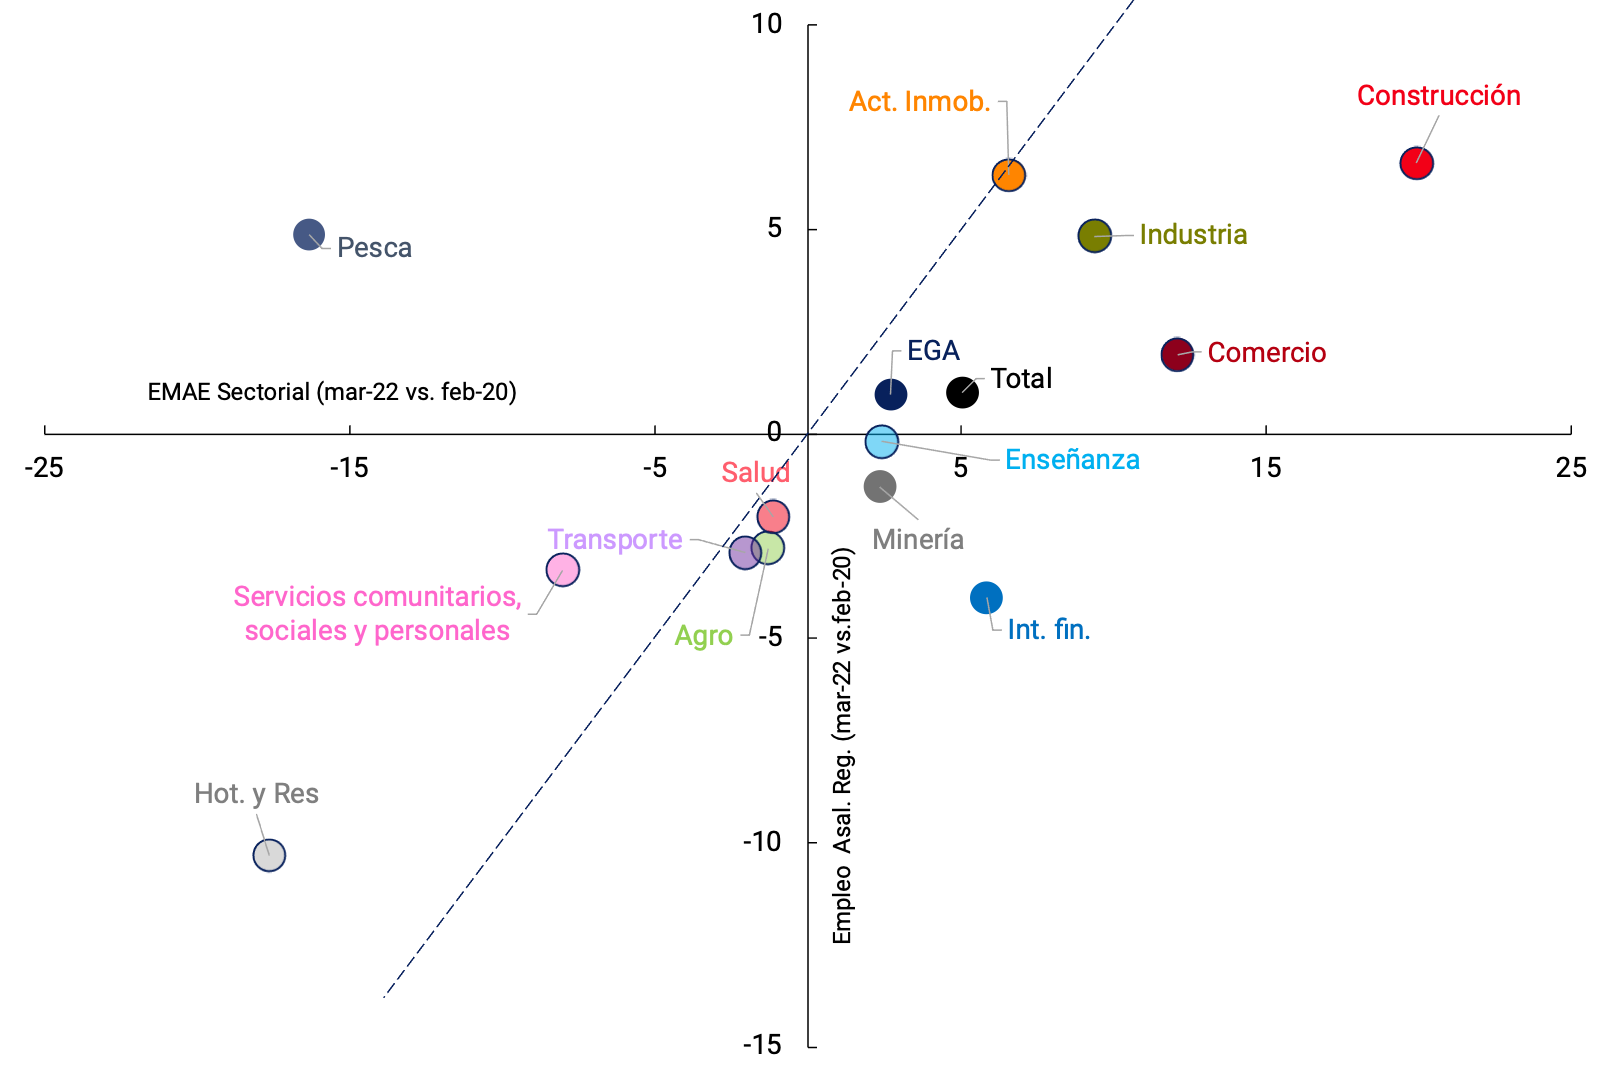
The behavior of private salaried employment between December 2021 and March 2022 allows us to distinguish at the sectoral level, as in the previous quarter, a strong dynamism in branches such as Hotels and restaurants (3.8% s.e. acum.) and Construction (3.0% s.e. acum.). However, taking into account pre-pandemic levels, it can be seen that the Hotels and Restaurants sector, as well as Community, Social and Personal Services, still has potential for recovery both in terms of activity and staff hiring. On the other hand, in the sectors that experienced the greatest recovery in terms of activity (Trade and Construction and Industry), the growth in registered salaried employment has occurred in a smaller proportion (see Figure 3.9).
Figure 3.9 | Activity and Registered Employment. Percentage
changes
Source: BCRA based on data from MTEySS and INDEC.
The Labor Indicators Survey (EIL) as of April 2022 ratified the positive trend in net hiring expectations that began in February 2021, chaining 15 consecutive months of positive values. On the other hand, suspensions after a sharp reduction during 2021 remained at levels within the historical average and the rate of layoffs remains in a limited range.
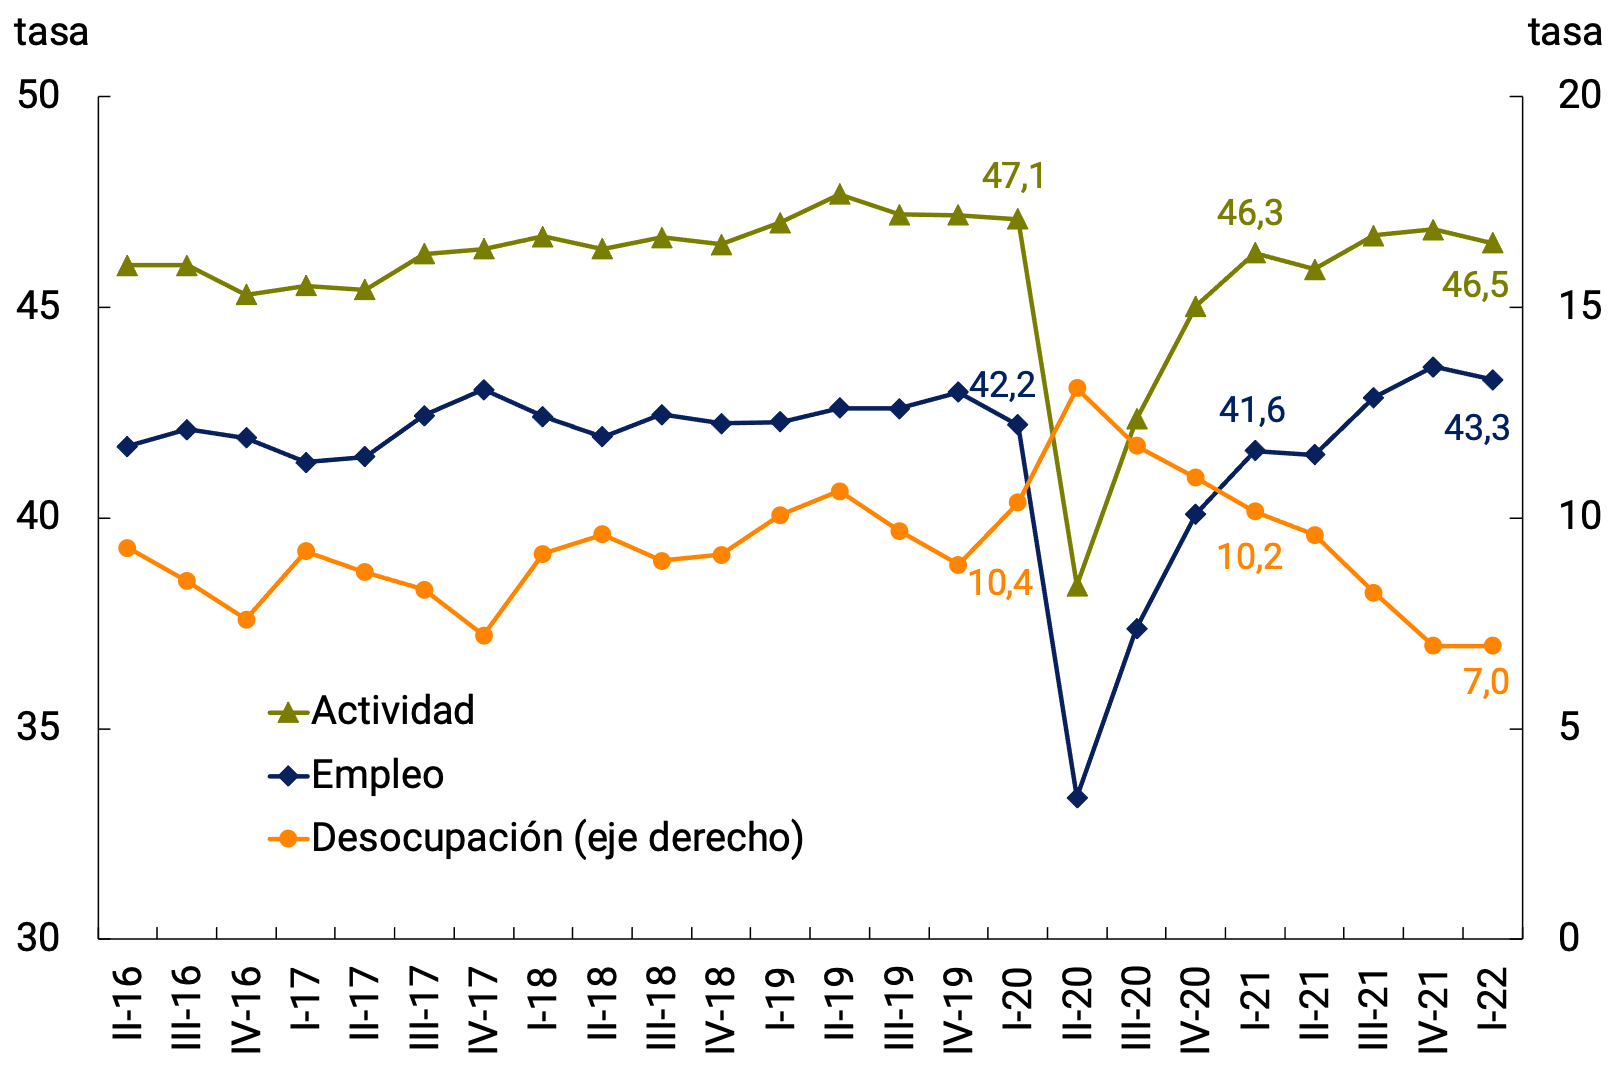
According to data from the Permanent Household Survey (EPH), in the first quarter of 2022 the employment rate stood at 43.3% (+1.7 p.p. y.o.y.), after reaching a maximum in the fourth quarter of 2021 in the new INDEC series (II-2016 / I-2022) standing at 43.6% (See Section 2 / Employment and Income: two years after the start of the pandemic). For its part, the EAP stood at 46.5% (+0.2 p.p. y.o.y.), slightly below pre-pandemic activity levels. Thus, the open unemployment rate stood at 7.0% (see Figure 3.10), as in the previous quarter, remaining at the lowest level since the beginning of the new INDEC series.
Figure 3.10 | Main labor
market rates
Source: BCRA based on EPH data (INDEC).
As for the evolution of the different occupational categories, self-employment remained relatively stable compared to the previous two quarters. The “employers” category showed, as in the fourth quarter of 2021, a significant drop that leaves them far from pre-pandemic levels. Formal wage earners fell compared to the previous quarter, but are still close to the average growth of employment. Finally, the number of informal salaried people increased again, thus exceeding the level of the first quarter of 2020.
With regard to the age range and gender, it was observed that, in both women and men, it is still the category of people over 65 years of age that has not yet managed to recover after the impact of the pandemic. In the case of young people (under 30 years of age), women have already exceeded the levels of the first quarter of 2020 while men are very close to achieving it. Both women and adults (between 30 and 64 years old) had already overcome it before.
3.4. Perspectives
So far this year, economic activity continued to strengthen the recovery and growth process that began in 2021. The wide coverage of the population against COVID-198 allowed the different sectors to operate in an environment of “normality”. In this context, it is expected that the services that are still lagging behind will recover their pre-pandemic levels, at the same time that the rest of the sectors – which mostly operate at levels much higher than those of the beginning of 2020 – will continue the growth process driven by the policies of the National Government and the BCRA9. With respect to the agricultural sector, the expected contraction in its level of activity in the second quarter as a result of the drought will be much lower than that observed in previous episodes.
This base scenario continues to present several risks. Among the main ones are the continuity of a more deteriorated international financial context in the face of the persistence of international inflation, greater pressure on international energy prices as a result of the prolongation of the armed conflict between Russia and Ukraine and, with a low probability of occurrence, the circulation of new variants of the Coronavirus that could emerge and truncate the health advances achieved so far (see Chapter 2. International Context).
The outlook for global growth contemplates a slowdown in the coming months, associated with the systematic reduction of monetary stimuli by advanced economies and the continuation of bottlenecks in certain supply chains, as a result of geopolitical conflicts and the health policies implemented in China in response to the increase in positive COVID-19 cases at the beginning of the year. This scenario continues to put pressure on external financing costs for emerging countries and on international prices of raw materials and energy, which remain at historically high levels.
After recovering 10.3% annually in 2021, the Argentine economy grew 6% YoY in the first quarter of the year. For the average of 2022, the statistical carryover is 4.1 p.p., the midpoint of the range of economic growth forecast contemplated in the IMF’s PFE for the year (3.5% – 4.5%). The market outlook is below this level: according to the estimates of the Market Expectations Survey (REM) at the end of May 2022, specialized analysts expect a growth of 3.3% for economic activity during this year.
The National Government continued to implement policies aimed at sustainable and inclusive economic growth within the framework of the “Argentina 2030” Development Plan10. Among them, the promotion of strategic sectors to enhance production chains, the modernization of industry and the promotion of regional economies in order to increase exports11. In addition, in the context of a recent acceleration in inflation, the National Government temporarily implemented income-boosting measures, mainly aimed at the most vulnerable sectors12. The calibration of public policies in a dynamic and uncertain context will contribute to strengthening greater macroeconomic stability.
4. External Sector
In the first quarter of 2022, in a context of trade flows at record levels (measured in current dollars), the trade surplus in goods was recovered, mainly due to an improvement in the terms of trade. In this context, the economy is expected to have sustained the seasonally adjusted current account surplus. In the April-May two-month period, due to the strong growth in imports of goods, driven by high fuel prices, the seasonally adjusted monthly average trade surplus was reduced by 40%.
In the foreign exchange market, the evolution of exports and imports of goods added to the dynamics of commercial debt for these concepts, resulted in a net result in the exchange market for goods of US$7,278 million in the first five months of 2022, significantly decreasing compared to what was observed in the same period of the previous year. Additionally, net outflows were recorded through the foreign exchange market for services, interest and other financial transactions for US$6,928 million, while entities made sales for US$154 million. For its part, the BCRA bought US$844 million net in the foreign exchange market, in addition to net payments through the Local Currency System (SML) for US$339 million.
These operations in the foreign exchange market by the BCRA together with the net income of financial debt of the General Government of about US$3,100 million, explained entirely by the income of the IMF, brought the level of international reserves to US$41,561 million at the end of May, which represented an increase of US$1,899 million above its value at the end of 2021.
Following the agreement reached with the International Monetary Fund (IMF) that resulted in the current Extended Facilities Program (EPP), the goal for monitoring Net International Reserves was set at an increase of at least US$1,200 million for the first quarter of 2022, which was satisfactorily achieved given the increase of US$1,521 million for the period arising from using the methodology defined in program18.
After the first review of the PFE and after recognizing the importance of investing in economic stability and maintaining the objectives of the year-end program with some flexibility in quarterly trajectories to adapt to external shocks, the objective of accumulating Net International Reserves for the first half of 2022, according to the parameters established in said program, they were established in an increase of at least US$3,450 million.
4.1. In the first quarter of 2022, the economy would have sustained the current account surplus
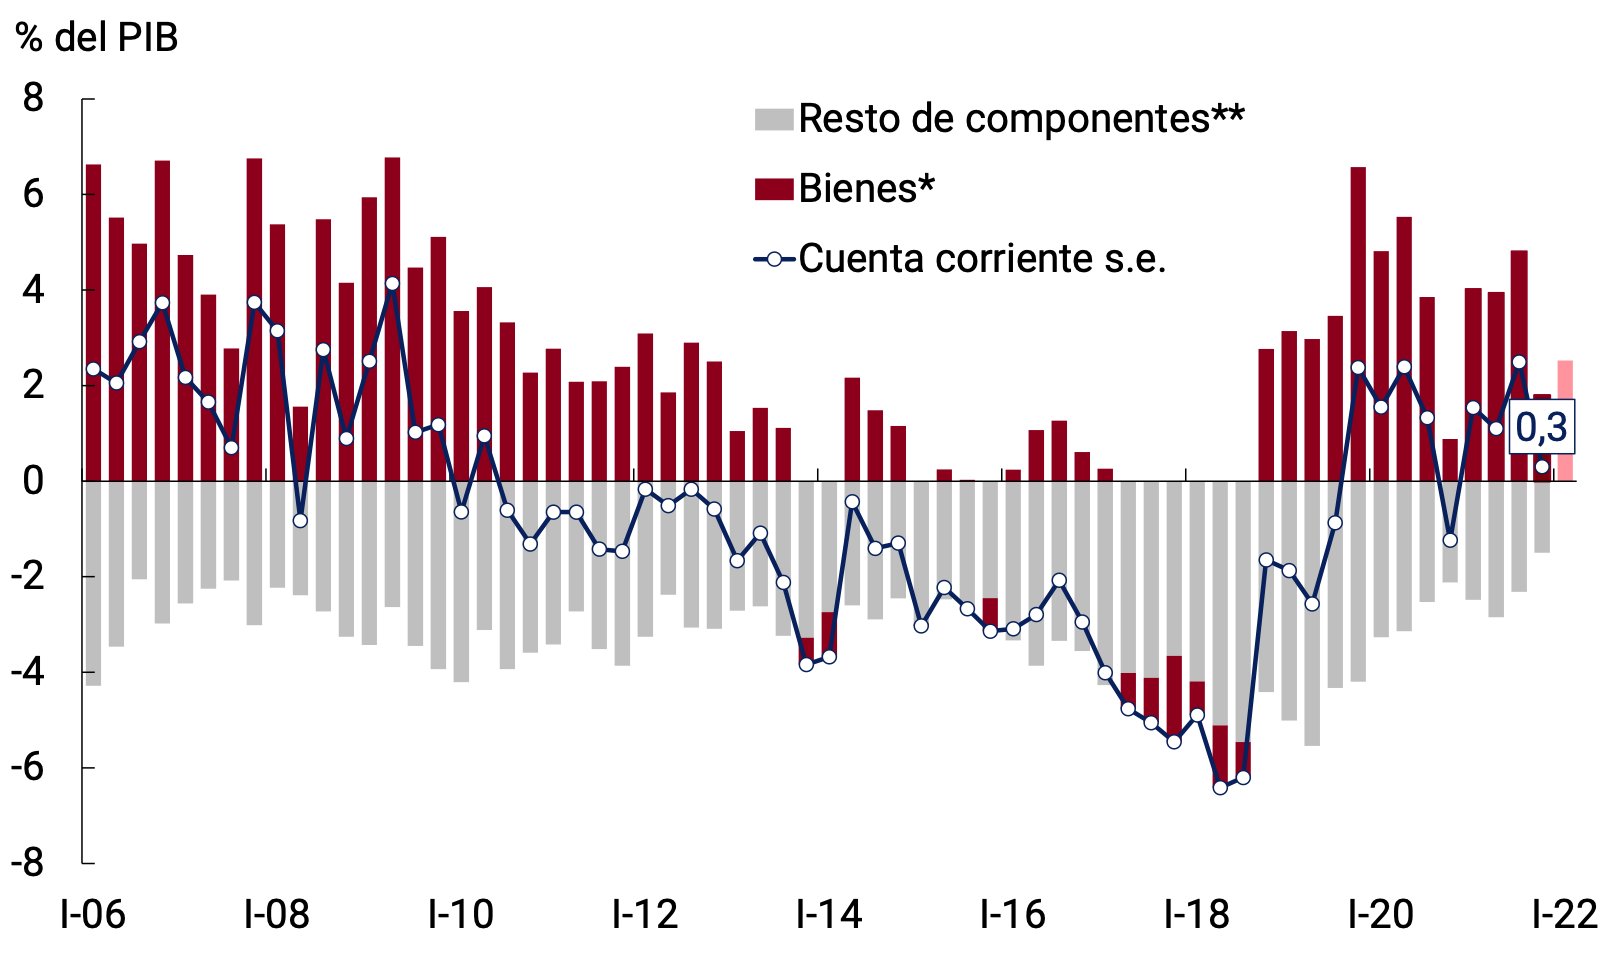
In the fourth quarter of 2021 (latest official data available) the Argentine economy had registered a current account surplus of US$373 million – equivalent to 0.3% of GDP in seasonally adjusted and annualized terms. The fall in the volumes of goods exported compared to the third quarter had been the main reason behind the temporary decline in the current account surplus.
In the first quarter of 2022, the trade surplus in goods was recovered, mainly due to an improvement in the terms of trade. In this context, the seasonally adjusted current account would have remained in positive territory (see Figure 4.1).
Figure 4.1 | Seasonally adjusted current account. Annualized
values
* IV-21: estimated.
** Includes the accounts: Services, Primary Income, and Secondary Income.
Source: BCRA based on INDEC data.
In that period, the exported values of seasonally adjusted goods reached US$22,425 million (Free on Board —FOB—) at current prices, which represented an increase of 12.4% compared to the level recorded in the fourth quarter of 2021. This evolution was mainly due to the performance of export prices, which grew 8% s.e. on average between January and March 2022 compared to the previous quarter. To a lesser extent, the quantities exported had a lesser impact, which expanded 4% in s.e. terms and were around 2019 levels. In the April-May two-month period, exported values rose again at a rate of 3% quarter-on-quarter s.e., again driven by prices that more than compensated for a fall in quantities.
For its part, between January and March 2022, seasonally adjusted imports of goods totaled US$19,543 million (CIF), which was a record for imported values at current prices. This performance of imported values was explained to a greater extent by the rise in volumes, which grew 6% quarter-on-quarter (see Figure 4.2). In the April-May two-month period, imported values accelerated at a rate of 9% quarter-on-quarter s.e., reflecting a rise in prices of the same magnitude, while imported quantities remained practically constant.
Figure 4.2 | Trade in goods. Seasonally adjusted series
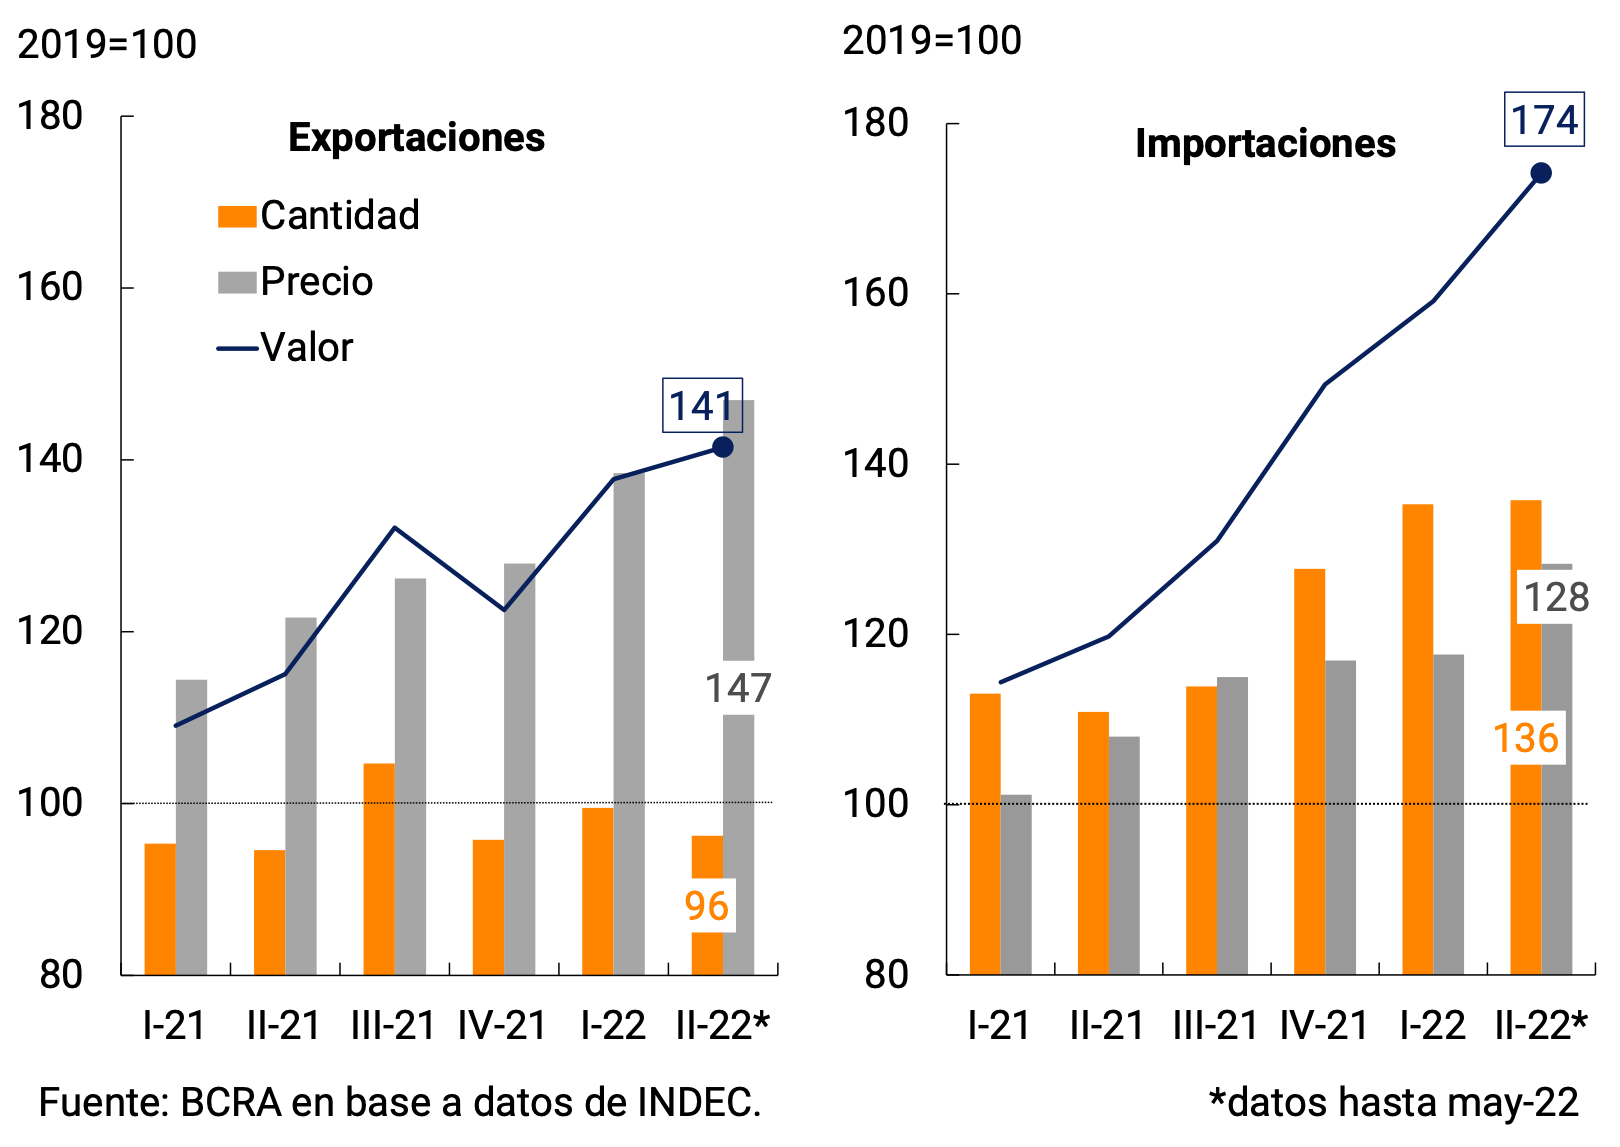
As a result of the recent evolution of exports and imports, the seasonally adjusted average monthly trade balance went from US$961 million in the first quarter of 2022 to US$546 million in the April-May two-month period.
Two of the four main export items had increases in exported volumes in the first quarter of 2022. In the case of Primary Products (PP, +5% qq. s.e.), 6 of the 10 categories that make up the category showed increases, with higher shipments of cereals (in the context of the record wheat harvest) and fishery products standing out for their incidence. The quantities exported from. Fuels and Energy (S) increased 11% QoQ. s.e., mainly due to higher crude oil exports. On the other hand, shipments of Manufactures of Industrial Origin (MOI) fell (-2% QoQ, s.e.), with a strong negative impact on land transport material. Finally, the exported quantities of Manufactures of Agricultural Origin (MOA) fell 5% s.e. in the quarter, affected by a weak performance of soybean derivatives, partially offset by an increase in shipments of dairy products. In the two months of Apr-May, almost all the dynamics of the first quarter of the year were reversed. There were increases in MOA and MOI (due to recoveries in the quantities exported of soybean derivatives and land transport material, respectively) and falls in PP and S, as a result of declines in shipments of oil and fishery products, and a deepening decline in oilseed exports (see Figure 4.3).
Figure 4.3 | Quantities exported. Seasonally

adjusted series
Source: BCRA based on INDEC data.
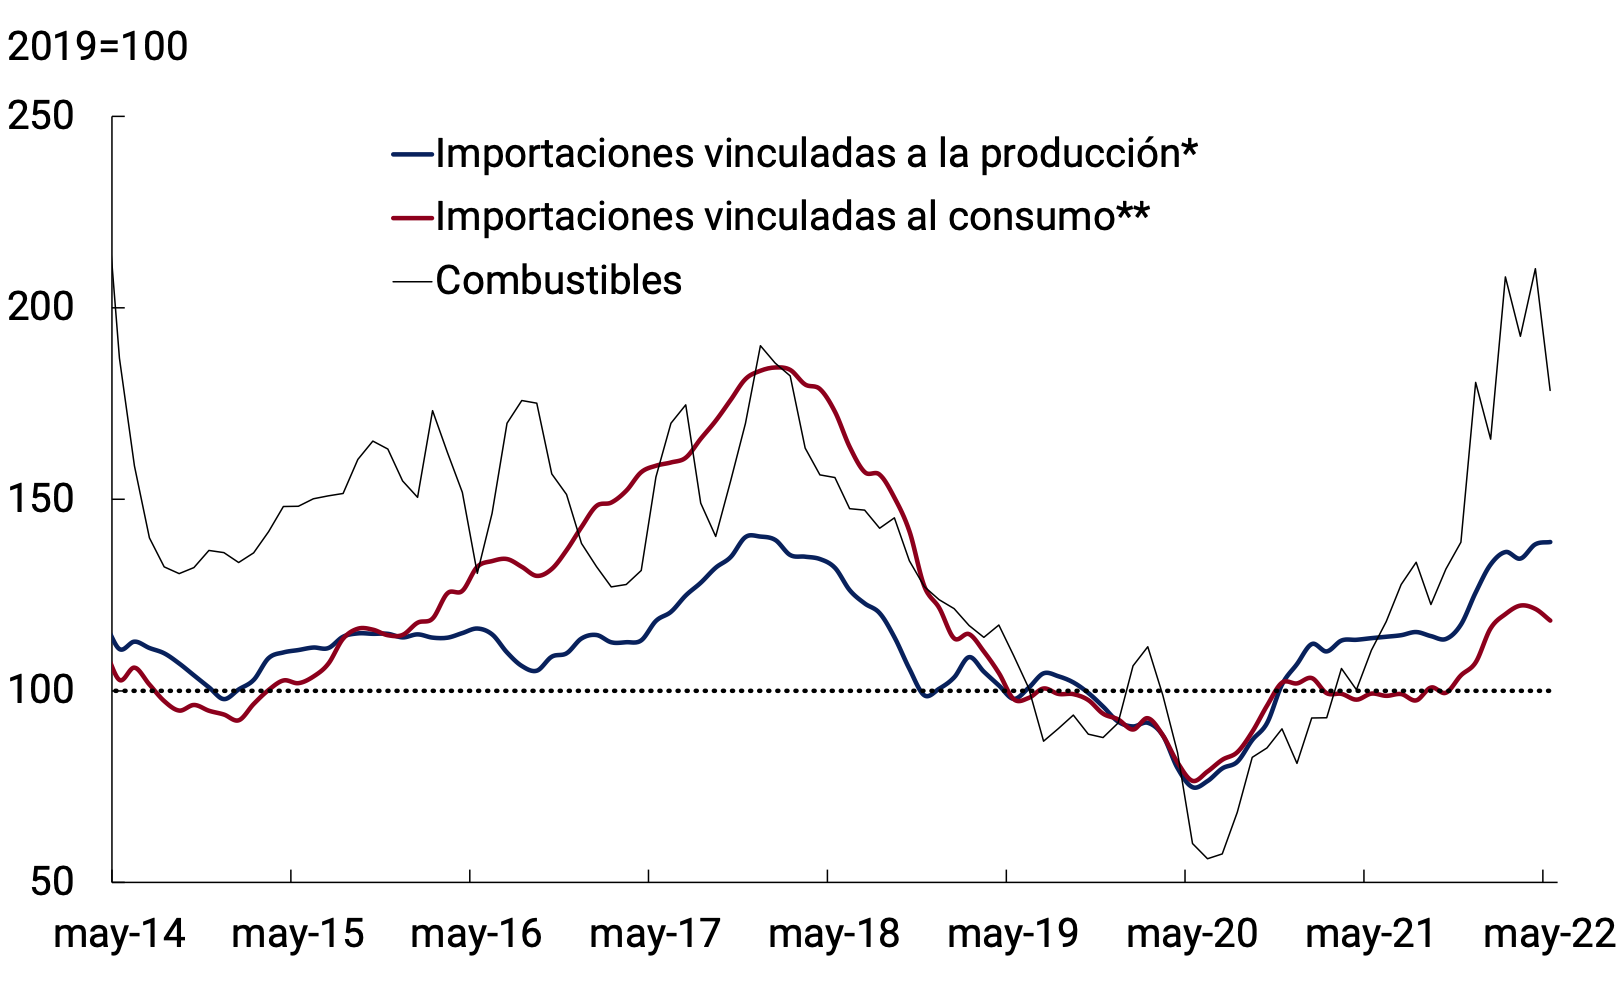
In the case of imported quantities of goods, the increase in the first quarter was publicized, fuel purchases grew 7% quarter. s.e., those associated with consumption 14% s.e. and those linked to production, 7% s.e. In the two months of April-May, this strong growth was interrupted. Imported volumes of fuels and consumer goods fell 8% and 6% respectively and imported quantities of goods closely associated with production slowed their growth to a 3% quarter-on-quarter pace. s.e. (see Figure 4.4).
Figure 4.4 | Quantities imported. Seasonally adjusted seriesMoving average 3 months* Includes imports of capital goods and parts thereof and intermediate goods.
** Includes imports of consumer goods and vehicles.
Source: INDEC.
Box. Commodity prices
Global commodity markets were under pressure at the beginning of 2022, before the armed conflict between Russia and Ukraine broke out. The strong recovery in demand as the recessionary effects of the pandemic dissipated was not matched by a proportional increase in supply affected by some bottlenecks resulting from years of low investment and restrictive trade measures19. From April 2020 to December 2021, the Commodity Price Index prepared by the BCRA (IPMP) accumulated a 61% increase in current dollars.
In this context, the shock of the war in Ukraine occurred (see Chapter 2. International Context). Russia and Ukraine have a significant weight as exporters of a variety of raw materials, including wheat, gas, oil, sunflower oil, palladium, barley, corn, urea, phosphates and potassium chloride. Both the economic sanctions imposed on Russia and the material damage suffered in Ukraine put additional pressure on global commodity markets. So far this year, the main grains have accumulated increases of between 29% and 33%, oil grew 49% and the reference price of liquefied natural gas in Europe (TTF) increased 42%.
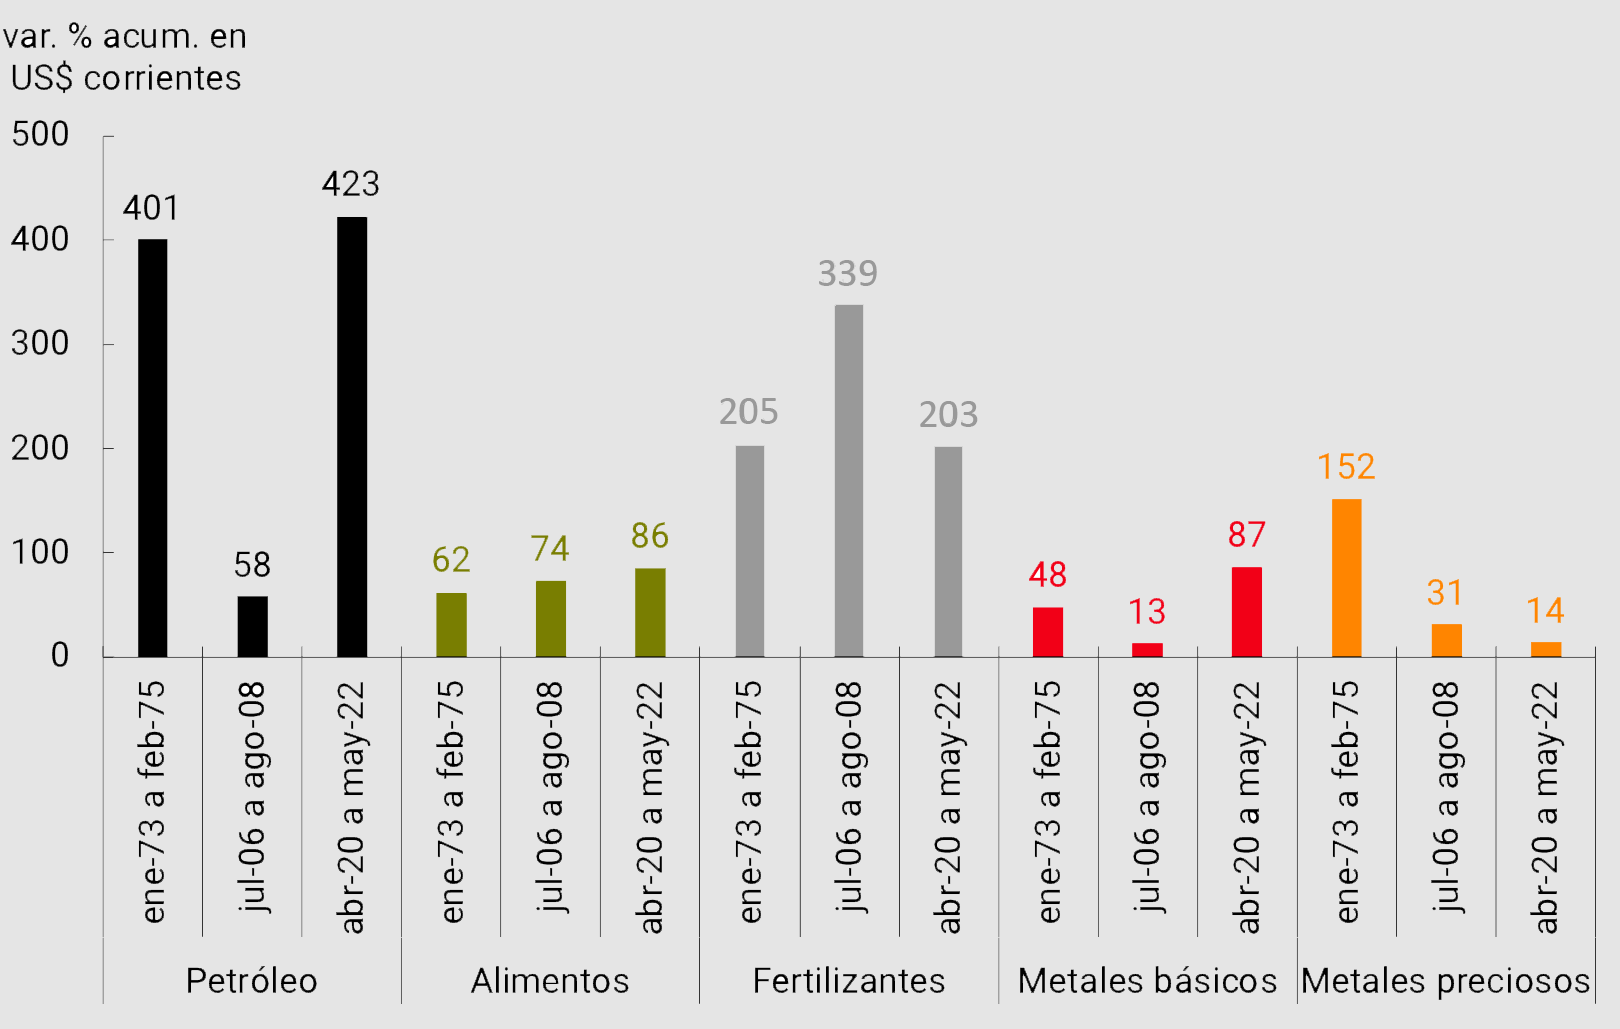
As a result of these events, the world economy is going through one of the three episodes of the most intense increases in commodity prices in the last 50 years. Taking a 25-month window, since April 2020 oil accumulated a rise of 423%, food 86%, fertilizers 203% and base metals 87%. In both oil and fertilizers, these increases are comparable to those observed in 1973/76, while in food and base metals the current increases far exceed those verified in the historical episodes indicated (see Figure 4.5).
Figure 4.5 | Episodes of commodity
increases
Source: BCRA based on data from the World Bank.
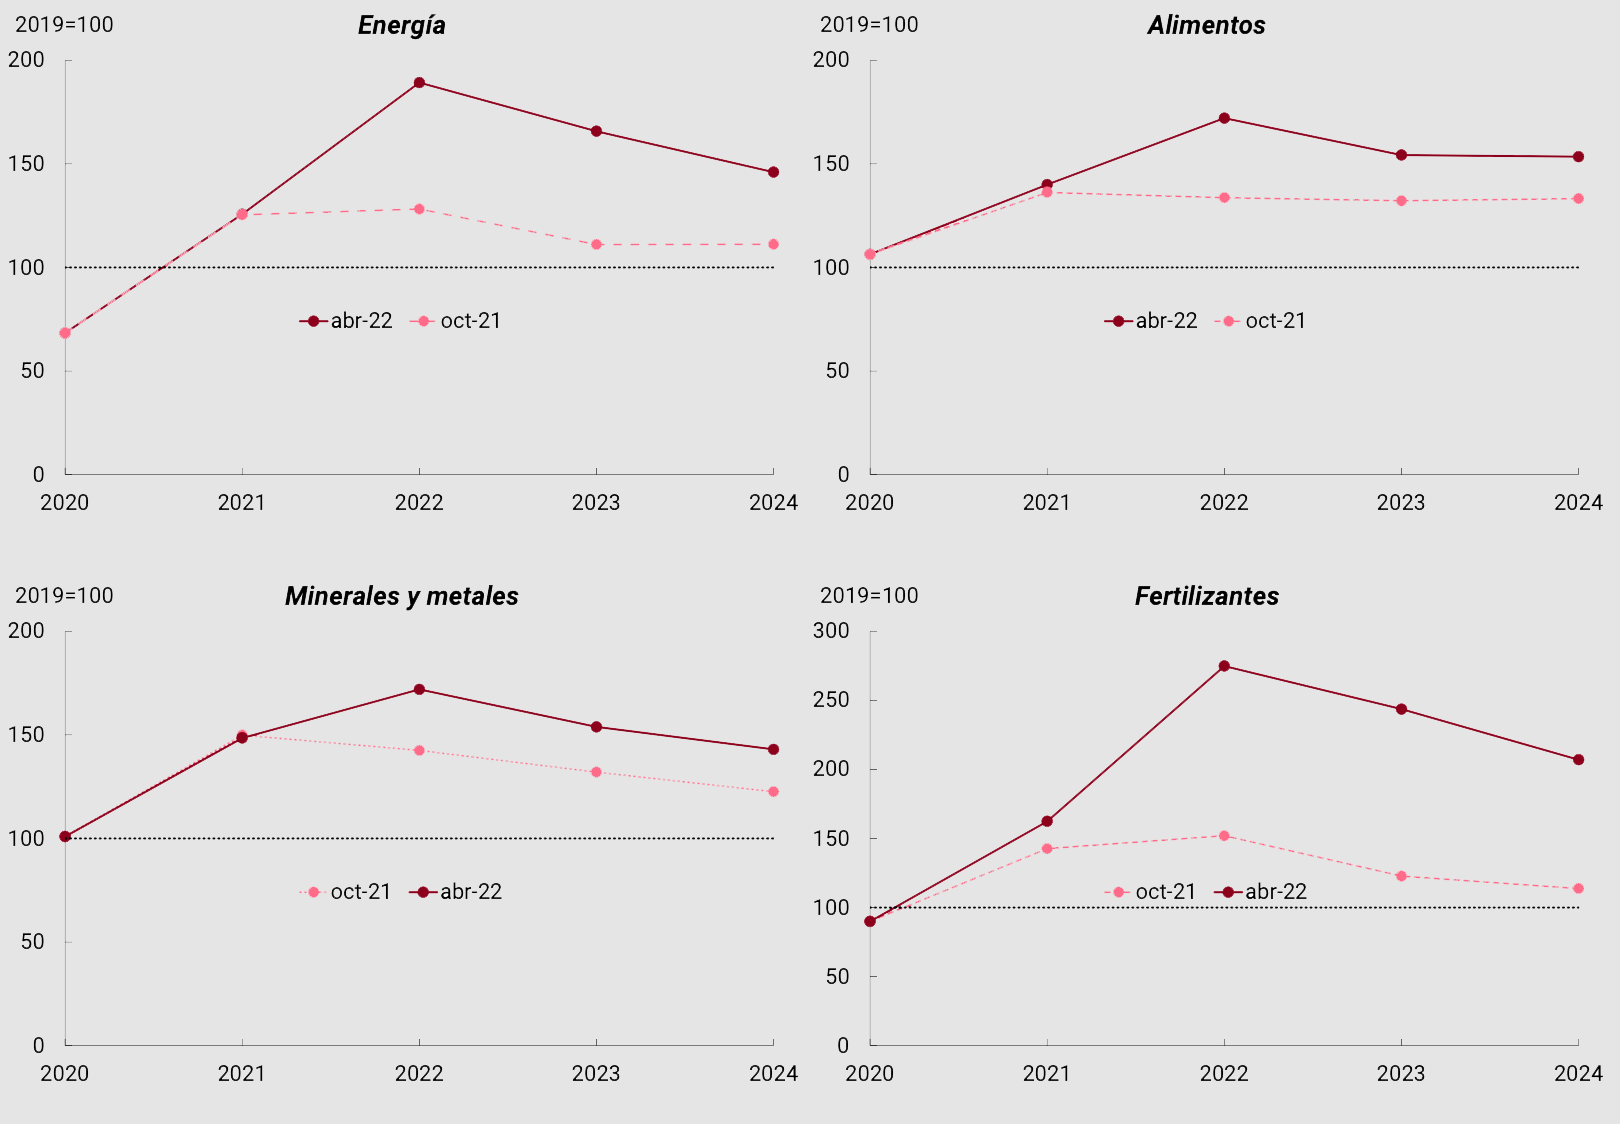
The effects of the shock of the war in Ukraine are expected to last in the medium term. While commodity prices are expected to peak in 2022, forecasts through 2024 suggest that prices would hold comfortably above pre-pandemic levels, a prospect that has sharpened in recent months (see Figure 4.6).
Figure 4.6 | Commodity
prices
Source: BCRA based on data from the World Bank.
4.3. So far in 2022, the BCRA recorded an increase in international reserves
During the first five months of 2022, exporters recorded revenues from collections of exports of goods of about US$36,065 million. On the other hand, exports of goods totaled about US$35,827 million, which is why a slight increase in external debt for advances and pre-financing of about US$237 million is estimated. Despite this increase, the ratio of this type of debt to exported securities is reduced to 6.5% and represents the lowest ratio verified since December 2006 (see Figure 4.7).
Figure 4.7 | Assets. Exports and external debt for exports
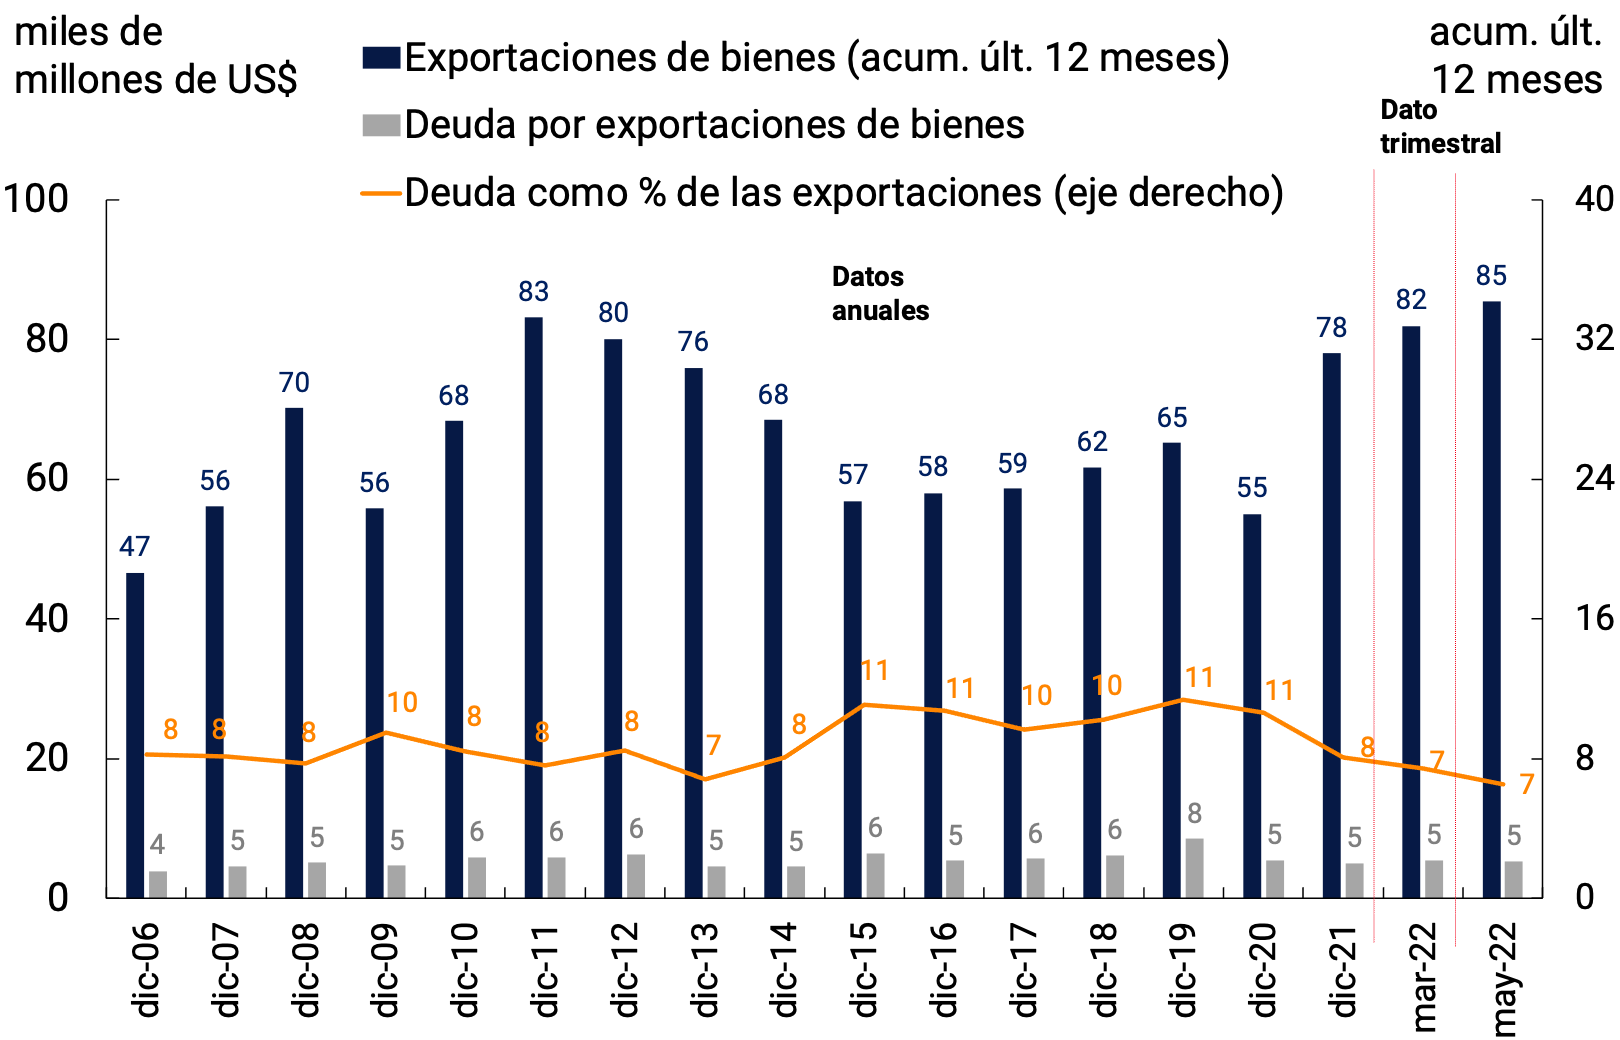
Note: I-22 and May-22 debt estimated based on accrual data and cash.
Source: BCRA based on INDEC data and own data.
During 2020, the BCRA established a series of regulations that aim to promote the allocation of foreign currency more efficiently, with an impact on both the evolution of private commercial and financial debt. These rules were maintained throughout 2021 and continued to be refined throughout 202220. In this context, during the first five months of this year, payments for imports of goods through the foreign exchange market for around US$28,800 million were about US$1,800 million below FOB imports for the period, which would imply an increase in foreign debt for this concept. However, the relationship between external indebtedness and the level of imports registered a further fall in May 2022, which would imply about 23 p.p. less than at the end of 2020 (see Figure 4.8).
Figure 4.8 | Assets. Imports and external debt for imports
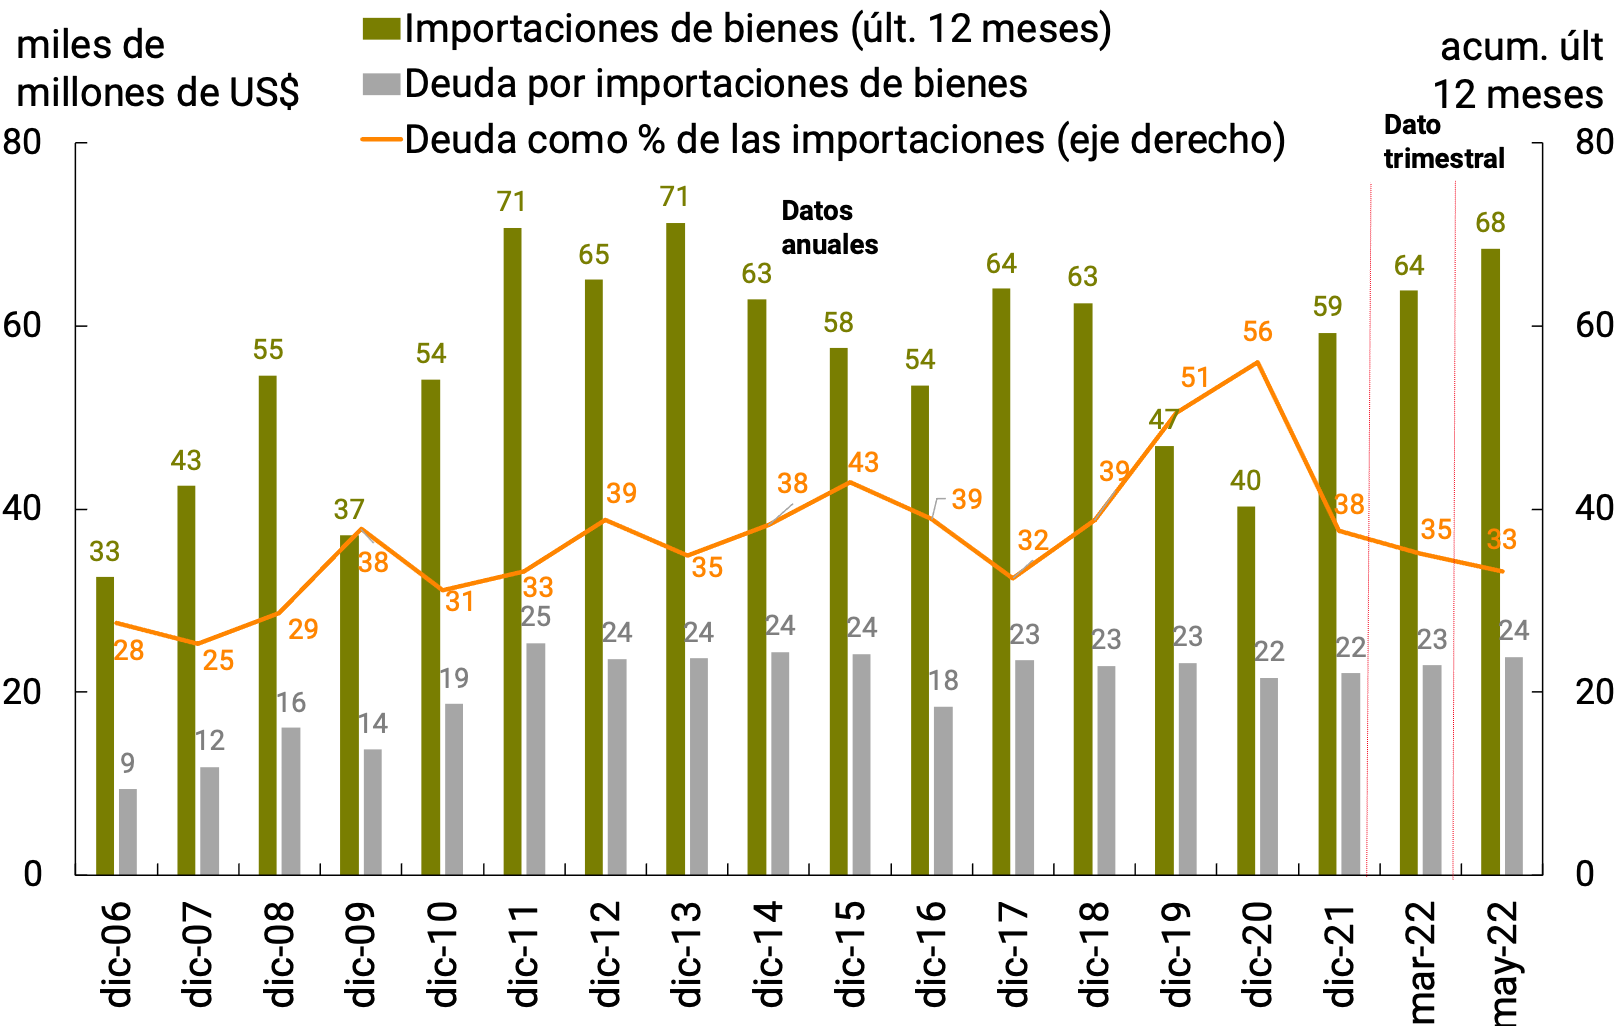
Note: I-22 and May-22 debt estimated based on accrual data and cash.
Source: BCRA based on INDEC data and own data.
With regard to financial debt and as part of the current regulatory framework mentioned above, in September 2020, Communication “A” 7106 established the guidelines under which private sector companies could initiate a process of refinancing their respective external liabilities, which would allow them to adapt their maturity profile to the guidelines required for the normal functioning of the foreign exchange market. This communication, which reached certain capital maturities between 15-Jan-20 and 31-Mar-21, was extended by Communication “A” 7230, covering maturities from then until the end of 2021. Likewise, Communication “A” 7422 extended the term of the maturities until 30-Jun-22 and Communication “A” 7466 did so until 31-Dec-22.
In this context, the renegotiations recorded during the first five months of 2022 had an impact on lower net purchases in the foreign exchange market of about US$550 million compared to the original maturities for that same period, accumulating lower net payments of about US$3,100 million since its inception. It should be noted that in the first five months of 2022, net cancellations represented only 26% of the maturities reached, with almost three-quarters of the maturities of securities and financial debts being refinanced.
The aforementioned evolution of trade in goods and commercial debt for exports and imports of goods, resulted in a net result for goods in the foreign exchange market of US$7,278 million in the year, about US$1,000 million higher than the result of the FOB trade balance of the same period and exhibiting a fall compared to the previous year (17% y.o.y.).
This result allowed the BCRA to accumulate net purchases in the foreign exchange market for US$844 million during the year (see Figure 4.9), while international reserves increased by US$1,899 million in the same period. This difference was mainly explained by the purchases detailed above, by the net income of debt in foreign currency of the National Government with a direct impact on international reserves of about US$3,100 million —of which about US$4,700 million corresponded to IMF revenues—, payments for operations carried out through the Local Currency Systems with Brazil, Uruguay and Paraguay and ALADI for about US$380 million and for the decrease in the prices of the assets that make up the international reserves in relation to the currency of account (US dollar), which resulted in a decrease of about US$1,100 million.
Figure 4.9 | Exchange market. Result
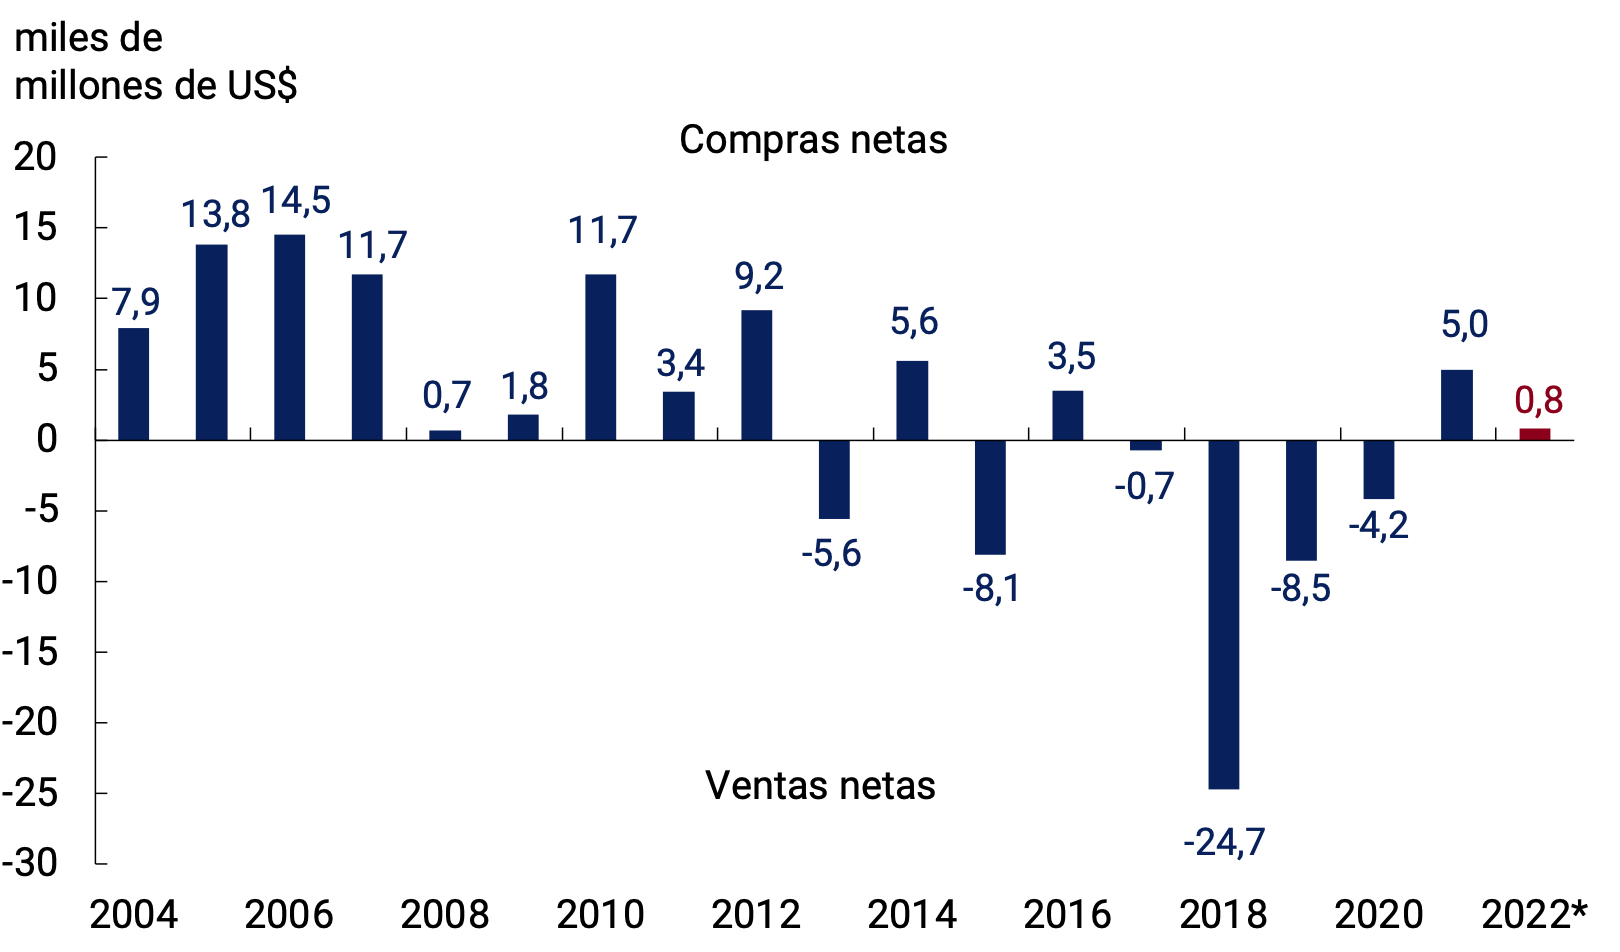
*Data as of May-22.
Note: joint cumulative result of the BCRA and the National Treasury in the foreign exchange market.
Source: BCRA.
4.4. Perspectives
For the year 2022, the economy is expected to register a trade surplus in goods for the fourth consecutive year, within the framework of a managed floating exchange rate policy.
Various factors in the international context make up the risk matrix of the external sector of the Argentine economy. The continuation and potential escalation of the war in Ukraine, a resurgence of the pandemic and an increase in volatility in financial markets could have a negative impact on the growth of our trading partners and on commodity prices, which are at historically high levels.
The BCRA will continue to prudently manage foreign exchange regulations in order to adapt them to the needs of the situation, favoring monetary and exchange rate stability. Along these lines, on June 27, 2022, Communication “A” 7532 was issued, which, in order to respond to the extraordinary needs for foreign currency to meet energy imports and in order to sustain economic growth and the development of SMEs, extends the import financing system to those made under a Non-Automatic License and to the import of services and will be in force for one quarter. to give time for the normalization of foreign trade. In the same sense, it was decided in coordination with the Ministry of Productive Development to expand the tariff positions of goods equivalent to those produced in the country that will have access to the market from 180 days and that of luxury goods that will be able to access from 360 days.
To the extent that macroeconomic conditions allow, regulations will be relaxed, with the aim of maintaining in the medium and long term a set of macroprudential regulations compatible with the dynamization of capital flows oriented to the real economy. Examples of this were the regime for the availability of foreign currency for exporters of services (Communication “A” 7518 of June 2, 2022)21 and the Regime for Access to Foreign Exchange for Incremental Oil Production (RADPIP), created by Decree 277/2022 of May 27, 2022, which makes access to the foreign exchange market more flexible depending on the increase observed in hydrocarbon production.
5. Public Finance
National tax collection grew in real terms during the first part of 2022, strengthening national tax revenues. The tax collection increased by 58.9% during the first quarter of 2022 compared to the previous year (see Figure 5.1), which meant a real growth of 4%. With data up to May, during the second quarter collection accelerated to 72.2% y.o.y. (+7.9% y.o.y. in real terms). The performance of taxes during the first five months responded to the consolidation of the economic recovery and the improvement in wages and employment. Taxes associated with foreign purchases maintained a high dynamism while export duties had a more limited advance.
During the first quarter of 2022, revenues of the National Non-Financial Public Sector (NFPS) grew 66.6% YoY (+8.7% YoY in real terms), while they increased to 67.6% YoY (+5.2% in real terms) in the second quarter with data as of May. Primary expenditure rose 71.0% YoY (+11.6% YoY in real terms) during the first three months of the year and expanded at a rate of 87.9% YoY (+17.9% YoY in real terms) between April and May. The increase in expenditures was widespread among the main items of expenditure, while those linked to social programs, economic subsidies and current transfers to the provinces stood out for their dynamism. This evolution reflected the impact of the external context on public finances: the sharp rise in international energy prices increased the magnitude of economic subsidies – given the proposed tariff update path – while the National Government implemented extraordinary reinforcements of household income in the face of the abrupt rise in food prices worldwide.
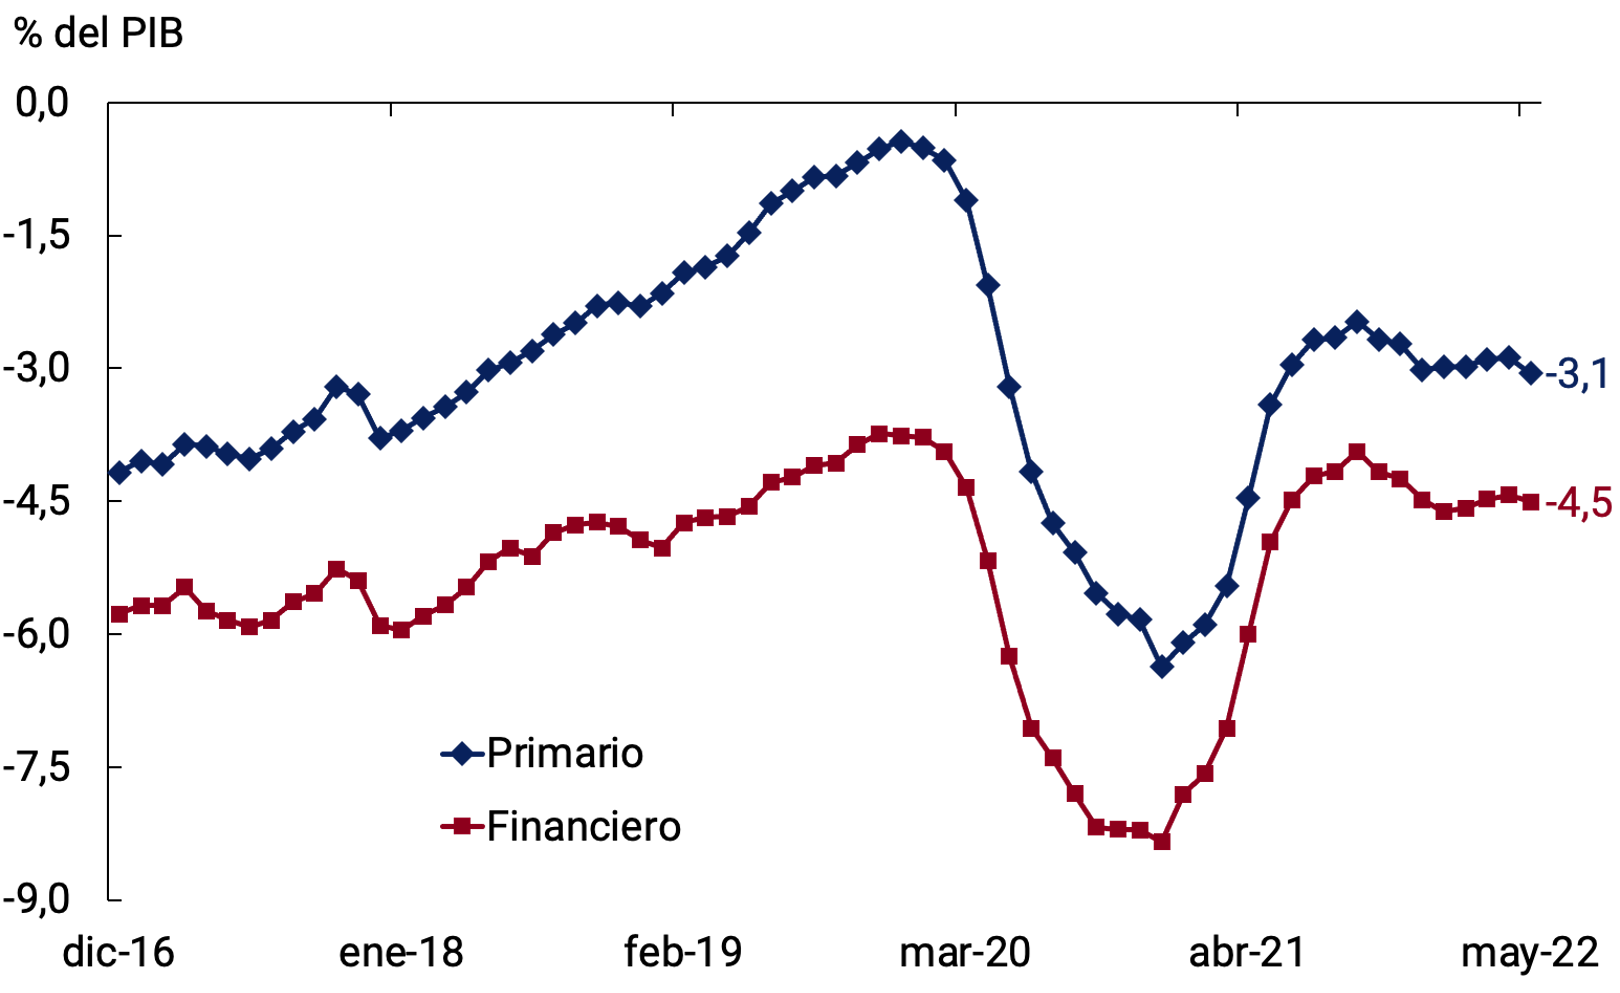
Thus, in the first five months of the year, primary expenditure grew above the increase in revenues, with a considerable impact on the primary deficit in the second quarter. However, the fiscal deficit on a cash basis of the NFPS in terms of GDP remained at levels similar to those of the end of 2021 for an amount equivalent to 3.1% of GDP, a deficit level significantly lower than that observed during 2020 (6.4% of GDP).
With respect to the Extended Facilities Program (PFE) with the International Monetary Fund (IMF), the fiscal targets agreed upon for the first quarter of the year were met, while no modifications are expected for the annual primary deficit targets of the NFPS (2.5% of GDP) or financing by the BCRA to the National Treasury (1% of GDP). This implies the adoption of compensatory measures that reduce the magnitude of the deficit in the second half of the year. The National Government, through Decree 331/22, updated the National Budget, adapting it to the current conditions of the macroeconomic context. The Ministry of Economy has stated22 that the budgetary result derived from Decree 331/2022 is consistent with a projection of the primary deficit base cash of the National Public Sector (SPN) of 2.5% of GDP.
The stock of National Public Debt at the end of May23 , 2022 represented approximately 77% of GDP, exhibiting a reduction of about 12 p.p. compared to the end of 2019. The financing strategy made it possible to obtain net funding of about $660,000 million in the first five months of the year, while an extension of the terms of the instruments tendered in the market was sought, evidencing a growth in the share of debt adjustable by the Reference Stabilization Coefficient.
5.1. National tax collection grew in real terms during the first part of 2022, strengthening national tax revenues
National tax collection increased 58.9% during the first quarter of 2022 compared to the previous year (see Figure 5.1), which meant a real growth of 4%. With data up to May, during the second quarter collection accelerated to 72.2% y.o.y. (+7.9% y.o.y. in real terms). The performance of taxes during the first five months was mainly due to the consolidation of the economic recovery and the improvement in wages and employment. Taxes associated with foreign purchases maintained a high dynamism while export duties had a more limited advance, given the impact of the drought on the agricultural harvest, although sustained by higher international grain prices.
Figure 5.1 | Contribution to the growth of national tax
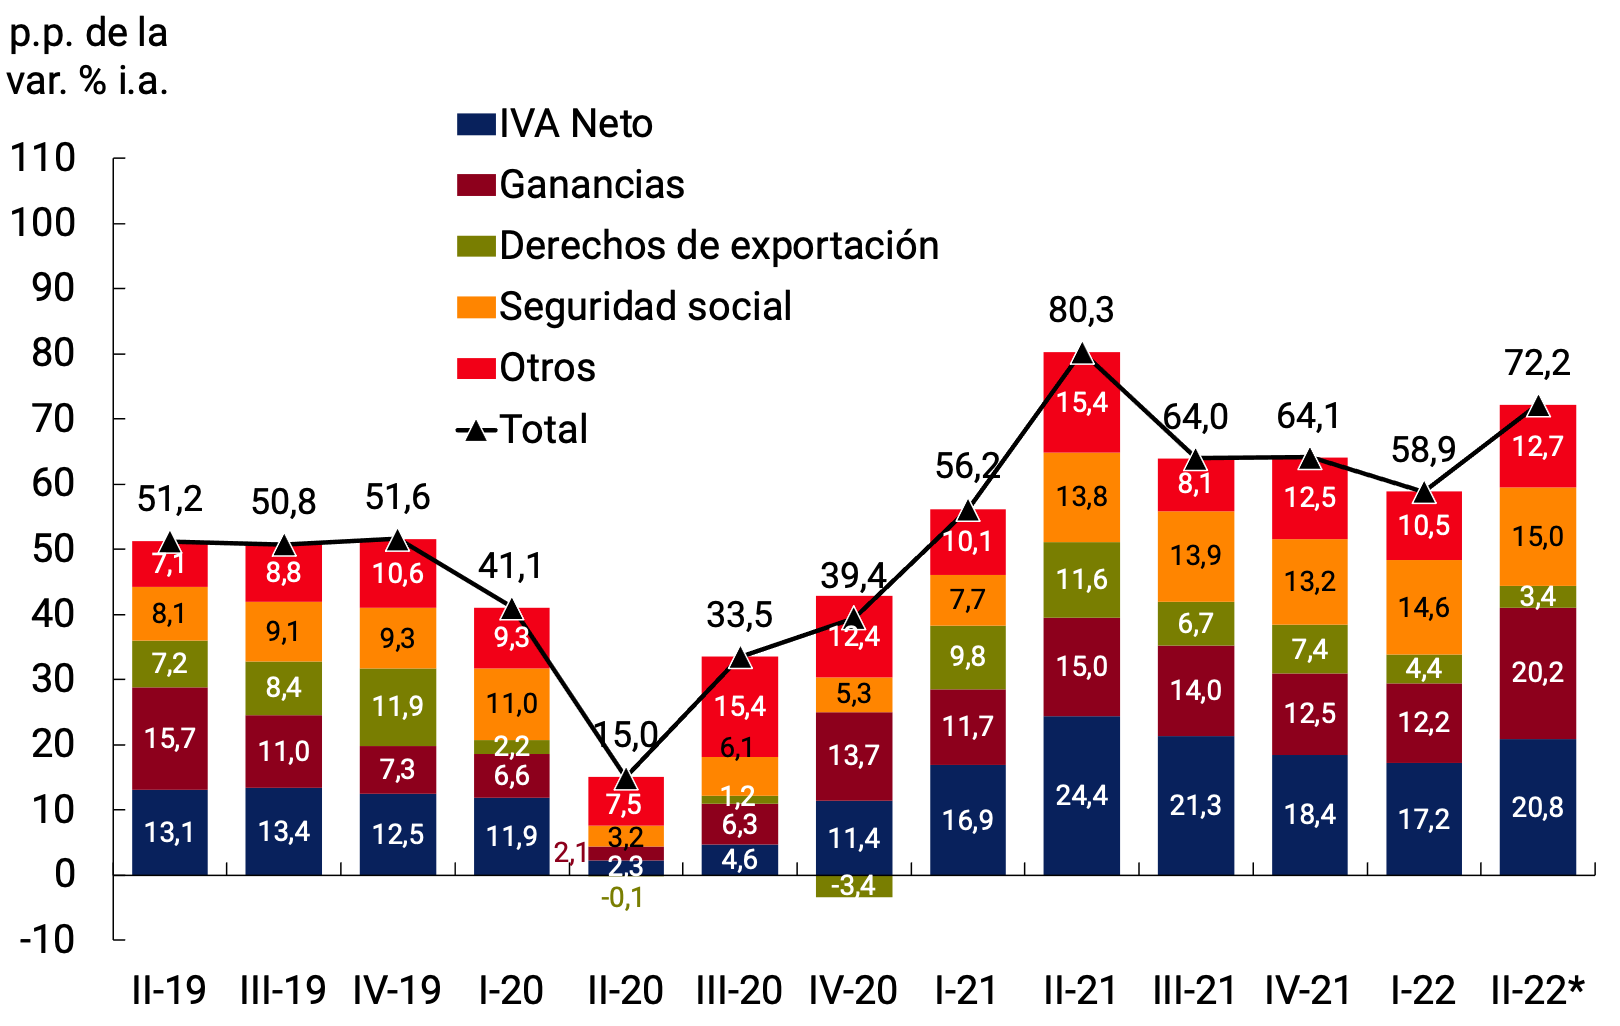
collection
* Data as of May-22.
Source: BCRA based on AFIP data.
The vast majority of taxes related to the domestic market (Value Added Tax (VAT), Profits, among others) performed well at the beginning of the year, mainly due to the maintenance of the recovery of economic activity. Net VAT grew 55.9% YoY in the first quarter and 71.4% YoY with partial data in the second. On the other hand, the Tax on credits and debits in bank accounts advanced 64.3% YoY and 61.3% YoY in the first and second quarters to May, respectively. The exemption to the Health sector (which is maintained until June 2022) operates negatively on this tax. The income tax showed great dynamism: it grew 63.1% YoY between January and March and 94.2% between April and May. This is explained by improvements in the labour market, as well as by better results of companies with a balance sheet closure in December 2021 compared to the previous period.
Other taxes had a more irregular start to the year: Internal Taxes grew 39.2% YoY between January and March and 55.2% YoY between April and May, while Fuels advanced only 23.3% YoY and 29.7% YoY in the same periods, mainly due to the delay in updating the tax. On the other hand, Personal Assets advanced 33.6% YoY and 18% YoY in the first and second quarters respectively, affected by a high base of comparison: last year a payment on account for assets abroad had been paid in April, which did not occur this year.
Social security resources increased by 65% YoY between January and March and 74% between April and May, explained by improvements in the labor market (see Chapter 3. Activity and employment), both due to increases in registered employment and improvements in the real formal wage. It is worth adding that these resources continue to be negatively impacted by the measures taken by the National Government – which remain in place until June 2022 – which reduced employer contributions in the health sector, to the critical sectors contemplated in the REPRO program and to companies located in the provinces of the Norte Grande.
Import duties and the statistical tax showed a joint increase of 66.8% y.o.y. during the first quarter and 69.5% y.o.y. in the second. This behavior was explained by higher imported values (see Chapter 4. External Sector). Finally, export duties had a more limited performance: +46.4% YoY between January and March and +33% YoY between April and May, in a context of drought that affected agricultural production, which was partly offset by the favorable international context for international prices of the main export products and the recovery of external demand.
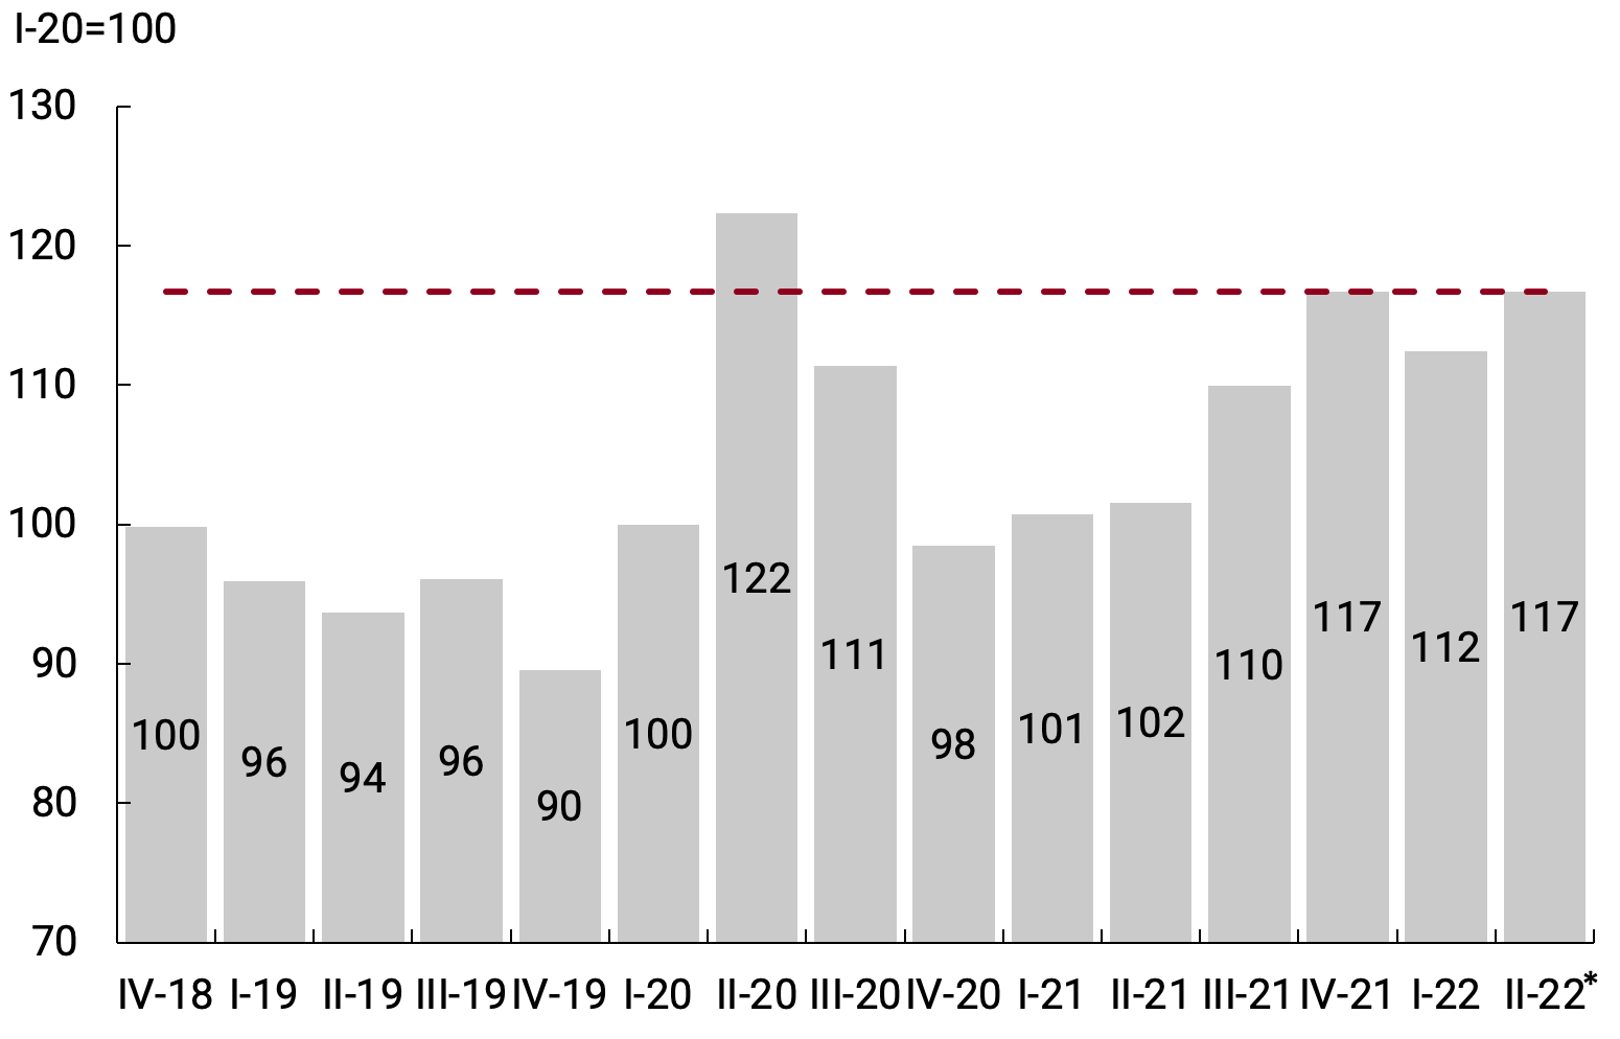
In real terms, seasonally adjusted national tax collection grew 1.2% in the first quarter of 2022 and fell by a similar magnitude during the second quarter with partial data as of May. In any case, this indicator was 16.6% above the pre-pandemic level between April and May (see Figure 5.2). This performance reflects the consolidation of the recovery in tax revenues after the harmful effects of the COVID-19 pandemic. In relation to 2019, the tax structure had been modified at the end of 2019, mainly from the creation of the PAIS Tax, the modification of the export duty rates, the changes on the Personal Property Tax, as well as the revision of the tax reform promoted during 2017 that affected social security resources.
Figure 5.2 | Real seasonally adjusted national
tax collection
*Data as of May-22.
Source: BCRA based on data from the Ministry of Economy and AFIP.
The evolution of tax revenues allowed the total revenues of the National Non-Financial Public Sector (NFPS) to increase in nominal terms by 66.6% YoY in the first quarter (+8.7% YoY in real terms) and 67.6% YoY in the second quarter (+5.2% YoY in real terms, with partial data as of May-22). The performance of resources was affected by the extraordinary registration of property income linked to the primary issuances of public securities24. For this reason, property rents increased 242% YoY between January and March and 325% YoY between April and May. Net of this effect, funds would have shown a nominal increase of 60% YoY in the first quarter and a similar figure in April. Tax and social security revenues increased by 58% YoY in the first quarter and 68.2% YoY in the second.
Meanwhile, the tax collection of the provinces as a whole exhibited a behavior consistent with what was observed at the national level. According to the partial information available for the main districts, in the first quarter of the year the nominal advance of own tax resources would have shown an increase of close to 55% YoY, while at the beginning of the second quarter it would have expanded by around 63% YoY.
5.2. NFPS primary expenditure expanded in real terms, with the boost of subsidies and social programs standing out in the face of the deterioration of the international context
NFPS primary expenditure exhibited a nominal increase of 71.0% y.o.y. during the first quarter of 2022, slightly above the nominal advance of revenues in the same period. During the first quarter, real primary expenditures advanced 11.6% compared to the same quarter of 2021 (see Figure 5.3). However, the data for the months of April and May provide a growth in primary expenditure of 17.9% in real terms for the second quarter of the year compared to April and May 2021.
Figure 5.3 | NFPS

Real Primary Income and Expenditures
* Net of Special Drawing Rights (SDR) Allocation in Sep-21.
** Data as of May-22.
Source: BCRA based on data from the Ministry of Economy and INDEC.
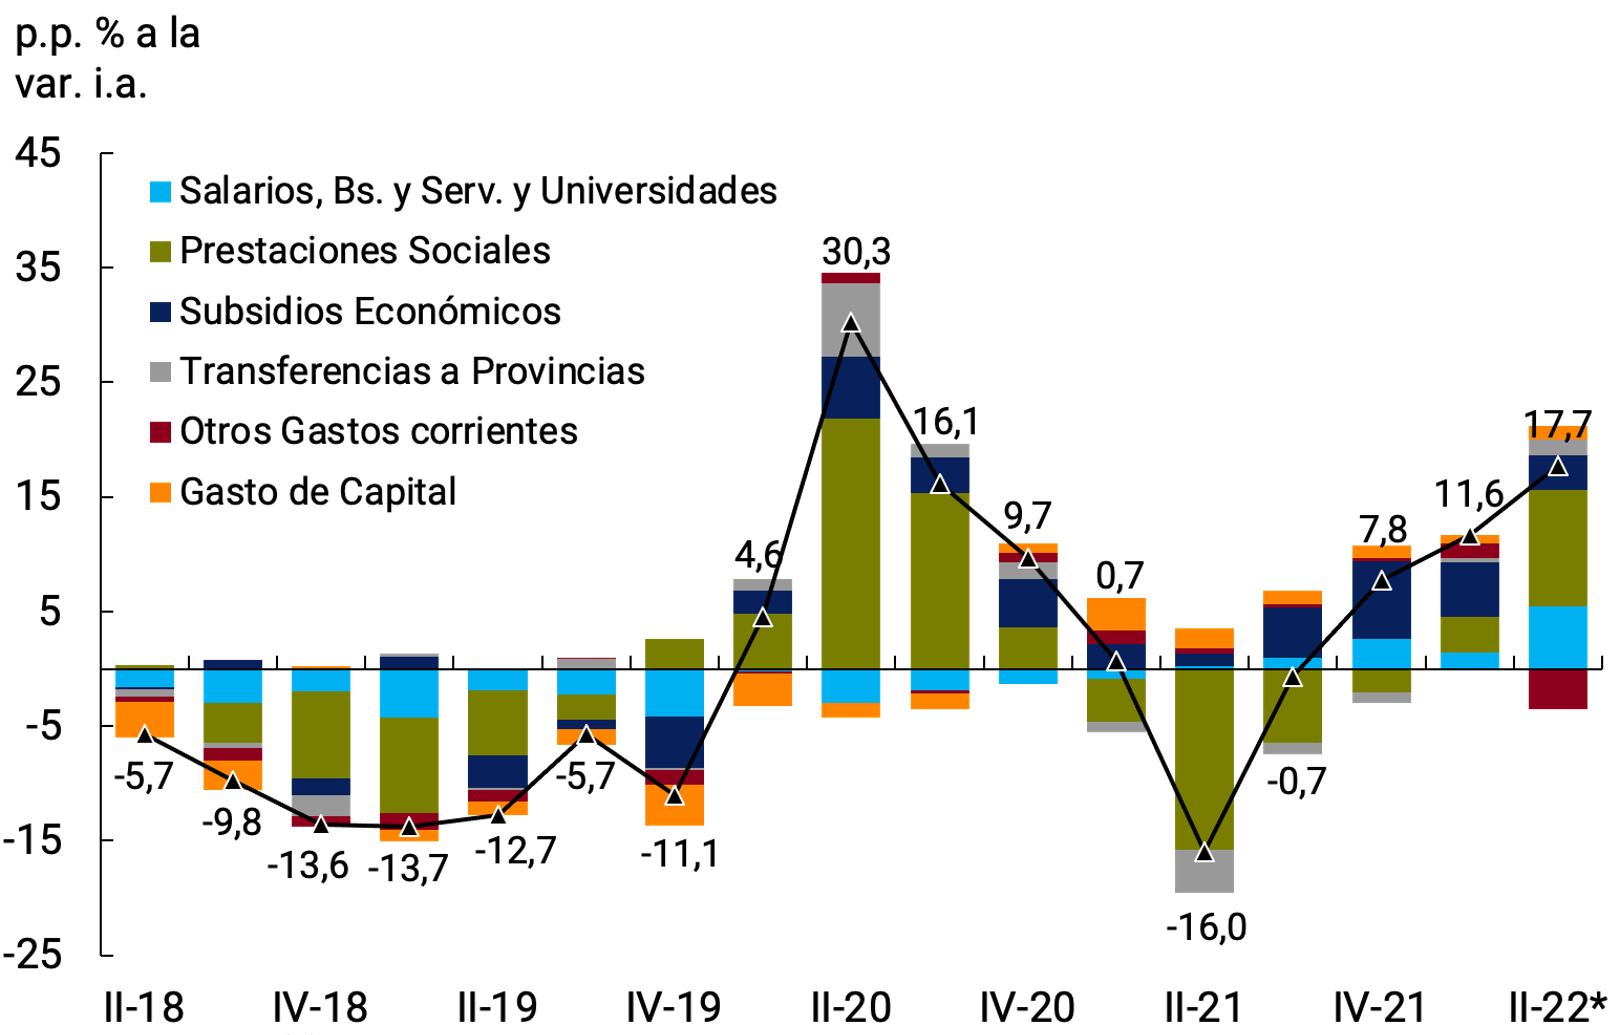
Spending grew in a widespread manner among the main items, although the increases in social programs, economic subsidies and current transfers to the provinces stood out. This evolution reflected the impact of the external context on public finances: the sharp rise in international energy prices increased the magnitude of economic subsidies – given the proposed tariff update path – while the National Government implemented extraordinary reinforcements of household income in the face of the abrupt rise in food prices worldwide.
Figure 5.4 | NFPS
seasonally adjusted real primary expenditure
*Data as of May-22.
Source: BCRA based on data from the Ministry of Economy and INDEC.
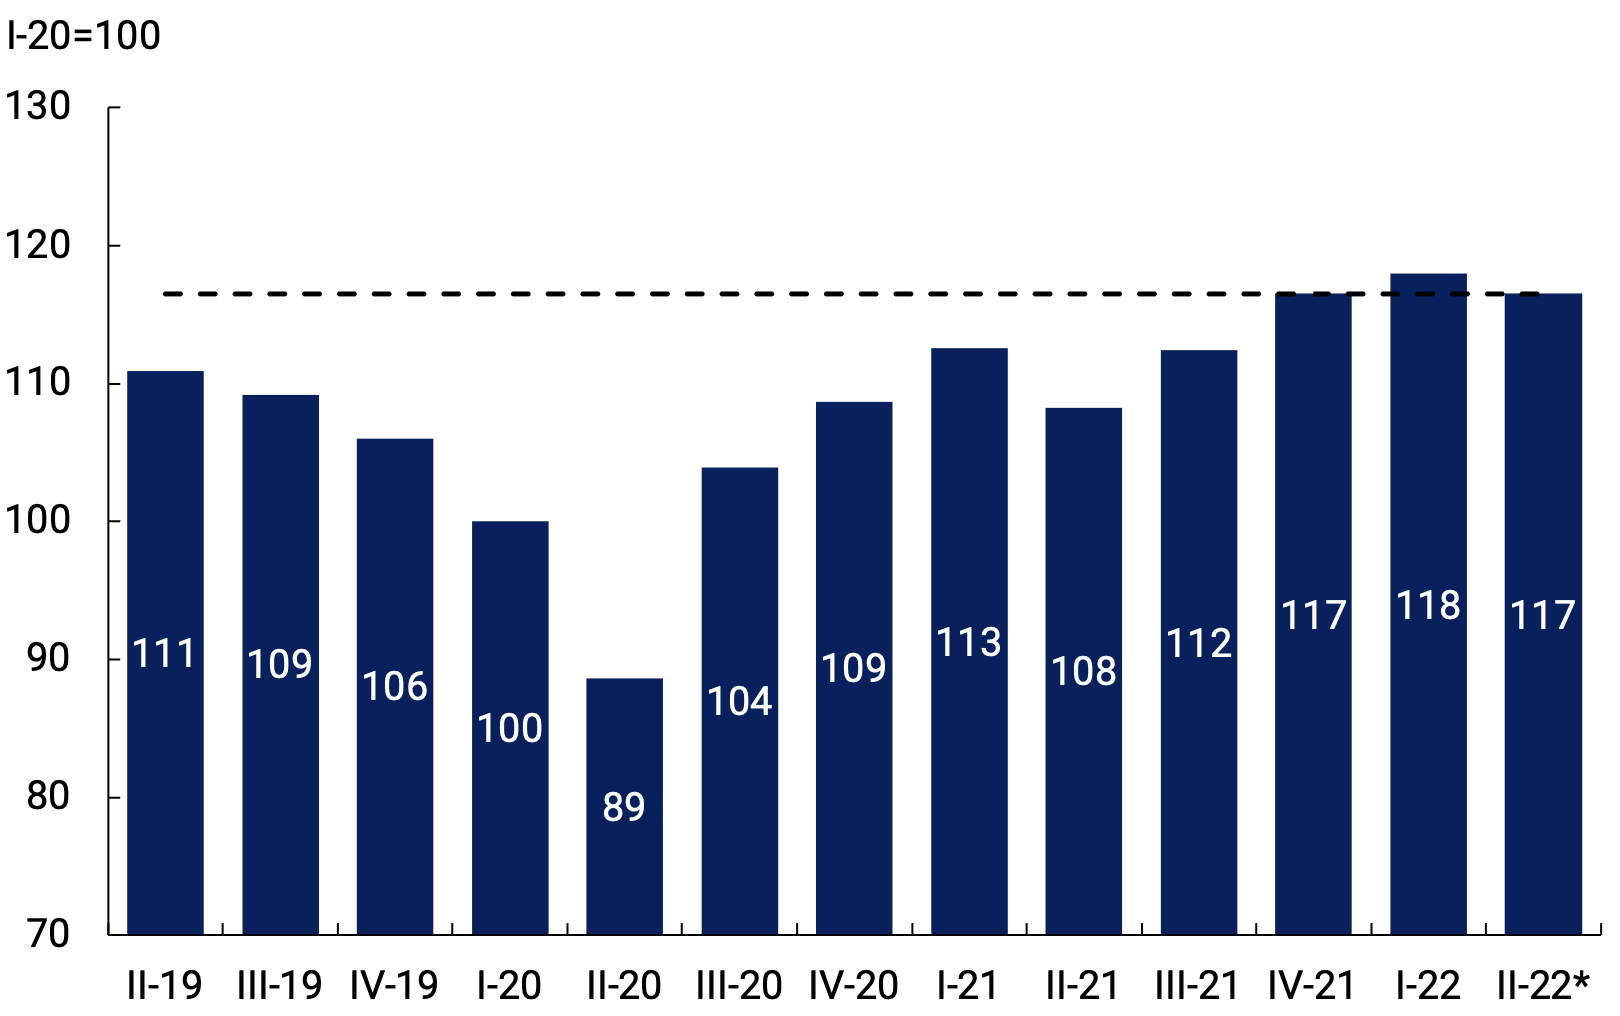
In this regard, seasonally adjusted real primary expenditure was 17% above the pre-pandemic level (I-20) and the fourth quarter of 2018 in the fourth quarter of 2021 (see Figure 5.4). In the first quarter of 2022, this level had fallen by 5 percentage points; however, considering the social containment measures adopted and the higher costs of subsidies in the face of the international shock of commodity prices, a real level similar to that of the end of 2021 was recovered.
Among the main items of expenditure that explain this evolution are social benefits and economic subsidies (see Figure 5.5). Expenditure on pension benefits (retirements and pensions) increased by 5.3% YoY in real terms in the first quarter of the year and by 3.6% YoY during the months of April and May. This behavior is influenced by the provisions of the salary adjustments in accordance with the Pension Mobility Law25, which established a variation of 58.62% y.o.y. in the salaries to March, 3.5 p.p. more than the accumulated inflation in the last 12 months to March 2022. In June, the more than 7 million people who are holders of retirements and pensions will automatically contemplate the half bonus together with their assets, while they will receive their pension benefits with the 15% increase corresponding to the second quarterly increase in the year provided for by the Pension Mobility Law. This improvement also includes family allowances, including the Universal Child Allowance (AUH) and Pregnancy Allowance, impacting the income received by almost 9 million children and adolescents.
Figure 5.5 | Contribution to the growth of primary expenditure of the NFPS
*Data as of May-22.
Source: BCRA based on data from the Ministry of Economy and INDECs.
As for the remaining social benefits, these expenditures had a slight reduction in real terms during the first quarter, but a strong real boost from the months of April and May (51.3% YoY). This was due to the income reinforcement policies carried out by the National Government to protect and improve the purchasing power of households in the face of the sharp increase in food prices globally. In this way, some 7.5 million people with informal jobs, in private homes, social monotributistas and categories A and B received economic assistance during May and June of $9,000. On the other hand, around 6 million retired people and pensioners with monthly incomes of less than 2 minimum salaries, received together with their May salaries a sum of $12,000, which is in addition to the $6,000 bonus in April for those who receive a minimum pension.
In this category of social benefits, a large part of the programs to sustain income have been incorporated since 2020 (such as the Emergency Family Income (IFE) and the Emergency Assistance Program for Work and Production (ATP). Once the stage of Mandatory Preventive Social Isolation (ASPO) due to the COVID-19 pandemic was over, these programs gave way to income and employment programs such as the Productive Recovery Program (REPRO)26 or the National Program for Socio-Productive Inclusion and Local Development “Empower Work”27, which provide assistance for up to a maximum of fifty percent 50% of the value of the Minimum Living and Mobile Wage28 (SMVyM; see Section 3 / Measures taken to reinforce income). In the second quarter, the disbursements of the Food Policies program are also highlighted, which had a 50% increase in the benefit, which 2.4 million beneficiaries receive and reaches 4 million people, bringing the new amounts since May to $9,000 for families with a child up to fourteen years of age or disabled or receive the pregnancy allowance. $13,500 in the case of families with two children and $18,000 in the case of families with three or more children under 14 years of age. For their part, for all workers who receive family allowances, since October 2021 a monthly supplement has been in force that doubled the family salary for those who received family incomes of up to $115,062 and that with the successive increases in the family salary was losing share.
On the other hand, the attention to the requirements to pay for the provision of public services until the end of May, in a context of rising energy and fuel costs – as a result of the war between Ukraine and Russia – and the higher domestic costs of electricity production due to the lower contribution of hydroelectric generation (in a context of low rivers due to drought), led to economic subsidies accounting for a growing portion of primary expenditure, growing 45.2% YoY in real terms in the first quarter of the year and 22.3% YoY in real terms in April and May. This increase in participation was mainly due to the increase in expenditure associated with energy subsidies and subsidies for public passenger transport.
In relation to electricity and gas tariffs, a segmentation of subsidies was formalized with an effective date as of June 202229. The new subsidy regime defines three segments of users, classified by the Ministry of Energy according to objective criteria of income and externalization of assets. Those with higher incomes will pay the full cost of electricity and natural gas services. There will be a harmonization process and the subsidy removal will be carried out gradually and in bimonthly thirds, so that people within this segment will be paying the full cost of energy by the end of 2022. Secondly, for the lower-income segment, energy increases may not exceed 40% of the increase in the Wage Variation Coefficient (CVS) of the previous year. Finally, for middle-income users, the tariff increases will be up to 80% of the CVS growth. The middle- and low-income segments will not have a new increase in bills for the year 2022.
Items associated with salaries (including transfers to National Universities) and operating expenditure grew 7.1% YoY in real terms in the first quarter of the year and 13% YoY in real terms in April and May. It should be noted that the latter item includes purchases of goods and services (including expenditures associated with the purchase of COVID-19 vaccines and expenses associated with the organization of the National Census). On the other hand, current transfers to provinces30 boosted their rate of increase (+10.6% real y.o.y. during the first quarter and 45.4% y.o.y. real between April and May).
Capital spending, in line with the definition of priorities set out to sustain the recovery of economic activity, grew 11.2% YoY in real terms during the first quarter and 16.2% YoY in April and May.
Considering that in the first five months of 2022 NFPS revenues grew 67% YoY (7.2% YoY in real terms), and that primary expenditures advanced 78.2% YoY (+14.1% YoY in real terms), the NFPS primary deficit stabilized at around 3.1% of GDP (see Figure 5.6). For its part, the financial deficit of the NFPS accumulated in the same period stood at 4.5% of GDP. The National Government updated the National Budget31 , adapting it to the current conditions of the macroeconomic context, in order to establish a framework of predictability for fiscal and financial management, determining a new calculation of resources and credits of the National Public Administration (APN), as well as a determination of the primary deficit on an accrual basis. The Ministry of Economy has stated that the result derived from the budget modification is consistent with a projection of the primary deficit base cash of the NFPS of 2.5% of GDP.
Figure 5.6 | Fiscal Result of the National Non-Financial
Public Sector Accumulated 12 months
Note: the allocation of Special Drawing Rights (SDRs) of the IMF for $427,400 million in Sep-21 are excluded among the Revenues.
Source: BCRA based on data from the Ministry of Economy and INDEC.
Box. Meeting the fiscal targets agreed with the IMF
During the first quarter, the fiscal targets agreed upon under the Extended Facilities Program (PFE) were met, as detailed in Table 5.1.
Table 5.1 | Fiscal targets under the Extended
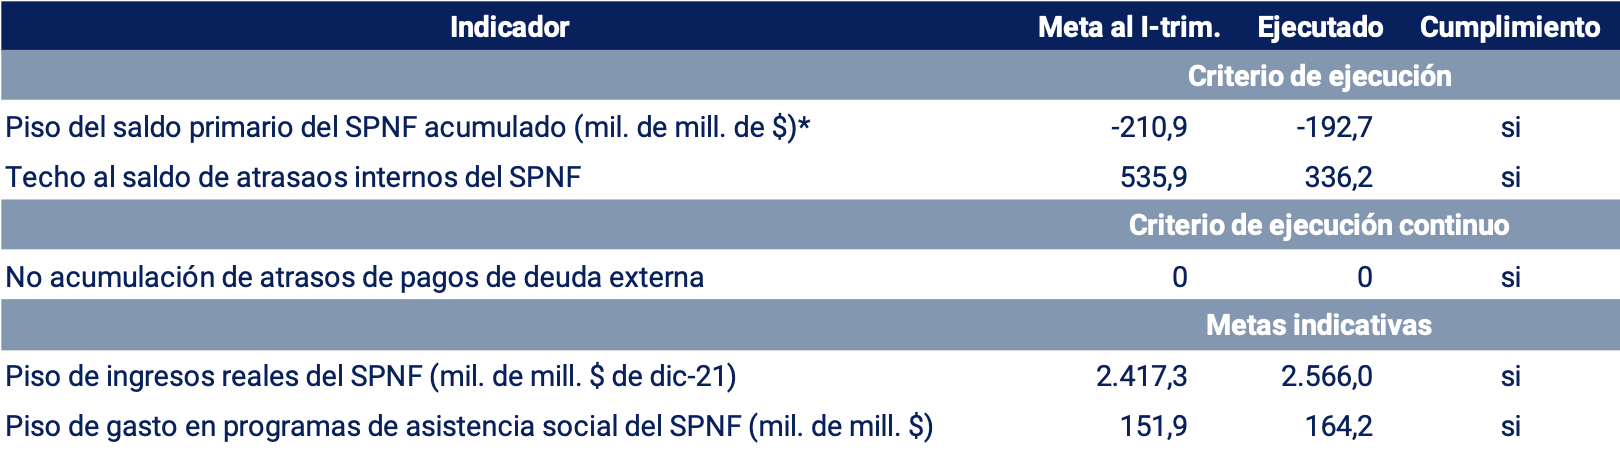
Facilities Program
*Adjusted according to adjustment factors defined in the Technical Memorandum of Understanding with the IMF.
Source: BCRA based on the First Review of the Extended Facilities Program (IMF).
On the one hand, the primary result of the NFPS cumulative to March 2022 was $192.7 billion, $18.2 billion below the quantitative target stipulated by the PFE. Second, the indicative target for the NFPS real income floor was comfortably met for the first three months of 2022. Real income was 6.2 per cent higher than the indicative target. Third, the agreement incorporated a target for a real social expenditure floor. Social spending included expenditures for the Universal Child Allowance, the Progresar plan and food programs. The sum of these expenditures resulted in the accumulated of the first three months of 2022 at around $164.2 billion, complying with the indicative floor of the agreement. Fourth, the financing of the National Treasury by the BCRA through Transitory Advances did not exceed the ceiling indicated in the PFE targets: $122 billion of this type of financing was accumulated, some $115 billion less than the ceiling provided for in the agreement (see Figure 5.7).
Figure 5.7 | Accumulated Primary Deficit and IMF
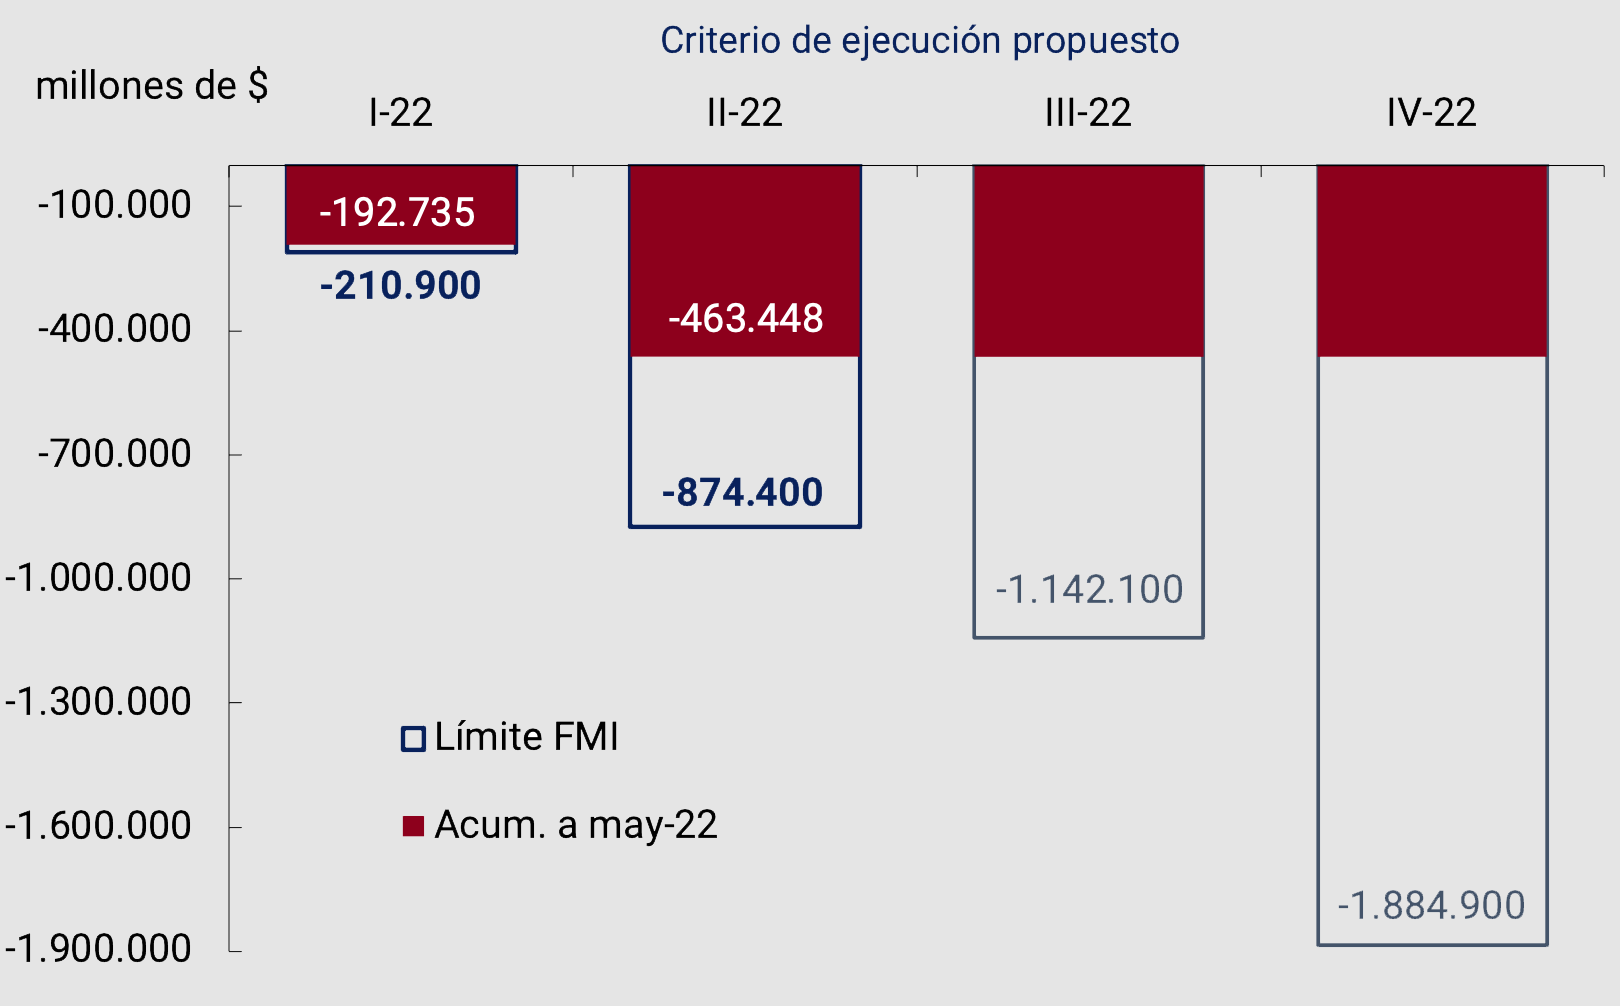
Target
Note: Targets subject to adjustment factors defined in the Technical Memorandum of Understanding (IMF).
Source: BCRA based on data from the Ministry of Economy and IMF.
The implementation of a battery of measures by the National Government to sustain the income of the population in a situation of vulnerability in the face of the acceleration of inflation and the higher costs of subsidies, had a considerable impact on the primary deficit of the second quarter. The forecasts for updating public service rates were effectively applied only at the beginning of June, after regulatory compliance that requires public hearings to be held and contemplating the criteria of gradualness required by jurisprudence. With the aim of achieving compliance with the annual fiscal target, within the set of compensatory measures for the second half of the year, the national government sent to Congress the Unexpected Income bill that seeks to reduce the distributional impact caused by the consequences of the war in Ukraine on food prices. The initiative proposes the exceptional modification of the law that regulates the Income Tax in the country, adding an additional rate of 15%, which will be charged only once, on those activities that have had what the Government considers an “unexpected income”.
Recently, the IMF and the Argentine authorities reached an agreement at the technical level on the first revision of the EFP. The review focused on evaluating the performance since the approval of the agreement, contemplating the impact of the war in Ukraine on the Argentine economy and identifying policies that allow its effects to be mitigated. With the aim of strengthening macroeconomic stability, it was agreed to keep the annual targets established in March unchanged, changing its quarterly trajectory. After meeting all the program’s quantitative targets for the first quarter of 2022, the agreement on the first review was approved by the IMF’s executive board.
5.3. The treasury obtained positive net market financing in the first months of the year
The stock of National Public Debt at the end of April 2022 reached approximately US$374,260 million and represented about 77% of GDP, exhibiting a reduction of about 12 p.p. compared to the end of 2019.
During the first quarter of 2022, the TN achieved a refinancing of 150% of the principal and interest services, which implied a net financing of approximately $641,153 million. In turn, so far in the second quarter of 2022, a period in which it sought to extend the term of the debt instruments tendered, the TN obtained a refinancing of 101.1% of the capital and interest services, which implied a net financing of approximately $17,754 million. Issuances of public debt instruments so far in the second quarter were mainly concentrated in securities adjustable by reference stabilization coefficient (CER), and discount bills, while, to a lesser extent, securities adjusted to the evolution of the dollar and at a variable rate were placed.
The extension of the maturities of the instruments issued increased, driven by the growth in the participation of the CER instrument in total placements; meanwhile, there was an increase in the nominal cost of financing in pesos.
On the other hand, during February, March and June 2022, voluntary debt conversion operations were carried out, which made it possible to significantly decompress the profile of short-term maturities, with a continuity of this type of operations expected. With the aim of developing the local peso debt market, the participation of the 2021 Aspiring Market Makers continued to be strengthened, and short-term investments continued to be offered to the Mutual Funds (FCI) from the auctions of Treasury Liquidity Bills (LELITES; very short-term and highly liquid instruments intended exclusively for subscription by FCI).
So far in 2022, and in line with the budget forecasts under the agreement with the IMF, the net financing of the NT contemplated, in addition to the financing obtained in the auctions of market instruments, the net transfer of $435,051 million. It was given as transitory advances from the BCRA to the NT and the variation in deposits that contemplated the partial use – in the amount of $322,449 million – of the budgetary support component provided for in the agreement with the IMF that the international organization had disbursed in Special Drawing Rights (SDRs) on the occasion of the initial signing of the agreement.
6. Pricing
In March 2022, inflation rose significantly, reaching a monthly rate of 6.7%, a very high record in historical terms. The acceleration in prices was mainly explained by the evolution of the Core category, to which were added increases in regulated education, gas and electricity services. After the maximum verified in March, monthly inflation moderated in April (6.0%) and May (5.1%), still remaining at levels higher than those observed in the first two months of the year. The year-on-year inflation rate was 52.8% in the first quarter of the year and rose to 60.7% in May, the latest data available.
The acceleration in food prices had a significant impact on the increase in core inflation, especially in March and April, driven by the increases in international commodity prices as a result of the war in Ukraine. This external shock affected Argentina in the context of a recovering economic activity and with a previous high inflationary inertia. Likewise, the existence of formal and informal indexation mechanisms increased the magnitude and persistence of the impact of this inflationary shock compared to what has been observed in other countries. Thus, there was an increase in inflation expectations, while the acceleration observed in food prices extended to the rest of goods and services, with high core inflation rates recorded in March (6.4%) and April (6.7%). After the peak reached in April, the core inflation rate fell in May to 5.2%. This incipient slowdown was largely explained by the slower rate of increase in food prices, particularly processed foods and meats.
For the second part of the year, core inflation is expected to gradually decline as the effects of the external shock continue to moderate. After the impact of the updates in utility rates during June, the general level of inflation would resume a path of gradual decline starting in July. This expectation of a gradual monthly deceleration in prices during the rest of 2022 is shared by market analysts, according to what the Market Expectations Survey (REM) suggests.
The national government and the BCRA will continue to adopt measures to lower inflation. In this sense, the validity of the agreement with the IMF will allow the consolidation of a framework of macroeconomic certainty, thus helping to limit expectations of an increase in the exchange rate and inflation. The BCRA will conduct its monetary and exchange rate policy, in a context of less financial assistance to the National Treasury, seeking a gradual convergence towards positive real interest rates and managing liquidity appropriately to preserve monetary stability without affecting the economic recovery.
6.1. Domestic inflation peaked in March and April amid sharp increases in international commodity prices
The year 2022 began with an increase in average inflation in January and February (4.3%) compared to that recorded in IV-21 (3.3%). This first acceleration in prices was largely explained by the sharp increase in vegetables due to climatic factors and also by the end of the “+Careful Prices” freezing program adopted by the National Government in October 2021 (see IPOM of March 2022).
Since the first days of March, there has been a second process of acceleration in prices, driven by the significant increase in international commodity prices as a result of the war between Russia and Ukraine that began on 24 February 2022. In March, the higher rate of increase in food prices at the domestic level was compounded by corrections in public service rates and fuel prices, which had been showing deteriorations in their relative prices. This process of acceleration of food and regulated prices was generalized to the rest of the consumption basket. Thus, the general level (NG) of monthly inflation reached its maximum level in March (6.7% NG; 6.4% Core) and Core inflation in April (6.0% NG; 6.7% Core). With the March increase, the first quarter of 2022 ended with an average monthly inflation of 5.1%, increasing 1.8 p.p. compared to the previous quarter, being the highest quarterly record since the current National CPI was published (see Chart 6.1).
Figure 6.1 | CPI. Monthly and quarterly evolution of the General
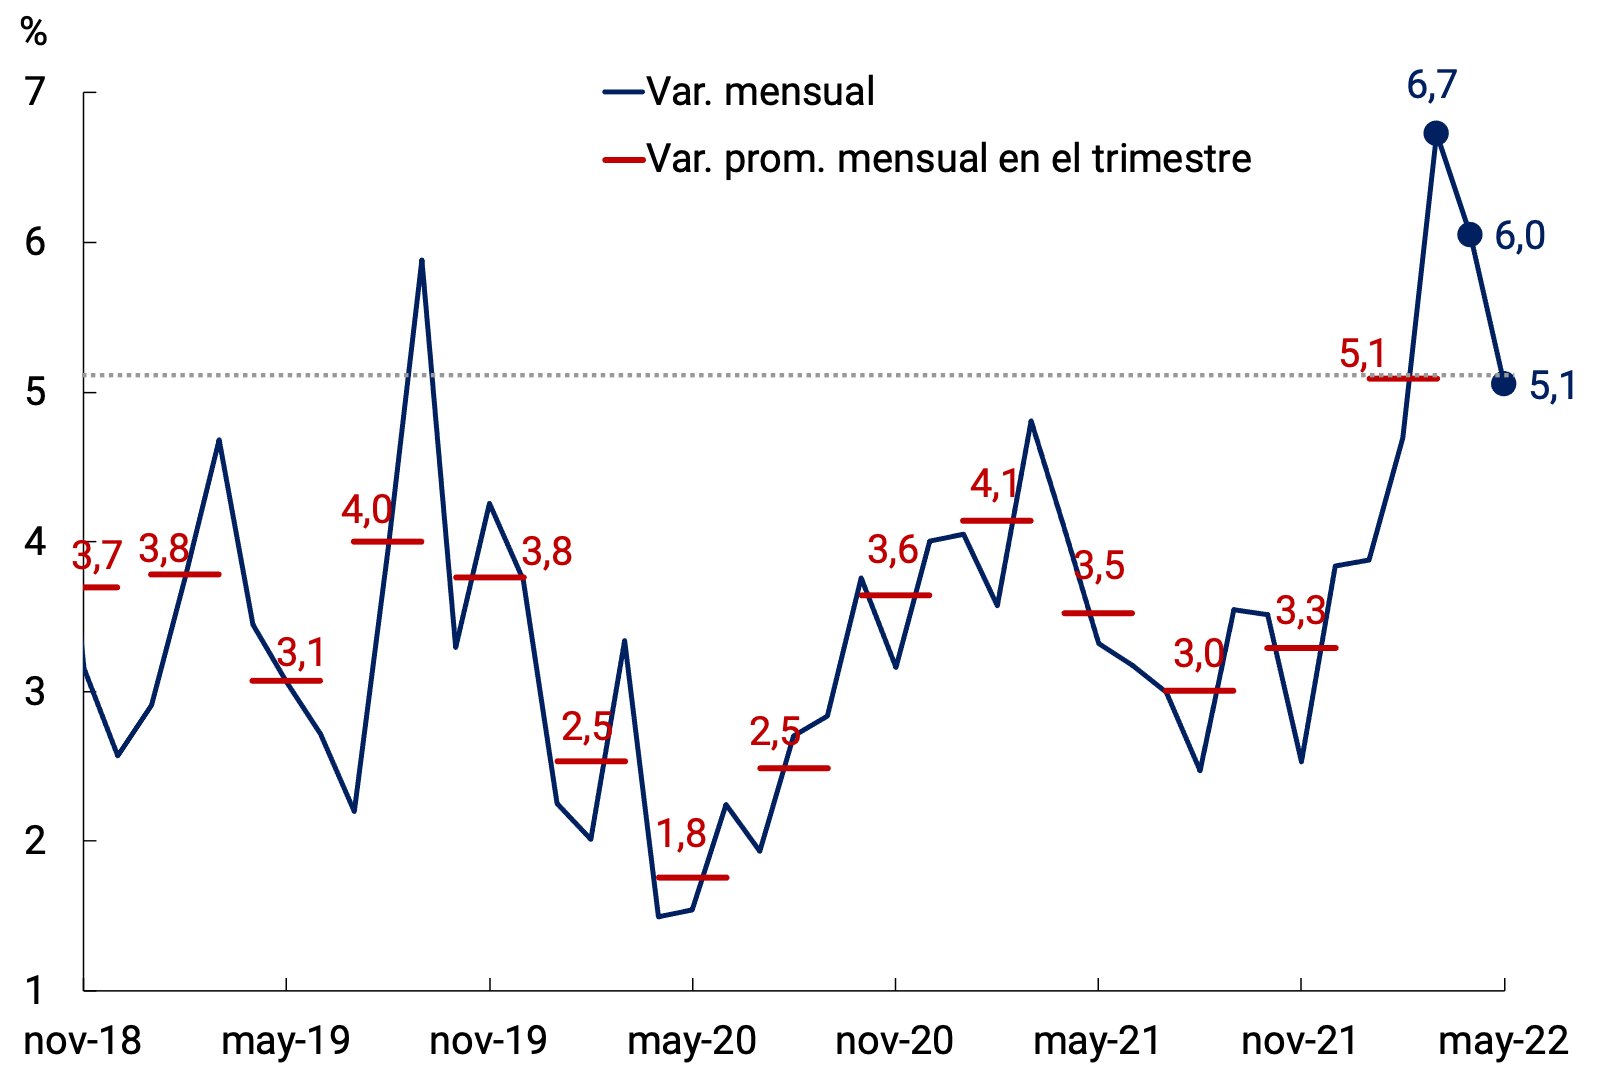
Level
Source: BCRA based on INDEC data.
In the April-May two-month period, the general level of inflation fell (5.5% monthly average, -1.2 p.p. compared to March), although it persisted at high levels, higher than the average of the 2020 and 2021 records. The slowdown between April and March (from 6.0% to 6.7% monthly) was explained by the evolution of Regulated (3.9%, -0.9 p.p. compared to March) and Seasonal (3.0%, -2.4 p.p.), while in May (NG 5.1%) the slower rate of increase in the Core category (5.2%, -1.5 p.p. compared to April) was particularly influential, largely due to the evolution of processed foods and meats.
The increase in core inflation in March and April was significantly impacted by the high rate of rise in average food prices, as a result of the war in Ukraine. This external shock affected Argentina in the context of a recovering economic activity with high inflationary inertia, directly impacting the prices of packaged foods and meats – both components of the Core category. In contrast, the average prices of foods that are part of the Seasonal category fell (Vegetables, tubers and legumes -1.9%), or slowed down (Fruits 2.4%, -6.5 p.p.) in the second two months compared to the first, a period in which they had shown very significant increases mainly due to climatic factors (see Figure 6.2). In May, packaged foods and meats reduced their rate of increase compared to April, while vegetables and fruits, as a whole, again showed a negative monthly variation (see Recent evolution of food prices).
Figure 6.2 | CPI Food and non-alcoholic beverages. Average monthly variation by quarter
and contributions by selected
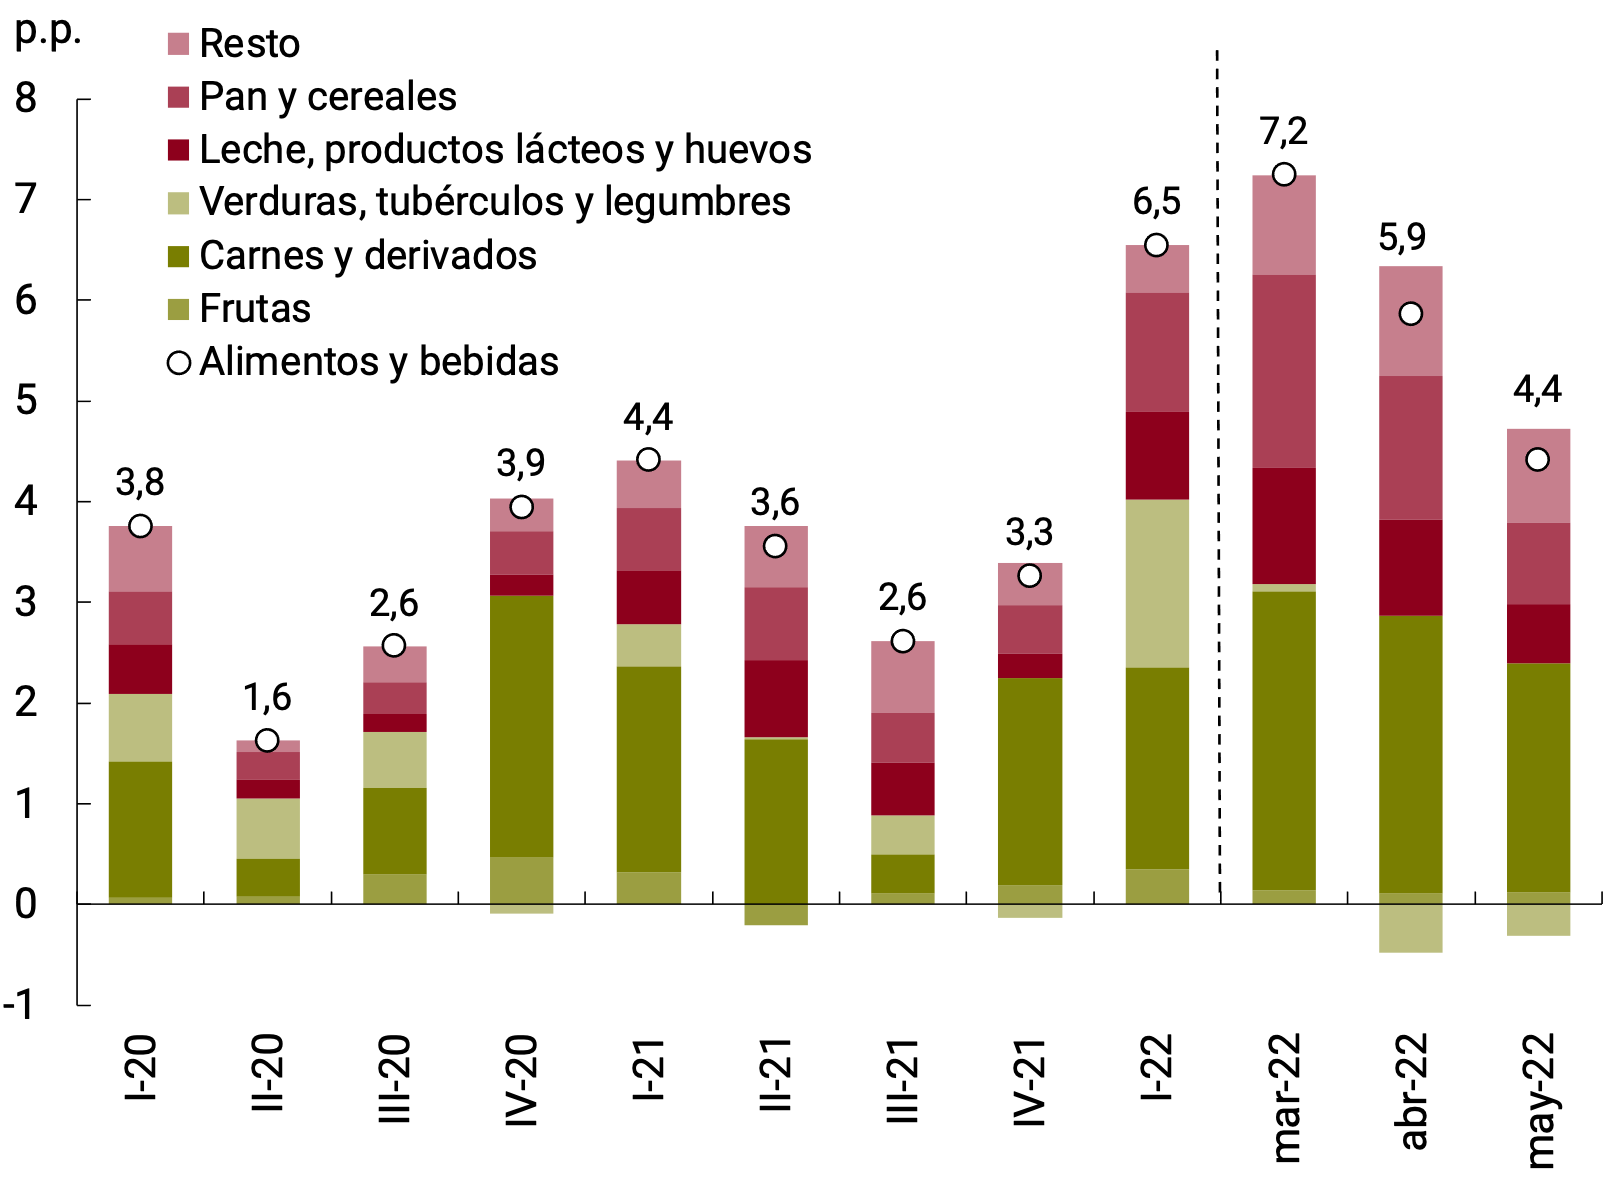
components
Source: BCRA based on INDEC data.
Regarding the evolution of the Meat and derivatives grouped during the second two months (8.0% average monthly increase), the increase in the international price of corn, the main input for fodder, was highlighted as an explanatory factor, which had the first impact on wholesale prices of beef, measured by the Liniers Market Steer Index (INML). In May, there were signs that would indicate the beginning of a trend of deceleration in the domestic price of meat, both at the retail level (6.2% compared to April, -1.4 p.p.) and wholesale. In this sense, the monthly fall in the INML in May (-0.6%), accompanied by the retraction of the international price of corn (-1%), would anticipate a possible new slowdown in meat at the retail level for June (see Figure 6.3).
Figure 6.3 | Evolution of retail and wholesale meat prices and the international price of corn
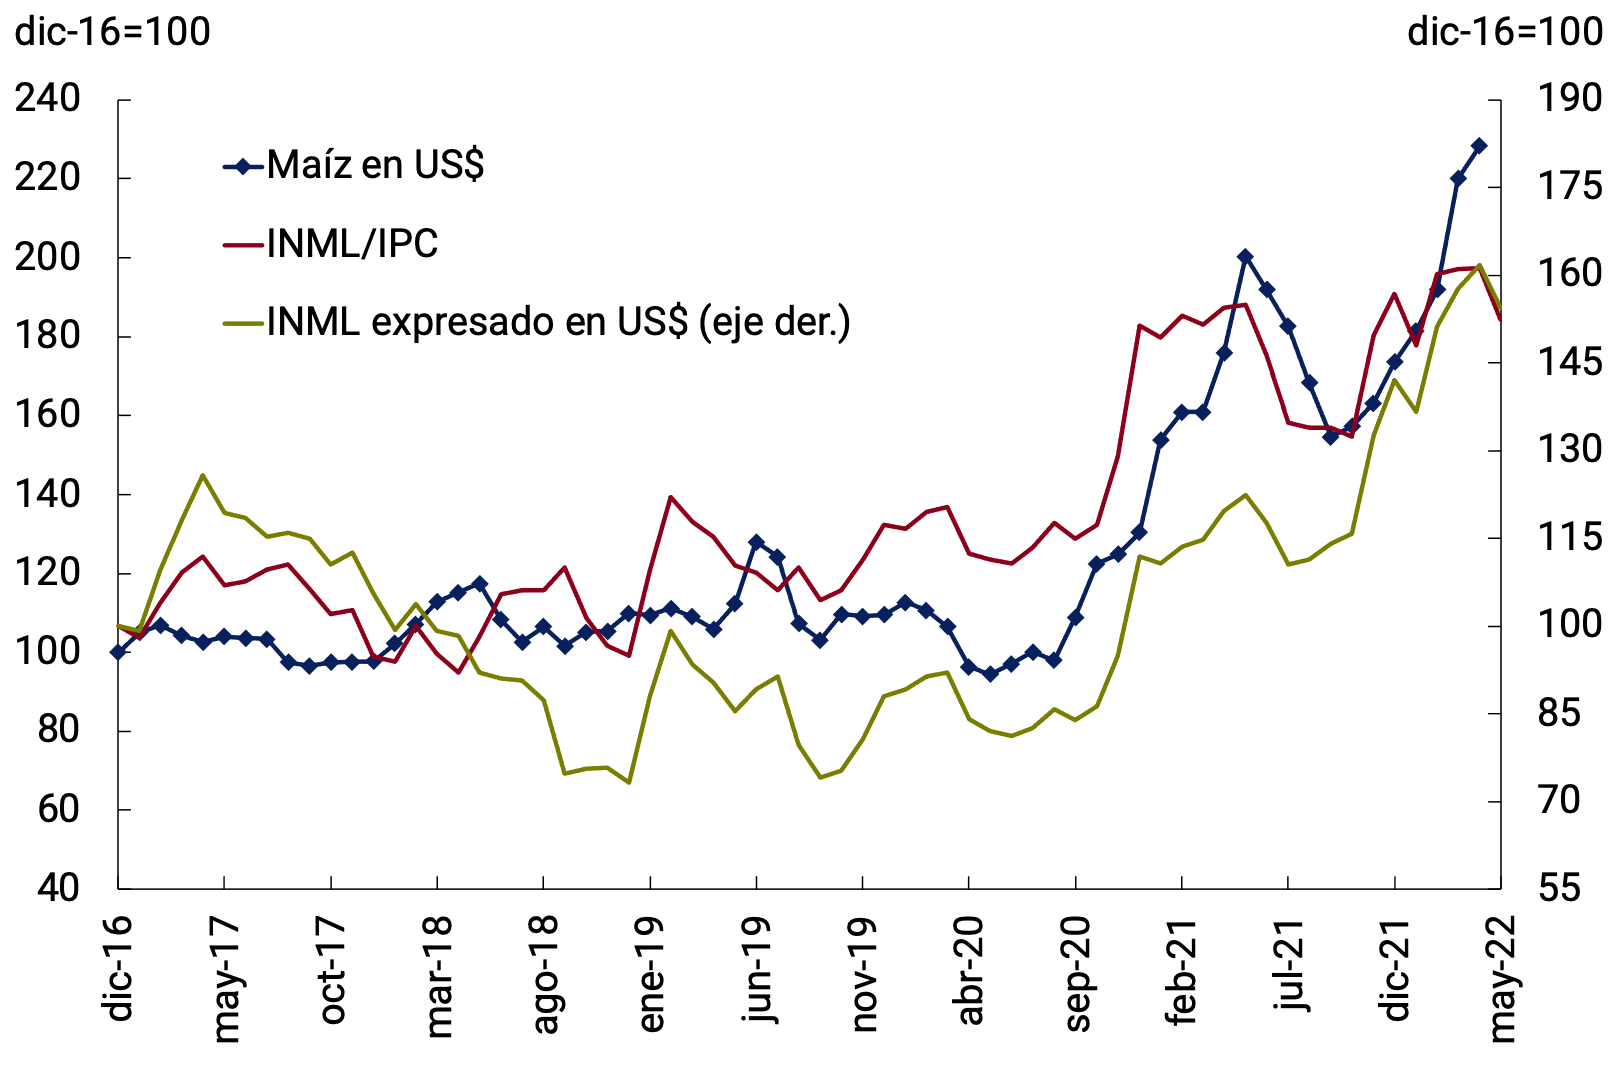
Source: INDEC, Cañuelas Agricultural Market and World Bank.

* Steer Index of the Cañuelas Agricultural and Livestock Market (ex Liniers Market)
Source: BCRA based on data from INDEC, Cañuelas Agricultural and Livestock Market.
On the other hand, packaged food and beverages (6.8% increase in the March-April two-month period) accelerated since the end of February, with very significant increases in bakery, dairy and sugars. In addition to the impact of international prices, the largest increases observed in packaged foods would have been associated with hedging strategies by several firms in the sector that, in the face of the announcement of possible government measures aimed at counteracting inflation, updated their price lists in advance in mid-March. Added to this was a downward trend in the proportion of prices that are part of the “+Precios Cuidados” program over the total of products surveyed by INDEC in GBA (6.0% coverage in May), after reaching the maximum in November 2021 (13.1%). This reduction in CPI participation continued in April and May, even as the new phase of the programme had incorporatedmore than 50 items and varieties (see Figure 6.4). After the acceleration of the second two months, packaged foods verified a significant reduction in the rate of increase in May, increasing 4.8% compared to April, a record similar to that observed in February 2022.
Figure 6.4 | Monthly evolution of fresh and packaged food and share of Precios Cuidados products in the total number of products surveyed in GBA
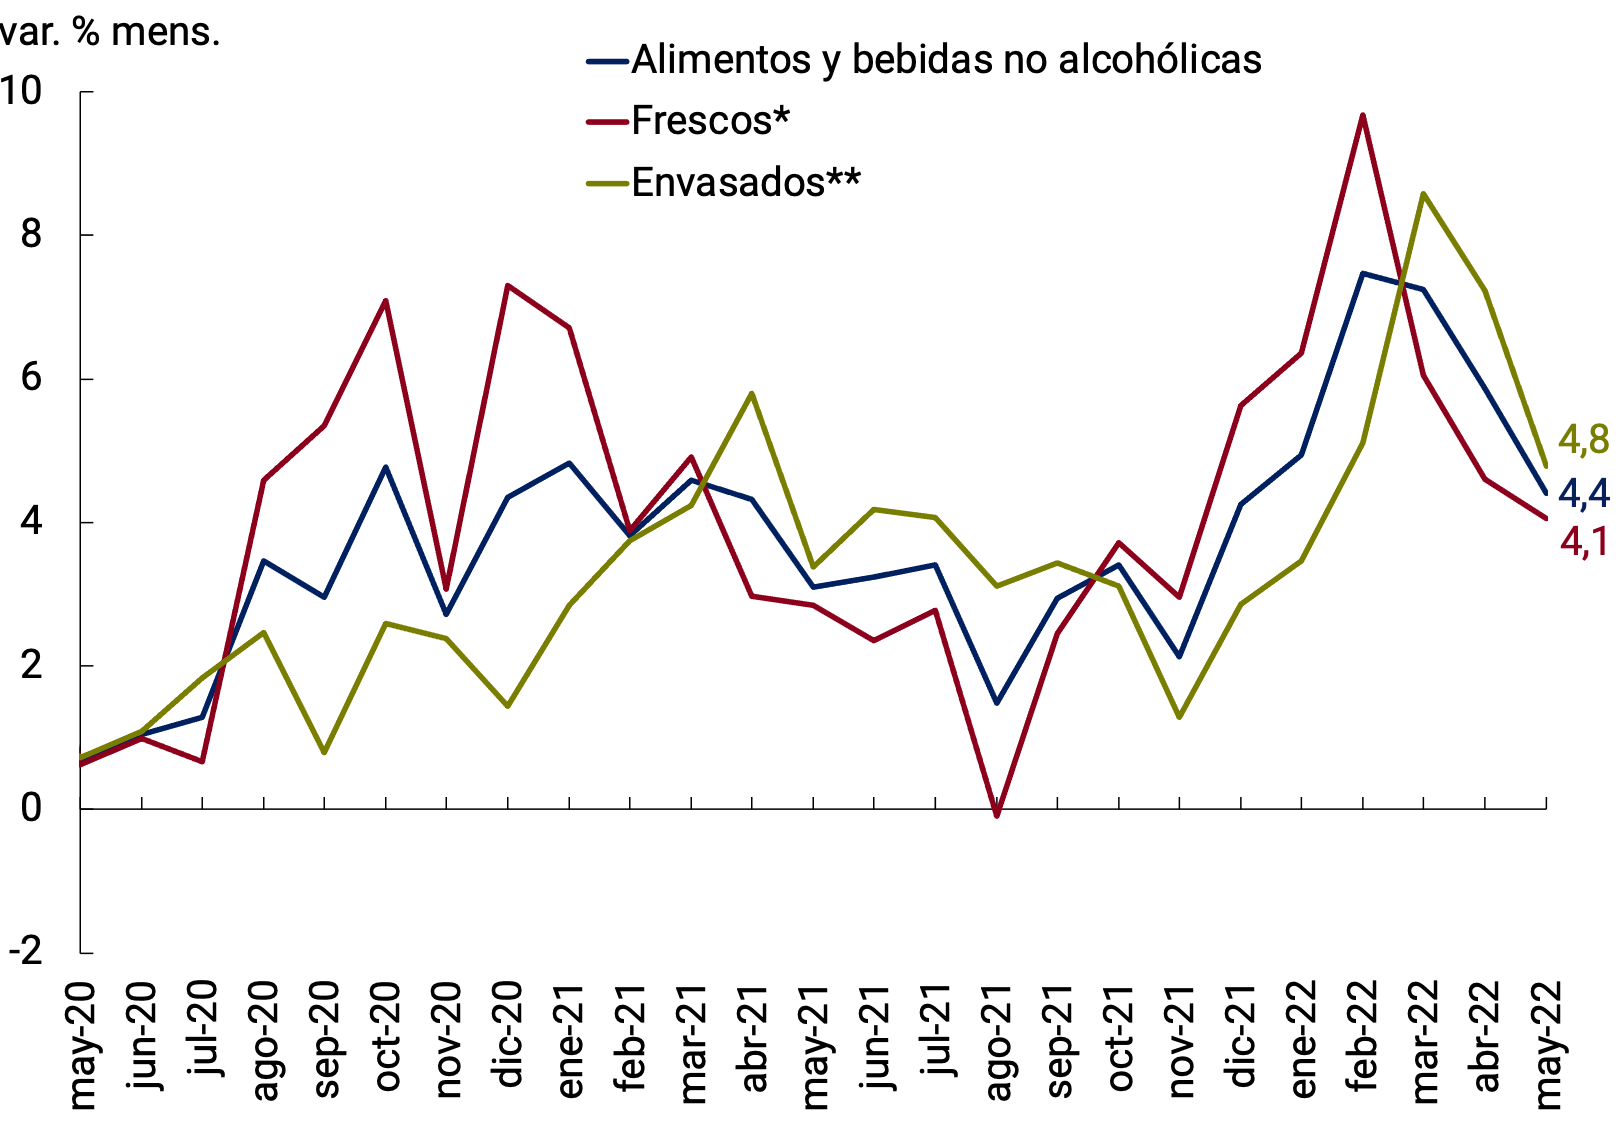
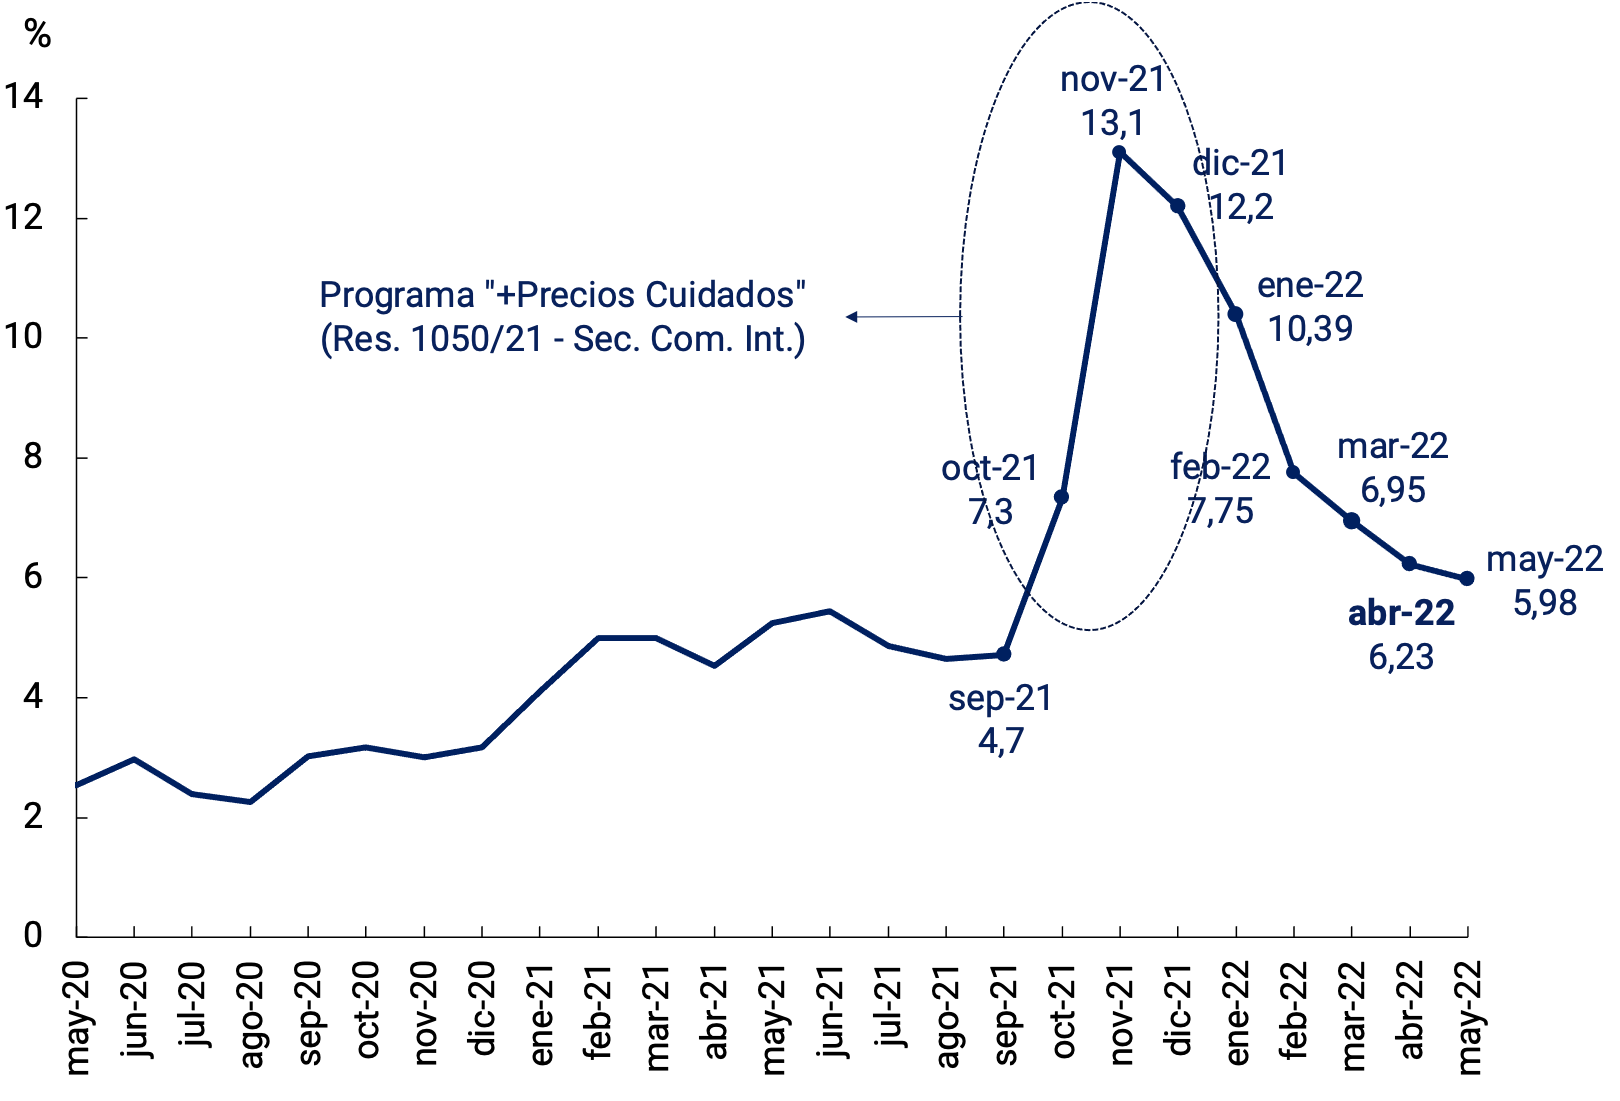
*Includes meats and meat products, fruits and vegetables.
** Includes baked goods, dairy, oils and fats and non-alcoholic beverages mostly included in price programs.
Source: INDEC.
In addition to the aforementioned increase in the rate of increase in Food and beverages during the months of March and April (6.6% monthly average, +0.4 p.p. compared to the first two months), the acceleration of the general price level was also the result of the evolution of other groups of goods (see Chart 6.5). At the divisional level, the increases in Clothing and footwear (10.4% monthly average, +7.5 p.p. compared to the first two months) and in Alcoholic beverages and tobacco (4.5%, +2.3 p.p.) stood out. At the grouped level, the increase in the rate of increase in Medicinal products, artifacts and health equipment (5.6%, +1.9 p.p.) stood out. After the international price shock that impacted the second two months of the year, goods slowed down in May in a very widespread way (5.3%, -1.2 p.p. compared to the March-April average), although they maintained a still high pace compared to 2021.
Figure 6.5 | CPI. Contributions of Seasonal, Regulated and Core goods and services in the quarter
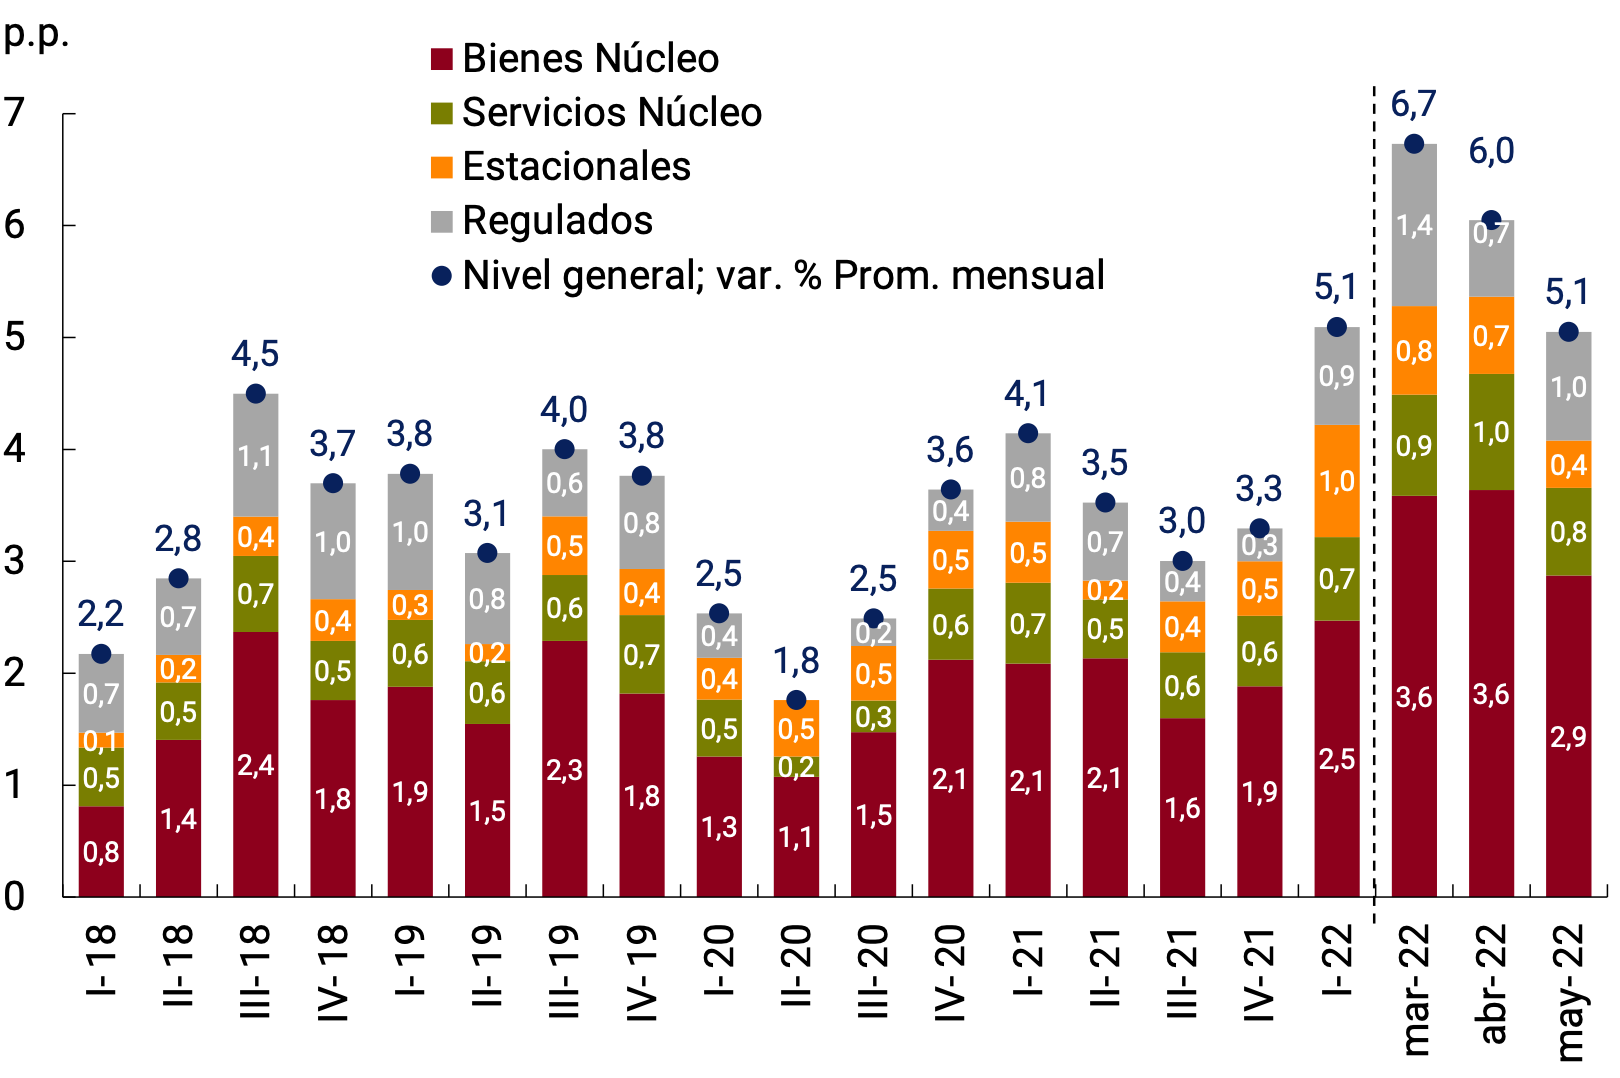
Source: BCRA based on INDEC data.
Regarding services, these also accelerated significantly during March and April (5.9% monthly average; +2.5 p.p. compared to the first two months), although they continued to grow at a lower magnitude than goods. In May, they cut their pace of expansion to 4.3% monthly.
At a more disaggregated level, the increase in Services in the second two months was widespread. Public services accelerated compared to the first two months, although they continued to grow below the general level. This grouping reflected the increases authorized in March in gas and electricity rates, while public transport rates continued with moderate increases. In May, public services had a limited average increase.
As for regulated private services, the Education division grew 12.7% monthly average in the March-April two-month period, mainly due to the usual increases that take place in March in private school fees. Prepaid expenses also contributed to the acceleration of services, with increases of around 6.2% monthly average (+1.8% compared to the first two months). For their part, telephone and internet services slowed down during this period to 3.4% (-1.0 p.p. compared to the first two months). Regulated private services also cut their rate of expansion in May, except for prepaid medicine fees.
Finally, during the second two months, non-regulated private services51 also increased their rate of increase compared to the first months of the year (5.1% monthly average, +0.9 p.p. compared to the first two months), trying to avoid the delay of their relative prices in the face of the acceleration of goods and other services, in a context of higher inflation expectations and then in May they slowed down (4.6%, -0.5 p.p. compared to the March-April average). In fact, Restaurants – with a high weighting in this group – exhibited monthly average increases of 7.1% in the second two months (+2.8 p.p. compared to the first two months), influenced by the increase in food prices. Recreational and cultural services showed a similar trend, with increases of around 5.4% in the second two months (+3.5 p.p.). Contrary to what was observed in most private services, the Housing Rental item maintained its rate of increase during March and April (4.5%; same as the first two months), while Tourism-Related Services—accommodation, transportation, packages, and excursions—slowed down, influenced by seasonal factors. In May, unregulated private services rose by an average of 4.6%, slowing down compared to the second two months due, among other factors, to the fall in the rate of increase in restaurants and hotels and the stability of common housing expenses (expenses) after months with significant increases.
In summary, the acceleration of the CPI during the March-April period compared to the first two months of the year was disseminated. Using information from the CPI of the City of Buenos Aires, due to its higher level of openness compared to the National CPI, it can be seen that most goods and services exhibited increases higher than the monthly year-on-year rate they had registered until February, which accounts for a widespread phenomenon (see Figure 6.6).
Figure 6.6 | CPI BA. Changes in goods and services at the maximum available
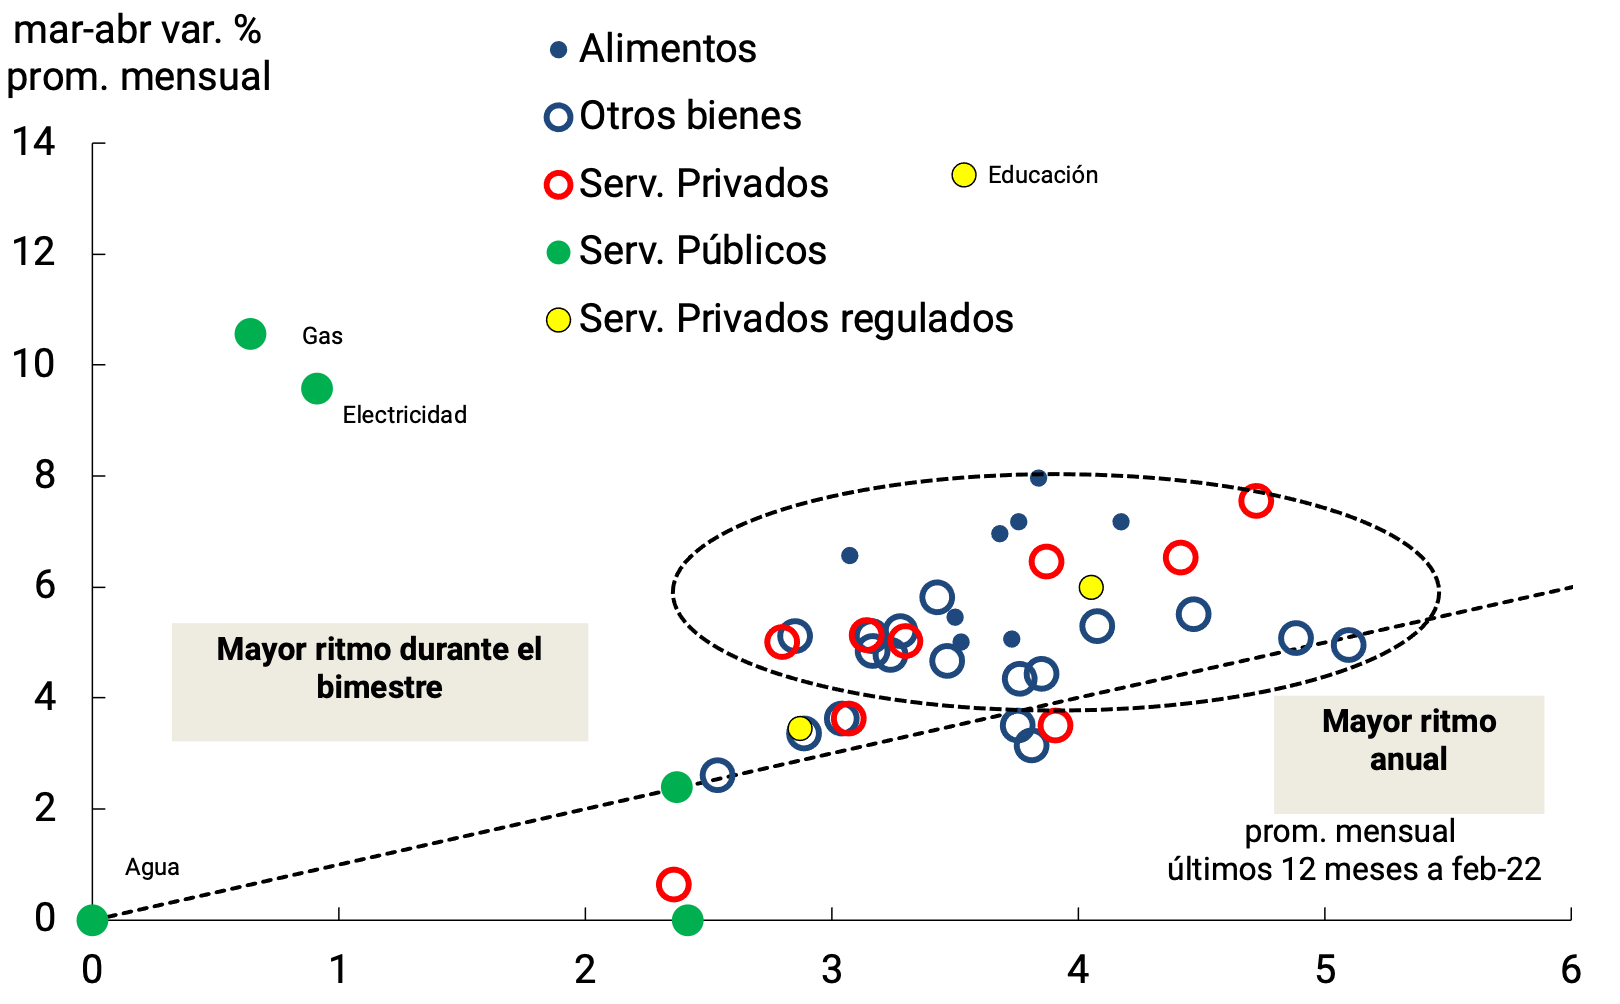
opening level
Note: excludes seasonal goods and services.
Source: Institute of Statistics of the City of Buenos Aires.
6.2. Wholesale prices accelerated, but maintained a more moderate pace than retail prices in the first quarter
In the first quarter, wholesale prices captured by the Domestic Wholesale Price Index (IPIM) accelerated to 4.9% monthly average, +2.2 p.p. above the previous quarter, although they continued at a lower pace than that of retail goods. As in the case of retailers, this trajectory was also influenced since March by the new increases in international commodity prices. After the maximum verified in March (6.3%), the IPIM slowed down slightly in April (5.9%) and more significantly in May (5.2%), although it maintained a much higher pace than in the second half of 2021 (see Charts 6.7 and 6.8).
Figure 6.7 | IPIM, nominal exchange rate and international prices of raw materials (IPMP)

Source: BCRA based on data from INDEC and Com. “A” 3500.
Within the IPIM, the higher rate of expansion during the first quarter reflected the acceleration of Manufactured Products – the category with the highest weighting in the index – which rose 4.6% (+1.9 p.p. compared to IV-21). Meanwhile, the other categories also increased their rates of increase, although their incidences in the IPIM were lower. Primary Products expanded by 6.5% (+3.9 p.p. compared to IV-21), synthesizing increases in Agricultural Products and Crude Oil and Gas (see Figure 6.8). Finally, imported products accelerated, although they continued to grow at a slower rate than the other categories, at around 3.5% monthly average (+1.1 p.p.), influenced by the relatively limited variations in the nominal exchange rate.
Figure 6.8 | Evolution and contributions of the IPIM and the nominal

exchange rate Source: BCRA based on INDEC data.
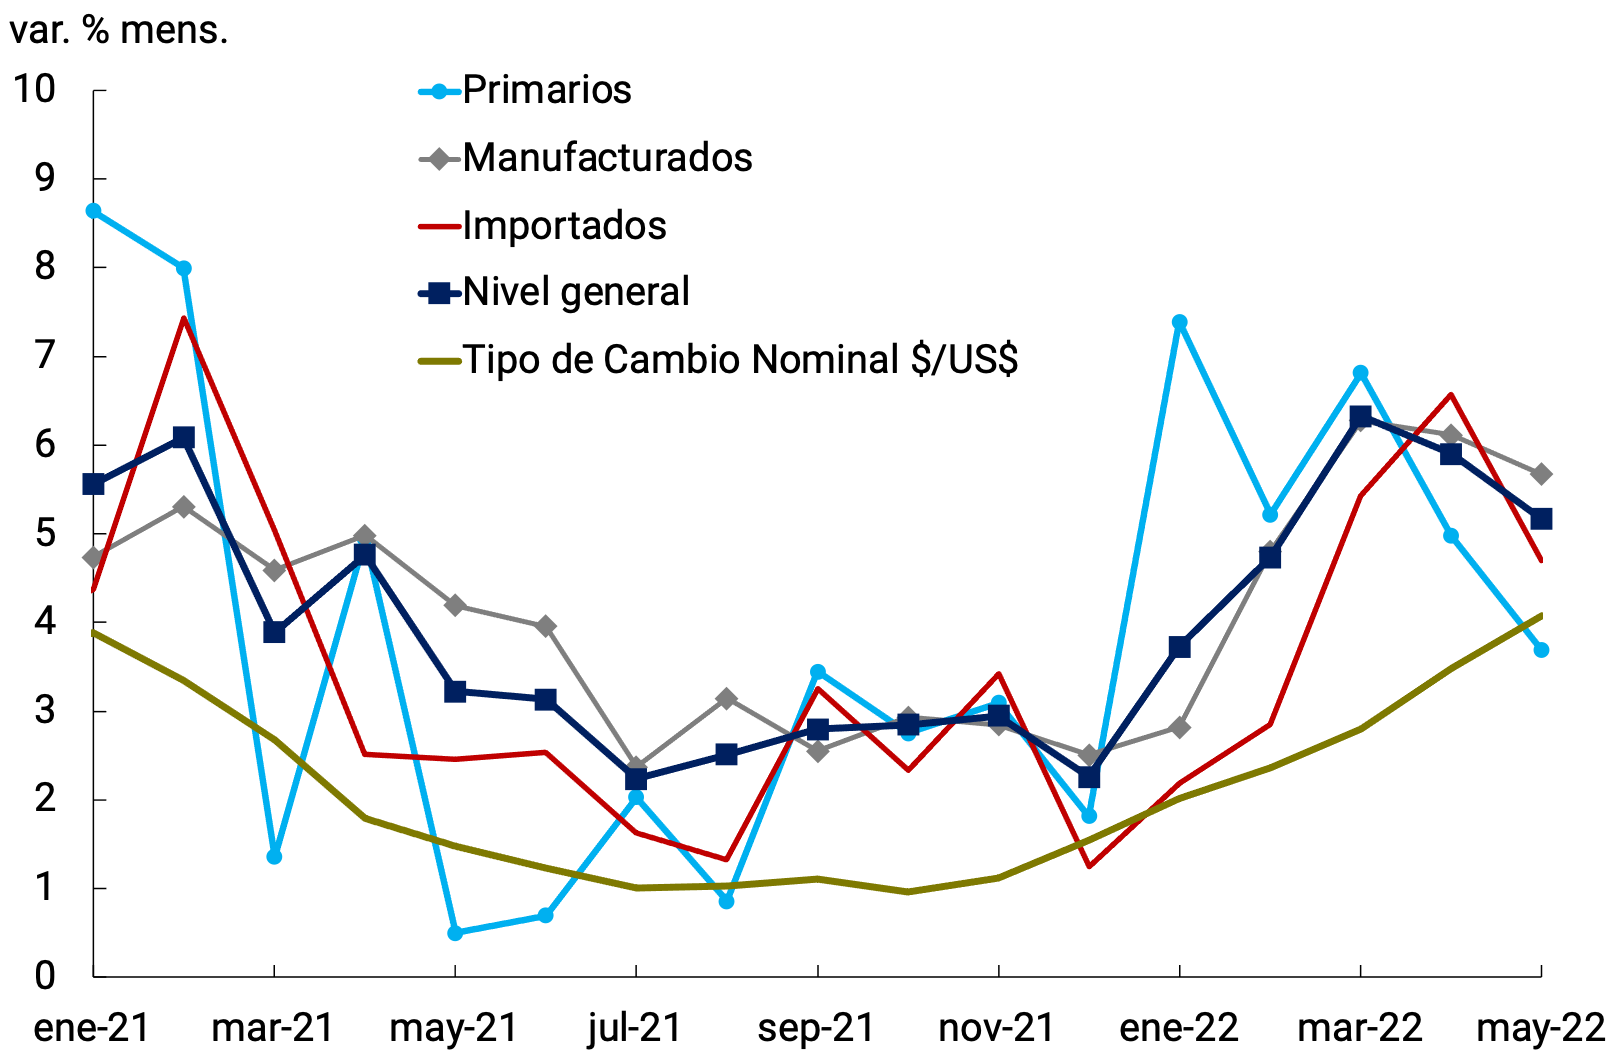
Source: BCRA based on data from INDEC and Com. “A” 3500.
On the other hand, Construction costs (CCI) also increased their rate of expansion in the first quarter to 4.5% monthly average (+3.0 p.p. above the previous period’s record), an acceleration that was spread among its categories. Construction Materials increased their rate of increase to 4.0% (+0.4 p.p.), while the costs of the Labor component rose 4.7% (+4.5 p.p.). The largest increase in labor costs reflected the entry into force of parity tranches during this period. In April, construction costs showed a slowdown explained by the minimal variations in the labor component, in the absence of parity sections, while Materials continued with significant increases. In May, the opposite situation occurred, as the 8.2% increase in wages accelerated the ICC to 6.2% while materials slightly reduced their rate of increase (see Figure 6.9).
Figure 6.9 | Construction costs
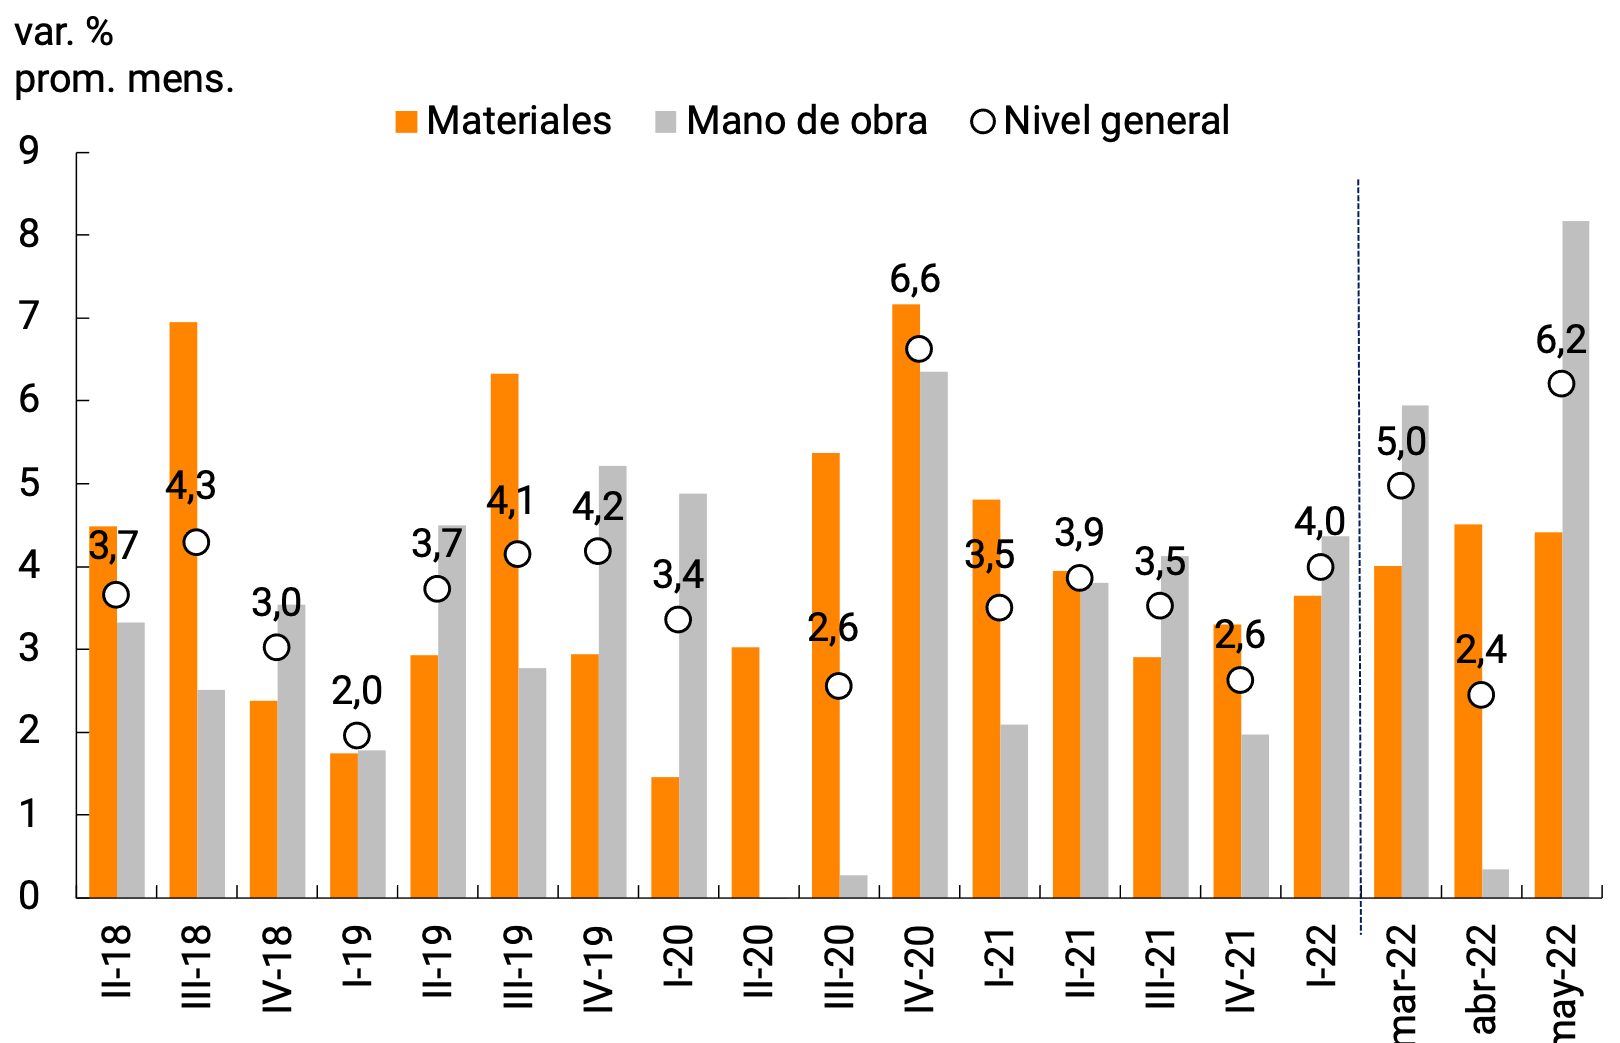
Source: BCRA based on INDEC data.
6.3. Year-on-year inflation rose widely among the main grouped groups
The significant rise in inflation so far in 2022 led to monthly variations exceeding those of the same period in 2021 and therefore the year-on-year inflation rate increased in recent months to around 60.7% in May, 9.7 p.p. above the December 2021 figure (50.9% y.o.y.). This trend was also observed at the level of the main categories that make up the CPI and in the IPIM.
The Seasonal category exhibited an acceleration so far in 2022 and its year-on-year rates of change (74.0% y.o.y. in May) once again exceeded those of the rest of the categories. The Core category also increased its year-on-year growth rate (63.2% YoY), and continued to register increases above those verified by the General Level. Finally, Regulated goods and services (44.1% YoY) make up the category that continues to put downward pressure on the year-on-year variation of NG, although it has also accelerated in the last four months. For its part, year-on-year wholesale inflation (54.8% y.o.y.) verified a similar trajectory, accelerating in recent months, although with rates of change lower than those of the CPI so far in 2022, after the opposite situation occurred in 2021 (see Figure 6.10).
Figure 6.10 | Retail (CPI) and wholesale prices (IPIM)

Source: BCRA based on INDEC data.
6.4. Perspectives
The increase in core inflation in March and April occurred against a backdrop of high international turbulence characterised by rising food and energy prices as a result of the war in Ukraine. This external shock affected Argentina in the context of a recovering economic activity and with a high inflationary inertia. Despite the relatively limited rate of increase in the nominal exchange rate, this episode caused a higher rate of rise in domestic food prices that spread to the rest of the economy, causing an acceleration of inflationary records and an upward revision of inflation expectations. The reopening of wage parity agreements and the advancement of the tranches of some agreements in response to the unanticipated inflationary acceleration, as well as the updating of public service rates, contributed in the same direction, increasing the persistence of the shock. After an incipient deceleration of the general price level in April and May, in June a new update will temporarily impact the rates of gas by network and electricity52, as well as in those of public transport (the latter two with a greater effect on GBA) exerting upward pressure on the general price level.
For the second part of the year, it is expected that, in the absence of new international price shocks, core inflation will continue to decline gradually, while the general level of inflation would resume a trajectory of gradual decline since July, after the impact of the updates in public service tariffs in June. The gradualness foreseen for this path of inflation reduction contemplates certain factors that could operate in the opposite direction: the process of formation of inflation expectations, the advancement and concentration of wage parity and the possible second-round effects of the updates of public service and fuel rates, among others. This expectation of a gradual slowdown in prices during the rest of 2022 is shared by market analysts, since, according to what the Market Expectations Survey (REM) suggests, they predict that by the end of the year the monthly rates of change will return to values similar to those of the end of 2021 (see Figure 6.11).
Figure 6.11 | Monthly inflation expectations (REM May-22)
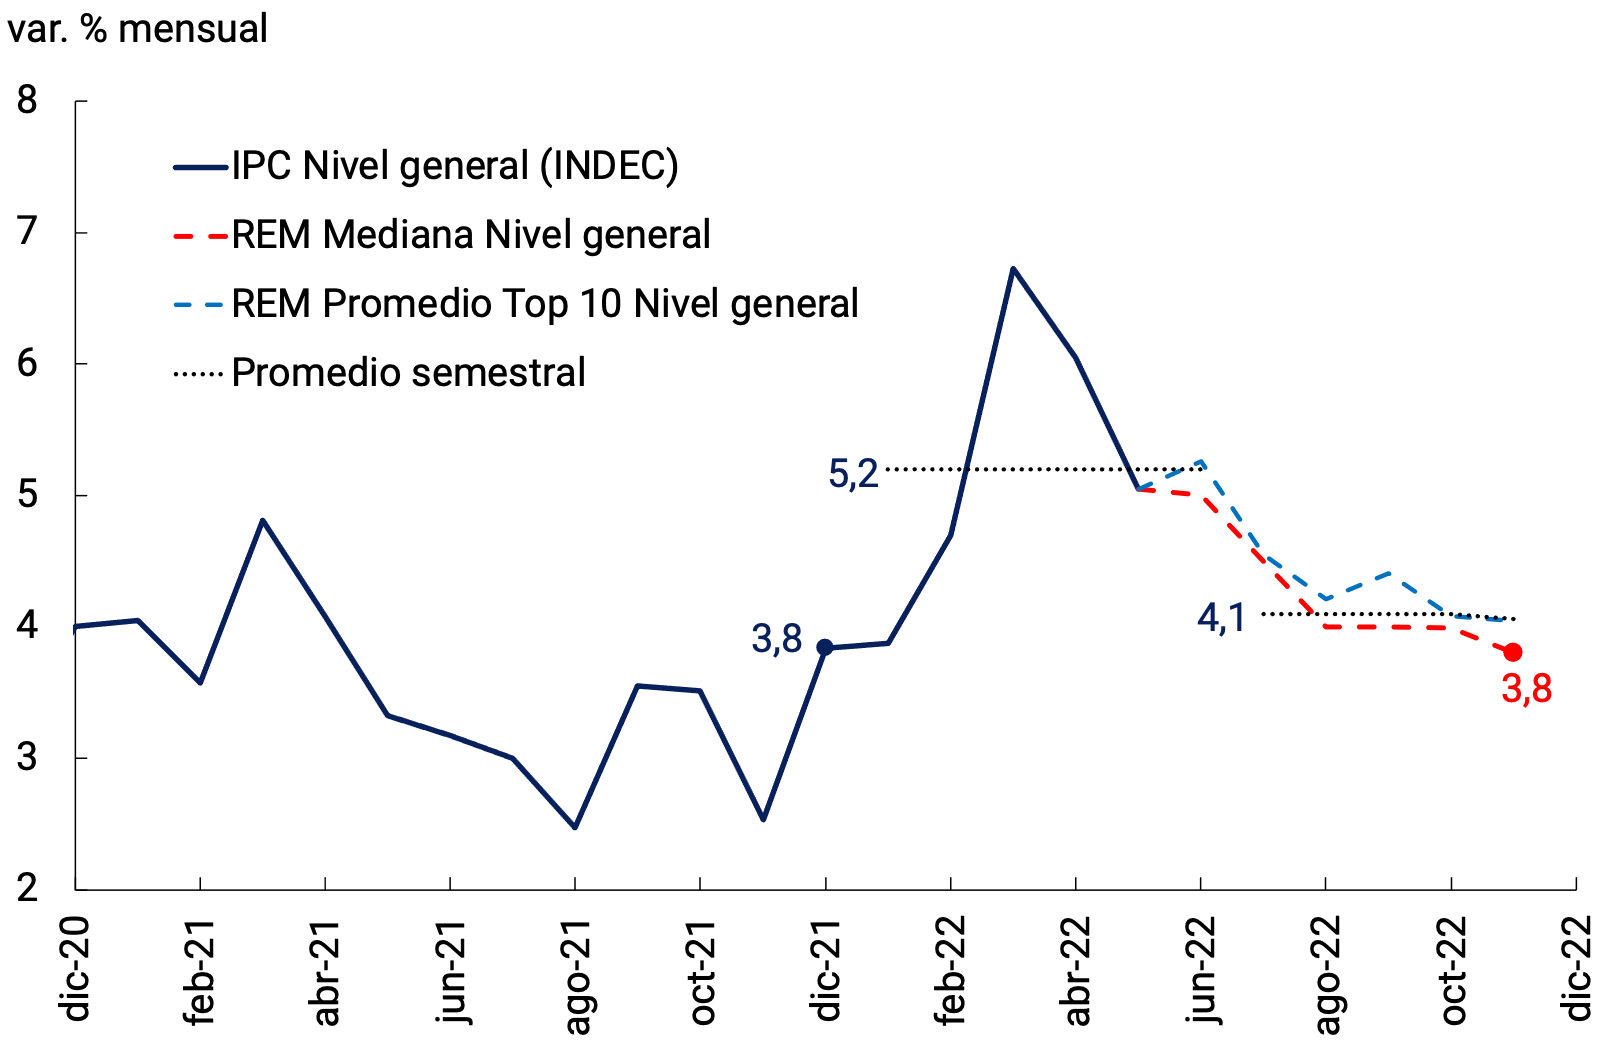
Source: INDEC and REM-BCRA (May-22).
The national government and the BCRA will continue to adopt measures to combat inflation. In this sense, the validity of the agreement with the IMF will allow the consolidation of a framework of macroeconomic certainty, thus helping to limit expectations of an increase in the exchange rate and inflation. The BCRA will conduct its monetary and exchange rate policy, in a context of less financial assistance to the National Treasury and seeking a gradual convergence towards positive real interest rates, managing liquidity appropriately to preserve monetary stability without affecting the economic recovery.
7. Monetary Policy
The BCRA continued to calibrate its monetary policy to adapt it to a changing macroeconomic environment. Although economic activity continued to show some dynamism in recent months, inflation accelerated at the end of the first quarter, a trend that began to reverse in May. On top of inflationary inertia, transitory factors were added that boosted prices, among which the increase in international prices of raw materials stands out.
In order to contain the impact of the acceleration of prices, the National Government decided to mitigate the loss of purchasing power of income of people without formal income and/or in a situation of socioeconomic vulnerability. On the other hand, the increase in energy prices had a negative impact on public finances. The increased financing needs were met using a variety of sources, including monetary assistance to the National Treasury. However, the use of this tool remained within the values established in the Extended Facilities Program (PFE) agreed with the International Monetary Fund (IMF) last March. Thus, so far this year, monetary assistance to the Treasury in terms of GDP was at a level similar to that of the years prior to the pandemic. The seasonally adjusted Monetary Base at constant prices is at historically low levels and in terms of GDP reached an all-time low in April.
At the same time, and in line with the Objectives and Plans defined for 2022, the BCRA increased the interest rates of monetary policy instruments on successive occasions. These increases sought to tend towards a path of interest rates that allows safeguarding the value of investments made in instruments denominated in domestic currency and avoiding pressures in the foreign exchange market. Meanwhile, the exchange rate policy was aimed at maintaining adequate levels of external competitiveness, gradually readjusting the rate of change in the nominal exchange rate at a pace in line with domestic inflation.
In order to resume a path of gradual disinflation that is consistent with the sustainability of public finances and the external sector, the BCRA will maintain a prudent administration of monetary aggregates, sterilizing any surplus liquidity, to avoid imbalances that directly or indirectly threaten the disinflation process.
7.1. The BCRA continued to calibrate its policies based on the new macroeconomic environment
Although the rate of COVID-19 infections accelerated in the first part of the year, the levels of hospitalization and lethality remain relatively low. The favorable epidemiological evolution allowed the process of recovery of economic activity not to be interrupted, with a gradual reduction in heterogeneity at the sectoral level. This better scenario in terms of growth contrasts with inflationary dynamics, which were affected by various transitory shocks that accelerated the pace of price expansion. Among the latter, the climatic situation stands out, which affected fruit and vegetable prices, and especially the effects of the war between Russia and Ukraine, which generated additional pressures on the commodity markets, given the high relative participation of these countries in these markets.
In this context, the National Government decided to mitigate the loss of purchasing power of the income of people in the informal sector of the economy and/or in a situation of socioeconomic vulnerability, particularly affected by the situation of acceleration of the general price level. This policy is part of the strategy of focusing assistance initiatives on the most backward sectors and on the population in the most vulnerable situation.
For its part, the BCRA sought to gradually move towards positive real returns for investments made in domestic currency, increasing the reference interest rate on several occasions. At the same time, it continued to make progress in meeting the rest of the monetary policy objectives set for 2022. The results of all these policies were reflected in the evolution of monetary aggregates, credit and the exchange market. In the following sections, an analysis of the dynamics of these variables is carried out.
7.1.1. Monetary financing to the National Treasury in terms of GDP remained among the lowest levels in recent years
The continuity in the process of recovery of economic activity allowed public sector revenues in real terms to maintain an upward trajectory in recent months (see Chapter 5. Public Finance). Public spending expanded at a higher rate than income due to the need to assist the most vulnerable sectors in the face of rising prices, and in particular that of food, and the greater expenditures on energy subsidies, due to the rise in international energy prices. In a context of greater needs, the National Government resorted to all available financing tools.
The BCRA’s monetary assistance to the National Treasury, through transitory advances, remained within the limits established in the Extended Facilities Program (PFE) agreed with the IMF. So far this year, however, the primary expansion of the public sector in terms of GDP was among the lowest in recent years, representing only 0.58% of GDP (see Figure 7.1).
Figure 7.1 | Primary issuance linked to the public sector*
Accumulated as of June of each year**
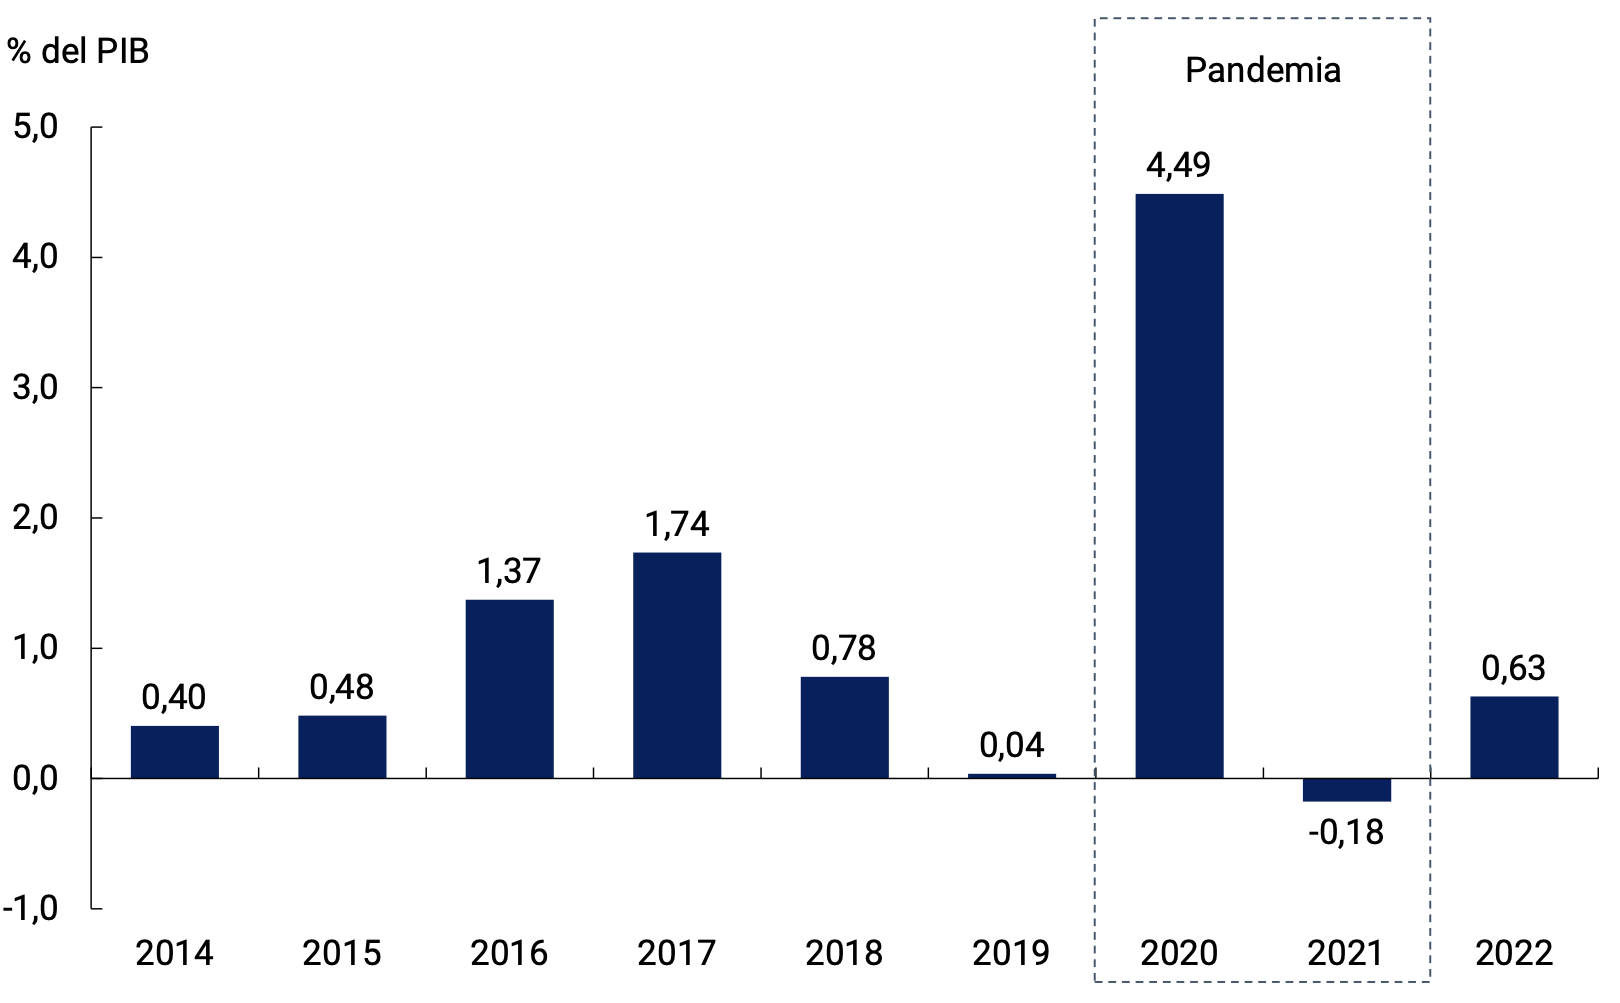
* Includes transfer of profits, transitory advances, net purchase of foreign currency and other public sector operations.
**Data as of 22-Jun-22.
Source: BCRA.
On the other hand, during June, in the face of an increase in volatility in global and local financial markets, the BCRA intervened in the secondary market of public securities with the aim of recomposing the Treasury’s curve in pesos, in a context of excessive and unjustified volatility in prices that could compromise financial stability. The counterpart of these operations was an expansionary effect on the monetary base, offset by monetary sterilization operations. It should be noted that the BCRA will also implement a liquidity line, exclusive to FCI, for Treasury debt securities. Likewise, the monetary authority will continue to operate on the curve to guarantee the liquidity of Treasury instruments and the support of their prices.
As for the rest of the factors explaining the Monetary Base, the net purchases of foreign currency by the BCRA from the private sector had an expansive effect so far this year, with a heterogeneous behavior throughout the period. In fact, during the first two months the BCRA was a net seller in the foreign exchange market, a trend that was reversed as of March more than compensating for the sales of the first months. The BCRA’s monetary regulation instruments, in the year to date, contributed negatively to the variation of the monetary base, absorbing liquidity surpluses. The nominal growth of the BCRA’s interest-bearing liabilities was lower than that of GDP, so that the ratio reached a value of 7.6% of GDP in May, which implied a reduction of 0.6 p.p. so far this year and 3.1 p.p. compared to the maximum reached during 2018.
In line with the Objectives and Plans defined for 2022, the BCRA continued to calibrate the interest rates of monetary regulation instruments in order to tend towards positive real returns on investments in local currency. In an economy like Argentina’s with a relatively small credit channel, the rise in interest rates acts mainly by encouraging savings in pesos. Its anti-inflationary action therefore largely involves contributing to exchange rate and financial stability, and must be complemented with other economic policy instruments to reduce inflationary inertia. Specifically, since the beginning of the year, it was decided to raise the interest rate of the LELIQ to 28 days on six occasions (with a total increase of 14 p.p.), which went to 52% n.a. (66.5% e.a.). With regard to the new longer-term instruments, the interest rate on the 180-day LELIQ rose in mid-May to 58.5% n.a. (67.2% y.a.), accumulating a rise of 14.5 p.p. in the year. Finally, the fixed spread of the NOTALIQ stood at 5.0 p.p. in the mid-June auctions. As for shorter-term instruments, the interest rate on 1-day pass-by-passes increased 8.5 p.p. in the year to 40.5% n.a. (49.9% y.a.); while the 1-day active passes stood at 57.5% n.a. (77.6% y.a.) at the end of the period under analysis.
The changes carried out by the BCRA in the first months of the year were aimed at increasing the average term of sterilization and extending the BCRA’s reference interest rate curve. As a result, a change in the composition of the BCRA’s remunerated liabilities was observed. Towards the end of the first half of the year, they were made up of around 80% of LELIQ, highlighting the shortest term (28 days) that represented approximately 70% of the total remunerated liabilities. The rest corresponded to passive passes to 1 day and NOTALIQ, with a growing participation of the latter. Thus, the average residual term of the monetary regulation instruments (LELIQ, Pases, and NOTALIQ) stood at approximately 30 days, more than tripling the one in force at the beginning of this year (see Figure 7.2).
Figure 7.2 | Average residual term of the BCRA’s
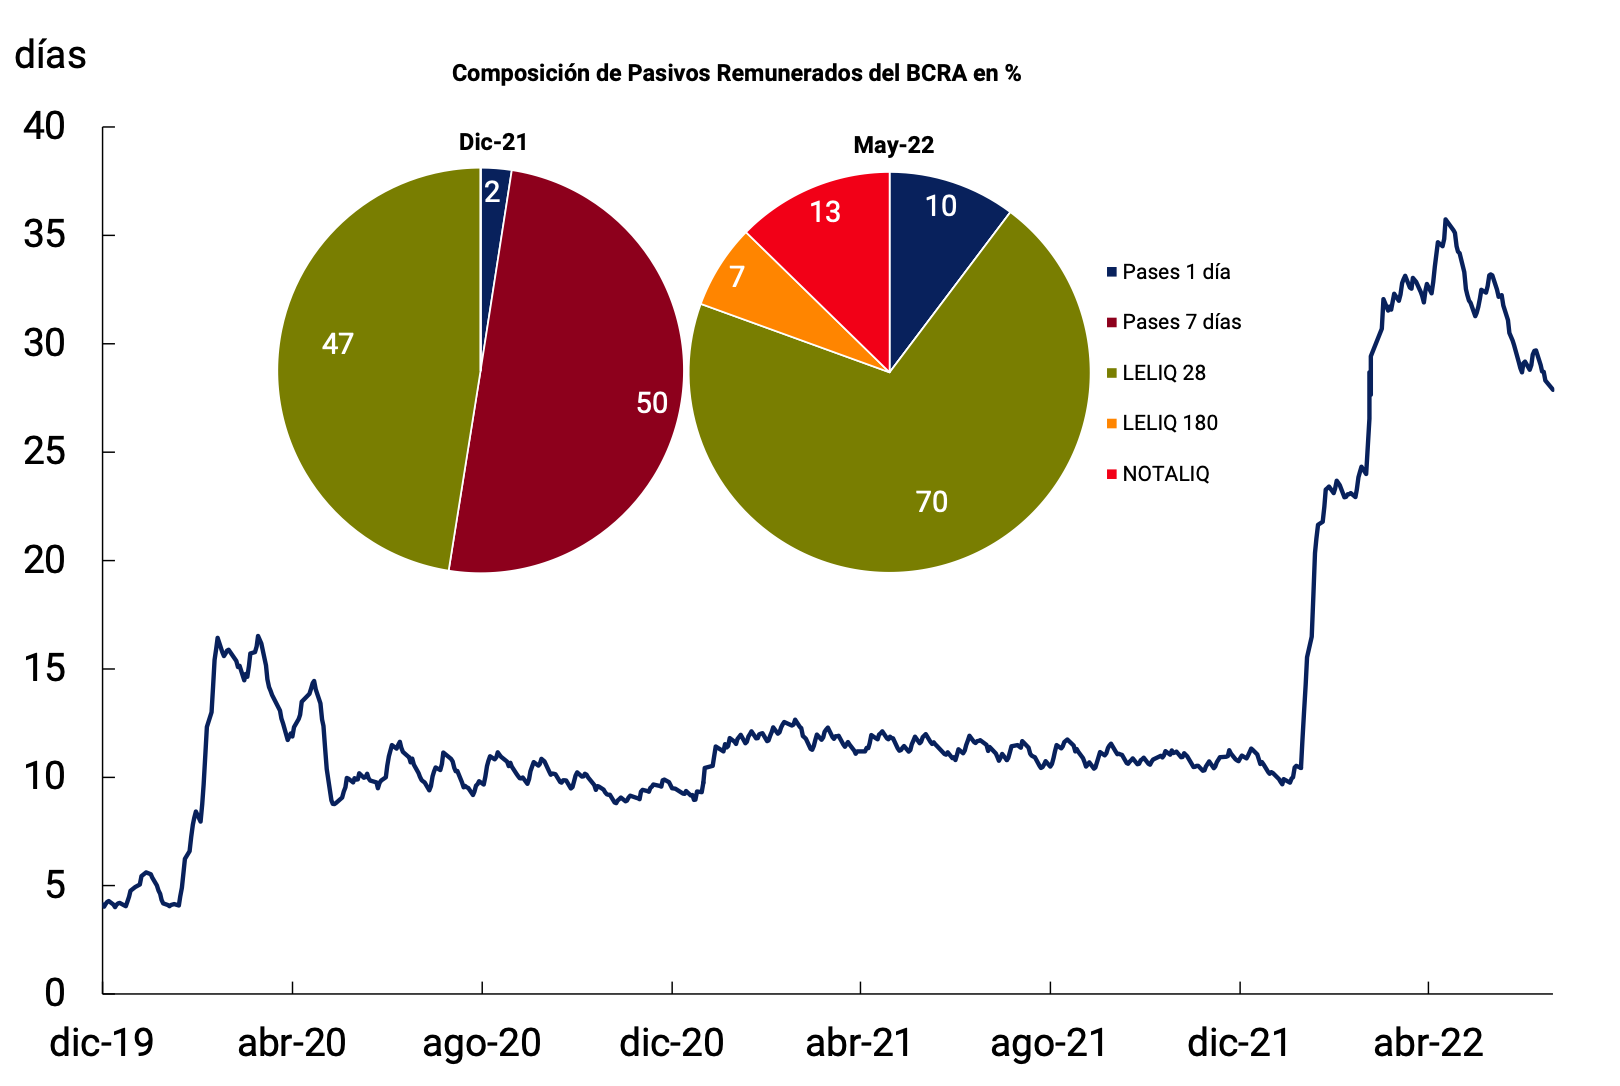
interest-bearing liabilities
Source: BCRA.
All in all, the growth of the monetary base accumulated in the year was 8.9%, with data as of May. However, seasonally adjusted and at constant prices, the Monetary Base continued to contract and is at historically low levels. Thus, in the last twelve months it has accumulated a real fall of the order of 10%. In the same sense, in terms of GDP it reached a historic low of 5.2% in the fourth month of the year (see Figure 7.3).
Figure 7.3 | Historical evolution of the monetary base

Source: BCRA.
7.1.2. Transactional means of payment in terms of GDP reached a level similar to that of pre-pandemic
In this context, means of payment, at constant prices and adjusted for seasonality, recorded a fall in the first part of the year. In fact, the Transactional Private M2 showed an average monthly contraction rate at constant prices of 1.4% s.e. in the first five months. Within its components, the dynamics were relatively homogeneous. In the year-on-year comparison, and at constant prices, private transactional M2 registered a contraction of close to 4%.
As a percentage of GDP, the Transactional Private M2 stood at 8.6% in May, positioning itself 0.9 p.p. below the record of December last year and a level similar to that of pre-pandemic. In particular, the working capital held by the public remained at the lowest levels of the last 15 years, while demand deposits are at values similar to those of the average of recent years. The low level of demand for banknotes and coins is partly linked to a higher relative demand for demand deposits, given the increasing use of digital means of payment in recent years (see Figure 7.4).
Figure 7.4 | Means of payment in terms of GDP
Series without seasonality

Source: BCRA.
7.1.3. The BCRA raised the interest rate on savings instruments in local currency on successive occasions to support their demand
In a scenario in which inflation presented higher records and in line with the objective of guaranteeing a greater availability of savings instruments that allow Argentines to obtain returns in line with the evolution of inflation and the exchange rate, the Board of Directors of the BCRA raised the minimum guaranteed interest rates on fixed-term deposits on successive occasions. Thus, the floor for the impositions of individuals accumulated an increase of 19 p.p. for the segment between $1 and $10 million and 16 p.p. for the segment of less than $1 million so far this year, currently standing at 53% n.a. for both types of placements (68% e.a.). For the rest of the private sector’s fixed-term deposits, the minimum guaranteed rate accumulated a rise of 16 p.p. to 50% n.a. (63.2% y.a.).
In this context, the private sector’s fixed-term deposits in pesos remained relatively stable in real terms and without seasonality in the first five months of the year. They thus remained around the highest levels of recent decades (see Figure 7.5). In terms of GDP, the figure for May would have remained at 6.3%, a record that is also among the recent highs.
Figure 7.5 | Fixed-term deposits in pesos of the private
sector At constant prices

Source: BCRA.
When analyzing the evolution of term placements, stratifying according to the level of the minimum guaranteed rate, it can be seen that placements of individuals of less than $10 million at constant prices showed a slight drop so far this year. On the other hand, the rest of the deposits of the non-financial private sector (those constituted by legal entities, regardless of the amount, and by individuals with placements of more than $10 million) remained relatively stable.
In particular, time deposits of legal entities showed an average monthly increase of around 1.6% s.e. in real terms during the first five months of the year, which was explained by the higher holdings of companies (excluding Financial Services Providers, PSF). On the other hand, the placements of the PSF exhibited an average monthly drop of 1.1% s.e. at constant prices. This contraction occurred in a context in which the assets of the Mutual Funds for Money Market (FCI MM), the main agents within the PSF, experienced a decrease in real terms in the accumulated year54.
At the instrument level, CER adjustable fixed-term deposits stood out for their growing dynamism. Thus, they gained participation in the total of forward instruments, although this is still limited (around 7% of the total). The average monthly growth rate so far this year of UVA-denominated placements was 6.4% s.e. at constant prices, reaching a balance of about $350,000 million in mid-June and a new all-time high in real terms (see Figure 7.6). The aforementioned dynamic was manifested in both traditional UVA placements and those with early cancellation options, whose average monthly expansion rates for the period stood at 4.4% s.e. and 10.2% s.e. in real terms, respectively. Discriminating the balance by type of holder, it is verified that the impulse came from the holdings of individuals and, to a lesser extent, from companies (excluding FSPs).
Figure 7.6 | Private Sector UVA Time DepositsAt Constant Prices
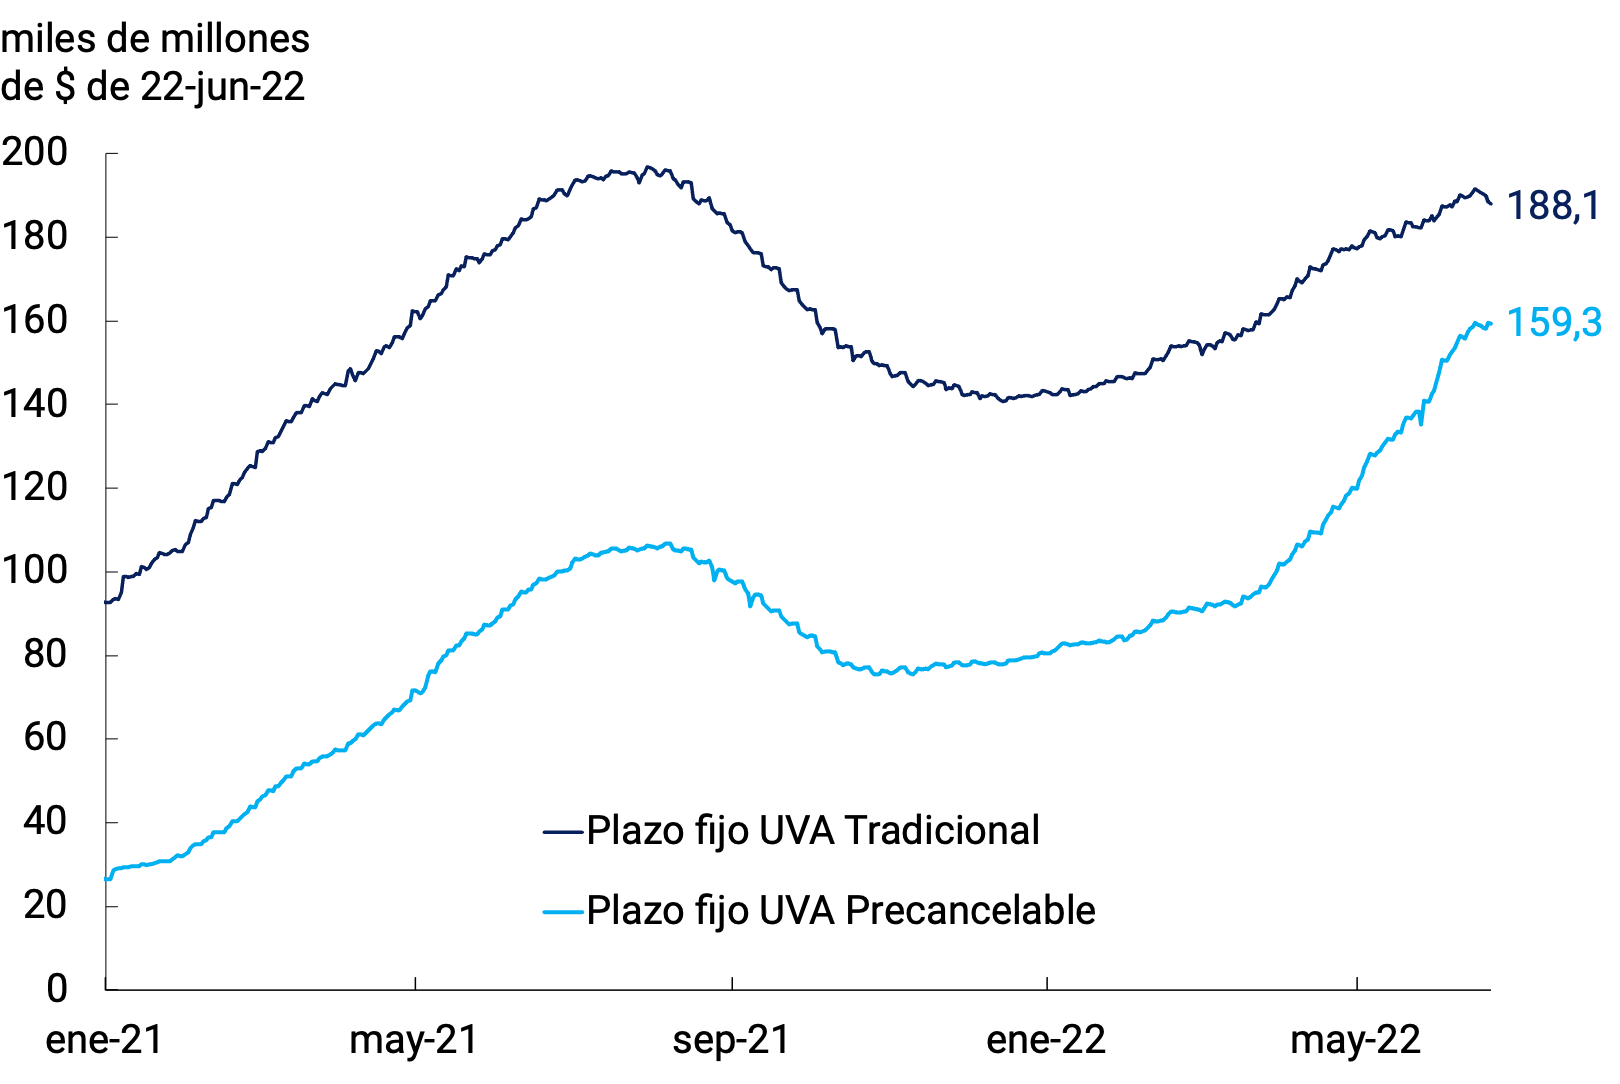
Source: BCRA.
All in all, the private M3 broad monetary aggregate registered an average monthly contraction of 1.2% s.e. at constant prices in the first five months of the year and was positioned 0.7% below the level of a year ago. As a percentage of GDP, this monetary aggregate stood at 16.4%, which implied a fall of 1.6 p.p. compared to the end of last year.
7.1.4. Credit policy continued to focus on the most backward sectors and on productive development
The continuity in the process of recovery of economic activity allowed the BCRA to maintain its credit policy focused on the most backward sectors and on productive development. The Productive Investment Financing Line (LFIP) continued to be the main tool used to channel productive credit to MSMEs under favorable conditions55.
Since its implementation, and until the end of May, loans granted under the LFIP accumulated disbursements of approximately $2.24 trillion since its inception (see Figure 7.7). This implied an increase of 49.1% compared to the record at the end of 2021. At the end of May, more than 269,000 companies had accessed loans under the LFIP. Regarding the destinations of these funds, approximately 85% of the total disbursed corresponds to the financing of working capital and the rest to the line that finances investment projects. Recently, the BCRA decided to extend the validity of the LFIP until September 30, 2022 (see Section 5 / Financing Line for Productive Investment of MSMEs: renewal and compliance with the 2021/2022 quota).
Figure 7.7 | Financing granted through the Productive Investment Financing Line (LFIP)
Accumulated amounts

Source: BCRA.
In the first five months of the year, commercial financing experienced an average monthly fall of 0.4% s.e. at constant prices and in year-on-year terms they were 10.7% above the records of the same month of the previous year. Within commercial loans, advances were those that showed a negative average monthly rate of change in real terms, while documents remained practically unchanged at constant prices.
When we analyze the composition of commercial loans by type of debtor, it can be seen that loans to MSMEs at constant prices showed a slight downward trend in the first quarter of the year, which was partially reversed during April and May. Thus, in year-on-year terms, in May credit to MSMEs expanded 25.7%. Meanwhile, financing for large companies contracted both in the year to date and in the year-on-year variation (-8.1 s.e.% and -7.0%, respectively; see Figure 7.8).
Figure 7.8 | Estimated balance of commercial loans to the private sector by type of debtor
At constant prices
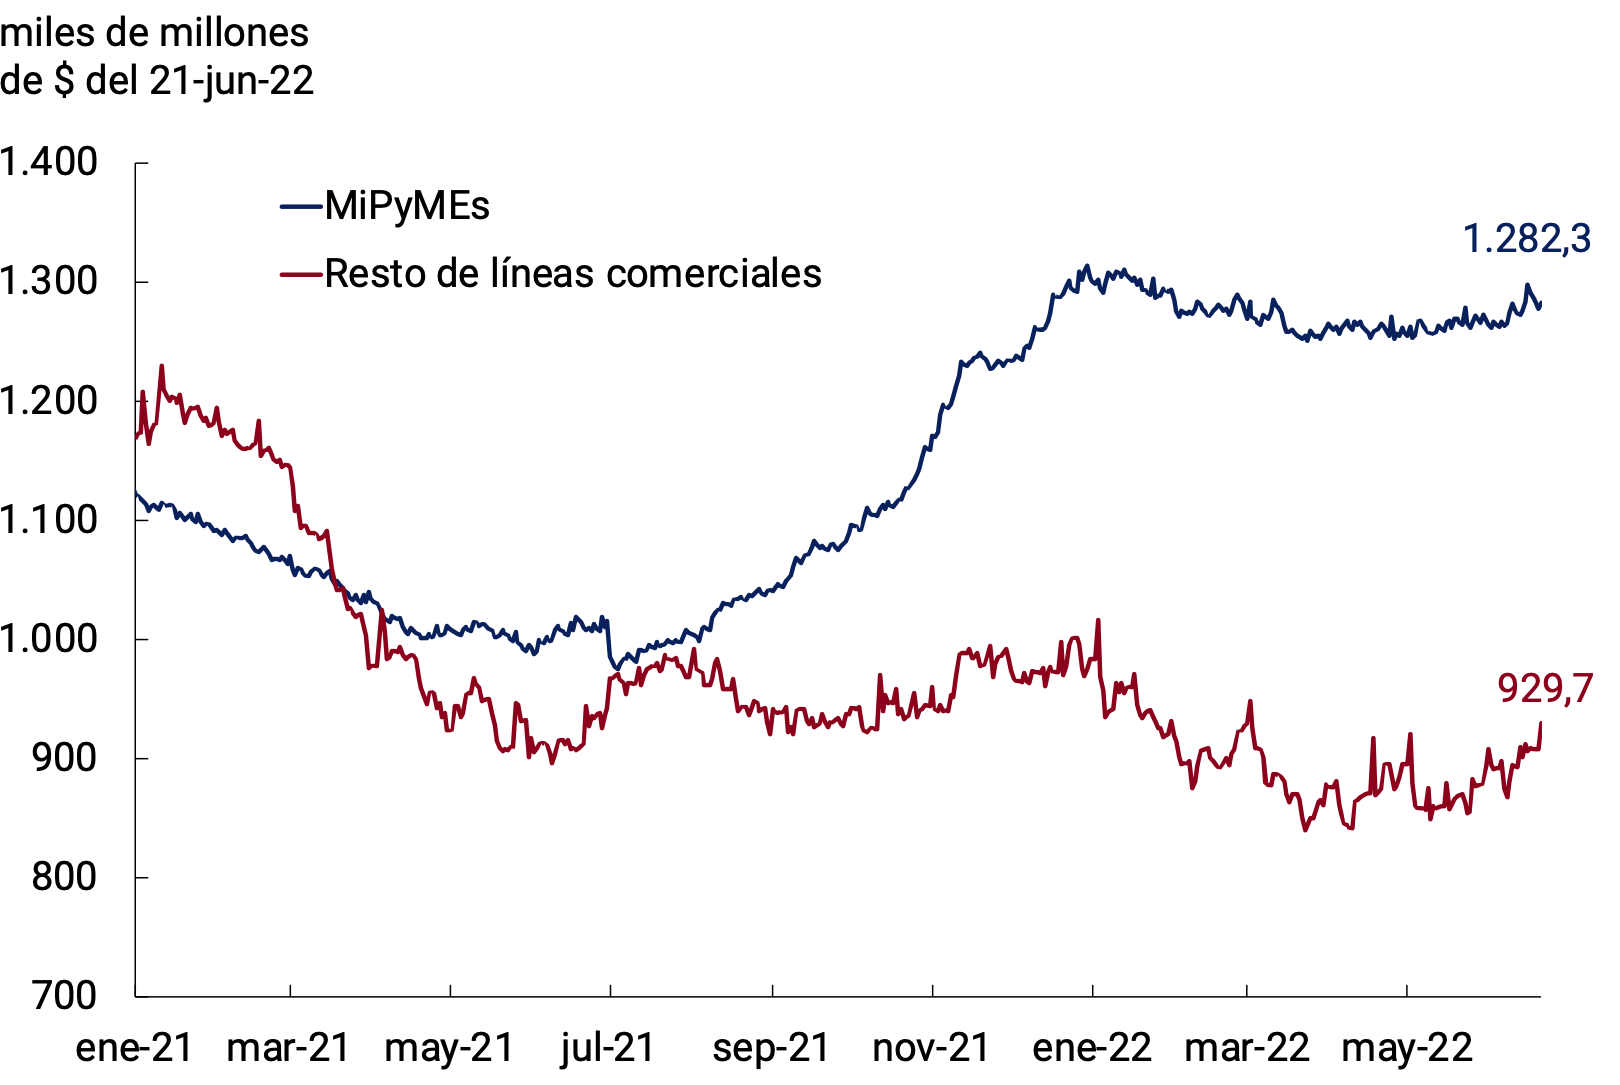
Source: BCRA.
As for lines with real collateral, collateral loans were the only line that expanded in real terms so far in 2022, continuing the trend that began in mid-2020. In the first five months of the year, the average monthly growth rate was 1.8% s.e. at constant prices, accumulating an expansion of 41.5% in the last twelve months. For its part, the balance of mortgage loans fell at an average rate of 2.5% s.e. per month in real terms in the first months of the year, registering a contraction of 15.8% year-on-year in May.
Among loans associated with consumption, financing granted through credit cards showed an average monthly decrease of 0.9% s.e. at constant prices and are 11.5% below the level of a year ago56. Something similar happened with personal loans, whose average monthly rate of change so far this year was -1.3% s.e. real and -3.3% year-on-year.
However, in real and seasonally adjusted terms, loans in pesos to the private sector showed an average monthly fall of 0.9% between January and May (+0.4% YoY; see Figure 7.9). In terms of GDP, bank financing in pesos to the private sector amounted to 6.6% in May.
Figure 7.9 | Loans in pesos to the private sector as a percentage of GDP
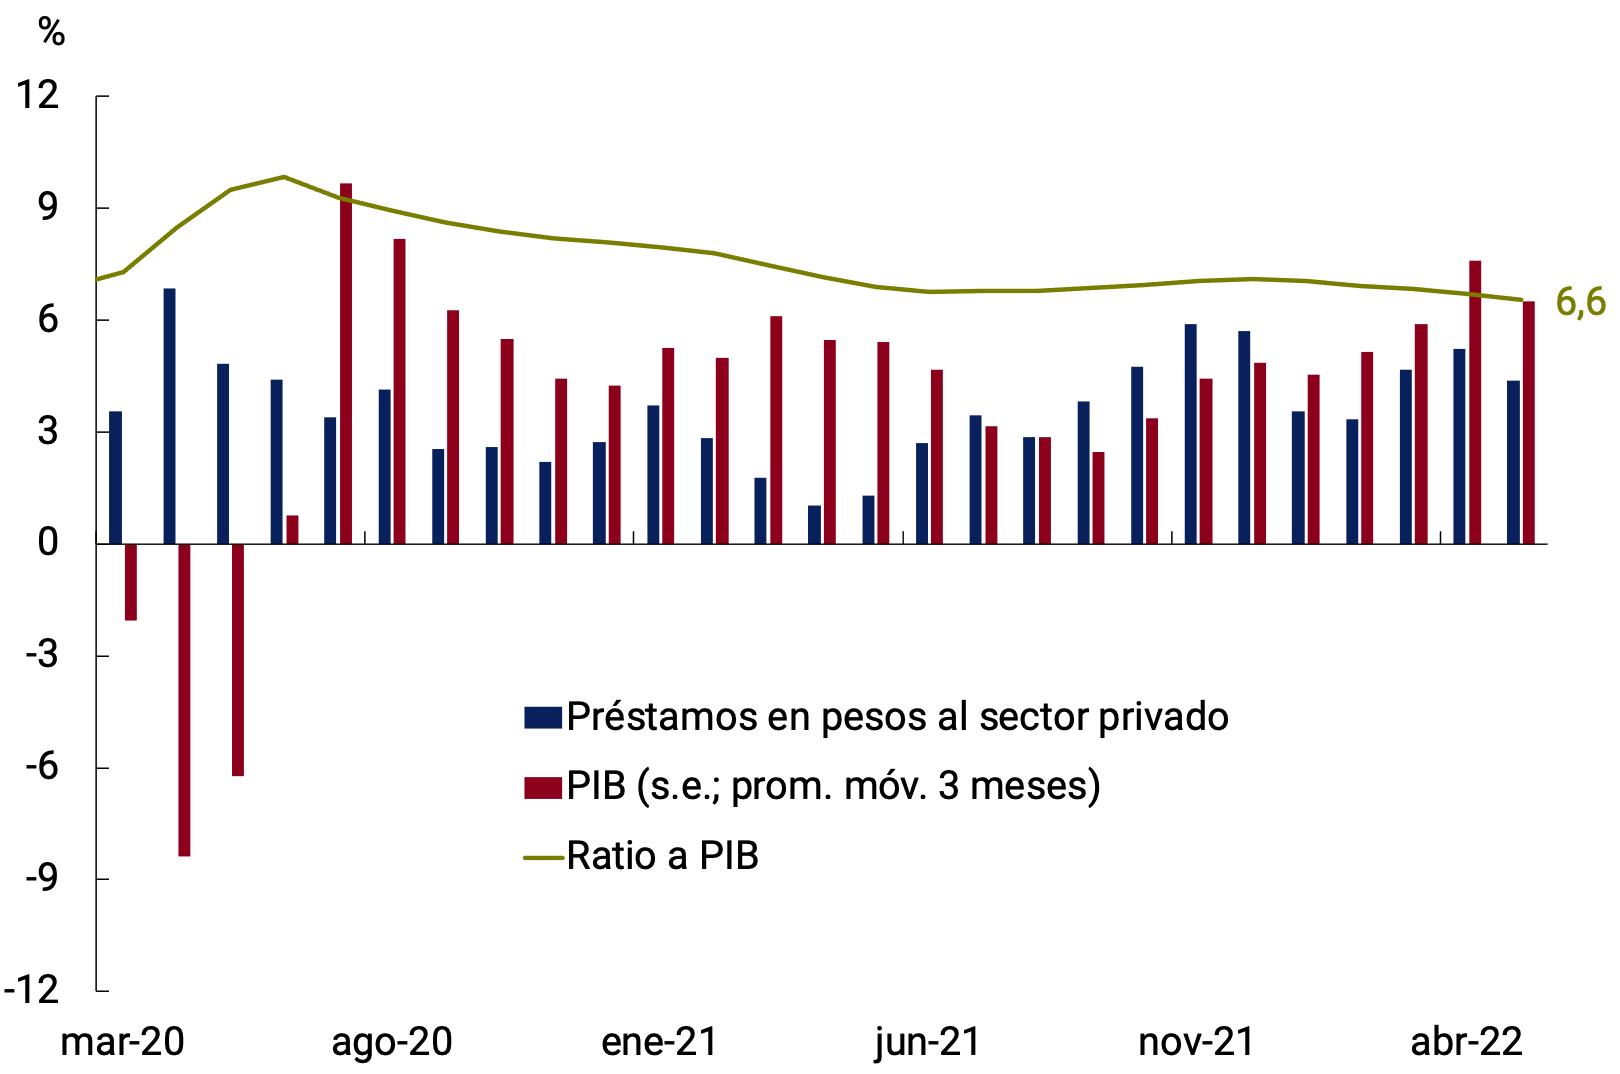
Source: BCRA.
7.1.5. Exchange rate policy continued to be adapted to meet the needs of the situation
The exchange rate policy carried out by the BCRA so far in 2022 was aimed at preserving the levels of external competitiveness, gradually readjusting the crawl rate to the rhythm of inflation within the framework of the current managed floating regime (see Figure 7.10). In this way, it sought to strengthen the position of International Reserves, based on the genuine income of foreign currency from the external sector.
Figure 7.10 | Monthly change in nominal exchange rate
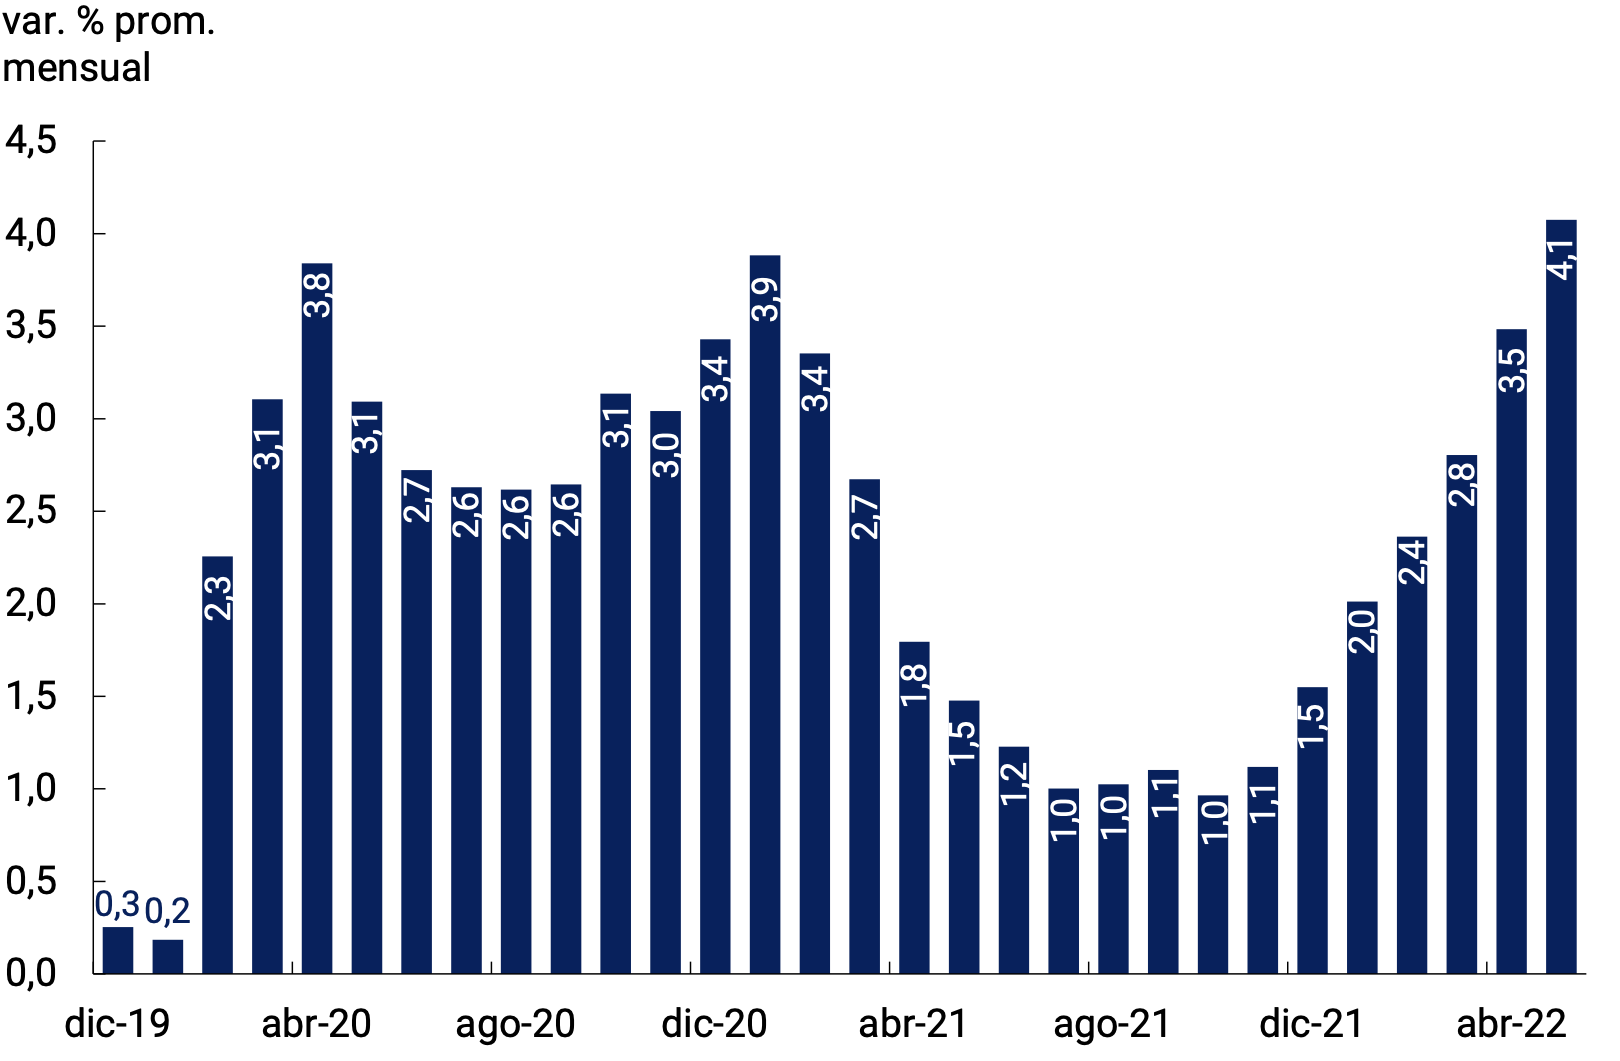
Source: BCRA.
In the first months of 2022, new regulatory modifications took place in foreign exchange matters. First, the conditions for access to the foreign exchange market applicable to import payments, prior approval to make payments of foreign financial debts with related creditors, and the rules on the refinancing of external liabilities were extended until the end of the year57. In addition, new exceptions were incorporated to the BCRA’s prior approval requirement to access the foreign exchange market58.
On the other hand, it was decided to classify importers when it comes to imported goods for which it is required to have the declaration in the Comprehensive Import Monitoring System (SIMI) and are not included in the deadlines provided for in the exchange regulation. Thus, they are assigned a category A for rapid access to the market, as long as they do not exceed certain parameters of demand for foreign currency to import, and a category B that entails that imports of associated goods must be financed at least 180 calendar days from the registration of the customs entry of the goods into the country. In this way, those importers who during 2021 showed a behavior for their purchases abroad aligned with the recovery of economic activity, will be able to continue accompanying growth during 2022. For their part, those whose import activity grows above their productive needs must meet them by obtaining extra financing.
Subsequently, the regulations were improved, through the incorporation of exceptions and the design of particular regulatory frameworks for imports linked to certain productive activities59. In line with the above, and considering the usual cycle of trade in this activity, it was established that agricultural companies will be able to finance part of the annual increase in their imports of fertilizers and phytosanitary products, at least, for 90 calendar days from the registration of customs entry, instead of the 180 days that would have corresponded when the SIMI assigned to them is category B60. Finally, with the aim of improving access to foreign currency for sectors that warned of the lack of essential inputs, the conditions of access to the foreign exchange market for imports linked to certain productive sectors were made more flexible61.
On the other hand, with the aim of directing capital flows towards the real economy, the creation of regimes for access to foreign currency for the incremental production of oil and natural gas was determined, in order to generate certainty and incentives to encourage investments and increase production in the hydrocarbon sector62. In turn, at the beginning of June, individuals were exempted from the requirement to settle in pesos exports of services linked to the knowledge economy for up to US$12,000 per year and for companies in the sector for salary payments for a percentage of the increase in foreign sales they make this year compared to 202163.
Finally, at the end of June, the BCRA adapted the foreign trade payment system in order to respond to the extraordinary needs for foreign currency to meet energy imports64. Thus, the financing system for imports made under a Non-Automatic License and services was extended until September 2022. In addition, certain conditions corresponding to the SIMI categories that had been relaxed in recent months were limited, while the conditions of access to the foreign exchange market for small and medium-sized enterprises were improved. Likewise, the treatment of imports of services was equated to that of goods, allowing access to the market for the same amount as in 2021 and, in case of exceeding the established amount, having to finance the balance within a term of at least 180 calendar days. Finally, a rule was established that allows paying 80% of imports of capital goods at the port of origin and the remaining 20% with nationalization. In addition, the pre-financing of exports was facilitated with the aim of accelerating the income of foreign currency, especially from the cereal complex.
In this context, the balance of International Reserves stood at US$38,006 million as of June 24, which implied a fall of US$1,656 million so far this year. This dynamic was impacted by the first disbursement by the IMF within the framework of the PFE that was made at the end of March for US$9,650 million, the principal payments to the organization for US$6,863 million and interest payments for US$731 million in the accumulated of the year (a positive net impact of US$2,056 million). The net purchase of foreign currency from the private sector also contributed to the growth of International Reserves. These expansion factors were more than offset by the negative contribution of other public sector operations, the change in the valuation of net foreign assets, and payments to other international organizations (see Figure 7.11).
Figure 7.11 | Factors of change in the Accumulated International Reserves
in the year

* include changes in exchange rate assessments.
Source: BCRA.
7.2. Monetary policy outlook for the remainder of the year
For the remainder of the year, economic activity is expected to continue with the growth process underway, supported by a better health situation and by the stimulus policies implemented by the National Government and the BCRA. The gradual recovery of the lagging sectors, specifically services, will also contribute to the dynamism of the economy as they recompose pre-pandemic levels of activity.
The acceleration in inflation observed at the end of the first quarter was largely the result of an international supply shock that particularly affected food and energy prices, caused by the war in Ukraine, to which was added the concentration of increases in the prices of regulated goods and services and seasonal increases. These characteristics give a partially transitory nature to this shock, so a gradual moderation in the inflation rate is expected, a fact that has already begun to be verified.
The BCRA, in coordination with the National Government, is using all its tools to help mitigate the second-round effects of the commodity shock on inflation. In particular, the determination of the appropriate increases in the interest rate in the face of a negative supply shock requires a different calibration than that derived from a demand shock, since the objective is to limit the second-round effects of the initial price increase, preserve monetary and exchange rate stability, and protect the savings in pesos of Argentines. avoiding incentives that accelerate dollarization. Although the rise in interest rates will impact the cost of sterilization, it is estimated that it will be relatively limited. In addition, the longer-term sterilization instruments created this year will allow the BCRA to maintain a combination of short- and medium-term interest-bearing liabilities. Even considering the effect of the rise in interest rates, in a context of lower sterilization needs, during 2022 interest-bearing liabilities would be reduced in terms of GDP.
For its part, exchange rate policy will continue to be aimed at preserving levels of external competitiveness and promoting the accumulation of international reserves, based on genuine foreign exchange inflows from the external sector. Thus, the BCRA will continue to gradually adjust the rate of change of the nominal exchange rate at a pace in line with domestic inflation. On the other hand, the BCRA will continue to carry out prudent management of the current regulatory framework, adapting it to the needs of the situation, in order to preserve monetary and exchange rate stability. To the extent that macroeconomic conditions allow, regulations will be relaxed, with the aim of maintaining in the medium and long term a set of macroprudential regulations compatible with the dynamization of capital flows oriented to the real economy.
In the medium term, sustained growth in economic activity and a moderation in the inflation rate will lead to greater demand for real money balances. After two years in which the Central Bank exceptionally assisted the Treasury to face the needs arising from dealing with the pandemic, without access to external financing and with a domestic capital market in reconstruction, the progress made by the National Government in the normalization of the peso debt market and the prospects for external financing by multilateral and bilateral organizations pose a scenario with a reduction in the of financial assistance to the Treasury. In this new stage, it is expected that the monetary sterilization effort will be reduced. This will favor the demand for the monetary base to be provided by the interest associated with the BCRA’s interest-bearing liabilities and, potentially, by a reduction in its stock. However, the BCRA will maintain a prudent administration of monetary aggregates, sterilizing any surplus liquidity, in order to preserve monetary balance.
Section 1 / Fiscal measures against the inflationary impact of raw materials
Measures in response to the pandemic, together with the recessionary impact of the pandemic, led to sharp increases in the fiscal deficit and public debt in 2020 in most countries. This was even more pronounced in advanced economies, with greater fiscal space (see Charts 1 and 2). In 2021, the recovery of the global economy allowed many countries to begin fiscal consolidation processes, while rising inflation began to move away from the scenario of low interest rates. Reducing fiscal imbalances is particularly challenging for developing countries, which must also deal with the pandemic’s “scars” on income distribution, climate change and digitalization, in a context in which international financial conditions are negatively impacting the cost of and access to financing.
Graph 1 | Fiscal result
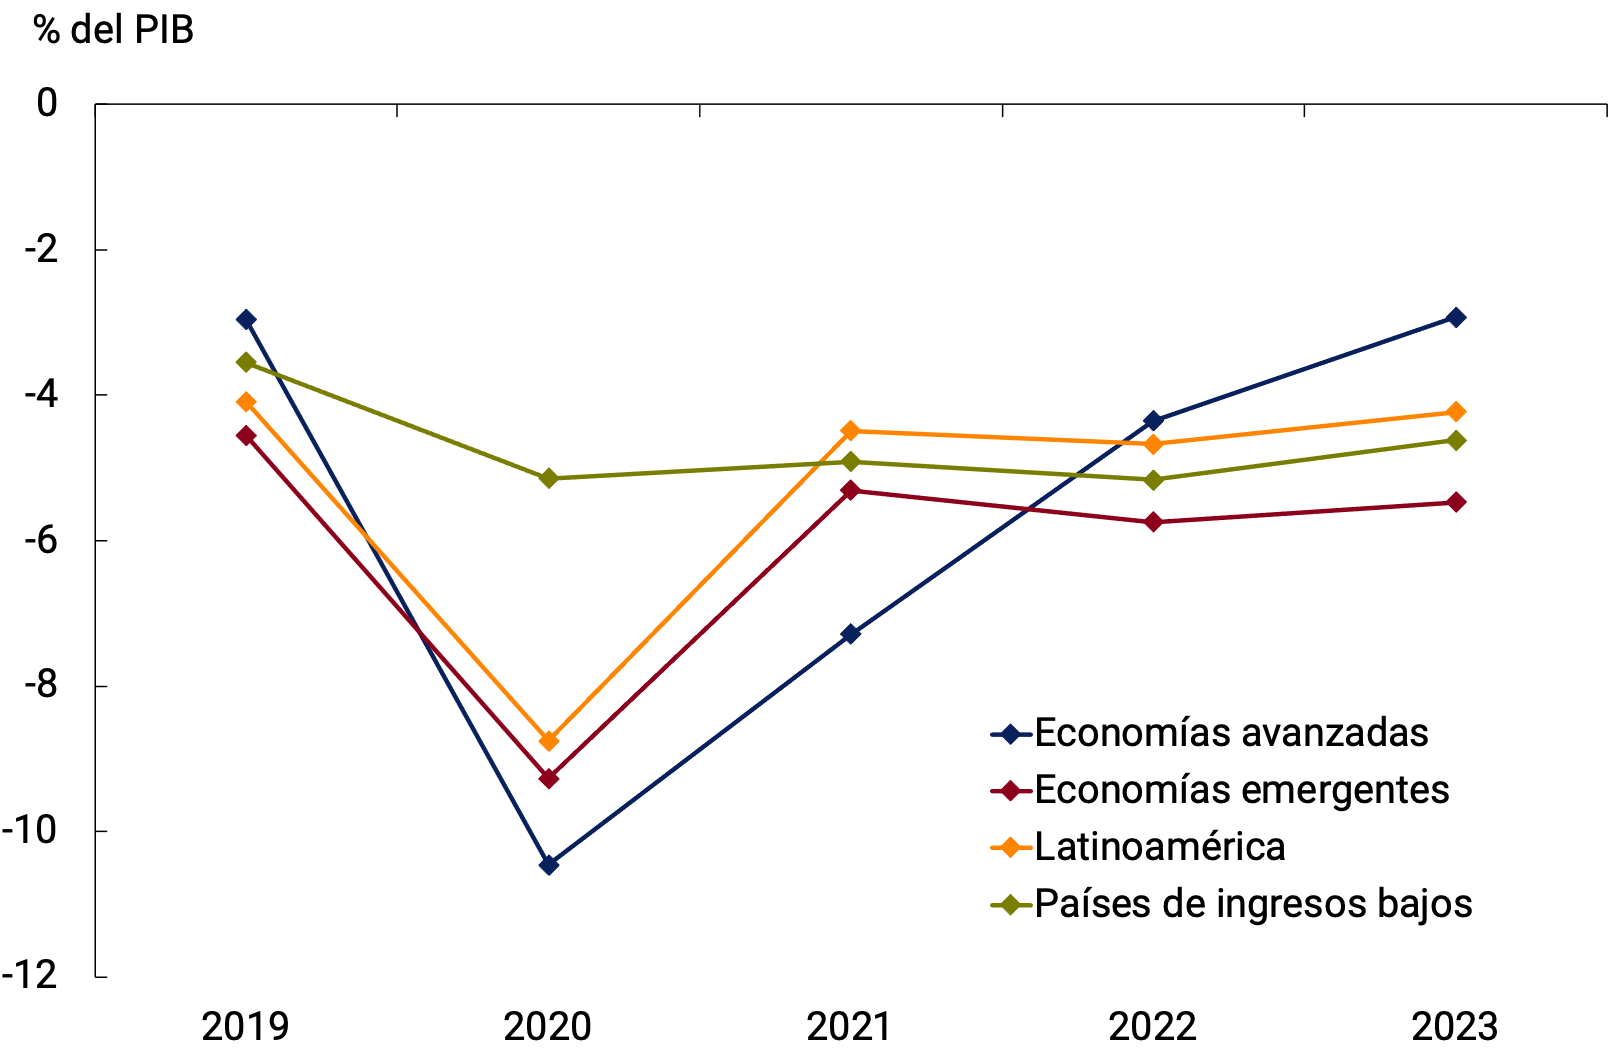
Graph 2 | Public
debt Change from the previous year
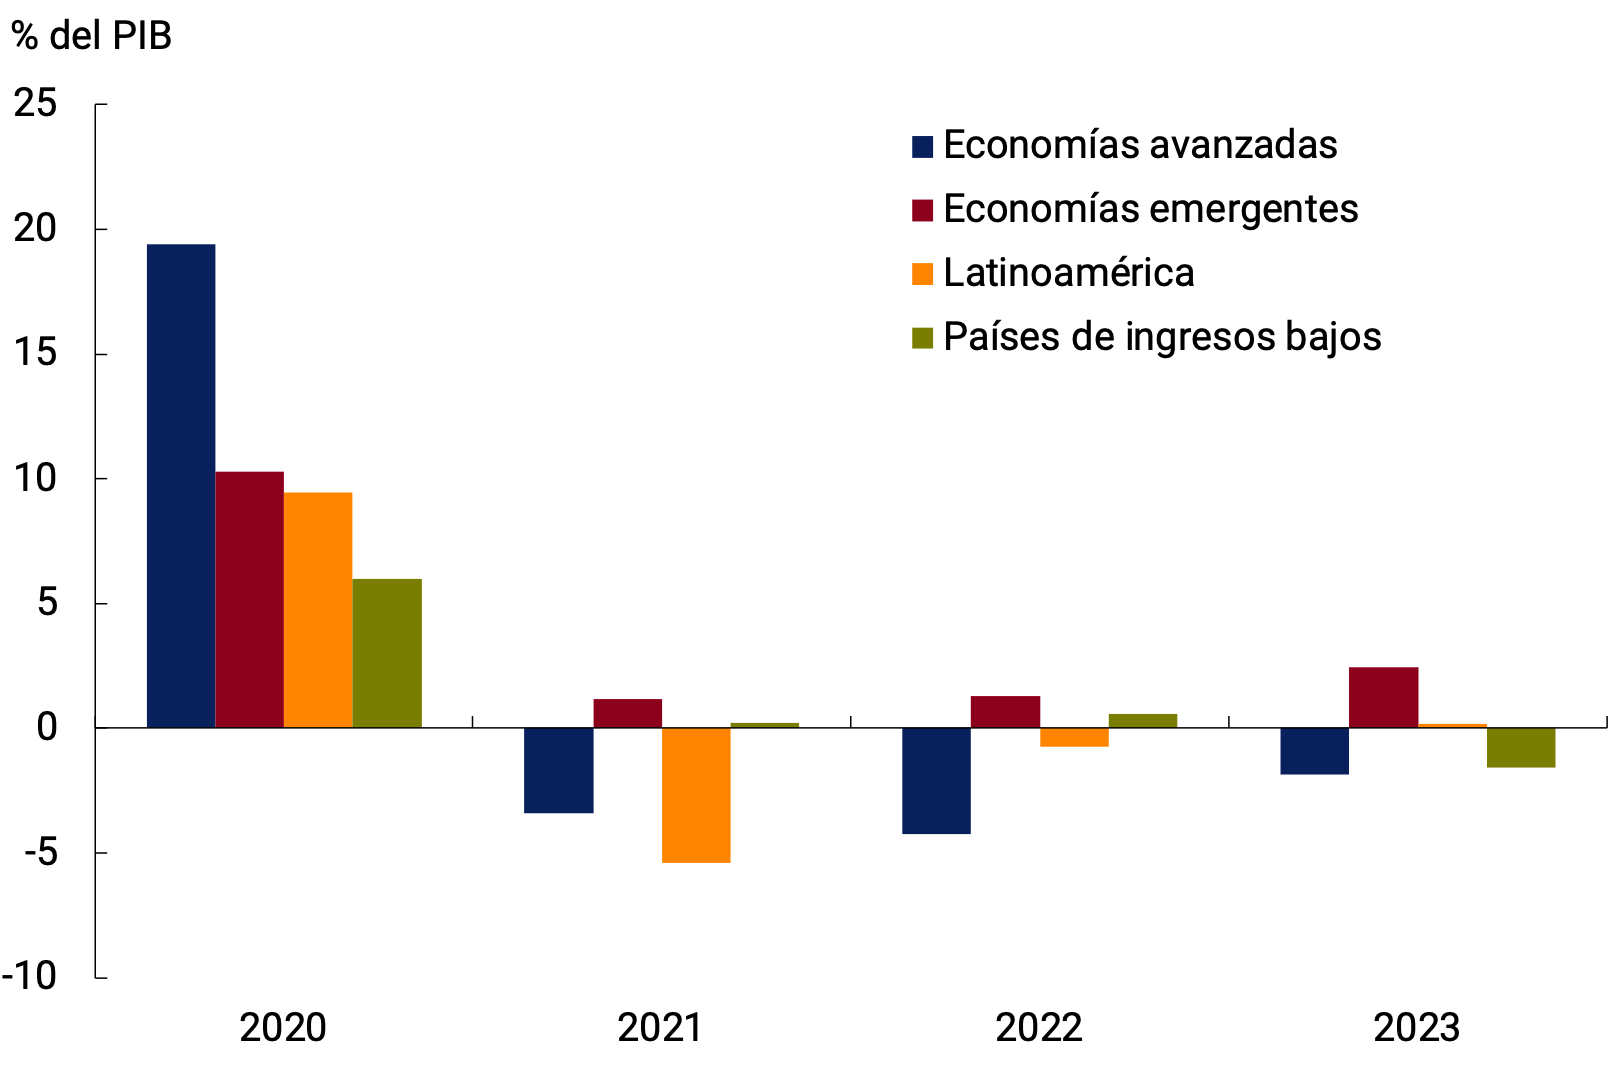
Source: BCRA based on IMF data (Fiscal Monitor, April 22).
In this environment of multiple challenges for public finances, the Russian invasion of Ukraine erupted, which led to a sharp rise in energy and food prices. Commodity prices had been showing an upward trend during 2021 in the face of the recovery in economic activity and problems in supply chains. The war exacerbated this dynamic: after the start of the war, the prices of energy, grains, oils, and fertilizers practically doubled from pre-pandemic levels (in the case of fertilizers, the increase was 207%; see Graph 3).
Graph 3 | International energy, food and fertilizer prices and changes in %
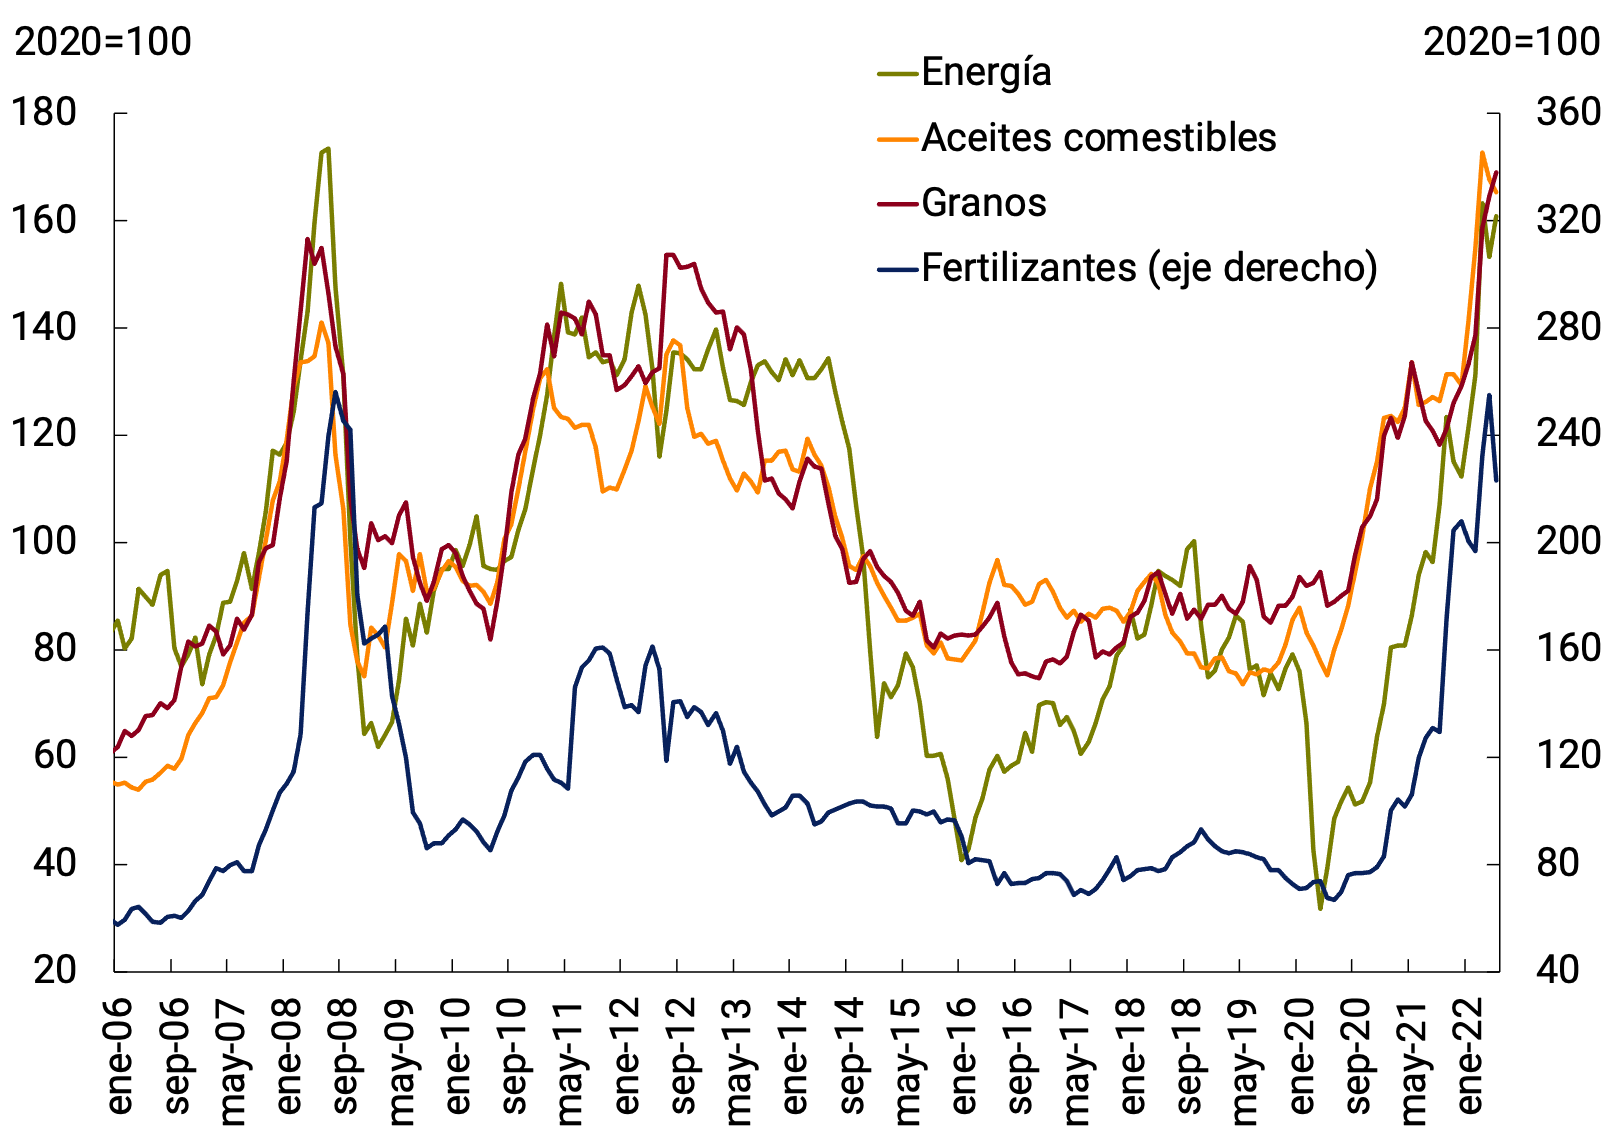
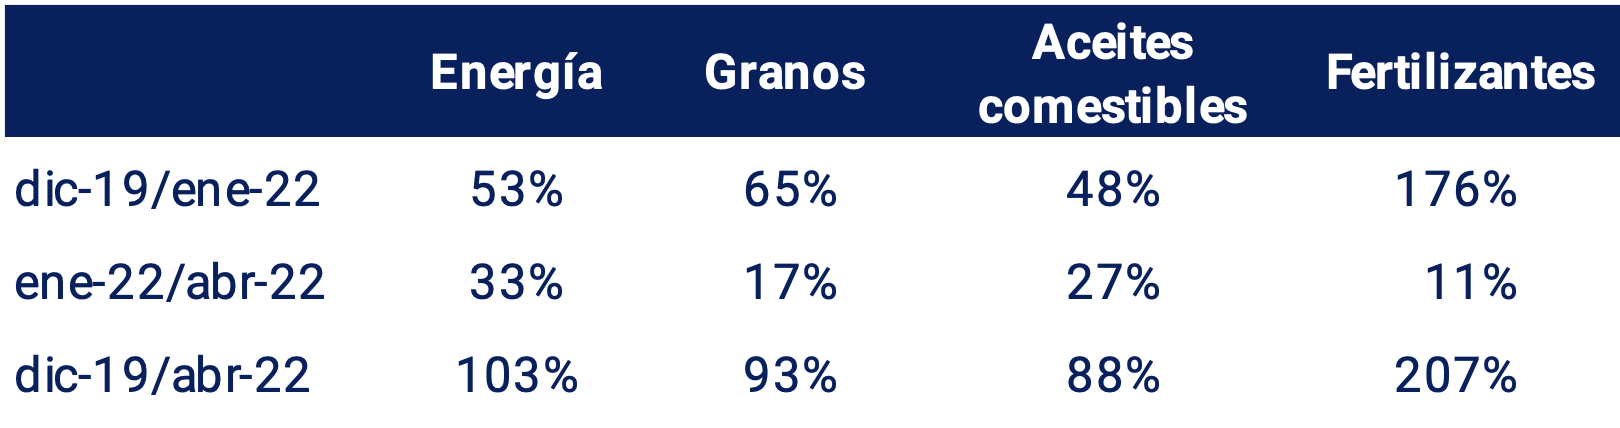
Source: BCRA based on data from the World Bank.
The rise in these prices has a direct impact on the real income of households, particularly in emerging countries and, even more so, in low-income developing countries, where food has a greater weight in consumption baskets. In advanced countries, food represents an average of 16% of household expenditure, a share that rises to about 25% in Latin America and emerging Asia and to 40% in sub-Saharan African countries (see Figure 3). Likewise, this problem is also transferred to the interior of each country, where lower-income households tend to have a greater share of food in their expenses. According to the World Bank, hunger levels remain alarmingly high. In 2021, they surpassed all previous records, with close to 193 million people acutely food insecure, almost 40 million more than during the previous peak in 20203.
Figure 4 | Share of energy and food in the household
basket Accumulated in the year
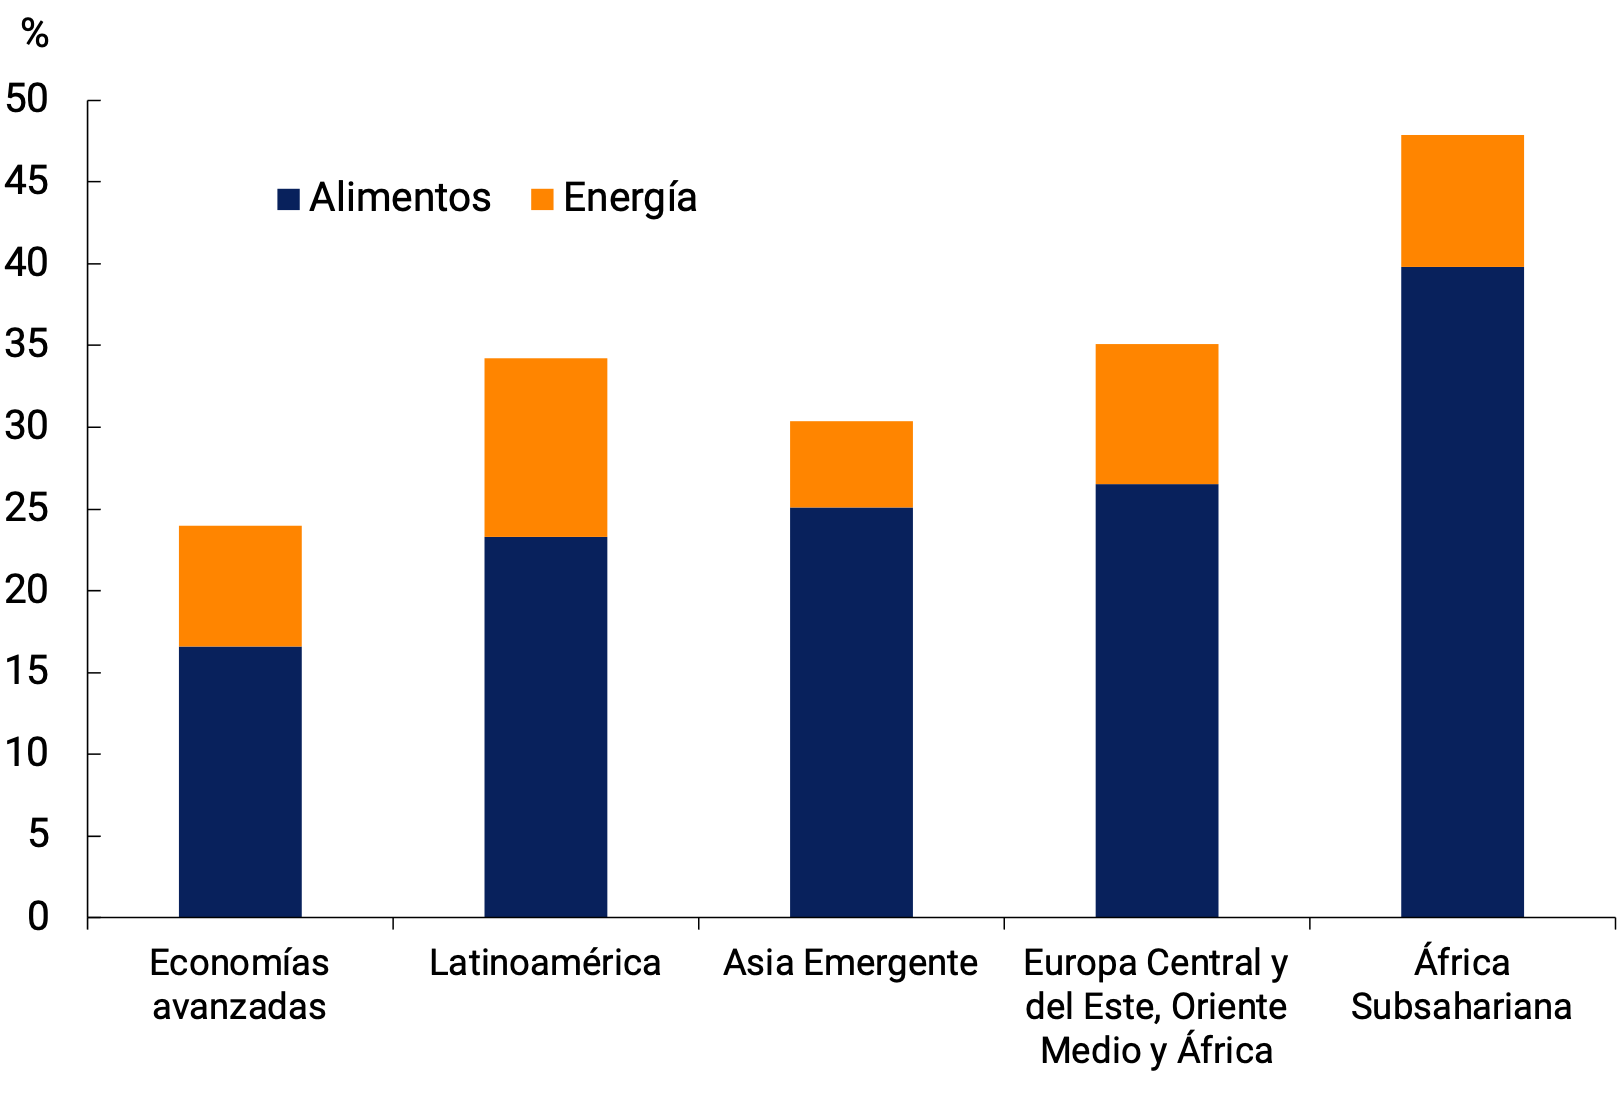
Source: BCRA based on IMF data.
Together with the monetary policy response detailed in Chapter 2. In the international context, many countries took steps to soften the impact of rising energy and food prices on spending by the most vulnerable households. According to a survey carried out by the IMF on 134 countries (between January and March of this year), governments took measures mainly on the expenditure and income policy side, and on the tax side, while export restrictions and loans or guarantees to energy and/or food producers were little used. In the case of spending and income policy measures, price freezes and subsidized prices (implemented by 22% of countries), direct subsidies to food and energy producing companies (12%) and targeted money transfers (7%) stood out. In the case of tax measures, reductions in consumption taxes, such as VAT, internal taxes and fuel taxes (used by 28% of countries), income tax (15%) and import tariffs (10%; see Graph 4) stood out. Advanced countries, with greater fiscal space, took a greater number of measures than their emerging and developing peers. In the case of Latin America and the Caribbean, about 40% of countries implemented measures, with tax reductions predominating, with an estimated average fiscal cost for 2022 of 0.3% of GDP4.
Graph 5 | Measures taken to mitigate the impact of higher food and energy prices (number of countries)
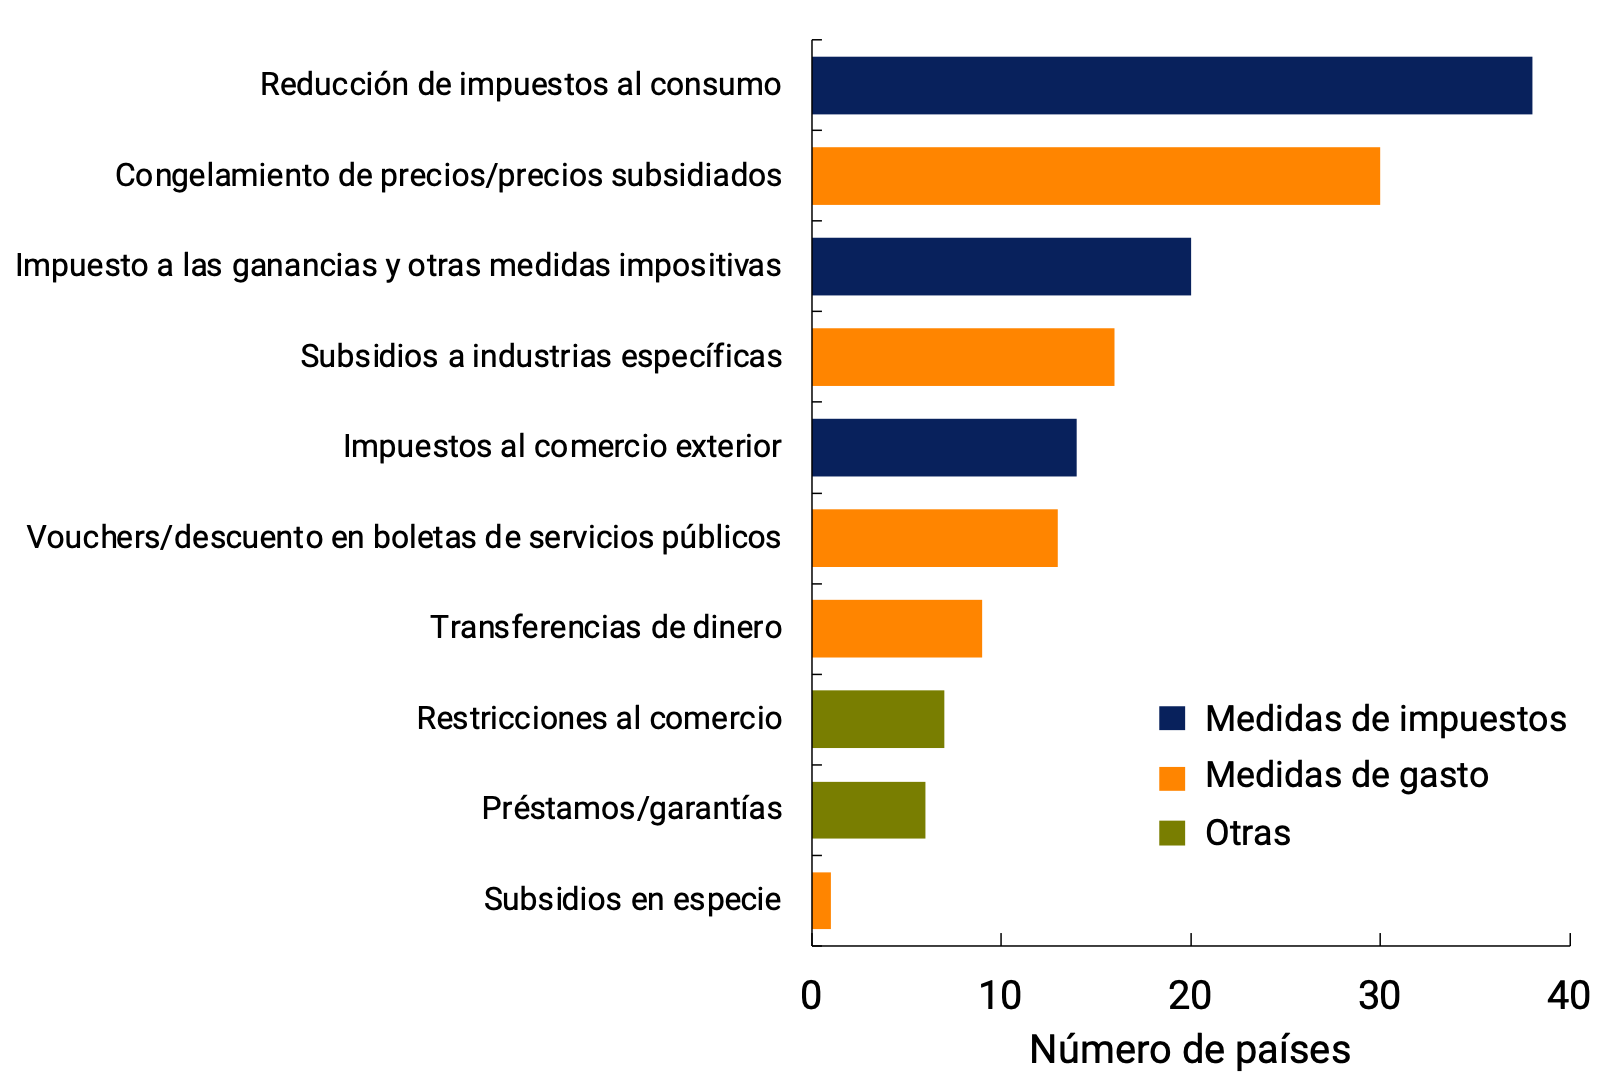
Source: IMF.
The possibility of sustaining these measures to mitigate the loss of purchasing power of households will depend on the duration of the war and the fiscal space of each country. Targeting aid towards the most vulnerable households would help reduce the fiscal impact and give greater room for manoeuvre to public accounts. On the other hand, net commodity exporters will be in a better position to deal with this challenge because of the potential direct or indirect improvement in government revenues. The distortion of producer and consumer incentives that some of these measures generate, by restricting supply (e.g., export restrictions) and encouraging demand (e.g., generalized subsidies), could further stimulate the rise in commodity prices, and is another factor that may weigh on their sustainability. While the war lasts, global coordination of national responses would be desirable, including greater involvement of multilateral organizations, which will stimulate the global supply of these products and a greater availability of food in the most vulnerable countries.
Section 2 / Employment and income: two years after the start of the pandemic
During the fourth quarter of 202113 the employment rate not only exceeded the level prior to the COVID-19 pandemic, but also stood at the highest value (43.6%) of the new series14 of the Permanent Household Survey (EPH) of the Institute of Statistics and Census (INDEC). Different dynamics, at the level of job categories, age groups and gender, among others, have led to changes in the composition of employment in Argentina.
As an example, formal salaried employment (with a retirement discount) has gained weight (2.1 p.p.) within total employment, if we compare the fourth quarter of 2021 with the same quarter of 2019. Both formal private employment (1.1 p.p.) and public employment (1.0 p.p.) have contributed in this regard. On the other hand, there was a fall in informal salaried employment (-1.8 p.p.) and, to a lesser extent (-0.3 p.p.), in independent work (employer and self-employment; see Graph 1).
Graph 1 | Composition of employment
Job category
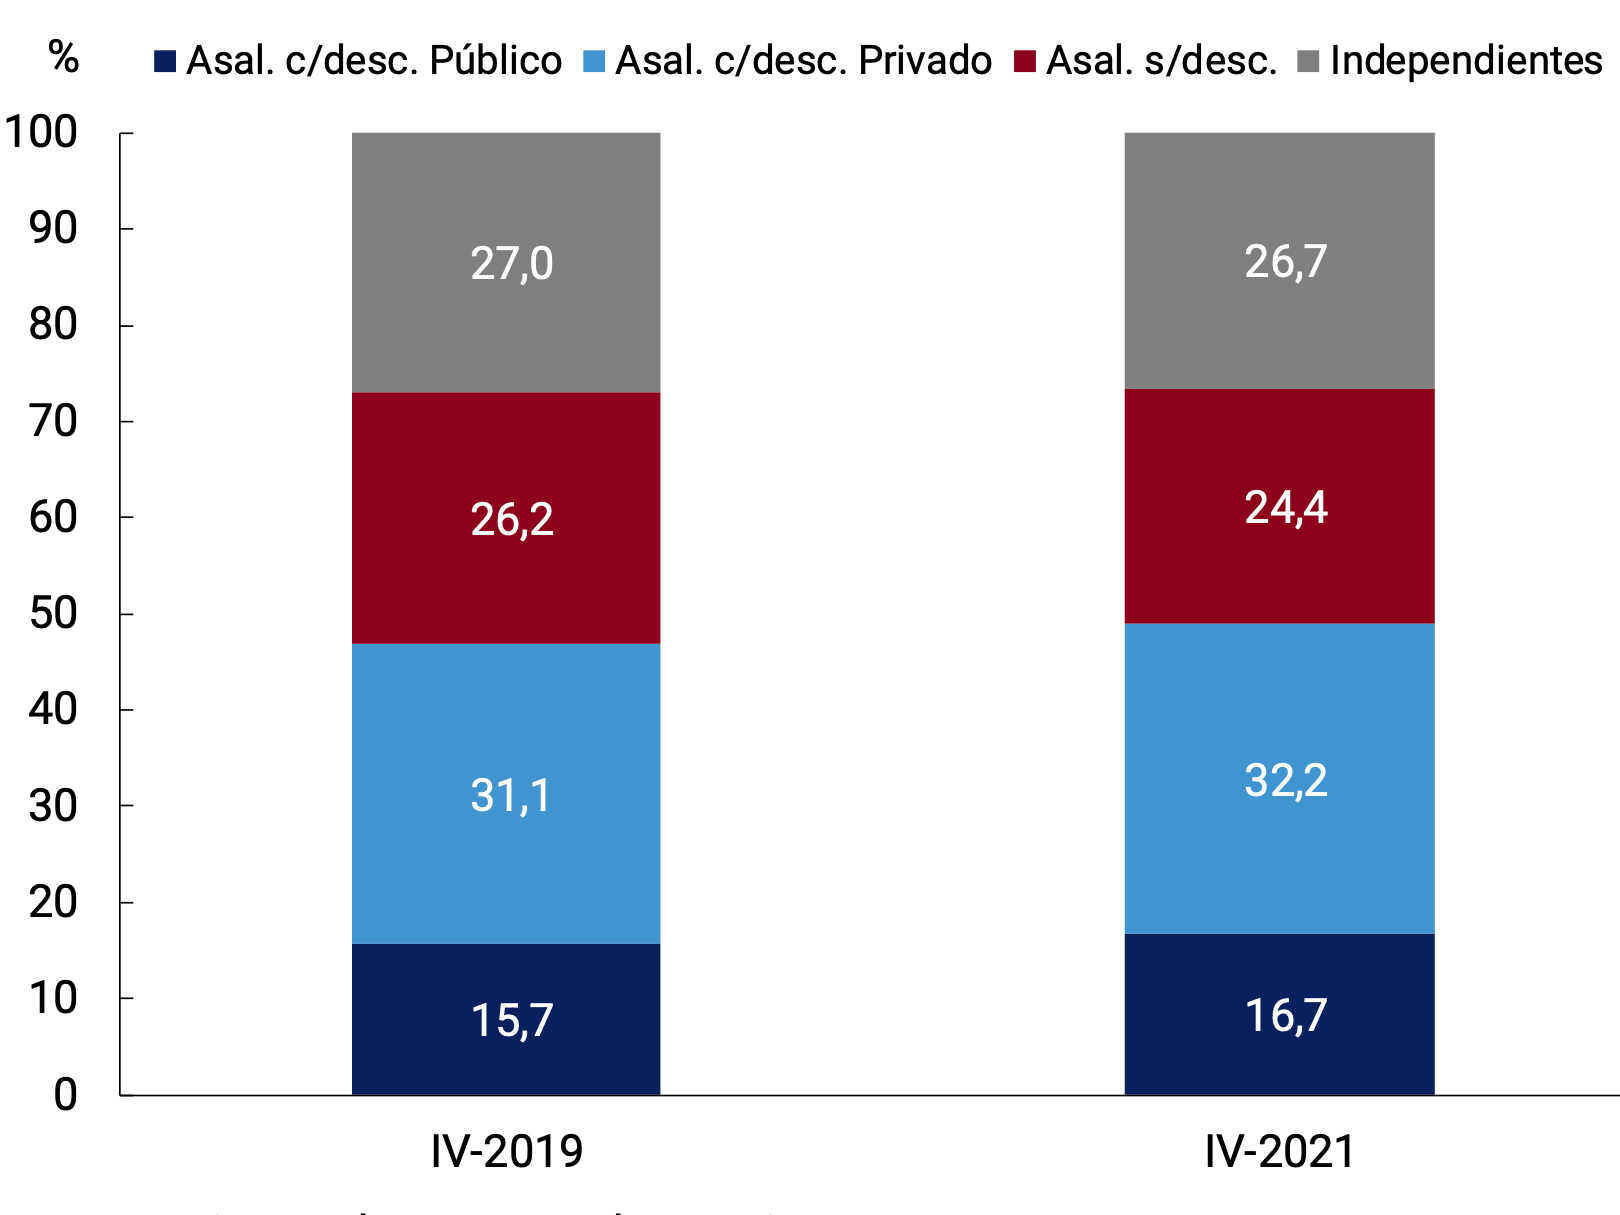
Age and gender
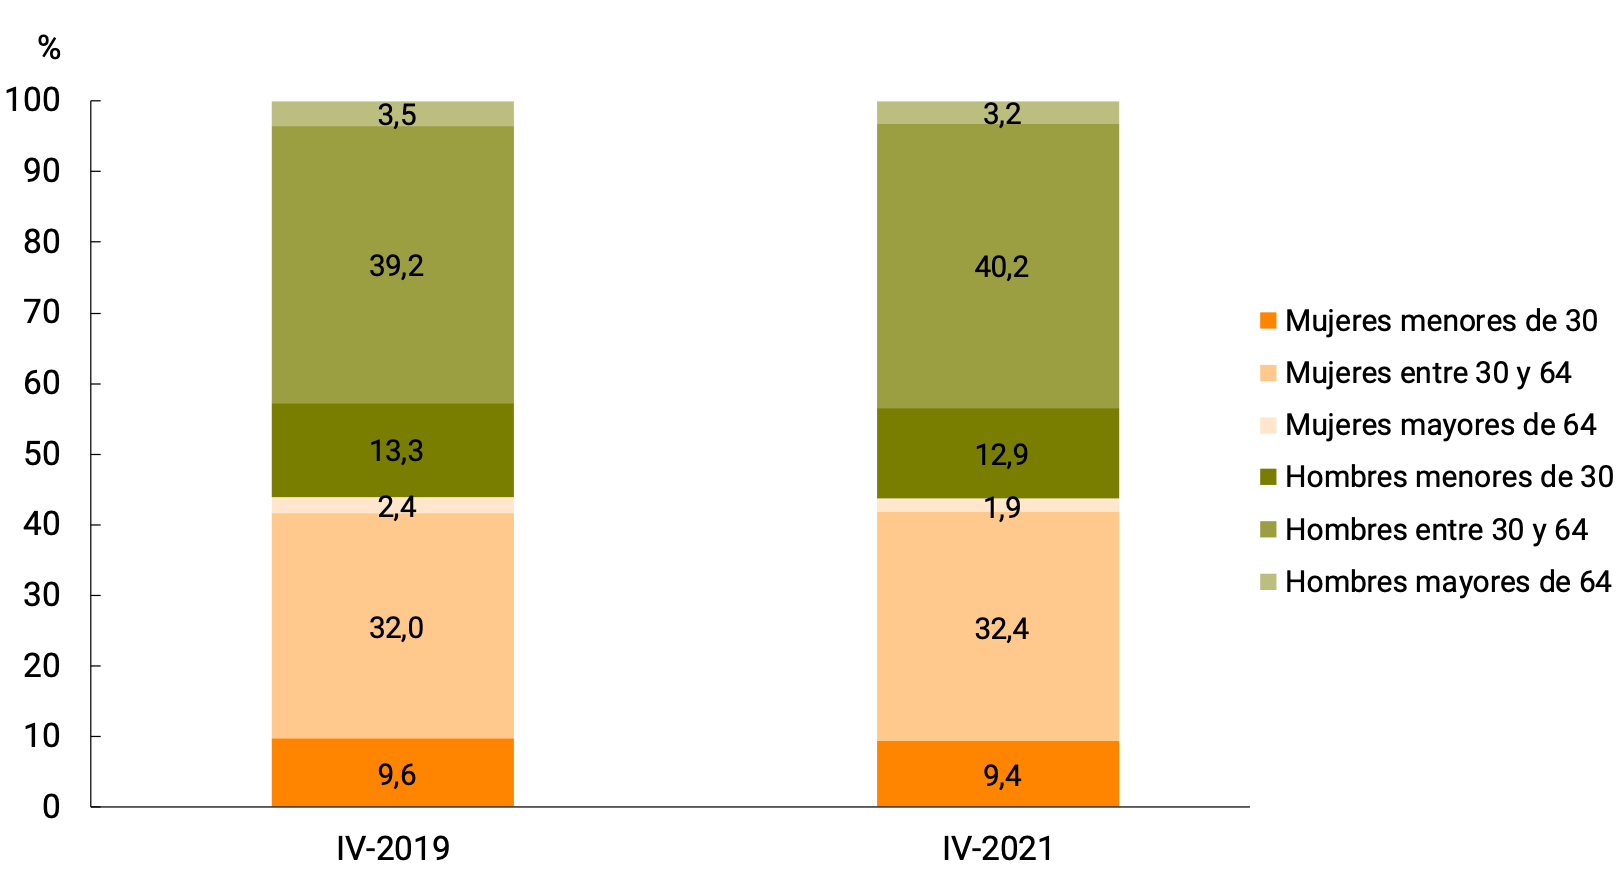
Source: BCRA based on INDEC EPH.
With regard to the age range and gender, there is a greater concentration of employment within the 30 to 64 age group, both in men (+1 p.p.) and women (+0.4 p.p.), thus reducing the participation of older adults (-0.8 p.p.) and young people (-0.6 p.p.; see Graph 1).
For the same period, a fall in total real income per capita (IRTPC) is observed. This decrease is entirely explained by the fall in real non-labour income per capita (IRNLPC), as real labour income per capita (IRLPC) grew. Analysing the evolution of the IRLPC and IRNLPC from the fourth quarter of 2019 to the fourth quarter of 202115, it can be identified that after the impact of the pandemic, the IRLPC have recovered, exceeding the level of the fourth quarter of 2019 by 2% (see Graph 2). On the other hand, IRNLPC have fallen by 17.4% in the same period. The sum of both effects explains the 5.4% drop in IRTPC during the period under analysis.
Graph 2 | Real income per capita
Evolution
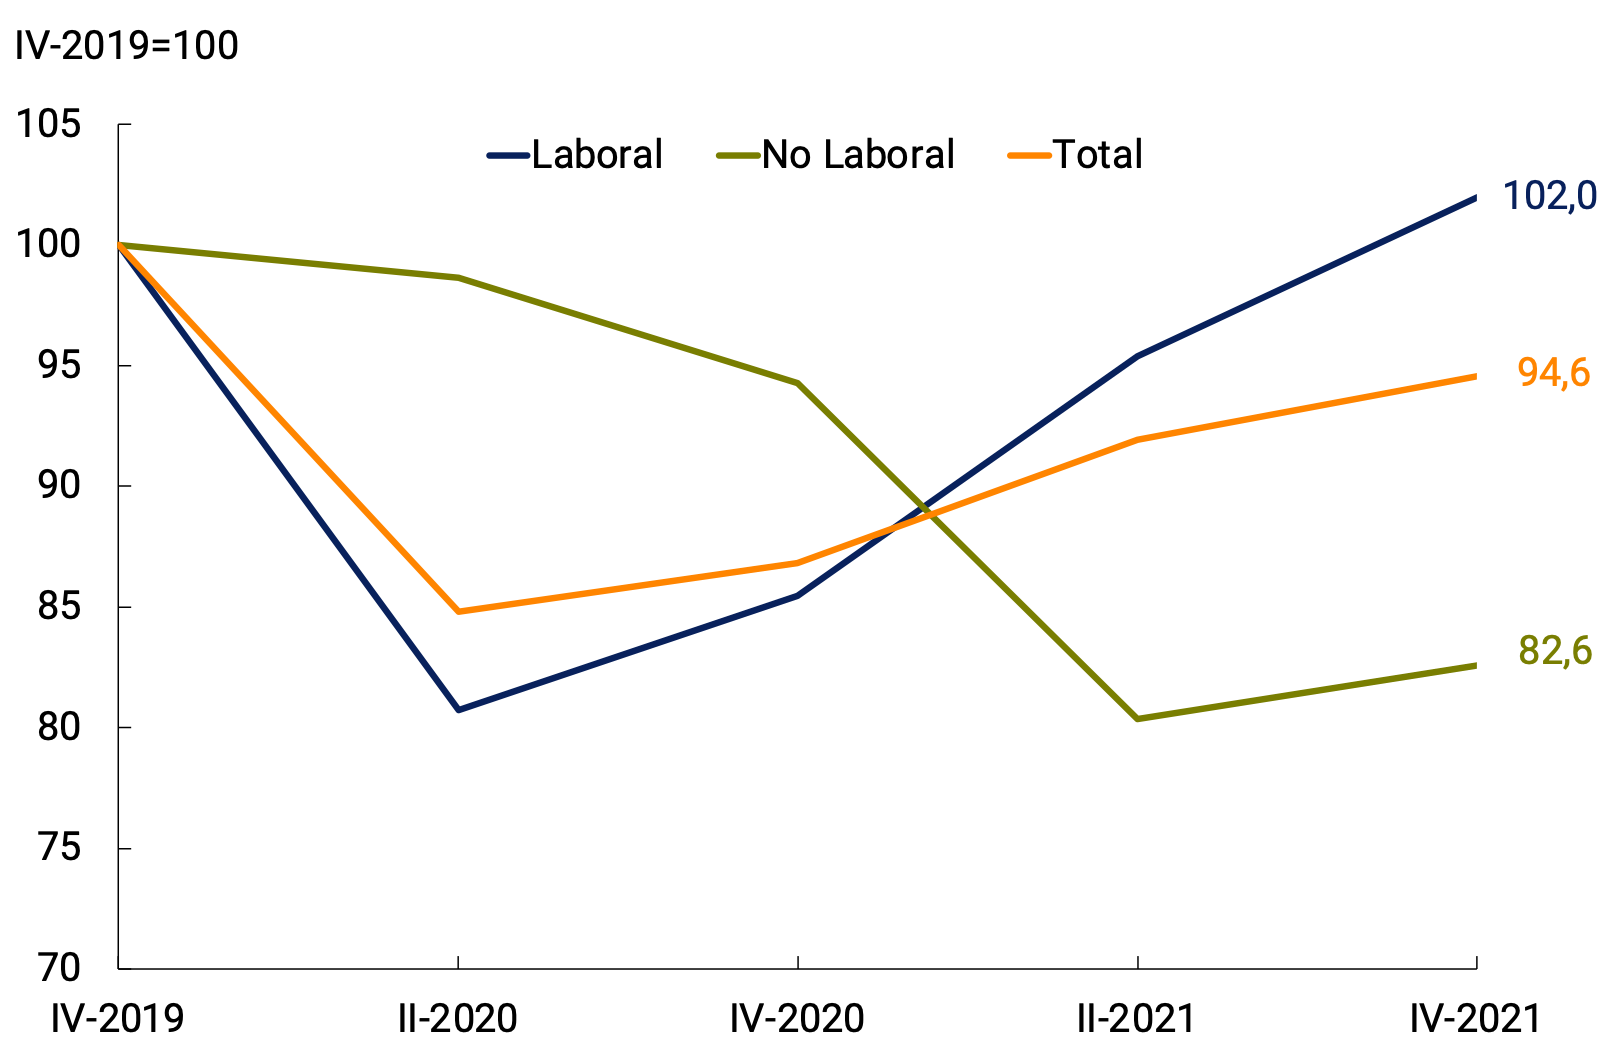
Contributions to the variation in Non-Labor Income
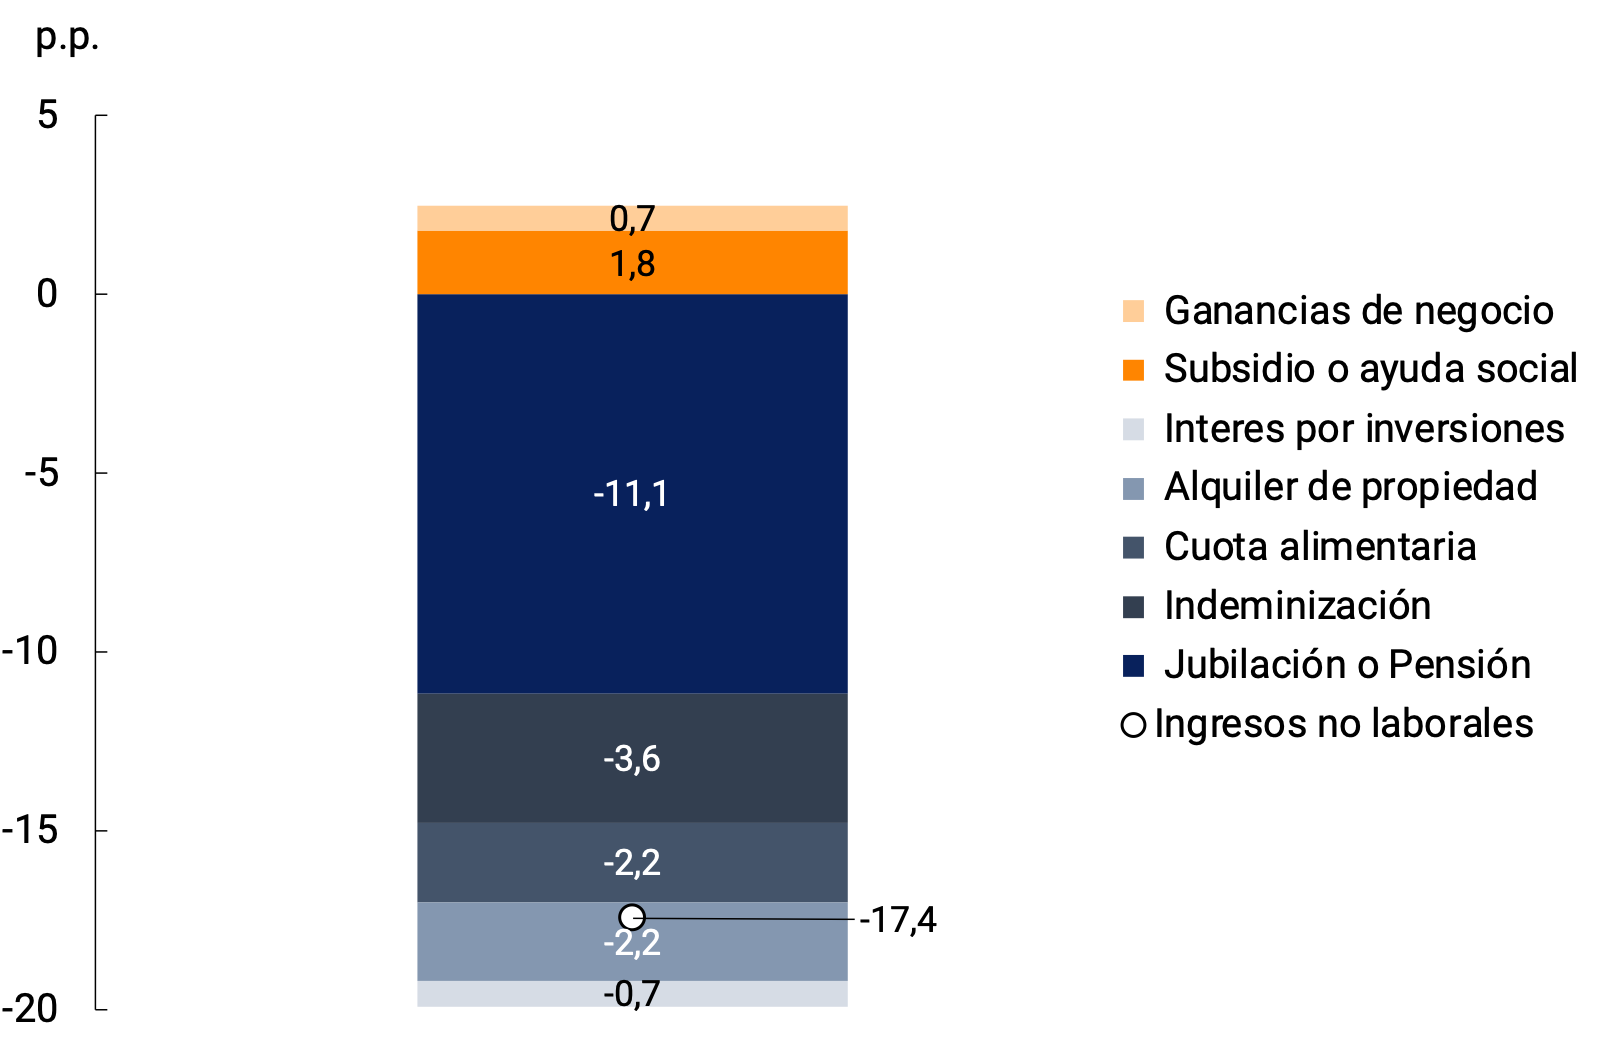
Source: BCRA based on INDEC EPH.
The main items that contributed to the fall in IRNLPC (-17.4%) were: retirements or pensions (-11.1 p.p.), compensation (-3.6 p.p.), alimony (-2.2 p.p.), property rental (-2.2 p.p.) and interest on investments (-0.7). Subsidies or social assistance (+1.8 p.p.) and business profits (+0.7 p.p.) contributed, on the other hand, to partially offset the fall.
The variation in the IRLPC (2.0%) and the IRTPC (-5.4%) has not occurred homogeneously across the different income deciles16. In both cases, a redistributive effect is observed: positive real variations within the four lowest deciles and negative real variations within the six highest income deciles (see Graph 3).
Graph 3 | IRLPC and IRTPC variation according to income
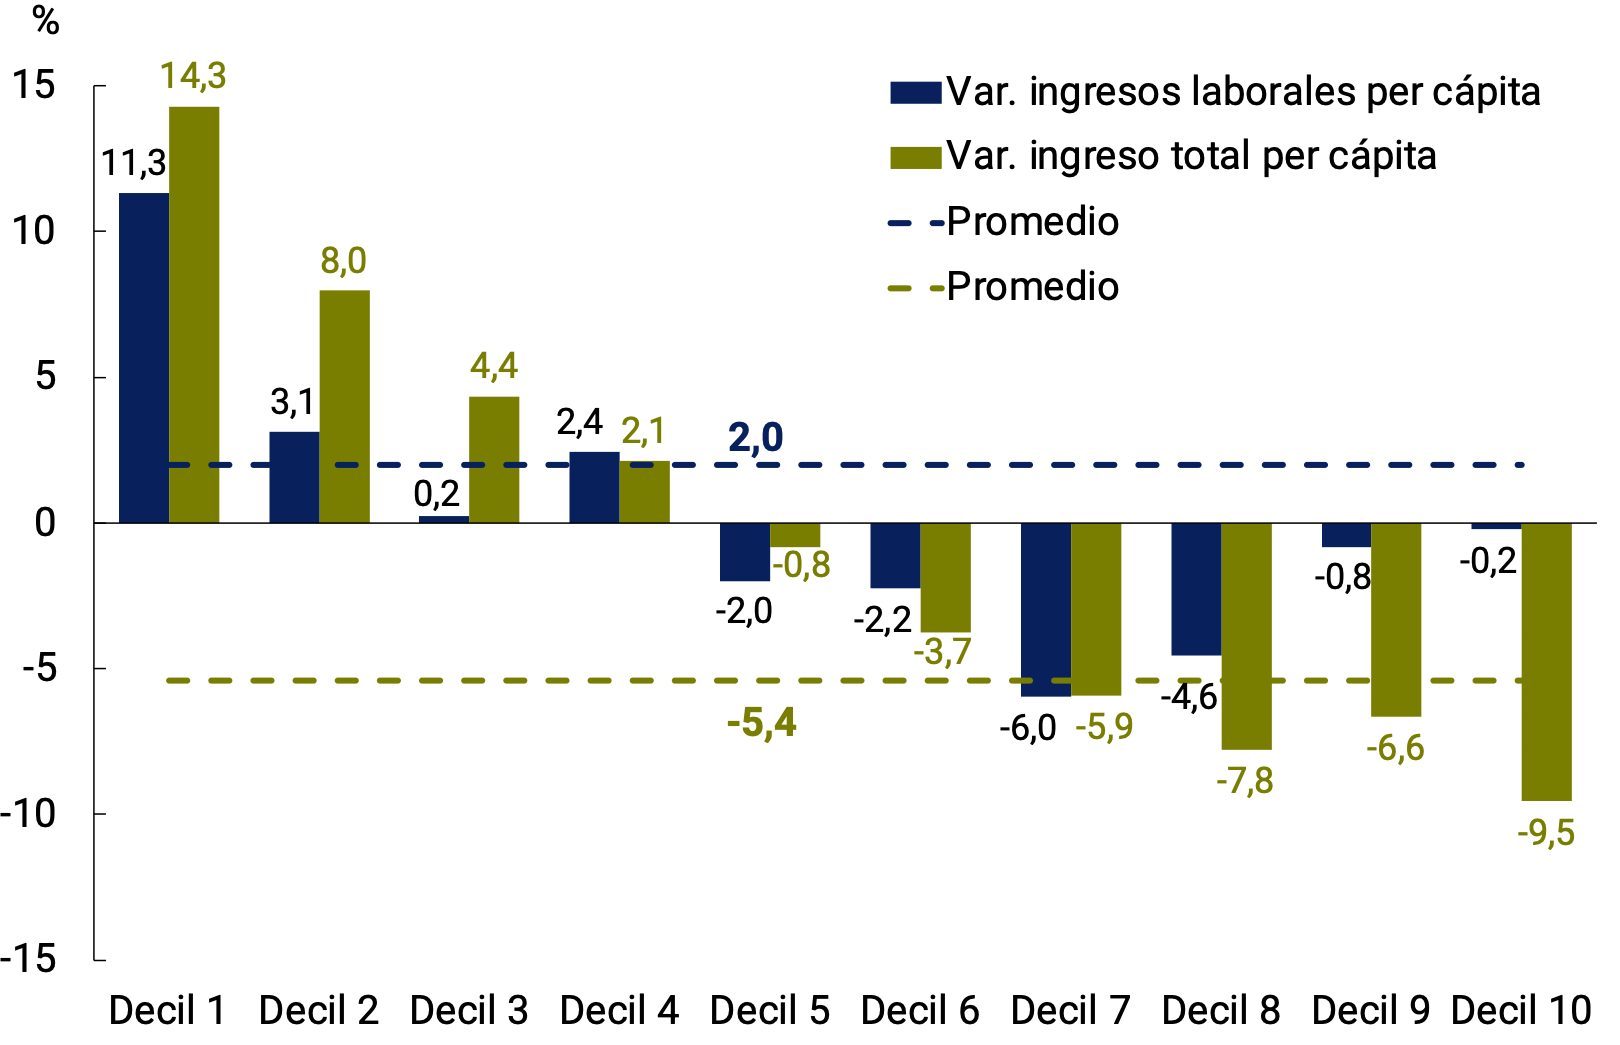
decile
Source: BCRA based on INDEC EPH.
This situation is consistent with the fall in the Gini Coefficient (-0.026 points for the period) detailed in the latest report “Evolution of income distribution (EPH)” of April 2022 published by INDEC. In turn, the variations of the IRTPC across the deciles also explain why, despite having an average fall of -5.4% during the period under analysis, poverty fell between the fourth quarter of 2019 (38.3%) and the fourth quarter of 2021 (36.3%).
The phenomenon of increased IRTPC in low-income deciles is also consistent with the need for these households to strengthen their incomes in a context in which, during the pandemic, a fall in real wages had been observed. The new workers managed to obtain jobs by more than compensating for the exit of the elderly from the labor market due to the pandemic17. A recovery in real labor income was gradually observed, reaching levels slightly higher than those of the end of 2019 towards the end of 2021.
According to what has been analyzed in this section, it can be concluded that, for the period analyzed, the labor market as a whole showed a solid recovery after the pandemic. In terms of employment, employment reached the maximum of the new EPH series with a greater weight of formal employment (salaried people with a retirement discount). From a real labor income perspective, these managed to exceed the level prior to the start of the pandemic. In turn, despite the average fall in real total income, the role of subsidies and social assistance allowed the impact not to fall on the lowest income deciles of the population.
Finally, it is important to highlight two relevant aspects to take into account. The first of these is that the situation of the labor market in general, but mainly of the real income of the population, was in a delicate situation prior to the beginning of the pandemic, that is, in the fourth quarter of 2019. That is why, as encouraging as it sounds to have recovered pre-pandemic levels, there is still a lot of room for improvement both in terms of formalization of employment and increase in the purchasing power of the population. The second aspect is directly related to the current evolution of prices: the inflationary acceleration during the first months of 2022 may have affected the real incomes of the most vulnerable population, supporting the measures to reinforce household incomes taken by the government in recent months (See Section Measures taken to reinforce incomes).
Section 3 / Measures taken to strengthen revenues
The greater inflationary pressures derived from the external shock associated with the war in Ukraine have affected the purchasing power of income at the domestic level, generating difficulties in some sectors to access the basic basket. Faced with these extraordinary circumstances, the National Government ordered an expansion of social support aimed at households in the most vulnerable situations, with the aim of strengthening their income, while sustaining the economic recovery, within the framework of the program agreed with the International Monetary Fund (IMF).
This income policy is part of the government’s efforts to promote the recovery of the real income of households in the lowest income deciles after years of crisis (see Section 2 / Employment and income: two years after the start of the pandemic), understanding that it is important for stability and to underpin economic growth with social inclusion32.
Indeed, with the change of management in December 2019, the National Government sought to reverse the loss of purchasing power of pension benefits observed in previous years. Thus, the Government granted33 bonuses to retirees and pensioners in December 2019 and January 2020 for recipients of the minimum wage, and a bonus, for a single time in December, for each son or daughter for those who receive the Universal Child Allowance (AUH) and Pregnancy Allowance (AUE). On the other hand, within the framework of the Argentina Plan against Hunger34, the Government devised the Food Card, which initially stipulated $6,000 per month for households with children under 6 years of age. The card allowed families in vulnerable situations to purchase food in any store and its objective is to guarantee access to the basic food basket.
Starting in March 2020, the government deployed a battery of programs in order to mitigate the effects of the pandemic. First, it promoted in the very short term an Emergency Family Income (IFE)35 that was executed by the National Social Security Administration (ANSeS). The IFE was an exceptional non-contributory monetary benefit, which sought to protect the income of Argentine families in the face of the loss or decrease in their income due to the health emergency situation generated by COVID-19. The measure covered a universe of approximately 8,970,000 people. The beneficiaries were those unemployed or in informal employment, as well as social monotributistas and workers in private homes.
Second, expanding direct income transfer policies, the Government granted an extraordinarybonus 36 for recipients of Universal Child Allowance (AUH) and Universal Pregnancy Allowance (AUE) to approximately 4 million children and adolescents. A similar bonus was also agreed for almost 600 thousand holders of social plans such as Hacemos Futuro and recipients of the Complementary Social Wage. In addition, an extraordinary bonus was granted for retired and pensioned people, specifically for those who receive a single salary, which reached more than 4.3 million people. Added to this was a policy of debt relief with the ANSeS itself.
Third, the Government collaborated with private sector companies through the implementation of Emergency Assistance to Work and Production (ATP). The ATP37 program included a series of benefits: the payment of employer contributions to the Argentine Integrated Pension System (SIPA) was postponed or reduced to 95%; a complementary salary paid by the State to certain workers in a relationship of dependence in the private sector was implemented; and zero-rate credits were granted for single-tax and self-employed people, as well as subsidized rate credit for companies. Particularly, the last ATP paid in 2020 included 563,312 workers from 33,873 companies38. Finally, an increase in the amount of unemployment insurance was also carried out39.
As the effects on the productive sectors dissipated, the vaccination campaign covered a significant proportion of the population and economic activity recovered, policies focused on those people linked to sectors still affected by the pandemic to sustain sources of employment. The40 Productive Recovery Program (RePro2) continued to provide aid to companies that saw their activity affected by the pandemic in order to sustain private employment41. The Empower Work42 program aims to contribute to improving employment through the development of productive, community and training projects, in order to promote full social inclusion for people who are in a situation of social and economic vulnerability. As part of the National Government’s commitment to progressively transform social plans into registered employment, the State provides incentives to employers to incorporate beneficiaries of the Plan as registered employees43.
From the second quarter of 2021, a series of exceptional measures were adopted in order to mitigate the economic effects caused by the second wave of the pandemic and to strengthen the economic and social protection of the most deprived sectors. Thus, the coverage of the Food Card was extended to44 years of age to girls and boys of 14 years of age, pregnant women, mothers and fathers of children with disabilities, these without age limit, and mothers with seven or more children up to and including 14 years of age. At the same time, new extraordinary payments were made to beneficiaries of lower-income retirements andpensions,45 and an extraordinary subsidy of $15,000 was granted to holders of the Universal Child Allowance (AUH) and single-payers A and B holders of Family Allowances, residents of the Metropolitan Area of Buenos Aires (AMBA)46. Likewise, a monthly supplement was established to the family allowance per child of formal workers depending on the income range to which they belong47.
After the acceleration of inflation in the first months of this year as a result of the external shock, during the course of the second quarter,48 allowances have been granted again for informal workers, unemployed or income-free people, employed in private homes, single-payers, retirees and pensioners to reinforce income policy and prevent the shock that the world is experiencing, and Argentina, has harmful effects on inequality. In addition, as of May 2022, the amount of the Alimentar card was increased by 50%49.
As previously described, the main assistance programs for people have played a major role in recent years. According to the information that emerges from the physical execution of the National Budget, it is possible to account for the increase in the coverage and expansion of these programs (see Table 1).
Table 1 | Main Assistance Programs for Persons in Physical
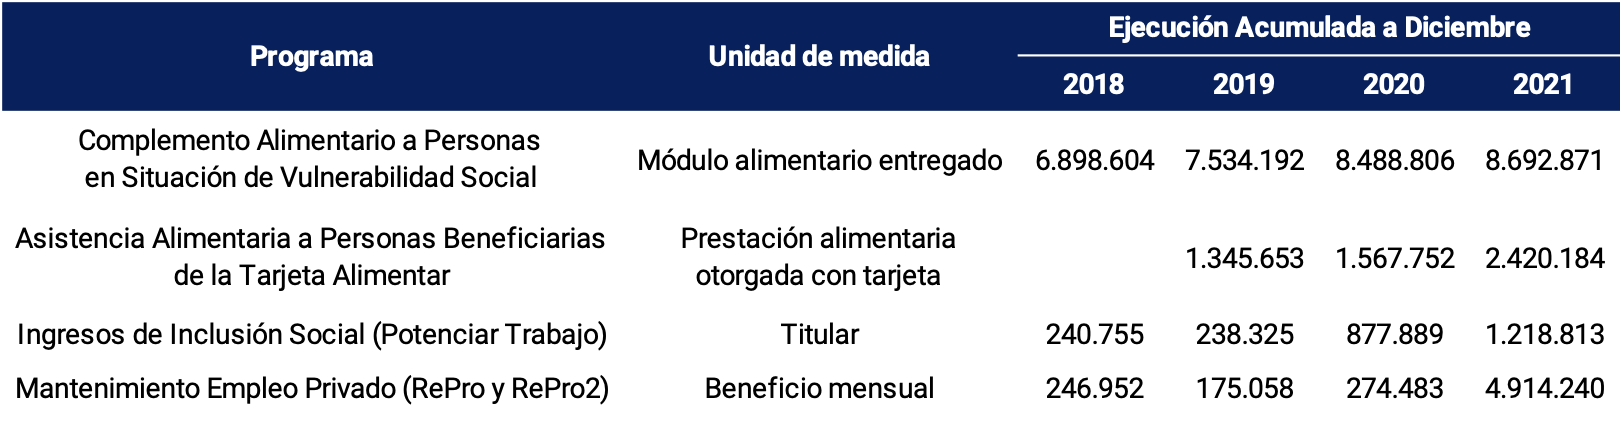
Units
Source: Directorate of Budget Evaluation of the National Budget Office (Ministry of Finance).
Likewise, based on the information on Credit and Expenditure of the National Public Administration Budget, it is possible to verify the financial execution of each of the budget programs (see Graph 1)
Graph 1 | Current transfers to the Private Sector (Aid to Individuals) of the National
Administration Millions of pesos at Dec-21
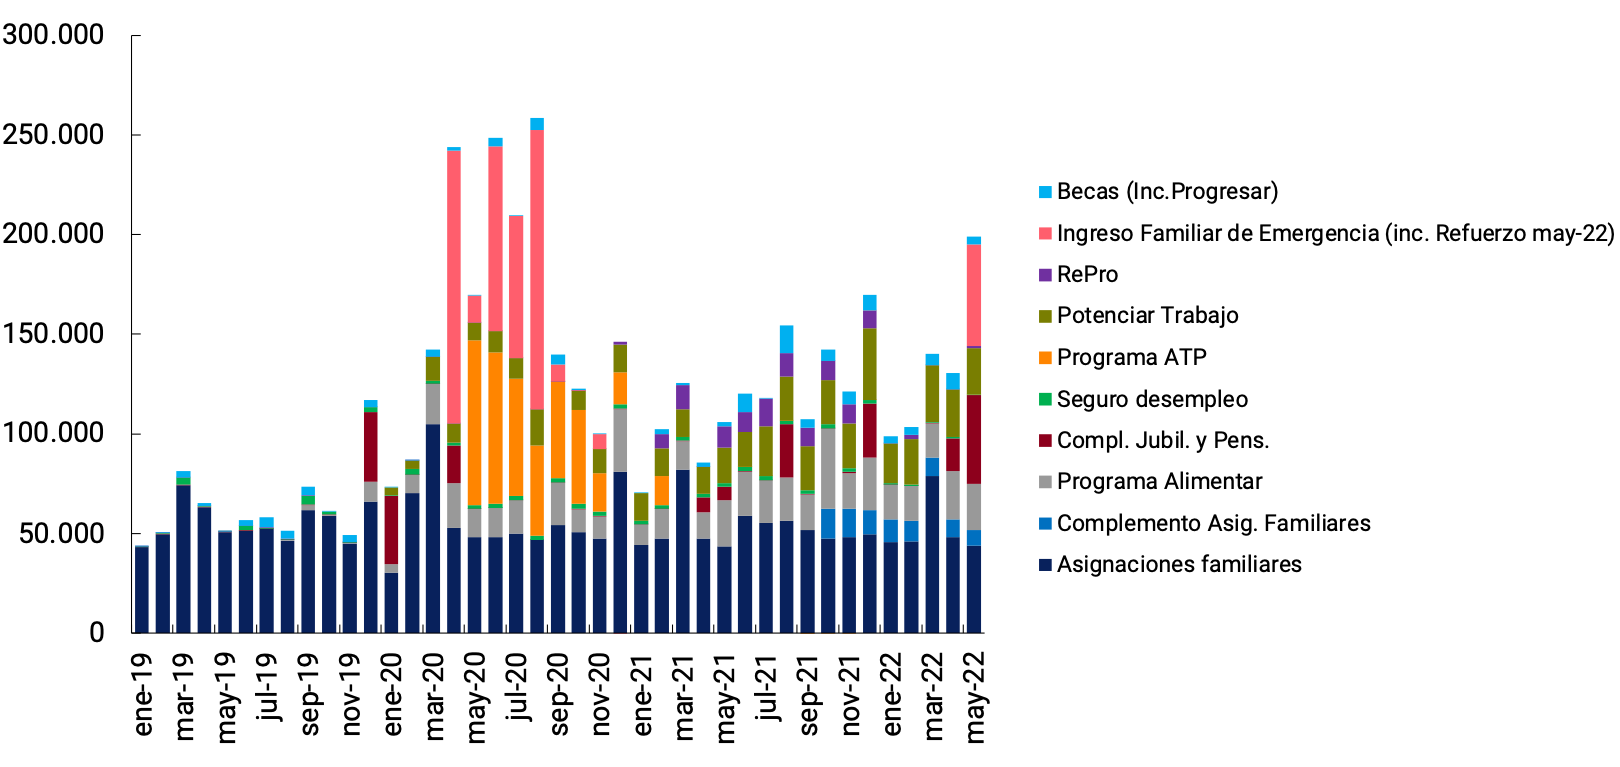
prices Source: BCRA based on data from the Ministry of Finance.
In conclusion, since the end of 2019 the National Government took a series of measures to sustain the real income of families, in the face of the complex macroeconomic situation with which the previous administration ended. Then, during the COVID-19 pandemic, it generated the mechanisms to support workers – both formal and informal – companies and society in general to mitigate its harmful effects. As the negative effects of the pandemic dissipated, the Government focused its attention on the population in a situation of greater vulnerability or linked to the productive sectors that took longer to recover from the pandemic. Currently, in the face of the start of the war between Russia and Ukraine and its inflationary effects as a result of the disruption of production chains, the government has reinforced the income of this population with a series of urgent and exceptional measures (see Section 4 / Recent developments in food prices).
Going forward, it is expected that, within the framework of the Extended Facilities Program with the IMF, the consolidation of greater macroeconomic stability will favor economic growth and the gradual reduction in inflation, allowing the Government to progressively transform these income support tools to support the growth of formal private employment.
Paragraph 4 / Recent developments in food prices
In the first months of 2022, there was a significant acceleration in food and beverage (A) prices at the domestic level, which reached very high rates of change in historical terms. In January and February, there was a sharp increase in vegetables and fruits due to climatic factors that temporarily affected supply (see IPOM, March 2022). In March and April, the acceleration was concentrated in the rest of the AyB. This behavior was mainly due to the war between Russia and Ukraine, which caused a strong boost to international commodity prices since the end of February, exacerbating the upward trend that had already been evident since mid-2020. This episode had an impact on food and energy prices, increasing international inflation rates and putting global food security at risk (see Graph 1 and Chapter 2. International Context).
Graph 1 | Evolution of international food
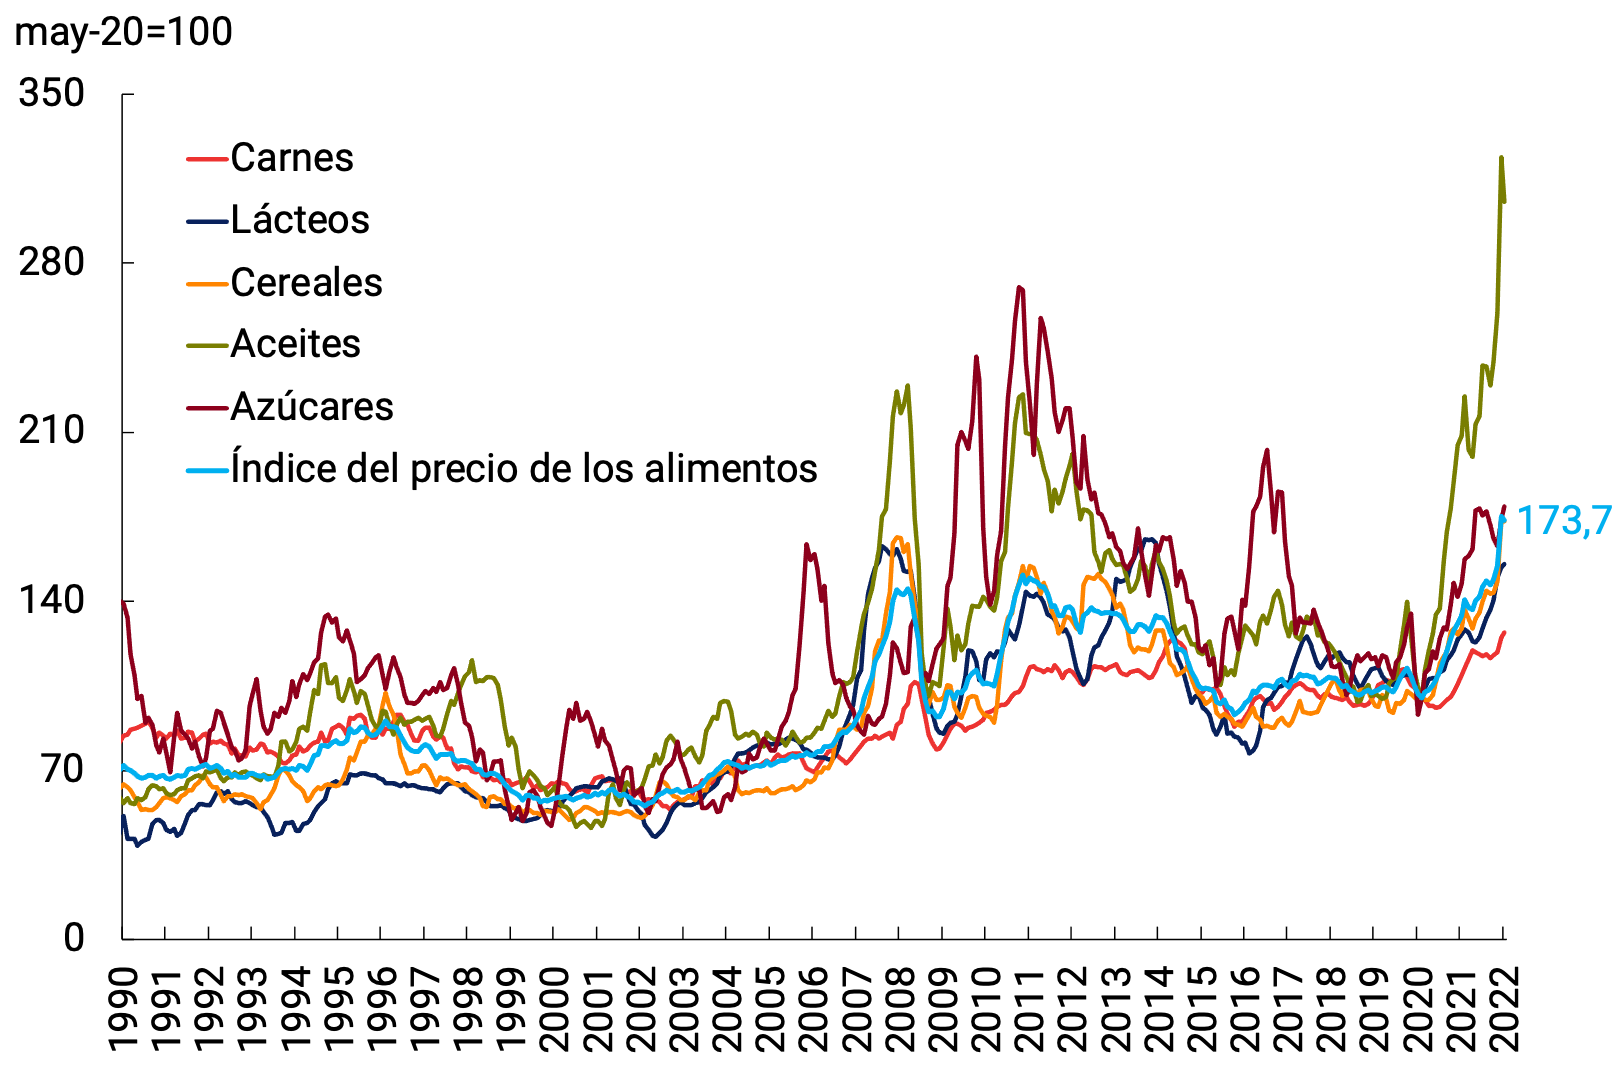
prices
Source: FAO – Food Price Index.
In Argentina, the external shock produced a further acceleration in the prices of A which, in the context of high inflationary inertia, quickly spread to most goods and services in the consumption basket. Although as a whole the AyB significantly increased its rate of increase in the first months of the year, the evolution has been different between those that make up the Core category, with an acceleration spread in March and April, and those that belong to the Seasonal category (fruits, vegetables and vegetables), which slowed down after a first two months in which they were affected by transitory problems in the supply.
Regarding the acceleration of non-alcoholic A that make up the Core category, although it was disseminated, some heterogeneity can be observed in the average rate of increase among the main grouped (see Graph 2). The class of the national CPI that accumulated the highest increases in the second two months of the year was Bread and cereals (21.8% year-on-year, 10.4% monthly average, +6.3 p.p. compared to the average of the first two months), affected by the significant increase in the international price of wheat, a crop in which Ukraine stands out as one of the main producers and exporters globally.
In second place, driven by the increase in the international cost of corn, the main input for fodder, the increases in Milk, dairy products and eggs (16.7% acum., 8.0% average, +3.2 p.p.) and in Meat and derivatives (16.6% acum., 8.0% average, +4.5 p.p.) stood out.
Finally, the classes that rose less than the average of the A of the Core category were: Sugar, sweets and others (13.6% acum., 6.6% average, +2.6 p.p.), Oils, fats and butter (12.3% acum., 6% average, +2.0 p.p.) and Non-alcoholic beverages (9.4% acum., 4.6% average, +0.9 p.p.). In the case of oils, the trust arising from the agreement between the companies in the sector and the national government in December 2020 and renewed in February 202253 contributed to partially and temporarily decoupling the evolution of the domestic price from the international price, taking into account that it was one of the groupings that rose the most globally in recent years (see Graph 1).
In May, as the effects of the international shock moderated, there was an incipient slowdown in domestic A Among the groupings that slowed their increases the most were those that had led the acceleration of the second two months: Bread and cereals (4.7% in May, -5.7 p.p. compared to the second two months average), Milk, Dairy products and eggs (4.4%, -3.6 p.p.) and Meat and derivatives (6.2%, -1.8 p.p.).
Graph 2 | Recent evolution of the prices of core Food and non-alcoholic
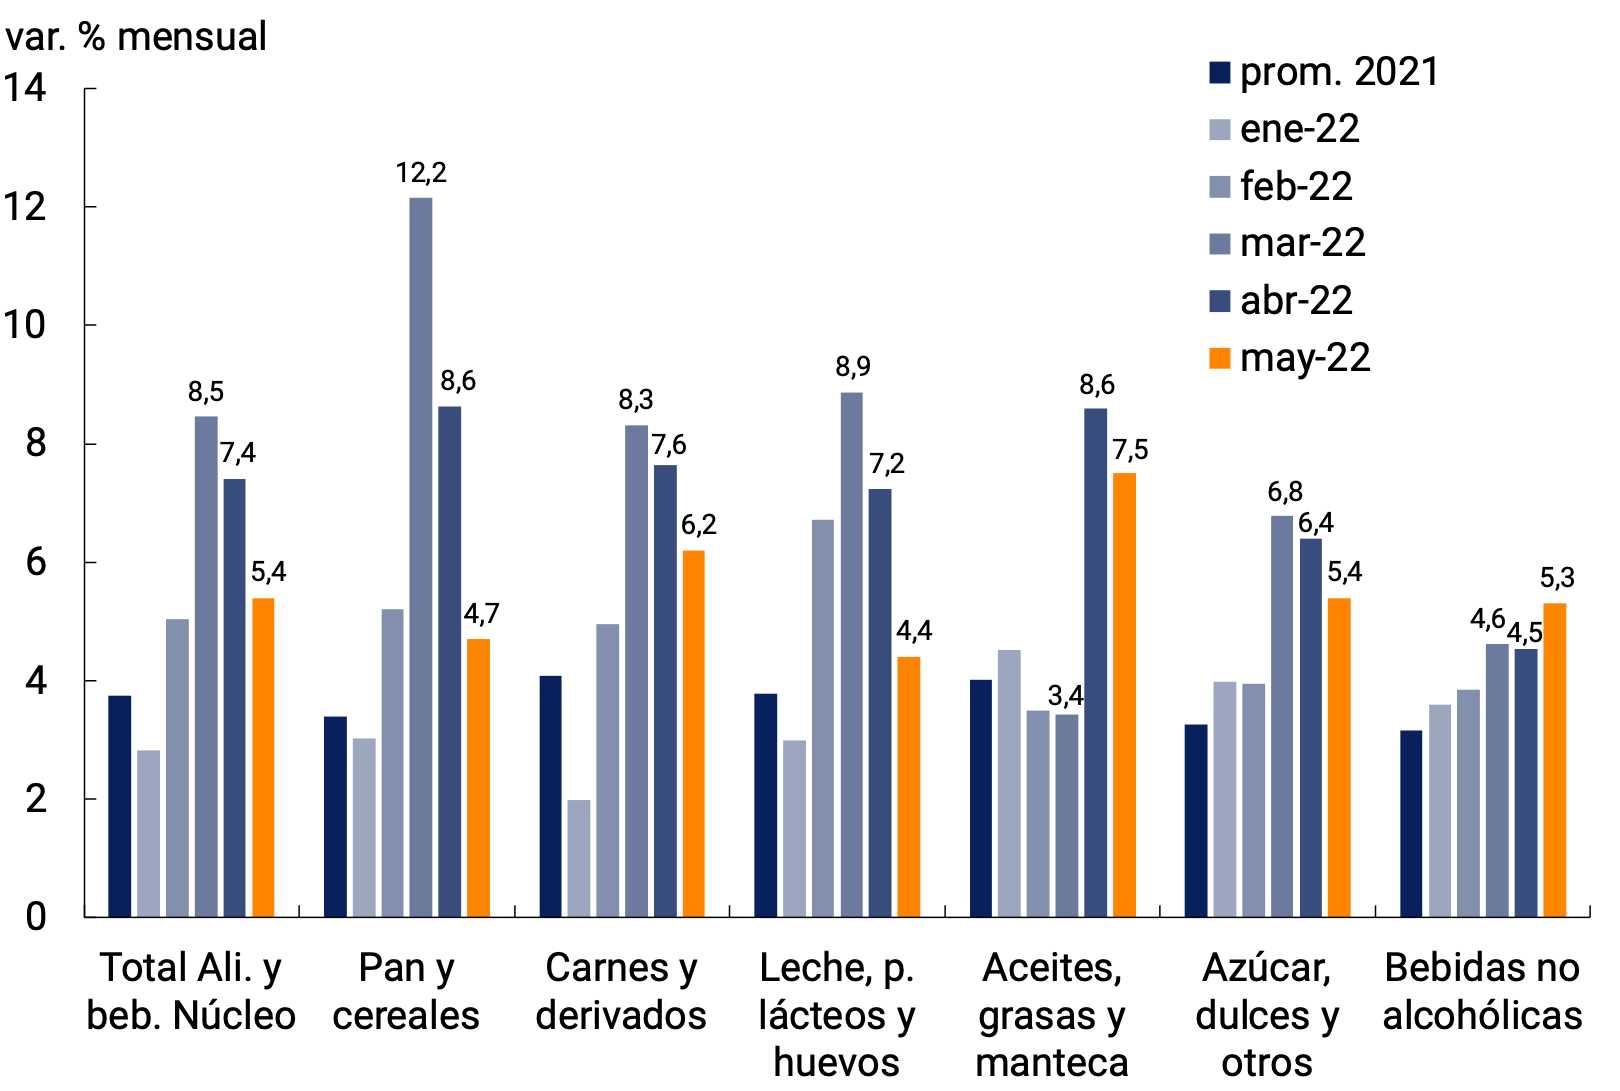
beverages
Source: BCRA based on INDEC data.
With a higher level of disaggregation, analyzing the average prices of 50 AyB published by INDEC for GBA, an increase in the percentage of items that rose more than 4% monthly has been observed since February (as suggested by the greater participation of the light blue, blue and red bars in Graph 3). This behavior was similar to that observed in episodes of currency depreciation (see 2018 and 2019), but in this case in a period of moderate increases in the nominal exchange rate. In May, after the effect of the international shock moderated, there was a reduction in the percentage of items that rose above 8%.
Graph 3 | Dissemination of Food Beverage increases in GBA*
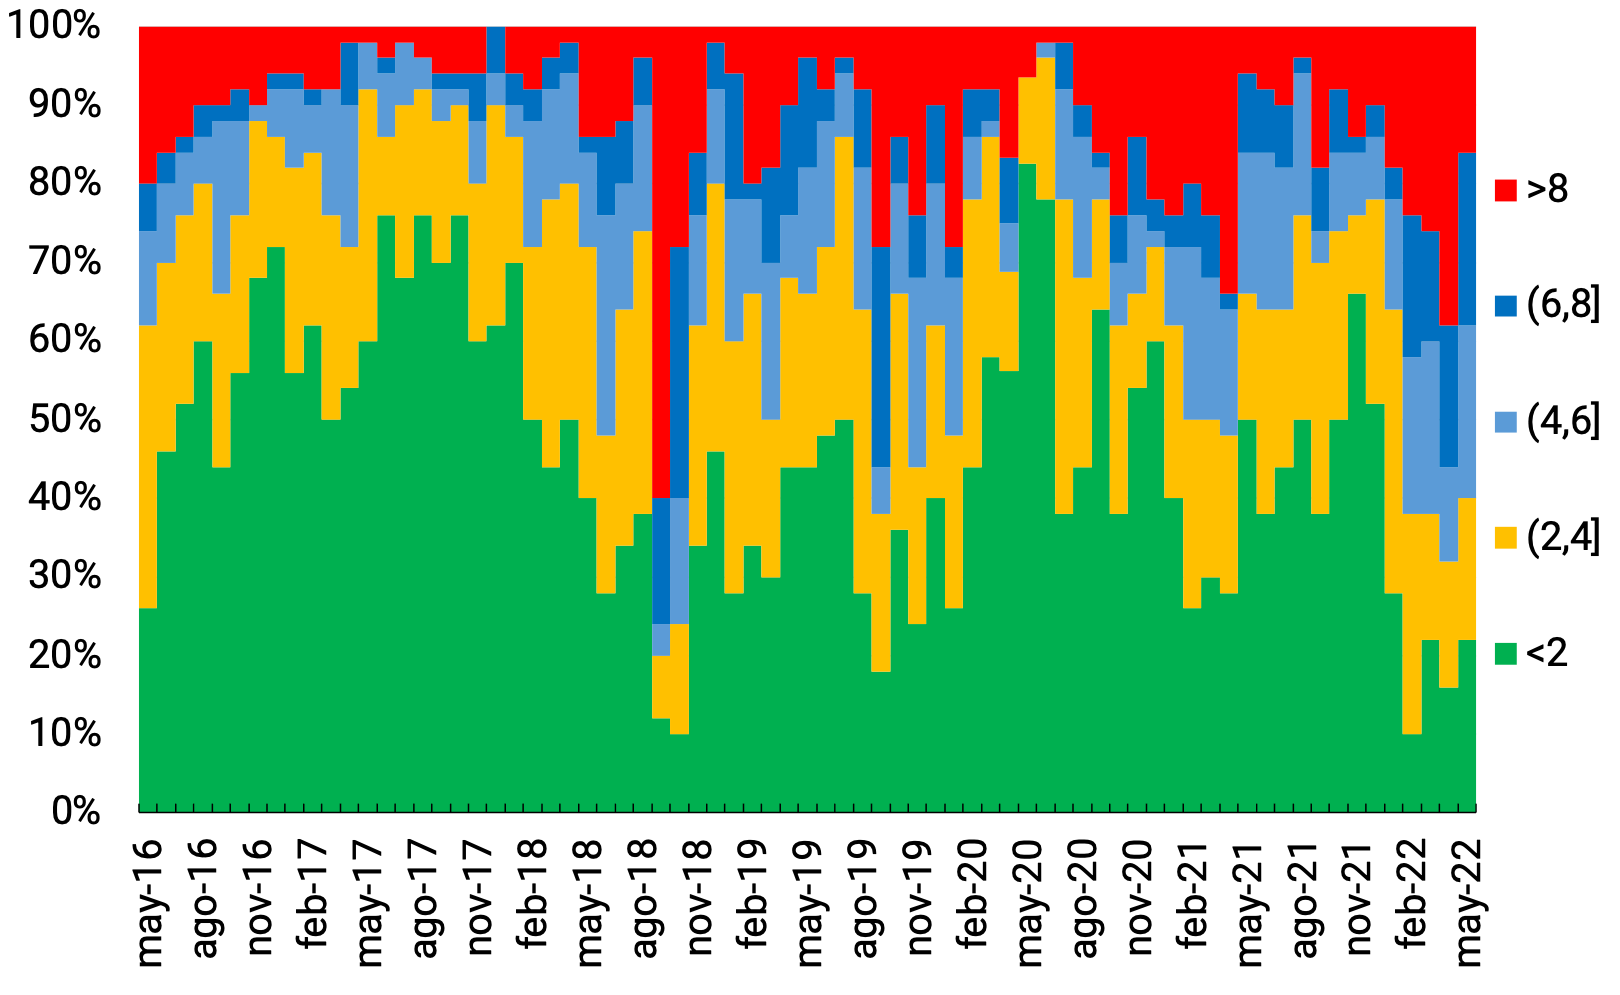
*based on the average published prices of the selected items.
Source: INDEC.
As can be seen in Table 1, within this group of 50 AyBs, those who accumulated increases during March and April greater than those of the average of the AyBs that belong to the Nucleus (8.0%) were the following 15 articles:
- Increases greater than 12% (monthly average): table bread, French flute-type bread, chicken eggs, common wheat flour 000 and whole chicken,
- Increases of between 10% and 12%: ground coffee, sugar, fresh whole milk in sachet, cream cheese and fresh hake fillet,
- Increases of between 8% and 10%: dry noodles such as a stew, butter, wine, frozen hamburgers and shoulder.
In May, in contrast, slowdowns were observed in most of these 15 selected items, with only two exceptions (Ground coffee and Sugar).
Table 1 | Food and beverages whose average prices accumulated greater increases in the second two months in GBA

In conclusion, the external shock in international commodity prices resulted in a sharp increase in domestic food prices in March and April, after which this acceleration quickly spread to a large part of the rest of the goods and services in the consumer basket. While this increase in international prices favored food-exporting countries, it also represents a challenge for their governments by deteriorating the purchasing power of households and boosting the distributive bid. Going forward, the inflationary impact of the external shock is expected to lose strength, however, the environment continues to be characterised by high uncertainty regarding the resolution of the war in Ukraine and, consequently, about the expected trajectory of international commodity prices.
Section 5 / Financing Line for Productive Investment of MSMEs: renewal and compliance with the 2021/2022 quota
In March, the Central Bank decided to extend the validity of the Financing Line for Productive Investment (LFIP) for MSMEs and established a new quota that will run from April to September of this year (Quota 202265. It will continue to be 7.5% of deposits in pesos of the non-financial private sector66 for Group A financial institutions and 25% of said quota for public sector financial agents that do not belong to this group.
It should be remembered that the financing scheme contemplates three main lines with the following applications:
- 1. Financing of Investment Projects: at least 30% of the quota must be allocated to the acquisition of capital goods and/or the construction of facilities necessary for the production and marketing of goods and/or services.
- 2. Working capital financing: includes the discount of deferred payment checks and other company documents.
- 3. Special (non-MSMEs): reaches health service providers that provide hospitalization services in the framework of the COVID-19 emergency and other companies for the acquisition of machinery and equipment produced by MSMEs.
With respect to the conditions of each of these lines, the financing of investment projects contemplates a maximum interest rate that since the end of June stands at 42% n.a., with a total term of no less than 36 months. Meanwhile, for the rest of the financing, the maximum interest rate is currently at 52.5% n.a., while they do not have a minimum term required. The aforementioned interest rates were adjusted throughout the year, in line with the increase in the BCRA’s reference interest rates.
It should be noted that the gastronomy, hospitality, cultural and leisure services sectors, which were the most affected during the pandemic, receive special treatment. In fact, since the previous edition of the LFIP, they can access the working capital line with a grace period of 6 months to start paying the loan. Likewise, and in order to encourage this type of financing, for the purposes of meeting the quota, such financing is computed at 120% of its value67. In addition, among the eligible financing at the end of last year were those granted to small companies with agricultural activity, provided that the funds are intended to increase the productive capacity of beef and/or bovine milk. Thus, small agricultural producers will be able to access the line of financing for investment and working capital projects 68.
The LFIP helped to sustain the growth of loans to relatively smaller firms. Thus, the average balance of financing granted between October 1, 2021 and April 30, 2022 through the LFIP reached $790,400 million, of which 38.4% corresponded to investment projects and the rest to working capital (see Graph 1). This balance represented about two-thirds of loans to MSMEs and about 40% of total commercial loans.
Graph 1 | Balance of Financing granted under the LFIP
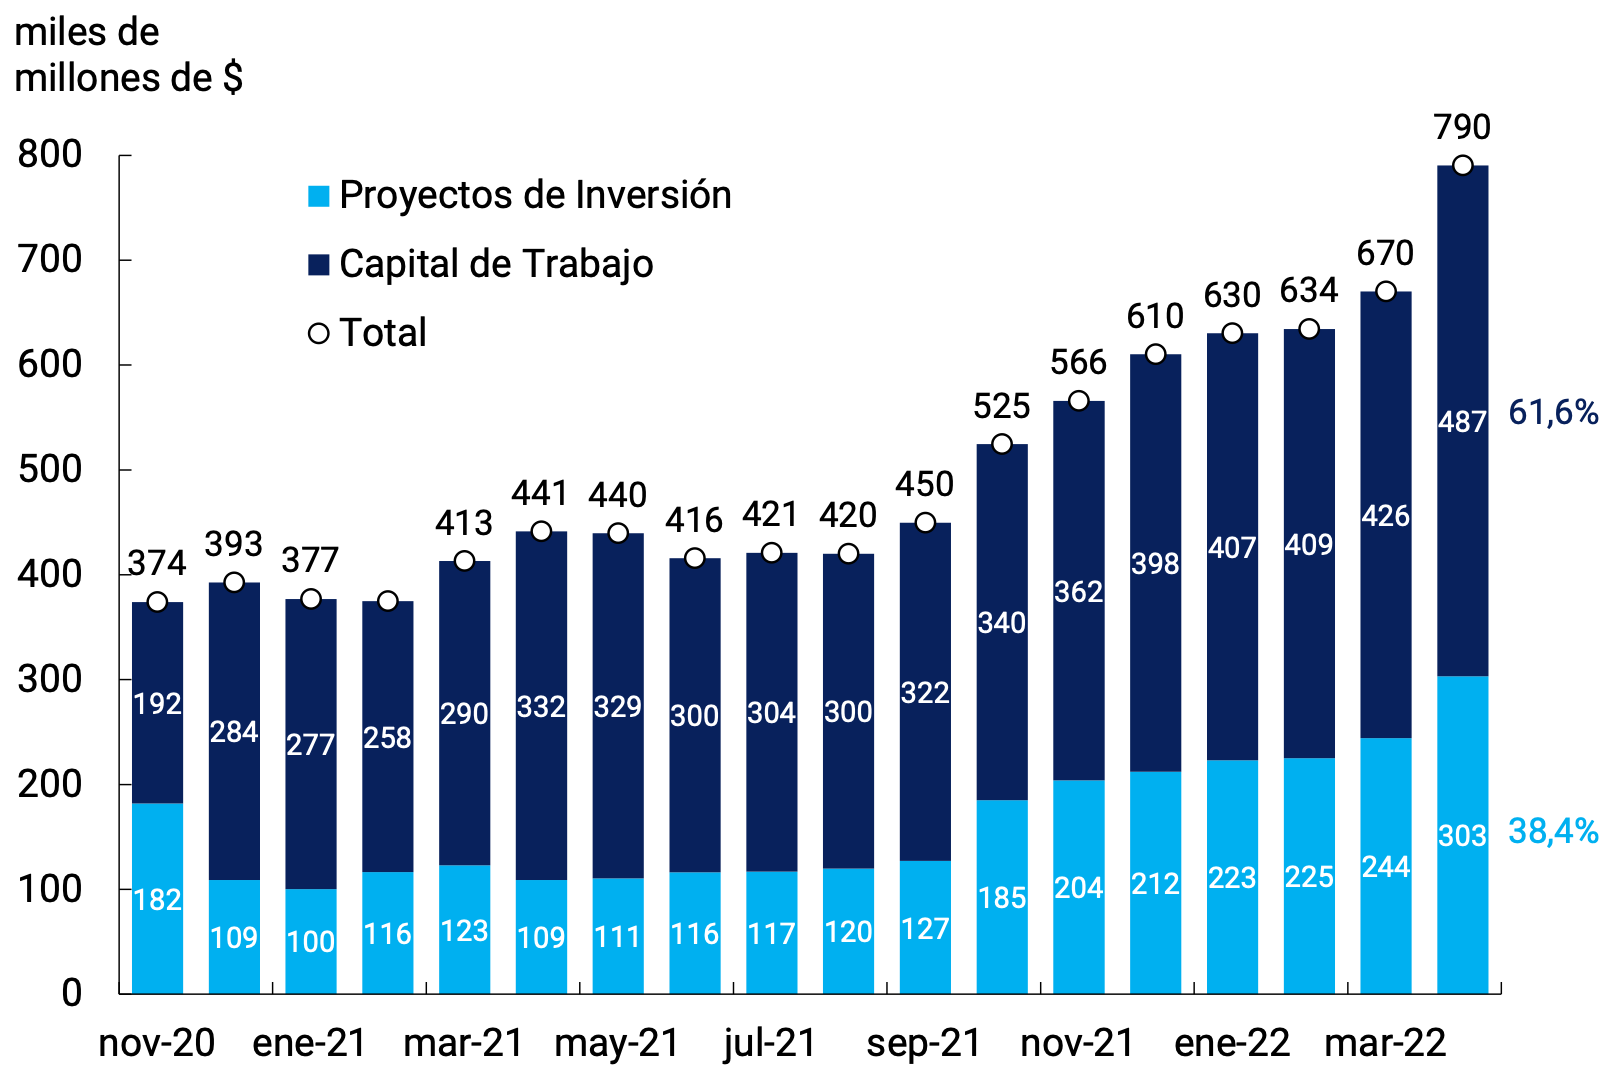
Source: BCRA.
In terms of instruments, the credits granted within the framework of the LFIP to finance investment projects were mainly given through documents with a single signature. In fact, the amounts granted for these commercial loans, at rates close to the maximum interest rates compatible with those of investment projects in each period, were given for an average term of close to 36 months. In this way, the interest rate and term are consistent with the conditions established by the standard for financing investment projects. On the other hand, with regard to financing for working capital (granted at an interest rate close to that of this segment of the LFIP), there is an indiscriminate use of discounted documents and a single signature (see Graphs 2 and 3).
Graph 2 | Average term of Loans to MSMEs
Granted around the maximum in force in each period for investment projects
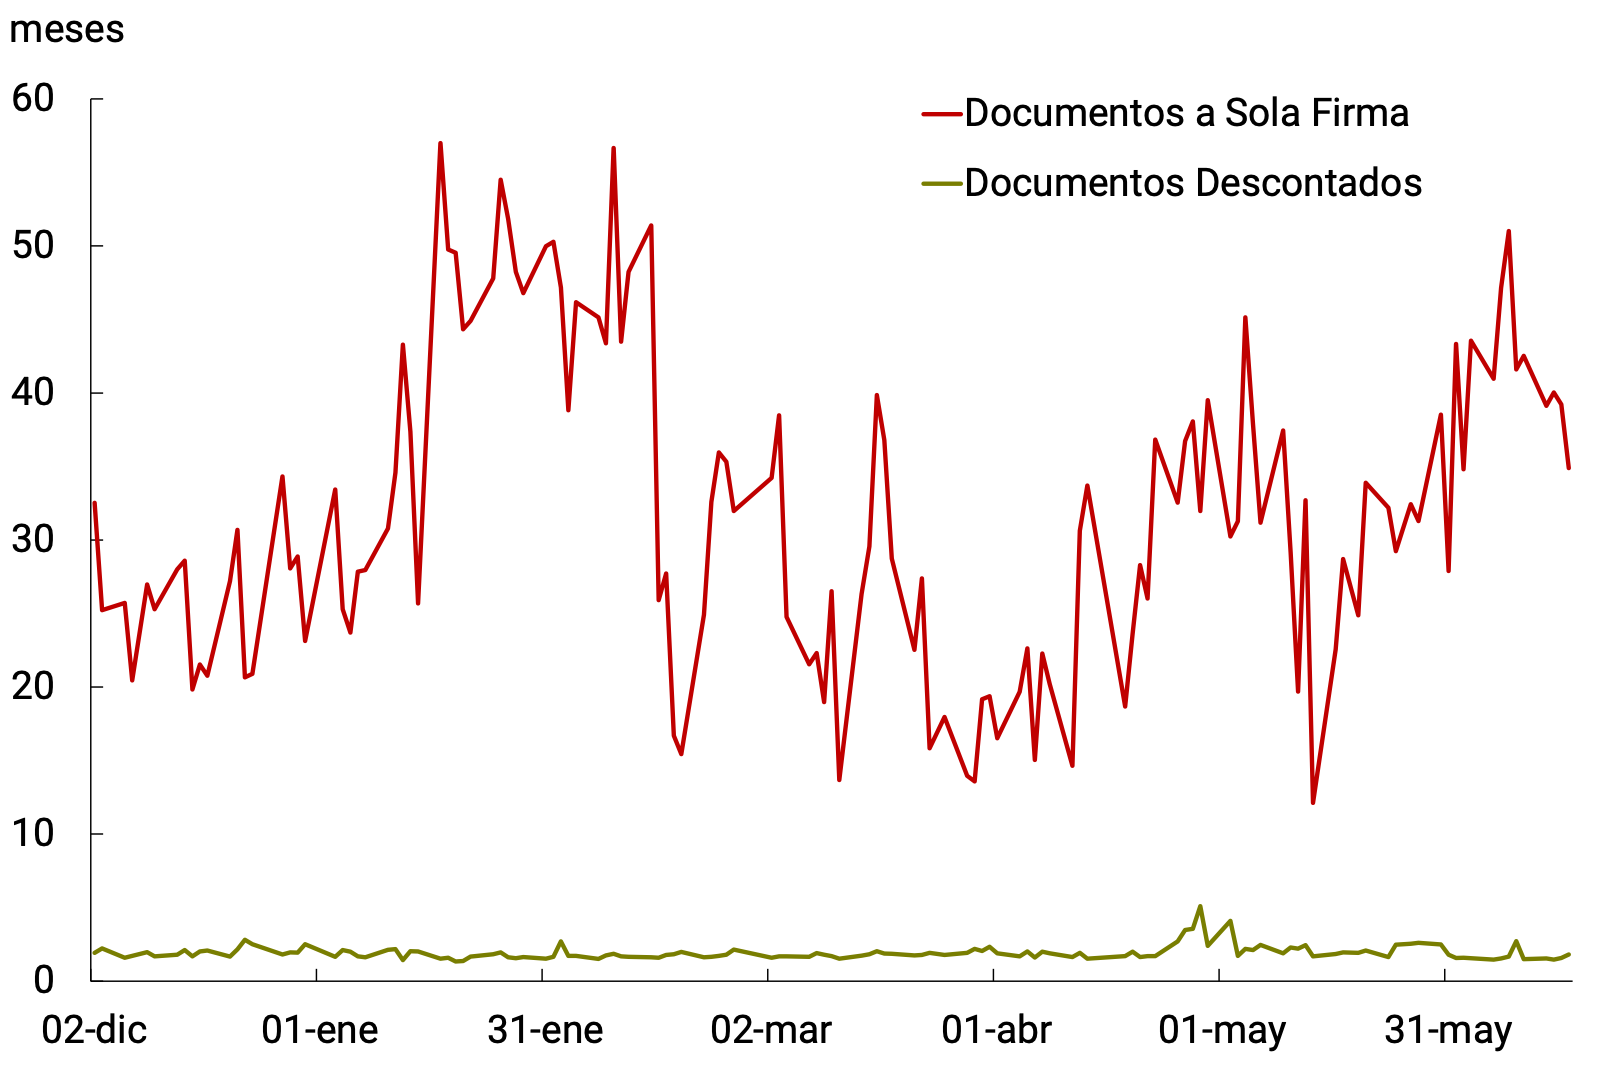
Graph 3 | Amounts granted to MSMEs
Amounts granted around the maximum in force in each period for working capital
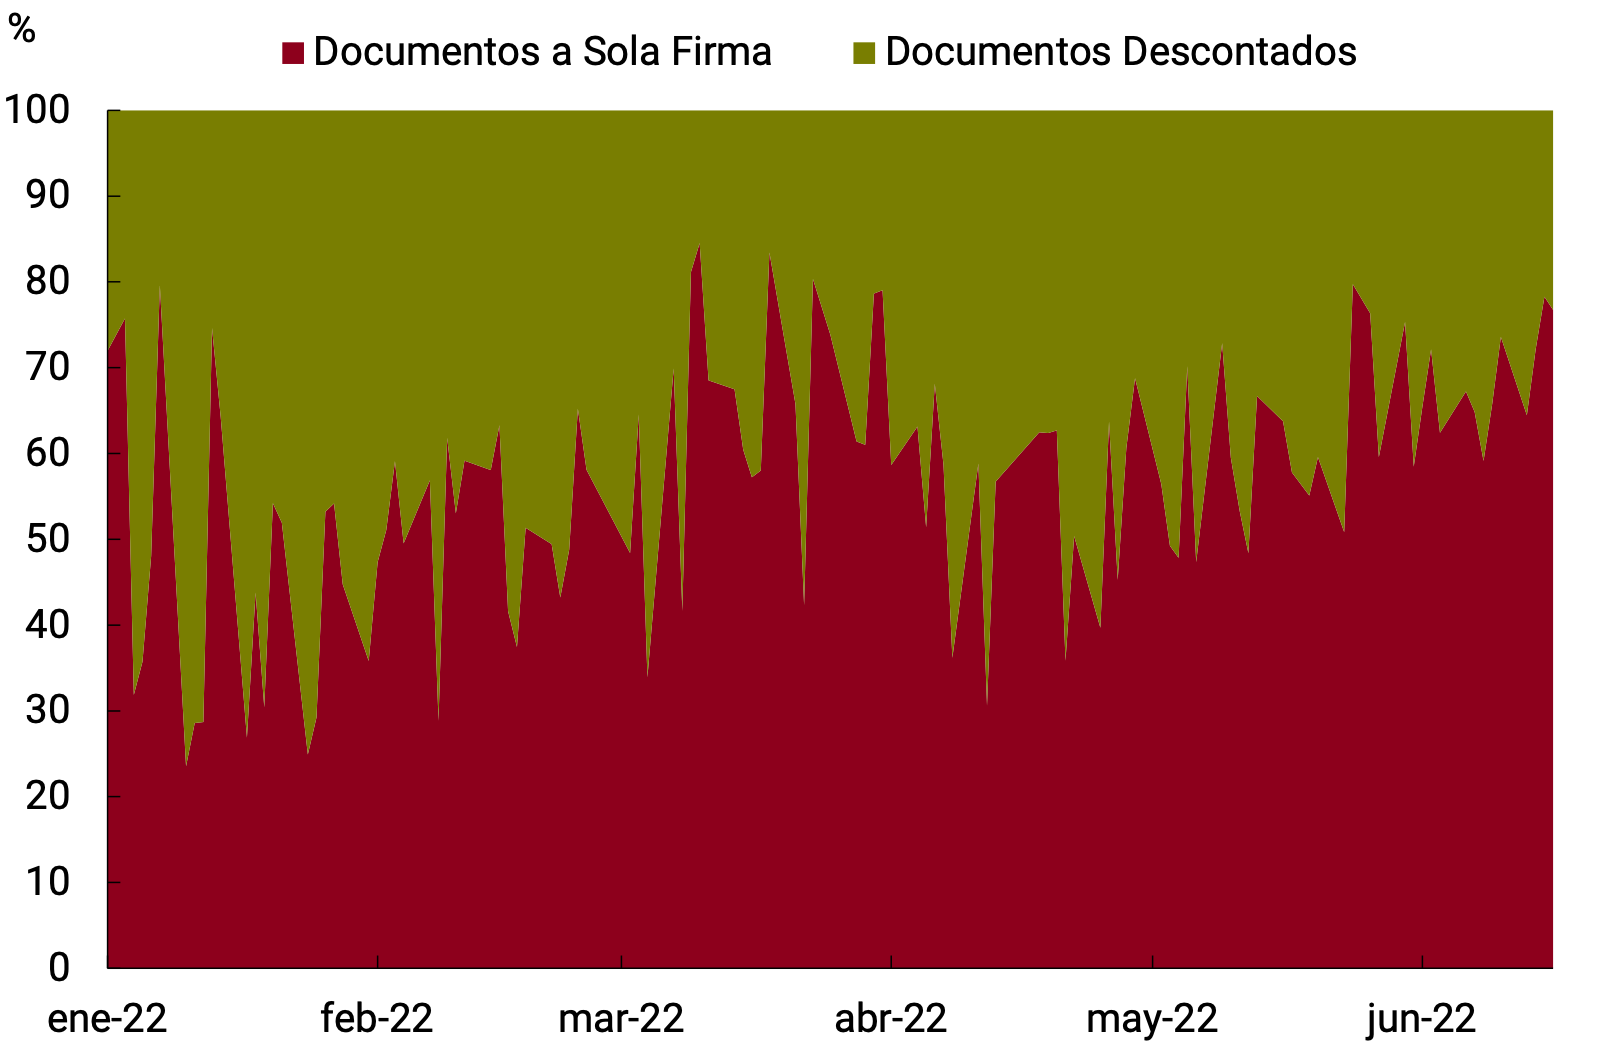
Source: BCRA.
Regarding the degree of compliance with the quota that ended on March 31 (Quota 2021/2022), at the level of the entire financial system, it is verified that on average financial institutions exceeded the minimum limit established in the LFIP since the balance of these financings (monthly average of March) stood at 10.6% of the deposits in pesos of the non-financial private sector in September 2021 (see Graph 4).
Distinguishing between entities, Group A and others, it was observed that both types of entities had an over-compliance with the total quota. Regarding the minimum requirement for Investment Projects, it is verified that on average financial institutions complied with this requirement. This behavior was homogeneous among the different types of entities (see Graph 5).
Figure 4 | LFIP financing in terms of deposits
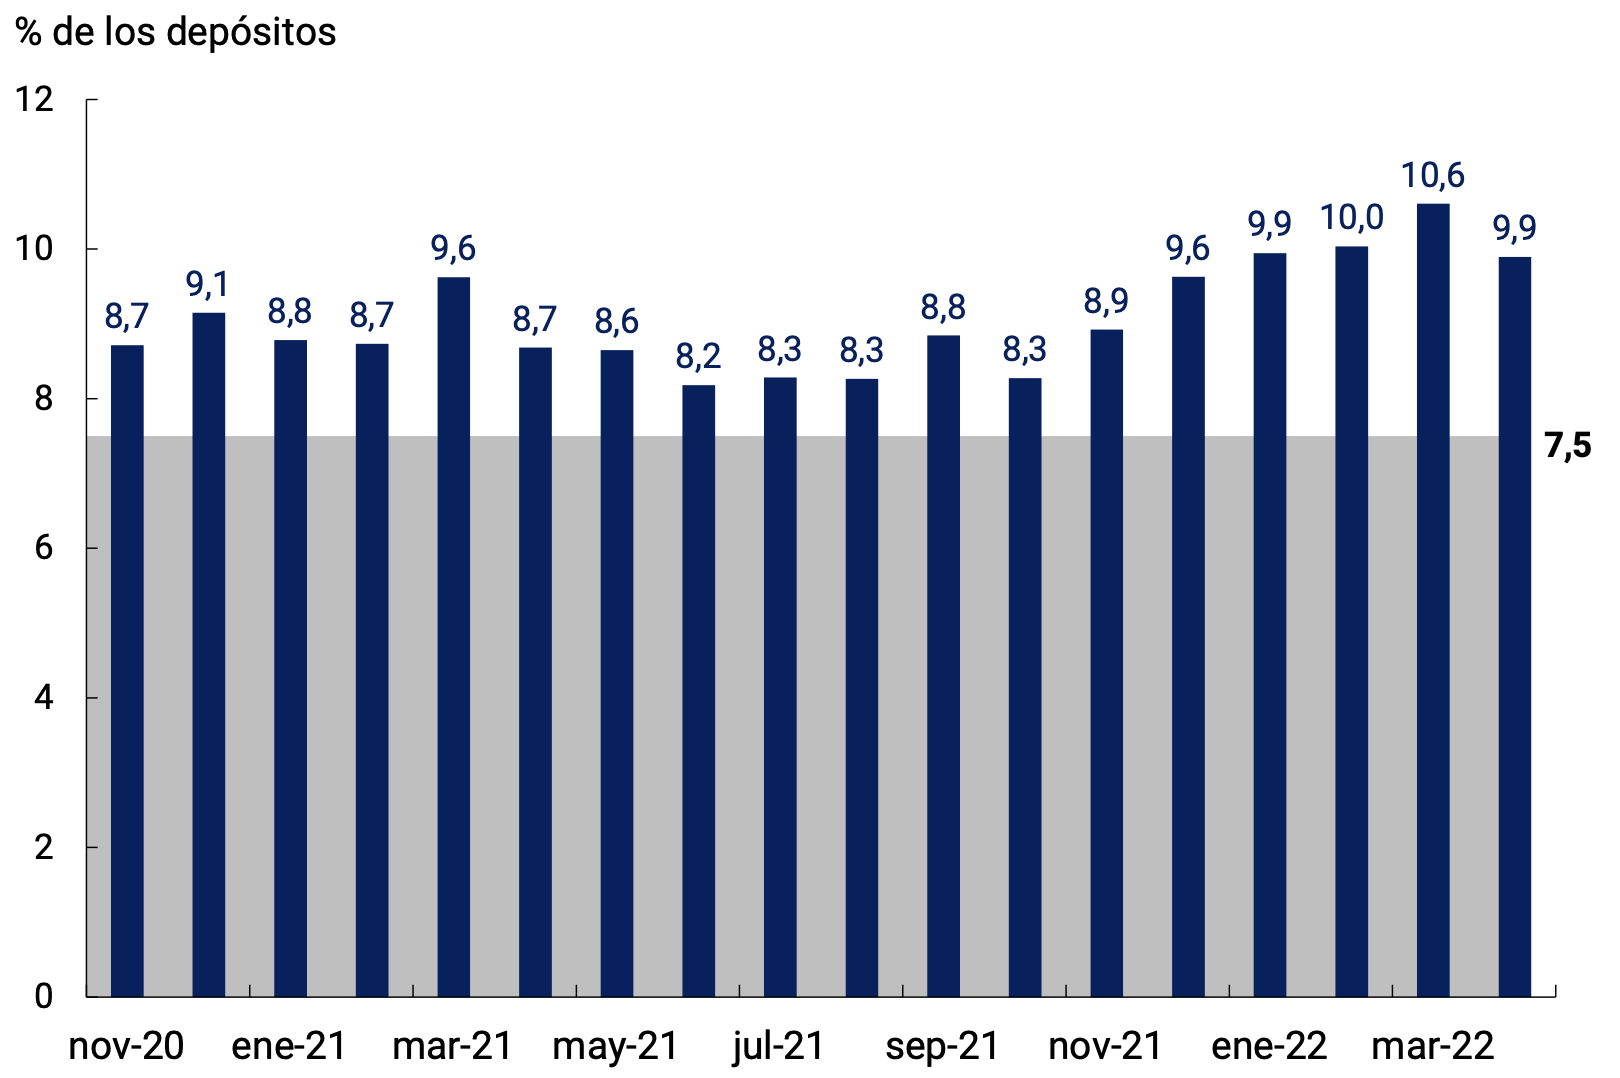
Graph 5 | LFIP financing in terms of deposits by type of financing and group of banks
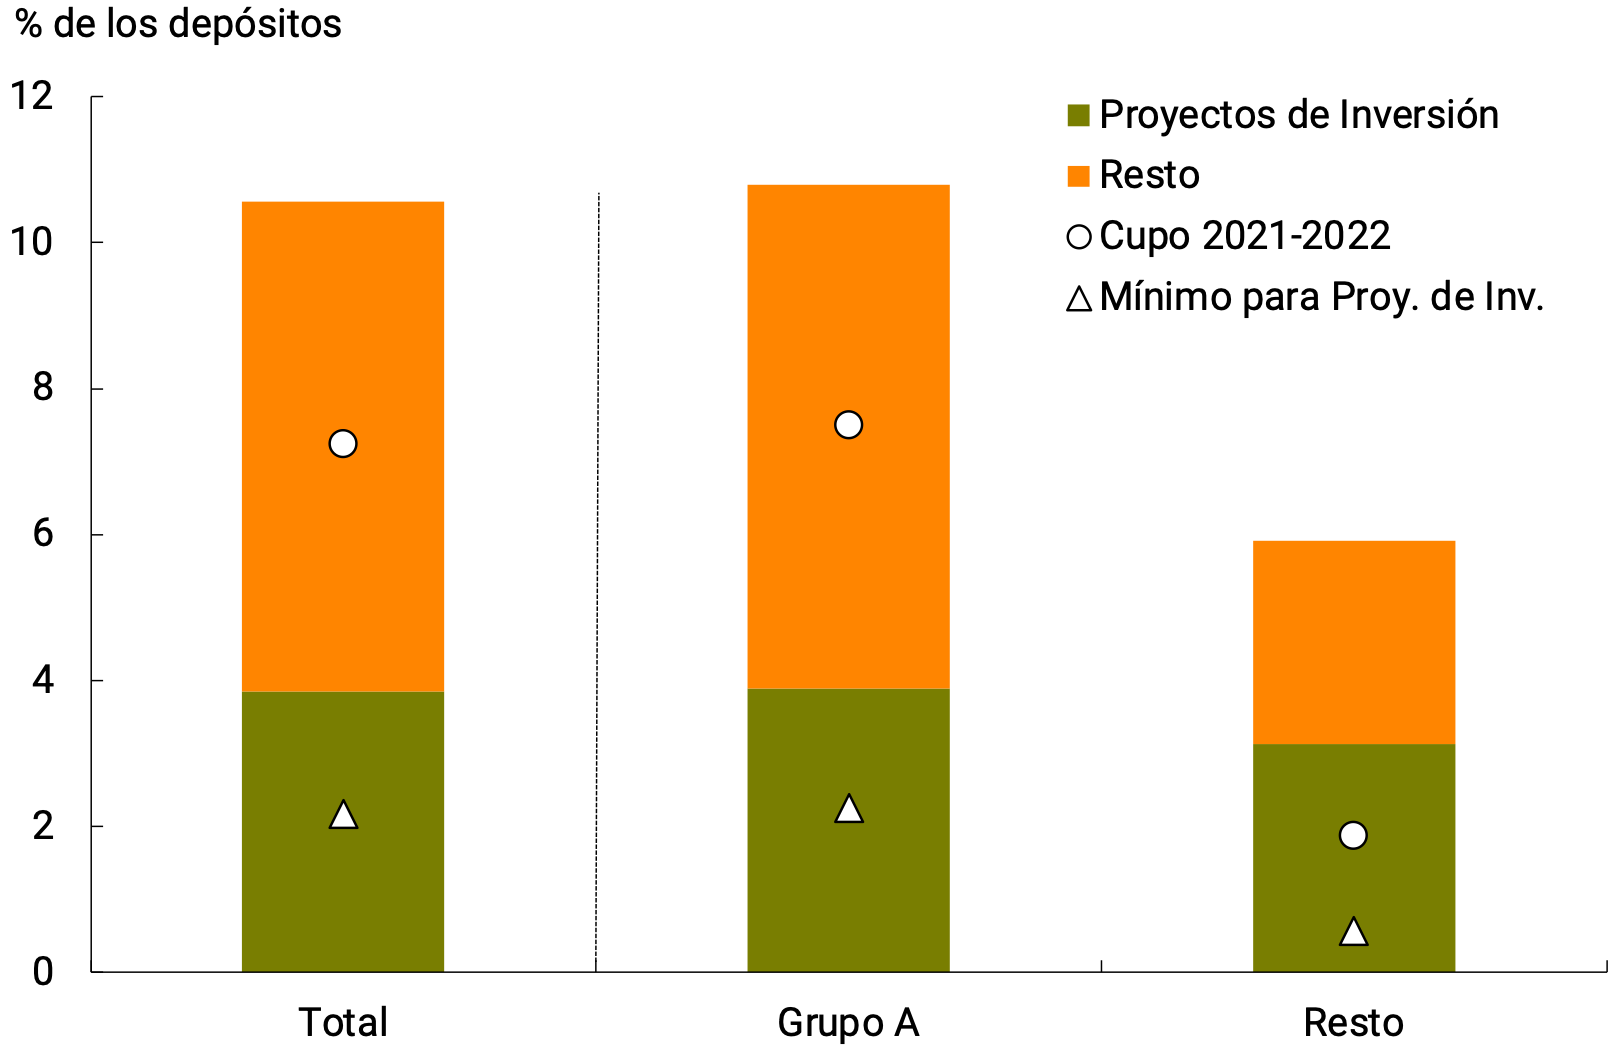
Source: BCRA.
The renewal of the LFIP for MSMEs is part of the BCRA’s policy to stimulate credit intermediation, particularly that linked to productive development. Initially, the LFIP aimed to protect the productive apparatus during the moment of greatest impact of the pandemic. Once this objective was met, this tool was aimed at supporting the recovery process of economic activity underway. The promotion of credit to MSMEs under favorable financial conditions will allow the expansion of the aggregate supply, also contributing to the process of controlling inflation.
Section 6 / Transformations in the payment infrastructure: the use of cash and the growing influence of digital means of payment in the region
With different intensity and characteristics, the payment infrastructure is mutating rapidly in most economies, including those in our region. Digital wallets and the use of payment applications based on mobile phones, P2P transactions, micropayments, interfaces with extensive functionalities integrated into social networks and other large technological platforms, the rise of cryptoassets69 and smart contracts, among other innovations, are contributing to the emergence of new means of payment and financial services that compete with more traditional ways of transacting. In this process, new actors, instruments and markets are constantly emerging.
Digital innovations in payment technologies are part of a longer-ranging trend towards less use of cash in the conduct of transactions. All these trends have been accelerated as a result of the pandemic which, due to restrictions on mobility and initial fears of viral transmission through the handling of banknotes and coins, favoured a strong spread of e-commerce and stimulated the use of “contactless” means of payment. Government action during the health crisis also favoured this transition towards digitalisation. On the one hand, in many jurisdictions, limits were raised and fees were reduced on card and mobile phone transactions. On the other hand, several governments, including those in our region, resorted to digital media to distribute more effectively and quickly the massive fiscal transfers made during the pandemic (Alfonso et al. —2020—)70. Having paid the “learning costs” and having become familiar during the health crisis with the convenient benefits offered by these new means of payment, many users could have changed their transactional habits more permanently. In this sense, several observers estimate that the pandemic would have operated as a catalyst for the ongoing digital revolution in payment systems.
Graph 1 | Transactional media stocks in terms of GDP
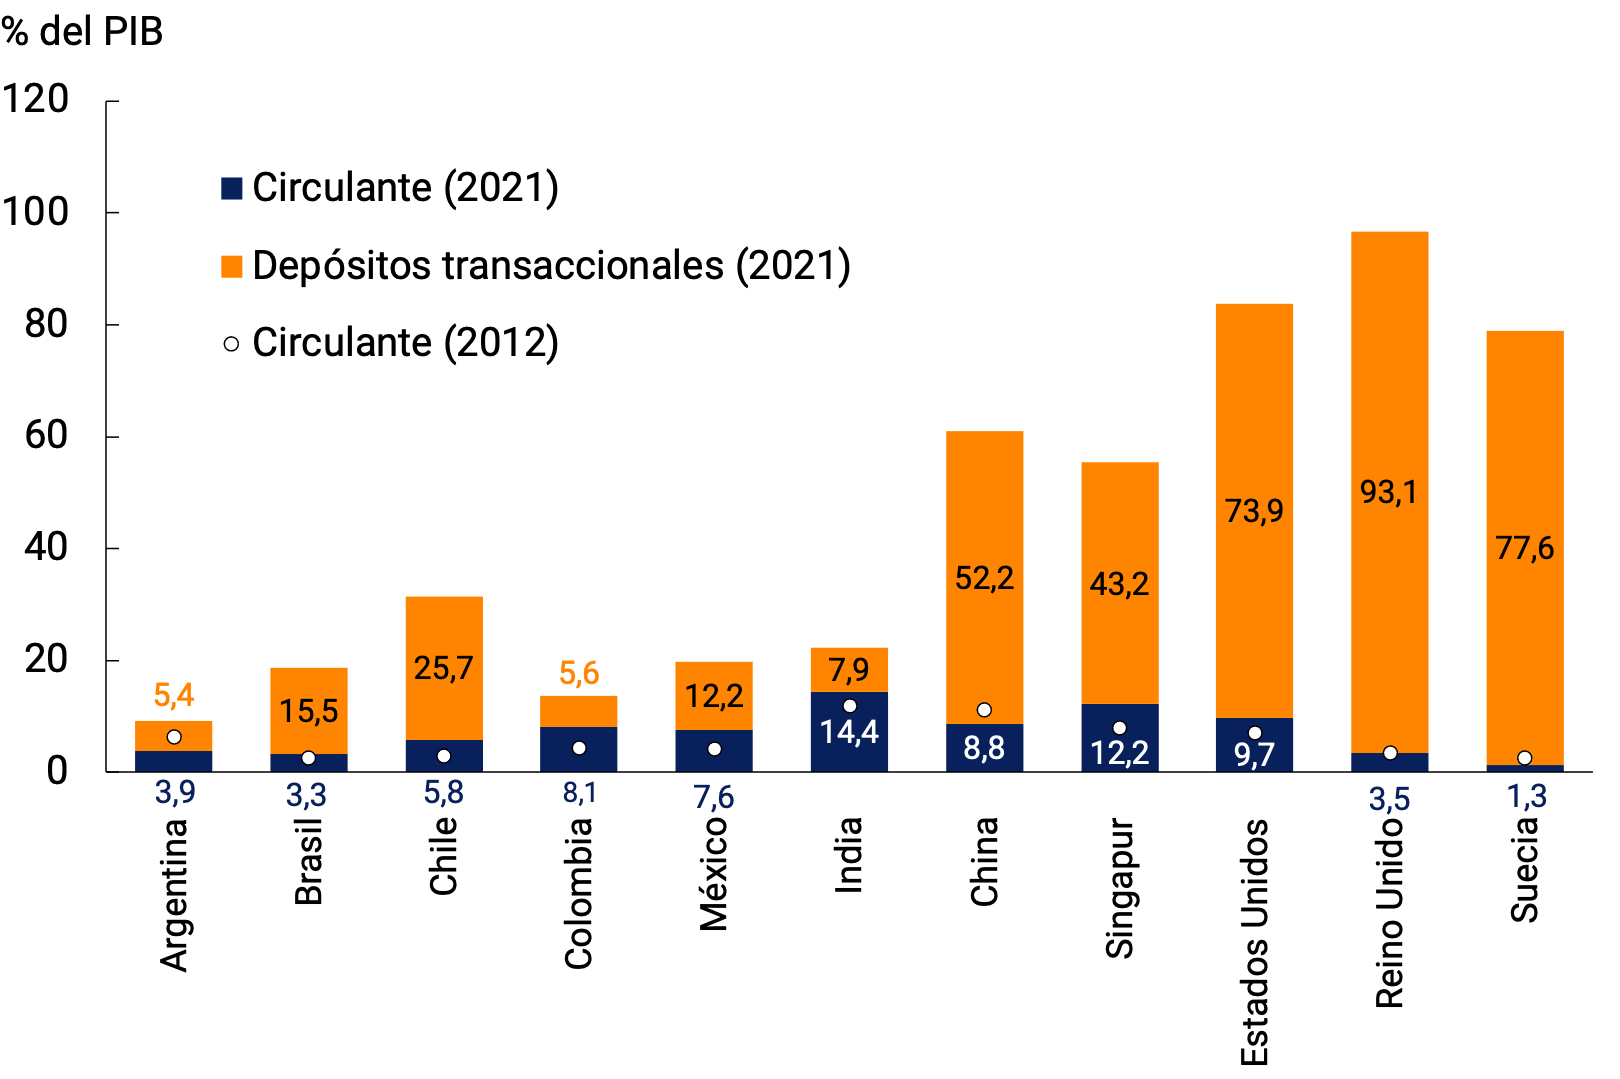
Note: Data for India, China, Singapore, the United States, Sweden and the United States are for the years 2012 and 2020.
Source: BCRA based on own data, BIS, IMF, INDEC, Central Bank of Brazil, Central Bank of Chile, Central Bank of the Republic, Bank of Mexico, and Araño and Maisto (2013).
The reduction in the use of physical transactional money has been particularly sharp in advanced economies, such as Sweden (where this process is well underway and the stock of working capital currently represents only 1 percent of GDP) and the United Kingdom (where the share of transactions through working capital and other physical means of payment such as checks fell from 60 percent to 20 percent). However, this phenomenon also spread to several developing economies, such as Brazil and China. In contrast, in many other jurisdictions, physical means of payment still have considerable relevance. In particular, this is the case in Latin America, where the circulating currency held by the public represents a very high percentage of the total stock of transactional money and where the use of digital means of payment is still relatively low compared to that observed in other regions (see Figures 1 and 2).
Graph 2 | Evolution of physical and digital transactions, 2012 vs. 2020
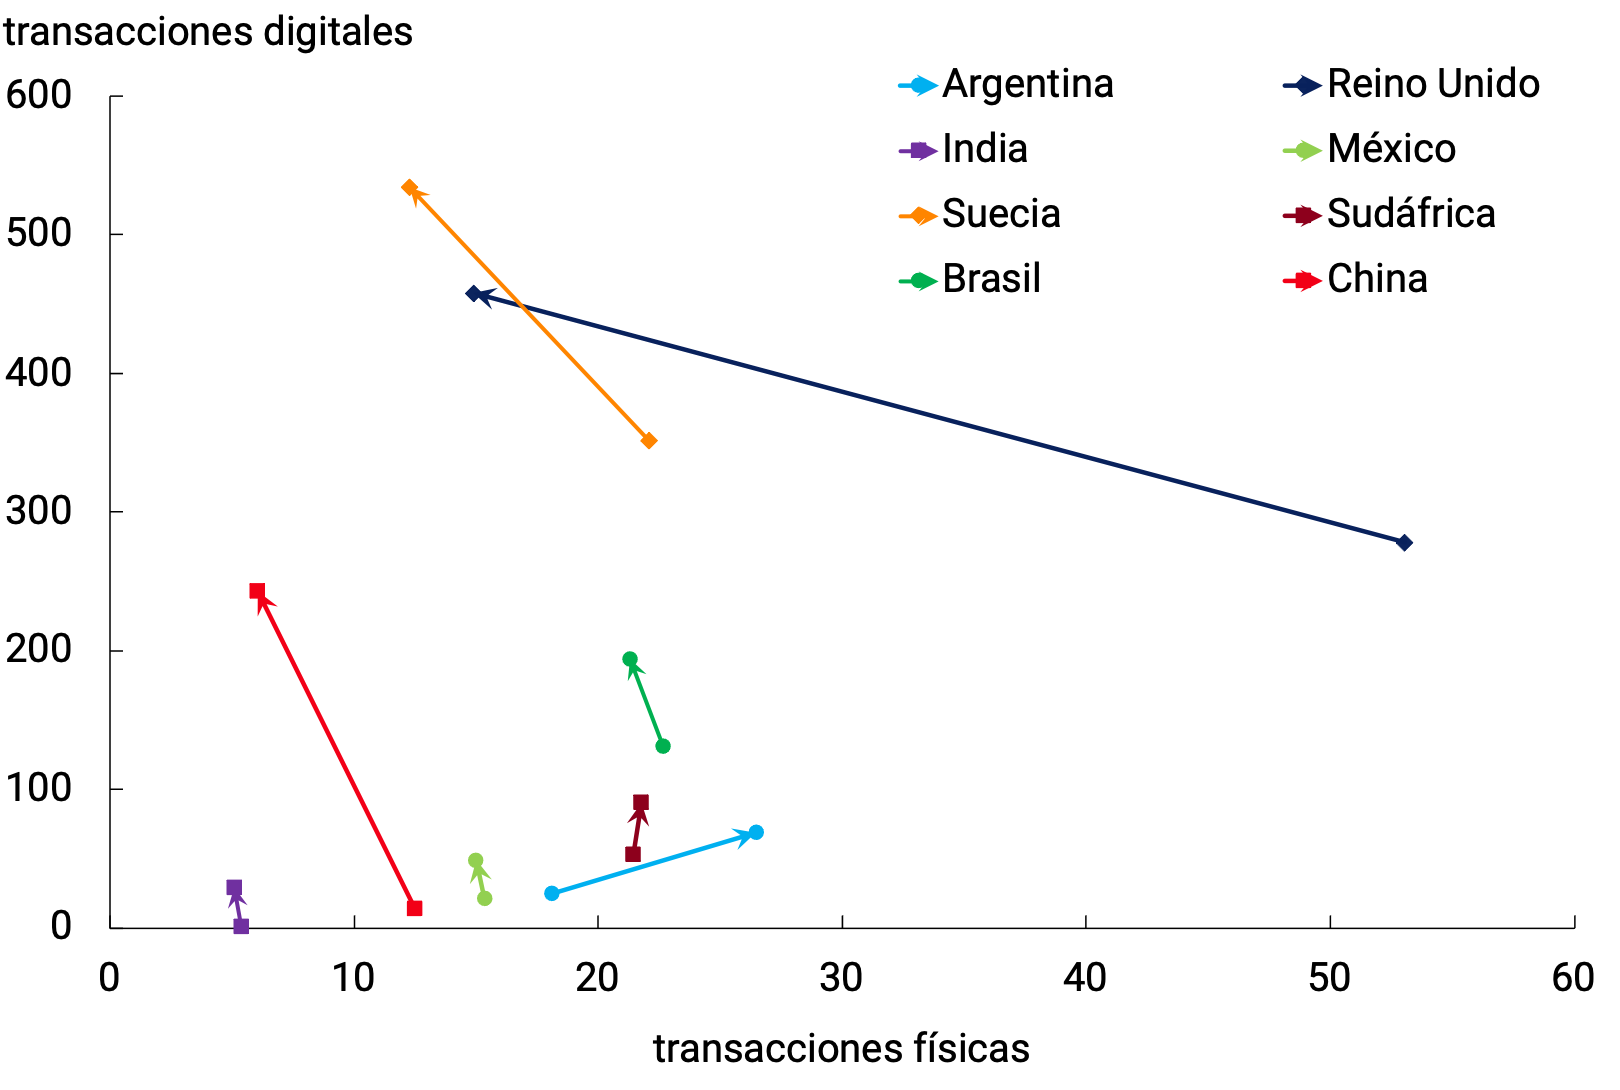
Note: Physical transactions include bank withdrawals and checks, while digital transactions refer to the sum of credit transfers, direct debits, card and e-money payments, and other payment instruments. The beginning of the arrow indicates the transactions per capita in 2012, while the destination of the line refers to the data for 2020.
Source: BIS.
Among the factors that explain the limited regional use of digital means of payment are low levels of per capita income and high informality, as well as low levels of financial literacy and competition in the traditional financial sector, which translates into substantial incomes and segmentation and very high costs for most users (Alfonso et al. —2020–)71. The existence of low levels of financial access and high costs are thus still two prominent features of payment systems in most economies in the region, characterized by a high dependence on physical means of payment72.
Attracted by the existence of high potential profit margins and the increasing penetration of the Internet and mobile telephony, several Latin American countries have witnessed a rapid expansion of firms specializing in technological innovation in payments (non-bank payment service providers) in recent periods. Although the emergence of more convenient payment methods or new features and functionalities on top of existing instruments has drastically expanded the range of transactional services, technological progress has not always resulted in a spontaneous solution to the problems of access and high costs mentioned above.
The response of the Central Banks
Central banks and other public authorities play an essential role in ensuring that the accelerated private developments underway are effectively translated into adequate levels of coverage, competition, as well as security and integrity. In particular, as regulators and supervisors of a key public good of each economy, such as their national payment systems, Central Banks are in a position to impose common governance rules and technical standards, promote interoperability73 and the exchange of data between different private operators, coordinate projects to catalyse innovation, and in some cases, even providing – and sometimes directly operating – public payment infrastructures and platforms.
In this regard, one of the most relevant initiatives in recent years has been the establishment of so-called retail fast payment systems (SMPR). By connecting multiple platforms, these systems allow payments to be available instantaneously, definitively (firm and irrevocable) and continuously (24/7) at very low or no cost to users (CPMI —2021—). Since the first SMPR in Korea in 2001, these schemes have proliferated around the globe. Currently, more than 60 jurisdictions have implemented, or plan to do so immediately, systems of this type (see Figure 3, where the speed of their diffusion in selected economies is visualized).
Graph 3 | Evolution of fast payments over time
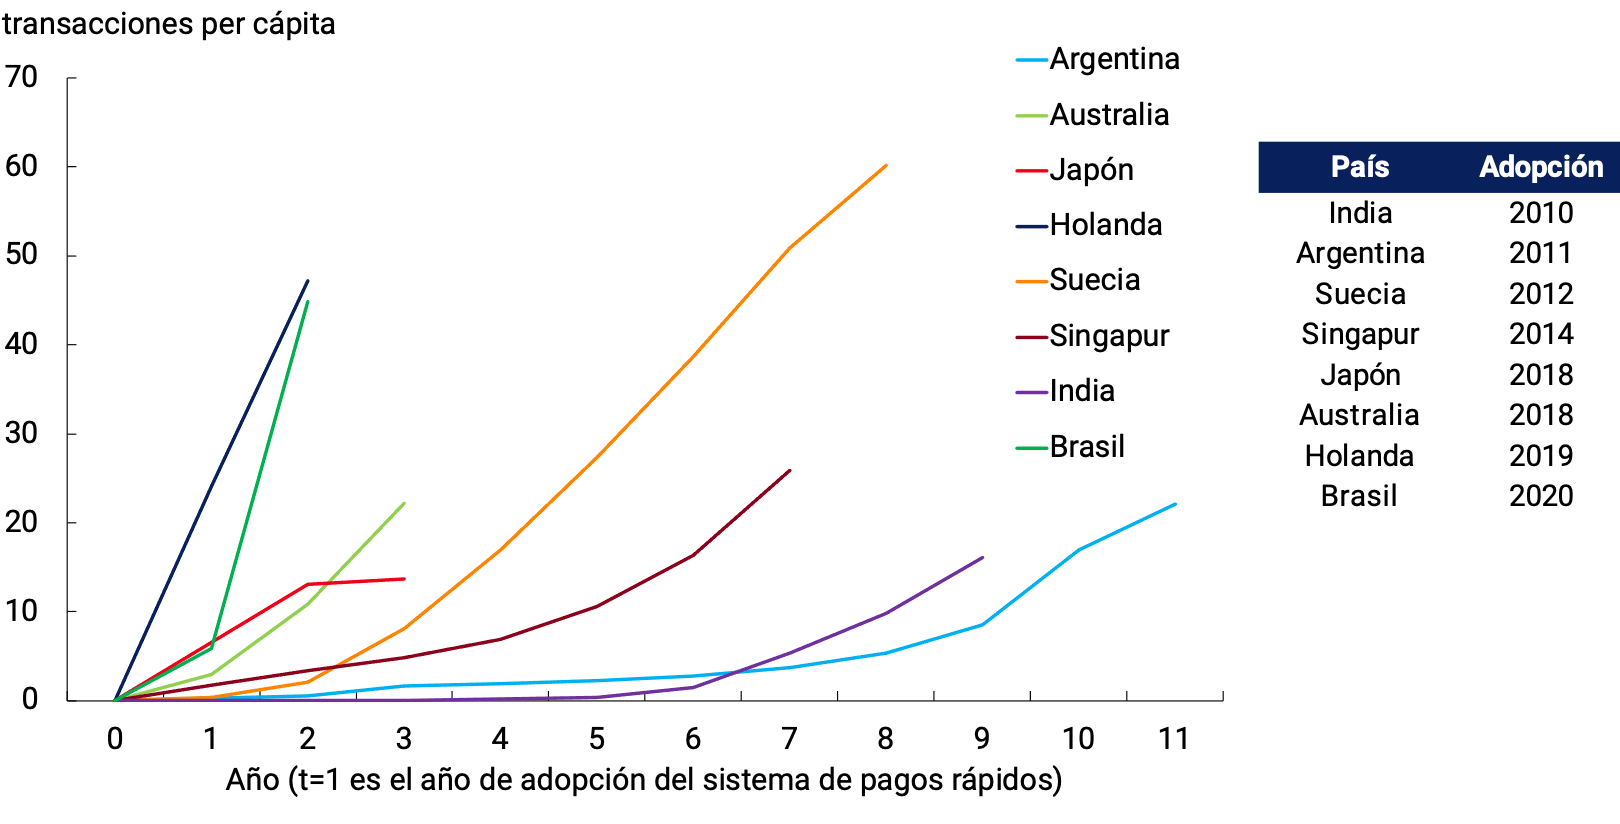
Note: Data for Argentina from year 7 (corresponding to 2017) onwards do not include transfers between customers of the same financial institution or the same PSP.
Source: BCRA based on data from BIS, BCRA and Central Bank of Brazil
Due to their coverage, affordability, availability of services, and speed of operation, the projects recently implemented in Brazil (Pix), Mexico (Codi), and our country (Transfers 3.0) stand out in the region74. In the case of Pix, implemented at the end of 2020, the adoption rate has been remarkable: just 17 months after its launch, some 117.5 million people (almost 70% of the population) had made transactions through the system. Although approximately 75% of the transactions operated so far were carried out between individuals (free of any charge for end users), the participation of transactions involving companies – also benefiting from substantially lower fees than those paid to traditional card networks – has gradually begun to become more relevant (BIS – 2022).
Similarly promising developments are verified in the case of our country, which has been one of the pioneering jurisdictions in the region in the promotion of digital transactions since the implementation of the immediate transfer system more than a decade ago. Including both operations involving bank accounts and accounts opened in payment service providers, these grew rapidly to the point that the amounts of transactions in the last biennium went from representing less than 30% of GDP to around 40%. The momentum was reinforced from the end of 2020 with the launch of the Transfers 3.0 scheme, which pursues the creation of an efficient, secure, open and universal digital payment ecosystem, enabling payments in shops with immediate transfers through different modalities. Through greater competition, significant simplifications and cost reductions – with free transactions for individuals and commissions ranging between 0.6% and 0.8% for participating businesses – it is aimed, at the same time, to promote greater financial inclusion. Additionally, to expand the acceptance of the means of payment by small businesses, the initiative establishes a dynamic exchange rate that favors those who “adhere” to the system. In close collaboration with the private sector, the definitive implementation of the scheme occurred at the end of last November based on the full interoperability of QR codes to make payments with transfers between different payment platforms, which, since then, registered a significant dynamism to accumulate more than 9 million transactions at the beginning of May. On the other hand, the emergence of electronic checks (ECHEQ) as a substitute for their traditional physical version added a fundamental value as a means of payment and a remote negotiation and financing instrument for companies (in 2021 their number already amounted to 12.8 million, representing 47.3% of the total amount of cleared checks in December of that year).
In a context of strong technological transformation and accelerated change in payment habits, it is highly likely that, with their own characteristics, similar initiatives will tend to be replicated in other countries in the region in the coming period.
References
Alfonso, V., A. Tombini, and F. Zampolli (2020): Retail Payments in LAC: present and future, BIS Quarterly Review, December.
Araño, E. and C. Maisto (2013): Coherence between National Accounts by Institutional Sector and Monetary and Financial Statistics, Statistical Economic Studies No. 103, Central Bank of Chile.
BIS (2022): Central Banks, the Monetary System and Public Payment Infrastructures: Lessons from Brazil ́s Pix.
CPMI (2021): Developments in retail fast payments and implications for RTGS systems, December.
IMF (2022): Capital Flow Management Measures in the Digital Age: Challenges of Crypto Assets, Fintech Notes.
Glossary
ADEFA: Association of Automotive Manufacturers of the Argentine Republic.
AFCP: Portland Cement Manufacturers Association.
AFIP: Federal Administration of Public Revenues.
AMBA: Buenos Aires Metropolitan Area.
ANSES: National Social Security Administration.
ASPO: Social, Preventive and Mandatory Isolation.
AUH: Universal Child Allowance for Social Protection.
BADLAR: Buenos Aires Deposits of Large Amount Rate (interest rate paid for fixed-term deposits of more than one million pesos in the 30 to 35-day bracket by the average of banking entities).
BCRA: Central Bank of the Argentine Republic.
BOAT: National Treasury Bond.
CABA: Autonomous City of Buenos Aires.
CAME: Argentine Confederation of Medium Enterprises.
CAMARCO: Argentine Chamber of Construction.
CAMMESA: Compañía Administradora del Mercado Mayorista Eléctrico Sociedad Anónima.
ECLAC: Economic Commission for Latin America and the Caribbean.
CER: Reference Stabilization Coefficient.
S Fuels and Energy.
DECNU: Decree of Necessity and Urgency.
DISPO: Social, Preventive, and Mandatory Distancing.
EIL: Survey of Labor Indicators.
EMAE: Monthly Estimator of Economic Activity.
EMBI+: Emerging Markets Bond Index Plus.
EPH: Permanent Household Survey.
EUR: Euros.
Fed: Federal Reserve of the United States.
FAITHFUL: Latin American Economic Research Foundation.
IMF: International Monetary Fund.
FSB: Financial Stability Board.
G20: Group of 20.
GBA: Greater Buenos Aires.
A.I.: Year-on-year.
IBIF: Gross Fixed Domestic Investment.
ILA: Leading Indicator of Economic Activity.
INDEC: National Institute of Statistics and Censuses.
National CPI: Consumer Price Index of national coverage released by INDEC.
CPI BA: Consumer Price Index of the Autonomous City of Buenos Aires.
IPIM: Internal Wholesale Price Index.
IPOM: Monetary Policy Report.
ISAC: Synthetic Construction Indicator.
VAT: Value Added Tax.
LELIQ: Letrax de Liquidez of the Central Bank of the Argentine Republic.
M2: Banknotes and coins + quasi-currencies in circulation + current accounts in $ and savings accounts in $.
MSMEs: Micro, small and medium-sized enterprises.
Mens: monthly/monthly.
MOA: Manufactures of Agricultural Origin.
MOI: Manufactures of Industrial Origin.
MTEySS: Ministry of Labour, Employment and Social Security.
N.A.: Annual nominal.
NEA: Northeast Argentina.
NGFS: Network for Greening the Financial System.
NOA: Northwest Argentina.
OECD: Organization for Economic Cooperation and Development.
P.B.: Basic points.
P.P.: Percentage points.
Q: Projected.
COUNTRY: Tax for an Inclusive and Supportive Argentina.
EAP: Economically Active Population.
PFE: Extended Facilities Program.
GDP: Gross Domestic Product.
PMI: Purchasing Managers’ Index. Index of surveys to purchasing managers.
PP: Primary products.
SMEs: Small and medium-sized enterprises.
REM: Survey of Market Expectations of the BCRA.
s.e.: Series without seasonality.
NFPS: National Non-Financial Public Sector.
TNA: Annual Nominal Rate.
Trim.: Quarterly / Quarter.
US$: US dollars.
UTDT: Torcuato Di Tella University.
UVA: Unit of Purchasing Value.
Var.: Variation.
WEO: World Economic Outlook prepared by the IMF.
References
1 The Purchasing Manager Index is constructed through surveys of purchasing managers and executives of companies in the manufacturing and service sectors. The questions asked are related to, for example, production, new orders, employment, stocks, delivery times, among others, and must be answered in relation to the situation with respect to the previous month (in terms of whether they increased, decreased or remained the same). For each variable, the index is the sum of the percentage of responses that indicated “increases” and half of the percentage of responses “no change.” The indices range from 0 to 100, with a level above 50 indicating a growth in the variable compared to the previous month, and below 50 indicating a contraction. Source: IHS Markit.
2 These twelve coins represent about 70% of the total cryptocurrency universe.
3 See the World Bank’s Global Report on Food Crises 2022.
4 According to an IMF survey of 11 countries in Latin America and the Caribbean, measures taken after February 24 and until March 23. The fiscal cost corresponds to the GDP-weighted average.
5 Gross Fixed Capital Formation is composed of Construction and Durable Production Equipment (which includes Machinery and Equipment and Transportation Equipment, national and imported).
6 The purpose of this indicator is to anticipate the EMAE pivot points, it can alert about a pivot point once the ILA meets certain necessary criteria. To give an alert about the beginning of a recessionary period, it is required, in addition to the conditions of diffusion and depth, that the ILA presents three consecutive monthly falls. For more methodological details of the ILA, see Section 3 / BCRA’s Leading Index of Economic Activity published in the IPOM of January 2017.
7 In 2018, soybean production had fallen 31.3% and corn production by 12.2%.
8 As of the date of publication of this report, 90% of the total population has at least one dose, while 82% has the complete vaccination schedule. Likewise, 59.4% of the population received a booster/additional dose.
9 The Ministry of Tourism announced a new edition of the “Pre-Trip” Program that aims to underpin the low season, in conjunction with the development of tourism infrastructure.
10 For more information on the Argentina Productive Plan 2030 see: https://www.argentina.gob.ar/produccion/argentina-productiva-2030.
11 The National Government announced the elimination of export duties on the sectors of the knowledge economy.
12 Through Decree 216/2022, the National Government established an income reinforcement of $18,000 in two payments for categories A and B of the monotax, unemployed people, informal workers and staff of private homes.
13 Although INDEC recently published the technical report “Work and Income” for the first quarter of 2022, this section works with information from the fourth quarter of 2021 because it is the last quarter for which the microdata have been published.
14 During the second quarter of 2016, the EPH was restarted after being discontinued for three quarters.
15 Even quarters are used to avoid the volatility generated in the series by the collection of Christmas bonuses in odd-numbered quarters.
16 The deciles of per capita household income were used for this analysis.
17 This evolution has already been noted in previous versions of the IPOM (See “Section 3 / Main features of the labour market recovery” of August 2021).
18 Definition of Net International Reserves according to the program agreed with the IMF, valued at the program’s exchange rates.
19 For more information see: https://openknowledge.worldbank.org/bitstream/handle/10986/37223/CMO-April-2022.pdf.
20 Following the same line, as of December 2021, new adjustments to foreign regulations and changes came into force with an effect on import payments. In March 2022, the BCRA issued Communication “A” 7466, which later received various flexibilities. In this regulation, it is determined that the BCRA will assign to the SIMI granted by the Ministry of Productive Development a category A for rapid access to the market, to the extent that they do not exceed certain parameters of demand for foreign currency for imports, and a category B, which entails that imports of associated goods must be financed at least 180 calendar days from the registration of the customs entry of the assets to the Argentine Republic.
21 Persons who export services may have up to US$12,000 per year in accounts in local financial institutions without the requirement of settlement in pesos. The benefit extends to companies in the sector, which will have foreign currency available for salary payment for a percentage of the increase in foreign sales they make this year compared to 2021.
22 Communiqué of 16-Jun-22 (Policy actions to strengthen the sustainability of growth and macroeconomic stability | Argentina.gob.ar).
23 Preliminary data.
24 These are reopenings of inflation-linked financial instruments originally issued in previous periods whose effective value exceeds the nominal value at the time of placement. According to the Ministry of Economy, in order to meet the NFPS’ primary deficit fiscal target of 2.5% of GDP, an annual limit will be established for the calculation of income from property income linked to the primary issuances of public securities equivalent to 0.3% of GDP (a magnitude similar to that recorded in this concept during 2021).
25 The increases in the last year were 12.12% in Jun-21, 12.39% in Sep-21, 12.11% in Dec-21 and 12.28% in Mar-22. In this way, they totaled an increase of 52.67% y.o.y. in Dec-21, 1.8 p.p. more than the accumulated inflation in the year.
26 The REPRO provides assistance to employers whose activities are facing critical situations so that they can meet the remuneration of their employees.
27 The Empower Work Program seeks to promote full social inclusion for people who are in a situation of social and economic vulnerability.
28 By Resolution 6/2022 dated 10/5/22, the increases provided for in the Minimum Living and Mobile Wage were brought forward, implying an increase of 17% as of June and an additional 10% in August 2022.
29 Decree 332/2022.
30 This performance was verified despite the fact that since the beginning of 2021, the transfers associated with the creation of the Fund for the Fiscal Strengthening of the Province of Buenos Aires (Decree 735/2020) began to be recorded in the budget.
31 Decree of Necessity and Urgency No. 331/22 dated June 16, 2022. As the 2022 Budget Bill that the National Executive Branch sent to the National Congress on September 15, 2021, had not been sanctioned or enacted, Decree No. 882/2021 and Administrative Decision 4/2022 were issued, which extended the 2021 Budget Law No. 27,591.
32 It is worth clarifying that throughout this section reference will be made to the main programs proposed by the Government, both in terms of amount and universe reached, leaving out several others that coexist with those presented here.
33 Decree 73/2019. The amount of $5,000 received by beneficiaries of pension benefits, Universal Pension for the Elderly (PUAM), non-contributory pensions for old age, disability and other ex-gratia pensions whose payment is in charge of the ANSES, was then equivalent to 35.5% of the minimum retirement benefit. The $2,000 received by the beneficiaries of the AUH and AUE was equivalent to 72.8% of the monthly allowance.
34 RESOL-2020-8-APN-MDS. The $6,000 (RESOL-2020-26-APN-MDS) then exceeded the value of the Basic Food Basket of an Equivalent Adult.
35 For an amount of $10,000, then 75% of the Minimum Living and Mobile Wage, the IFE was paid in April 2020, based on the provisions of Decree 310/2020, again in June, in accordance with Decree 511/2020 and for the last time in August, as of Decree 626/2020.
36 The bonus of $3,100 for each son or daughter was paid between March and April 2020.
37 CFue created by Decree 332/2020 and was paid over the 9 rounds that the program had until December 2020, plus a remainder in the first months of 2021. The State was responsible for the payment of 50% of the salary, on account of the payment of the salaries of the affected personnel, up to $33,750, which was the equivalent of two Minimum, Vital and Mobile Salaries.
38 Physical-Financial Execution of the National Administration Budget.
39 Through Decree 376/2020, in April, the minimum was raised to $6,000 and the maximum to $10,000.
40 The RePro grants subsidies to workers in companies and geographical areas in crisis, in order to supplement the basic remuneration paid by the employer through a fixed monthly non-remunerative sum and for a period of up to 12 months.
41 The benefit granted to each recipient was agreed with the following scheme: a) non-critically affected persons: up to $9,000; b) critical: up to $12,000 (by transitory provision it will be $18,000); and c) health sector: up to $18,000. Currently, the amount of the assistance, which is paid for three months, is equivalent to 50% of the total remuneration of each active worker up to a maximum of fifty percent 50% of the value of the SMVyM in force at the time of requesting the assistance. To receive the allowance, workers must not have a total remuneration greater than four times the current SMVyM.
42 The National Program for Socio-Productive Inclusion and Local Development “Empower Work” unifies the Hacemos Futuro and Complementary Social Wage programs into a single initiative.
43 Decree 711/2021 amends the Socio-Productive Inclusion and Local Development Programmes “Empower Work” and the Labour Insertion Programme of the Ministry of Labour, Employment and Social Security, with the aim of converting the different assistance benefits for unemployed people or those with precarious jobs into a stimulus for the hiring of their holders in the form of salaried employment registered in the private sector.
44 RESOL-2021-655-APN-MDS of May 2021.
45 According to Decree 218/2021, an extraordinary payment of $1,500 was made in April and another of $1,500 in May. Subsequently, decrees 481/21 and 855/21 established extraordinary payments of $5,000 in August and $8,000 in December, respectively.
46 Decree 261/2021.
47 Decree 719/2021.
48 According to Decree 216/2022, the amount of the “income reinforcement” benefit will be $18,000 to be made in two payments of $9,000 in May and June 2022.
49 The amounts received for families with one child came to represent $9,000, $13,500 for families with two children and $18,000 for those with three or more children (RESOL-2022-371-APN-MDS).
50 The new stage of the +Precios Cuidados program launched in April increased the number of items included in it to 1,357 and incorporated 473 products from the entry into force of the private wheat trust (000 flour and dry noodles).
51 Unregulated private services refer to services excluding electricity, gas and other fuels, public transportation, prepaid medical expenses, telephone and internet, and education.
52 On 16-Jun-22, Decree 332/2022 was published, which establishes the segmentation of electricity and natural gas tariffs by network, dividing users into 3 scales: Higher income (level 1), Lower income (level 2) and Medium income (level 3). In the first case, subsidies will be removed during the year so that users pay the full rate by the end of 2022. In the case of lower-income users, they will pay the Social Tariff, and the increase may not exceed 40% of the CVS of the previous year. Finally, the rates of middle-income users will be increased to 80% of the CVS of the previous year. In this way, after the March increases, the rates of levels 2 and 3 will not show any more increases in the rest of 2022.
53 On December 30, 2020, a Memorandum of Agreement was signed between the companies in the agro-export sector of oils grouped in the Chamber of the Oil Industry of the Argentine Republic and the Center of Cereal Exporters (CIARA CEC) and the Ministries of Agriculture, Livestock and Fisheries and of Productive Development for the formation of a private trust in order to guarantee the domestic supply of oils and ensure fair and reasonable prices for the domestic market. The trust consists of a compensation system through which agents operating in the soybean and sunflower market and are registered in the Single Registry of the Agri-Food Chain (RUCA) make contributions of funds that are calculated according to the Affidavits of Foreign Sales of the products subject to contributions. The beneficiaries are economic actors who carry out the transformation of bulk oil in the country into final consumption products for supply in the domestic market that adhere to the trust. As for the products subject to compensation, they are “Packaged Oils” and “Refined Oils”. At the request of joint resolution No. 1/22, the continuity of this system was set until January 31, 2023.
54 This cumulative fall so far this year presents a heterogeneous behavior in the months, with a systematic fall until April and a reversal in May.
55 Recently, and in line with the rise in monetary policy rates, the lending rate for investment projects was increased to 42% n.a. and the working capital rate to 52.5% n.a.
56 Recently, the rate of financing granted through Ahora 12 was raised to 42% n.a. for financing in three, six and twelve installments.
59 Communication “A” 7469 and Communication “A” 7471.
61 Communication “A” 7488, Communication “A” 7507, Communication “A” 7516 and Communication “A” 7528.
62 Decree 277/2022 of the National Executive Branch.
66 On this occasion, calculated on the average of private sector deposits in March 2022.
69 Cryptoassets are a type of privately issued digital asset that relies on cryptography and distributed ledger technology (DLT) for transaction verification. The first crypto assets, such as Bitcoin, were issued in their own unit of account and are not the liability of any entity. Although they have attracted growing interest as a speculative investment vehicle, data on their use in the conduct of legal transactions are scarce. Its high volatility and the unregulated nature of its market raises significant consumer protection concerns. New variants such as stablecoins (designed with the purpose of maintaining a stable value with respect to a basket of assets) have, however, the potential to function as a substitute for money in their traditional functions and, depending on their degree of adoption, also pose potential risks to macro-financial stability (IMF –2022–).
70 By way of example, it should be noted that in the case of our country, the number of new accounts created to enable the payment of the IFE and ATP programs aimed at mitigating the negative impacts of the pandemic on the income of families and firms was around 5 million, which made it possible for 95% of the adult population to access bank accounts and payment service providers. A similar, even more pronounced development was verified in Brazil where the number of accounts grew by about 50 million in 2020 alone to reach a coverage of 96% of the adult population.
71 On the other hand, in addition to these factors of a more structural nature, it should be borne in mind that in a context marked by the uncertainty caused by the pandemic, the precautionary demand for cash has tended to increase temporarily in the last period, even in advanced economies. In the latter, the coexistence between a lower transactional use of cash and a greater demand for it for hoarding reasons – something that in the literature has been called the “banknote paradox” – is a phenomenon that had already been verified as a result of the lower opportunity cost of working capital holdings associated with the validity of very low nominal interest rates in the period of the post-global financial crisis.
72 This is not necessarily the situation in all cases. For example, as mentioned in footnote 2, levels of financial access (measured as the number of bank and payment accounts in relation to the total adult population) are currently very high in Brazil and in our country. However, despite this high coverage, in some circumstances the lack of knowledge regarding their existence or their conditions of use implies a low effective use of these digital media.
73 Interoperability is the technical, operational, and legal compatibility between payment mechanisms and systems that allows users and providers to carry out transactions without the need to participate simultaneously in these multiple systems (CPMI –2016–).
74 In other countries of the region, there are also SMPRs with more limited coverage and uses for the time being (with clearing mechanisms operated by and owned by the private financial sector).
Share on


