Summary
1. Monetary policy: assessment and outlook
Despite significant progress in the fight against COVID-19, the global rate of infections and deaths has intensified since the publication of the last IPOM. Under this scenario, the world economy continued to recover, but at a heterogeneous pace and with several factors of uncertainty ahead. The outlook for the coming months is conditioned by the progress in the vaccination process and the effect of monetary and fiscal stimulus policies, especially those driven by the central economies.
Argentina registered a worsening of the epidemiological picture in mid-March. With the arrival of the second wave of COVID-19, the National Government implemented new restrictions on mobility to slow down the speed of infections. These measures were, so far, of less intensity than those implemented a year ago, specific to each jurisdiction and calibrated taking into account the progress of vaccination and the strengthening achieved in the health system. To contain the economic and social effects of this second wave, the National Government focused its assistance programs on the most vulnerable social strata and on helping companies in the affected jurisdictions.
In recent months, as we have been anticipating in previous editions of the IPOM, various factors such as the recovery of the relative price of services, the recomposition of retail marketing margins in some sectors, and the progress of parity agreements, exerted pressure on the price formation process. Added to this was the significant increase in international commodity prices and their pass-through on the domestic price of food. Thus, during the first four months of the year, the year-on-year inflation rate accelerated by 10.2 p.p., to 46.3%. Given the transitory nature of several of these shocks, inflation is expected to begin a gradual and sustained decline in the coming months.
In this context, the BCRA continues with the policy of managing the exchange rate, encouraging the exchange rate dynamics to contribute to consolidating the gradual process of lowering the inflation rate. Indeed, in a favorable external context marked by the rise in the price of raw materials, the monetary authority adapts the pace of exchange rate sliding in order to contain the price rises of tradable goods and influence inflationary expectations. With respect to its monetary policy, the BCRA maintains a prudent administration of monetary aggregates, sterilizing any surplus liquidity that may arise and ensuring the existence of savings instruments in pesos that exhibit positive returns with respect to inflation and the exchange rate. Finally, the BCRA has focused on access to productive lines of credit at subsidized rates, with the aim of promoting a rapid recovery of aggregate supply.
For its part, the National Government intensified its efforts to break the inflationary inertia by moderating the distributive bid, through dialogue between business chambers and unions within the framework of the Economic and Social Council.
Tax collection continued to strengthen during the first four months of the year, based on the contribution of taxes related to foreign trade – in a context of increases in international commodity prices – and the sustained recovery of taxes linked to domestic economic activity, favored by a faster recovery than initially expected. Likewise, the regulatory modifications on taxes provided for in the Social Solidarity and Productive Reactivation Law of the end of 2019 and in the National Budget Law 2021 continued to have a positive impact on public revenues. This, added to the efforts deployed by the National Government to rebuild the peso debt market, made it possible to reduce the Central Bank’s financial assistance to the National Treasury. Thus, so far in 2021 there has been a limited and balanced variation in the factors of expansion of the monetary base. Specifically, with regard to financial assistance to the Treasury, it is in line with the records of previous years in terms of GDP, excluding the first year of the pandemic.
Monetary aggregates continued with the moderation process initiated in the last quarter of 2020. So far in 2021, the means of payment presented a continuous fall in real terms, which was explained both by demand deposits and by the circulating deposits held by the public. In terms of GDP, these aggregates were around their historical average. A factor that contributed to the low dynamism of the means of payment was the demand for savings instruments denominated in pesos. Time deposits grew at an average monthly rate of 1.9% in real terms without seasonality during the first four months of the year. A segment that stood out especially is the one denominated in UVA, whose traditional placements grew at a monthly average of 14.2% in real terms, while pre-cancelable placements, which have a real guaranteed rate of 1%, expanded to a monthly average of 25.4% in real terms.
The improvement in the fiscal and monetary position, together with the growth of traditional fixed terms and the existence of savings alternatives with inflation and exchange rate hedging, allowed the BCRA to face the new stage while maintaining the minimum fixed-term interest rates and monetary policy unchanged. This is in line with the importance of accompanying the process of normalization of economic activity.
The moderation of the monthly depreciation rate of the peso took place in a context where the real exchange rate is above its historical average, and in which a current account surplus is registered. The BCRA maintains its structural objective of accumulating international reserves by maintaining a competitive and stable real exchange rate. So far this year, the BCRA managed to maintain an increasing trend in the balance of International Reserves, which accumulated an increase of US$2,130 million since the beginning of the year and stood at US$41,517 million as of May 20.
The BCRA seeks to promote economic recovery and generate the conditions for a process of sustained economic growth by promoting adequate credit conditions and financing levels for companies and families. Currently, the productive credit policy is channeled through the Productive Investment Financing Line (LFIP), whose interest rates are at levels consistent with those of the monetary policy rate. Since its implementation, and with data as of April 30, the LFIP accumulated disbursements for a total of $513,321 million, which implied an average monthly nominal growth of 32.4% in the first four months. At the time of publication, some 120,180 companies had accessed a loan granted within the framework of the LFIP.
In a context still marked by the effects of the COVID-19 pandemic, the BCRA will carry out a monetary policy that, in addition to preserving monetary and financial stability, will lay the foundations for a path of economic development with social equity. To this end, it will continue to sterilize any monetary surpluses and manage the exchange rate in order to contain inflationary pressures and preserve external balance. At the same time, it will continue to promote productive development and structural change through its financial and credit policies.
2. International context
Since the previous IPOM, the global rate of COVID-19 infections has intensified again, with the focus of the pandemic shifting first to Latin America (mainly Brazil) and then to India. At the beginning of May 2021, the cases registered reached their highest since the beginning of the health crisis (plus 5.7 million per week). Vaccination is progressing at a slow pace and with marked differences between high- and low-income countries.
The global economic recovery continues, but at an uncertain and heterogeneous pace. During the first quarter of 2021, activity still showed the impact of outbreaks in many countries: growth accelerated in the United States, slowed in China, and GDP contracted in the euro area and Brazil (to mention Argentina’s main trading partners). As vaccination progresses and expansionary monetary and fiscal policies are implemented—such as those recently announced in the United States—the recovery will gain new momentum. This is reflected in expectations and upward revisions to growth forecasts, with the IMF forecasting global growth of 6% this year.
Global risks persist: vaccination and the ability to implement supportive policies are very disparate between countries. Developing economies may take longer than advanced economies to reach pre-pandemic levels of output, creating wider gaps in living standards between these countries. The increase in long-term interest rates in advanced economies could induce greater volatility in capital flows to emerging countries, as observed in recent months. Thus, the pace and extent of vaccination campaigns, the continuity of support policies and the effective provision of global liquidity will determine the intensity of the recovery.
2.1. Pandemic: daily cases at peak levels and uneven vaccination progress
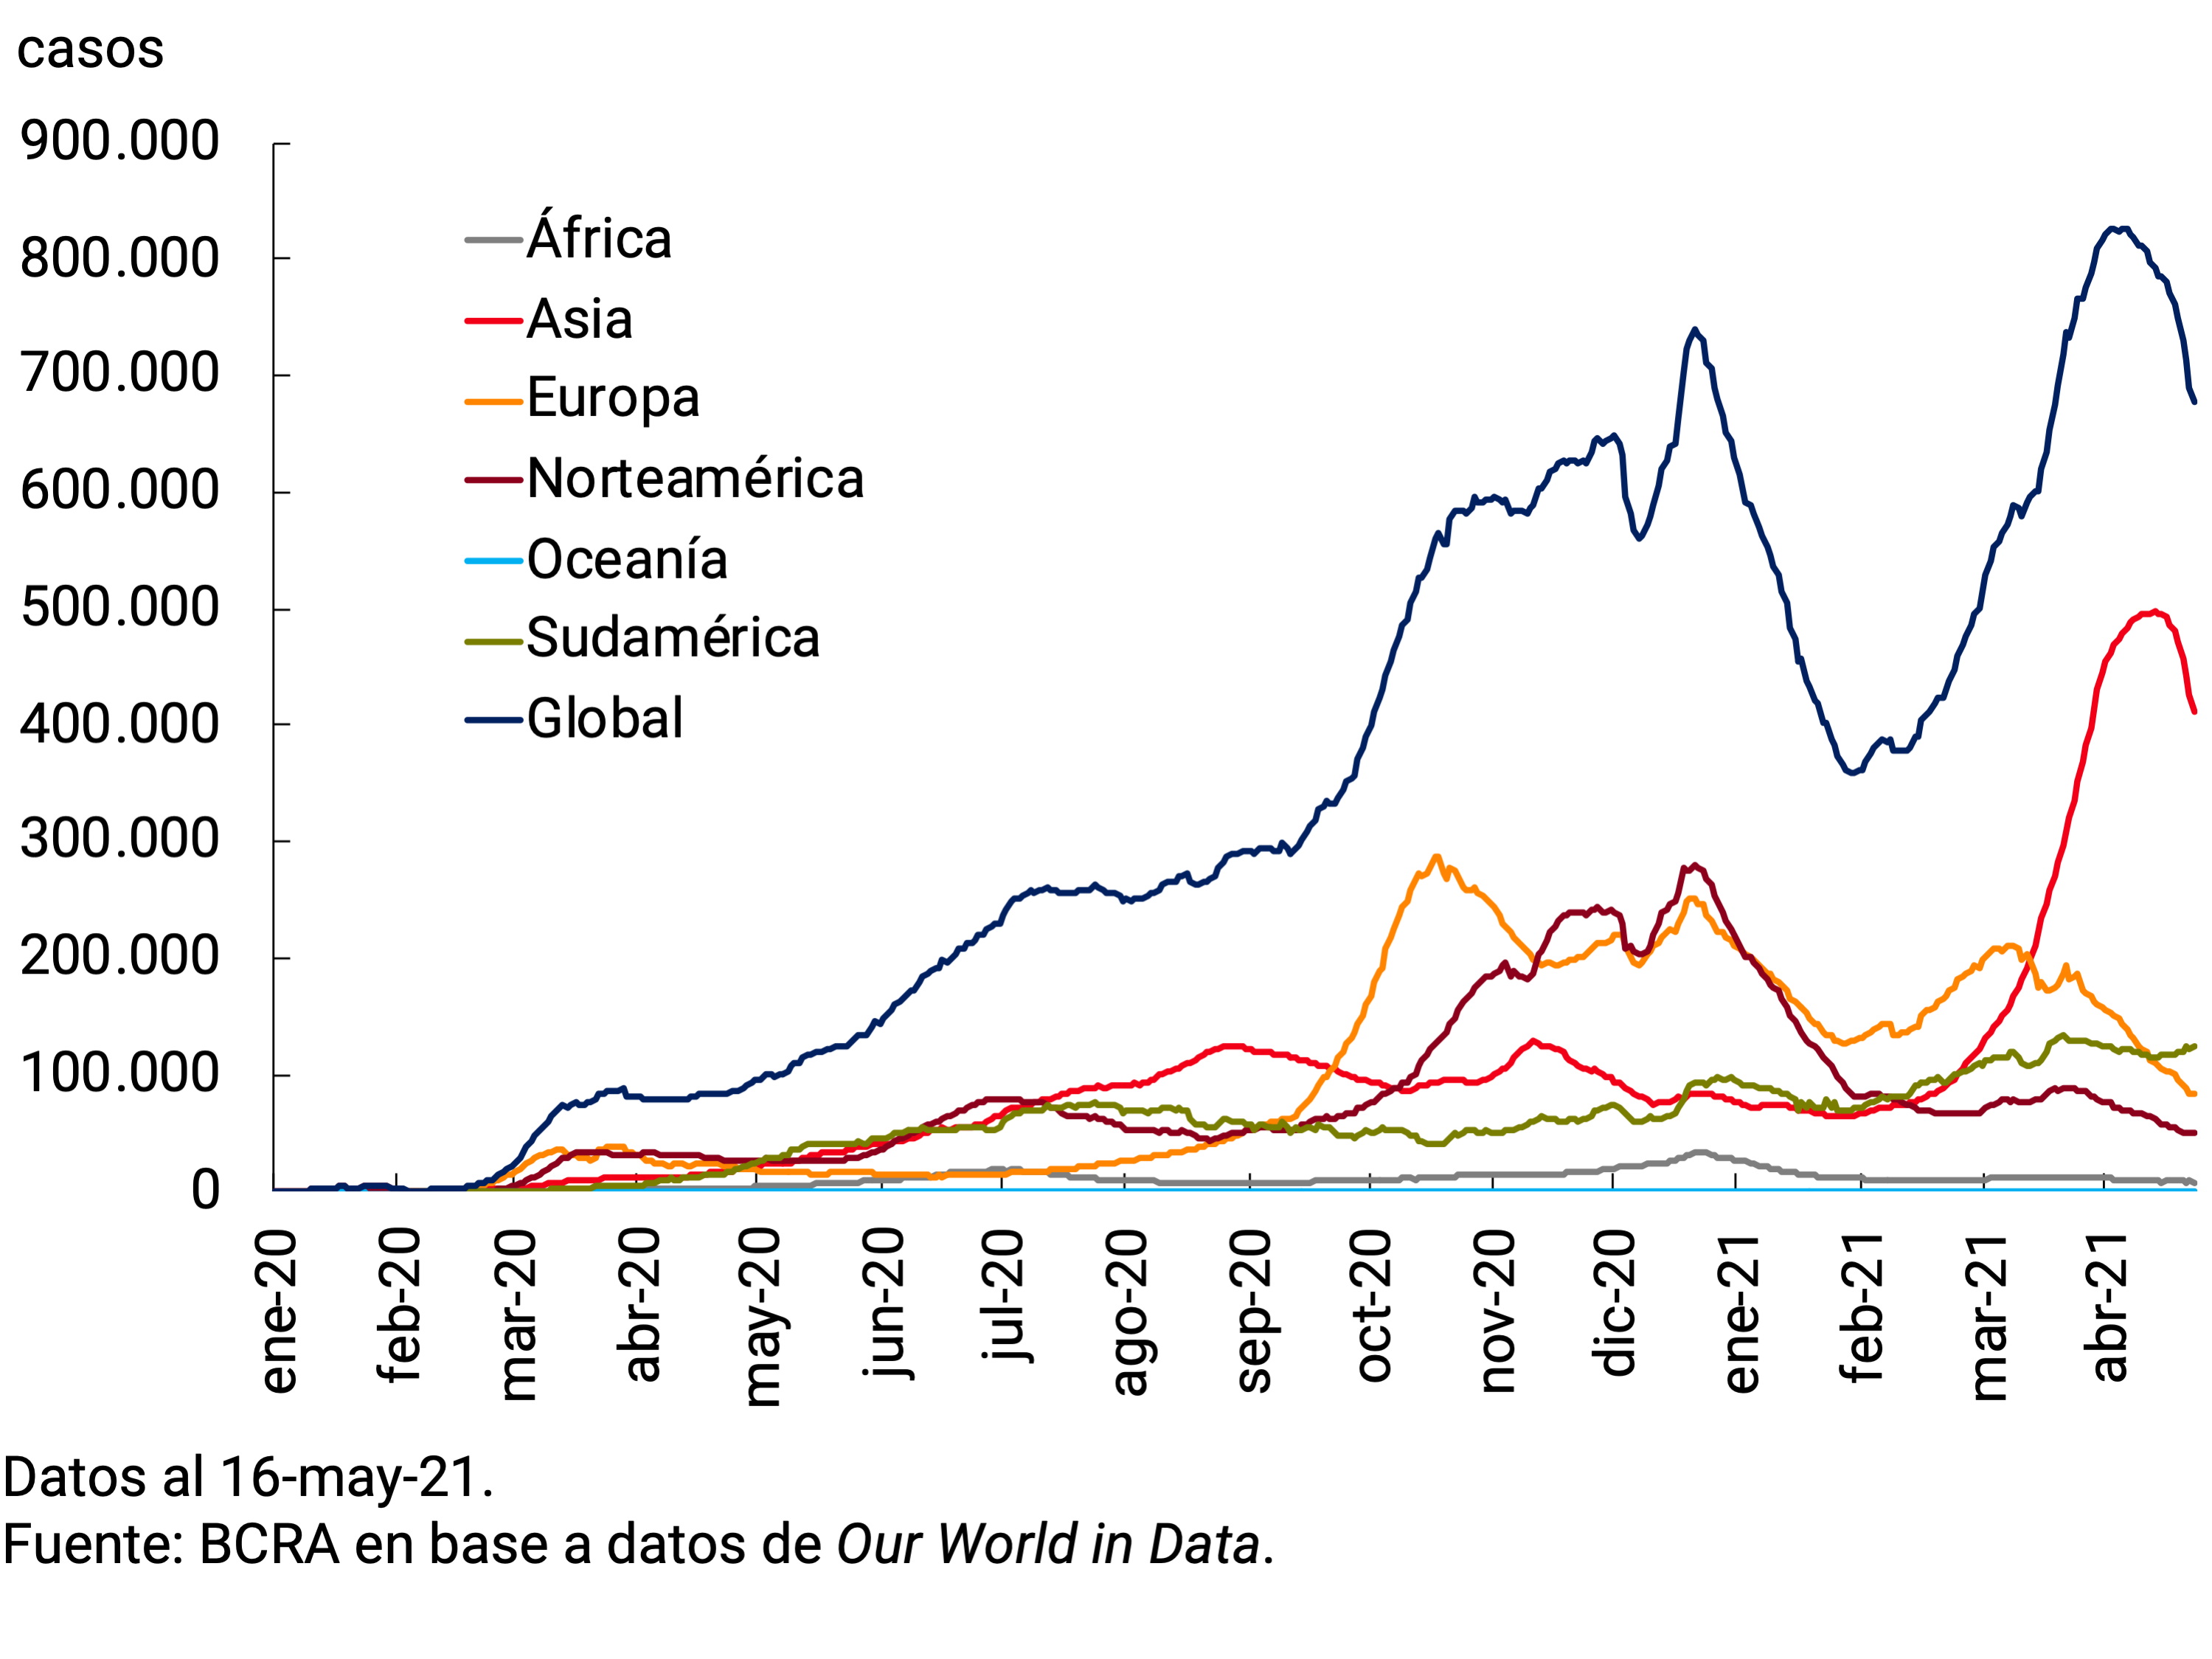
The decline in global cases that had begun at the close of the previous IPOM stopped towards the end of February, at a floor of 2.5 million per week. By that time, cases began to fall in the United States, but increased exponentially in Brazil (and the rest of Latin America) and then in India. They also resurfaced in several European countries. In early May, recorded cases reached their highest since the beginning of the pandemic (more than 5.7 million per week; see Figure 2.1). The resurgence paralleled the spread of more contagious variants. The UK variant was dominant in Europe and spread in North America; and the Manaus variant in Brazil. As of the date of publication of this report, cases were declining from their peaks on all continents except South America.
Figure 2.1 | New daily confirmed COVID-19 cases by continent (moving average last 7 days)
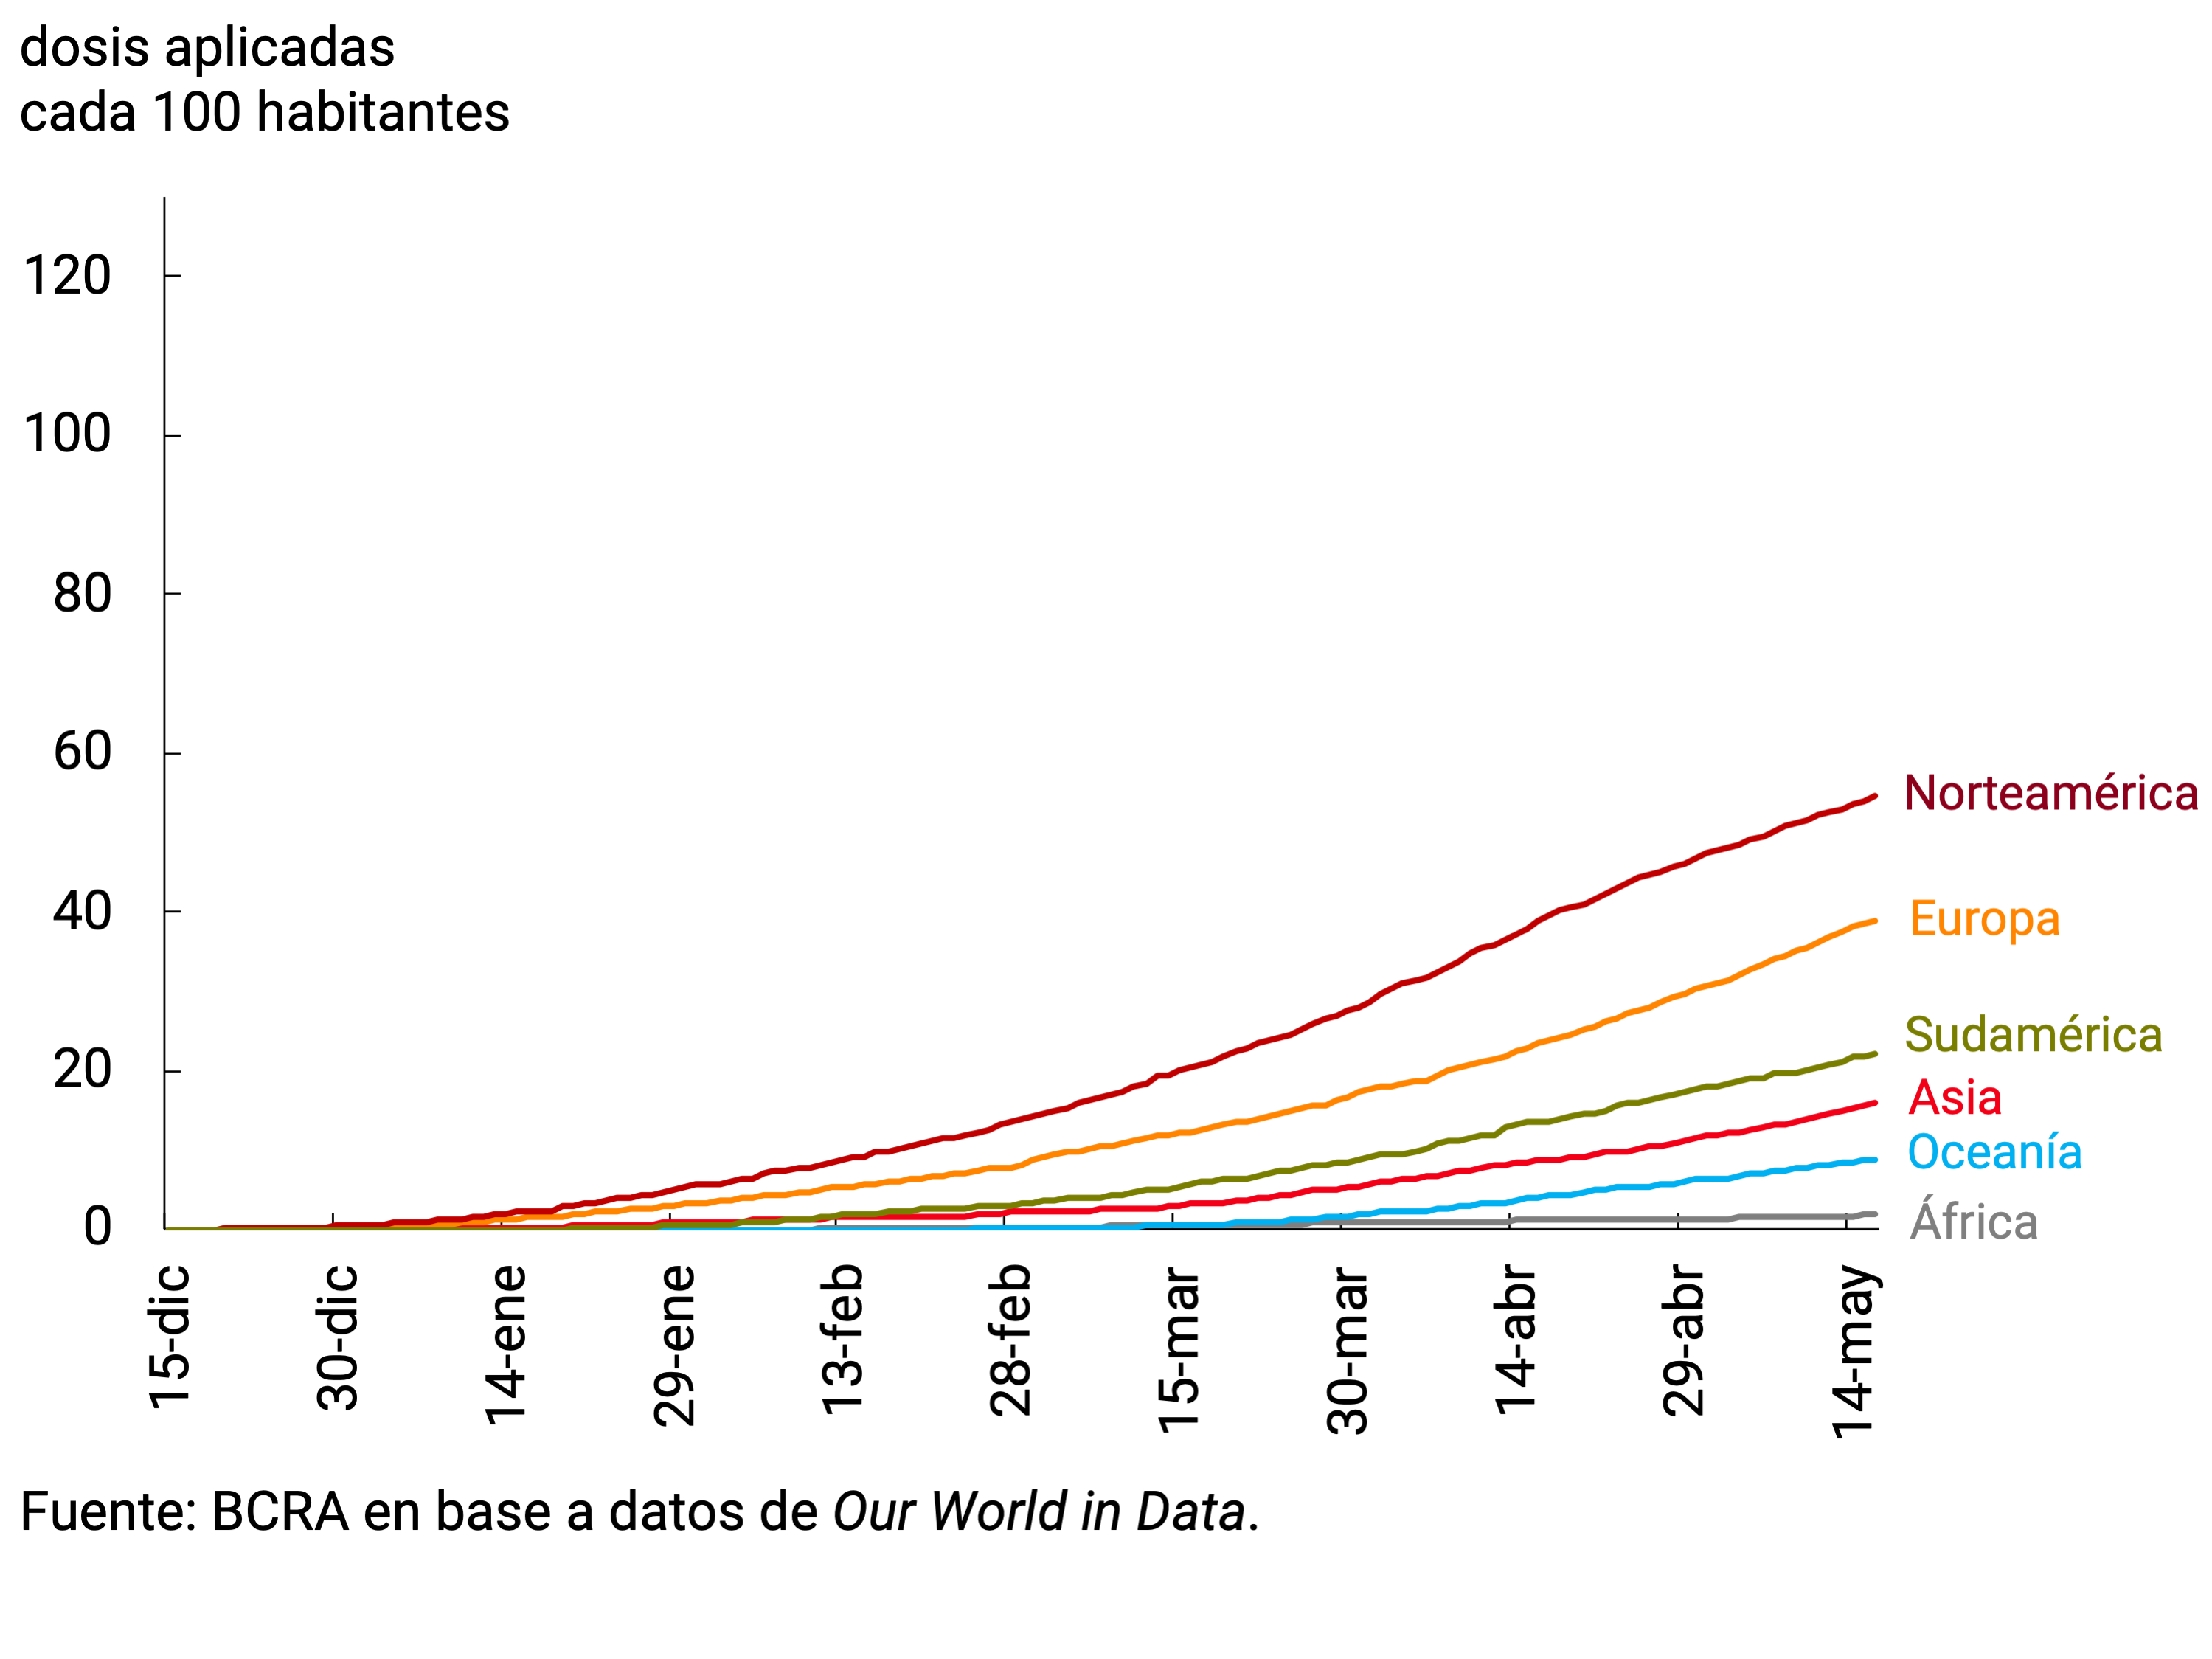
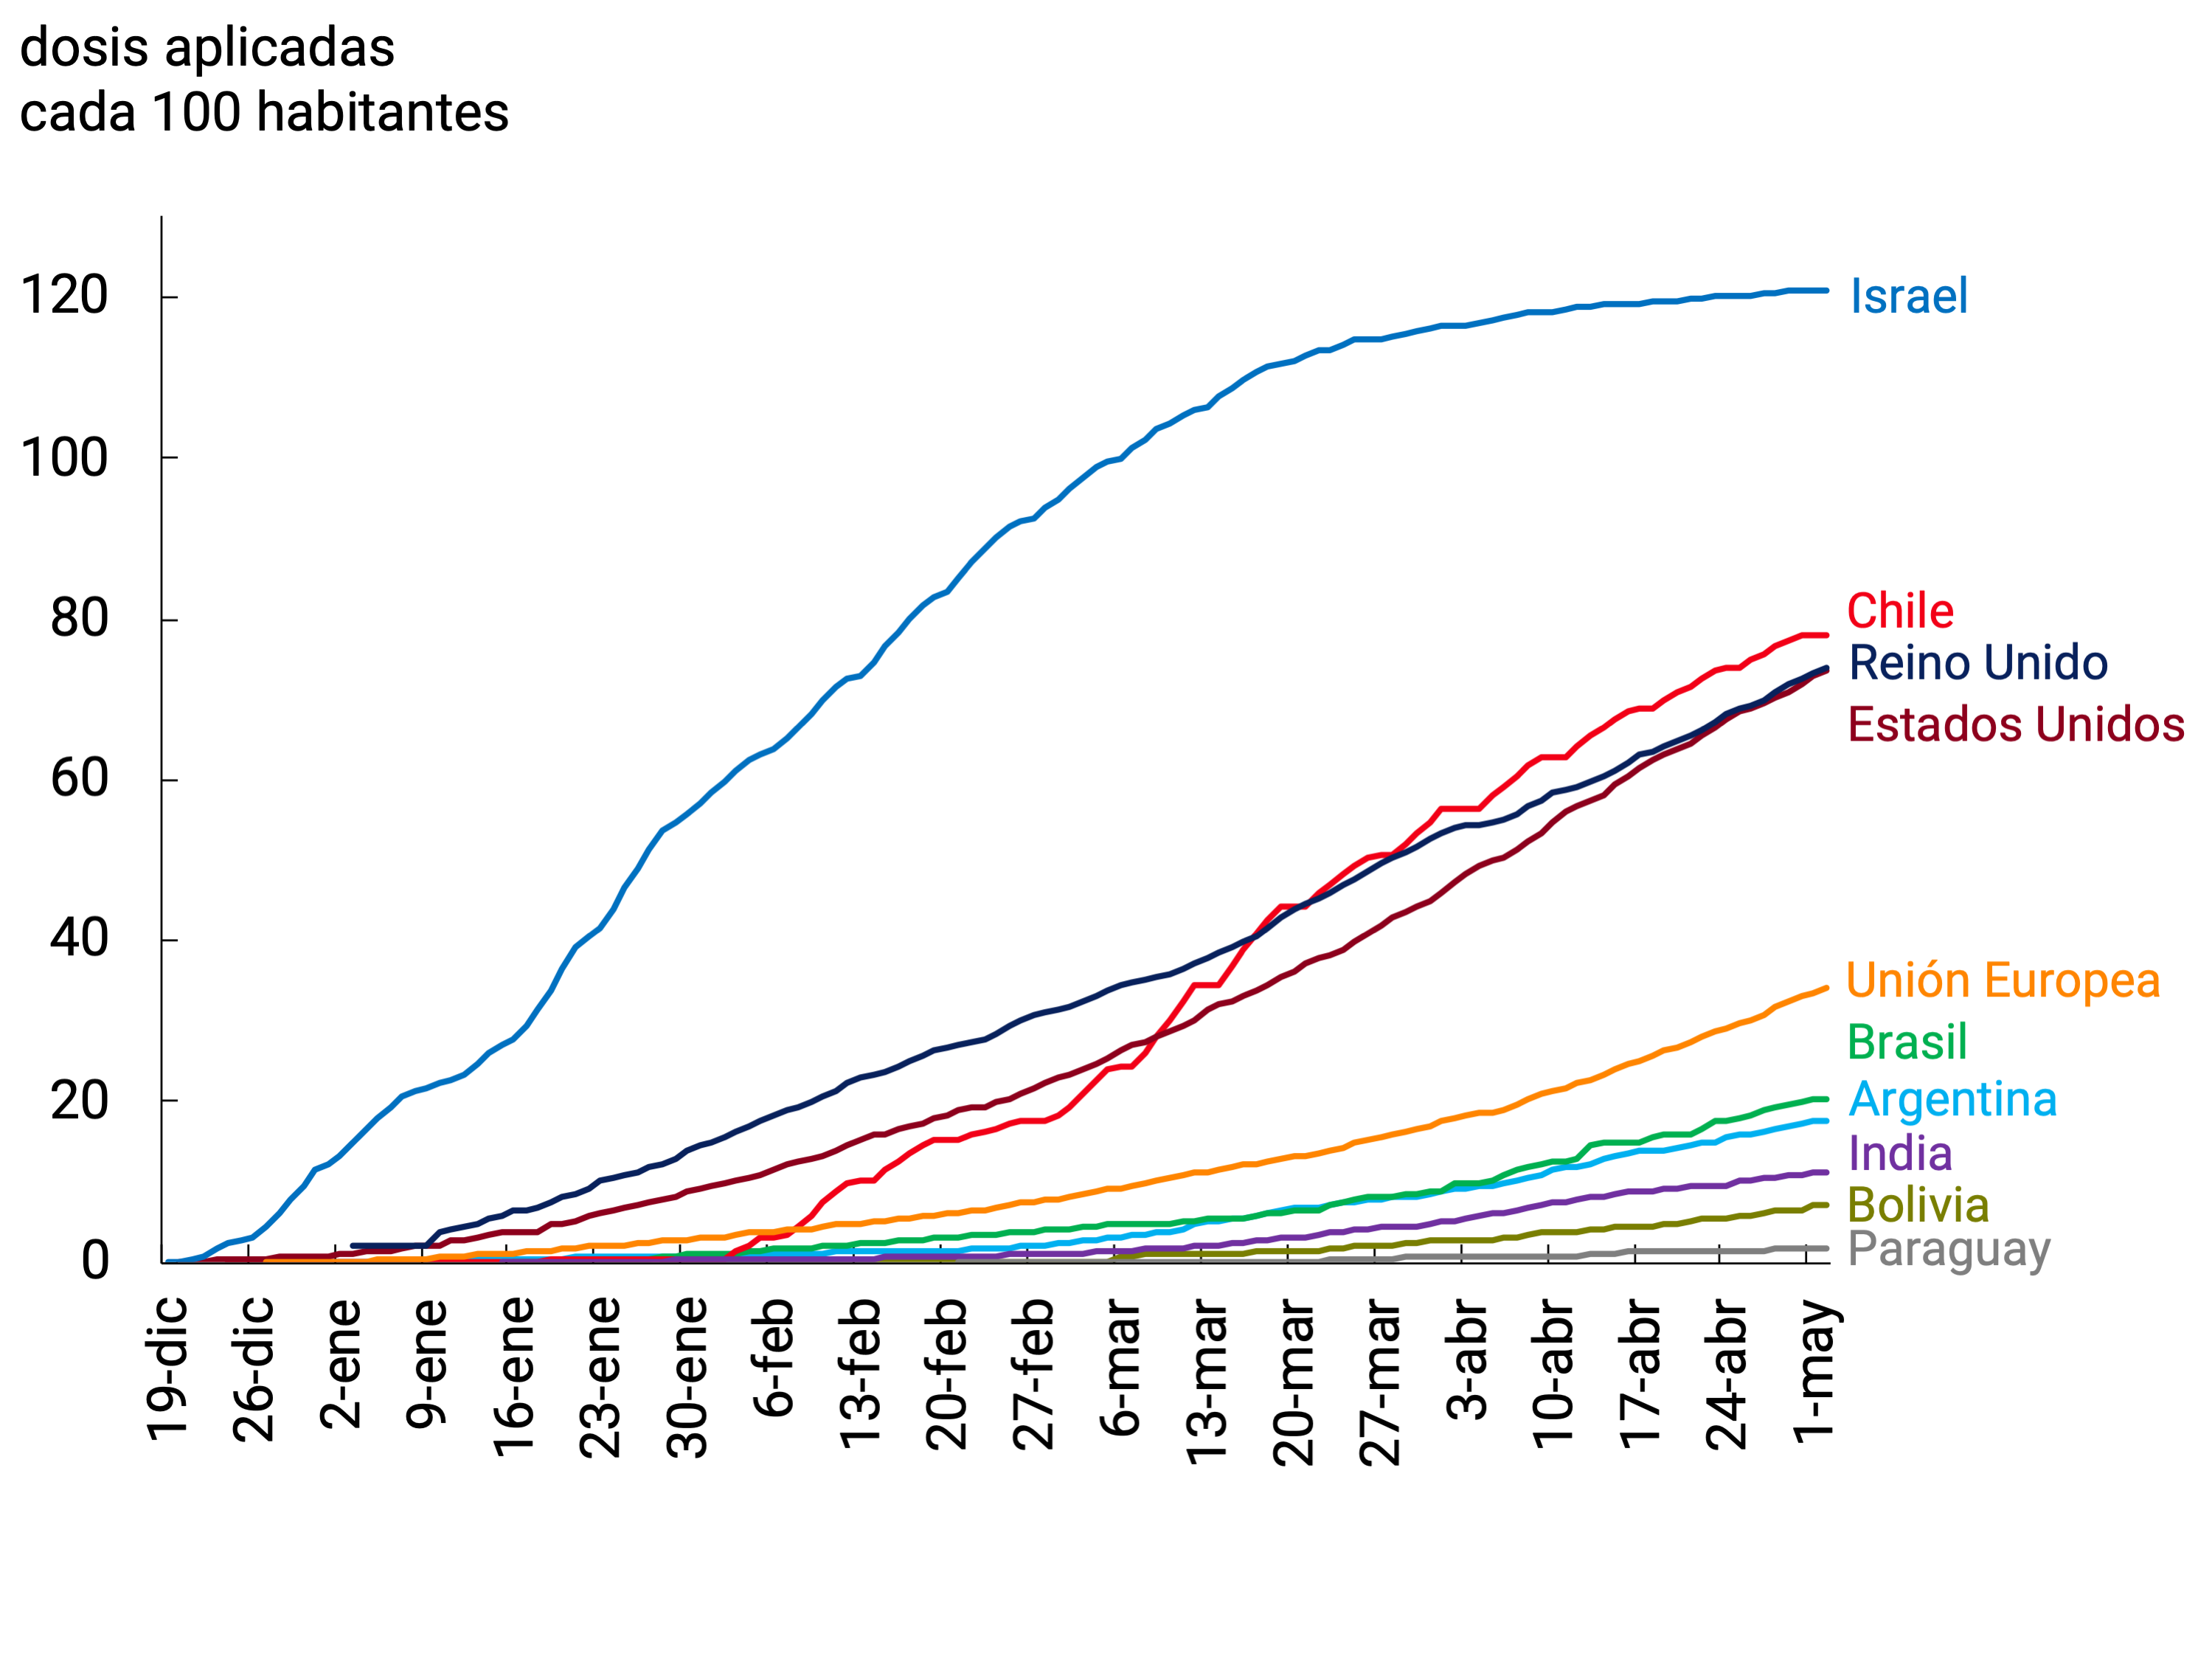
The new wave found most countries in the early stages of vaccination campaigns (see Figure 2.2). In recent months, the pace of vaccination has increased: at the beginning of March, 1 dose was applied per thousand inhabitants on average per day in the world, and by the end of April, just over 2. Studies suggest that vaccines are effective in preventing, above all, hospitalizations and deaths. While new variants might be more adept at evading the immune system, available evidence also indicates that some vaccines remain effective against the U.K. and Manaus variants.
Figure 2.2 | Vaccination developments in selected continents and countries
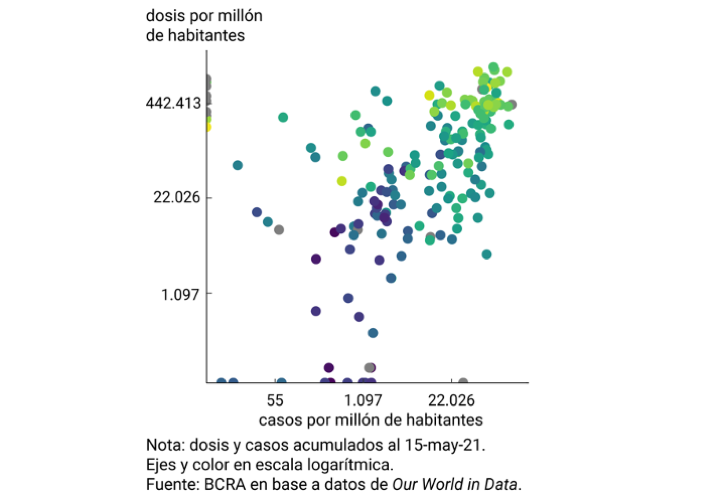
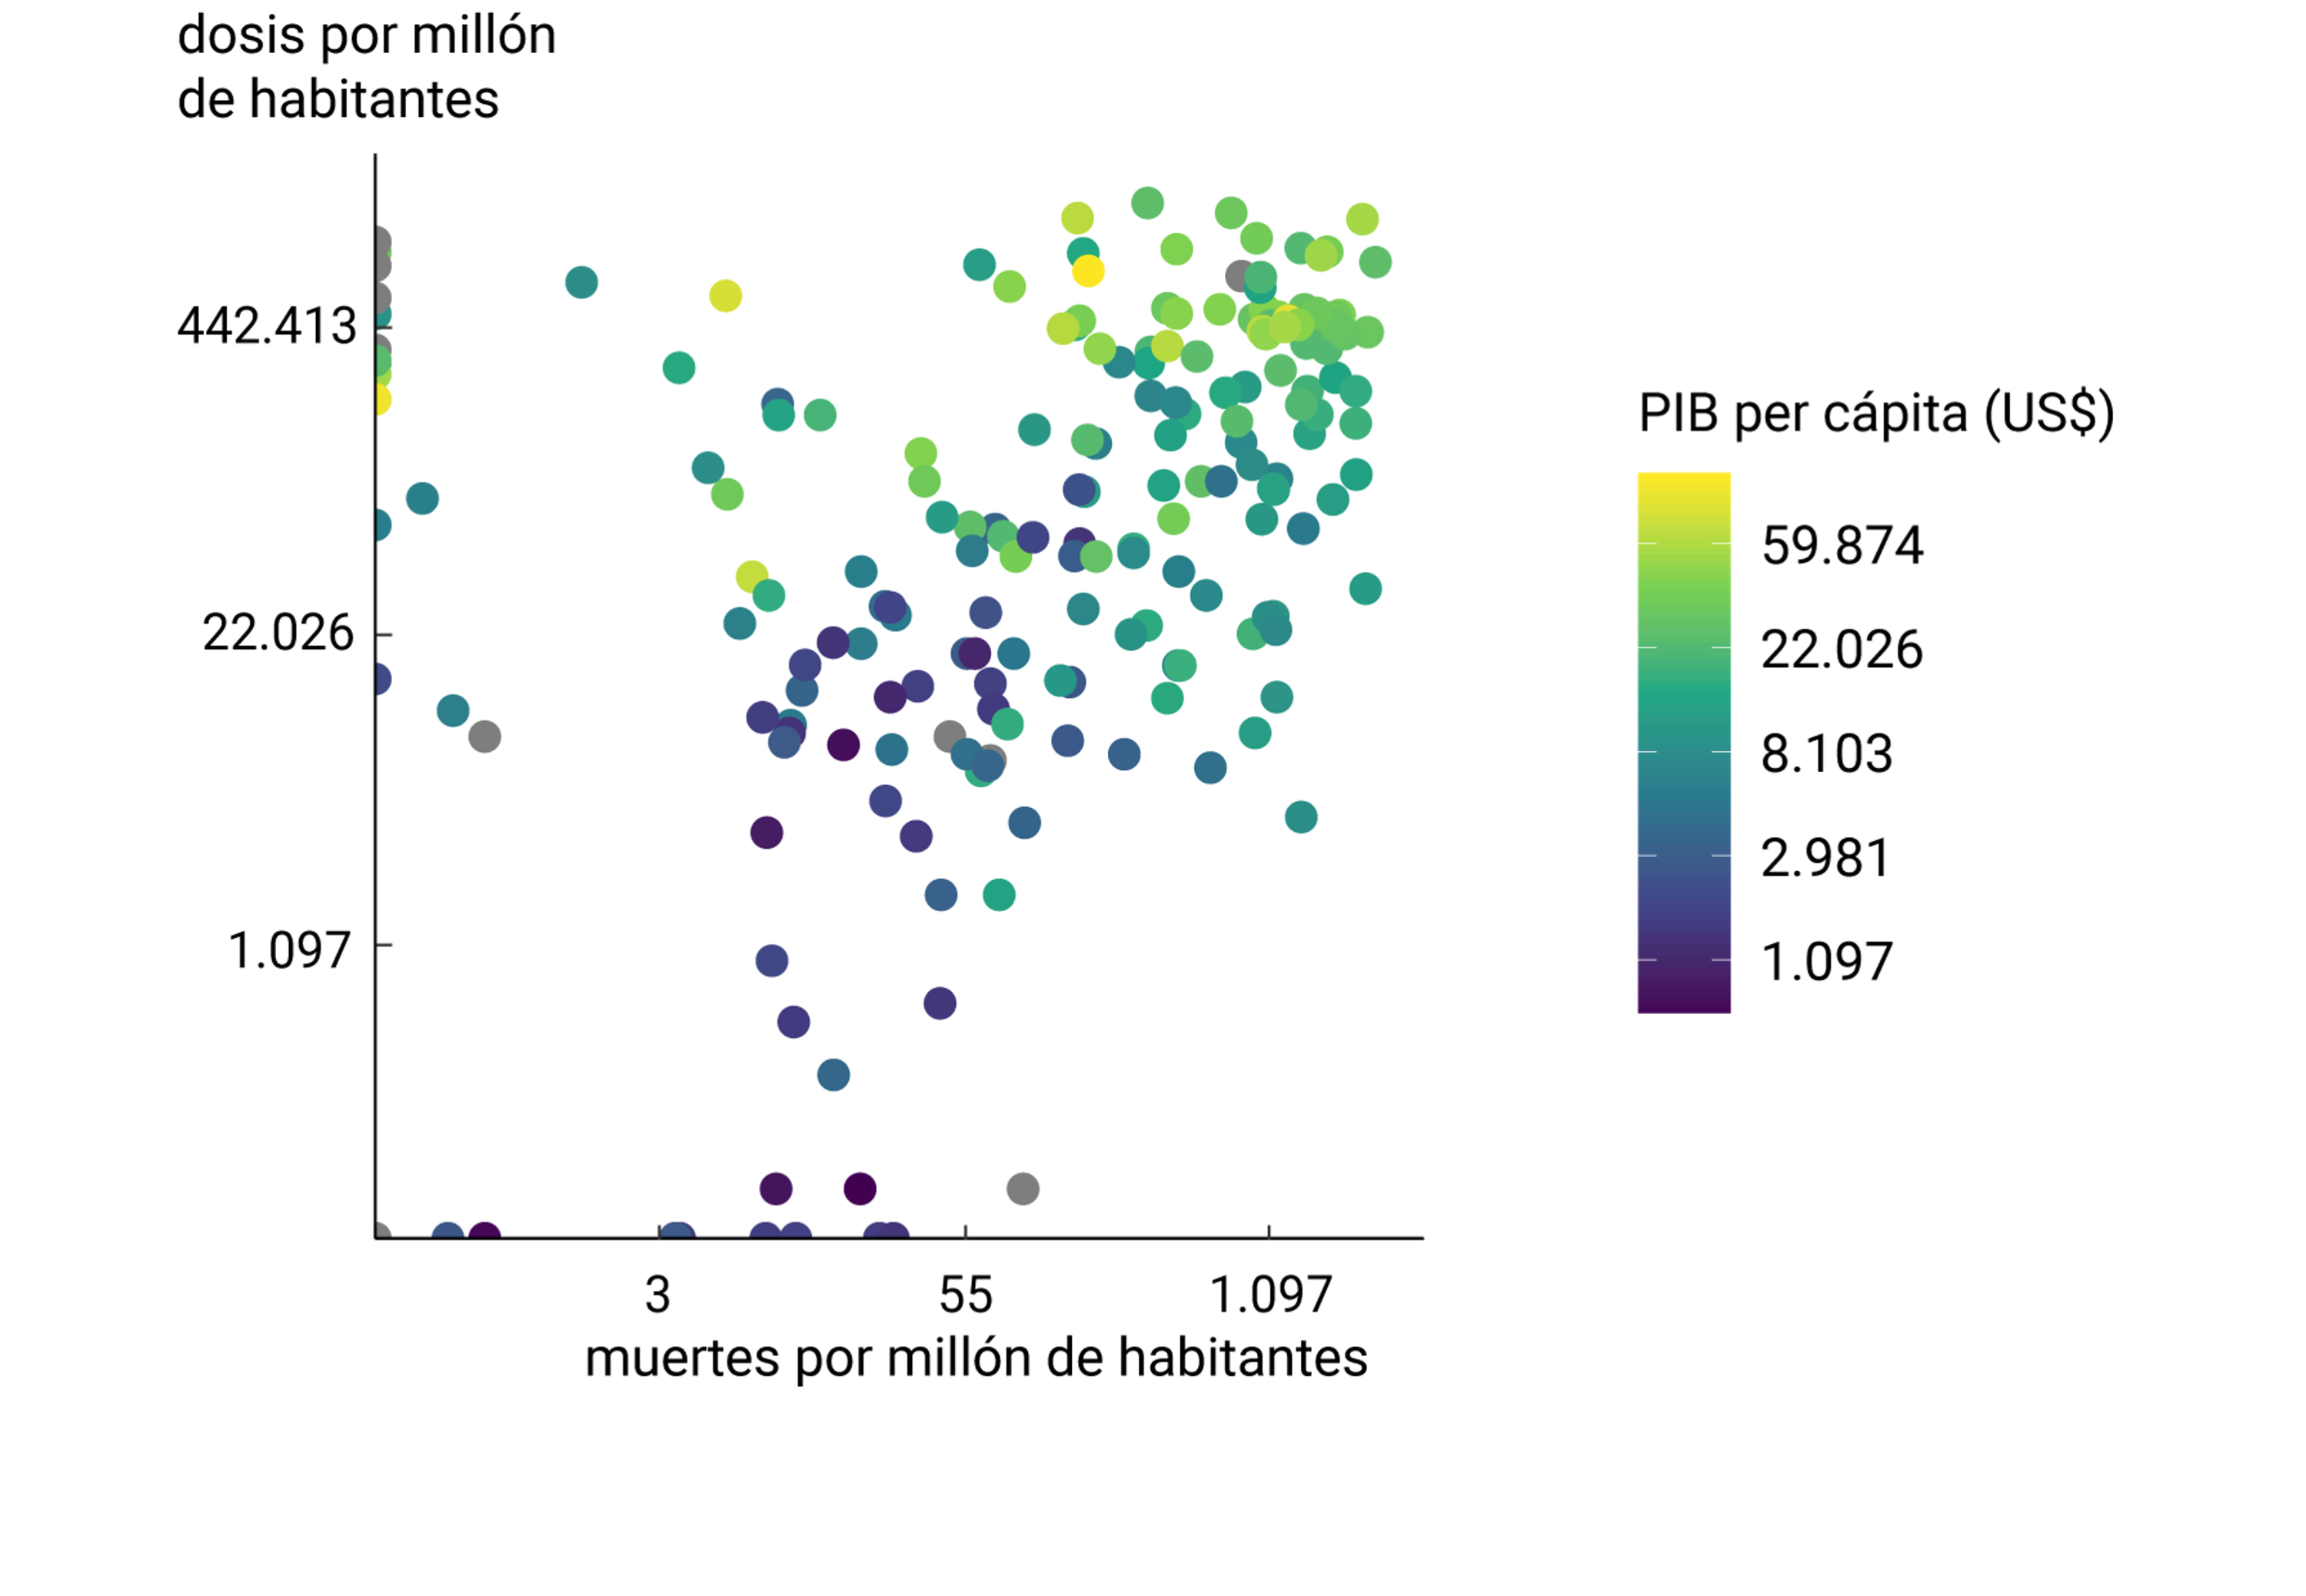
For the same level of cumulative cases, higher-income countries have applied the most doses (see Figure 2.3). In North America and Europe, campaigns have started earlier and have more than 54 and 38 doses applied per 100 inhabitants, respectively (data as of May 16). In contrast, South America has more than 21 doses per 100 inhabitants, with large differences between countries. The leaders are Chile (with more than 47% of the population with at least one dose), Uruguay (more than 38%), Argentina (more than 17%), Brazil (more than 16%). In the rest of South American countries, more than 90% of the population has not even received the first dose.
Figure 2.3 | Vaccination according to cases, deaths and country admissions
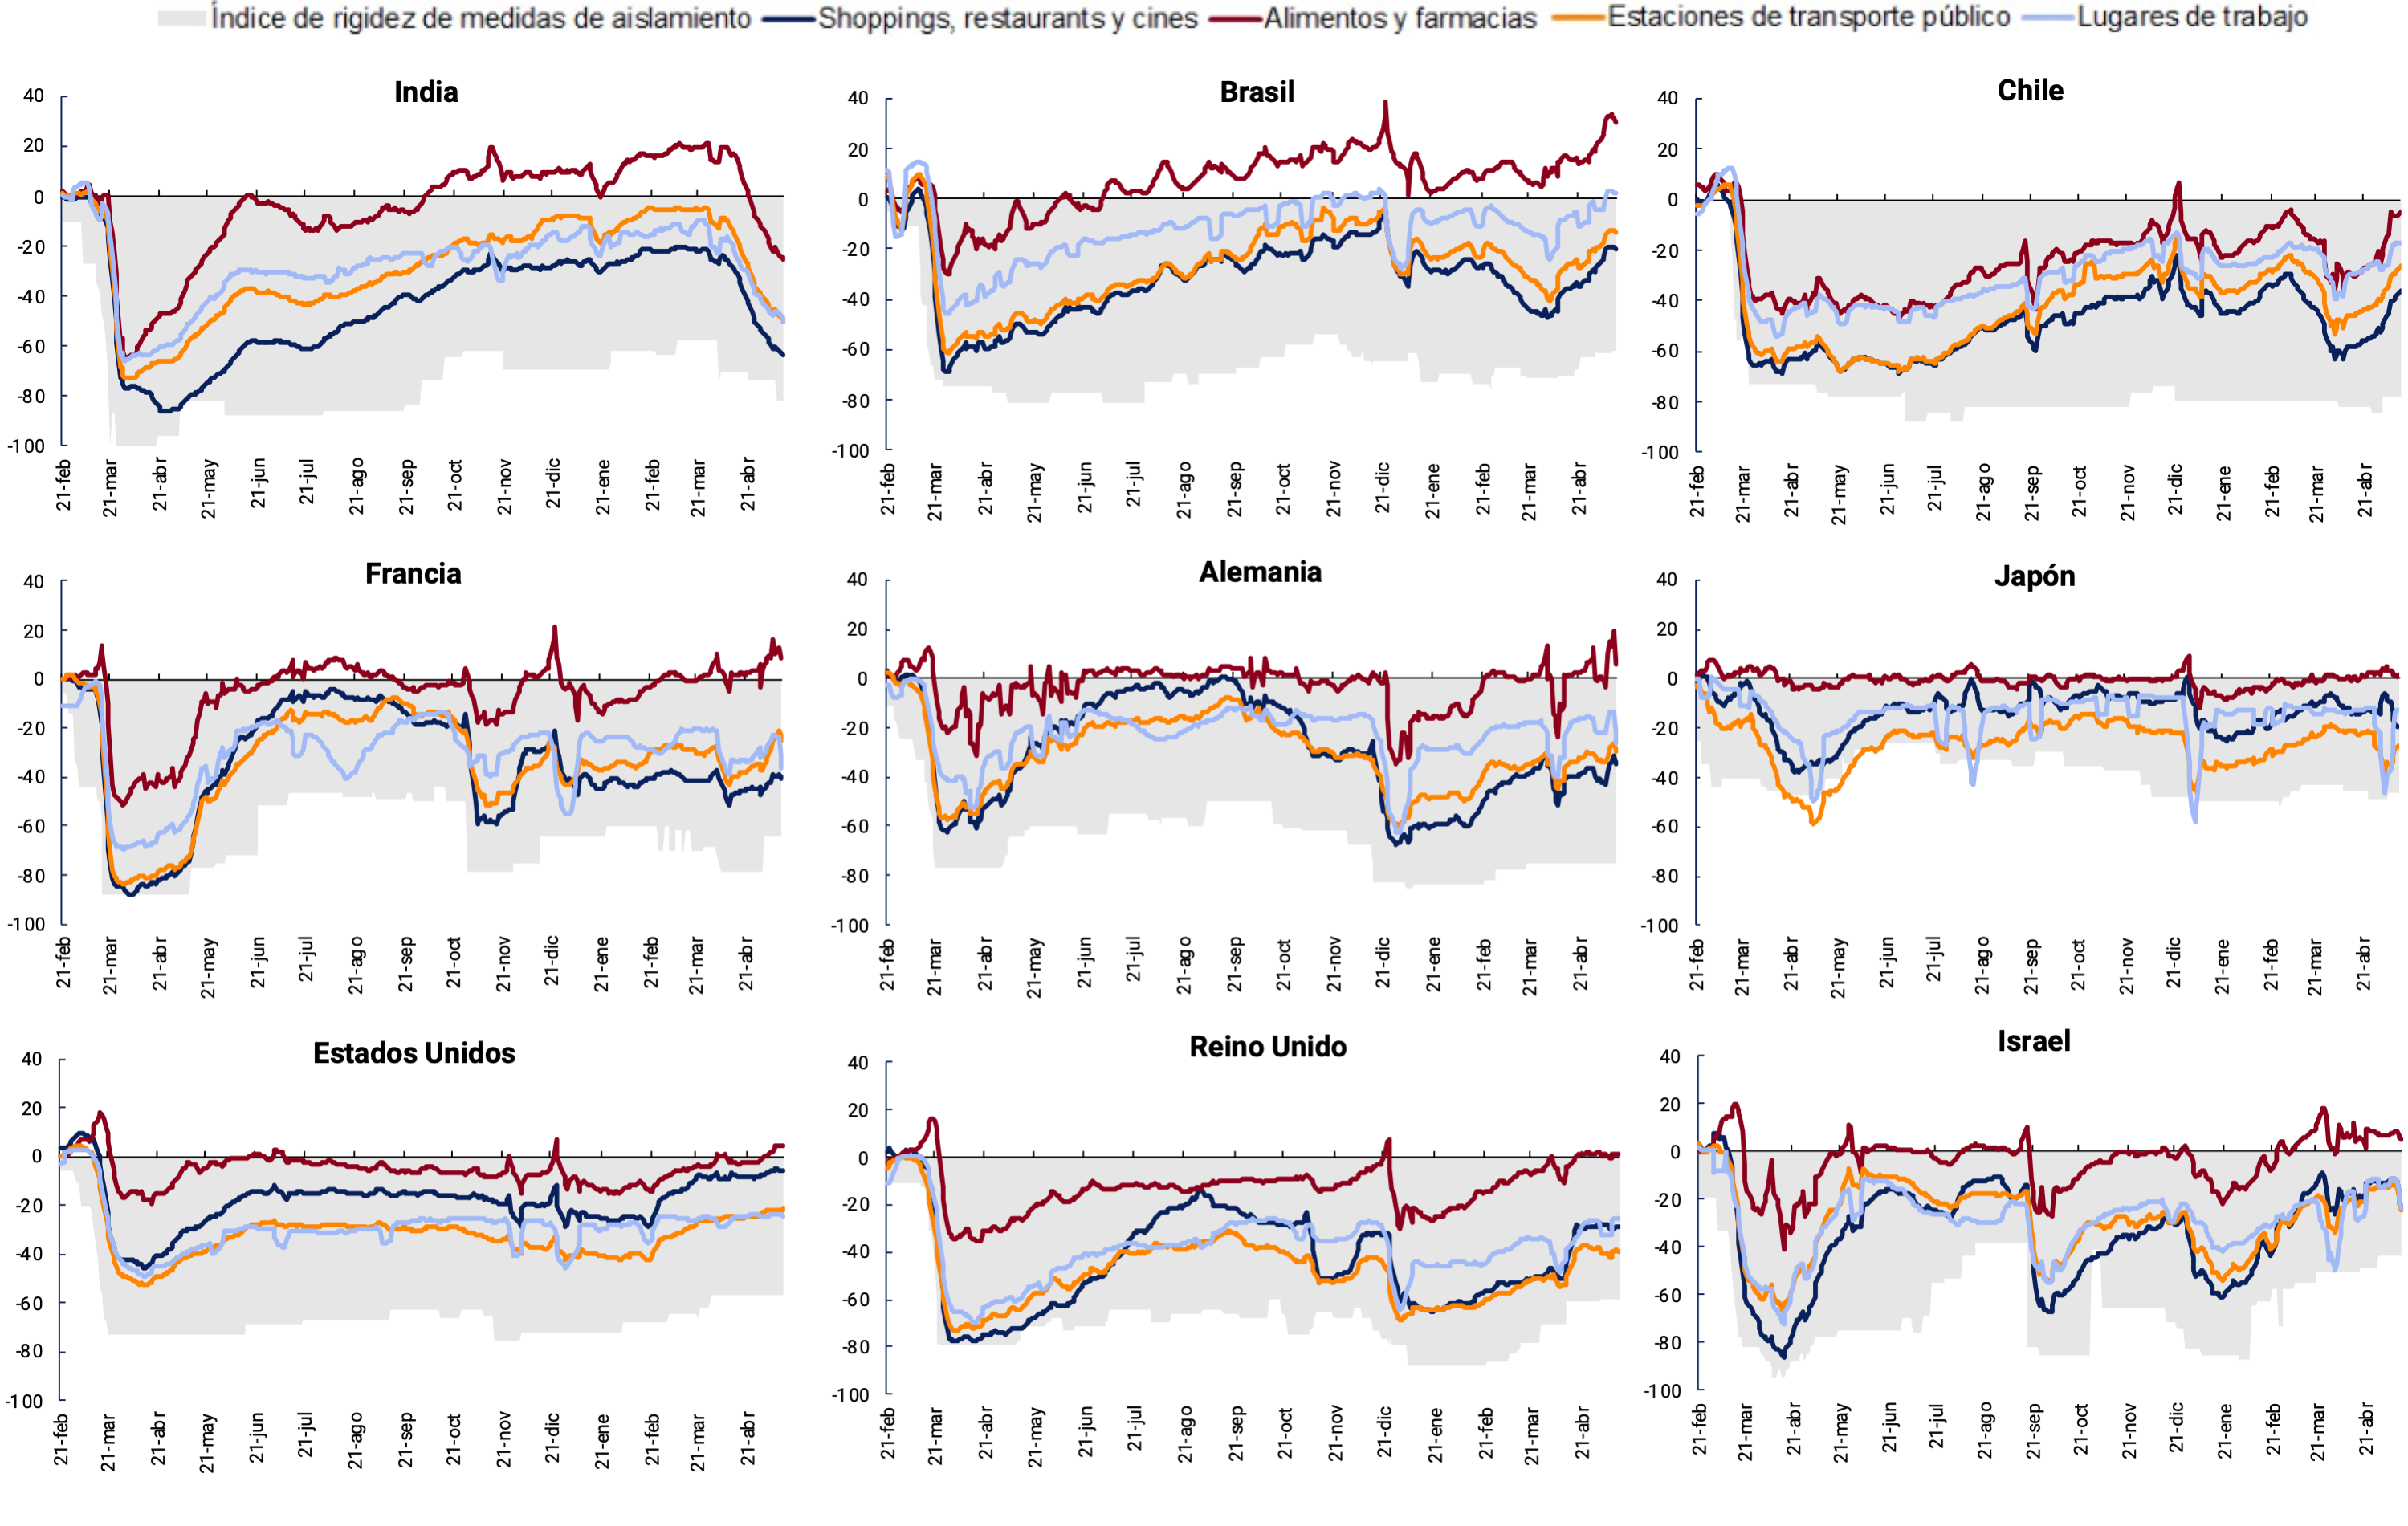
The uneven dynamics of vaccination and the shift in the epicenter of the pandemic translate into divergent trends in mobility rates between countries. Israel, the United Kingdom and the United States significantly reduced restrictions thanks to the progress of vaccination campaigns and the drop in cases. In contrast, in India, restrictions were tightened as a result of the exponential rise in cases (see Figure 2.4), and the same happened in Brazil, Chile, and some European countries; although in the latter mobility rose again in recent weeks.
Figure 2.4 | Mobility index (7-day moving average) and social distancing measures stiffness index (-100 = maximum rigidity) of selected countries
2.2. Global economic recovery continues, but divergence between countries is accentuated
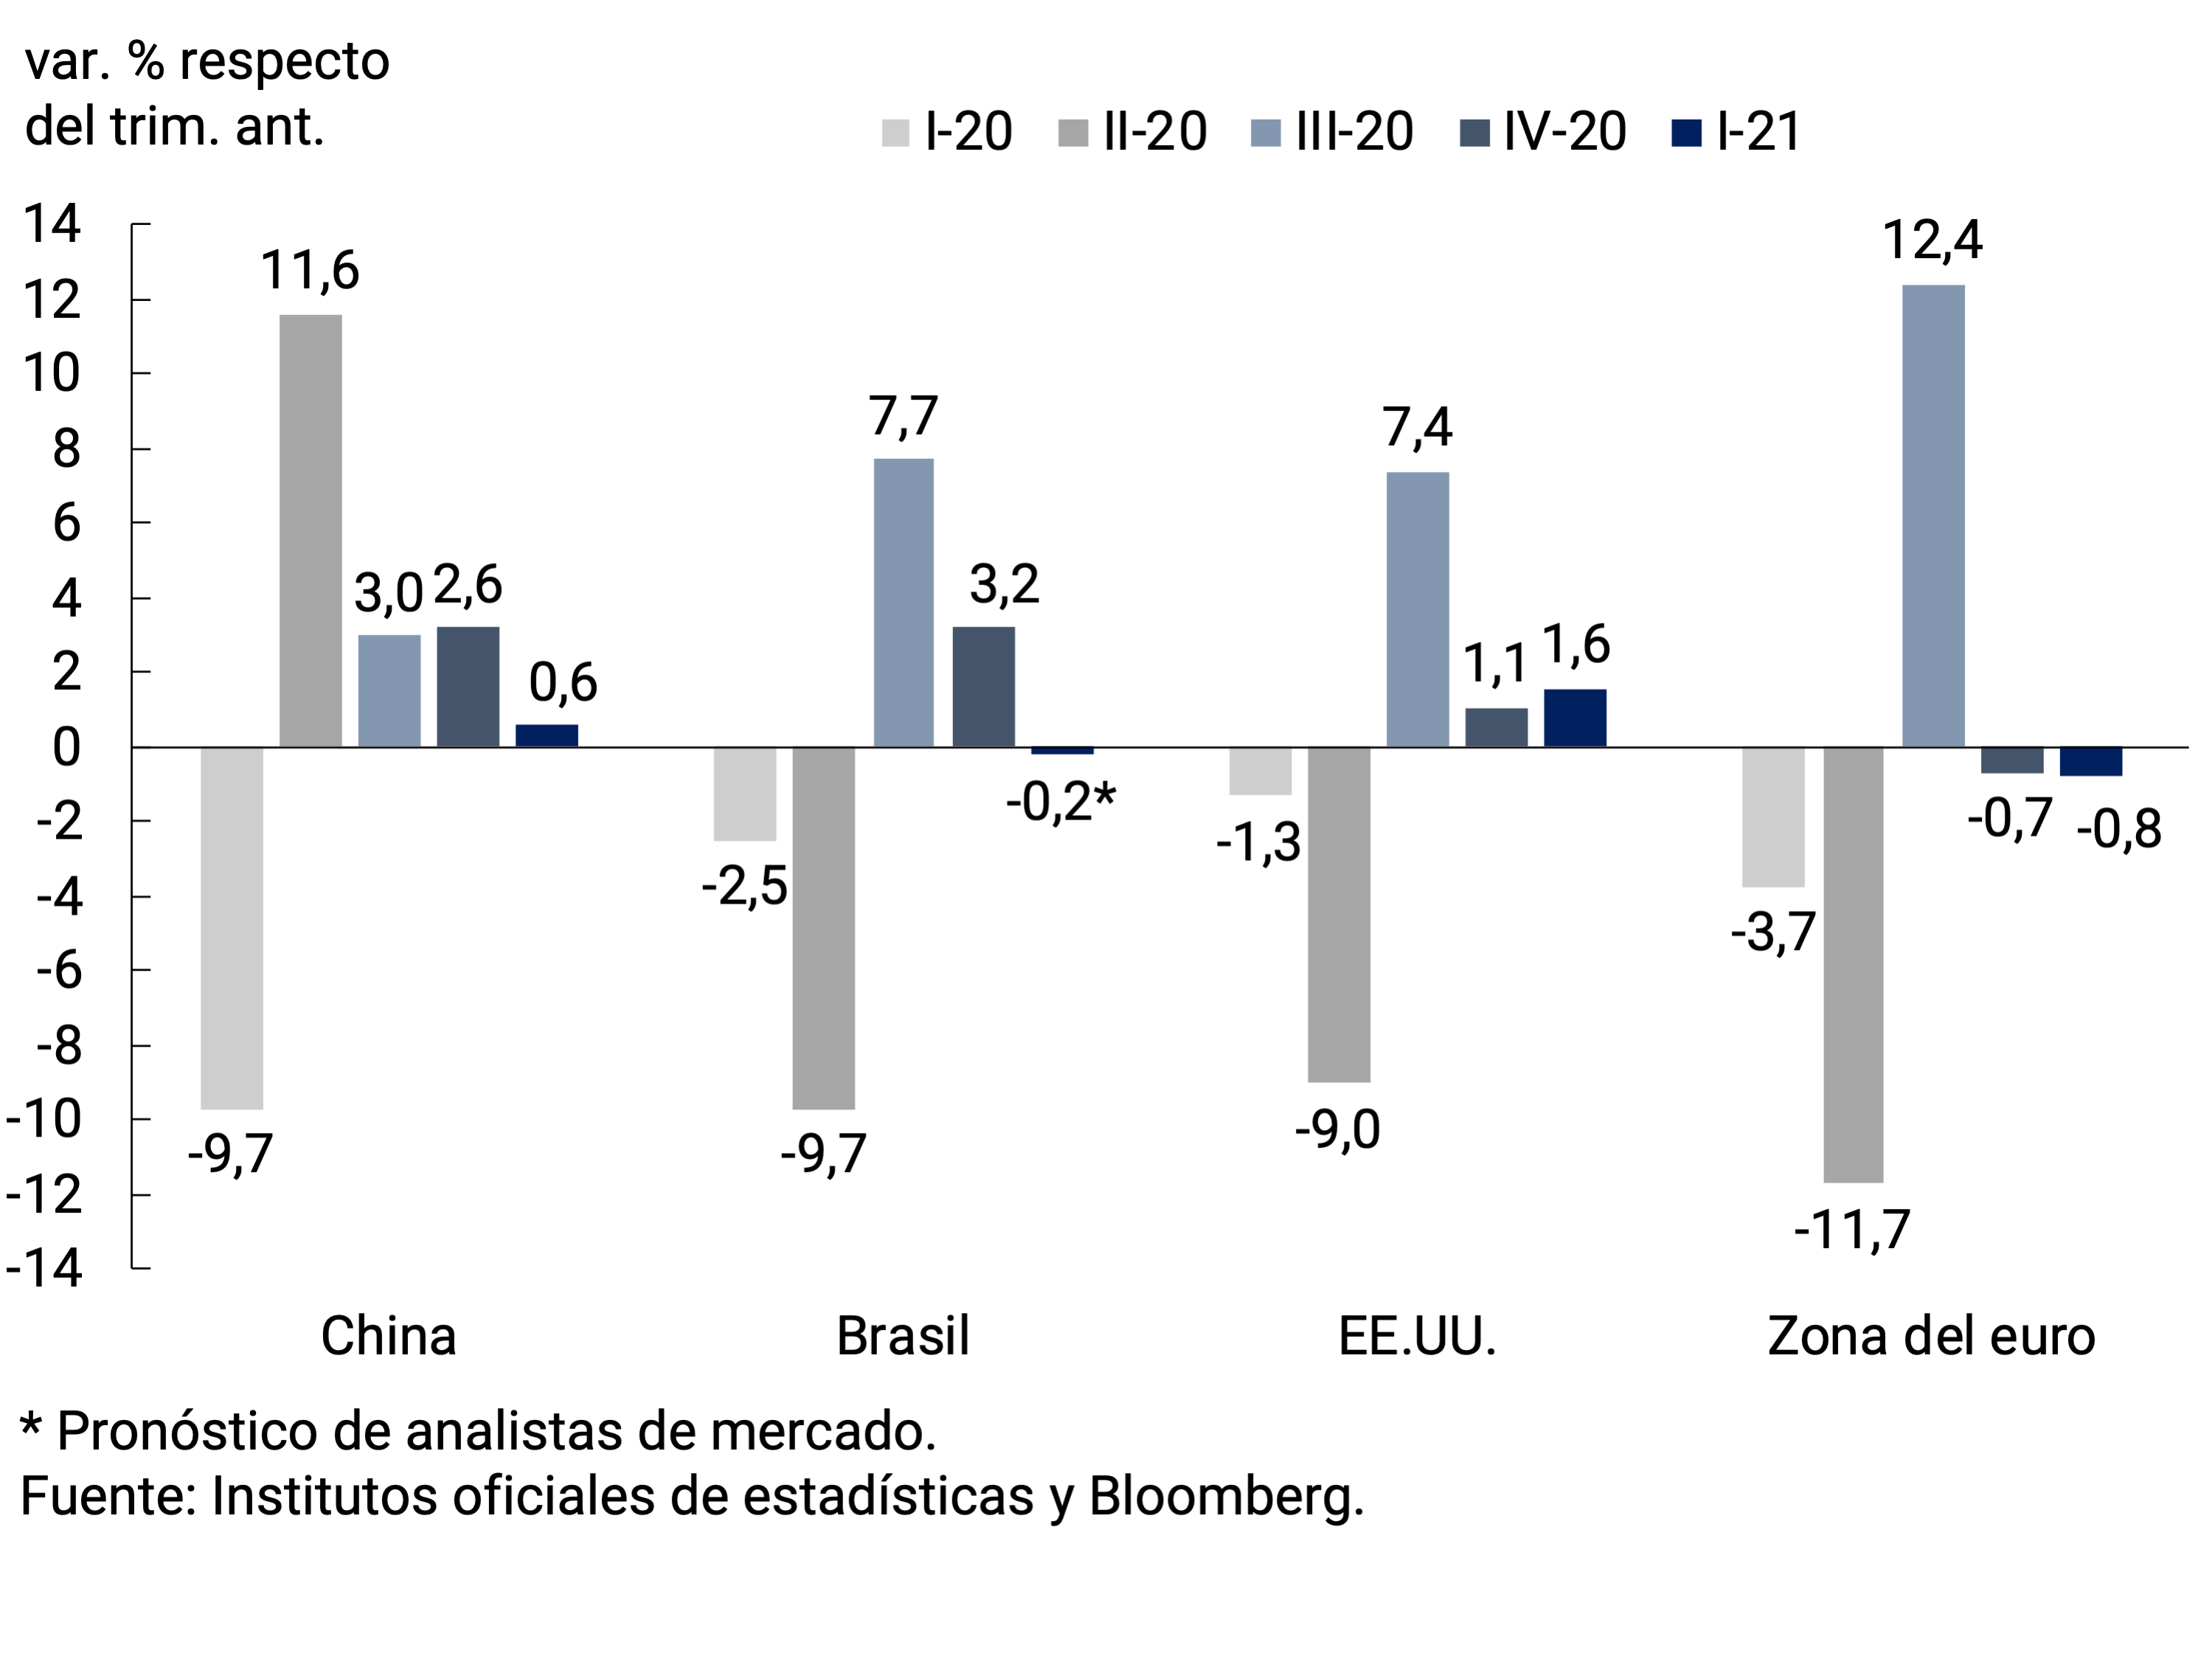
After the strong recovery in the level of activity in the third quarter of 2020 and the slowdown in the following quarter, activity still showed the uneven impact of outbreaks in many countries during the first quarter of 2021. In the first quarter of the year, there was a slight increase in the growth rate in the United States according to the advance estimate of GDP. On the other hand, China’s output went from growing 2.6% (quarterly, s.e.) in the fourth quarter of 2020, to 0.6% (quarterly, s.e.) in the first quarter of this year. As a result of the new wave of COVID-19 cases, the eurozone’s GDP fell by 0.8% (quarterly, s.e.), and Brazil’s would fall by 0.2% (quarterly, s.e., see Figure 2.5) in the first quarter of 2021.
Figure 2.5 | GDP evolution of Argentina’s main trading partners (without seasonality)
Based on high-frequency data and some forward-looking indicators, the level of global activity has accelerated slightly since February (see Figure 2.6). Bloomberg’s daily activity gauge resumed growth earlier that month. The global purchasing managers’ survey index (PMI), which also registered a slowdown in the fourth quarter, resumed a higher pace of growth since February, especially the services PMI, the most relegated due to the greater impact of the pandemic on this sector of the economy. In the euro area it has a similar performance, with a recovery in industry since February and to a lesser extent in services (whose index entered the “expansion zone” in April). Retail sales have also begun to recover in this region since February. In the United States, the PMI also shows a similar behavior, but with a more homogeneous recovery between industry and services.
Figure 2.6
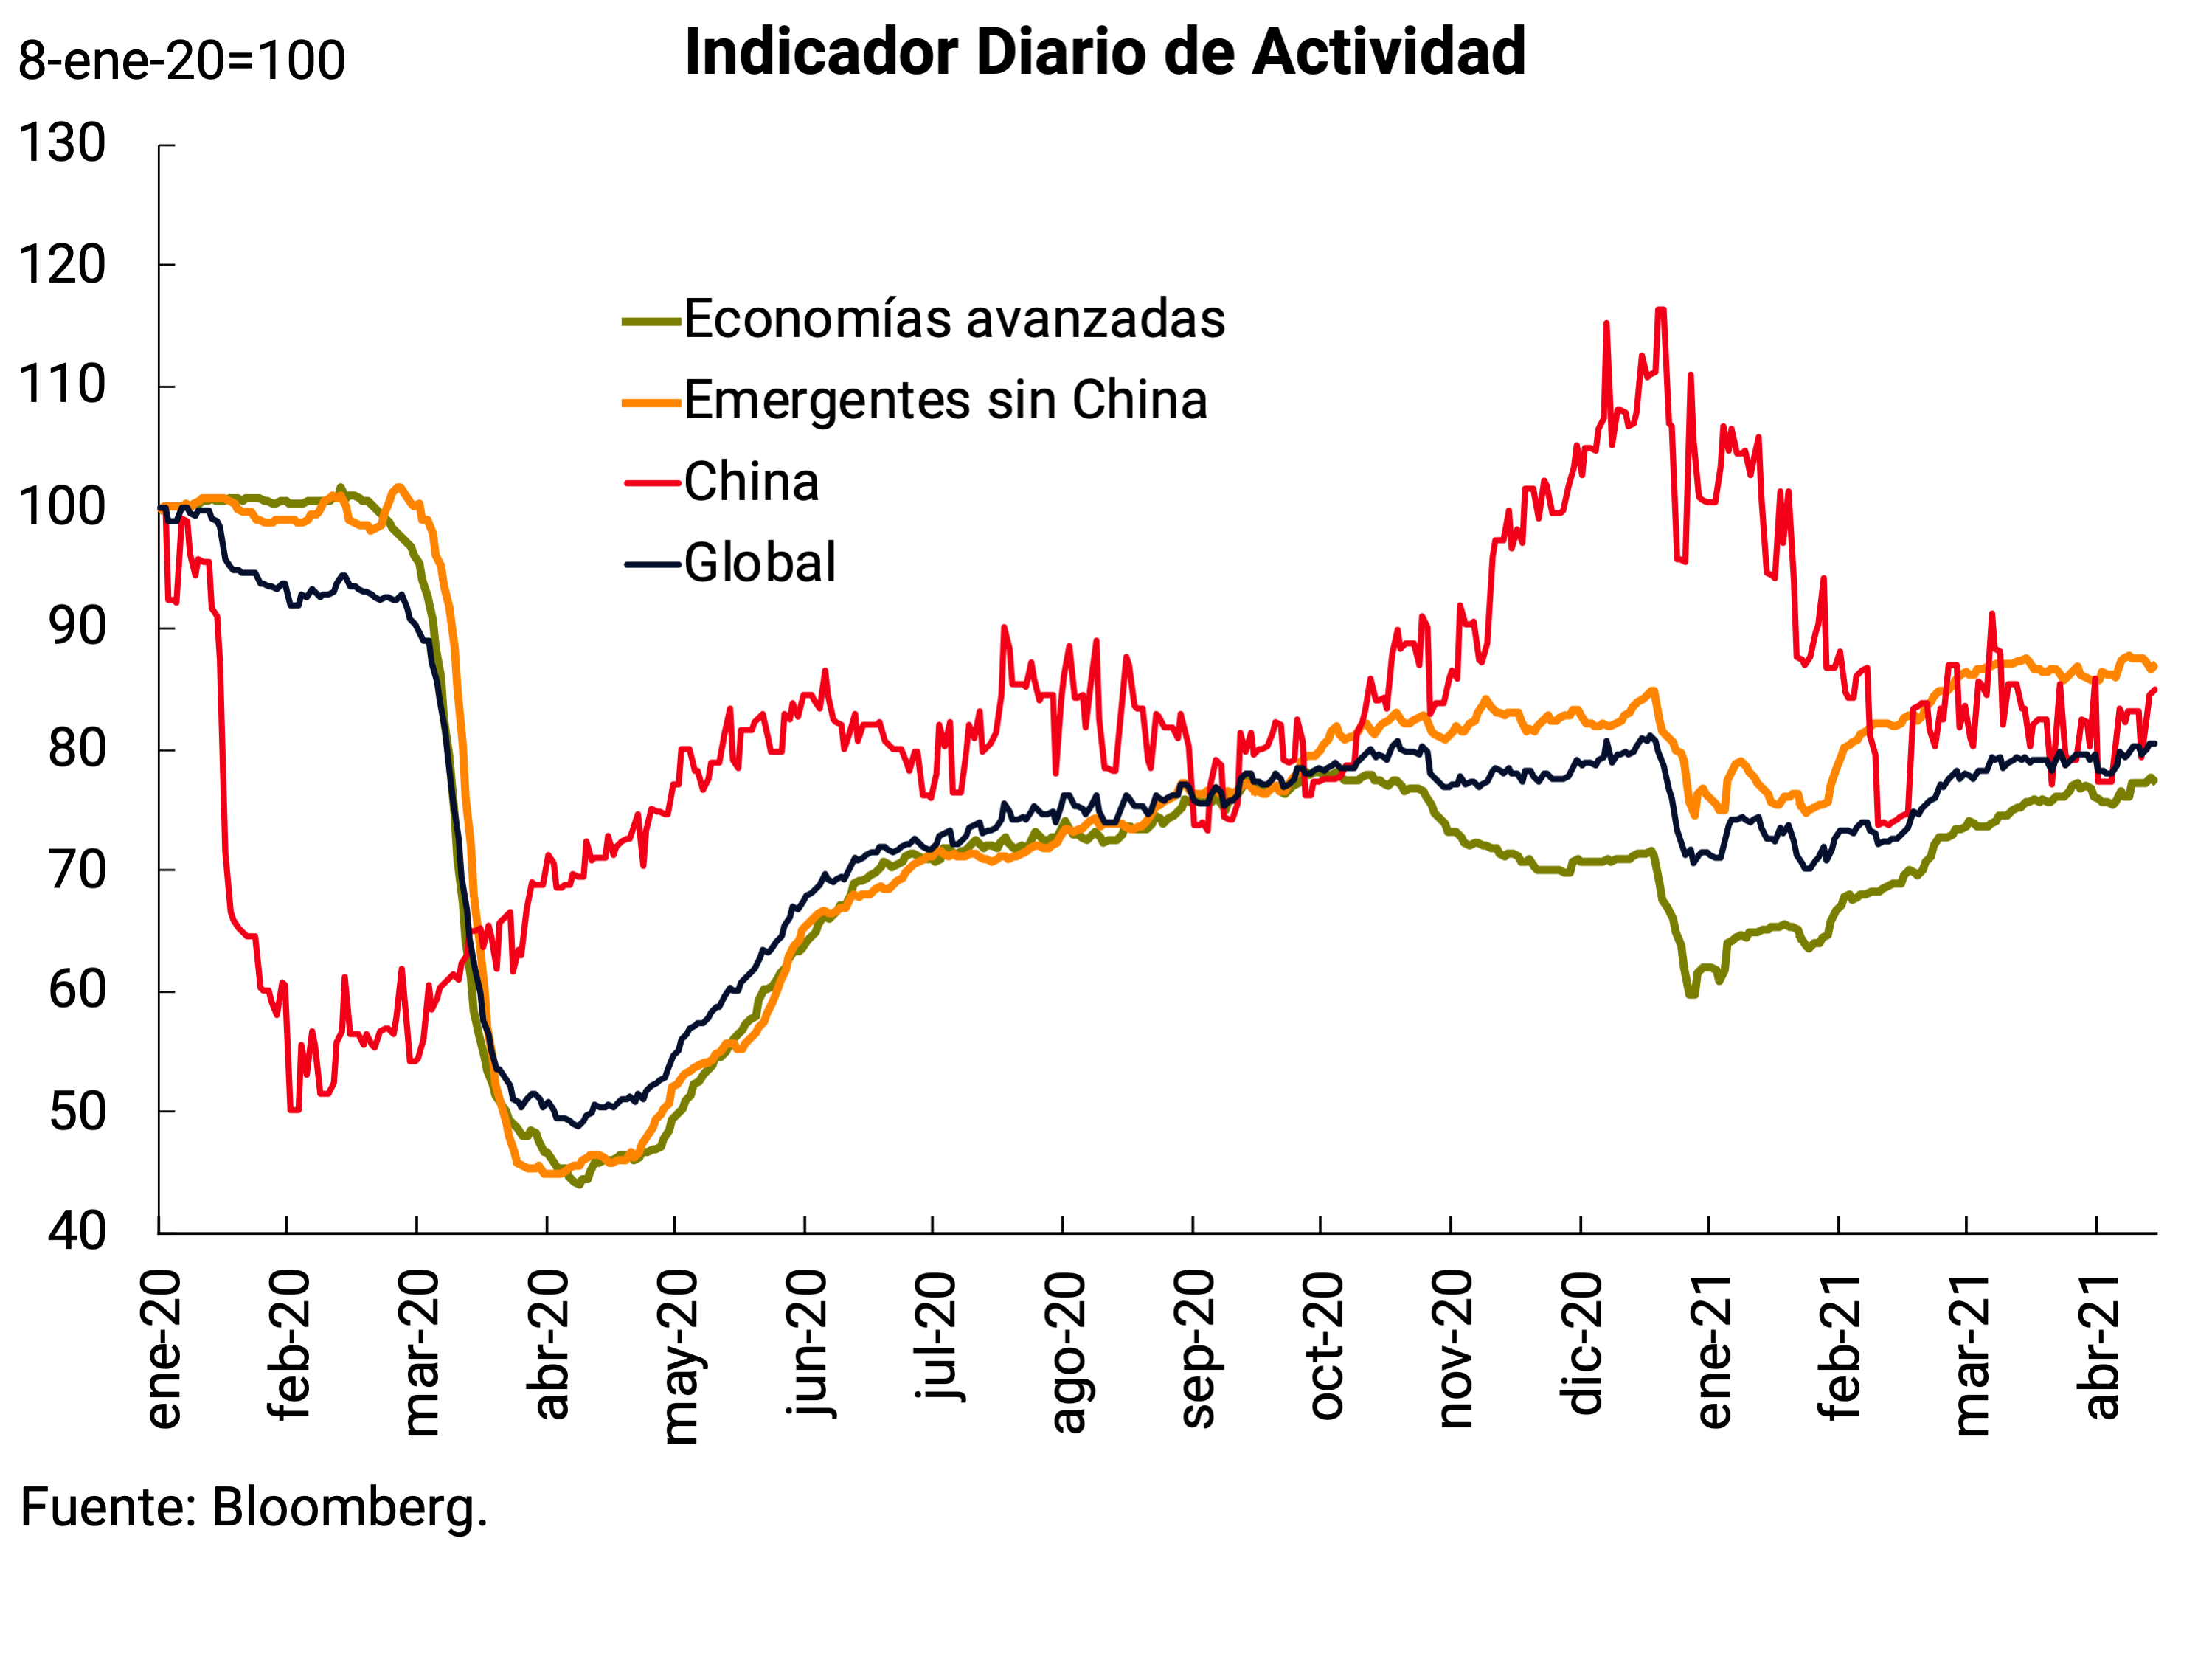
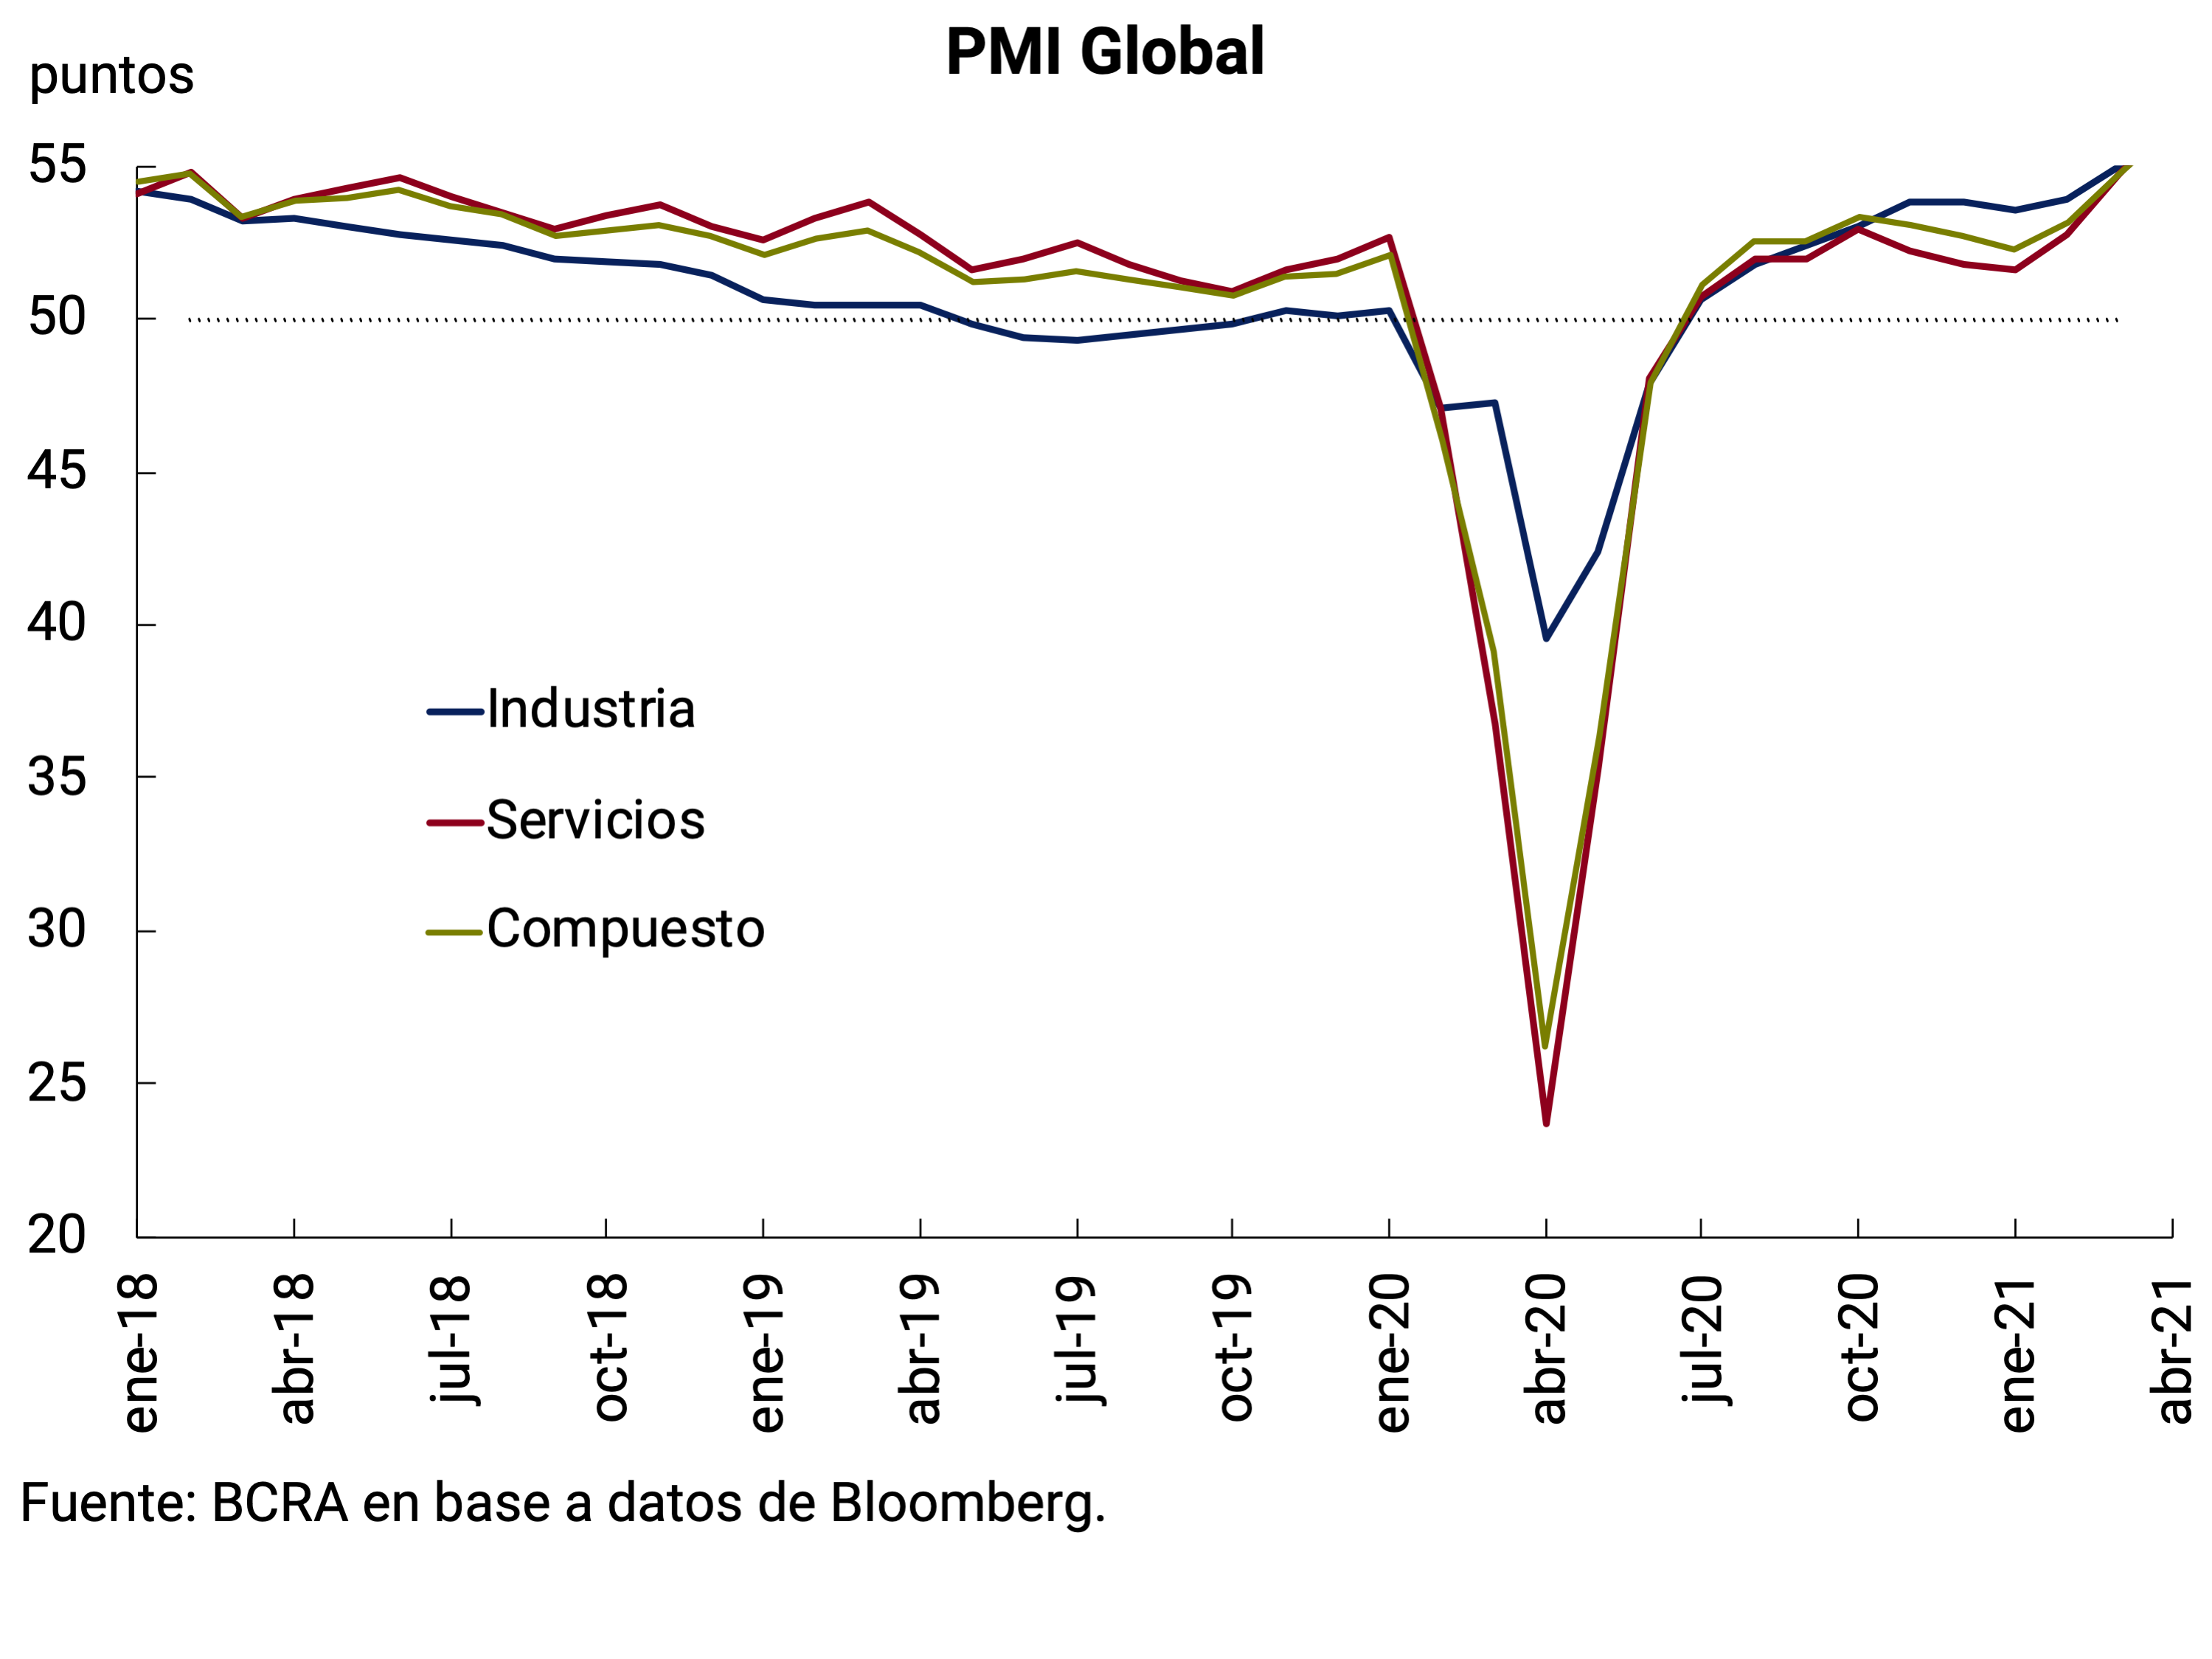
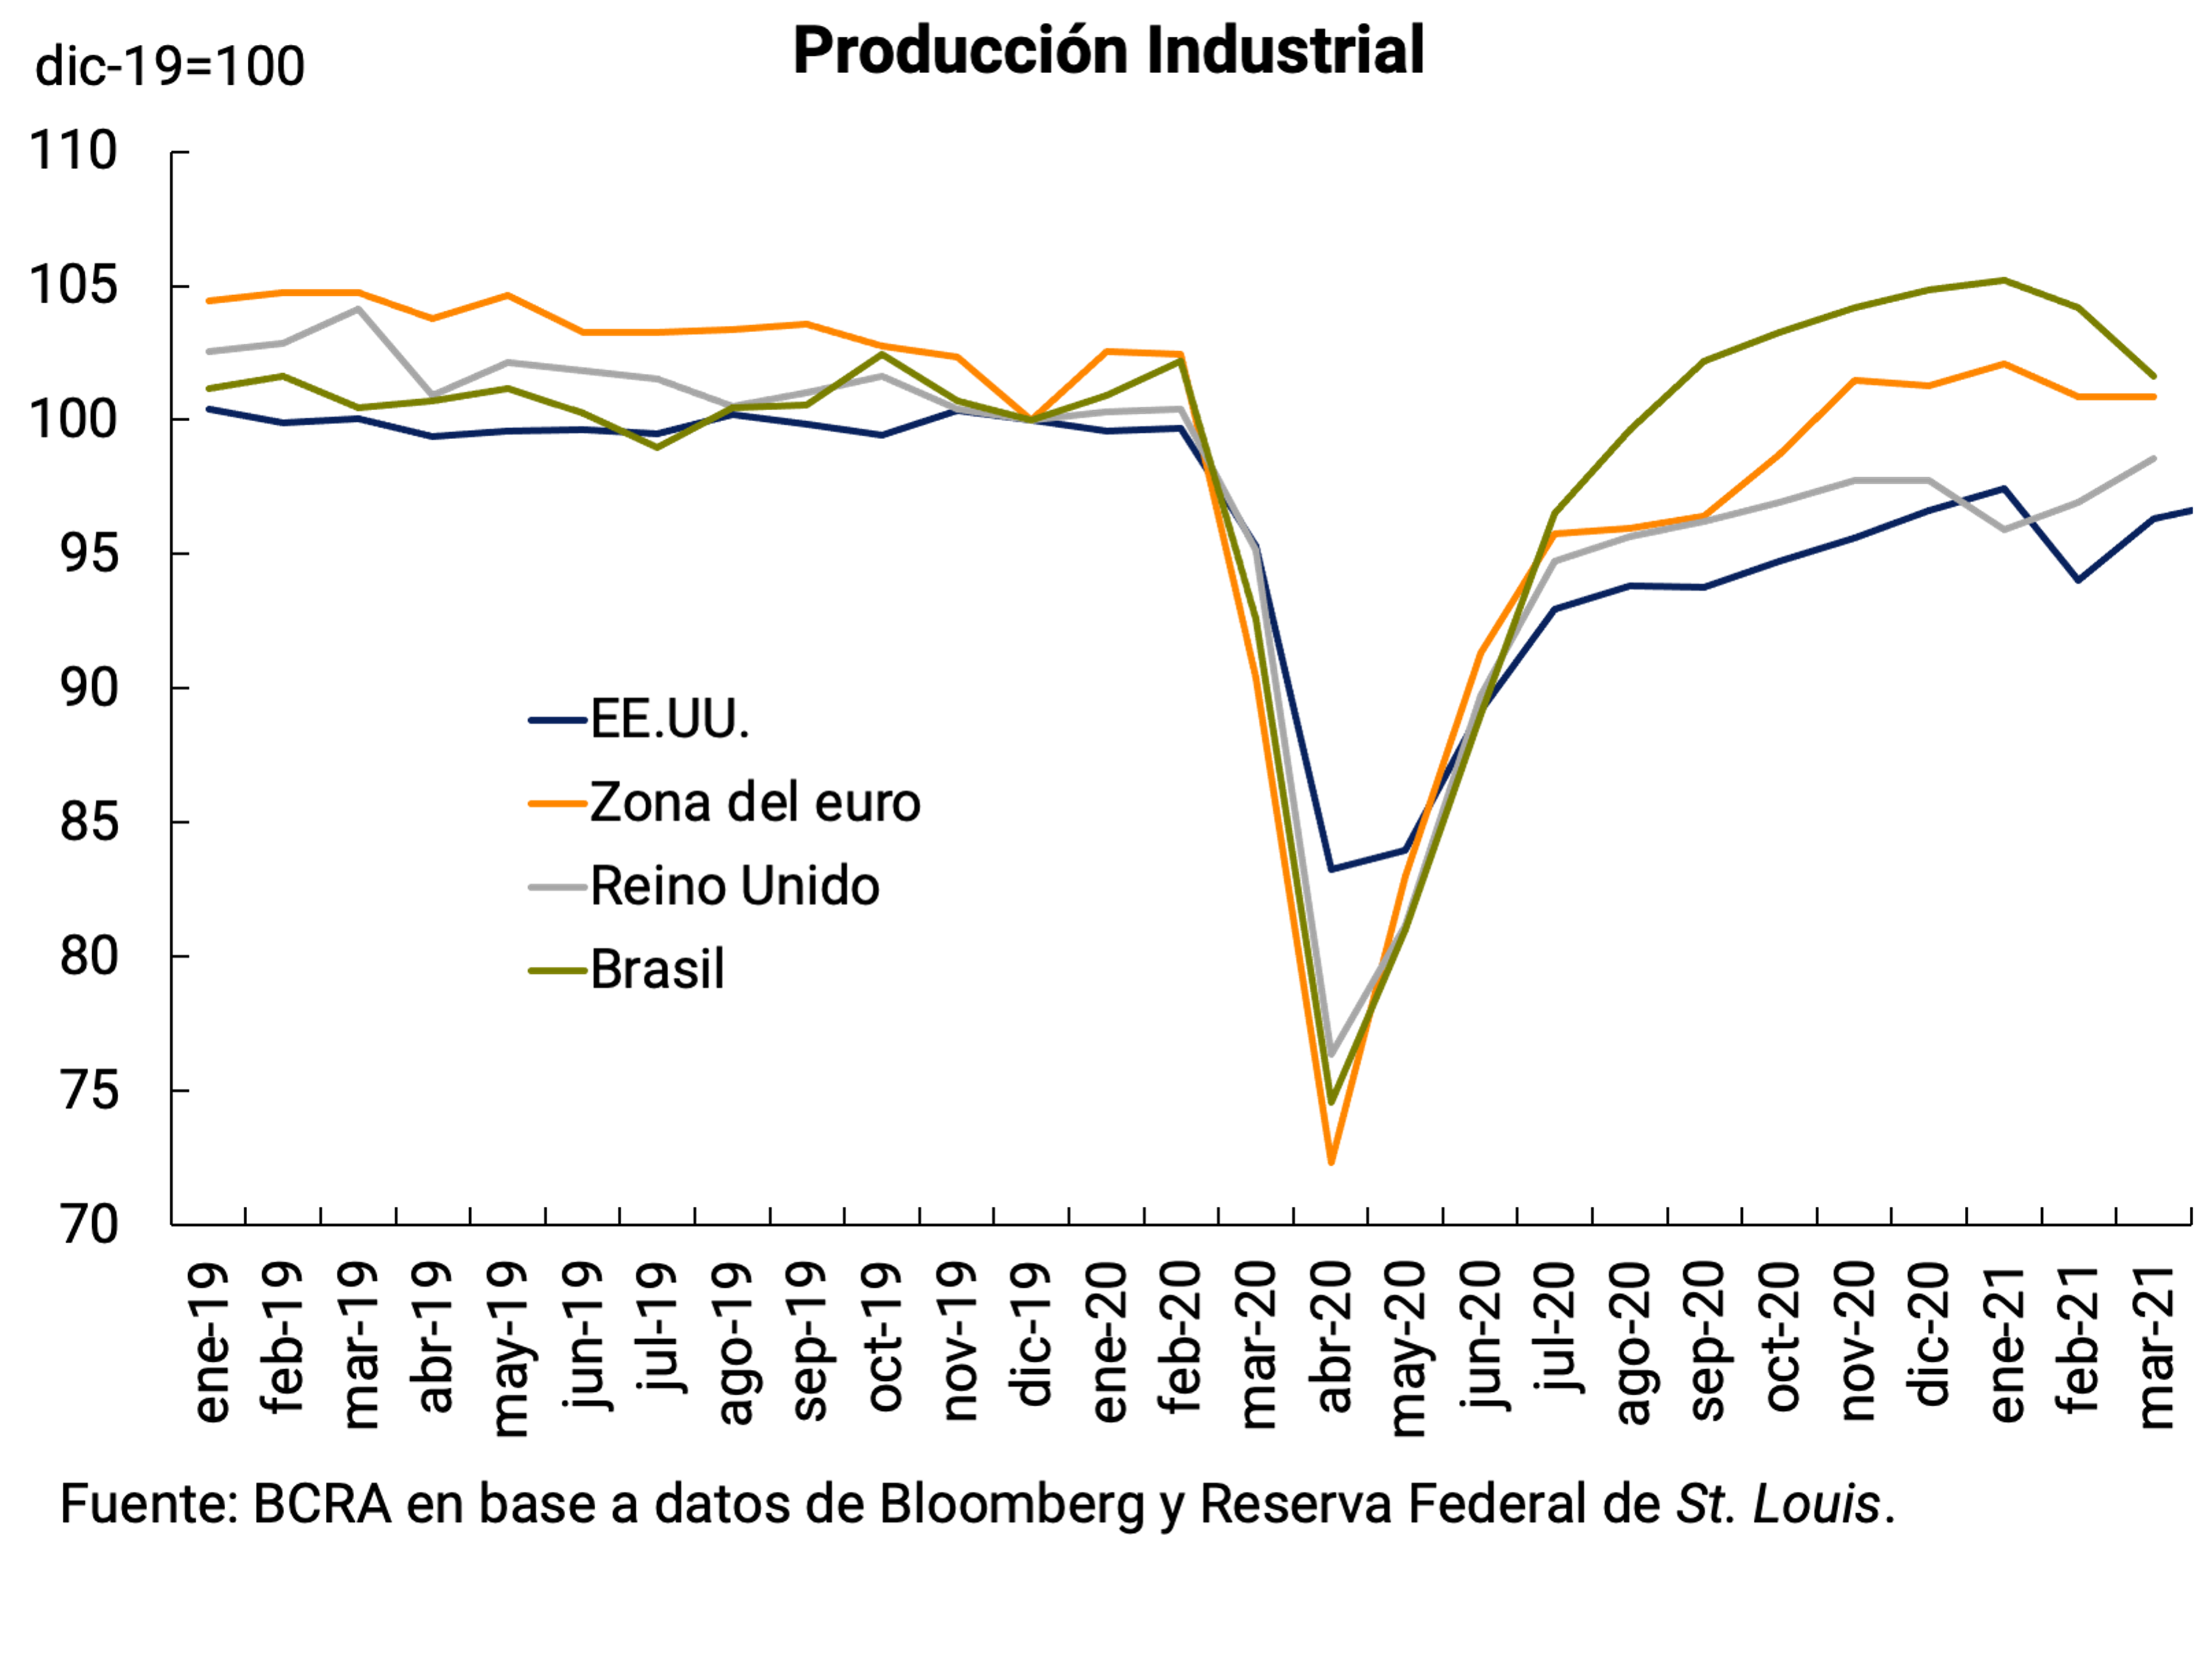
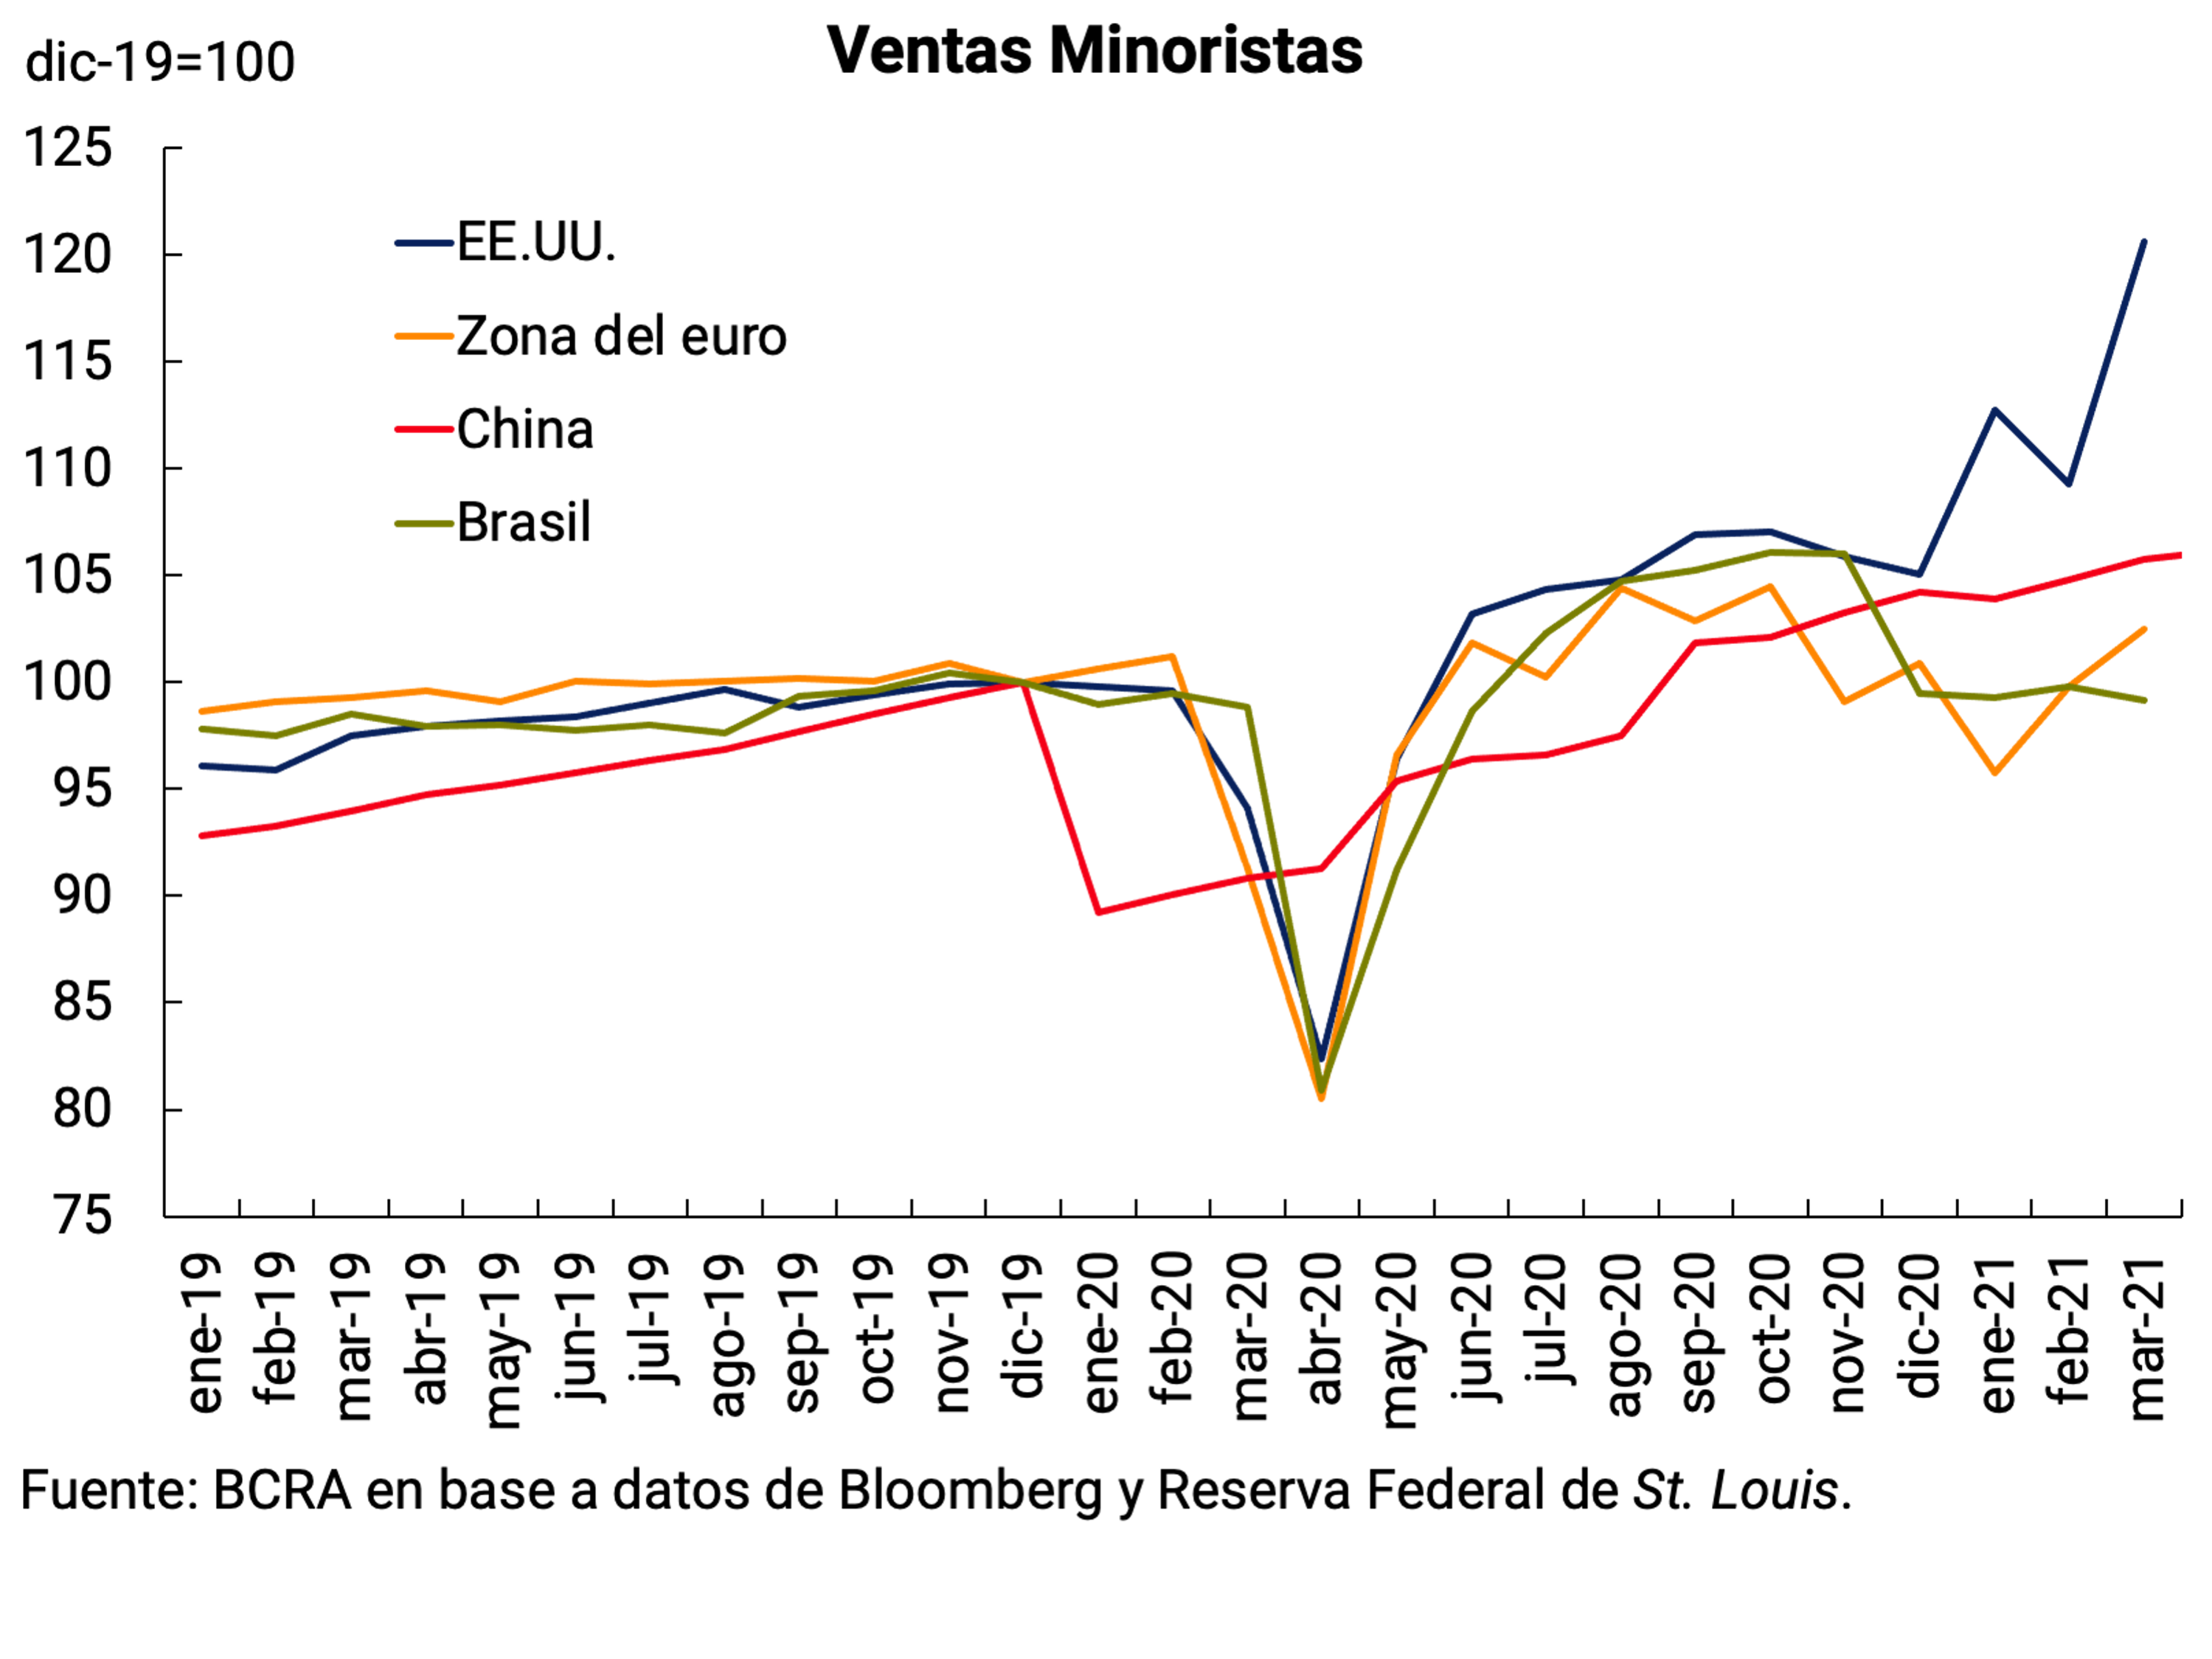
Two trading partners of Argentina with a different dynamic compared to the rest are Brazil and China. In Brazil (see Box. Brazil), there were lower values of the PMI indices from November 2020 onwards, along with a fall in retail sales, (which seems to have stopped since January of this year). In China, there has been a fall in the PMI since December, but with a slight rebound in March for services and in April for industry. In contrast, China’s retail sales continue to grow from the lows recorded in January 2020.
Growth forecasts for the world economy have been revised upwards in view of the progress of vaccination campaigns and the continuity of monetary and fiscal support policies, (among which the fiscal package recently approved in the United States stands out; see Table 2.1); and in line with world trade, which has exceeded the pre-pandemic volume. The IMF now forecasts a growth of the world economy of 6% in 2021, 0.5 p.p. above what was projected in January. GDP growth projections for advanced economies were also improved to 5.1% (+0.8 p.p.), and for emerging economies to 6.7% (+0.4 p.p.). The recovery is also divergent across groups of countries. Developing economies, in general, would take longer than advanced economies to reach pre-pandemic GDP levels, due to less policy space and greater difficulties in accessing vaccines, which would create wider gaps between these countries’ living standards (see Figure 2.7). A risk linked to faster growth in advanced economies is that it will lead to higher interest rates in advanced economies, which will end up affecting the recovery of developing countries.
Table 2.1 | Economic projections (GDP growth in %)
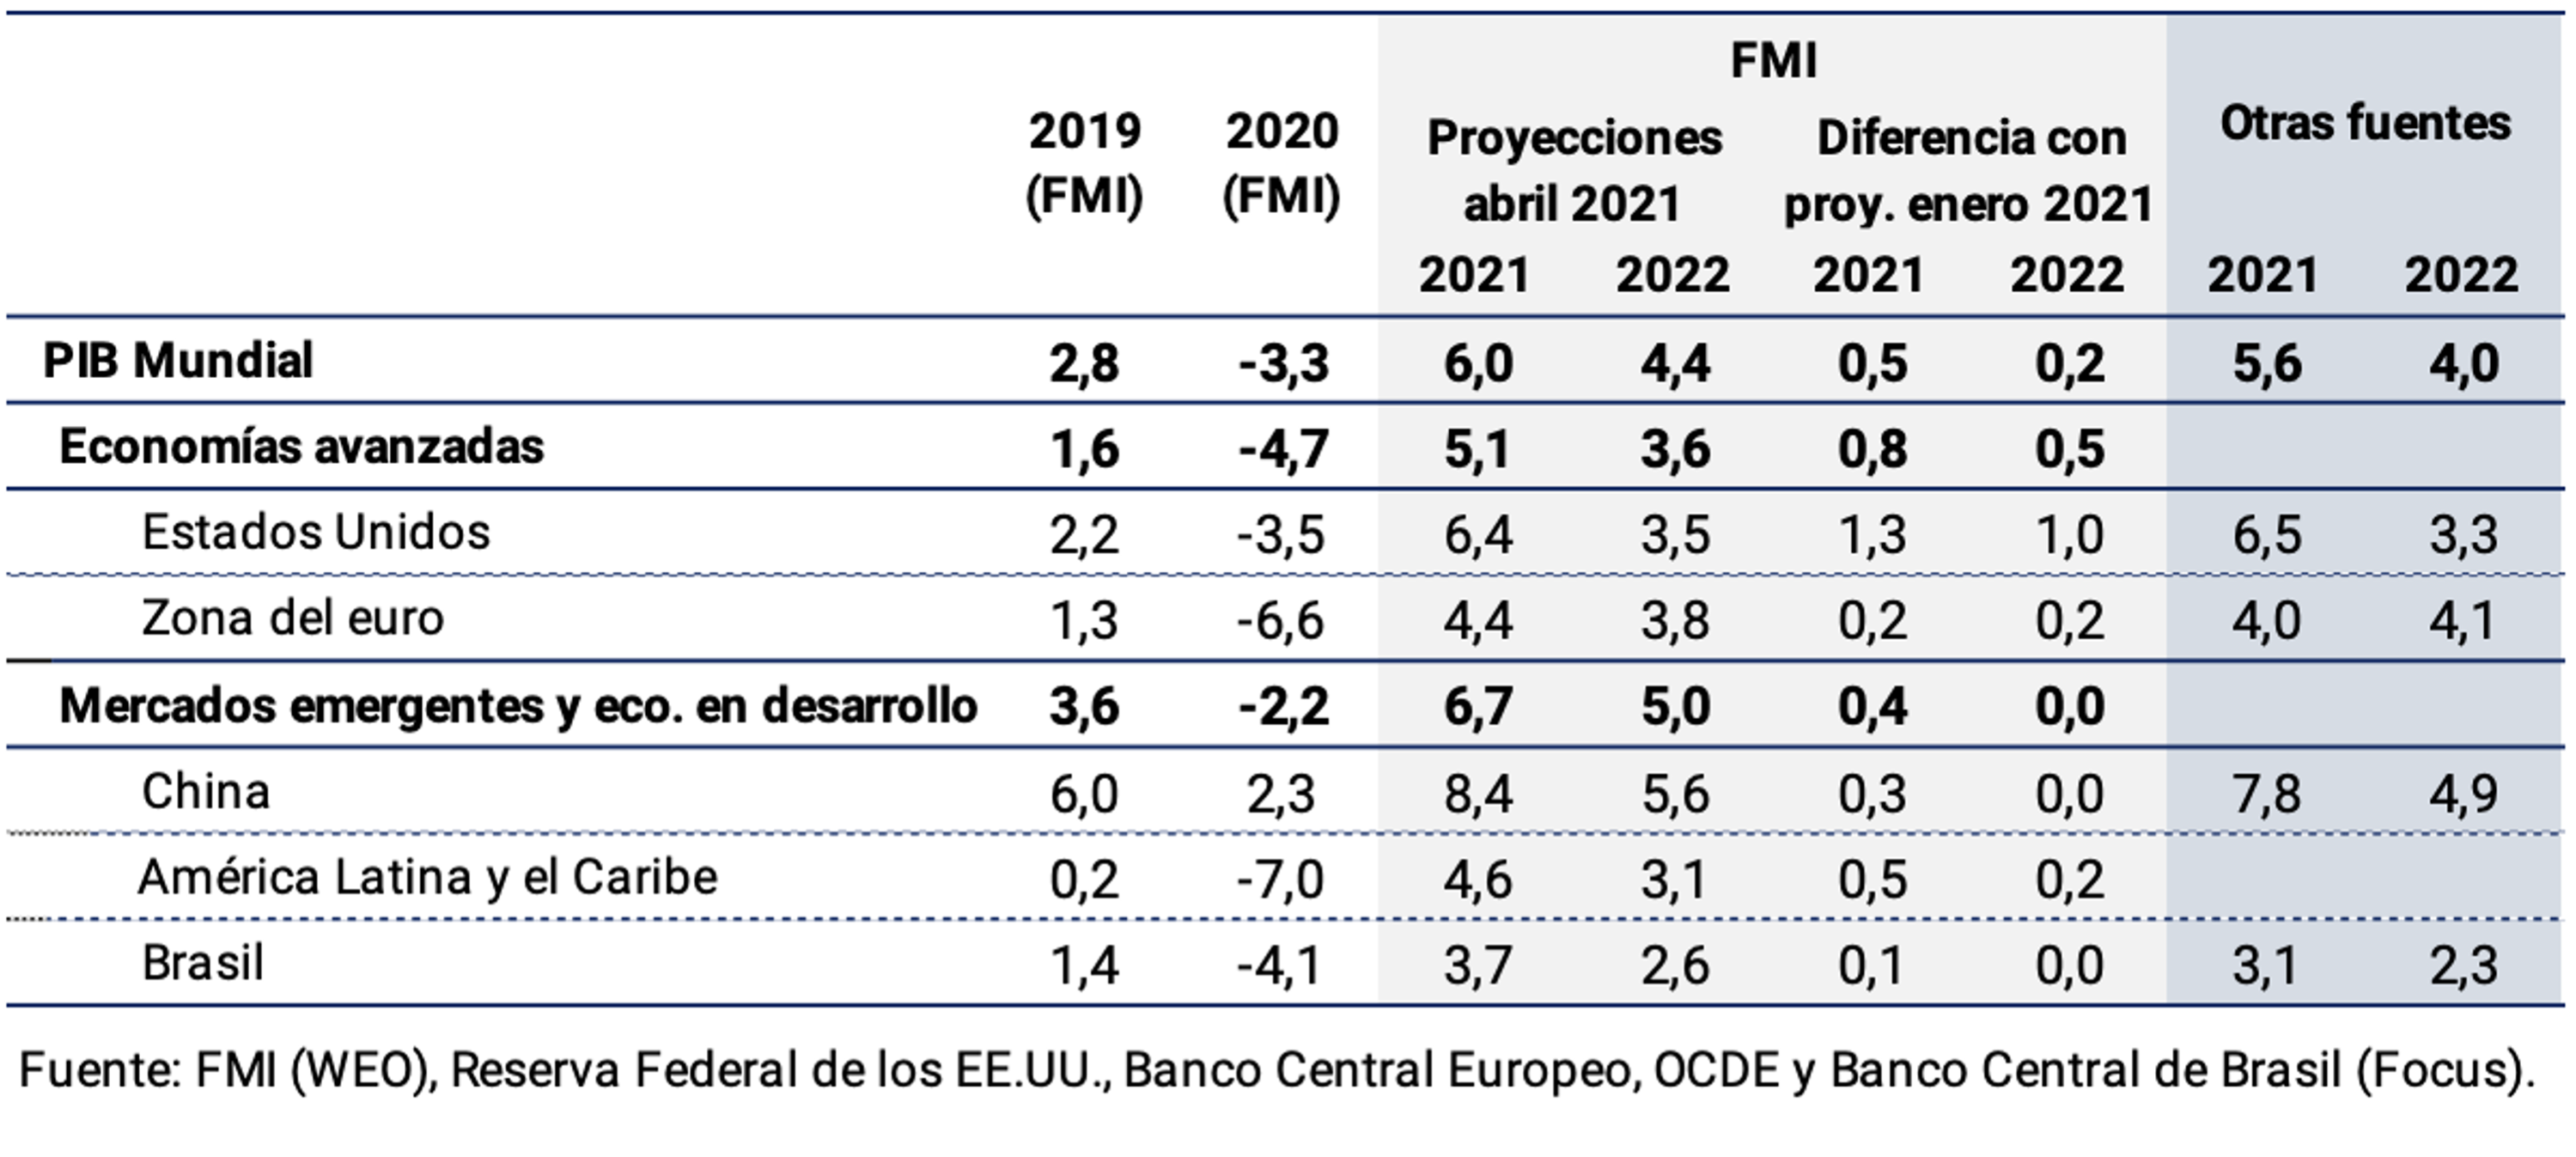
Figure 2.7 | Evolution of GDP per capita by region compared to pre-pandemic trends
Box. Brazil
In Argentina’s main trading partner, there are signs that would limit the space for fiscal and monetary policies to sustain the recovery. Inflation accelerated in recent months: in April, consumer prices (HICP) increased 6.8% year-on-year, above the central bank’s target of 3.75% ± 1.5, and with significant food increases. Although it is the second consecutive measurement to exceed the upper limit, inflation is above the average value of 3.75% since October last year. Wholesale prices, driven by increases in commodity prices and exchange rate depreciation, are rising well above inflation. The headline producer price index (PPI) stood at 33.52% year-on-year in March and has been in double digits since July last year (see Figure 2.8a). These increases in wholesale prices have largely not yet been passed on to retailers. Although long-term inflation expectations are in line with the target, the monetary policy committee reacted with two hikes, of 75 basis points (bps) each, in its policy rate (Selic), leaving it at 3.50%, and announcing that it expects a new adjustment of the same magnitude for the next meeting.
Figure 2.8 | (a) Retail and wholesale inflation in Brazil
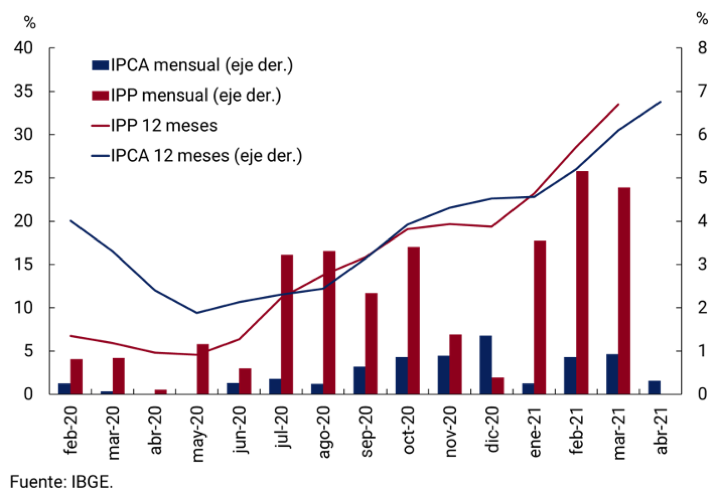
Figure 2.8 | (b) Fiscal Result and Public Debt in Brazil
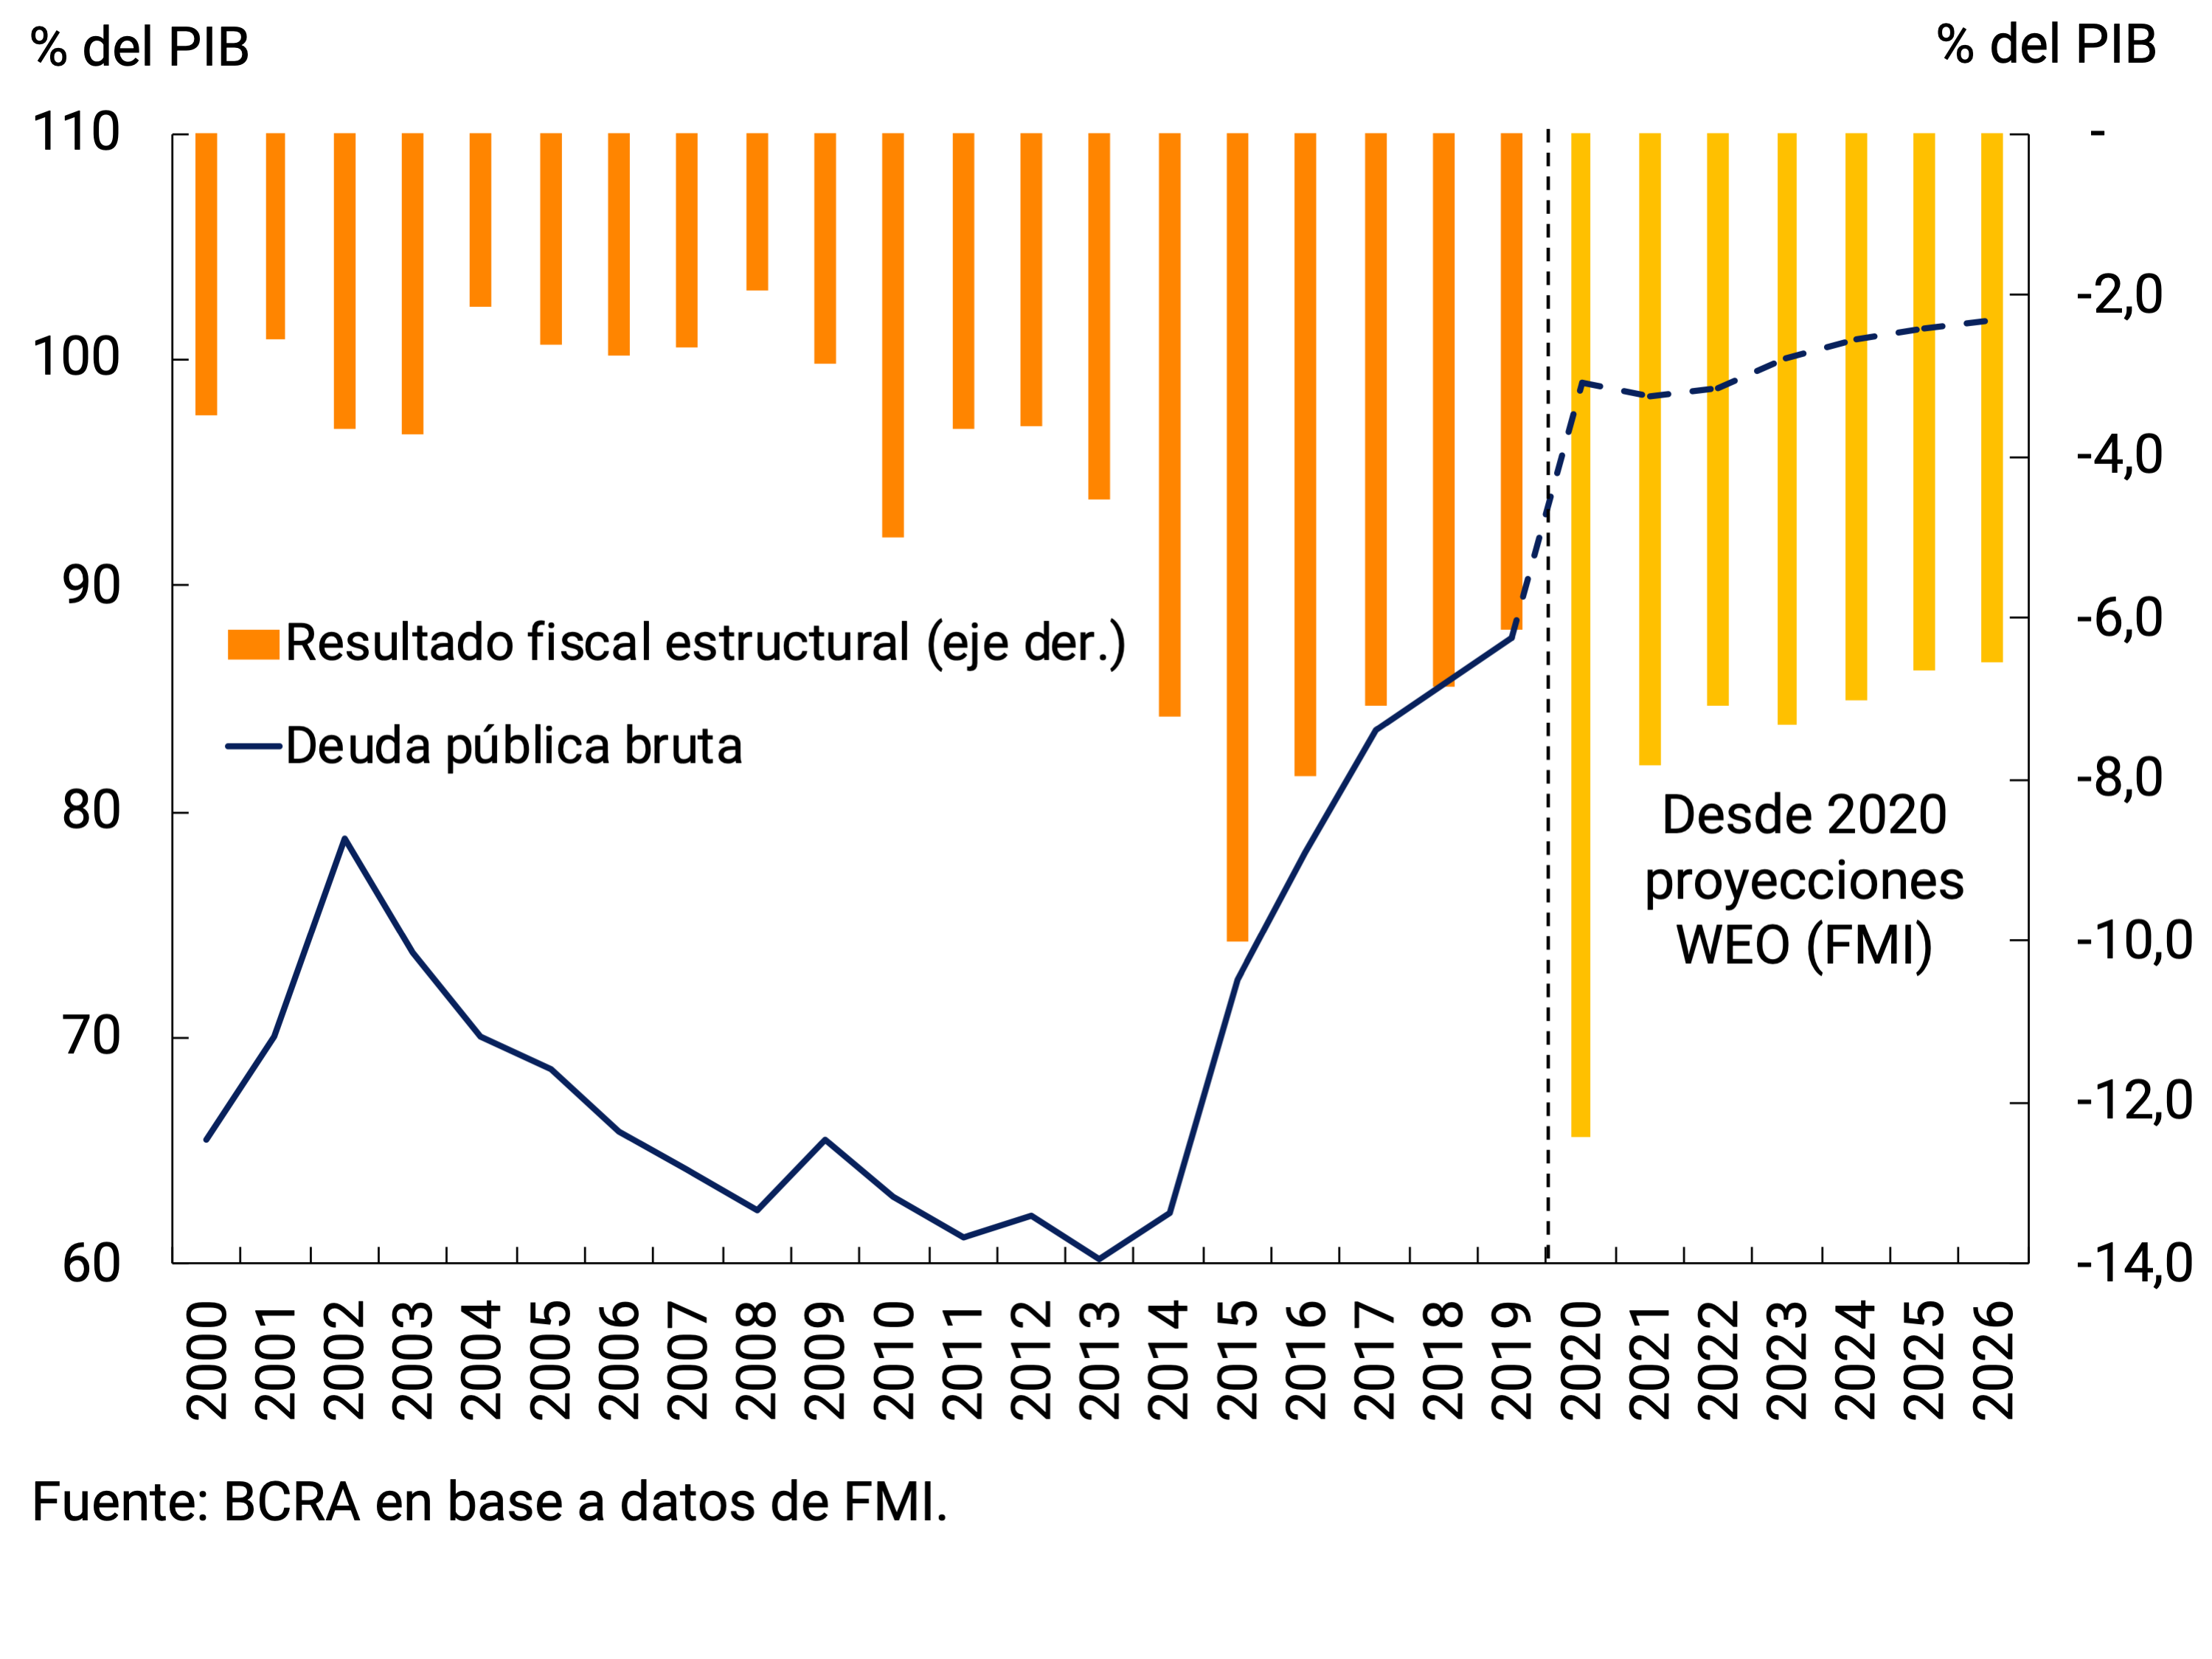
The process of structural reforms and fiscal consolidation initiated in Brazil before the pandemic also presupposes a contractionary fiscal policy. The structural fiscal deficit (according to IMF calculations) reached 12.4% of GDP this year in the face of the stimulus measures implemented to deal with the pandemic, interrupting a decline that had taken it from 10% in 2015 to 6.1% in 2019. Public debt to GDP reached 99% this year. The IMF expects the fiscal deficit to remain above 7% through 2024, with debt exceeding 101% of GDP (see Figure 2.8b). The need to reduce the fiscal deficit is difficult in the face of the serious economic and social situation due to the impact of the pandemic. In addition, with 46% of the debt indexed to the Selic rate, attempts to control inflation would worsen the fiscal result; interest expenditure increases by approximately 0.4% of GDP for each percentage point increase in the interest rate. The lower fiscal and monetary stimulus and the possibility of reduced investor appetite for the fiscal situation represent risks to the strength of the economic recovery.
2.3. Financial markets: higher long-term interest rates
One of the risks to international financial conditions is the increase in interest rates in advanced countries. Since the middle of last year, medium- and long-term interest rates in the United States have increased, and they are expected to continue to do so in the coming months. This is mainly due to an improving economic outlook for that country, but also to a higher expected inflation rate and more uncertainty about the economic and political outlook. For the time being, the steepening of the yield curve (higher increase in long interest rates than in short ones) seems to have stopped and partially reversed. Although rates are still low by historical averages, surprise hikes can generate volatility in financial markets. An example of this was the increase at the end of March, which generated turbulence and uncertainty, and in which the 10-year rate reached a peak of 1.74%. In the following weeks, rates fell, although they were 26 and 72 bps above the previous IPOM close and at the end of 2020, respectively. Just as the process of raising rates had occurred together with an appreciation of the dollar, when rates fell, the U.S. currency also depreciated (see Figure 2.9a).
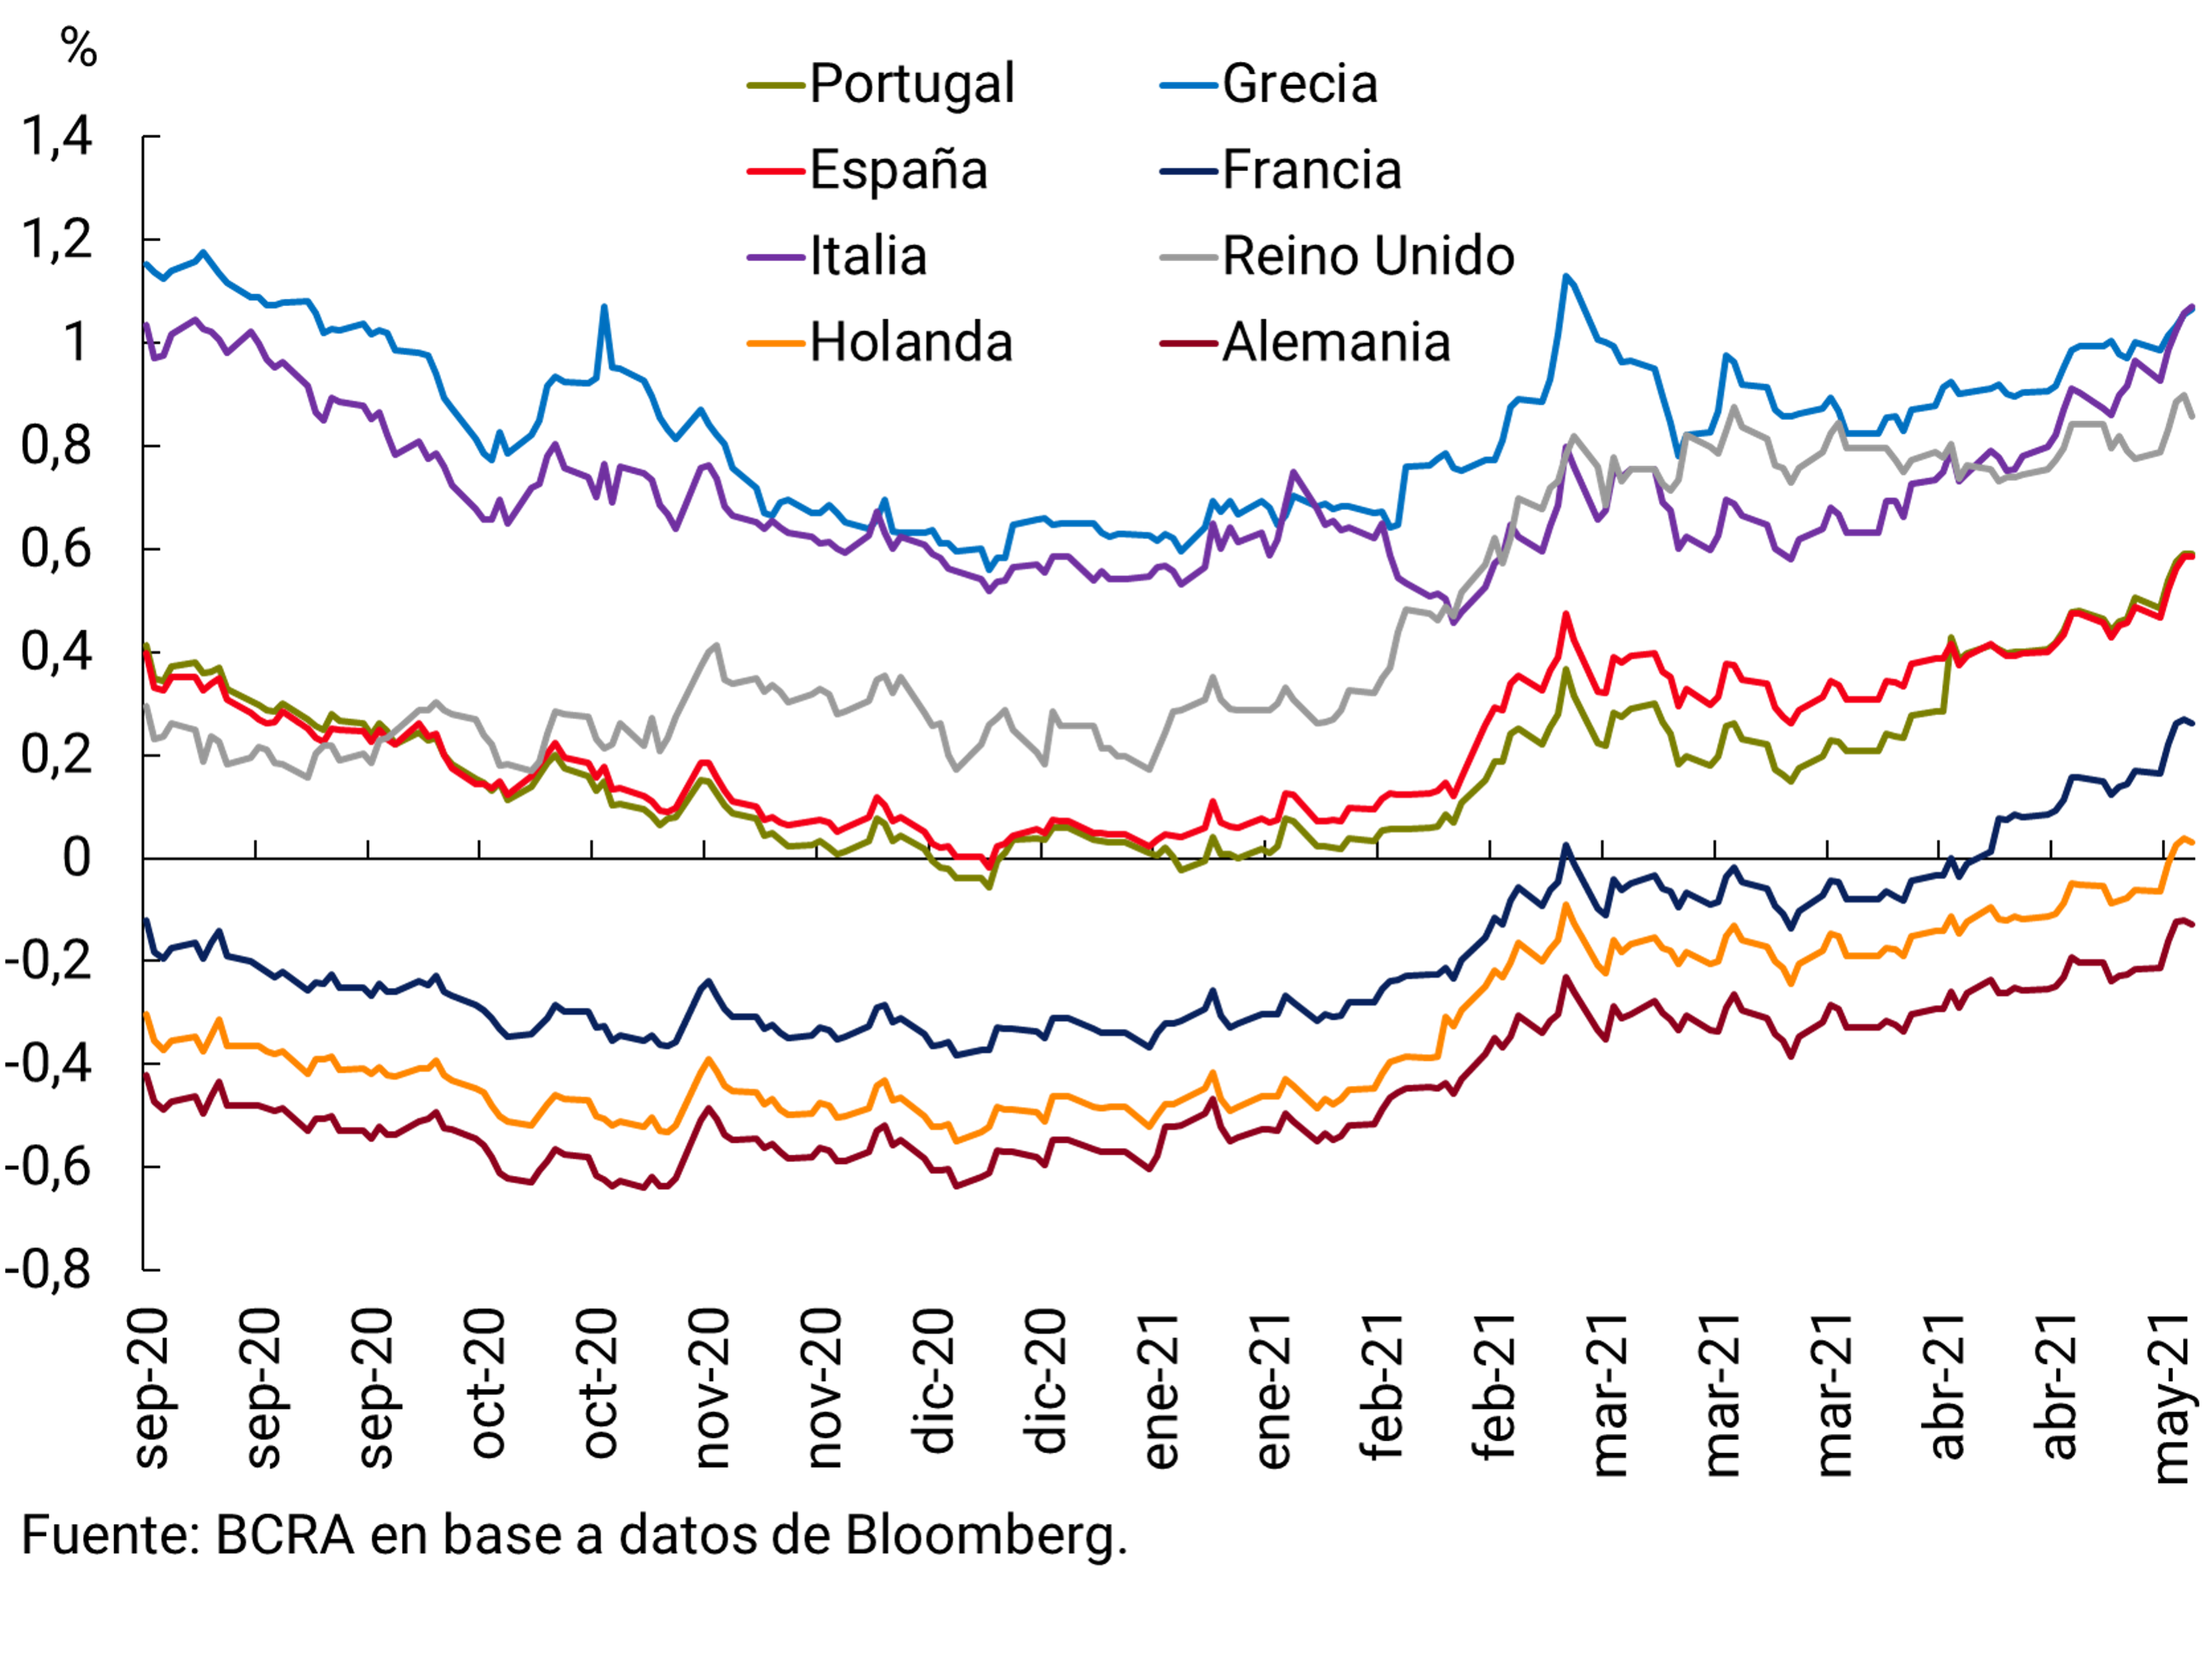
The yields on government bonds of European countries partially reversed the increase at the beginning of the year in March, among other reasons due to the clear signs of continuity of the asset purchase program by the European Central Bank. In recent weeks, European bond rates have risen again, although they have accumulated a lower rise than US bonds this year. Thus, rates have risen by an average of 52 bps since the beginning of the year and 30 bps since the close of the last IPOM (see Figure 2.9b).
Figure 2.9 | (a) U.S. Government Bond Yields and Dollar

Index Figure 2.9 | (b) Interest rate on 10-year European government bonds
Equity markets continued to perform well. Although the increases in the last quarter were not excessive (both the S&P 500 in the United States and the European Stoxx 50 increased by about 8% since the close of the previous IPOM, see Figure 2.10a), when we take into account the last year and so far this year, the strength in prices is still surprising given the context of economic activity. For example, the S&P 500 is up 29% since the end of 2019, a significant rise considering the economic effects of the pandemic. The disconnect between the boom in the financial markets and the performance of the economy is still present.
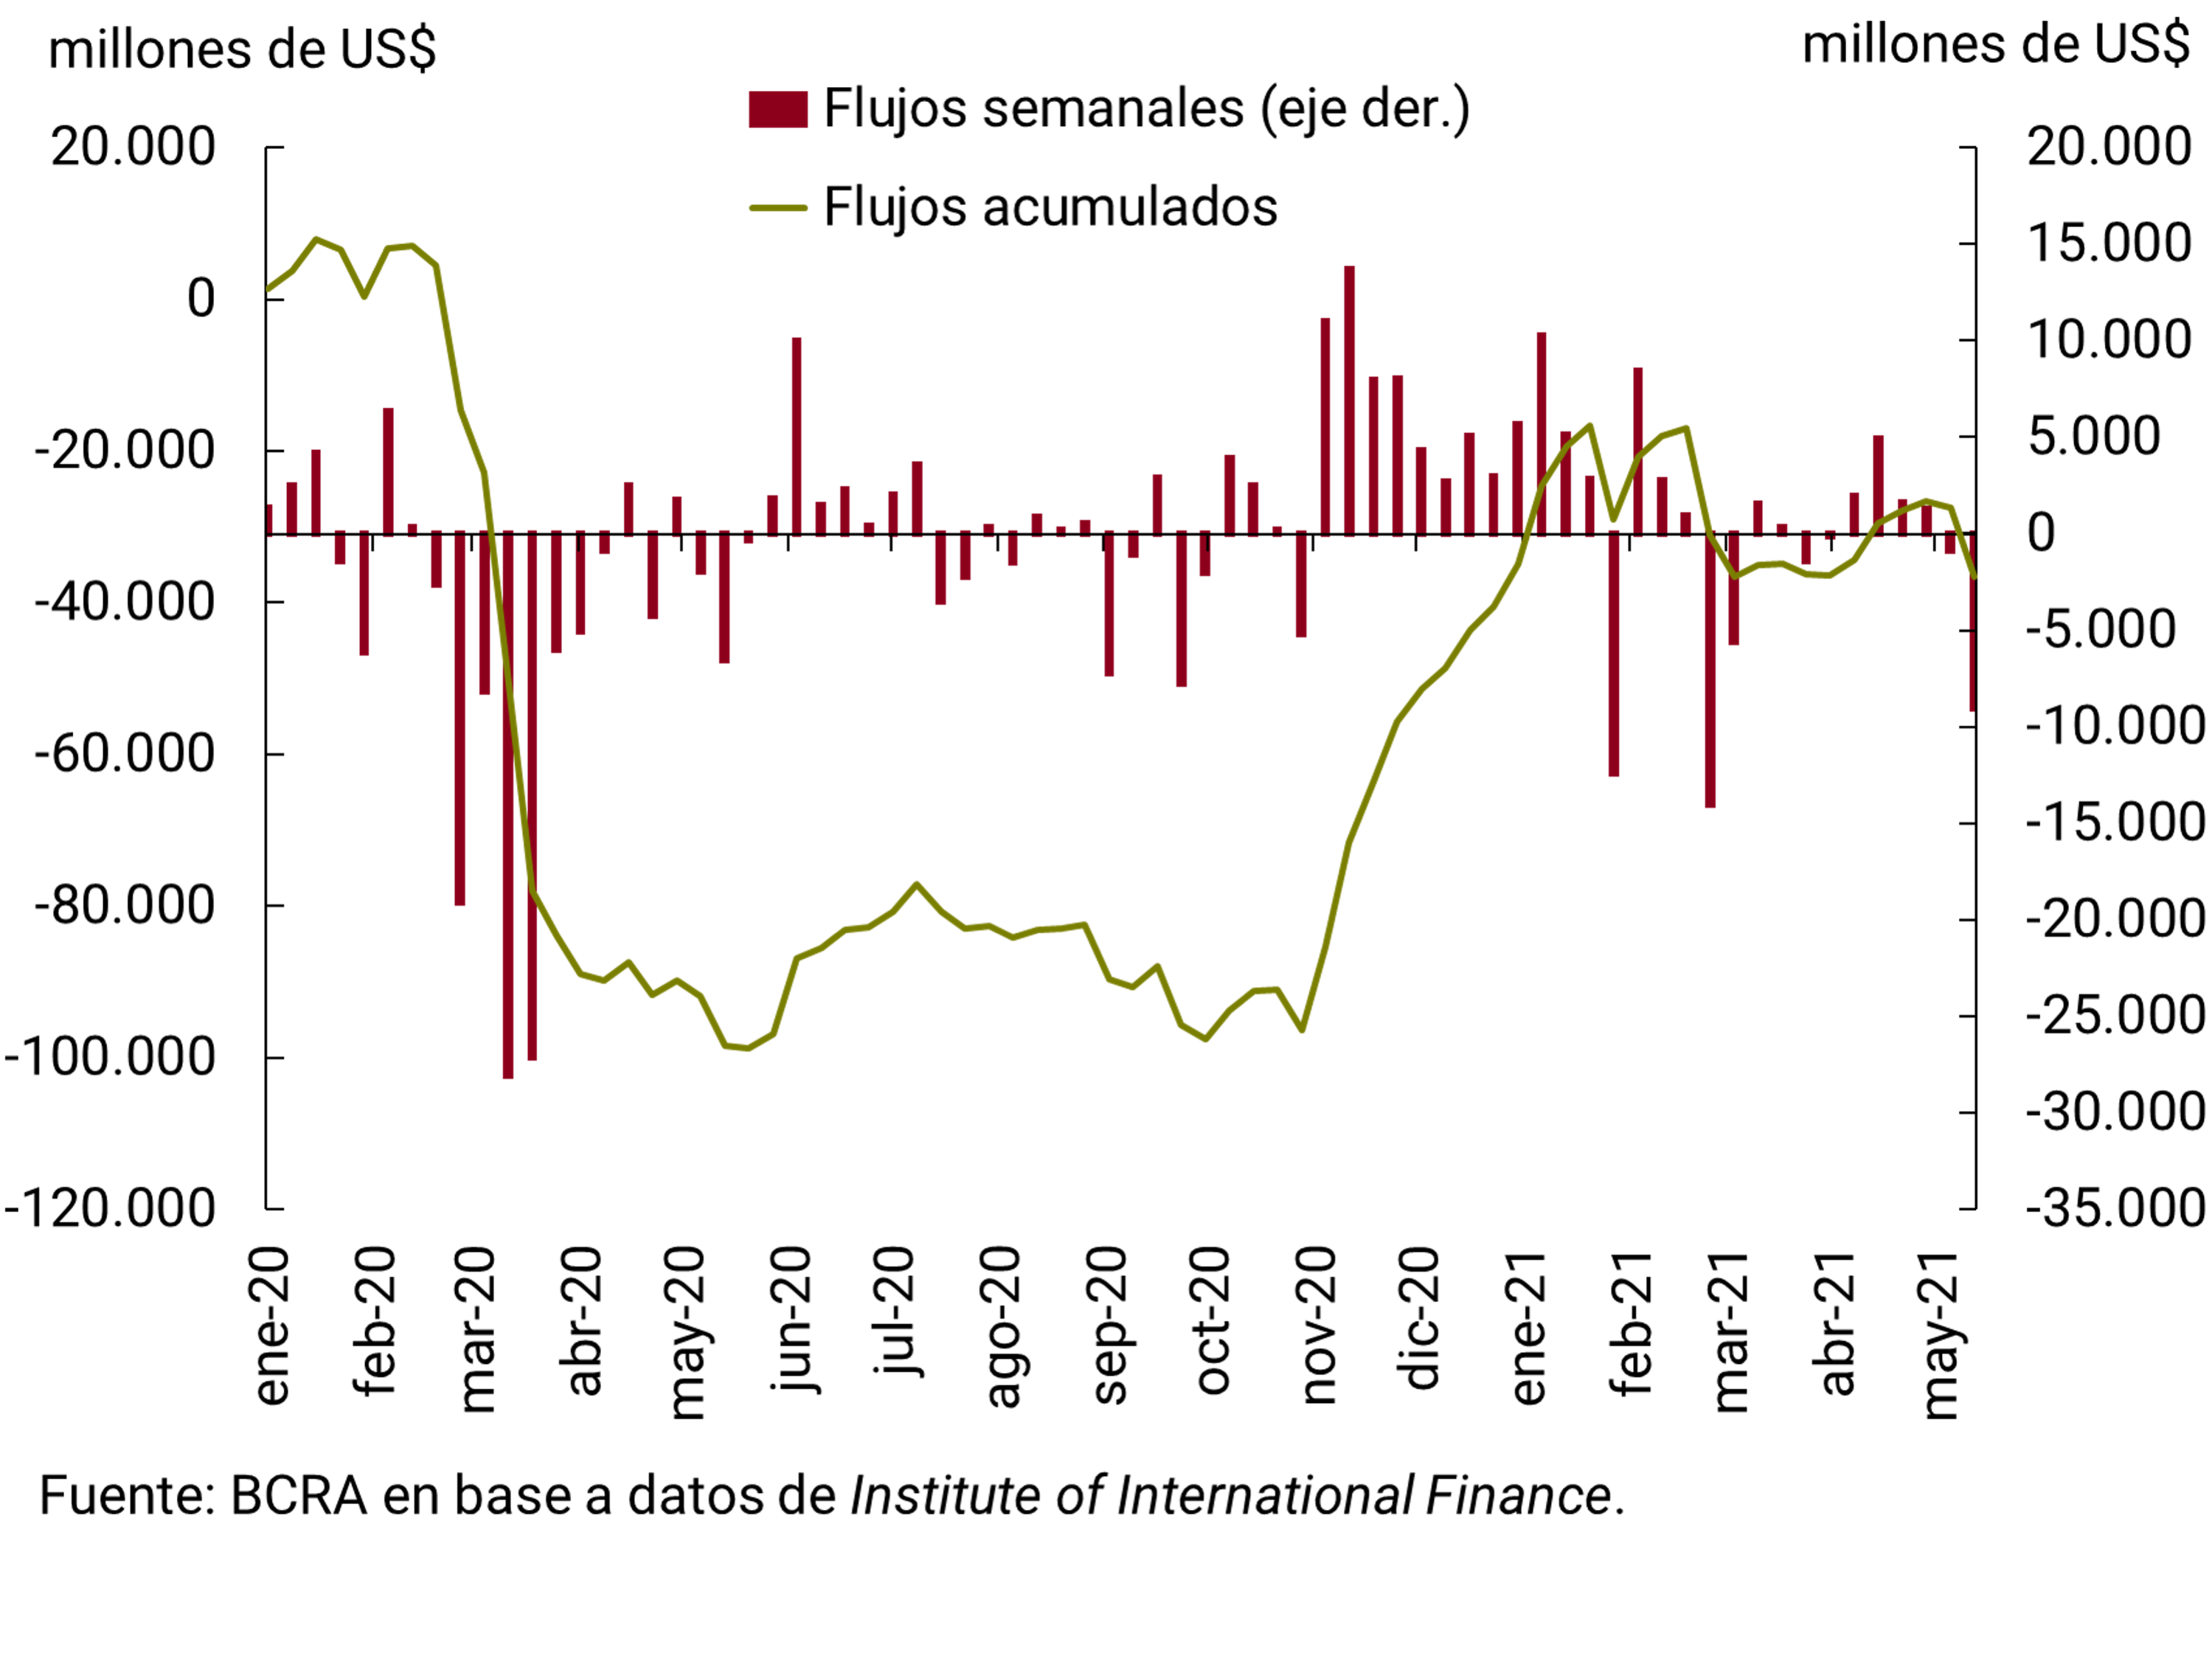
Capital flows to emerging countries have been negative by US$18 billion since the close of the previous IPOM, although they have accumulated a net inflow of US$4 billion in the year, not having fully recovered since the strong outflow at the beginning of the pandemic (see Figure 2.10b). The episodes of capital outflows at the end of February and the end of March of this year occurred at the same time as rate hikes in the United States. These events particularly affect developing countries.
Figure 2.10 | a) Stock indices
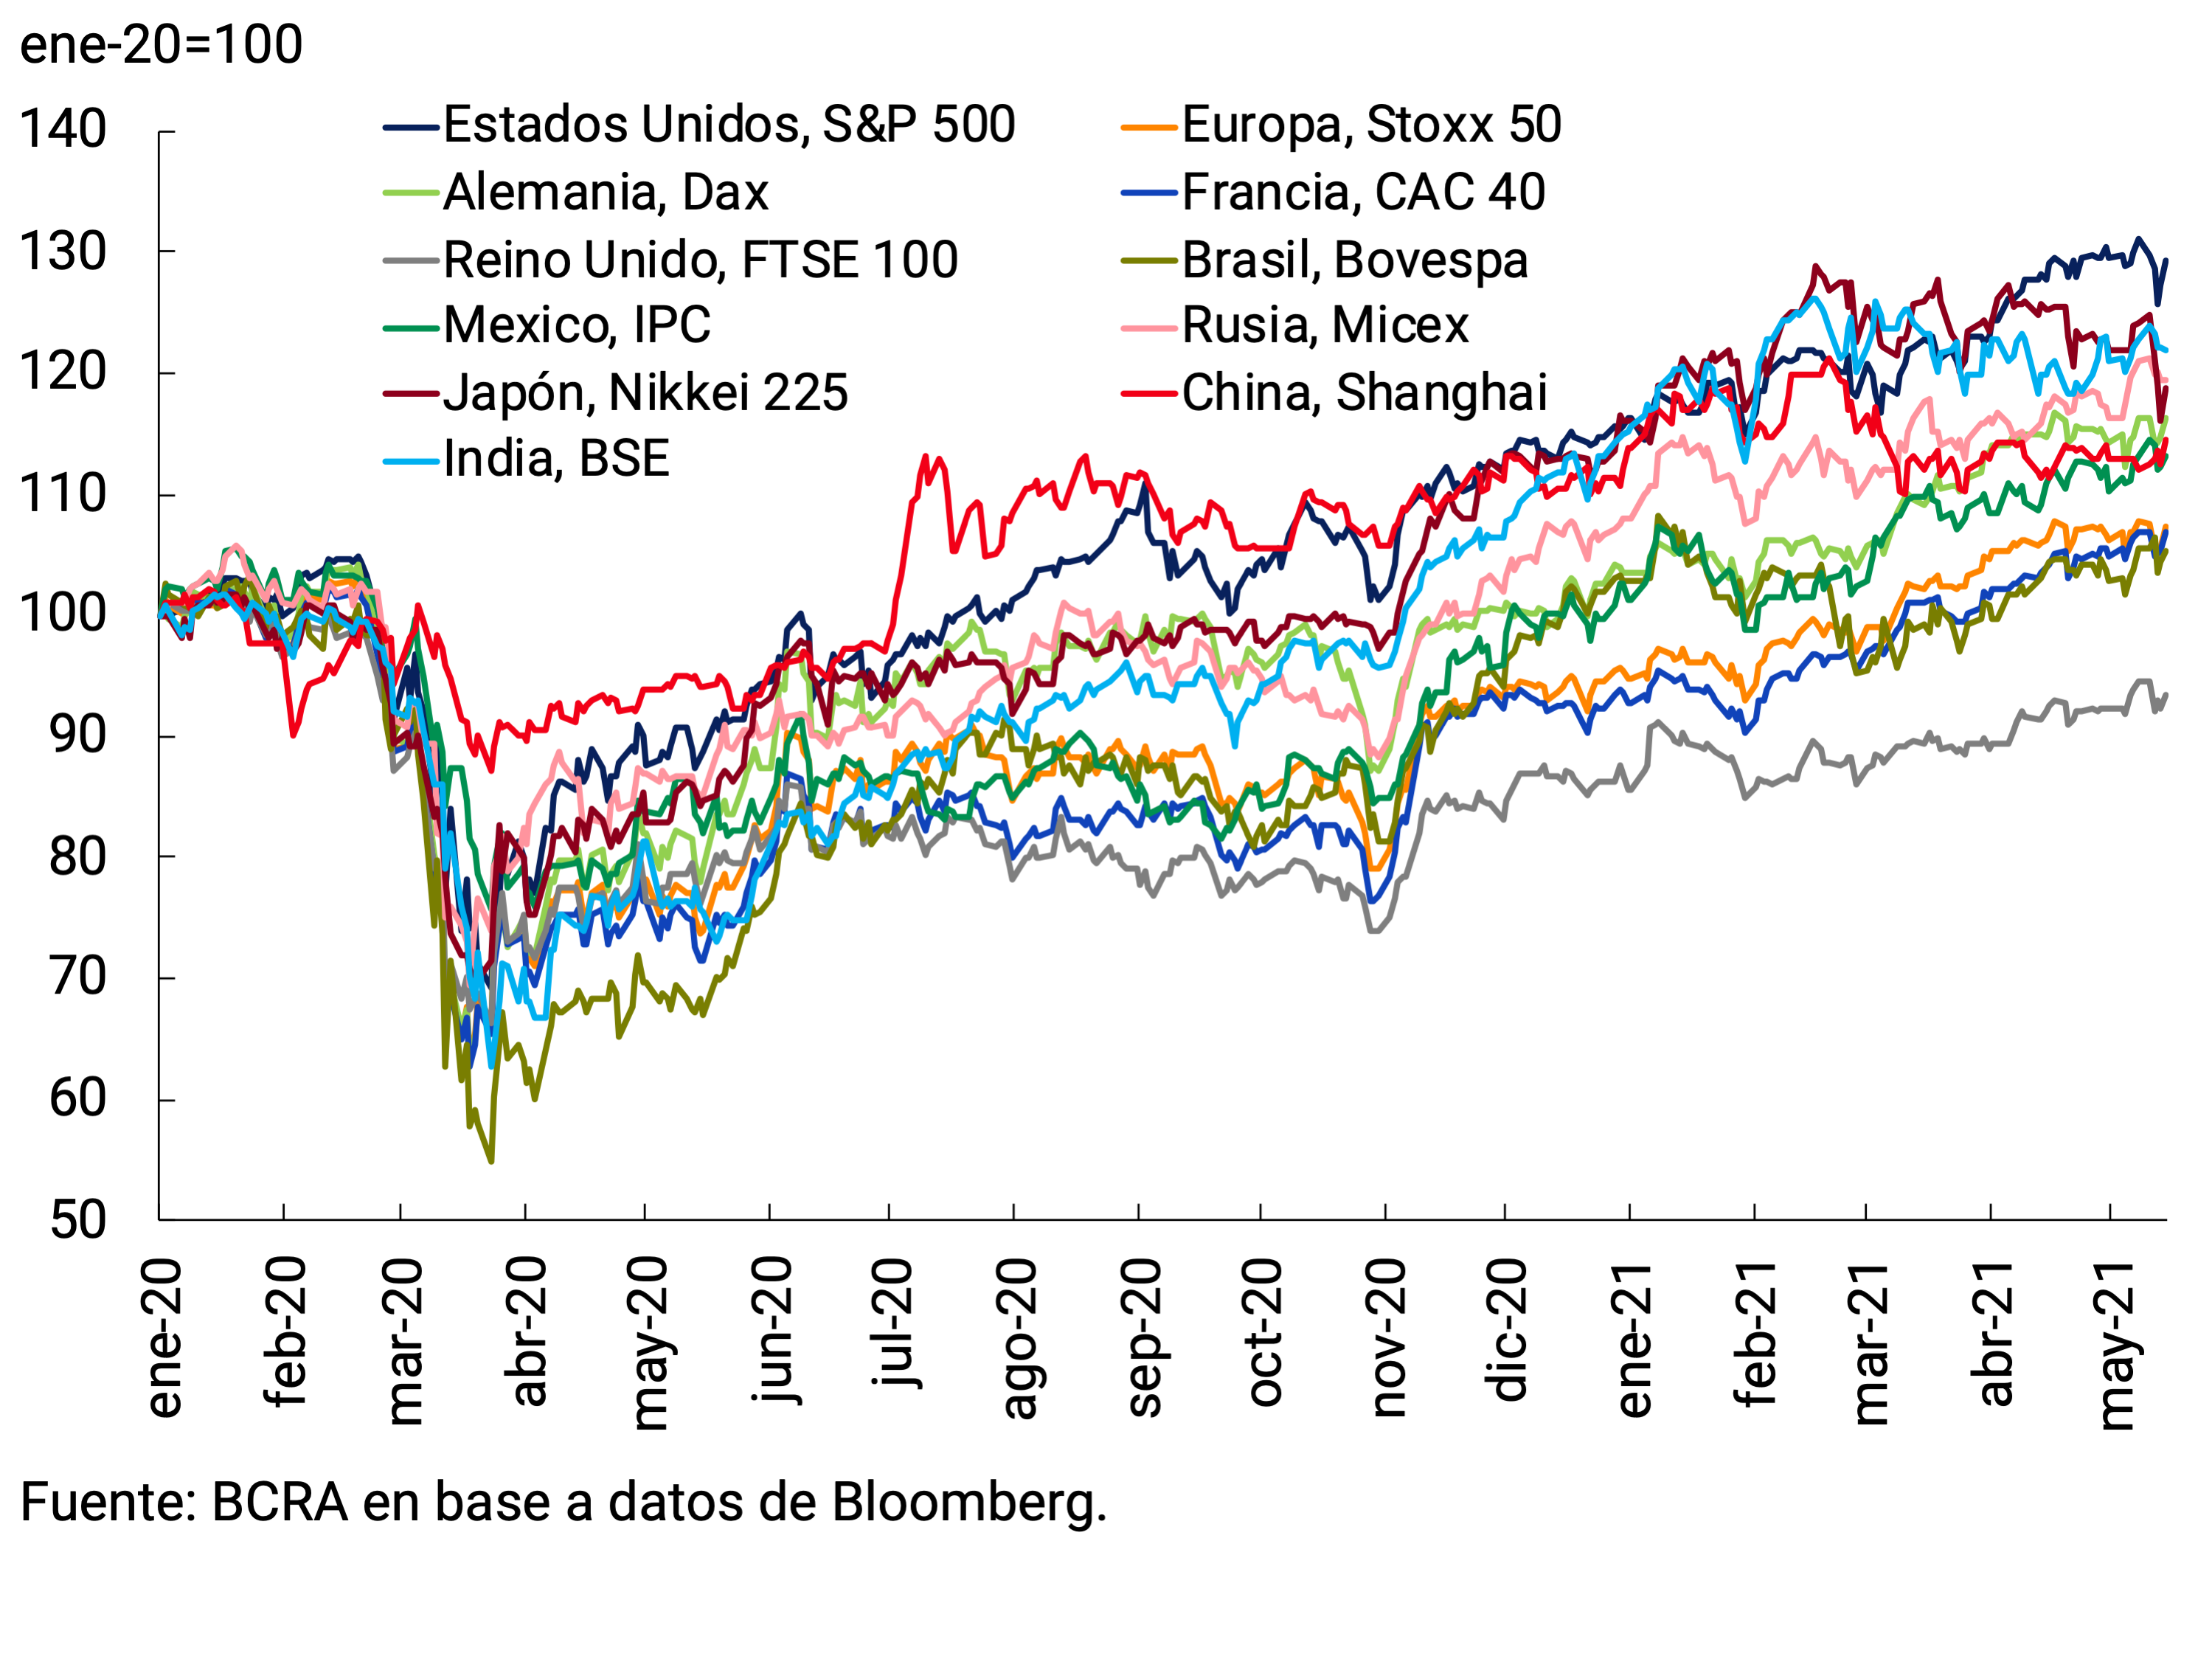
Figure 2.10 | (b) Capital flows to emerging countries
Commodity prices continued to rise, especially agricultural commodity prices, which are already at their highest since 2012 (see Box. Recent developments in international prices of Chapter 4 raw materials. External Sector).
2.4. Fiscal and monetary support measures continue, but some are already beginning to be reduced
Monetary and fiscal policy continues to be expansionary in the world, but with significant differences between advanced and developing countries.
Central banks in advanced countries maintained their pace of asset purchases, with inflation remaining within their tolerance range (see Figure 2.11). Some exceptions were the European Central Bank, the Central Bank of Canada, and the Bank of Sweden. The former has increased the weekly pace of its asset purchases since mid-March to avoid a steepening of the yield curve of the region’s sovereign bonds, which could affect the level of activity. For its part, the Central Bank of Canada announced a reduction in weekly asset purchases after improving the growth projection of the Canadian economy in 2021 by 2.5 p.p. (from 4% to 6.5%), thus being the first G7 country to begin to reverse its unconventional monetary policies. Sweden’s monetary authority also decided to reduce its asset purchase program from the third quarter of 2021, due to a higher-than-expected recovery in the level of activity.
Figure 2.11 | Advanced Countries Inflation
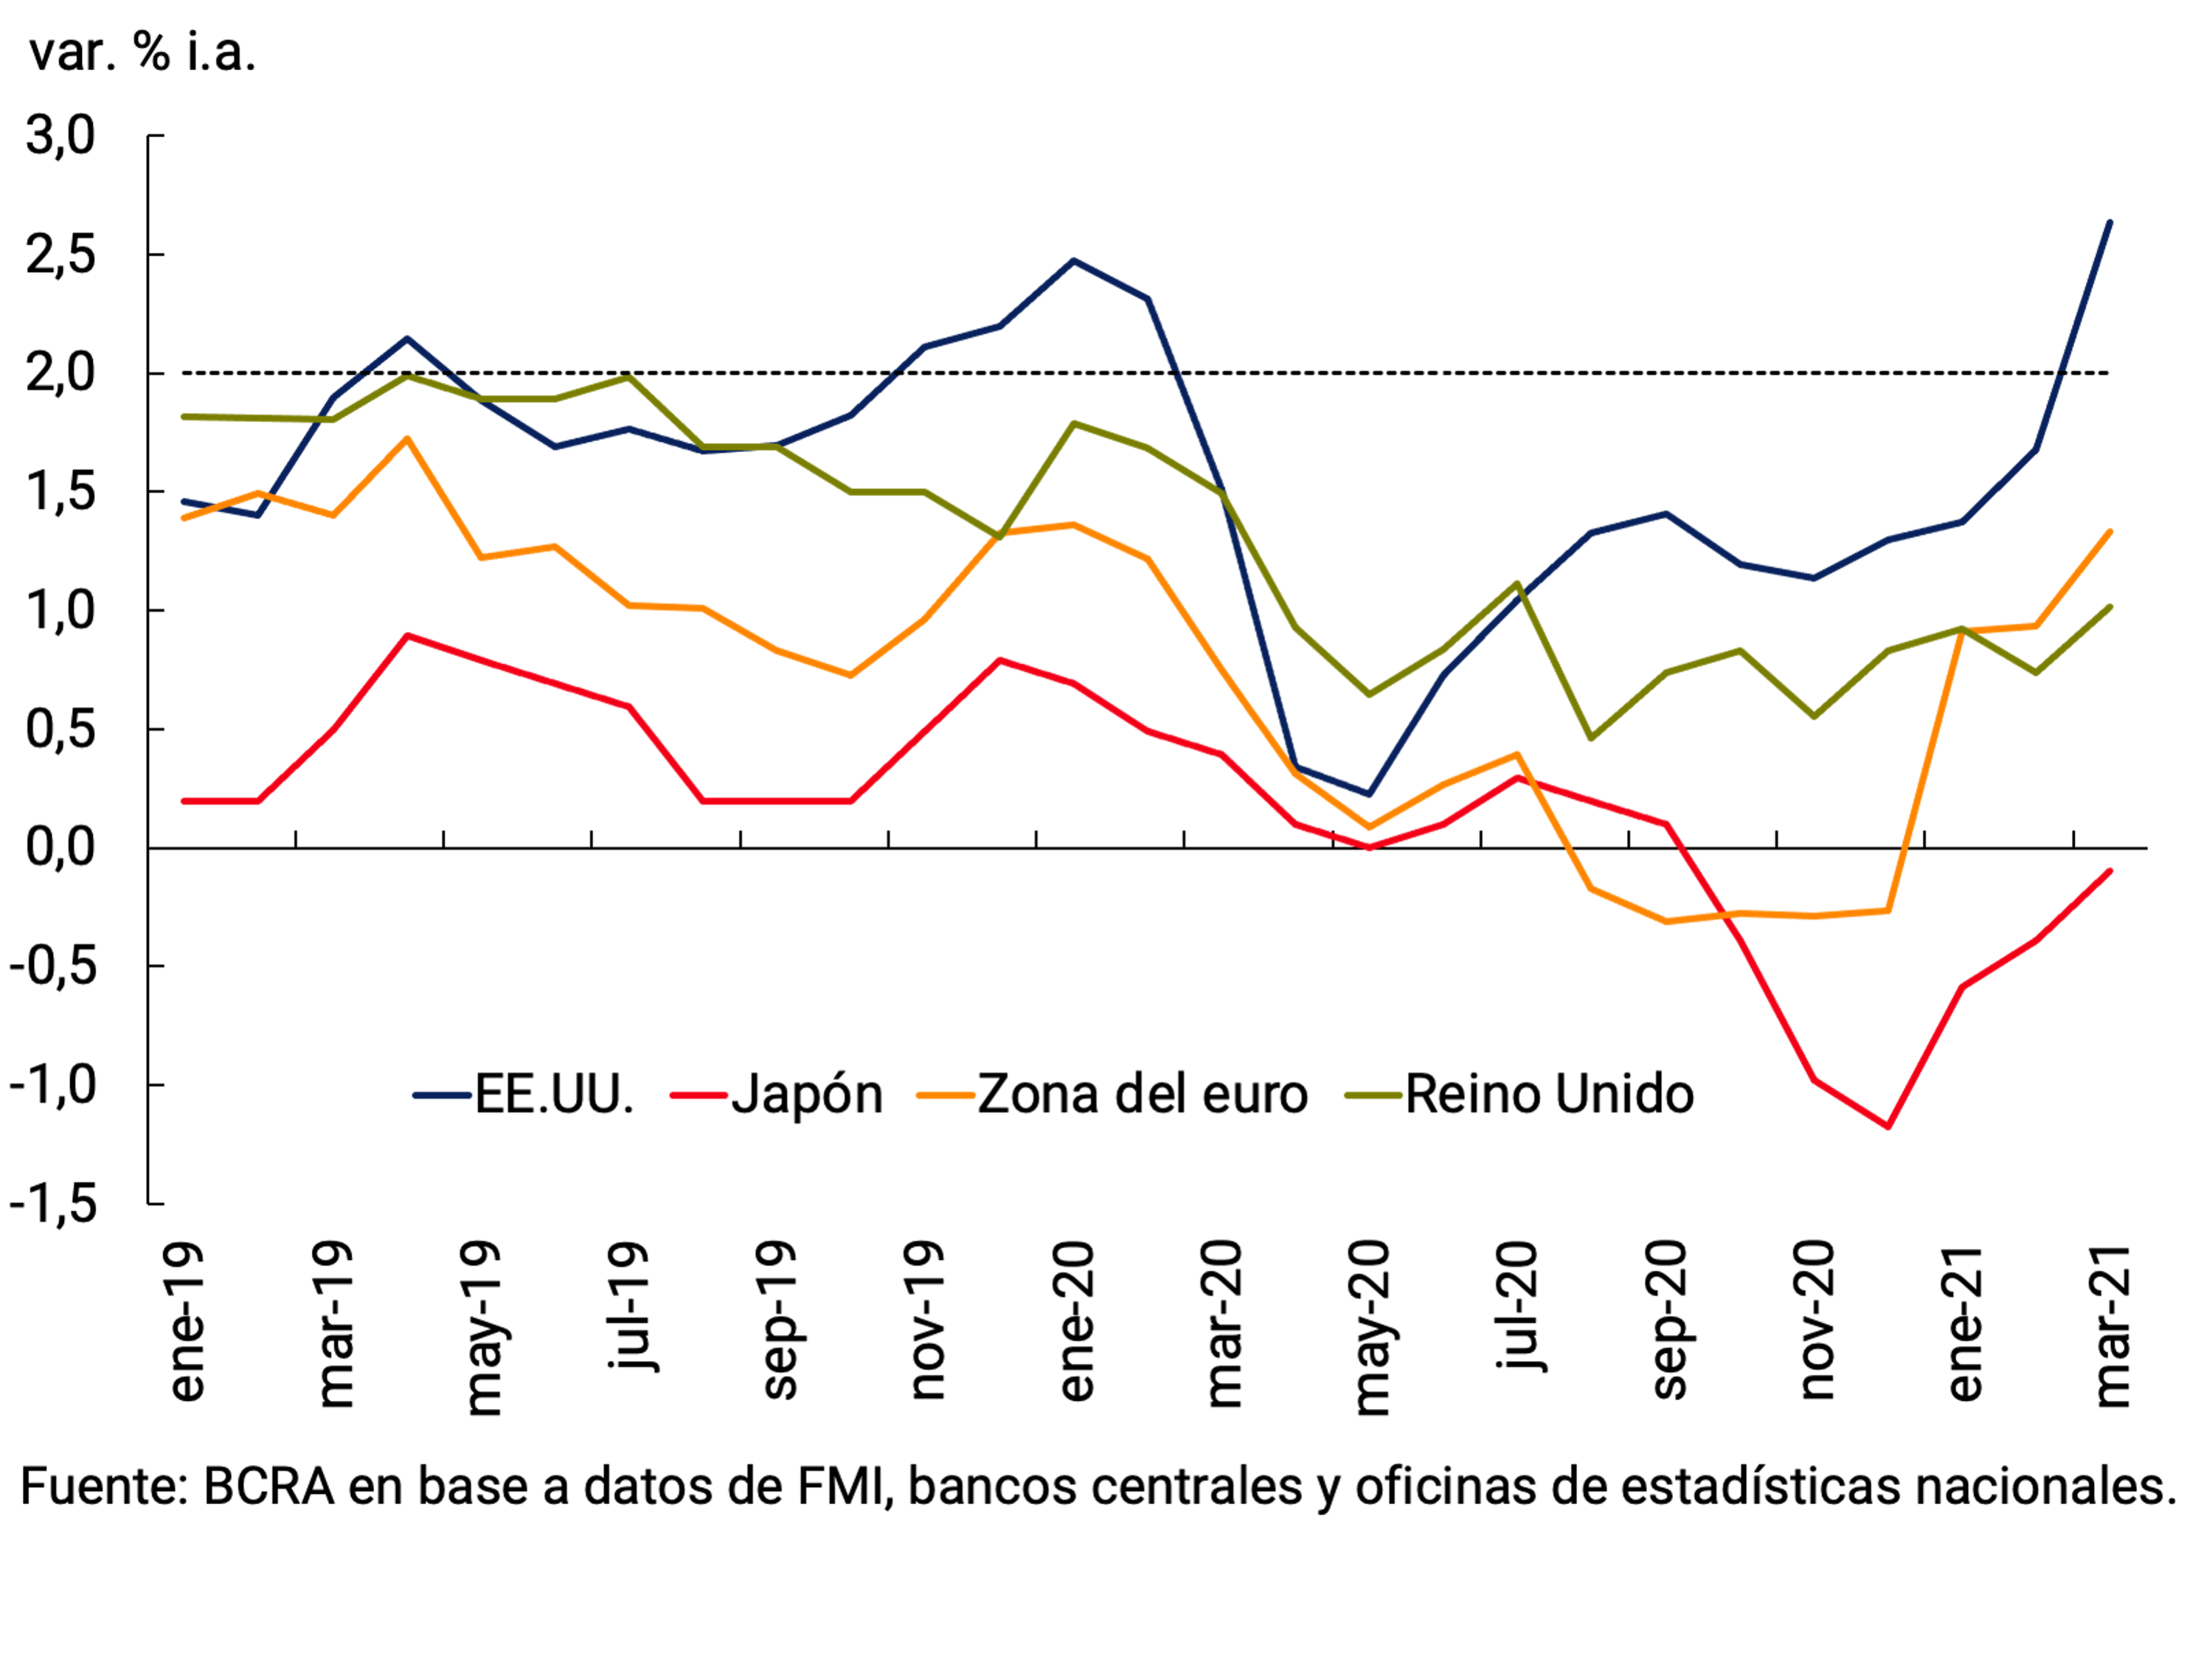
For their part, the authorities of the Federal Reserve of the United States (Fed) indicated on several occasions that they will maintain the expansionary bias of their monetary policy, not foreseeing an interest rate hike until 2024; however, some analysts expect such action in 2023. The reason for this analysts’ projection is that the improvement of the U.S. economy is being faster than expected, in part due to the recently approved fiscal stimulus package. The Fed upgraded its own projections for the economy, forecasting growth for this year at 6.5 percent (compared with 4.2 percent in its previous projection in December), the biggest increase in GDP since 1984. Unemployment projections are 4.5% by the end of the year (compared to the previous projection of 5%). Regarding inflation, the Fed predicts an increase for 2021 for the core household spending deflator of 2.2% (against 1.8% projected last December; 2.4% for the general level) and above the 2% target.
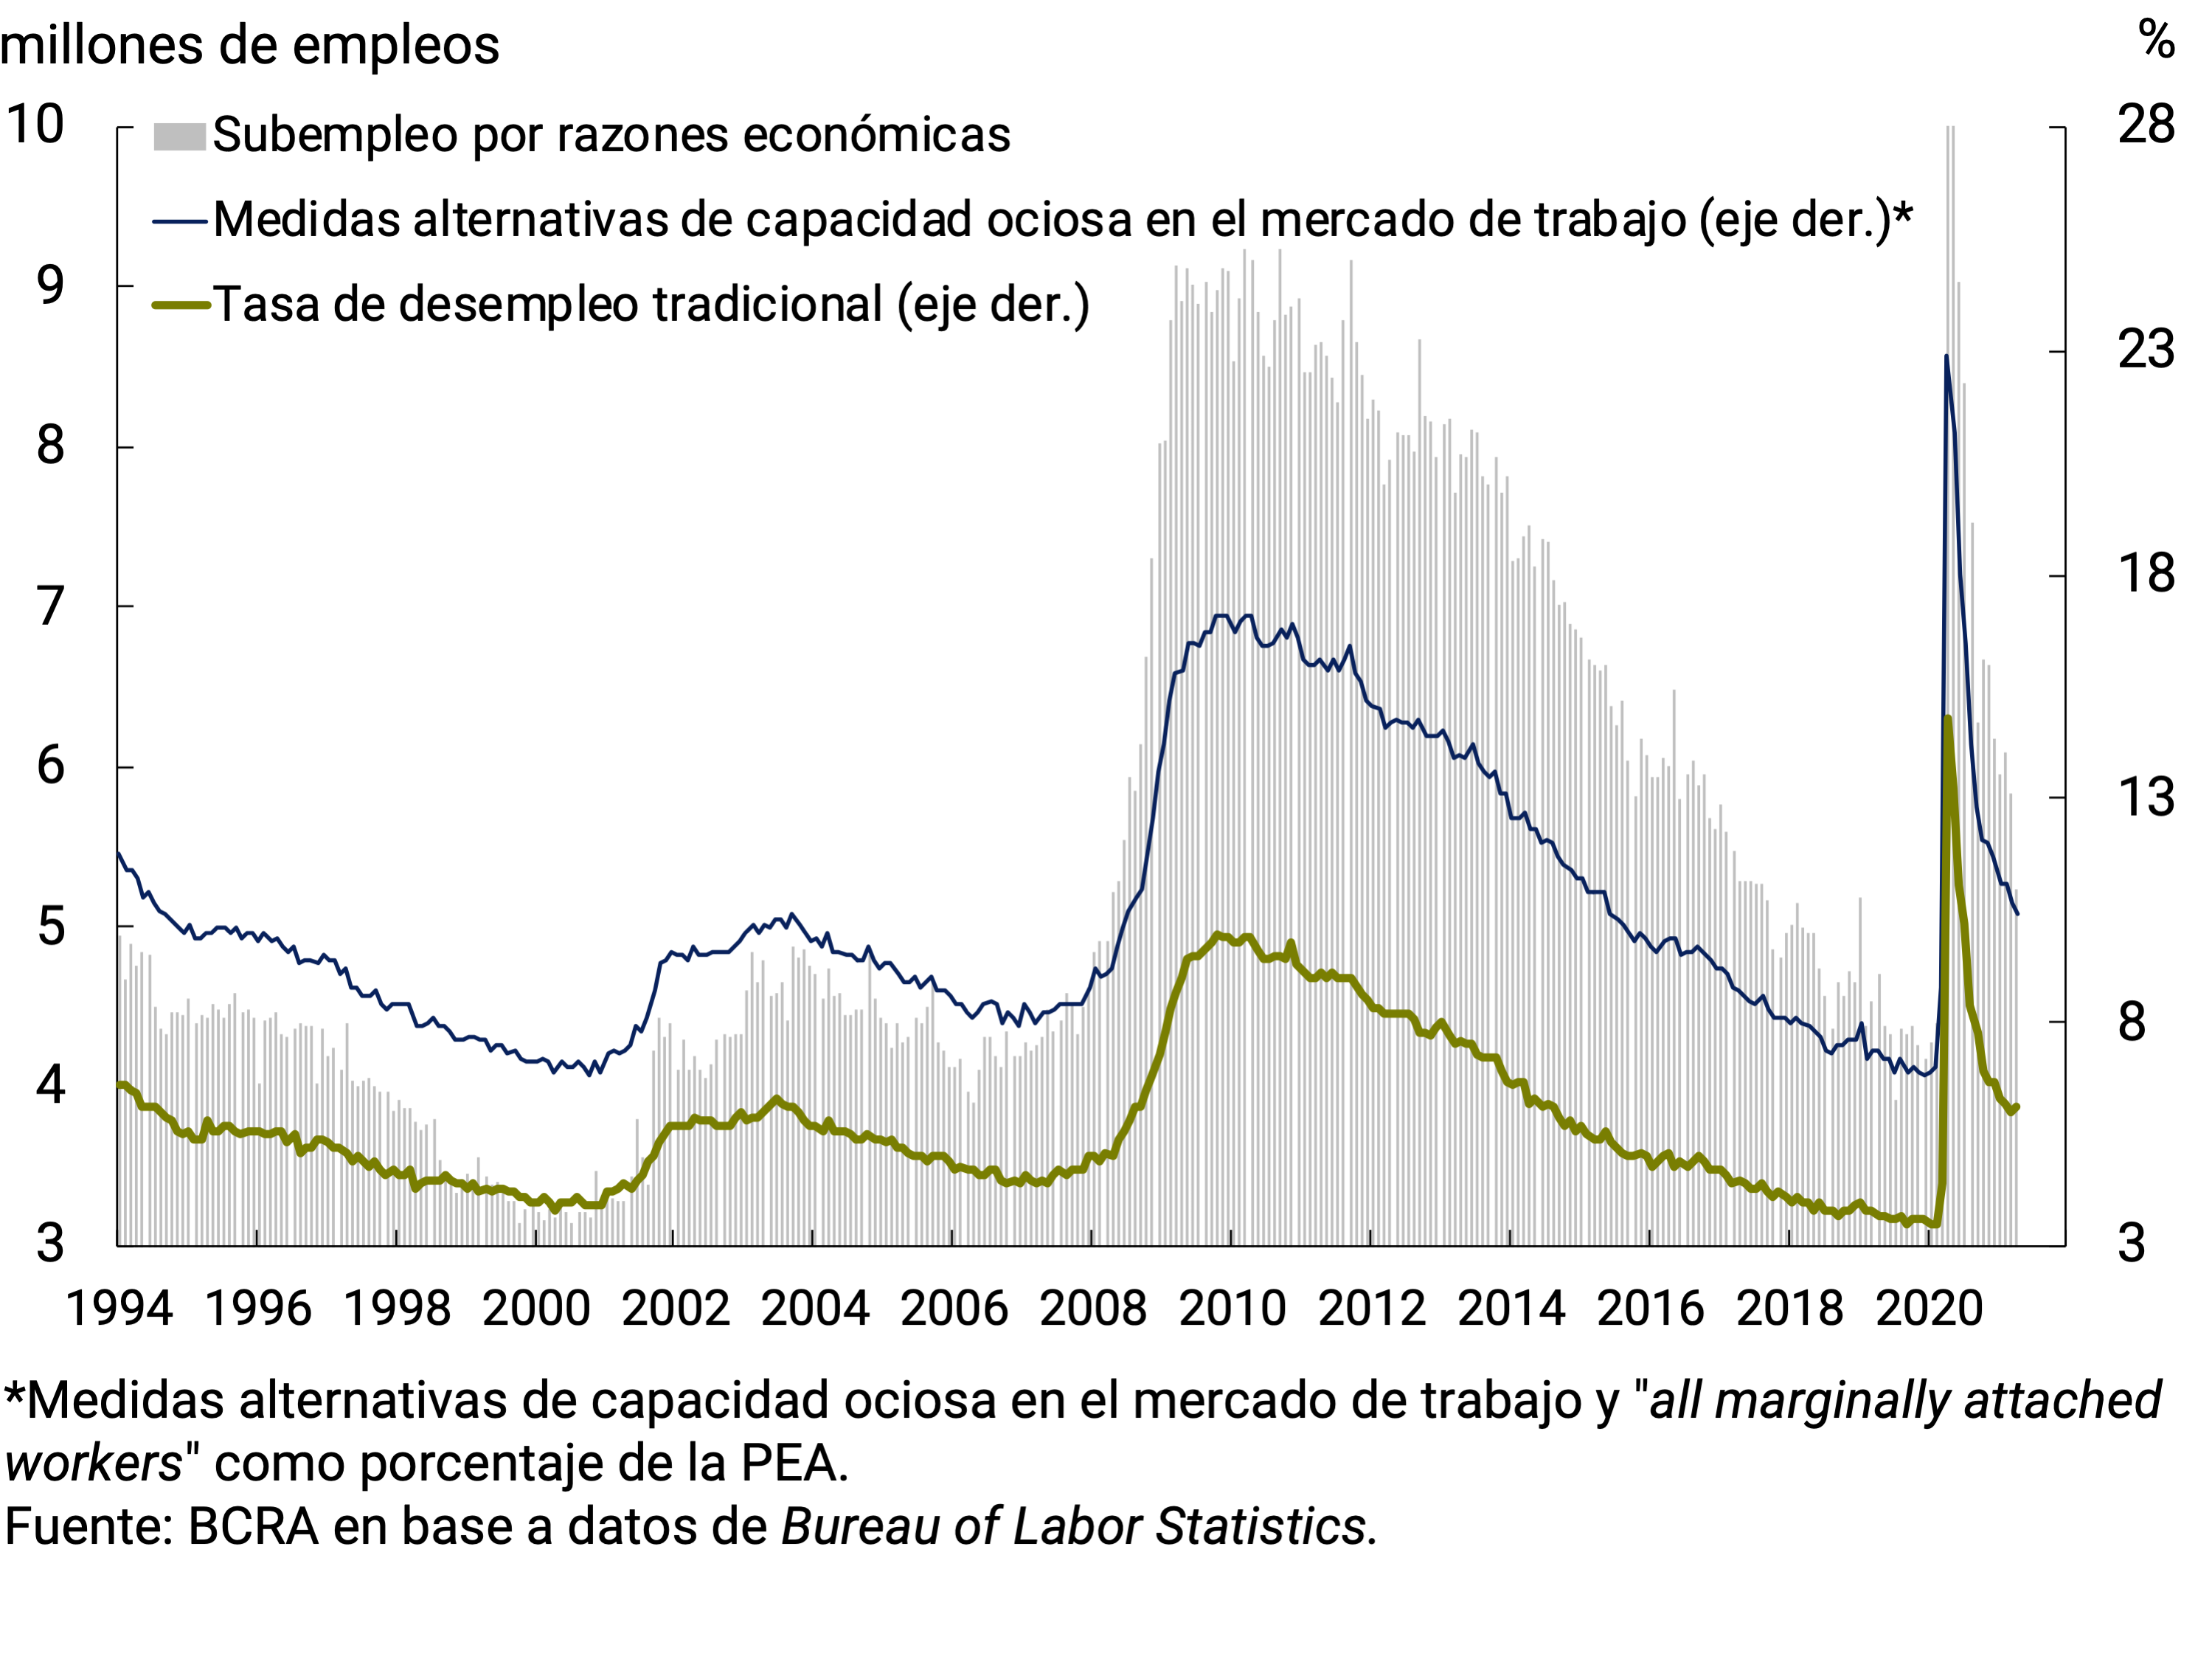
Several factors would explain why, despite these better projections, the Fed does not raise the target on the federal funds rate. First, it emerges from their own projections that they expect higher inflation to be only temporary, since they project inflation of 2% for 2022 and 2.1% for 2023. In addition, the Fed has a dual mandate: stability and maximum employment. In this regard, labour market indicators, especially broader measures of unemployment and underemployment, are still far from pre-pandemic values (see Figure 2.12).
Figure 2.12 |U.S. Labor Market Indicators
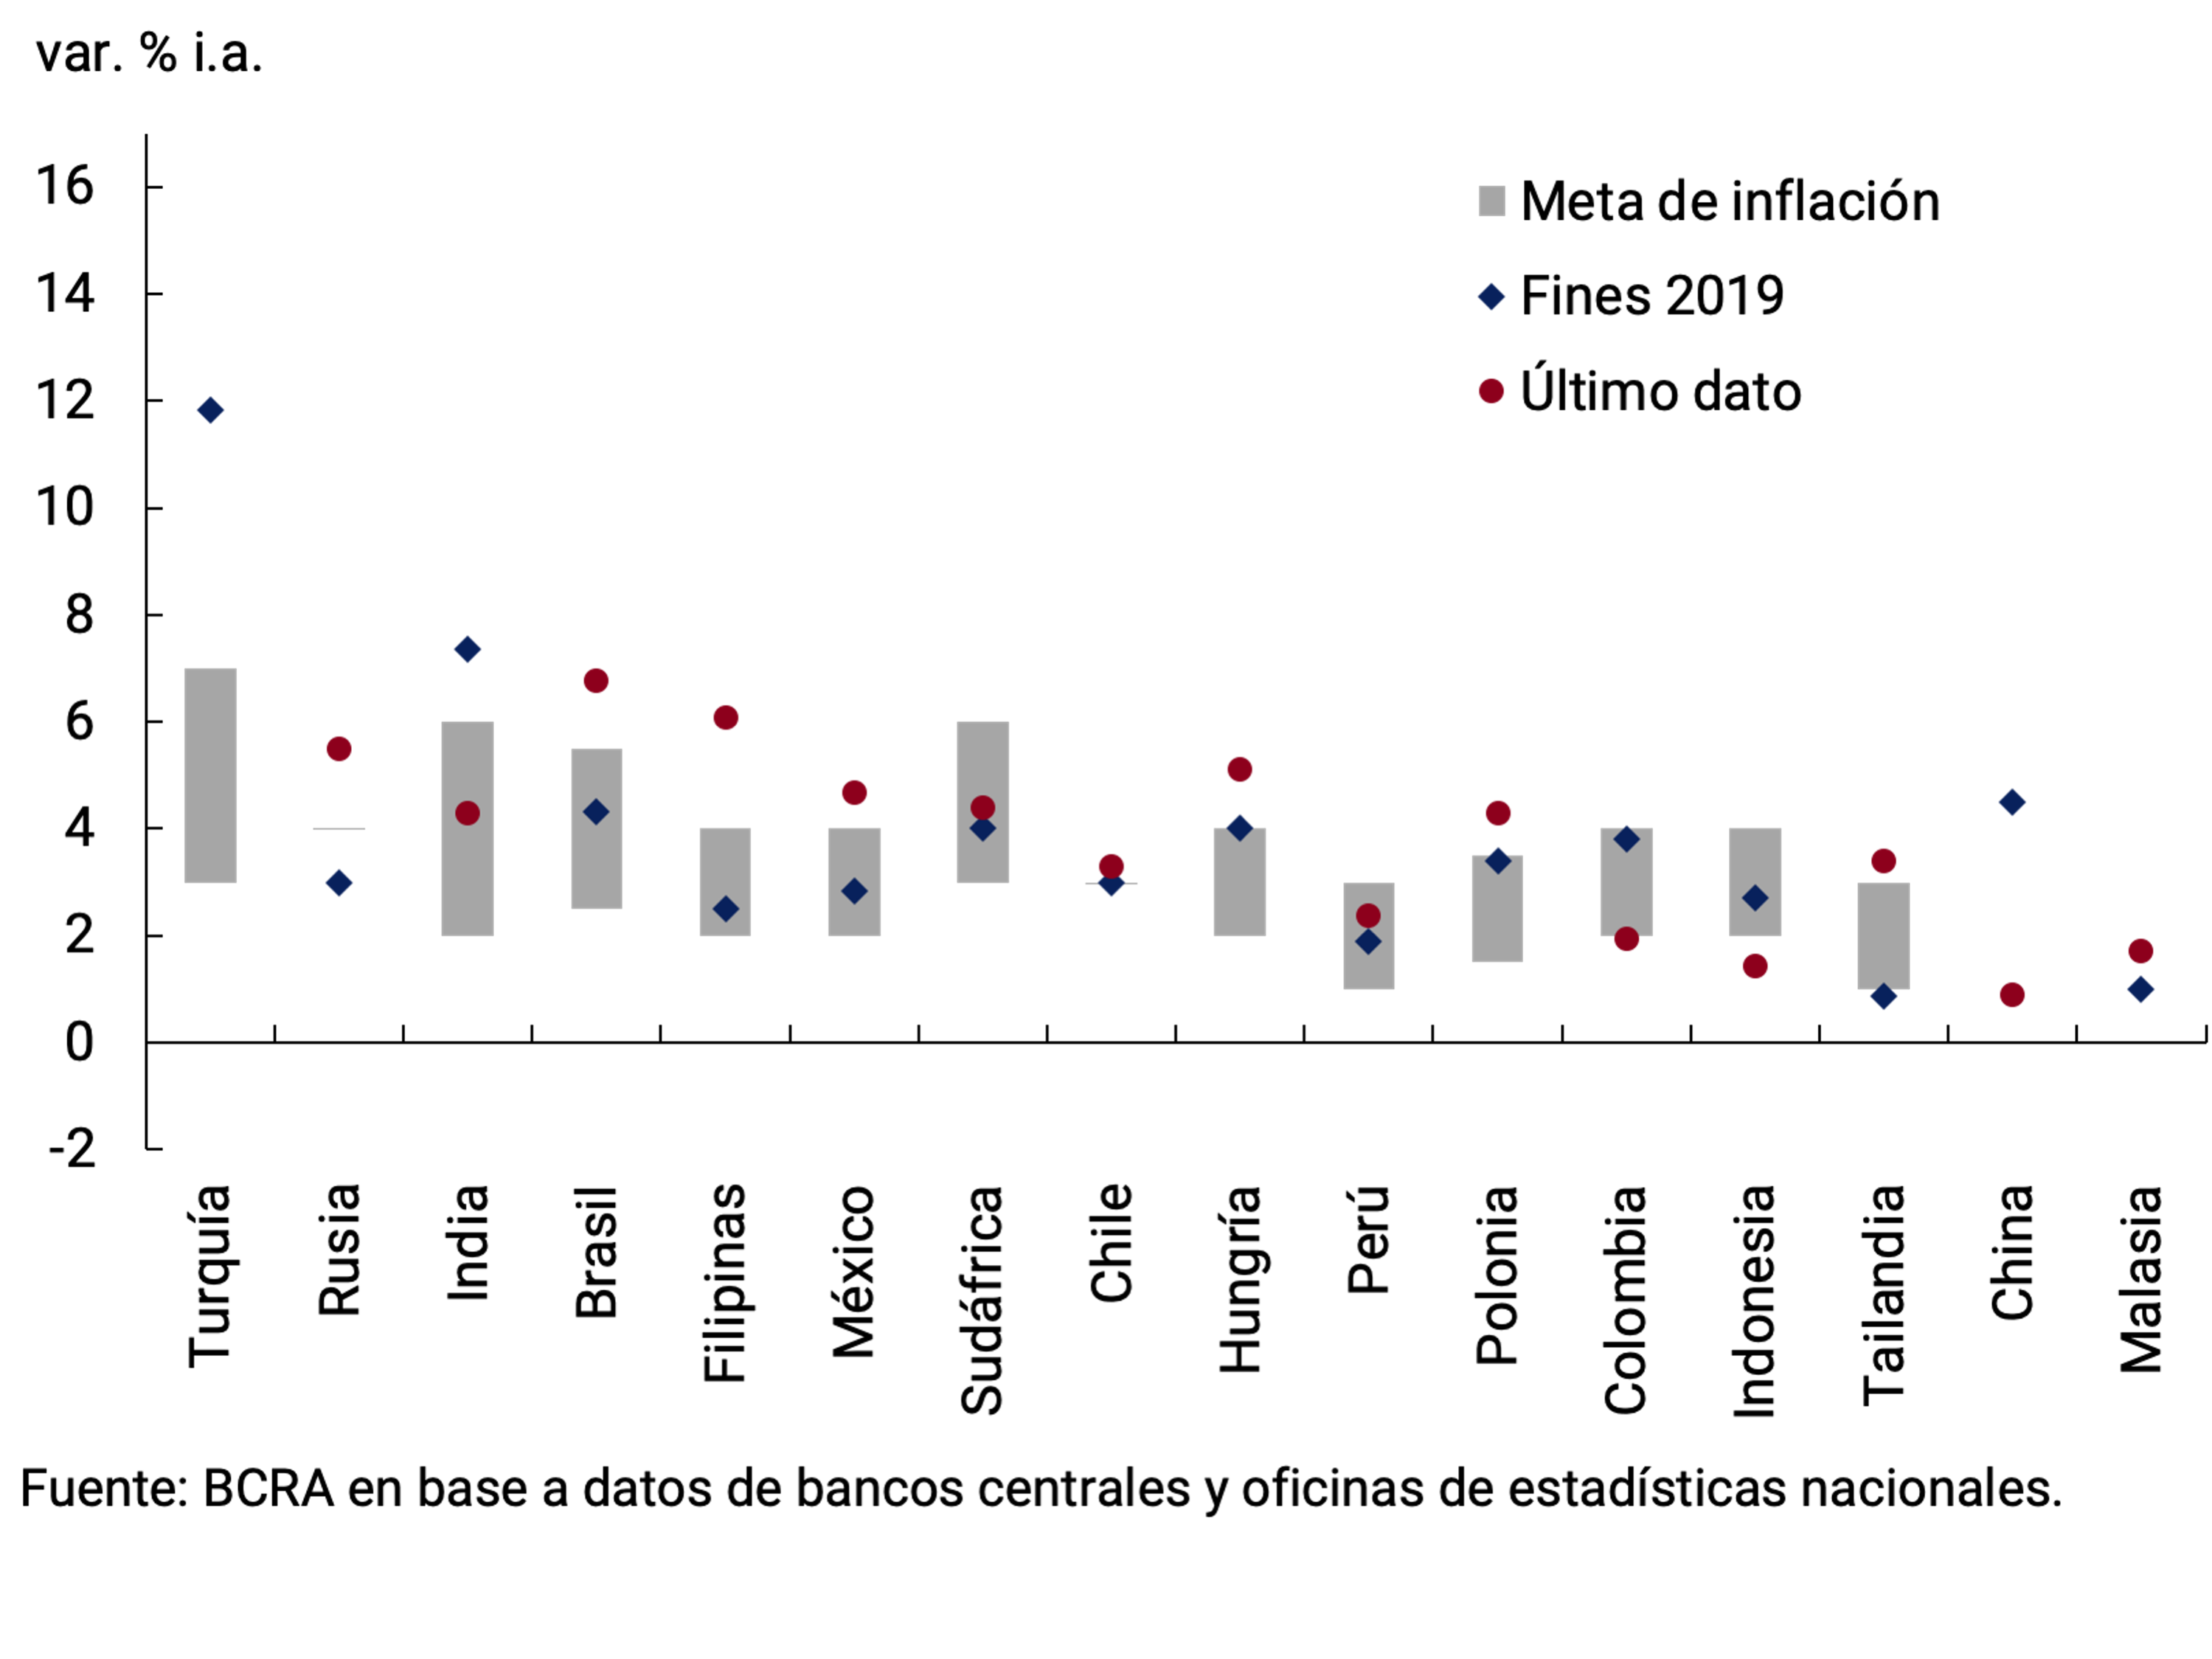
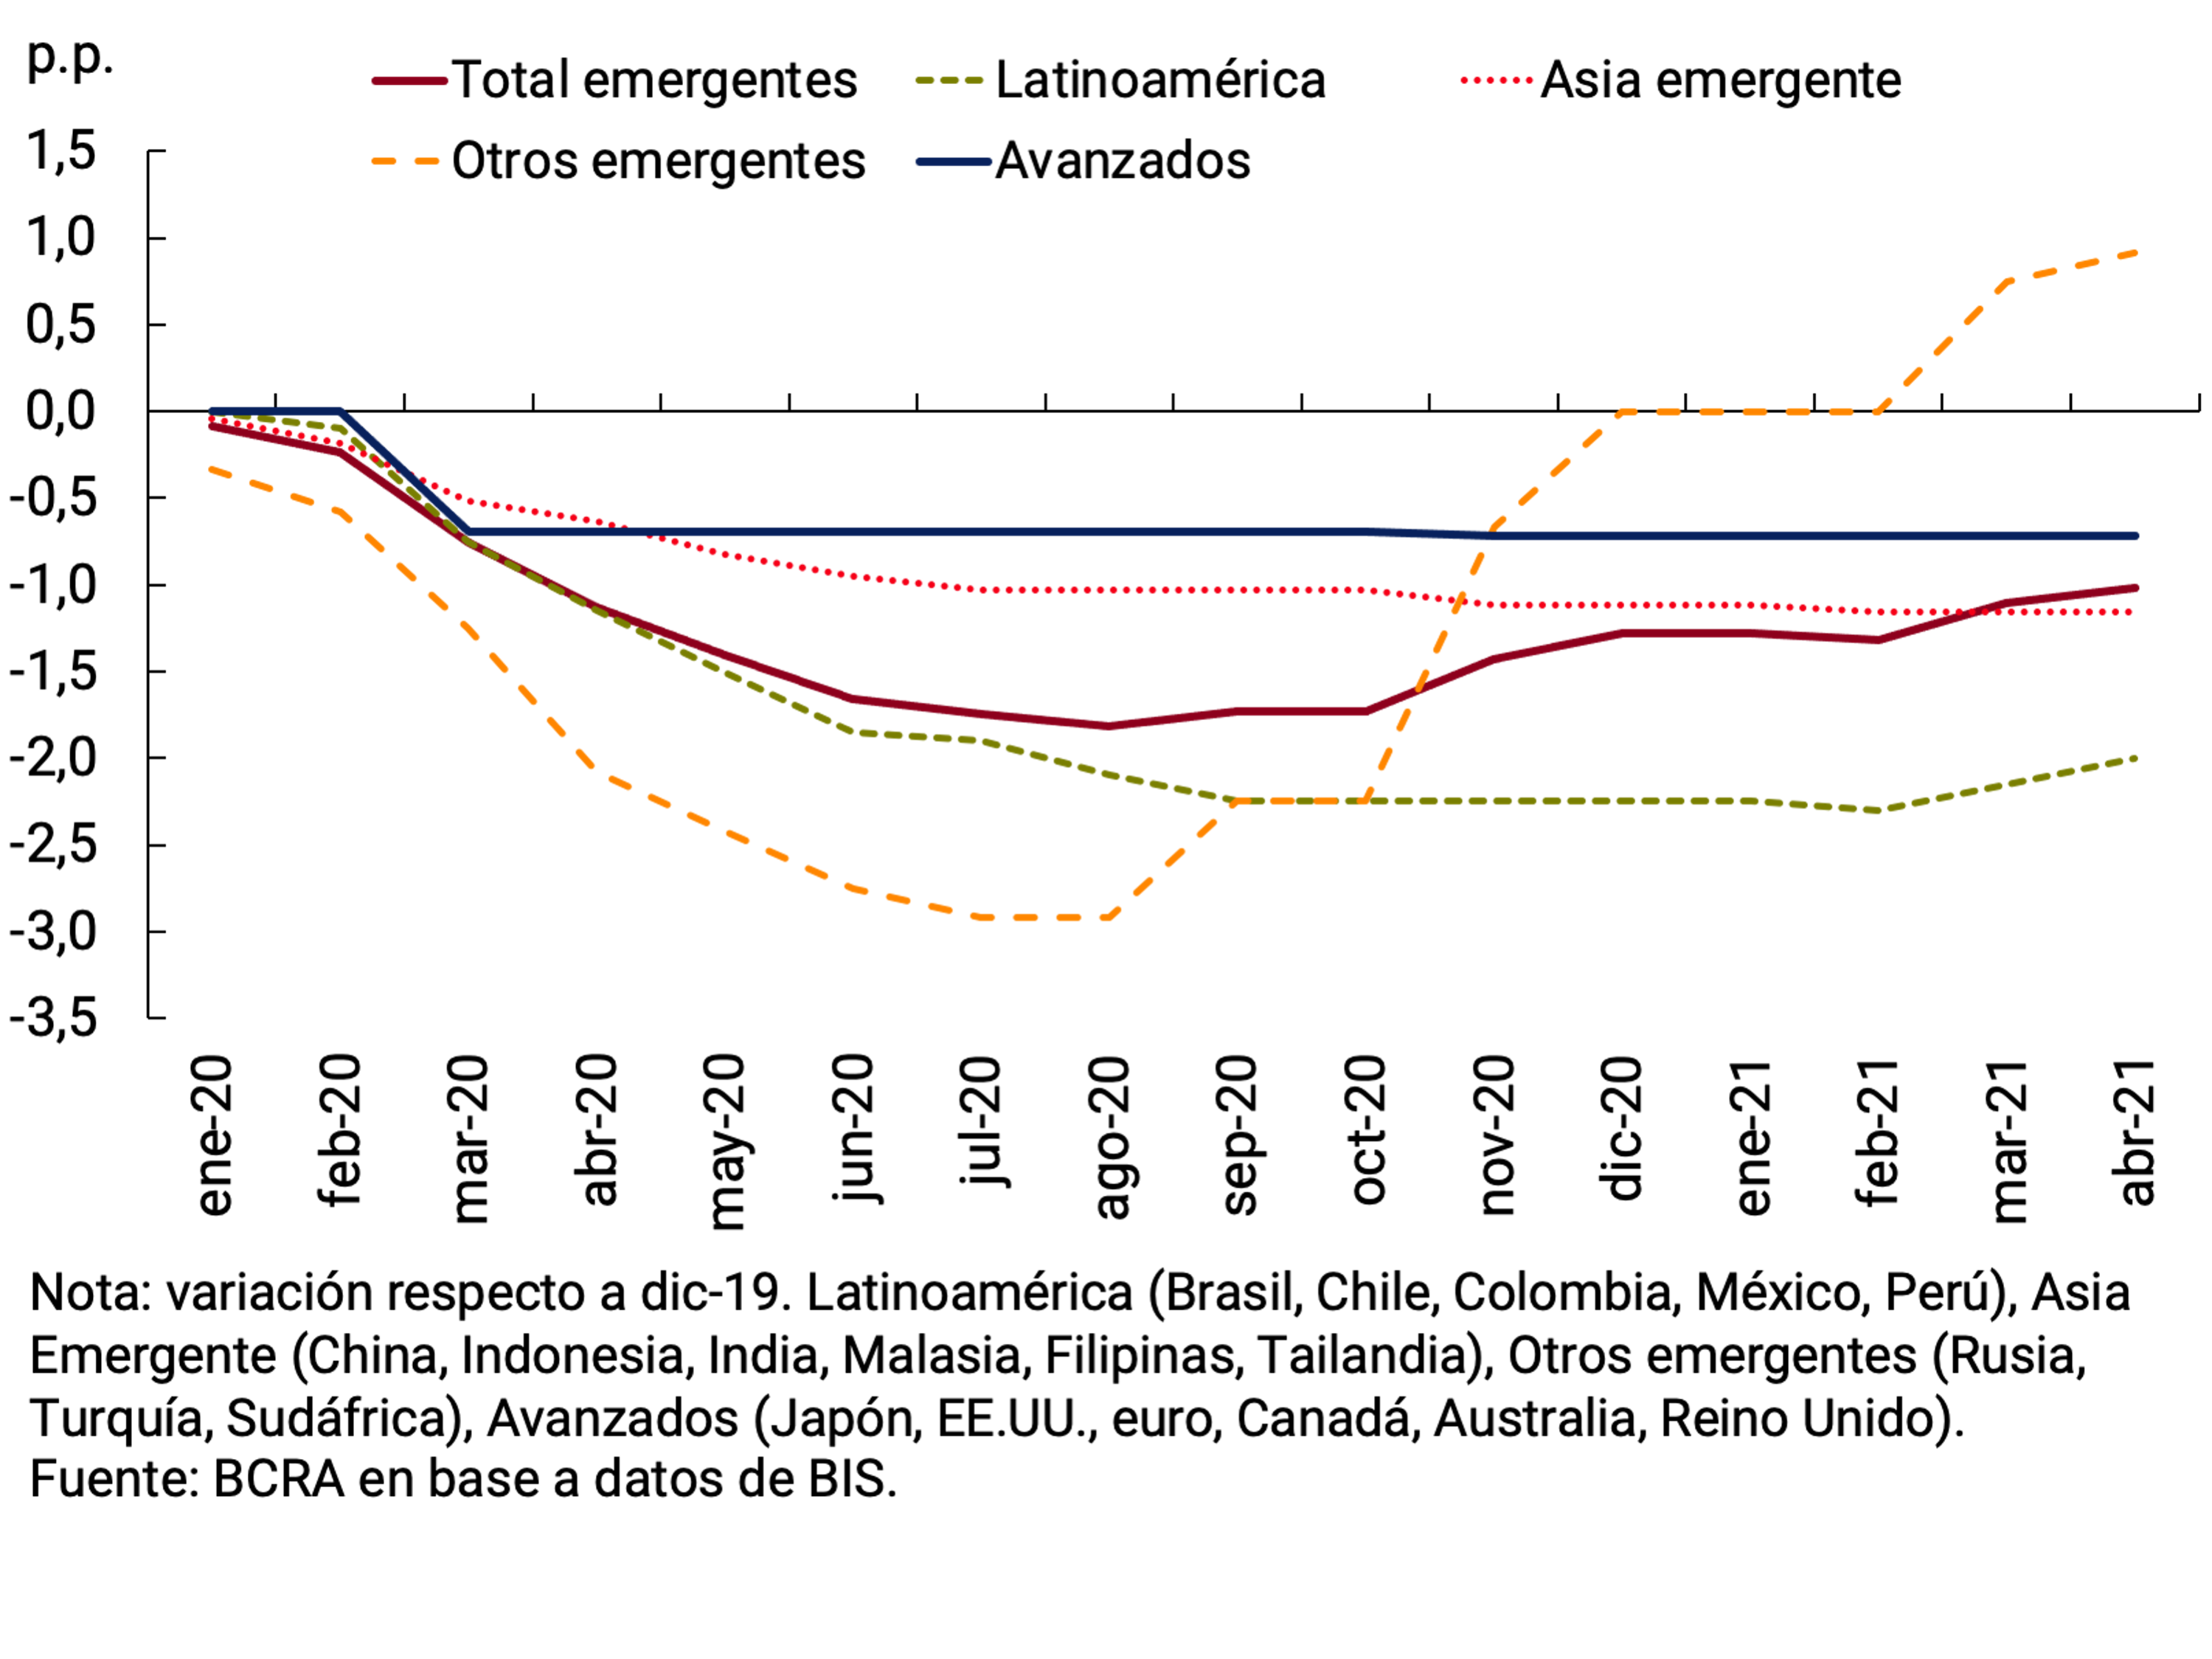
Some emerging countries are beginning to face more limited monetary policy space: they are experiencing higher inflation (see Figure 2.13a), suffering from the impact of sharp depreciations of their currencies and/or higher commodity prices. Thus, policy interest rates rose in Turkey, Russia, and Brazil (see Figure 2.13b). In turn, private sector analysts foresee contractionary measures from Chile’s monetary authority by the end of the year.
Figure 2.13 | (a) Emerging Countries
Rate Figure 2.13 | (b) Change in policy rate in emerging countries
In the first quarter of the year, the global fiscal policy response to the pandemic increased by US$2.2 trillion, to US$16 trillion (15.3% of global GDP), according to IMF data. Most of this increase was explained by the US$1.9 trillion fiscal package recently approved in the United States (about 9% of GDP) which, in turn, led analysts and international organizations to revise upwards the growth forecasts of the US economy and the global economy (together with greater optimism about vaccination campaigns)1.
After the sharp increases in fiscal deficits recorded during 2020 as a result of the response to the pandemic, for this year the international organization expects most countries to experience smaller imbalances in their public accounts as tax revenues increase and some expenditures automatically decrease with the recovery and pandemic-related measures expire (see Figure 2.14a).
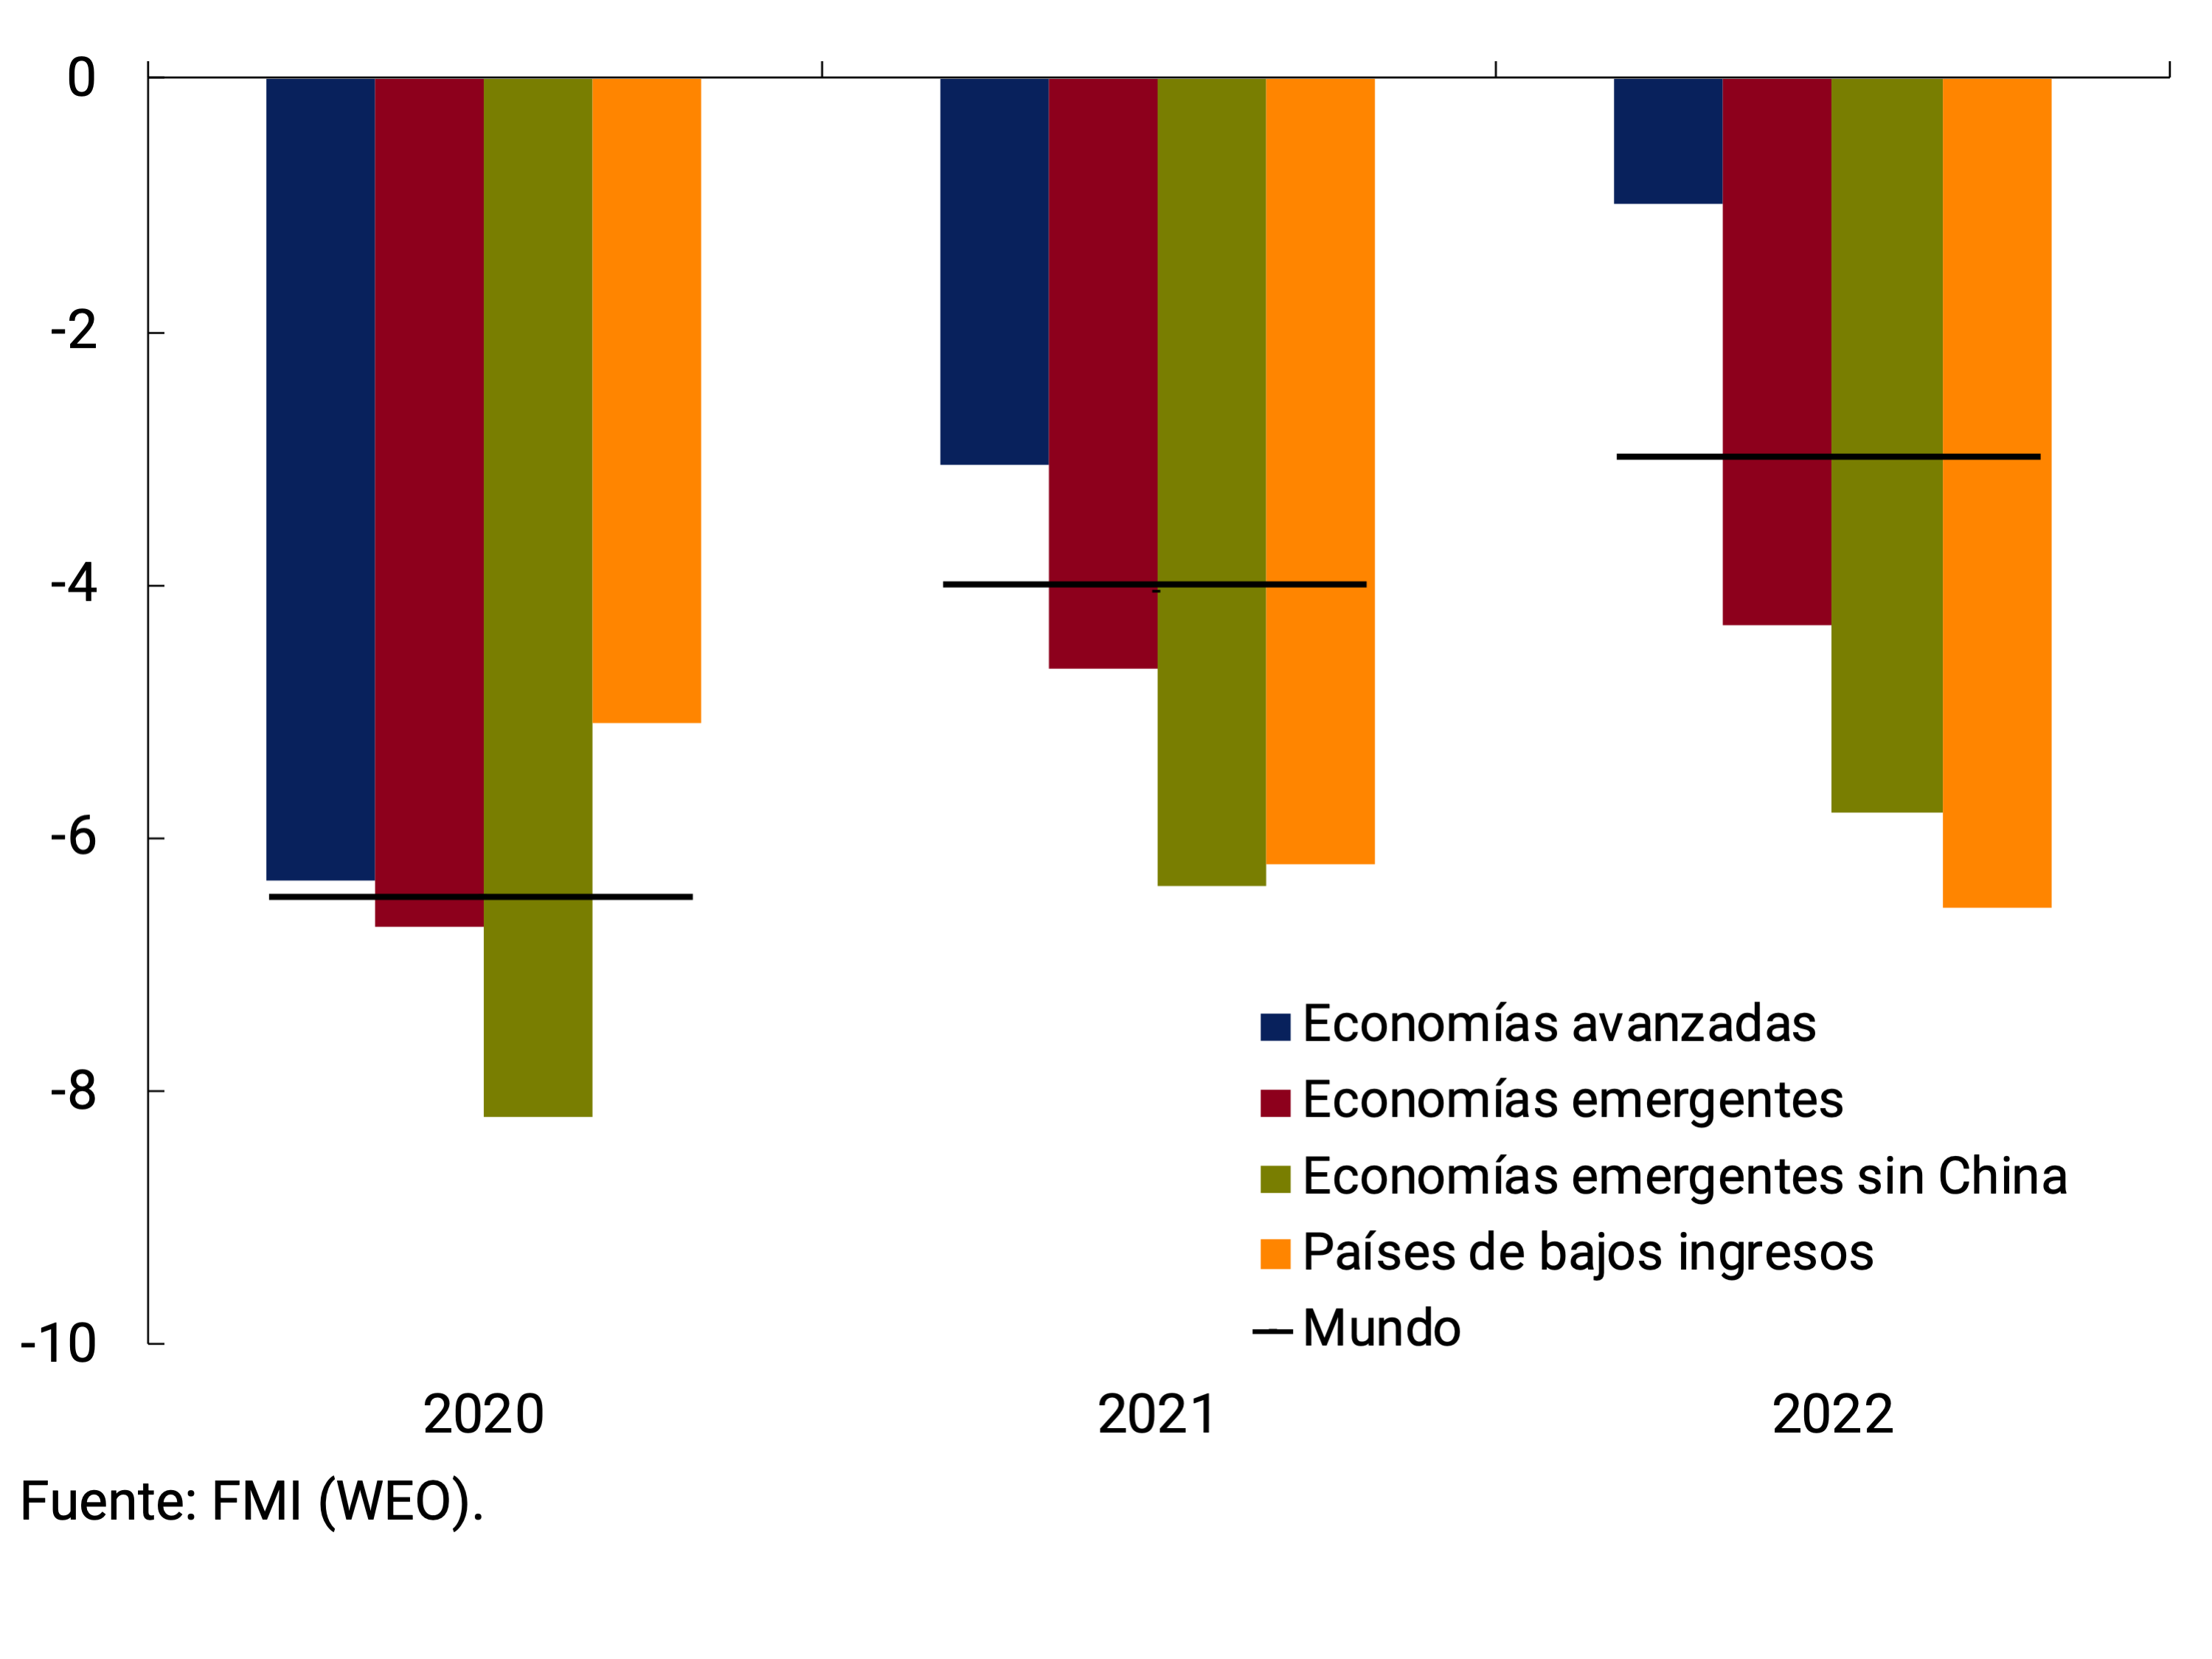
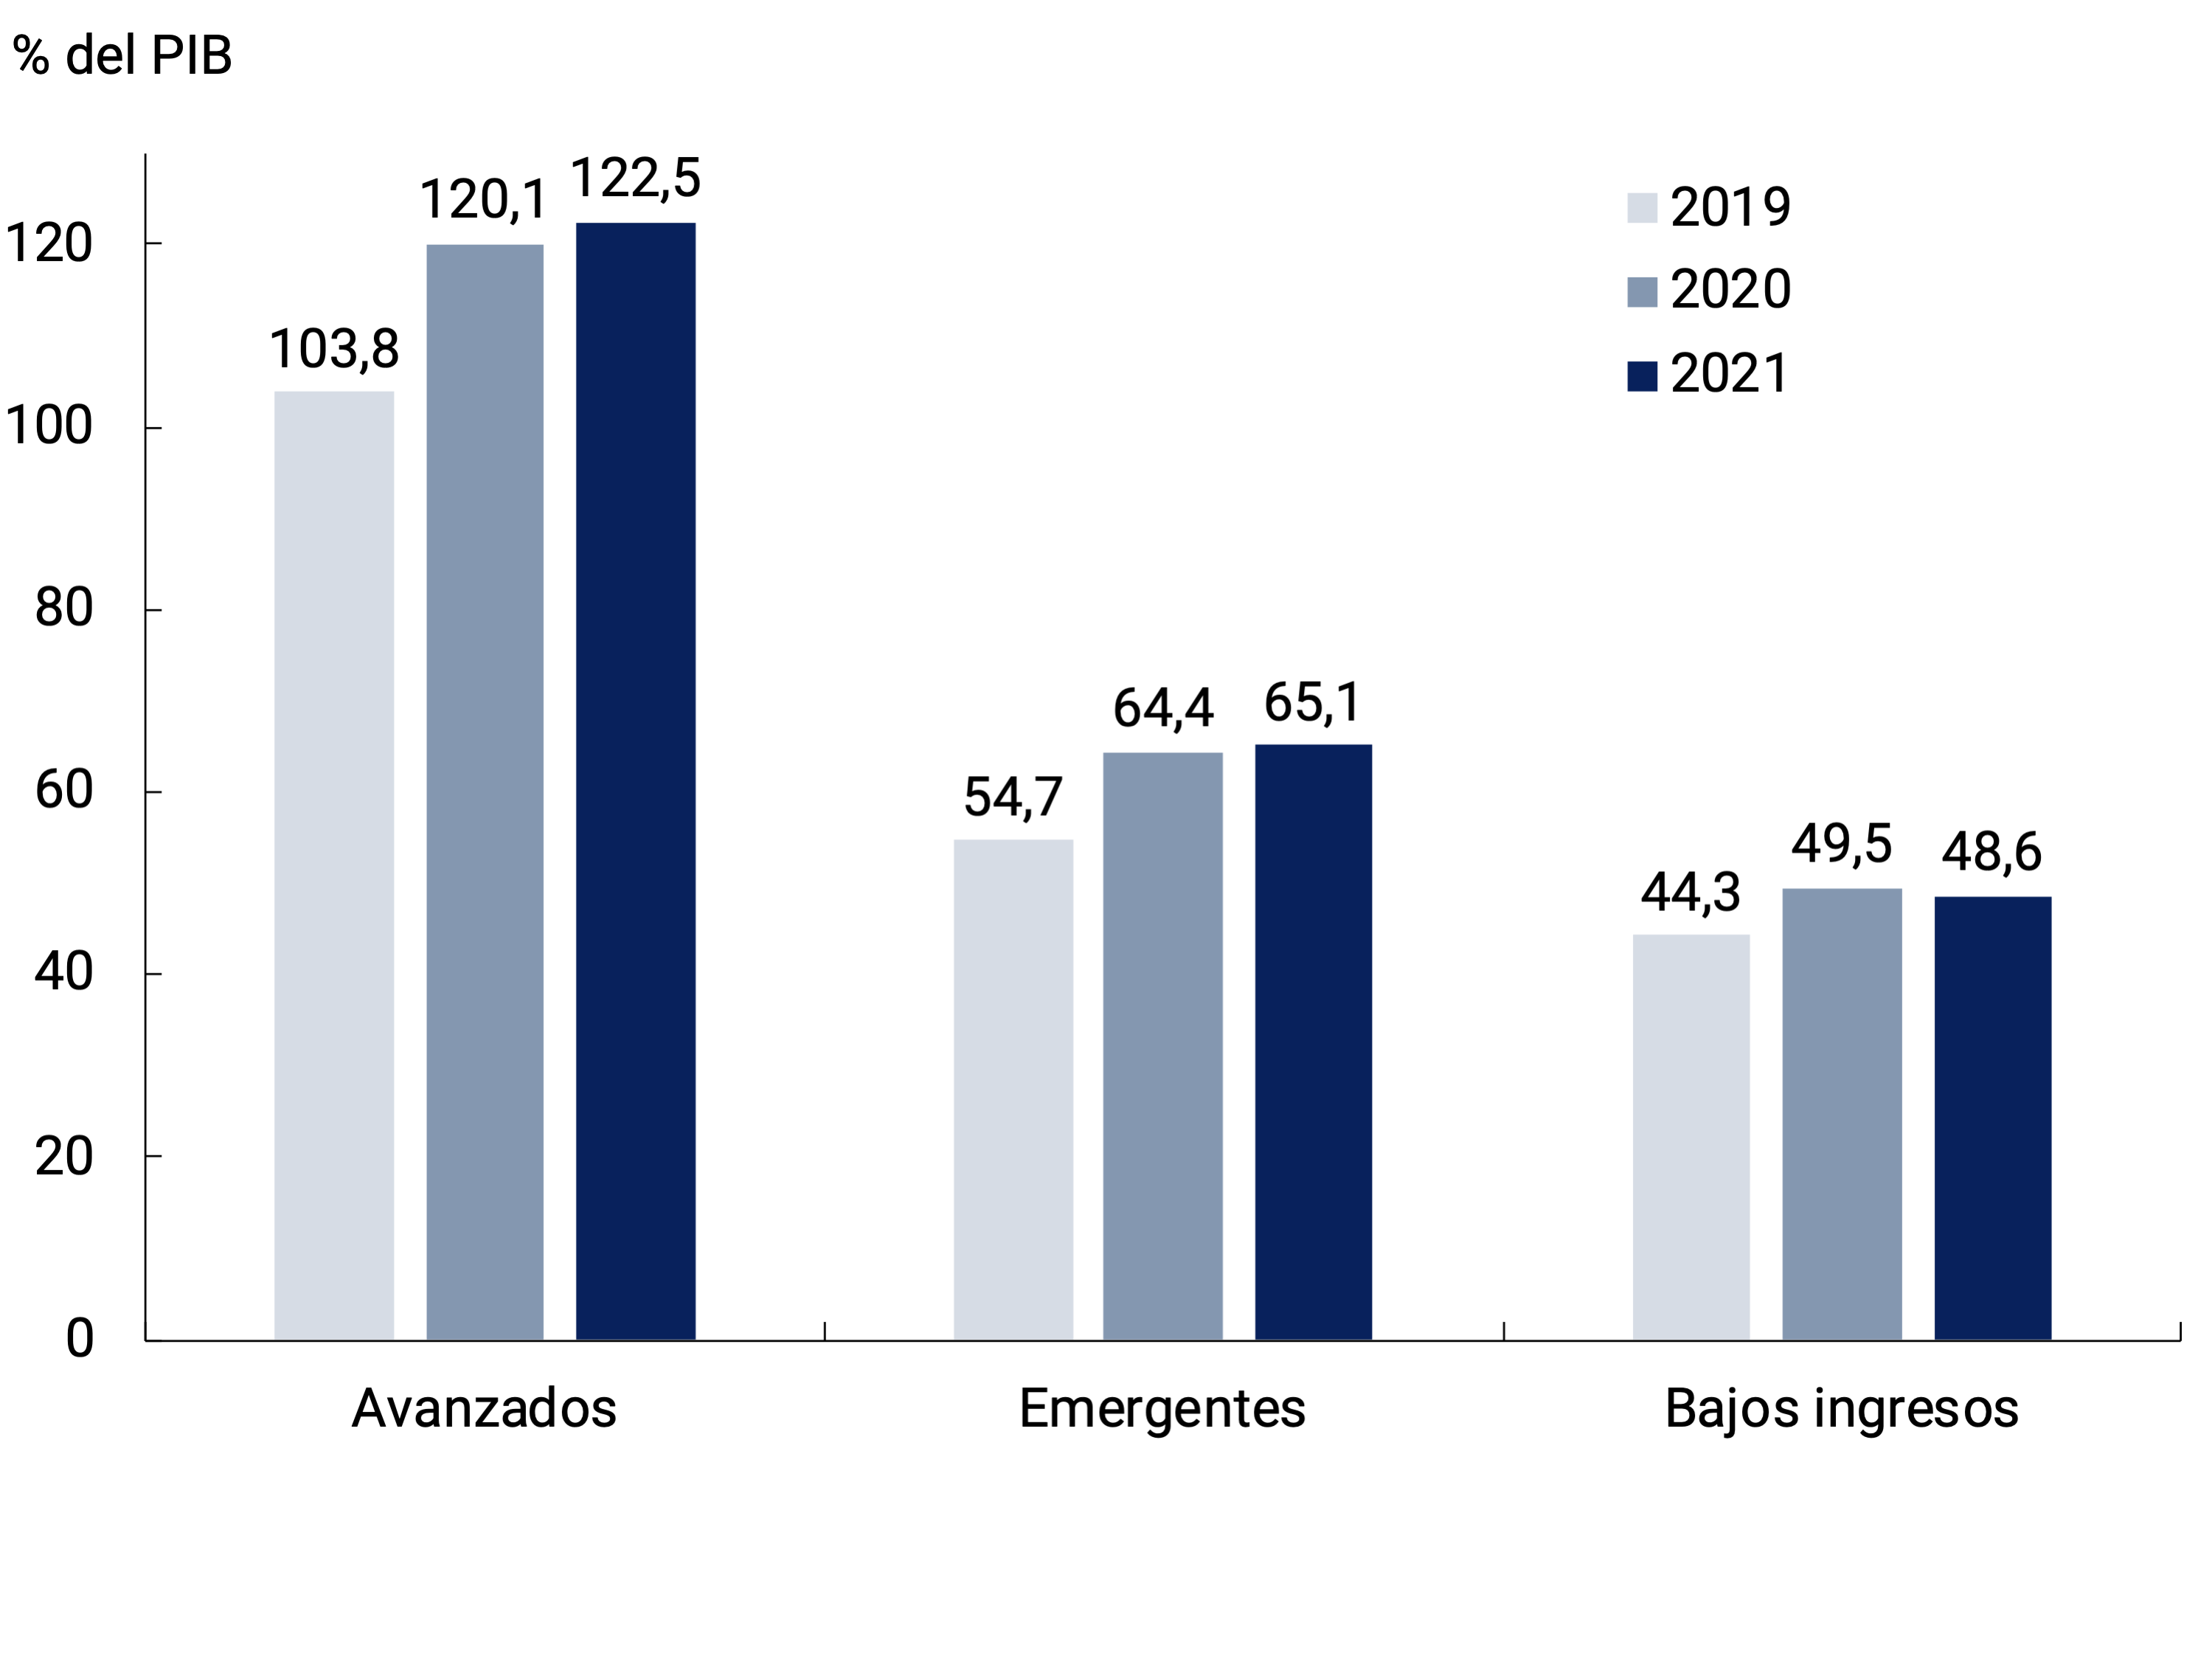
The fiscal bias measures estimated by the IMF, which try to “clean up” the effects of the business cycle on public accounts, show that for this year advanced economies would maintain the expansionary bias, while emerging economies would reduce it. Thus, the fiscal deficit adjusted for the economic cycle would remain stable in the former (from -9.0% in 2020 to -8.8% of GDP in 2021) and fall more significantly in the latter (from -8.1% to -7.3% of GDP). This fiscal dynamic, together with the expected recovery in economic activity, would lead to a more moderate increase in debt-to-GDP ratios at the global level this year compared to what was observed in 2020 (see Figure 2.14b).
Figure 2.14 | (a) Financial performance of the public sector
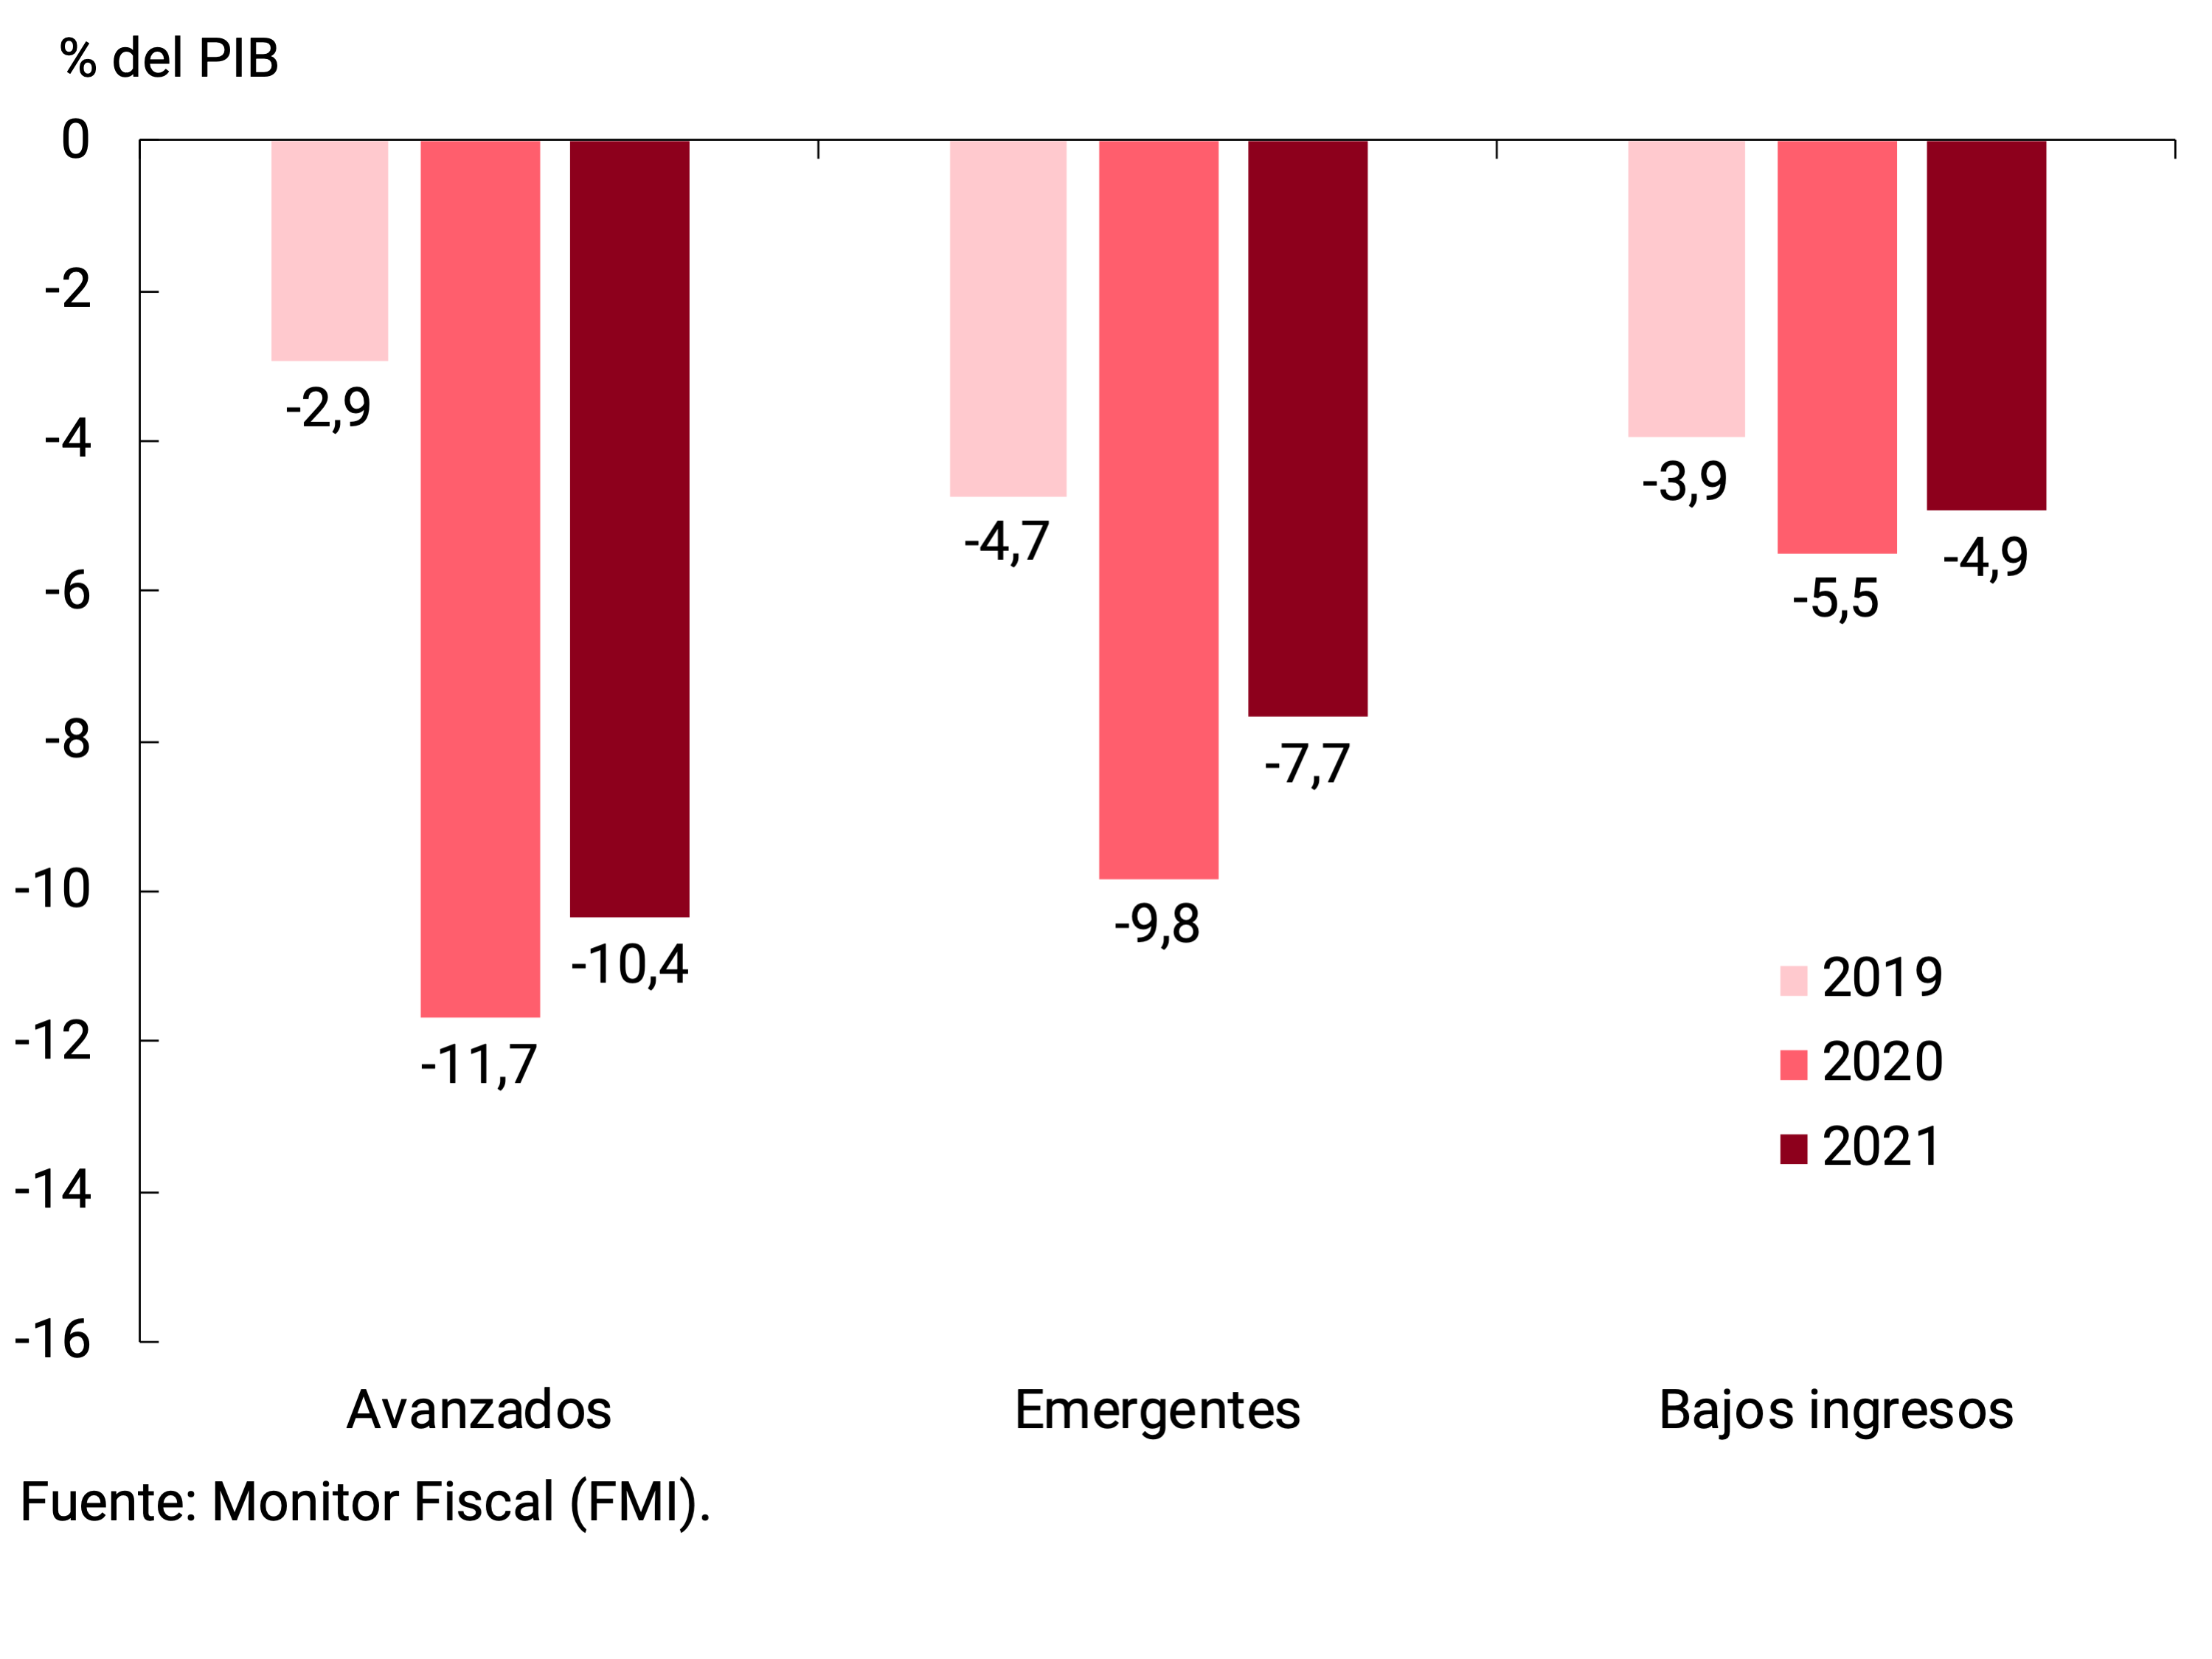
Figure 2.14 | (b) Gross public debt
Despite the increase in the debt burden, interest payments have remained limited, in general, given the low levels of interest rates driven by the expansive monetary policies of advanced countries and many emerging countries. However, for some middle-income and low-income countries, financing large deficits remains a challenge, given limited market access and limited scope for tax collection in the short term. In this context, higher interest rates, particularly in advanced countries, would put pressure on the dynamics of public accounts, especially on the possibilities of access to financing for emerging and developing countries.
Along with national responses, multilateral economic measures have been taken to address the crisis (see Section 2 / The need for a coordinated international approach to the IPOM crisis of May 2020). These include: currency swaps between central banks; the suspension of official public debt services for low-income countries by the G20, together with a common framework to deal with debt problems beyond this suspension; special financing lines from the IMF, the World Bank and multilateral development banks; and the relaxation of financial system rules by the Financial Stability Board (FSB).
The measures have been effective, but they cover a limited range of countries: the amount allocated to high- and low-income countries is estimated to account for 70% of multilateral financial assistance. Many developing economies have been left out of this coverage. The measures taken so far also revealed the limitations of the current tools of international organizations in terms of middle-income countries; or countries that do not qualify as either solid or low-income. That is why the G20’s decision to push for a new allocation of Special Drawing Rights (SDRs), and to explore the recirculation of surplus SDRs, is essential (see Section 1 / The New Allocation of Special Drawing Rights (SDRs): What It Is and What It Means for Developing Countries).
Likewise, and as part of the policies to promote inclusive and resilient growth beyond the recovery, the Italian presidency of the G20 has placed special emphasis on environmental issues, so that the growth pattern that emerges beyond the recovery fundamentally incorporates sustainability. Its treatment from the point of view of central banks is discussed in Section 2 / The challenge of central banks in the face of climate change.
2.5. In summary
The recovery of the global economy continues, but it is mixed across countries and subject to a variety of risks. Outbreaks and new variants of the virus, together with vaccination campaigns disparate in scope and speed between countries, are today the main limit to the continuity of the recovery. The greater intensity of fiscal support in advanced economies justifies the upward revision of growth forecasts; But there is still a risk of premature withdrawal of support measures in many countries, including those with less policy space. Divergence in health and support responses would deepen inequality between countries, and even within them. Some of the risks marked in the previous IPOM, such as the rise in medium- and long-term interest rates in the United States, have partially materialized: the risk is that the next hikes will be more abrupt and surprise the market, driving new capital outflows. Overall, the disconnect between the booming financial markets and the performance of the economy remains, along with the risks of private and public sector insolvency, which could lead to sharp corrections in asset prices.
3. Economic Activity and Employment
Economic activity continued to improve in the first quarter of 2021, favored by the measures taken by the National Government and the BCRA in the face of the health emergency, the authorization of economic activities under protocol rules and the implementation of the vaccination process against COVID-19. This recovery partially attenuated the sectoral heterogeneity, based on the progress in the activities most sensitive to the pandemic.
The sharp rise in COVID-19 cases observed since March led the National Government, in coordination with provincial authorities, to take measures to contain infections. Partial and specific mobility restrictions were implemented in each jurisdiction, considering the improvement of the health system in the last year and the progress of vaccination, which was added to the validity of sanitary protocols in the various productive activities. Based on the deterioration of the epidemiological situation, the Government recently temporarily reinforced the restrictions, complementing them with policies to support the affected sectors and households, in order to limit the impact on the social and productive fabric.
Economic activity could slow down due to the impact of the second wave of infections during the second quarter. The health measures adopted that temporarily restrict activity in some sectors, lower consumption due to the reduction in mobility, the fear of contagion and the consequent increase in economic uncertainty affect the normal development of production.
Going forward, the main risk factor is associated with greater difficulty in containing the pandemic from the appearance and circulation of new variants of the virus, which could be more contagious, and could lead to closures of activities and isolations for a longer time than expected. On the other hand, the ongoing vaccination process and a positive effect of the measures recently adopted could limit the duration and intensity of this second wave, allowing the impact on the economy to be less. Thus, the improvement in the health situation would allow economic activity to resume the pace of expansion.
3.1. The second wave of infections would temporarily impact an economy that was approaching its pre-pandemic levels of activity
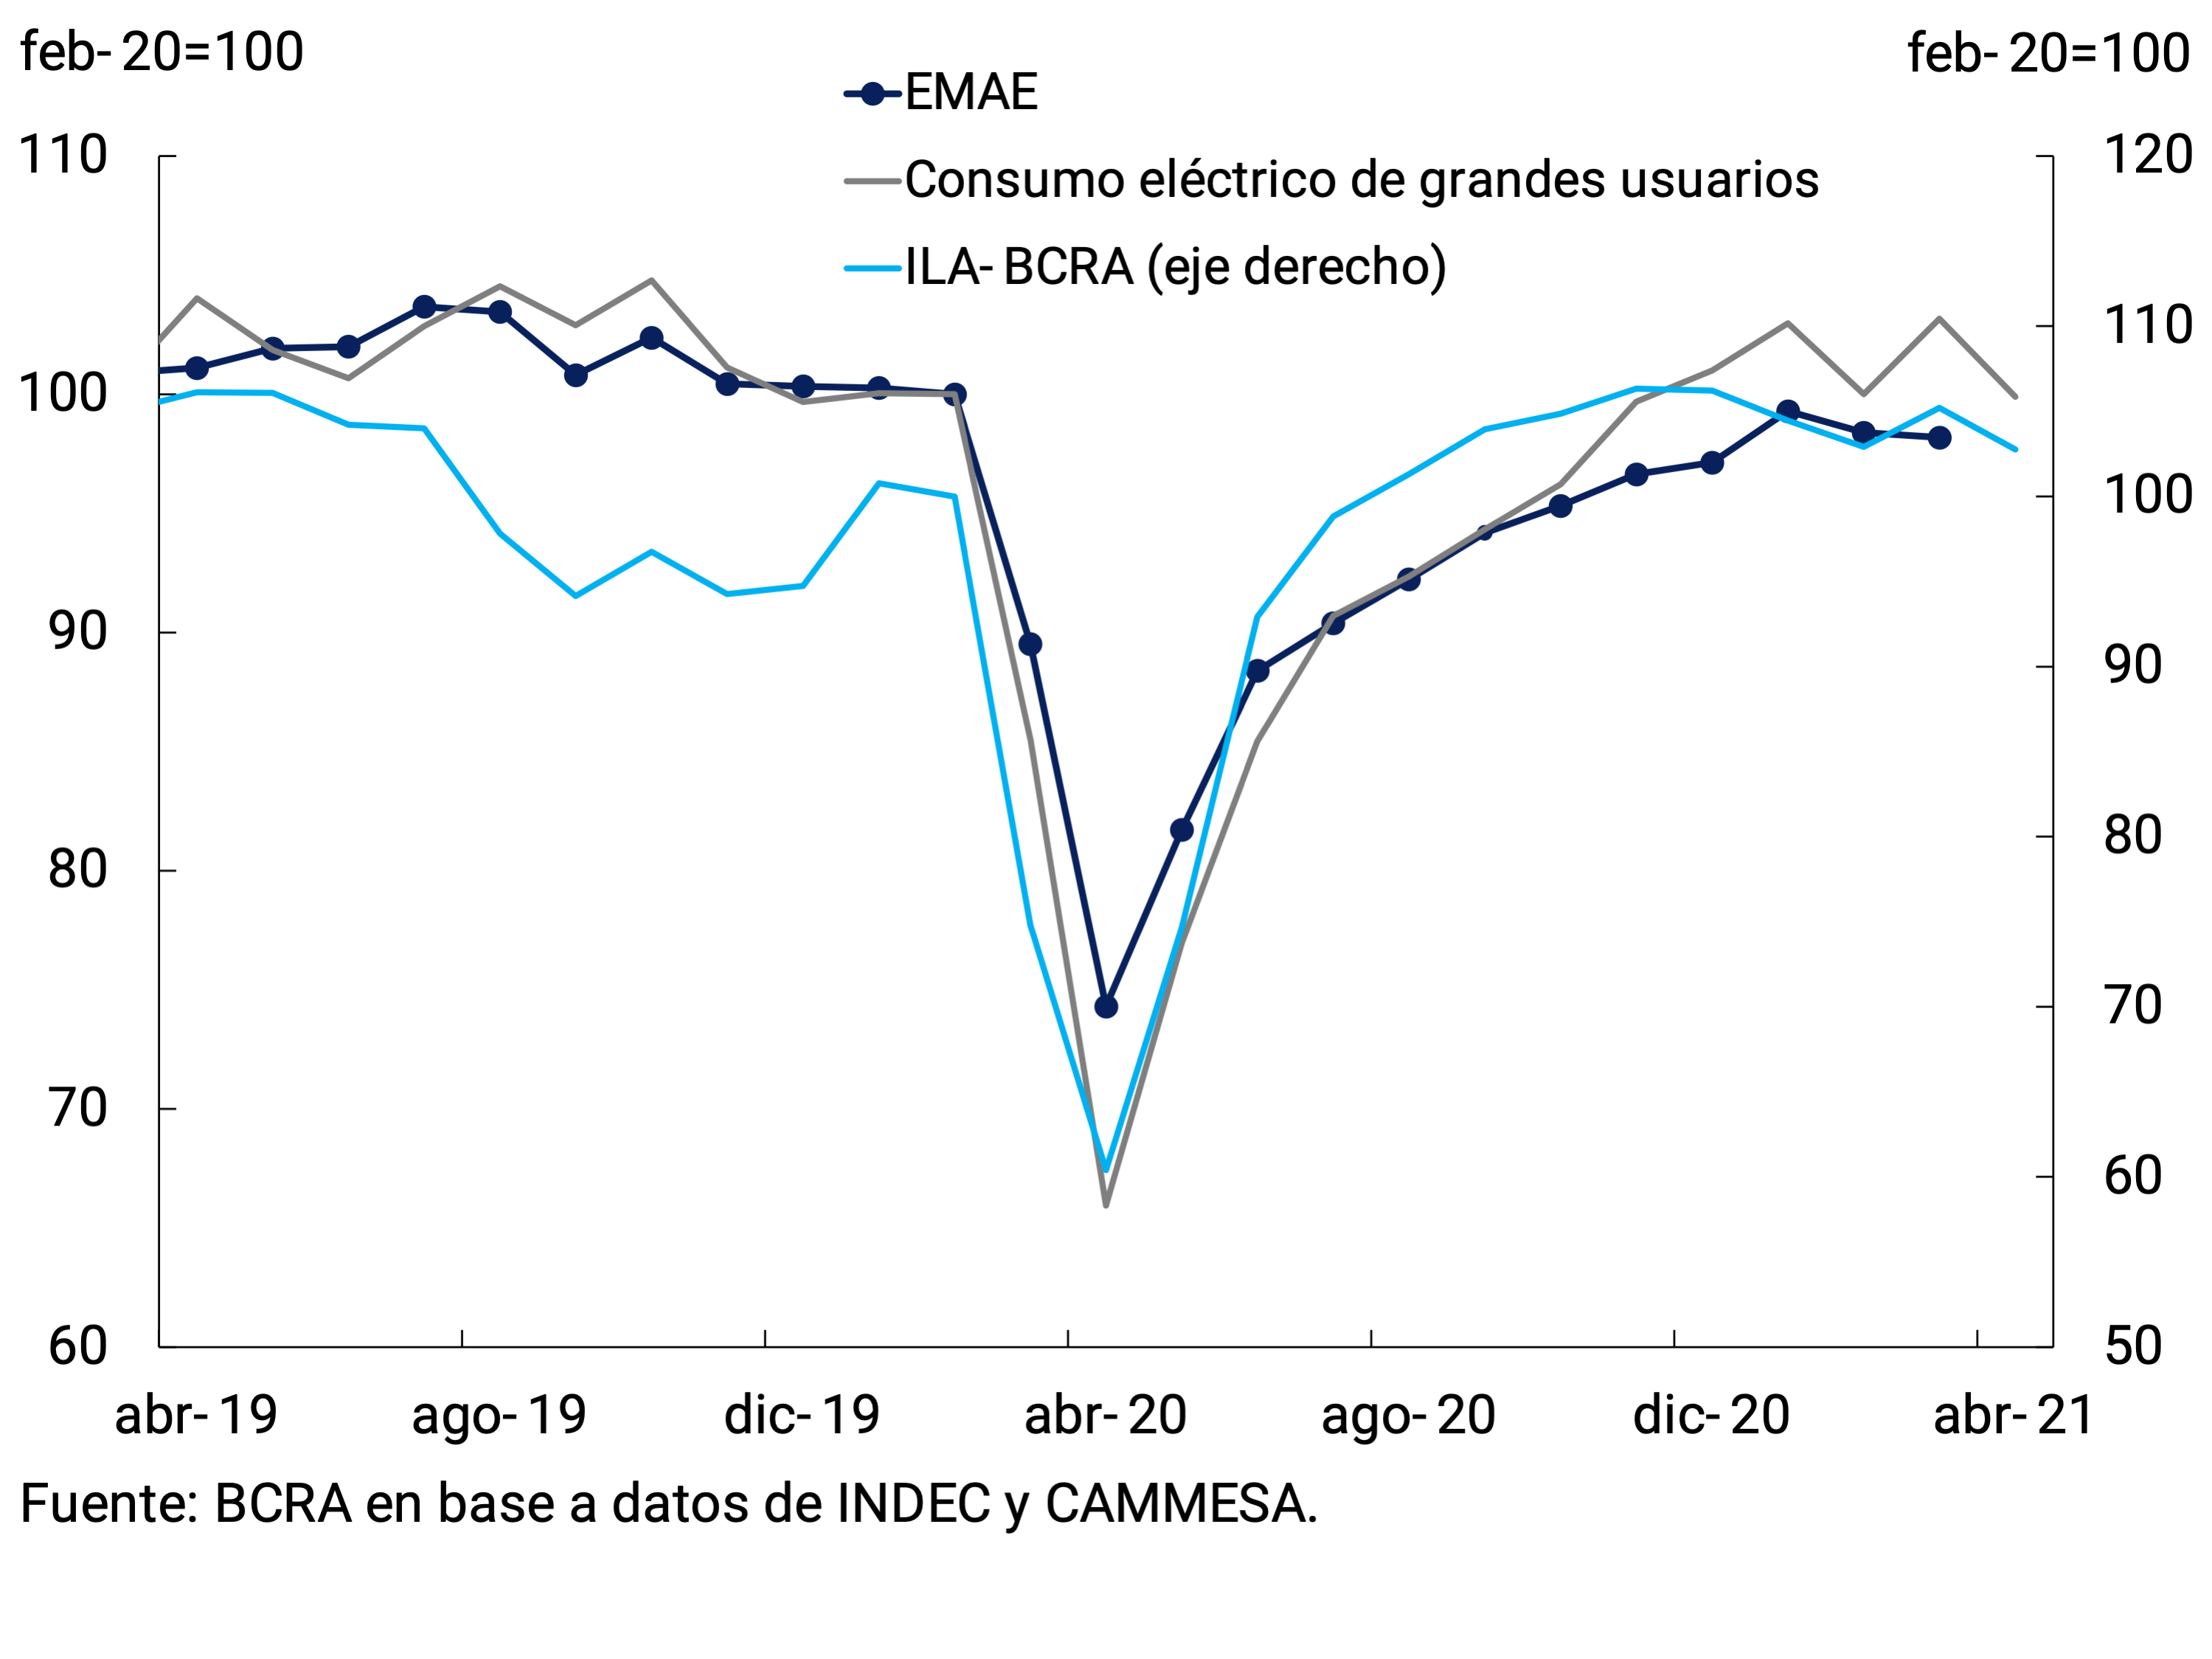
At the beginning of the year, economic activity continued to recover. The Monthly Estimator of Economic Activity (EMAE) adjusted for seasonal factors (s.e.) was 11.4% above the level of March 2020 in March 2021 and just 1.8% below the seasonally adjusted level of February 2020, the month prior to the spread of COVID-19 in the country. In the first quarter of the year, activity showed a growth of 2.3% s.e. compared to the previous period.
At the beginning of the second quarter, the materialization of a second wave of infections and the rapid deterioration of the health situation led to the implementation of restrictions on mobility – although of less intensity and duration than those in force a year ago – and revived uncertainty regarding the normal development of activity over the coming months.
The first high-frequency data for the month of April anticipate a limited contraction in activity. The electricity consumption of large users of CAMMESA3 adjusted for seasonal factors fell to reach the level of last February, which is very similar to those of the pre-pandemic (February 2020). This performance of electricity demand reflected the reduction in the mobility of people at night, the closure of shopping malls and gastronomic establishments, and also the lower activity in Vaca Muerta and the surrounding region as a result of the road blockades that took place during most of the month due to the union conflict of health workers (see Figure 3.1).
Figure 3.1 | Economic activity
The level of activity would register transitory falls during the second quarter, although for the rest of the year there are factors that play in favor of a good economic performance. In this scenario, once the epidemiological situation is controlled, the economy would resume the path of expansion in the third quarter and the year would show a recovery compared to the previous year, although sectoral heterogeneity will persist.
Among the factors that operate in favor compared to last year are, in the first place, greater knowledge about the contagiousness of the coronavirus, learning about the management of the pandemic, the progress of the vaccination campaign and the adaptability of individuals and economic sectors to the operation with health protocols and virtuality. In the same vein, global growth, greater international liquidity and high commodity prices compared to a year ago (see Chapter 2. International Context).
3.1.1. The recovery in demand continued to be led by the great dynamism of Investment
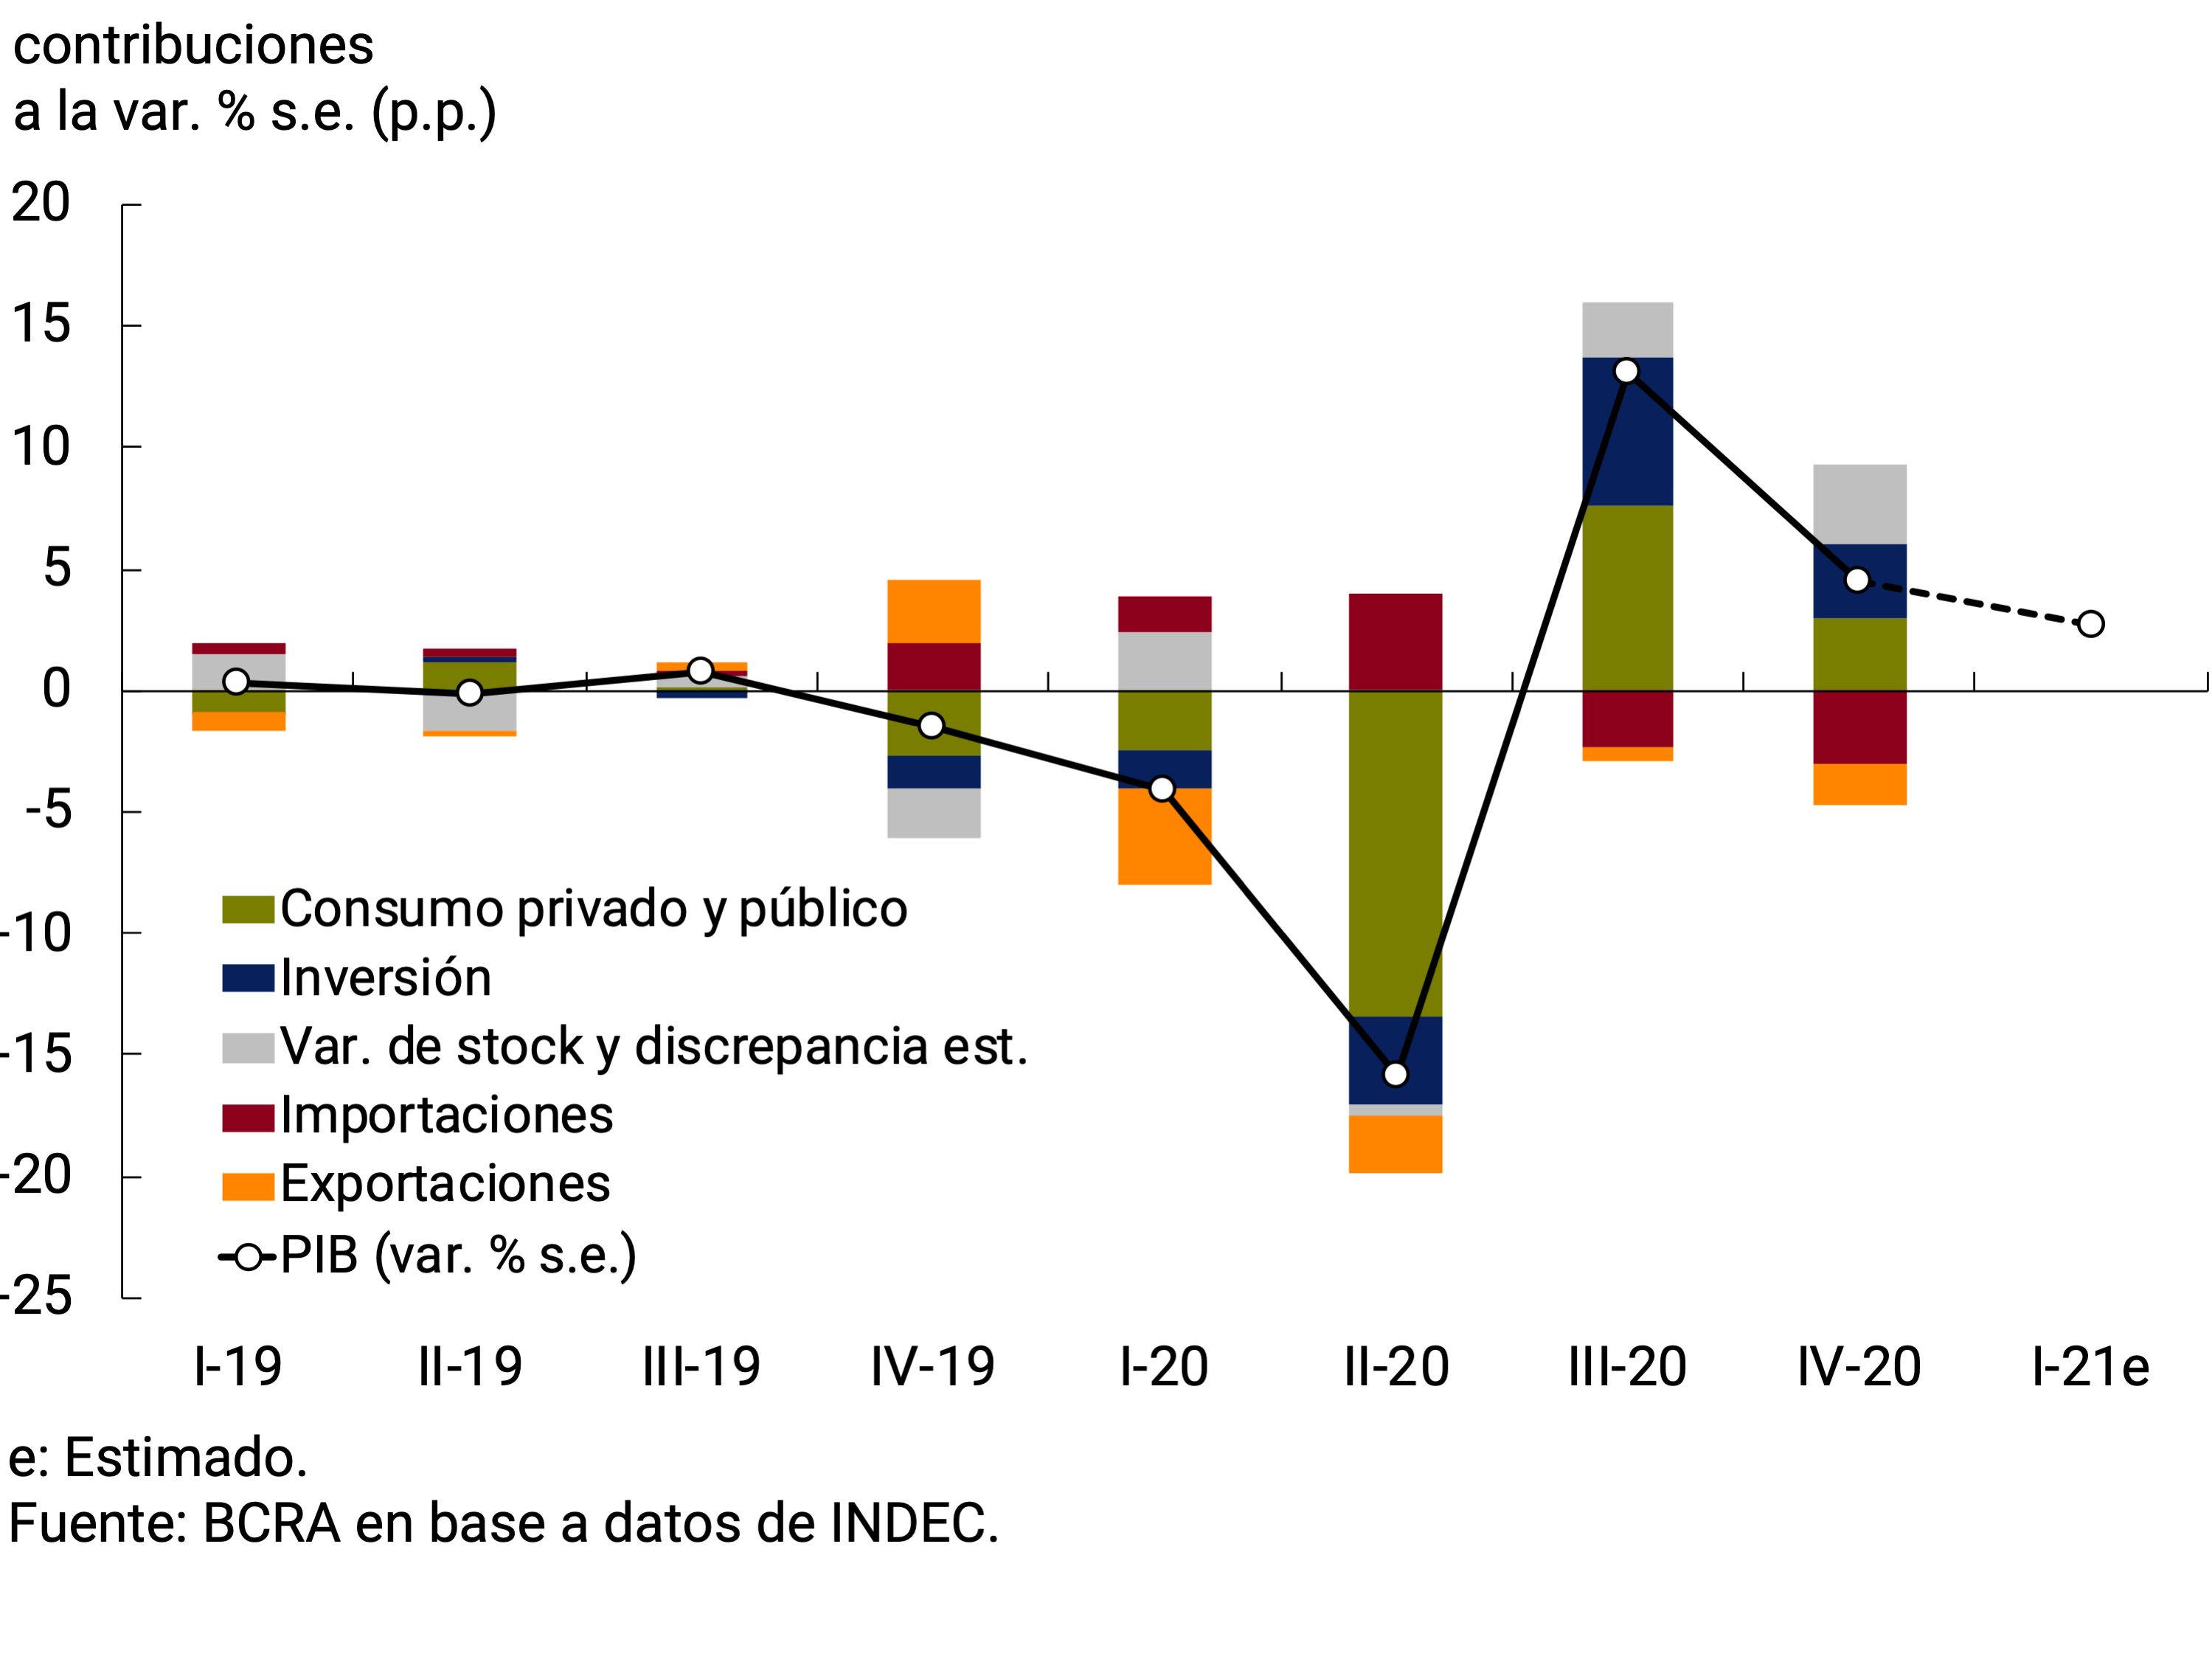
In the last quarter of 2020, GDP recovered 4.5% quarter-on-quarter (-4.3% y.o.y.) but domestic demand – total domestic expenditure on consumption and investment – in seasonally adjusted terms expanded again at a faster pace. Private consumption grew 4.2% qoq s.e. (-8.1% y.o.y.), public consumption increased 1.3% s.e. (-2.6% y.o.y.) and Investment4 again experienced a strong rebound, of 17.3% qoq s.e. (15.9% y.o.y.).
In terms of the contribution5 to quarterly GDP growth of each of the components of aggregate demand, Total Consumption and Investment both contributed 3 percentage points (p.p.) while the accumulation of stocks6 set a historical record of 3.3 p.p. of positive impact. On the other hand, the net external sector subtracted 4.8 p.p. from the quarterly variation in GDP, due to the increase in imports (-3 p.p.) and the fall in external demand (-1.8 p.p.; see Chart 3.2).
Figure 3.2 | Quarterly GDP and Contributions of Demand Components
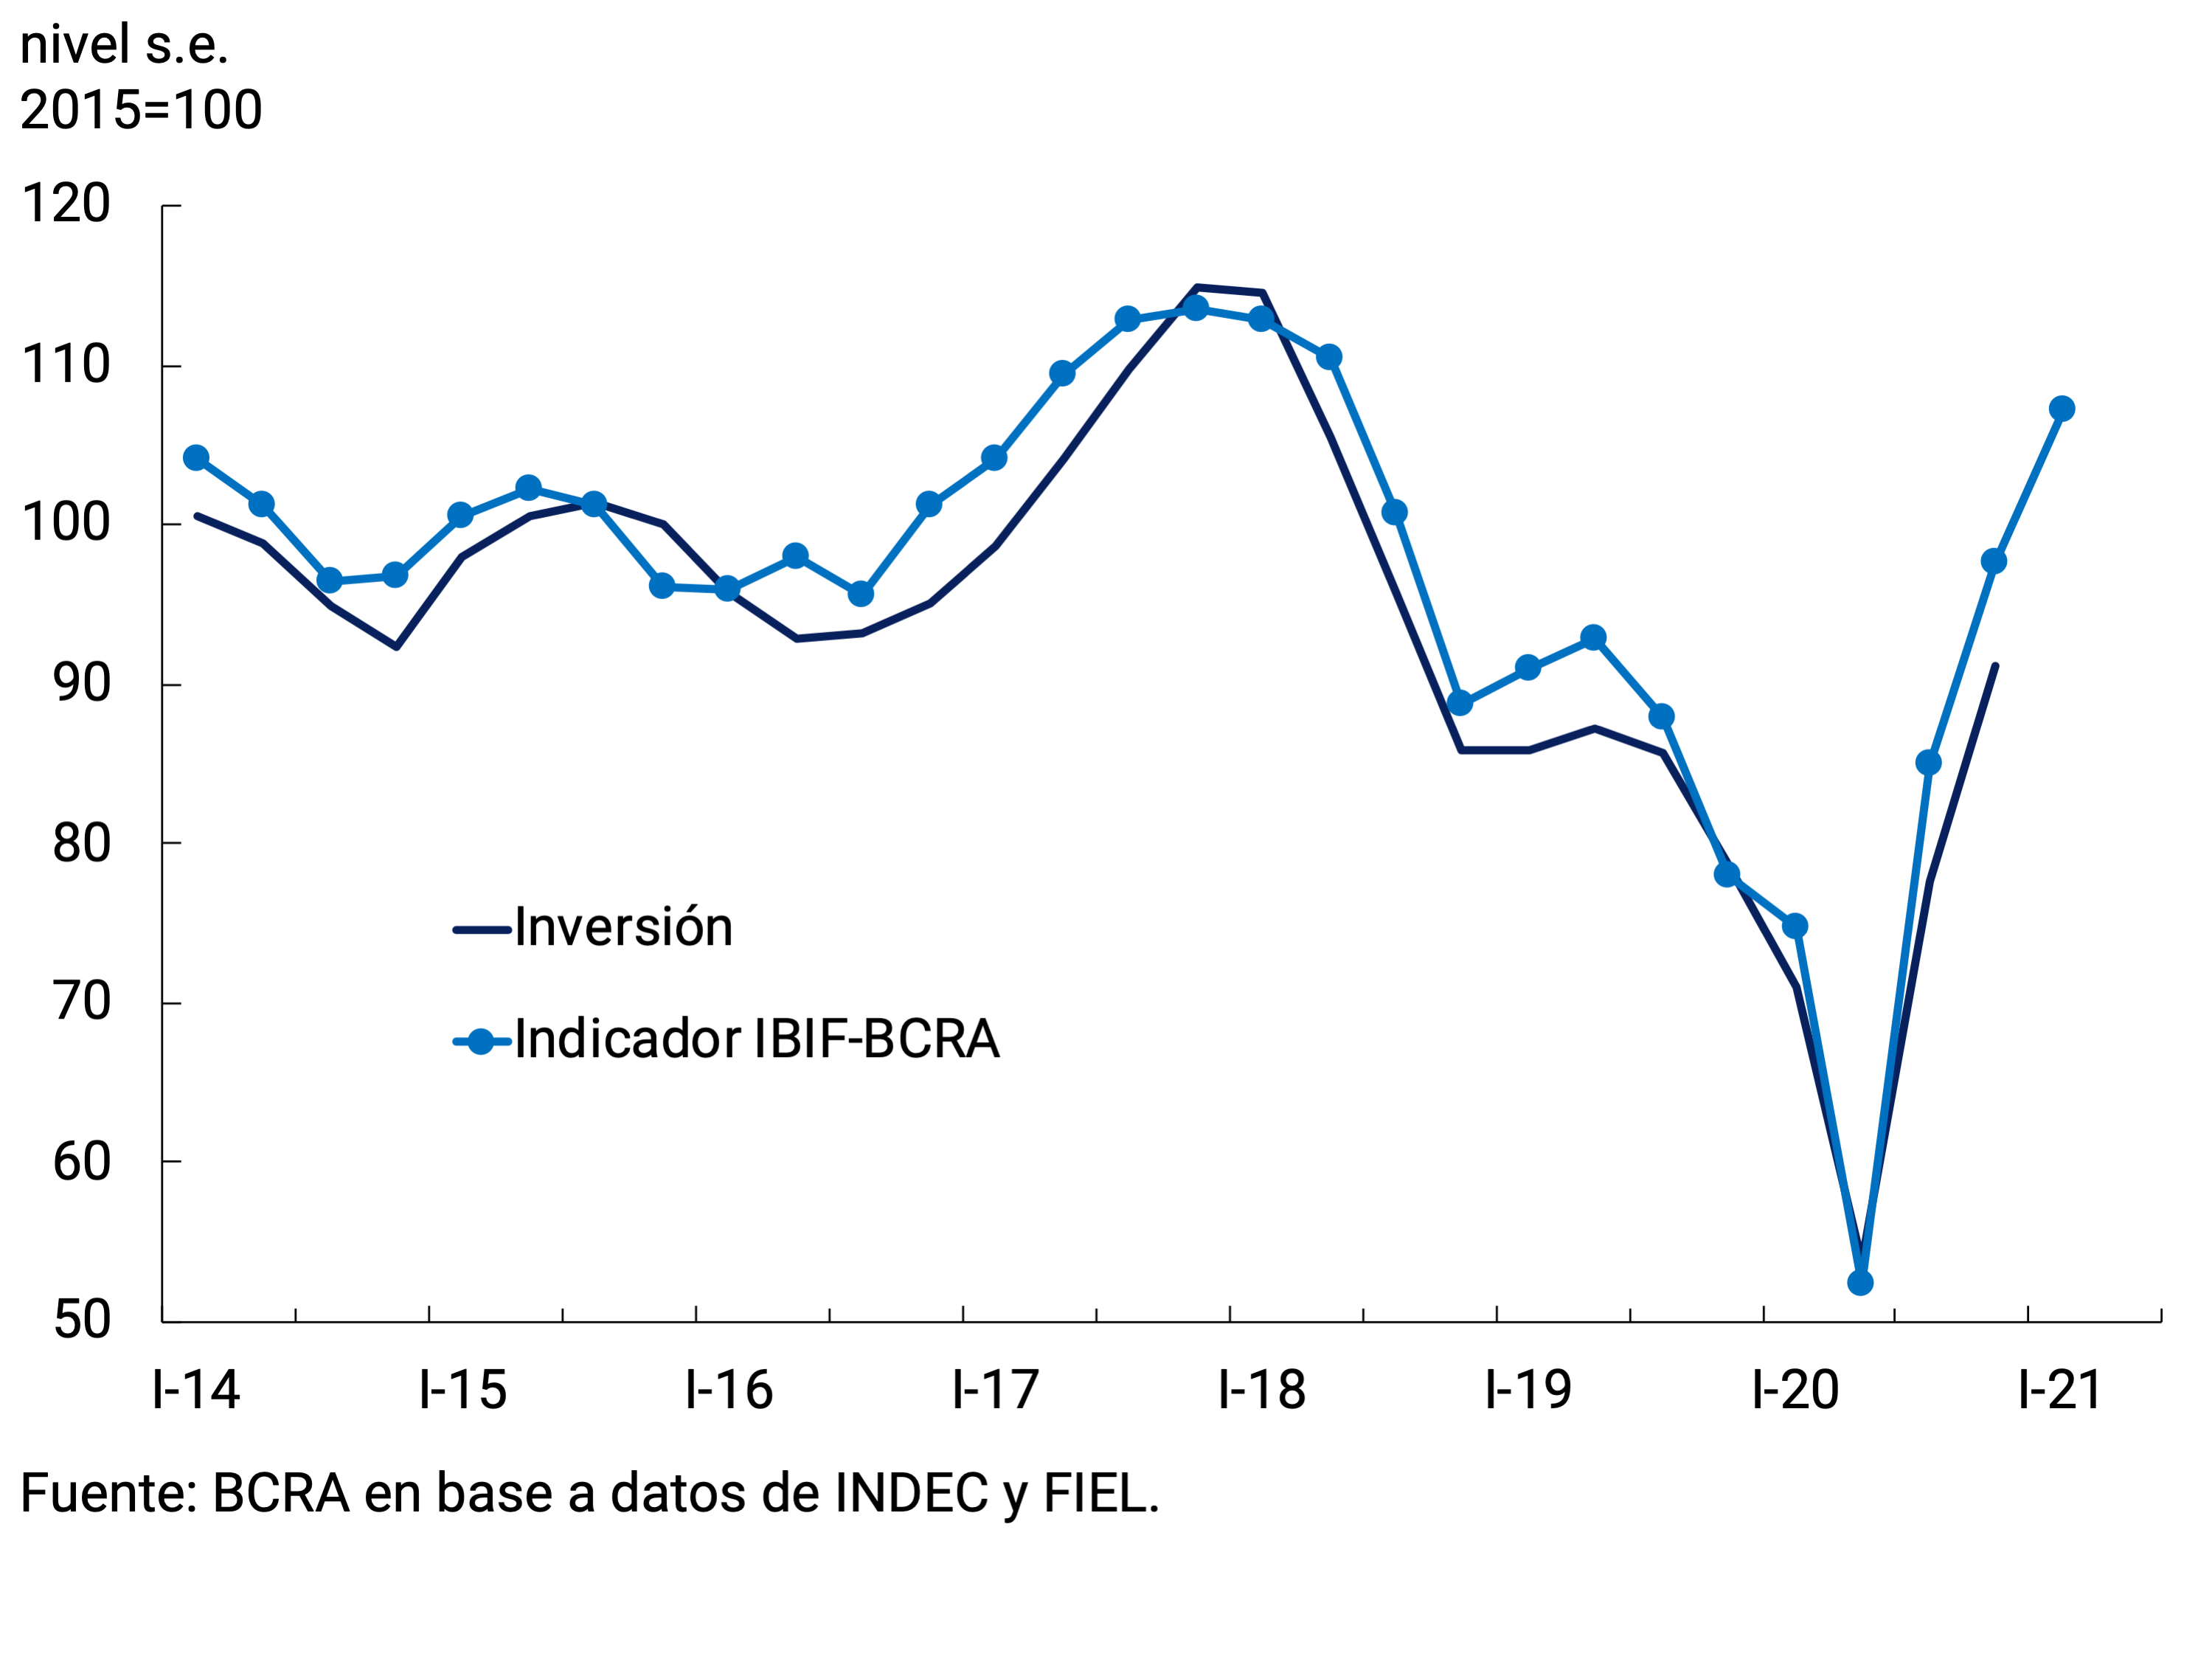
Advance data for the first quarter of 2021 allow us to anticipate a new rebound in investment that would place it at seasonally adjusted levels similar to those of 2018 (see Figure 3.3). The IBIF-BCRA indicator showed a quarterly increase of 9.8% s.e. with increases in both construction and spending on durable production equipment7. Investment is expected to grow by around 40% compared to a year ago, led both by the dynamism of the construction sector and by purchases of agricultural machinery and capital goods by the industrial sector.
Figure 3.3 | Investment Evolution
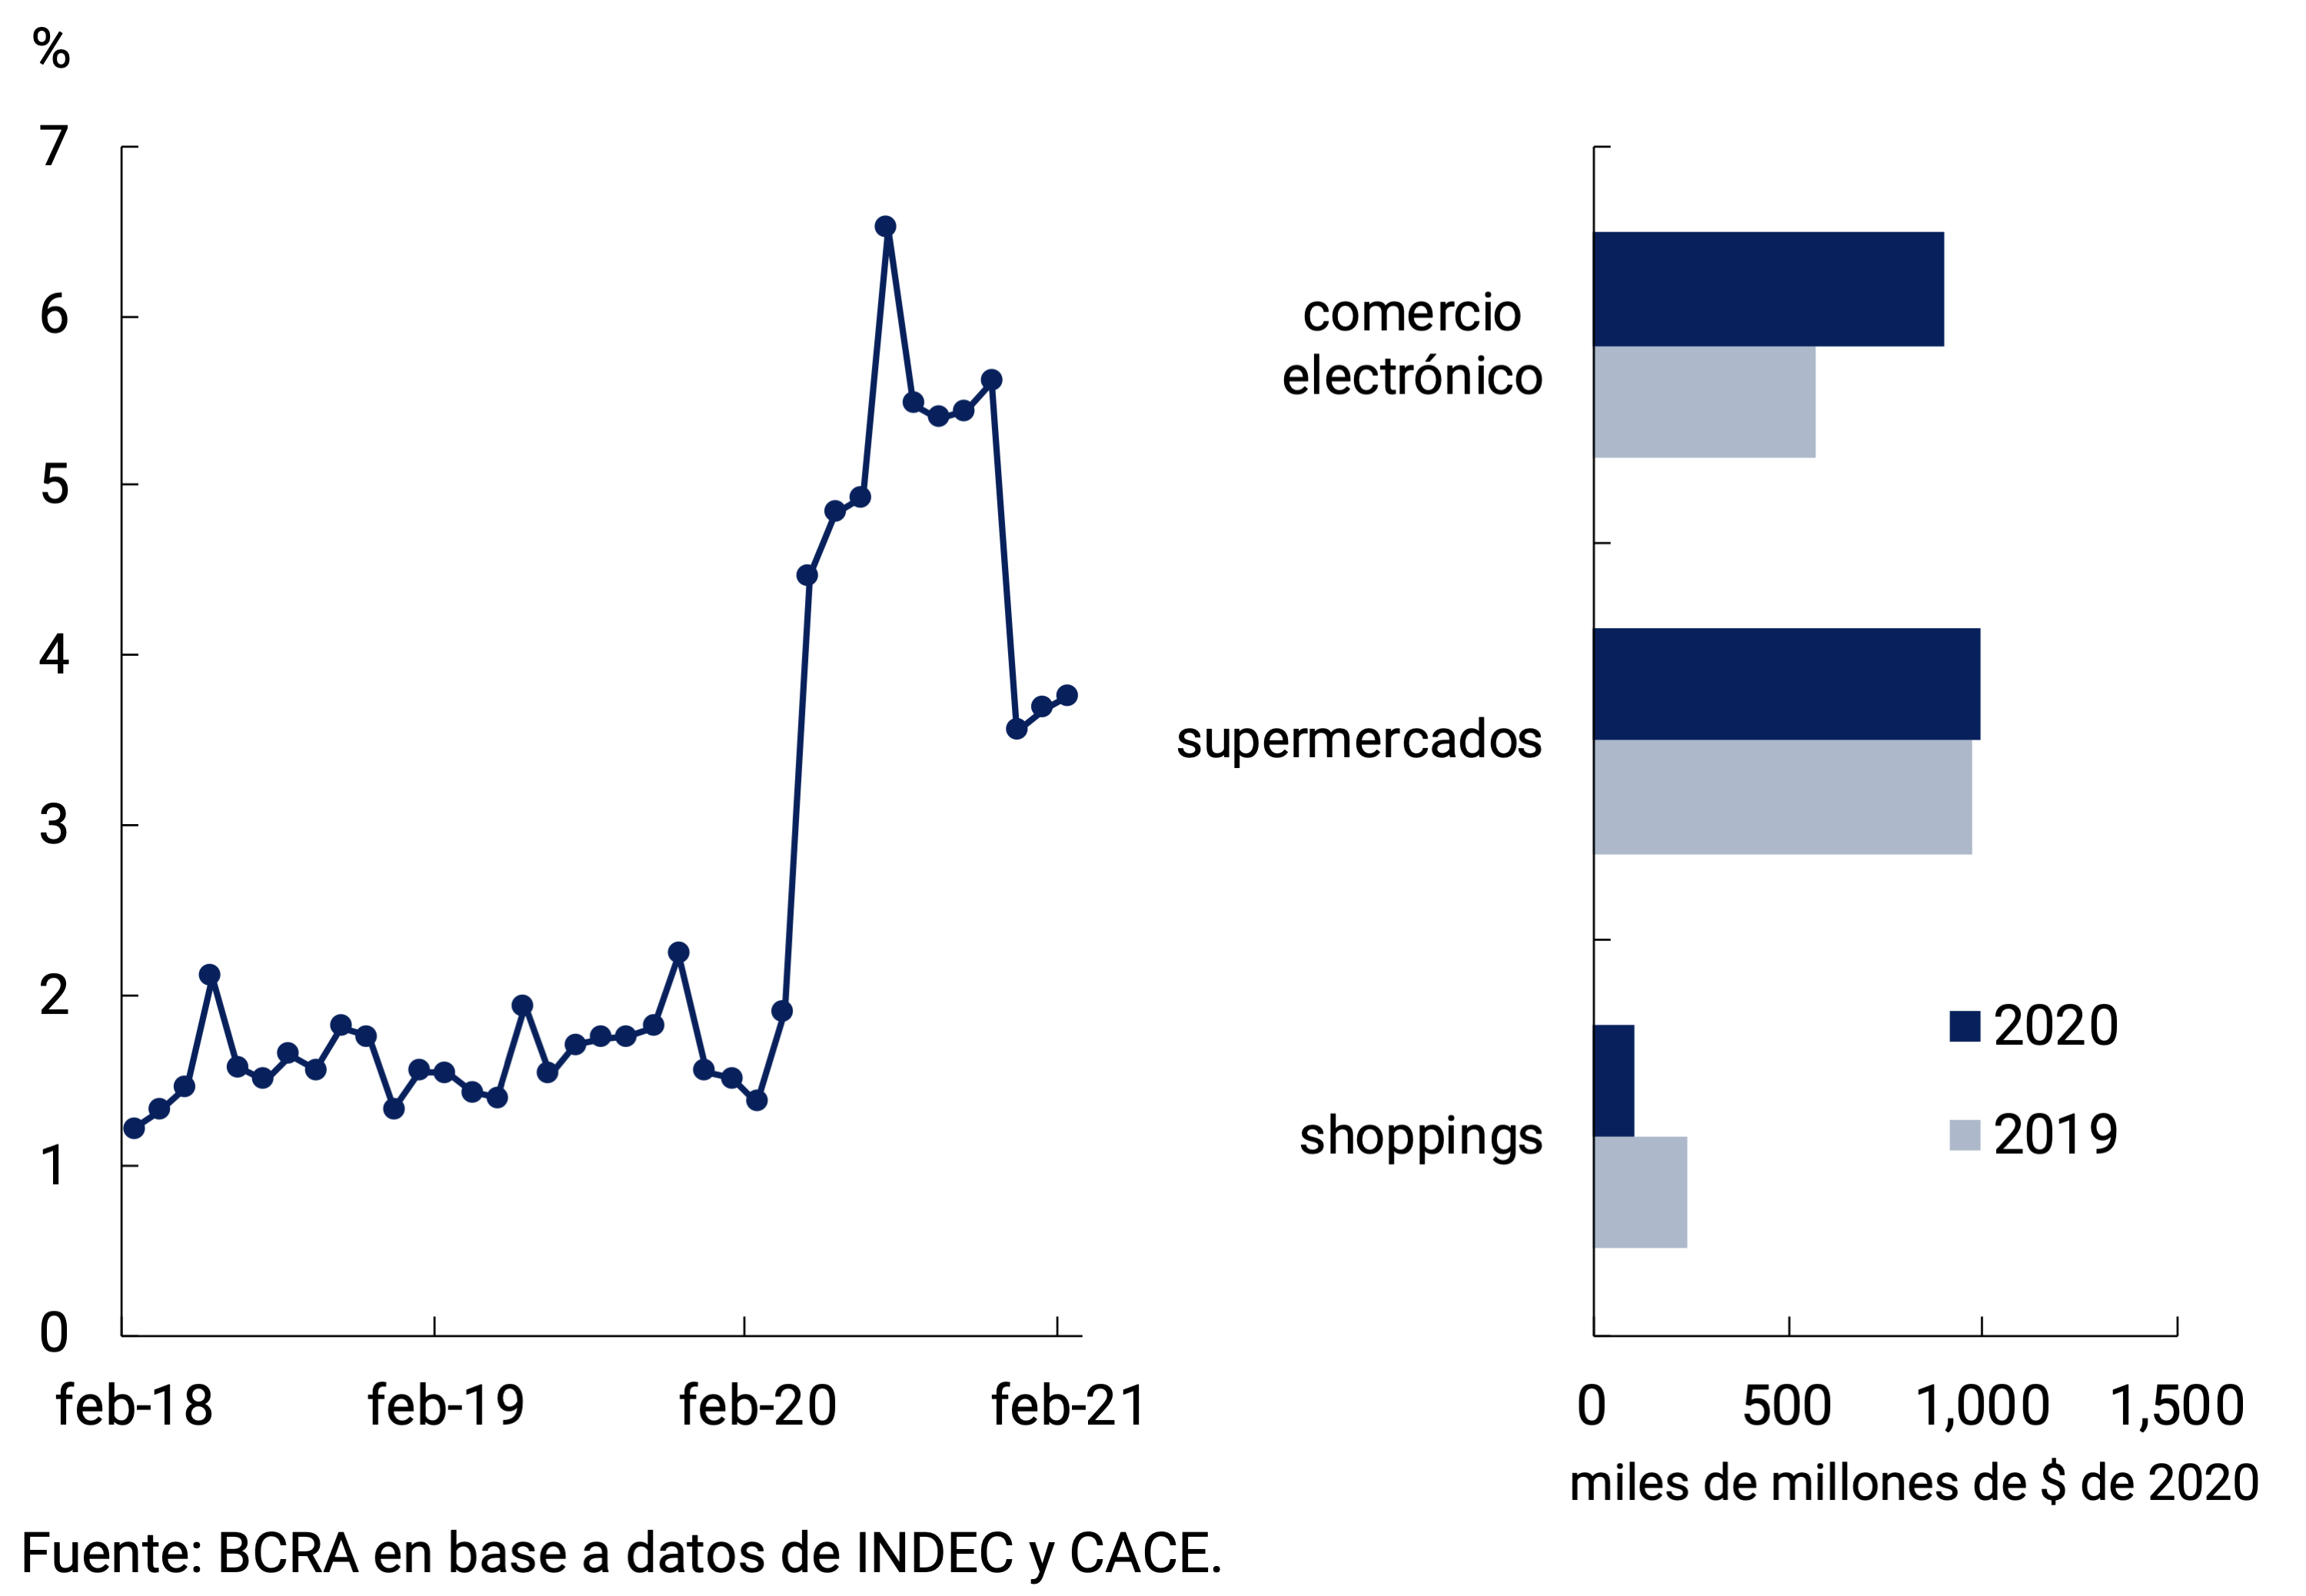
Private consumption had moderate growth during the fourth quarter of 2020, standing 8.3 p.p. below the pre-pandemic level. The recovery in household incomes was driven by independent and informal employment, while the formal wage bill was more stable throughout that year (see Employment Section). With partial data from the first quarter of 2021, the BCRA’s Private Consumption Indicator showed an improvement of 3% s.e. compared to the previous quarter. An important factor in the evolution of household spending during the rest of the year is the greater supply of services available and the strong redirection of spending in favor of consumption through electronic channels, compared to a year ago, when the pandemic broke out. The second quarter of 2020 was the period of greatest impact of this unusual shock that motivated the development of new digital platforms to which both consumers and firms gradually adapted.
According to the survey of the Argentine Chamber of Electronic Commerce8 in 2020, e-commerce turnover grew in 2020 by 124% compared to 2019 and the number of products sold increased 84%, with more than 1.2 million new buyers. The same survey reveals that 67% of companies in the sector are very optimistic for 20219. In supermarkets, the increase in online purchases from March 2020 was also noticeable and the participation of this modality in total turnover is still much higher than in the pre-pandemic period. In this way, total turnover via e-commerce, measured at 2020 retail prices, increased by 58% in 2020 and was close in magnitude to that of supermarkets as a whole (see Figure 3.4).
Figure 3.4 | (a) Share of online channels in supermarket sales (b) Comparative turnover
Net exports would contribute positively to aggregate demand during the first quarter of 2021. According to the information referring to the Commercial Exchange of Goods of INDEC, a partial reversal of the behavior observed during the previous quarter is expected, with a positive contribution of net exports close to 2 p.p. Quantities traded abroad registered a quarterly increase of 19.1% s.e., while imports measured at constant prices slowed down sharply, to 3.2% quarterly s.e. (see Chapter 4. External Sector).
3.1.2. The arrival of the second wave of COVID-19 would accentuate the heterogeneity of sectoral performance in the second quarter
During the fourth quarter of 2020 and the first quarter of 2021, the good performance of sectors that are very relevant to the economy was maintained, which continued to grow above their pre-pandemic levels. Services activities most affected by the crisis accelerated their recovery during that period, although they remained far from their previous levels. The second wave of COVID-19 has interrupted since April the improvement of those services that involve greater social contact. The necessary partial restrictions on movement were deepened in the last week of May and their impact could be directly or indirectly spread to other sectors. Health protocols, the strengthening of the health system and the ongoing vaccination process have allowed these restrictive measures to be, so far, less intense than those applied in March and April 2020. As a result, most productive activities will register strongly positive year-on-year growth rates in the second quarter of 2021, in some cases in double digits.
Regarding the performance since the beginning of the recovery, three groups can be identified based on the cumulative rates of change between the first two months of 2020 and the first quarter of 2021. In this way, the first available data from the EMAE in 2021 are compared with the months immediately prior to the arrival of COVID-19 in the country, following a classification similar to that used in the previous IPOM (see Figure 3.5).
Figure 3.5 | Sectoral economic activity
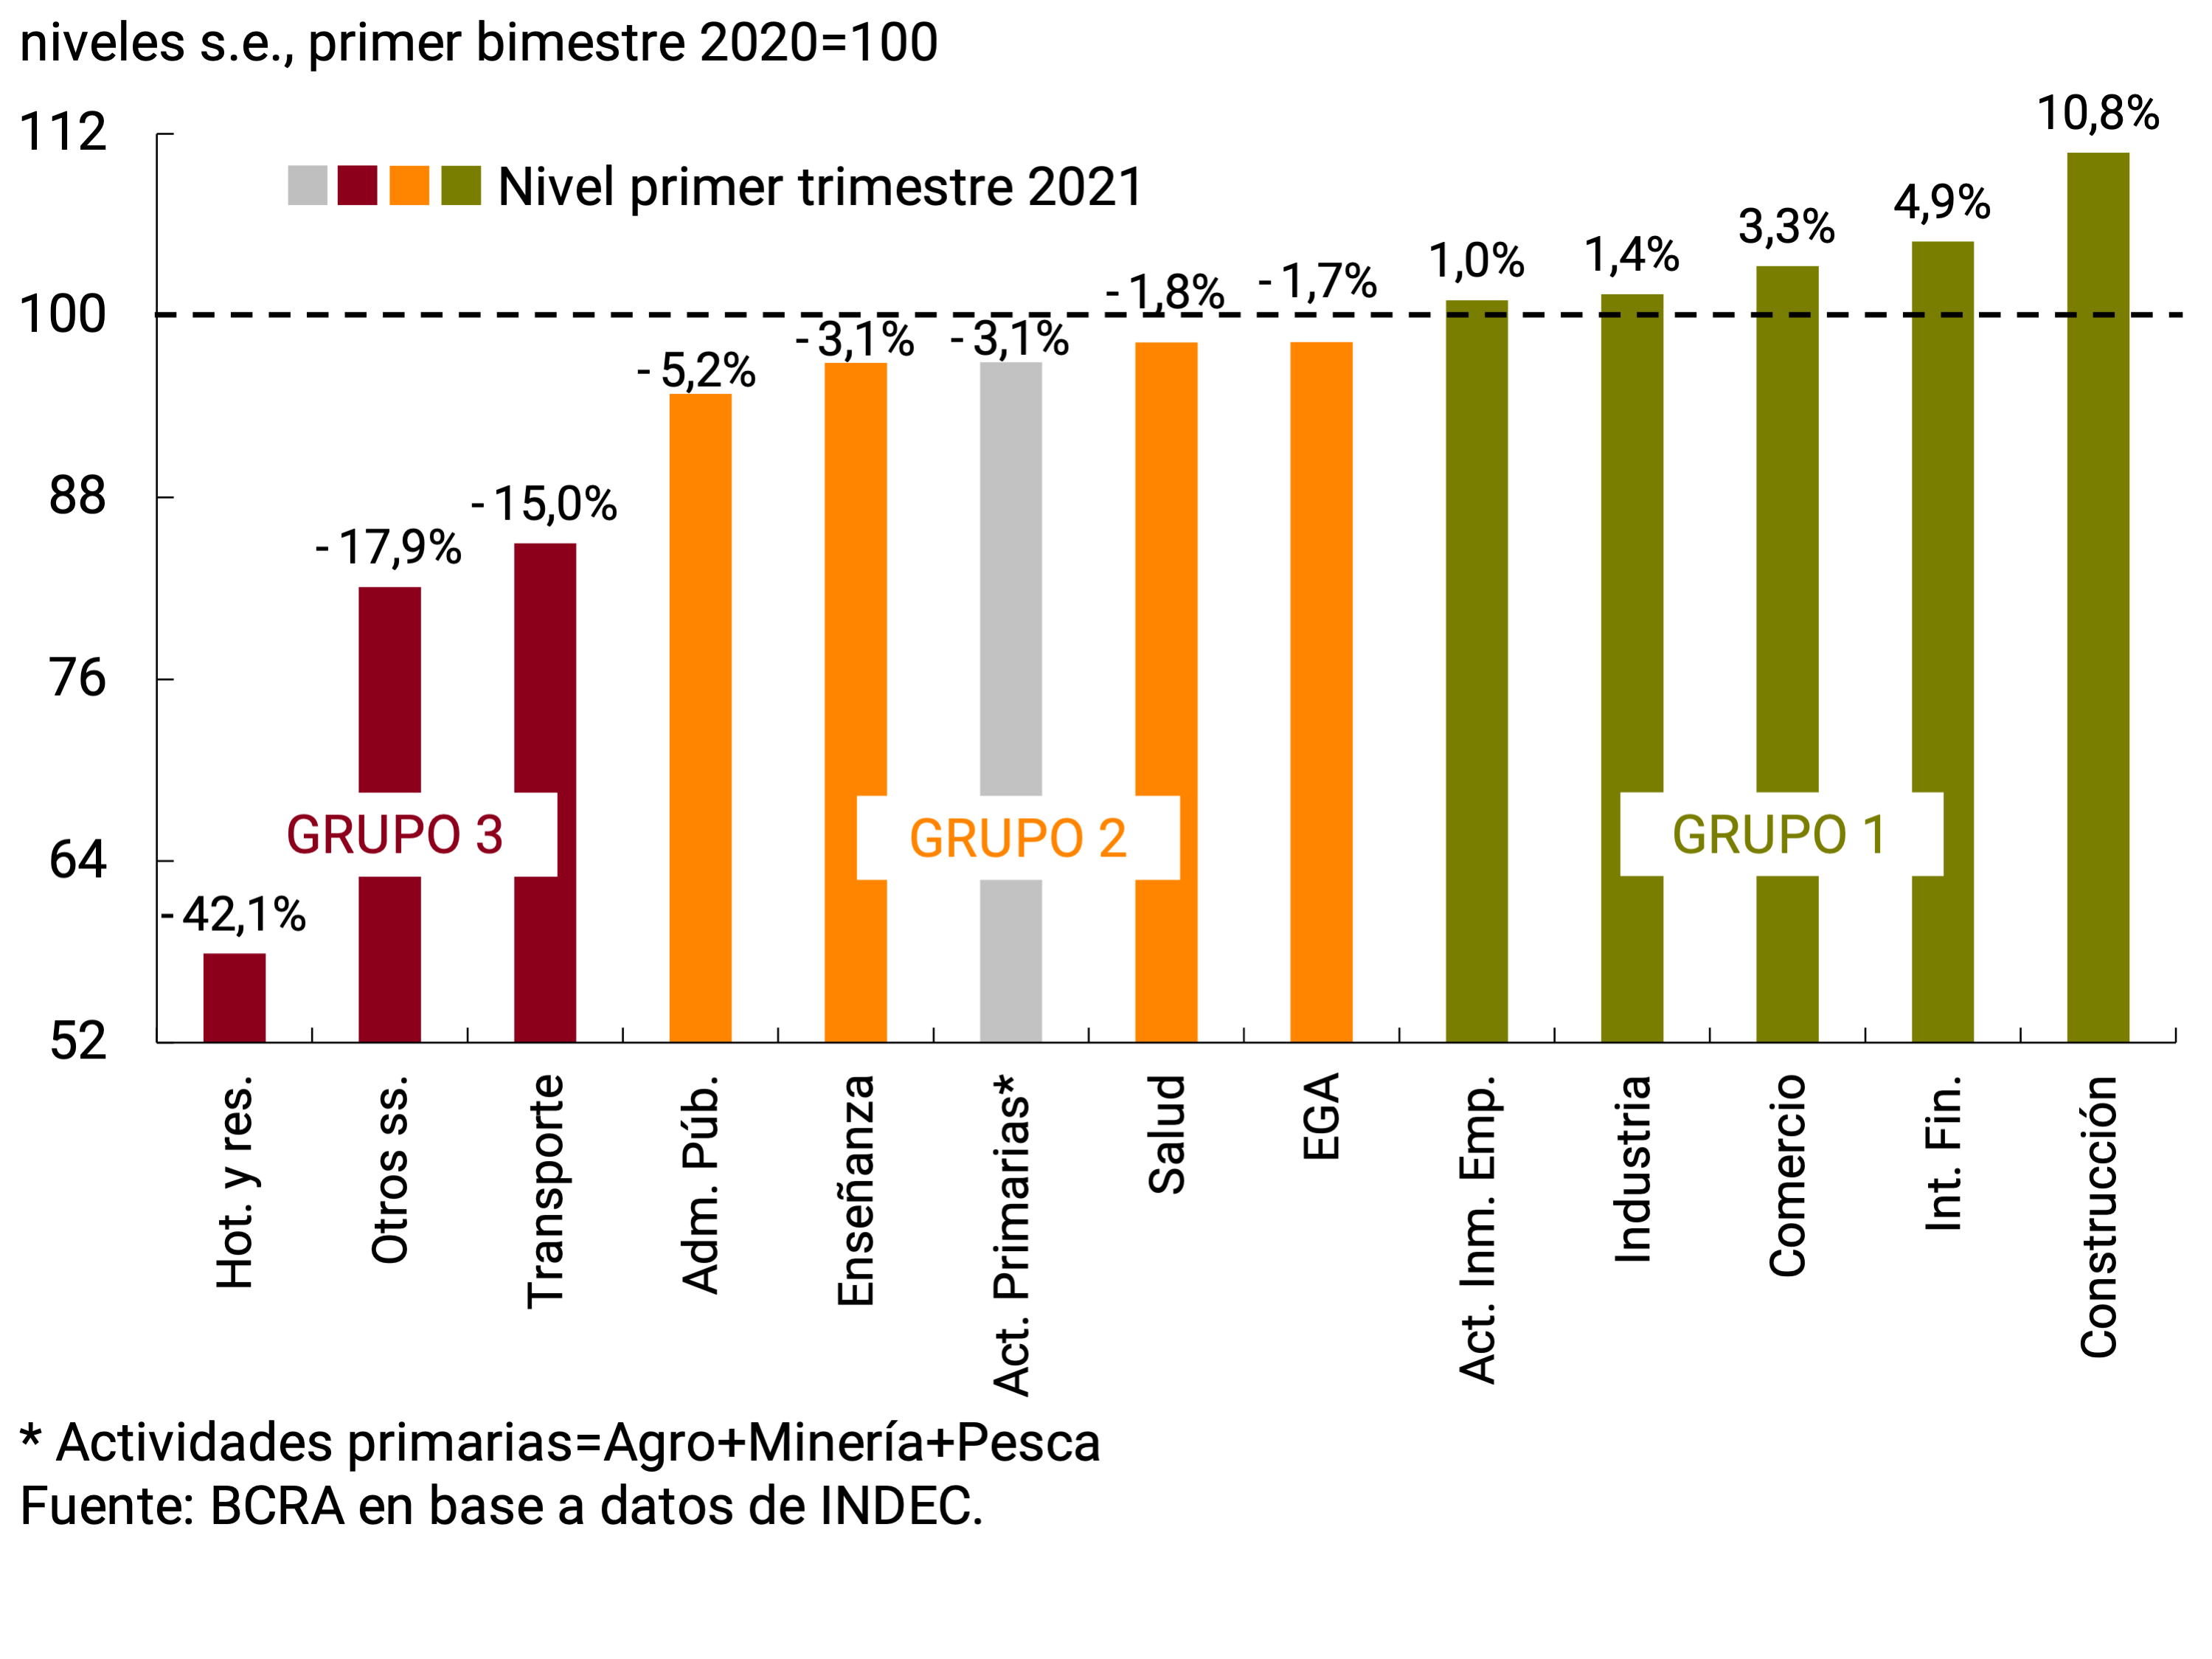
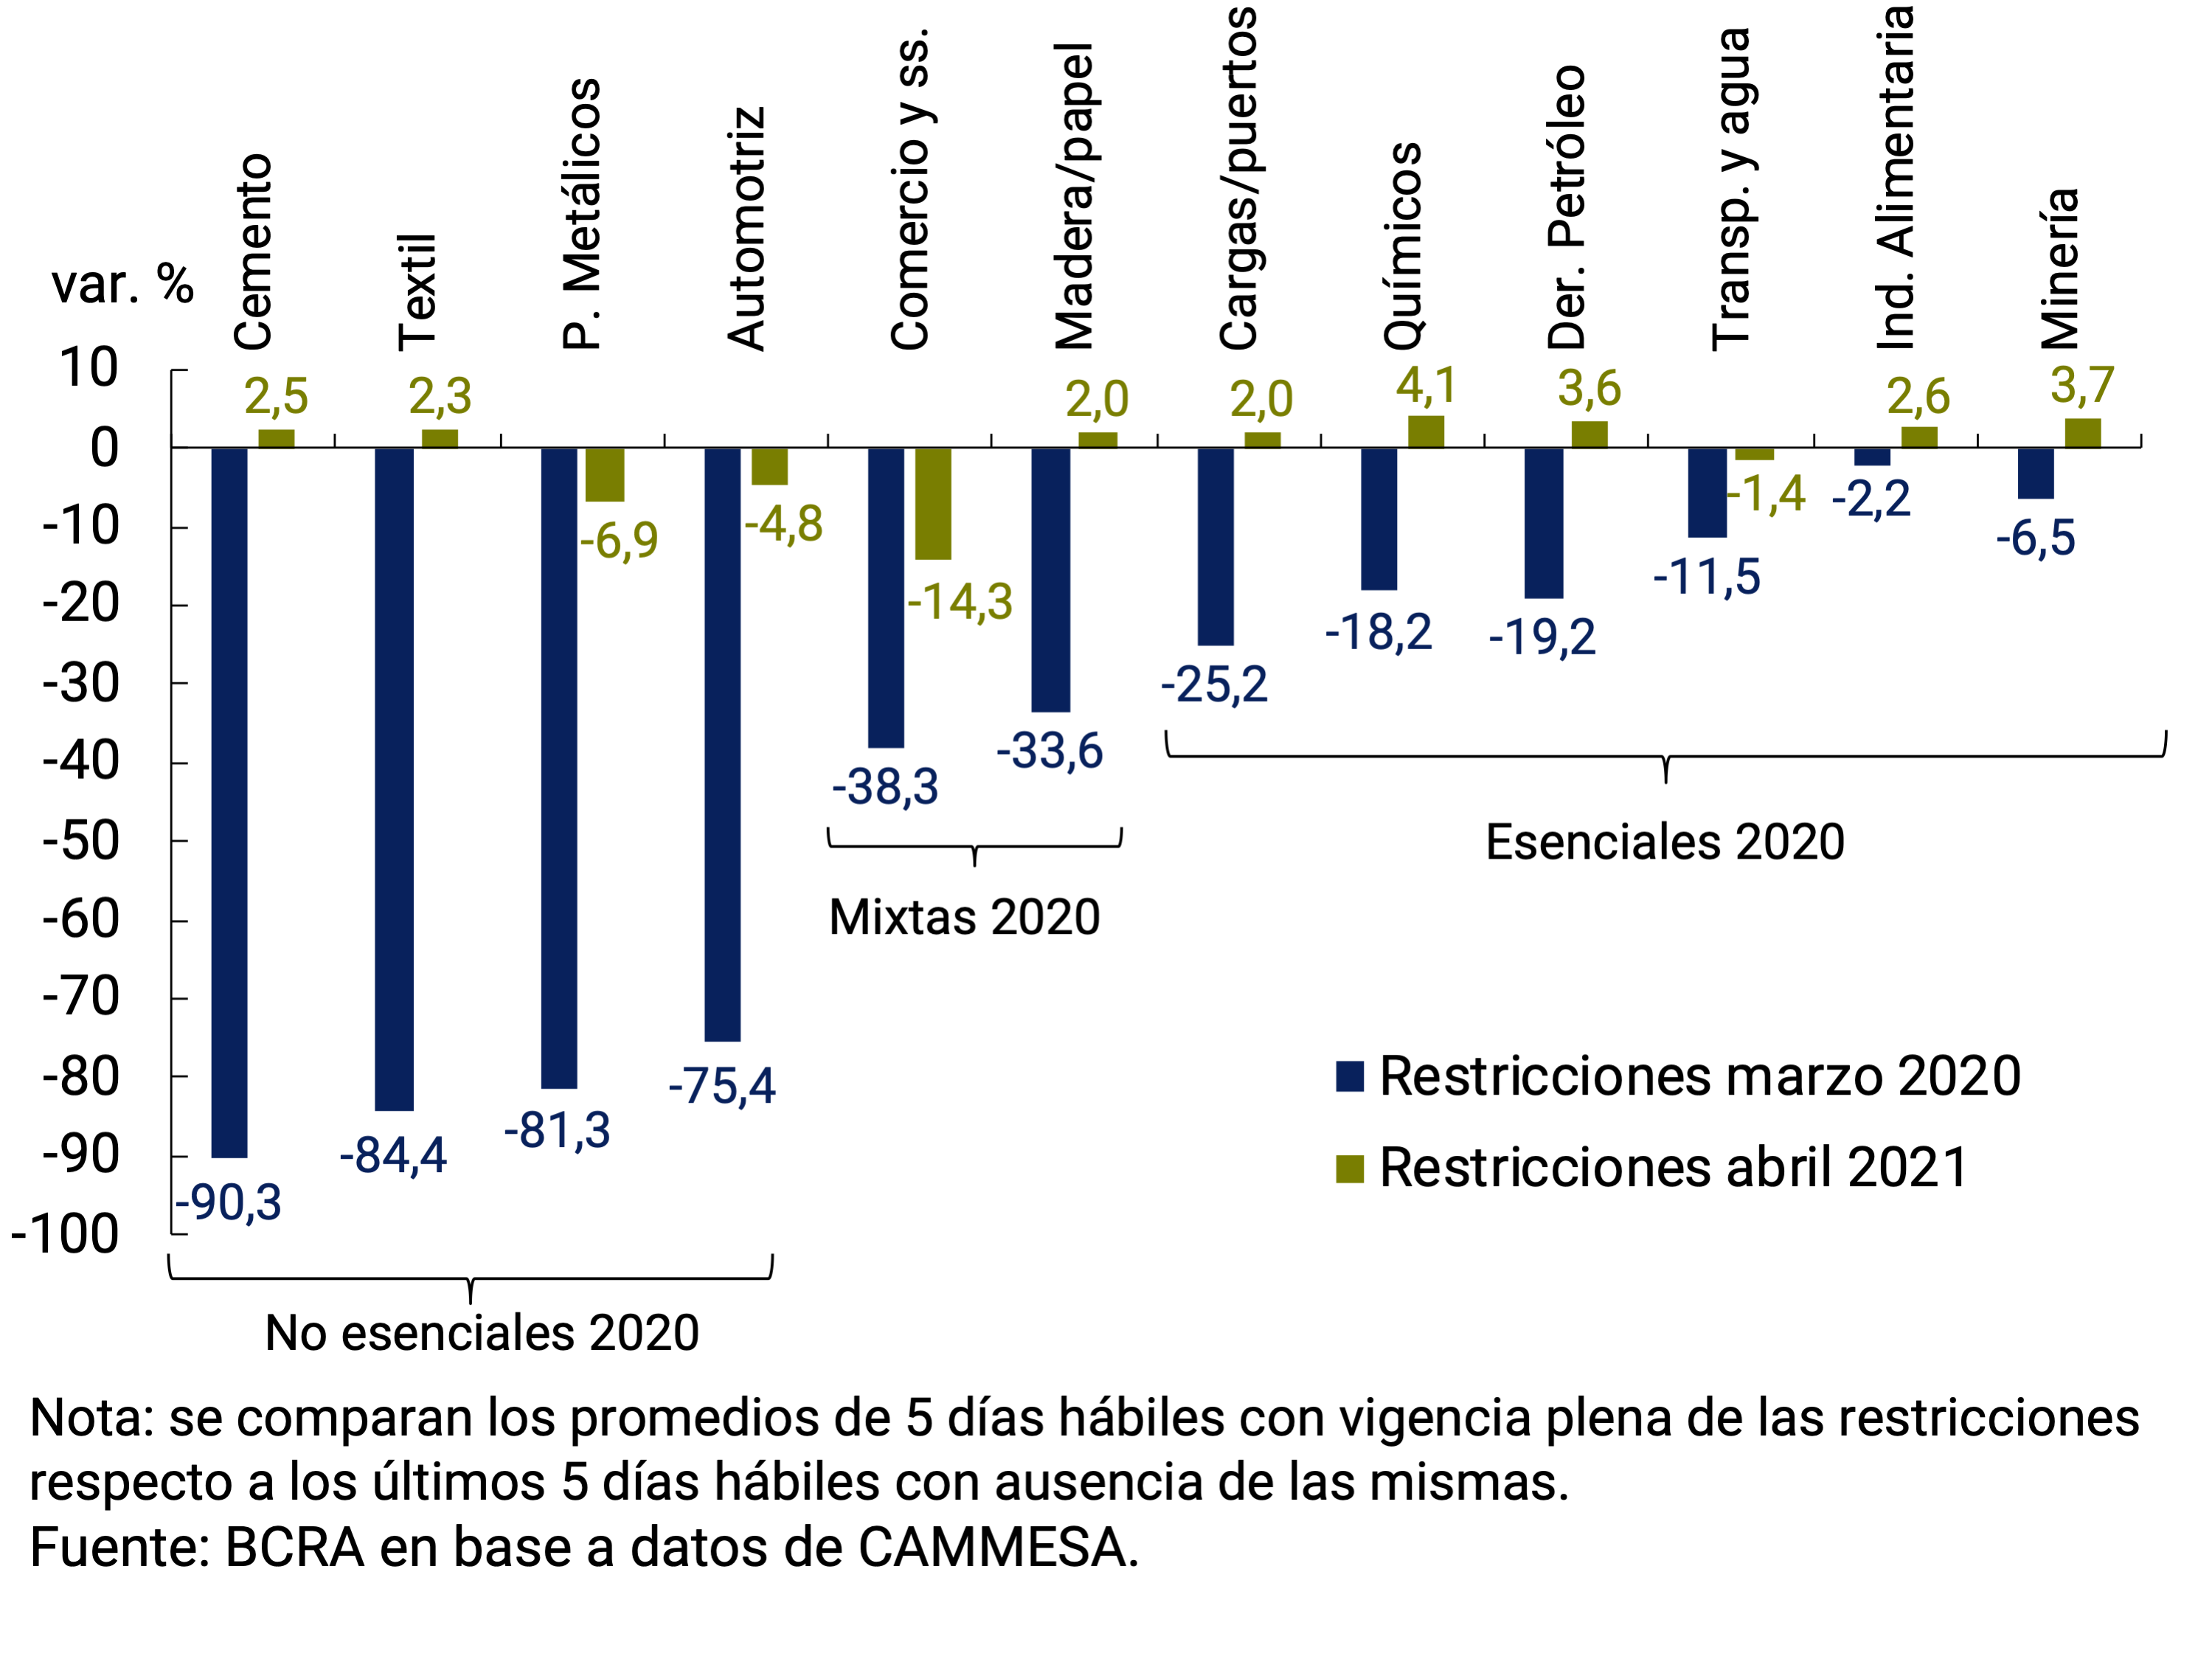
The first group is made up of several of the main economic sectors that operated in conditions close to normal during the first months of 2021 and have managed to exceed the production levels recorded in the first two months of 2020: Construction (10.8%), Financial intermediation (4.9%), Commerce (3.3%), Industry (1.4%) and Real estate and business activities (1%)10. The relaxation of social isolation measures since May 2020, added to the policies adopted by the National Government and the BCRA to strengthen aggregate demand and domestic credit, allowed the rapid recovery of these sectors, which together represent 67% of GDP11. The second wave of COVID-19, the associated higher absenteeism and the necessary restrictions adopted to deal with it could have affected these sectors from April 2021 onwards, although to a lesser extent compared to other activities that involve greater social contact. In the event of monthly falls, adjusted for seasonality, they would be significantly lower than those evidenced in March and April 2020. This would allow high growth rates to be recorded in year-on-year terms during the second quarter of 2021, especially in Construction, Industry, Commerce, and Real Estate and Business Activities (see Chart 3.6).
Figure 3.6 | Variation in the demand for electricity from productive activities after the adoption of restrictions on social interaction
A second group is made up of sectors that cut much of the fall generated by the pandemic, but failed to reach previous levels and, therefore, registered limited falls in the first quarter of 2021 compared to the first two months of 2020: Public administration (-5.2%), Education (-3.1%), Electricity, gas and water (EGA, -1.7%) and Health (-1.8%). These sectors evolved heterogeneously since May 2020, while Public Administration and Education slowly improved as their functions and activities were enabled, the Health and EGA sectors recovered rapidly, oscillating at levels close to normal. The impact of the second wave of COVID and the measures adopted since the second half of April would also be uneven among the sectors that make up this second group. Some activities will depend on the possibility of continuing to provide services with less “face-to-face” (Public Administration and Education); others, such as EGA and Health, would be affected by the restrictions in a mixed way, with upward and downward factors.
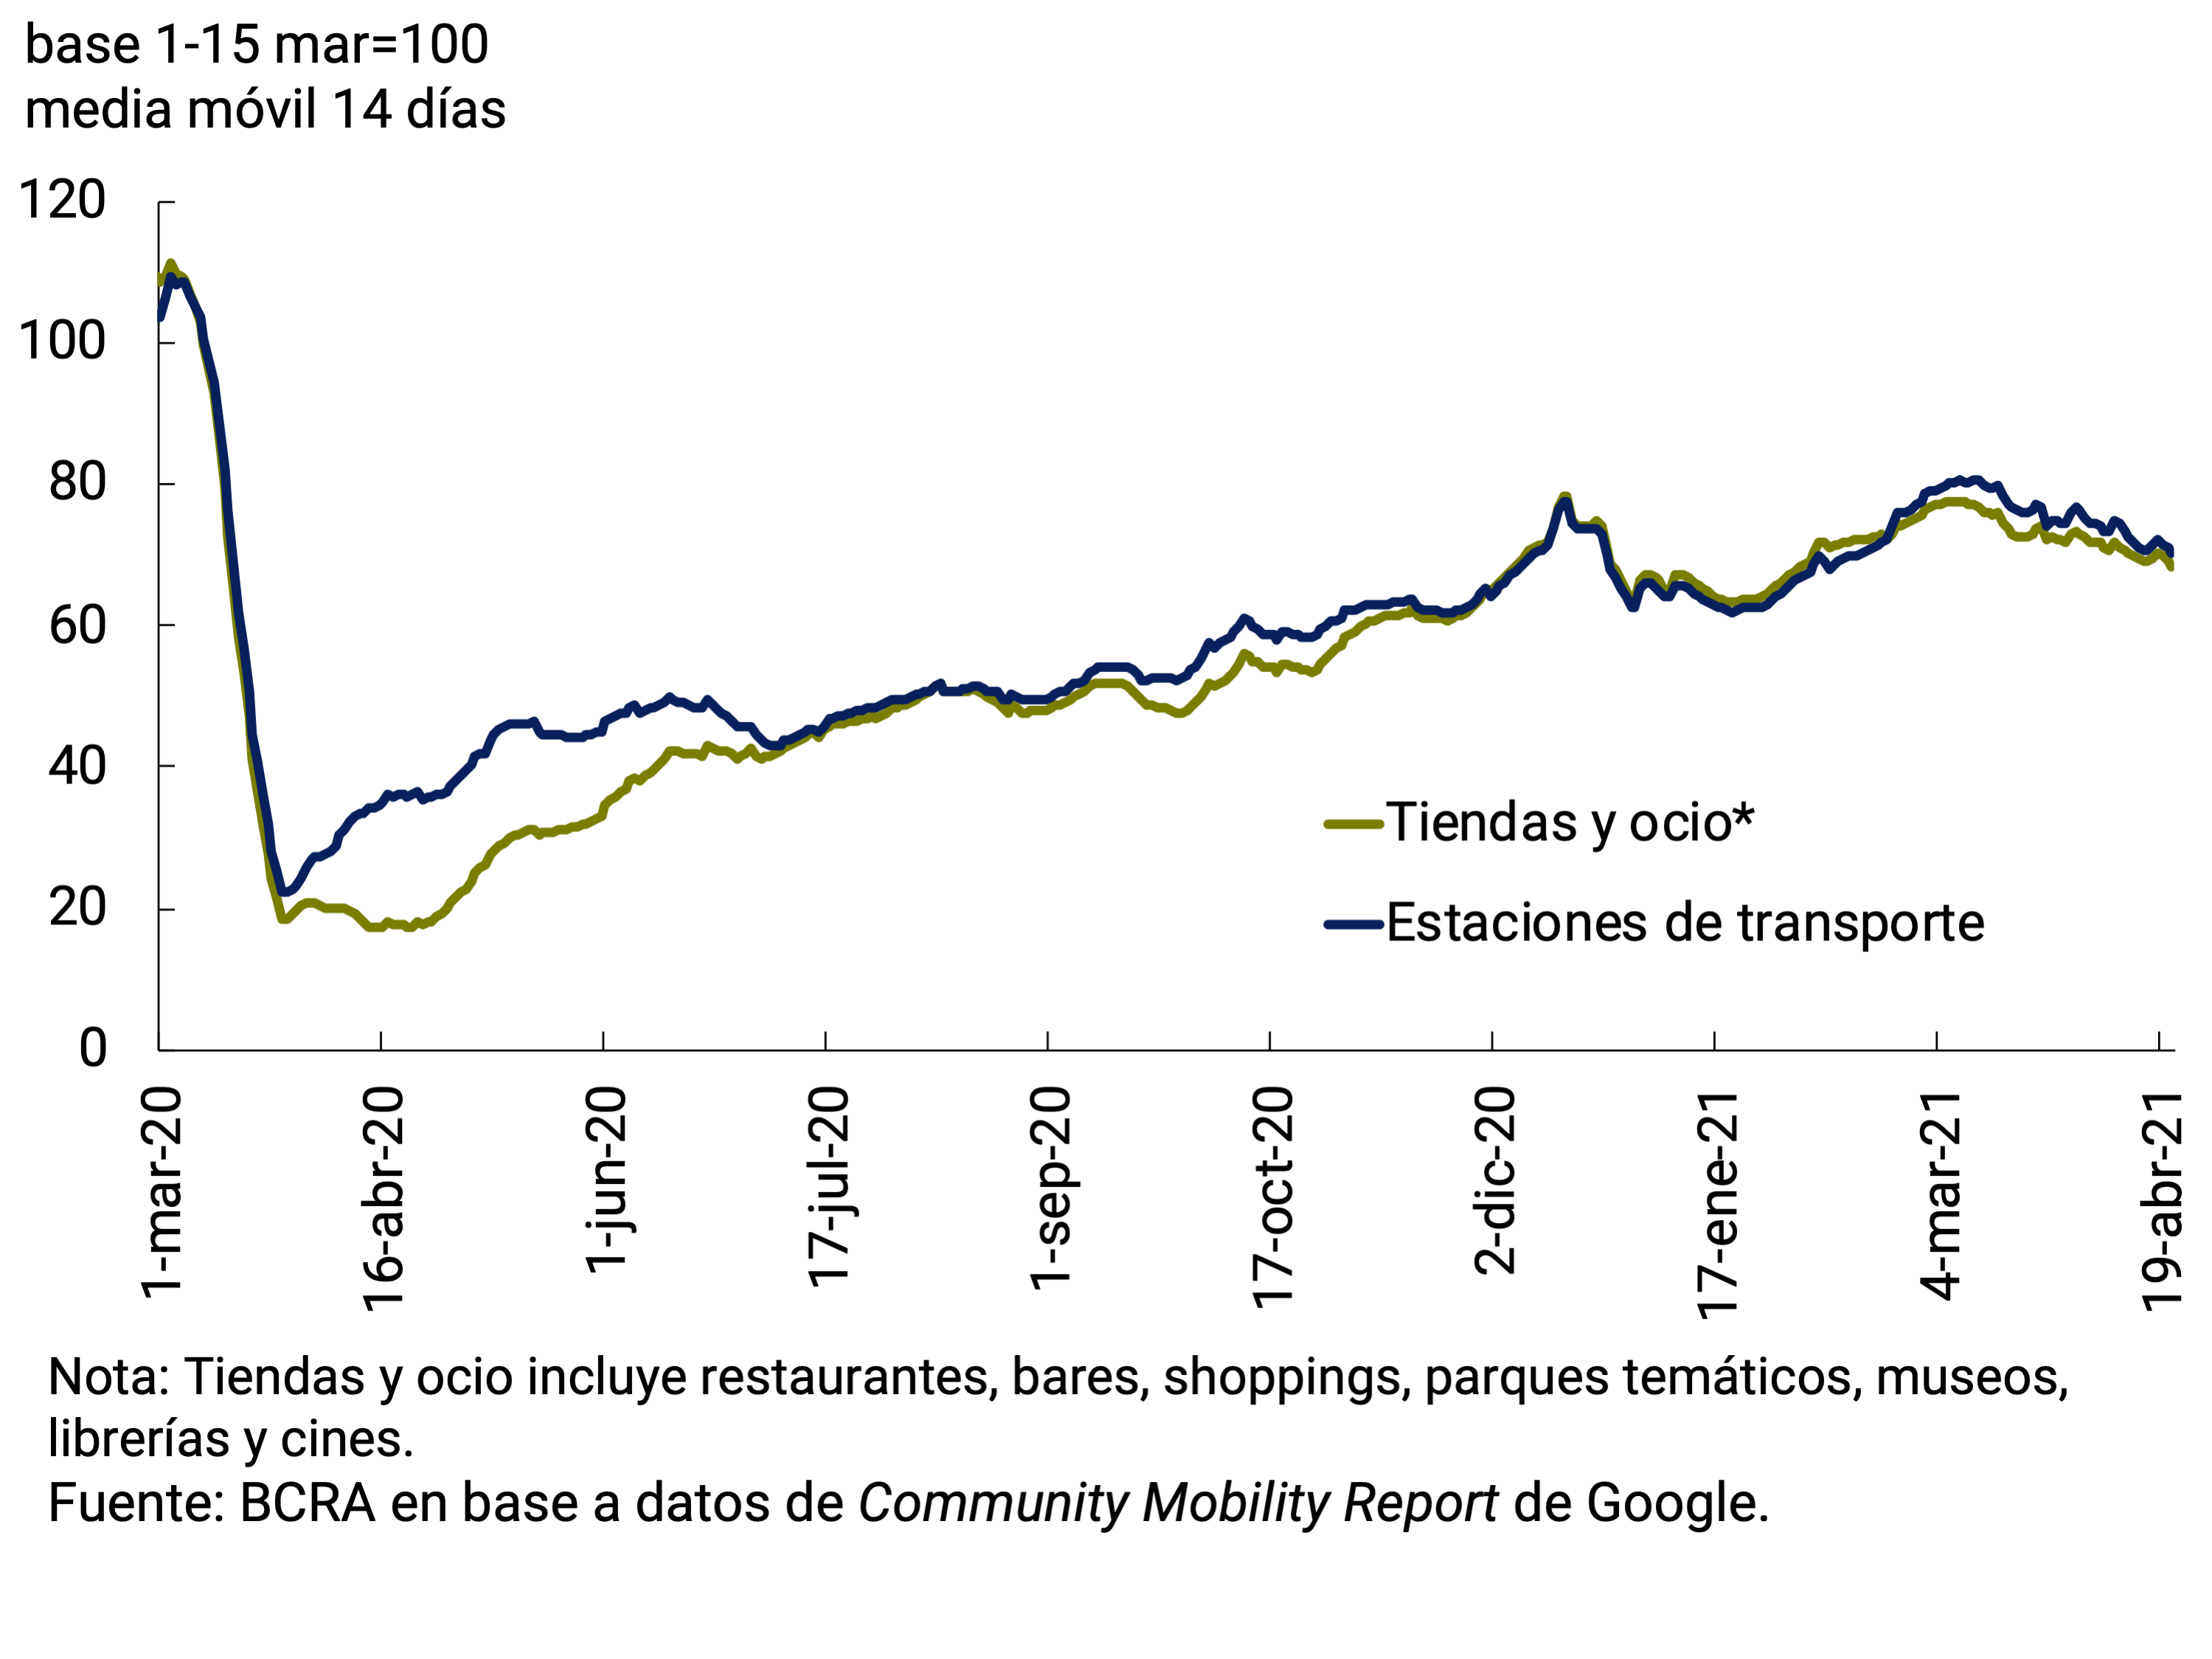
A third group is made up of some service sectors that, as they imply a greater health risk, were the most affected by the pandemic, accumulating strong contractions until the first quarter of 2021: Hotels and restaurants (-42.1%), Other services (-17.9%) and Transport (-15%). In the fourth quarter of 2020 and the first quarter of 2021, the restrictions affecting these activities were partially relaxed, allowing an acceleration in their recovery. The increase in circulation, the authorization of domestic tourism, the reactivation of flights, and the permission to operate cinemas and theaters gave impetus to these sectors which, however, were still far from normal levels, in the context of a preemptively contained demand. As noted in the previous IPOM, the speed of recovery of this group of activities depends directly on the evolution of the pandemic. In this sense, the arrival of the second wave and the implementation of restrictions to face it would have negatively affected these sectors as of April and a deepening is expected at the end of May. The mobility data associated with transport and recreation show declines compared to March, although of a reduced magnitude compared to those observed during the period of strict isolation during March and April 2020 (see Figure 3.7). The National Government reinforced assistance plans for these most sensitive sectors with the aim of cushioning the contraction in their incomes during the period of greatest severity of the health situation.
Figure 3.7 | Evolution of the presence of people at points of interest
Finally, the primary activities, Fishing (-0.4%), Agriculture (-1.3%) and Mining (-7.6%) have not been included in these three groups as their evolution depends on idiosyncratic factors of both supply and demand, which are less linked to the pandemic. The output of the agricultural sector recovered since May 2020 as a result of better-than-expected weather conditions and soil moisture, also favored by the increase in international prices. Fishery output continued to be highly volatile depending on the level of catches. Finally, in Mining, which includes oil and gas extraction, the recovery from the minimum in April 2020 has been slow. Plan Gas.Ar12 is expected to gradually boost production, after generating a sharp increase in the number of fracturing stages in the Vaca Muerta hydrocarbon wells during the first quarter of 2021. Specifically, in the month of April, there would have been a severe transitory retraction attributable to the union conflicts that interrupted activity in the area for much of the month. As happened in 2020, the second wave of COVID-19 would not significantly affect these three sectors and its evolution would continue to depend on idiosyncratic factors.
3.1.3. Employment indicators accompanied the economic recovery, although most have not yet returned to their pre-pandemic level
In a context of economic recovery prior to the outbreak of COVID-19, which implied the relaunch of health, labor, and income policies of the population, the labor market showed mixed trends. Registered salaried employment showed limited variations at the end of 2020 and the beginning of 2021, while within the informal market (both salaried and non-salaried) positive dynamics stood out that drove a gradual recovery in employment.
Employment indicators accompanied the economic recovery, although most have not yet returned to their pre-pandemic level. In the fourth quarter of 2020, the employment rate showed an improvement simultaneously with the normalization process of the activity rate13. The economically active population grew by up to 45%, 2.7 p.p. compared to the previous quarter, but with a decrease of 2.2 p.p. in year-on-year terms. In the fourth quarter of 2020, 3.1 million people re-entered a job, thus recovering 79% of the jobs lost during the second quarter of 2020. The employment modalities that were most affected during 2020 were the most dynamic: 1.4 million unregistered salaried workers and 1.9 million non-salaried workers (self-employed and employers) rejoined the labour market. The adaptation of the labour market to the pandemic also implied new trends in the way of working (see Section 3. Changes in work methodologies: Telework in Argentina). Finally, the unemployment rate stood at 11.0%, 2.1 p.p. lower than the rate of the second quarter and 2.1 p.p. higher than that of the fourth quarter of 2019, both due to the year-on-year increase in the unemployed and the effect of the reduction of the Economically Active Population (EAP).
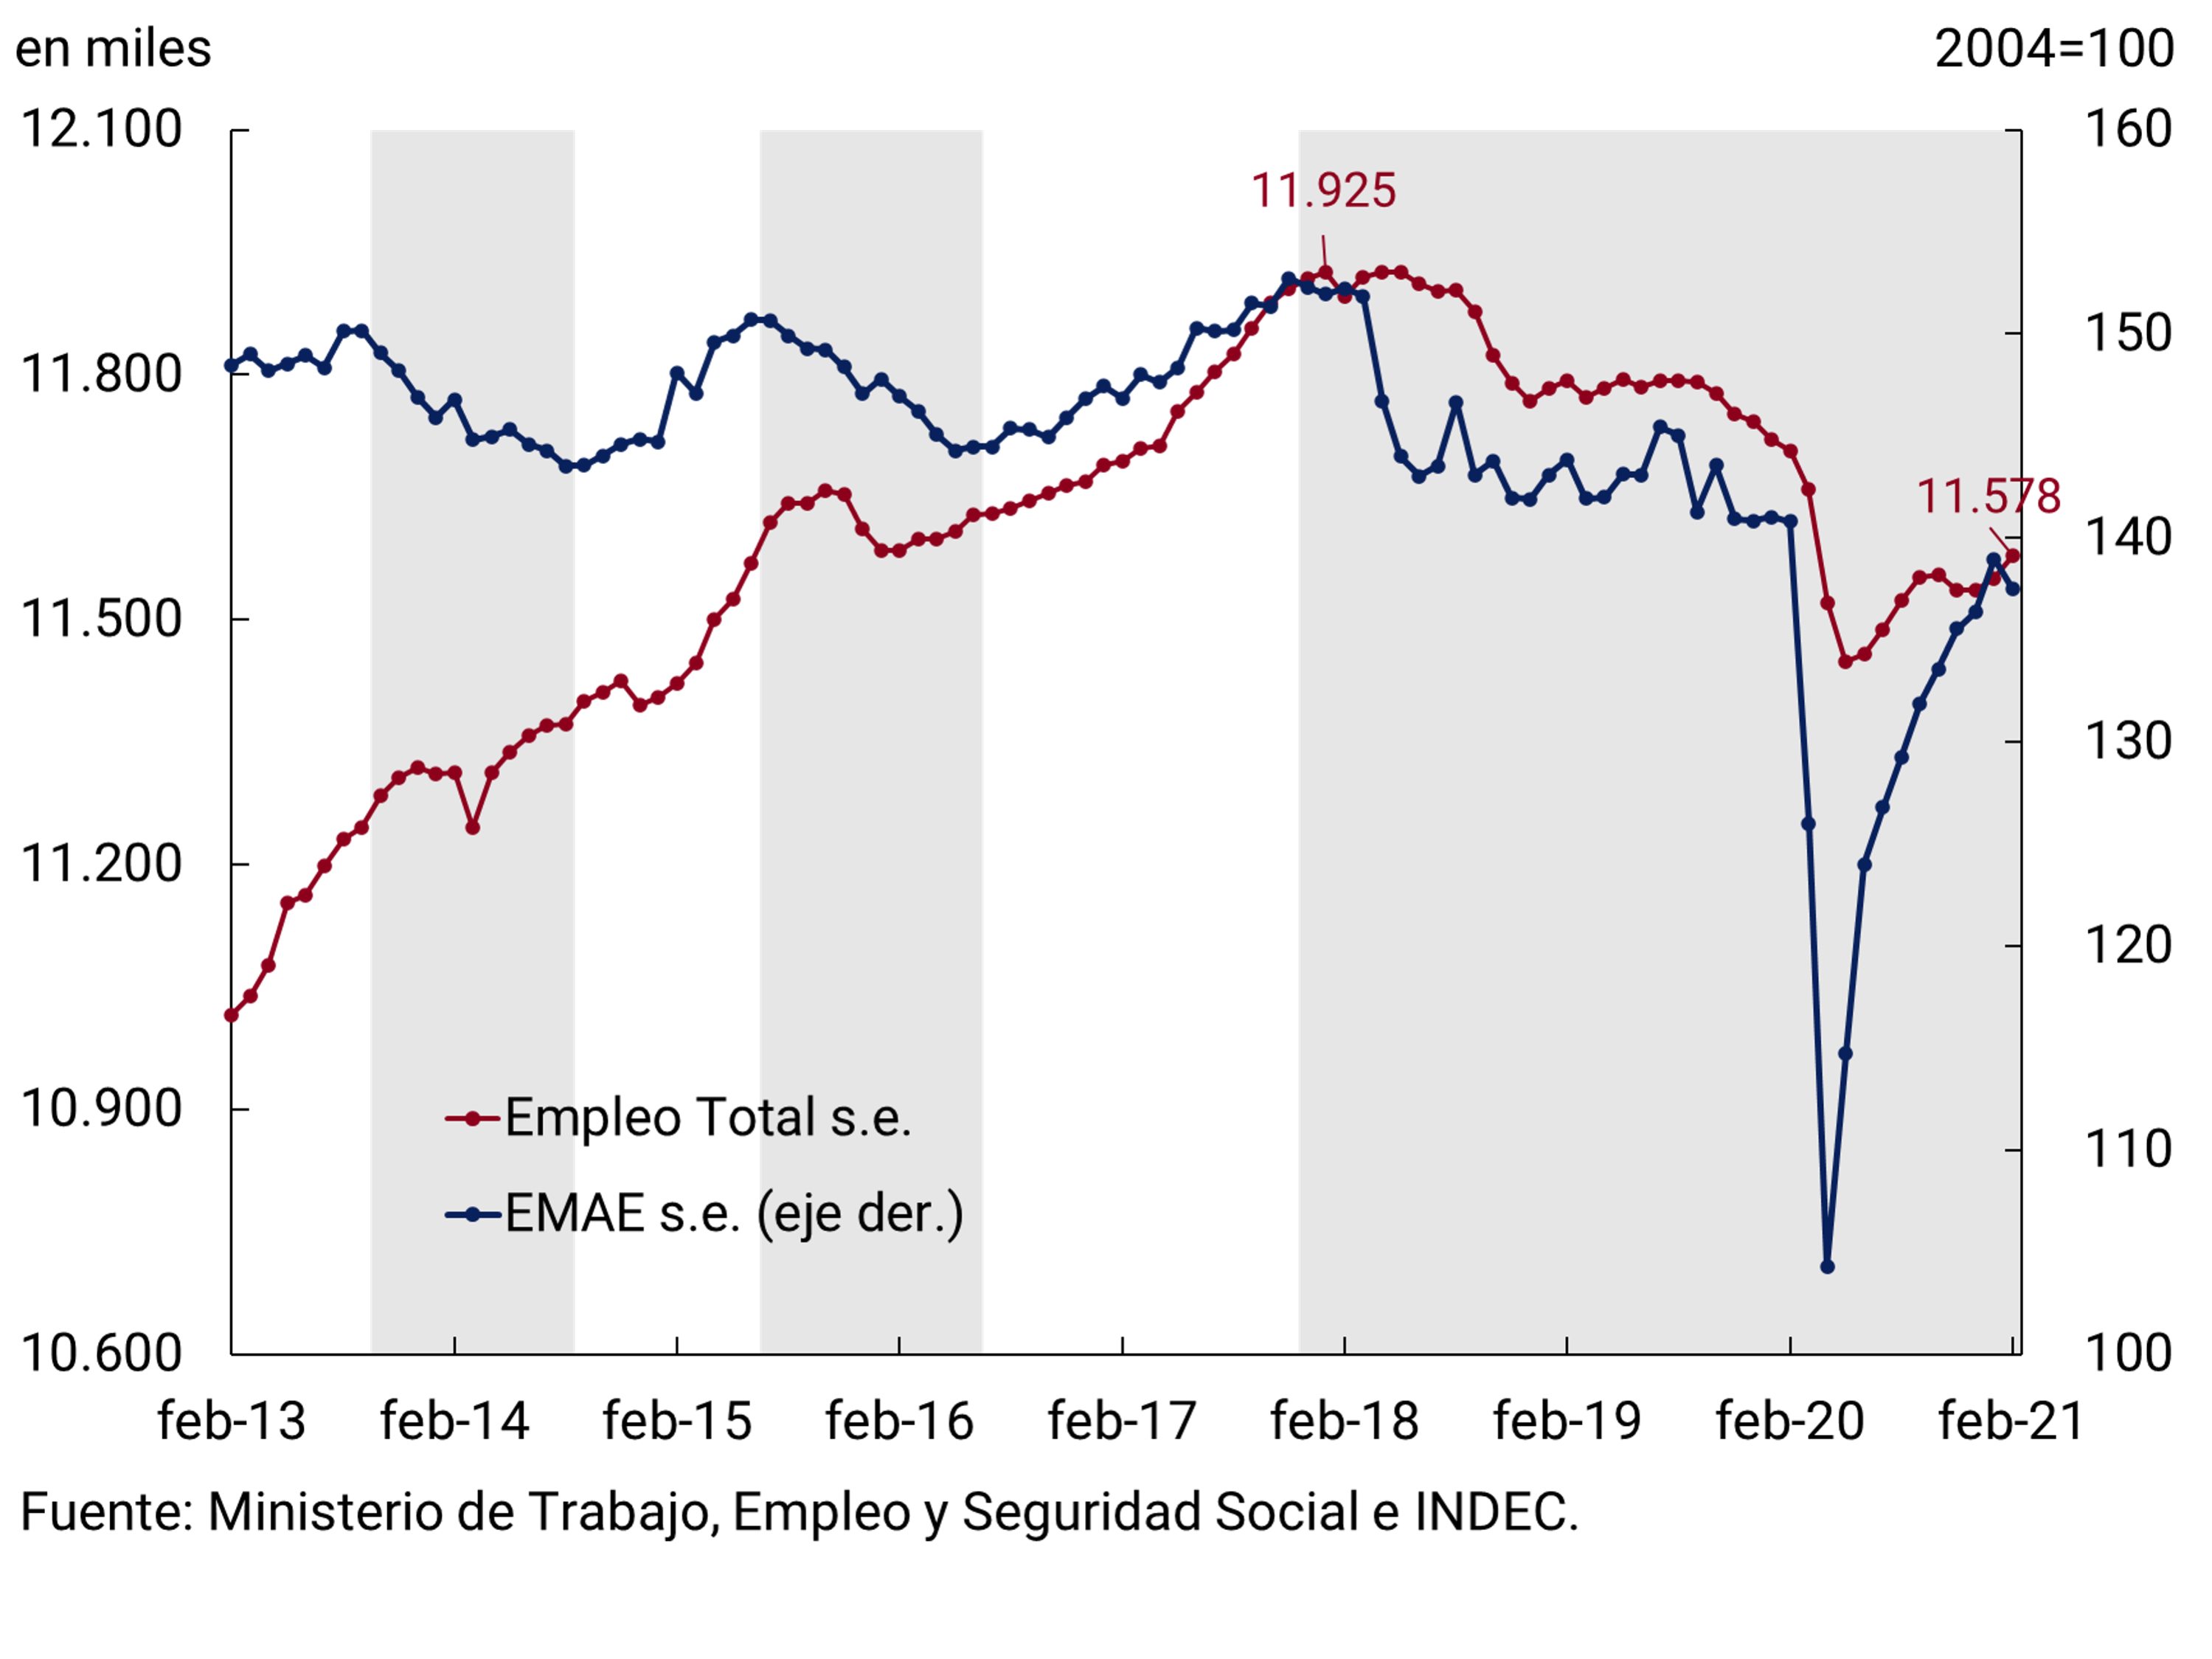
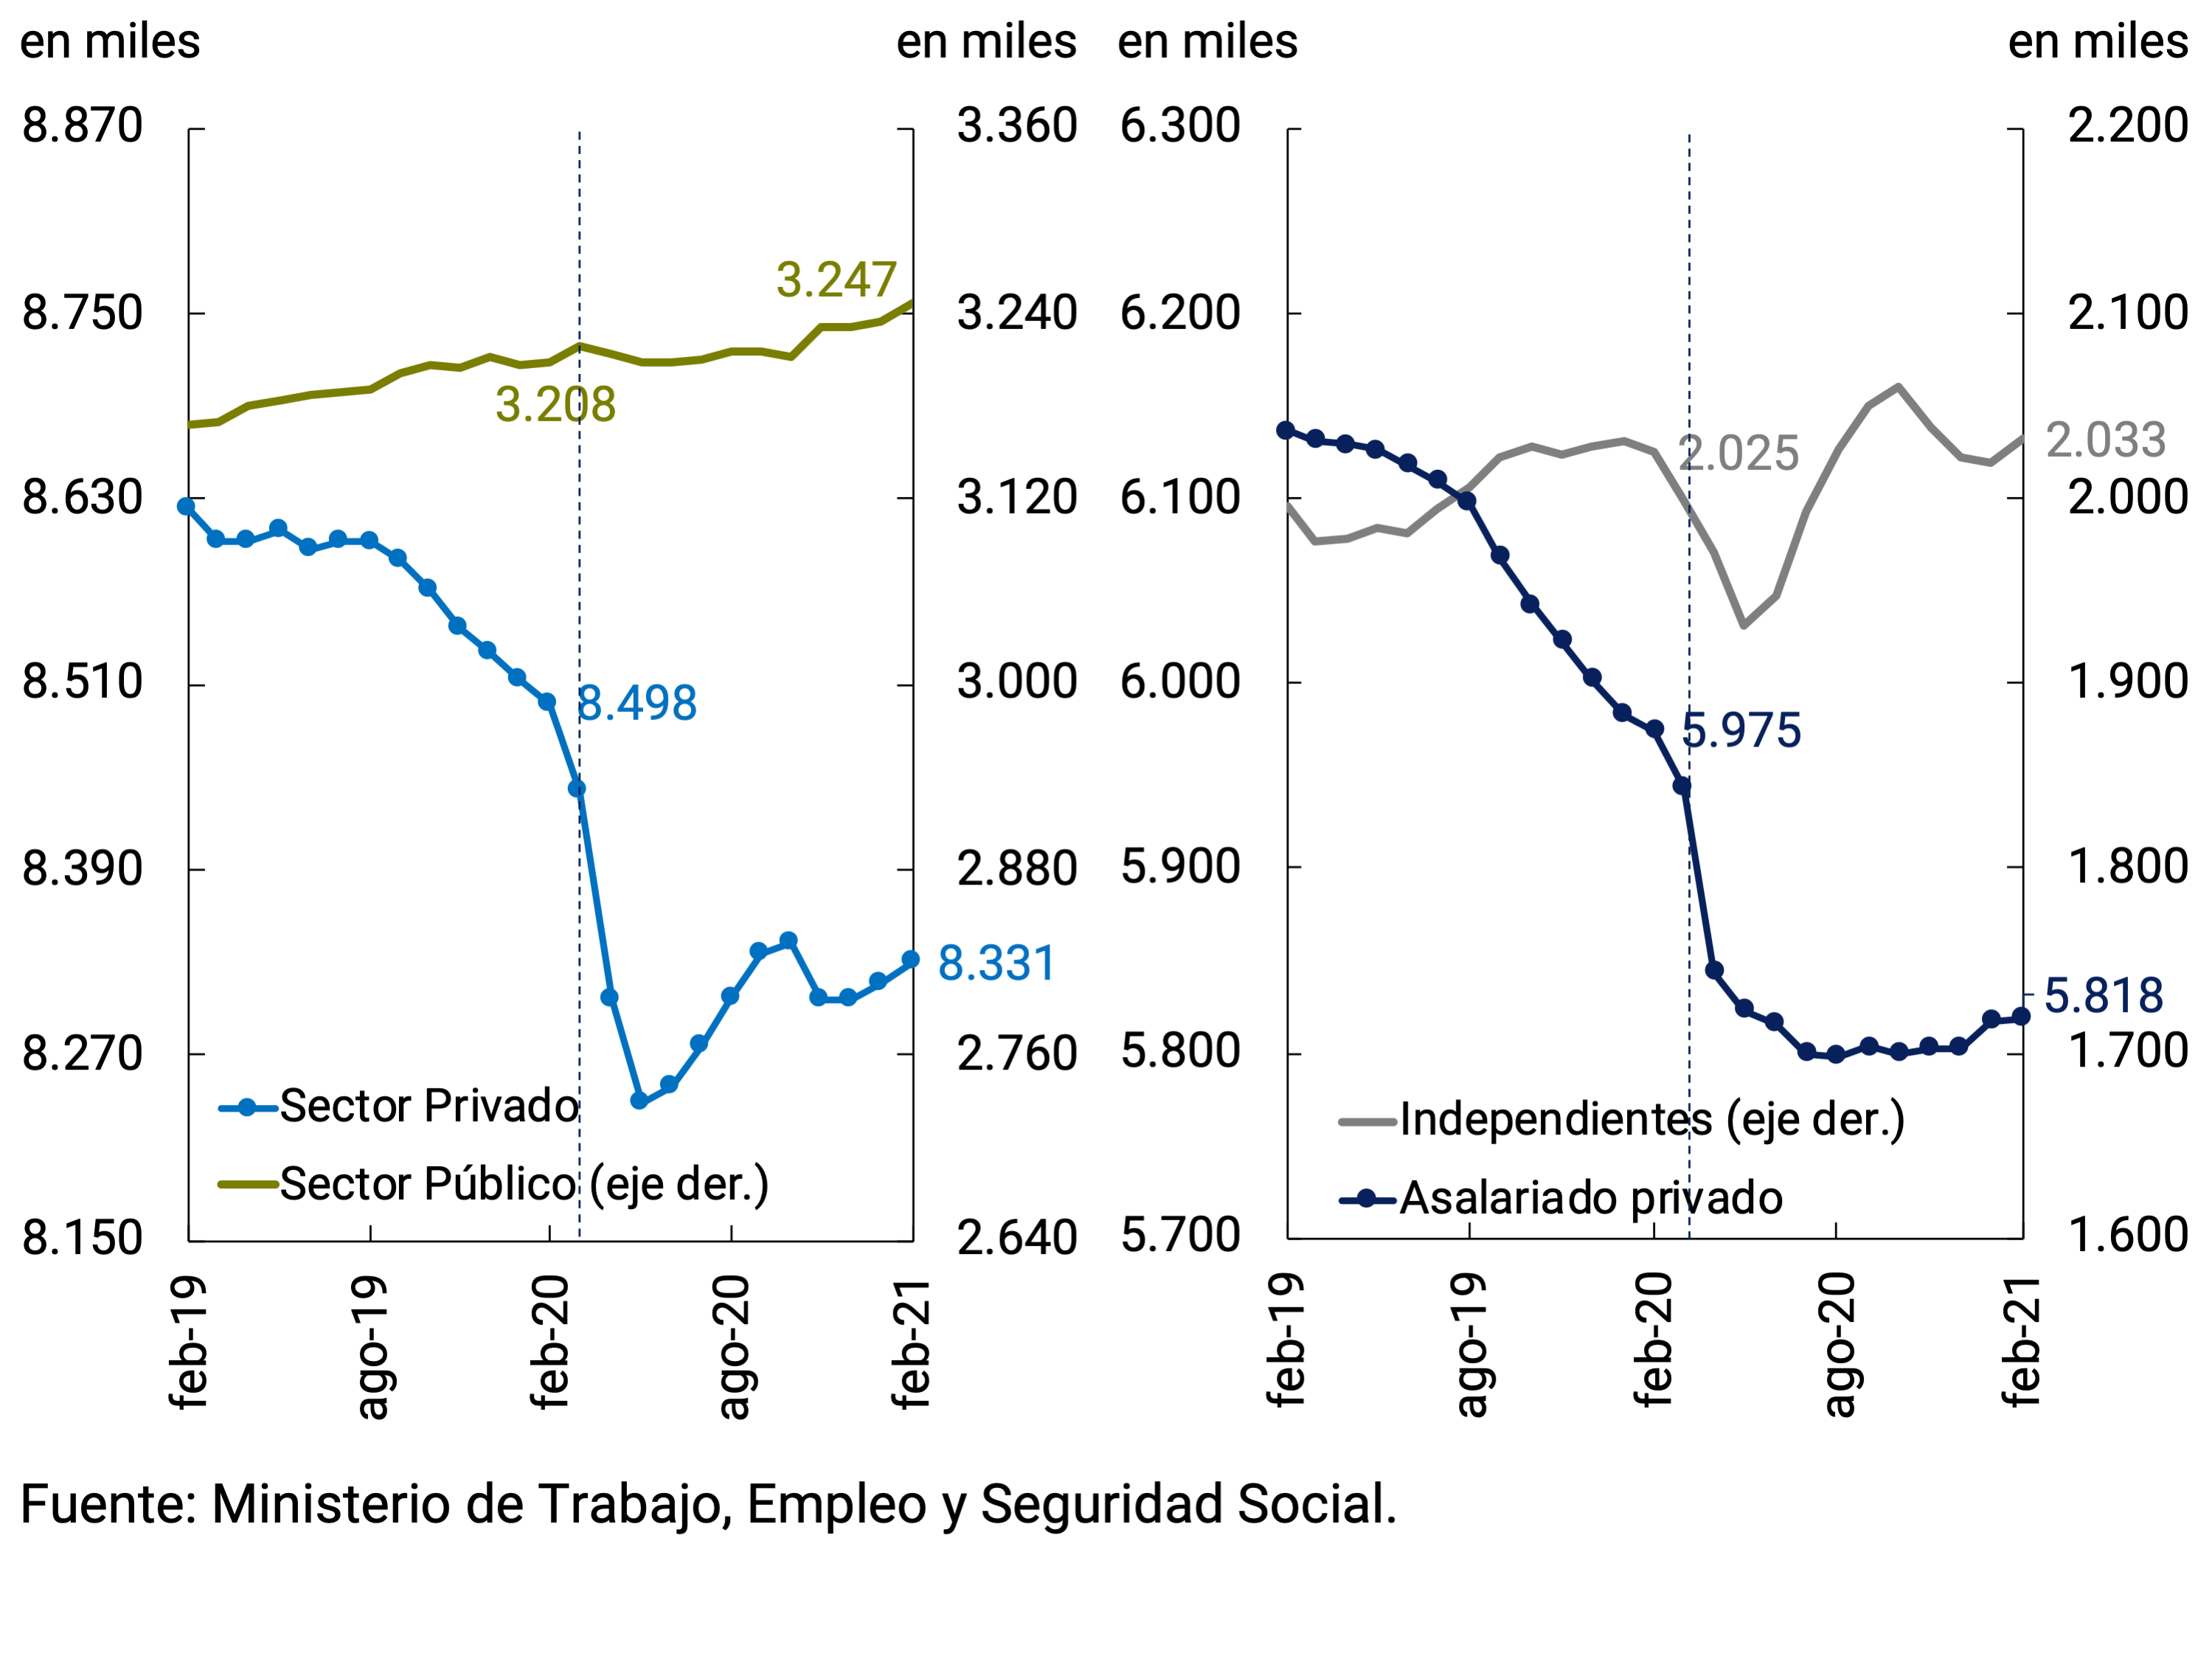
Total registered employment resumed the positive trend between November 2020 and February 2021 (+0.3% s.e.), reaching an improvement of 1.2% s.e. since the pandemic floor (May 2020), according to data from the Ministry of Labor, Employment and Social Security (MTEySS14; see Figure 3.8).
Figure 3.8 | Total registered employment and EMAE
This recovery in total registered employment is related to an incipient positive dynamic of registered wage earners. In particular, public wage earners grew 0.5% s.e. while private wage earners showed an increase of 0.2 s.e. since Nov-20. This growth offset the 0.3% drop s.e. in registered self-employment (single-tax and self-employed persons; see Figure 3.9). The aggregate behavior of private salaried employment hides at the sectoral level, a significant increase in employment in sectors such as Real Estate, Business and Rental Activity, Manufacturing Industry and Construction since Jun-20. On the other hand, the less economically dynamic branches (Transport, Hotels and restaurants and Other services) continued in a process of job destruction in the period Jun-20/Feb-21.
Figure 3.9 | Public, private, private salaried and self-employed employment
The Labor Indicators Survey (EIL) as of February 2021 shows a recovery in net hiring expectations, coupled with low rates of layoffs and stability in suspensions. 3 months ahead, the trend towards hiring personnel expanded in net terms (0.5 p.p. in February) for the second consecutive month. Suspensions, after a persistent drop from their peak in May 2020, stabilized at around 18.2 per thousand workers. For its part, the dismissal rate has remained at low levels since May (2.9 per thousand workers in February) due to decree 266/2021, an extension that prohibits layoffs and extends the obligation of double severance pay until May 2021. In this regard, both the improvement in net expectations in the increase in staffing and the suspensions and layoffs could be affected by the resurgence of COVID-19 cases evidenced at the beginning of March.
In addition, it is also worth mentioning the policies recently implemented by the National Government to deal with the effects of the second wave of the pandemic. The nationwide assistance involved a $6,500 bonus for three months for 740,000 health workers and the launch of the second edition of the Productive Recovery Program15 (REPRO II) aimed at sustaining employment in sectors with economic difficulties. In April, the Emergency Assistance Program for the Independent Gastronomic Sector was also implemented, a measure that aims to assist independent workers in the Gastronomic Sector with $18,000, both for single-payers and self-employed. Likewise, policies were implemented to sustain income in the Metropolitan Area of Buenos Aires (AMBA)16. A bonus of $15,000 was granted for beneficiaries of AUH and AUE as well as for low-category single-payers (A and B) – which are estimated at 960,000 beneficiaries – with a total expenditure of $13,900 million. In addition to the latter, in May the expansion of the scope of the Food Card was announced, both in amount and in the universe of children reached17.
3.2. Perspectives
At the beginning of 2021, with a large part of economic activities having been enabled to operate under protocol rules and with the vaccination process against COVID-19 underway, economic activity continued to improve, partially attenuating sectoral heterogeneity, based on the improvement in the activities most sensitive to the pandemic.
In this context of normalization of the economy, the BCRA continued to contribute to the economic recovery process by sustaining lines of credit both for productive purposes and for promoting private consumption18 (see Chapter 7. Monetary Policy). In the same sense, the recent measures implemented by the National Government aimed at the promotion of strategic sectors19 contributed.
However, the materialisation of downside risks contemplated in the central activity scenario generated a greater degree of uncertainty regarding their evolution for the rest of the year. Towards the beginning of March, the speed of infections in the AMBA increased simultaneously with the appearance of new strains in the country. This deterioration of the epidemiological situation implied new restrictions on mobility and the normal functioning of activities in April, which were deepened on May20. These measures, which are less intense and far-reaching than those of April and March 2020, will be reflected in aggregate economic activity over the coming months. In this new scenario, the BCRA expects a temporary interruption of the recovery process of activity in the second quarter, associated with both direct and indirect effects of the new health context. For the rest of the year, activity is expected to resume the path of recovery, in a framework of a high degree of adaptation of families and companies to operate in a pandemic, at the same time as the vaccination process advances.
Although the international context is favorable, with improvements in global growth prospects21 and high prices of raw materials exported by Argentina, the degree of uncertainty is still high and is fundamentally associated with the control of the speed of contagion vis-à-vis the progress of the effective vaccination of the population. given the asymmetric global availability of vaccines and the emergence of new strains of the virus. Other risk factors must be monitored, such as the persistence of the damage caused by the pandemic on productive capacity in each economy, greater financial volatility, and a larger-than-expected increase in the U.S. Federal Reserve’s (Fed) benchmark interest rate in response to inflationary pressures in the U.S. economy (see Chapter 2. International Context).
Among the factors that would improve growth prospects in Argentina is the faster-than-expected progress of the vaccination process, which would allow the supply of services to be normalized more quickly, based on a greater opening of activities with a risk of contact. This would contribute to an improvement in activity and allow the normalisation of consumer behaviour to be completed more quickly.
The recovery of GDP at a faster pace than expected in the second half of last year and the beginning of this year left a high growth floor for this year. The market’s projections for the economic recovery from May 2020 onwards were successively revised upwards. Thus, while at the end of June the median REM anticipated a 12% drop in GDP in 2020 and a 5% recovery in 2021, GDP finally showed a 9.9% drop last year. The seasonally adjusted EMAE data for the first quarter left a statistical drag of 7.6 percentage points of growth for 2021. In the April REM, a GDP recovery of 6.4% is forecast for 2021, above the projections of the International Monetary Fund (IMF; 5.8%).
4. External Sector
After a limited performance in the fourth quarter of 2020, exports of goods recovered thanks to the normalization of shipments of agricultural products and the increase in international prices of raw materials. Imports rose again, particularly those closely linked to investment spending. Thus, in the first quarter of 2021, in a context in which the terms of trade were close to the highest in the last 25 years, the economy would have recovered a current account surplus, a trend that continued in April.
This improvement in the trade surplus of goods, added to the renegotiation of financial debt maturities, allowed the BCRA to buy US$5,432 million in the Foreign Exchange Market so far this year.
Going forward, with the risk of a severe drought on the coarse harvest cleared, the current account surplus is expected to be maintained, supported by a comfortable trade balance of goods, in a context of high international commodity prices. The current regulatory framework will allow the BCRA to continue to efficiently manage the foreign currency originated in commercial operations, in order to preserve monetary, financial and exchange rate stability.
4.1. In the first quarter of 2021, the economy would have resumed the current account surplus
In the fourth quarter of 2020 (latest official data available) the Argentine economy recorded a current account deficit of US$1,372 million – equivalent to 1.8 p.p. of GDP in seasonally adjusted and annualized terms – linked to a marked contraction in the trade surplus in goods compared to previous quarters. In particular, the abrupt drop in exports of goods in December, temporarily affected by a union conflict that paralyzed grain shipments for almost the entire month, played a role.
Figure 4.1 | Seasonally adjusted current account. Annualized values
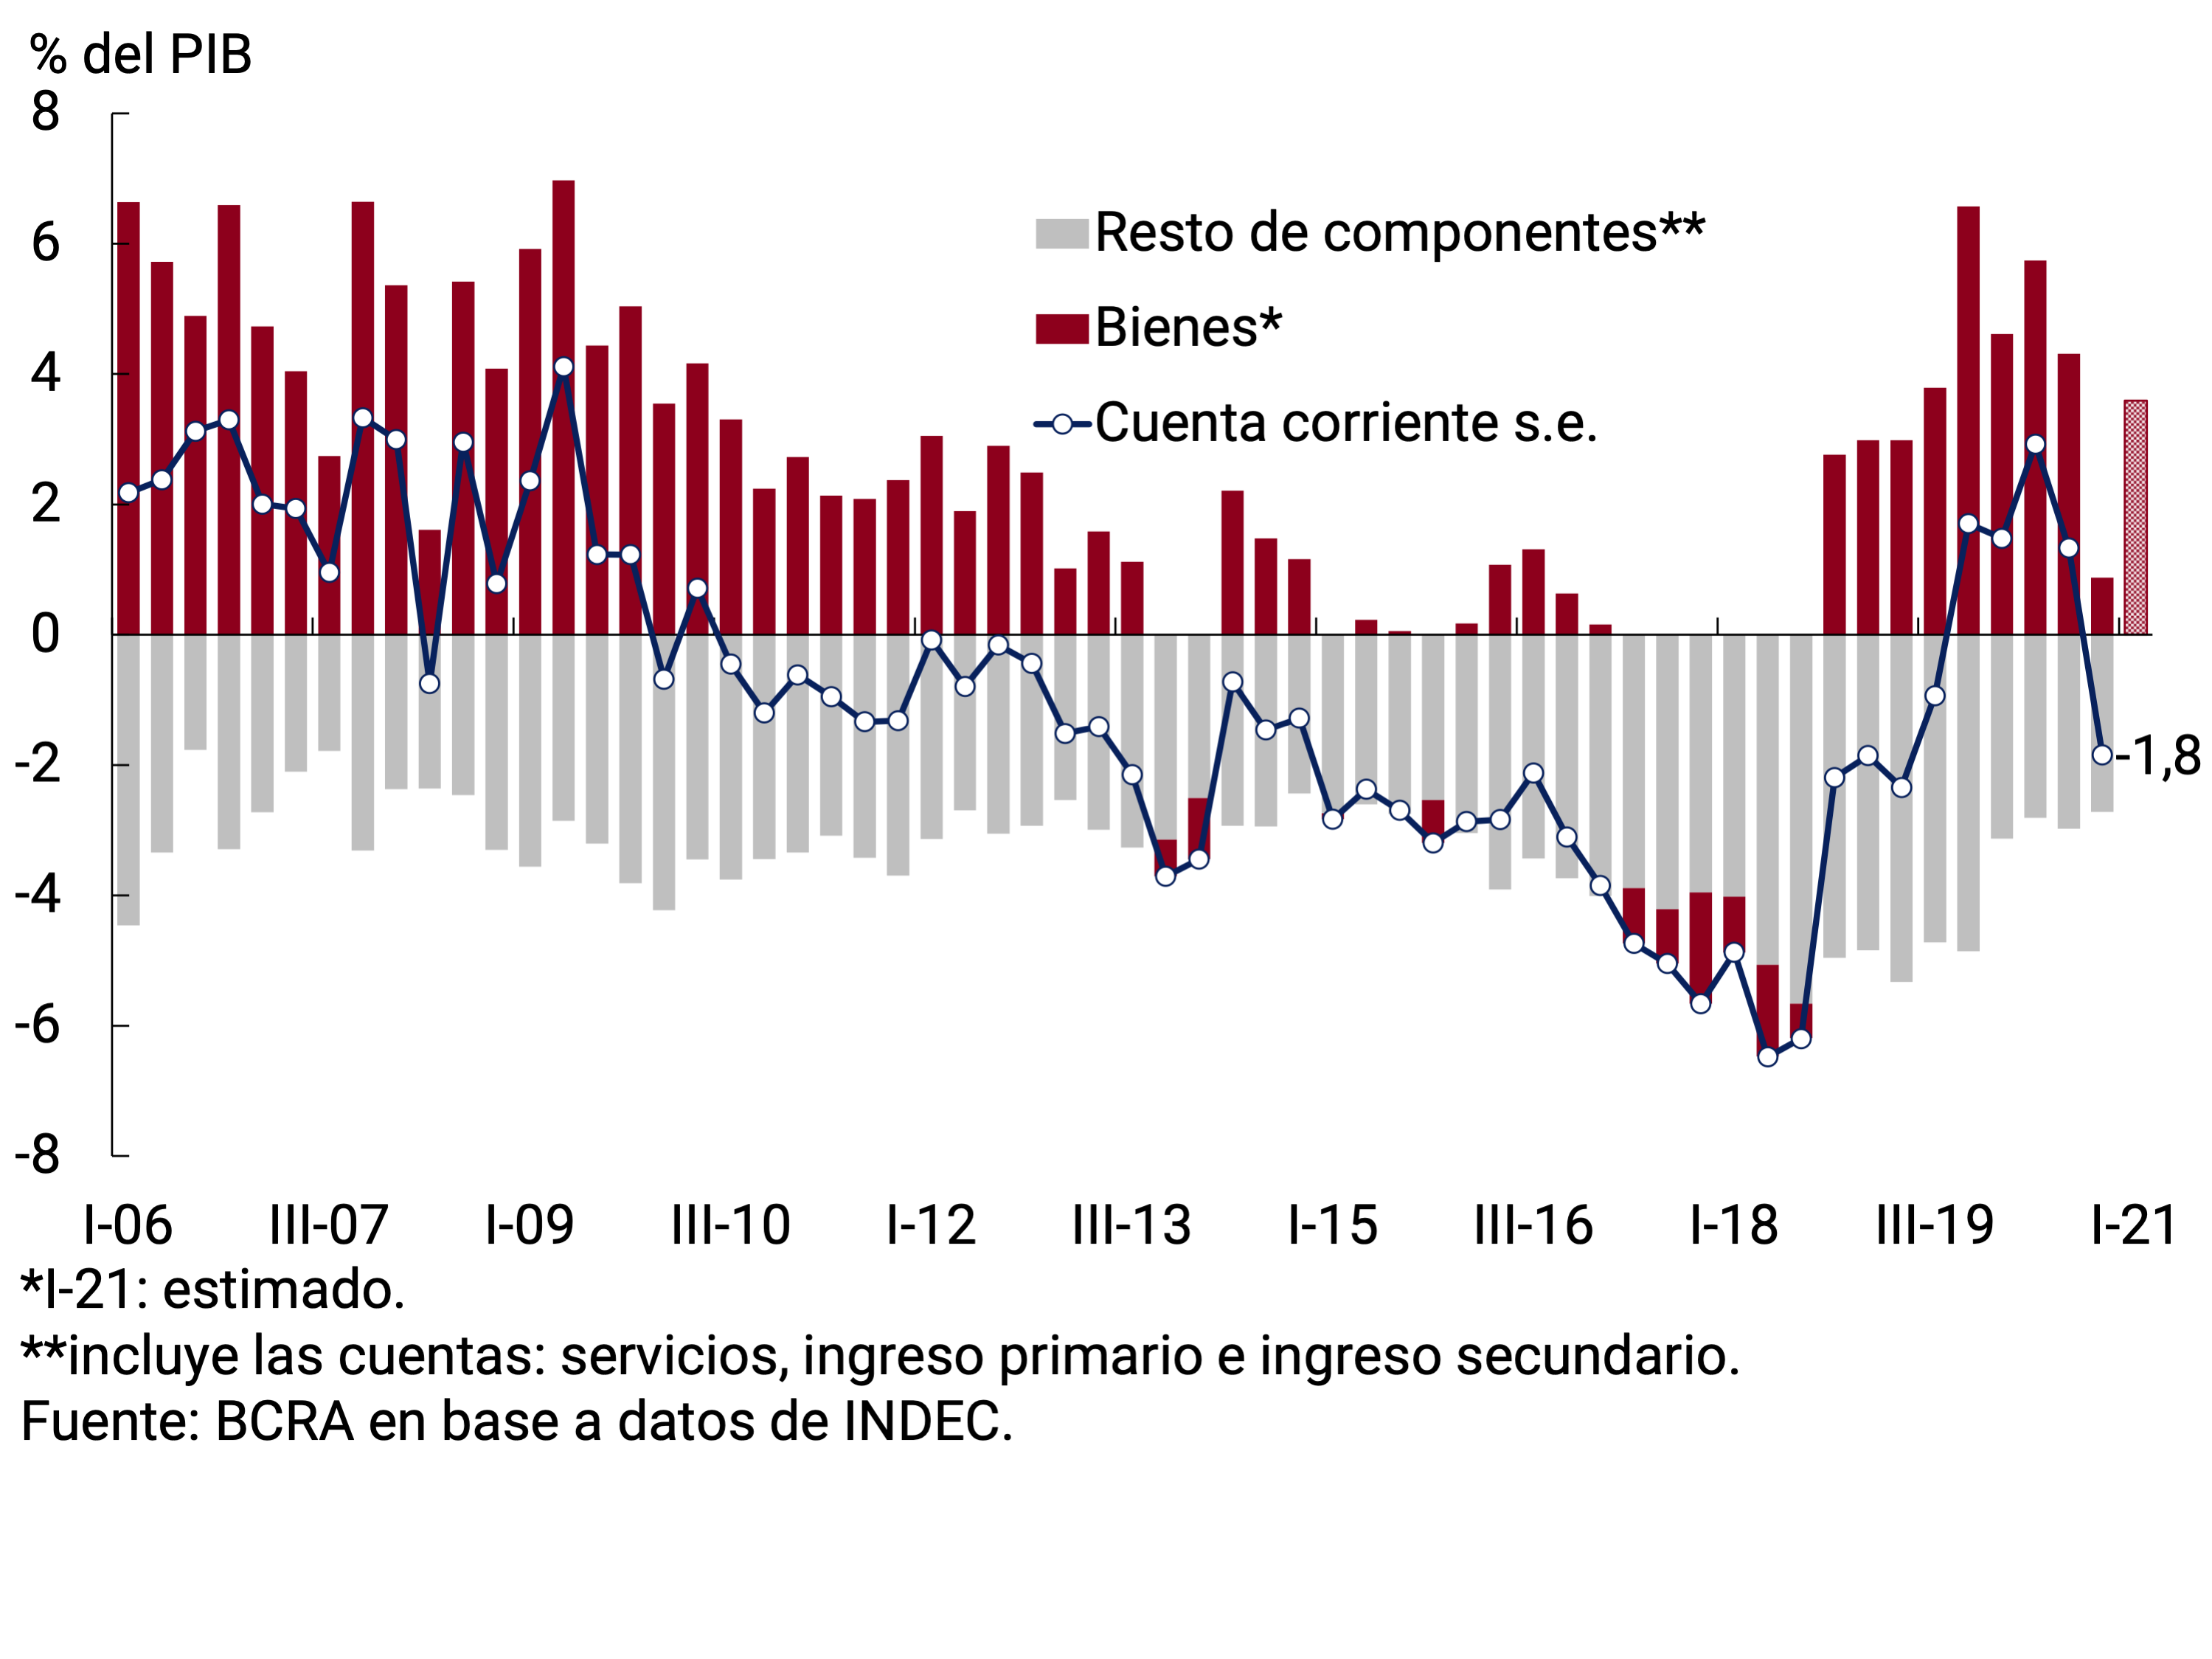
In the first quarter of 2021, the normalization of port operations, coupled with the improvement in international prices of the main agricultural commodities exported by Argentina, were reflected in an increase in the trade balance of goods, which would push the quarterly current account balance back into surplus territory (see Figure 4.1).
In the first three months of 2021, the export values of seasonally adjusted goods reached US$17,443 million (FOB), 27% above the quarterly average of 2020 and 7% higher than the average of 2019. This favorable evolution of exports of goods was due to the performance of export prices, which between May 2020 and March 2021 accumulated a rise of 27% and were comfortably above pre-pandemic levels, in a period in which the international quotations of raw materials exported by Argentina measured from the Commodity Price Index prepared and published by the BCRA (IPMP) grew 54%.
In April, exported values fell 4% month-on-month compared to March levels as a result of a decrease in the exported volumes of Manufactures of Industrial Origin (MOI) and Fuels and Energy. However, seasonally adjusted exports of goods remained above US$ 5,600 million in April, a level significantly higher than that recorded pre-pandemic.
For its part, between January and March 2021, seasonally adjusted imports of goods totaled US$14,141 million, 34% above the quarterly average recorded in 2020 and 15% higher than the average for 2019. In the case of external purchases, both prices and volumes contributed to the increase in imported values (see Figure 4.2).
Figure 4.2 | Trade in goods. Seasonally adjusted series
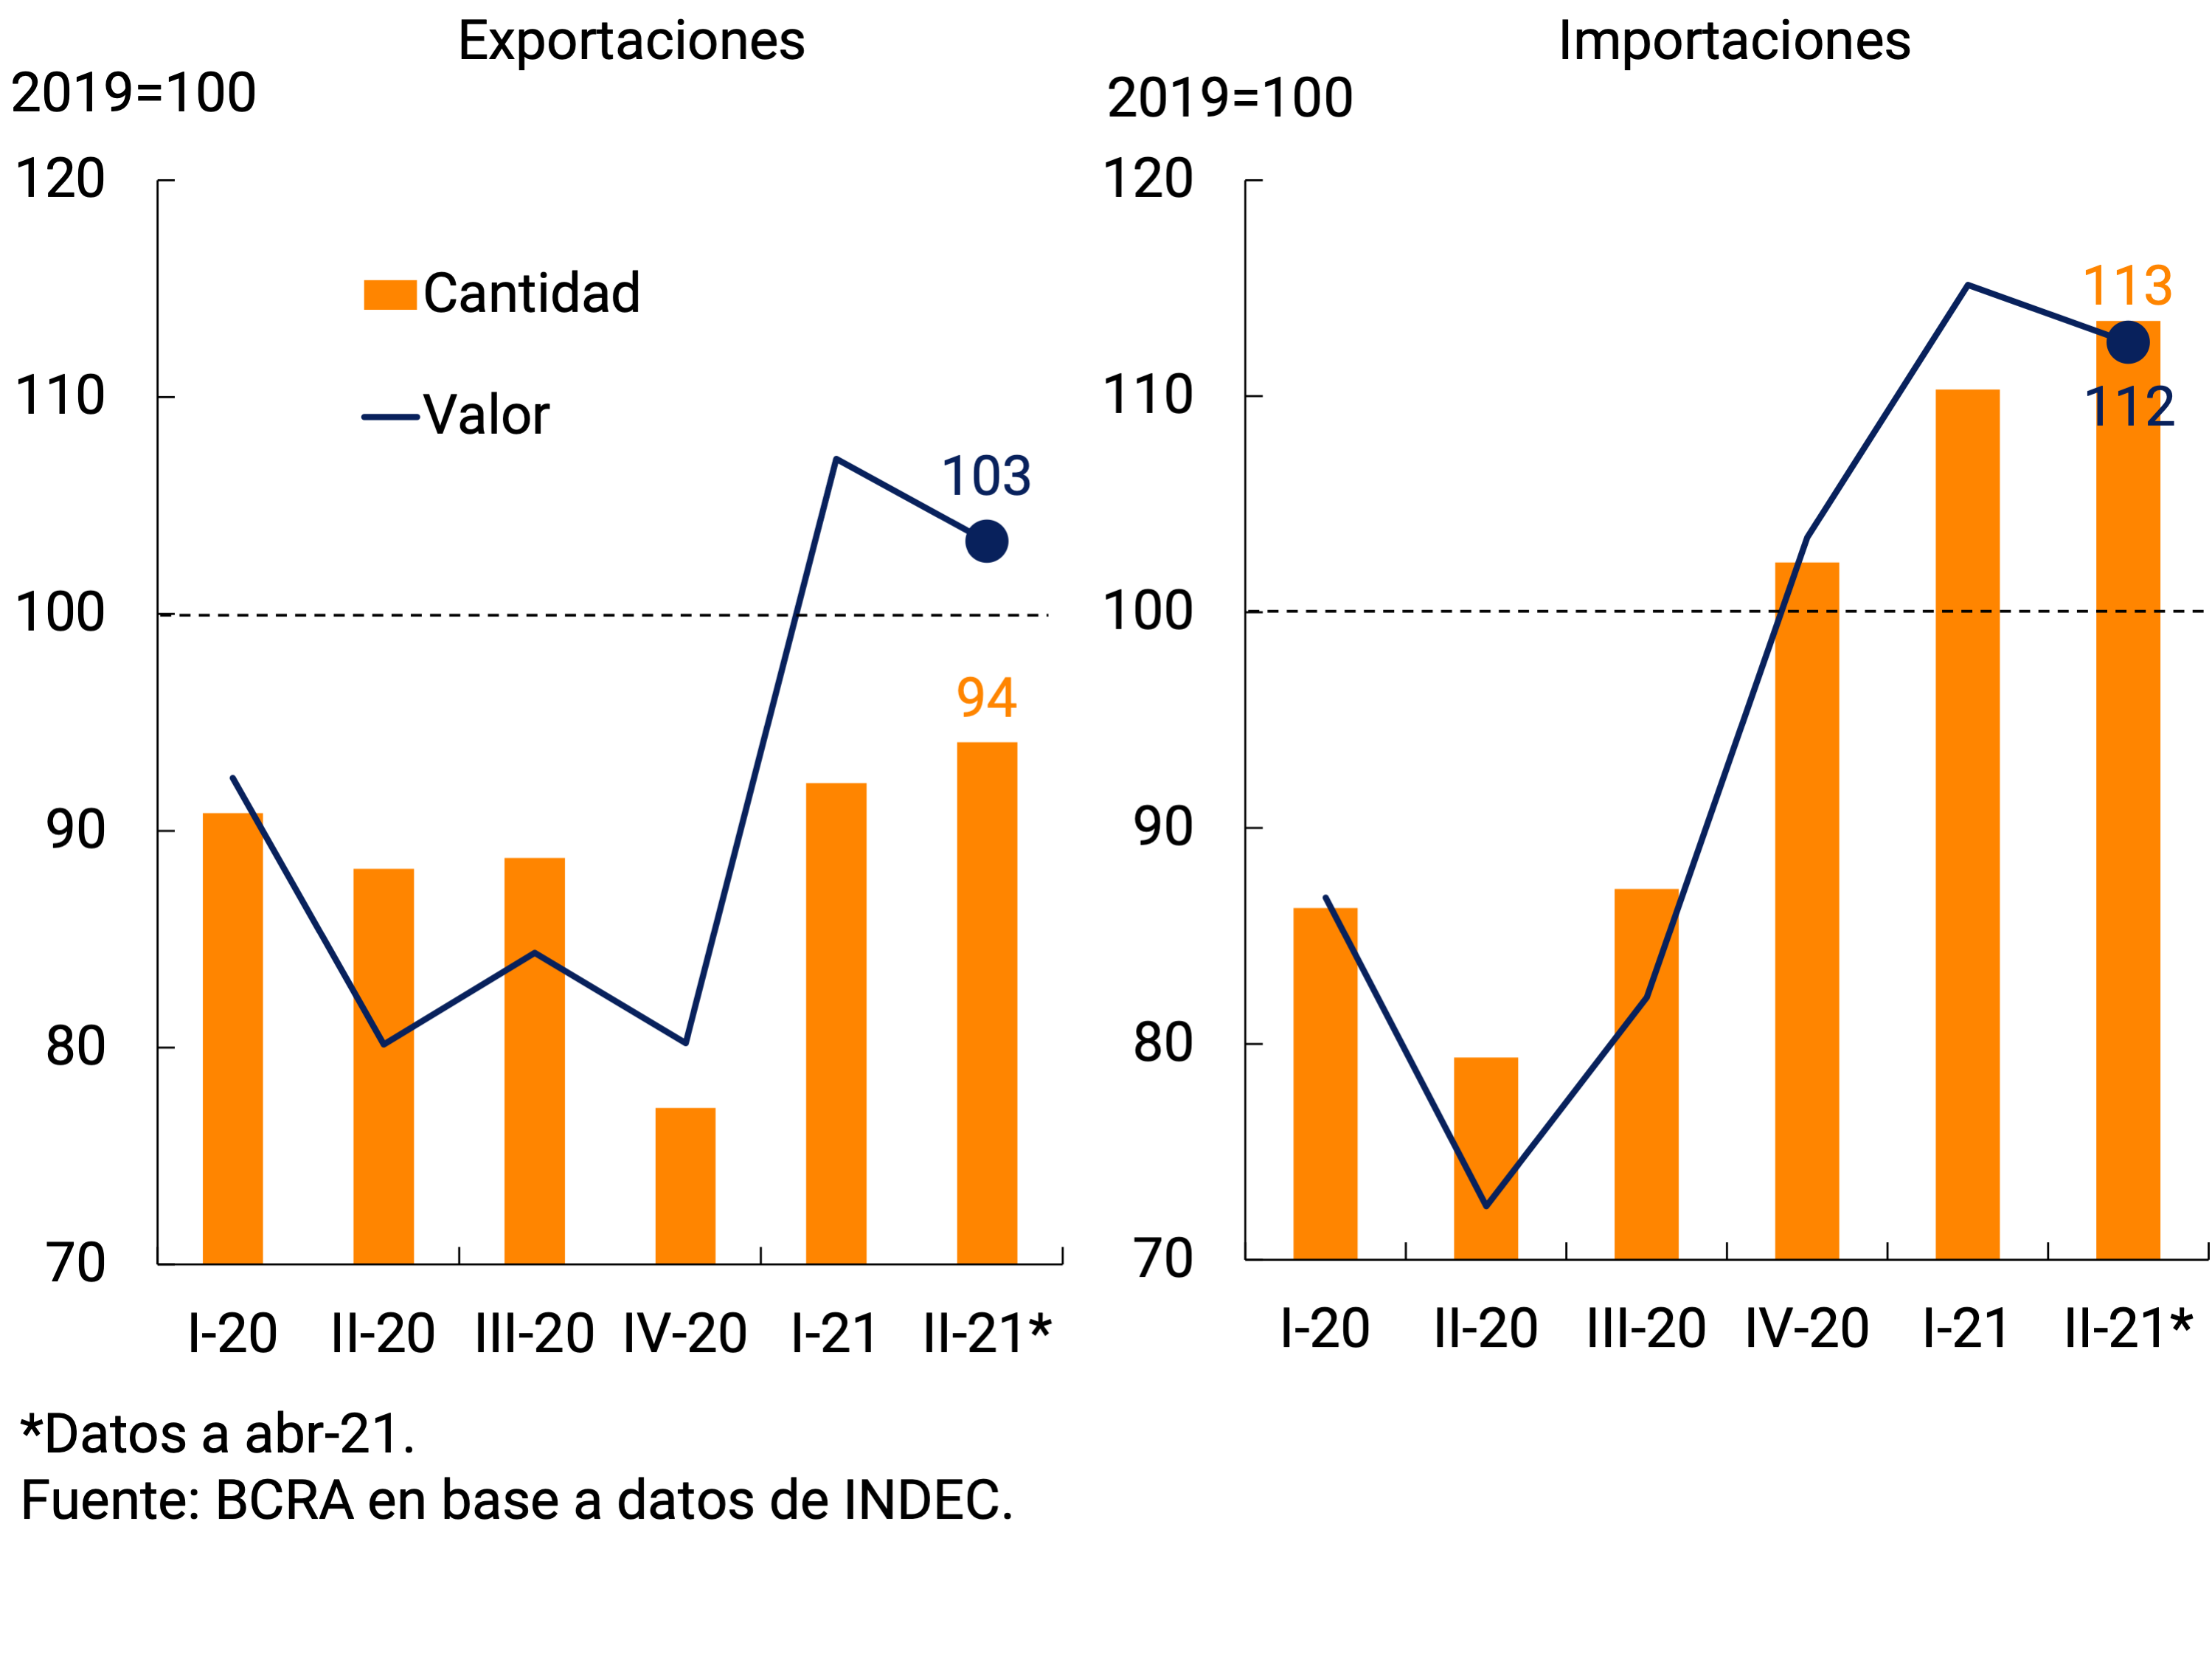
Specifically, in March there was a sharp increase in imported quantities (+15% s.e. monthly compared to Feb-21). This increase was widespread among the different import uses. The case of the acquired volumes of intermediate goods (reached an all-time high) and capital goods and their parts, which returned to mid-2018 levels, stood out. These data suggest that private investment spending, which had already stood out in the fourth quarter of 2020, continues to strengthen (see Chapter 3. Economic Activity and Employment). In April, import volumes fell partially on a widespread basis, with the exception of purchases of parts and accessories for capital goods and vehicles, which continued to increase. Despite this slight correction in the margin, the level of imported quantities in April leaves a positive carry-over of 3 p.p. for II-21 (see Figure 4.3).
For its part, in recent months there was also a marked rebound in import prices, which have accumulated an increase of 11% since December 2020.
Figure 4.3 | Quantities imported. Seasonally adjusted series

Box. Volumes exported one year into the pandemic
The four main items of export of goods (Primary Products (PP), Manufactures of Agricultural Origin (MOA), Manufactures of Industrial Origin (MOI) and Fuels and Energy (S)) can be subdivided into 38 groups of products23. The information available at this degree of disaggregation allows us to understand the performance of foreign sales from a more granular perspective, linked to the export sectors. Overall, all sectors were severely affected by the pandemic in 2020. During the second quarter of 2020, only 7 of the 38 grouped exhibited export volumes above the pre-pandemic level (fourth quarter of 2019). As of the first quarter of 2021, most sectors have not yet been able to recover those levels.
Depending on the recent evolution of shipments abroad, at least four stages can be distinguished in which the export sectors are (see Figure 4.4). The abscissa axis measures the change in the margin (var. % s.e. trim. between IV-20 and I-21), while the ordinate axis assesses the current level with respect to the level at which the sectors were before global trade was affected by the pandemic (var. % s.e. acum. between IV-19 and I-21).
Figure 4.4 | Volumes exported. Seasonally adjusted series

The set of five products located in quadrant I is in a growth phase: their non-seasonal export quantities currently exceed those recorded at the end of 2020 (floor of total exported volumes) and are also higher than those of the fourth quarter of 2019, i.e. those of the pre-pandemic global context. All the groupings that are located in this quadrant (vegetable fats and oils, dairy products, land transport material, chemical products, and machines and electrical material) stand out for their weight in the values exported: in sum, they represented 25% of total exports in 2020. In the specific case of foreign sales of vegetable fats and oils (where soybean oil is registered), not only was there a growth in quantities, but also in export prices, as a result of a manifest shortage in the global market for vegetable oils, which boosted the demand for soybean oil from our country. Foreign sales of land transport equipment and machinery and electrical equipment were boosted by a recovery in external demand (mainly from Brazil), while chemicals were boosted by the resumption of biodiesel shipments to the European Union. For its part, the increase in exports of dairy products was linked to a rise in primary milk production.
A larger group of products (quadrant II) is in a recovery phase, with improvements in the margin, but still far from pre-pandemic levels. In this segment, grains (cereals and oilseeds) and residues from the food industry (where soybean pellets are registered) stand out, affected in December by the strike in the ports where the bulk of the production is shipped.
A large number of grouped members (18) exhibit a negative dynamic. They are below the levels of the end of 2019 and continue to fall at the margin. In this group (quadrant III), precious metals stand out, whose domestic production continues to be affected by the sanitary measures put in place to mitigate the effects of the pandemic.
Finally, three categories of goods can be counted whose exported volumes exhibited a different dynamic from that of most sectors. They had their best moment during 2020 (tobacco in the IV-20, beverages in the III-20 and oil in the II-20), and in the margin they show signs of weakness (quadrant IV).
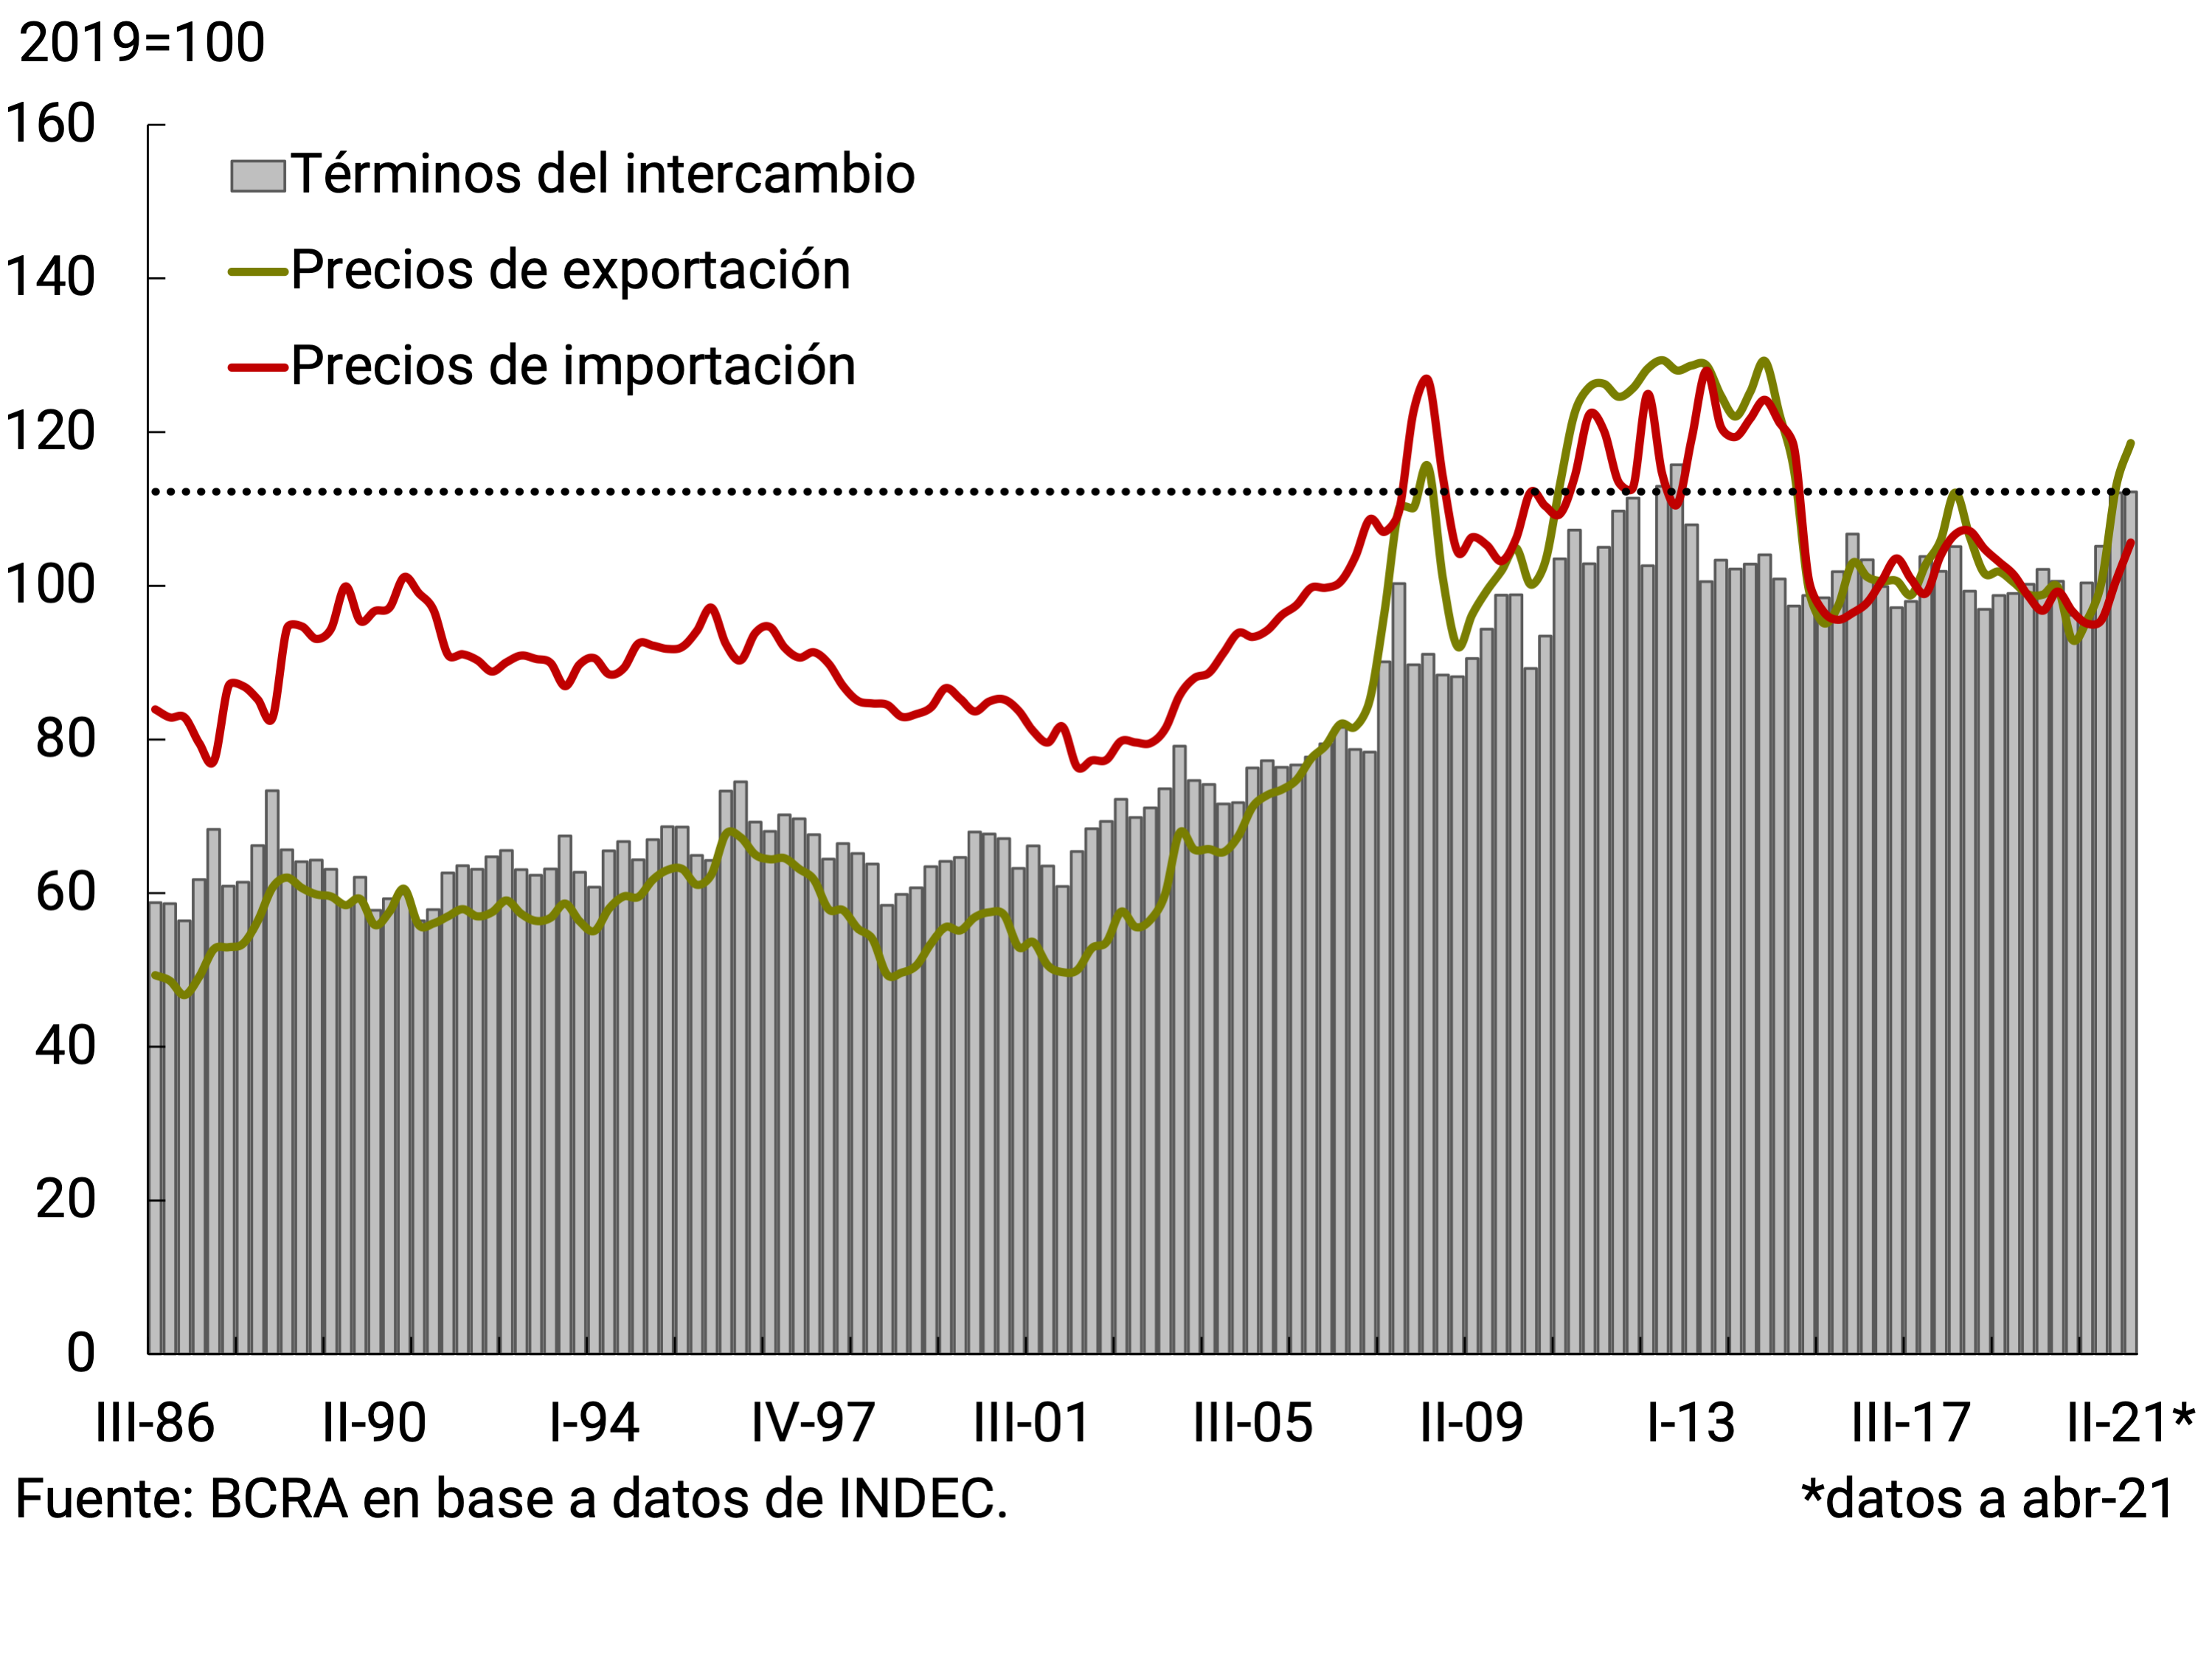
In the first quarter of 2021, the evolution of foreign trade prices in goods resulted in a 7.5% improvement in the terms of trade compared to the fourth quarter of 2020. The sustained rise in export prices allowed Argentina to have the most favorable terms of trade in the last 9 years, standing just 2.4% below the peak recorded in the third quarter of 2012 (see Figure 4.5). With partial data up to April, the terms of trade remained constant so far in the second quarter as a result of similar increases in export and import prices compared to the average for the first quarter of 2021.
Figure 4.5 | Terms of Trade in Foreign Trade in Goods
Box. Recent developments in international commodity prices
Since the publication of the IPOM in February 2021, international commodity prices continued their upward trend. Among those that have a significant weight in Argentina’s export basket, since the beginning of March, the increases in the reference prices of soybean oil (+46%), corn (+21%) and soybeans (+14%) stood out. Thus, international prices of agricultural commodities in current dollars recently reached levels similar to those of the second quarter of 2012. On May 19, 2021 (latest available data) soybeans were close to US$590/tn. tonne, and both wheat and corn exceeded US$250/tn. The case of soybean oil stood out, which in the Chicago spot market reached an all-time high on May 18, 2021: US$1,701 per ton.
The price of crude oil also registered a significant increase (almost tripling in value compared to the minimum records of April 2020). However, in historical terms, the recently reached level (around US$66 a barrel in the Brent variety) is still a long way from the figures for the second quarter of 2012 (approx. US$109 a barrel; see Figure 4.6).
Figure 4.6 | International prices of selected raw materials (in current dollars)
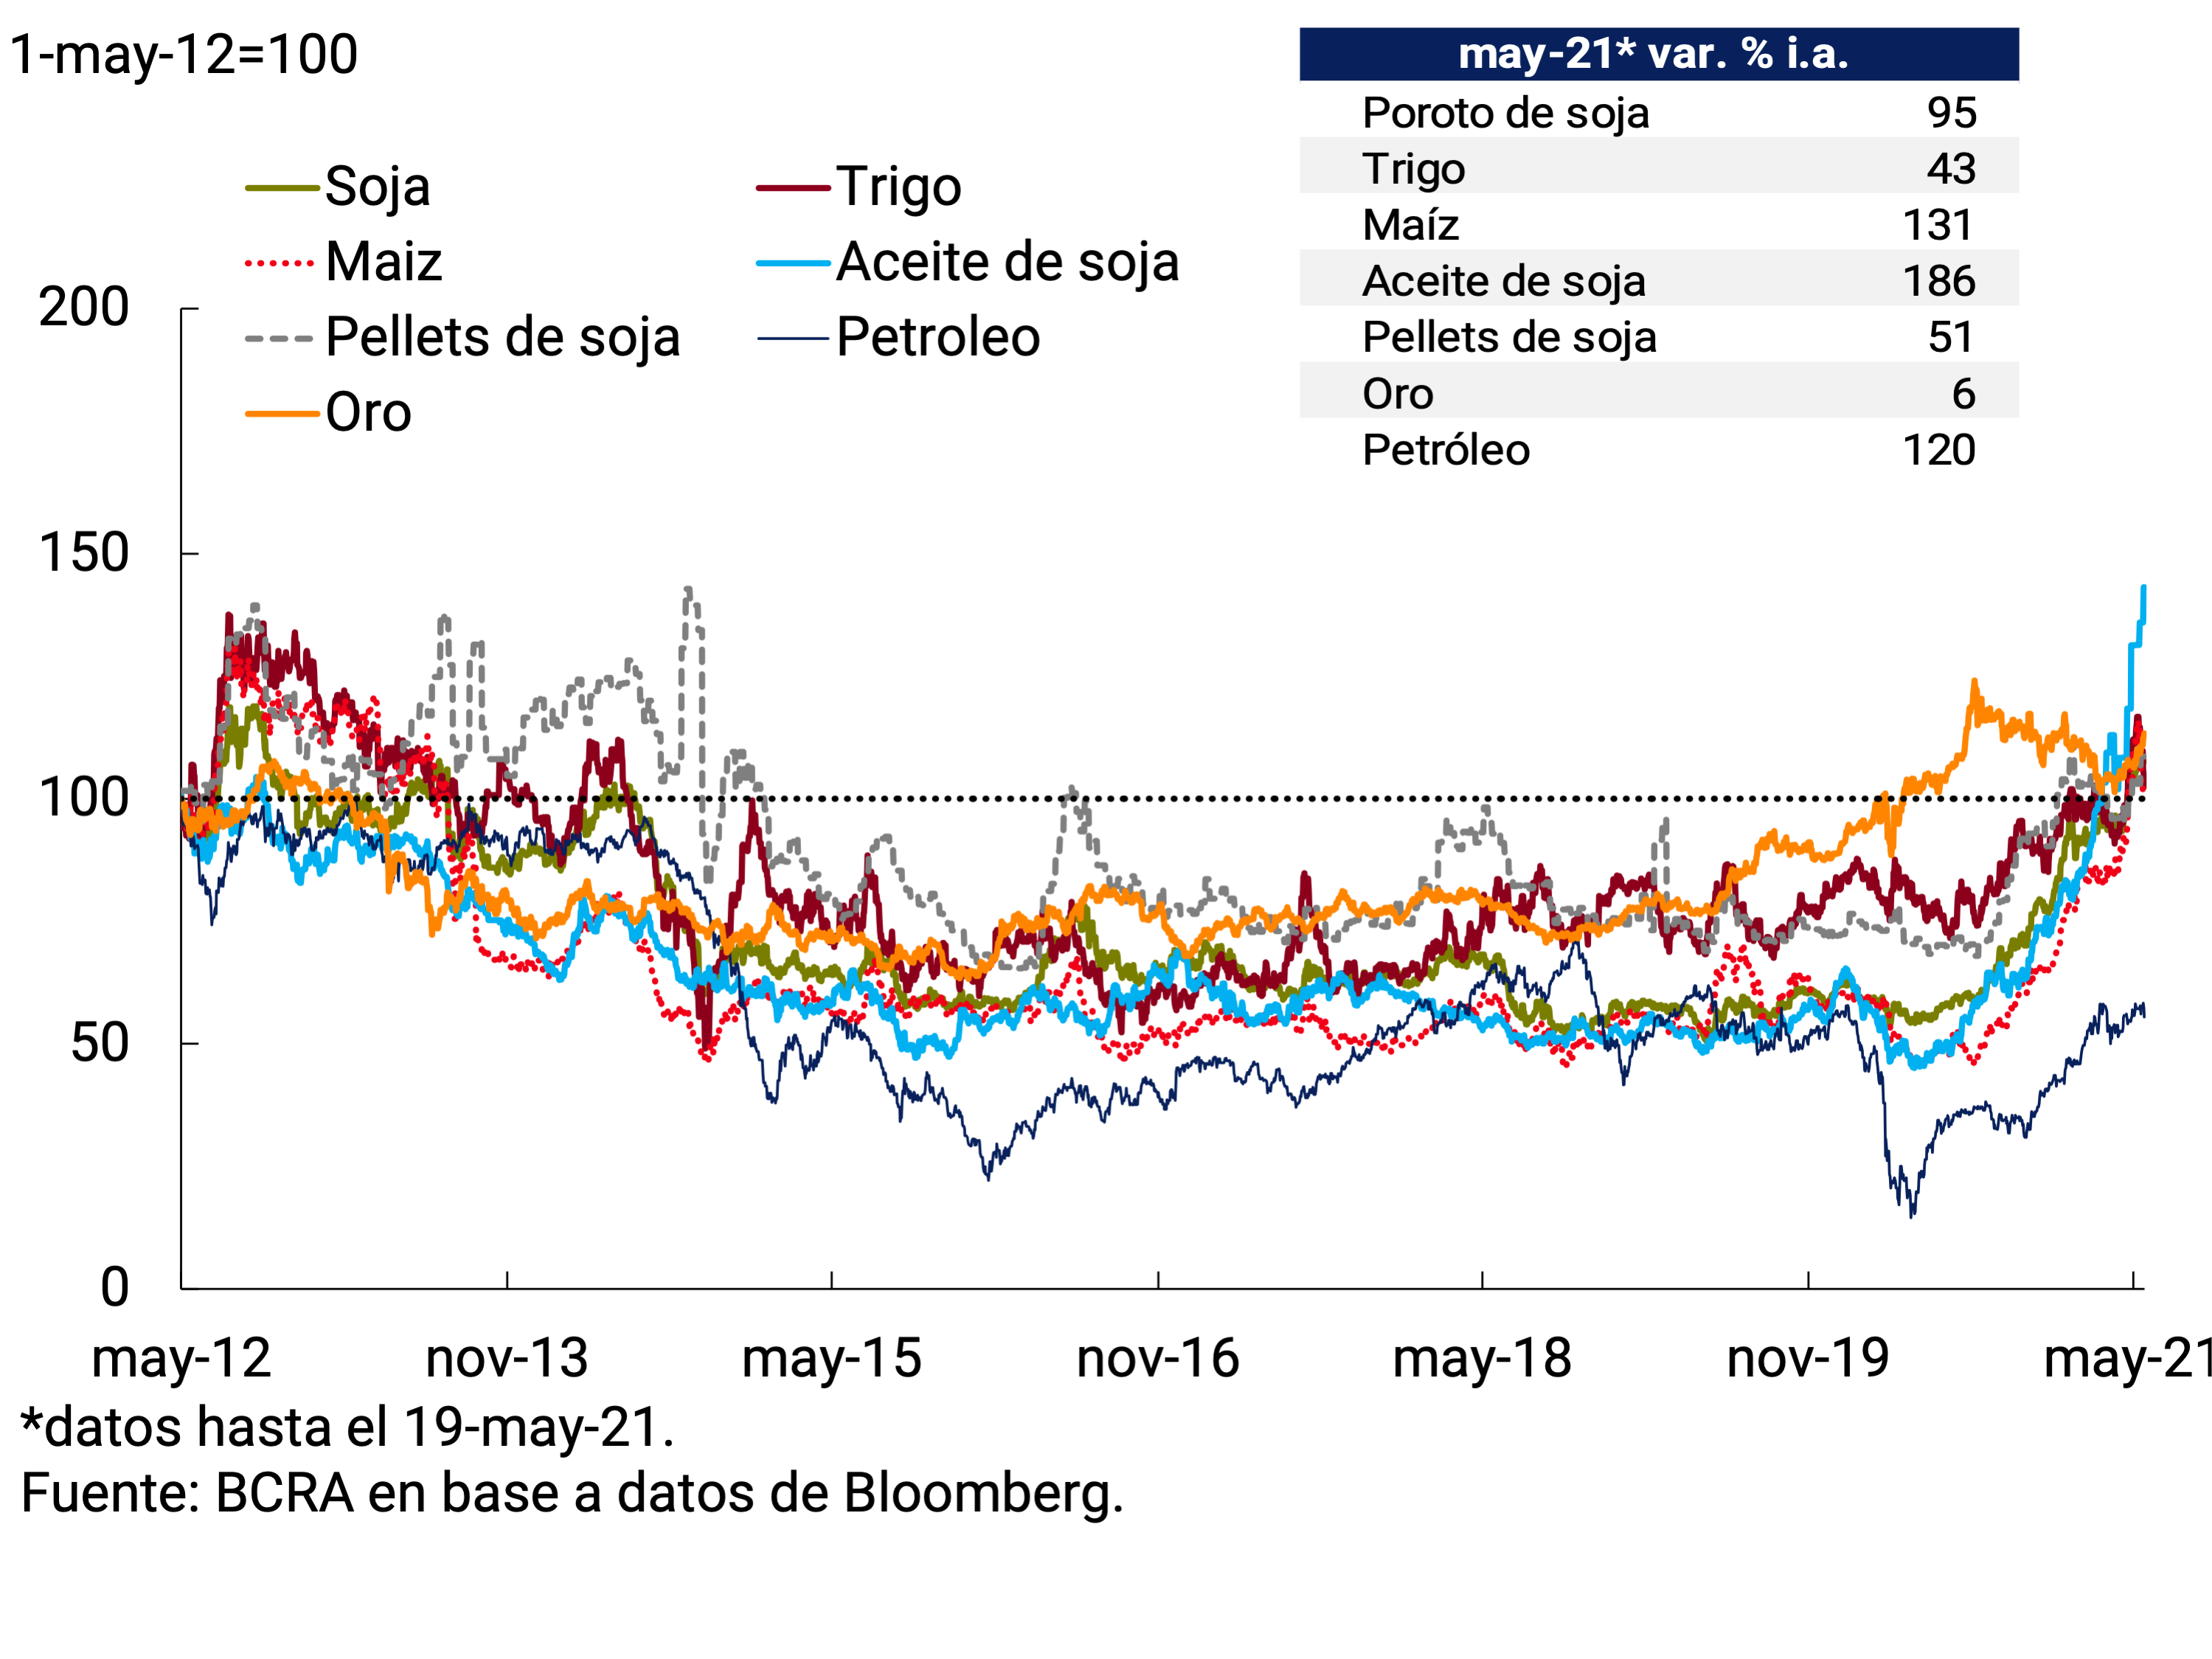
This combination of prices (food near the highs of 2012 and lagging oil) implies that the relative soybean/oil price will remain comfortably above the average of the last 20 years, a favorable level for the Argentine economy.
4.2. The BCRA bought US$5.432 billion in the foreign exchange market so far this year
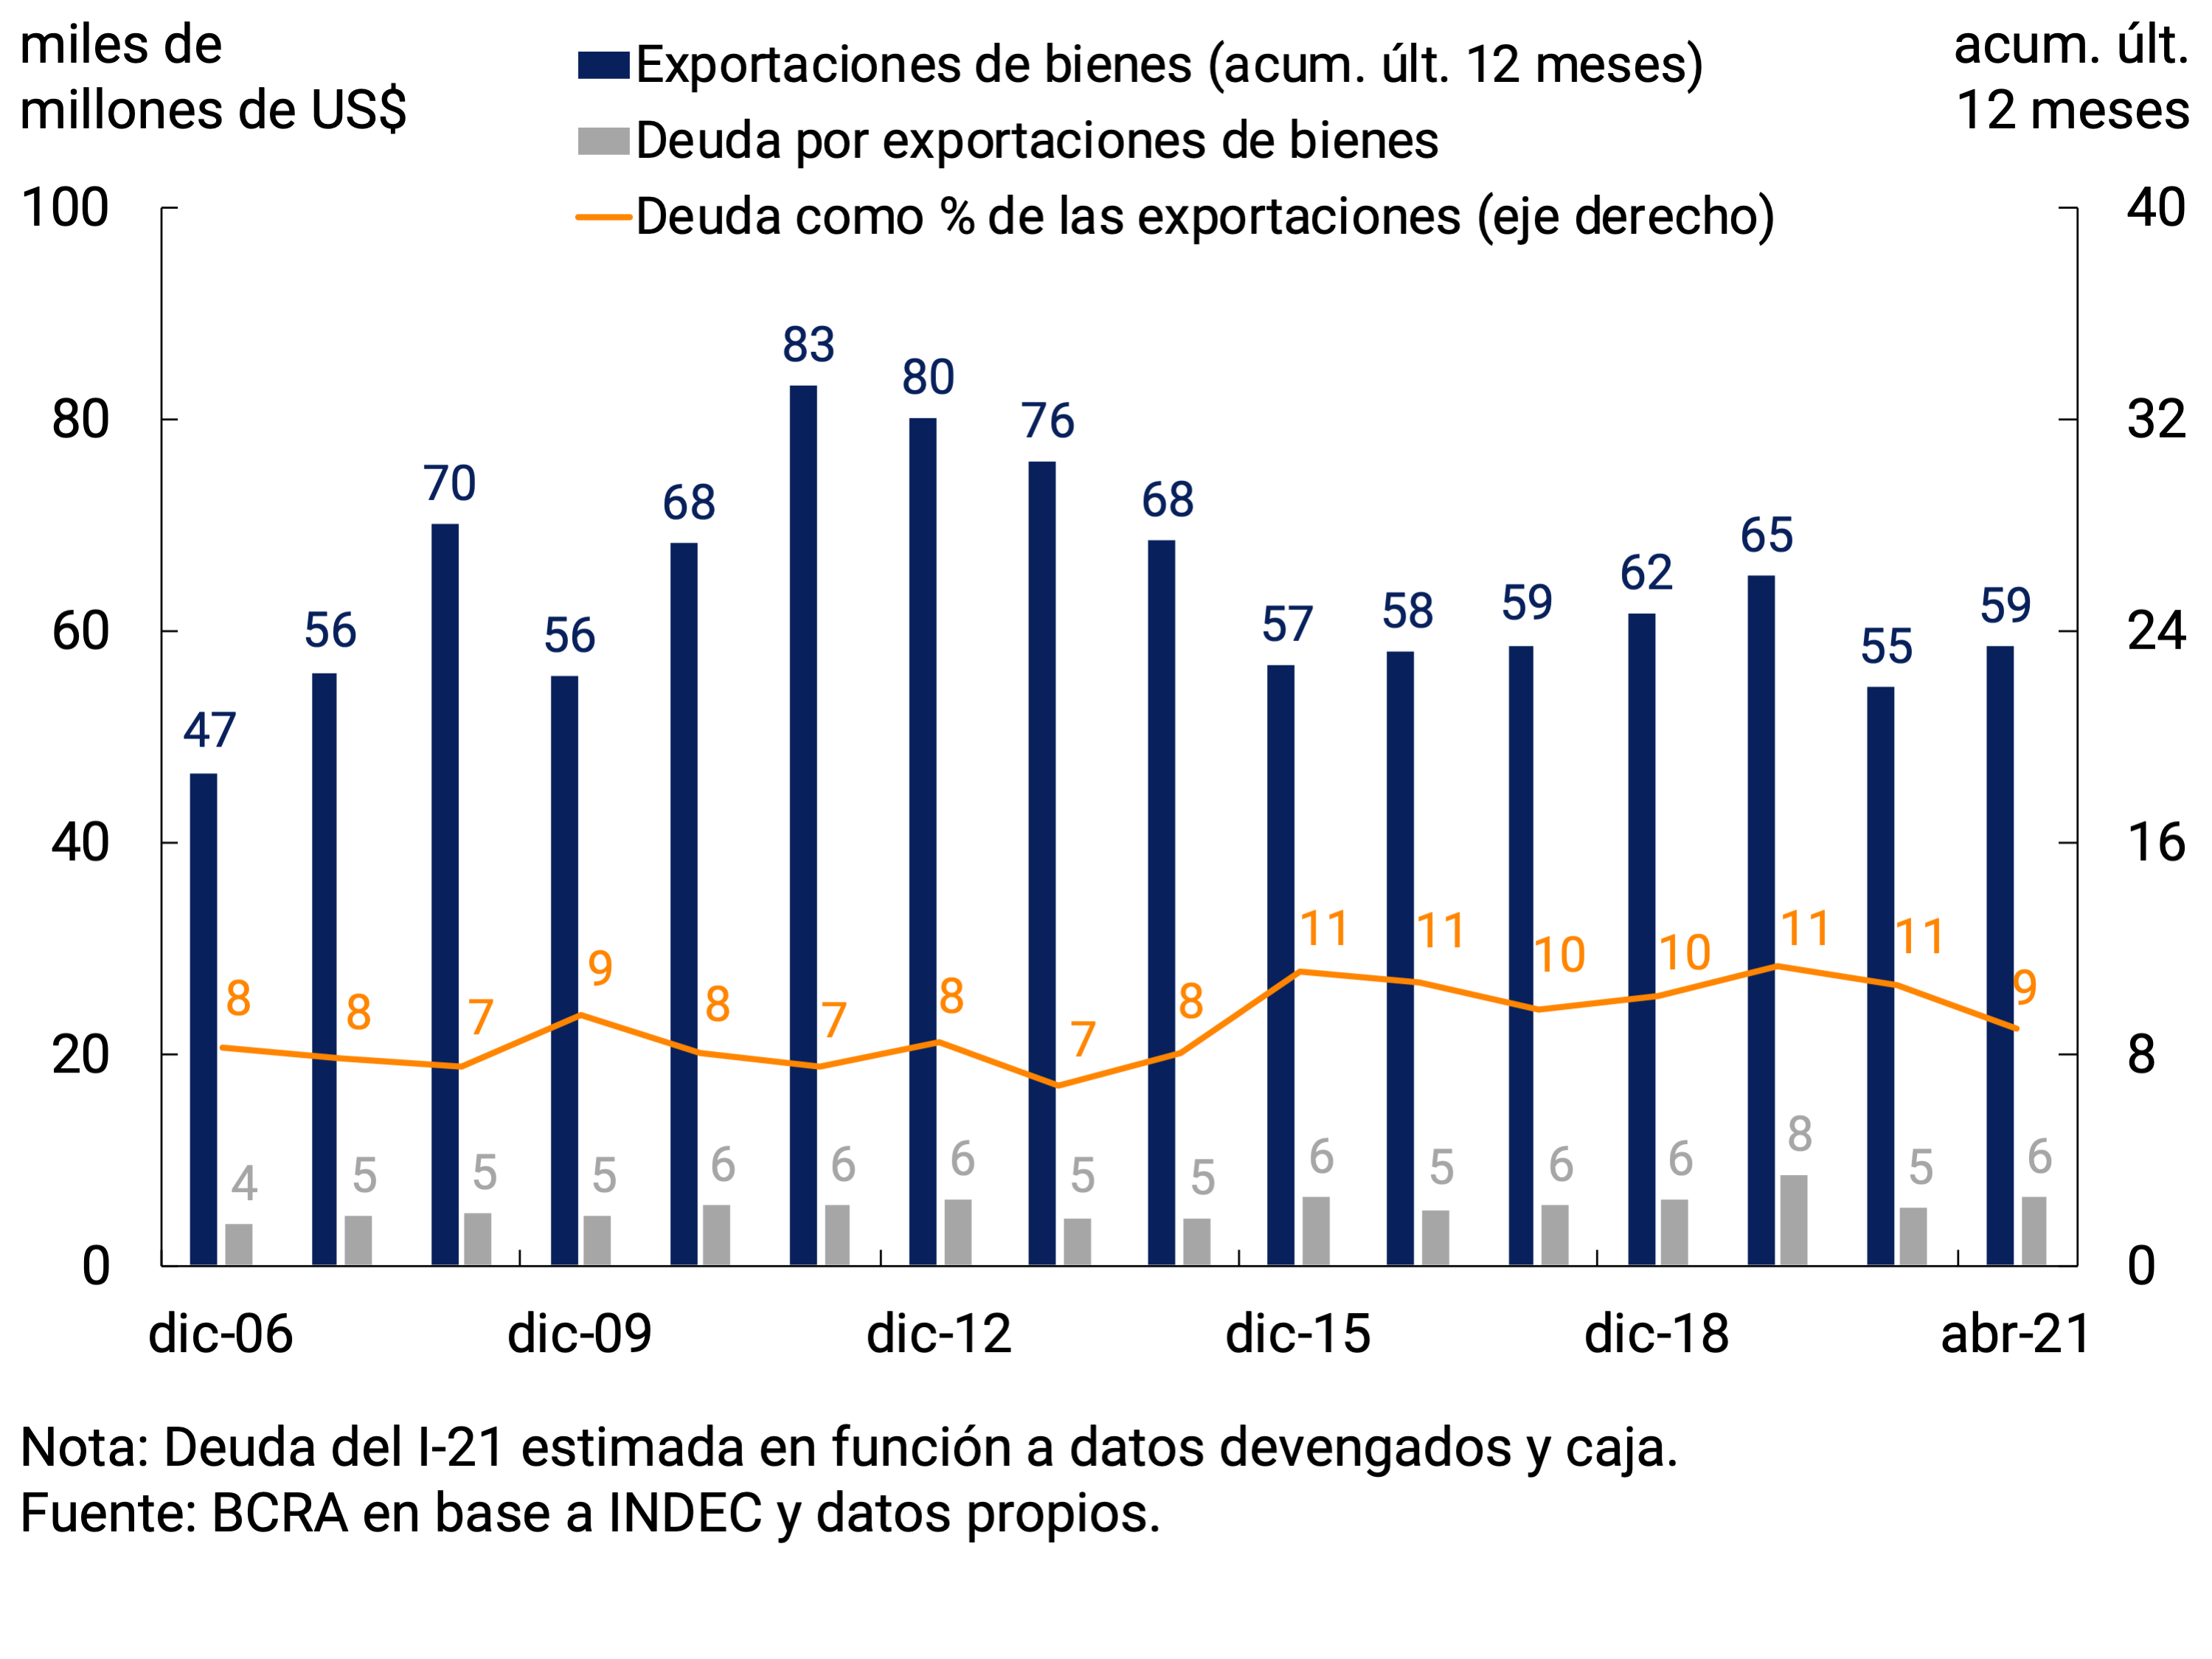
During the first 4 months of 2021, exporters recorded revenues from collections of exports of goods through the foreign exchange market of US$22,900 million, surpassing exports of goods by about US$1,300 million in the period. Considering that most of this differential was explained by an increase in external debt through advances and pre-financing24, the ratio of this type of debt to exported securities stood at 9%, a level lower than in recent years (see Figure 4.7).
Figure 4.7 | Assets. Exports and external debt for exports
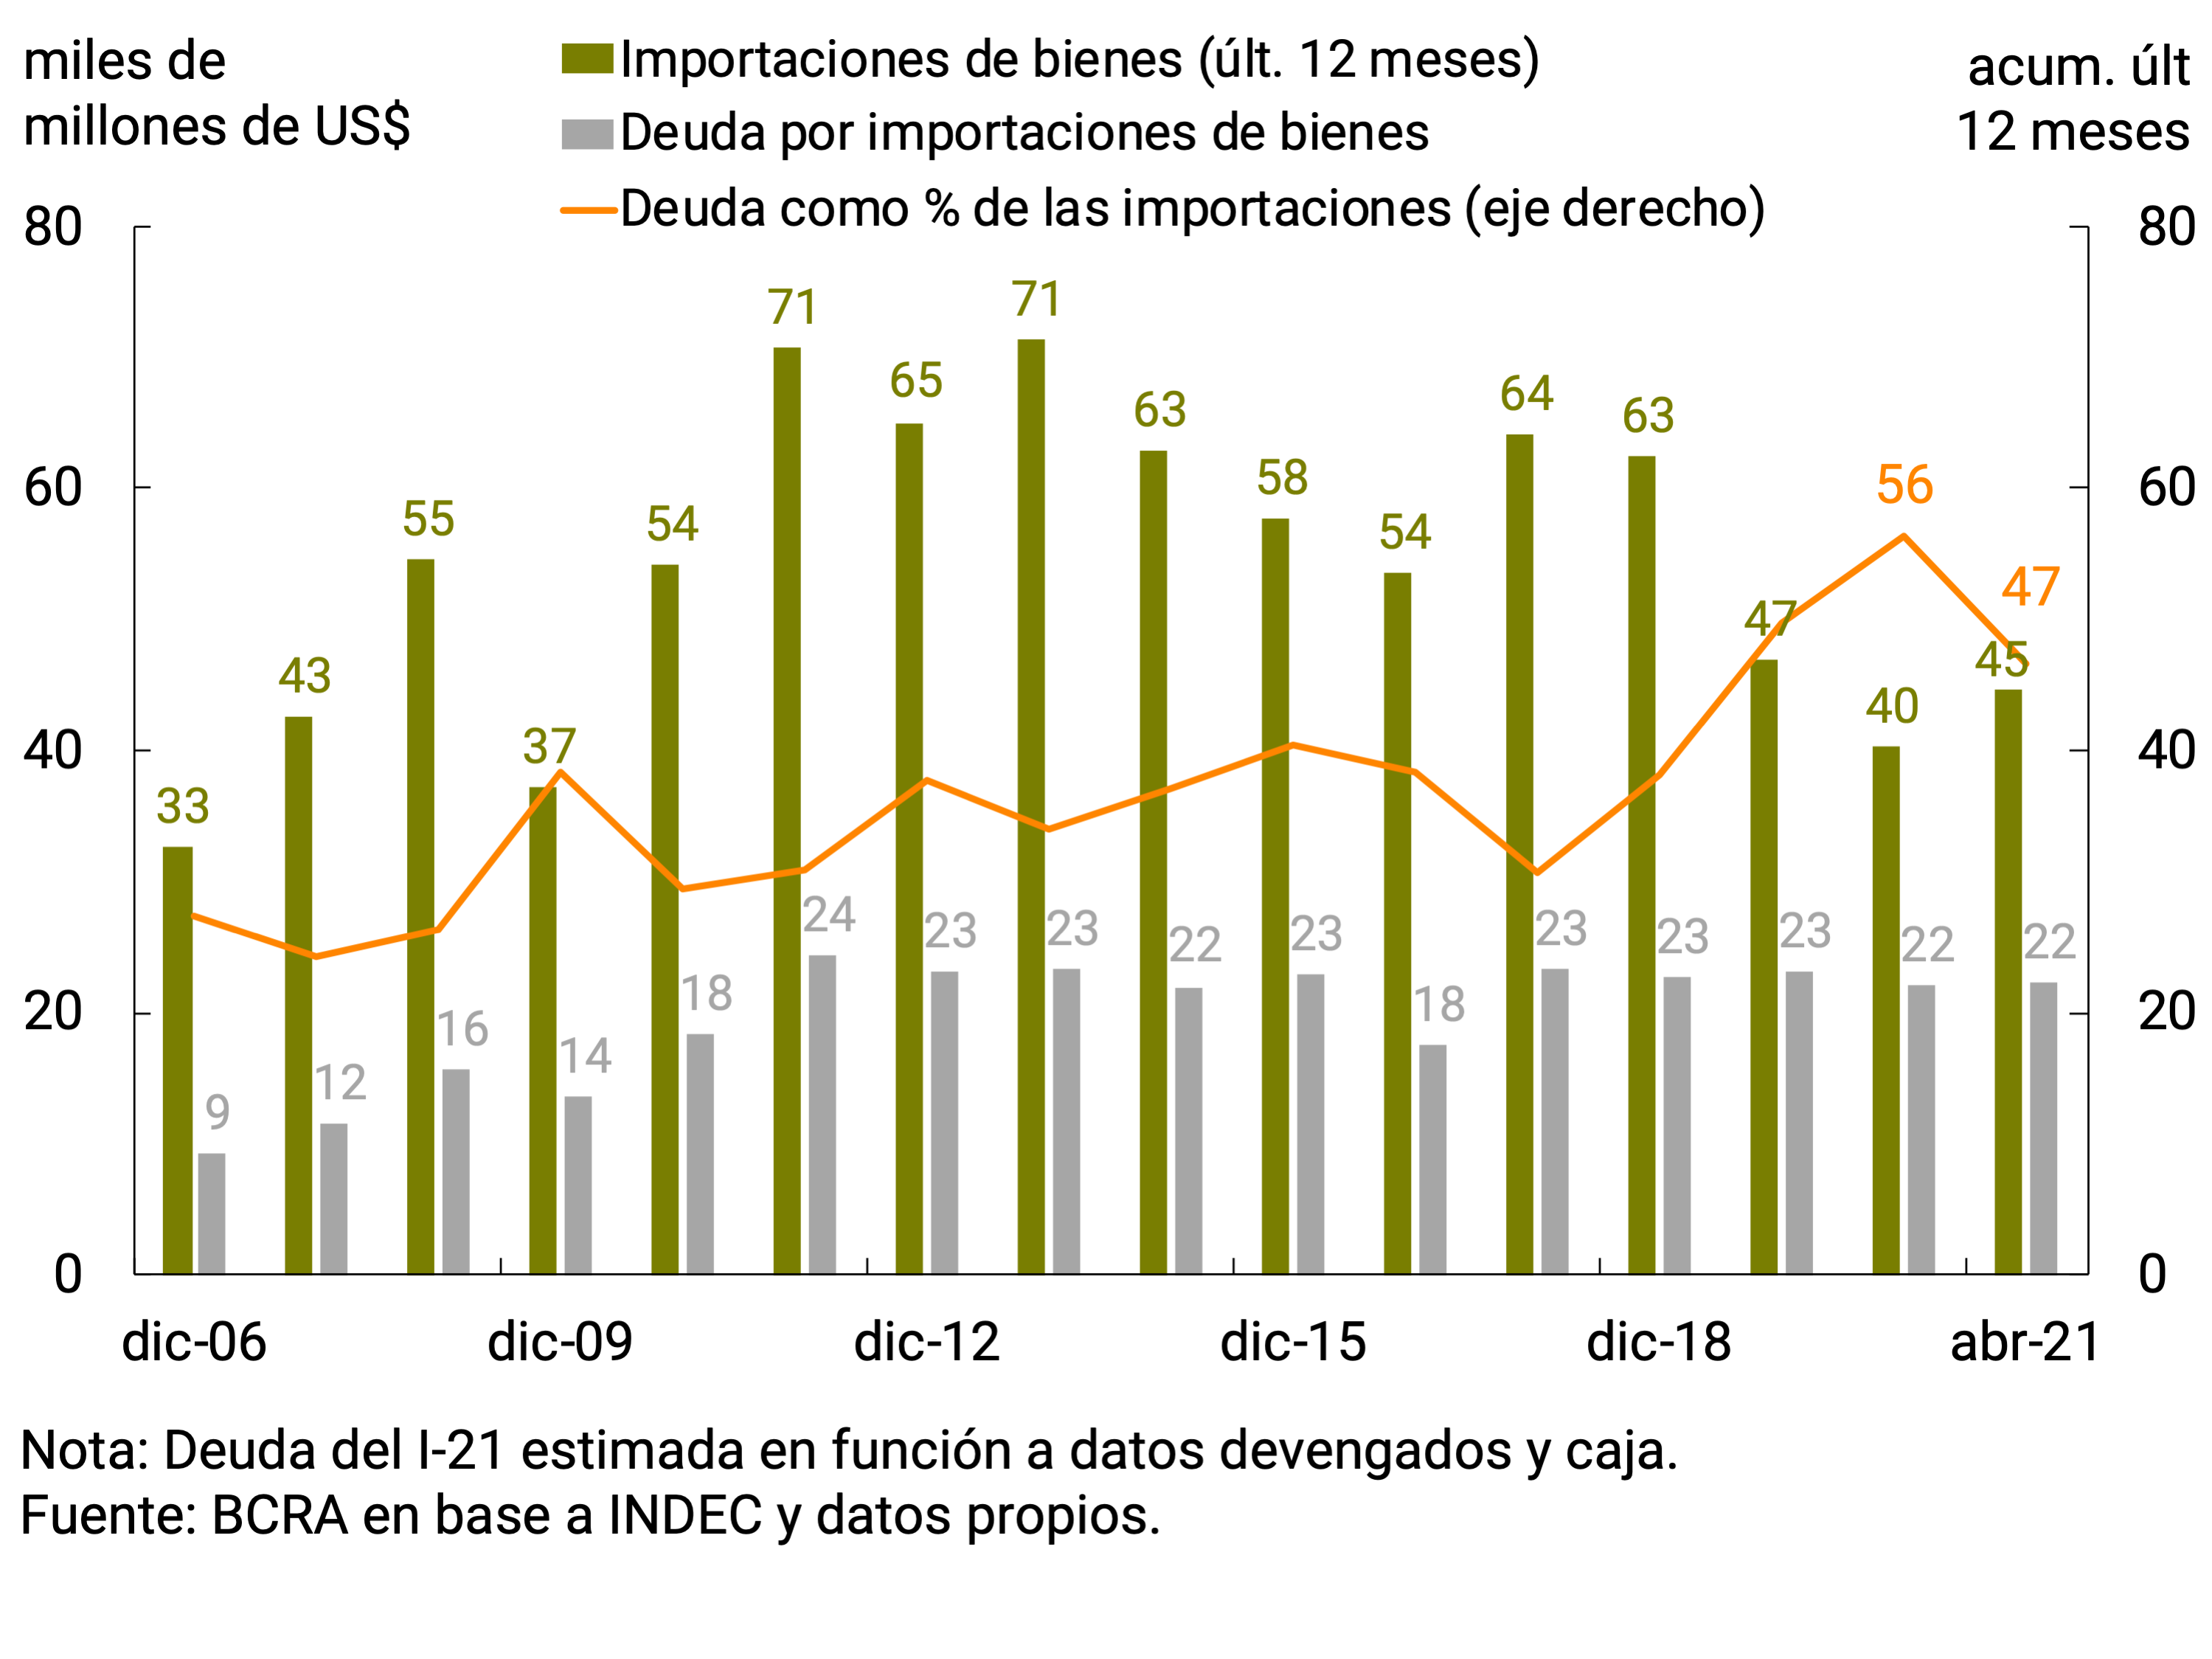
During 2020, the BCRA established a series of regulations aimed at promoting a more efficient allocation of foreign currency, which affected both the evolution of private commercial and financial debt, and which remain in force for the year 202125. In this context, payments for imports of goods through the foreign exchange market in the first four months, for US$16,400 million, were about US$140 million below imports in FOB value for the period, which would imply an increase in foreign indebtedness for this concept (or a reduction in foreign assets due to advances). Thus, the relationship between external debt and the level of imports, which reached the highest level in the last 15 years in 2020, registered a fall of 9 percentage points compared to the previous quarter, based on the increase recorded in the level of external purchases (see Figure 4.8).
Figure 4.8 | Assets. Imports and external debt for imports
Finally, with regard to financial debt, and as part of the current regulatory framework mentioned above, in September 2020, through Communication A7106, the guidelines were established under which private sector companies could initiate a process of refinancing their respective external liabilities, which would allow their maturity profile to be adapted to the guidelines required for the normal functioning of the foreign exchange market.
In this context, the renegotiations registered during the first four months of 2021 of some 40 companies had an impact on lower net purchases in the foreign exchange market of about US$500 million compared to the original maturities for the same period. For this same reason, in the fourth quarter of 2020, private financial debt service payments were reduced by US$500 million.
The aforementioned recovery in exports, added to the increase in commercial debt for exports and imports of goods, resulted in a net result for goods in the foreign exchange market of US$6,427 million in the first four months, about US$1,500 million higher than the result of the FOB trade balance in the same period, and exhibiting a strong improvement compared to the same period of the previous year (90%)26.
Thus, until May 20, the BCRA bought US$5,432 million in the foreign exchange market, while international reserves increased by US$2,130 million in the same period. This difference is mainly explained by the cancellations of principal and interest on foreign currency debt of the National Government, which directly affected international reserves of about US$1,876 million, and the fall in the holdings of entities in foreign currency accounts at the BCRA, which generated a decrease in the BCRA’s International Reserves of US$678 million in the period.
4.3. Perspectives
Going forward, the economy is expected to sustain the current account surplus. The probability of a severe drought scenario on the coarse crop was substantially reduced thanks to the rainfall of the last few weeks. Likewise, the international prices of the main grains exported by Argentina remained at high levels, which allows us to foresee higher income from agricultural exports than those of the last 5 years. On the other hand, imports of goods, which experienced a strong rebound from the second half of 2020, would resume a more moderate growth trend, linked to the trajectory of economic activity, which is close to the pre-pandemic level.
The regulatory framework in force in the Foreign Exchange Market will allow the BCRA to continue to efficiently manage the foreign currency originated in commercial transactions, in order to preserve monetary, financial and exchange stability.
5. Public Finance
During the first four months of 2021, the public accounts continued to strengthen due to higher tax collection associated with the economic recovery and a more limited trajectory of extraordinary expenditures, compared to the massive financial assistance deployed during 2020 to alleviate the critical situation faced by families and businesses at the beginning of the COVID-19 pandemic.
Tax collection continued to boost during the first four months of the year from the contribution of taxes related to foreign trade – in a context of increases in international commodity prices – and the sustained recovery of taxes linked to domestic demand. Likewise, the regulatory modifications on taxes provided for in the Social Solidarity and Productive Reactivation Law of the end of 2019 and in the National Budget Law 2021 continued to have a positive impact on public revenues.
For its part, during the first quarter of the year, expenditures continued to grow in real terms compared to the same period of the previous year. In April, they exhibited a retraction due to the high base of comparison of 2020, when massive assistance to families and companies had been made. Taking care of the critical situations derived from the economic and social emergency, primary spending was also driven by a significant dynamism of capital expenditure with the aim of supporting the recovery process of economic activity, in accordance with the provisions of the 2021 National Budget.
The nominal growth rate of expenditure showed a lower year-on-year growth than that of revenues, which allowed the primary deficit to continue to be progressively reduced. In the last 12 months to April 2021, the primary deficit on a cash basis accumulated a balance equivalent to 4.5% of GDP, significantly lower than that observed during 2020 (-6.5% of GDP). This trajectory is consistent with what was established in the 2021 National Budget, which foresees a primary deficit of NFPS of 4.2% of GDP during this year. Going forward, revenues that were not originally budgeted are expected, basically from the Solidarity and Extraordinary Contribution of large fortunes (Law 27605), while new assistance to families and companies was also provided that will involve additional expenses in the context of the pandemic.
Regarding financing from the National Treasury, during the first four months of 2021, the local market continued to play a greater role compared to the same period of the previous year, allowing less financial assistance from the BCRA. The National Government continues negotiations with the International Monetary Fund (IMF) and with the bilateral creditors grouped in the Paris Club. For its part, expectations of an extraordinary allocation of Special Drawing Rights (SDRs) by the IMF that would benefit Argentina are consolidated. Among the risks faced in the fiscal scenario, the resurgence of the pandemic stands out, resulting in the need to intensify assistance policies and negatively affecting tax revenues.
5.1. Tax revenue performance improved at the start of 2021
The consolidation of a heterogeneous but sustained economic recovery during the beginning of the year contributed to a 56% YoY increase in national tax collection in the first quarter of 2021, accelerating the pace of increase compared to the previous quarter (see Figure 5.1). In real terms, this performance implied an increase of 9 percentage points (p.p.) compared to the variation recorded during the fourth quarter (+2.2% y.o.y.). In April, the nominal increase was 105% YoY (+40.3% YoY in real terms), due in part to a low base of comparison due to the full impact of the COVID-19 pandemic in April 2020.
Figure 5.1 | Contribution to the nominal growth of national tax collection by tax

The high dynamism of taxes associated with foreign trade was highlighted. In a context of high international commodity prices, export duties registered significant year-on-year growth (+190.4% YoY between January and March, compared to -30% YoY between October and December 2020, a performance that was maintained in April). Taxes linked to foreign purchases29 also showed a strong increase in the first quarter that was sustained during the fourth month of the year, basically explained by the dynamism of imports (see Chapter 4. External Sector).
Taxes related to the domestic market (Value Added Tax (VAT), Profits, Fuels, among others) showed a better year-on-year performance at the beginning of 2021 in relation to previous quarters, in line with the heterogeneous but sustained recovery of economic activity. Income tax rose 63% y.o.y. between January and March, slightly lower than that which had been verified in the previous quarter. It continued to be affected upwards by the regulatory change of September 2020 on the withholding of purchases of dollars and expenses in foreign currency through credit cards30. Net VAT grew 54% YoY in the first quarter of 2021 compared to the 38% YoY increase recorded in the previous quarter. For its part, a set of taxes that were modified by the Law of Social Solidarity and Productive Reactivation (such as Personal Property, Internal, PAIS) and those modified from the 2021 National Budget Law, maintained a good performance.
Finally, social security resources continued to grow more limitedly, influenced by the evolution of wages and employment: they grew 28.3% YoY between January and March, 4 p.p. above the increase observed between October and December31 and continued to recover year-on-year dynamism in April, given the low base of comparison of the same period in 2020. This set of taxes is still negatively impacted by the measures taken by the National Government to address situations in sectors critically affected by the COVID-19 pandemic.
The evolution of tax revenues allowed the total revenues of the National Non-Financial Public Sector (NFPS) to increase in nominal terms by 60.9% y.o.y. between January and March, after having increased 28.6% y.o.y. during the previous quarter32. In April, NFPS revenues advanced 92.9% YoY due in part to the low base of comparison due to the full impact of the COVID-19 pandemic in April 2020. Going forward, it is expected that non-tax revenues will include the resources associated with the Solidarity and Extraordinary Contribution to Help Mitigate the Impact of the pandemic (Law 27605).
Meanwhile, the tax collection of the provinces as a whole exhibited a behavior consistent with what was observed at the national level. According to the partial information available for the main districts, in the first quarter of the year the nominal increase in equity would have accelerated to about 52% YoY after growth of around 35% YoY and 27% YoY in the fourth and third quarters of 2020, respectively. In April, this figure would be around 100% YoY due to the low base of comparison of the same month in 2020.
5.2. The improvement in revenues strengthened the public accounts and, without neglecting the vulnerable sectors, capital spending was prioritized to contribute to the economic recovery
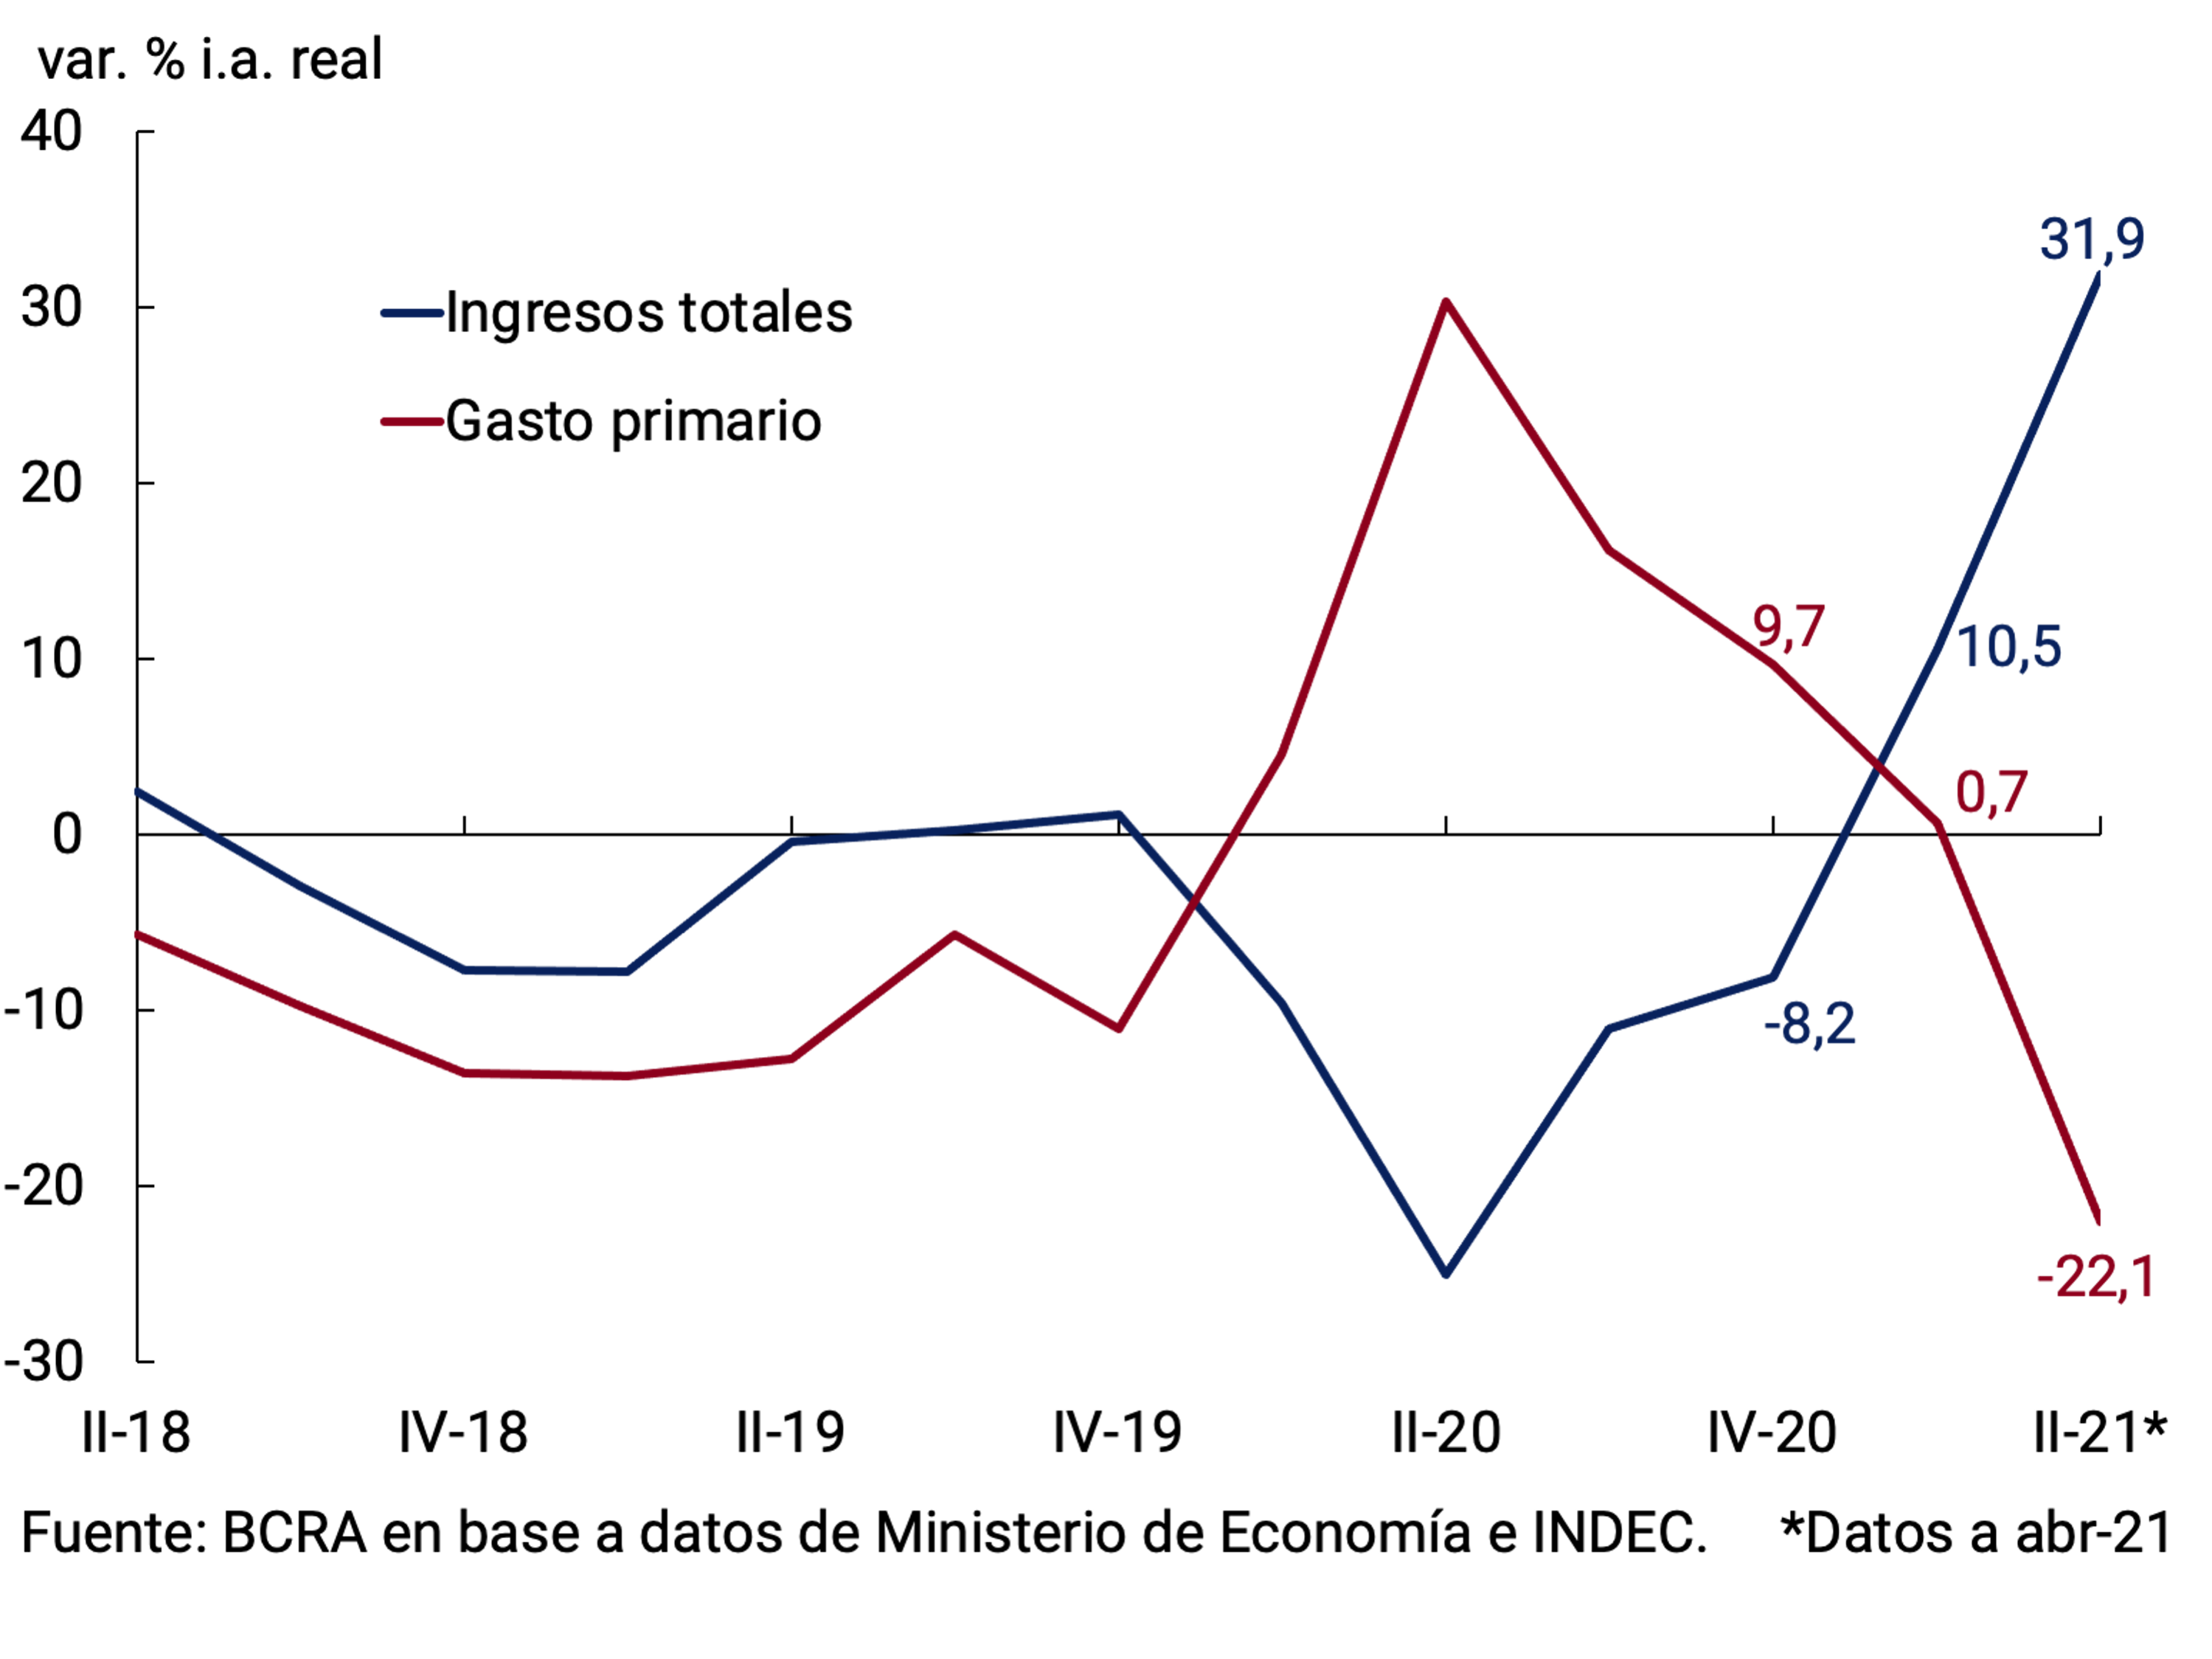
NFPS primary expenditure showed a nominal increase of 41.5% YoY in the first quarter of the year, 13.9 p.p. below the nominal increase in revenues. In real terms, expenditures grew by 0.7% YoY between January and March, while revenues grew by 10.5% YoY in the period (see Figure 5.2). In April, primary expenditure increased by 14% YoY, which implied a real drop of 22.1% YoY, explained by the high base of comparison in April 2020, when massive assistance to families and companies had been made.
Figure 5.2 | NFPS Primary Revenue and Expenditure
During the first four months of 2021, the increase in primary expenditure continued to be allocated mainly to expenditure on pension benefits, within the framework of the provisions of the new Pension Mobility Law. The contribution of pension benefits to the year-on-year increase in primary expenditure was 36%, a figure somewhat higher than that recorded for this item in 2020 (29%; see Figure 5.3). Likewise, the incidence of other social benefits decreased between January and April 2021 compared to 2020 (9% vs. 36% in both cases), given that this item had included during the past year the massive extraordinary disbursements of assistance to families and companies (such as the Emergency Family Income (IFE) and the Emergency Assistance Program for Work and Production (ATP). among other social programs. In the first four months of 2021, the efforts associated with the Empower Work program, the Food Card and the reinforcements of the Universal Child Allowance for social protection in the area of Greater Buenos Aires were highlighted. Extraordinary bonuses to strengthen the income of beneficiaries of the lower brackets of pension benefits were also highlighted.
For the coming months, it should be taken into account that the public accounts will be affected by a basis of comparison that includes the effects of the pandemic. In any case, the need to address the harmful effects of the new wave of COVID-19 will have an impact. Likewise, a large part of the expenditure (pension benefits and family allowances) will have an expected increase of 12.12% as of June, as a result of the application of pension mobility33.
Figure 5.3 | Contributions of the main items to the year-on-year growth of primary expenditure
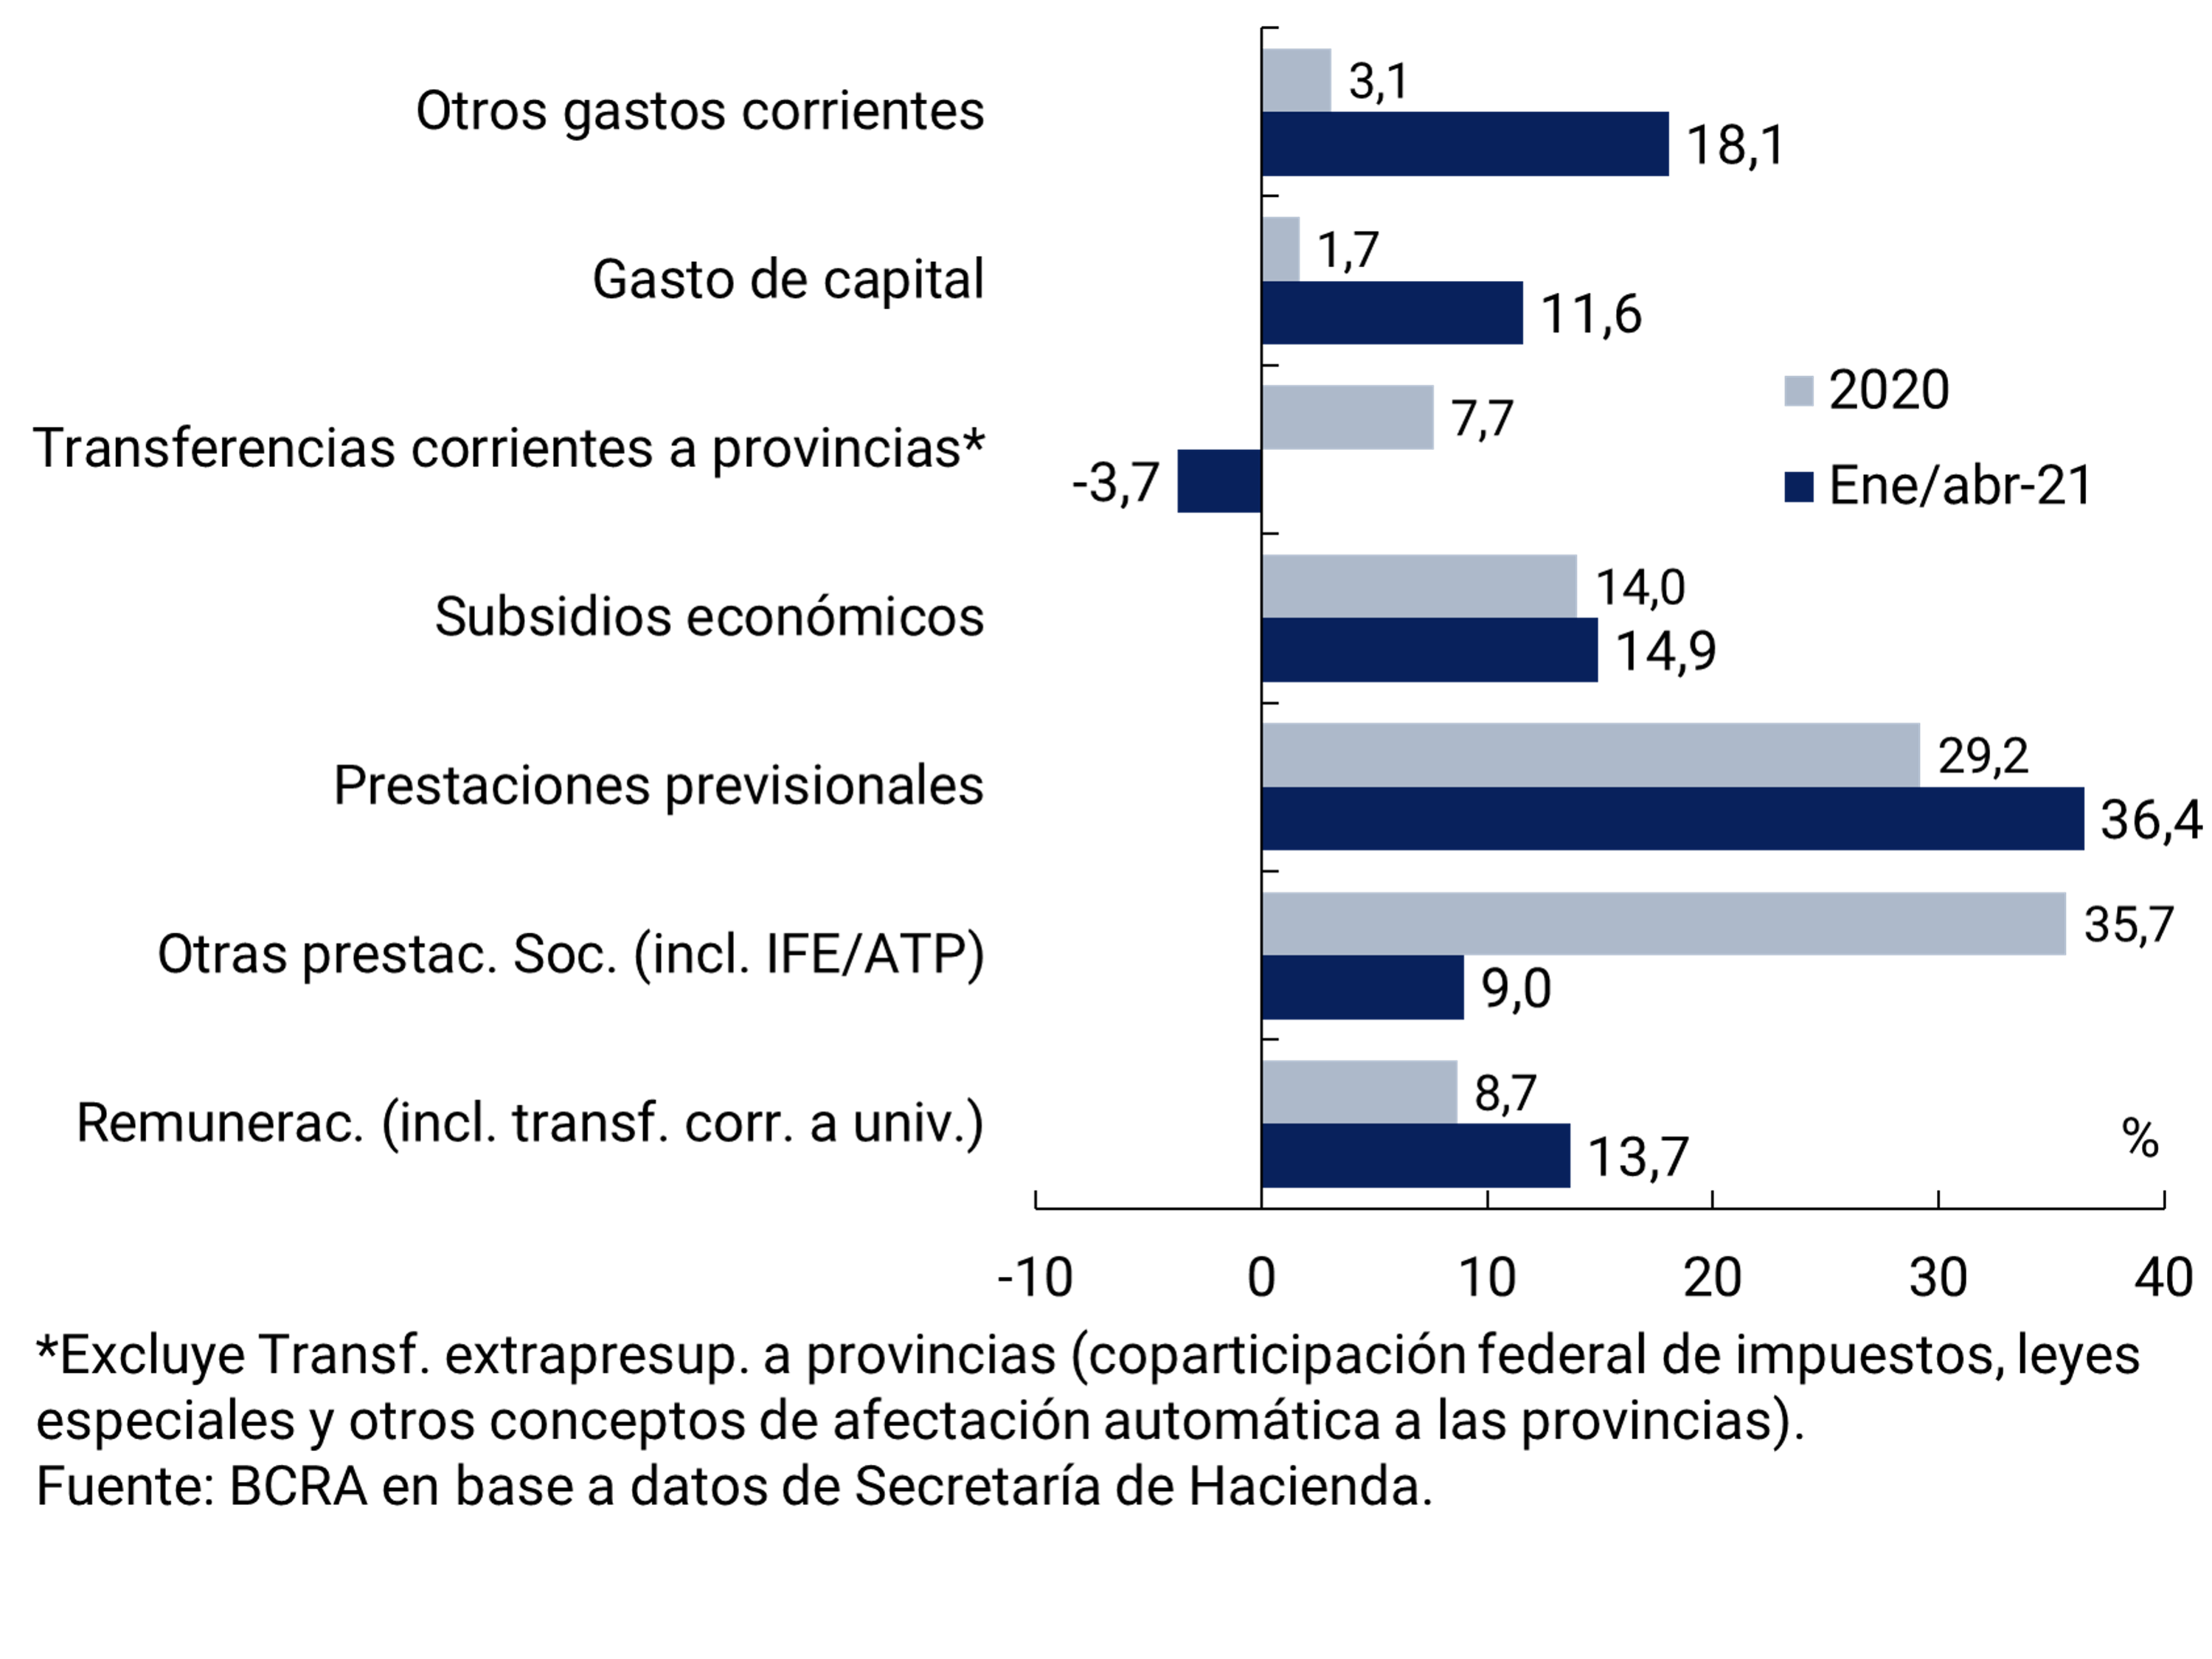
Economic subsidies also accounted for a significant portion of the year-on-year increase in spending (14.9%): they grew 54% YoY in the first four months of the year. The increase was disseminated among the main destinations associated with energy and public passenger transport.
Likewise, capital expenditure gained relevance (+138% YoY between January and April, contributing 11.6% to the advance of primary expenditure), due in part to a low base of comparison and in line with the guidelines stipulated in the 2021 National Budget. Items associated with salaries (including transfers to universities) and other current expenses increased their participation in the increase in primary spending, going from 8.7% and 3.1% in 2020 to 13.7% and 18.1% respectively. It should be noted that in this last item, purchases of goods and services (including expenditures associated with the purchase of vaccines) and the deficit of public companies, among others, are recorded. For their part, current transfers to the provinces moderated significantly compared to the same period in 2020, when the National Government had extraordinarily assisted the districts in the face of the significant decrease in subnational tax collection.
The primary deficit of the NFPS accumulated in the last 12 months to April 2021 represented approximately 4.5% of GDP, 1.9 p.p. less than in December 2020 (see Figure 5.4). This evolution is in line with the 2021 National Budget, which forecasts that the primary deficit result will be reduced to 4.2% of GDP for the accumulated to December.
Figure 5.4 | NFPS primary and financial results (cumulative 12 months)
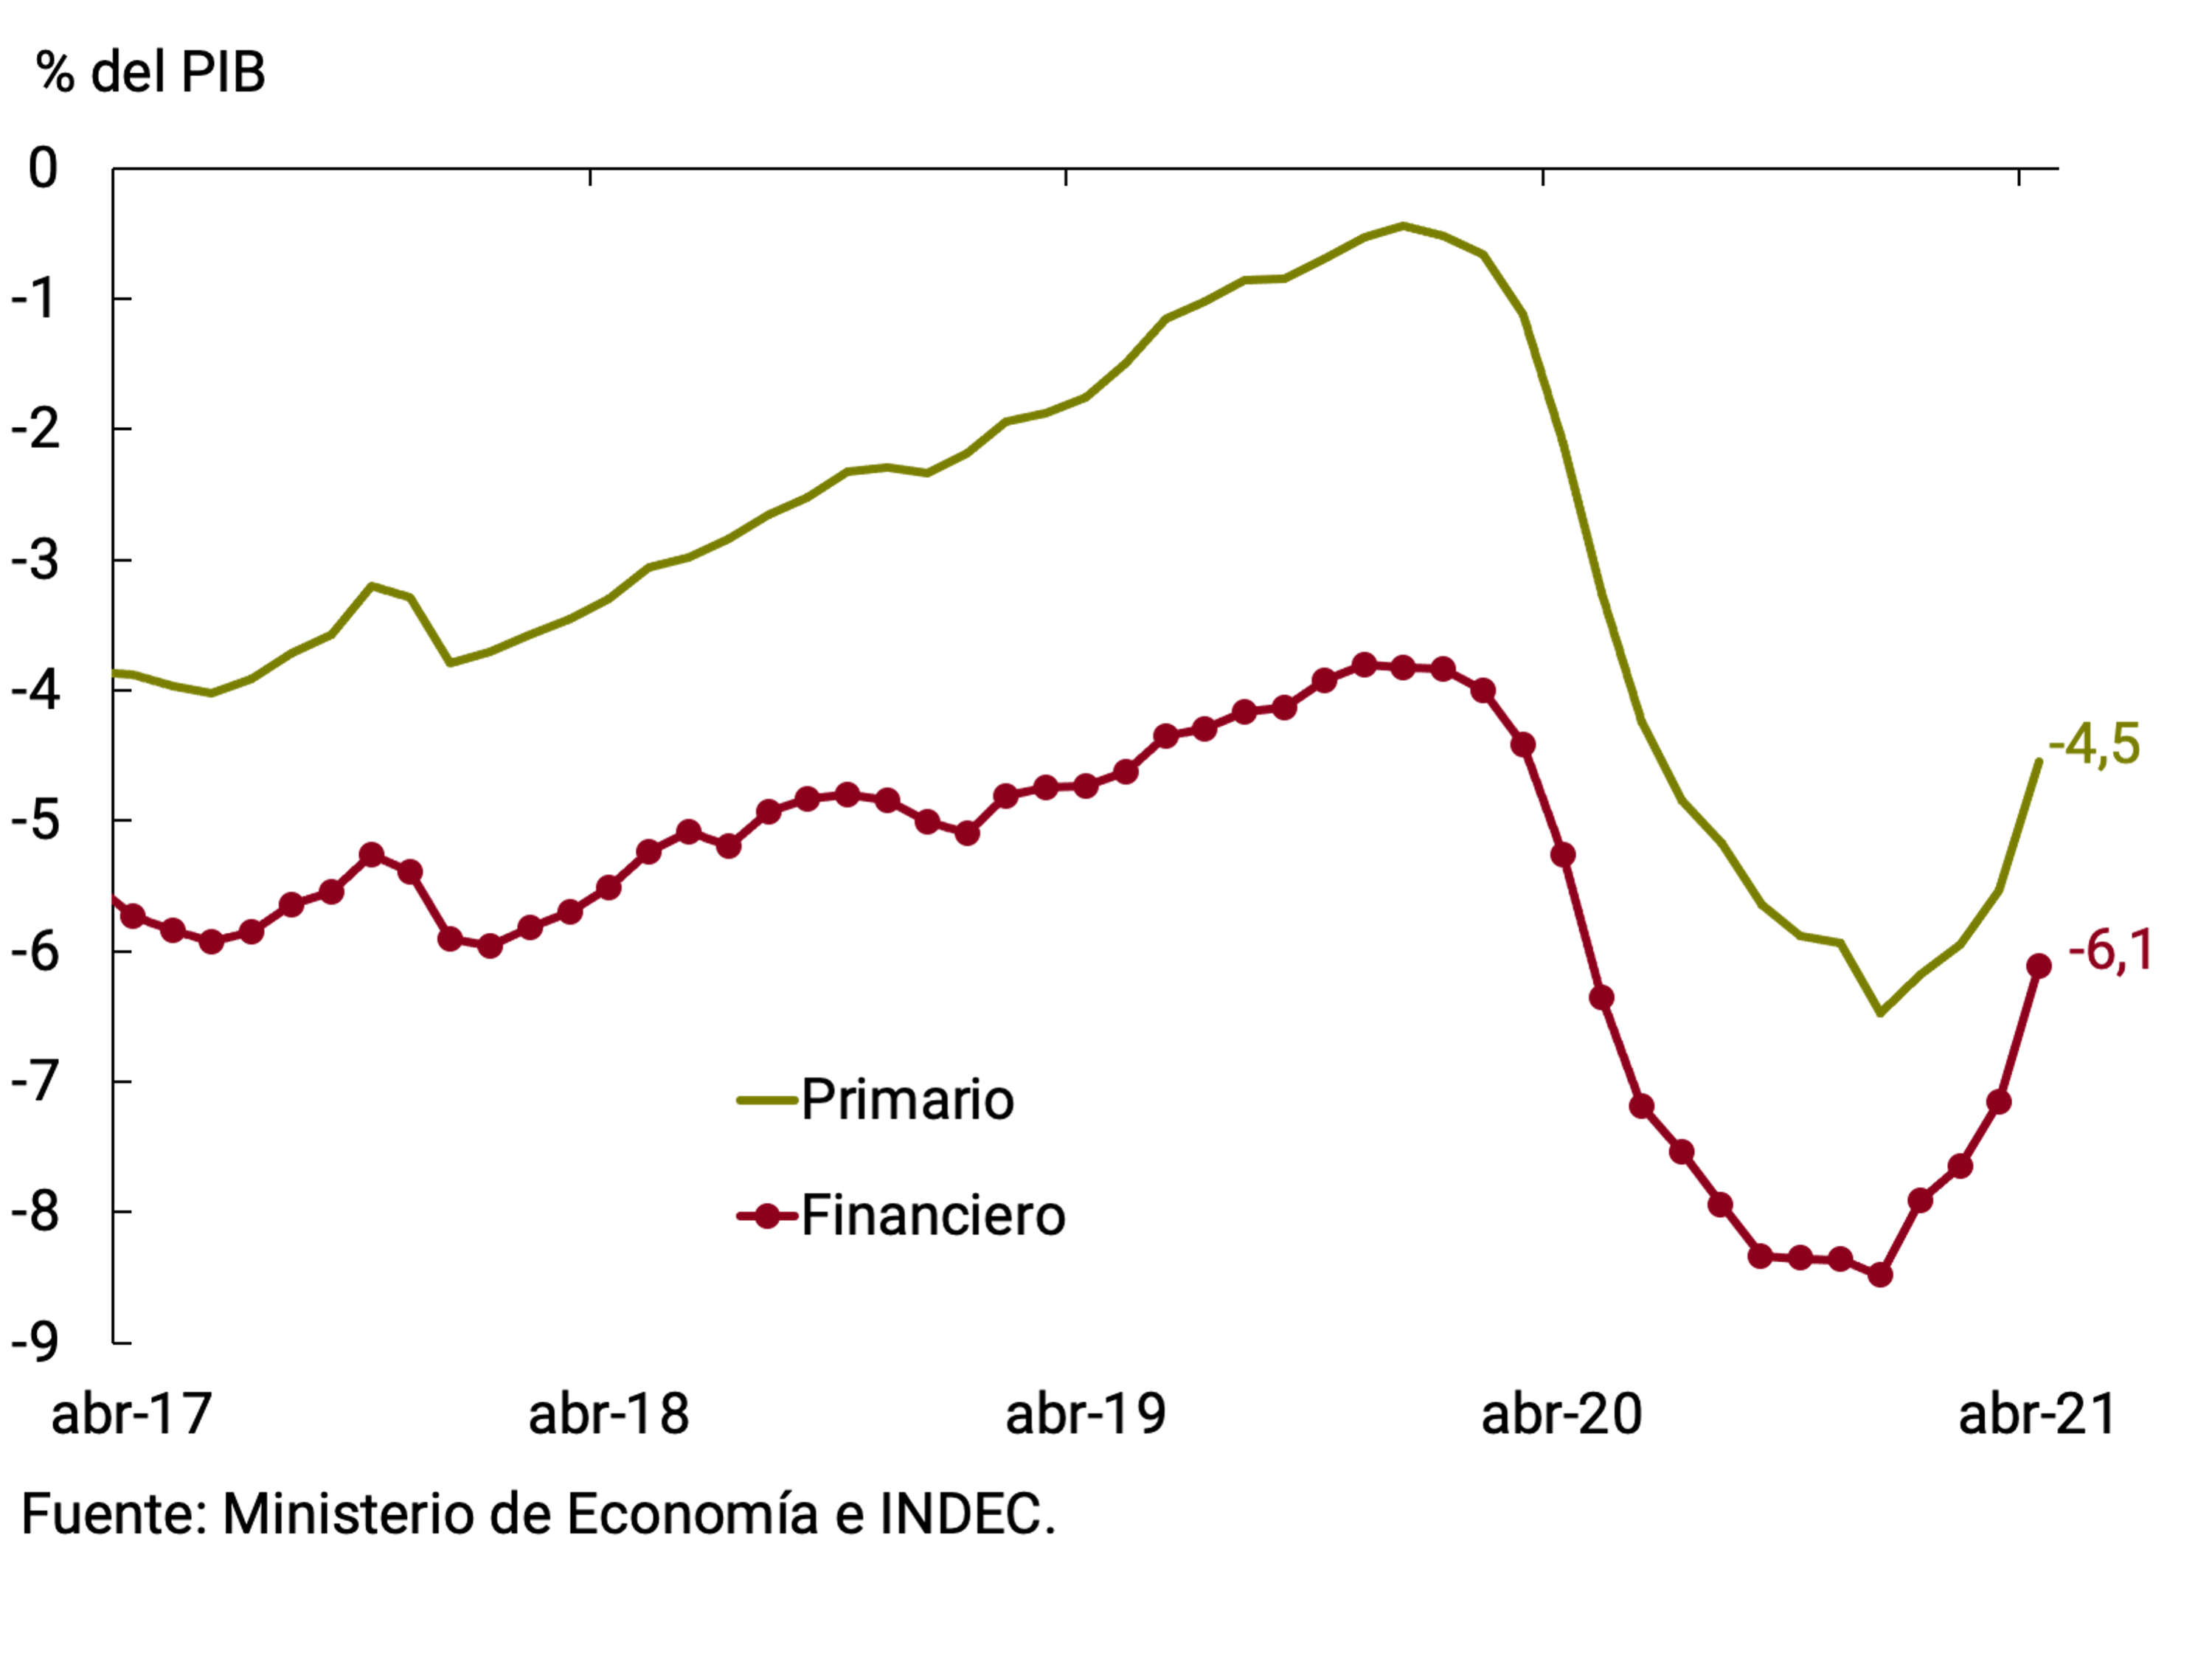
After the restructuring of the National Public Debt carried out in 2020 and the reconstruction of the local debt market, it was possible to reduce the interest burden faced by the National Government. Services with private, multilateral, bilateral creditors and with the public financial sector went from representing 3.4% of GDP in 2019 to around 2% of GDP in 2020 (see Figure 5.5) and around 1.6% of GDP in the accumulated of the last 12 months to April 2021. Thus, the financial deficit of the NFPS accumulated in the same period stood at 6.1% of GDP, 2.4 p.p. below the total deficit of 2020.
Figure 5.5 | NFPS Interest (Cumulative 12 Months)
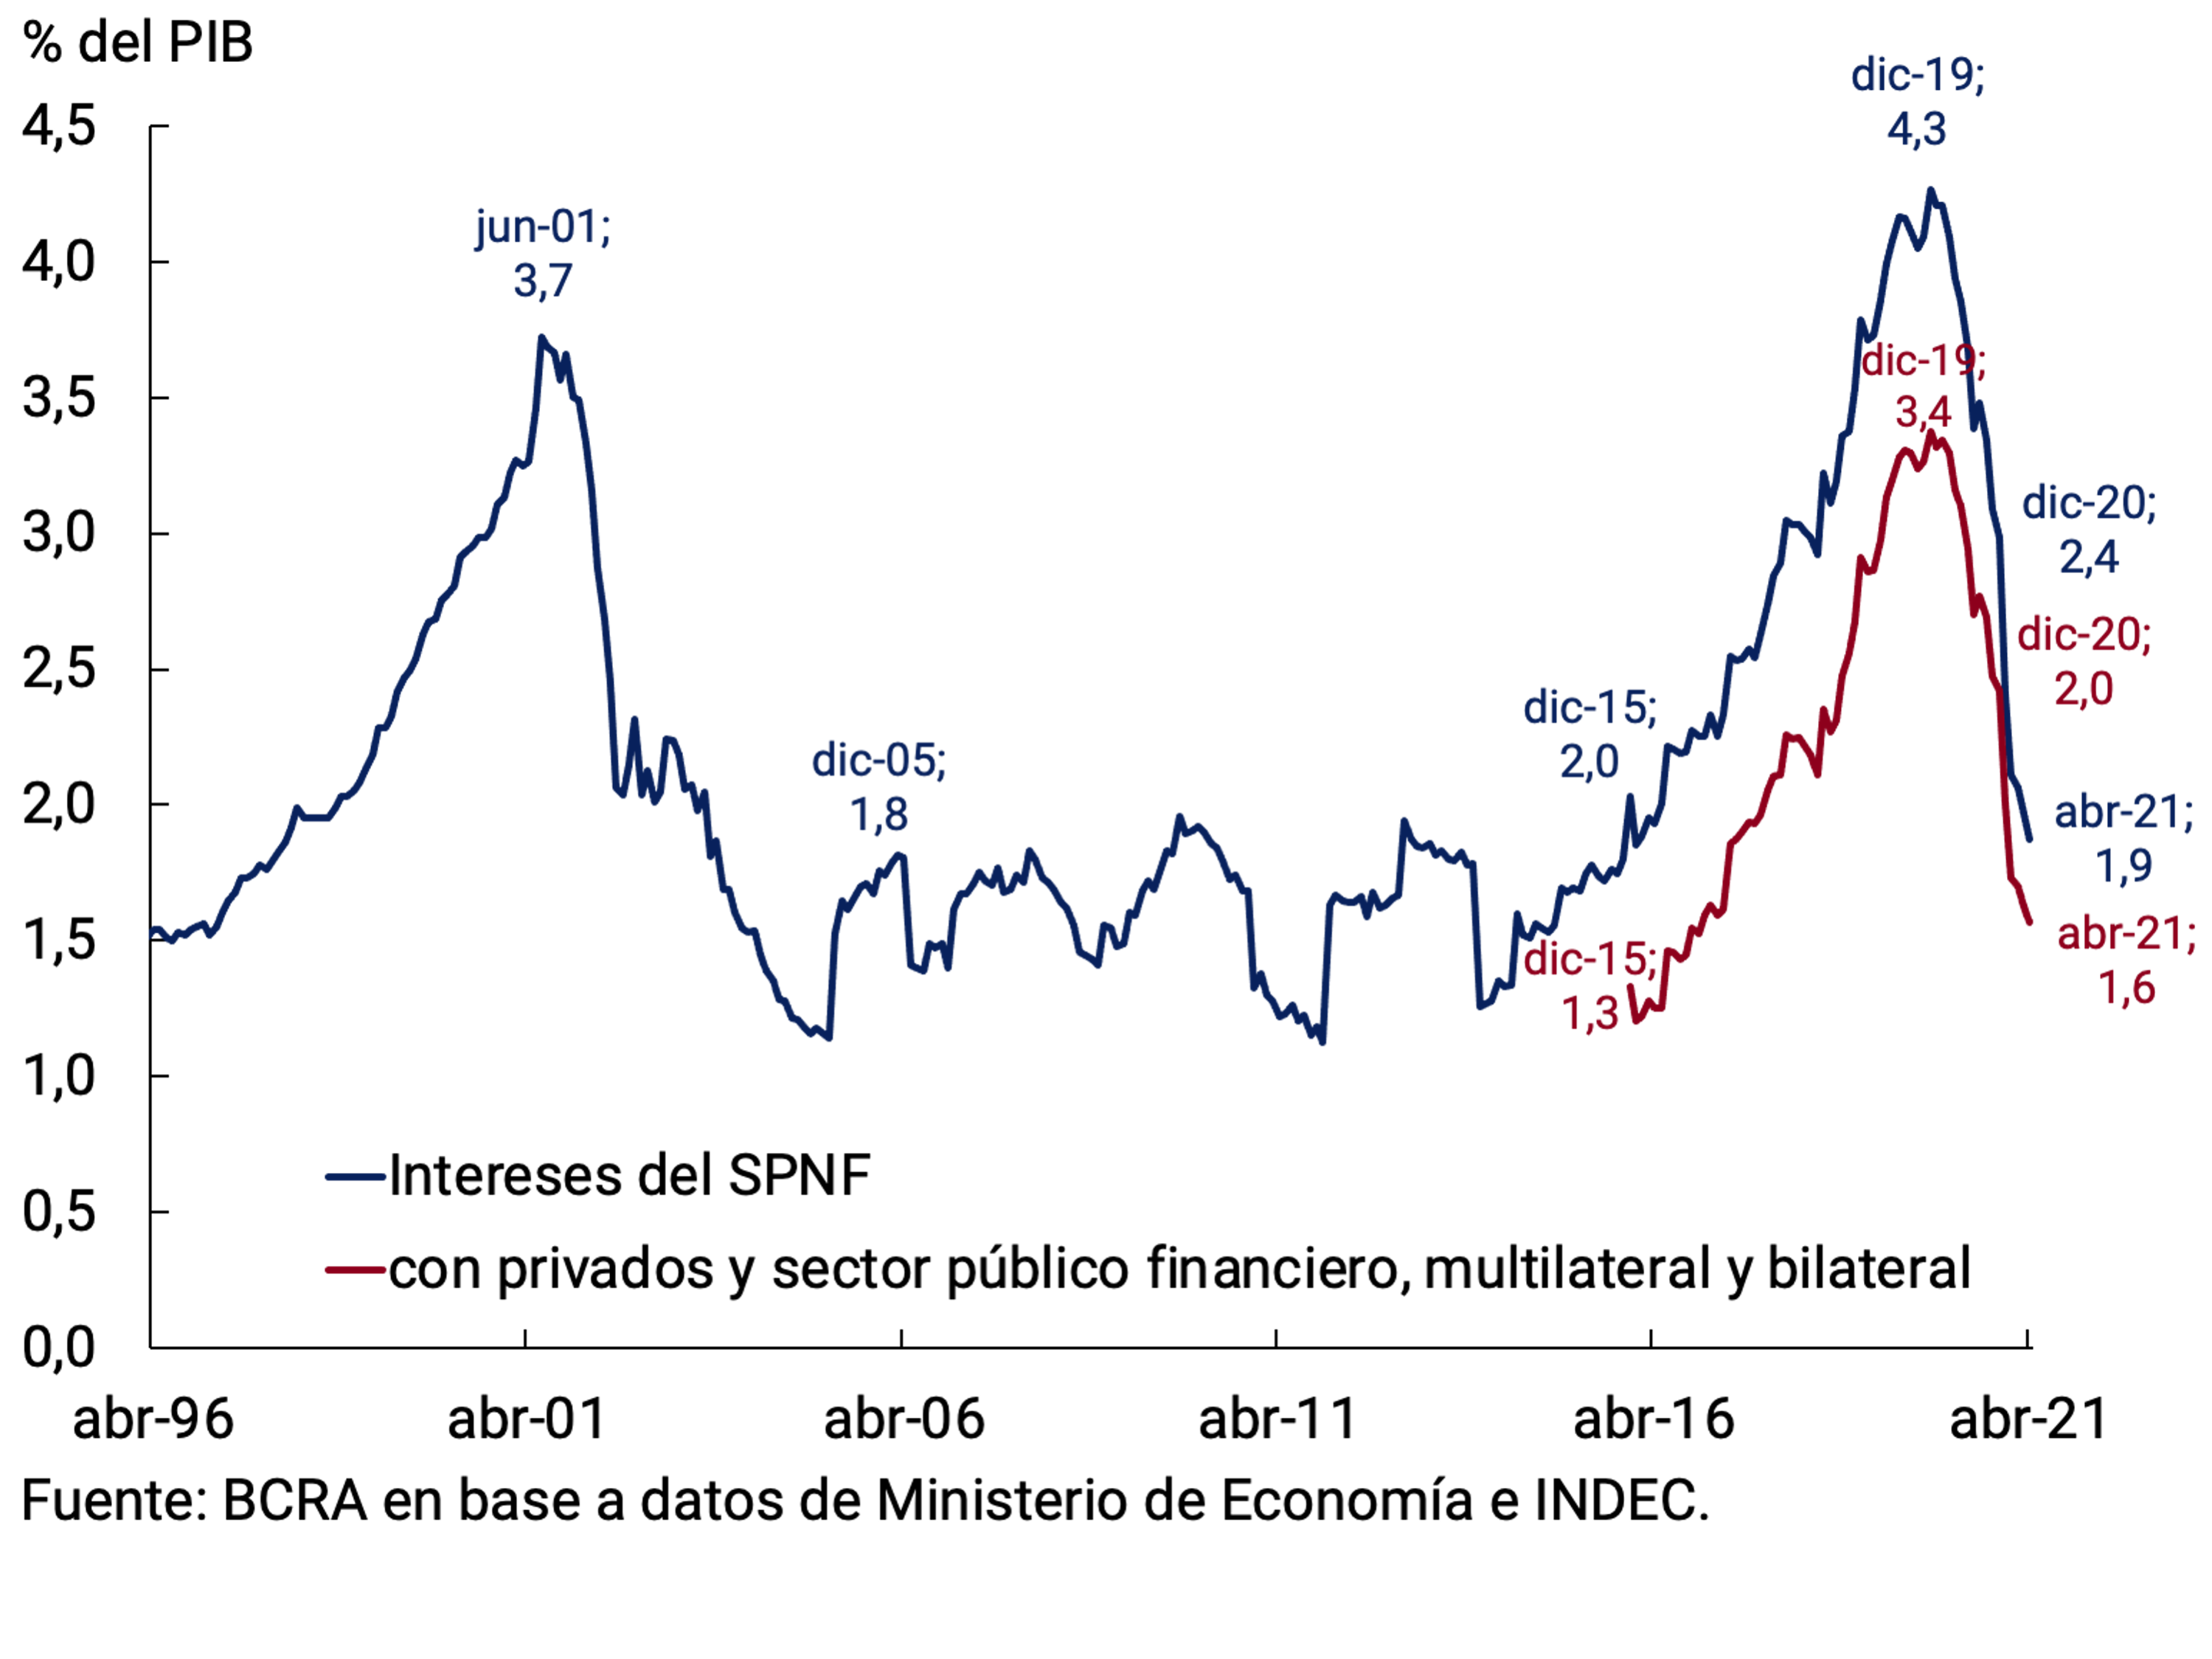
5.3. The National Government met its needs basically by placing debt instruments in the local market
During the first four months of 2021, the National Treasury (TN) achieved a refinancing of 117% of principal and interest services, which implied a net financing of approximately $149,000 million. The issuances of public debt instruments during the first four months of 2021 were mostly at a variable rate, followed by instruments adjustable by CER and finally by fixed-rate public securities. Since the beginning of the National Government’s administration at the end of December 2019, a process of extending the terms of the instruments issued was consolidated, while the cost of financing in pesos remained relatively stable. On the other hand, voluntary debt conversion operations were carried out within the framework of Article 8 of Law 27561, which made it possible to significantly decompress the maturity profile in the short term. Going forward, a continuity of the TN financing strategy is expected with the aim of developing the local peso debt market.
So far in 2021, and in contrast to the same period last year, the greater role of the market in financing the needs of the NT stands out, which led to a reduction in the BCRA’s financial assistance, which was only restarted towards the end of the first quarter34.
The National Government is negotiating with the creditor countries grouped in the Paris Club the maturity of around US$2,500 million that operates at the end of May, and with the IMF, for the capital maturities scheduled for September and December. In this context, the expectation that an extraordinary allocation of SDRs by the IMF will be made by the end of the third quarter was consolidated, which would represent around US$4,355 million for Argentina (see Section 1 / The new allocation of special drawing rights (SDRs): what it is and what it implies for developing countries).
6. Pricing
Year-on-year inflation increased during the beginning of 2021 after the significant drop reached during 2020. The acceleration of prices was explained by both their core and regulated components, while seasonal prices maintained high variations.
The behavior of core inflation was influenced by both the higher increases in the prices of goods and private services in the context of a recovery in economic activity. In goods, the increases in the prices of packaged foods and meats stood out – in a context of a sharp rise in international prices of agricultural raw materials – as well as the increases in the prices of cars, medicines, household items, clothing and footwear. The prices of private services reflected both the increases in those activities that began to operate from the relaxation of sanitary measures and the impact of salary updates.
In regulated areas, the dynamics were explained by the increase in the prices of educational services, prepaid medicine fees, fuel, telecommunications, electricity – in different provinces of the interior of the country – and public transport, mainly in the area of Greater Buenos Aires (GBA). With respect to fuels, the National Government allowed the update of the price of gasoline in a context of recovery of international oil prices and with regard to telecommunications, it authorized increases in telephony, internet and cable TV. In public transport, increases were recorded in different jurisdictions of the country, highlighting the authorized increases in subways and taxis in GBA. All in all, in the last twelve months to April, the regulated segment registered inflation of 27.6%, significantly below the other grouped segments.
In the coming months, as those factors that temporarily exerted pressure on the price formation process dissipate, inflation is expected to begin a process of gradual and sustained decline. Also in this regard, the BCRA will continue to guide its monetary and exchange rate policy to help consolidate the sustained decline in inflation.
6.1. Monthly inflation rose during the first months of 2021
In the first quarter of 2021, retail prices registered an average monthly increase of 4.1%, accelerating by 0.5 p.p. compared to the previous quarter (see Figure 6.1). In April, the CPI General Level registered a rise of the same magnitude.
The largest increase during the first quarter was mainly due to the dynamics of the Regulated price segment, which from updates in the rates of some public goods and services accelerated to 3.9% monthly average (+2.1 p.p. above the record of the fourth quarter of 2020), registering an increase of 3.5% in April. The goods and services of the Core component maintained a high dynamism by verifying a monthly average increase of 4.2% in the first three months of 2021, similar to the 4.1% monthly average of the fourth quarter of the previous year, and showed an acceleration in March, which stabilized in April (4.6%). On the other hand, Seasonal Bonds also maintained the pace of expansion of the fourth quarter of 2020 by growing 4.4% monthly average during the first quarter of 2021 (+0.2 p.p.), but registered a significant slowdown in April, to 2.2% monthly.
Figure 6.1 | CPI. Contributions of Seasonal, Regulated and Core Goods and Services in the Quarter
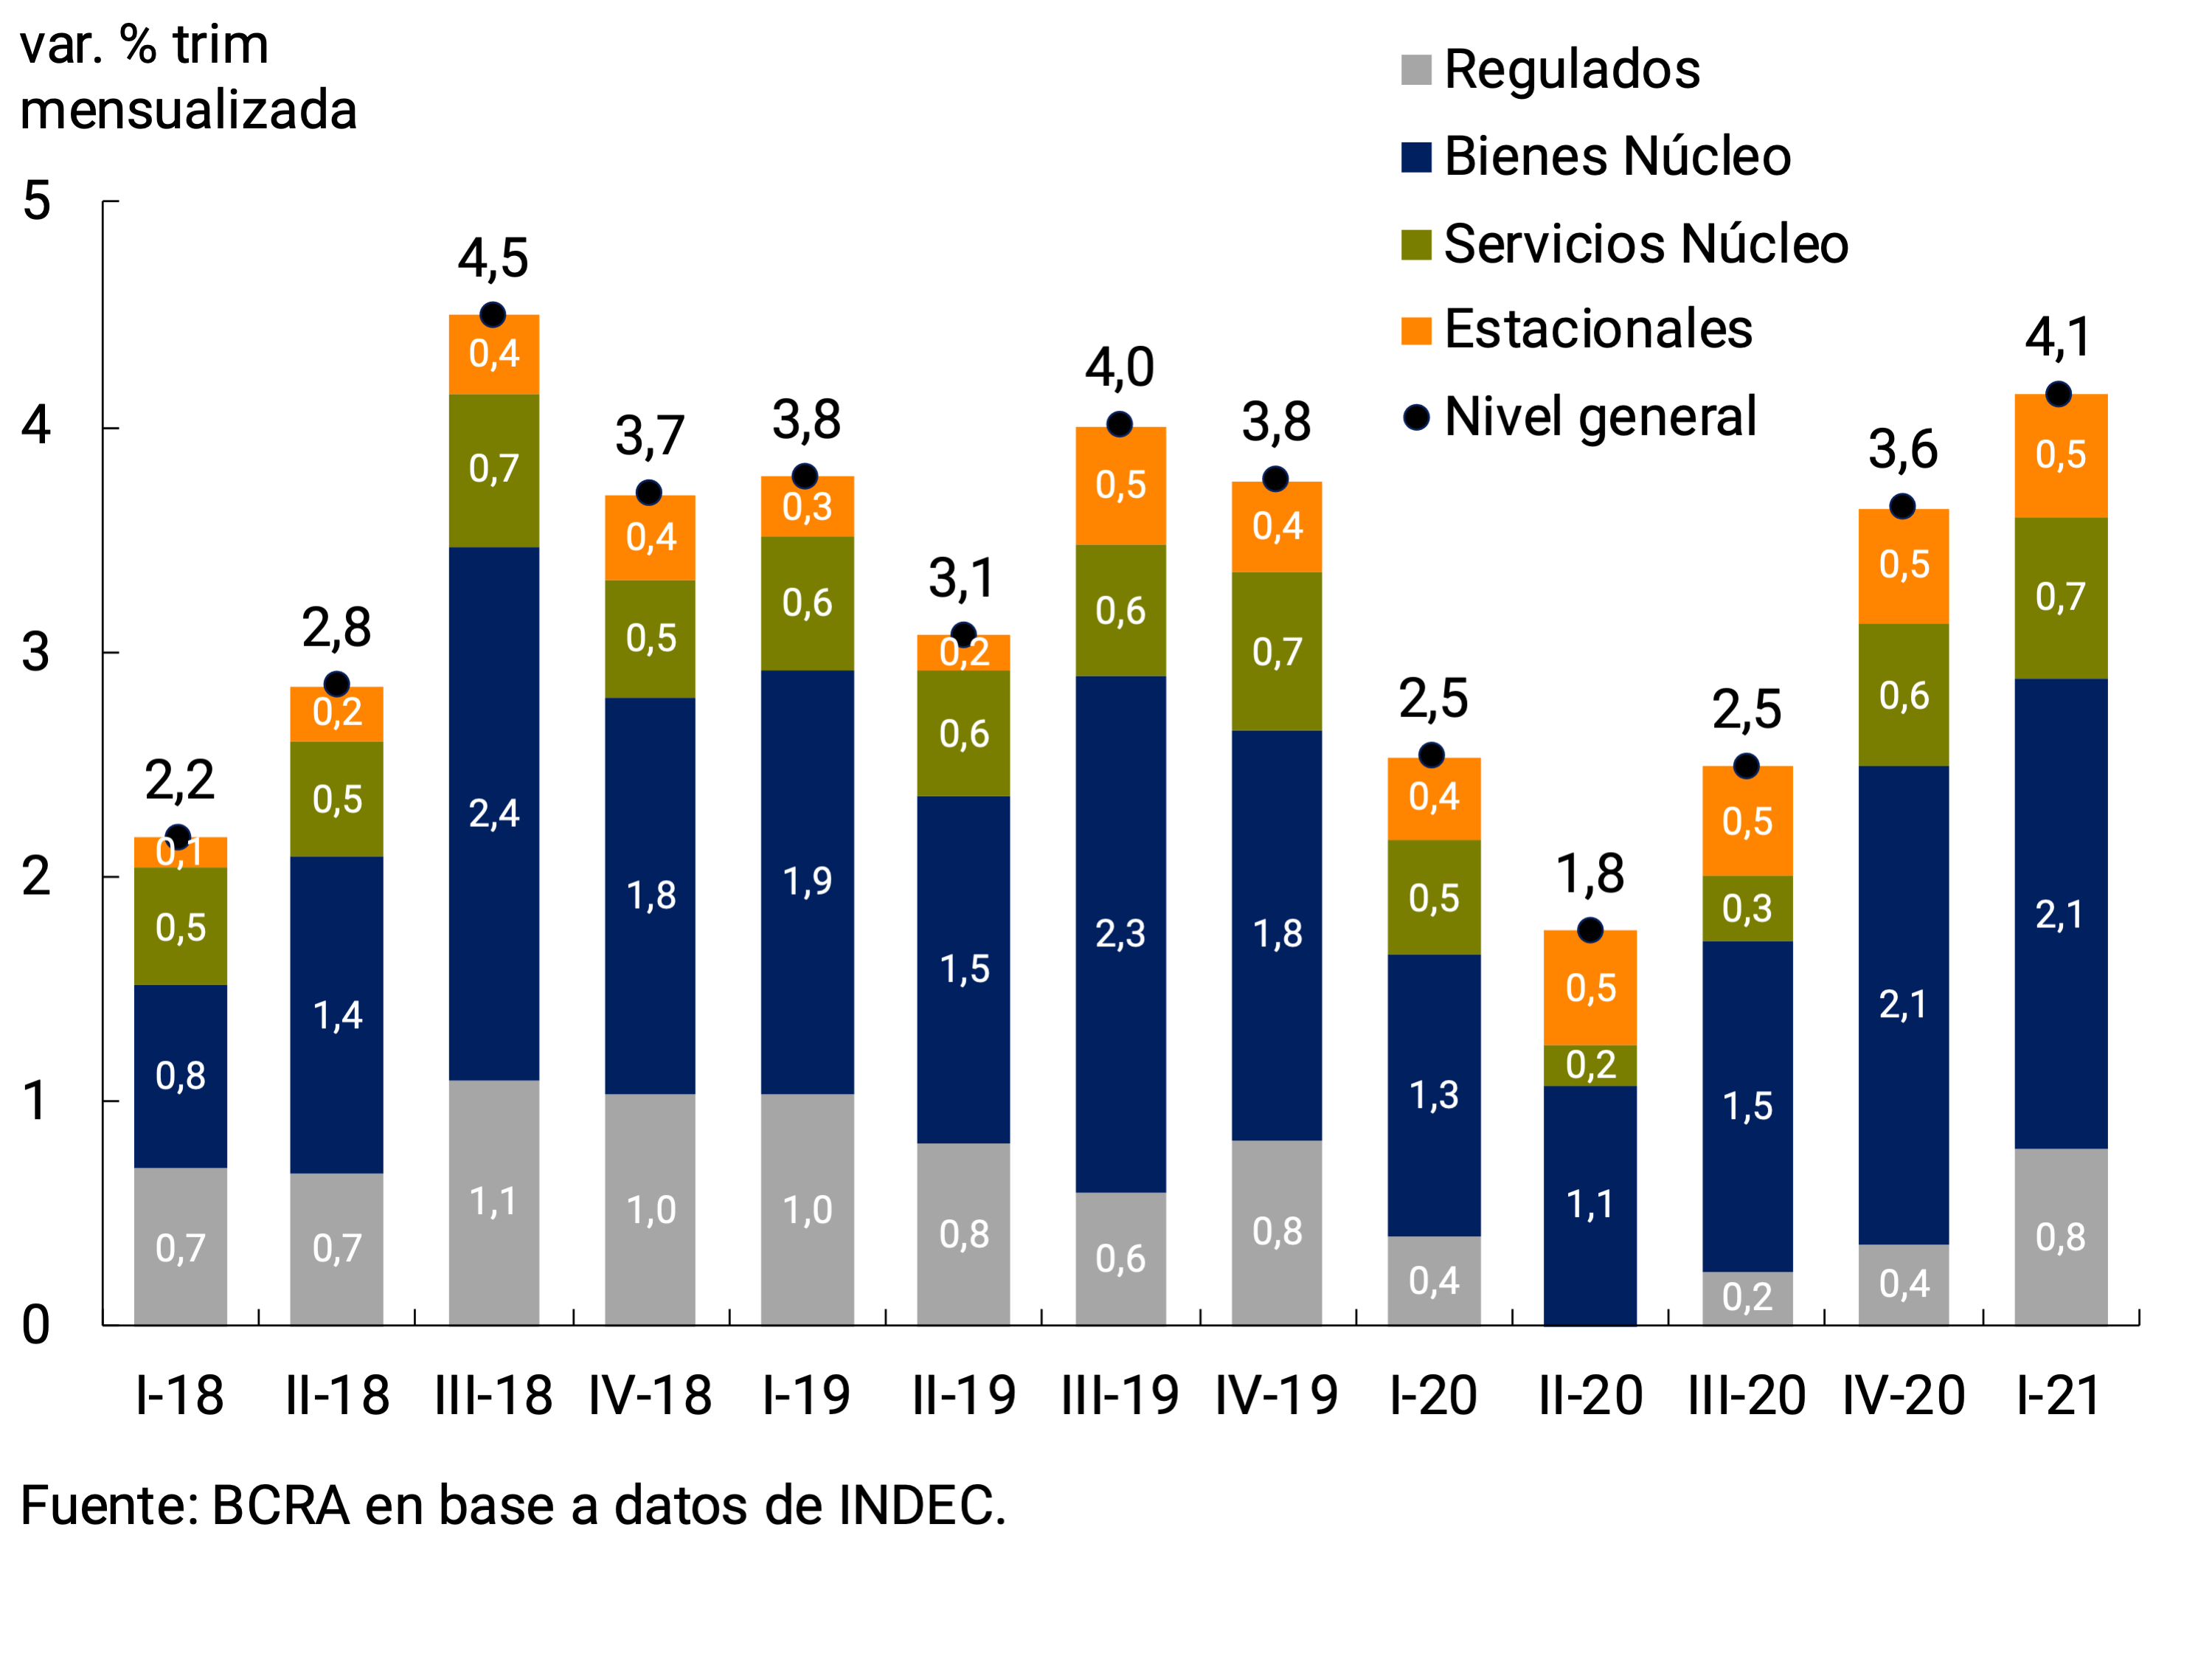
In the first quarter of the year, goods grew above services, accentuating the pattern observed since the beginning of the pandemic, a trend that continued during April. Both the prices of goods and services accelerated their rate of increase, averaging increases of 4.4% and 3.6%; 0.5 p.p. and 0.7 p.p. higher than those of the previous quarter, respectively. Excluding seasonal and regulated prices, private services rose at an average monthly rate of 4.0% (0.7 p.p. above the previous quarter) and core goods expanded at 4.2% (+0.1 p.p. compared to the previous quarter; see Figure 6.2).
Figure 6.2 | CPI. Goods and Services
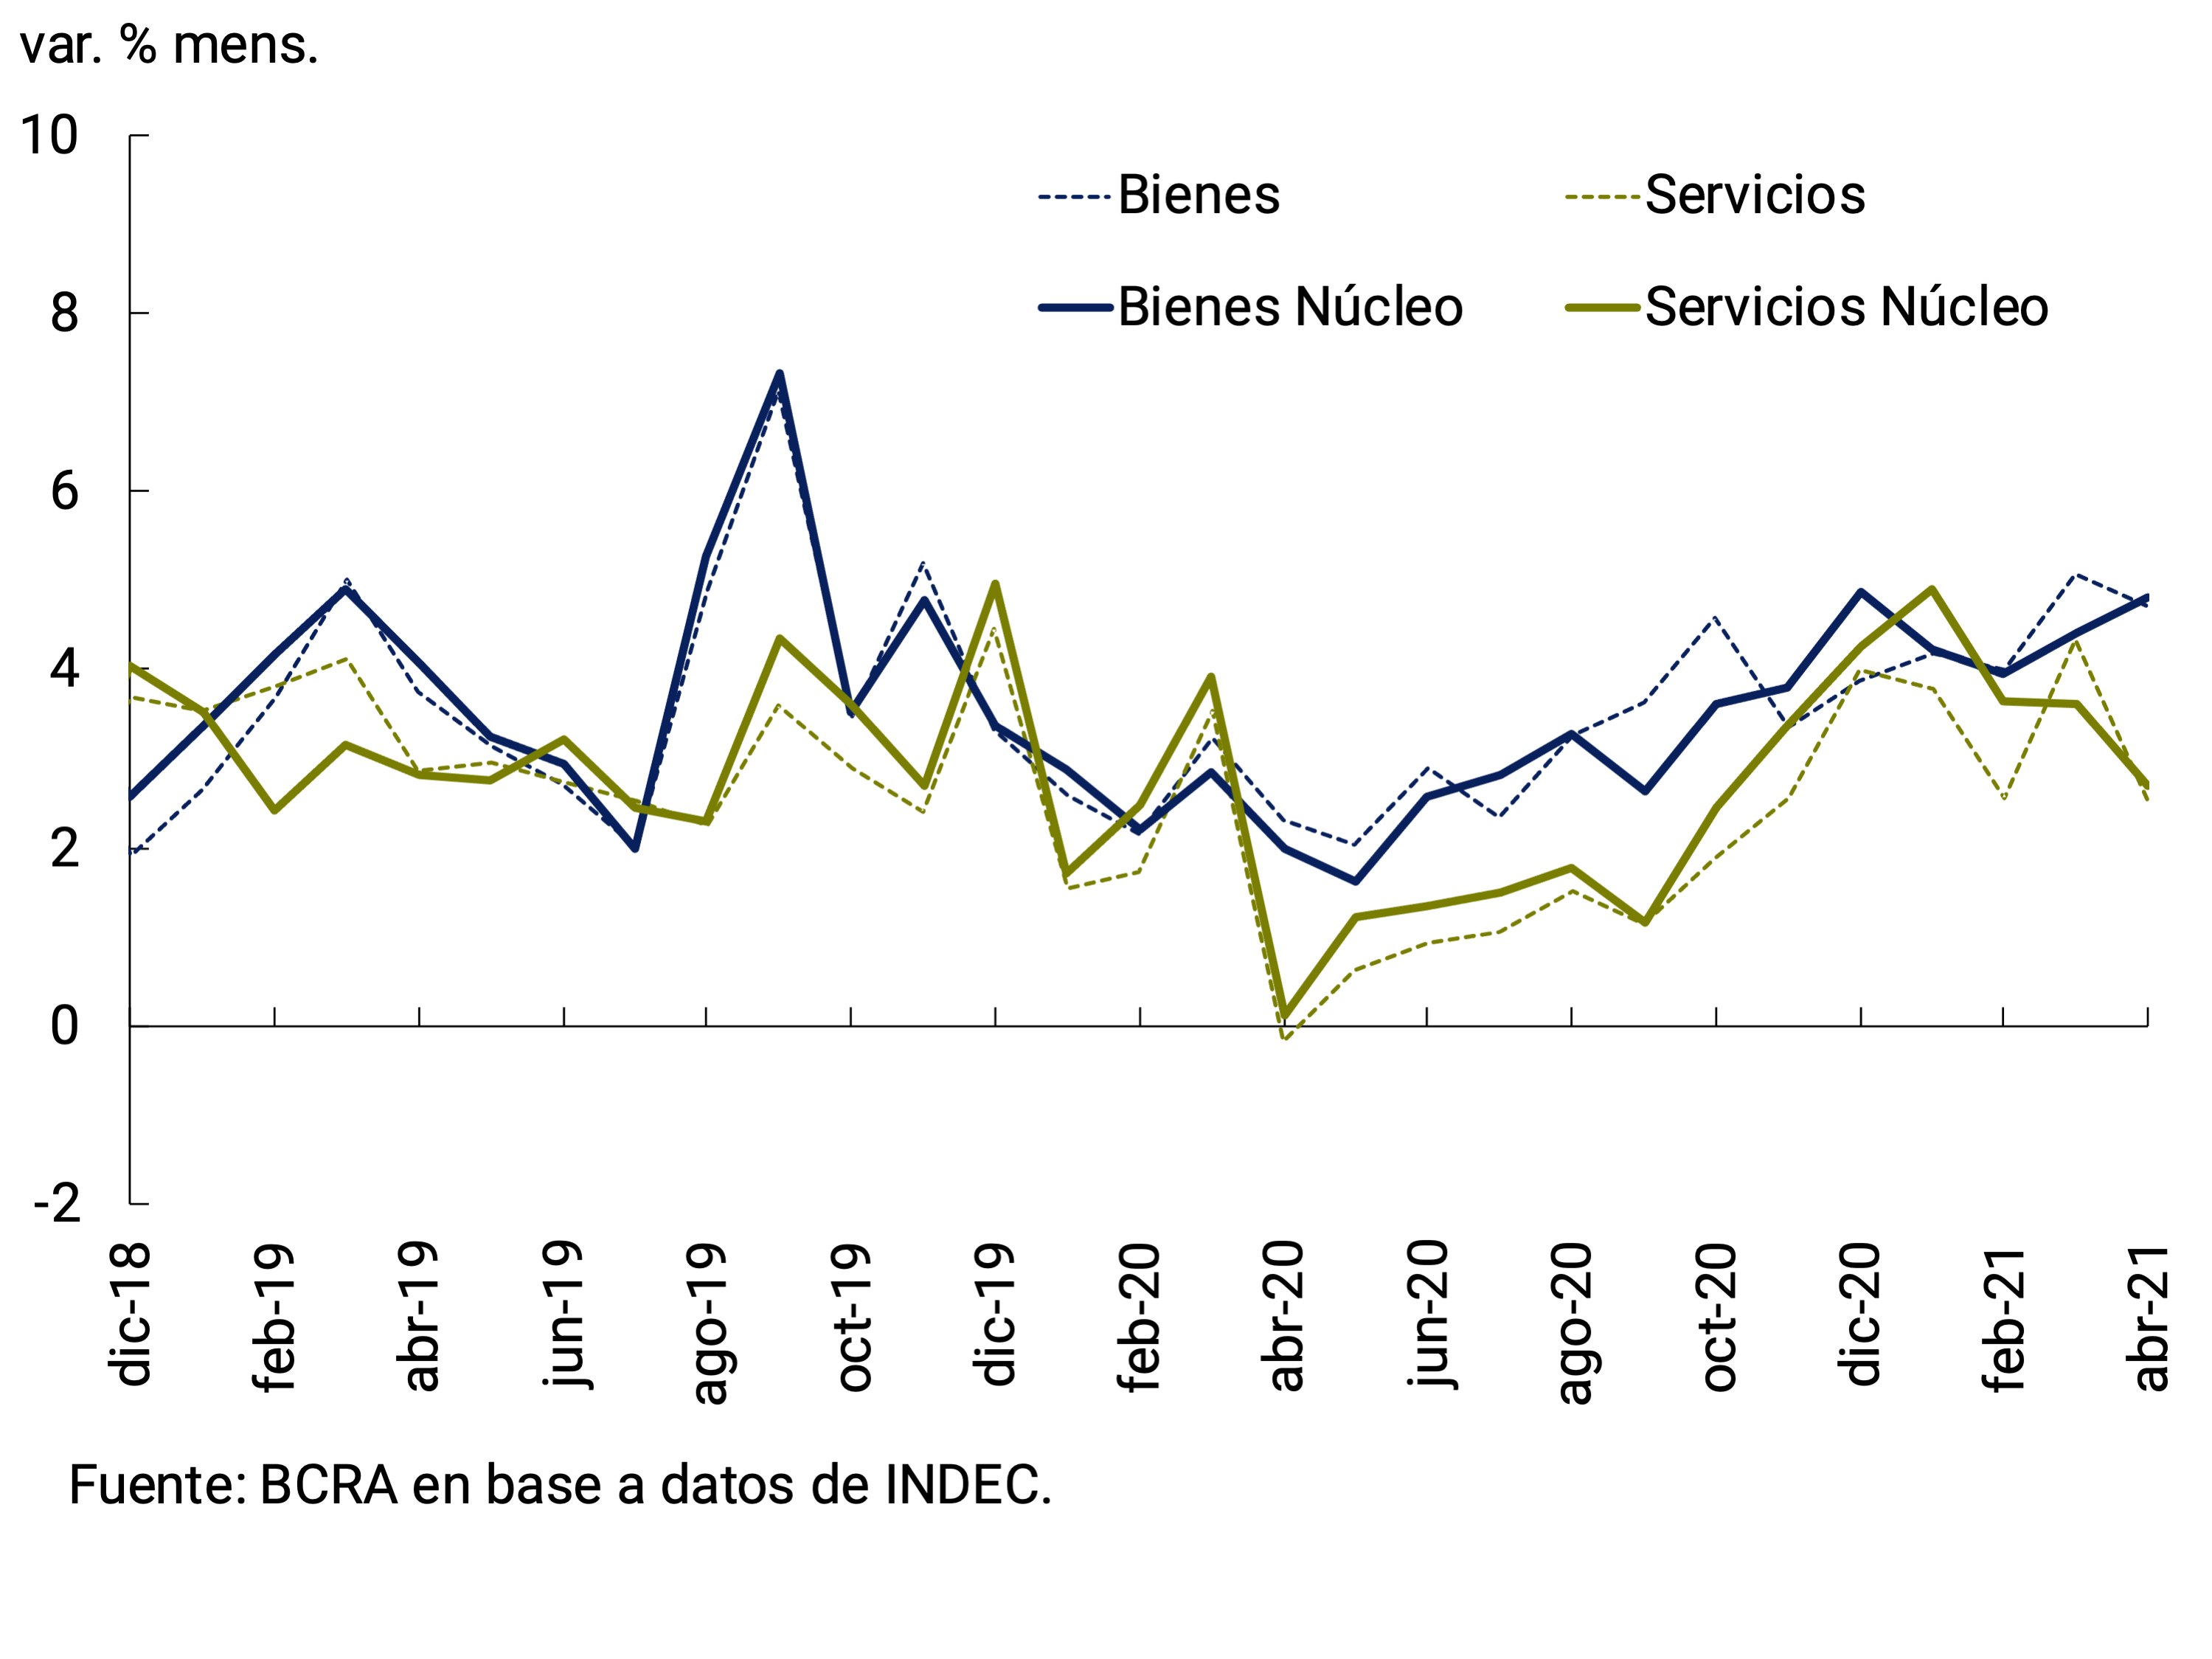
The greater dynamism of services responded, on the one hand, to the behavior of regulated services, mainly highlighting the increases in telephone and internet in January, the increases in educational services at all levels linked to the start of the new school year in March and the update of prepaid medicine fees in March and April. Specifically in the GBA region, the recomposition of toll rates in January and April, the update of the tariff tables of the electricity distributors for large users in April35, and public transport fares, with increases in taxis at the end of February and April and increases in subways and premetro in March and April, were verified. respectively. The acceleration of the prices of the Nucleus’ services was associated with the prices of food prepared in restaurants, bars and food houses and the recent dynamics of recreational and cultural services, among which the reopening of cinemas in March36 stood out. Seasonal tourist services such as accommodation and packages and excursions also showed great dynamism linked to the development of the high season.
On the other hand, the salary update in several unions would also have had an impact on the dynamics of the most labor-intensive private services (see Figure 6.3). The parity agreements arising from the wage negotiations for 2021 were aligned around the inflationary guideline of 29% y.o.y. as of Dec-21 set in the 2021 National Budget, and included adjustments by tranches and, in some cases, the granting of additional ones to make up for the loss of real wages, with review clauses generally foreseen for the last quarter of the year. Some of the increases in private services verified in the quarter were directly linked to the sectoral parity agreements, such as the case of expenses, which rose due to the new tranches of increases in the salaries of building managers that particularly impacted GBA and the increase in remuneration for the staff of private homes. in both cases during the month of February and again in April.
Figure 6.3 | Price of services and wages
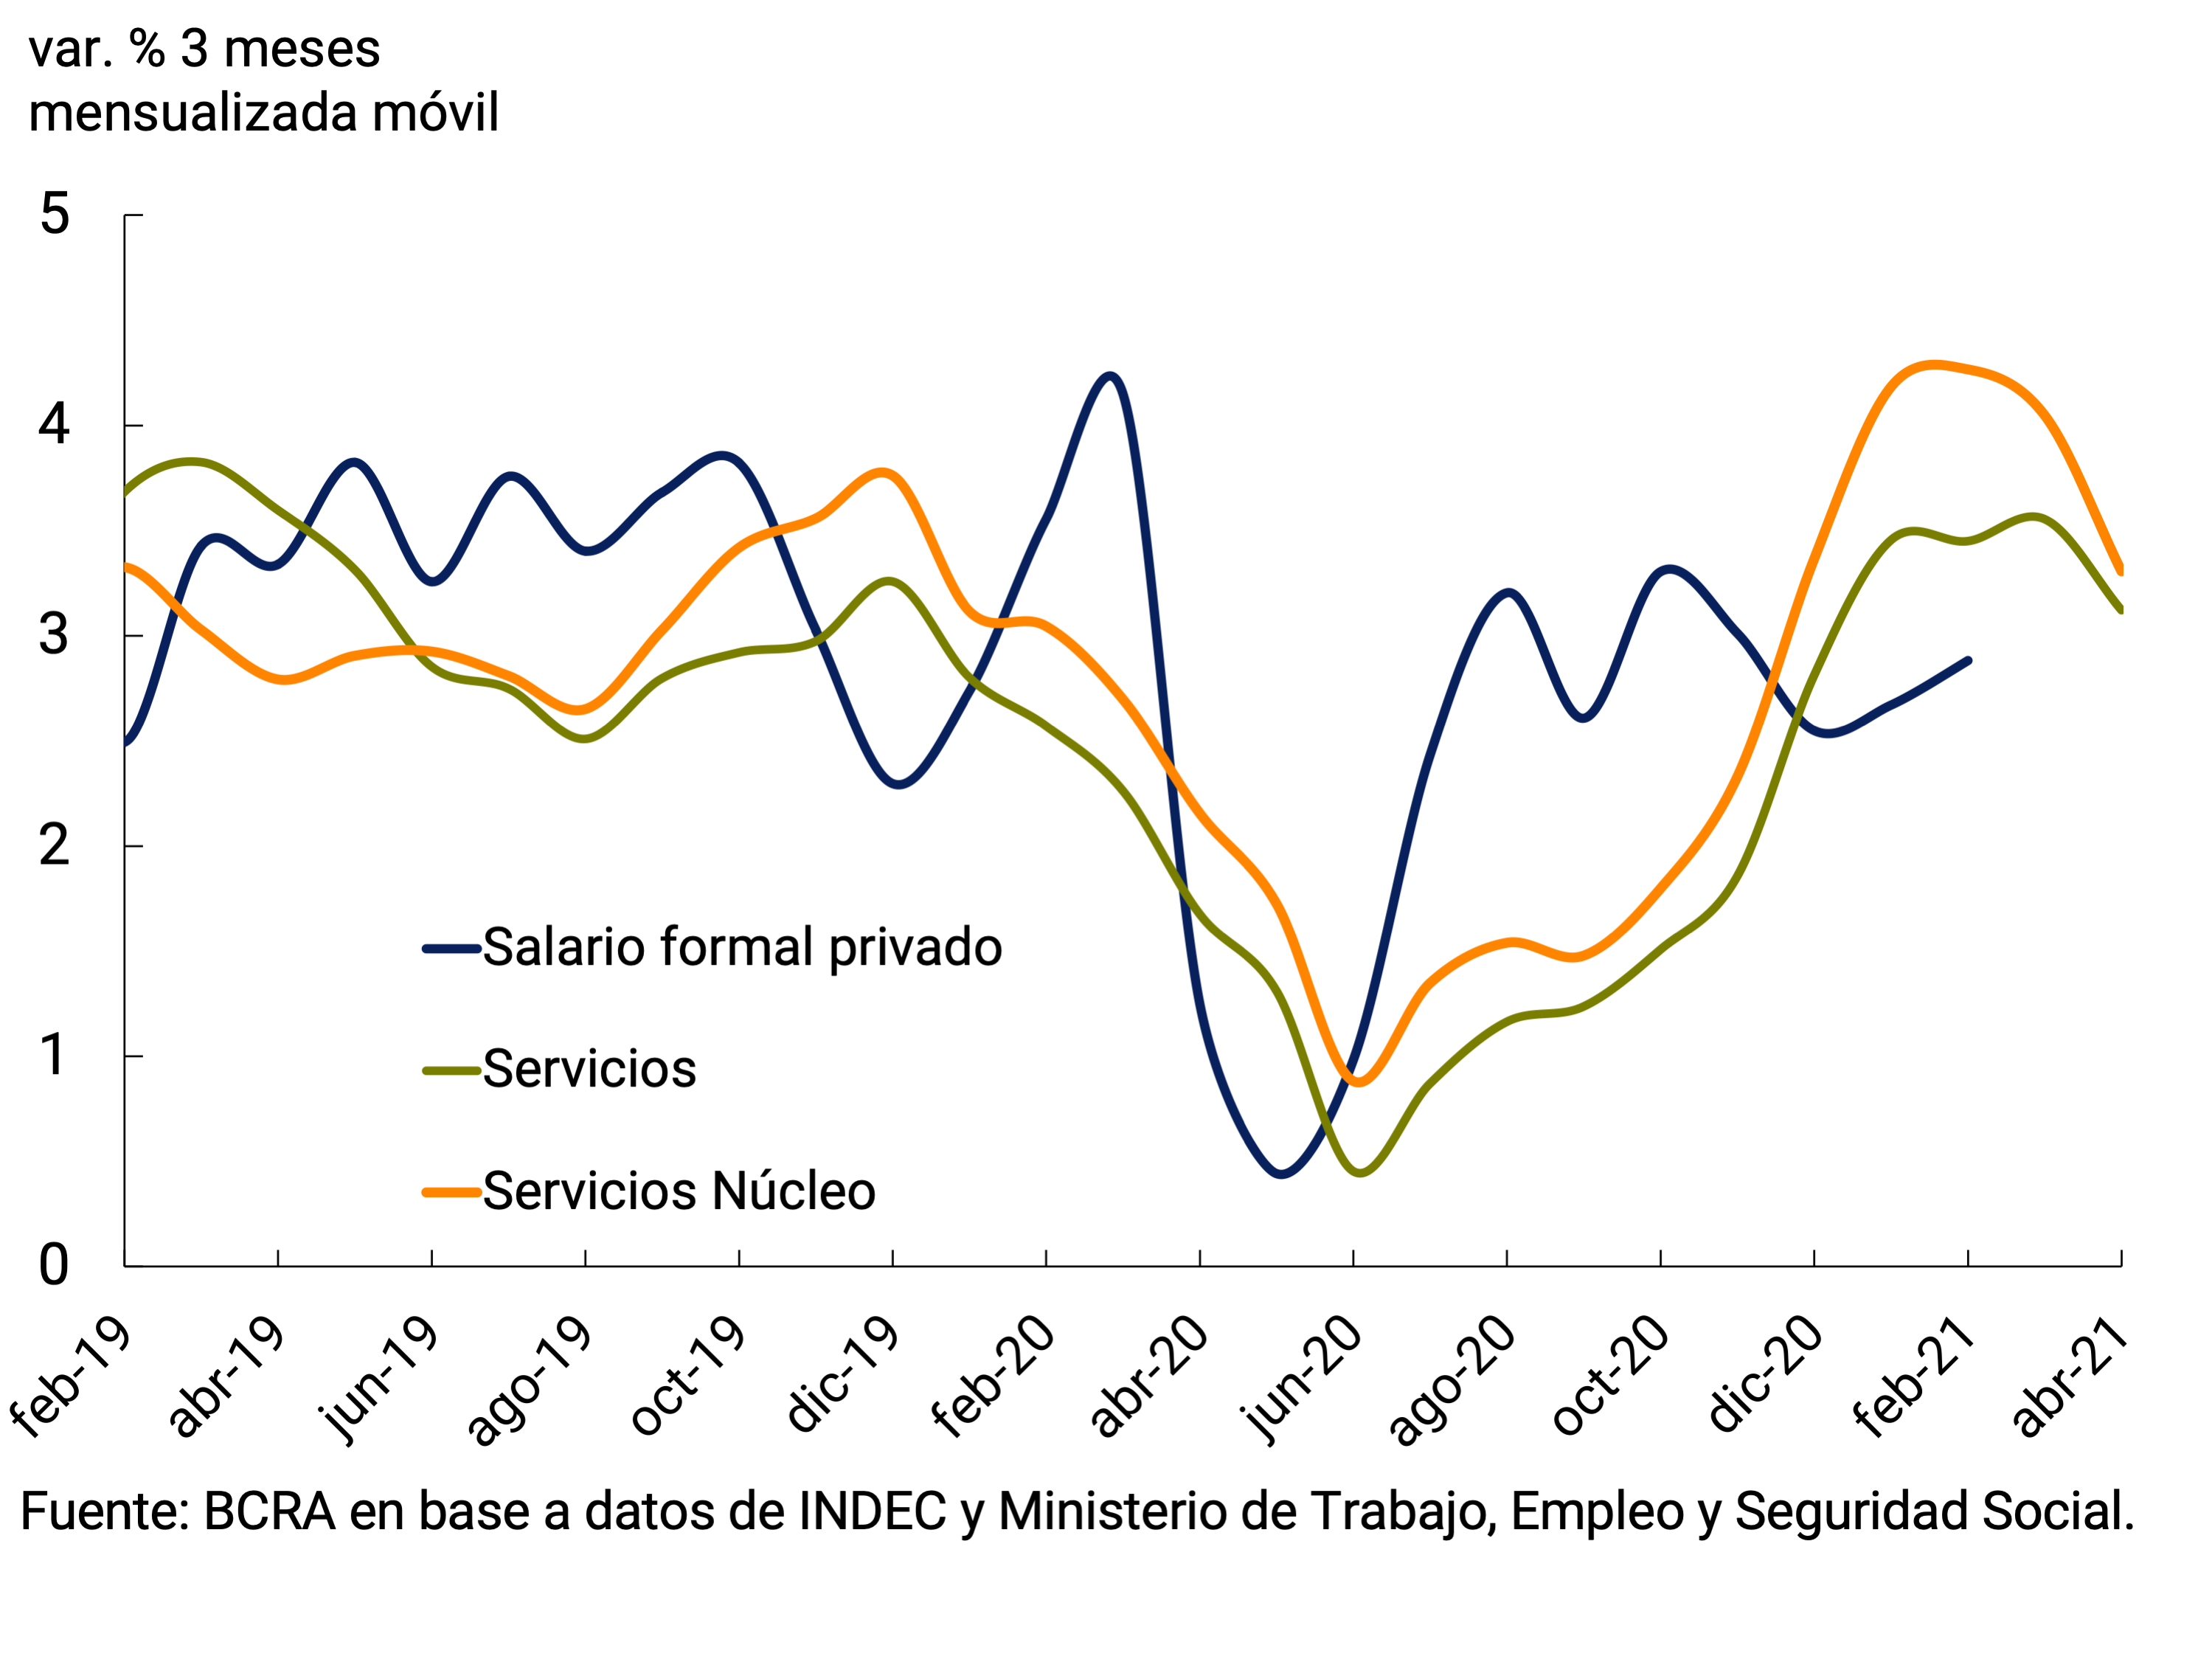
Goods were the ones that contributed the most to explain the acceleration of the general price level in the first months of the year. During the first four months, the main impulses were due to the generalized increases in the prices of food and non-alcoholic beverages and in clothing and footwear, which averaged monthly increases of 4.4% and 5.2% in the first quarter, and from the increases in regulated goods such as fuels and lubricants and cigarettes. which in the first four months of the year averaged increases of 6.3% and 3.9%, respectively.
The food and beverage division of the CPI accompanied the revaluation that food has been experiencing at the global level, in a scenario of extraordinary liquidity that coincides with a lower relative strength of the dollar and significant changes in the relative prices of raw materials, inputs and final goods that exert pressure on the dynamics of retail prices at the local level. With the exception of the month of April, in which the opposite effect was observed, within the food and beverage division, fresh foods continued to grow above processed foods and beverages, highlighting the higher rate of increase in vegetables and the high rates of increase that were verified both in fruits (particularly during the first two months) and in meats and their derivatives. In the latter case, although beef prices slowed the monthly rate of increase, they continued to show high increases, partially reflecting the rise in international prices of agricultural raw materials (particularly corn) that affect the cost of fodder. Recently, the National Government took measures related to the temporary restriction of beef exports37. The prices of processed foods and beverages that are mostly subject to government agreements such as Maximum Prices and Care accelerated compared to the previous quarter, mainly highlighting the recent evolution of baked goods, dairy products and oils and fats, which recovered relative share after lagging behind last year. In the case of Clothing and footwear, the entry in March and April of the products corresponding to the new autumn/winter season determined that the division continued to gain relative weight in the face of core inflation in almost all jurisdictions of the country, especially highlighting the increases registered in GBA.
On the other hand, medicines, automobiles, and furniture and home textiles had significant increases during the first four months and, although they were somewhat lower on average than those of the last quarter of last year, they continued to exert upward pressure on the general price level. On the contrary, household appliances, electronics, and computers, which had shown great dynamism over the past year, expanded at an average rate lower than the average of retail prices, probably linked to the slower rate of increase in the nominal exchange rate observed since February (see Figure 6.4).
Figure 6.4 | IPCBA. Var. Average monthly % per quarter by major components
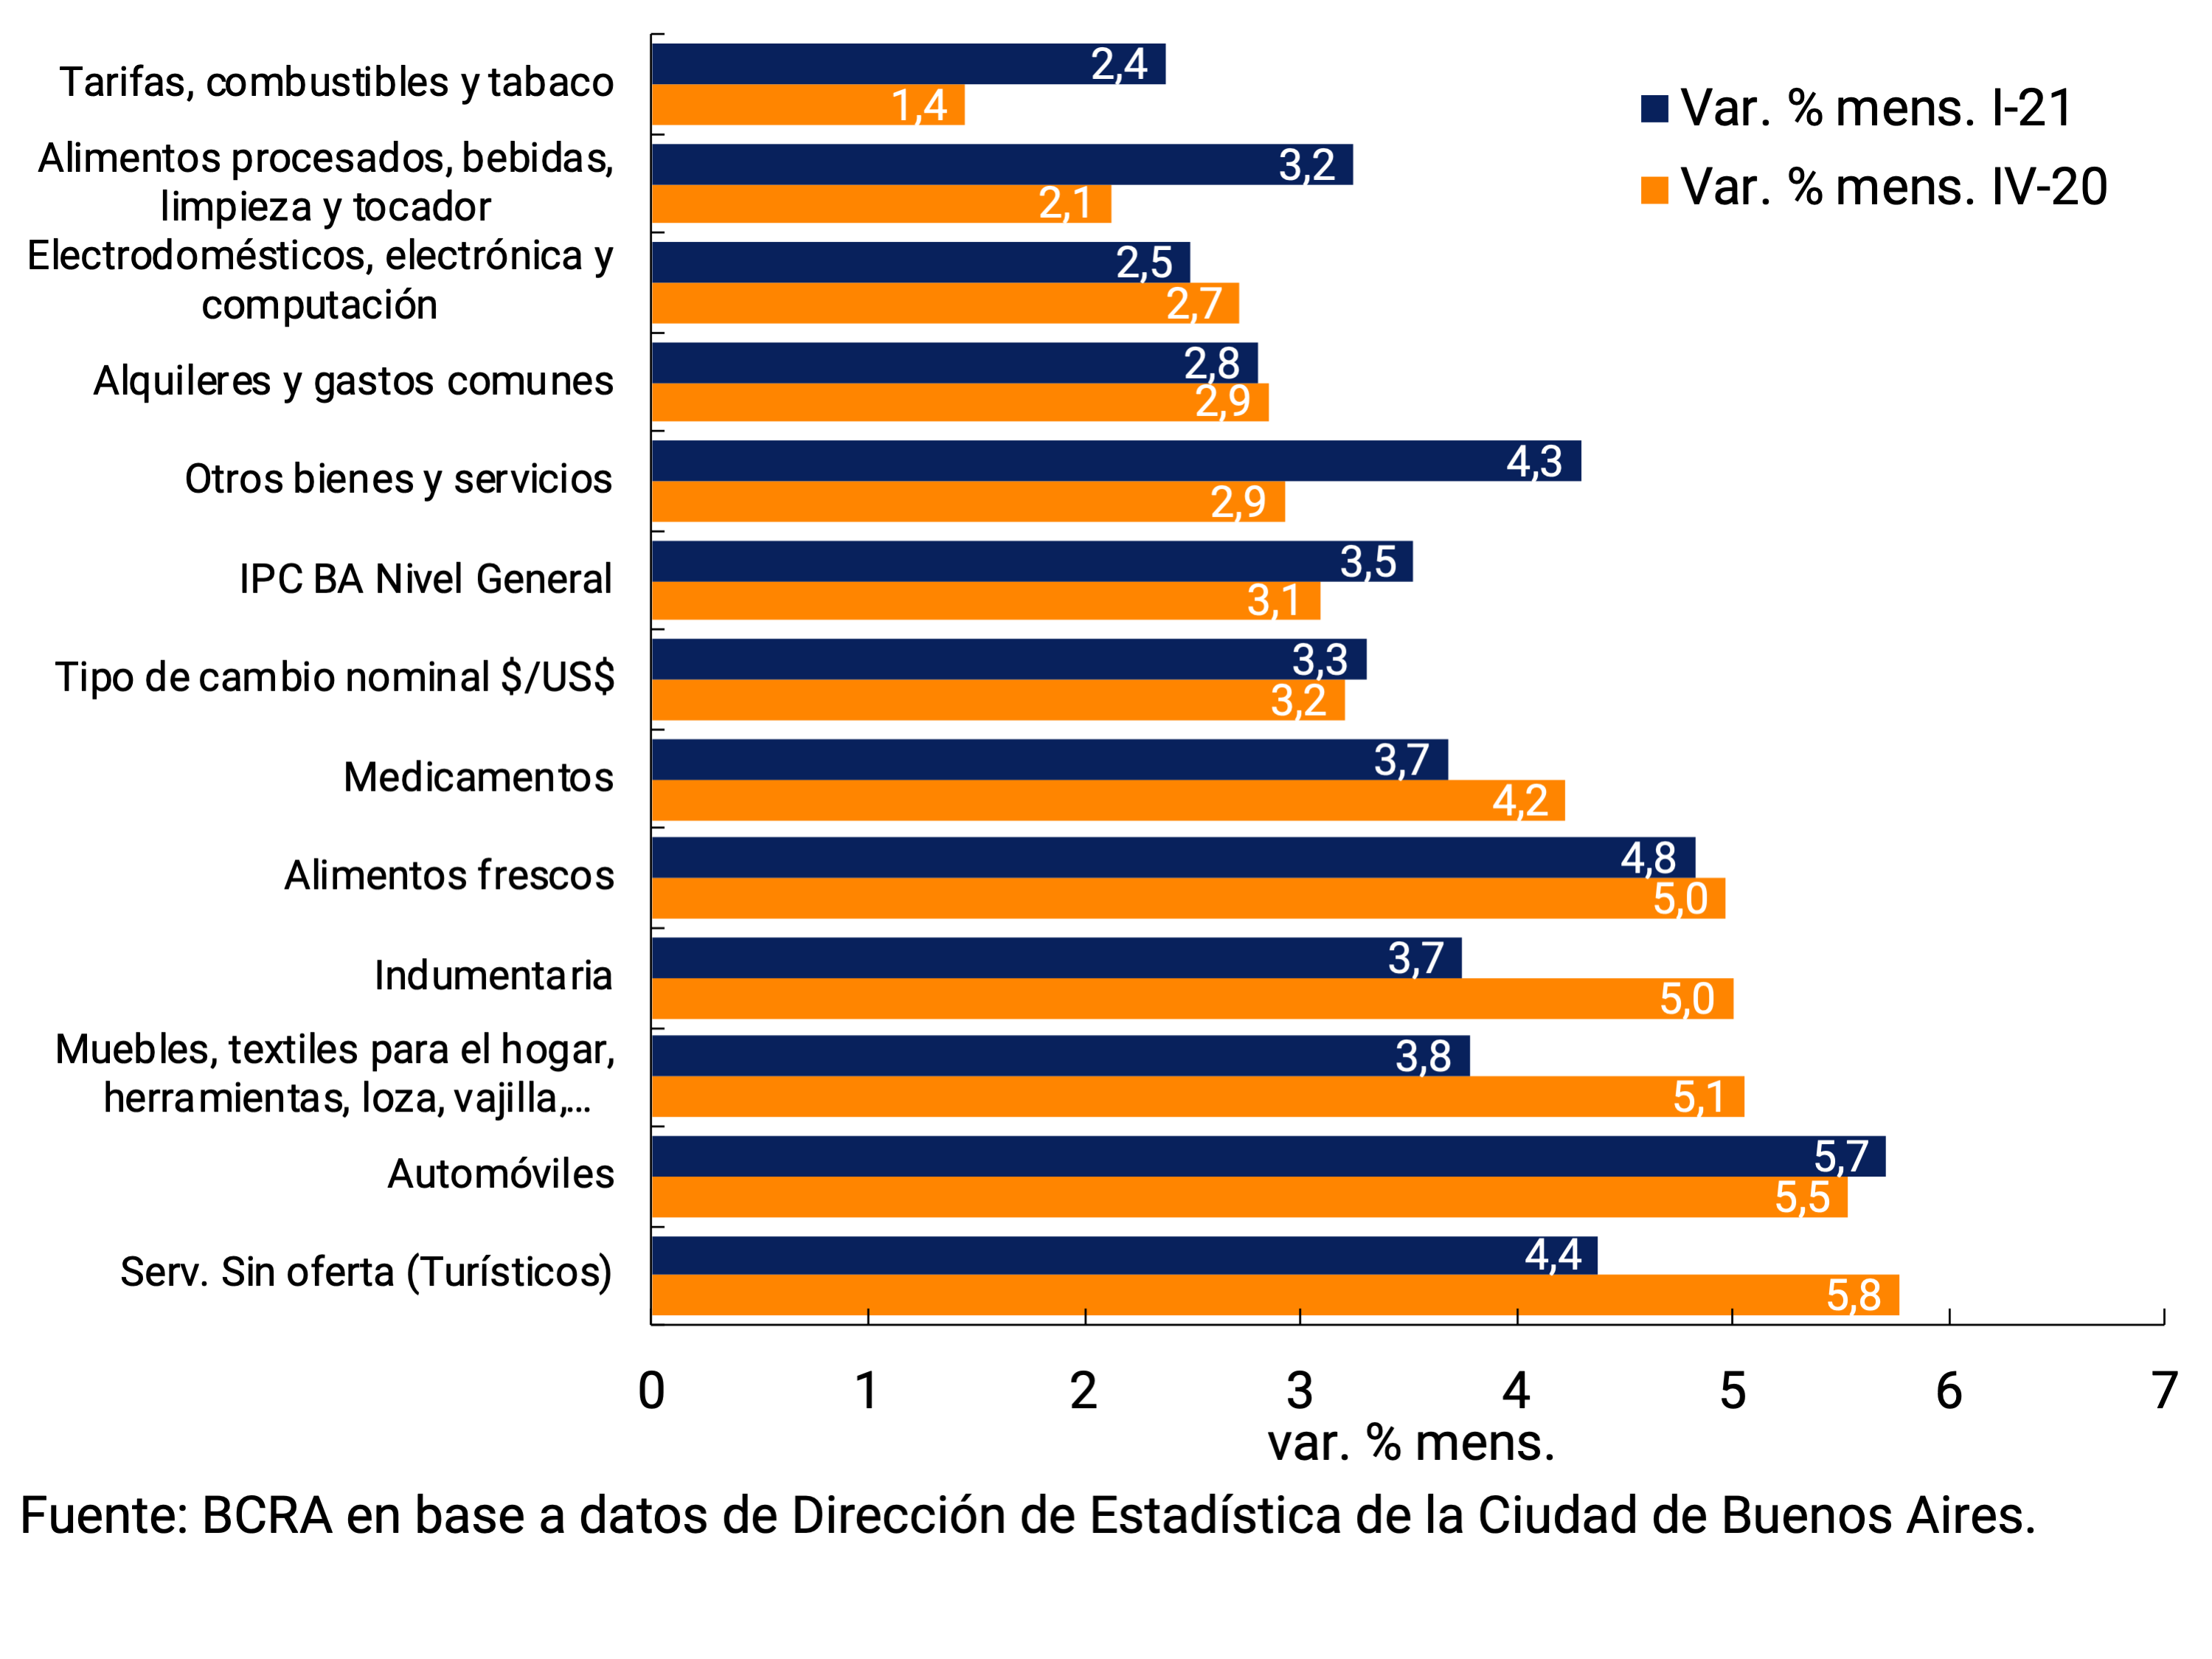
The Domestic Wholesale Price Index (IPIM), composed entirely of goods, maintained a high dynamism in the first quarter of 2021, growing at an average monthly rate of 5.2% (+0.8 p.p. compared to the fourth quarter of 2021; see Figure 6.5.), above the increase in the nominal exchange rate in that period (3.3% monthly average). In April, this index continued to show a high rate of expansion, around 4.8% monthly.
Figure 6.5 | Internal Wholesale Price Index (IPIM)
(a) Quarterly average evolution and contributions
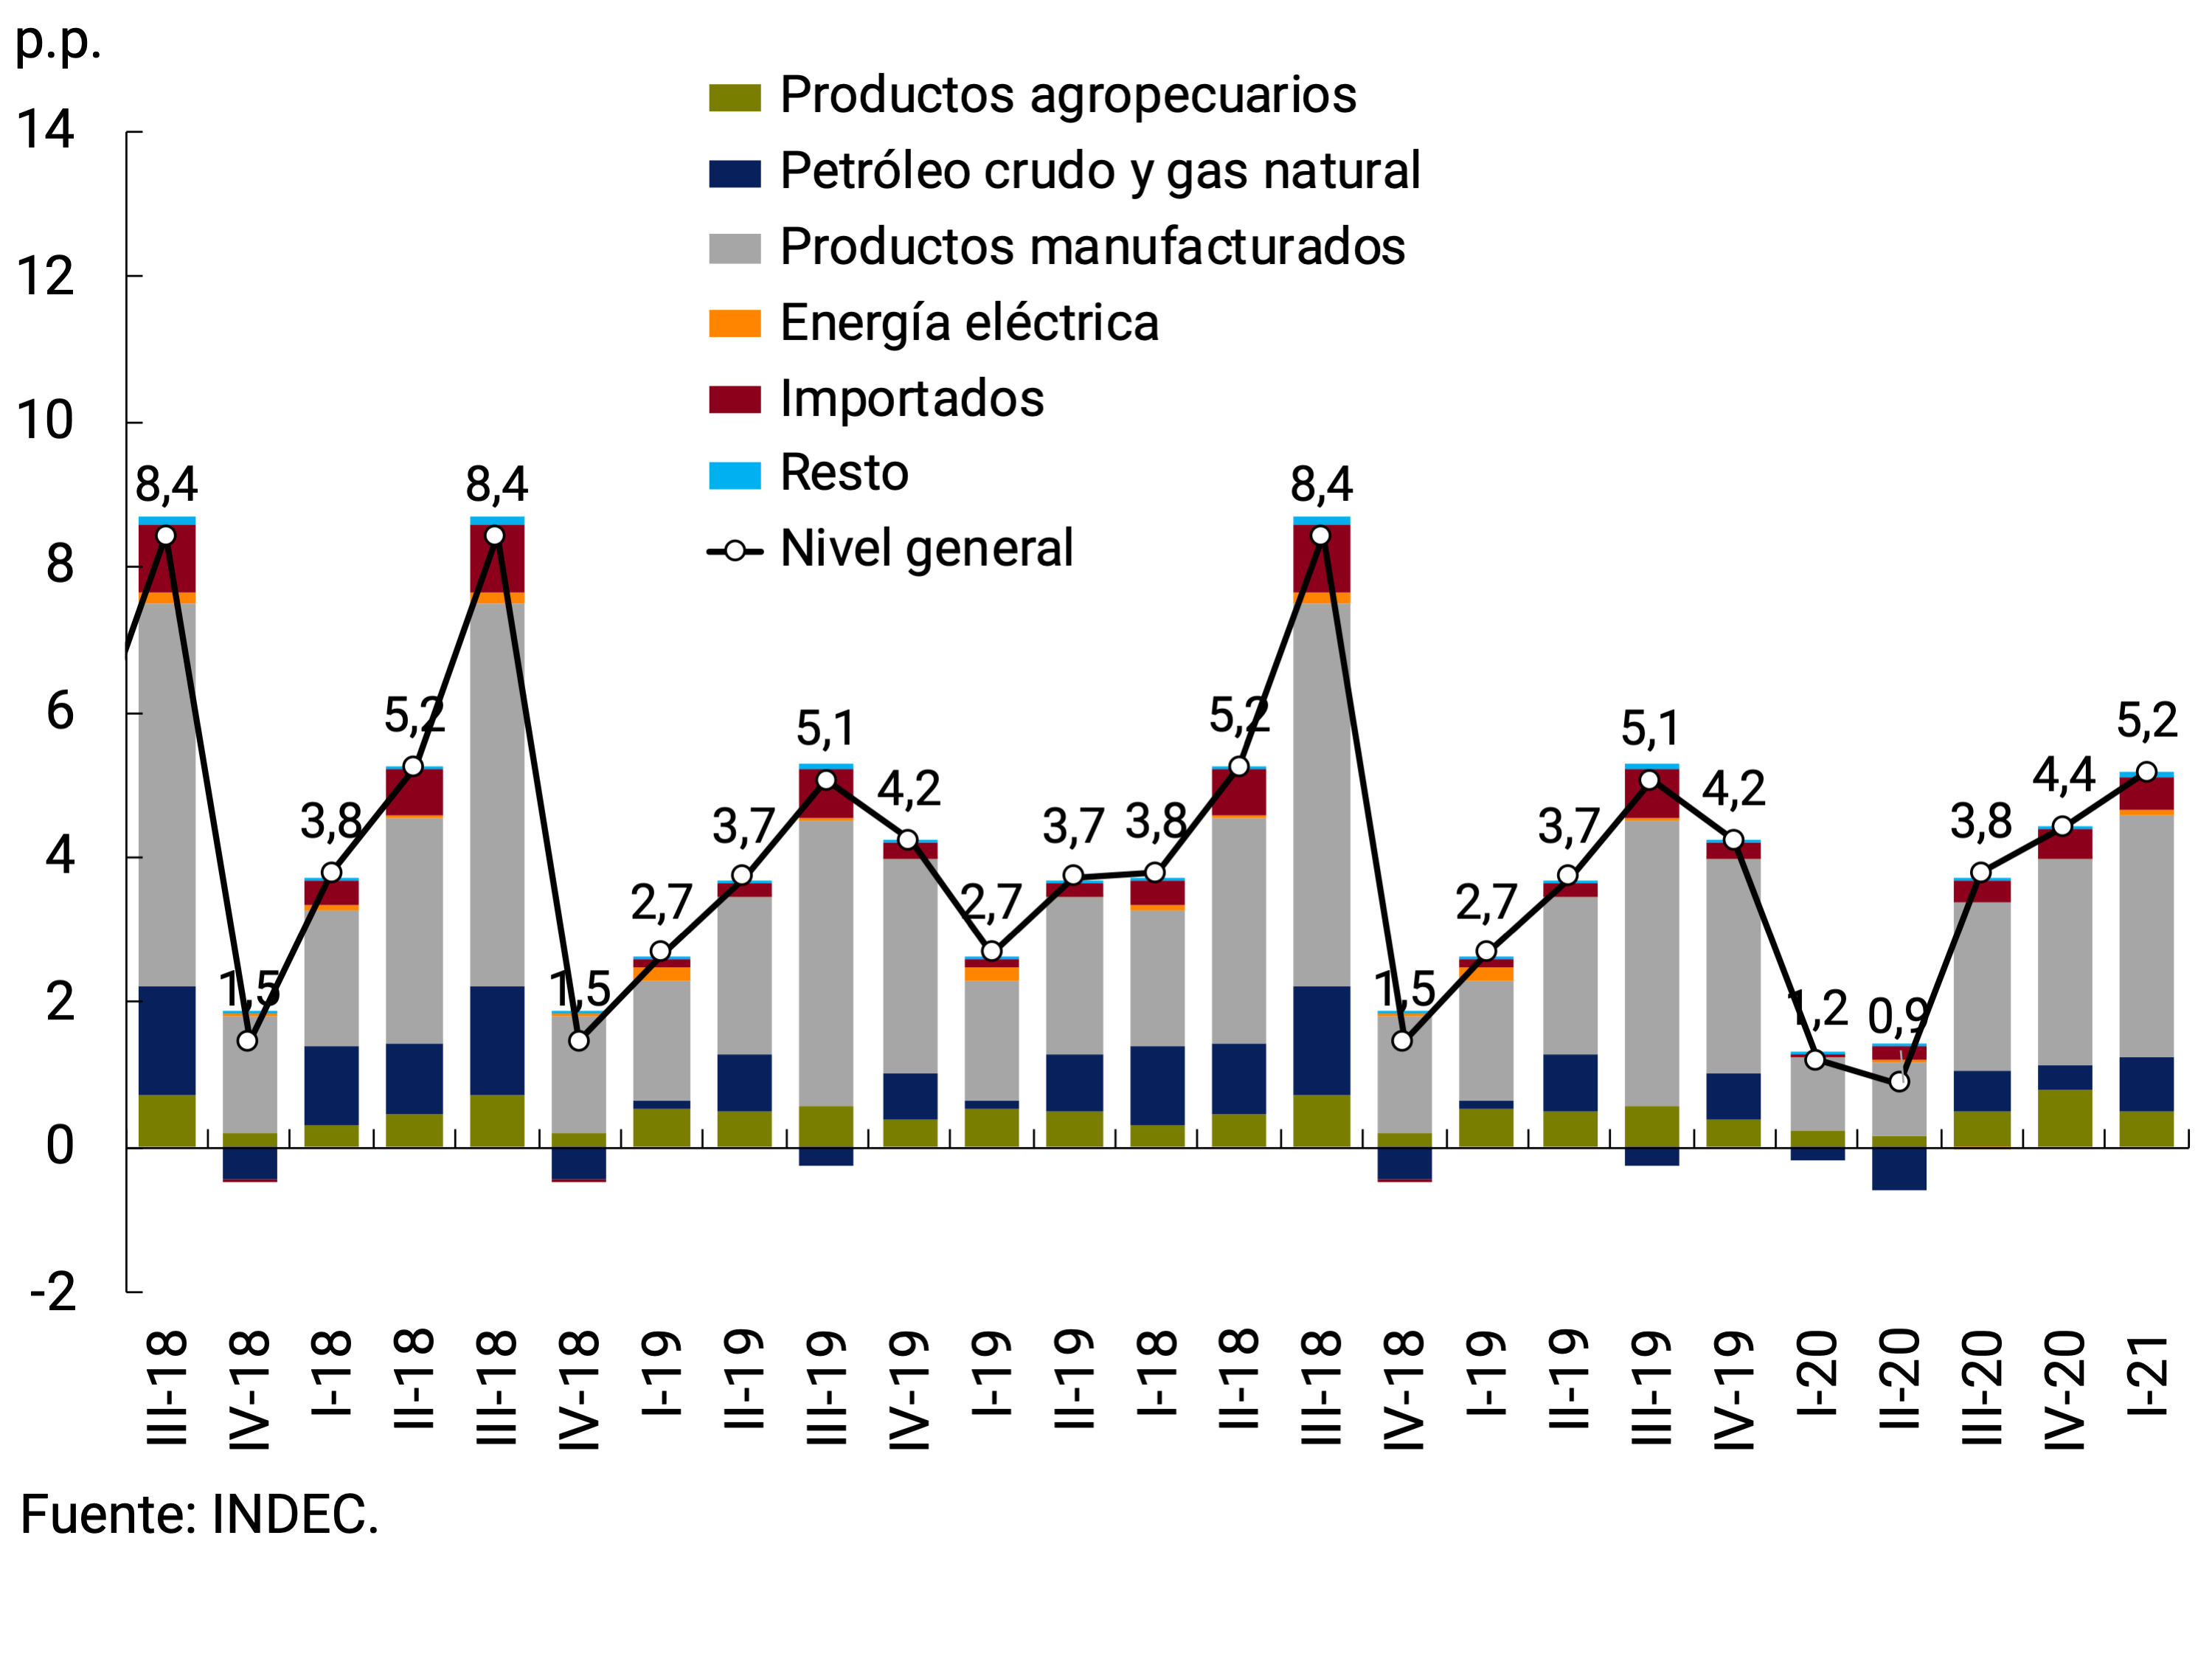
(b) Monthly evolution of the IPIM General level, divisions and TCN
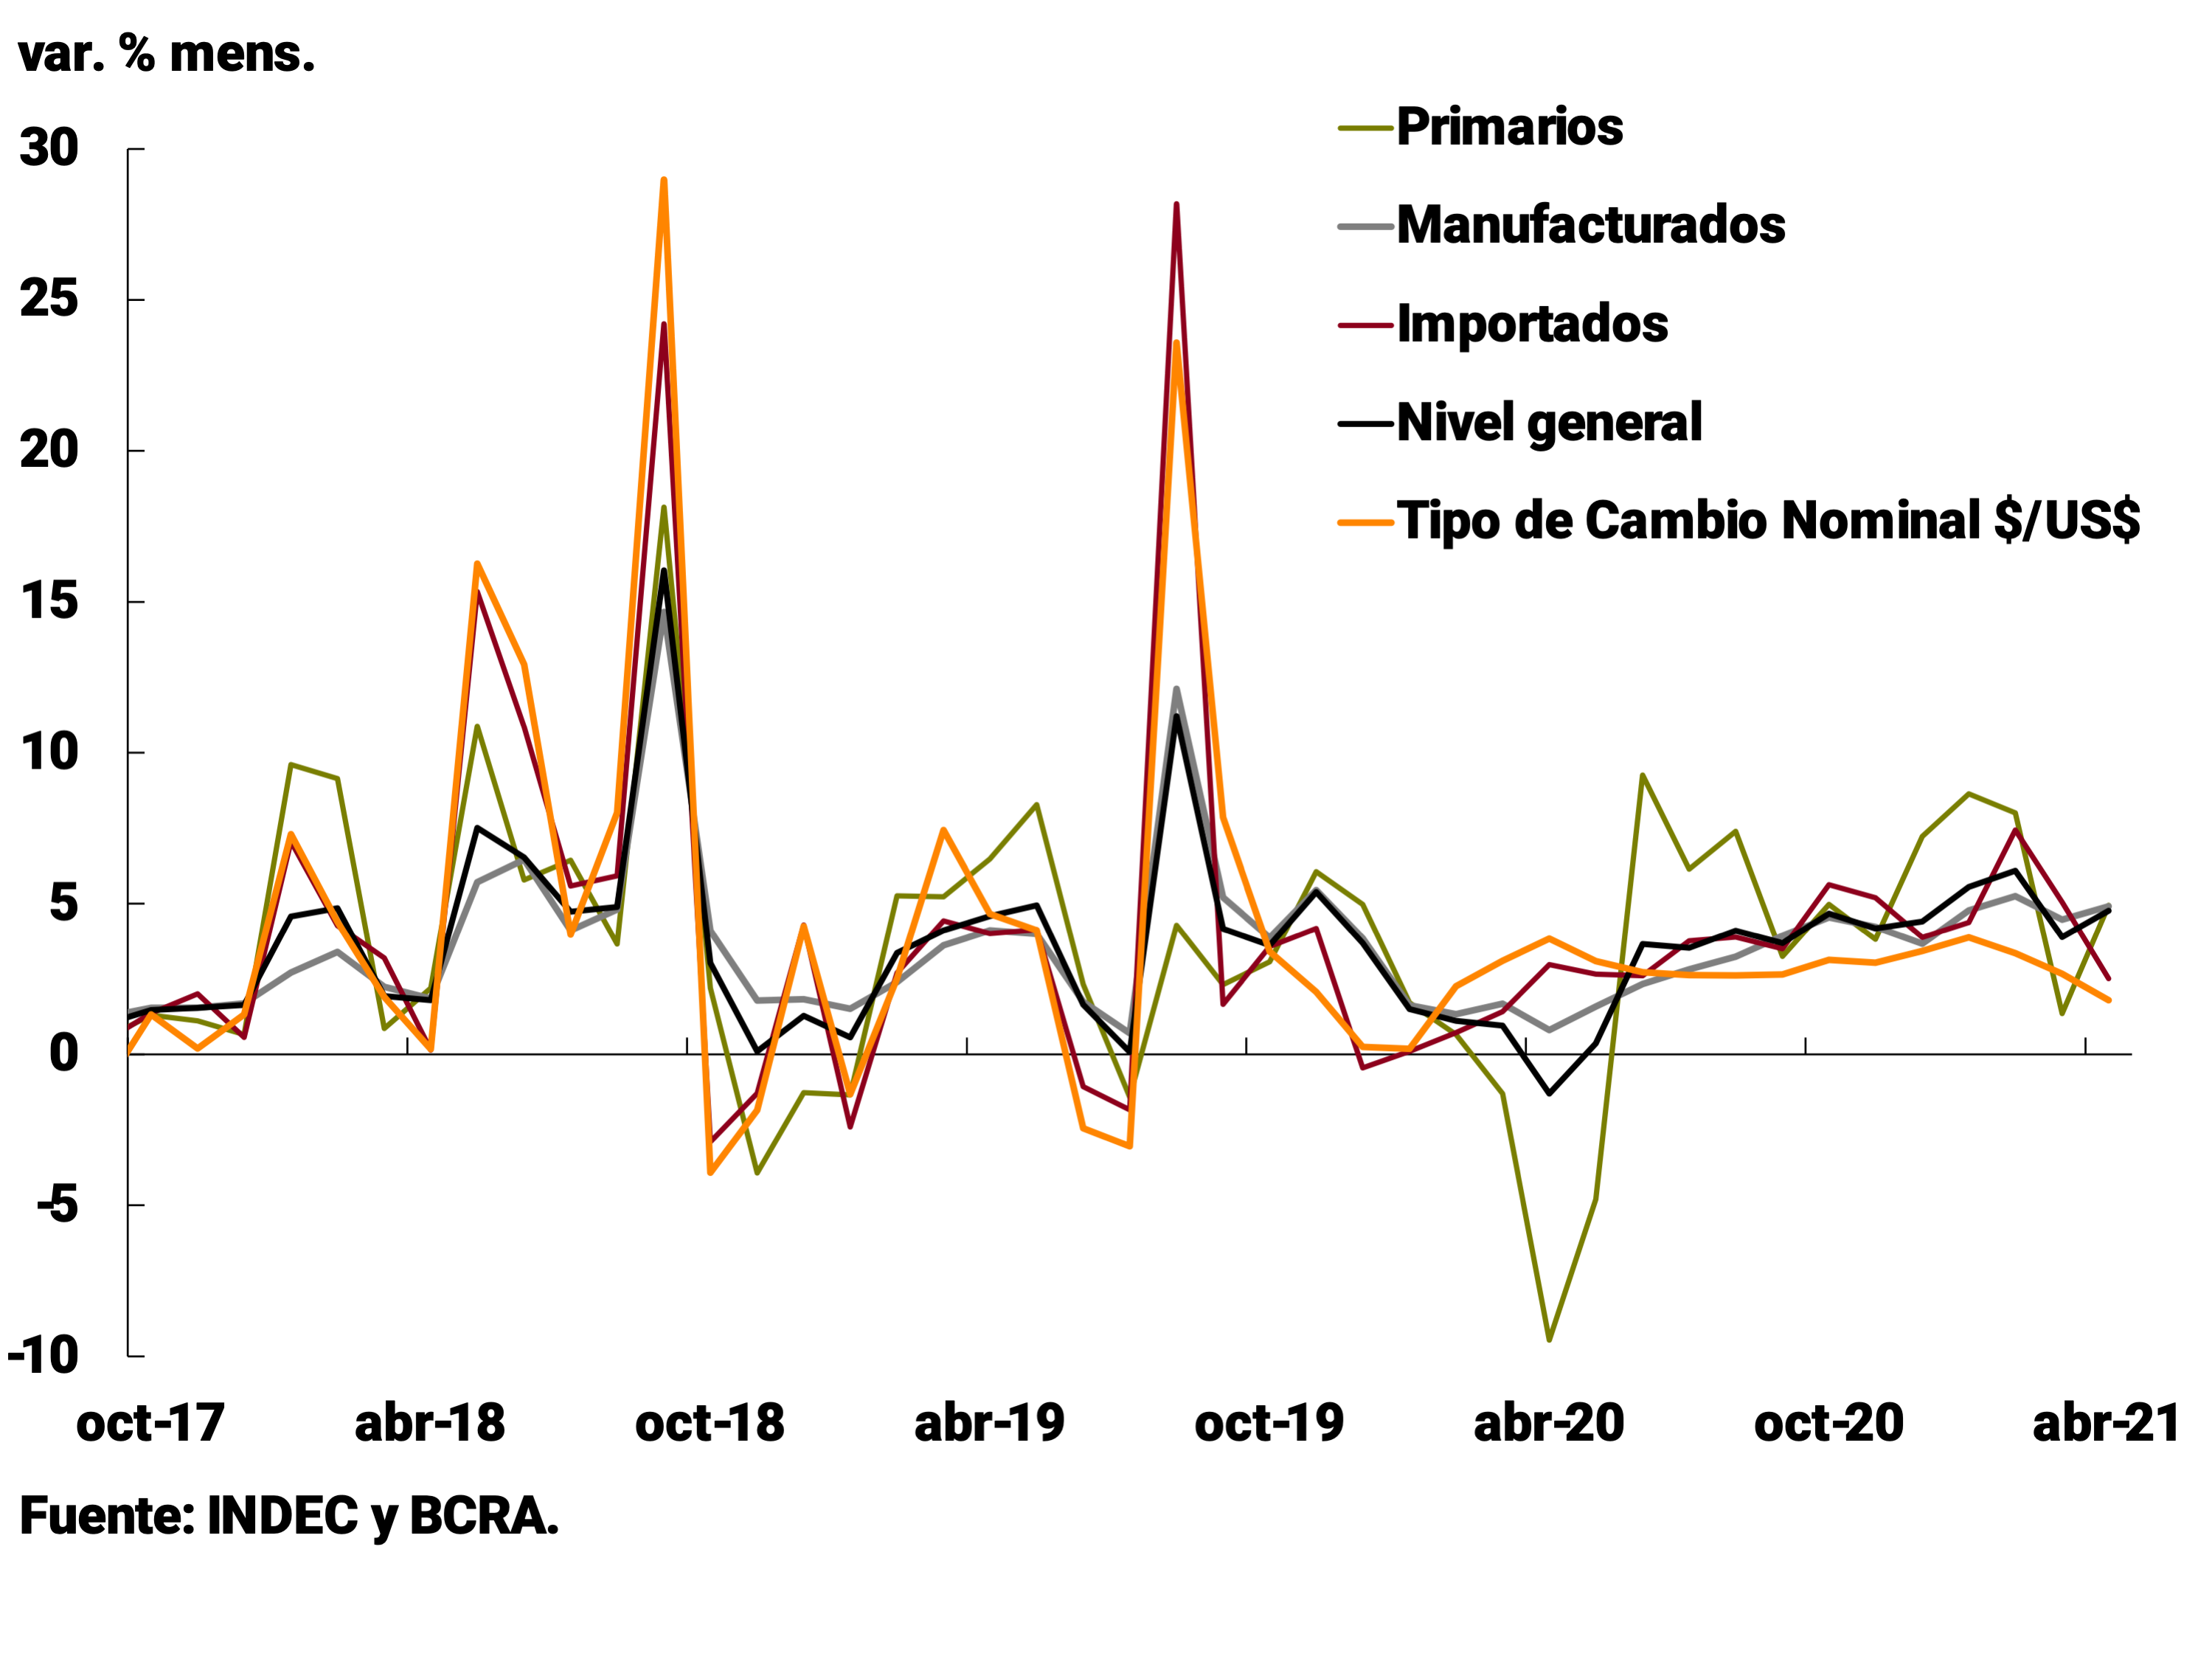
The higher rate of expansion was widespread among its main divisions. Primary products rose 5.9% monthly average in the first quarter (+0.6 p.p. above the increase in the fourth quarter of 2021), mainly reflecting the evolution of Crude Oil and Gas (8.5% monthly average in the first quarter, +4.7 p.p. compared to the previous period). This increase was linked to the increase in international crude oil values that occurred in the first months of the year. Meanwhile, the prices of Agricultural Products maintained their dynamism and rose 4.2% monthly average in the first quarter (-2.7 p.p. compared to the previous period), highlighting within this group the moderation in the rate of increase of Livestock Products. Manufactured products exhibited high increases, around 4.8% monthly average in the first quarter (+0.7 p.p. compared to the previous period), with a wide diffusion in the increases in the items that make up this group. It should be noted that electricity prices – with a low relative weight in the IPIM – rose 7.6% monthly average in the first quarter, reflecting the update of the reference wholesale prices for electricity established by the National Electricity Regulatory Entity (ENRE, Resolution 79/2021), which had remained unchanged since 2019. Finally, the prices of imported products maintained a high pace, rising 5.6% monthly average (+0.7 p.p. above the previous period). In April, the main divisions of the IPIM had slightly lower monthly expansion rates than those verified on average during the first quarter, although they maintained significant increases, with increases of 4.9% monthly for Primary Products and Manufactured Products.
During the first quarter, Construction costs had a lower rate of expansion than retail and wholesale prices, slowing down compared to the last quarter of 2020 to 3.4% monthly average in the first quarter (-3.2 p.p.). In line with the greater dynamism of goods in relation to services observed in the CPI, within this group, the prices of Materials maintained a high rate of expansion, growing 4.8% monthly average in the first quarter (-2.4 p.p. compared to the previous period), partially affected by the increase in international metal prices. For its part, the Labor chapter rose 1.9% monthly average (-4.4 p.p. in relation to the fourth quarter of 2020), reflecting the entry into force of the last parity tranche of the wage agreement between UOCRA and CAMARCO that was finalized in February (see Figure 6.6). In April, construction costs accelerated significantly to 6.4% monthly, mainly explained by the increase in the labor component (9%), after the first tranche of the new wage agreement was finalized, while materials continued with high increases, around 4.1%. It should be noted that in year-on-year terms, a marked disparity continued to be observed between the evolution of the costs of Materials and Labor, with increases to April of 84.6% YoY and 34.6% YoY, respectively.
Figure 6.6 | Construction costs
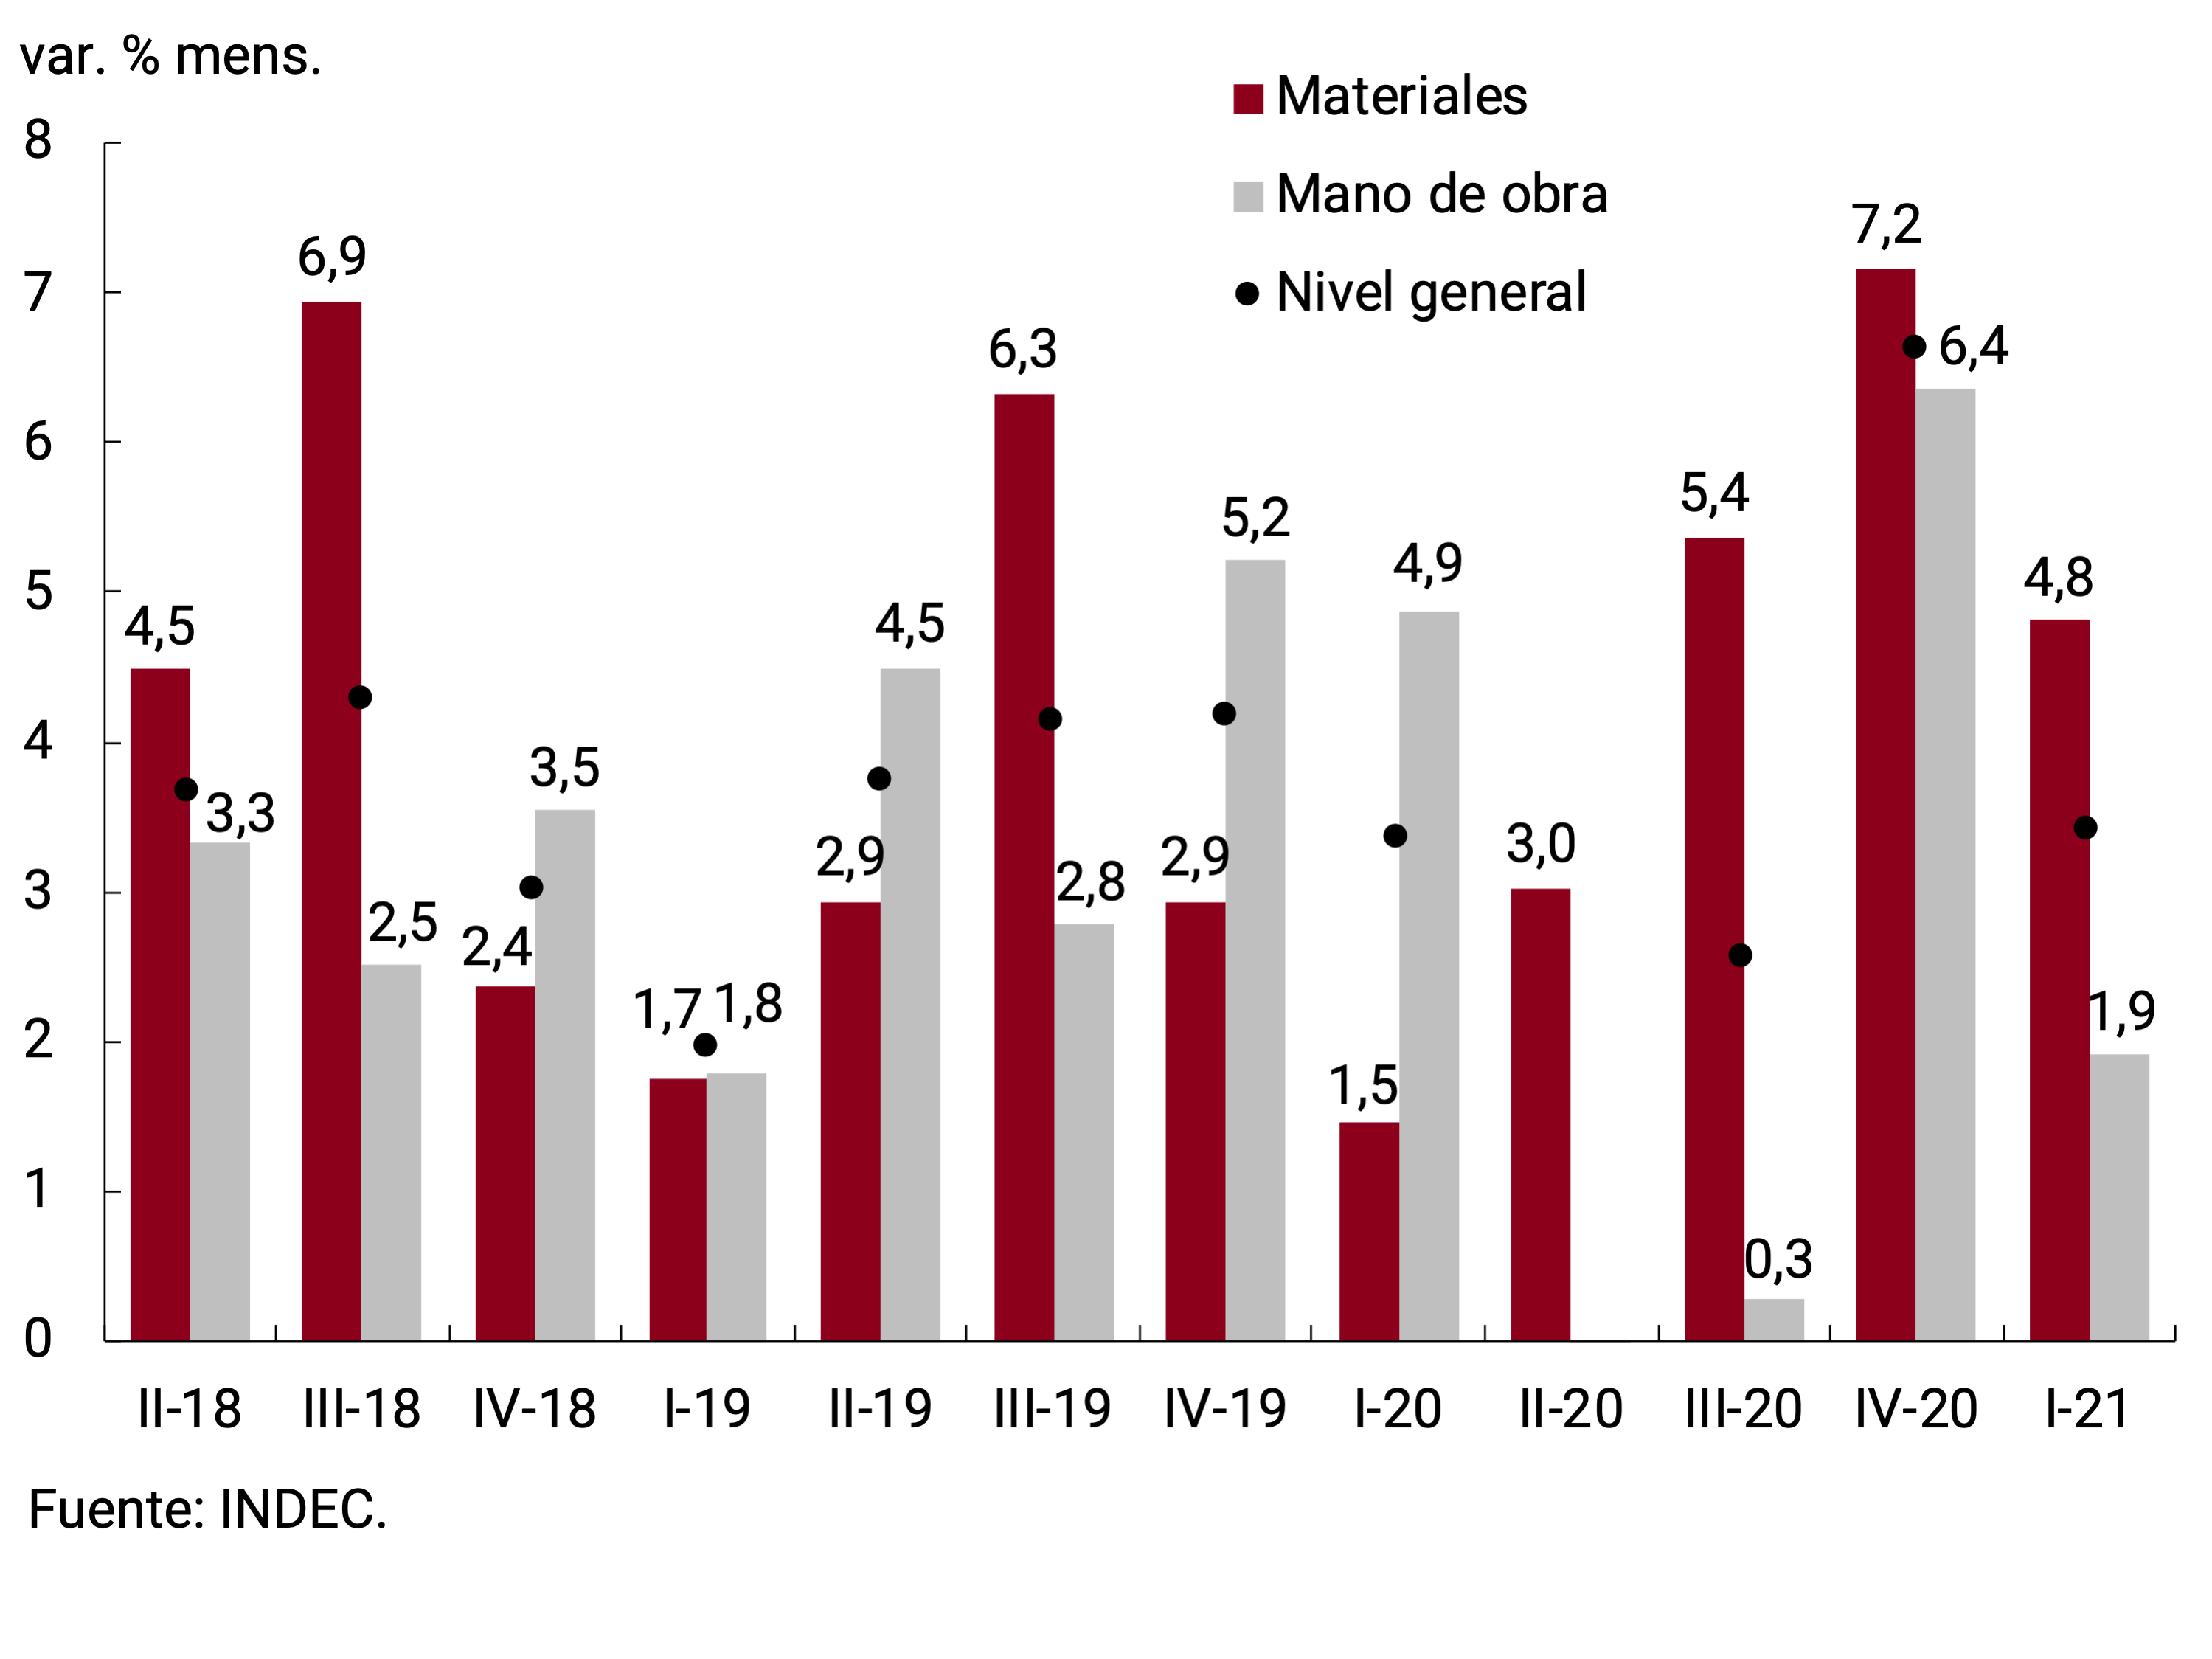
6.2. Retail prices accelerated to 46.3% in year-on-year terms in April, maintaining great heterogeneity at a more disaggregated level
The CPI marked a 46.3% YoY increase in April, accelerating since November 2020, above the average inflation that was verified during the previous year. This trend was observed among the main aggregates of the CPI, although they maintained different growth rates and deepened the change in relative prices observed over the past year (see Figure 6.7).
Figure 6.7 | Retail (CPI) and wholesale prices (IPIM)
(a) Quarterly changes
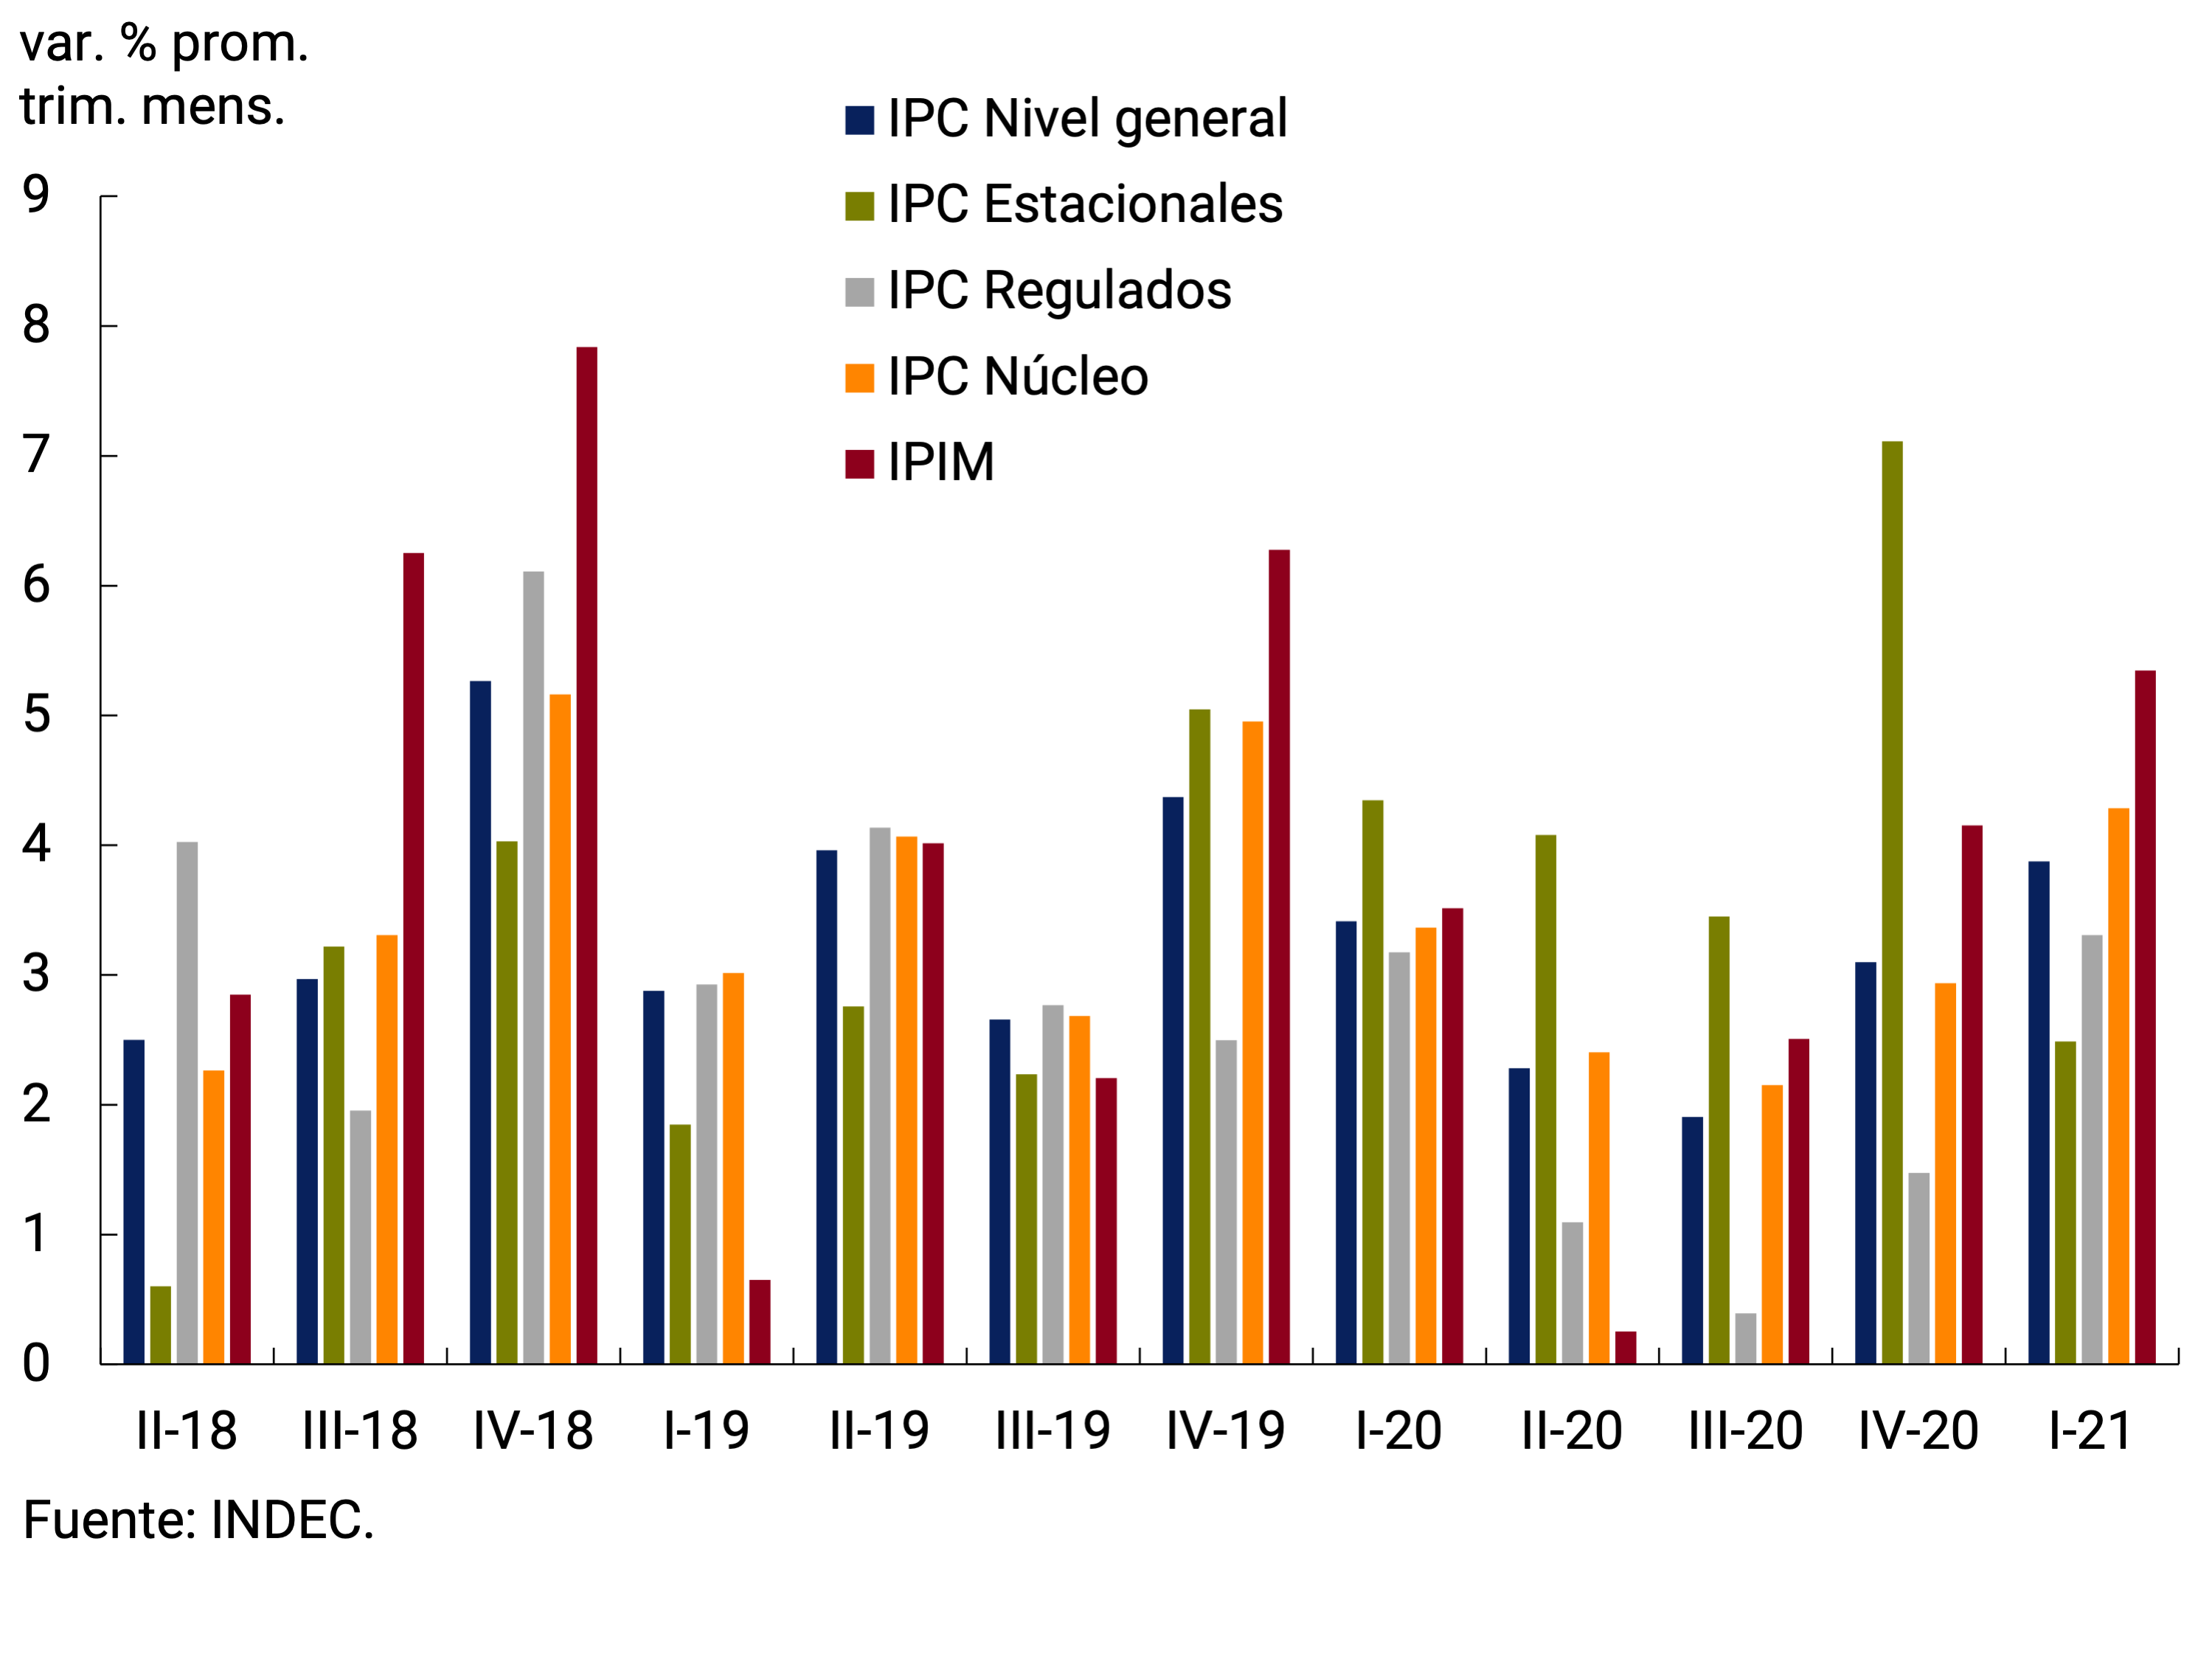
(b) Year-on-year changes
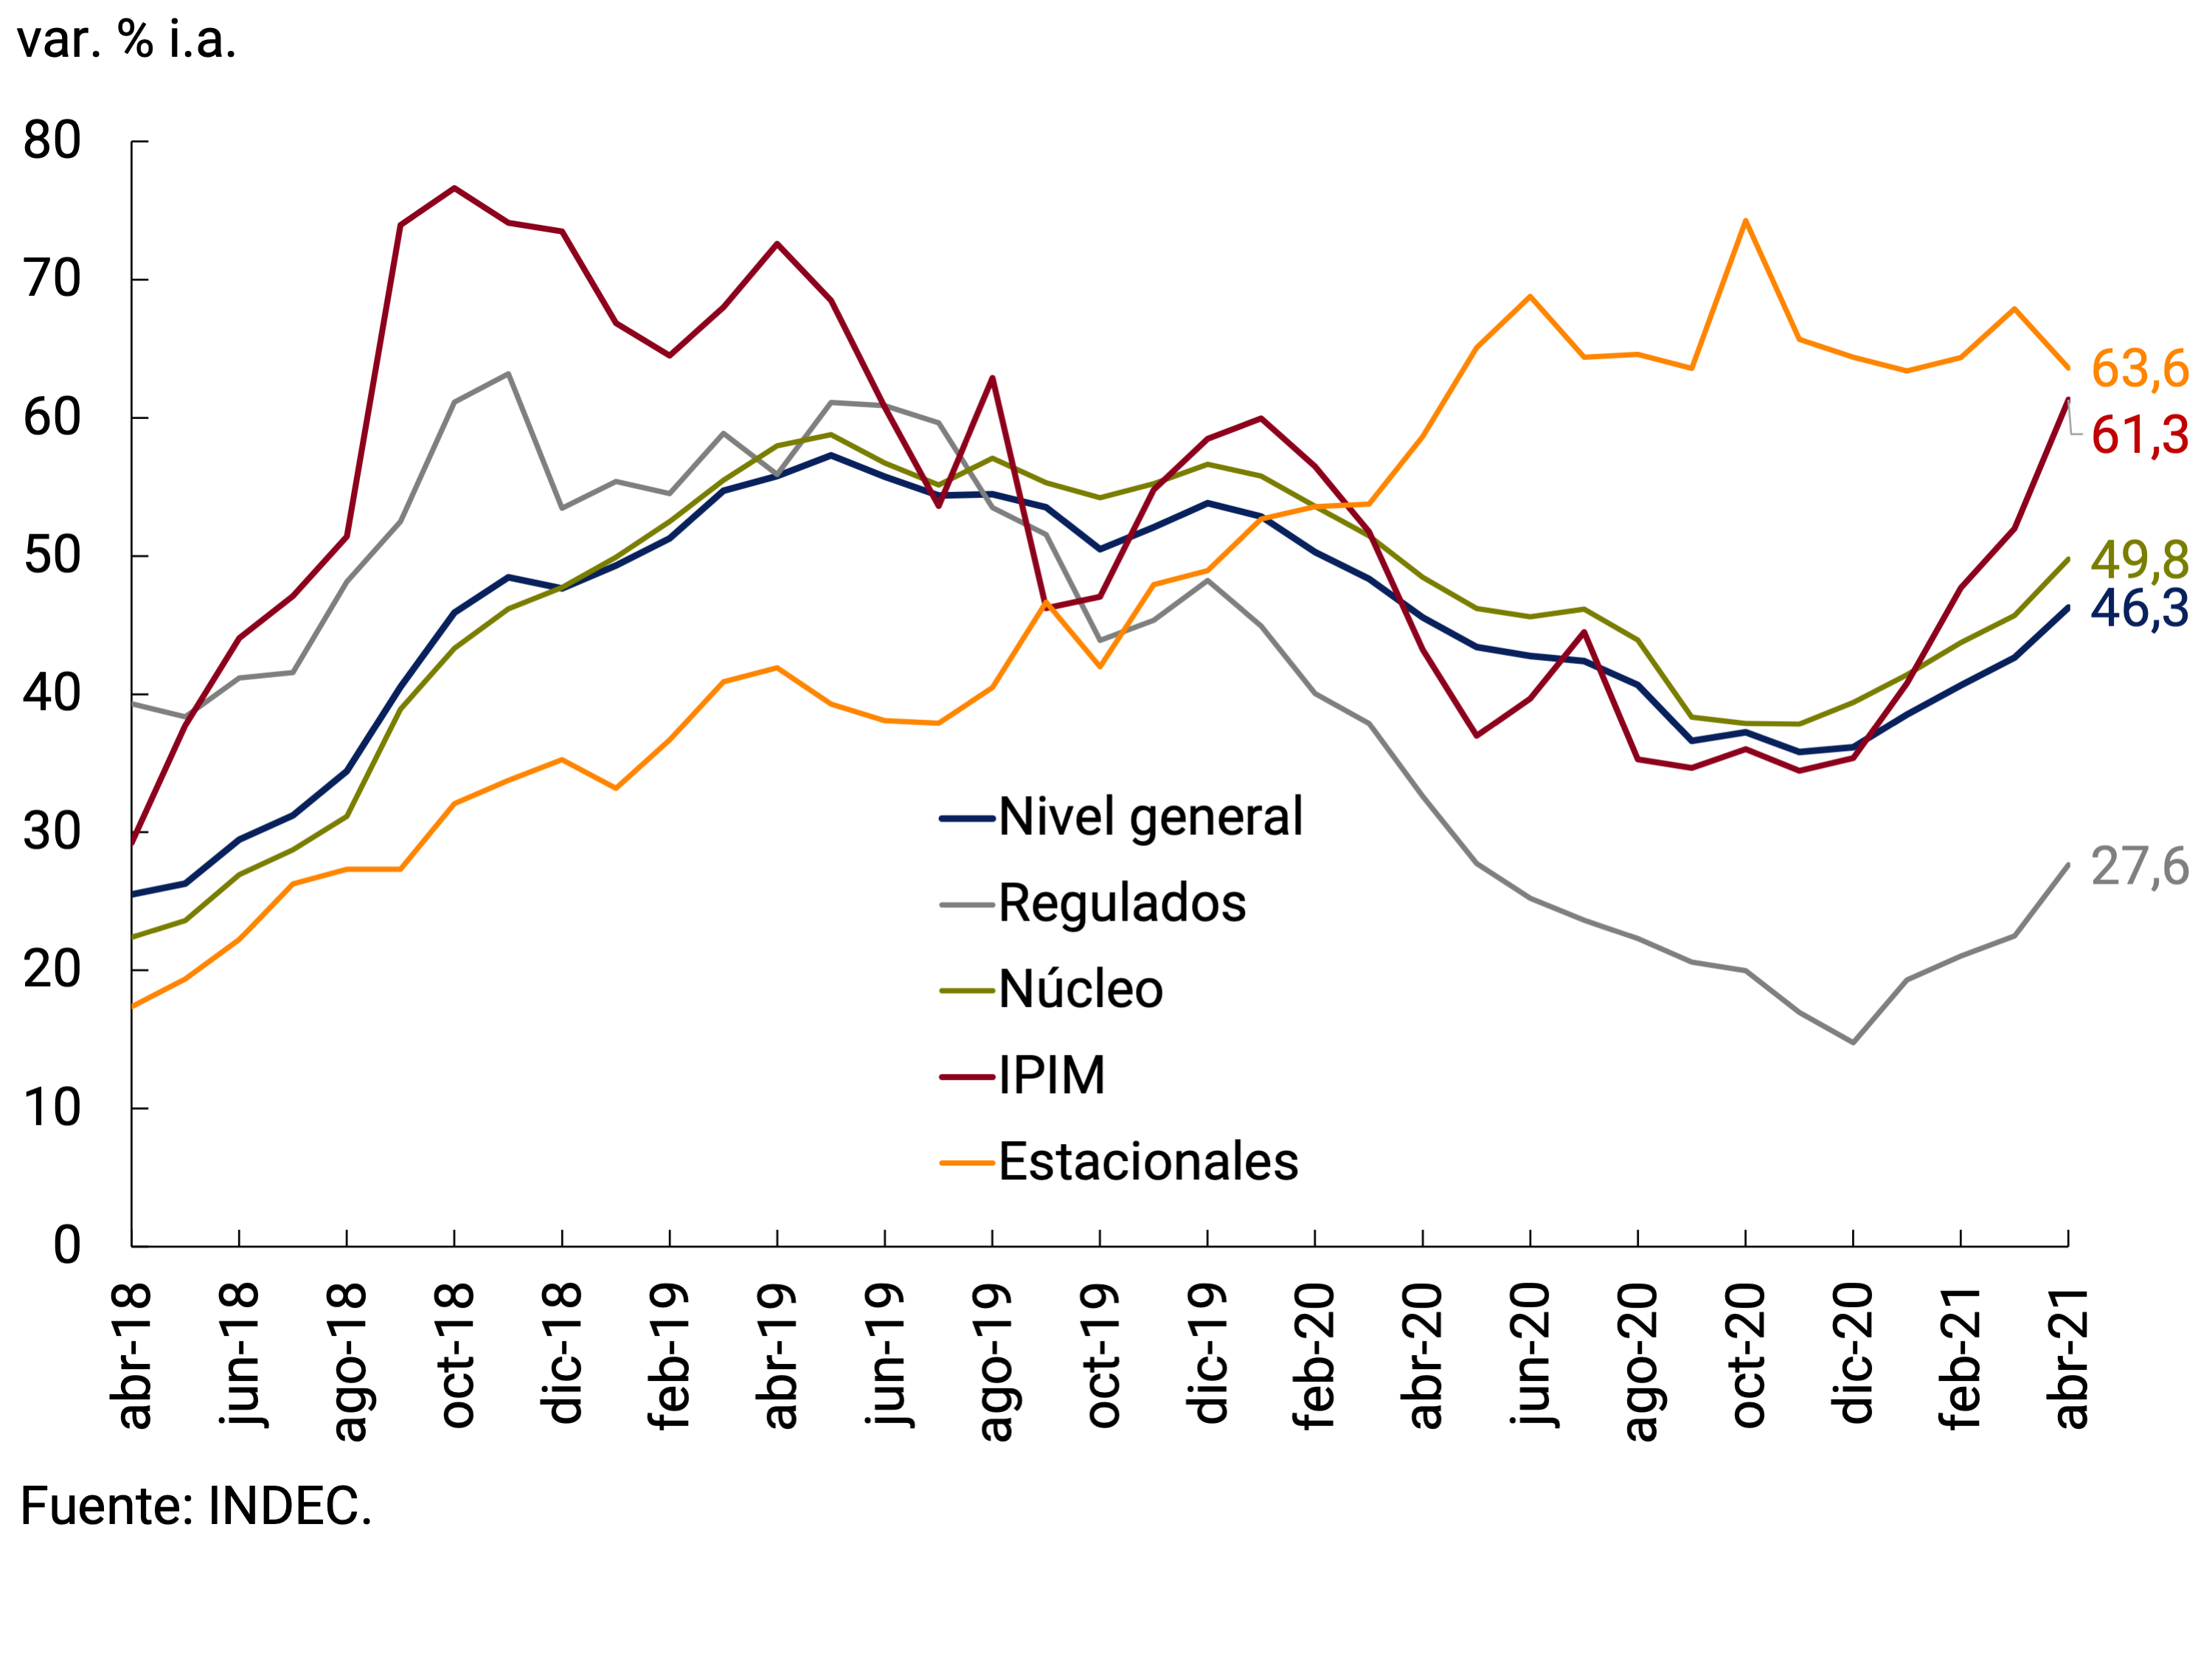
In recent months, changes in the trends of some goods and services have been observed. Graph 6.8 compares the variation of the last 12 months to April with the accumulated variation in the first four months of the year of the prices surveyed in the CPI of the City of Buenos Aires, which has a greater openness. The curve that divides the quadrant into two represents equivalent rates for both periods and, therefore, those goods and services that are below it accelerated their inflation rate. In particular, three groups were identified.
Figure 6.8 | Heterogeneous dynamics within the CPI BA
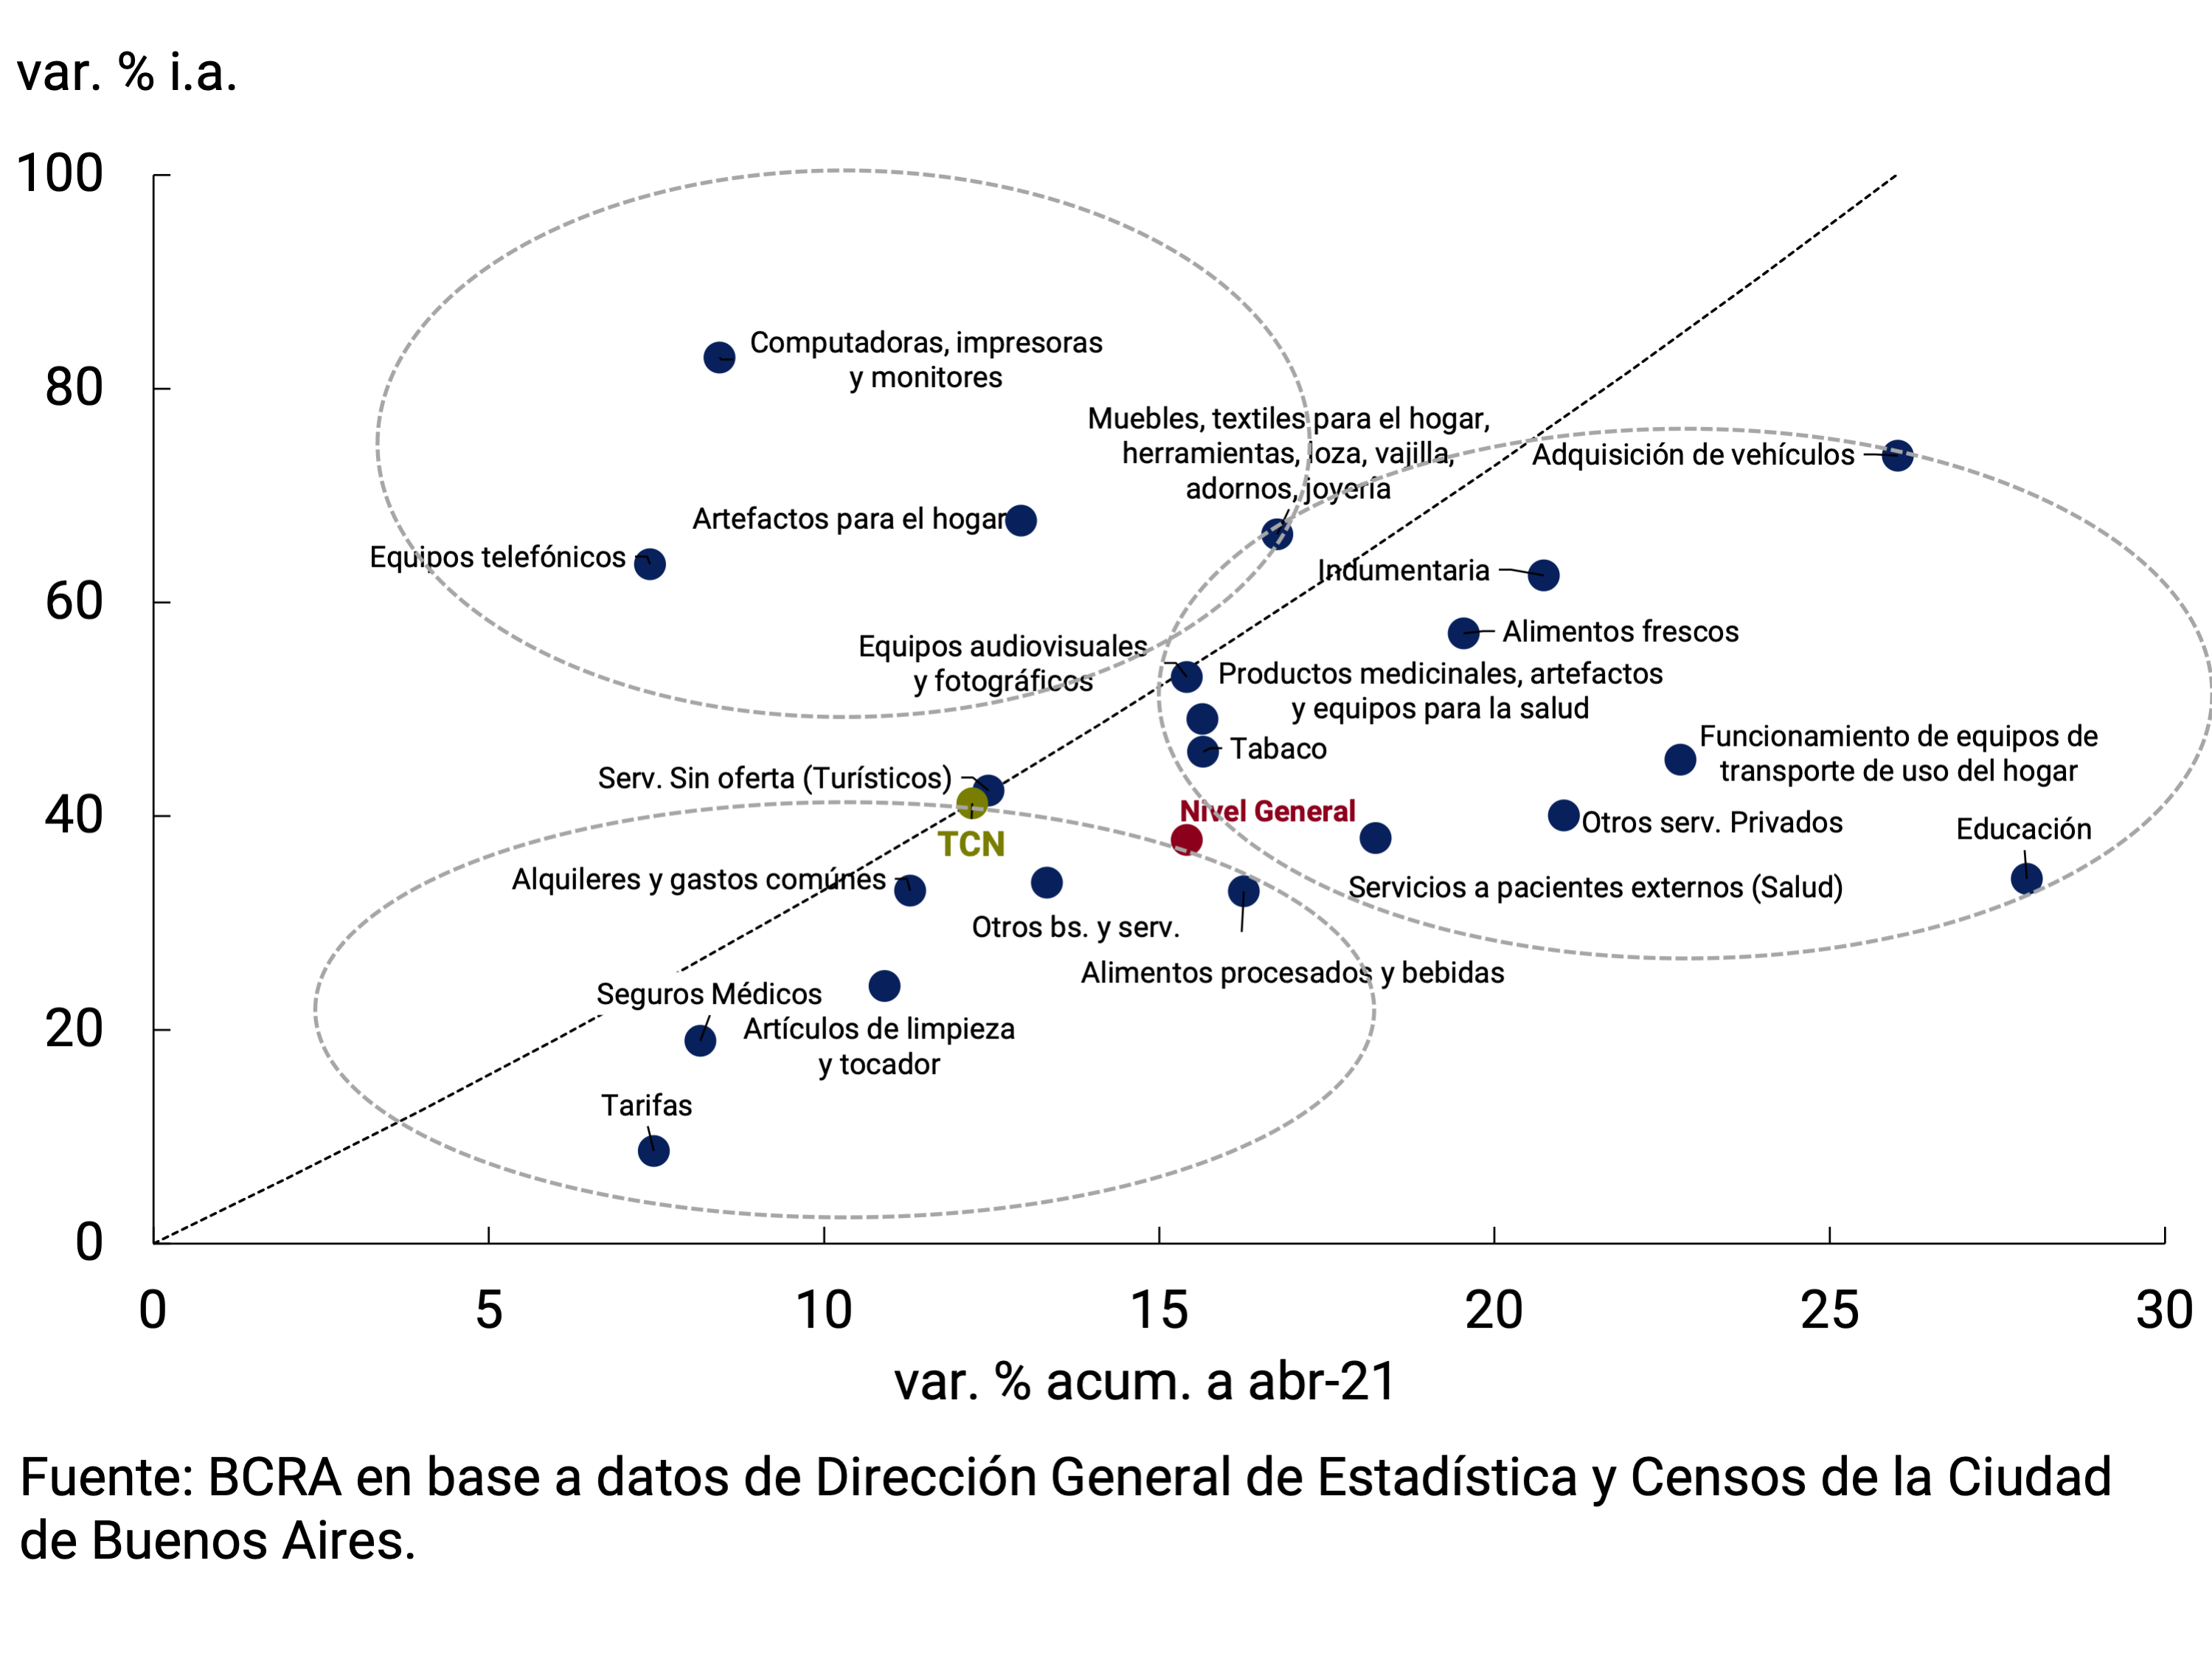
The first group was characterized by having shown an acceleration so far this year, after having shown the most moderate inflation in 2020. Such is the case of processed foods, in particular dairy products covered by reference price programs. A similar behavior was also verified in that period by public utility rates, which reflected updates in postal services and transportation, and services not directly covered by government agreements (rents, financial services, insurance, common expenses for housing, maintenance and repair of the home).
The second group showed increases in magnitude during 2020, despite which they also increased their rate of expansion during the first four months. It includes Fresh Foods – reflecting the evolution of Beef and derivatives, Vegetables and Fruits – Medicines, Clothing and Equipment, machines and services related to health. It also applies to automobiles, where domestic supply constraints were combined with an increase in demand driven by the recovery of economic activity, in a framework in which the sector was operating at the limit of its installed capacity, together with external supply restrictions.
In the third group, after having exhibited a high rate of expansion during the previous year, they moderated their dynamism in the first months of 2021, even below the accumulated variation of the nominal exchange rate in the first quarter. This group includes products with a high imported content, such as electronics, computers and household appliances, other non-essential goods such as home textiles, jewelry, furniture and clothing, among others. This trend may be associated with less uncertainty about replacement costs compared to the stability of the gap between the nominal exchange rate and the implicit quotations in transactions for the purchase and sale of financial assets, although some supply constraints to supply the growth in demand could continue to exert upward pressure on this set of goods.
6.3. Perspectives
In the coming38 months, the evolution of the epidemiological situation could have an impact on the dynamics of inflation. Restrictions on mobility and temporary closures focused on certain activities and regions to limit the rise in infections – less far-reaching than those of the previous year – could help to mitigate the rise in the prices of some activities, especially in those services linked to leisure and transport.
The exchange rate policy will help to remove additional pressures on the rate of rise in the prices of goods, which are more closely linked to the evolution of the exchange rate. Private services, which are more labour-intensive, would be more closely linked to the evolution of wages.
For their part, public service rates would increase in the year below what was initially expected, helping to take pressure off the pace of domestic price increases, as they are below the inflationary guideline for December 2021 set in the 2021 National Budget Law. In the coming months, the decision to update the reference prices of wholesale energy by the National Electricity Regulatory Entity (ENRE, Resolution 79/2021) for large users who acquire energy services from distribution companies could affect the costs of companies, which would seek to transfer these increases to the retail price lists to recompose marketing margins.
On the other hand, international commodity prices could continue to exert pressure on the price formation process at the local level, in a scenario of extraordinary global liquidity characterized by a lower relative strength of the dollar against the main emerging currencies and significant changes in the relative prices of raw materials, inputs and final goods.
The continuity of government price programs and agreements aimed at setting reference prices for a set of basic necessities would continue to help align expectations and preserve the purchasing power of wages. Along these lines, the National Government’s initiative to convene different business sectors to face broad and flexible sectoral price agreements aims to break the upward inertia of some groups of goods that showed great dynamism since the beginning of the mobility restriction measures. In this sense, the recent price agreements for the marketing of household appliances and electronic items provide for prices to be brought back to the levels of April 1 for six months until October 31, with the possibility of incorporating quarterly review clauses depending on the behavior of some variables such as the exchange rate. which directly impacts the cost structure of manufacturers. The extension of these sectoral agreements to other items would help to contain the rise in prices and guarantee the normal supply of products.
In the coming months, without the influence of those factors that temporarily exerted pressure on the price formation process, inflation is expected to begin a process of gradual and sustained decline. The BCRA will contribute to consolidating this process based on a prudent management of monetary policy. Within the framework of the managed floating strategy, the BCRA will continue to adapt the rate of change in the exchange rate to the needs arising from the situation in order to alleviate tensions and preserve monetary and external balances (see Chapter 7. Monetary Policy).
7. Monetary Policy
The COVID-19 pandemic was an unprecedented shock, which found the Argentine economy in an emergency situation, without access to credit markets and with very limited room for countercyclical policy. In this context, the National Government and the BCRA used all available instruments to design a response strategy to the pandemic that would contribute to containing the impact of the crisis on the living conditions of society. After the initial phase of the COVID-19 cycle, the domestic economy entered a phase of gradual recovery, which was accompanied by the successful restructuring of public debt in foreign currency with private holders and the reconstruction of the peso debt market. The recomposition of private sector revenues during this period made it possible to reduce the assistance efforts of the National Government and the BCRA, moving to a scheme of greater targeting of these policies.
During the first quarter of the year, payment methods continued to moderate their growth rate. In part, this dynamic was explained by the greater demand for savings instruments in pesos, whose year-on-year growth rate at constant prices remained at historically high levels. Meanwhile, in a context in which the real exchange rate was above its historical average, the pace of adjustment of the nominal exchange rate was adapted with the aim of contributing to the slowdown in domestic prices.
The second wave of COVID-19 and its potential impact on the performance of the economy generate a panorama of uncertainty for the coming months. The progress of the vaccination of the population and a more prepared health infrastructure will contribute to attenuating the economic effects of the pandemic. In this context, the BCRA will carry out a monetary policy that, in addition to preserving monetary and financial stability, will lay the foundations for a path of economic development with social equity. To this end, it will continue to sterilize any monetary surpluses and manage the exchange rate in order to contain inflationary pressures, preserve external balance, and promote productive development.
7.1. Monetary policy approach continued to be adapted to economic conditions
The COVID-19 pandemic was an unprecedented shock, which found the Argentine economy in an emergency situation, without access to credit markets and with very limited space for countercyclical policy. In this context, the National Government and the BCRA used all available instruments to design a response strategy to the pandemic that would contribute to containing the impact of the crisis.
This joint and extraordinary action was similar to that observed in other countries, where both governments and central banks designed stimulus policies. In this sense, fiscal measures to sustain economic activity, together with the negative impact of the crisis on tax revenues and the increase in some expenditures (such as social programs) led to a sharp increase in the fiscal deficit (see Chapter 5. Public Finance).
The financial support to the National Treasury and the consequent sterilization of surplus liquidity generated a nominal increase in the balance of the BCRA’s remunerated liabilities. The dynamics of this growth accompanied the process of gradual normalization of the economy. In fact, when considering the stock of BCRA instruments as a percentage of GDP, an increase is observed until mid-2020 and a gradual subsequent reduction, always registering levels below the maximums reached during 2017-18. If remunerated liabilities are measured in dollars, it can be seen that, although they grew in 2020, they represent approximately half of the maximum level reached between 2017 and 2018 (see Figure 7.1).
Figure 7.1 |
(a) Interest-bearing liabilities of the BCRA
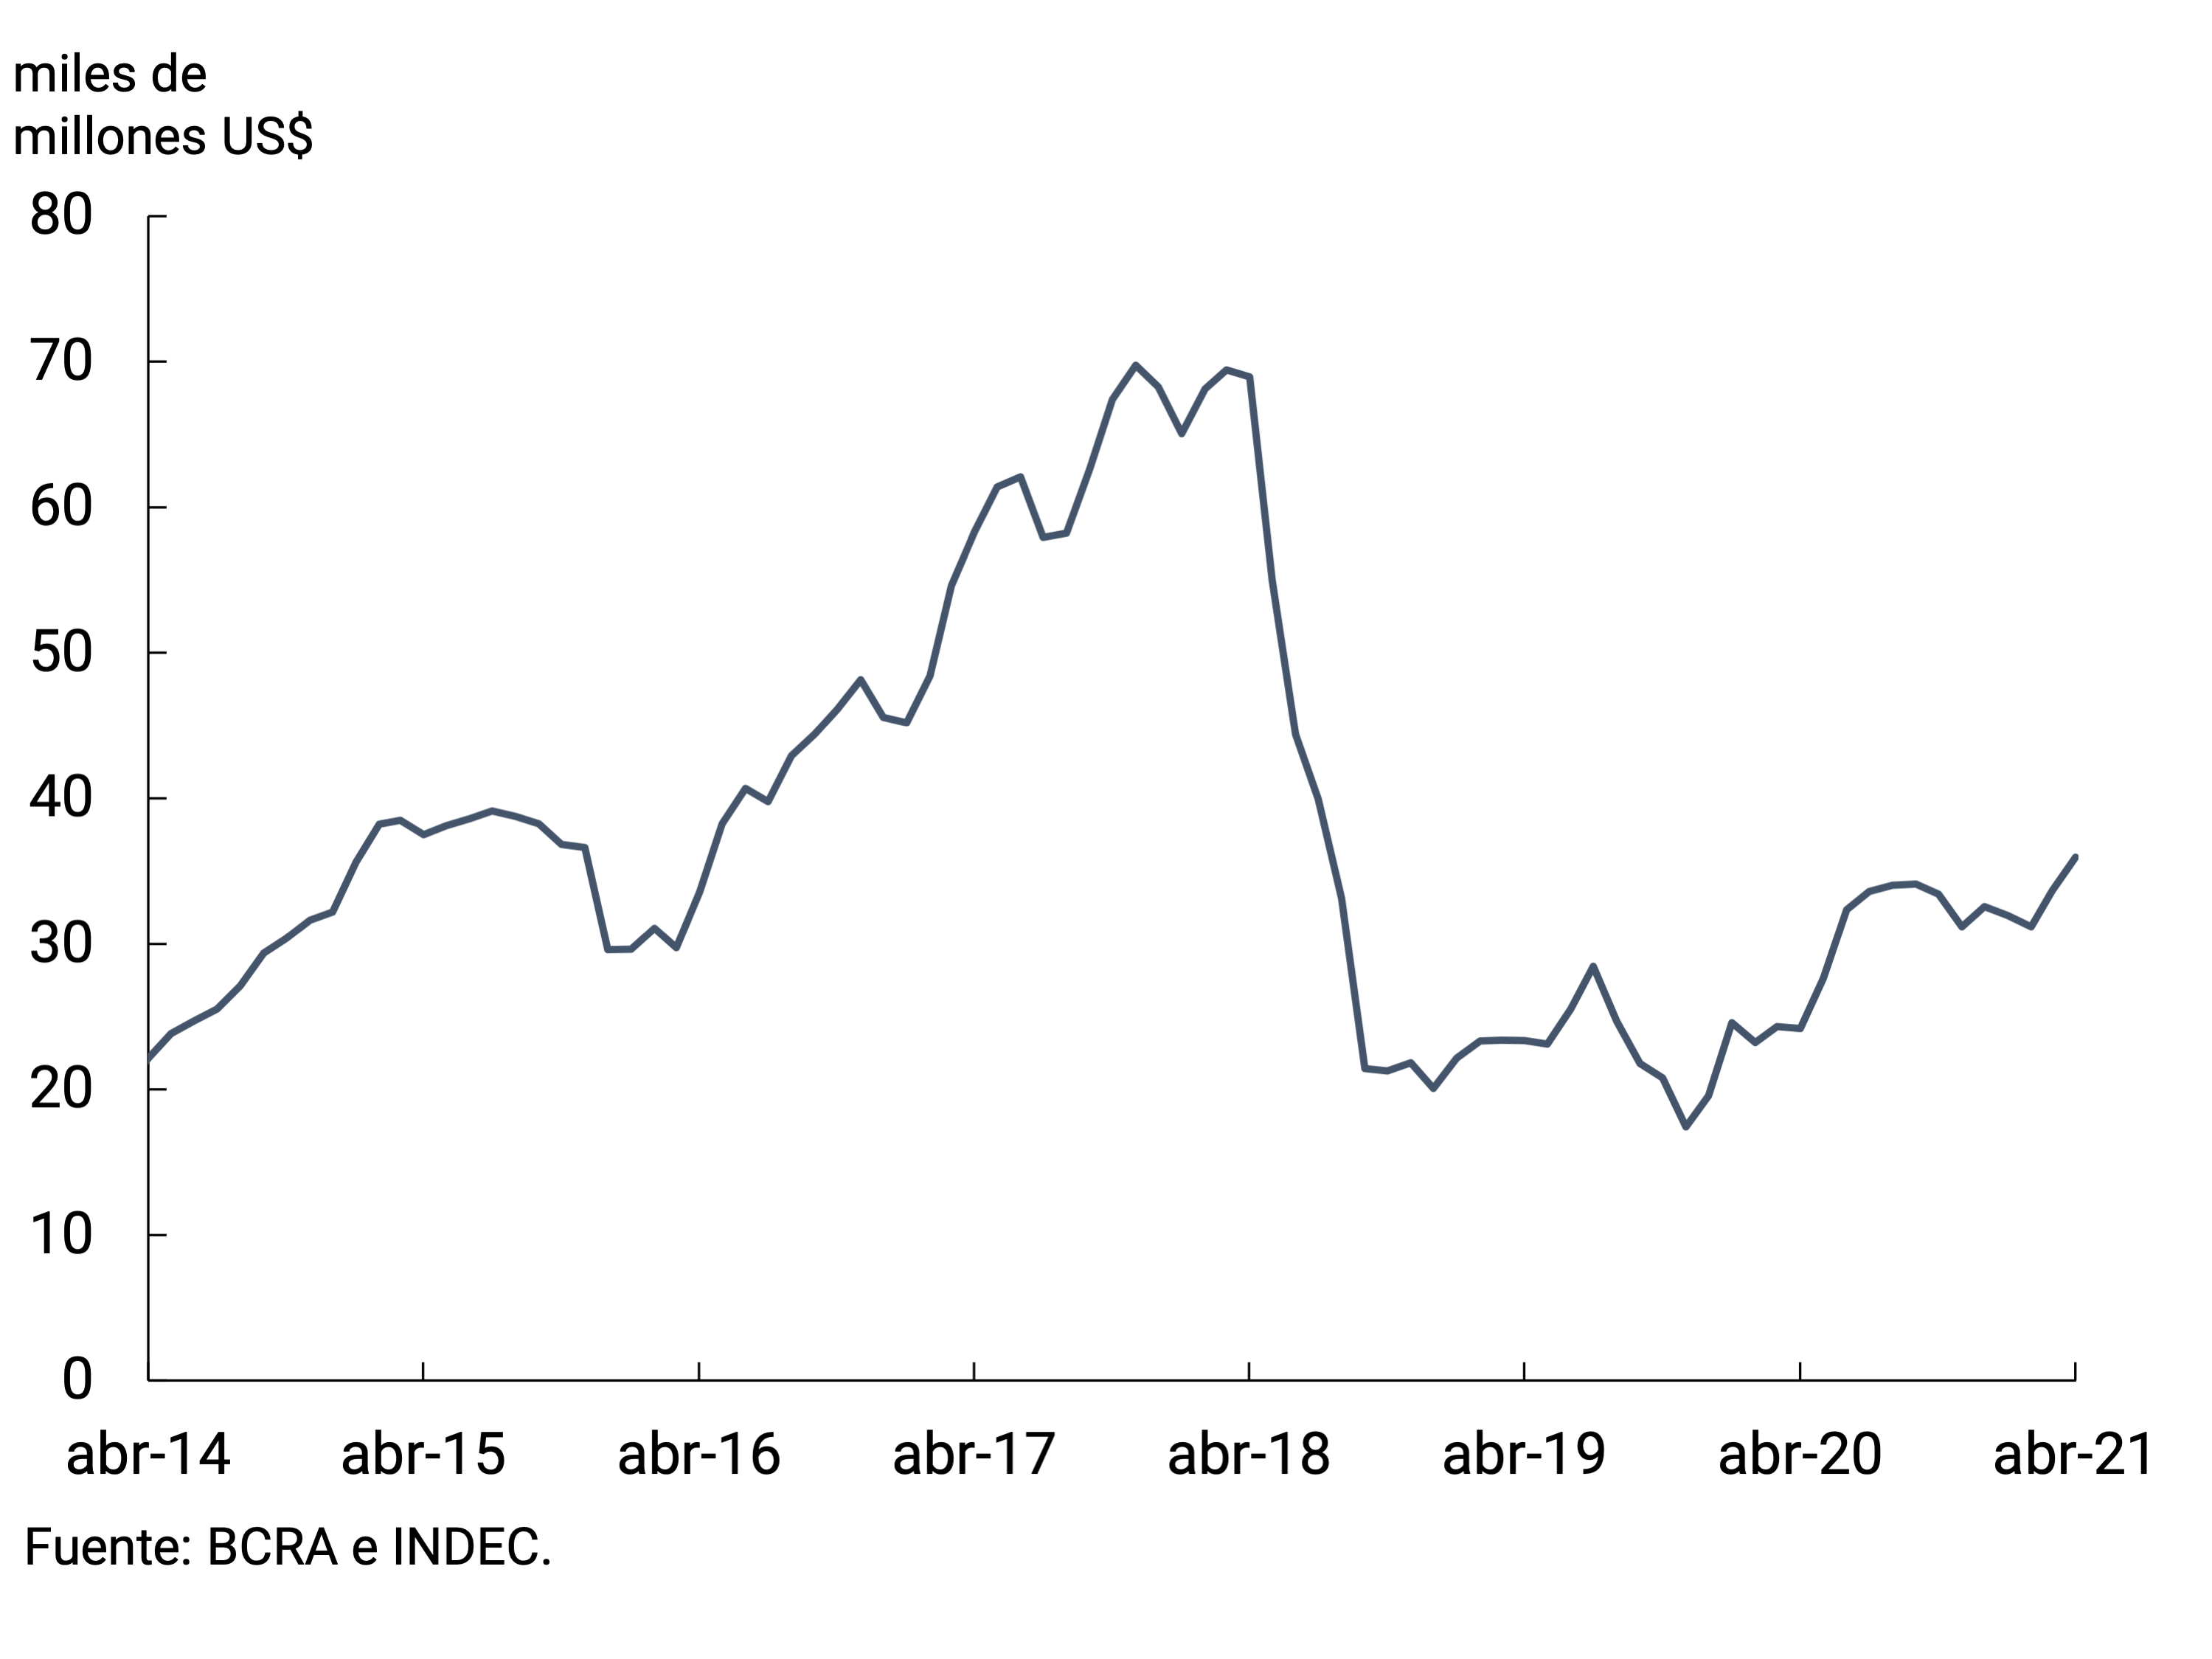
(b) Contribution to year-on-year growth by component
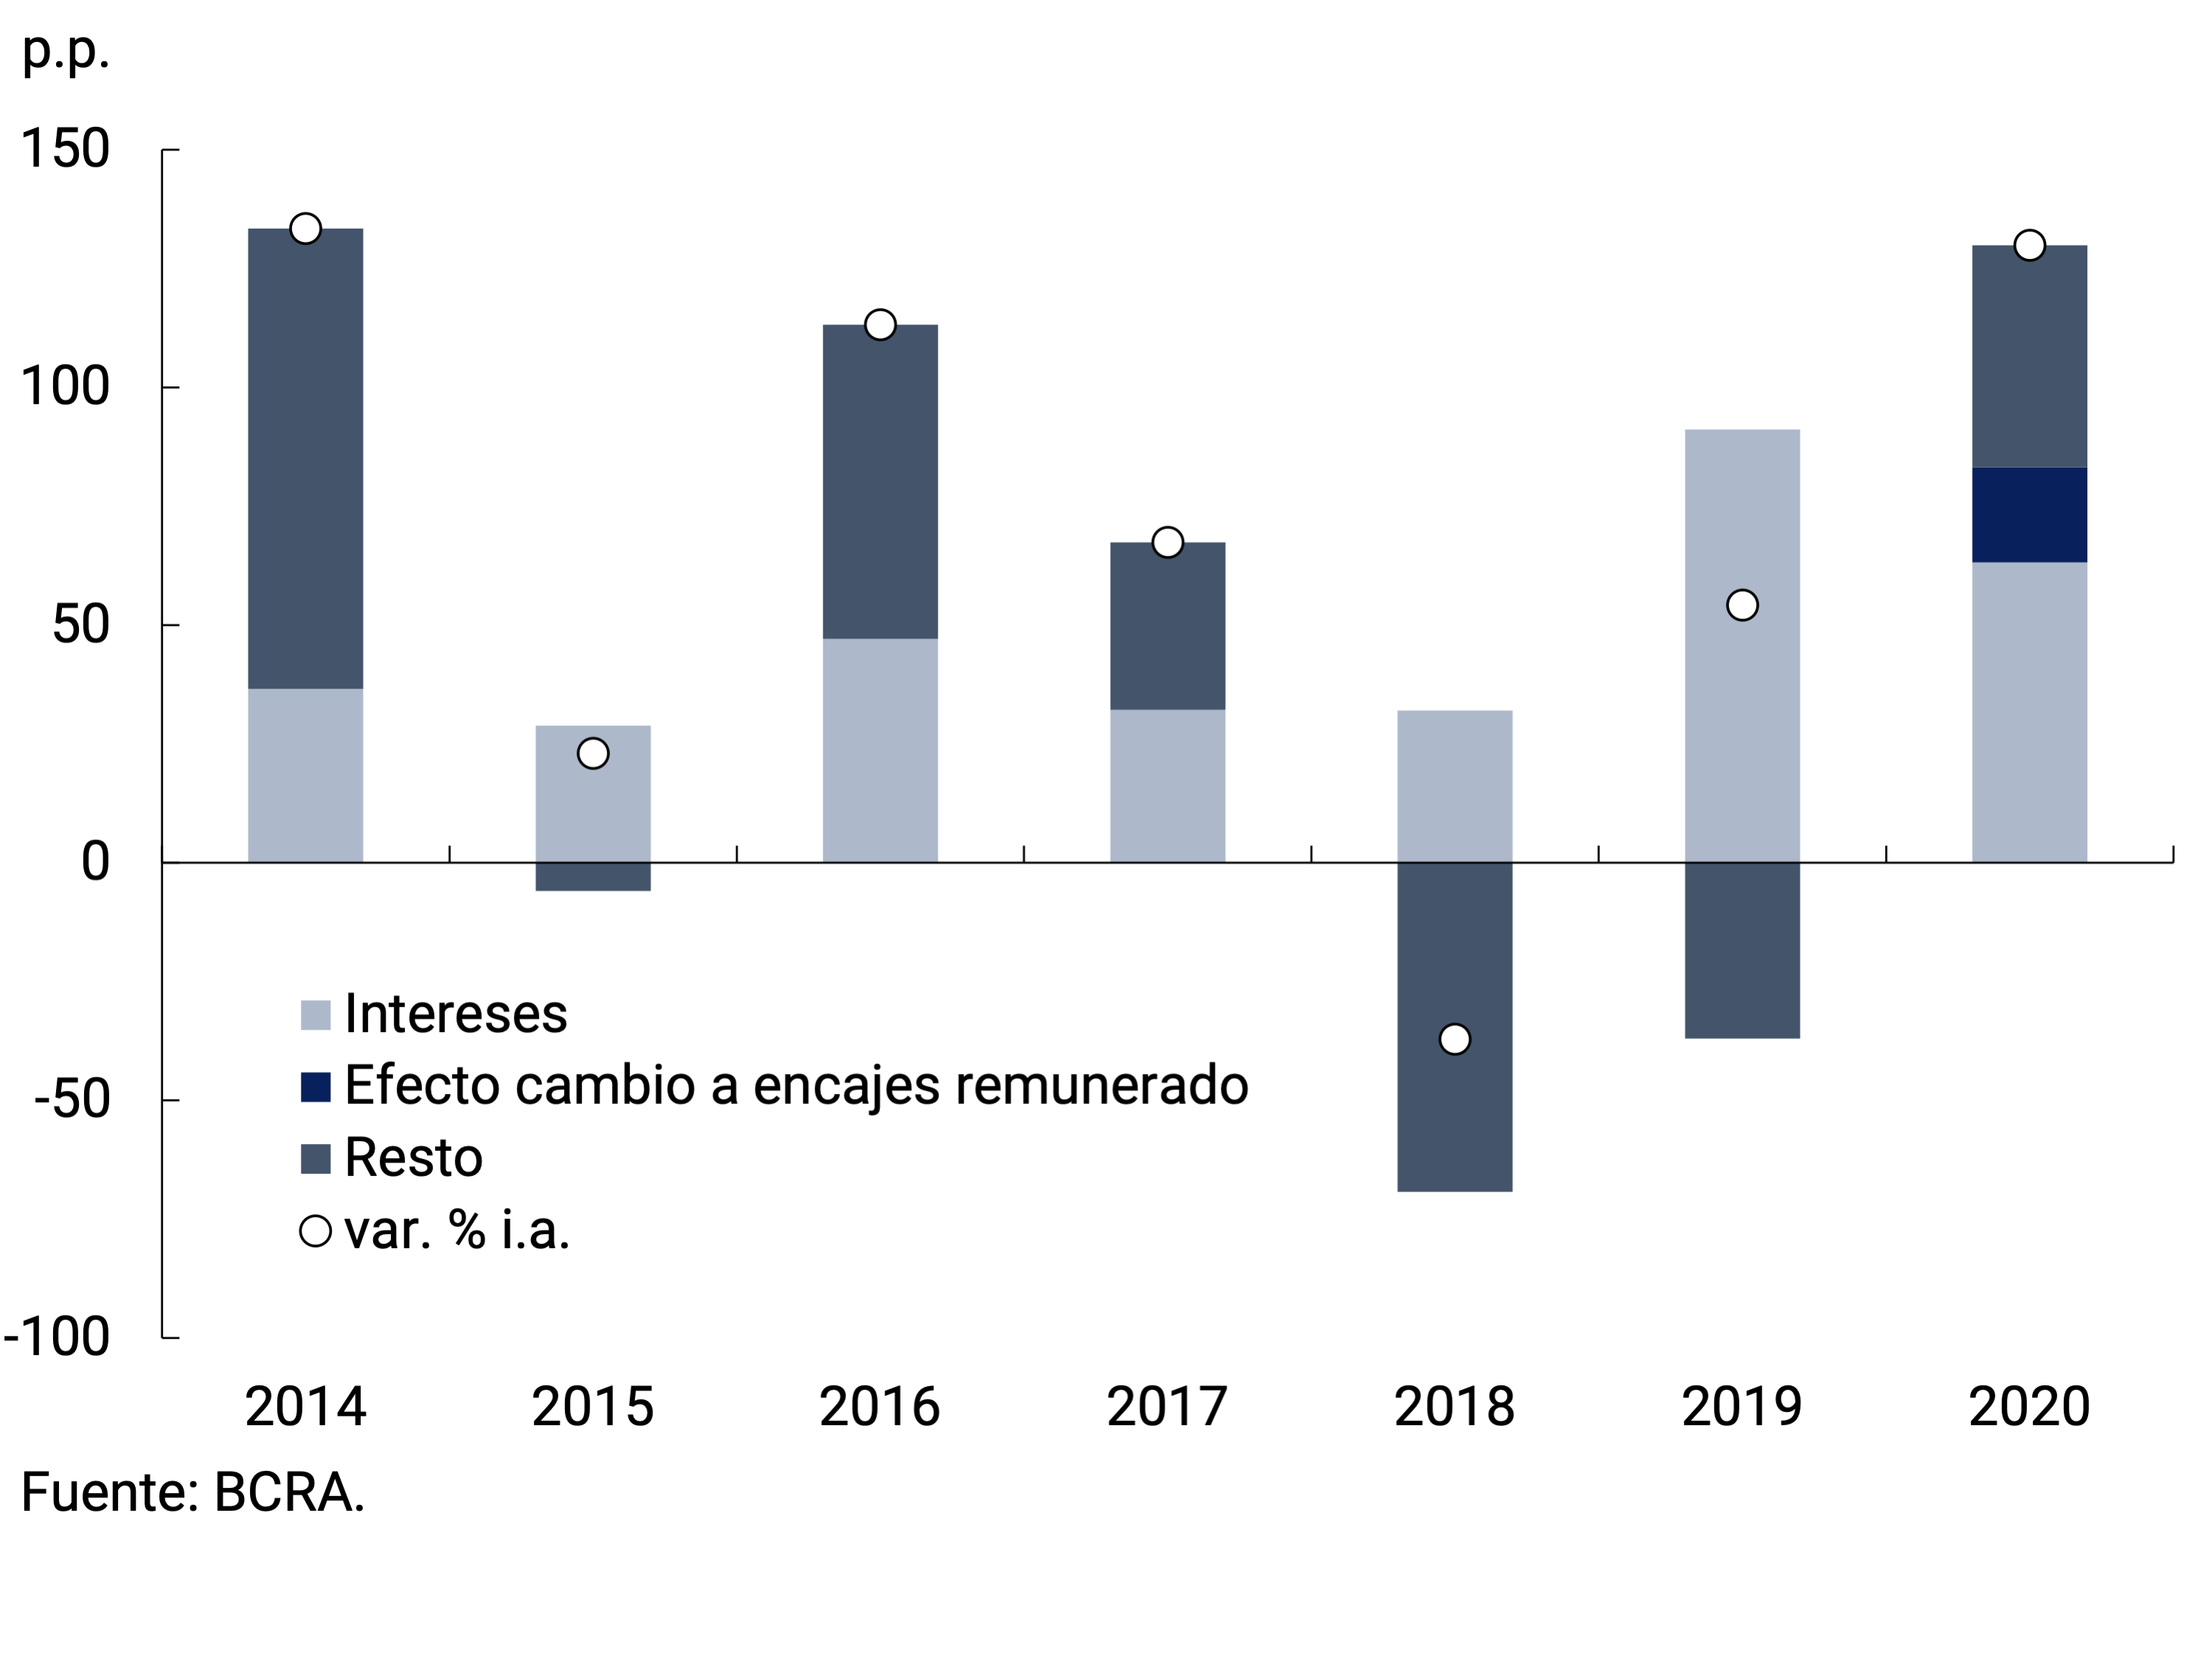
The contribution to the growth of the BCRA’s interest-bearing liabilities associated with the payment of interest on these instruments in 2020 was lower than that of the previous year. This lower relative weight is linked to the process of adjustment of the interest rates of the BCRA’s instruments since the end of 2019. An additional element that contributed to the increase in the balance of the BCRA’s interest-bearing liabilities was the change in the reserve requirement scheme of May and June 2020. The BCRA allowed all the reserve requirements corresponding to fixed-term deposits to be integrated into LELIQ, changing from a non-interest-bearing reserve to a remunerated one.
The greater dynamism of economic activity recorded since the middle of last year allowed a progressive focus of efforts to assist the private sector. The results of these policies continued to be reflected in the evolution during the first four months of the monetary aggregates, credit and the foreign exchange market. In the following sections, an analysis of the evolution of these variables is carried out.
7.1.1. In the first part of 2021, the moderation in the pace of expansion of monetary aggregates continued
The recovery in economic activity and the sustained improvement in private sector revenues reduced the need for extraordinary fiscal assistance and allowed, among other factors, to improve the dynamics of the public accounts. So far this year, assistance measures to the private sector in the context of the pandemic have focused on the Metropolitan Area of Buenos Aires, which contrasted with the massive assistance provided during 2020. Tax collection continued to strengthen in the same period, based on the contribution of taxes related to foreign trade and the sustained recovery of taxes linked to domestic economic activity. Likewise, the regulatory modifications on taxes provided for in the Social Solidarity and Productive Reactivation Law of the end of 2019 and in the 2021 National Budget Law continued to have a positive impact on public revenues (see Chapter 5. Public Finance).
At the same time, the reconstruction of the peso debt market allowed to continue channeling a proportion of financing needs through the market. Thus, the National Treasury achieved positive net financing of about $149,000 million so far this year, of which $90,550 million correspond to the first quarter and the rest to Apr-21. All this made it possible to reduce the BCRA’s financial assistance to the National Treasury since the end of 2020. Thus, in the first quarter of 2021 there was a limited and balanced variation in the factors of the monetary base, a dynamic that was maintained so far in the second quarter. Specifically, with regard to financial assistance to the National Treasury, it is in line with the records of previous years in terms of GDP, excluding the first year of the pandemic (see Figure 7.2).
Figure 7.2 |
(a) Factors of expansion of the monetary base
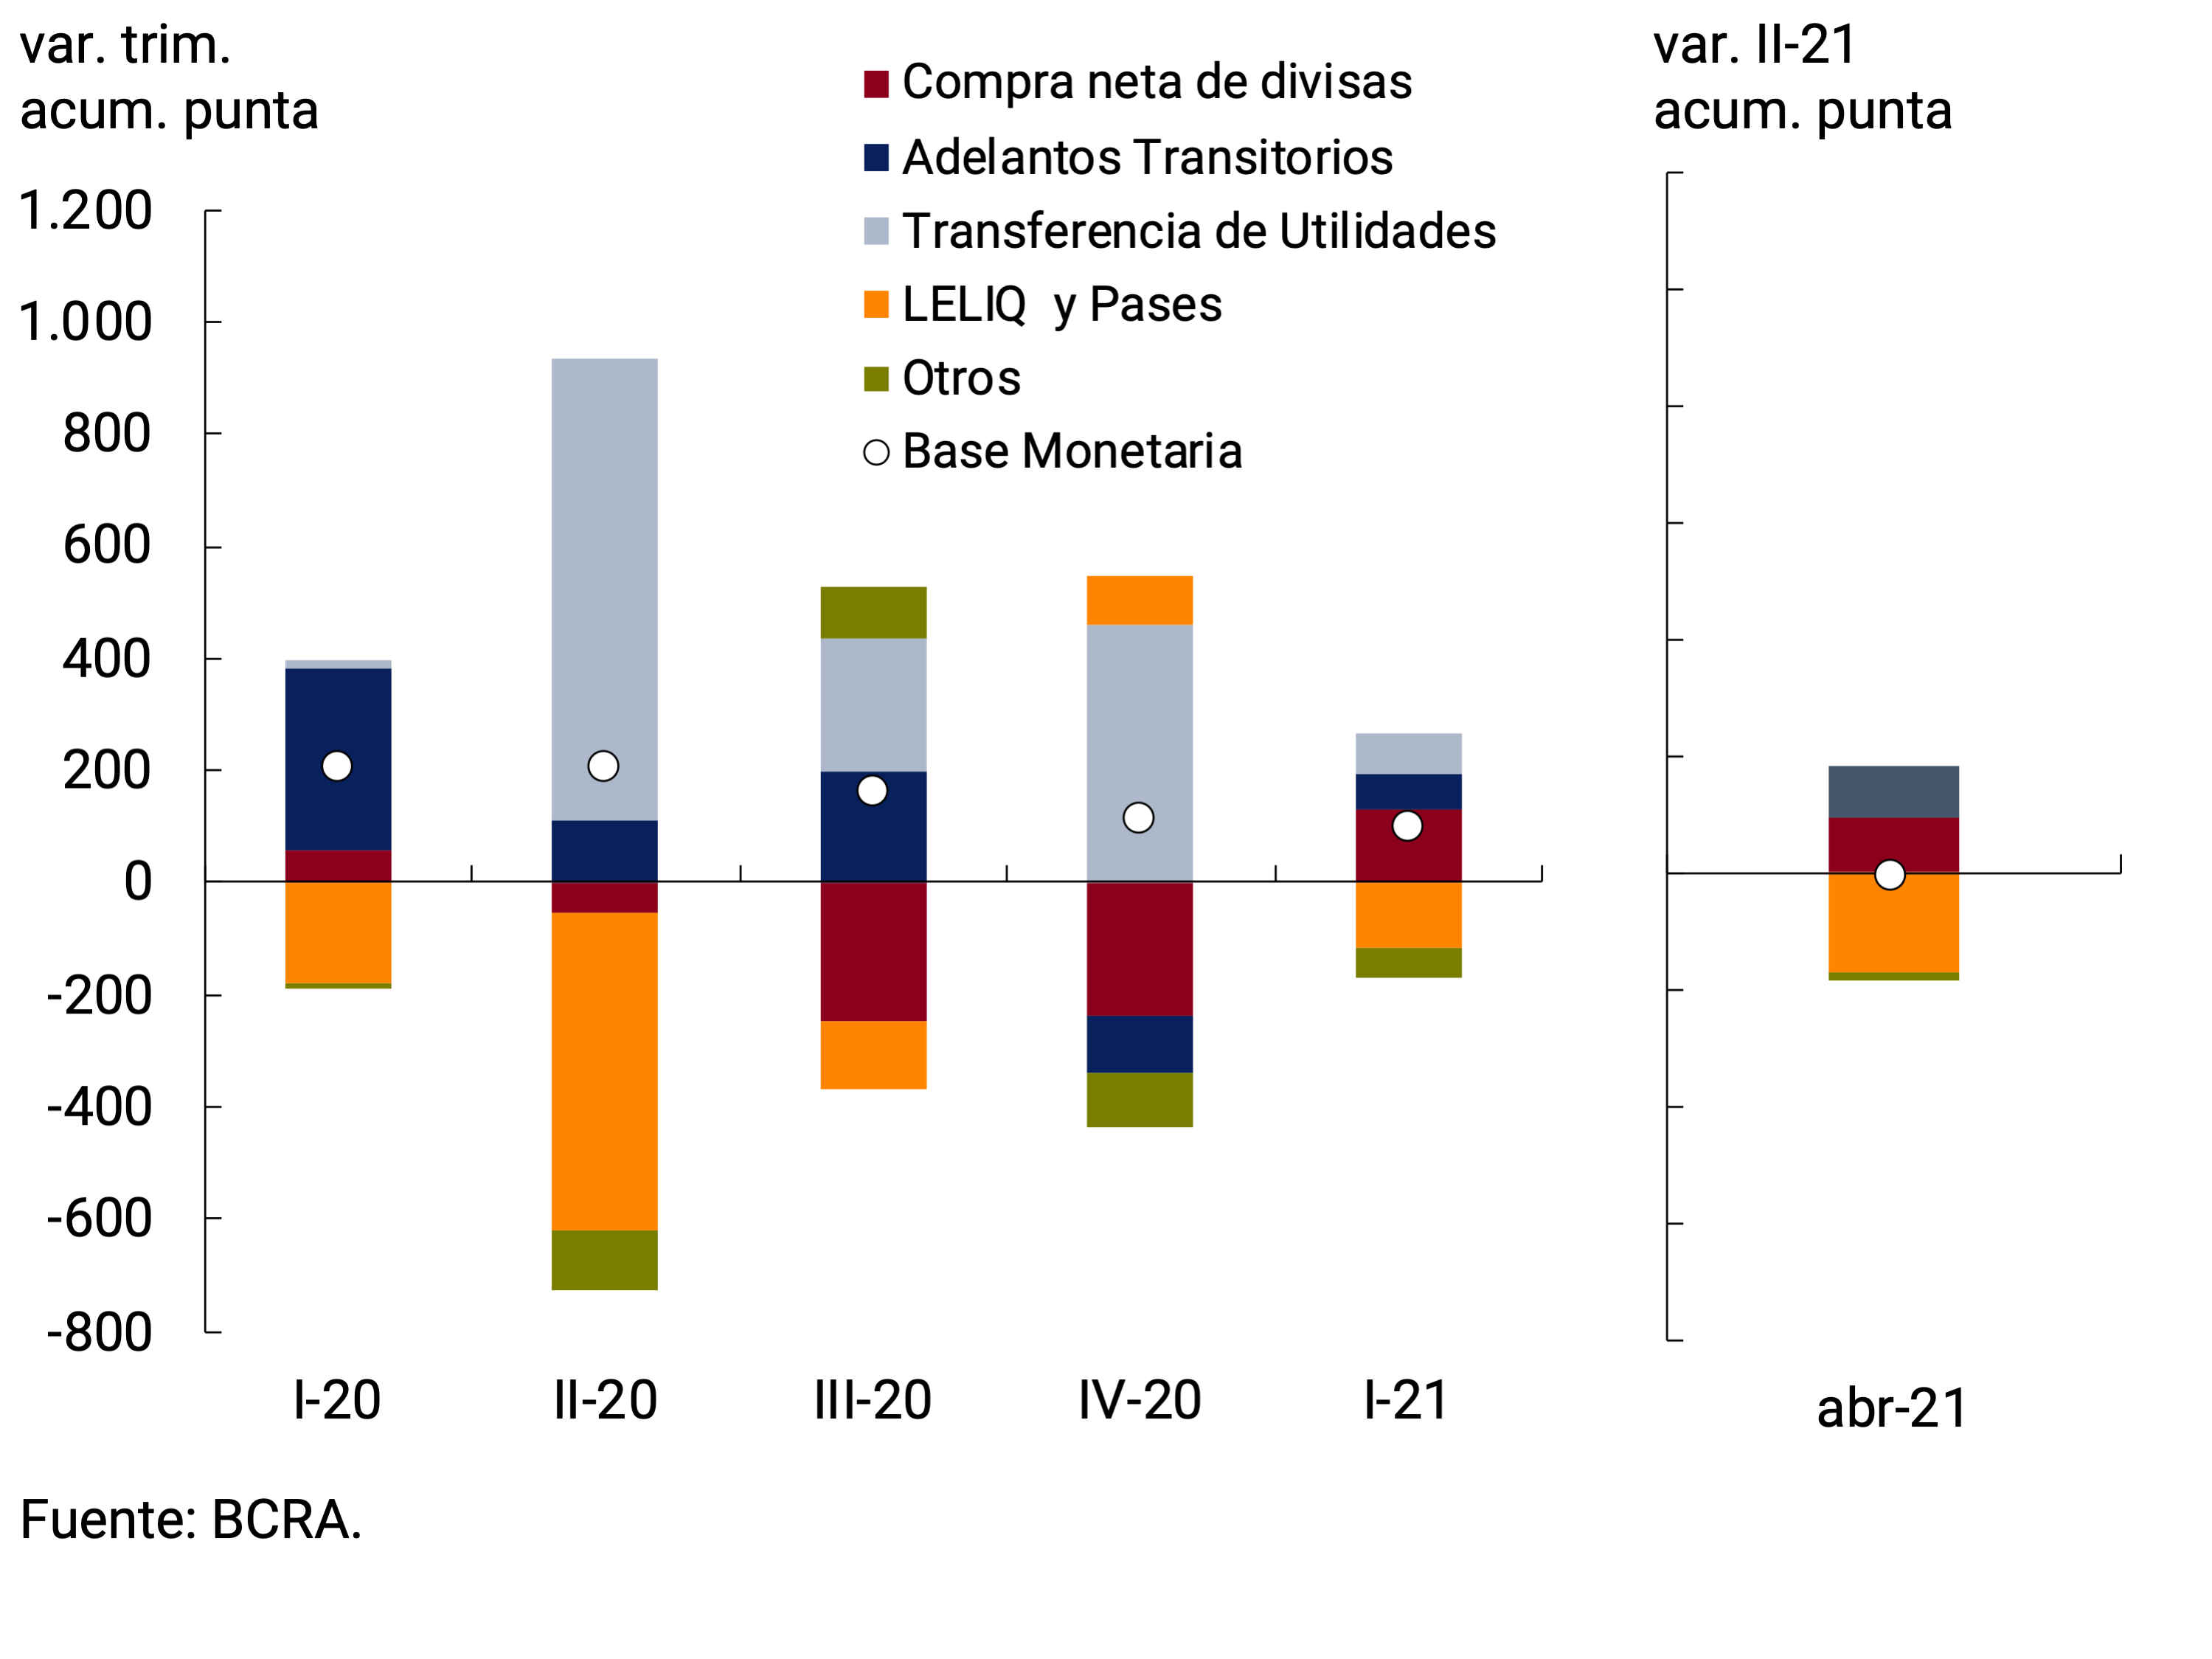
(b) Financing to the National Treasury (acum. April of each year)
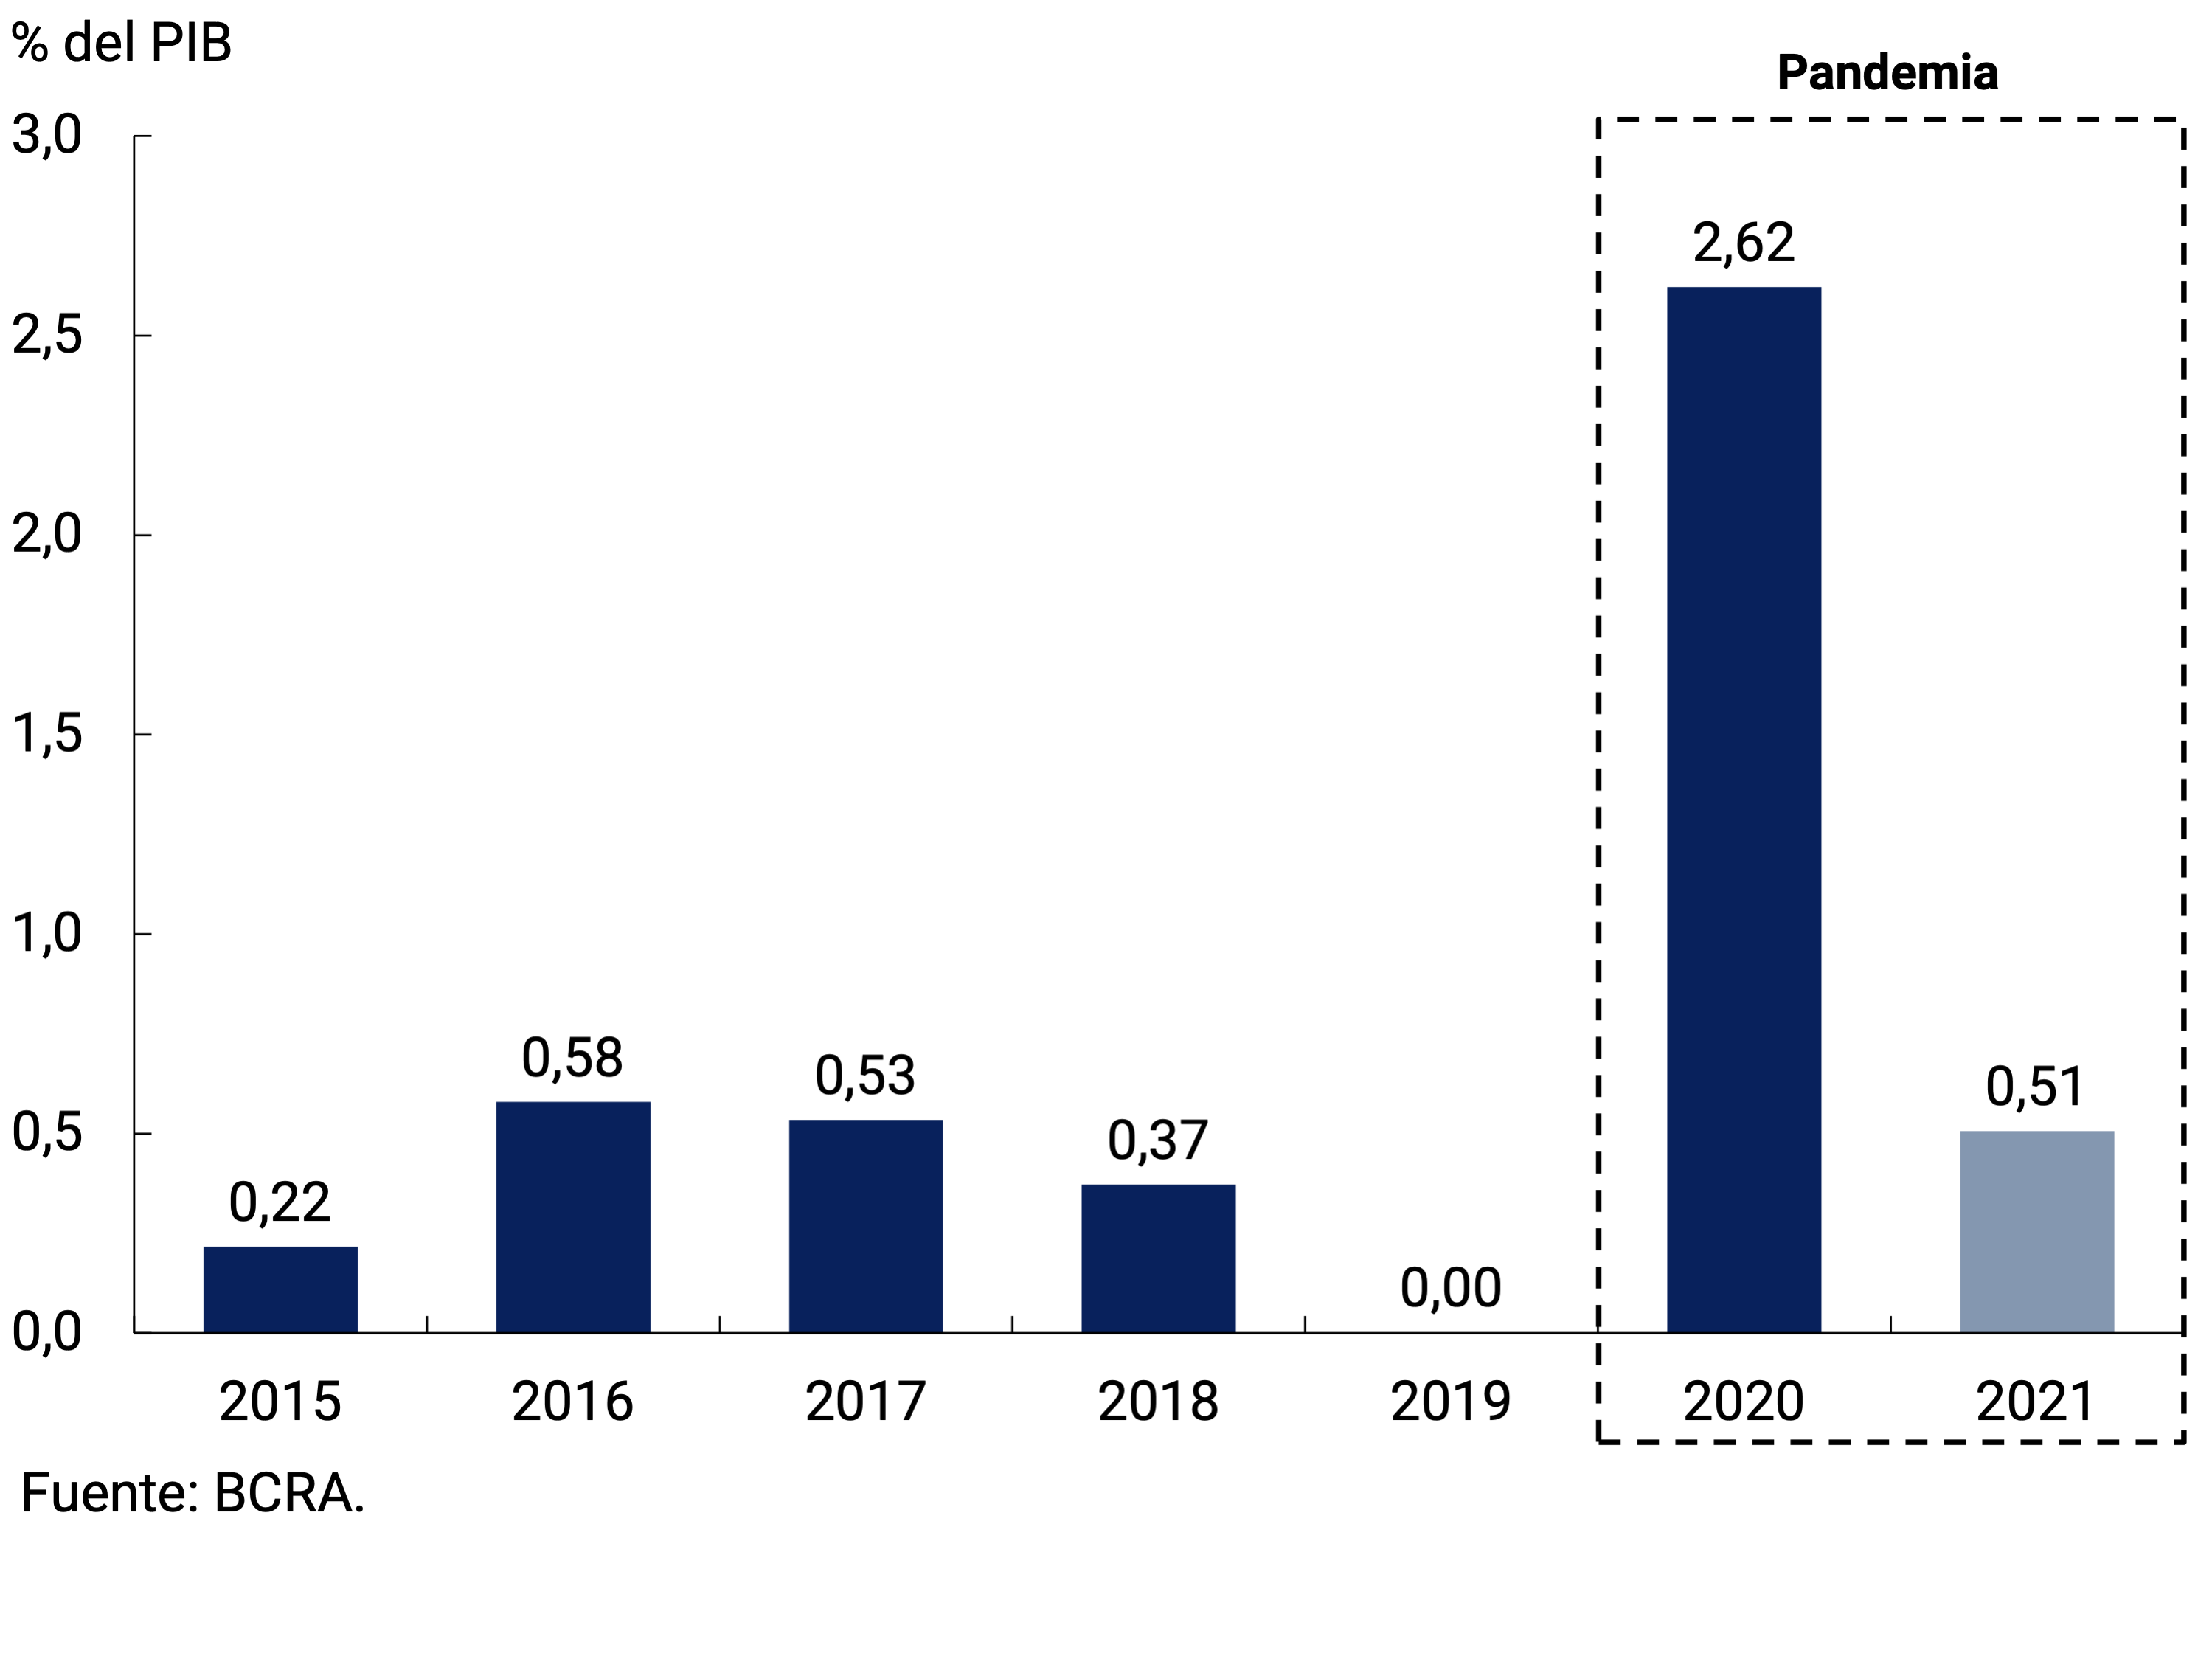
The moderation of monetary policy allowed monetary aggregates to continue with the convergence process. Thus, in the first four months of 2021, the means of payment measured through private M2 registered an average monthly expansion rate of 1.9% nominal and without seasonality (s.e.), which implied a real contraction of 2.3%. With regard to the composition of the growth of means of payment at current prices, practically all the impetus came from demand deposits, since the working capital held by the public remained almost unchanged.
Box. Evolution of Monetary Aggregates in terms of GDP
The moderation in the growth of monetary aggregates in a context of recovery in economic activity led to a fall in the ratios to GDP. Thus, private M2 showed a moderation of almost 5 p.p. from the maximum value recorded in June 2020, to 11.1% of GDP in April. The strong growth in the first part of 2020 was explained both by the expansion of the aggregate in nominal terms (which was concentrated between April and May) and by the fall in Output. Subsequently, the normalization of economic activity gradually offset the nominal expansion of aggregates (see Figure 7.3).
As for the components, demand deposits, which were the ones that verified the greatest expansion during the pandemic, in April were positioned below the average record of recent decades. The fall in the ratio of demand deposits to GDP was more moderate than that presented by the working capital held by the public. Cash holdings in the non-financial private sector prior to the pandemic were at historic lows, a behavior that was explained, among other things, by the growth in the use of digital means of payment that operate with demand accounts. However, during the period of Social, Preventive and Mandatory Isolation (ASPO) the transfers of social allowances had an impact on the dynamics of the circulating currency held by the public, since these payments were made to sectors that make a greater demand for cash and a significant part of these funds are quickly withdrawn from banks. The greater demand in local businesses that are characterized by a more intensive use of cash also played a role. After the period of greater restrictions on mobility, the demand for working capital adjusted to pre-pandemic levels and currently reaches values very close to historical minimums. This trend observed in recent months could be temporarily reversed in the short term by the payment of ANSES bonuses to the most vulnerable sectors, due to the new restrictions on mobility.
Figure 7.3 |
(a) Private M2 as a percentage of GDP
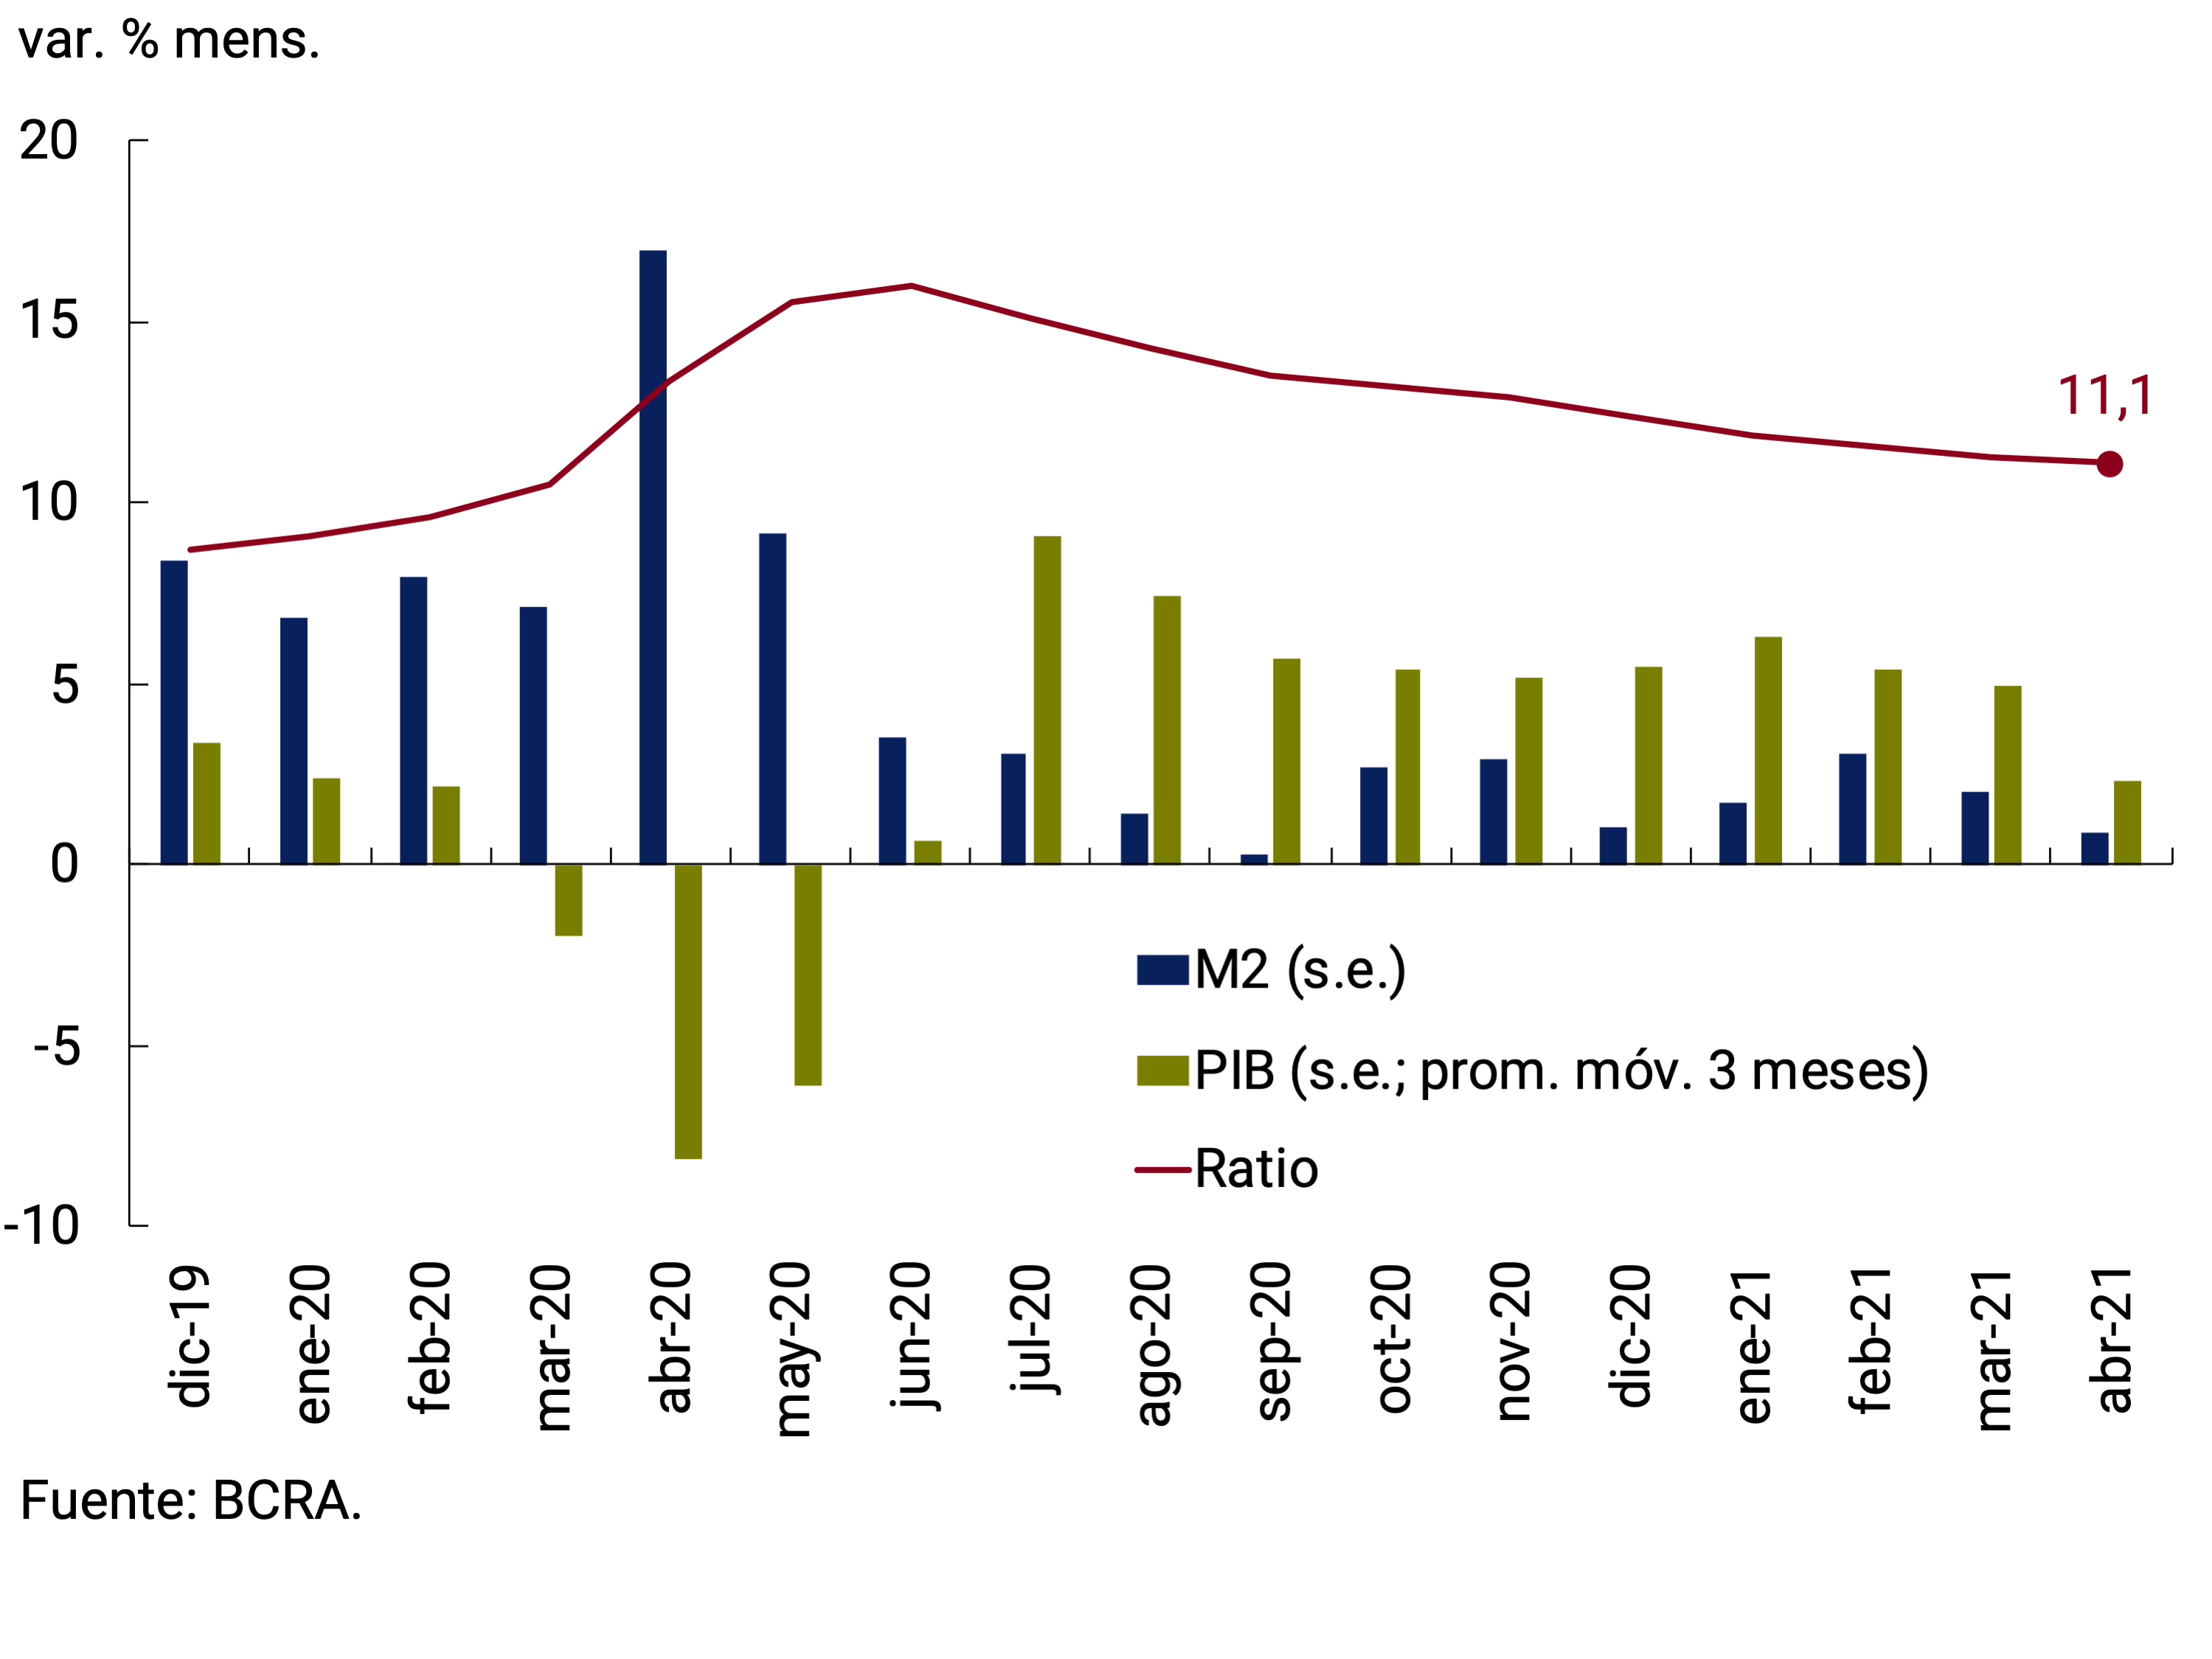
(b) Aggregates as a percentage of GDP
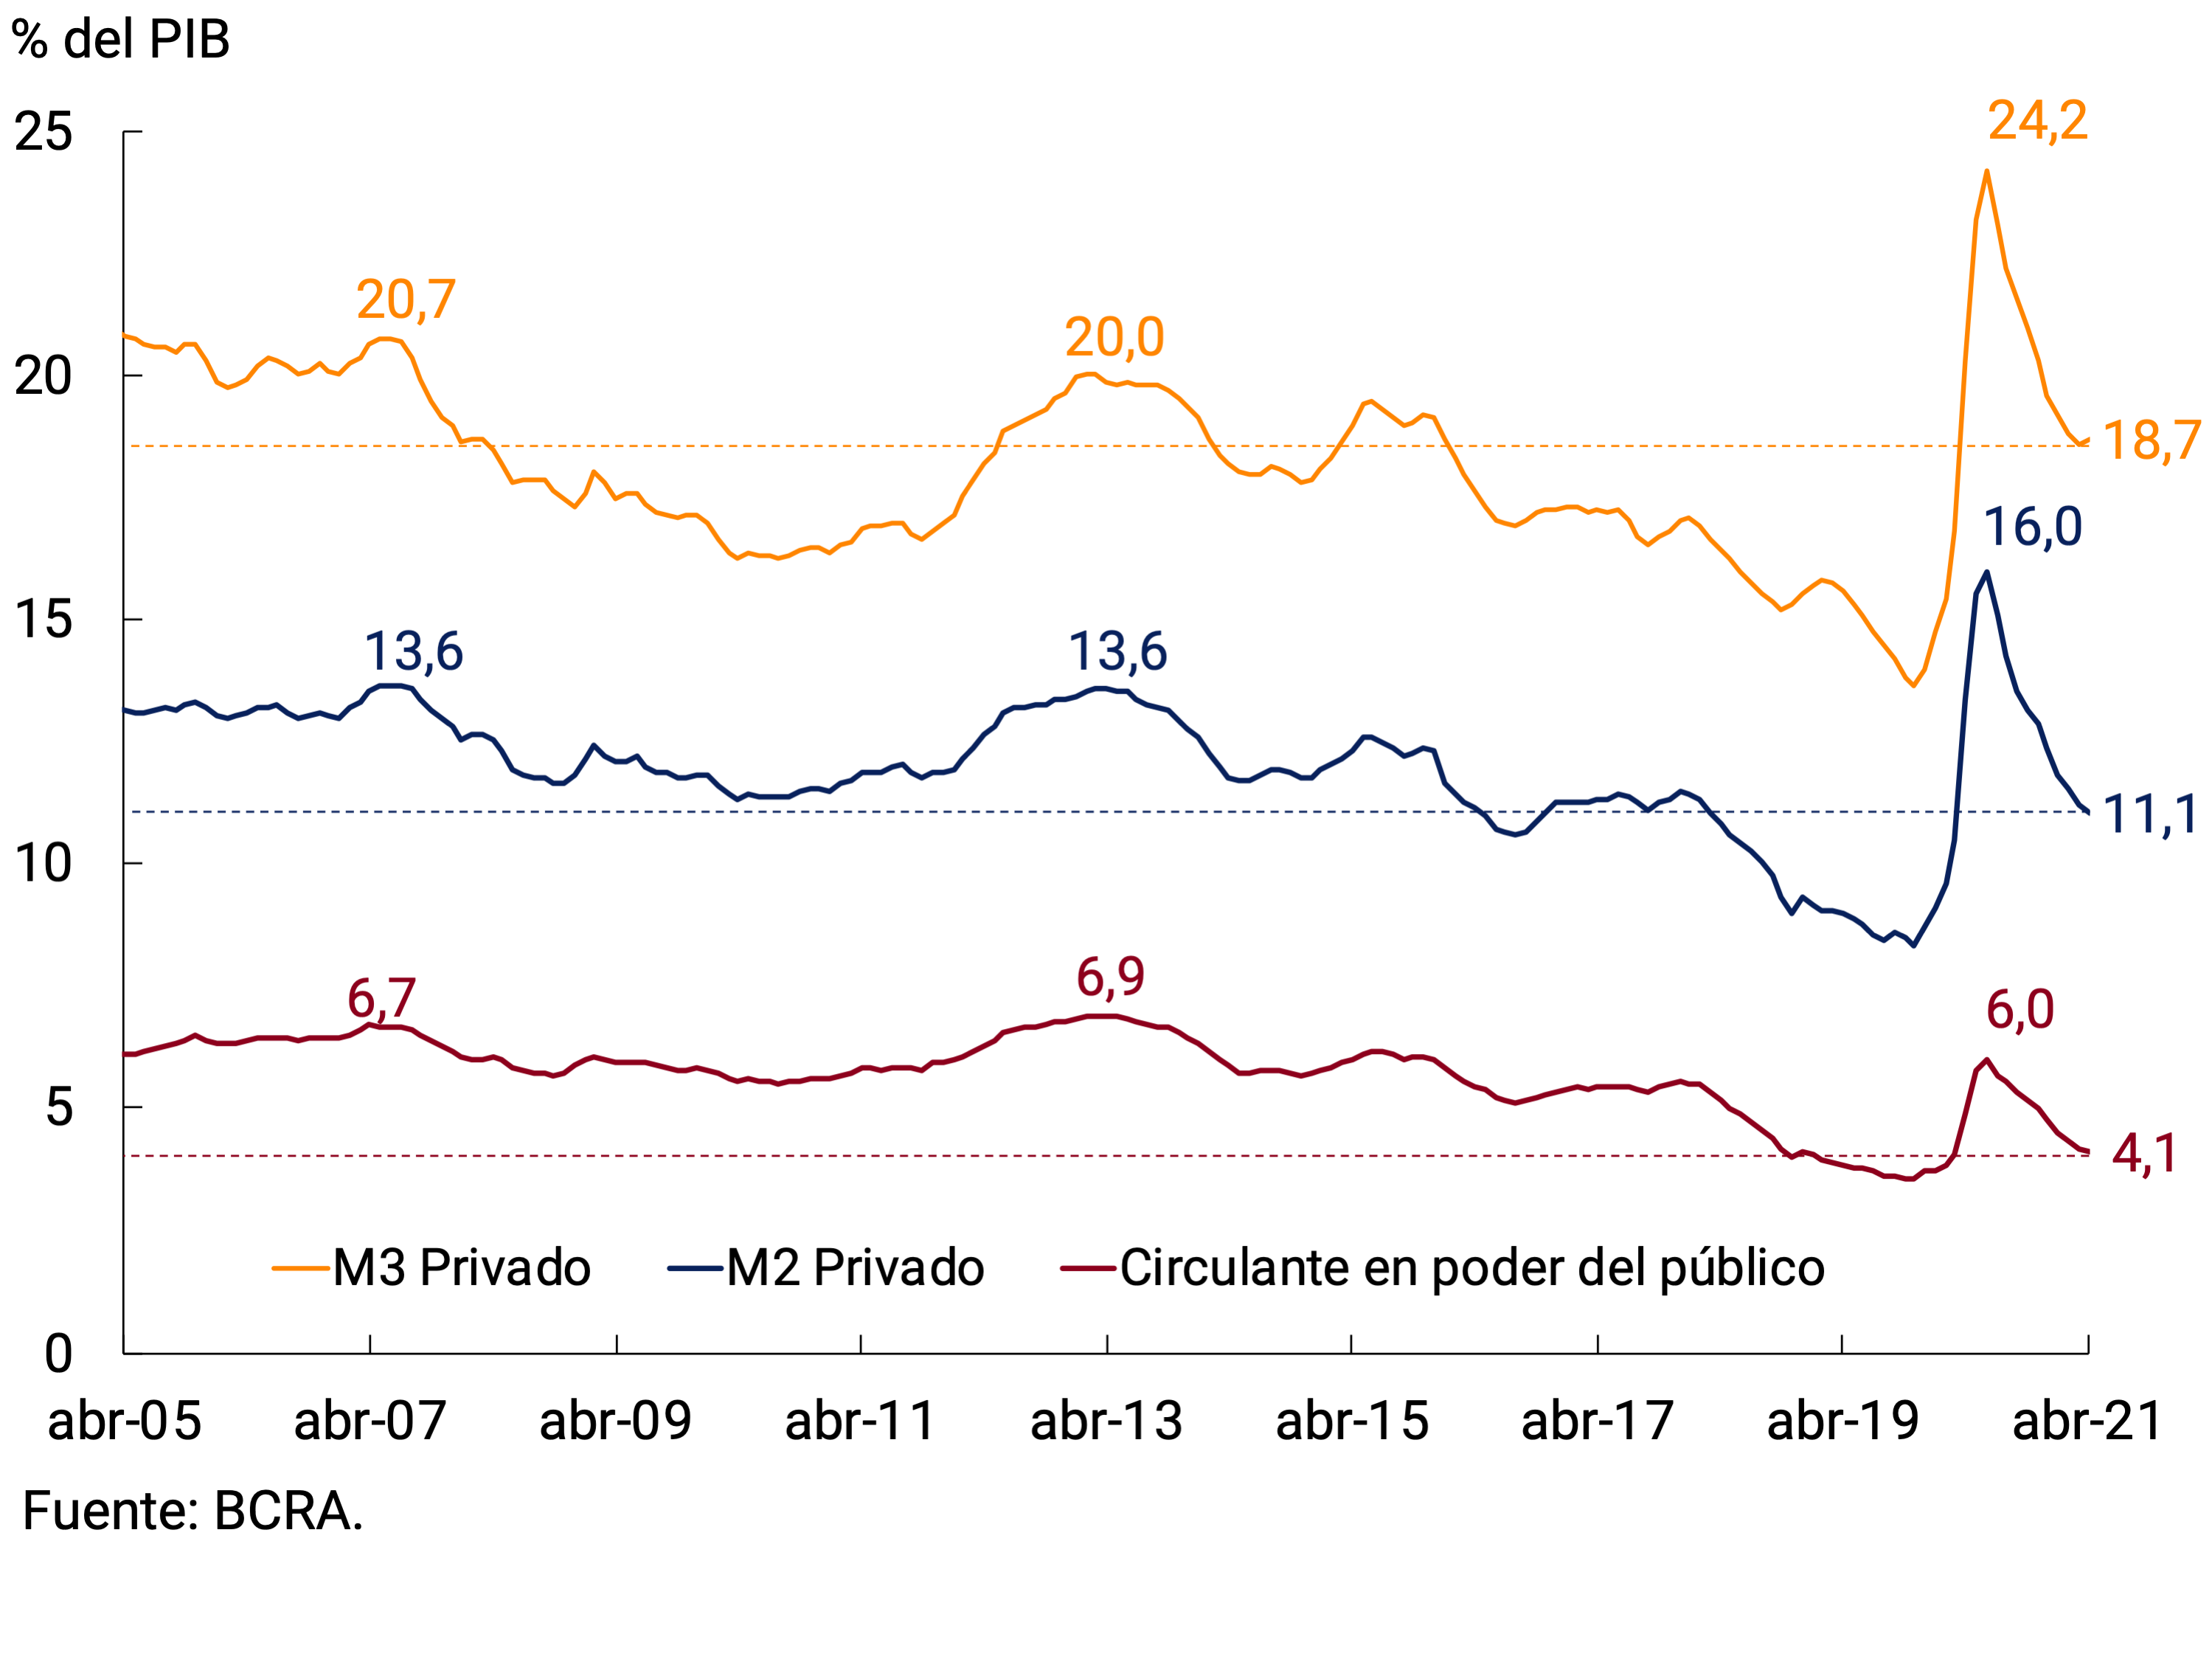
7.1.2. Savings instruments in local currency continued to grow in real terms
Another factor that contributed to the low dynamism of the means of payment was the demand for savings instruments denominated in pesos. Indeed, when we analyze private M3, a broad monetary aggregate, it sustained an average monthly expansion rate of close to 3.5% during the first four months of the year, which implied a slight fall at constant prices. In terms of its components, time deposits continued to grow at a faster pace, which was reflected in a significant and sustained increase in their relative share (to the detriment of means of payment) since the middle of last year (see Figure 7.4a)
Figure 7.4 |
(a) Private M3 without seasonality at constant prices
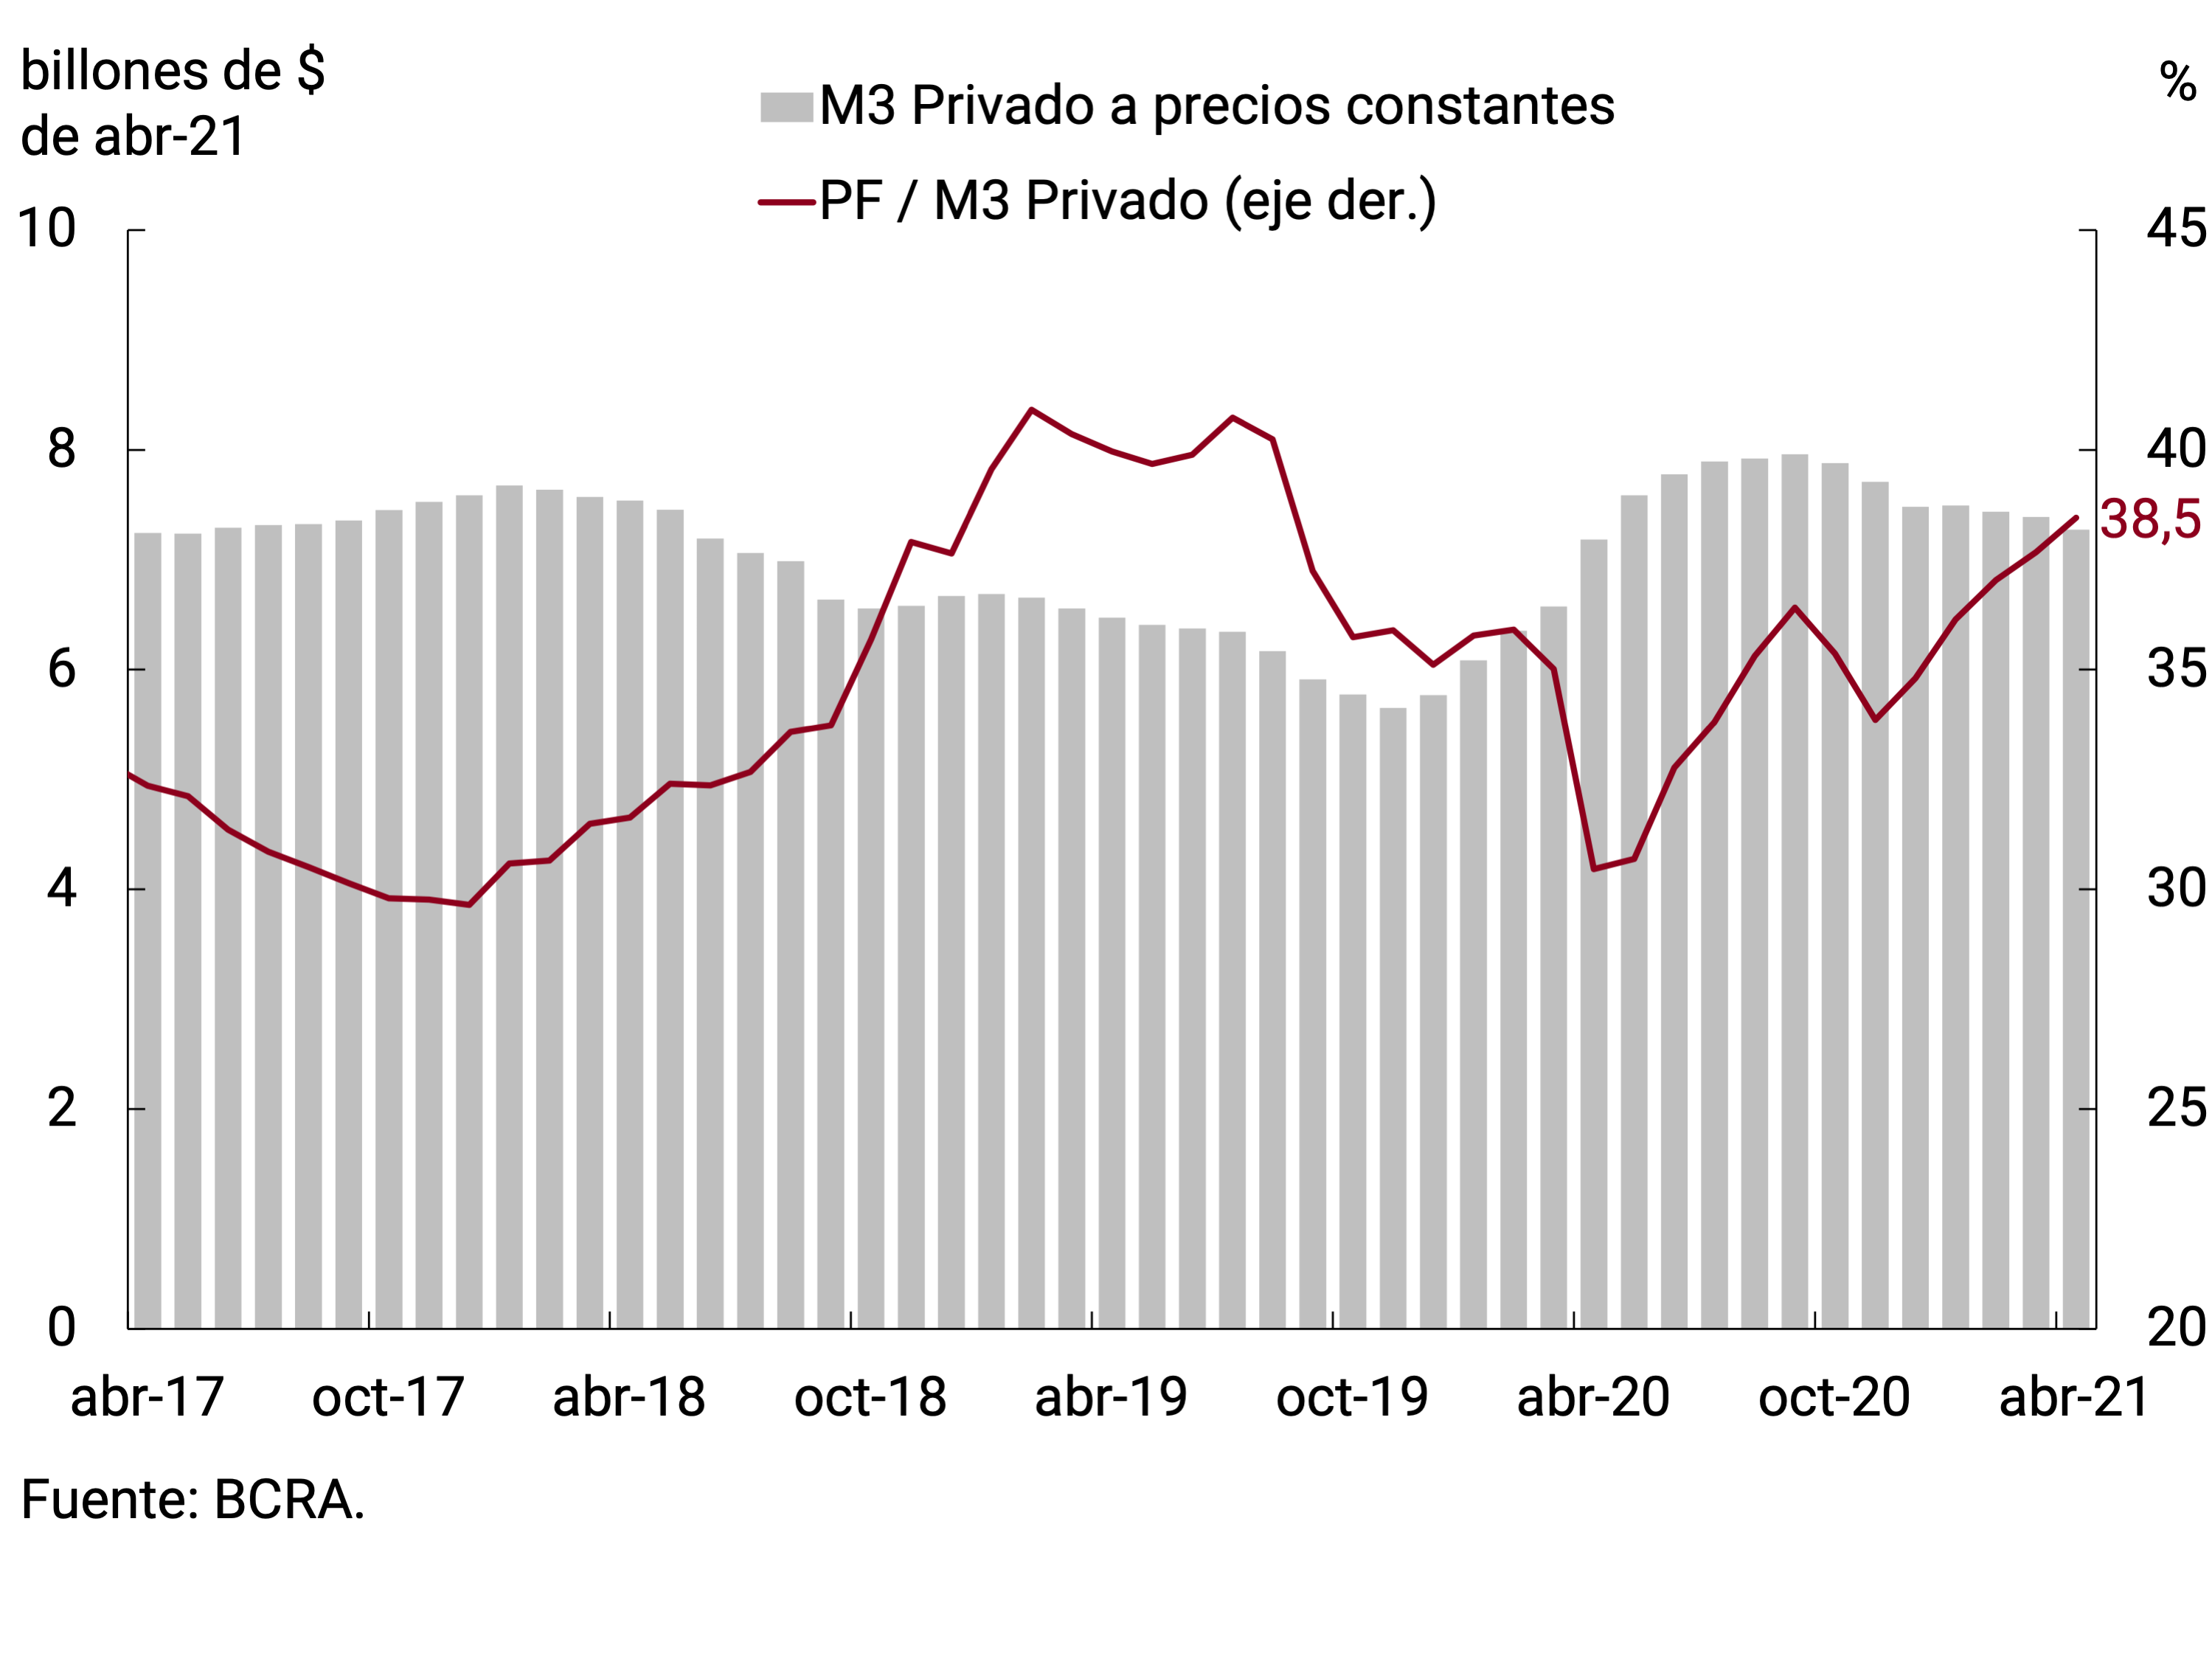
(b) Non-seasonal fixed-term placements at constant prices
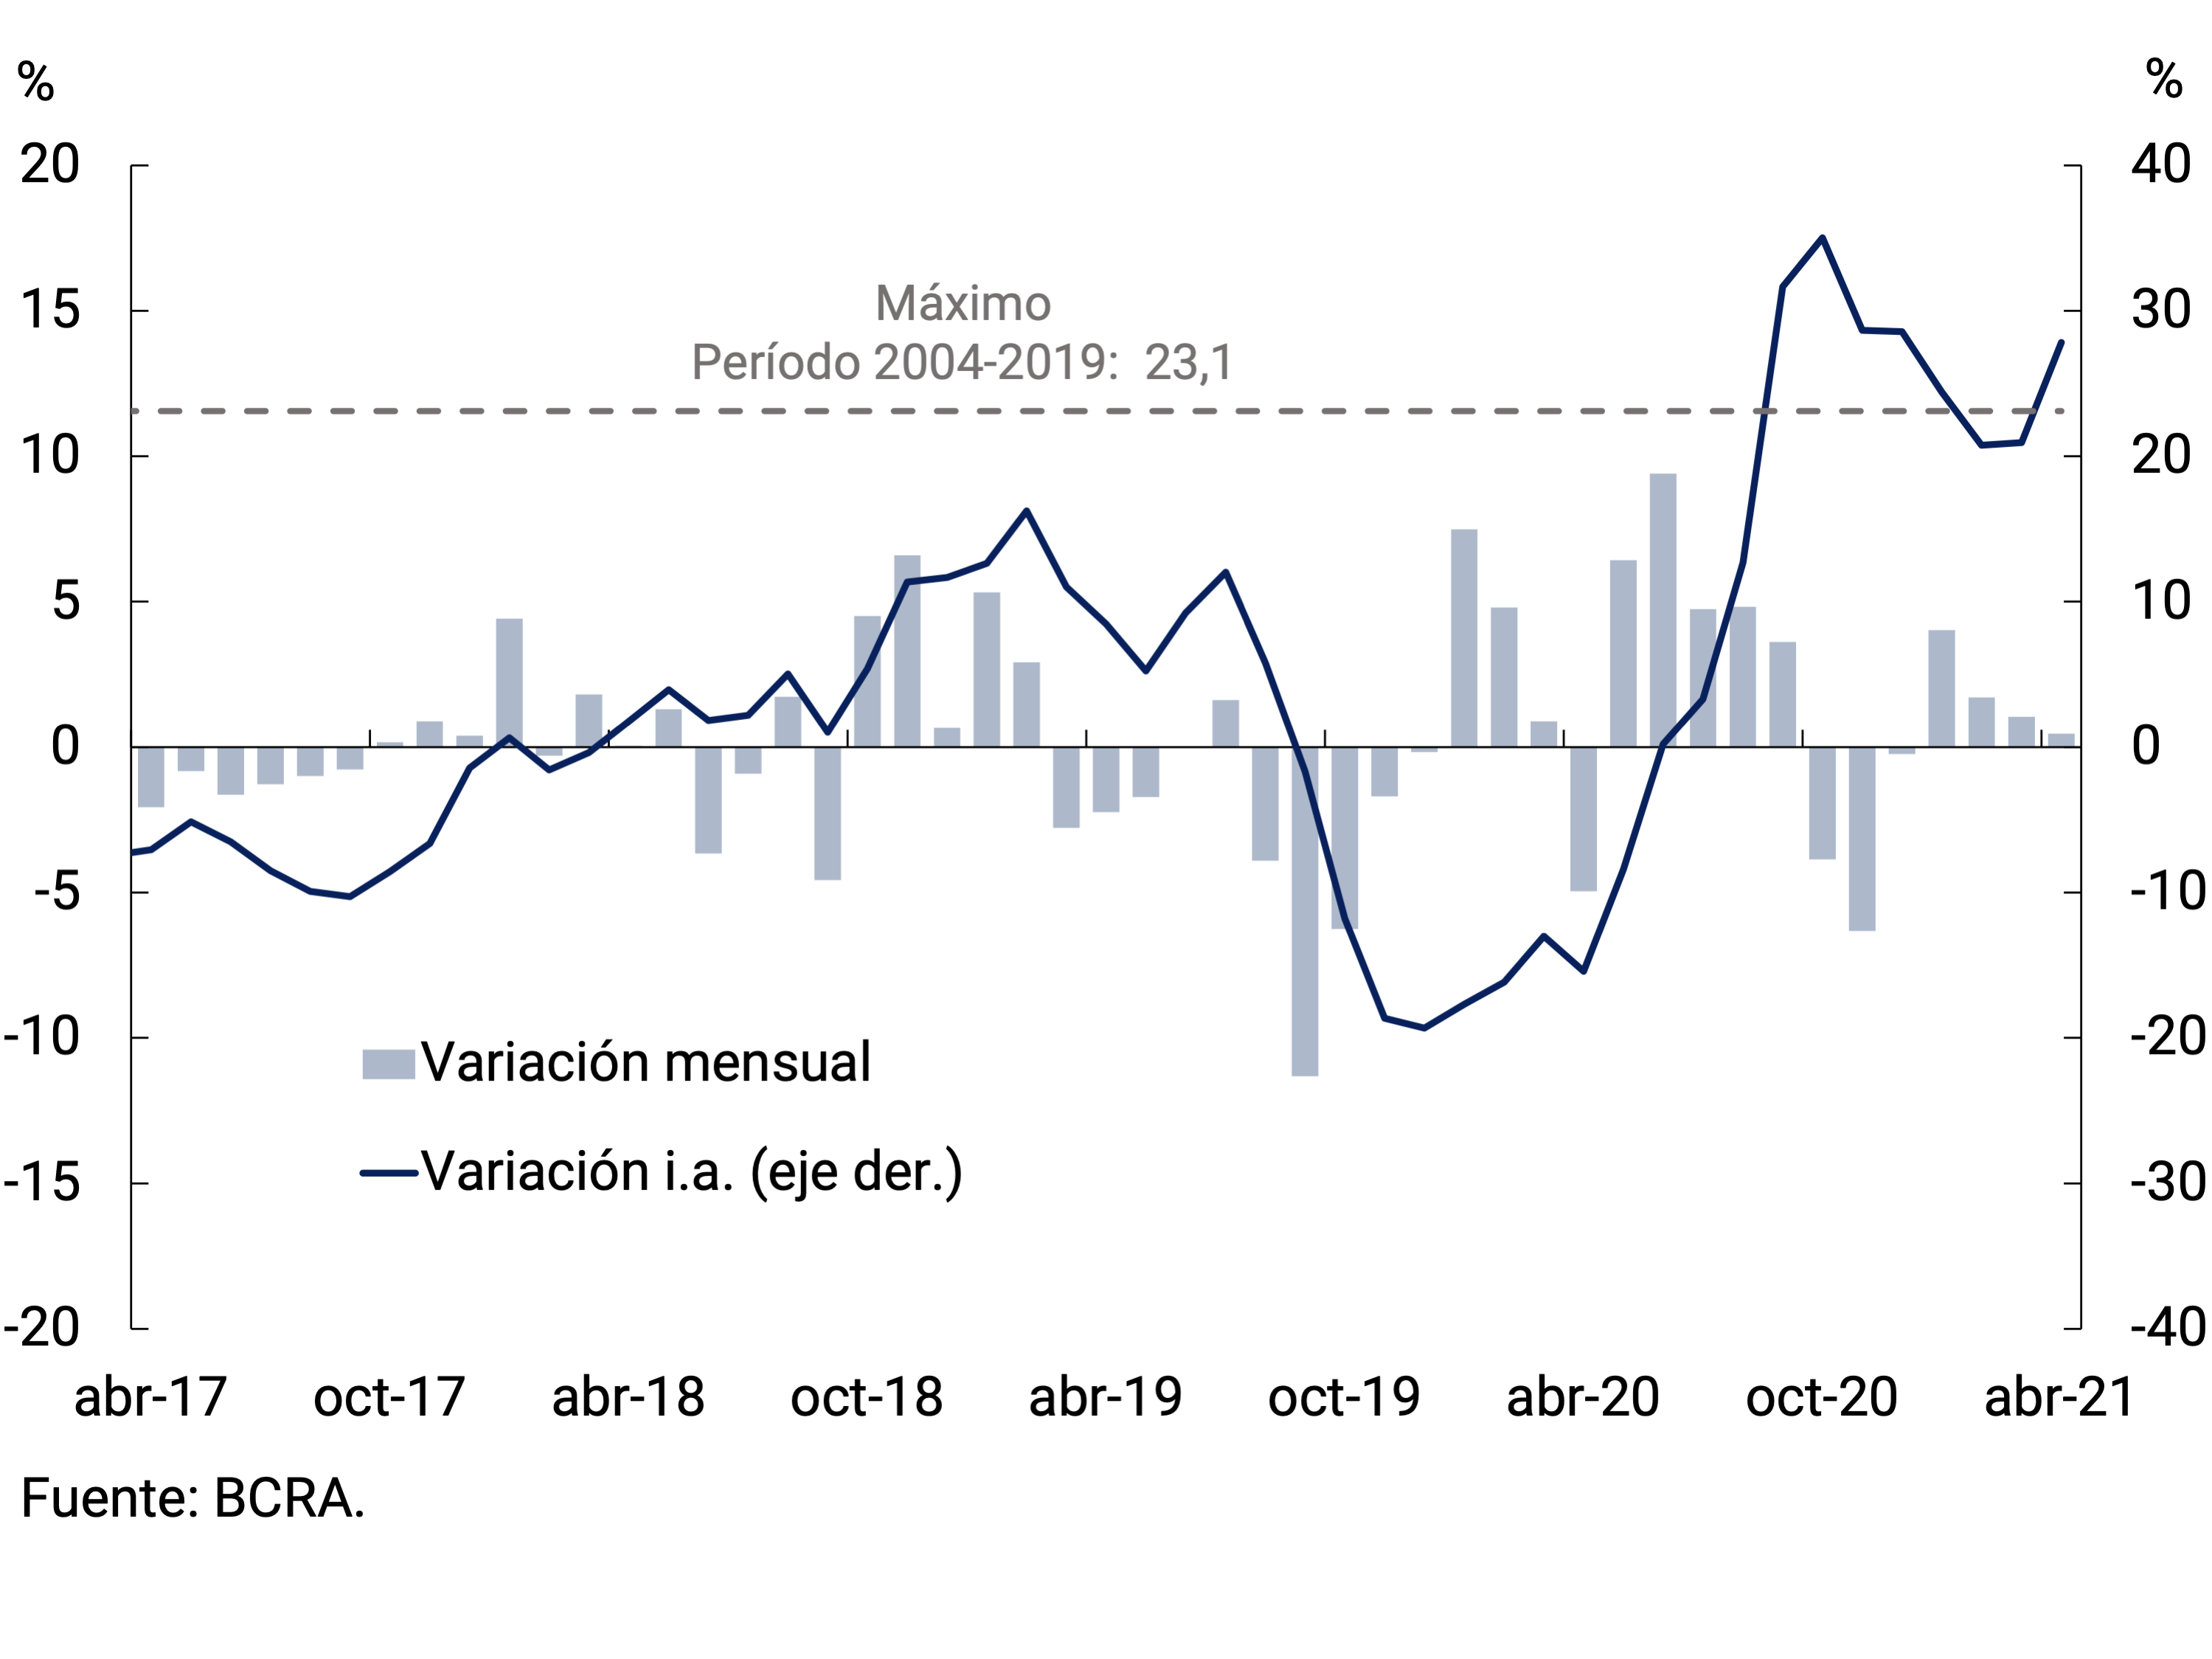
During the first four months of the year, the average monthly growth of fixed-term loans was 1.8%, real s.e. Thus, with data as of April 2021, the year-on-year expansion rate at constant prices was 27.8%, remaining above the highest values in recent history (see Figure 7.4b).
Distinguishing by strata of amount, the wholesale segment (more than $20 million) was the most dynamic. This segment of time deposits is primarily composed of deposits corresponding to Financial Services Providers (especially Money Market Mutual Funds (FCI MM)) and Companies. Both types of depositors maintained an uninterrupted upward trend from the beginning of November last year until mid-April, and then stabilized. On the other hand, the growth of placements between $1 and $20 million since the beginning of the year was also highlighted. Meanwhile, retail placements remained practically unchanged in real terms so far this year.
A segment that stood out for its wide dynamism was the one called UVA. Although its share of the total is growing, it still represents a limited fraction. This type of placement continued the trend that began in mid-November 2020, although with a significant acceleration since last January. In fact, traditional placements (i.e., without a pre-cancellation option) grew at a monthly average of 14.2% in real terms in the first four months. Meanwhile, pre-cancelable placements, which have a guaranteed rate of 1%, expanded to a monthly average of 25.4% in real terms. With regard to the composition by type of depositor, it can be seen that the greatest contribution to growth came from individuals, whose time deposits in UVA grew at an average monthly rate of approximately 26.1% at constant prices in the first four months( see Figure 7.5).
Figure 7.5 |
(a) Balance of fixed-term placements in UVA by type of deposit
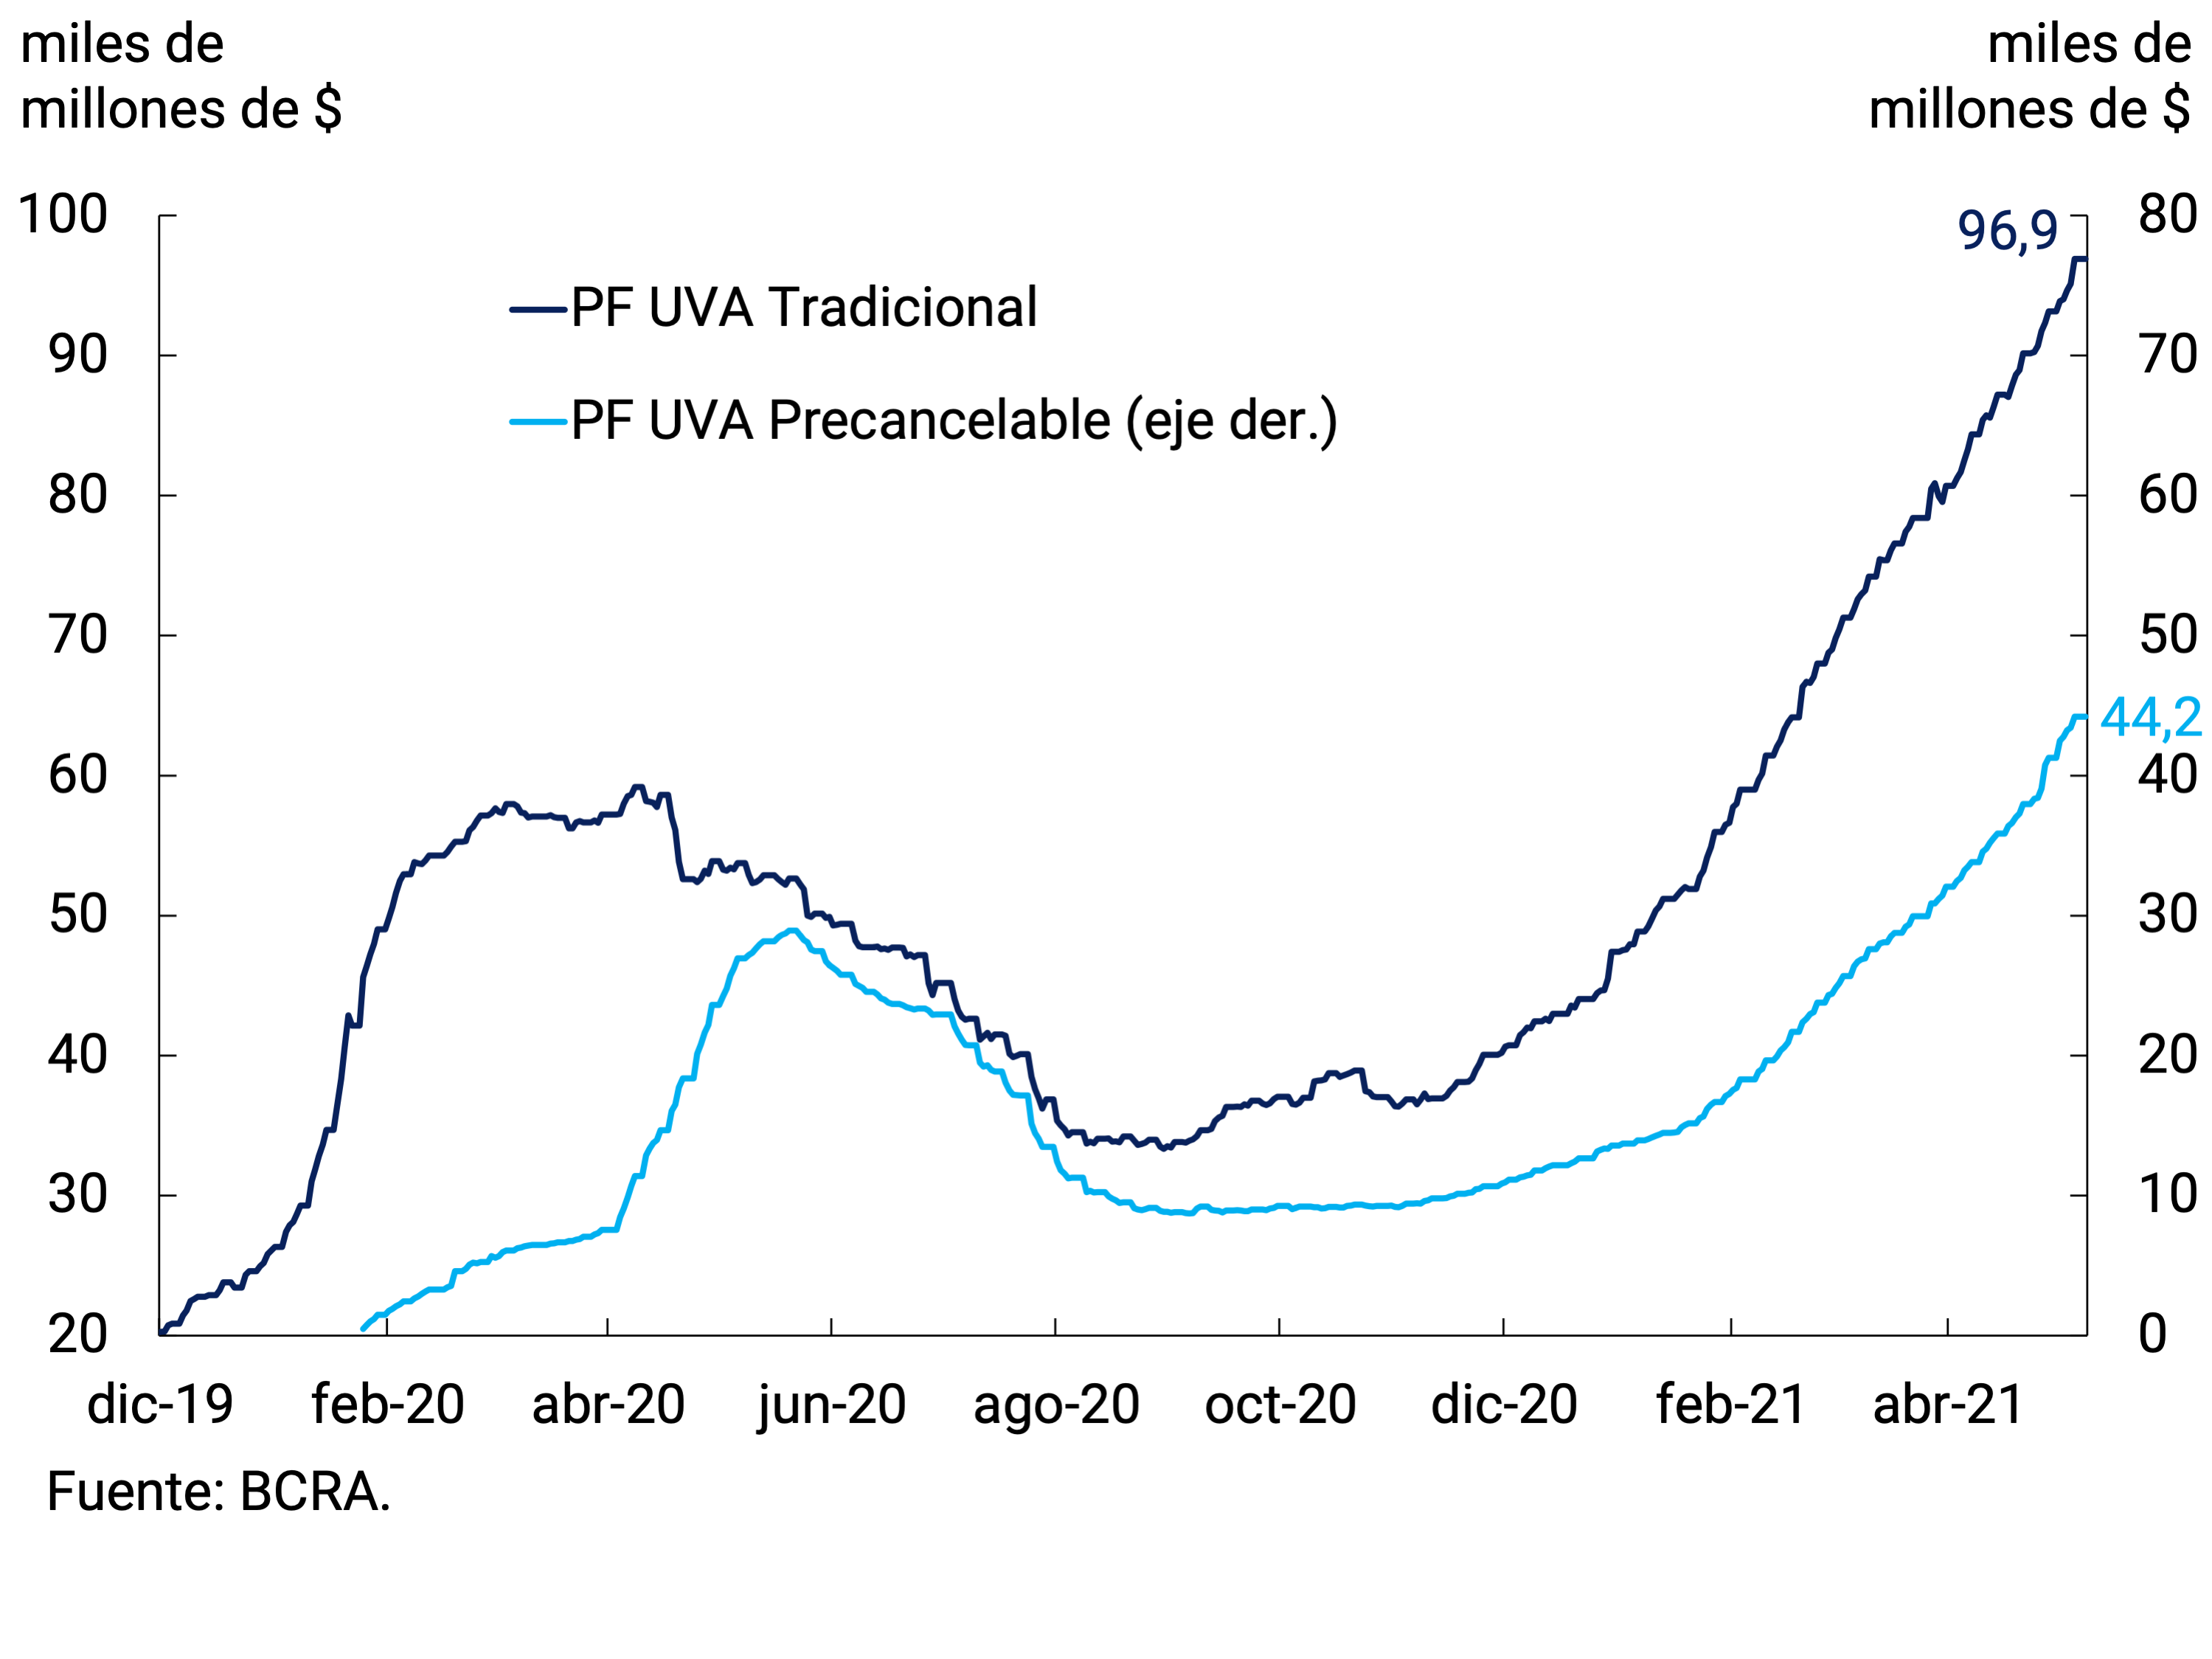
(b) Balance of fixed-term placements in UVA by type of depositor (b)
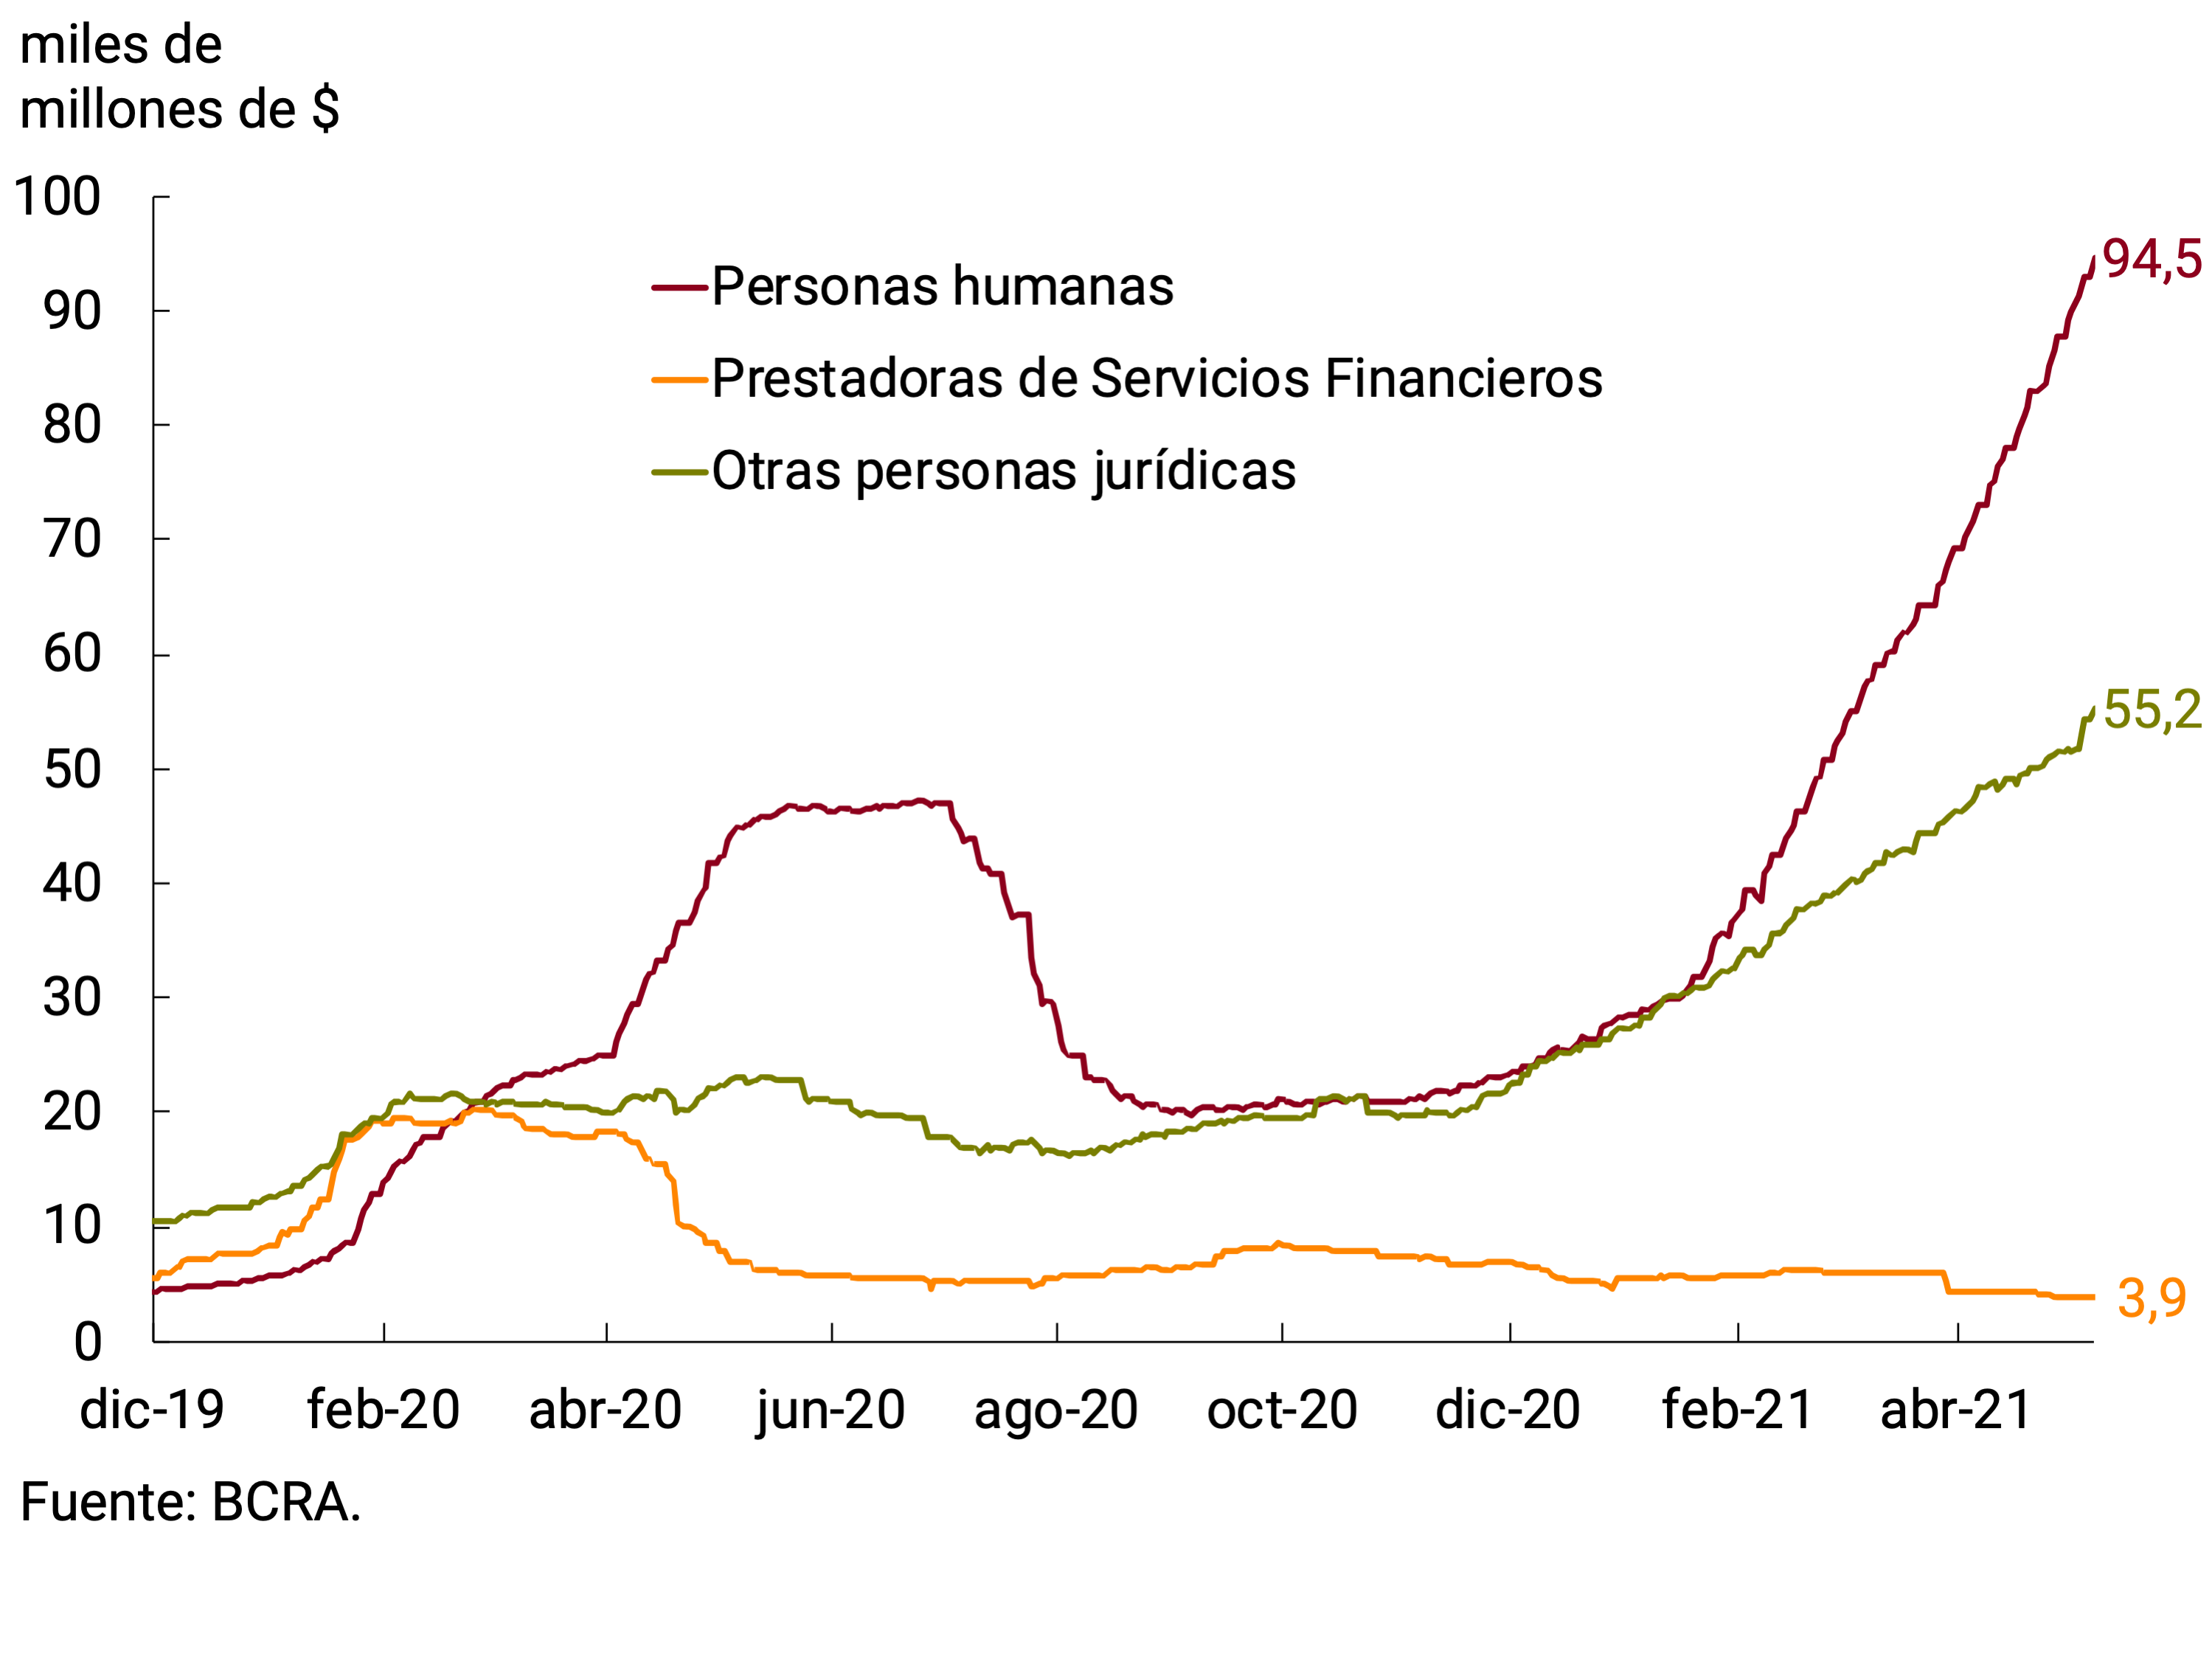
For people with agricultural activity, fixed-term deposits with a variable rate linked to the value of the dollar (DIVA dollar) are available. These placements, which maintained a gradual upward trend in the first two months of the year, began to contract from the beginning of March. Thus, the balance in mid-May stood at $8,700 million, a value similar to that of the end of November last year.
The improvement in the fiscal and monetary position, together with the growth of traditional fixed terms and the existence of the savings alternatives with inflation and exchange rate hedging mentioned above, allowed the BCRA to face the new stage while maintaining the minimum fixed-term interest rates and monetary policy unchanged. Likewise, this is in line with the importance of accompanying the process of normalization of economic activity. However, the context of stability in the interest rate paid by fixed-term deposits in pesos and higher inflation led to the spread between rates in pesos and UVA temporarily turning in favor of UVA deposits, which explains the growth of this type of placement. Something similar happened with deposits whose amounts are adjustable according to the evolution of the dollar, given the lower rate of devaluation of the domestic currency.
7.1.3. Credit policy continued to focus on the lagging sectors
Once the initial phase of the pandemic was over, the economy entered a stage of gradual recovery, allowing the BCRA to move to a scheme of greater focus of credit policy. In this new stage, the Productive Investment Financing Line (LFIP) was the main tool used to channel productive credit to MSMEs45. Thus, the credit assistance policy was focused on the most lagging sectors, with interest rates at levels consistent with those of the monetary policy rate. It should be noted that, in the event that the worsening of the epidemiological situation leads to a further drop in income, this instrument will allow the lines of assistance to MSMEs to be quickly adapted.
Since its implementation, and with data as of April 30, the LFIP has accumulated disbursements for a total of $513,321 million, which implied an average monthly nominal growth of 32.4% so far this year. Approximately 80% of the funds disbursed were used to finance working capital, while the remaining 20% was used to finance investment projects. Most of these credits were channeled through documents, which are usually the tool of choice to cover these financial needs. Because the discounted documents have an average life of close to 2 months, it is expected that a part of the amounts disbursed will have been amortized. If this effect were taken into account, the participation of investment projects would be in line with the 30% quota established by the law. At the time of publication, some 120,180 companies had accessed a loan granted within the framework of the LFIP.
Despite the upward momentum provided by financing through the LFIP, commercial credit has shown a nominal contraction since the end of February. When we analyse the composition by type of debtor, it can be seen that practically all the decline is explained by the dynamics of large companies. Within this group of legal entities, current account advances represent a high proportion of their sources of credit financing. In recent months, the largest drop in financing to large companies was recorded in current account advances. The rest of the lines to large companies also show a downward trend since last September, although more gradual. Credit to MSMEs is very different, both in composition and evolution (see Figure 7.6). Most of the credit to MSMEs is channeled through documents, which were promoted by the LFIP (which explains the growing trend in recent months). Thus, commercial credit to MSMEs presented an expansion rate at constant prices of 35.6% YoY in April.
Figure 7.6 |
(a) Estimated trade credit balance by line and type of customer
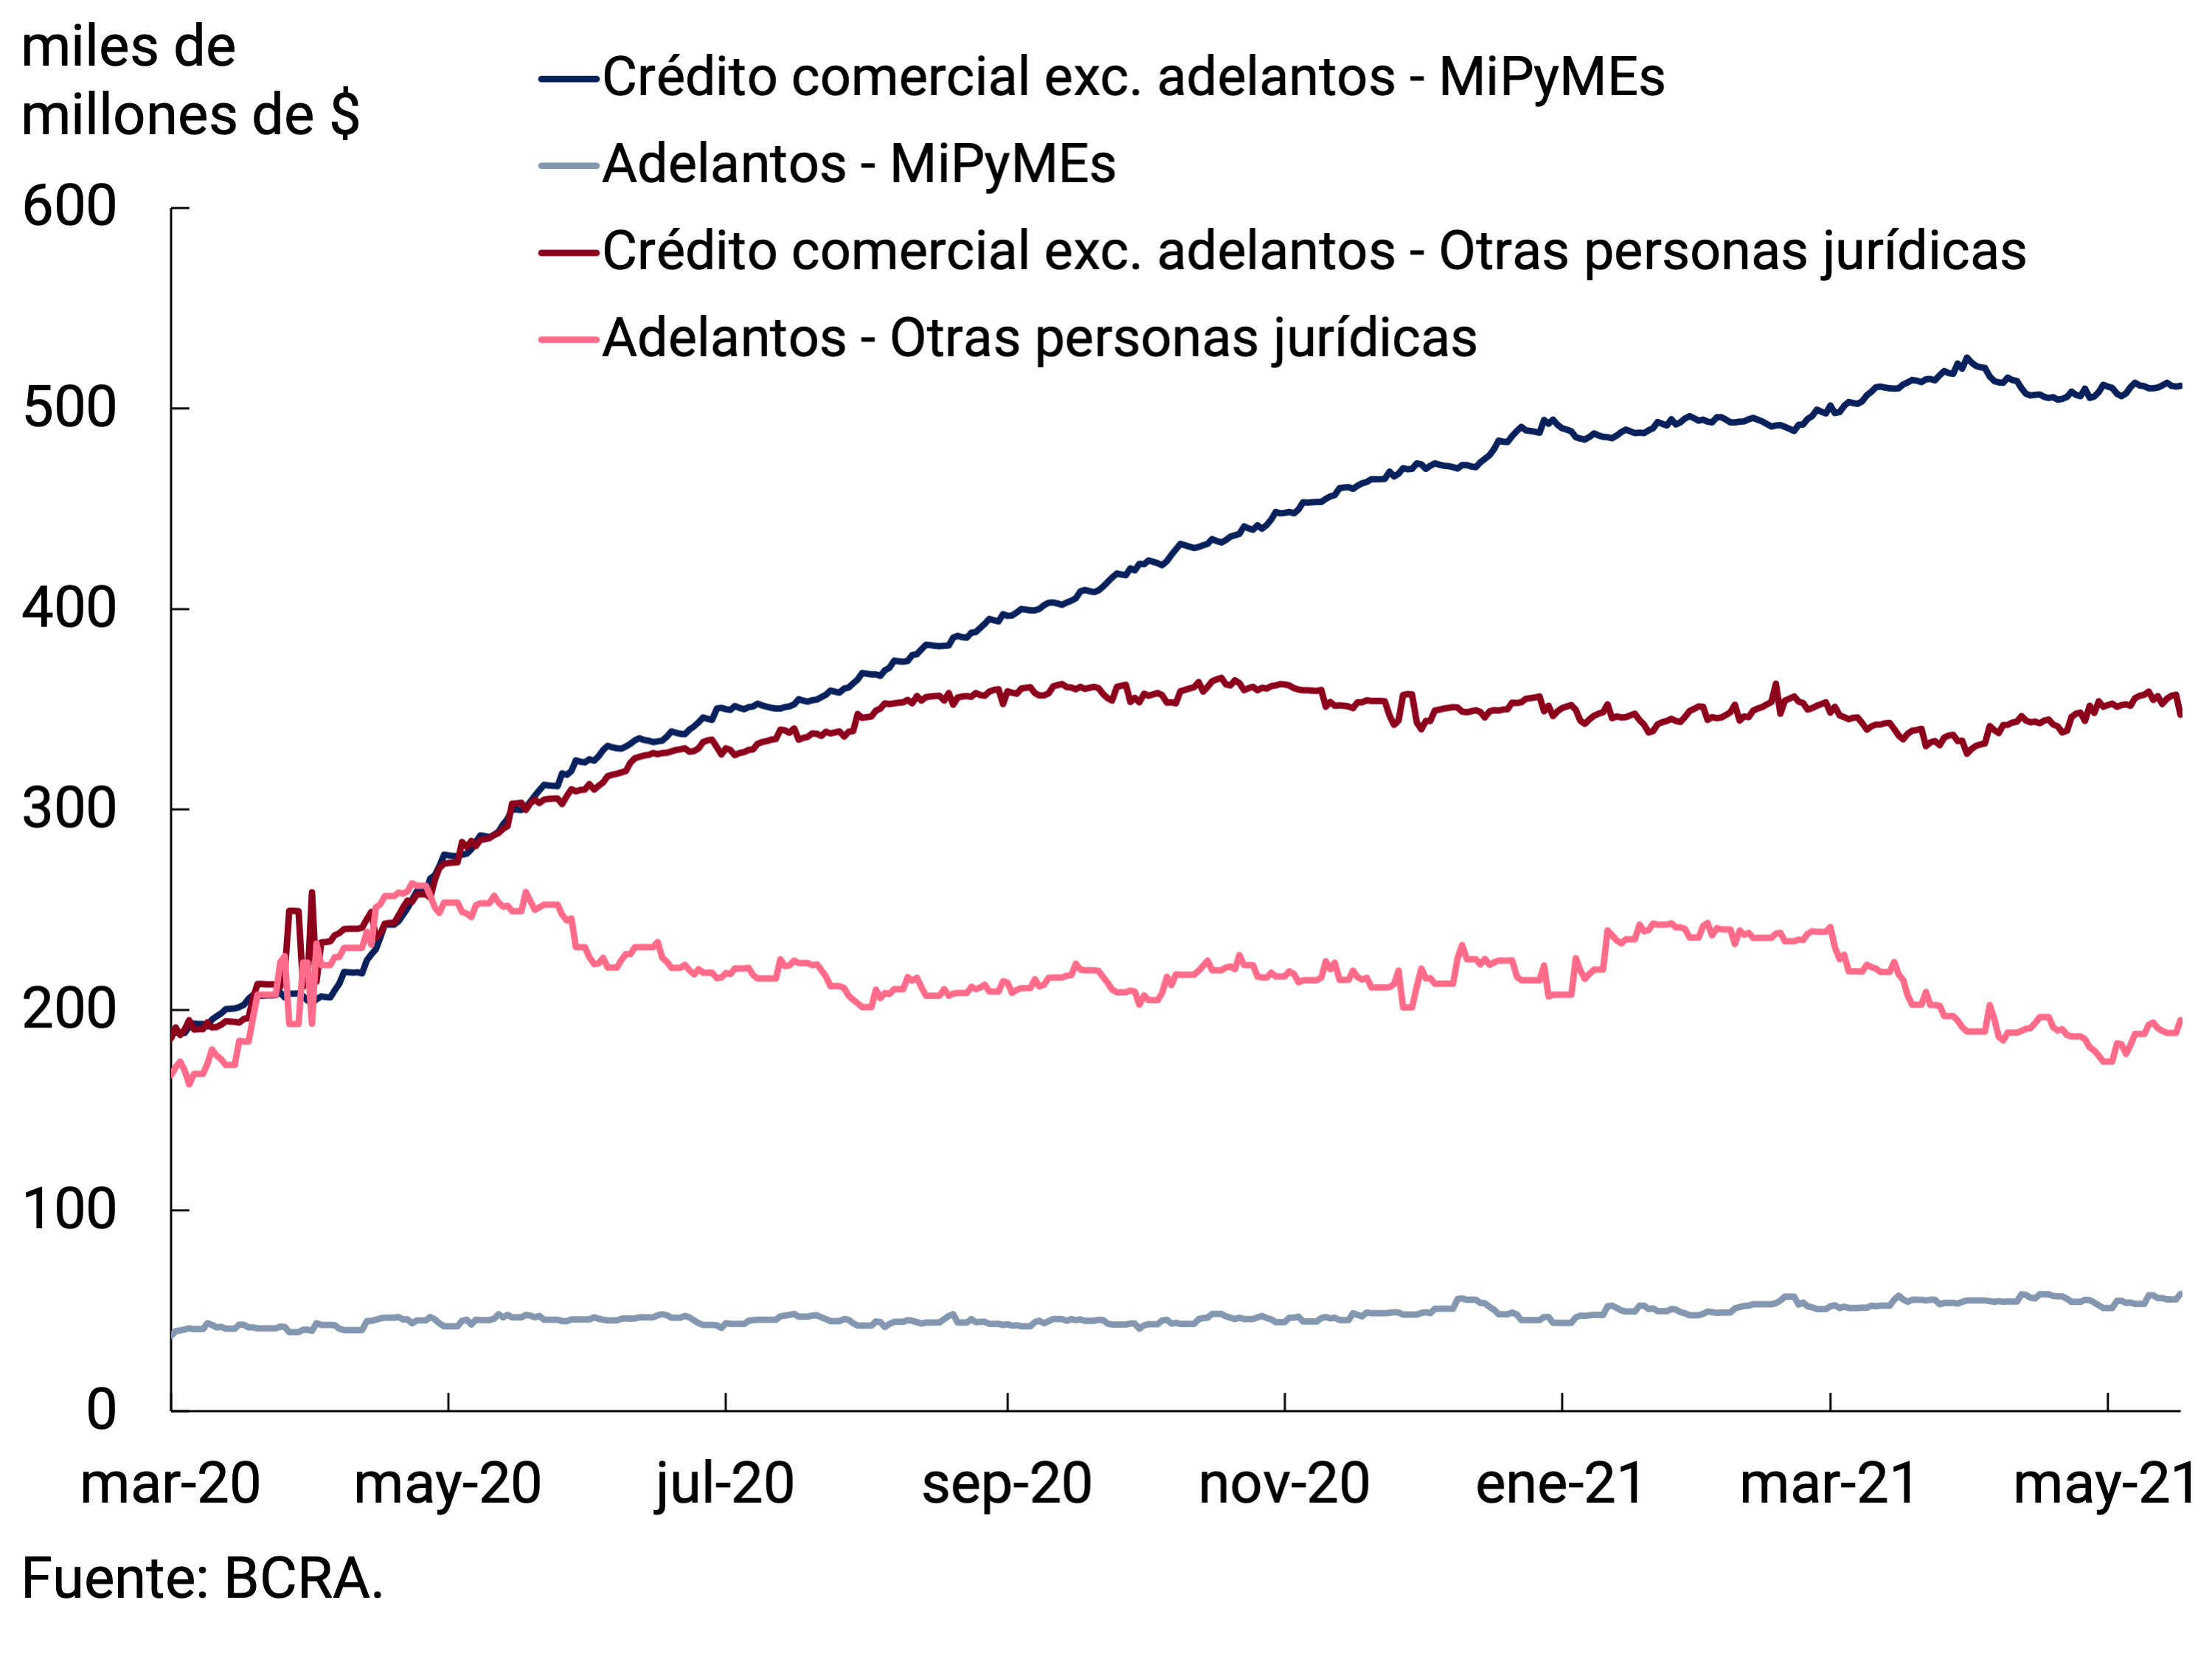
(b) Evolution of the stock of commercial loans to the private sector by type of debtor (at constant prices)
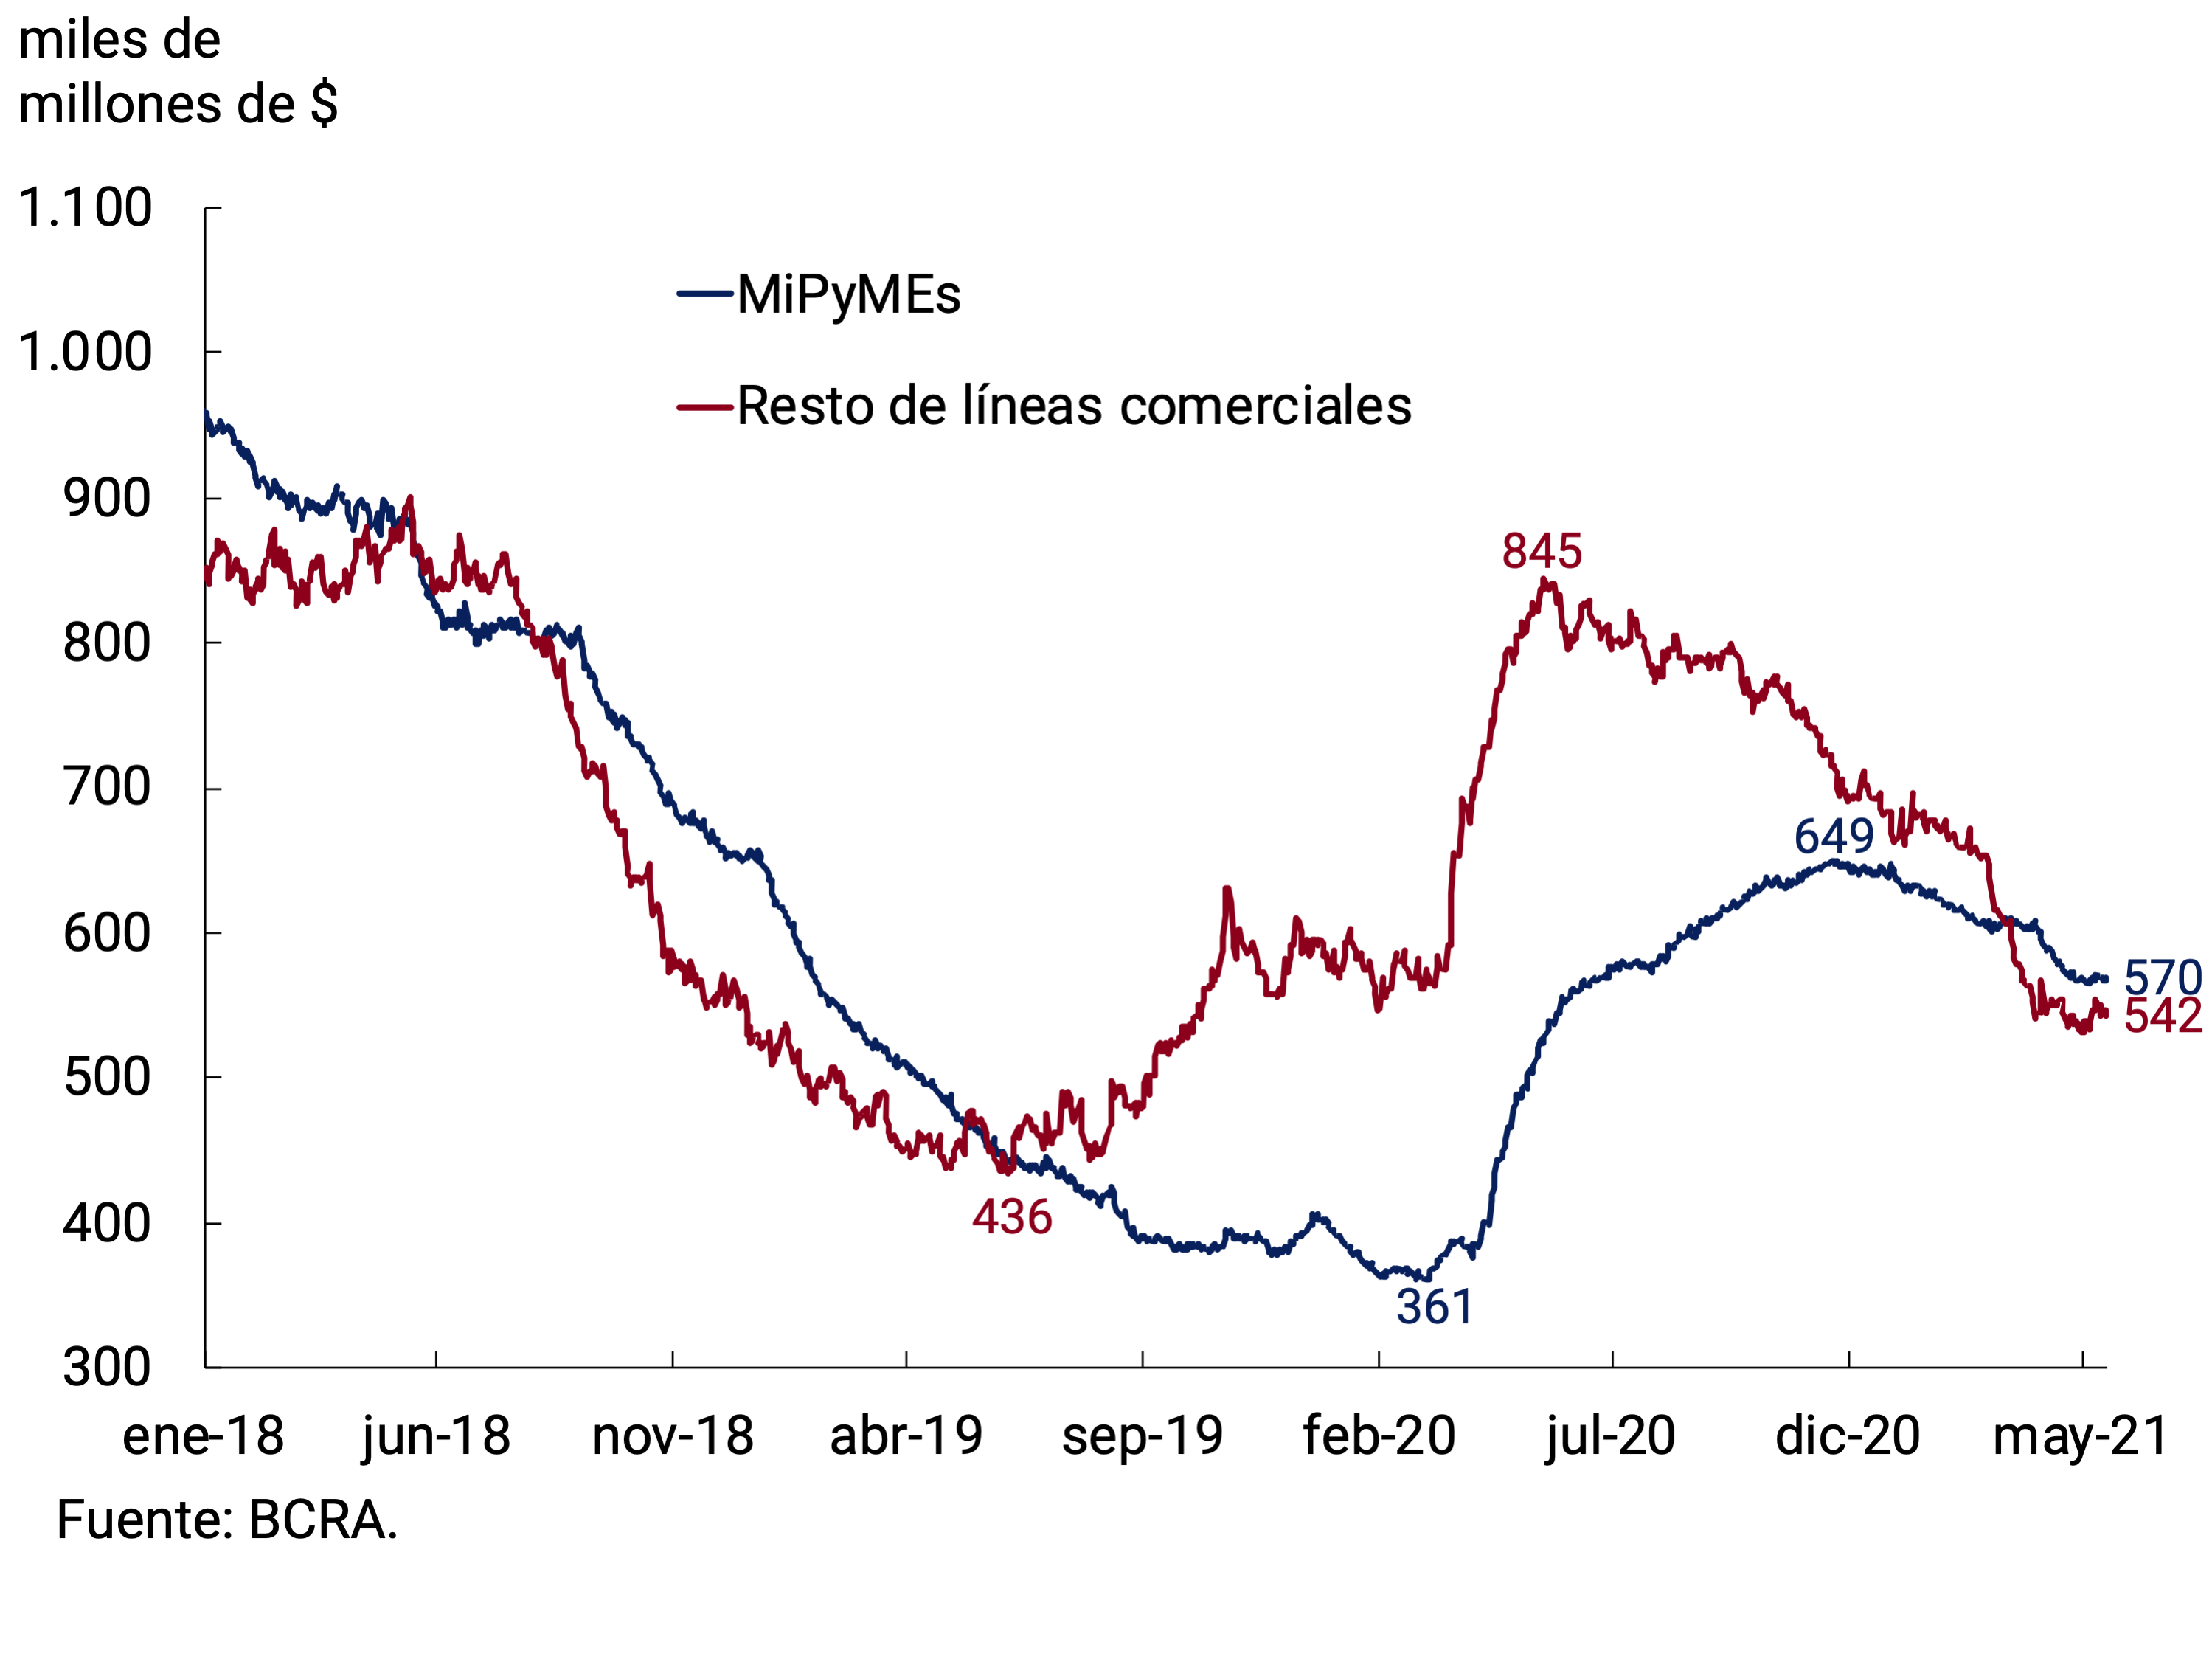
In line with the recovery in household income and confidence indicators, consumer loans showed increasing dynamism. In particular, during the first months of the year the boost continued to come mainly from credit card financing, encouraged by the invoicing of the “Ahora 12” program. It should be noted that the Ministry of Domestic Trade extended the program until July 31 with some modifications in conditions46.
All in all, total credit to the private sector expanded at an average monthly rate of 2.2% nominal during the first four months, implying an average real contraction of 1.9%. In terms of GDP, credit stood at 7.5% during April, 0.5 p.p. above the record prior to the start of the pandemic.
In regulatory matters, given the gradual recovery of the economy, the BCRA decided to normalize the debtor classification deadlines. However, the transition will be gradual, so between April and June the 60 days of extra term will be reduced to 30 and from June the general default criteria prior to the start of the pandemic will be in force again.
7.1.4. The exchange rate policy was adapted to meet the needs of the situation
On the external front, the BCRA maintains its structural objective of accumulating International Reserves by maintaining a competitive real exchange rate. With respect to its short-term strategy, the BCRA perfected its exchange regulations and adapted the volatility of the nominal exchange rate to the needs of the situation.
With regard to regulatory modifications, among the measures taken during the first quarter is the extension until the end of the year of the regime that establishes the refinancing of financial liabilities for those who register scheduled capital maturities47. Through the same communication, this requirement was relaxed for those debtors who require access to the foreign exchange market for the cancellation of this type of indebtedness for up to US$2,000,000 per calendar month48, while the universe of excepted debts was expanded. On the other hand, the validity of the prior agreement for access to the foreign exchange market for the import of goods and for the cancellation of the principal of financial obligations was extended until June30 49 and access for the import of capital goods was made more flexible50. The latter seeks to facilitate the importation of capital goods that must be produced at the request of the company that imports them and that must accompany the purchase order with an advance payment.
Finally, the BCRA regulated the Investment Promotion Regime for Exports51 that promotes investments aimed at the implementation of new productive projects52 and the expansion of existing business units that require investment to increase their production. Companies that adhere to the regime and make investments of more than US$100 million will be able to dispose of up to 20% of the foreign currency obtained in exports linked to the project, to be used to pay principal and interest on commercial or financial liabilities abroad and/or profits and dividends that correspond to closed and audited balance sheets and/or to the repatriation of direct investments by non-residents. This benefit has a maximum annual limit equivalent to 25% of the gross amount of foreign currency entered into the foreign exchange market53.
In addition, efforts have been made to maintain a competitive real exchange rate. To this end, the volatility of the nominal exchange rate has been adjusted and adapted to the needs of the situation. In a context in which the real exchange rate in the first quarter was above its historical average, the pace of depreciation of the currency moderated with the aim of contributing to the disinflationary process. However, at the end of April, the real exchange rate was around its historical average, a record consistent with a surplus balance of the current account.
So far this year, the BCRA has managed to maintain an increasing trend in the balance of International Reserves, which accumulated an increase of US$2,130 million as of May 20 and stood at US$41,517 million. Within the components, the net purchase of foreign currency in the market stood out, which, in the same period, reached US$5,432 million. However, the evolution of net purchases of foreign currency was partially offset by the dynamics of the rest of the explanatory factors (see Figure 7.7).
Figure 7.7 |
(a) Monthly variation of the Nominal Exchange Rate
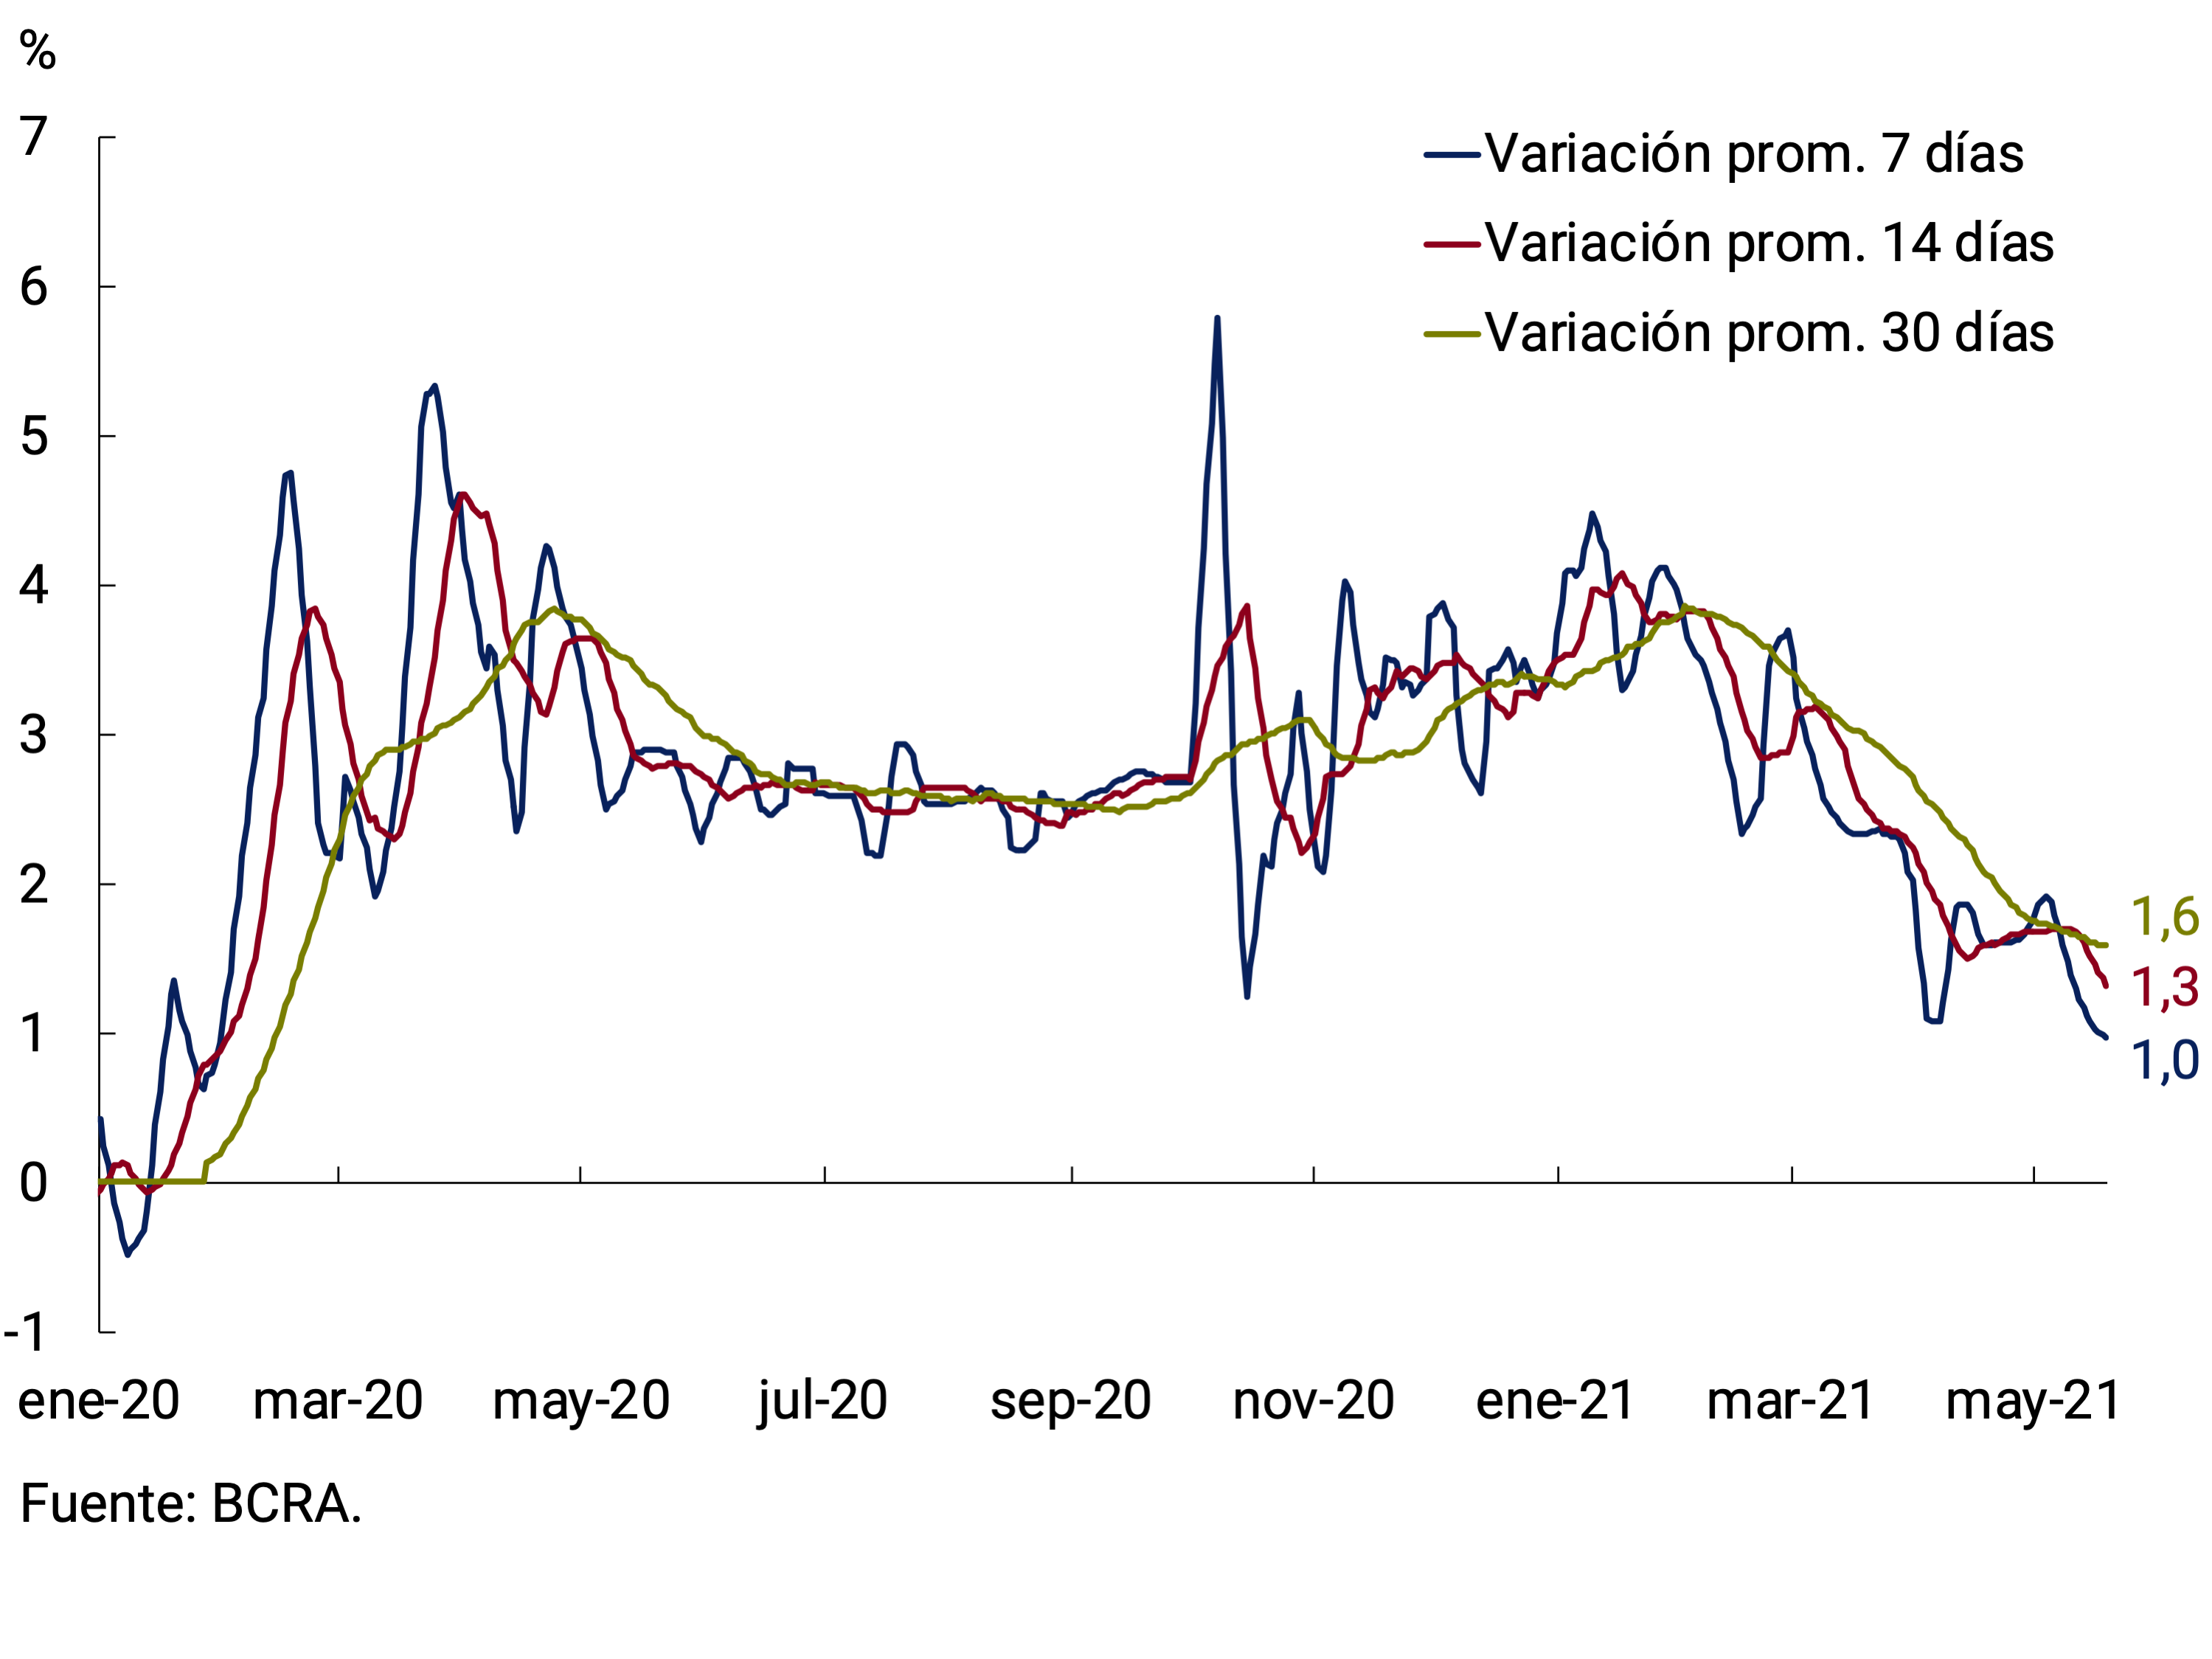
(b) Variation in International Reserves (accumulating since Dec. 31-20)

7.2. Monetary policy objectives for the current year
The resurgence of COVID-19 cases and its potential impact on the progress of the economy generate a panorama of uncertainty for the coming months. The progress of the vaccination of the population and a more prepared health infrastructure would contribute to mitigating the economic effects of the pandemic.
On the other hand, after the successful restructuring of the debt in foreign currency, the National Government continues to move forward with the necessary actions to reestablish the sustainability of the public debt. There is still progress to be made in the process of renegotiating the debt with the International Monetary Fund (IMF) and to advance in the restructuring of liabilities with the official creditors grouped in the Paris Club. In the first case, the aim is to set a more reasonable maturity schedule in accordance with the economy’s payment capacity, compared to the current one, excessively concentrated in the short term and the product of a stand-by agreement that did not meet its objectives.
For the remainder of 2021, less financial assistance from the BCRA to the National Treasury is expected compared to the previous year, as reflected in the 2021 National Budget. However, the BCRA will continue to calibrate the liquidity of the economy, sterilizing any monetary surpluses that may be observed in the short term. On the other hand, the exchange rate management policy will continue, encouraging the exchange rate dynamics to contribute to a gradual process of lowering the inflation rate.
With a medium-term vision, while the negative effects of the pandemic period dissipate and accompanying the recovery of the economy, monetary aggregates will continue to normalize their dynamics. In this new stage, it is expected that both the extraordinary financing needs of the National Treasury and the consequent sterilization effort will subside. This would favor the demand for the monetary base to be provided by the interest associated with the BCRA’s interest-bearing liabilities and, potentially, by a dismantling of the balance thereof. This process, together with economic growth, would contribute to reducing the relative weight of the BCRA’s Bills and Passes on its balance sheet and also with respect to the size of the economy, a trend that would be underpinned by a growing credit dynamic.
Paragraph 1 / The new allocation of special drawing rights (SDRs): what it is and what it means for developing countries
At their meeting on April 7, G20 finance ministers and central bank governors asked the International Monetary Fund for a general allocation of special drawing rights (SDRs) of US$650 billion, following what the IMF’s executive director, Kristalina Georgieva, had advanced.
The SDR is an international reserve asset created by the IMF in 1969 to supplement the official reserves of its member countries. It is not a currency in the strict sense since its use as a unit of account is very limited (only for the IMF and some other international organizations) and its use as a means of payment is also very limited (private companies cannot use them). However, as it is a potential right over a set of reserve currencies, it is used as a store of value by the member countries of the Fund.
SDRs can be exchanged against those currencies that the IMF considers to be “freely usable”: those that have a wide use in international transactions and a high share of traded volumes in foreign exchange markets. This criterion, together with belonging to one of the world’s top five exporting countries (considering goods, services, and the income account), defines the basket of currencies used to determine the value of SDRs. This basket is made up of the U.S. dollar, the euro, the Chinese renminbi, the Japanese yen, and the pound sterling (see Chart 1).
Graph 1 | Basket of currencies that make up the SDR (weight % of each currency defined in the last revision of 2015)
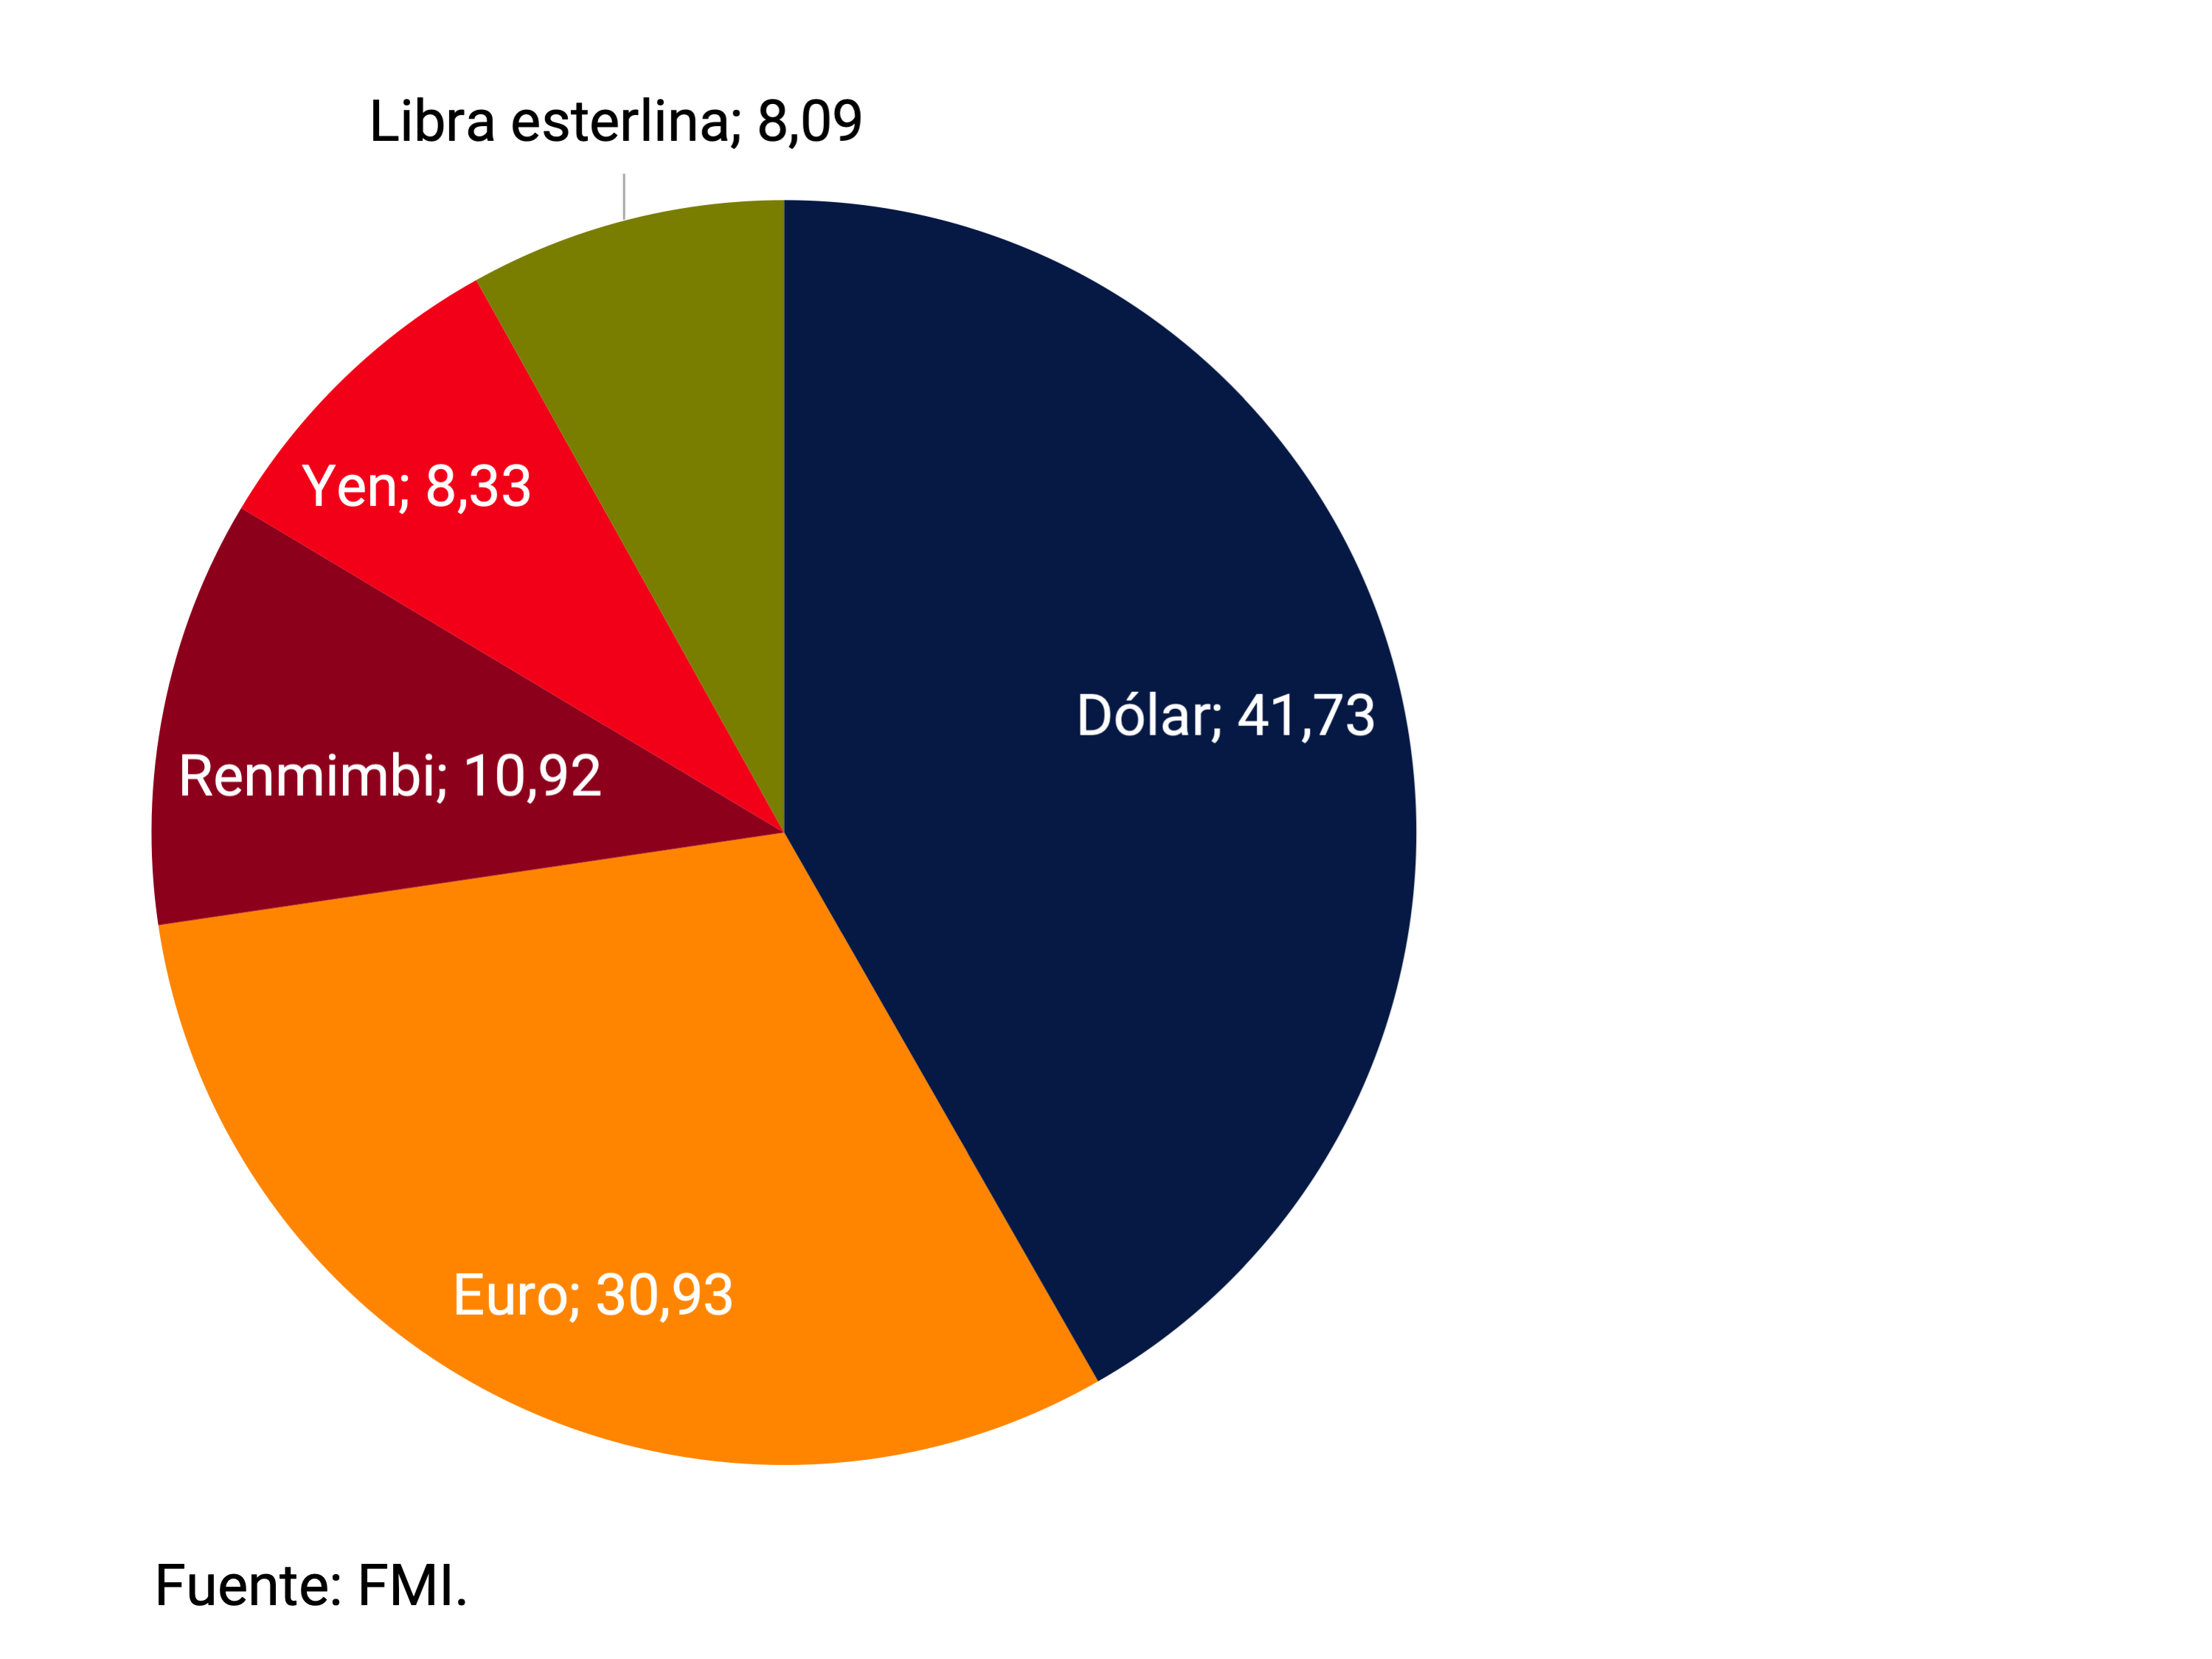
There is no cost to maintain the SDRs received, but there is a cost to use them: countries charge a certain interest rate on their SDR holdings (in their accounts with the IMF), and they must pay the same rate for using the distributions they have received. If a country uses part of the SDRs it receives from distributions, it will then have a smaller holding than the allocation received and will have to pay the SDR rate for the difference between the two positions (and vice versa). The interest rate is determined weekly on the basis of a weighted average of the interest rates representing short-term government debt instruments of the currencies of the SDR basket, with a floor of 0.05% per annum, which is the value it currently registers.
A general distribution of SDRs must identify a global need to supplement existing long-term reserves, in order to avoid economic stagnation and deflation, but also not to lead to excess demand and inflation at the global level. Reserve requirements are calculated for advanced, emerging market and developing countries that do not issue reserve currencies based on reserve adequacy indicators. Based on this calculation, the IMF estimated a distribution of US$650 billion to be appropriate.
The Executive Board must approve the measure by a majority vote, and then the Board of Governors (where all members are represented) must approve it with 85% of the vote. Finally, the amount of the general allocation is distributed according to the quotas of the IMF members. This could be carried out at the end of August of this year, if the same times as in 2009, the last time a similar process was carried out, are followed.
General distributions of SDRs have several advantages: they benefit all IMF members, provide liquidity quickly and without conditions, and supplement international reserves at a lower cost than other sources of financing. They also help to avoid external adjustment and contractionary policies in cash-strapped countries, while sending a signal of multilateral cooperation.
The current proposal would represent 0.7% of world GDP, almost doubling the 0.4% of GDP of the one made in 2009, in the face of a crisis whose global impact has been greater. Most of the allocation would go to advanced countries, while emerging and developing countries would receive 42%. Argentina, for its part, would receive some US$4,355 million (0.67%), which would represent about 1% of GDP, compared to the 0.7% received in the previous general distribution (see Table 1), and 11% of international reserves.
Table 1 | Overall SDR allocation 2021 versus 2009
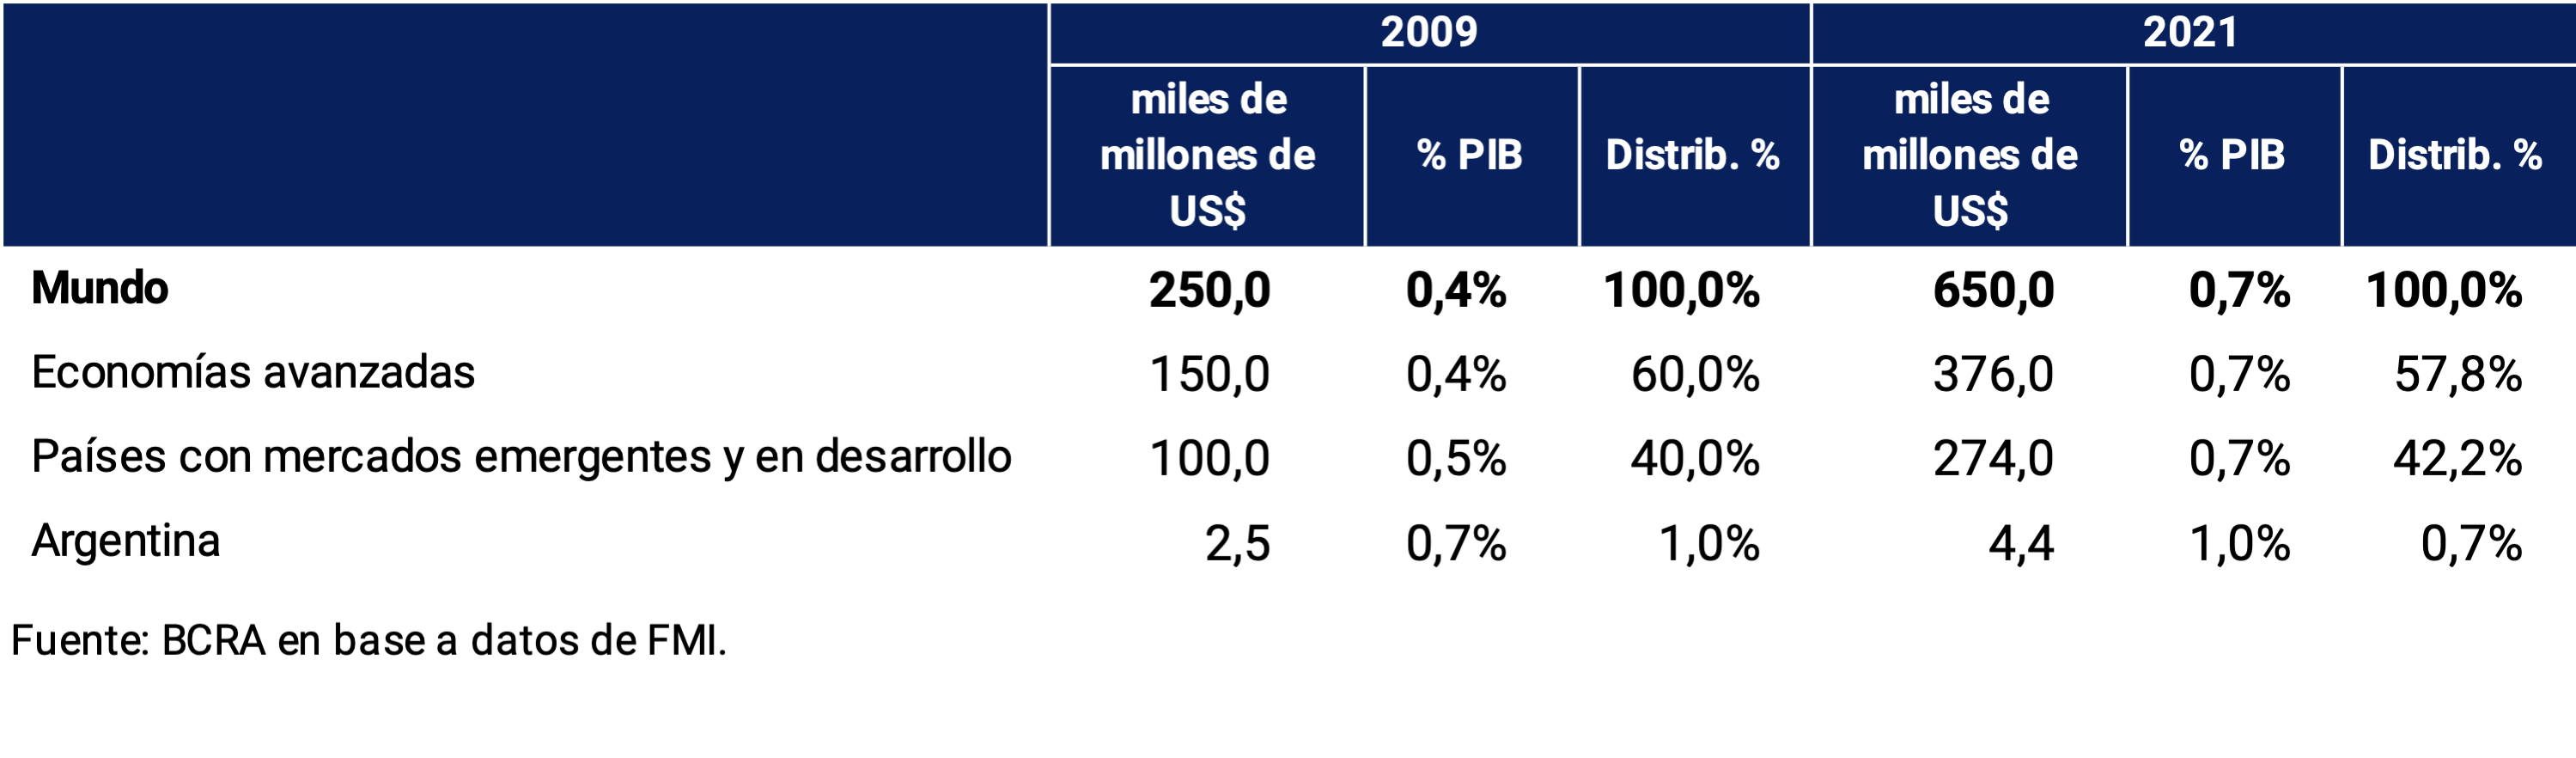
SDRs can be held as international reserves or used to change their composition, converting them to freely usable currencies. They can also be used to integrate IMF quota increases, to make payments related to IMF loans (principal and interest), and to contribute to the Poverty Reduction and Growth Fund (PRGT), from which the IMF lends to low-income countries at zero interest rates. with grace periods of between 4 and 5 and a half years and terms of between 8 and 10 years).
While countries can engage in transactions with each other (loans, grants, swaps, forwards, etc.), most operations are concentrated on the purchase and sale of SDRs against freely usable currencies, through a voluntary market in which the IMF acts as an intermediary to ensure liquidity. This market operates through voluntary swap agreements (VTAs) between 31 countries and the European Central Bank that act as “market makers” (for more details, see section 4.5 of this IMF report).
In the current situation, the IMF encourages countries with strong external positions to reallocate part of their holdings voluntarily to more vulnerable countries. The PRGT is a natural choice, but it is intended for low-income countries. At the same time, the international organization committed to explore new options for the voluntary reallocation of SDRs. In view of this, the claim of emerging countries, such as Argentina and Mexico, which led this request, is that the reallocation mechanism also reaches middle-income countries, considering the weight they have in the global population and output and their particular socioeconomic conditions.
Section 2 / The challenge of central banks in the face of climate change
Recently, there has been a renewed commitment at the international level to coordinate efforts in the fight against climate change, in which the reincorporation of the United States into the Paris Agreement is a very important milestone. While central banks (CBs) are not responsible for climate policy, they can play an important role, as European Central Bank (ECB) President Christine Lagarde has recently stated (see Lagarde (2021)).
In 2021, Italy took over the presidency of the G20 and set “People, Planet and Prosperity” as priorities, placing climate issues high on the agenda. It relaunched the Sustainable Finance Working Group (SFWG) that will develop a roadmap for sustainable finance based on scientific evidence, which will seek to homogenize and improve the quality of disclosure reports on climate issues, identify sustainable investments and align the efforts of international financial institutions with the Paris Agreement.
The involvement of CBs in the fight against climate change generated a debate among economists about what is the most appropriate way to frame it. If this would require extending their mandates, and on what could be the beginning of what the president of the Bank of France (BoF), François Villeroy de Galhau, called the beginning of a “mission creep”, which could end up weakening their independence and credibility (see Villeroy de Galhau (2021)). Although the institutional arrangements and the delimitation of the mandates of the CBs are quite heterogeneous (see Graph 1), many have as a subsidiary objective, within their powers and to the extent that it does not detract from the fulfillment of their main objectives, to collaborate with the policies carried out by the government or to contribute to development. But beyond this, as we will see shortly, global warming also makes it difficult to meet the traditional primary objectives of the CBs: monetary stability and financial stability.
Graph 1 | The mandates of Central Banks
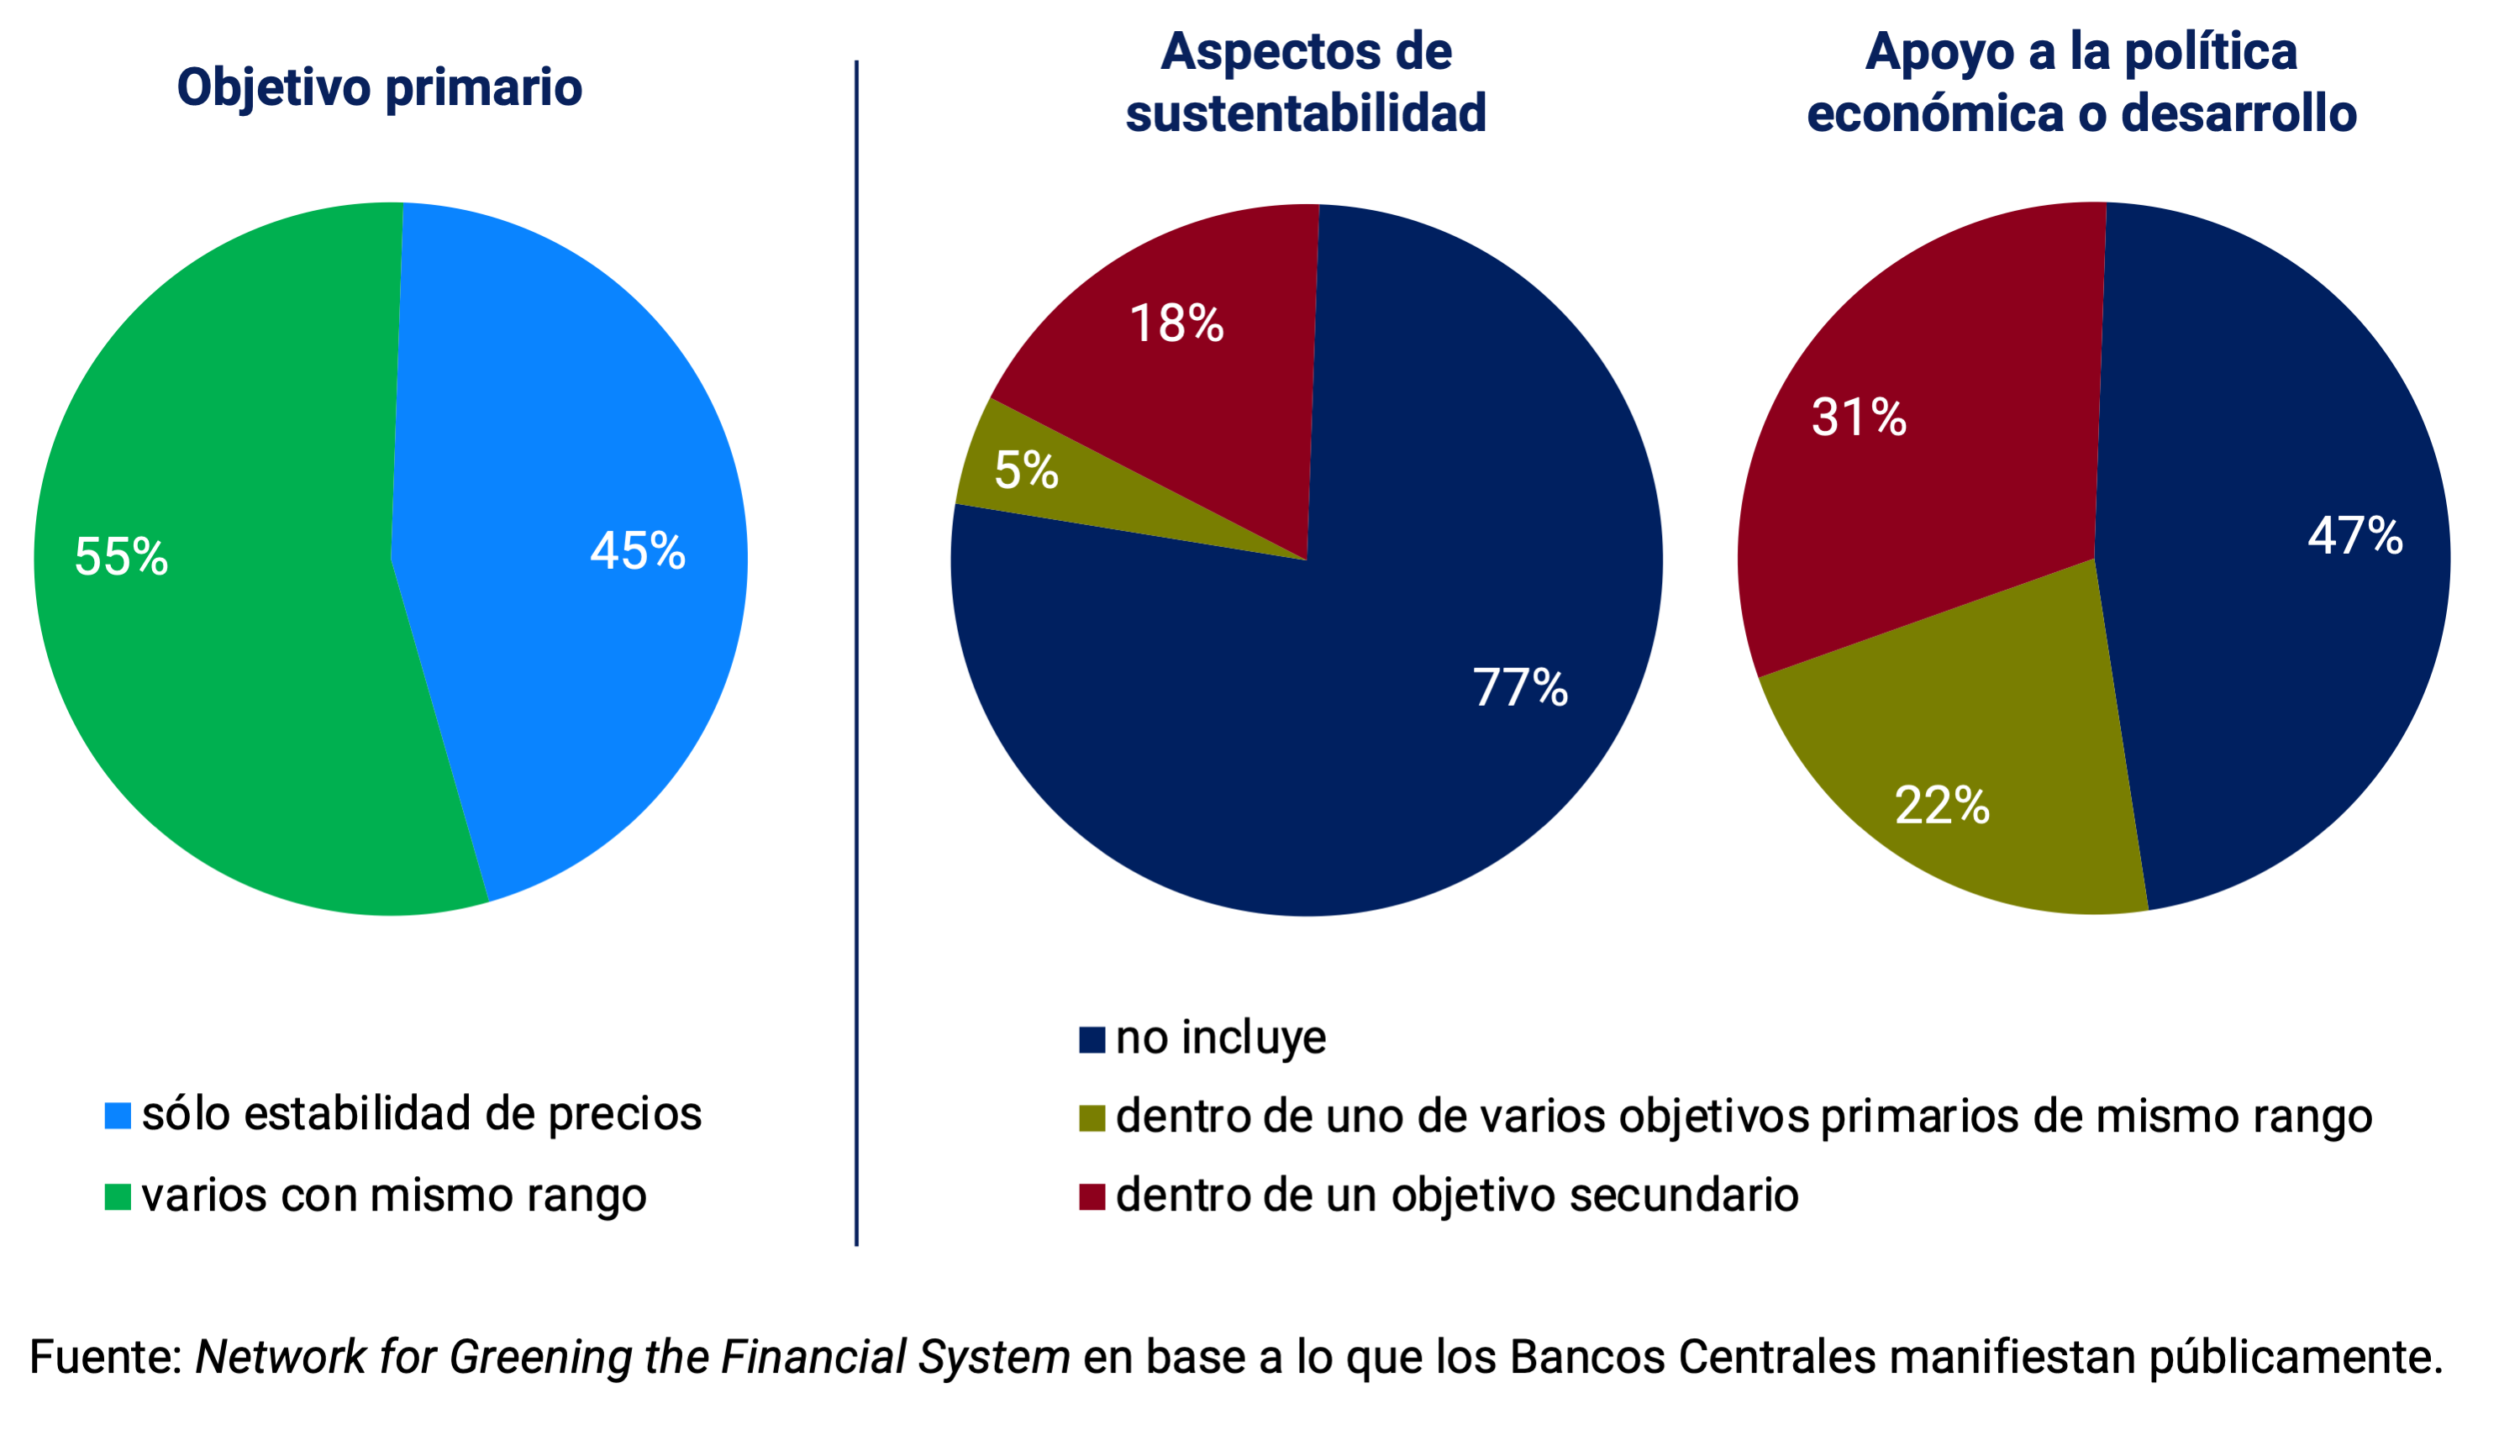
The effects of climate change on financial stability
Climate change generates financial risks that can affect the stability of the financial system, so regulation and supervision must ensure that the system can withstand these risks. As Bolton et al. (2020) point out, there are two main channels through which it operates: physical risk and transition risk.
Physical risk relates to the economic costs and financial losses generated both by the increased frequency and severity of climatic events (intense storms, floods, droughts, extreme heat waves), and by the effects of long-term climatic trends (desertification, sea-level rises, sea acidification). This could lead to losses and increase the fragility of financial intermediaries exposed to these risks. And given that this type of event can be characterized as ‘green swans’, by presenting a probabilistic distribution with heavy tails, could make capital buffers not enough to absorb the losses associated with the materialization of such climate risks, which in turn could generate contagion and successive rounds of asset price corrections.
Transition risk is associated with losses that can be caused due to a rapid migration to cleaner energy and low-emission production methods. It includes the risks of policy changes, reputational risks, technological advances or restrictions, and also changes in consumer preferences. An accelerated transition could cause some assets, such as fossil fuel reserves, to become stranded assets untapped for years.
Although both risks are often treated as if they were independent, in reality they are not, since there is a certain trade-off between them. Thus, a more aggressive emissions reduction policy would increase the transition risk, while limiting the physical risk.
Climate change and monetary stability
Climate change also presents a major challenge to monetary stability. In order to implement its monetary policy, it is useful to characterize the nature of the shocks to which the economy is exposed, whether they are supply shocks, demand shocks, and whether they are considered transitory or permanent (see NGFS (2020a)). Global warming involves shocks that affect both demand and supply; and while some, such as certain specific climatic events, may be more transitory, others, such as the desertification of some areas, or the flooding of some others, on the other hand, may be more permanent and even irreversible.
On the supply side, climate change is accompanied by a greater frequency and severity of extreme weather events, which can affect, for example, the supply of agricultural products, generating greater volatility in their prices. They can also affect certain facilities and infrastructure, which would alter the normal functioning of some production chains and tourism.
In turn, global warming, by raising the temperature and changing humidity conditions, can reduce crop yields, and can also affect the labor productivity of some activities that require work during long hours exposed to the weather, such as construction and many primary activities.
On the demand side, these phenomena reduce wealth. In addition, the greater uncertainty generated by climatic events increases precautionary behaviors that reduce spending (although on the other hand this could be at least partially offset by the need to replace damaged goods and the eventual accumulation of inventories).
In addition to these physical risks, there is the risk of transition, caused by policies to replace energy and production processes with less polluting ones, and policies to mitigate the damage caused by climate change (which are not known with certainty, but are subject to political uncertainty), which generates, in addition to changes in the level of expenditure, reallocation of resources between sectors and variations in magnitude in relative prices.
But the complexity is not limited to identifying the nature of the shocks, as global warming itself complicates a correct assessment of both the stance and the space of monetary policy. Indeed, by affecting the level of output and potential output, it complicates the correct assessment of the moment of the cycle in which the economy finds itself, and with it, it is difficult to calibrate interest rate policy.
On the other hand, global warming, by affecting the valuation of assets, the balance sheets of financial intermediaries and the financial conditions of some markets, may alter the mechanisms of transmission of monetary policy (see Diagram 1).
Diagram 1 | The challenges for monetary policy in the face of climate change
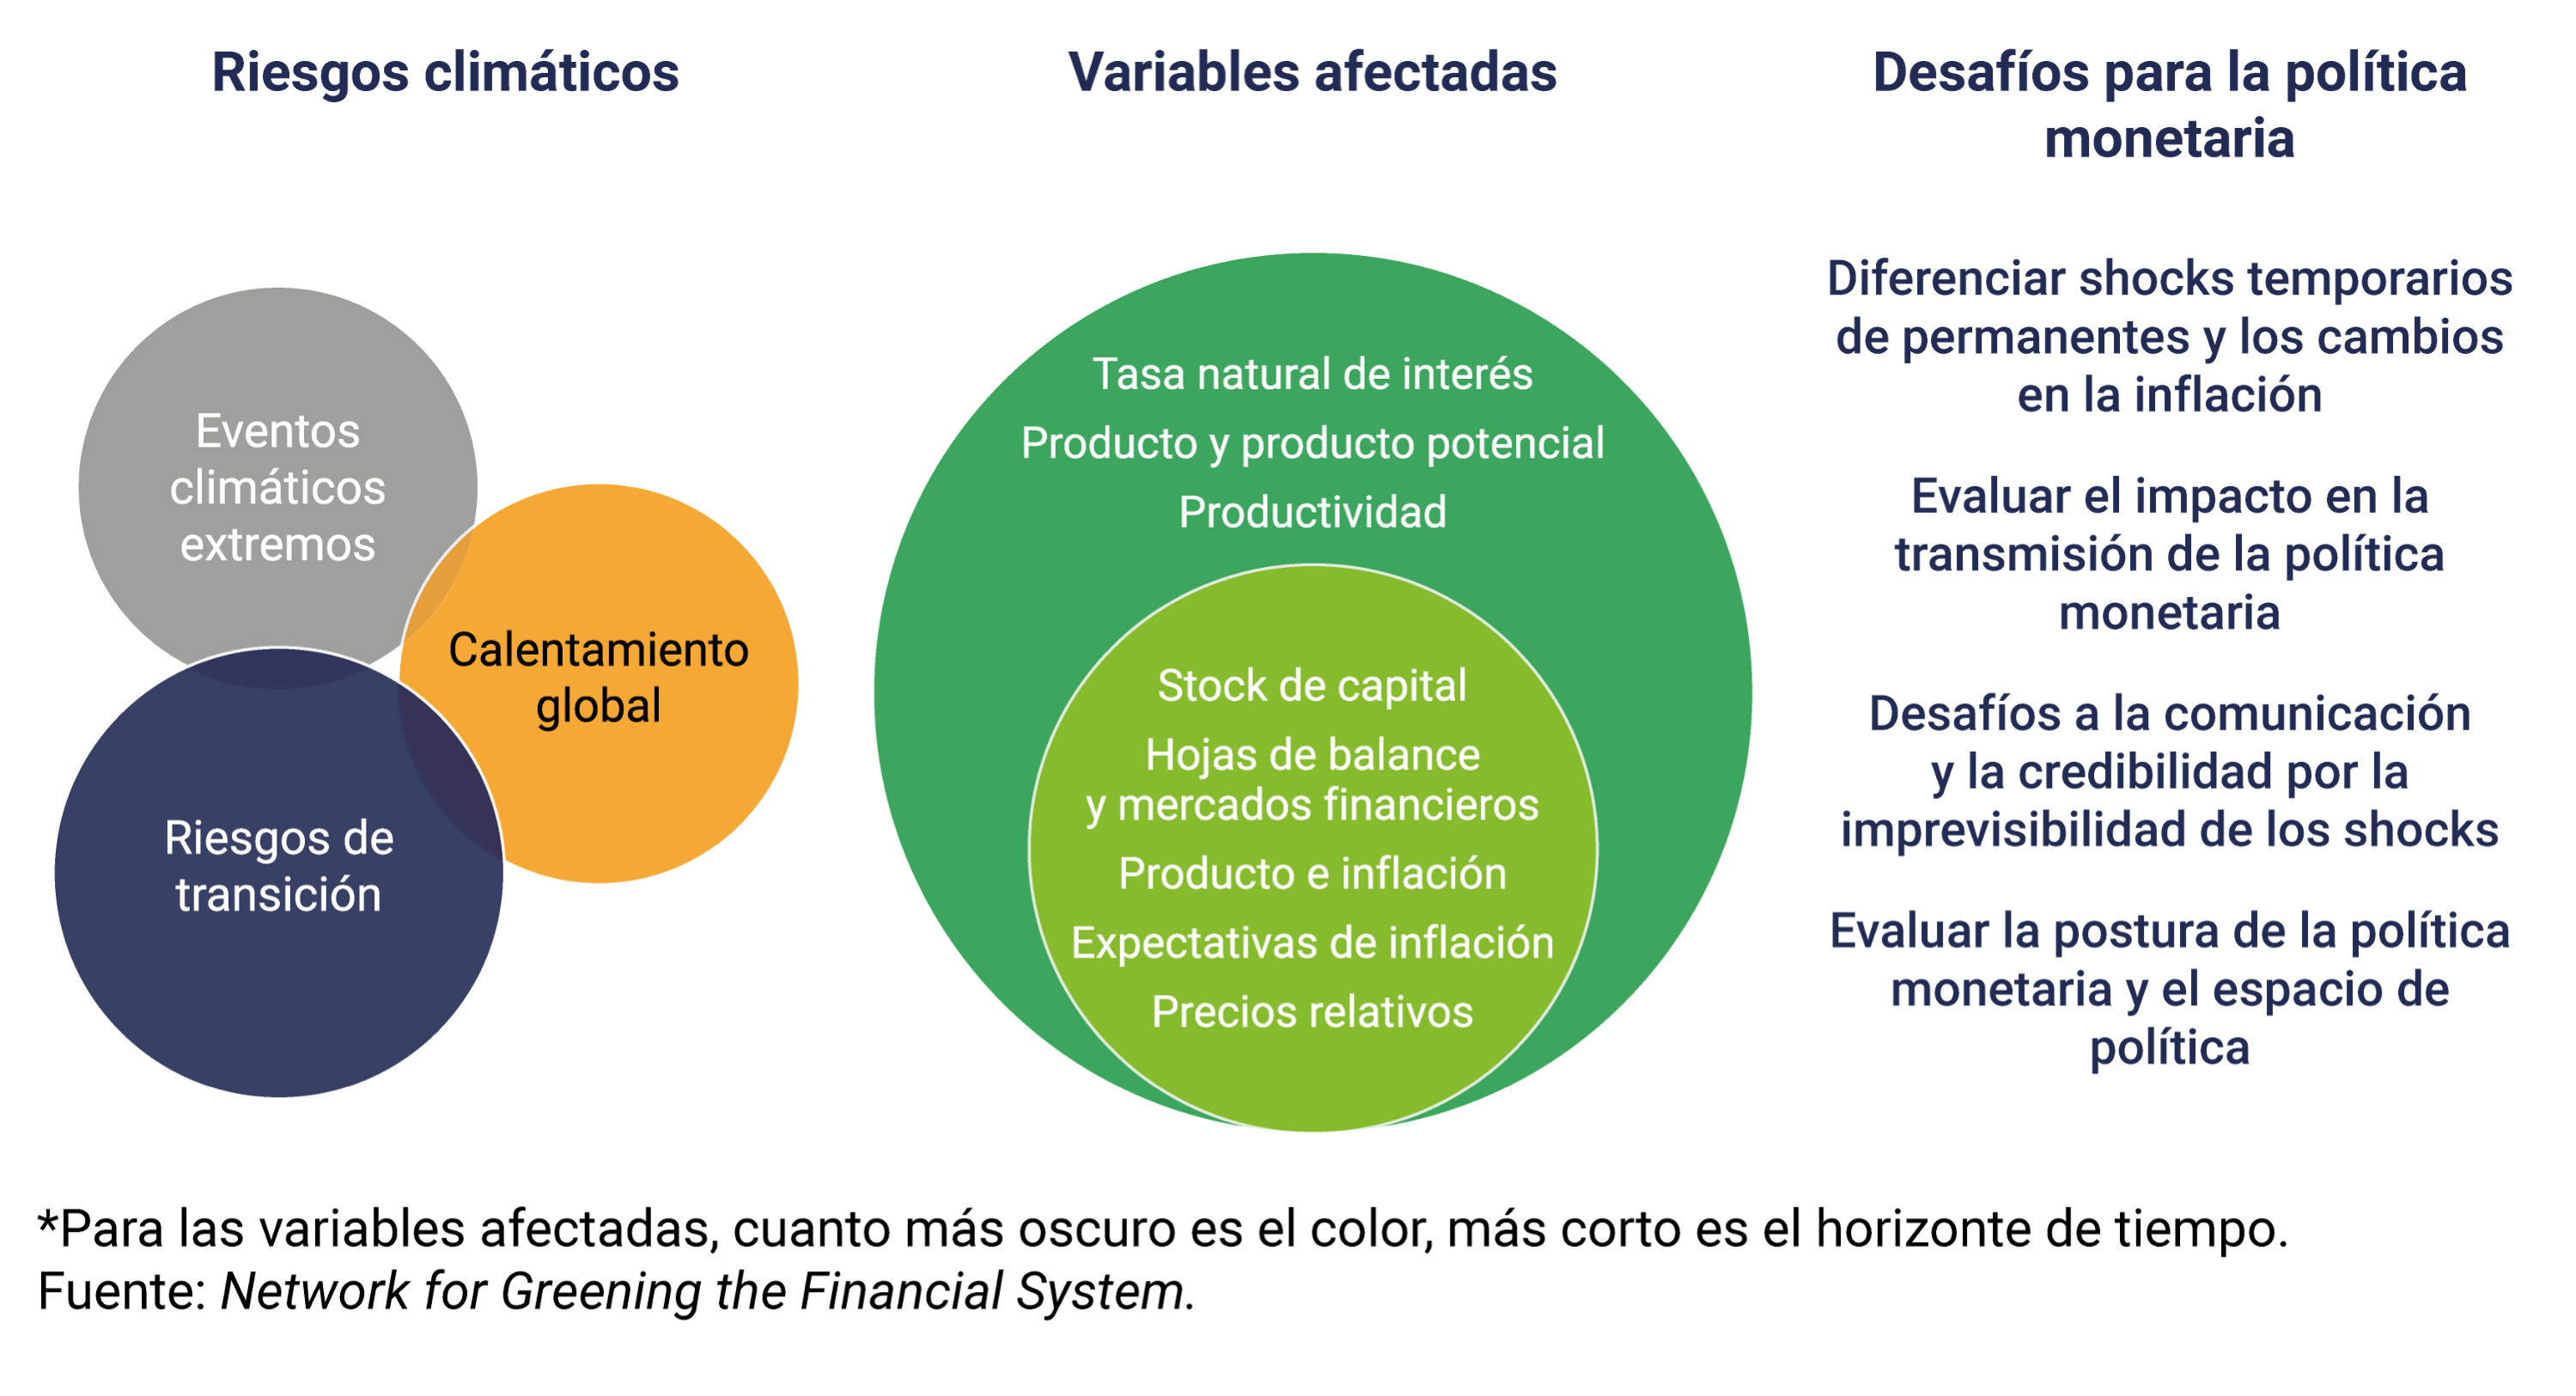
Finally, Bolton et al. (2020) point out three special considerations in the case of monetary policy responses to shocks related to climate warming. First, as the trajectory of climate change is expected to be maintained over an extended period of time, this could lead to stagflationary supply shocks that are difficult to fully reverse with monetary policy measures. Second, because climate change is a global problem, it requires a global response, where what a single country does might be irrelevant, and what is required is a major effort of international coordination. Finally, given the ‘green swan’ nature of global warming, it does not seem plausible that Central Banks could take preventive measures to protect themselves ex ante against climate risks.
The redistributive effects of global warming
Global warming and the efforts made to prevent it generate redistributive effects in various dimensions. First, there is an intertemporal dimension, related to what Mark Carney called, the tragedy of the horizon (see M. Carney (2015)). The accumulation of polluting emissions has effects that are really worrying in a time horizon that exceeds the duration of the mandates of elected public servants and the periods in which policy makers are in office. And in particular, it exceeds the horizon of action of monetary policy and financial regulation that Central Banks carry out in the fulfillment of their mandates. Policies aimed at reducing the rate of emissions imply making an effort today, and increasing a transition risk, to achieve a benefit and lower physical risk in the future, which would be fully exploited by future generations.
A second dimension is within societies, where it is observed that there is a higher degree of awareness about the risks posed by climate change the higher the levels of income and wealth, which is why for many it was considered a ‘problem of the rich’. On the other hand, there is an extensive literature that advocates for equity and social justice when designing adaptation and mitigation policies. To be viable, a better understanding of the redistributive effects of climate change, adaptation policies, and associated mitigation costs is required (see Bolton et al. (2020)).
Third, there are significant heterogeneities between countries both in the contribution to cumulative gas emissions and in terms of exposure to potential risks. Naturally, the currently most developed countries, led by the US and European countries, are the ones that have historically contributed the most to CO2 emissions, to which China, and to a lesser extent, India have been added in recent decades (see Figure 2). Paradoxically, the geographical distribution of the potential physical risks generated by global warming is biased against emerging economies that depend more intensely on primary production. Countries with urban settlements in coastal areas that may be more affected by a change in sea level are also more vulnerable. Transition risks, meanwhile, could affect more intensely those countries with greater natural endowments of fossil fuels, and those with a more carbon-intensive industry.
Graph 2 | Annual carbon dioxide emissions by region
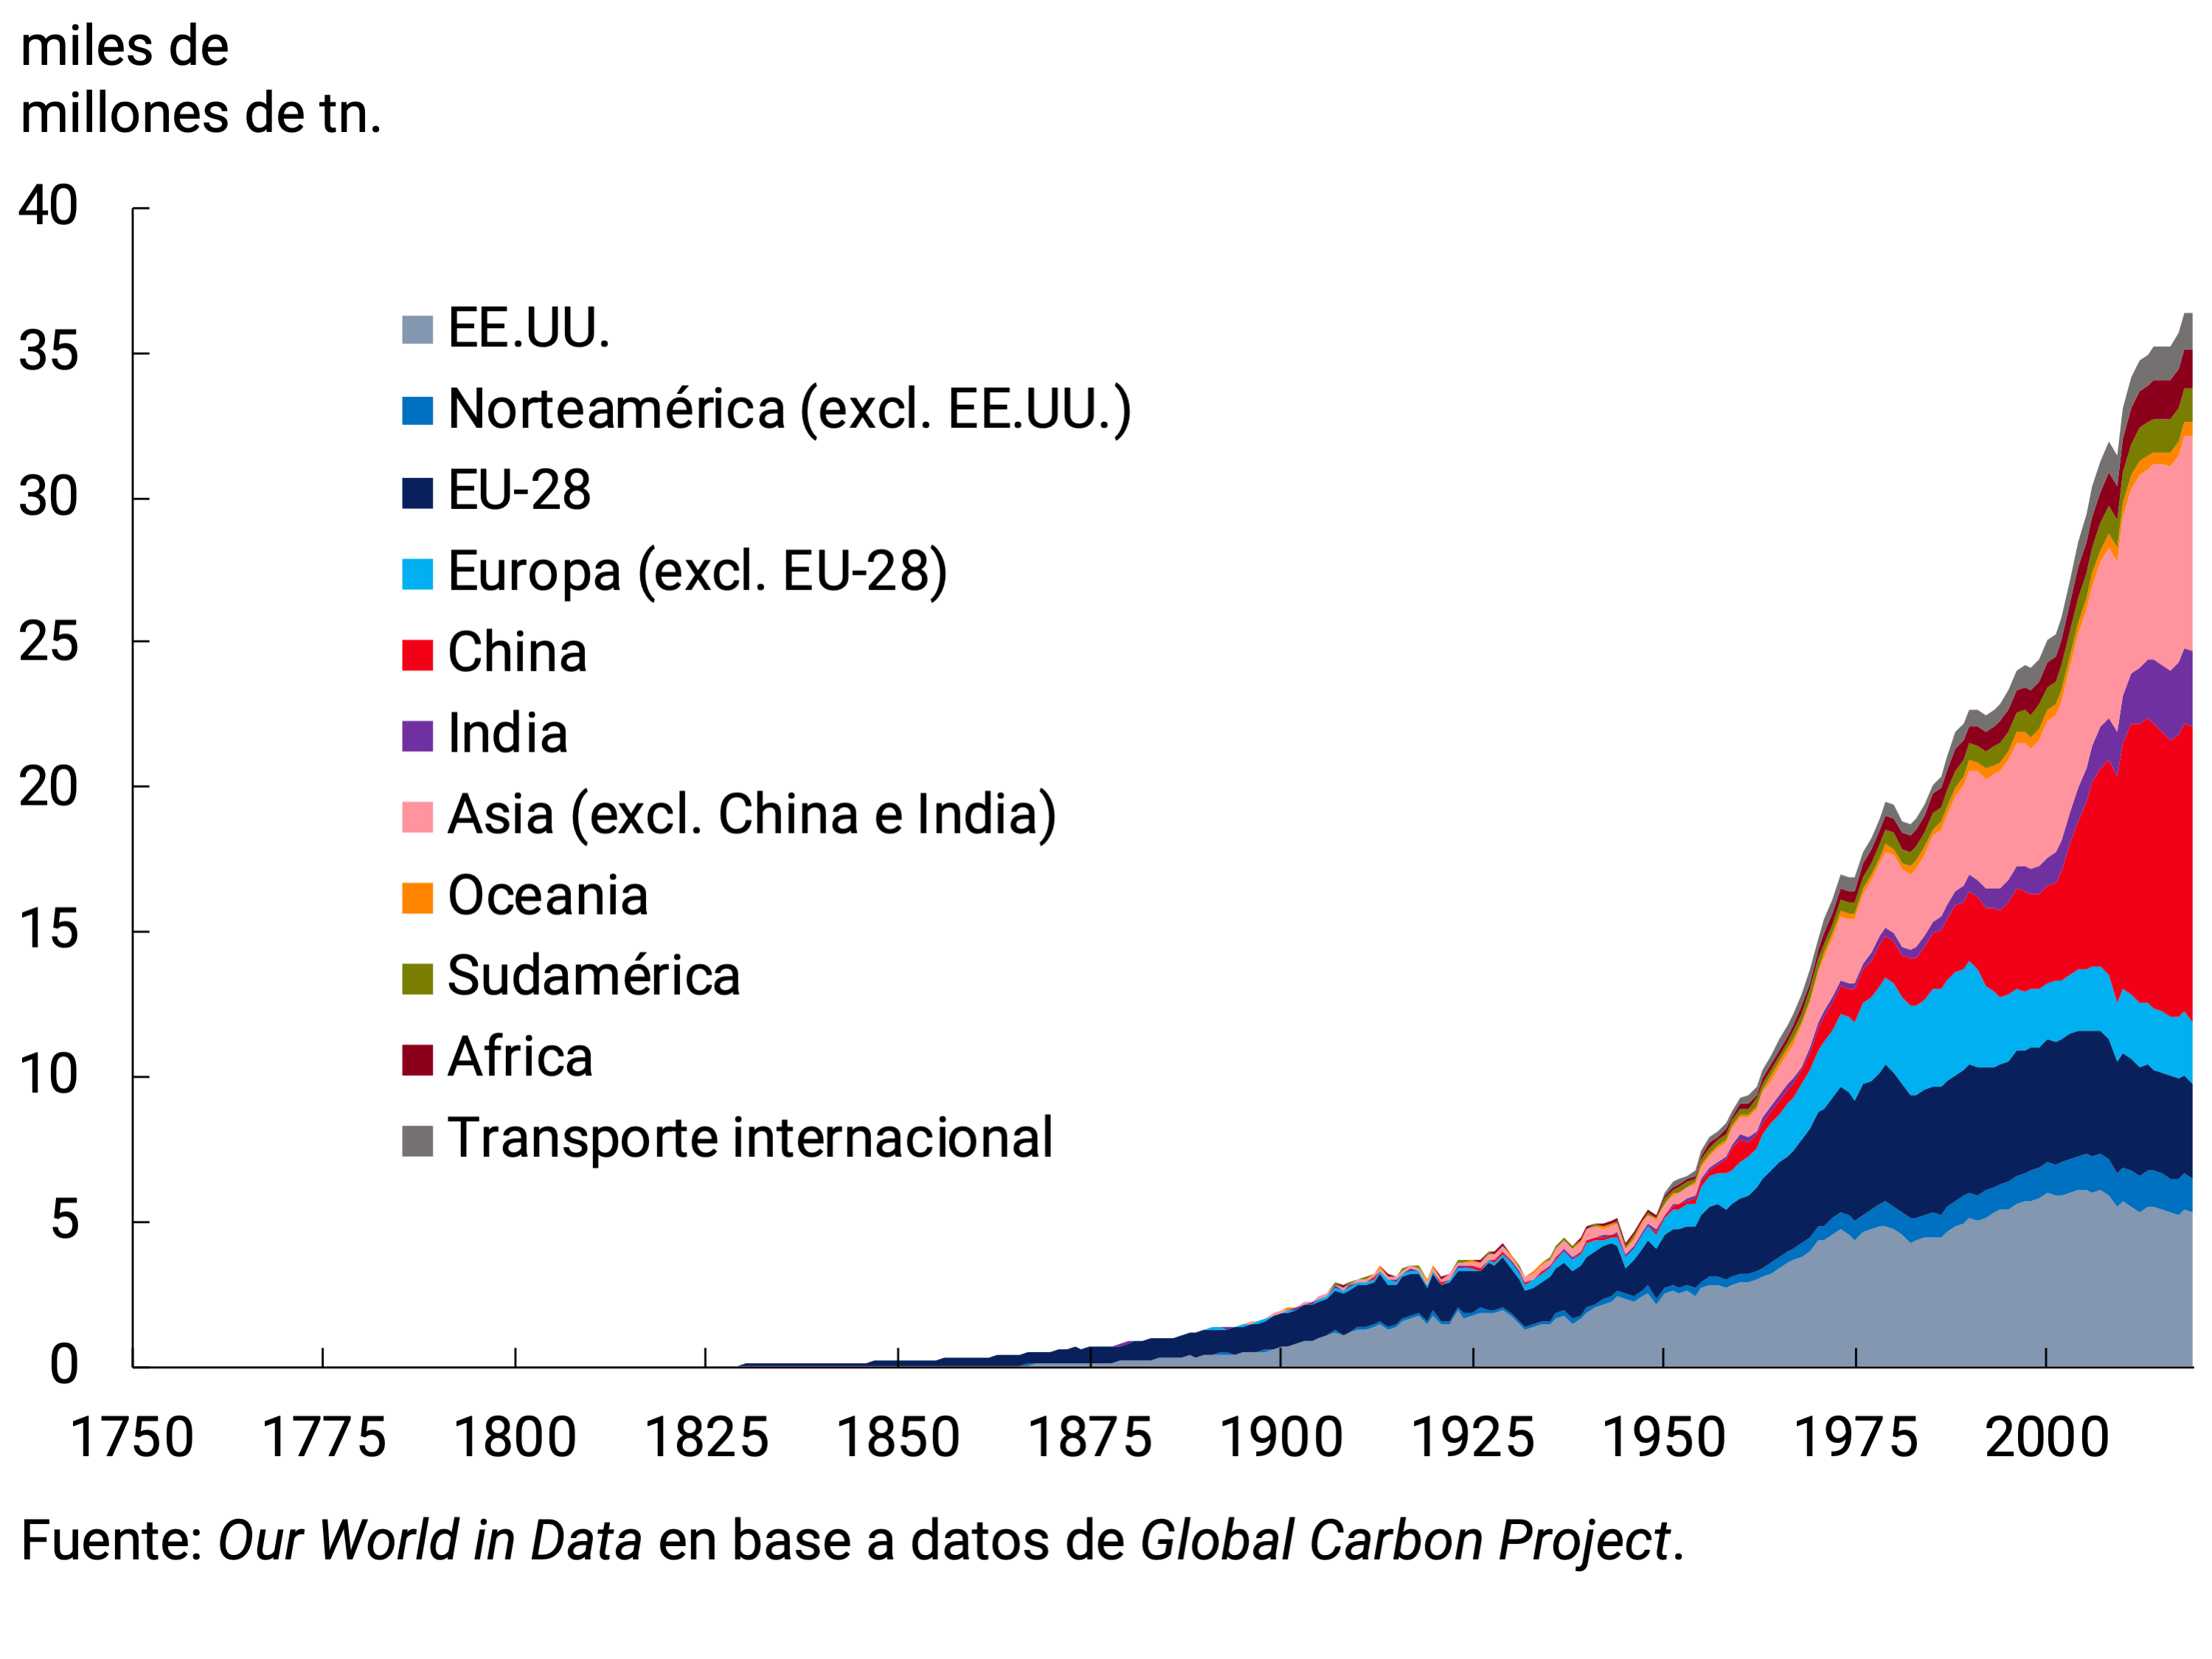
Given the distributional impact of climate change on emerging countries and the need to expand international mechanisms to finance their transition and reduce their vulnerability to climate events, a mechanism was established to enable richer countries to contribute to the cost of adaptation by developing countries, through the creation of an Adaptation Fund. although its practical implementation has so far been limited (see Bolton et al (2020)).
With the same purpose, at the recent Leaders’ Summit on Climate, the President of the Argentine Republic, Alberto Fernández, renewed the country’s commitment to the Paris Agreement, while setting ambitious goals to address climate change and mentioning the need to renew the international financial architecture and speed up the mobilization of resources. including the swap of debt for climate action, given that debt is part of the problem and the difficulties of many countries to advance in the transition.
References
– Bolton, P., Despres, M., Pereira da Silva, L., Samama, F. Svartzman, R. (2020) The green swan. Central banking and financial stability in the age of climate change. BIS. January 2020.
– Carney, M. (2015) “Breaking the Tragedy of the Horizon – Climate change and financial stability”. Speech given in Lloyd’s of London. September 2015.
– Lagarde, C. (2021) Climate change and central banking. Keynote speech at the ILF conference on Green Banking and Green Central Banking. January 2021.
– Network for Greening the Financial System (2020a) Climate Change and Monetary Policy. Initial takeaways. Technical document prepared by the “Scaling up Green Finance” workstream chaired by Mauderer, S. from the Deutsche Bundesbank. June 2020.
– Network for Greening the Financial System (2020b) Survey on monetary policy operations and climate change: key lessons for further analyses. Technical document prepared by the “Scaling up Green Finance” workstream chaired by Mauderer, S. from the Deutsche Bundesbank. December 2020.
– Villeroy de Galhau, F. (2021) The role of central banks in the greening of the economy. Speech at the Banque de France’s 5th edition of the Rencontres on “Climate Change and Sustainable Finance”. Paris. February 2021.
Section 3 / Changes in work modalities: Teleworking in Argentina
The pandemic and the measures implemented to mitigate its health effects forced changes in the way many people work. In this context, both in Argentina and in the rest of the world, the proportion of workers who perform work tasks from home increased sharply. This modality, which made it possible to circumvent mobility restrictions by cushioning their impact on economic activity, is shaping up (subject to changes and improvements) to last beyond the duration of the pandemic.
Teleworking, defined as “the use of information and communication technologies to work outside the employer’s premises” (Eurofund and ILO, 2019), cannot be considered as a new work methodology. This labor regime had been gaining ground in recent decades, to a greater or lesser extent, in all the economies of the world. What is new is its massive use during the context of the COVID-19 pandemic. This phenomenon made it possible to cushion the effects of confinement and social distancing measures on the activity of many sectors of the economy.
While the increase in telework was widespread globally, the countries most affected by the virus and those with the highest levels of teleworking pre-pandemic were those that recorded the highest levels of telework. As an example, approximately 60% of Finnish workers worked from home at the peak of the pandemic. The levels of teleworking in Latin America, despite having suffered a strong epidemiological impact, were significantly lower. In Chile, 20.3% of employed people worked from home between April and June 2020. In Uruguay, where the first wave had a slight impact in relative terms, 19.3% of people teleworked during April 2020 but that percentage decreased over the months.
In Argentina, the Permanent Household Survey (EPH) carried out by the Institute of Statistics and Census (INDEC) on a quarterly basis, allows the phenomenon of teleworking to be analyzed from different perspectives. During the first quarter of 2020 (pre-pandemic) the percentage of employed people who carried out their work tasks from home reached 6.1% of the total, while in the two subsequent quarters, driven by the rise in COVID-19 cases and the implementation of Social, Preventive and Mandatory Isolation (ASPO), this indicator climbed to 22.2% and 21.9%. respectively. During the fourth quarter of 2020, the percentage of employed people who carried out their work tasks from home remained above 20% despite the relaxation of mobility restrictions resulting from the sharp fall in the contagion curve.
Throughout the Argentine geography, teleworking experienced something similar to what happened in the international arena. While teleworking increased significantly in all regions, it stood out in those where the epidemiological situation was more complex and whose previous levels of teleworking were higher before the outbreak of COVID-19. In the GBA and the Pampas region, the highest levels of teleworking in the country were reached (25.5% in III-20 and 21.7% in II-20, respectively; see Graph 1).
Graph 1 |
(a) Telework by region
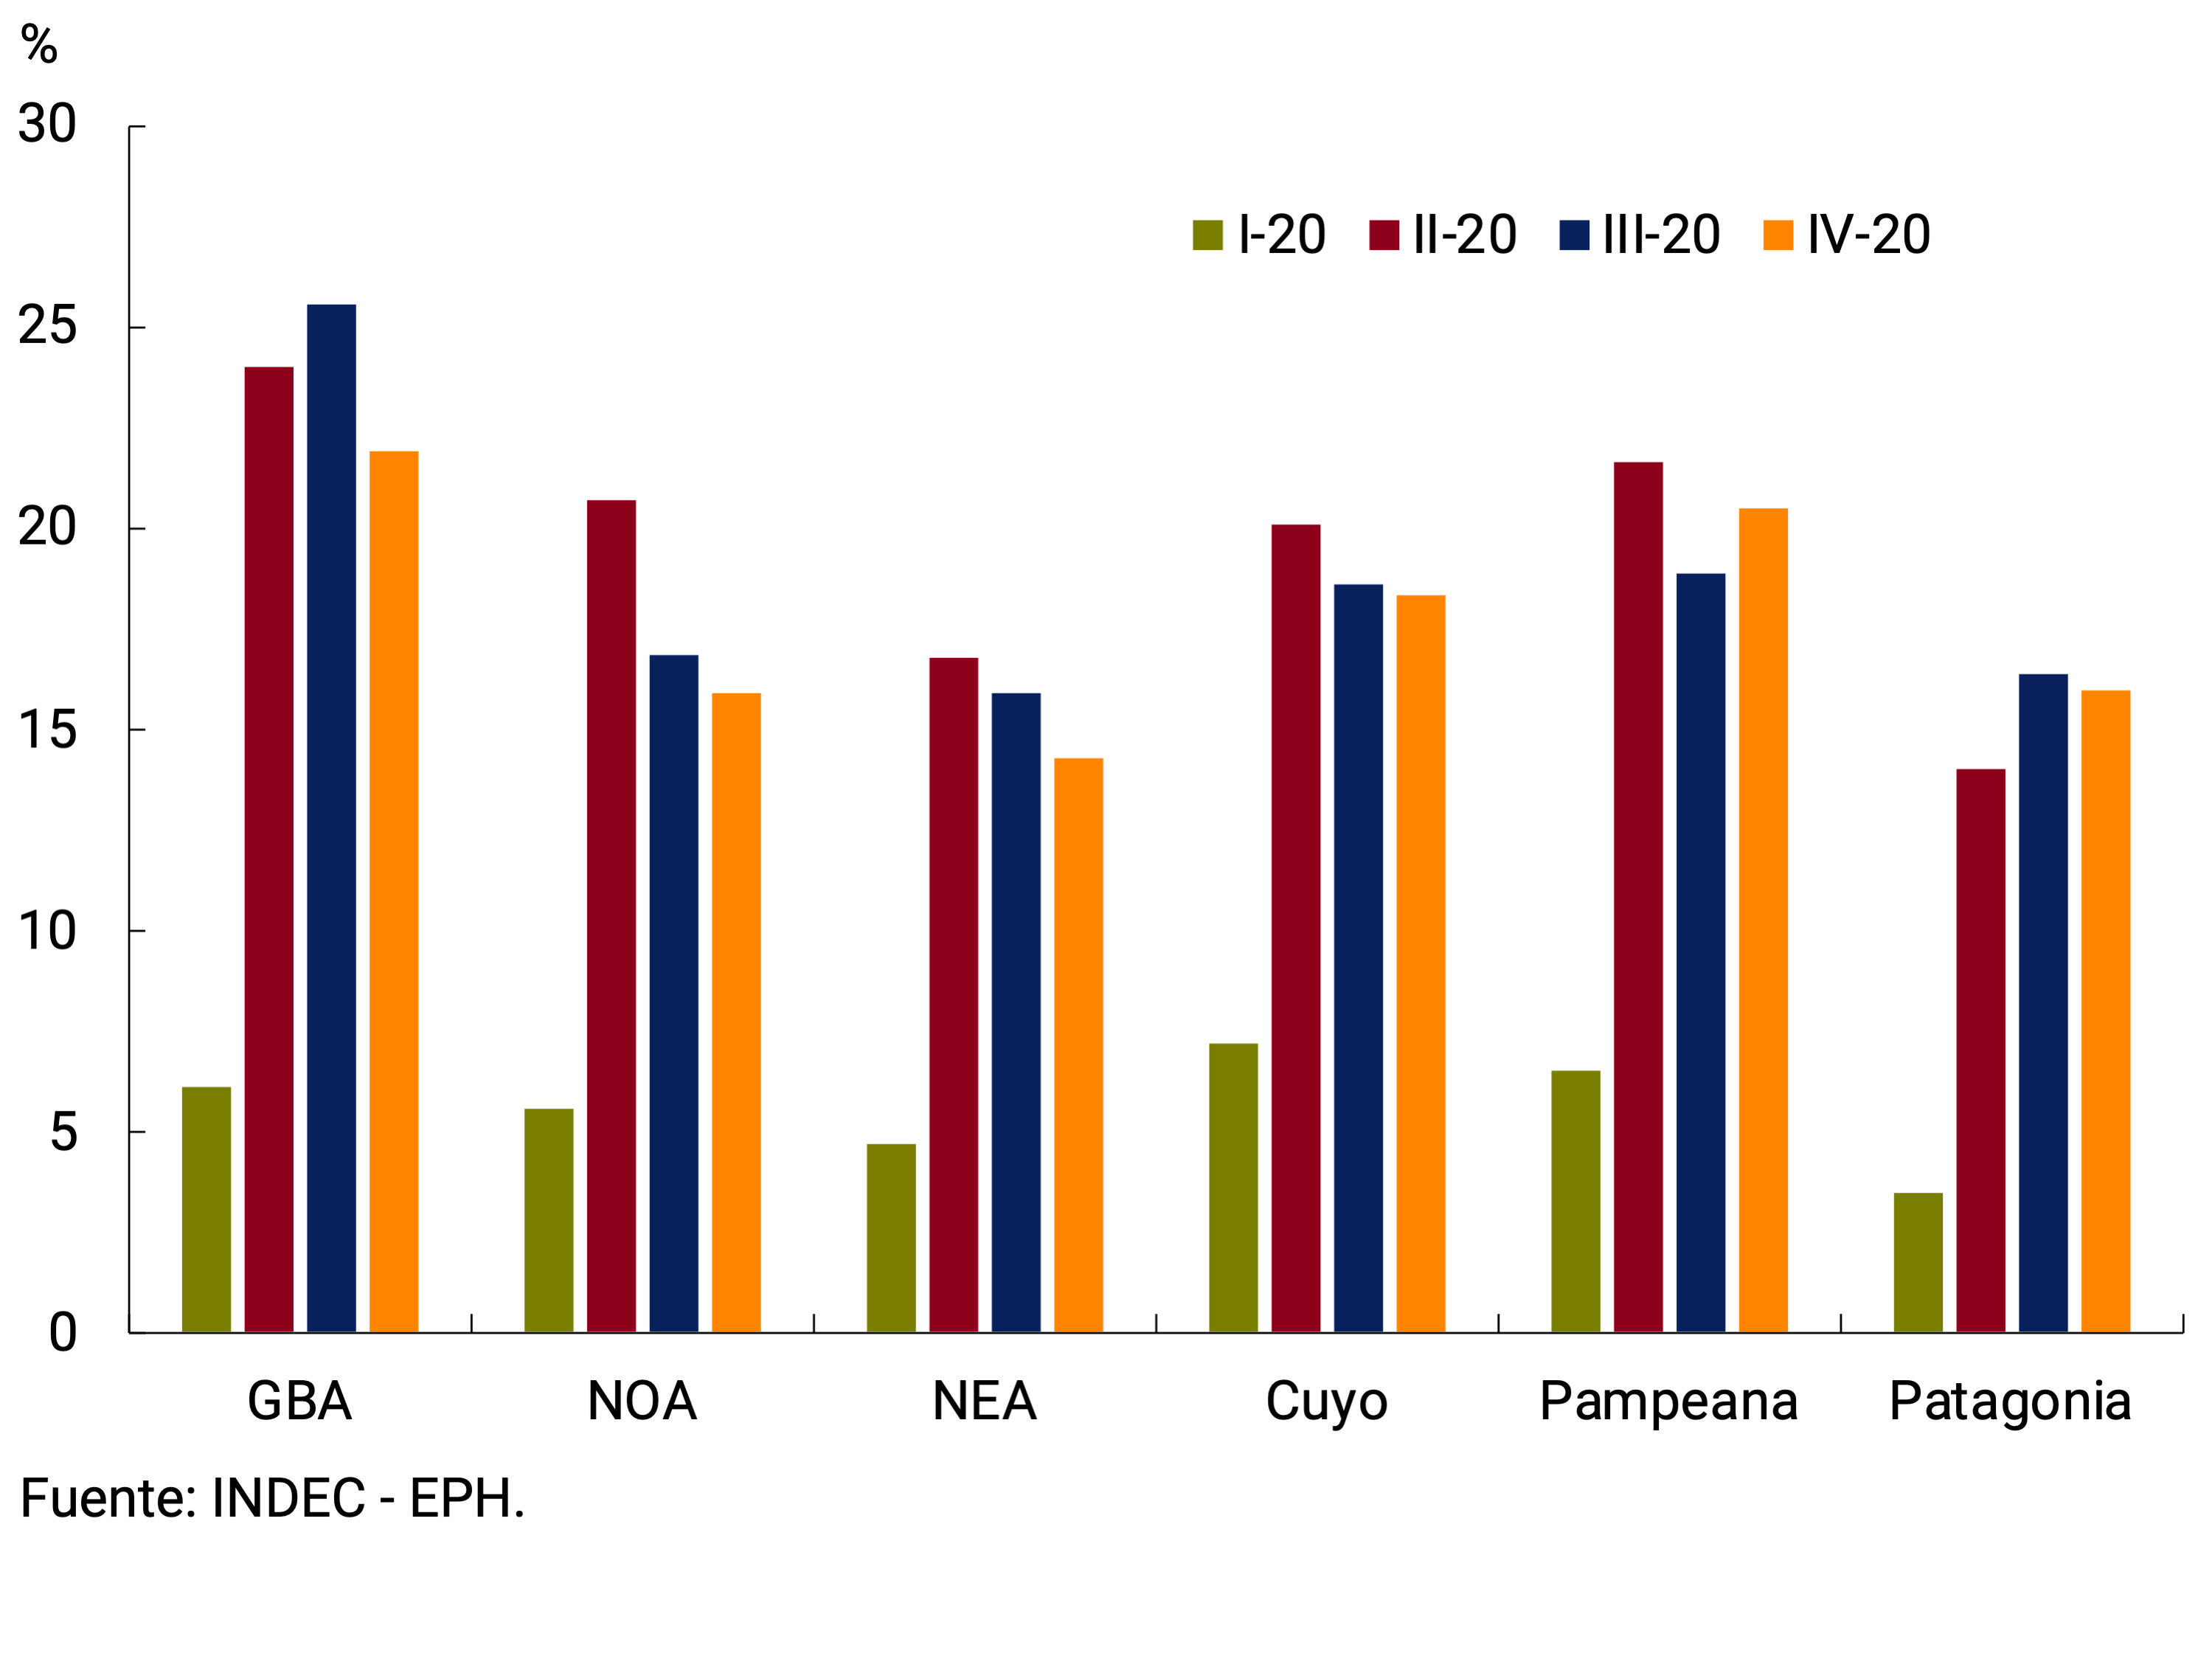
(b) Telework by occupational category
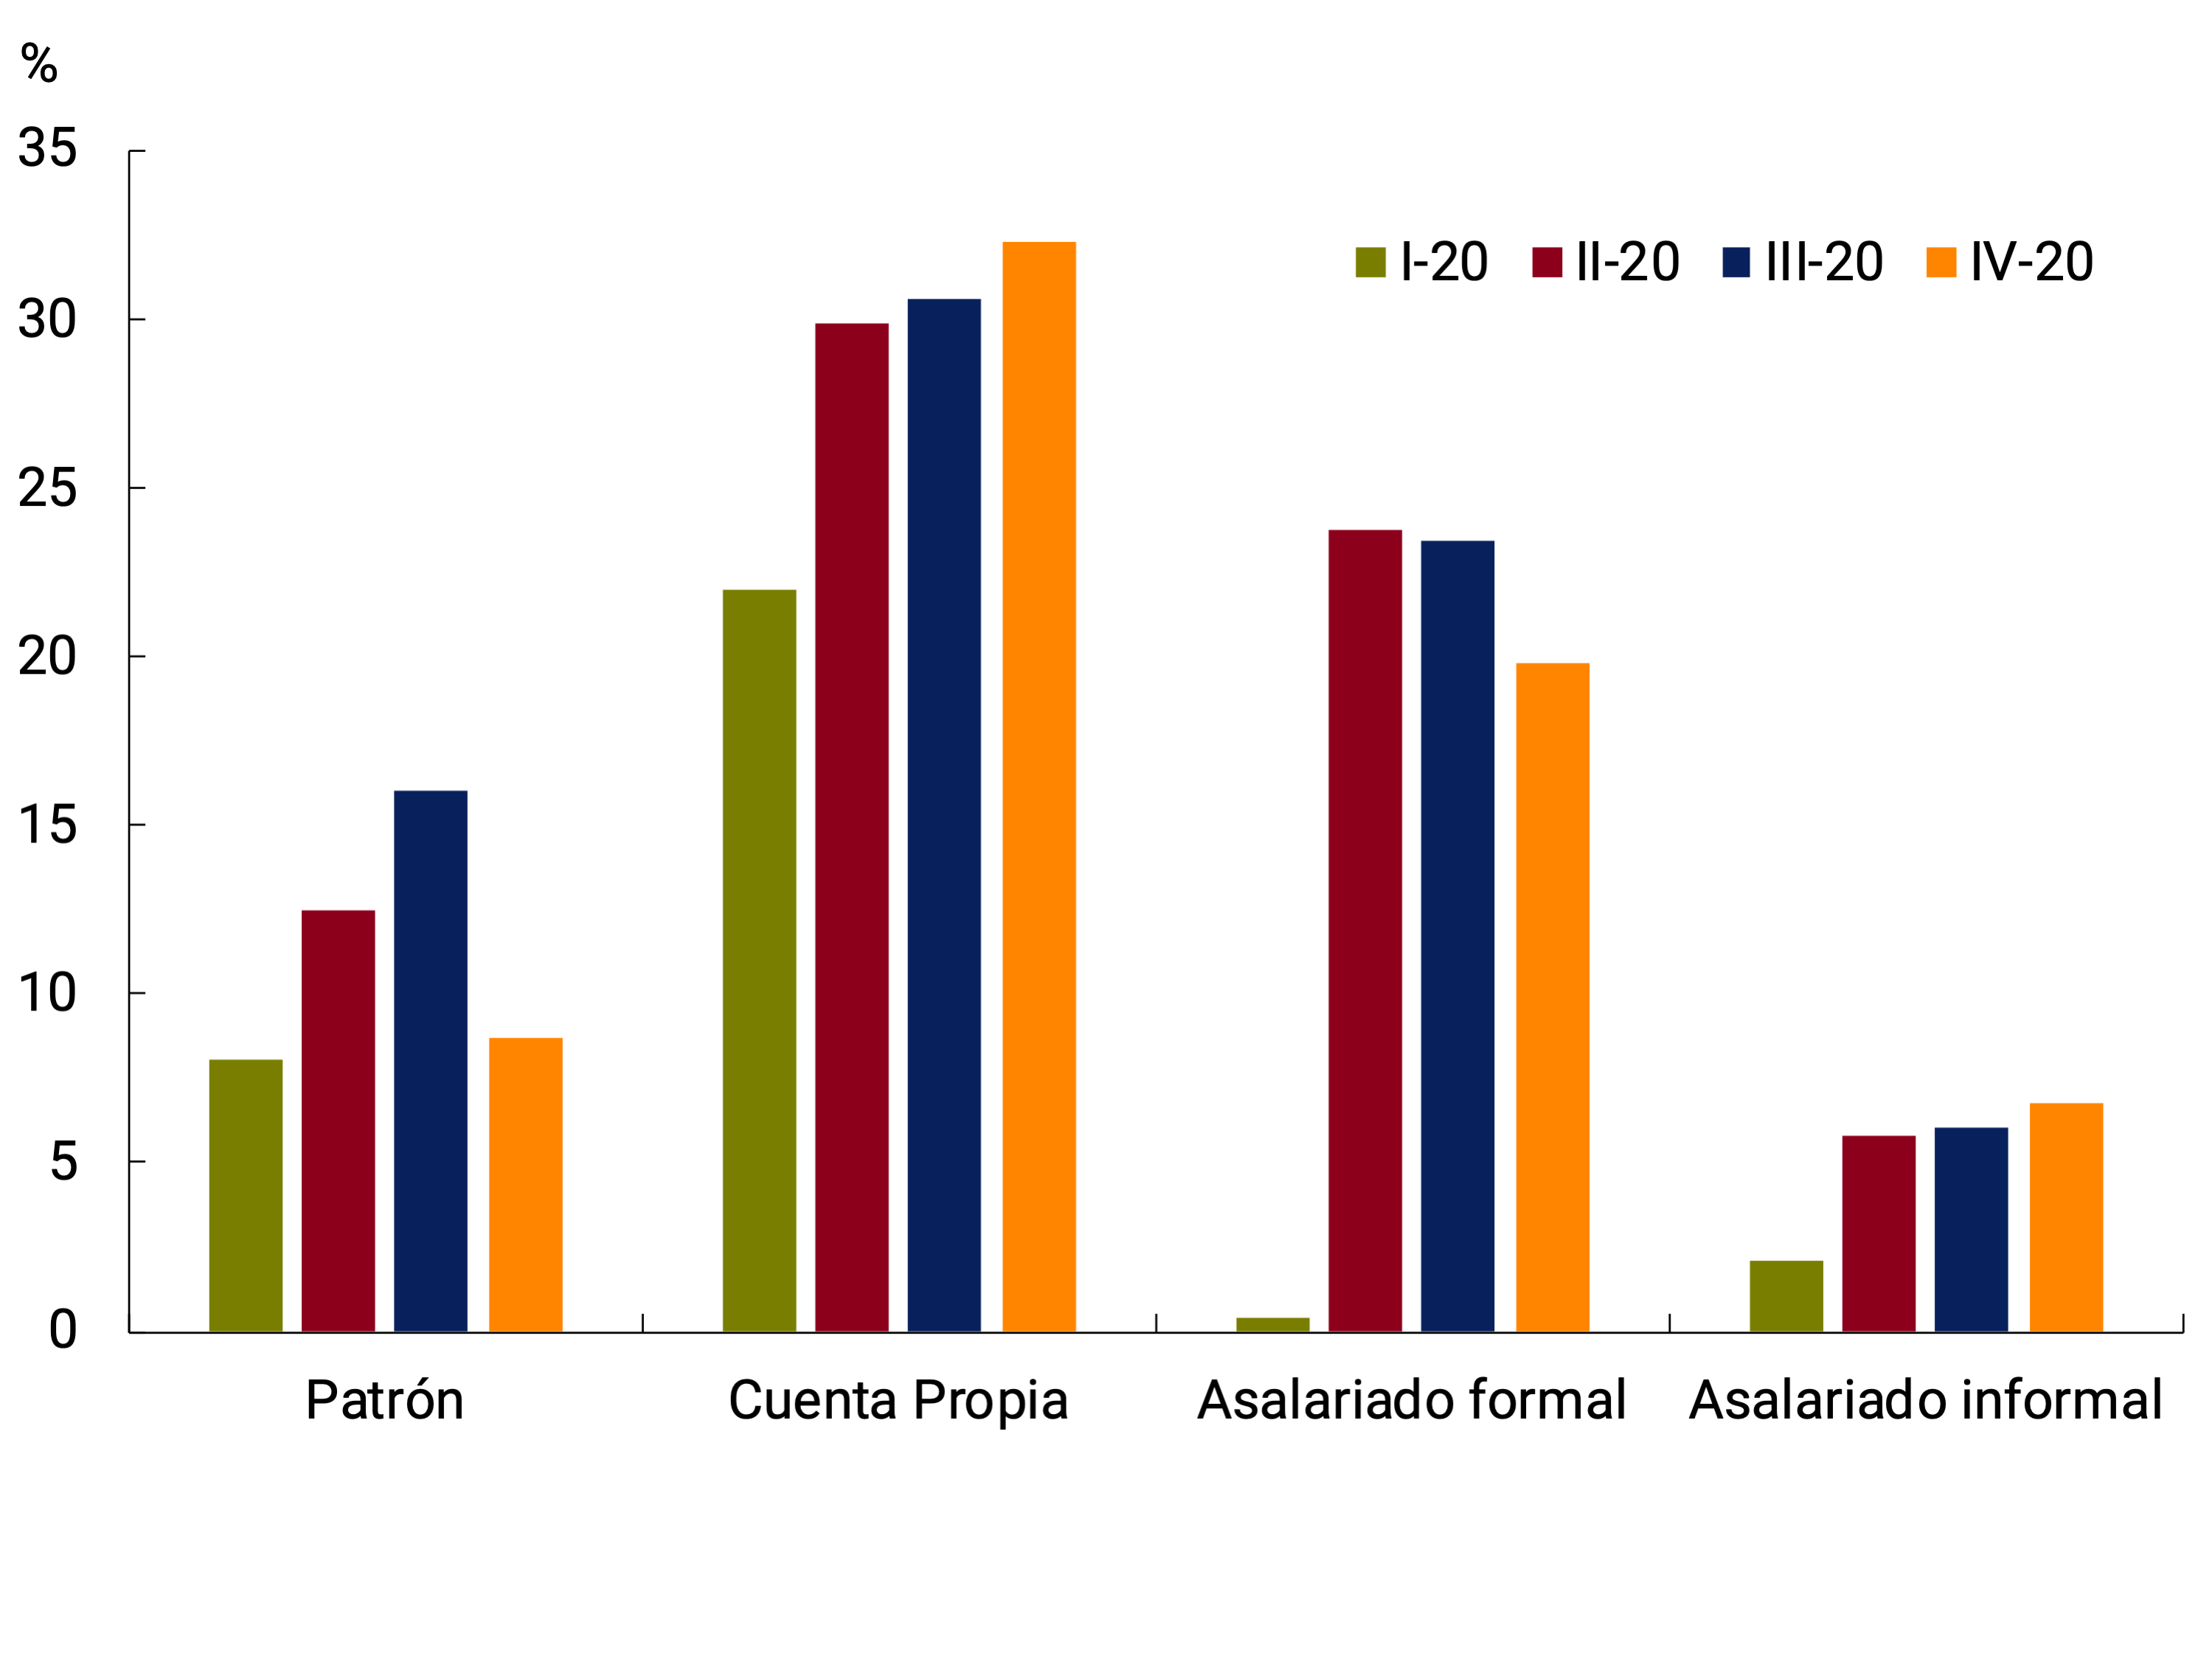
From an occupational perspective, it can be seen that it was, to a large extent, formal wage earners who drove the sharp increase in teleworking during the pandemic (See Graph 1). Although they are not the occupational category that reached the highest level of teleworking (it was self-employment), they are the ones that had the most abrupt growth, since they started from an almost zero level in the pre-pandemic. This effect, added to the fact that they are the most relevant occupational category in terms of the number of jobs, explains the high impact that formal salaried people have had on the general level.
Analysing the phenomenon of teleworking from a gender perspective, we observe that prior to the outbreak of the pandemic, women who worked from home more than doubled the percentage corresponding to men (8.5% and 4.1% respectively for the first quarter of 2020). This, added to a greater growth in female teleworking in the context of the pandemic, results in the fact that in the fourth quarter of 2020, 29.3% of female workers carried out their work tasks from home, while within men this percentage reached only 13.1%.
In terms of educational profile, the greatest dynamism occurred in employed people with more education (See Graph 2). On the one hand, within the group with completed primary school, no change was directly visualized since the outbreak of the pandemic. On the other hand, the variation within those employed with completed secondary education is not significant when compared to the strong growth observed within the group with tertiary/university studies and the group with postgraduate studies. Given the abrupt way in which this change in work modality took place, it is natural that workers with more education, and therefore greater knowledge (and tenure) in terms of the information and communication technologies necessary to telework, have experienced a disproportionate growth compared to workers with lower levels of education.
Graph 2 |
(a) Telework by gender

(b) Telework by educational level
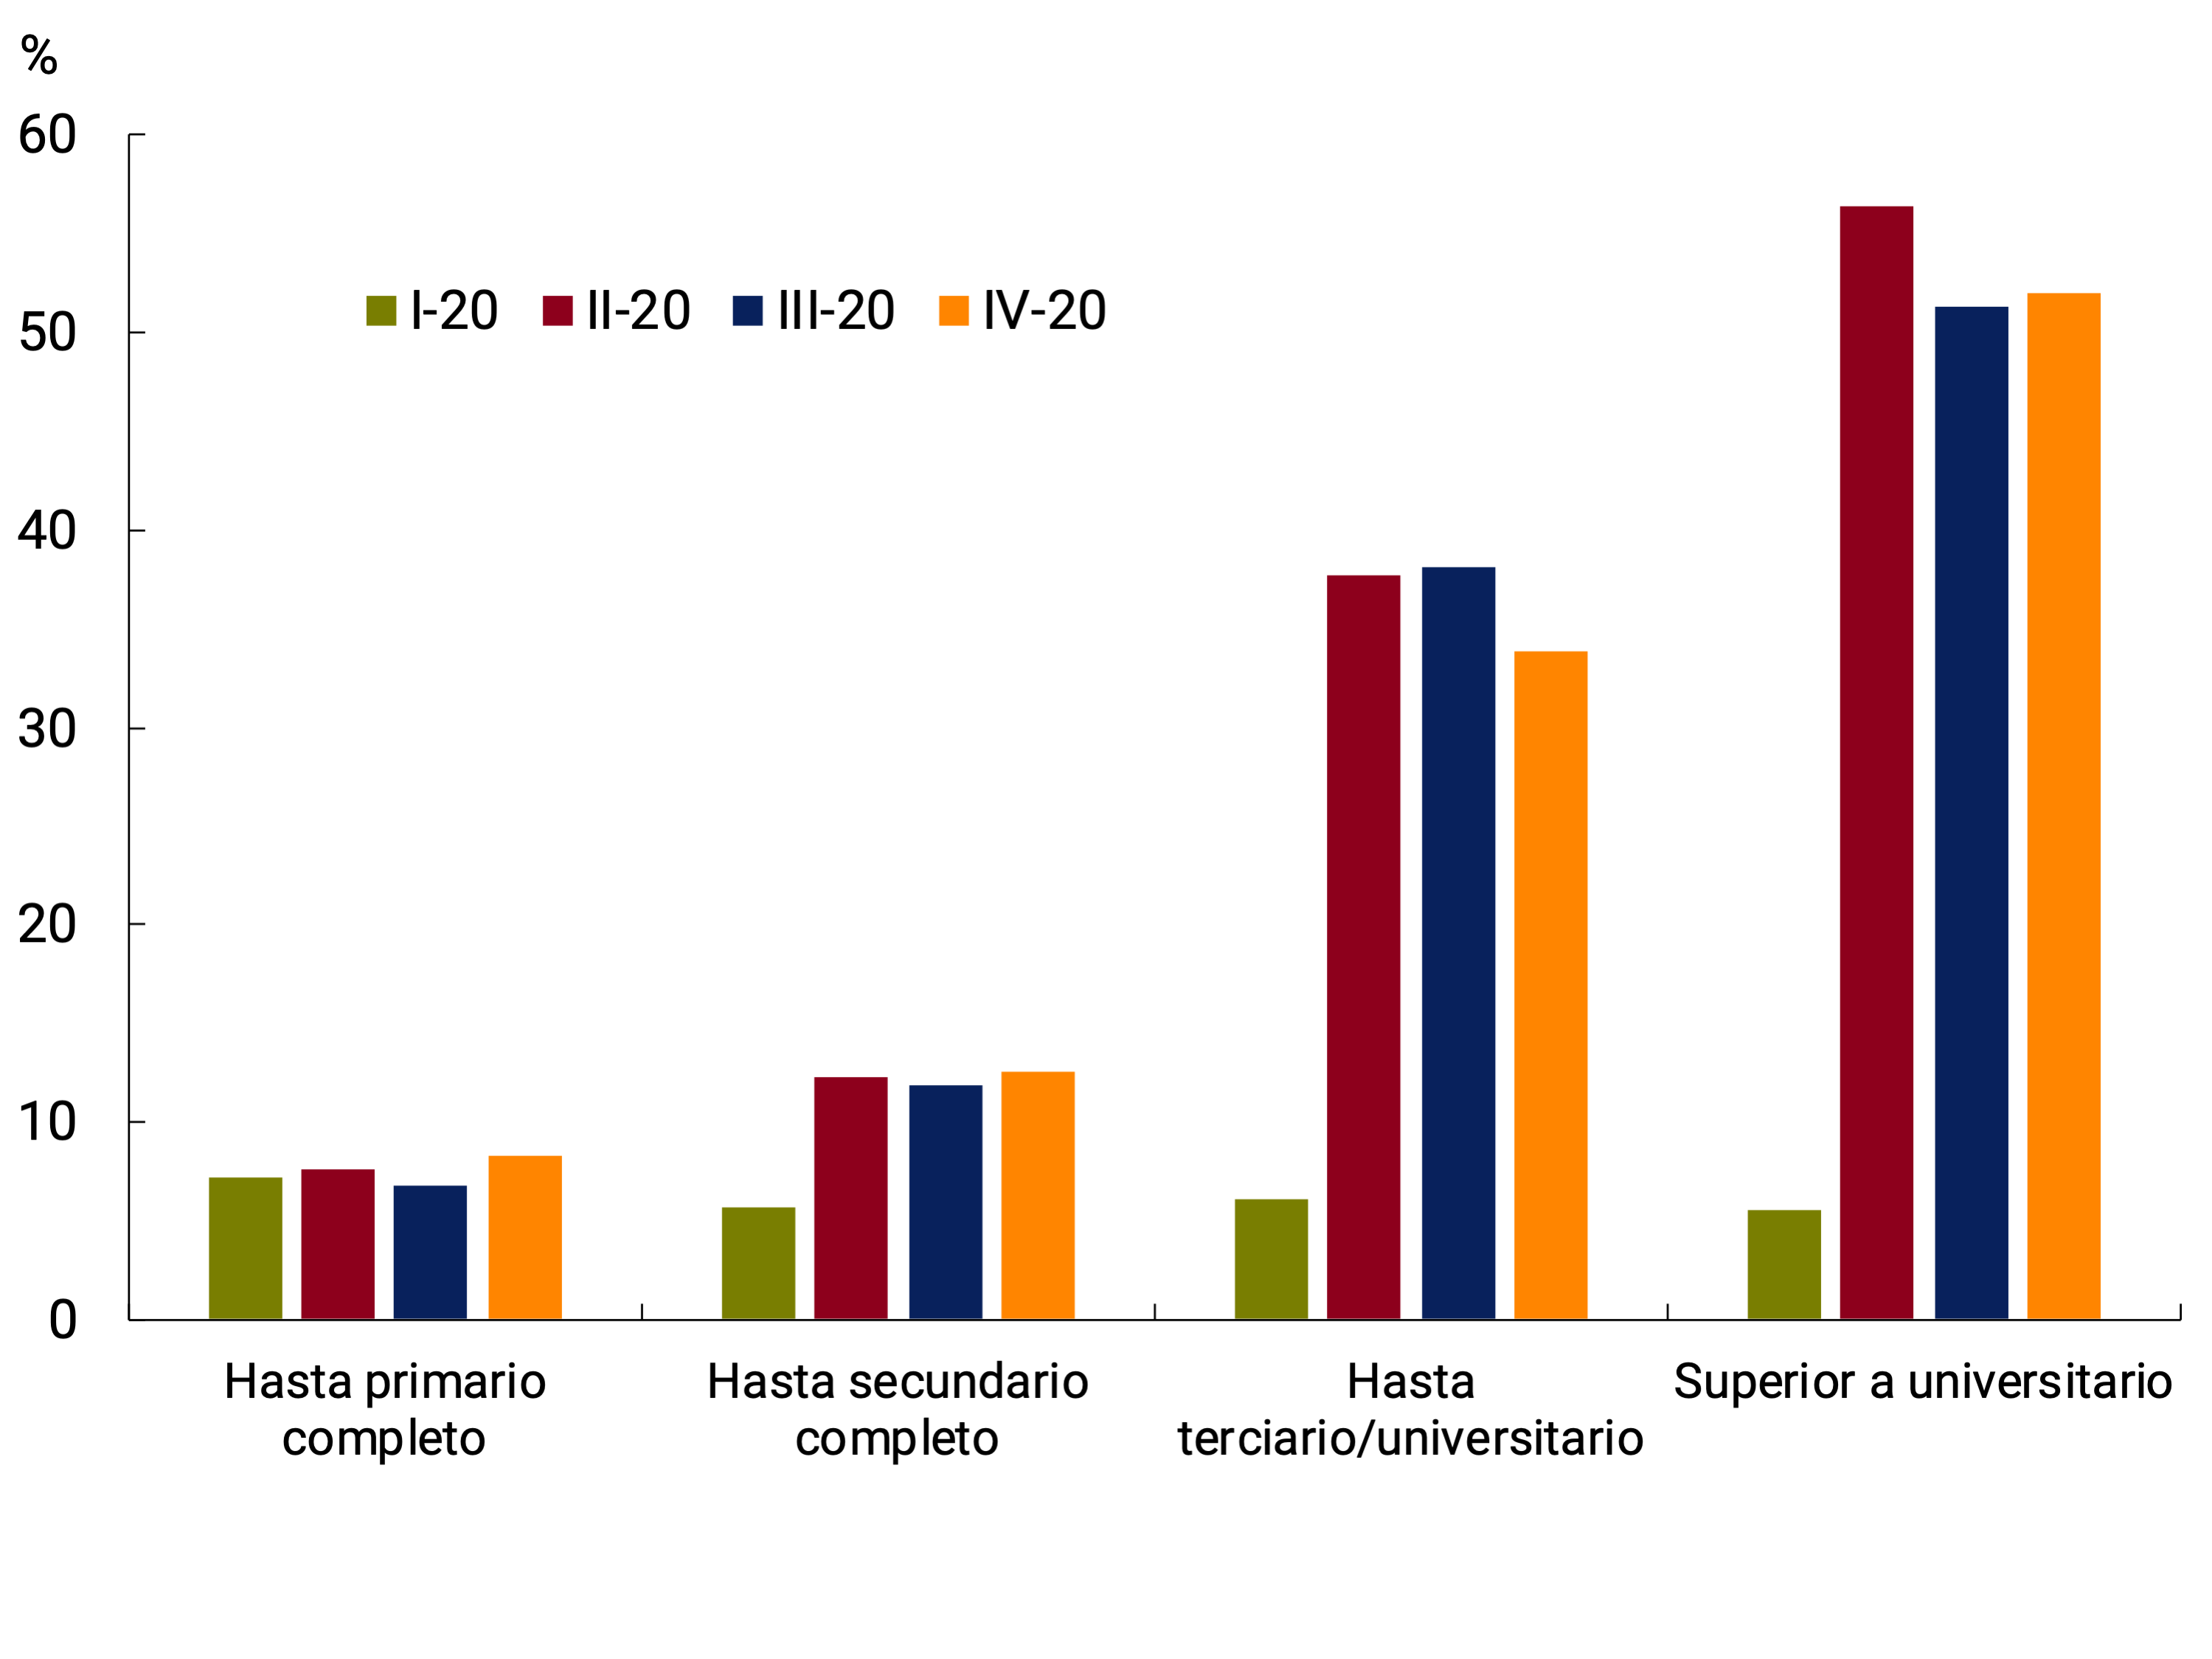
The sectoral dynamics were eminently influenced by the intrinsic characteristics of the work tasks of each area. Most of the tasks carried out in sectors such as construction, transport and health require a high degree of face-to-face work to be carried out. On the contrary, in areas such as teaching, professional activities, communications and financial intermediation, the ground is much more fertile. It is in these sectors where a strong growth in teleworking was observed during the pandemic.
As mentioned above, the abrupt implementation of mobility restrictions due to the health emergency situation prompted both employers and workers to adapt to a new way of performing their work tasks with very little preparation time. The urgency of this change prevented it from being developed in accordance with best practices. In a study on the impact of COVID-19 carried out by INDEC between August and October 2020 in the AMBA region, it is detailed that only 9.4% of workers who perform work tasks from home do so with equipment provided by their employer and in an environment for exclusive use. 42.3% of teleworkers use their own equipment in an environment shared with other members of the household. This situation led to the expeditious treatment and enactment of the Telework Law (Law 27555) through the National Congress. This law, which came into force on April 1 of this year, stipulates the rights and obligations of both employers and workers who develop their employment relationship remotely.
What happened during the fourth quarter of 2020, in which the level of infections was reduced, restrictions were relaxed and despite this the percentage of teleworkers remained at very high levels, may be indicative that this change in the work modality, which was initially perceived as transitory, is more permanent than expected. It is essential, if this trend is confirmed once the pandemic is over, that teleworking is quickly adapted to the stipulations of Law 27,555. Conditions such as voluntariness, reversibility, the right to disconnect and privacy, respect for the working day, provision of equipment, support and maintenance, among others, are essential for teleworking to be successfully developed in the near future.
Bibliography
– “Telework during and after the Covid-19 pandemic – A Practical Guide” ILO (2020).
– “Labour Overview 2020 – Latin America and the Caribbean” ILO (2020).
– “Study on the impact of Covid-19 on households in Greater Buenos Aires – Second results report” INDEC (2020).
– “Labor market. Socioeconomic Rates and Indicators (EPH) – Fourth Quarter of 2020” INDEC (2021).
Section 4 / The change in the external debt of the private sector during 2020
After the record observed in the third quarter of 2019, the external debt of the private sector showed a decreasing trend until reaching, at the end of 2020, a total of US$78,075 million. Thus, the stock was reduced in the year by US$5,686 million, both due to a fall in commercial debt of US$3,393 million, and a reduction in external financial debt of US$2,293 million. Despite the cancellations observed during the year, private external debt remains at historically high levels (see Chart 1).
Graph 1 | Private sector external debt by type of operation
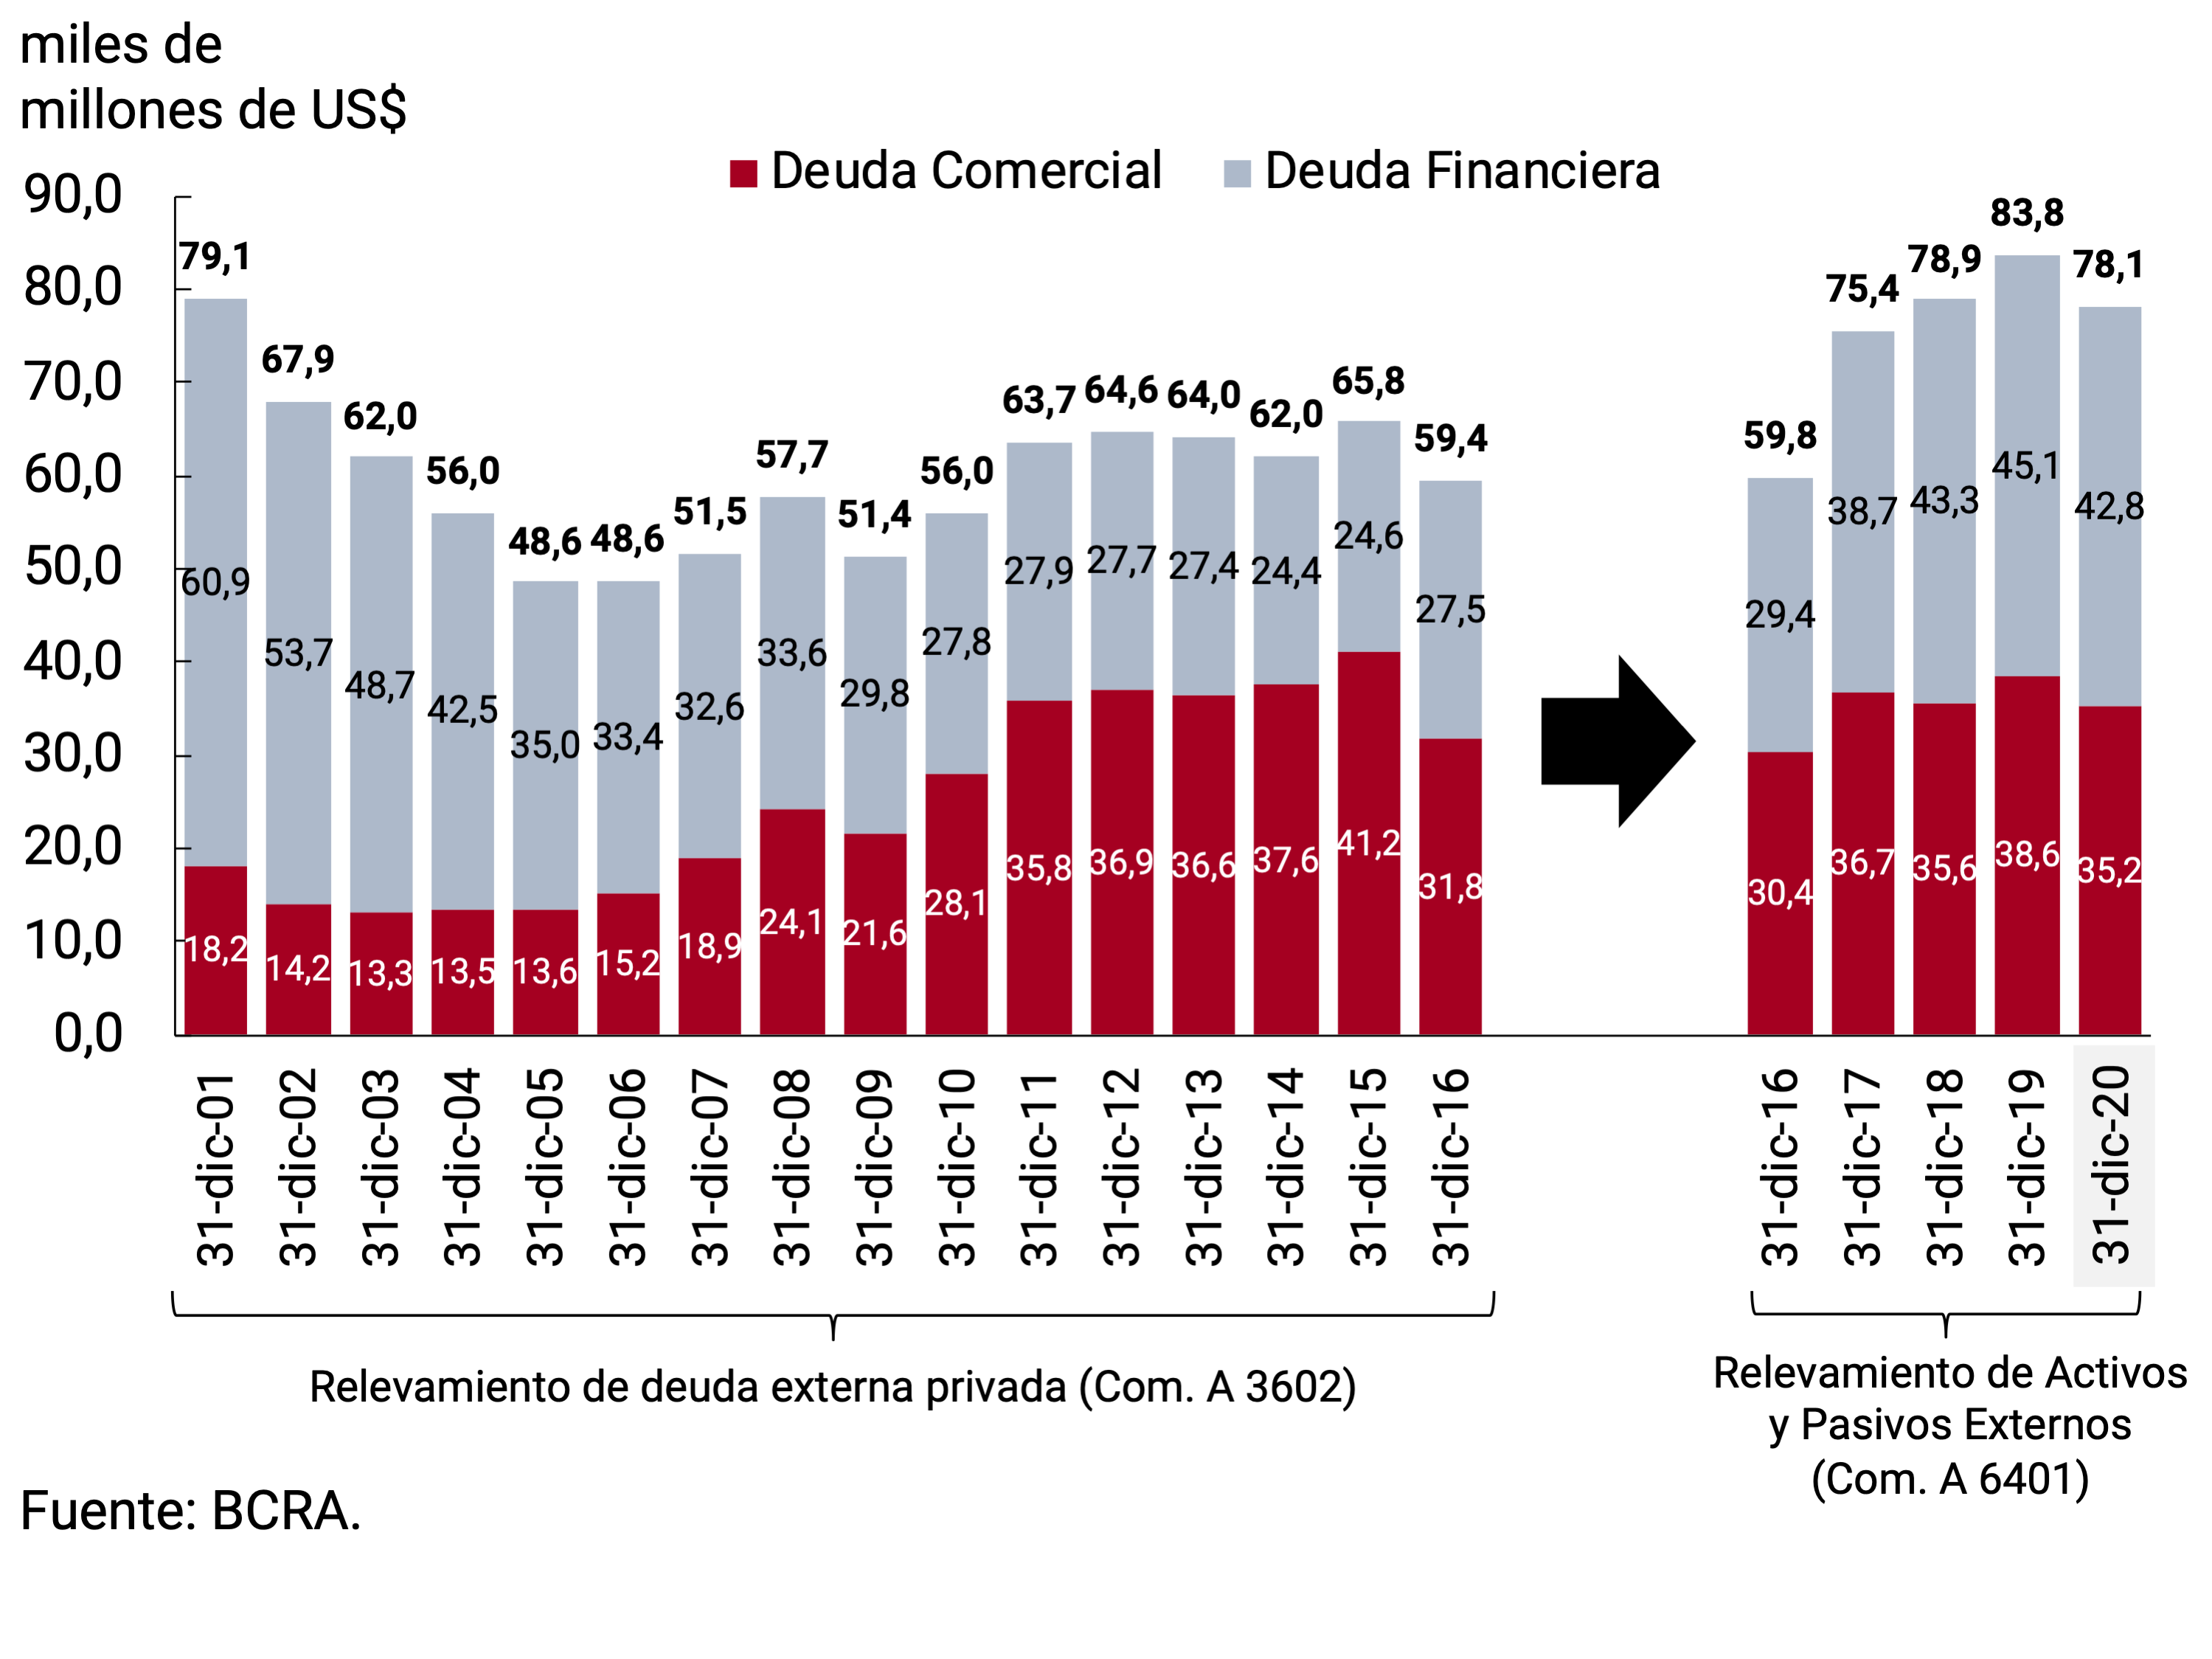
On the side of external commercial debt, liabilities for exports of goods (customer advances and pre-financing) were reduced by US$3,112 million during 2020 (see Chart 2). It should be noted that, in September 2020, this type of financing registered a minimum since the beginning of the series in December 2017, although it partially recovered in the last quarter of the year. Despite the net cancellation, the ratio between export debt and exports of goods remained in line with the levels observed in the last 5 years, but above those recorded until 2014, and it can be concluded that, among other factors, the decrease in debt was associated with lower external sales in the context of the COVID-19 pandemic.
In the same sense, the debt of imports of goods resulted in net cancellations of US$1,092 million in 2020 (see Graph 2). After a first quarter of 2020, in which debt increased by about US$546 million, an acceleration was observed in import payments through the foreign exchange market in relation to imports, which led to the cancellations of this type of debt, resulting in a significant drop in it in the second quarter of about US$1,100 million. In this context, the BCRA, through Communication A7030 of May 2020, regulated the payments of foreign trade obligations, establishing that, although with certain exceptions, importers required prior approval from the Central Bank to make payments for imports of goods above the value of their imports, in both cases accumulated since January 1, 2020. Since July 2020, the regulations have been perfected, attending to the particular commercial needs of different productive sectors. The effects of the regulatory changes had a greater impact in the last quarter of the year, reducing the levels of debt cancellation of imports observed in previous quarters, although the reduction of financing through other forms of payment that are not made through the foreign exchange market, such as capitalization or debt forgiveness, persisted. the use of freely available funds abroad, among others.
Graph 2 | Quarterly change in private sector external debt by type of operation
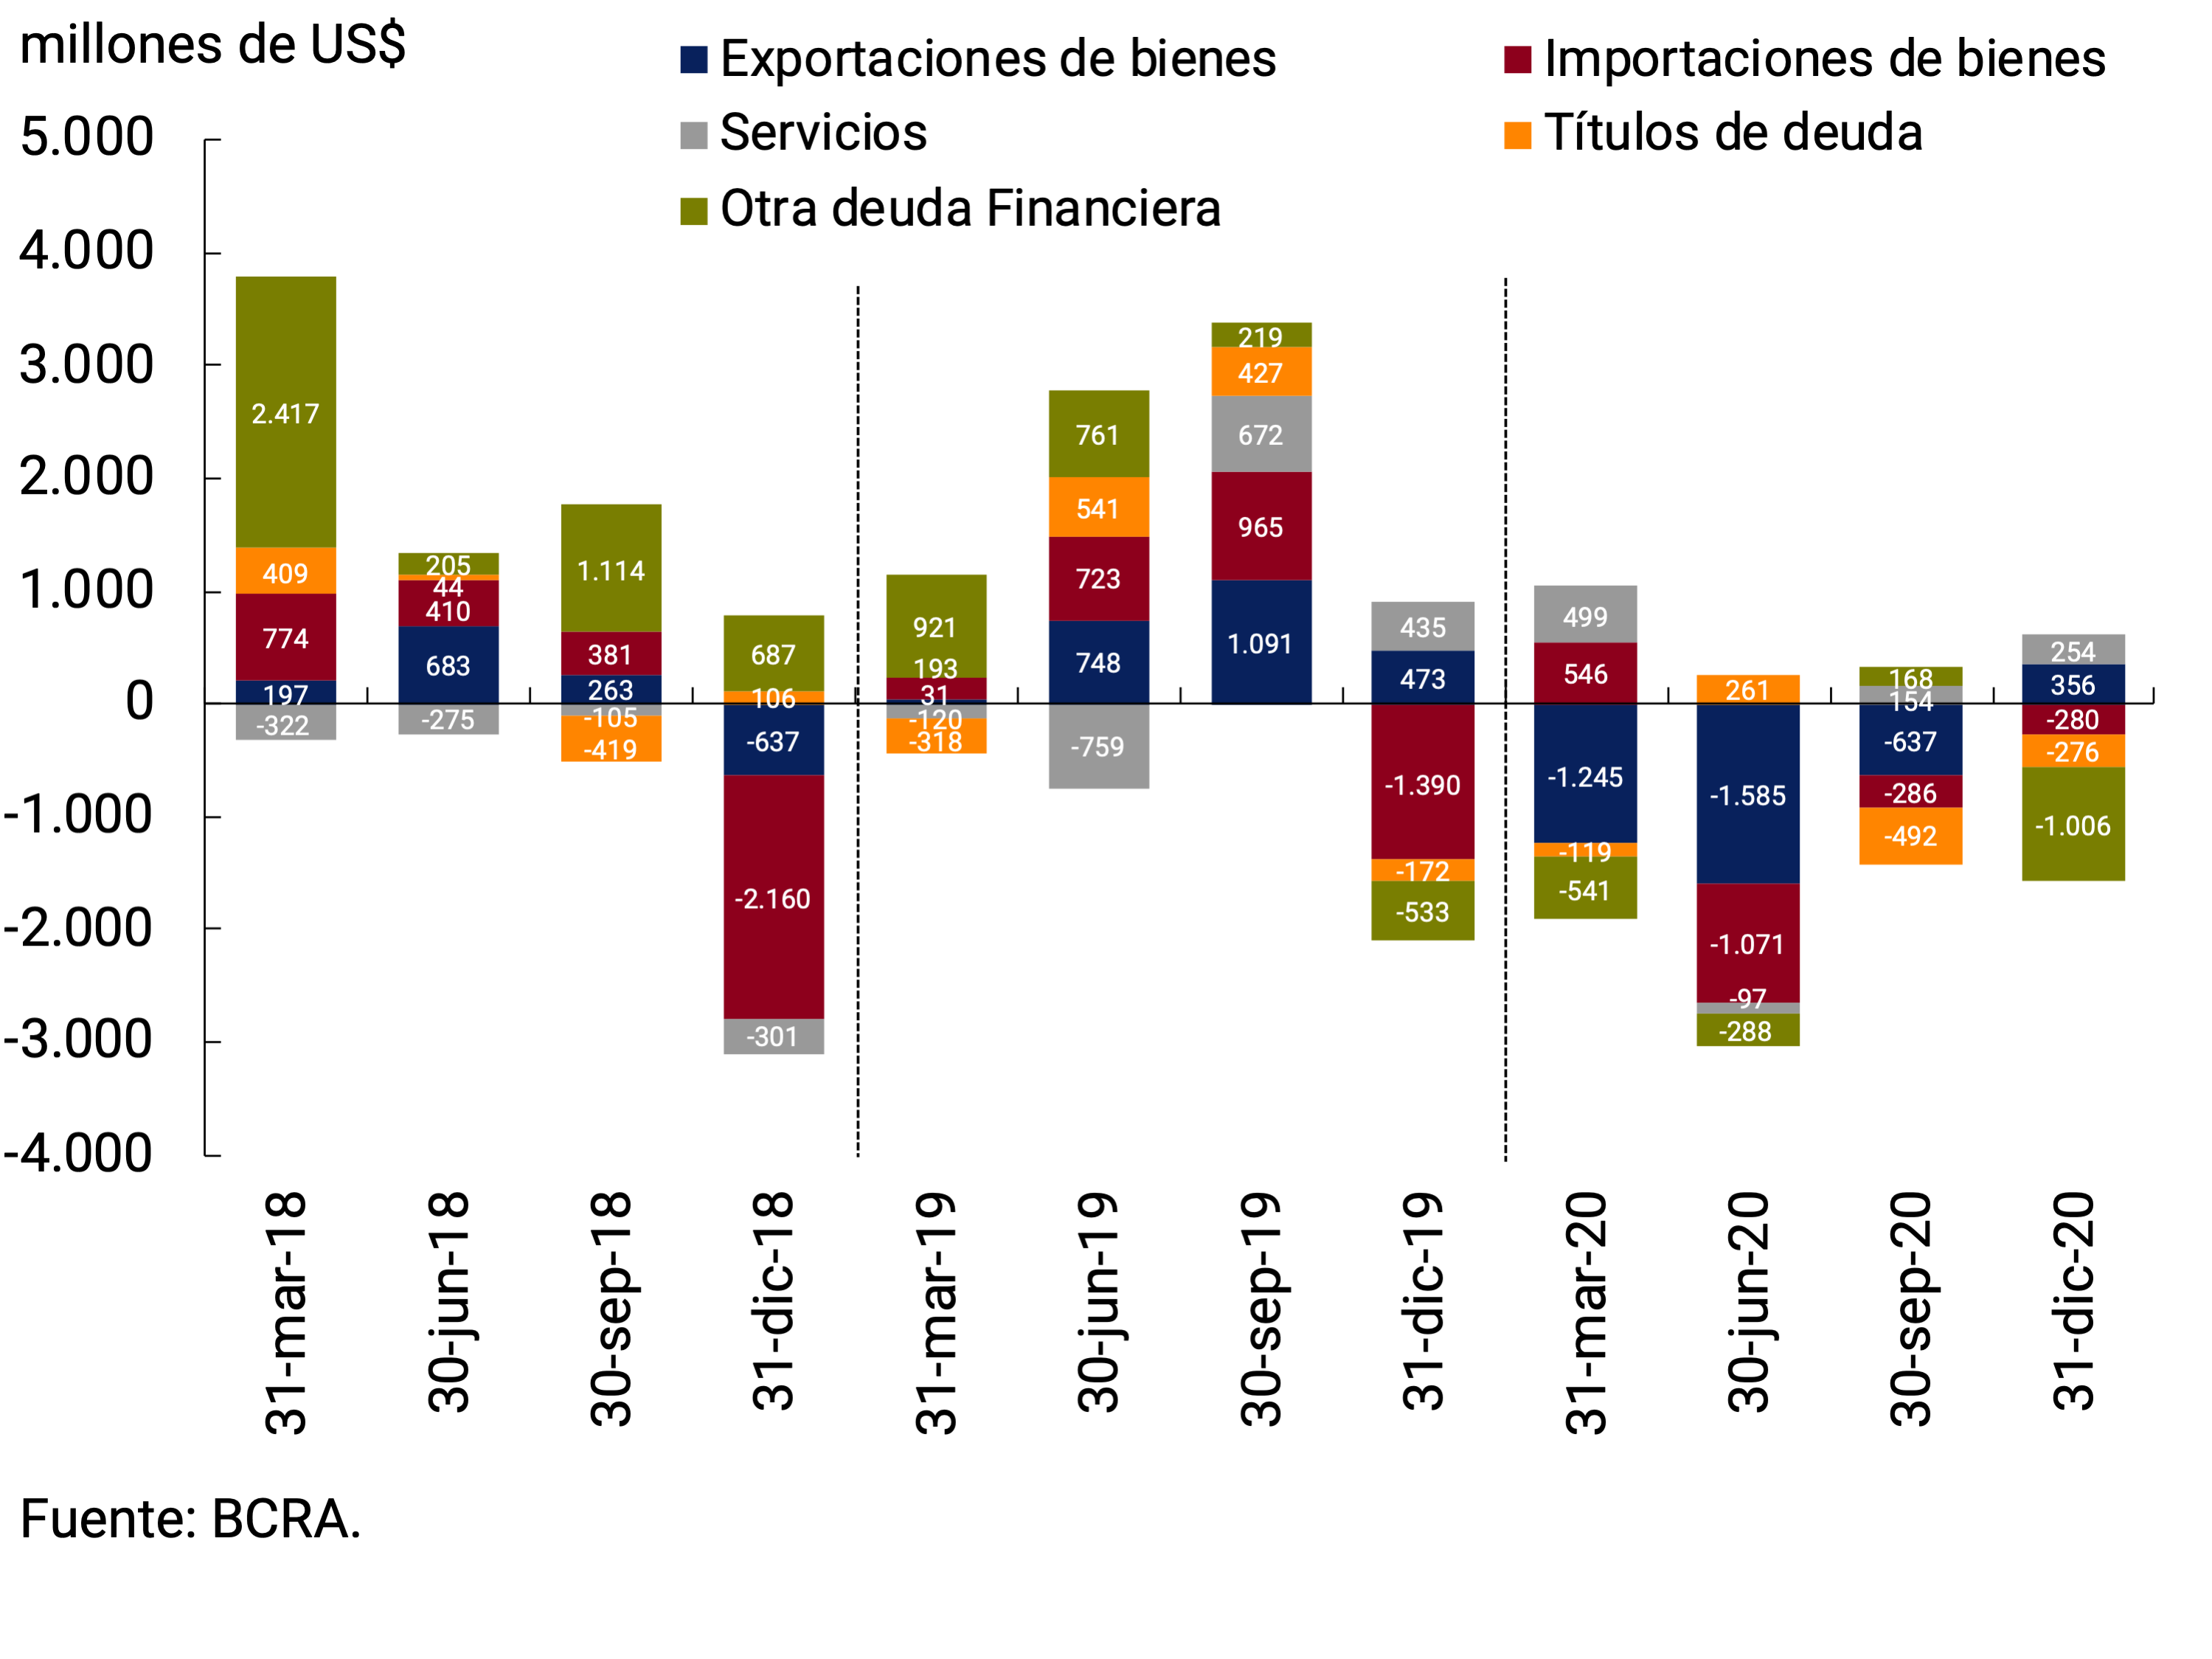
Unlike what was observed in the rest of the commercial debt, in the case of debt for services, there was an increasing trend that began in the third quarter of 2019, resulting in a variation of about US$810 million during 2020, which would be associated with the implementation of foreign exchange regulations for the payment of this type of operation. especially with regard to related creditors (see Graph 2).
In a context of growing net demand for foreign currency for the cancellation of external financial debt, in the third quarter, after the process of restructuring sovereign debt in foreign currency had been successfully completed, through the issuance of Communication A7106, the BCRA established the guidelines under which private sector companies could initiate a process of refinancing their respective external liabilities that would allow them to adjust their corporate profile. maturities for the normal functioning of the foreign exchange market.
In this context, companies that renegotiated their financial debts improved the profile of maturities towards the end of 2020. In the financial debt of these companies, a decrease in the incidence of short-term maturities (receivable capital, without an agreed maturity date and maturities in the previous year) in the total financial debt was observed from 30%, as can be seen from the debt profile as of June 30, 2020, to 21% considering the profile of December 31, 2020.
Graph 3 | Private sector external debt by type of creditor as a percentage of total
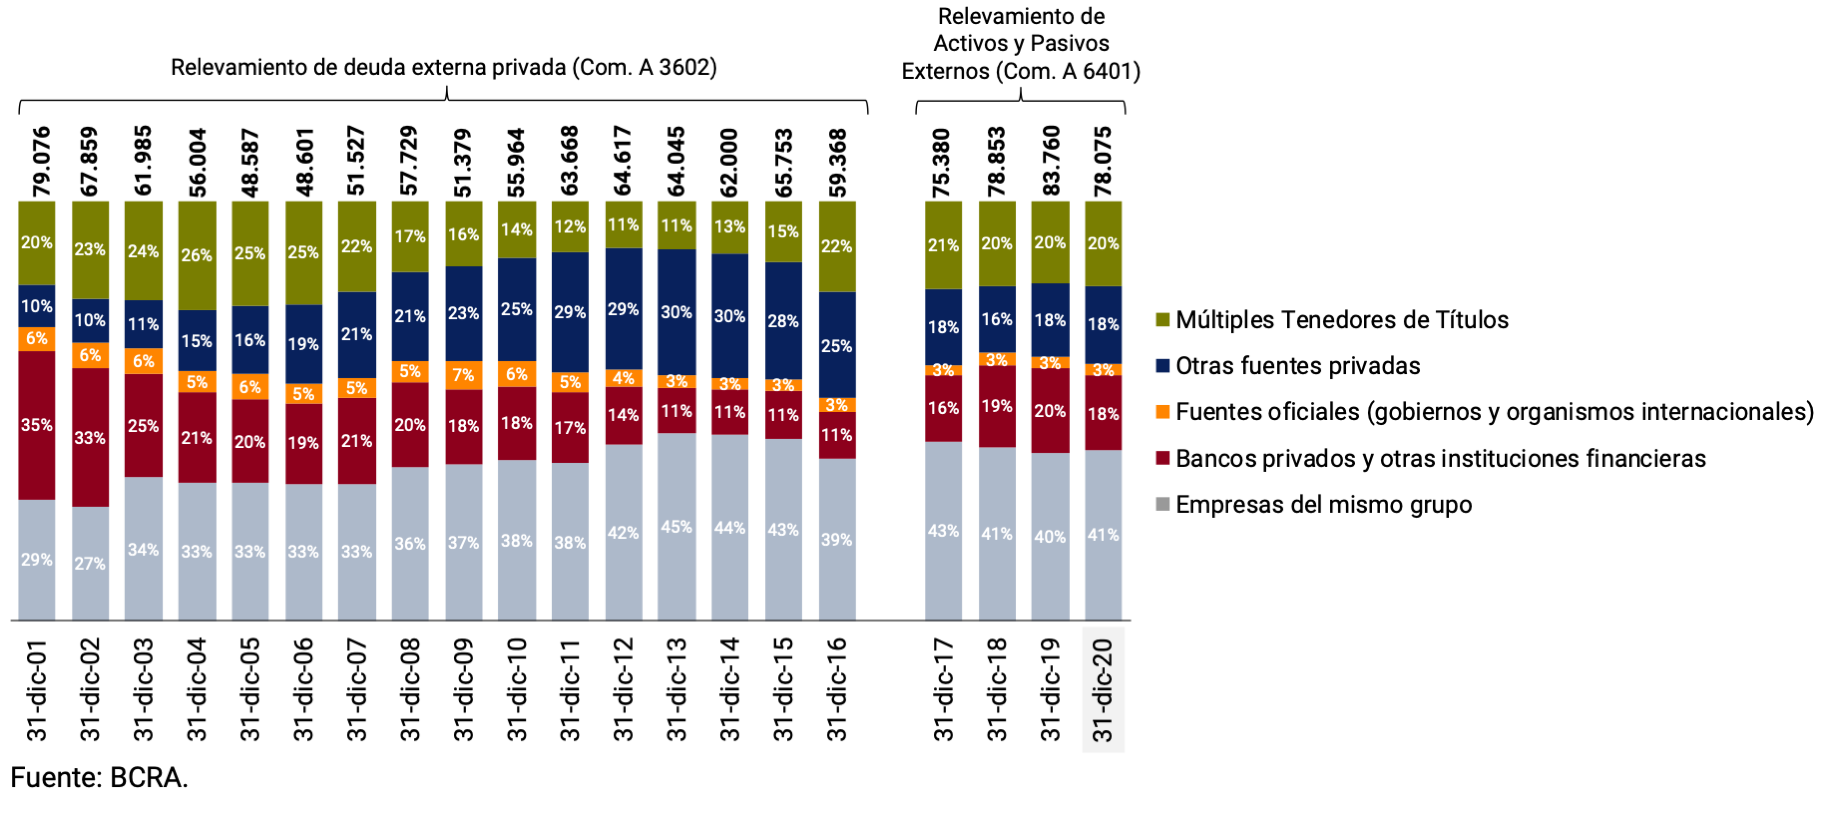
Section 5 / Regional opening of retail price developments
The Consumer Price Index (CPI) of national coverage prepared by the National Institute of Statistics and Census is a representative indicator of the evolution of retail prices of the household consumption basket throughout the country. For its preparation, prices are surveyed in 39 urban agglomerations that comprise the Autonomous City of Buenos Aires (CABA) and 24 districts of the Buenos Aires metropolitan area —which make up the Greater Buenos Aires (GBA)—, all the provincial capitals and other localities with the largest population. This information is grouped into 6 regions: GBA, Pampeana, Northwest Argentina (NOA), Northeast Argentina (NEA), Cuyo and Patagonia. From a technical point of view, the CPI is constructed using a weighted average of regional indices, which participate in the CPI of national coverage according to the importance of the region’s urban expenditure in total urban expenditure at the national level. The GBA and Pampas regions have the greatest weight in the national indicator, concentrating almost 80% of the total expenditure of urban households.
With data as of April 2021, inflation at the national level averaged a cumulative increase in the last twelve months of 46.3% y.o.y. Within the country, the dispersion of year-on-year records was somewhat greater than in the past (with a standard deviation of 1.9 p.p. and a coefficient of variation of 4%), maintaining a similar trend among the different regions, with a range of records ranging from a minimum of 44.2% y.o.y. for the GBA to a maximum of 48.8% in the northeast (see Graph 1). At the regional level, price indices may show discrepancies in their rates of change in the short term, although they tend to converge towards a similar trend.
Graph 1 | CPI. Recent evolution of the CPI by region
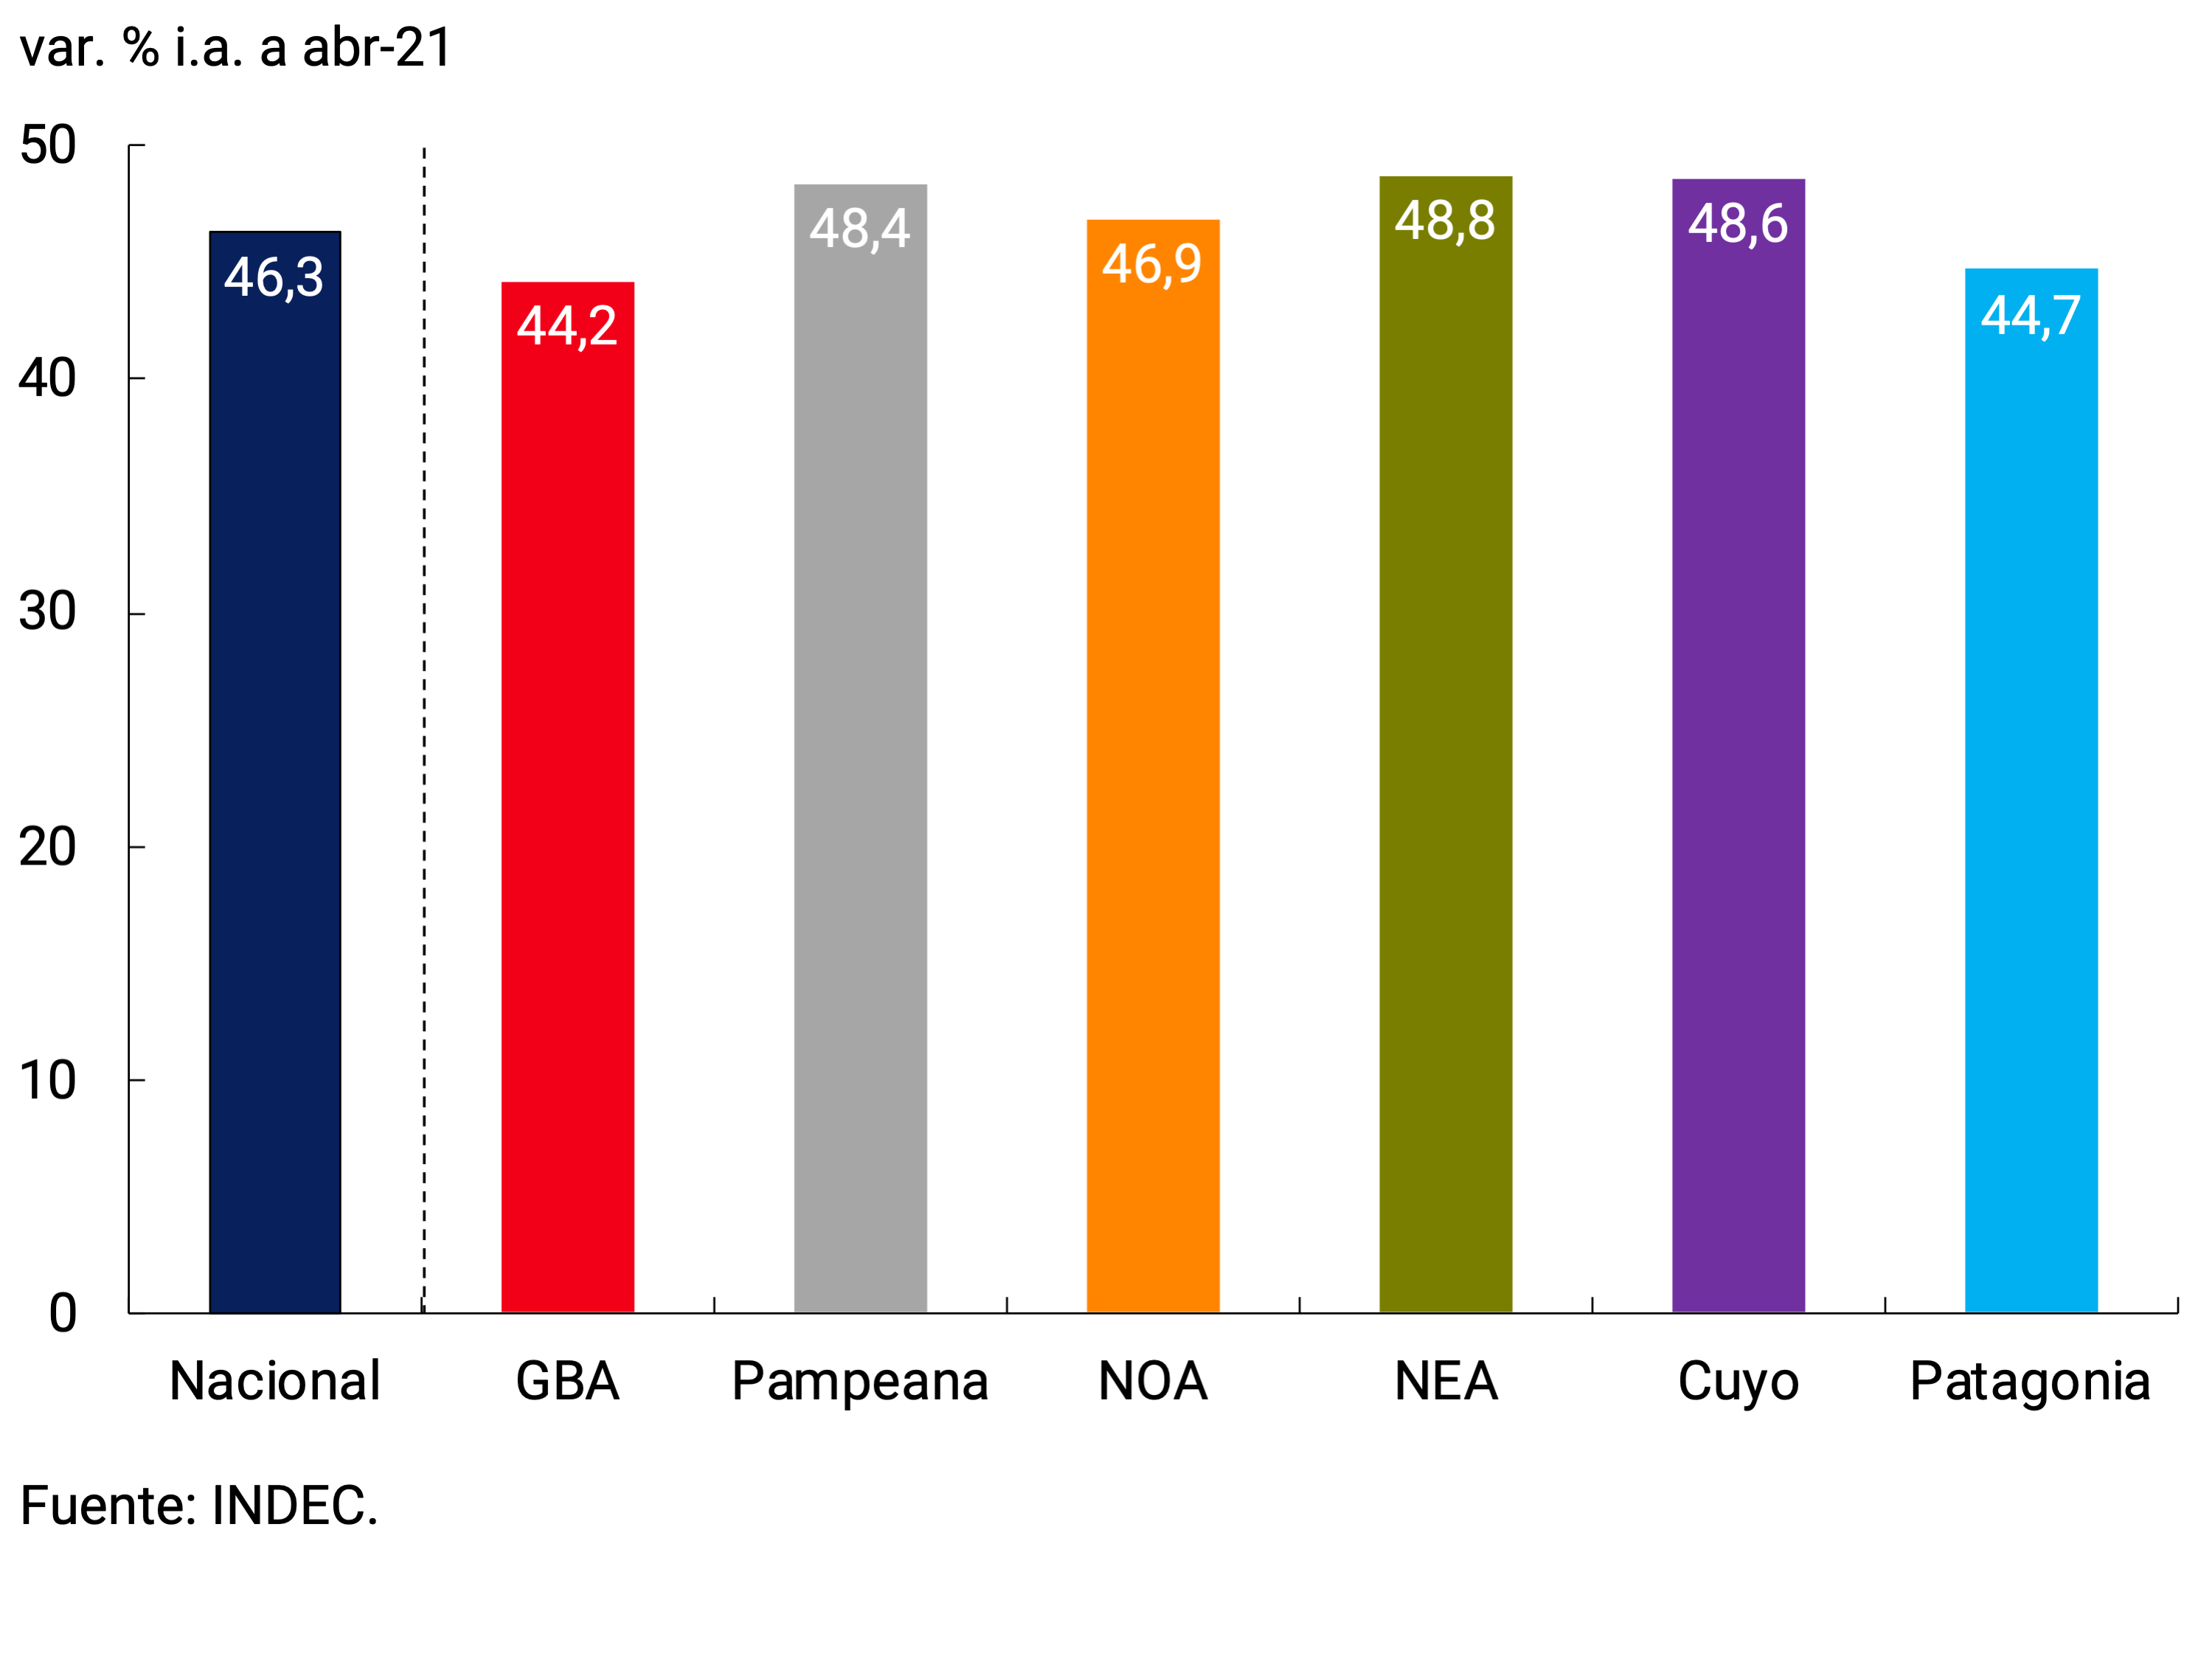
The discrepancies in the rates of change between regions are mainly due to the different weightings of different sets of products in each region (according to the representative baskets of local consumption), to differences in the samples used to carry out the surveys, and to administrative decisions of a subnational nature that impact on the updating period and/or the degree of adjustment of some regulated prices. specifically in the rates of public services.
First, the consumption patterns of the population in each region of the country determine a different weighting structure for the different indices that make up the national index. These discrepancies are particularly observed when analyzing the CPI in terms of Goods and Services, verifying a greater weight of Services in the GBA area, particularly in the CABA region, in relation to the other regions, which have a significantly higher share of goods (see Graph 2). While in the Northwest and Northeast regions the weight of goods represents more than 75% of the index, in GBA goods reach a lower proportion, around 60% of the basket. This weighting structure explains the differences in the variations in the general level between the regional indices that were observed in the last year, where the GBA index grew below those of the other regions due to the greater relative weight of services, which had a more limited dynamic than goods.
Graph 2 | CPI. Disaggregation of weights within the national CPI and by region by division
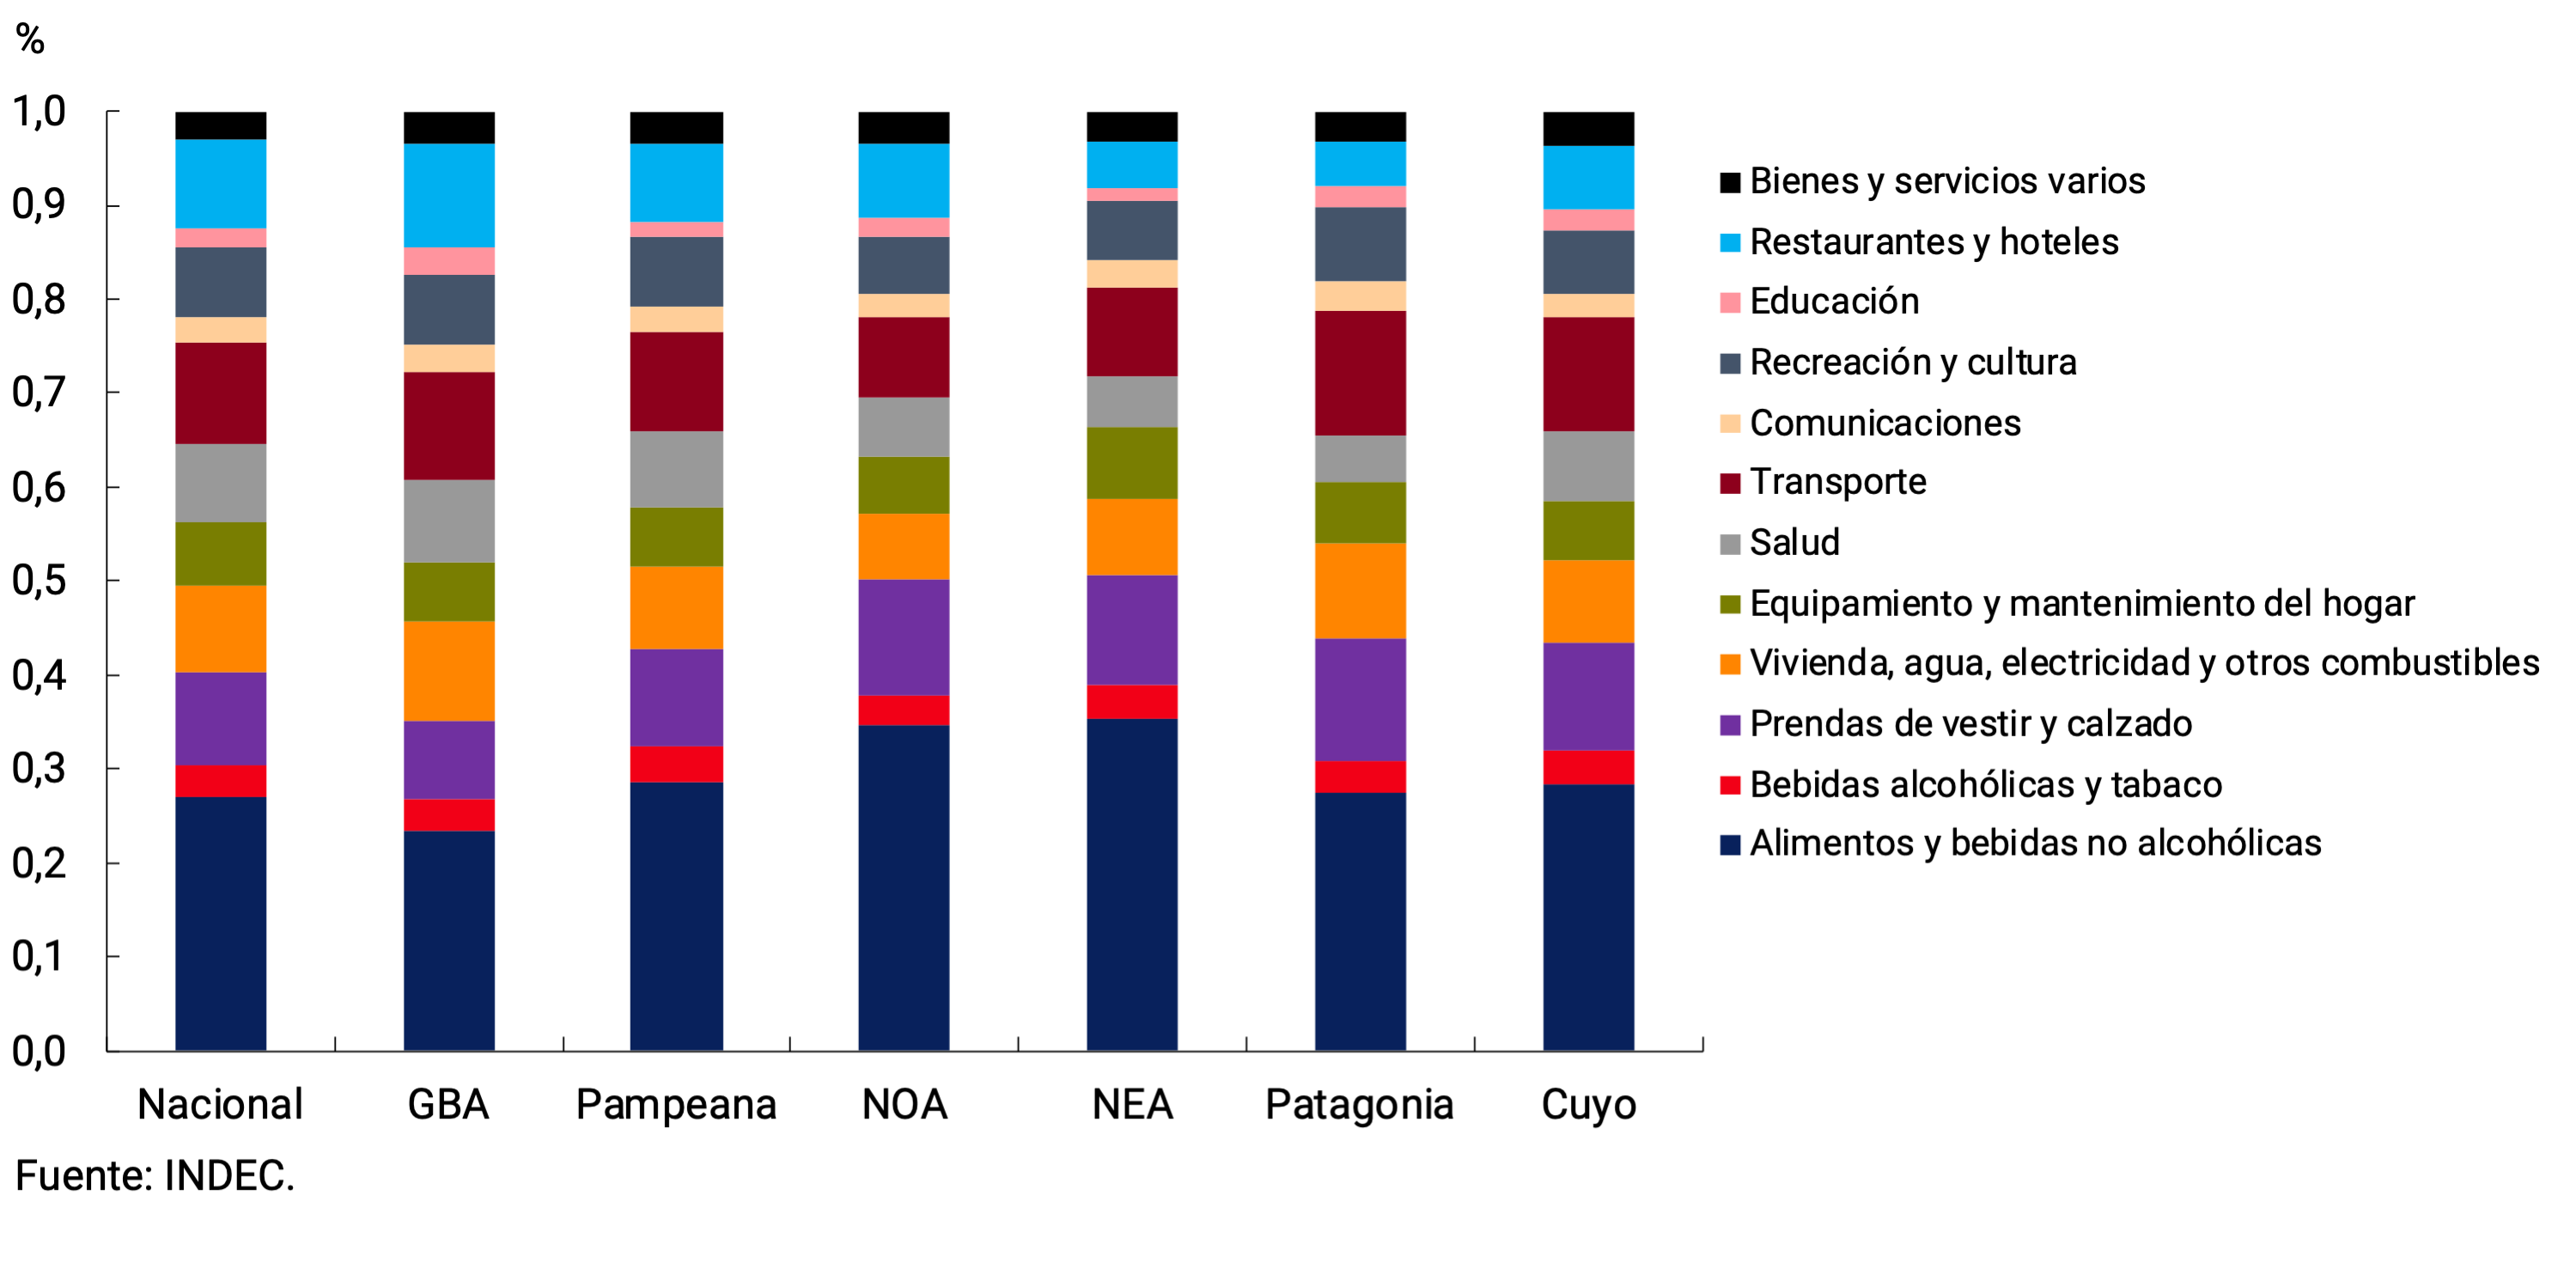
Within the goods that make up the CPI, relevant differences are observed in the relative weight of the Food and Non-Alcoholic Beverages grouping between each region, with higher weightings for the NOA and NEA and lower for GBA. These differences in weighting structures imprint heterogeneity on the evolution of each index in the face of shocks affecting the economy. For example, in the face of episodes of abrupt currency depreciations – which were very frequent in the period 2018 and 2019 – indices with a higher relative weight of goods initially reacted more quickly to the upside. This phenomenon is explained by the fact that the prices of goods are to a greater extent determined by the evolution of the exchange rate parity in relation to services, which have a production function that is more intensive in the use of the labor factor and are characterized by being usually less tradable than goods.
The selection of the sample to carry out the price survey is another factor that may explain part of the regional gap in the statistical measurement of retail prices. The scarcity or lack of certain products in various areas of the country, linked to possible logistical issues, climatic or idiosyncratic factors, influence the prices of the products surveyed. Likewise, the different product distribution channels throughout the country – with a predominance of large distribution chains in the most populated cities and traditional distribution circuits in smaller urban centers – generate greater dispersion in the prices of the products surveyed in regions where urban centers with a smaller relative population predominate. It should be noted that the highest year-on-year increases are not necessarily associated with regions where the highest absolute price levels are observed. To a lesser extent, the Clothing and footwear division is also characterized by some heterogeneity in supply between regions, which may also generate differences in the relative evolution of the prices of this type of set of goods.
With regard to the last of the factors identified, the pace and magnitude of the increase in public service rates may not coincide simultaneously in all regions in cases where provincial governments have jurisdiction over the service providers and the authorization of increases in tariffs is not set by national resolutions. In such cases, the determination of the tariff schedules is more likely to follow an update schedule adjusted to the needs arising from the local situation, to the cost structure of the private companies in charge of providing the service in each locality and to the initial situation of the tariff schemes of each province. At the level of stylized facts, when provincial regulatory bodies authorize increases, the impact of the tariff update is limited only to the affected province, giving rise to dynamics differentiated by region. In fact, during the first quarter of the year, the greater dynamism of the “Housing, gas, electricity, water and other fuels” division in the CPIs of NOA and Cuyo in relation to the rest of the regions reflected the increase in the provision of drinking water and sanitation services in Mendoza and the increases authorized by the provincial entities in the electricity tariff tables in Mendoza and San Luis and Tucumán and Salta, to cite some recent cases.
Apart from the aforementioned factors that explain, in part, the differences observed between the regional indices, it is worth noting that, when considering average prices of specific goods surveyed by INDEC according to the basket of National CPI for each region, variations of similar magnitude are generally observed in recent years (see Graph 3).
Graph 3 | CPI. Year-on-year evolution of average selection prices of goods disaggregated by region
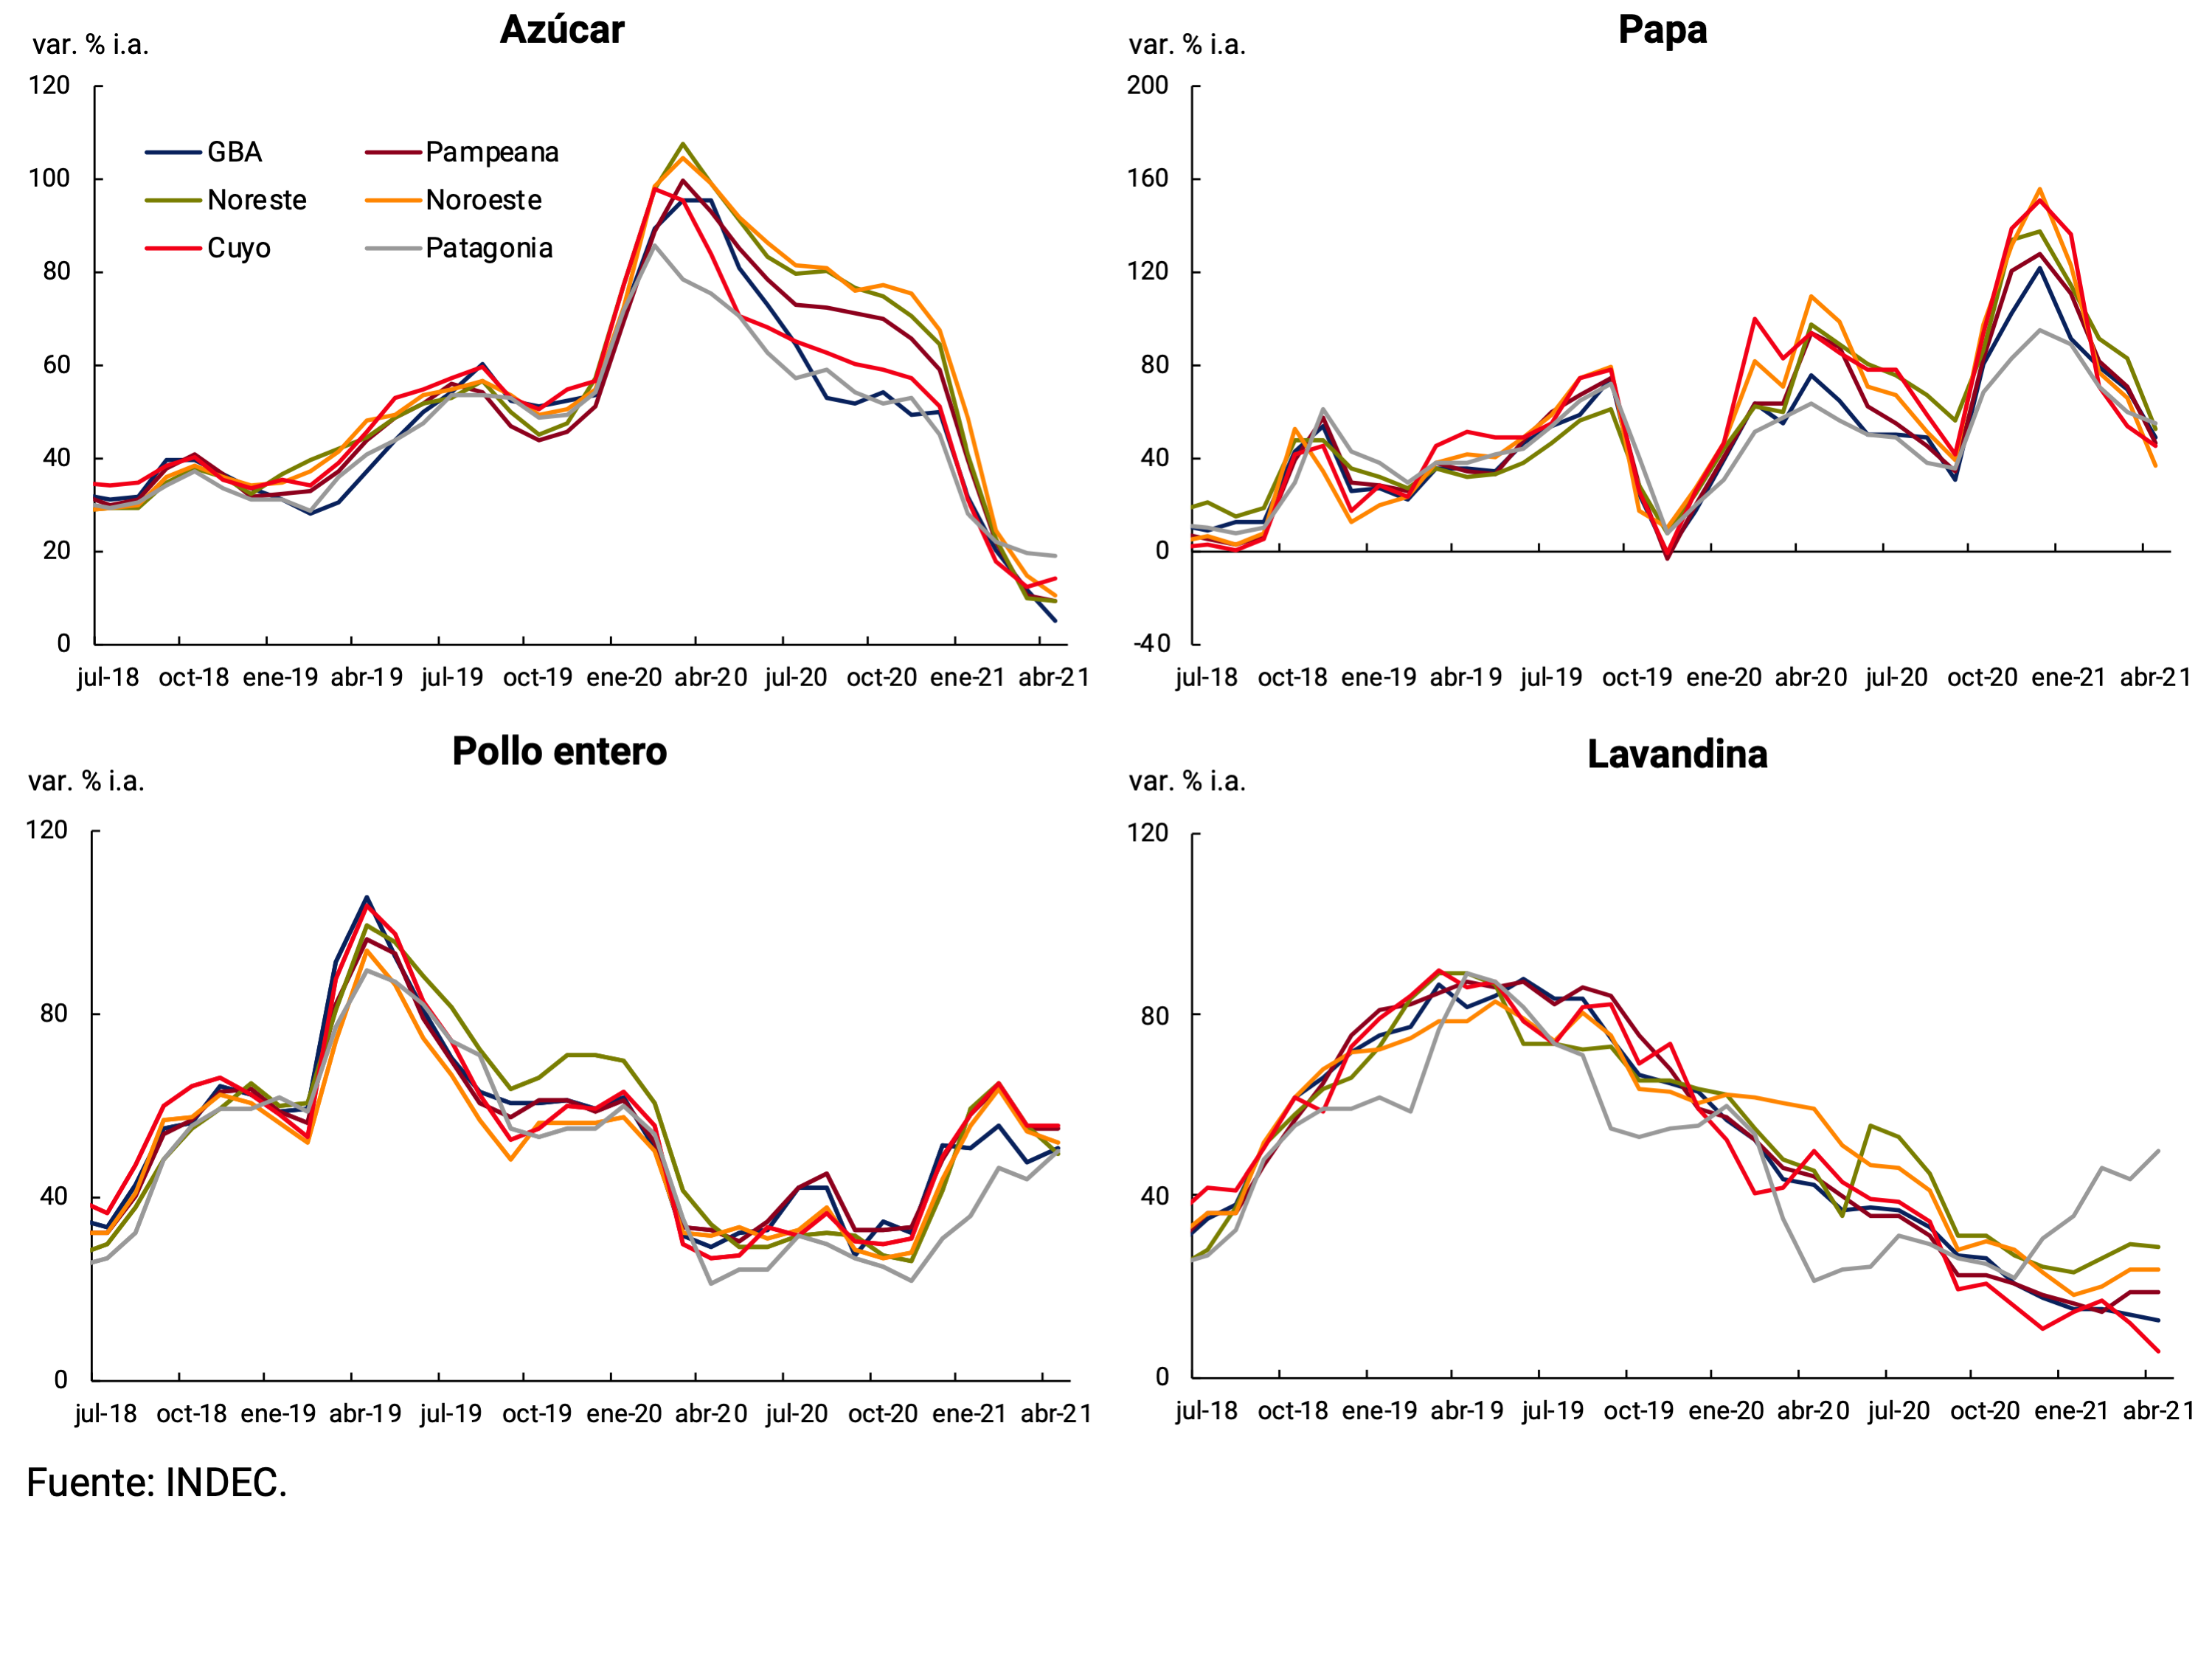
It can therefore be concluded that the gaps observed in the regional dynamics of retail inflation are not necessarily explained by a differential evolution of the prices of the same product, but must be considered, among other factors, the particularities of the technical construction of the indices or possible incidences of administrative provisions with a differential geographical impact. among other factors.
Section 6 / Consumer-linked loans during 2020
In the face of contractionary shocks such as the one experienced from March 2020 as a result of the COVID-19 pandemic, people try to resort to credit to soften part of the negative effects on their income. In these contexts, the implementation by the Central Bank of policies that reduce interest rates and boost the supply of credit are essential for the financial system to play a countercyclical role. This section attempts to quantify the effect of interest rate reductions on the loans most directly related to consumption: credit card loans and personal loans.
Graph 1 shows the evolution of credit card loans (in real terms s.e.) from February to December 202054, contrasting it with the evolution of the EMAE (real s.e., excluding the Agriculture sector) and the interest rate. As can be seen, the dynamics of loans and activity are similar (initial falls, with recovery from May onwards). However, the drop in activity was much more intense. At the same time, the interest rate on credit card loans fell by more than 30 percentage points (p.p.). The exercise developed tries to quantify how the dynamics of these loans would have been if the interest rate had not decreased as it did, being only affected by the dynamics of activity.
Graph 1 |
(a) Credit Card Loans and Activity
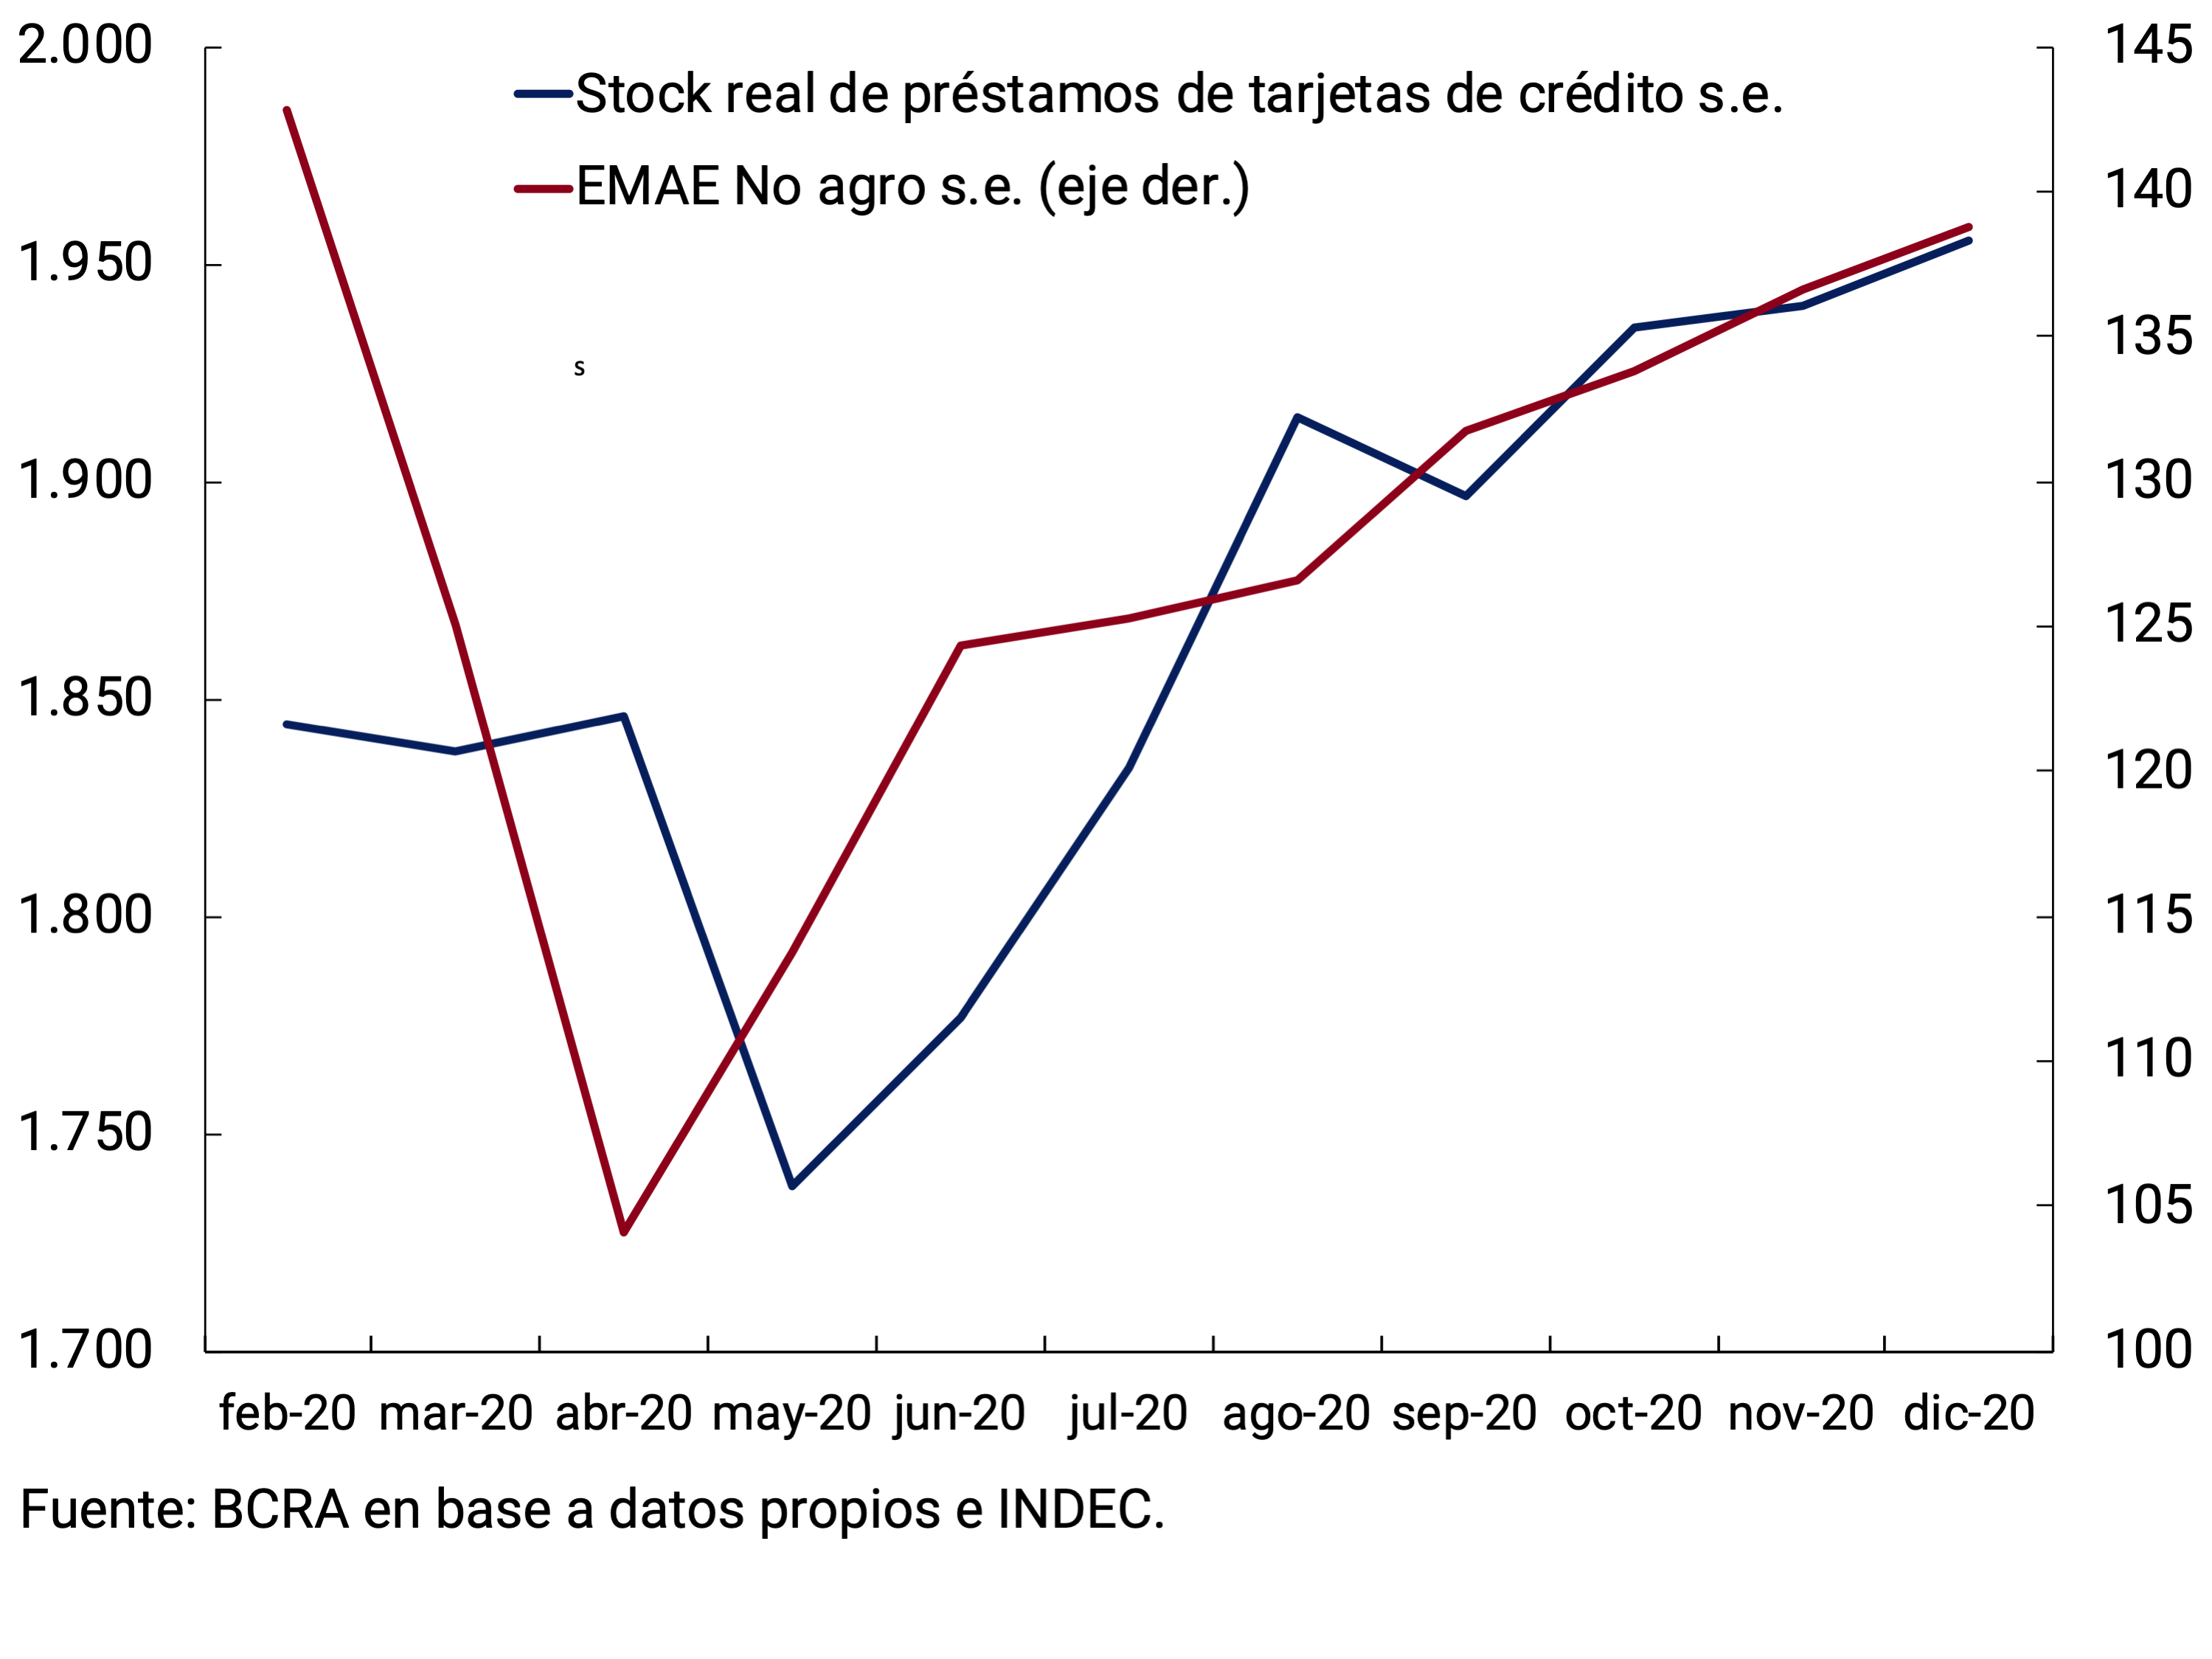
(b) Credit Card Loans and Interest Rates
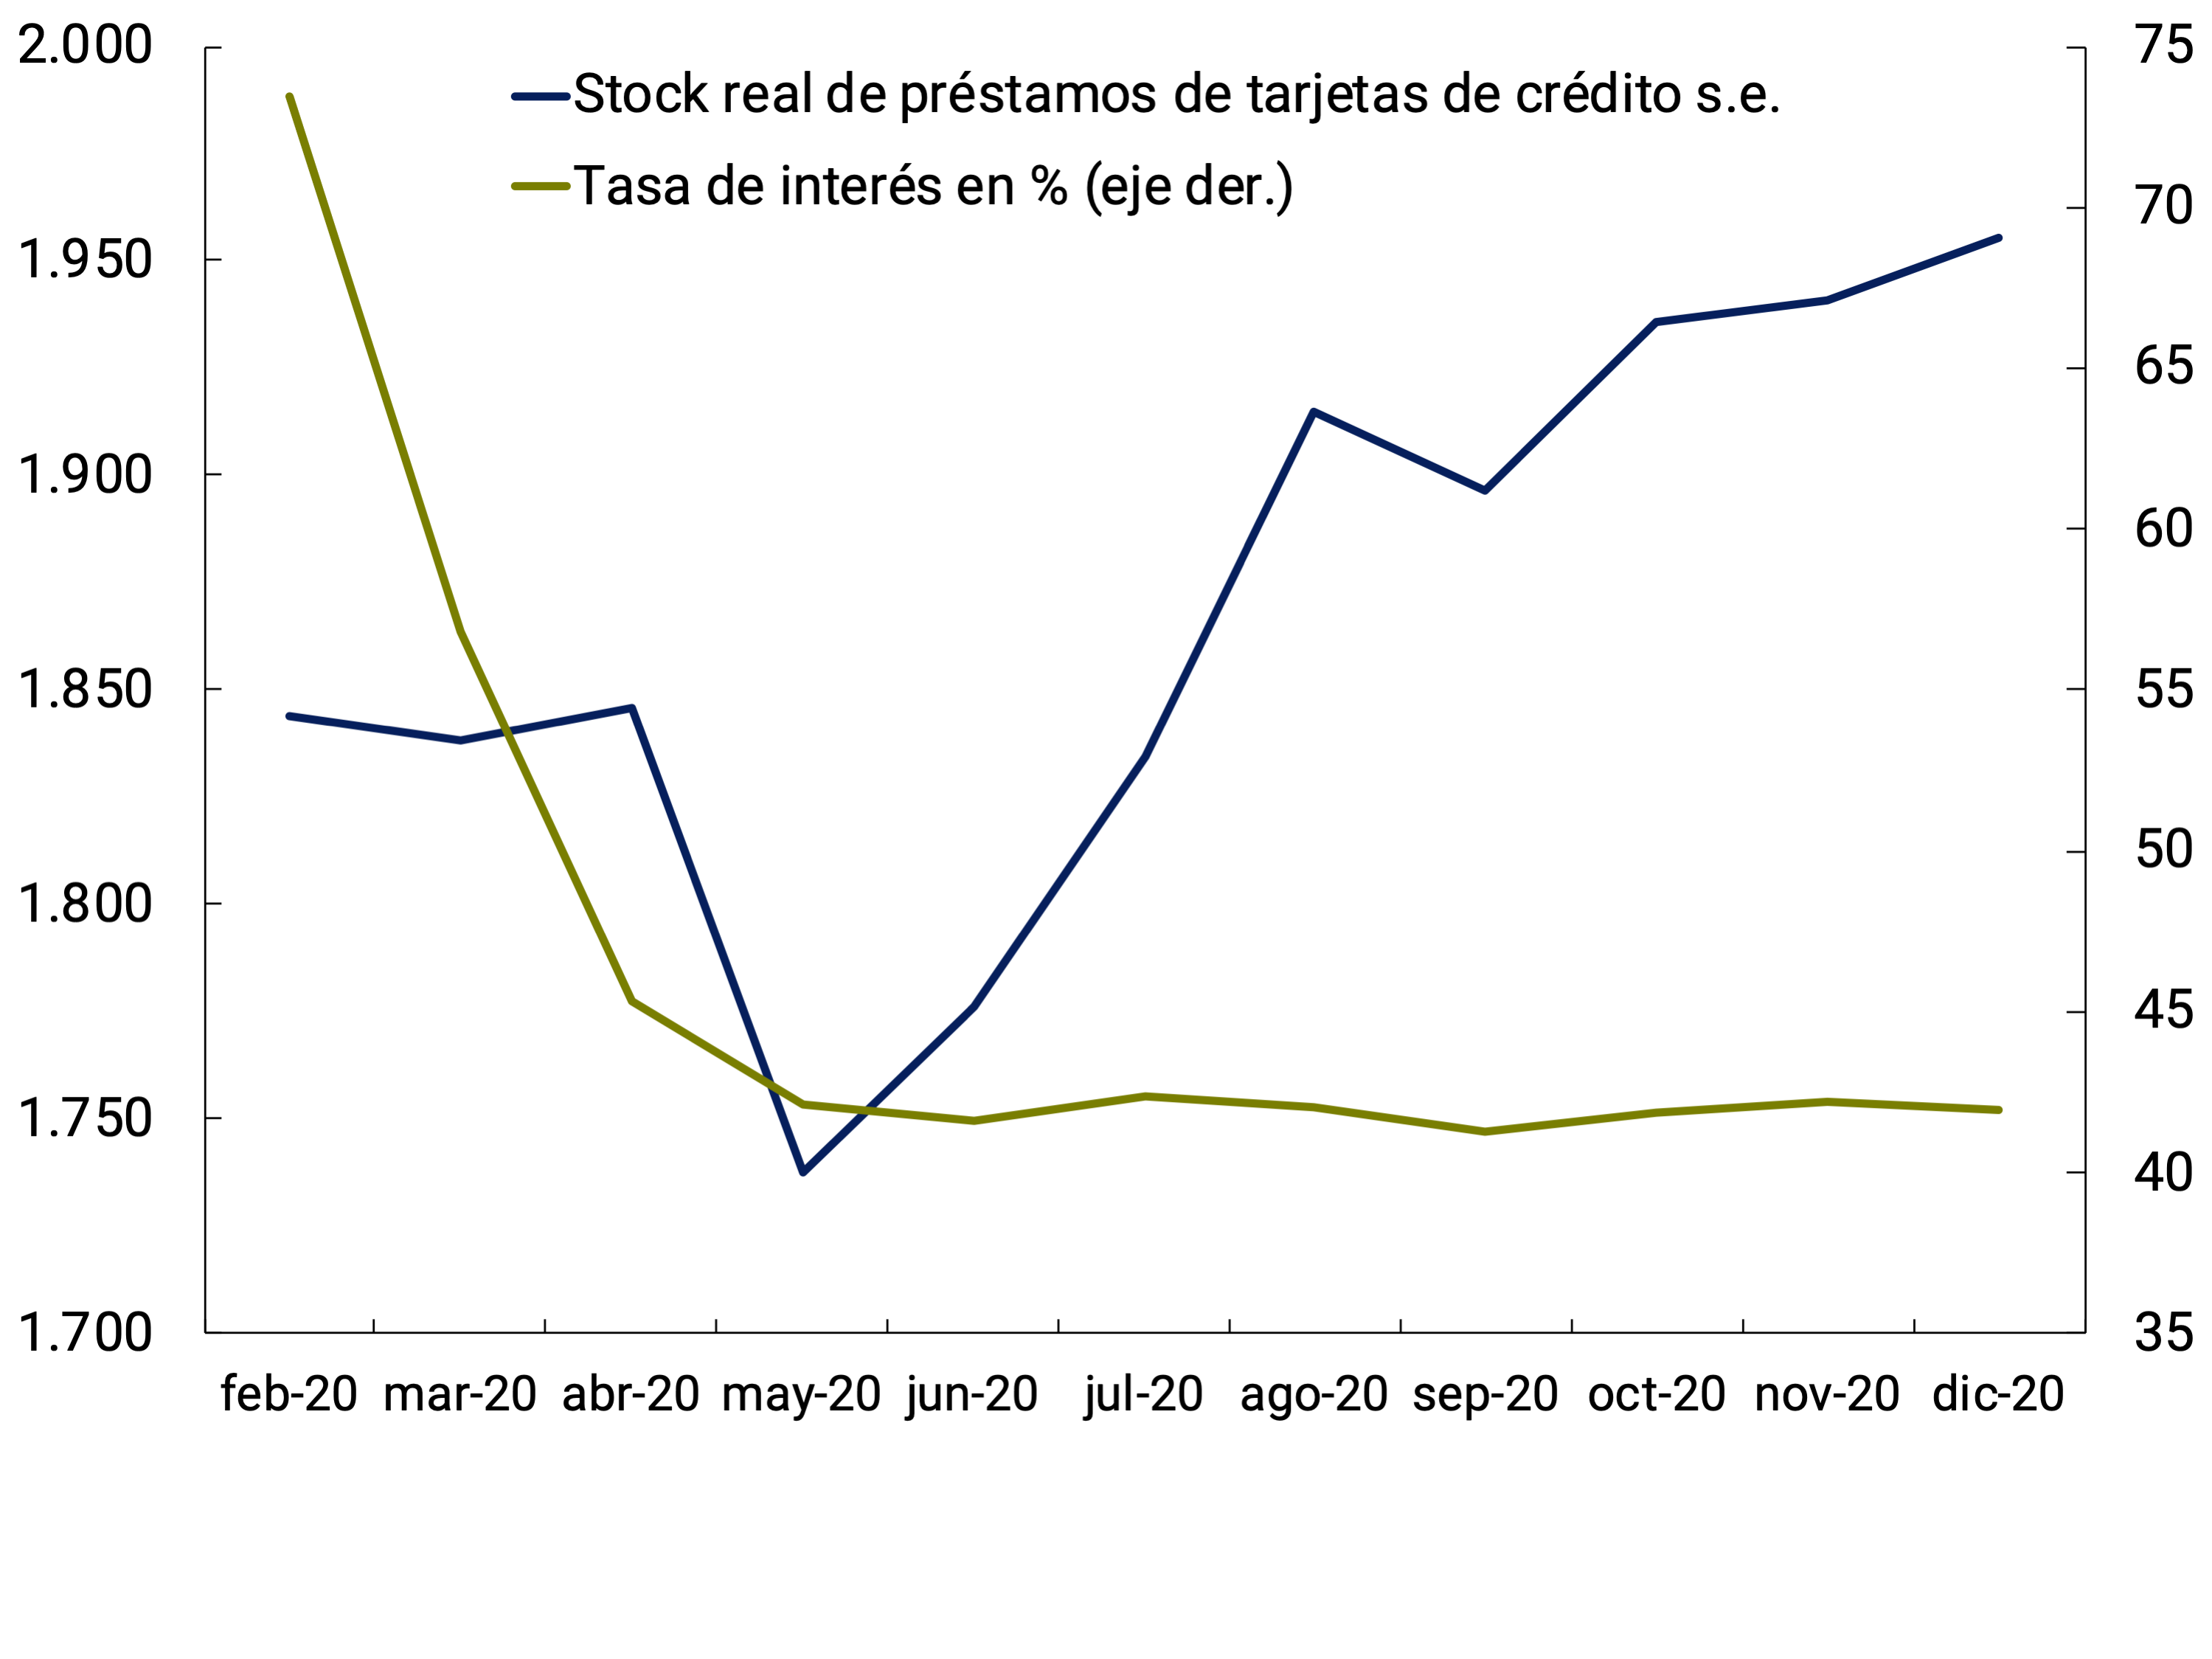
Graph 2 contrasts the dynamics of personal loans (in real terms, i.e.) with the measure of activity and with the interest rate for these loans. In this case, personal loans fell in real terms throughout the period, continuing the downward trend they have experienced since mid-201855. Interest rates also decreased, although the fall was somewhat more limited (about 10 p.p.). In this case, the objective is to quantify how much more personal loans would have been reduced if the interest rate had not decreased, depending only on the dynamics of the activity.
Graph 2 |
(a) Personal loans and activity
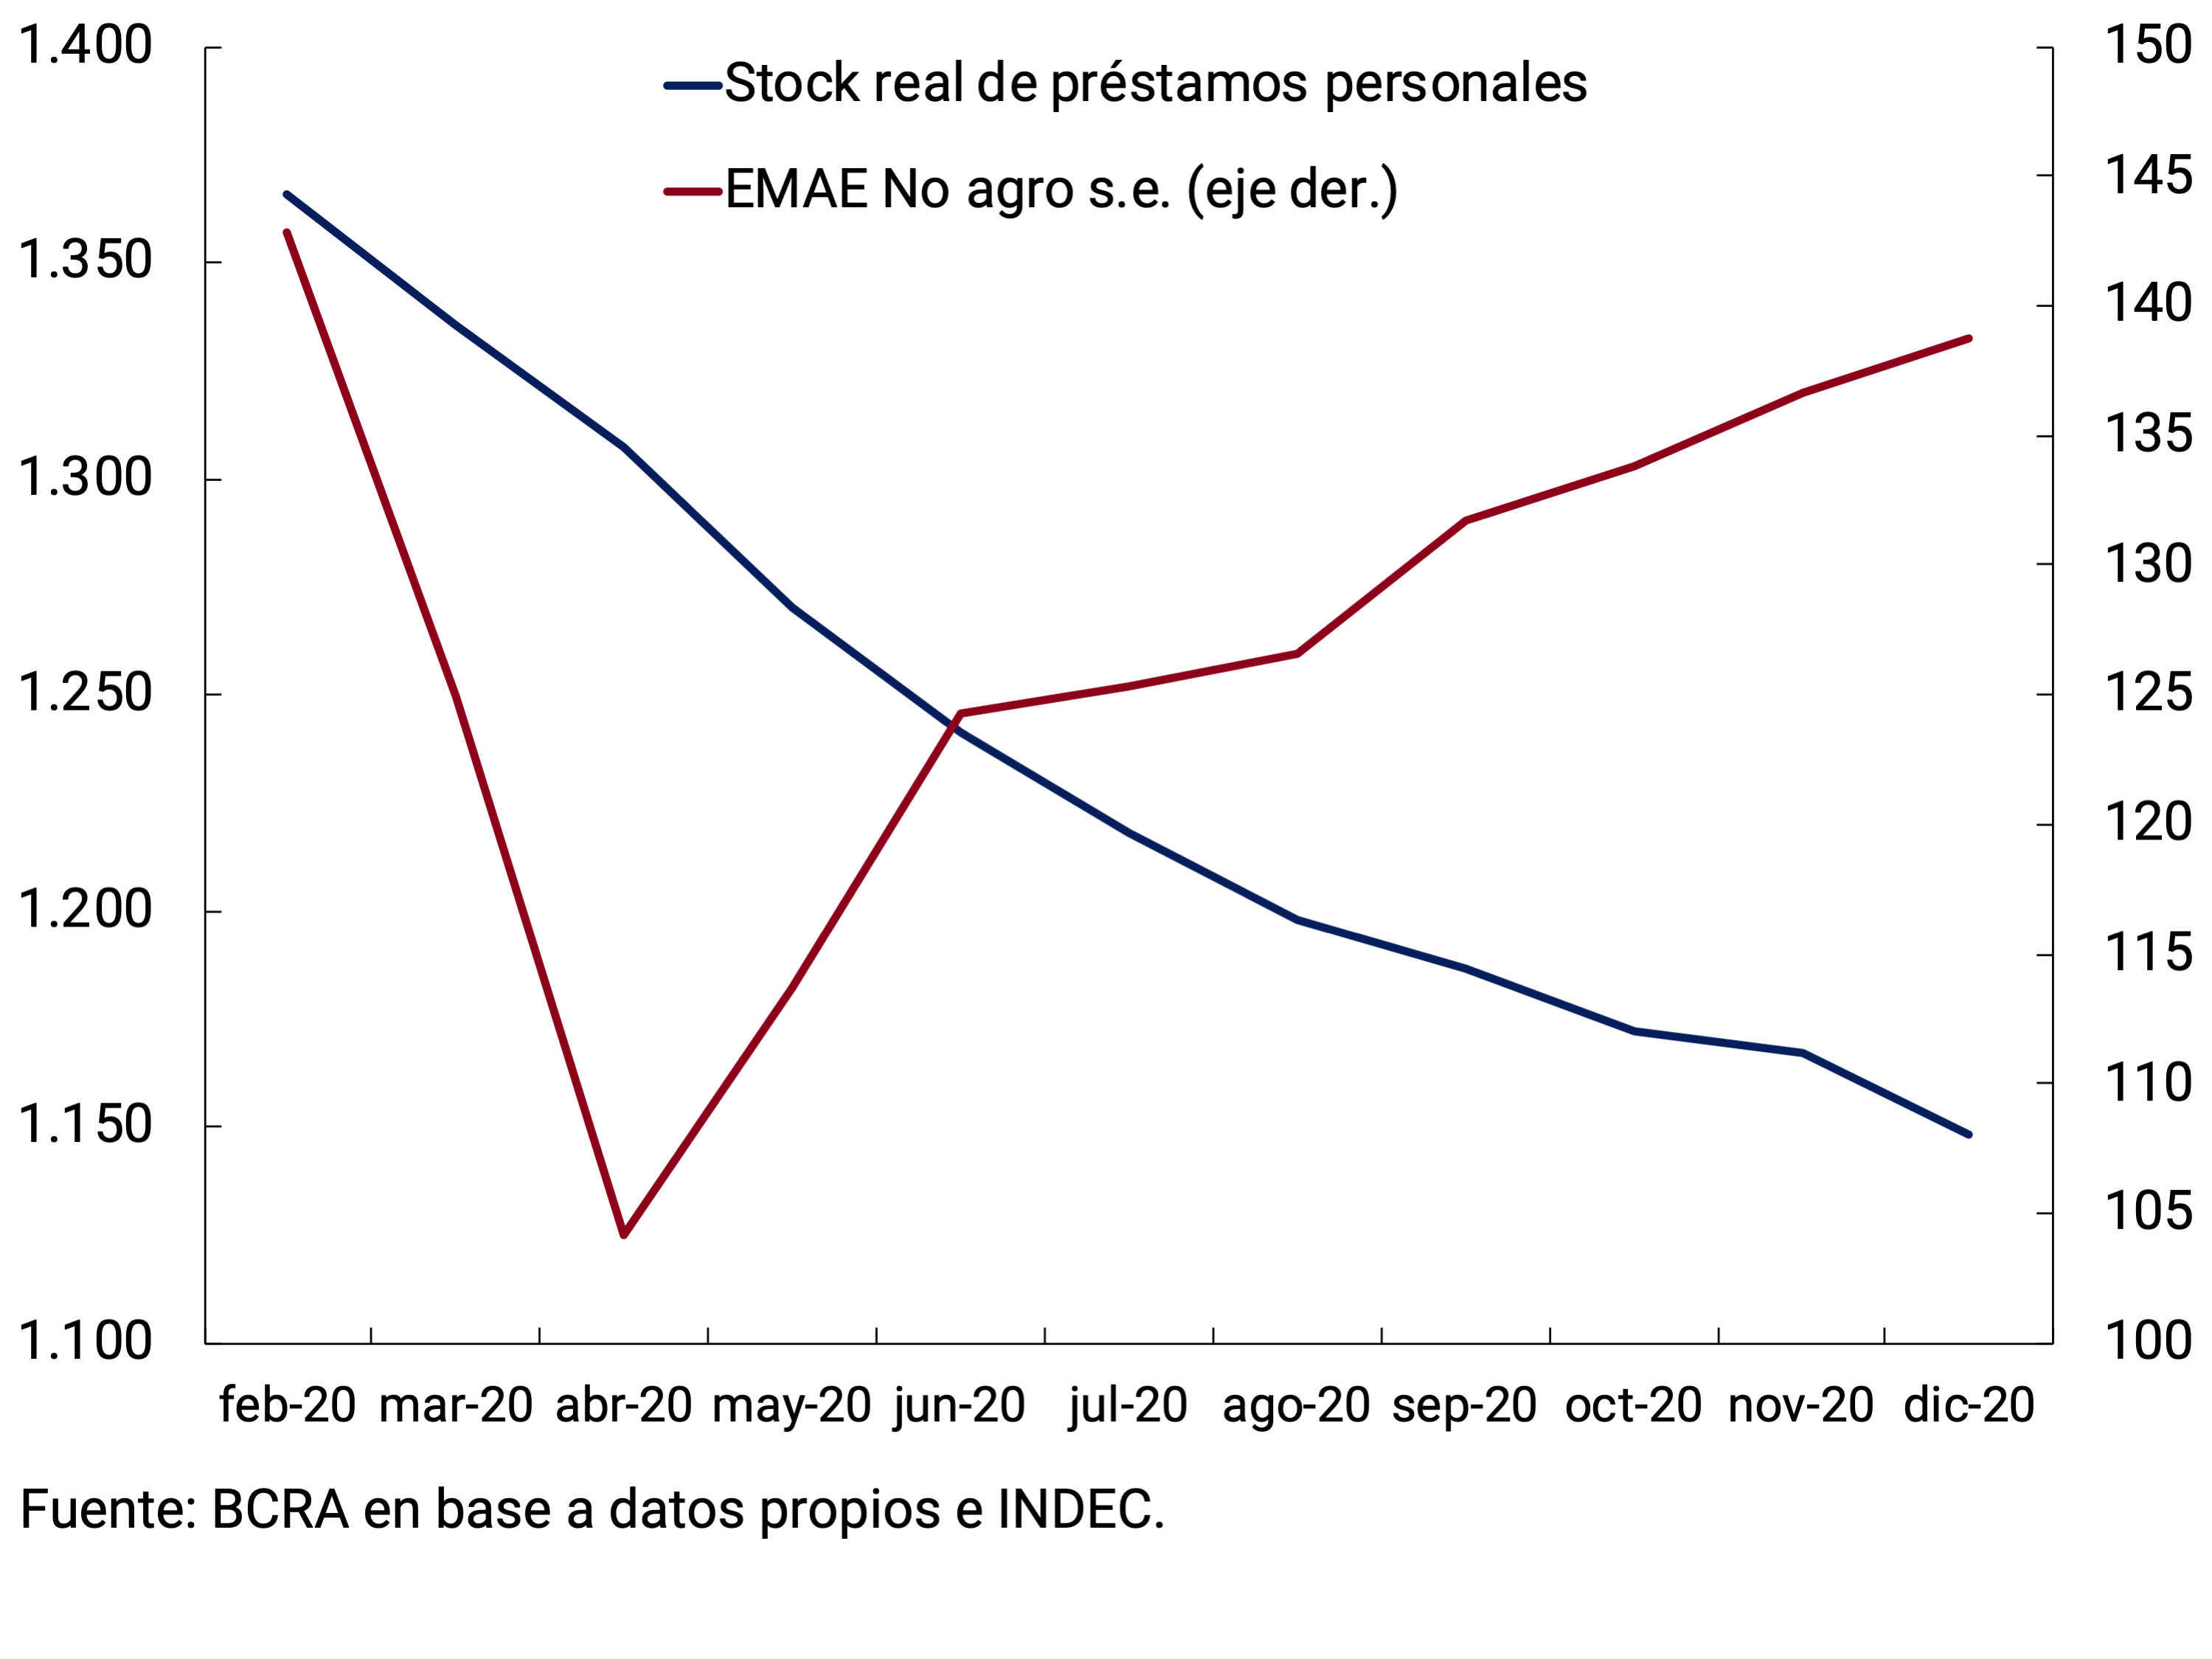
(b) Personal loans and interest rates
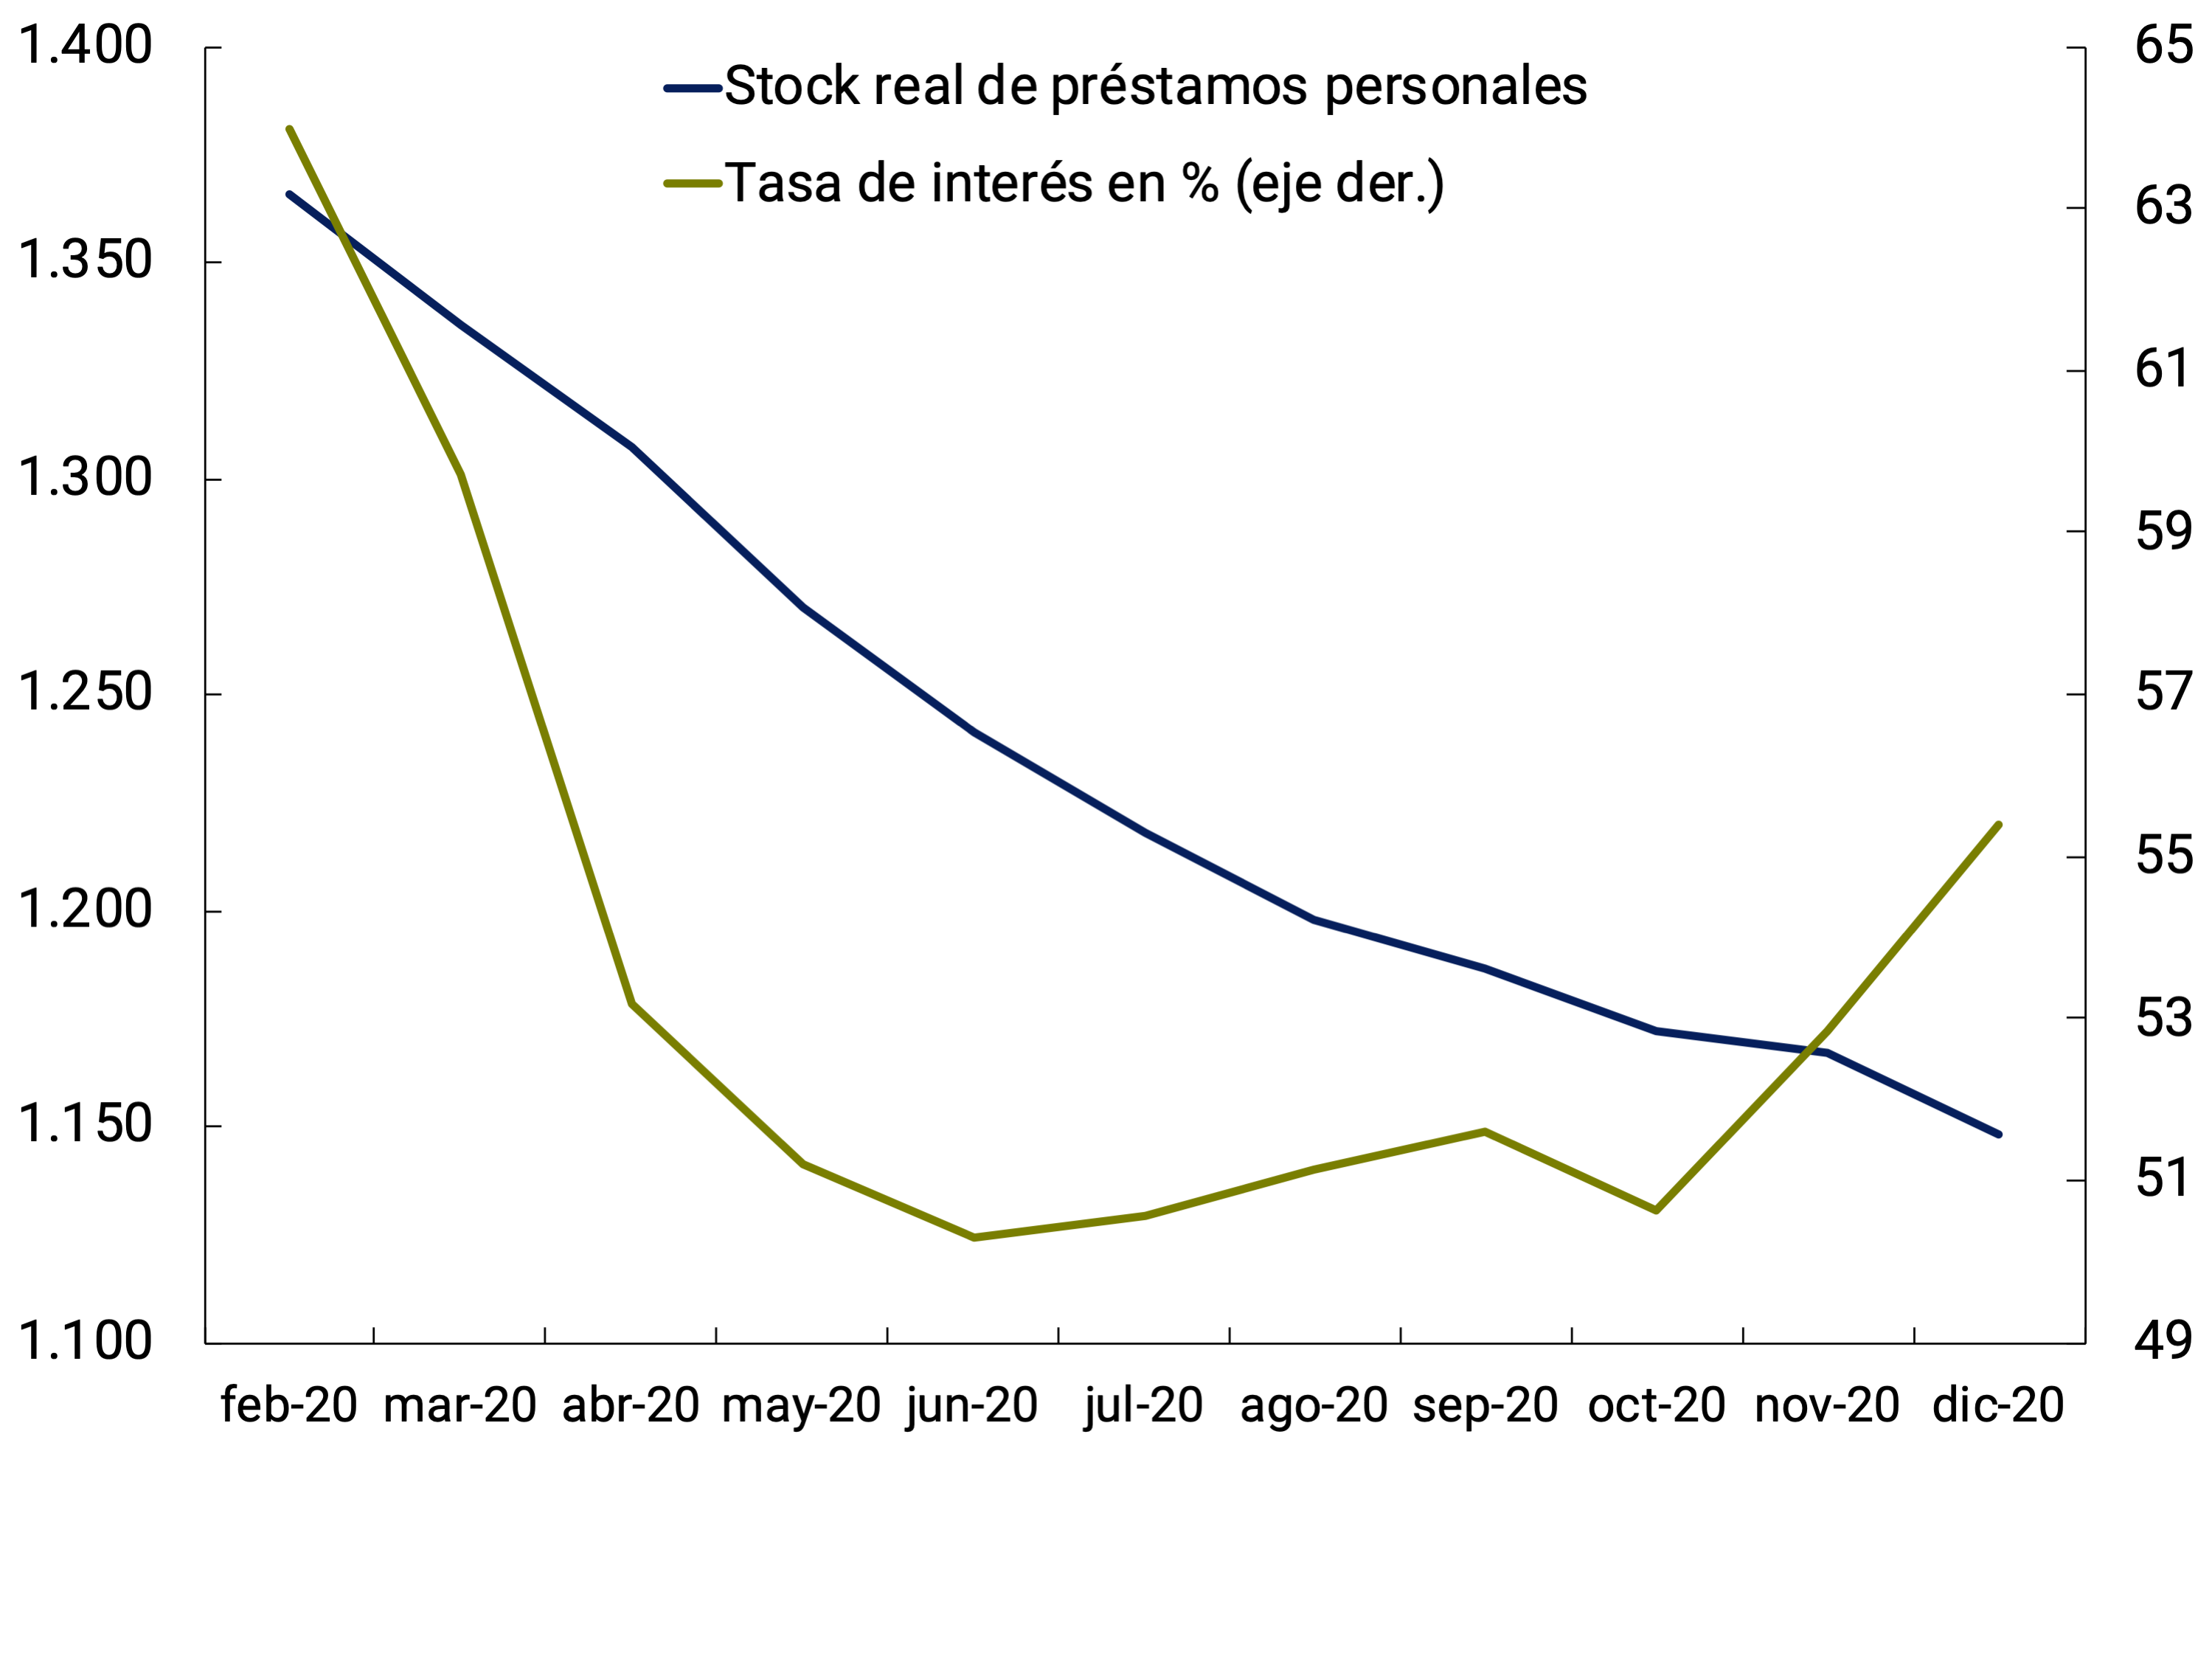
To carry out the exercise, it is necessary to construct counterfactual scenarios that reflect the evolution that each of these loans would have had if their respective interest rate had not decreased as of March 2020. Such quantification requires a model that appropriately captures the dynamics of these loans in normal times, and then proposes alternative scenarios that enable the desired calculation. In this case, an econometric model was estimated for each of these loans, where they are determined by the economic activity and by the interest rate of the credit category in question. In particular, the model assumes a relationship between loans and these determinants that dictates the average dynamics over long periods of time (also known as the cointegration relationship); then, the month-to-month evolution is gradually adapted so that loans are eventually aligned with this long-term relationship56.
With these models, three counterfactual scenarios were constructed for each type of loan starting in March 2020. Scenario I uses the model with parameters that allow us to properly explain the evolution observed on average until February 2020, and asks how the evolution of credit would have been from that month onwards if only the observed evolution of activity were taken into account, but assuming that the corresponding interest rate remained fixed at the value of February 2020. Scenario II uses the same set of parameters, but also incorporates the observed evolution of the interest rate. Finally, Scenario III incorporates the observed path of rates and activity (like Scenario II) but uses parameter values that (according to the estimate) may have changed as of March 2020. These changes may be due to the influence of various economic policies implemented during the period (which, due to their diversity and magnitude, may have modified the dynamics observed), although they may also have been caused by other changes in the economy that could alter the relationship between these variables during the pandemic. Unfortunately, the estimation method does not allow distinguishing the relative weight of these alternatives, but it is at least of interest to consider the effect of these changes.
Table 1 summarizes the results of these exercises. Starting with credit card loans, the first column indicates that the lowest value observed during 2020 (in real terms s.e.) was 5.8% lower than the February 2020 record (as can be seen in Graph 1, this valley occurred in the month of May). Using Scenario I, the results indicate that this minimum would actually have been almost 2 p.p. lower if the interest rate had not decreased (i.e., card loans would have had a maximum contraction of 7.7%). Considering Scenario II, these loans would have had a minimum record that is very similar to that observed (only 0.3 p.p. less). Thus, the decrease in the interest rate cushioned the maximum observed fall in these loans by 1.6 p.p. (i.e., 1.9-0.3); about one-third of the observed drop. Scenario III shows that, if we also consider the potential changes in the inferred parameters for the period after March, the difference with the observed one is even smaller.
Table 1 | Observed Lending Developments and Counterfactual Scenarios
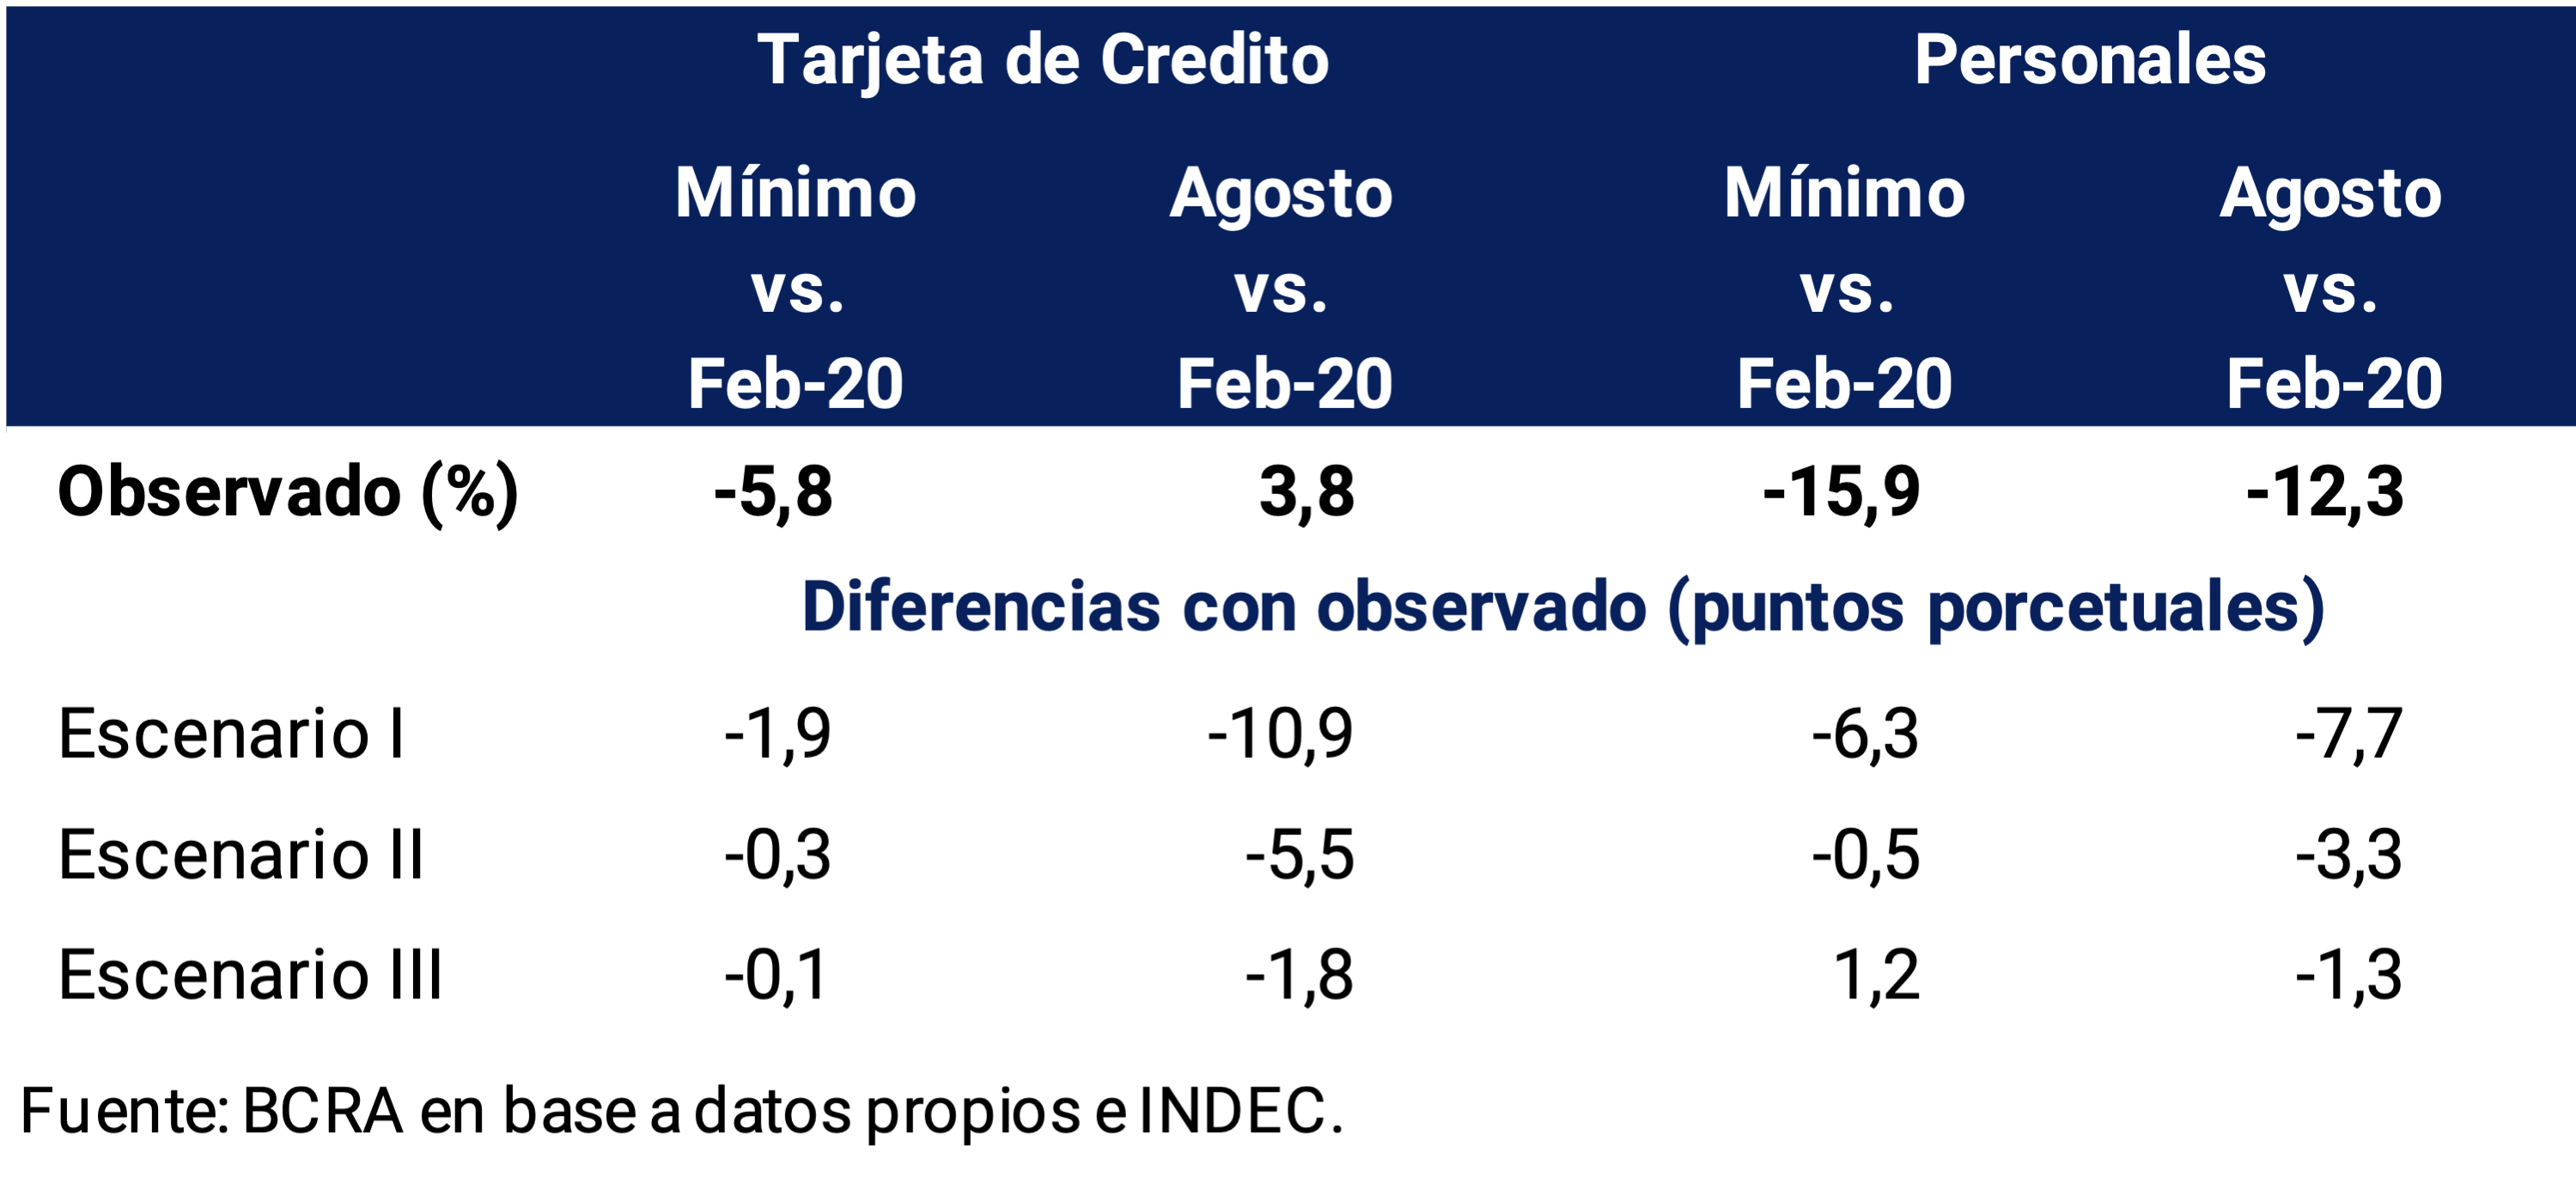
The second column makes a similar comparison, but taking the month of August 2020 as a reference; which, as can be seen in Graph 1, is the month where these loans begin to stabilize after reversing the May minimum (and it is also the month from which interest rates stabilized). In August, card loans had recovered above the level of February, being 3.8% higher than in that month. However, the results of Scenario I show that, if rates had not decreased, loans in August would have been at a level almost 11 p.p. below that observed in the same month (equivalent to 7% less than in February). In other words, while the recovery in activity that began in May could account for an increase in lending, this effect is relatively marginal. If we consider Scenario II, this difference is reduced by half. And if we also consider the changes in the parameters (influenced in part by the set of economic policies, as mentioned above), the difference with the observed one is only 1.8 p.p. (that is, in August the level of credit per card would have been 2% higher than in February)57. Thus, the dynamics of rates not only contributed to limiting the maximum fall in these loans, but also proved fundamental for the subsequent recovery.
The last two columns of Table 1 show analogous comparisons for personal loans. As observed in Graph 2, these loans continued to fall in real terms throughout the year (compared to February, the value of December is 16% lower). However, the results of Scenario I show that, if interest rates had not changed, that fall would have been even greater; contracting the credit by more than 6 p.p. than what was observed. At the same time, both Scenarios II and III account for the contribution of the lower interest rate, which managed to greatly mitigate the influence of the fall in activity. The last column shows the comparison for the month of August, identifying results in the same orders of magnitude.
In conclusion, the set of monetary and financial policies implemented in response to the pandemic, which were reflected in significant decreases in interest rates, were extremely relevant in boosting consumer credit. While the pandemic clearly had a significant negative effect on the economy as a whole, the various countercyclical policies implemented made a positive contribution; in this case identified through their effect on the availability of consumer credit.
References
1 INDEC will release July’s inflation data on August 12.
2 See Carney, M. (2015) “Breaking the Tragedy of the Horizon – Climate change and financial stability”. Speech given in Lloyd’s of London. September 2015. Mark Carney has been driving the Green Finance agenda for some time and the Bank of England currently has an area of work on these issues whose reports can be consulted at the following link.
3 Wholesale Electricity Market Administrator Company (CAMMESA). The information on daily demand in MW is accounted for based on economic transactions by branch of activity, then it is normalized to 30 days per month and seasonally adjusted. The information corresponding to the ALUAR signature is not included.
4 Gross fixed capital formation, is composed of Construction and Durable Production Equipment (which includes Machinery and Equipment and Transportation Equipment, domestic and imported).
5 It is calculated as the quarterly percentage change s.e. of each component multiplied by the share of each of them in the GDP of the previous quarter.
6 Together with the statistical discrepancy.
7 In the first quarter, construction activity increased by 4.5% quarter-on-quarter s.e. (EMAE data) while imported quantities of capital goods increased 14.2% quarter-on-quarter s.e. and national production of this type of goods grew 17.6% s.e. in the same period, according to FIEL.
8 Survey conducted with 1,105 adults, online consumers from all over the country and 220 companies from different sectors that made sales through the Internet.
9 The ranking of the 10 categories with the highest sales by this modality in 2020 was made up of: Audio, image, consoles, telephony equipment; Food, beverages and cleaning supplies; Construction materials and tools; Household items (furniture, decoration); Office supplies; Clothing (non-sports); Household appliances (white goods) and Sports.
10 For each group, the cumulative variation between the first two months of 2020 and the first quarter of 2021, adjusted for seasonality, is specified in parentheses.
11 Sectoral GVA for the fourth quarter of 2020 at 2004 prices and seasonally adjusted were used.
12 Plan for the Promotion of Argentine Natural Gas Production.
13 According to the survey of the Permanent Household Survey (EPH) of INDEC.
14 Data from the MTEySS based on the Argentine Integrated Pension System (SIPA).
15 Resolution 198/2021. Establishing an assistance of $18,000 for critical sectors and the health sector and $12,000 for non-critical sectors that show a lower turnover than that of the same month in 2019. In the event that the net remuneration received by the worker is less than this value, the subsidy will be equal to the net remuneration, which will be determined by applying 83% to the total remuneration declared to the AFIP (Resolution 57/2021 of the MTEySS). Likewise, it was provided that those companies that carry out activities classified as critical will be exempted from the payment of employer contributions to the Argentine Integrated Pension System (SIPA) until December 31, 2021.
16 LVhe AMBA is the common urban area that makes up the City of Buenos Aires (CABA) and 40 municipalities of the Province of Buenos Aires.
17 Its scope is extended to girls and boys up to 14 years of age (previously it reached infants up to 6 years of age). The amount of the card will be $6,000 for mothers with one child; $9,000 for two children; and $12,000 for three or more children. The number of children benefited goes from 1,900,000 to 3,700,000.
18 By Resol. 282/2021, the Ministry of Domestic Trade extended the Ahora 12 Plan until July 31, 2021 with modifications to the conditions.
Through Communication A7240 , the BCRA extended the validity of the Financing Line for Productive Investment MSMEs until the end of September 2021.
19 By means of UNIC 234/21, the National Government established the Export Investment Promotion Regime. It seeks to promote investments aimed at the implementation of new productive projects in forestry-industrial, mining, hydrocarbon, manufacturing and agro-industrial industries, and the expansion of existing business units.
Through DECNU 244/2021, the National Government regulated Law No. 27613 on the Incentive for Argentine Federal Construction and Access to Housing, establishing tax benefits and new tools that seek to promote development and investment in real estate projects.
20 Through DECNU 235/2021 of April 8, the National Government defined new sanitary measures for the control of the pandemic, mainly in the AMBA area. It was subsequently amended by UNCC 241/21 and extended until 21 May by UNDEC 287/2021. On May 20, the National Government announced the temporary deepening of sanitary measures both in the AMBA and in the rest of the areas of the country considered to be of high health risk and epidemiological alarm.
21 The IMF raised the growth outlook for the world economy to 6% from 5.5% projected in January.
22 The EPH does not allow for the precise identification, according to the ILO’s definition, of teleworkers. In this section we use, as an approximation of this concept, employed people who carry out their work tasks mainly from their homes.
23 The ranking of the 10 categories with the highest sales by this modality in 2020 was made up of: Audio, image, consoles, telephony equipment; Food, beverages and cleaning supplies; Construction materials and tools; Household items (furniture, decoration); Office supplies; Clothing (non-sports); Household appliances (white goods) and Sports.PP can be divided into 10 grouped, MOA into 14, MOI into 9 and S into 5.
24 Another factor that could explain the difference is the variation in assets due to uncollected exports.
25 A summary of the regulatory modifications introduced throughout 2020, with an impact on foreign exchange market flows, can be read in the report on the Evolution of the Exchange Market and Exchange Balance of December 2020.
26 For more information regarding the recent evolution of the Foreign Exchange Market and Exchange Balance, you can access the monthly reports published by the BCRA at the following link.
27 The data presented here have been presented in the reports on private external debt published by the BCRA on its website.
28 Communication A6770 and complementary ones.
29 VAT-DGA, DGA Profits, Import Duties and Statistical Tax.
30 Law 27617 was recently enacted, which increased the non-taxable minimum and the special deduction for retirees and employees in a relationship of dependency, relieving the low and middle income brackets that were covered by the tax, while implementing a schedule for the refund of what was withheld until the time of entry into force of the rule.
31 In relation to personal contributions to social security, in August 2019 the temporary exemption of part of the payment of personal contributions during the months of September and October had been ordered.
32 The negative year-on-year evolution of the rest of the NFPS revenues (-4.6% YoY in the first quarter of the year) is mainly due to the lower capital resources available by the ANSeS to finance the payment of the obligations arising from the Historical Reparation Program for retirees and pensioners (Law 27574).
34 During the first four months of 2021, the BCRA granted $190,000 million of net Transitory Advances (TA) to the National Treasury (TN), which contrasted with the financial assistance of the same period in 2020 for $310,000 million in transfer of advances of profits and $312,000 million of net TA.
35 Resolutions No. 78 and 79 of the Electricity Regulatory Entity (ENRE).
36 Cinemas were enabled to operate in March after having remained inactive since the beginning of the pandemic, but were again affected by the restrictions associated with the second wave of COVID-19. According to INDEC, until February, the lack of transactions made it impossible to define the prices of attendance at movie theaters, and since then they must be attributed by the level of the immediately higher group. During March, the reopening of cinemas made it possible to capture the accumulated variation in effective prices after having been excluded from the CPI survey since April last year. The disqualification to operate since mid-April in some regions within the framework of the health emergency foresees that prices must be charged again at the next higher level to avoid the distortion that would be generated by including a zero variation for this concept.
37 MAGyP Resolution No. 75/2021.
38 In the April report of the BCRA’s Market Expectations Survey, the median of general inflation expectations for the current year stood at 47.3%, while those who lead the first 10 positions of the REM ranking estimate on average that year-on-year inflation will reach 47.5% in December 2021.
39 Based on the results of the 2004/05 Household Expenditure and Income Survey (ENGHo 2004/05).
40 See Section 3 / National Consumer Price Index of the July 2017 edition of the Monetary Policy Report.
41 In the case of the Consumer Price Index of the City of Buenos Aires (IPCBA) prepared by the Directorate of Statistics and Censuses of the City of Buenos Aires, the weighting of goods and services in the base period is 47% and 53%, respectively. This represents a greater relative weighting for services than that observed in the GBA CPI of INDEC which, at the level of territorial coverage in addition to the CABA, also covers the Buenos Aires metropolitan area.
42 In the case of electricity tariffs, excluding the GBA, the provincial governments have jurisdiction over the distribution companies and the increases are authorized based on the resolutions of the provincial regulatory entities.
43 However, it is worth noting the recent increases in the electricity rates authorized on I-21 in other provinces such as Río Negro (Patagonia), Córdoba and Santa Fe (Pampeana) and Entre Ríos (Northeast).
44 All strata of amount showed marked growth, with a very similar dynamic between deposits of more than and less than $1 million.
45 In March, the BCRA decided to extend the validity of the LFIP until the end of September through Communication A7240, maintaining the quota of 7.5% of non-financial private sector deposits in Mar-21 pesos for Group A entities and 25% of said quota for financial agents that do not belong to Group A.
46 Resolution 282/2021 of the Secretariat of Domestic Trade of the Ministry of Productive Development.
47 The reference framework for the external deleveraging of the private sector was established by point 7 of Communication A7106 and was extended by Communication A7230.
48 This limit was previously $1,000,000.
51 Decree 234/21.
52 In forestry-industrial, mining, hydrocarbon, manufacturing and agro-industrial activities.
54 As of May 2020, the series of credit card loans includes the “Zero Rate Credit” financing in pesos provided for in Decree No. 332/2020 (and amendments). These, according to the BCRA’s communication A6993/2020C, must be credited to the credit card issued by the entity of the applicant for financing, to all customers who request them. To carry out the analysis, these amounts granted were excluded from the total stock since, although they are accounted for within the credit card category, they are not comparable with those that are usually included in that group. For example, in August 2020 these represented more than 7% of the total stock of credit card loans. In the same way, the credit card interest rate series is constructed as a weighted average of the rates corresponding only to loans with a positive rate.
55 Between August 2018 and December 2019, these loans decreased by about 50% in real terms. The drop during 2020 was 19%.
56 These models are known as error correction (ECM). For each type of loan, in a first stage, the cointegration relationship between the levels of loans (real s.e.), EMAE (real s.e., excluding the Agro sector) and the interest rate of the corresponding credit line is estimated; using dynamic least squares (DOLS) estimates. A model for the growth of real loans is then estimated as a function of loan arrears, of the growth of activity and the interest rate, and of the residuals of the long-term relationship. The estimates were made with monthly data for the period 2004-2020. However, the model allows the short-term elasticities to be different as of March 2020; also adding binary variables for the months of March and April 2020 to control for the large movements of those months. In this way, there are two sets of parameters: one that characterizes the evolution of the variables before the pandemic, and another for the period after. Finally, the possibility of including a wage bill index of registered employment as a measure of activity was also evaluated. However, the adjustment of the models, in particular for the 2020 period, was not as precise as when the EMAE is used as an indicator, so results were only reported with that alternative.
57 Like all econometric models, the fit is not perfect and there are always residues to be explained; because the model is always a simplification of reality. But, as can be seen, in relative terms the magnitude of this waste is smaller.
Share on


