Summary
1. Monetary policy: assessment and outlookThe international context continues to be favorable for Argentina. The global economy continued to recover during the third quarter of the year, although at a slower pace than in previous months. The latest forecasts kept the growth projections for the global economy for this year and next practically unchanged (5.8% and 4.8%, respectively). On the other hand, although with a reduction in the margin, the prices of raw materials exported by the country remained at high levels in historical terms. Going forward, external risks are mainly linked to the implications of the rise in international energy prices, which, in a context of rising inflationary expectations in advanced countries, could accelerate the reduction of the monetary stimuli deployed during the crisis and slow down global growth. In the same sense, possible outbreaks of the Delta variant or the expansion of new strains of COVID-19 could have an impact that force the reimposition of sanitary measures that restrict circulation. In Argentina, since June, a systematic drop in the rate of COVID-19 infections has been observed, which reached minimum levels in October. This improvement in the epidemiological situation was possible thanks to the significant progress made in the vaccination campaign. The lower economic impact of the second wave and the subsequent rapid recovery made it possible to achieve continuity in the process of reopening and revitalizing the local economy, although with still heterogeneous sectoral performances. It is estimated that activity will continue to recover in the remainder of the year, driven by the flexibilities of both activities and capacity, supported by greater vaccination coverage with complete schemes of the population, and by the stimulus policies implemented by the National Government and the BCRA. All in all, GDP would grow by about 9% in 2021, also translating into improvements in employment. In this more dynamic macroeconomic environment, retail inflation in September and October stood at 3.5%, above the monthly average observed during the third quarter of 3%. Core inflation, essentially less volatile, also remained at a high value since July, close to 3.2%. On top of an inflationary inertia that remains at high values in recent months, transitory factors anticipated in previous versions of the IPOM were added, with greater intensity than expected. These include the impact of international prices, which have lately been more closely linked to energy prices and the cost of global manufacturing, the observed recomposition of marketing margins in certain sectors and the readjustment of relative prices of private services in the face of the reopening of activities within the framework of the improvement in the epidemiological situation, and, to a lesser extent, to the updates of the salary parity agreements. This occurred in a context where the electoral process gave greater volatility to exchange rate expectations. The BCRA faced these weeks of greater financial volatility, calibrating its intervention in the spot and forward exchange markets and adapting the exchange regulation in order to preserve exchange rate stability. It should be noted that, between January and October, the monetary authority accumulated purchases in the foreign exchange market for US$6,421 million, constituting the highest value since 2012 for the first 10 months of the year, while international reserves increased by US$3,430 million in the same period, mainly considering the net cancellations of principal and interest on debt in foreign currency of the National Government and the open market operations of the BCRA. At the close of this edition, also counting on the income of the allocation of Special Drawing Rights (SDRs) by the IMF to mitigate the effects of the pandemic, international reserves stood at around US$42.6 billion and, despite the lower dynamism of the nominal exchange rate in recent months, the ITCRM remained at competitive levels and around the average of the last 24 years. The BCRA calibrates the liquidity of the economy, sterilizing any surpluses, to help preserve monetary balance. In this regard, so far this year, primary expansion linked to the public sector was at levels significantly lower than those of the previous year of the pandemic, reflecting values with respect to GDP similar to those of previous years. In this sense, in the third quarter of the year the growth of the monetary base was 8.6%, maintaining in October an expansion rate similar to that of the previous three months. In year-on-year terms and at constant prices, the base continued to contract, reaching a variation of -17.1% in October, which placed it in GDP terms at figures similar to those of mid-2003.In support of the economic recovery, the BCRA continued with its credit policy focused on the most backward sectors and on the promotion of productive development. The Productive Investment Financing Line (LFIP) continued to be the main vehicle for channeling productive credit to MSMEs under favorable financial conditions. Since its implementation, and with data as of October 31, the LFIP has accumulated disbursements for a total of $1,187,780 million. Recently, the BCRA decided to extend the validity of the LFIP until the end of March 2022, extending it to some specific sectors. With the boost of the LFIP, the balance of credit to relatively smaller companies showed a sustained increase in real terms since the beginning of August, registering an average monthly increase in the third quarter of 2% and accelerating to 4.9% in real terms s.e. in October. Among consumer-related loans, credit card financing has recovered since the end of September, mainly due to the relaunch of zero-rate loans for single-tax individuals. In the coming months, it is expected that as the transitory factors that pressured the general price level subside, inflation will resume a path of gradual deceleration. In this regard, the BCRA will focus its efforts on promoting a macroeconomic environment with lower inflation levels than those currently observed, without damaging the economic recovery underway. For its part, the temporary setting of maximum prices for sale to the final consumer recently established by the National Government, aimed at bringing the prices of a set of products back to their values of early October and keeping them unchanged until next January, will also contribute to moderating inflation in the last months of the year. Looking ahead to 2022, an upcoming agreement with the IMF will help improve the expectations of those actors who condition their vision of the sustainability of the external sector on the outcome of such negotiations, helping to contain exchange rate pressures and inflation expectations. In this sense, the sustained growth of economic activity and a moderation in the inflation rate will lead to a greater demand for real monetary balances, which would be around the average value recorded during the previous decade (2010-2019). In this new stage, it is expected that the lower financing needs of the National Treasury and the greater role of the peso debt market will contribute to reducing the monetary sterilization effort. This will favor the demand for the monetary base to be provided by the interest associated with the BCRA’s interest-bearing liabilities and, potentially, by a reduction in its stock.
2. International context
During the third quarter of the year, new global COVID-19 cases continued to rise to a peak of 4.2 million per week towards the end of August, and have since dropped to 2.8 million by the end of October. Although at the date of publication of this report cases were increasing again, standing at 3.4 million per week, the lethality rate is lower than in previous phases of the pandemic. Vaccination also accelerated in Latin America and Asia, although significant divergences remain between high- and low-income countries. The global economy continued to recover during the third quarter of the year, albeit at a slower pace, given the disruption of global supply chains and the continuation of the pandemic. The latest forecasts kept the growth projections for the global economy for this year and next practically unchanged (5.8% and 4.8% on average, respectively), while a divergent evolution between advanced and developing countries is still expected. Global inflation accelerated, and it did so most markedly in developing countries. The central banks of the latter have reacted with sharp interest rate hikes, while those of advanced countries have begun to withdraw their quantitative monetary stimulus. Going forward, the global economic recovery remains subject to high uncertainty. The disparity of vaccination campaigns and the continuity (or not) of support policies give rise to a scenario in which developing economies will take several more years to reach pre-pandemic levels of activity. The advanced countries’ response to inflation could lead to tighter financial conditions for the rest of the world. Similarly, the boom in the stock market and cryptocurrencies presents the risk of a “sudden correction”, with a potentially adverse impact on capital flows to emerging countries.2.1. Daily cases rose with lower lethality than in previous phases and booster doses of vaccines began to be appliedDuring the third quarter of the year, new global cases of COVID-19 continued to rise to a peak of 4.2 million per week at the end of August, and since then they fell to 2.8 million by the end of October. First cases fell in Southeast Asia, and then in the United States. In contrast, in Europe they remained relatively stable, and from the end of September they began a marked rise, particularly in Germany, Russia and the United Kingdom. South America, so far, has not registered a strong rise in cases again, although in the days prior to the publication of this report, increases were observed in some countries. At the time of publication, global cases were at 3.4 per week and rising again, with an epicentre in Europe (see Figure 2.1). Deaths followed the evolution of cases, but increased less than in previous phases: the global fatality rate fell from 2.5% in June (during the peak of deaths in India) to 1.40%, and in mid-November it stood at 1.66%.

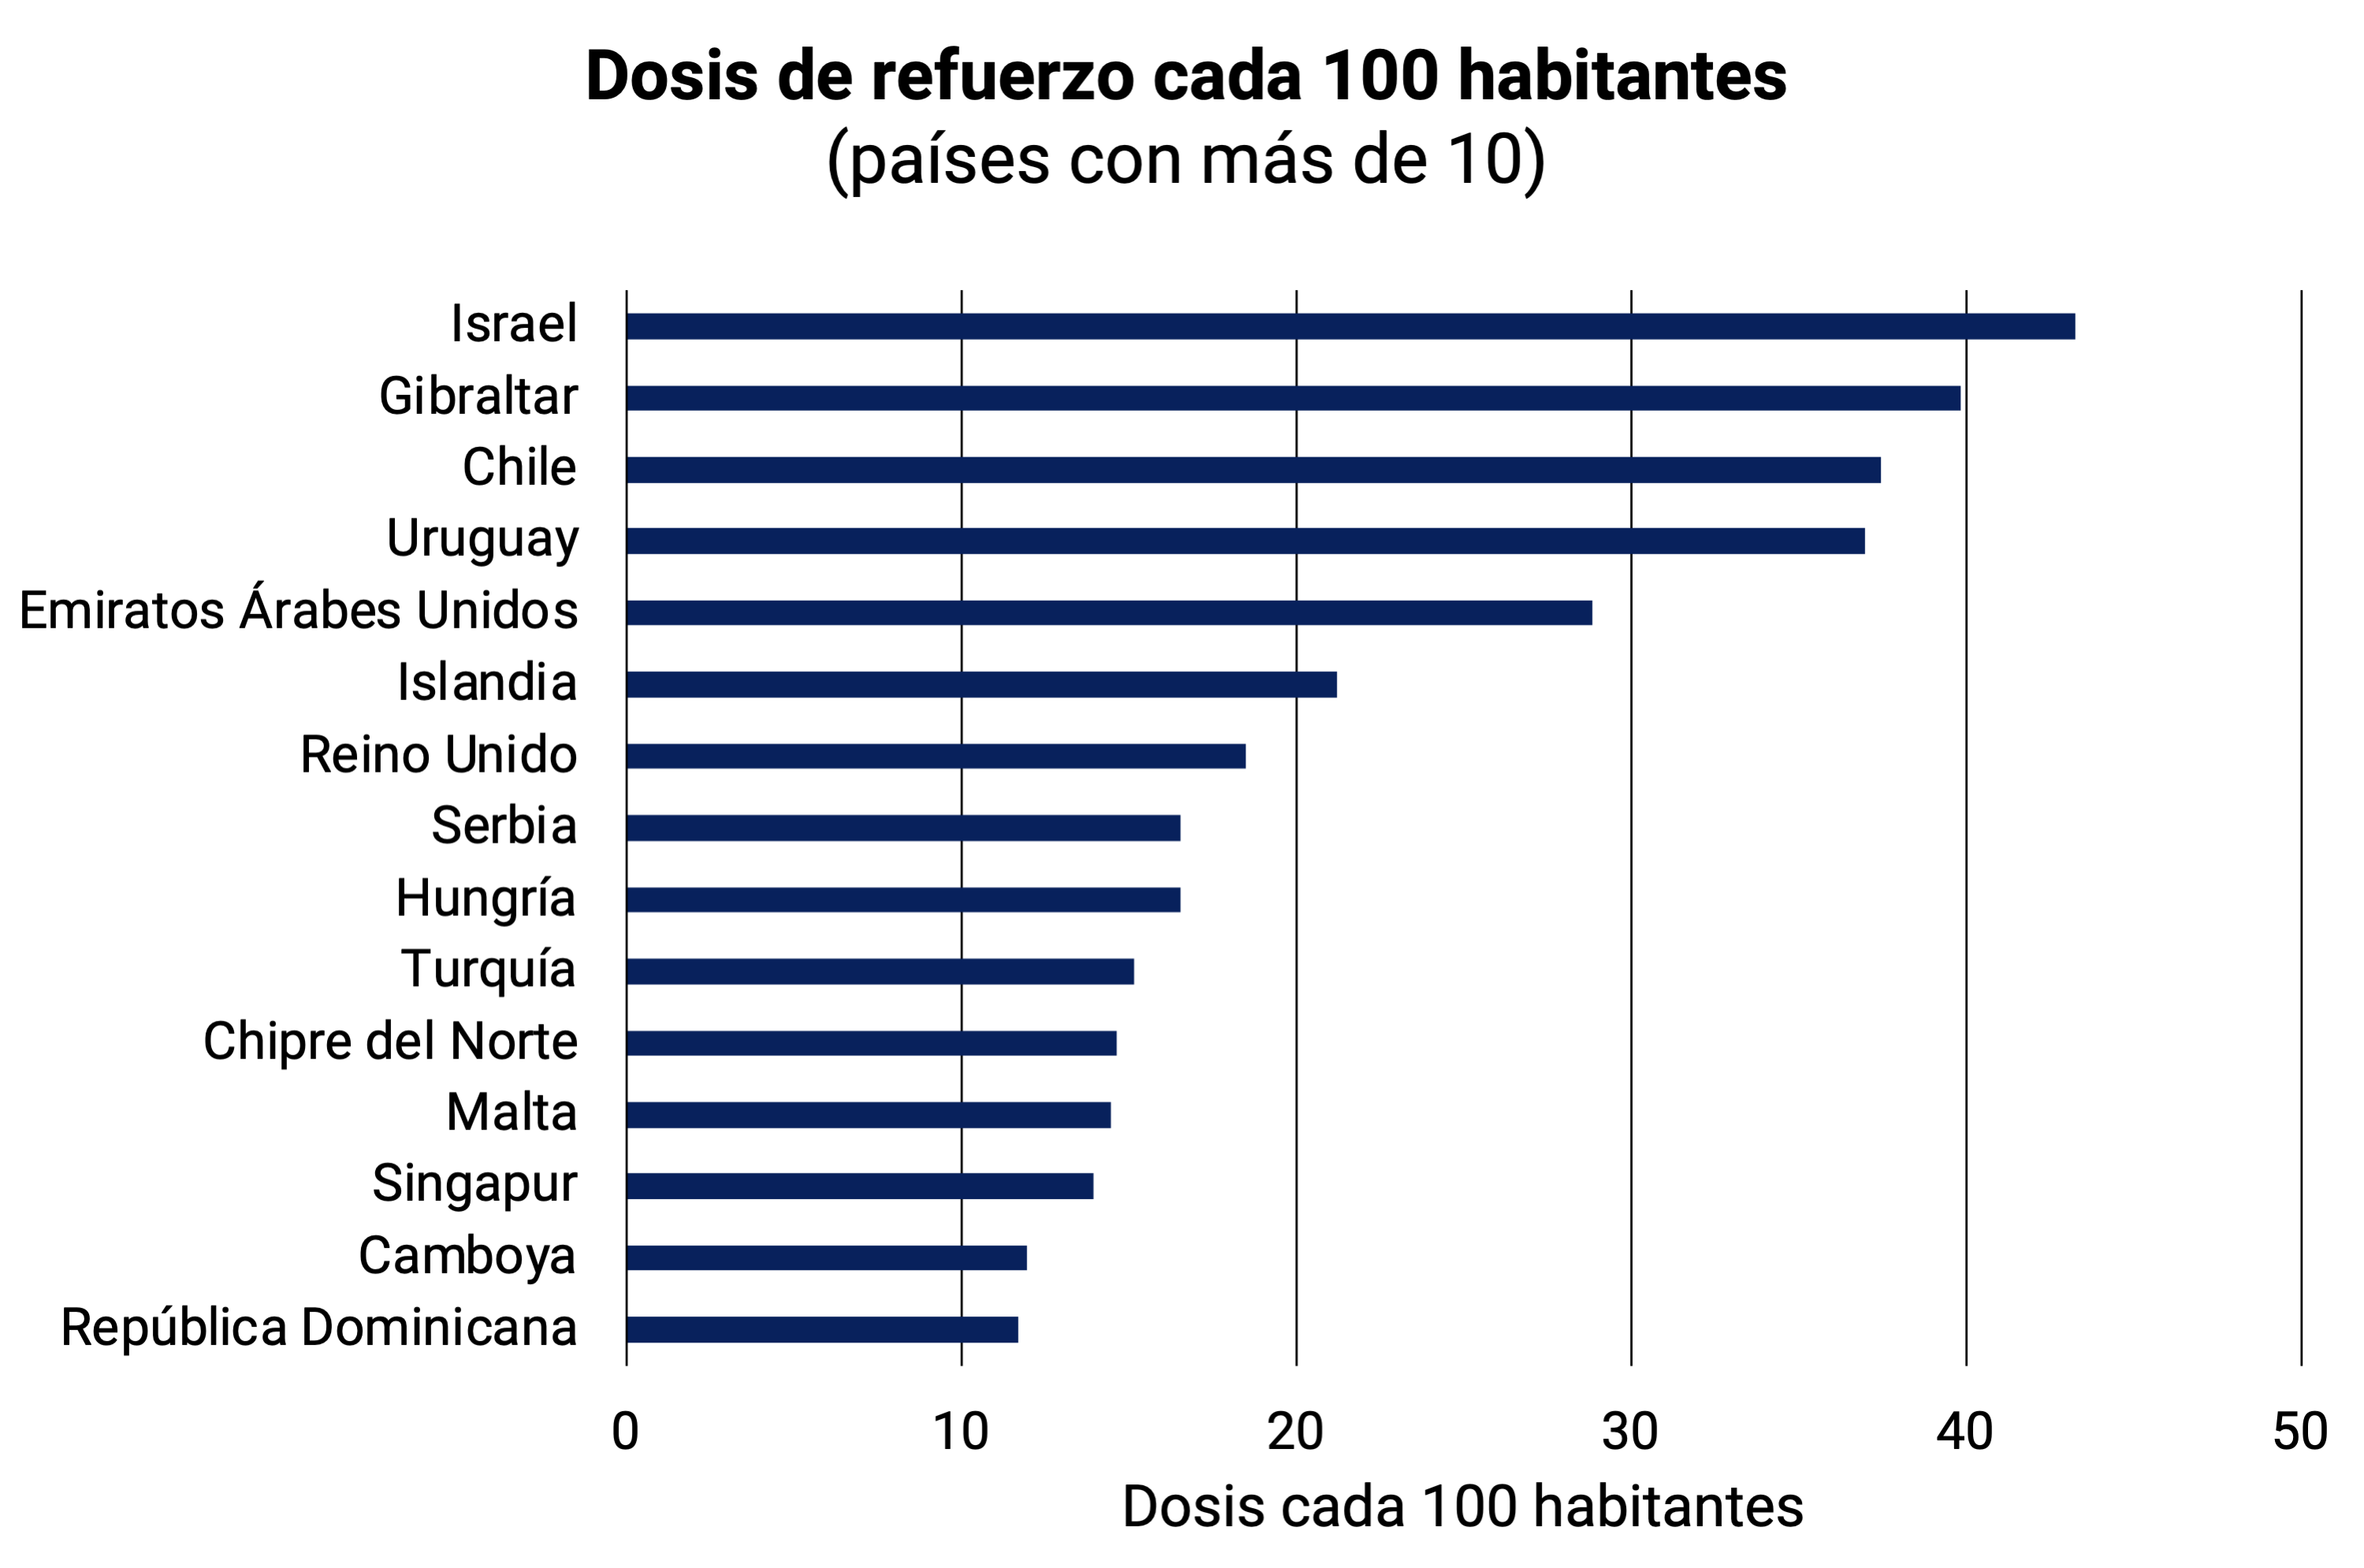
Vaccination accelerated notably in South America, Oceania and Asia, which converge towards the levels of percentage of the population with a complete scheme in Europe and North America. Meanwhile, vaccination in Africa is lagging markedly behind (see Figure 2.2). Thus, while more than 65% of the population in high-income countries is fully vaccinated, less than 4% completed the scheme in low-income countries. Given the greater contagiousness of the Delta variant and the evidence of the fading effectiveness of vaccines over time, more than 50 countries have already begun to apply booster doses. Israel has already applied them to 43% of its population, Uruguay and Chile to 37%.
Figure 2.2 | Evolution of vaccination campaigns

In countries where cases increased, the growing trend in mobility that had been observed slowed down, or even fell. Some (such as Germany and France) reintroduced restrictions that, except for Japan, generally did not reach last year’s levels (see Figure 2.3).
Figure 2.3 | Mobility change (7-day moving average) and social distancing measures stiffness index (-100 = maximum stiffness) of selected countries

2.2. Global economic recovery continues, but slows in the third quarter
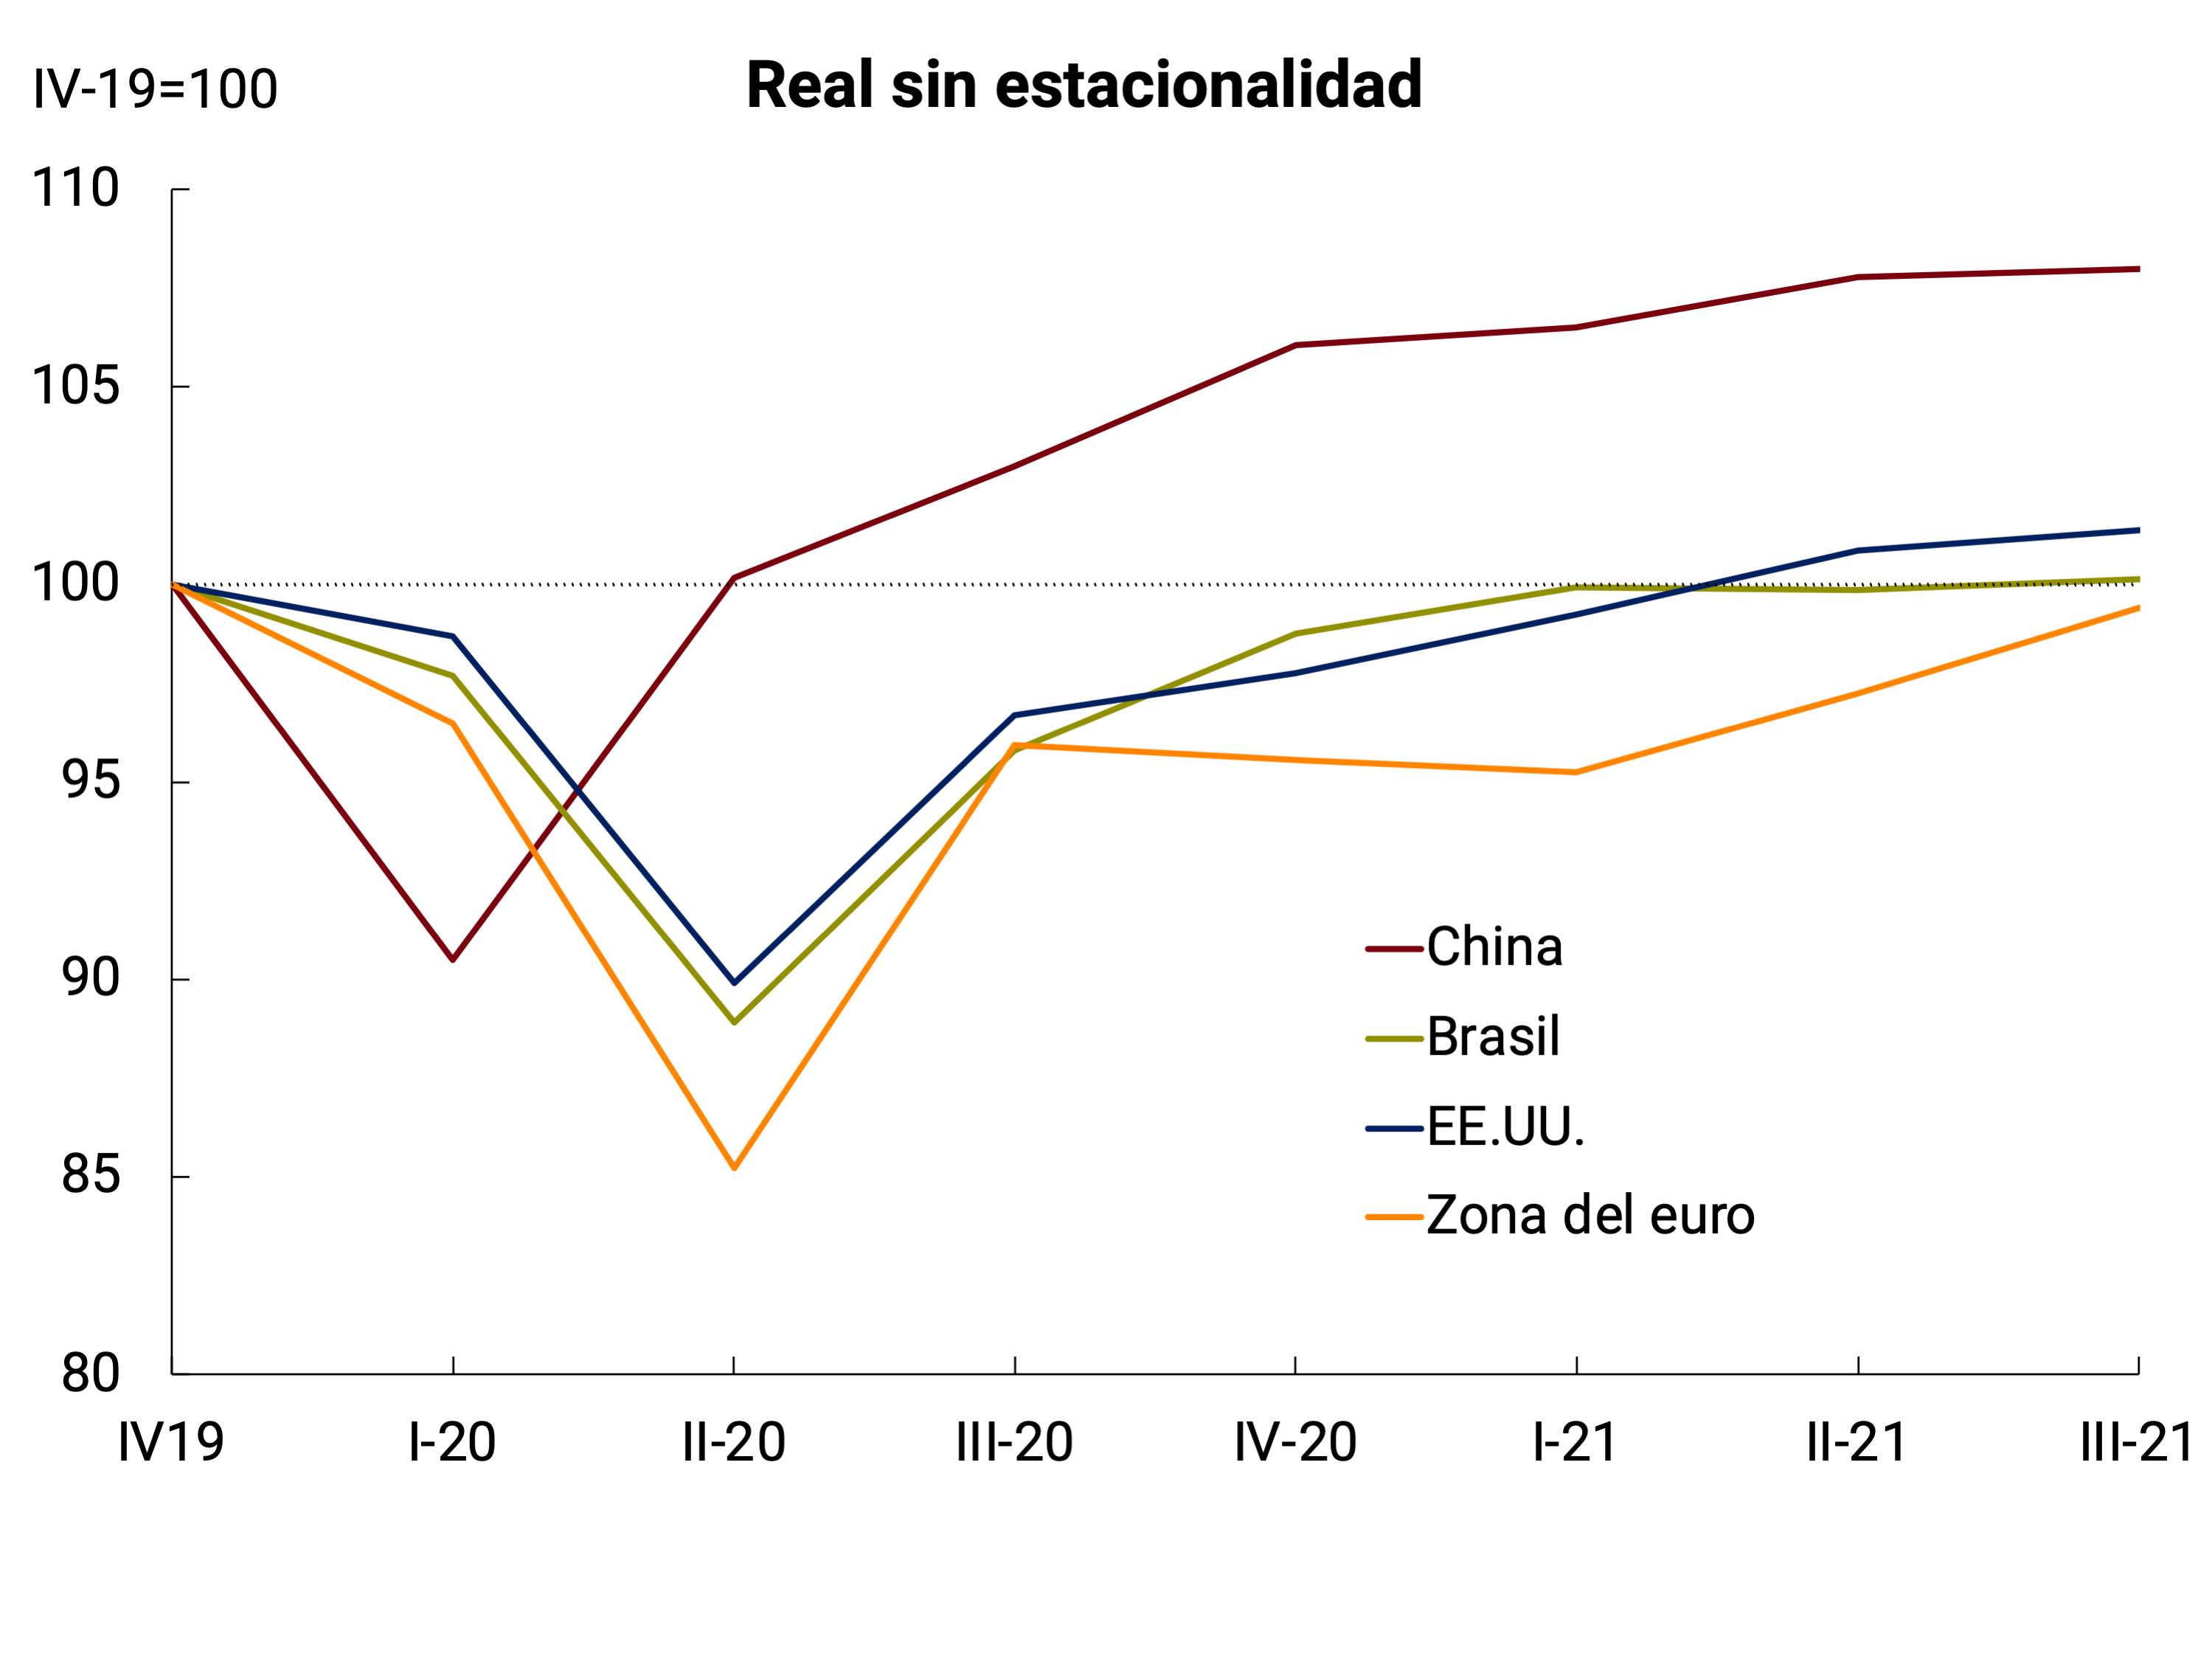
The global economy continued to grow in the third quarter of the year, albeit at a slower pace than in previous quarters (see Figure 2.4). This was due to the interruption of global supply chains and the continuity of the pandemic in some countries. Among Argentina’s main trading partners, the slowdowns in the expansion of economic activity in the United States and, especially, in China, and the low growth in Brazil stand out. In the euro area, economic activity picked up again at a high rate, similar to that of the second quarter. Thus, in the third quarter of 2021, the activity levels of Argentina’s main trading partners were above or close to pre-pandemic levels (see Figure 2.4).
Figure 2.4 | Evolution of the GDP of Argentina’s main trading partners

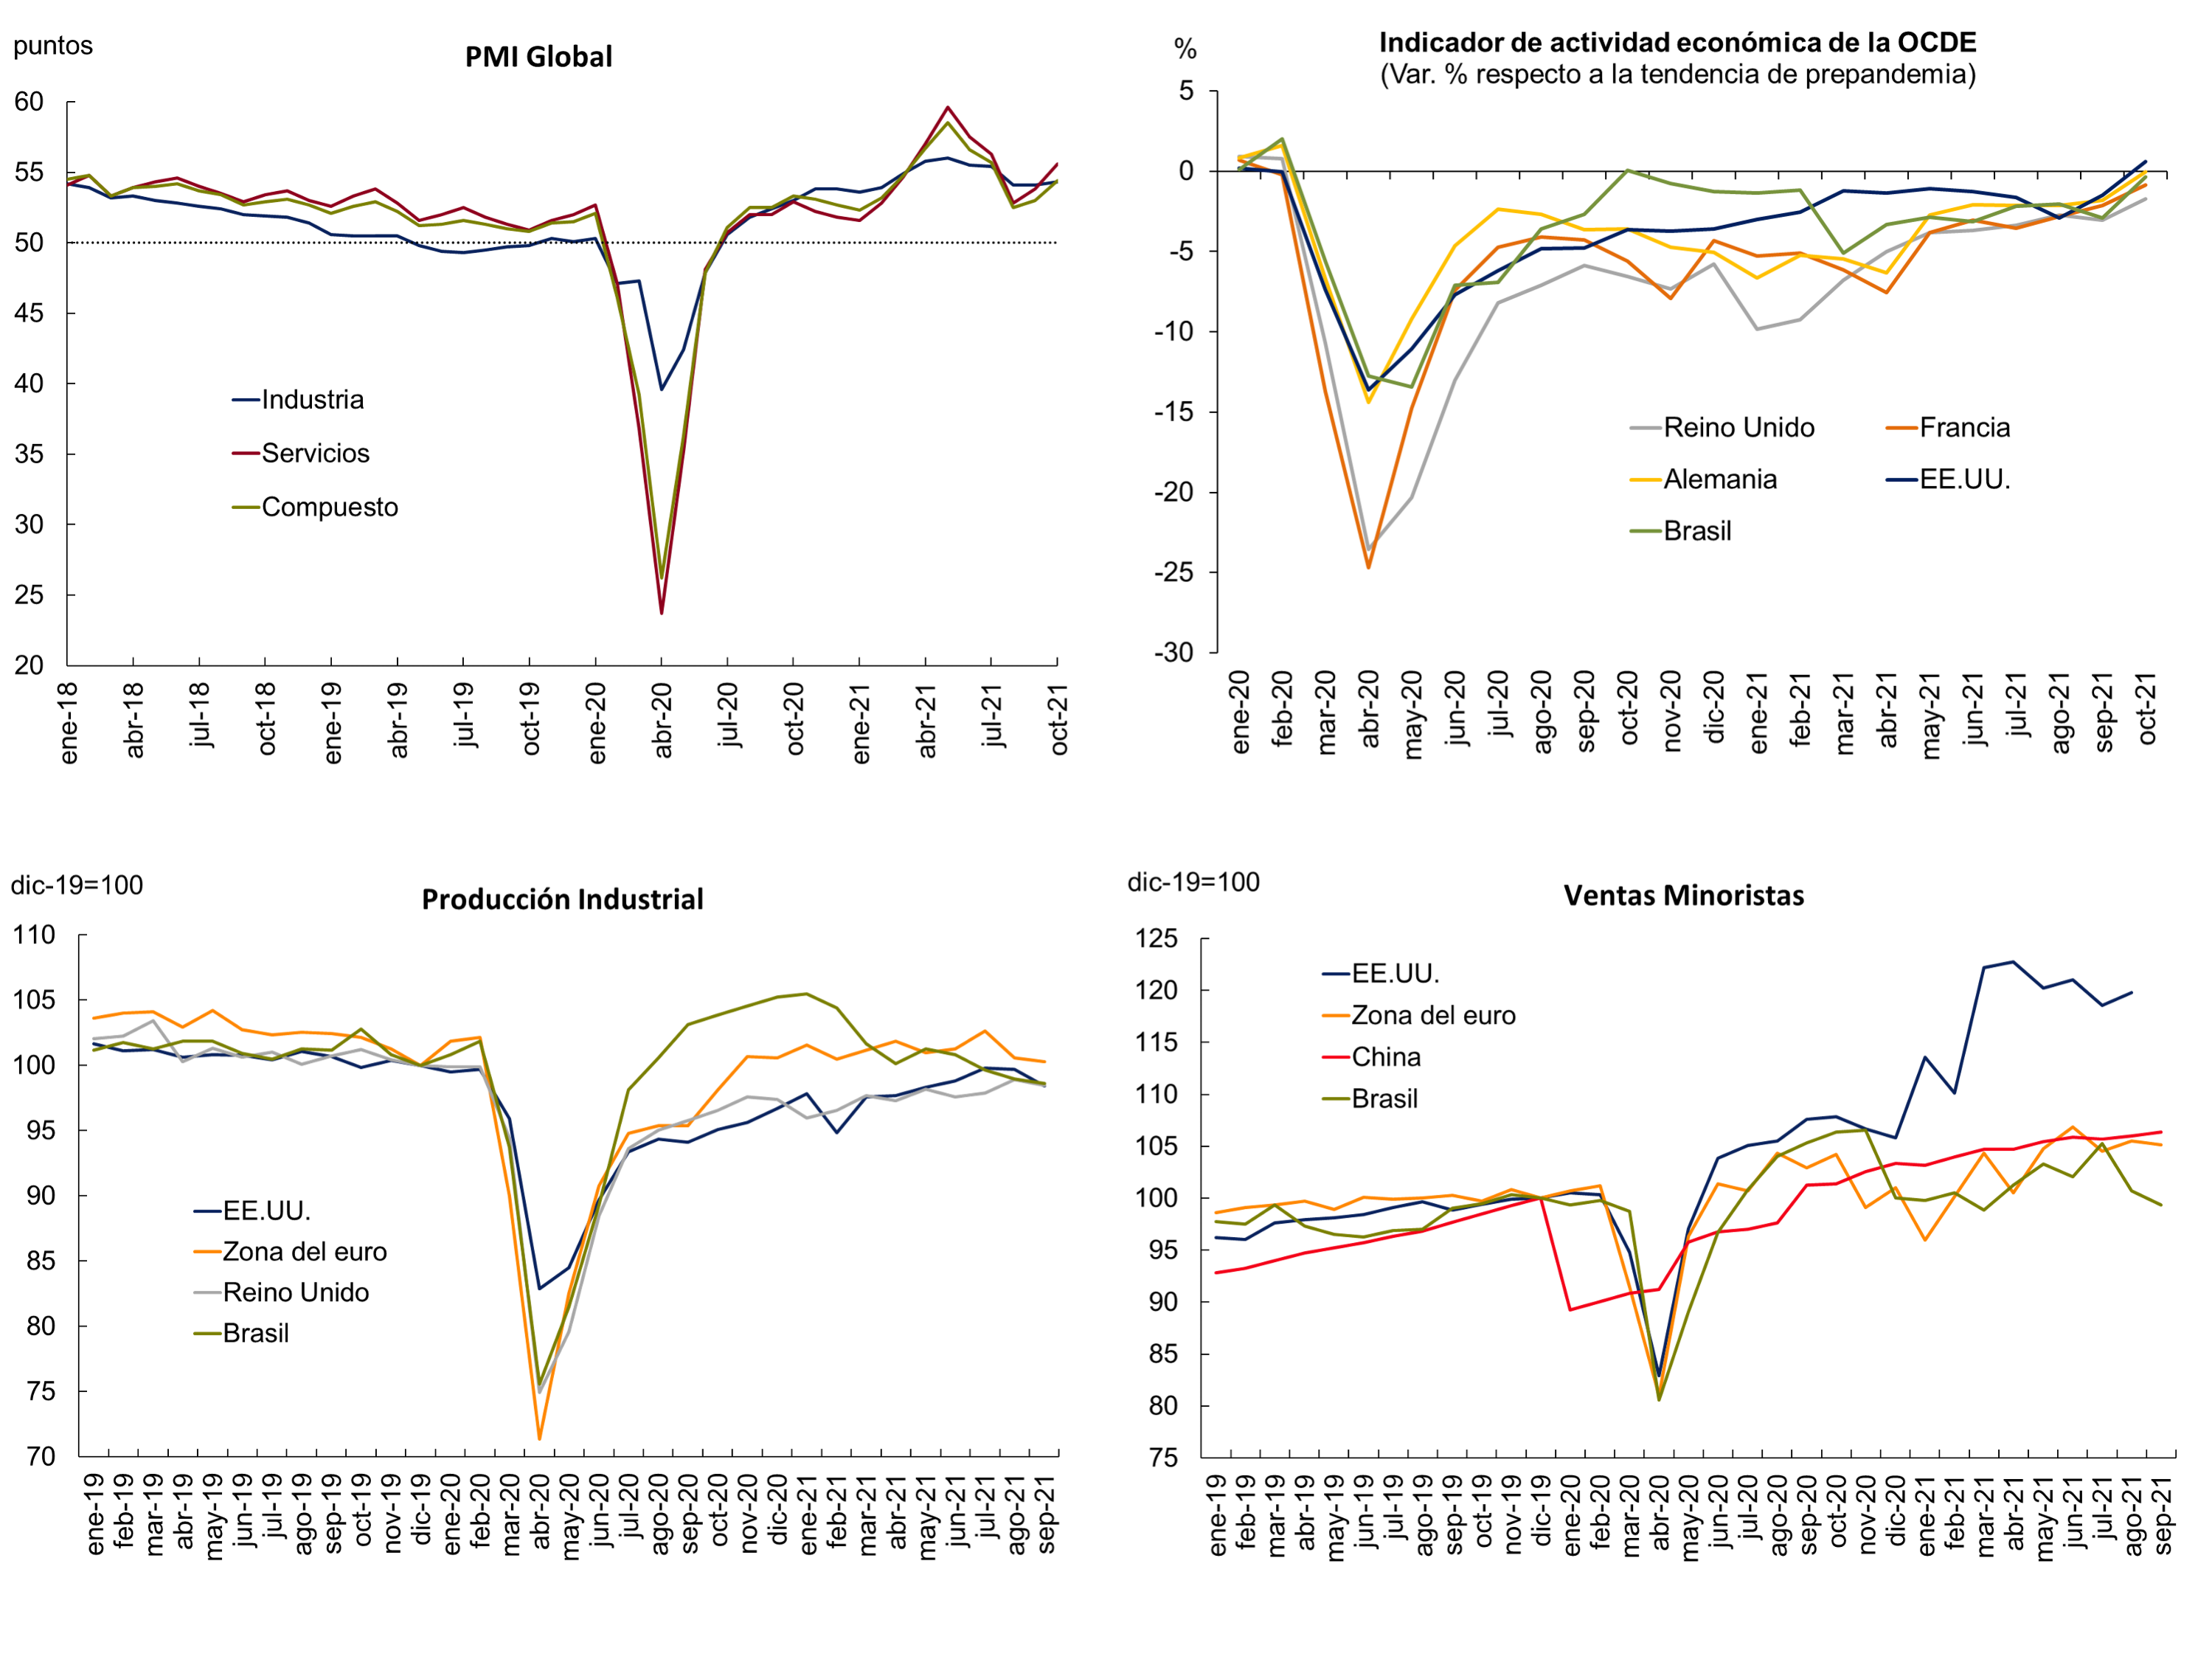
The high-frequency data also reflect lower growth in the global economy in the third quarter of the year. The global purchasing managers’ indicator (PMI) shows a downward trend from the 15-year high recorded in May, with a more marked fall in the services sector, although it remained in expansionary territory (above 50)1. On the other hand, industrial production indicators stagnated in the third quarter, mainly due to global “bottlenecks” in raw materials, semiconductors and maritime transport; while retail sales showed a lower growth rate than previous quarters (see Figure 2.5). Between September and October, there is a recovery in the PMI in the United States and China. The OECD economic activity indicator also shows better performance in October in the United States, the major euro area countries, and Brazil (see Figure 2.5).2
Figure 2.5 | Activity indicators
Internacional slightly lowered its growth forecast for 2021 from 6% to 5.9% and maintained its growth forecast for 2022 at 4.9%. The latest forecasts kept the growth projections for the global economy for this year and next largely unchanged (see Table 2.1). The IMF’s downward correction this year focused on advanced economies (from 5.6% to 5.2%), particularly in the United States (from 7.0% to 6.0%) due to the impact of bottlenecks in some inputs and a moderation in consumption in the third quarter. The growth forecast for emerging and developing economies improved slightly (from 6.3 percent to 6.4 percent), based in part on the recent performance of commodity prices. Other sources of forecasts, such as those of the OECD (global economy and China), the Federal Reserve (United States) and the European Central Bank (euro area) show a similar picture for 2021 and 2022 (see Table 2.1). Meanwhile, Brazil’s expected growth for next year fell significantly (from 2.0% to 1.5%, for the average forecast), due to the expectation of a more contractionary monetary policy to deal with inflation and the greater fiscal uncertainty linked to the relaxation of the public spending rule and the election year.
Table 2.1 | Economic

projections
Source: IMF (WEO) and other sources: OECD (world and China), ECB (euro area), Fed (United States), Bacen – Focus Survey (Brazil). (1) Corresponds to October 2021. (2) Corresponds to May 2021. (3) Corresponds to June 2021.
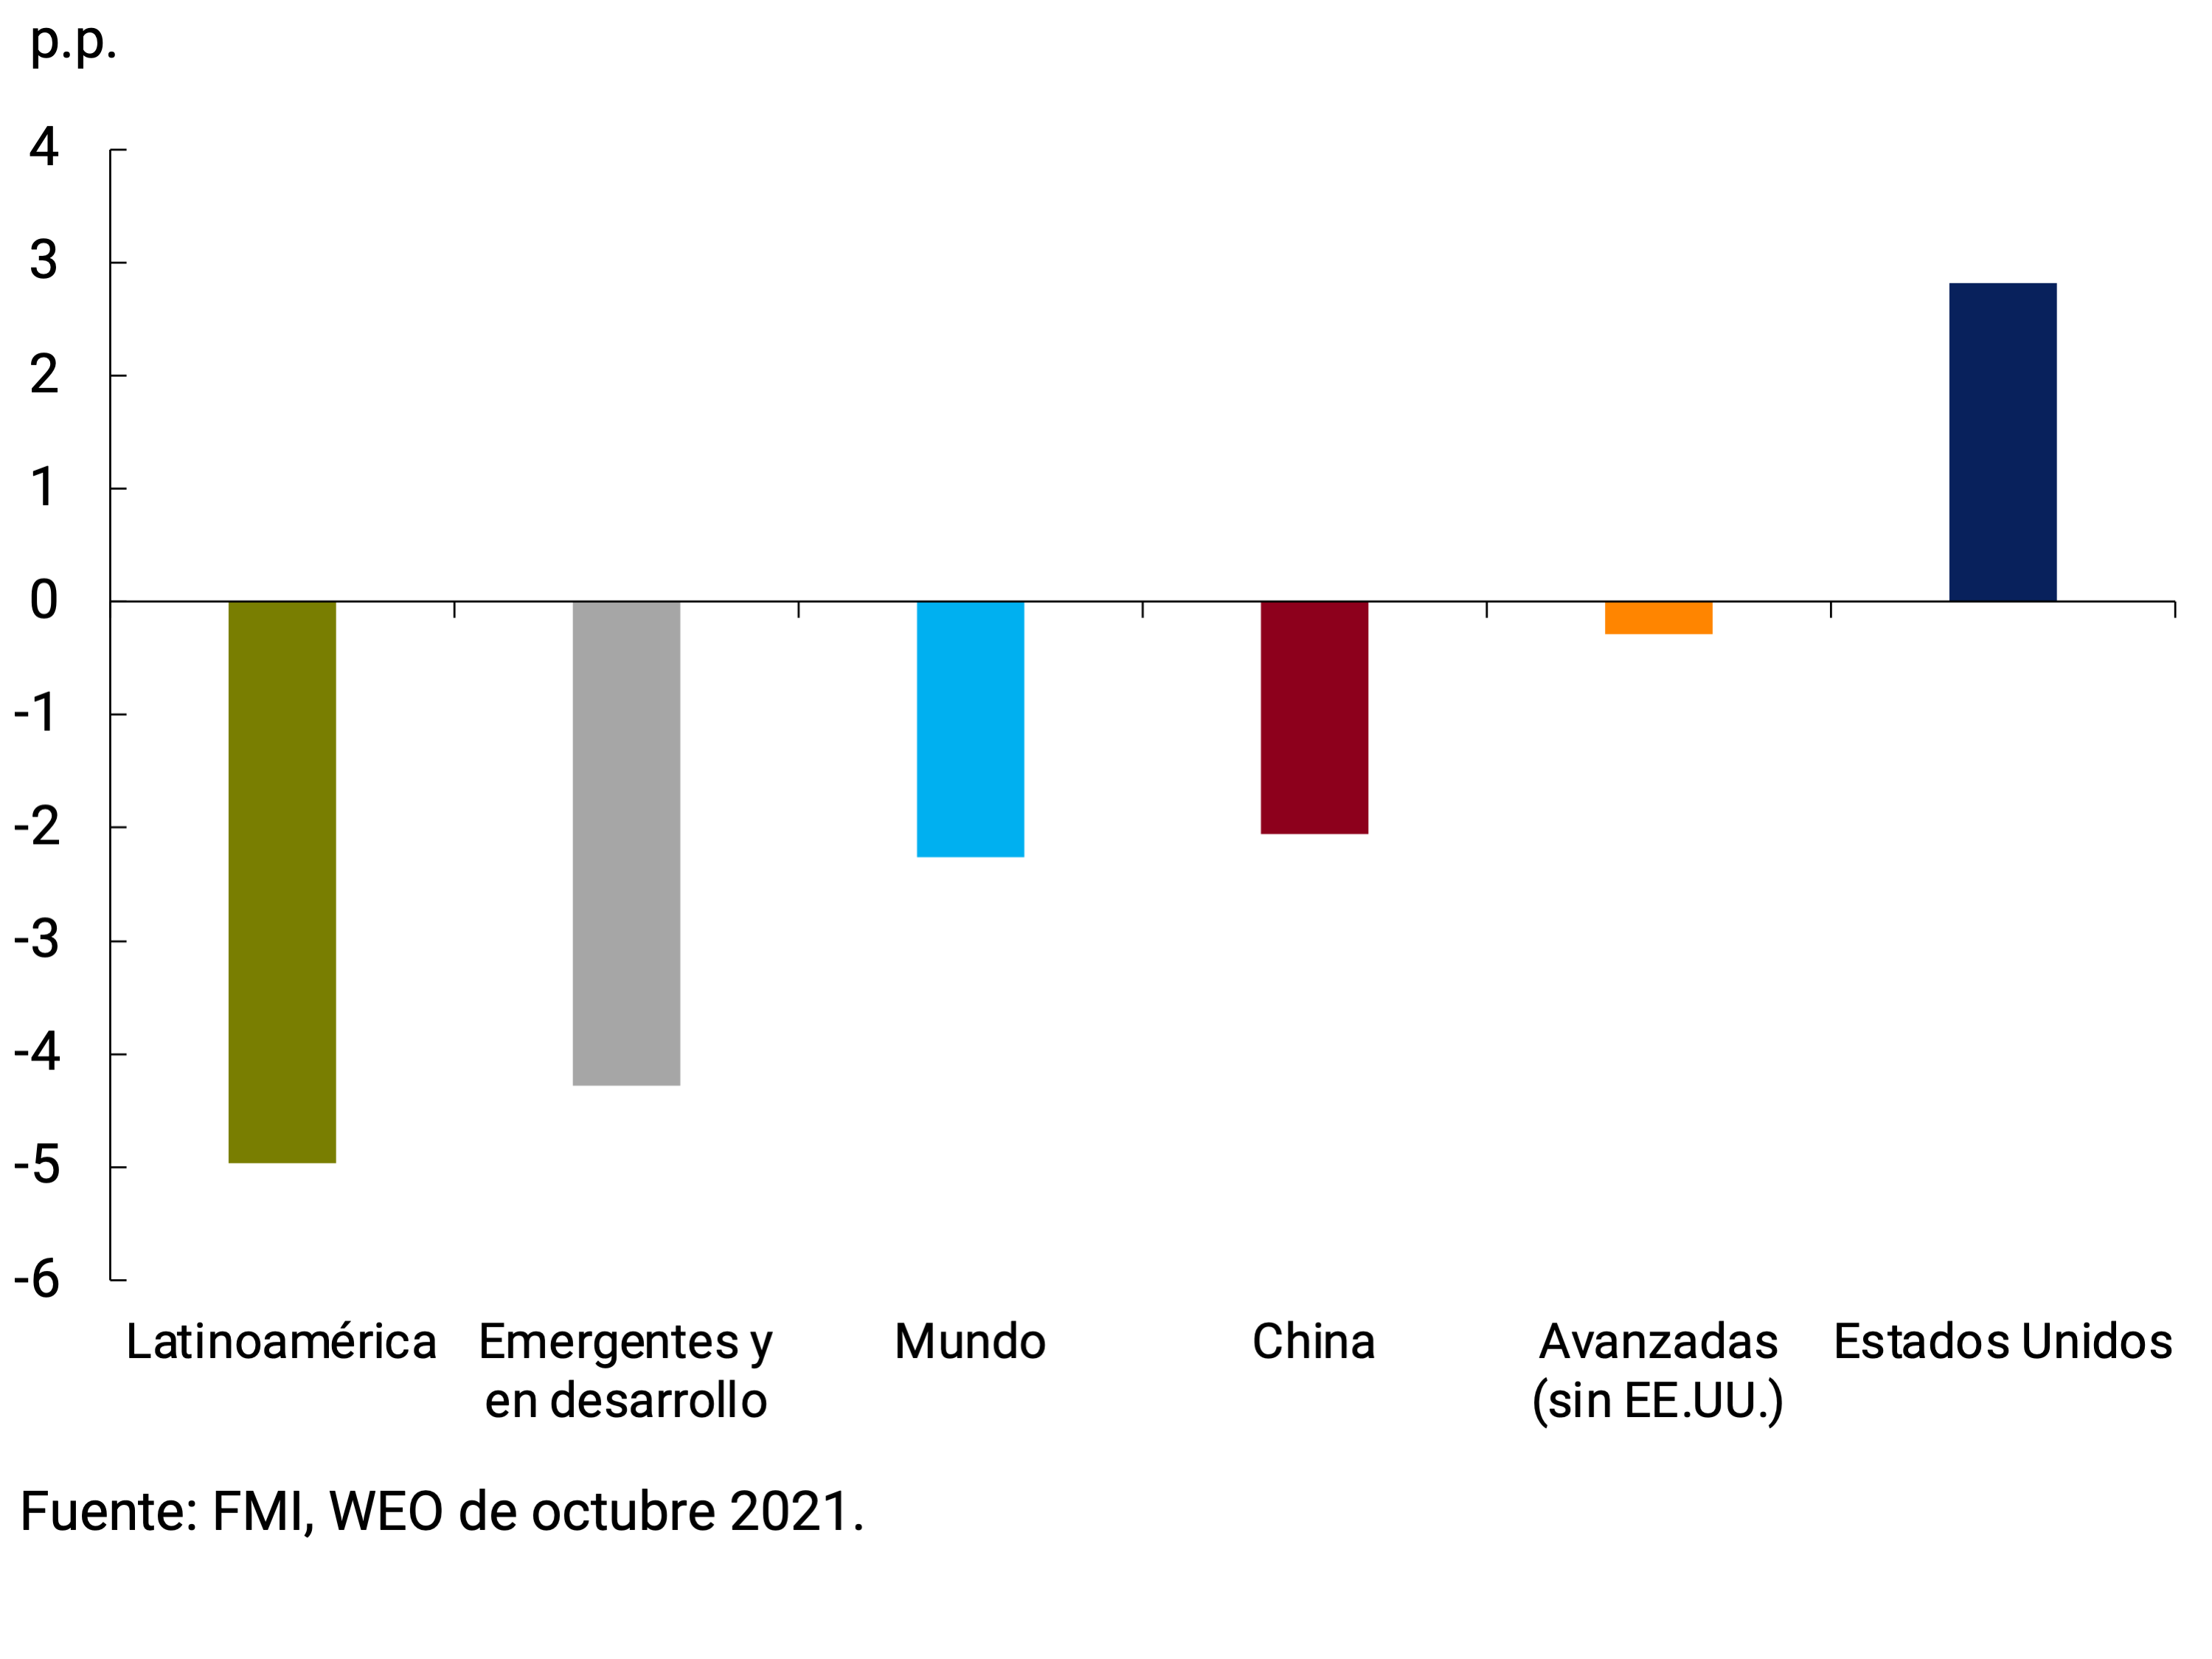
For the medium term, the prospects for a divergent recovery between advanced economies and emerging and developing countries remain in the face of differences in access to vaccines and in the policy space for the implementation of stimulus measures. Considering the IMF’s growth forecasts through 2024, economic activity in advanced economies would exceed the pre-pandemic forecast trajectory by 0.9 p.p., while that of emerging and developing economies would remain 4.3 p.p. below the pre-pandemic trend (see Figure 2.6).
Figure 2.6 | Evolution of GDP compared to pre-pandemic
trends
Loss of GDP in 2024 compared to pre-pandemic trends
The labor market continues to show less dynamism in most of the world’s economies. Employment rates have increased since the trough of the second and third quarters of 2020 but generally remain below pre-pandemic levels, even in countries where activity has returned or is close to reaching pre-pandemic levels (see Figure 2.7). This phenomenon is even more prevalent in developing countries. And it is affecting low-skilled workers, young people and women to a greater extent, resulting in growing inequality and making it difficult to reverse the increase in poverty generated by the pandemic. The IMF estimates that around 65 to 75 million more people will be in extreme poverty in 2021 compared to pre-pandemic projections.
Figure 2.7 | Employment rate of selected countries
% of working-age population
2.3. Central banks began to reduce stimulus in the face of rising inflation
Central banks in emerging countries continued to take monetary policy measures with a contractionary bias. Meanwhile, central banks in developed countries have largely maintained expansionary monetary measures, but have begun to withdraw part of the quantitative stimulus; This creates the risk of negative spillovers to developing countries.
Figure 2.8 | Monetary Policy Rates in Emerging Countries

The average interest rate of the emerging countries surveyed went from 3% in October 2020 to 4.5% a year later (see Figure 2.8). In some cases, the contractionary measures accelerated. At its meeting last October, the Central Bank of Chile decided on the largest increase in its monetary policy interest rate in the last two decades (+1.25 p.p.). Similarly, the Monetary Policy Committee of the Central Bank of Brazil increased the target on the SELIC rate by 1.5 p.p. at the end of October; It was also a record increase in more than two decades, and 50 bps above market surveys.
Figure 2.9 | Fed Open Market Committee members’ interest rate developments projection
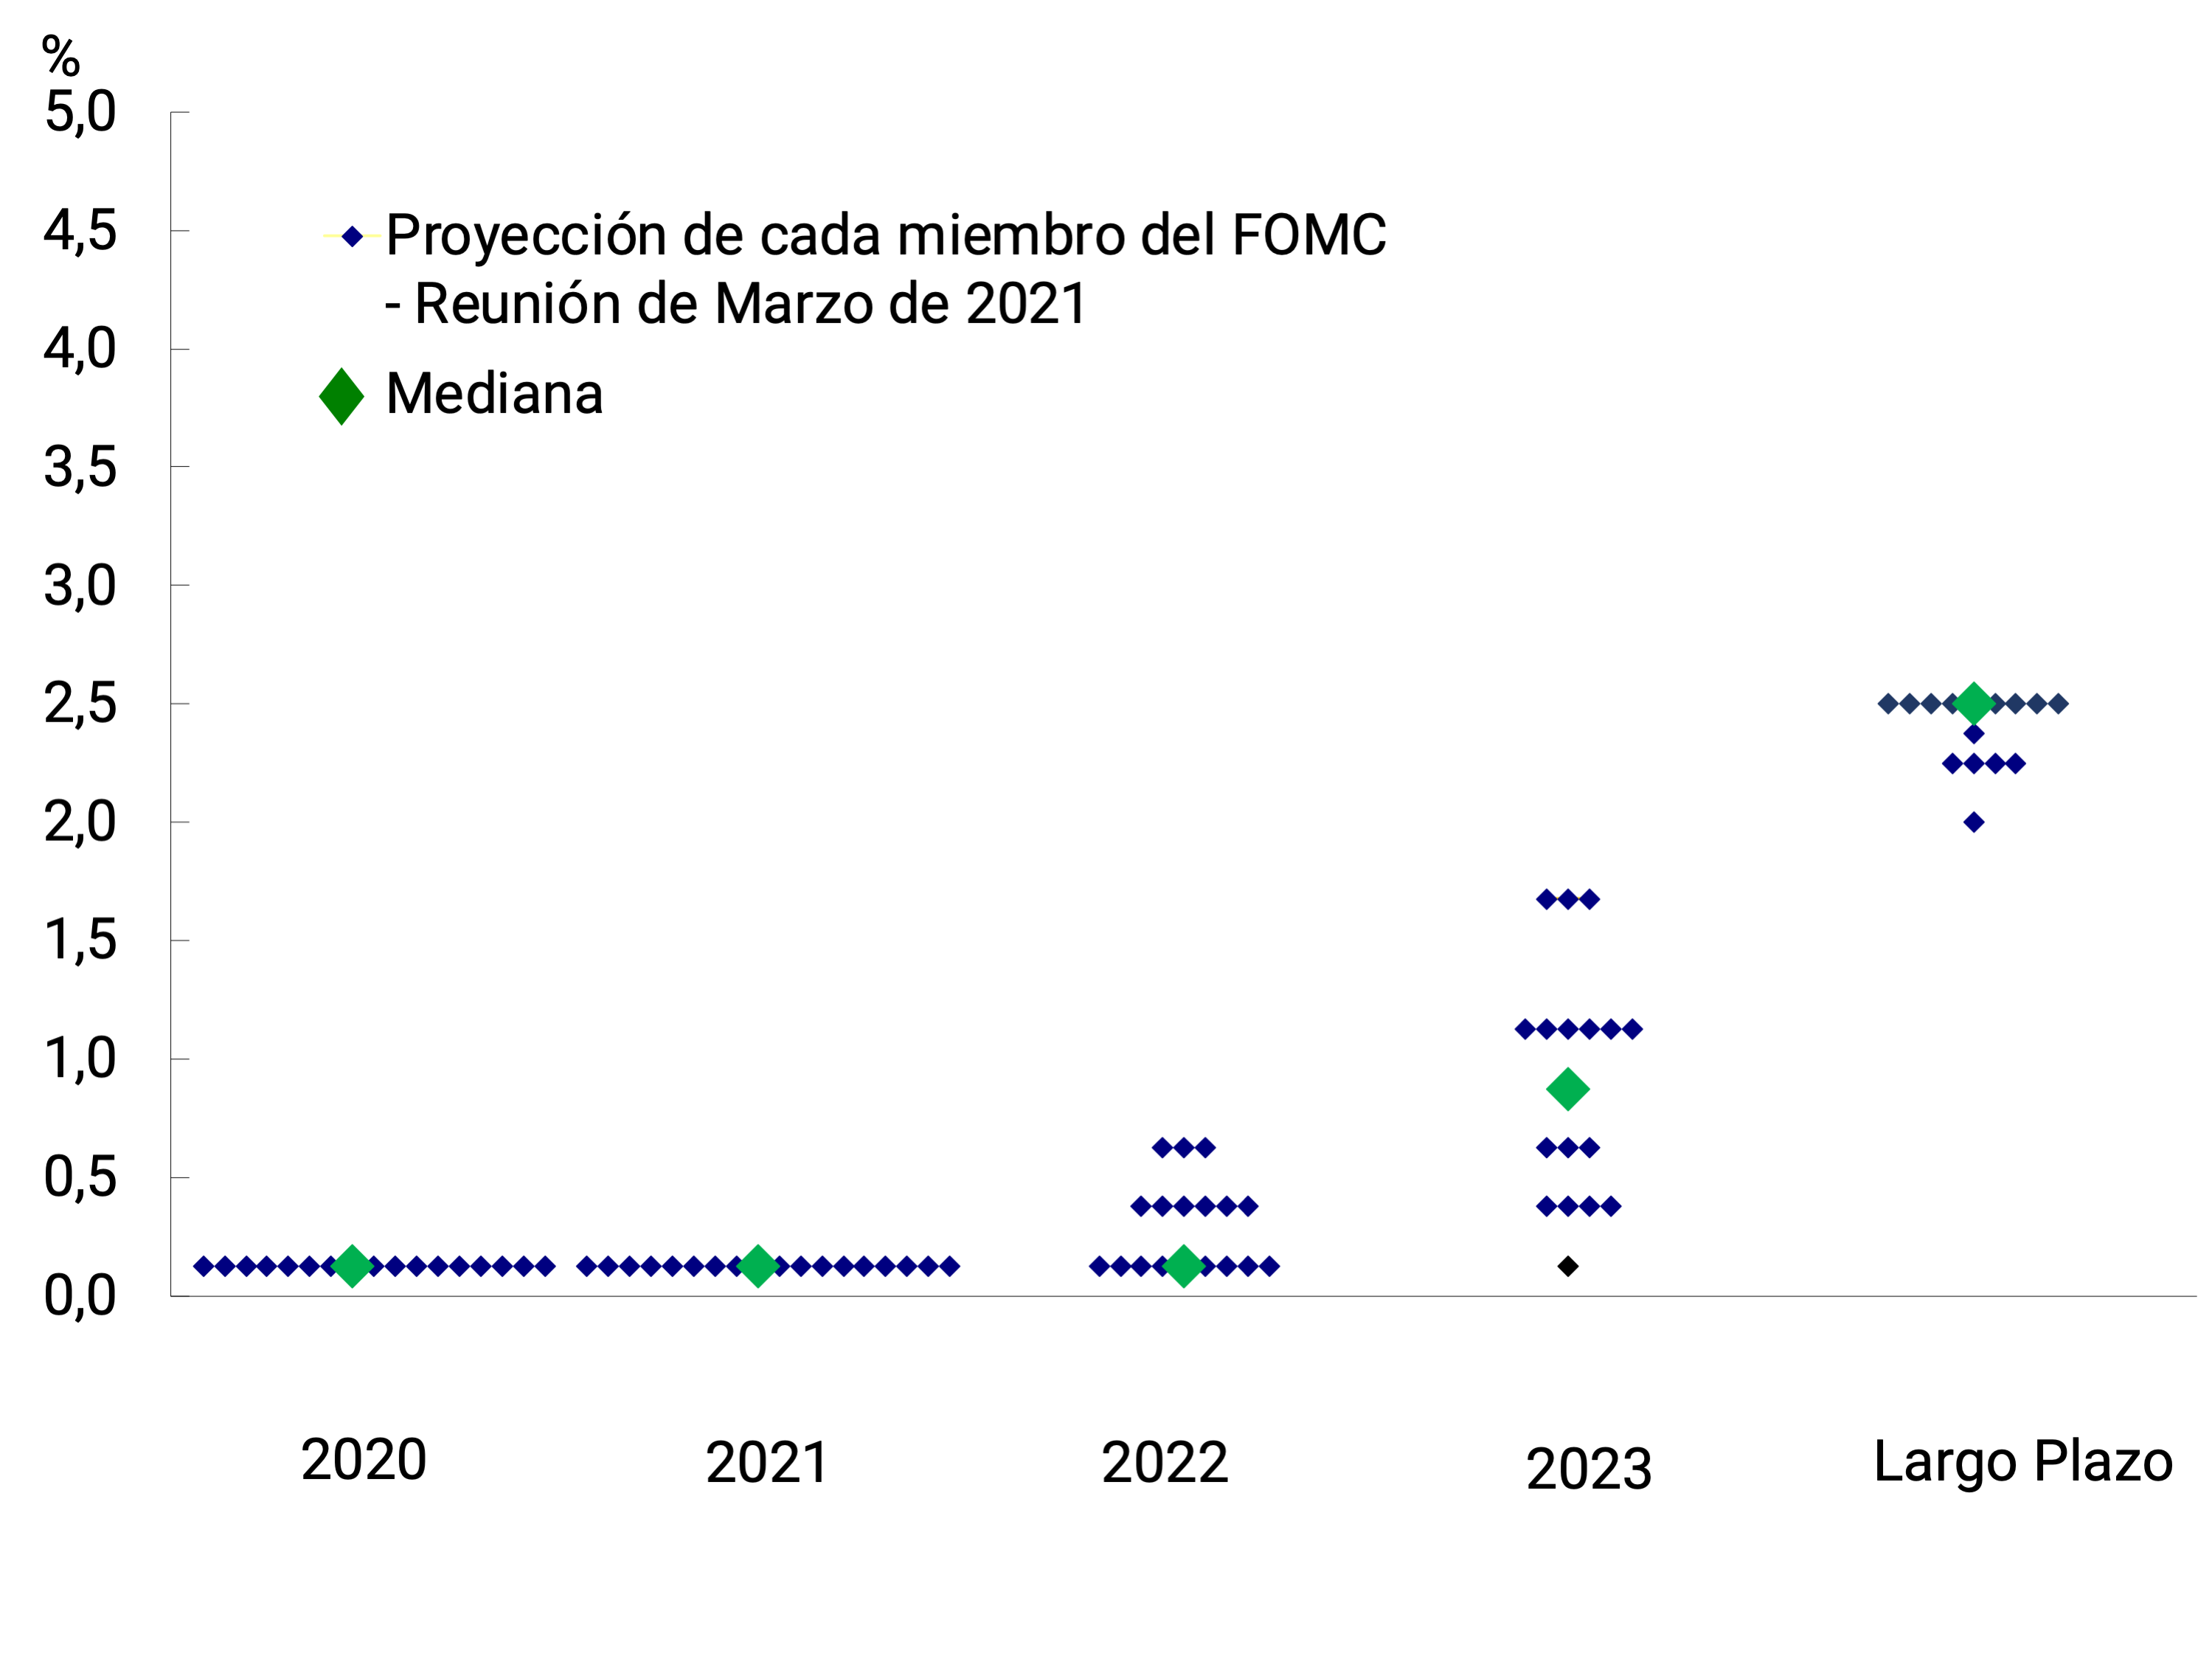

On the other hand, for developed countries in the same period, the policy interest rate remained unchanged. Central banks in the US, Australia and Canada have begun to withdraw unconventional monetary policies, reducing net asset purchases to zero at the end of October in the latter case. This contractionary bias could become widespread to most central banks in developed countries in the coming months. Thus, the Federal Reserve (Fed) gave clear signals that before the end of the year it would announce the reduction of its asset purchase program. In turn, it would also bring forward the first increase in the target on the federal funds rate. This is based on projections by members of the Fed’s Open Market Committee (see Figure 2.9). In addition, the Bank of England could raise the Bank rate, perhaps even at the end of 2021. On the other hand, the European Central Bank would maintain its expansionary policy without major changes.
Figure 2.10 | Inflation in different groups of economies


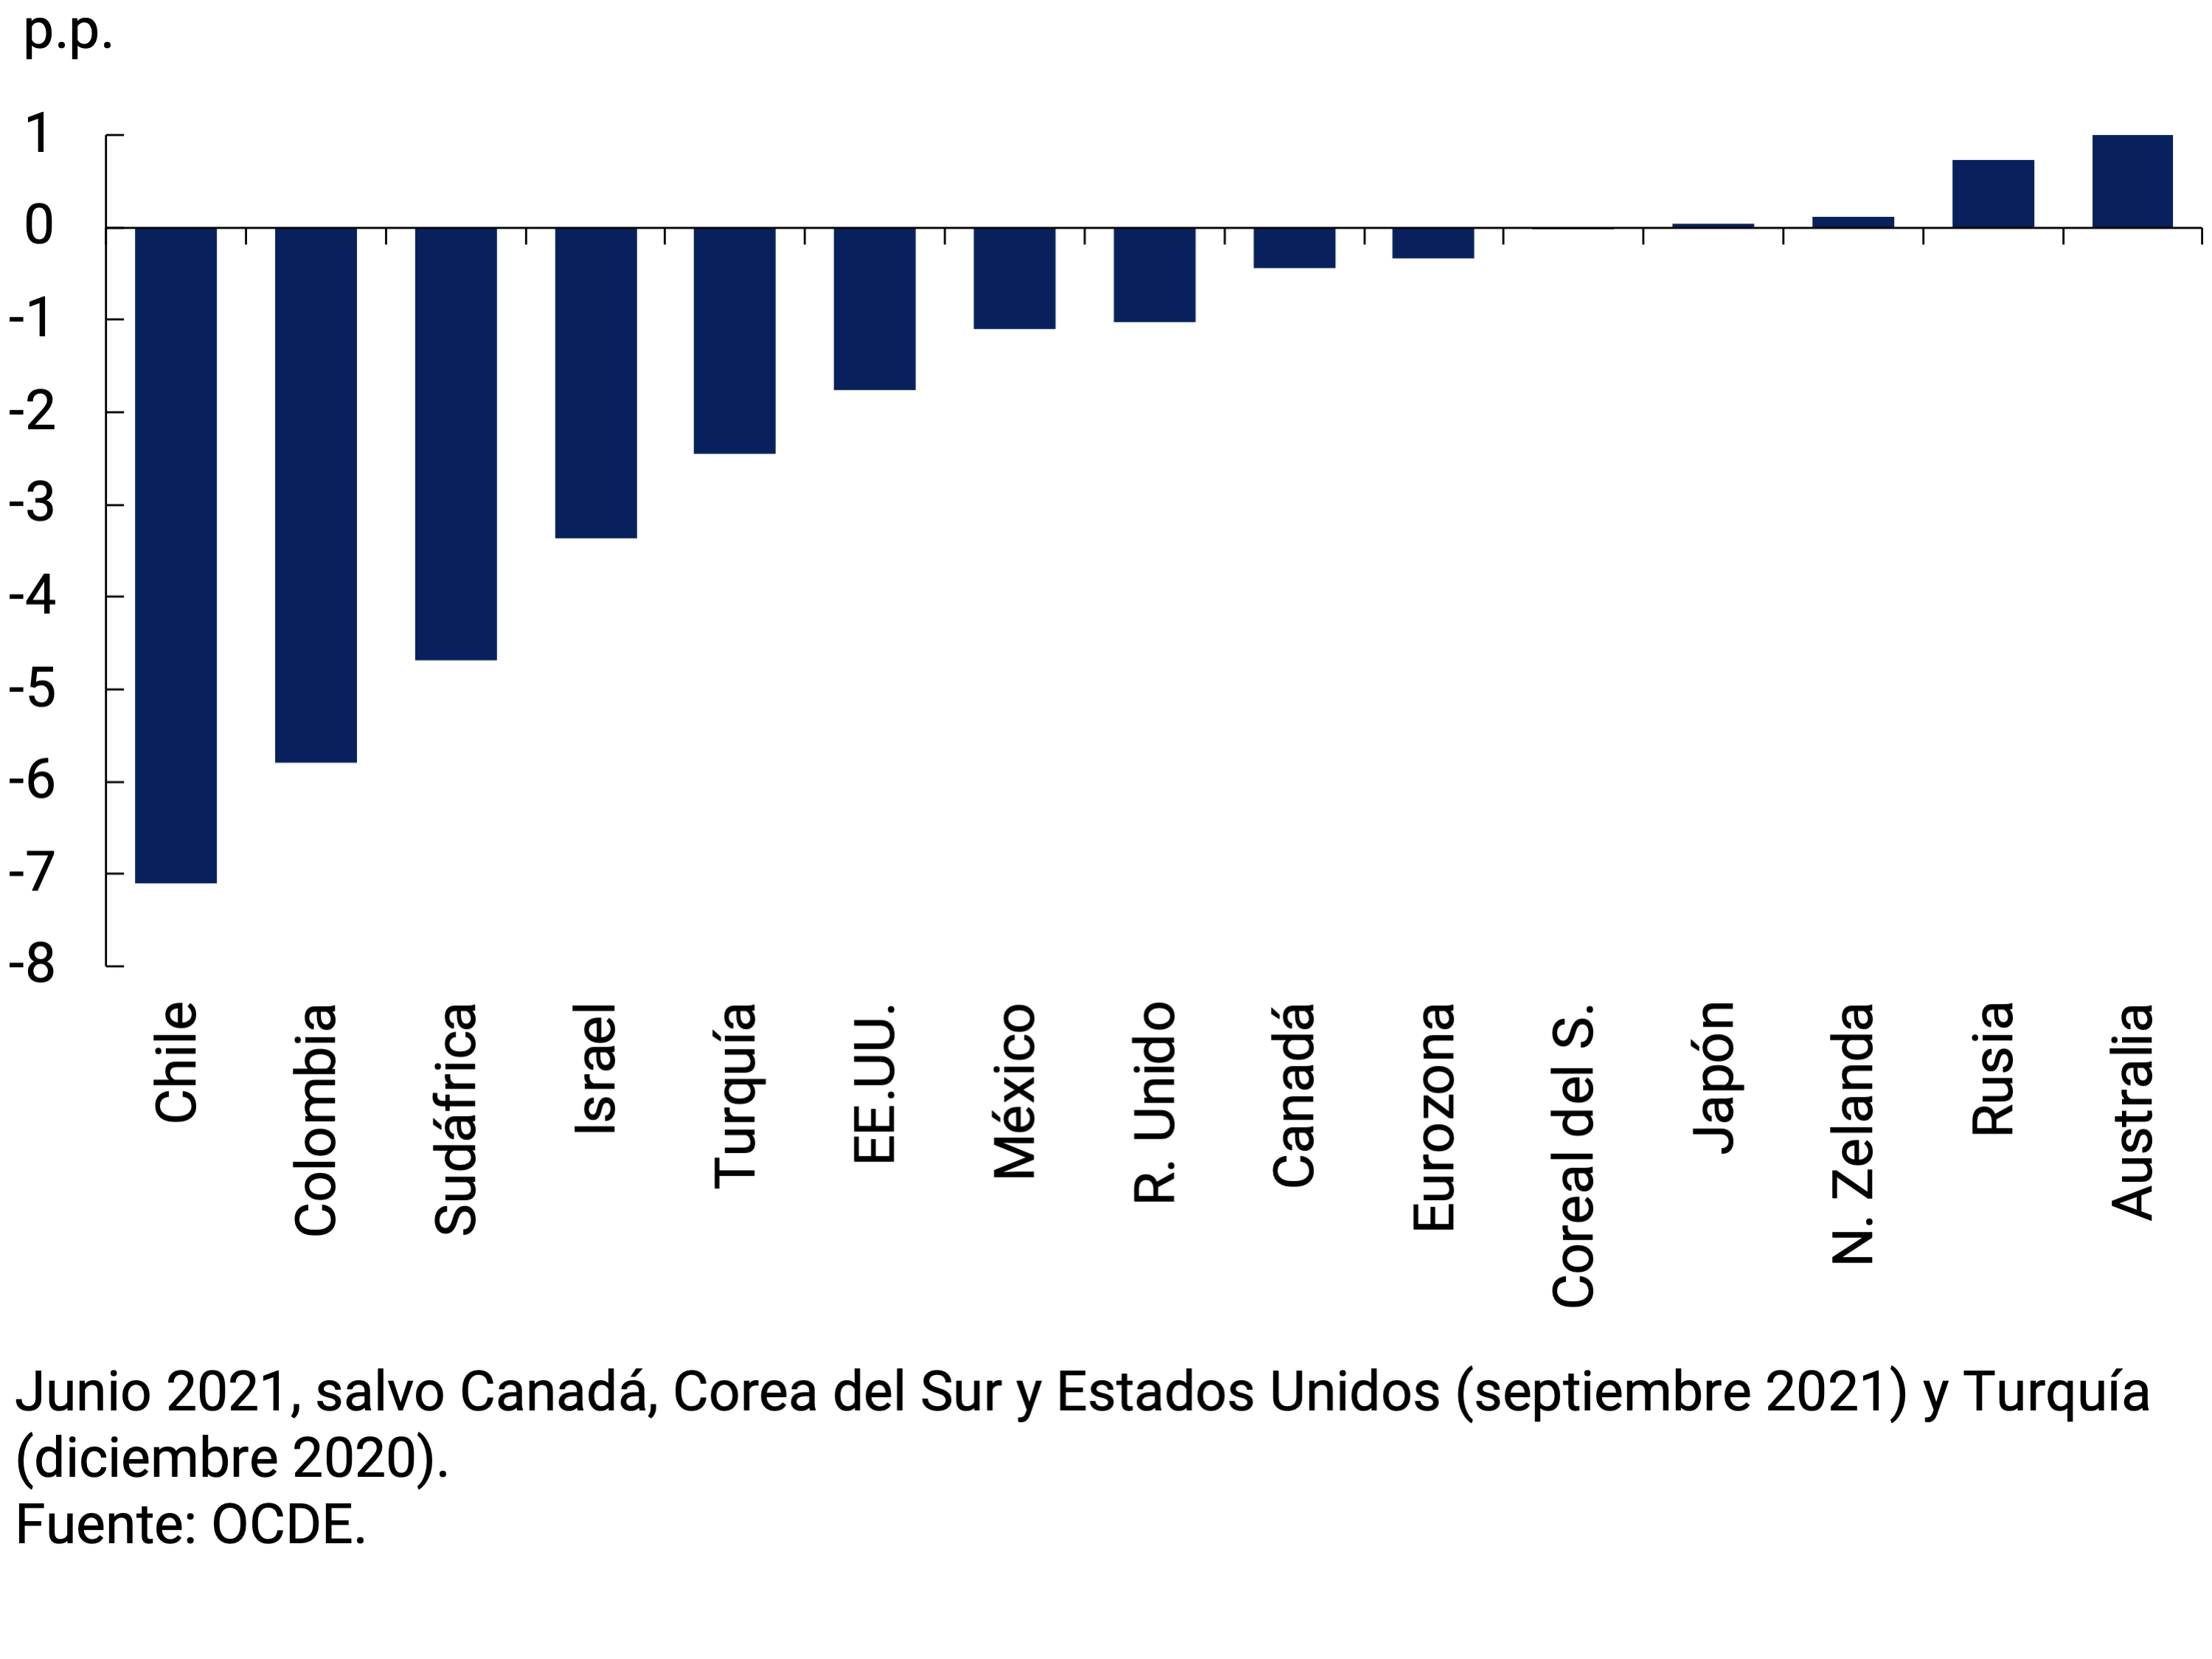
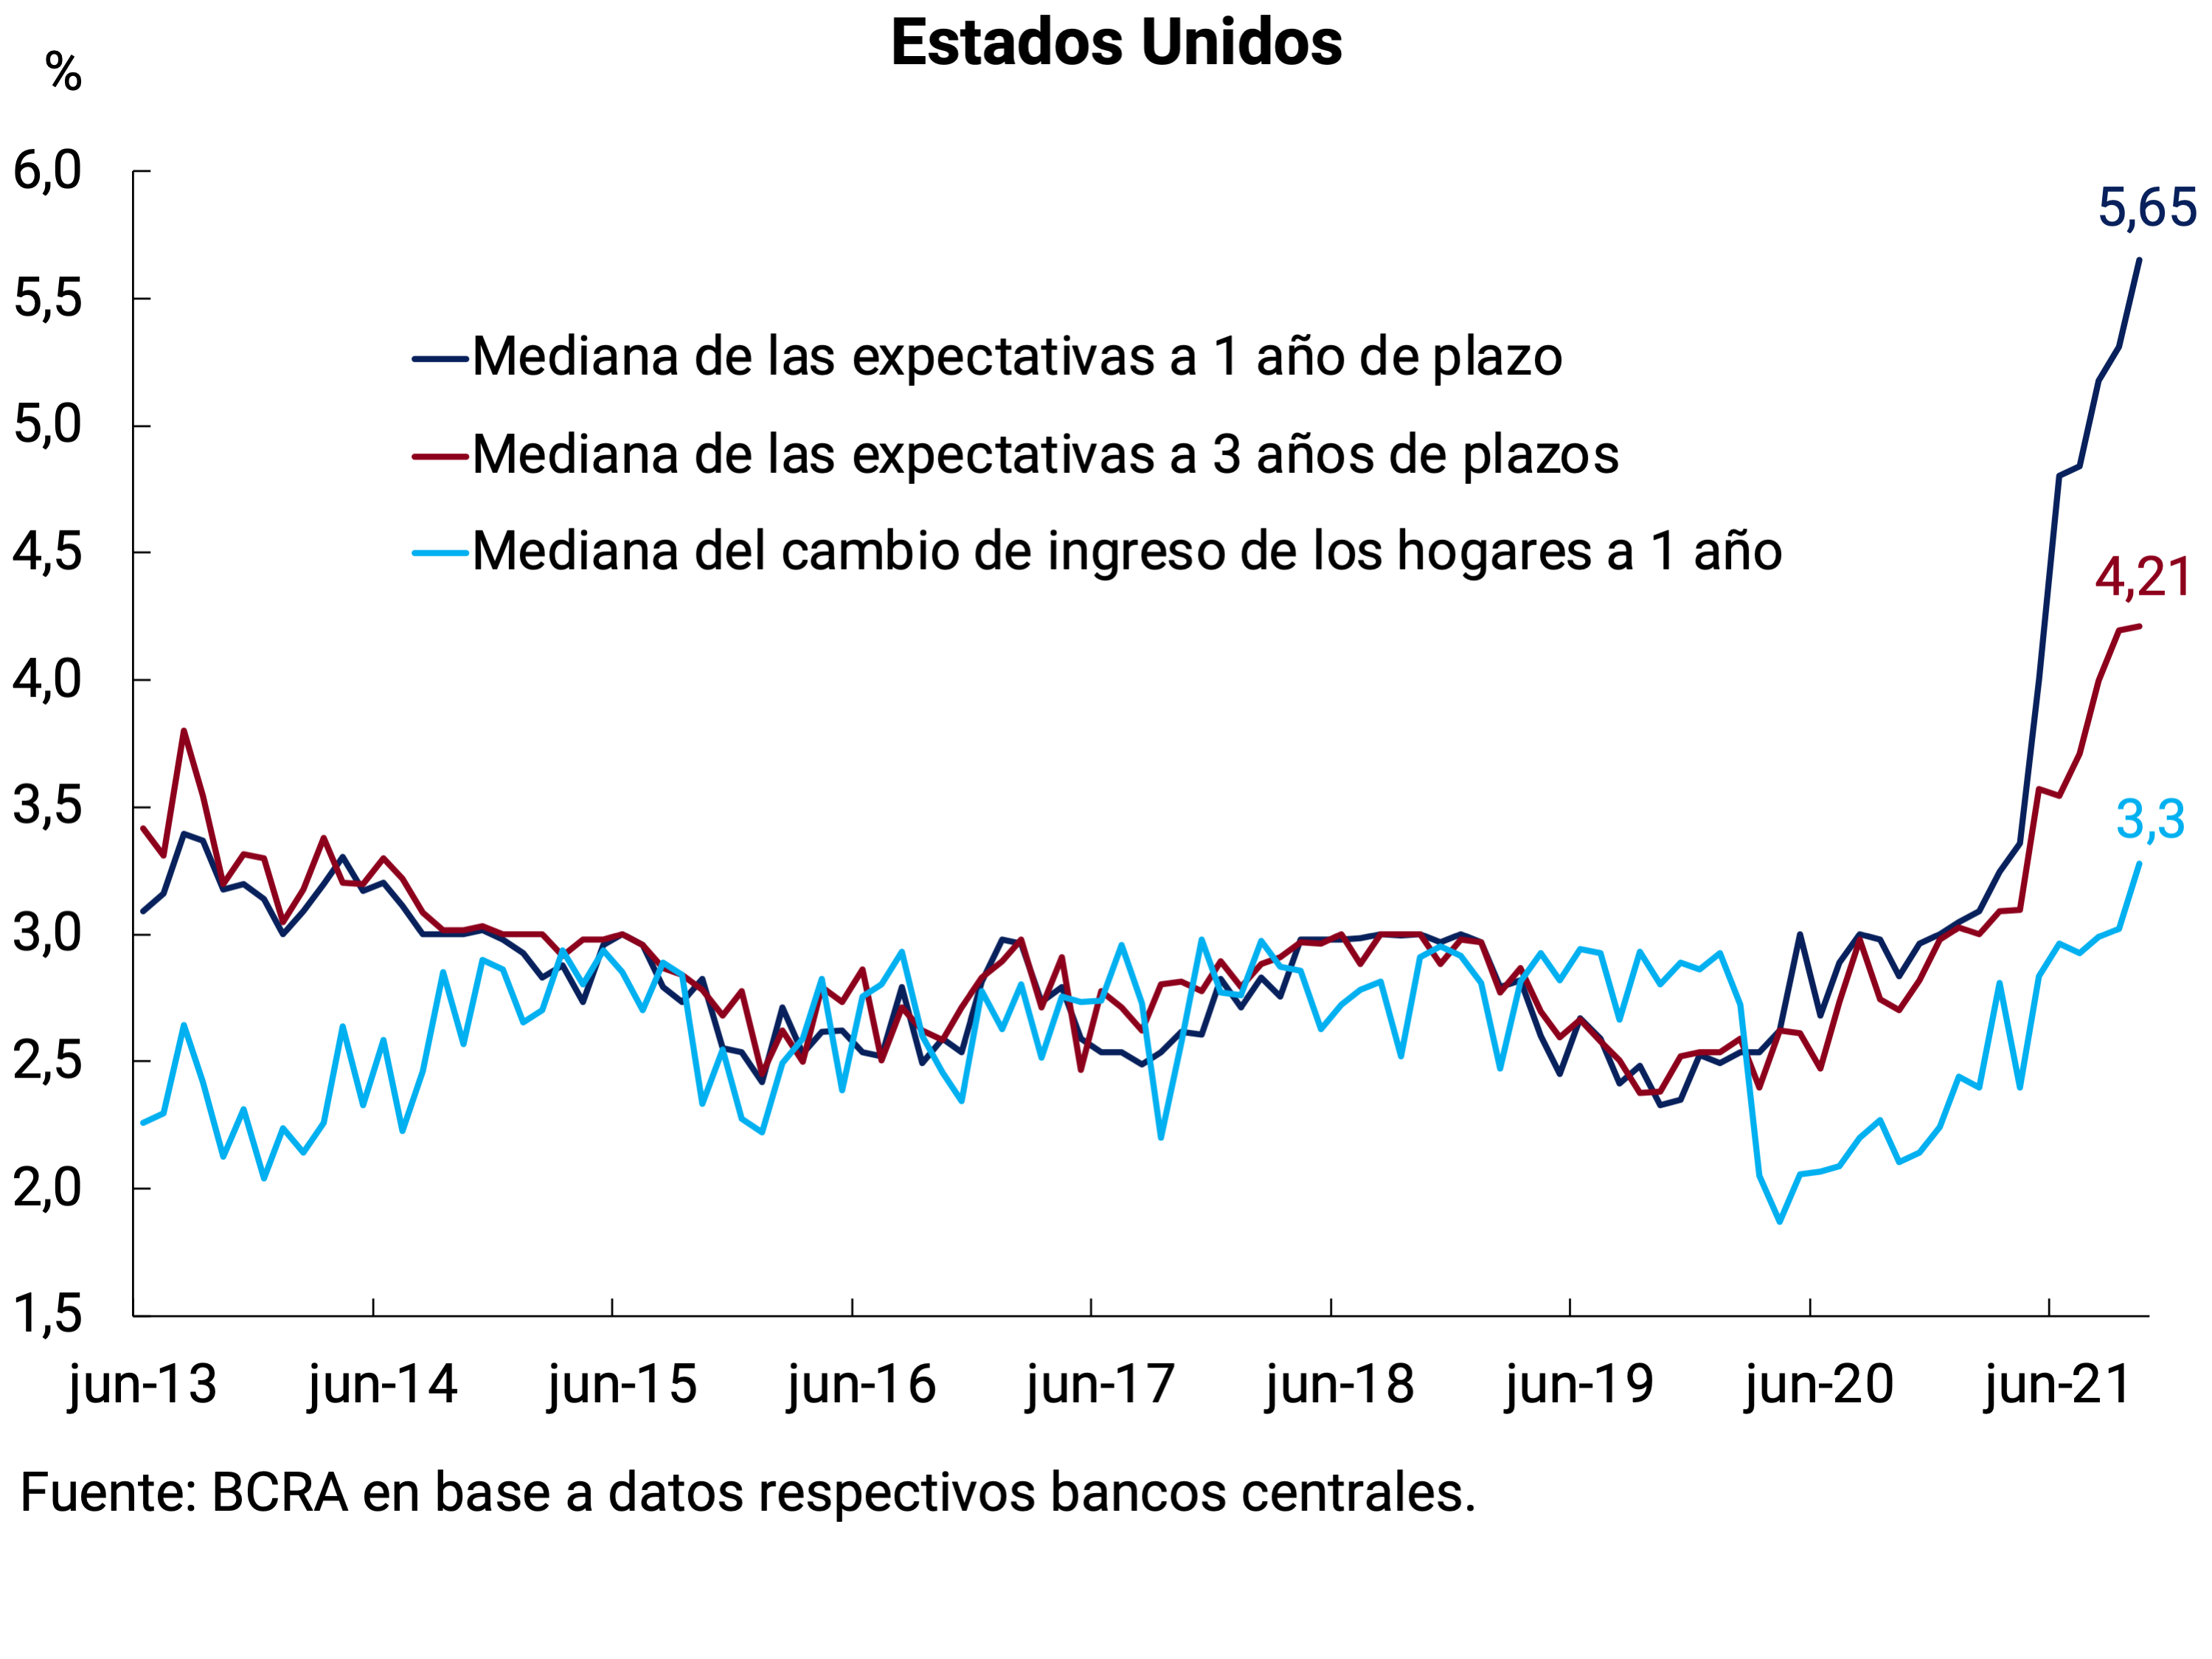
Changes in global monetary policy are in response to rising inflation. It is explained by supply mismatches, the base effect of comparison, the increase in the price of raw materials, mainly energy; all this in the context of monetary support measures taken since March last year (see Section 1). In emerging economies, the impact of higher commodity prices was enhanced by exchange rate depreciation; This is the opposite of what happened during the commodity boom (2003-2008), when higher prices were offset by exchange rate appreciations. Central banks in emerging countries have responded more quickly to a further acceleration in inflation (see Figure 2.10 and Figure 2 in paragraph 1), and to the risk of price expectations becoming unanchored. Meanwhile, inflation expectations in developed countries have increased, but remain in most cases anchored in the medium term. In the United States, indicators of expected inflation by the market show a slight increase in the margin, but a greater rebound in expected inflation is observed in consumer surveys. Expected inflation in the euro area is anchored (see Figure 2.11).
Figure 2.11 | Inflation expectations in the United States and the euro area
United States
Euro area

In many advanced economies, fiscal policy remained expansionary and is shifting towards spending more closely related to infrastructure, human capital accumulation, climate change, and digital transformation. The Employment Plan and the Family Plan in the United States and the “New Generation” plan in the European Union are the most relevant examples. By contrast, in emerging and developing economies, the fiscal impulse is more constrained by the challenges of financing large deficits, given reduced market access and limited scope for tax collection in the short term.
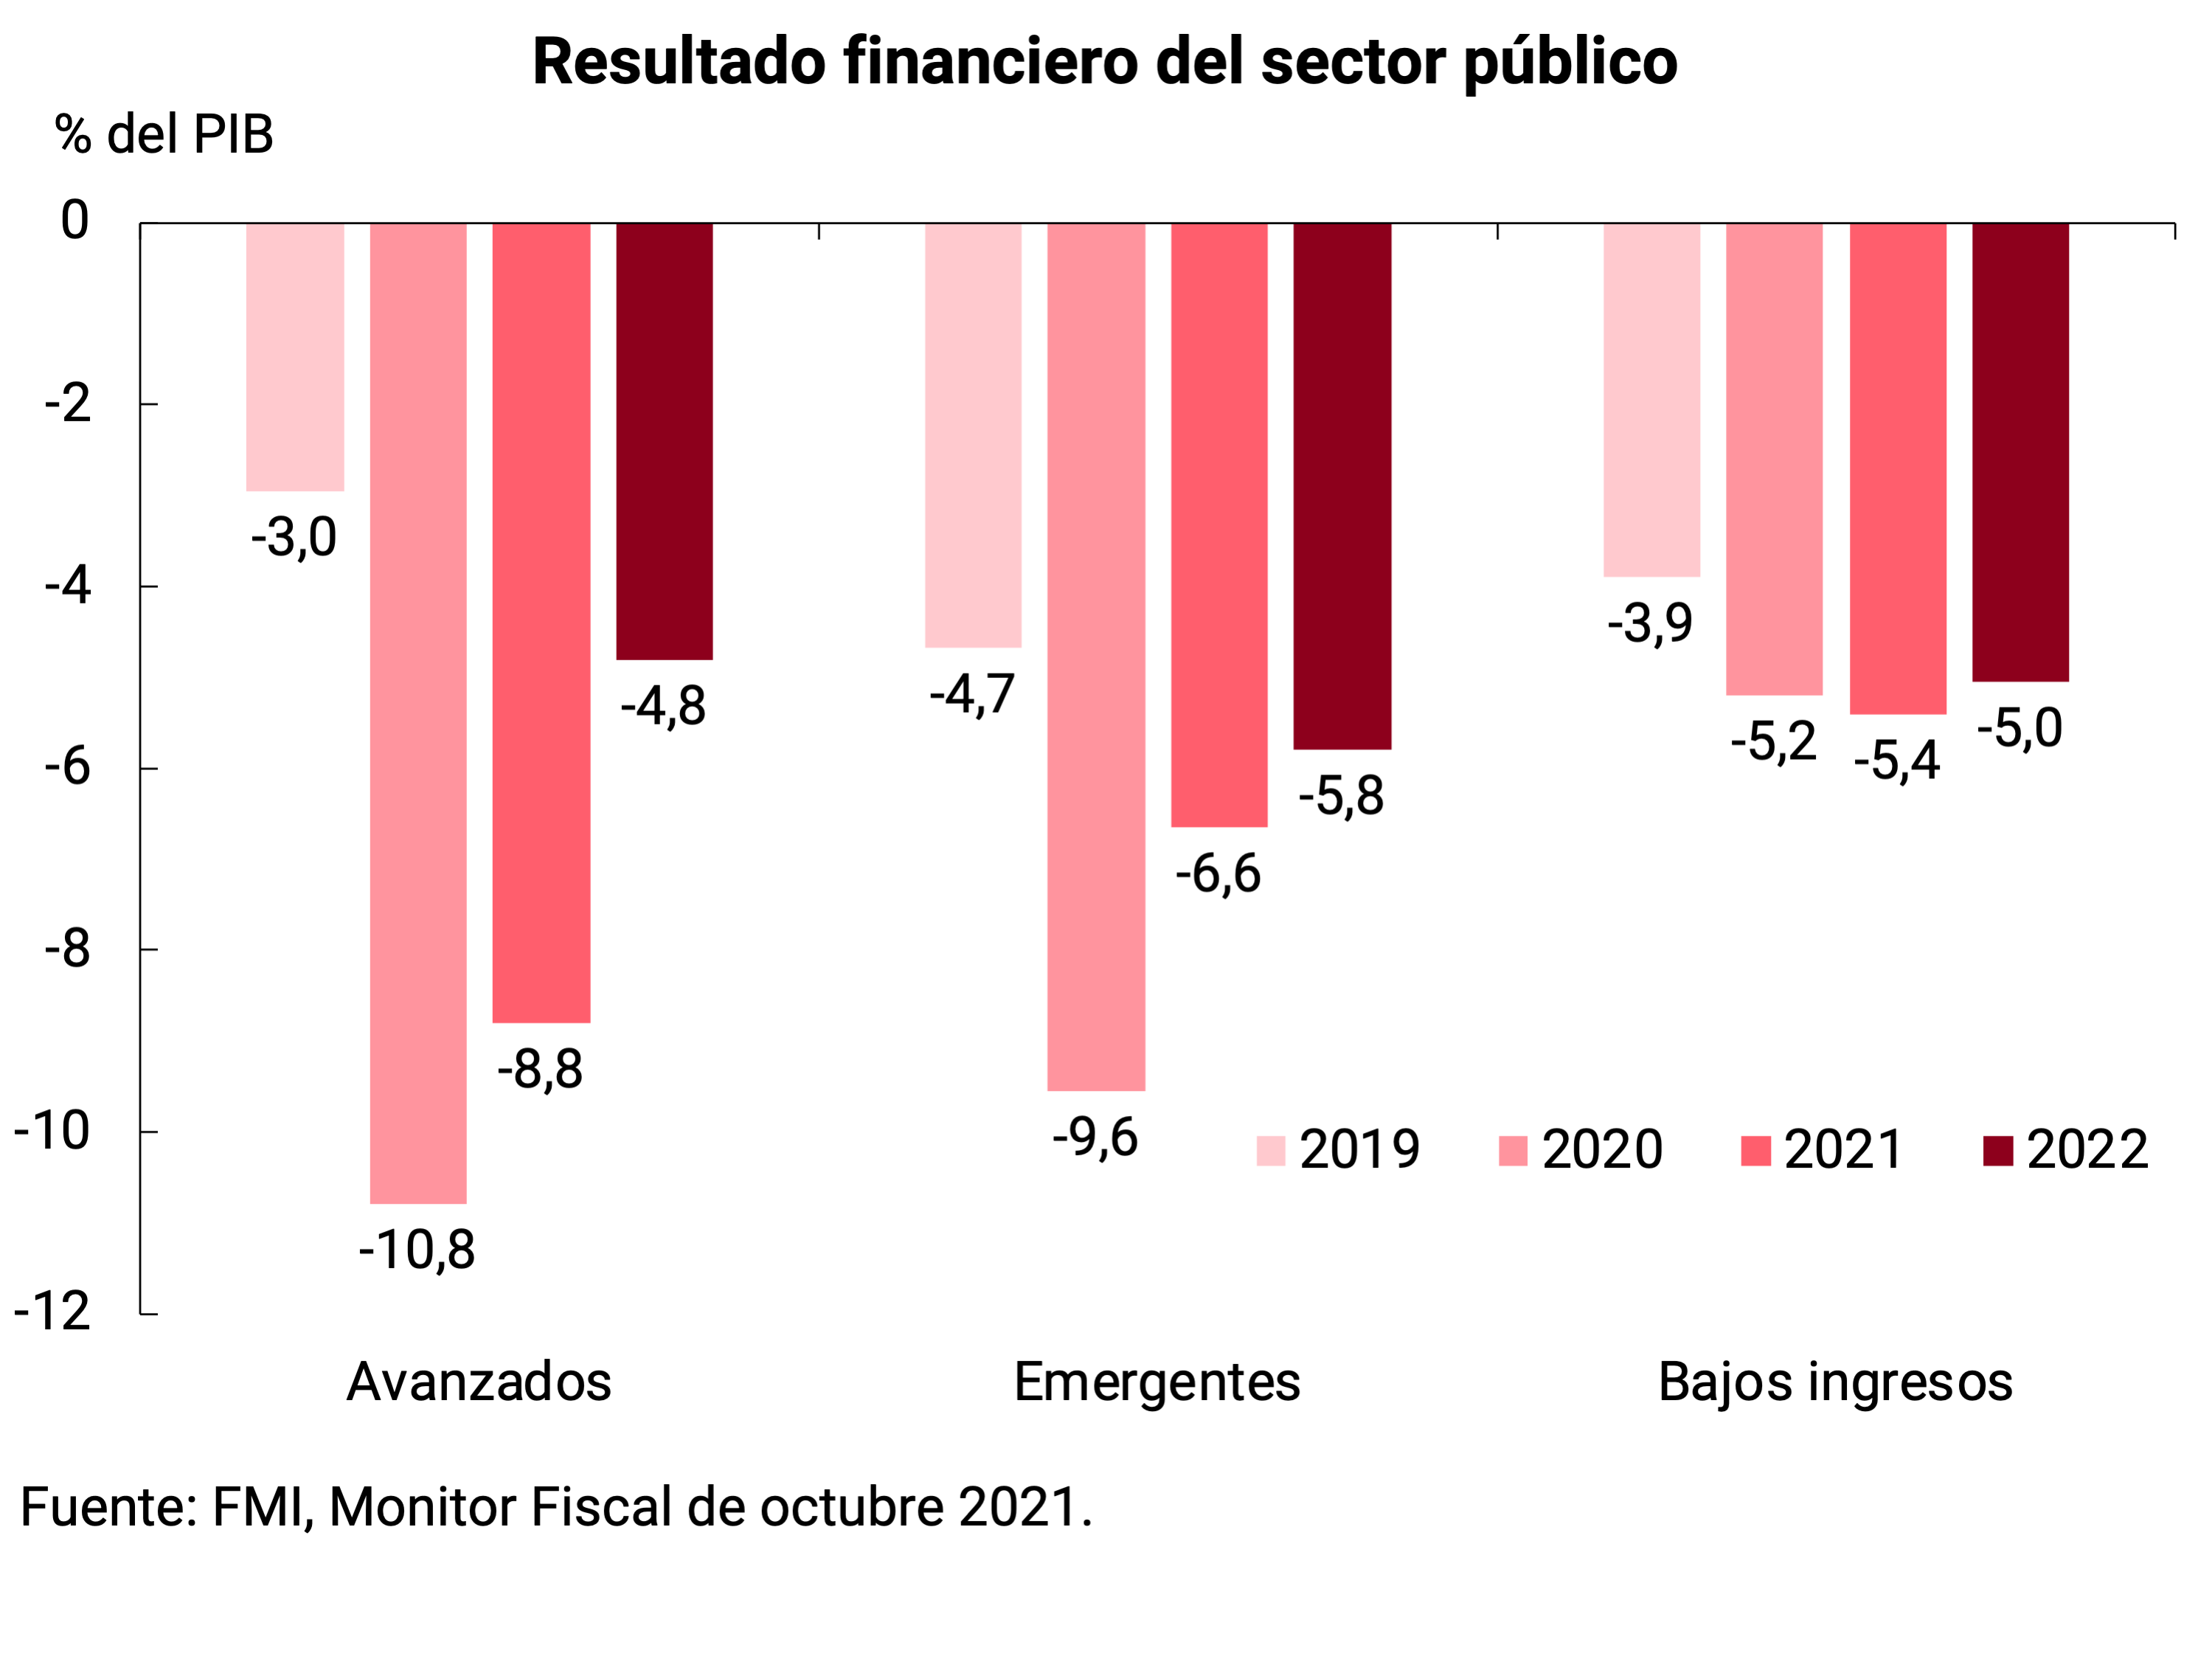
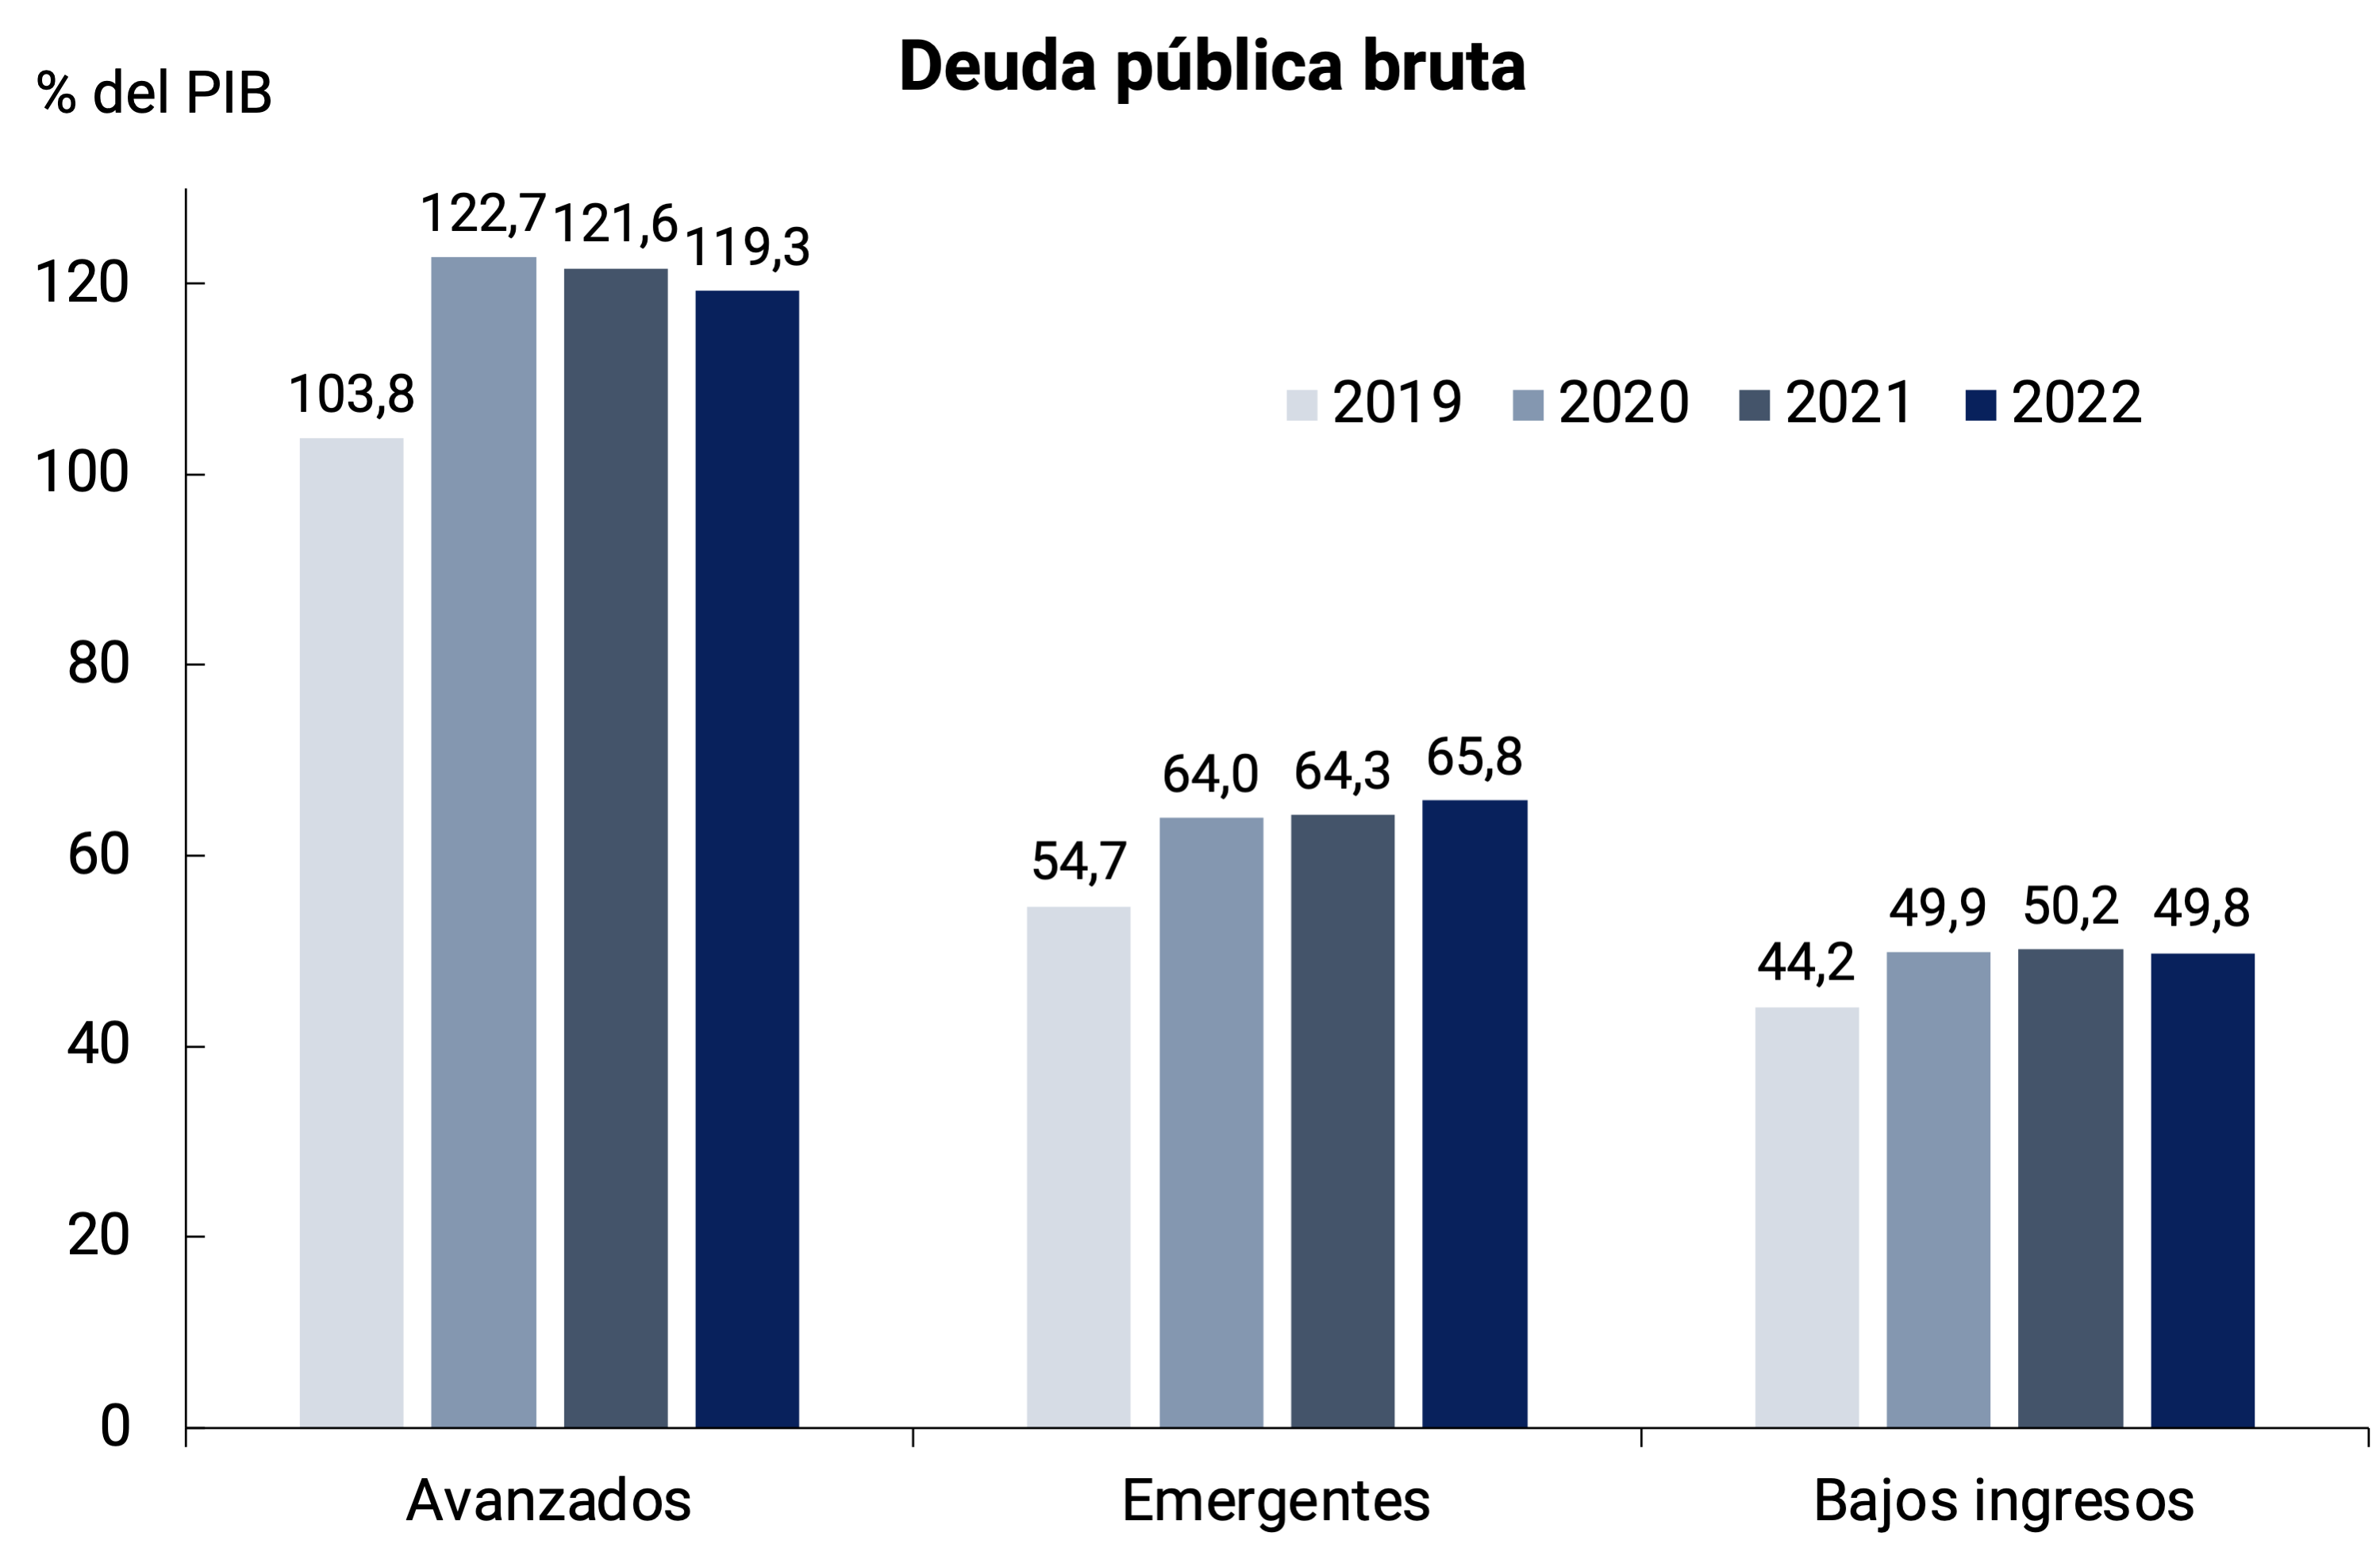
According to IMF estimates, most countries would register smaller deficits in their public accounts in the year than in 2020, a trend that would continue in 2022. For this year, the largest imbalances would be registered in advanced countries, which would close the year with an average fiscal deficit of 8.8% of GDP, while emerging economies and lower-income economies would end up with imbalances of -6.6% of GDP and -5.4% of GDP, respectively (see Figure 2.12). This fiscal dynamic, together with the expected recovery in economic activity, would lead to a moderation in the evolution of debt-to-GDP ratios at the global level during this year and 2022, even with slight declines in advanced countries (see Figure 2.12).
Figure 2.12 | Financial performance and public debt
Public sector financial performance
Gross public debt
2.4. Markets: Hikes in global interest rates and stock market increases continue
Since the close of the previous IPOM, there has been a tightening of the margin of financial conditions for emerging countries. Interest rates on advanced-country government bonds have continued to rise since August. In the United States, expectations of an earlier hike in the policy rate in the face of higher expected inflation (see Figure 2.13) drove shorter rates. The 10-year rate, which peaked at 1.70% in May, then fell to a low of 1.20% in early August, continued to rise and stands at 1.56%, up 32 bps since the close of the previous IPOM. For the moment, these are not sudden movements or movements of magnitude that could generate turbulence, especially in emerging countries. Despite the rise in the 10-year rate, the 30-year rate barely rose in the last three months, so the yield curve has flattened (see Figure 2.13), an indication that markets are expecting a slowdown in global growth. This phenomenon of 10-year rate hikes and flattening of yield curves is also being observed in Europe and Great Britain (see Figure 2.13). Meanwhile, the U.S. dollar, which hit a low in late May, continued to appreciate against a basket of currencies.
Figure 2.13 |
U.S. government bond yields and dollar index

Rate differential and inflation rate

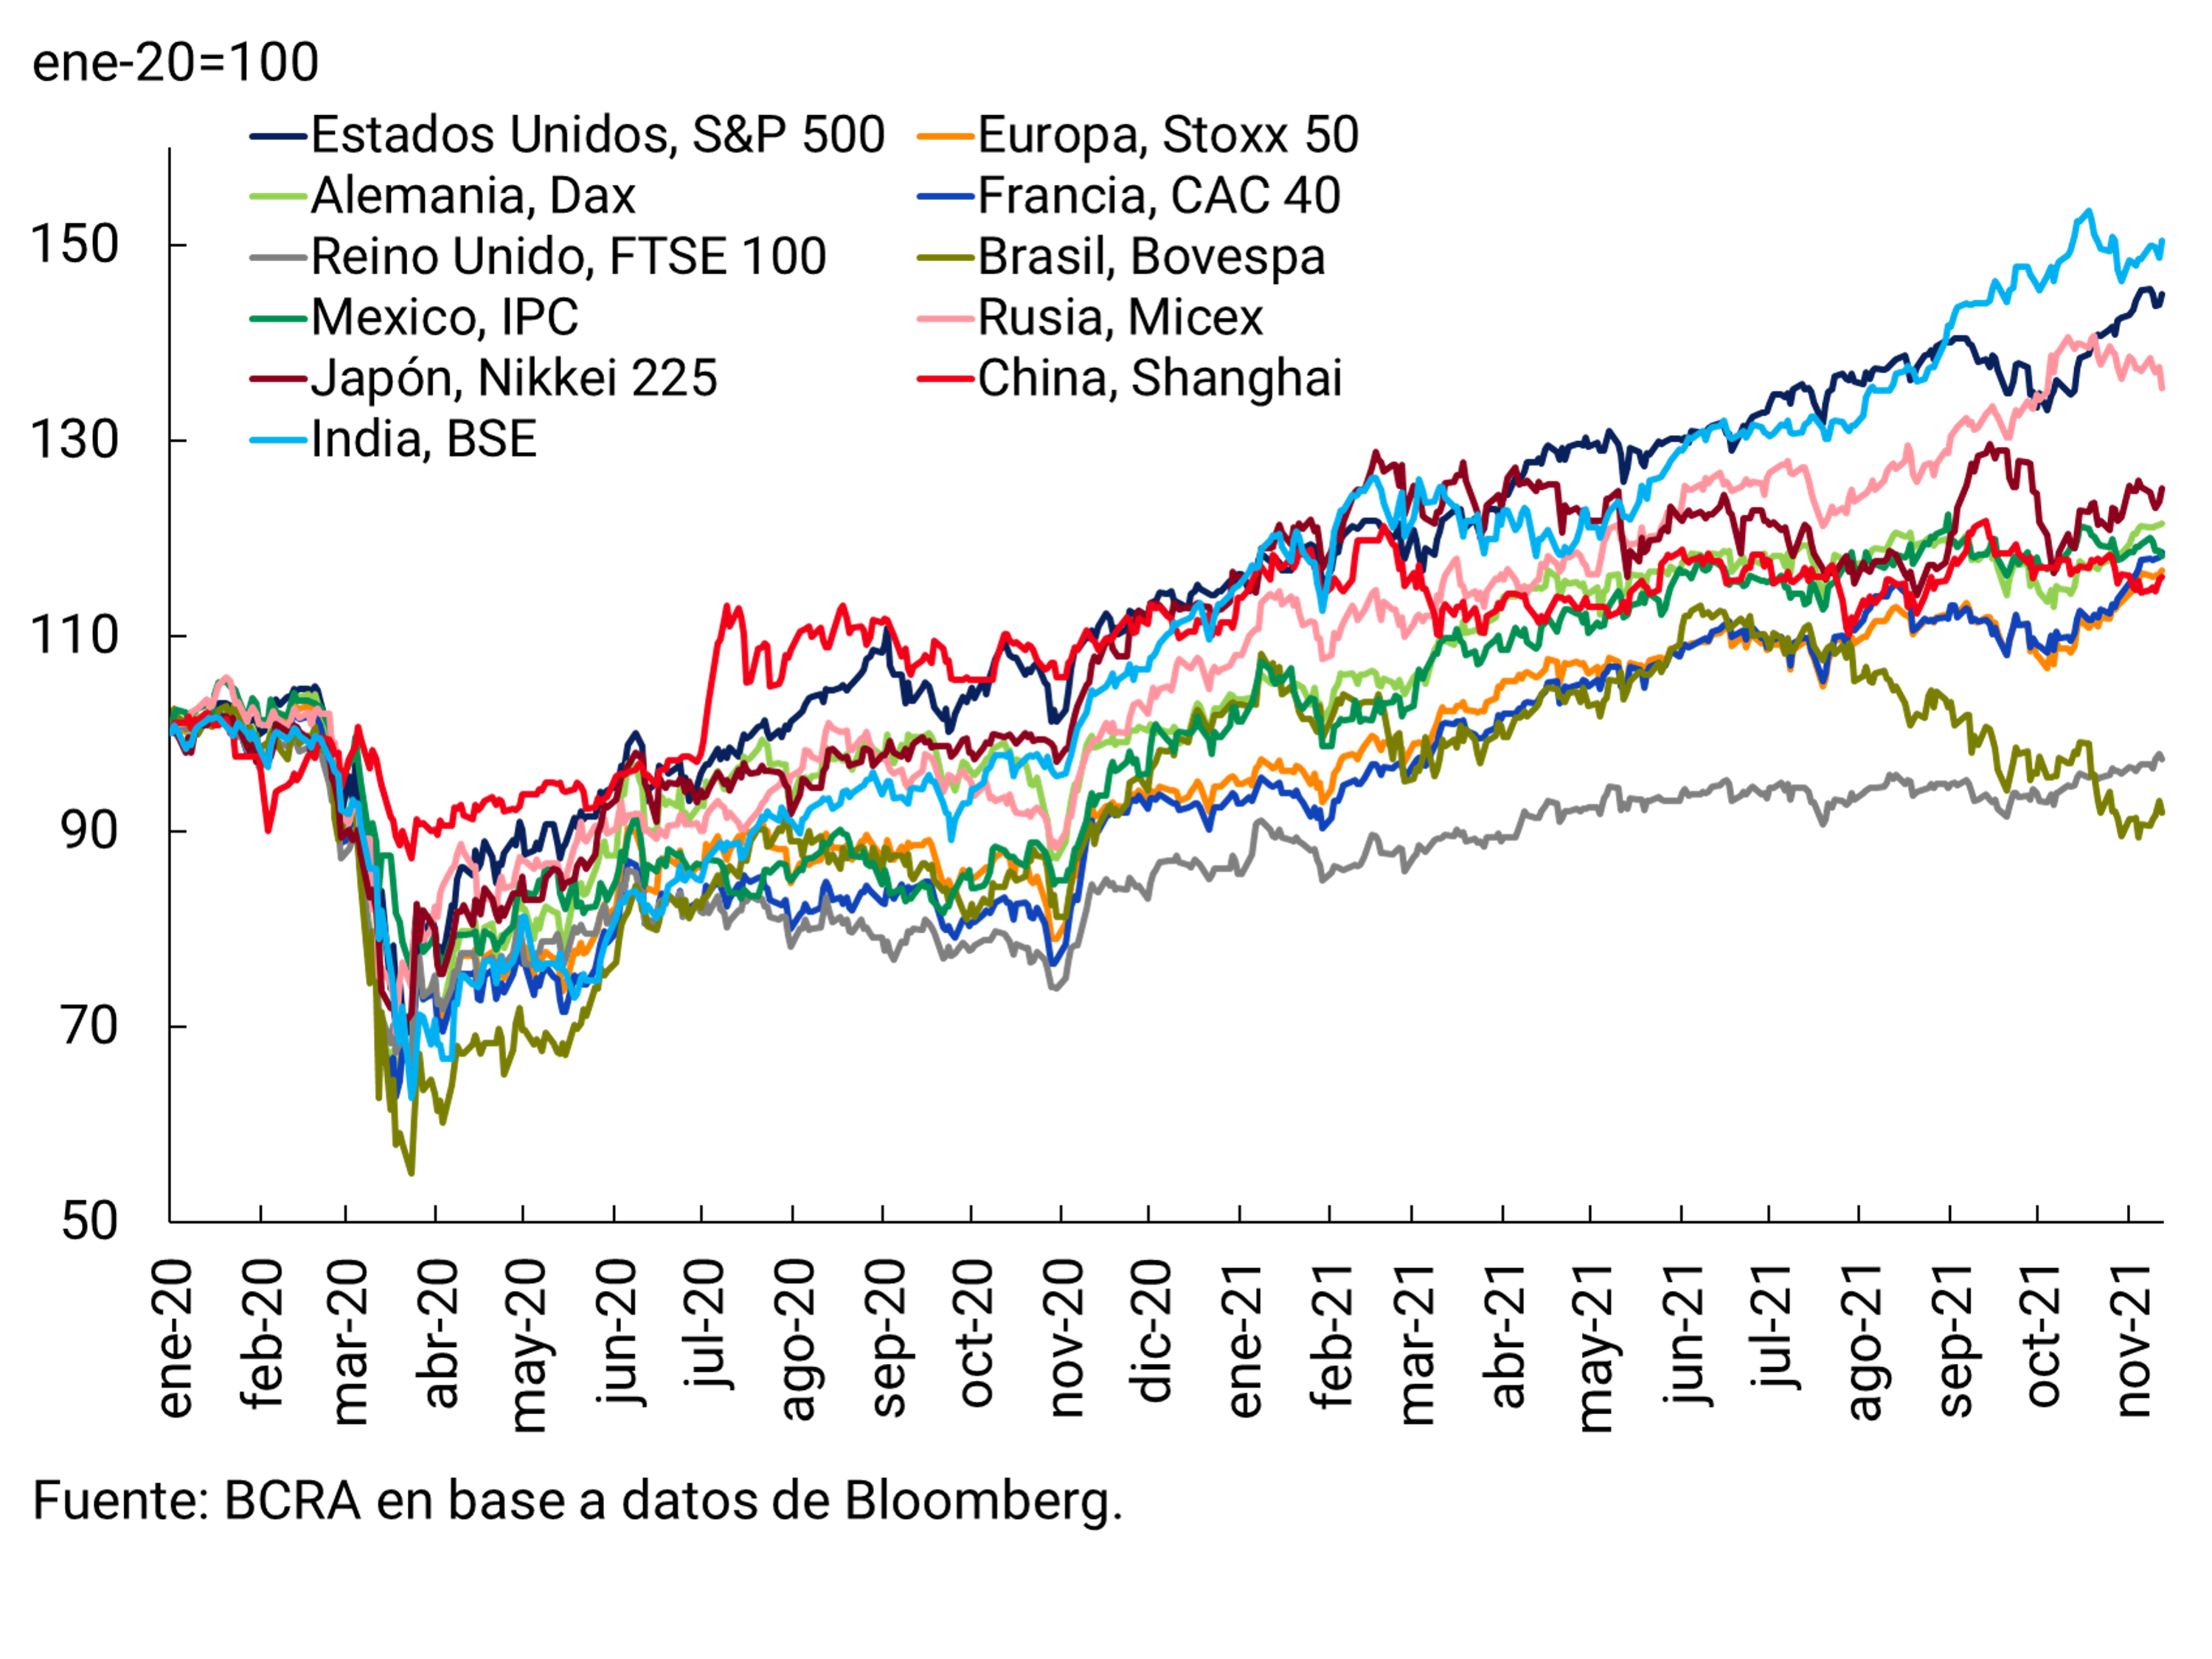
While bond prices may suggest lower expected growth, global equities remain elevated (see Figure 2.14). The S&P500 is 6% above the previous IPOM close and up 25% for the year. European stocks, as measured by the Stoxx 50 index, are also up 6% since the close of the previous IPOM and are up 23% for the year. This dynamic continues to present the risk of a sudden correction in equity markets.
Figure 2.14 |
Stock index returns
Capital flows to emerging countries since the beginning of the pandemic
In September, there were a few days of turbulence in the stock markets due to fears of what the global impact of the problems to face debt maturities by Evergrande and other Chinese real estate developers could be; Although the fear of financial contagion has been diluted, it is estimated that the impact on the real sector may be considerable. The cryptoasset markets continued with euphoria and high volatility. The market capitalization tripled in 2021 to an all-time high of $2.6 trillion today, although before peaking at $2.4 trillion in May to fall to $1.2 trillion in July, showing the high volatility.
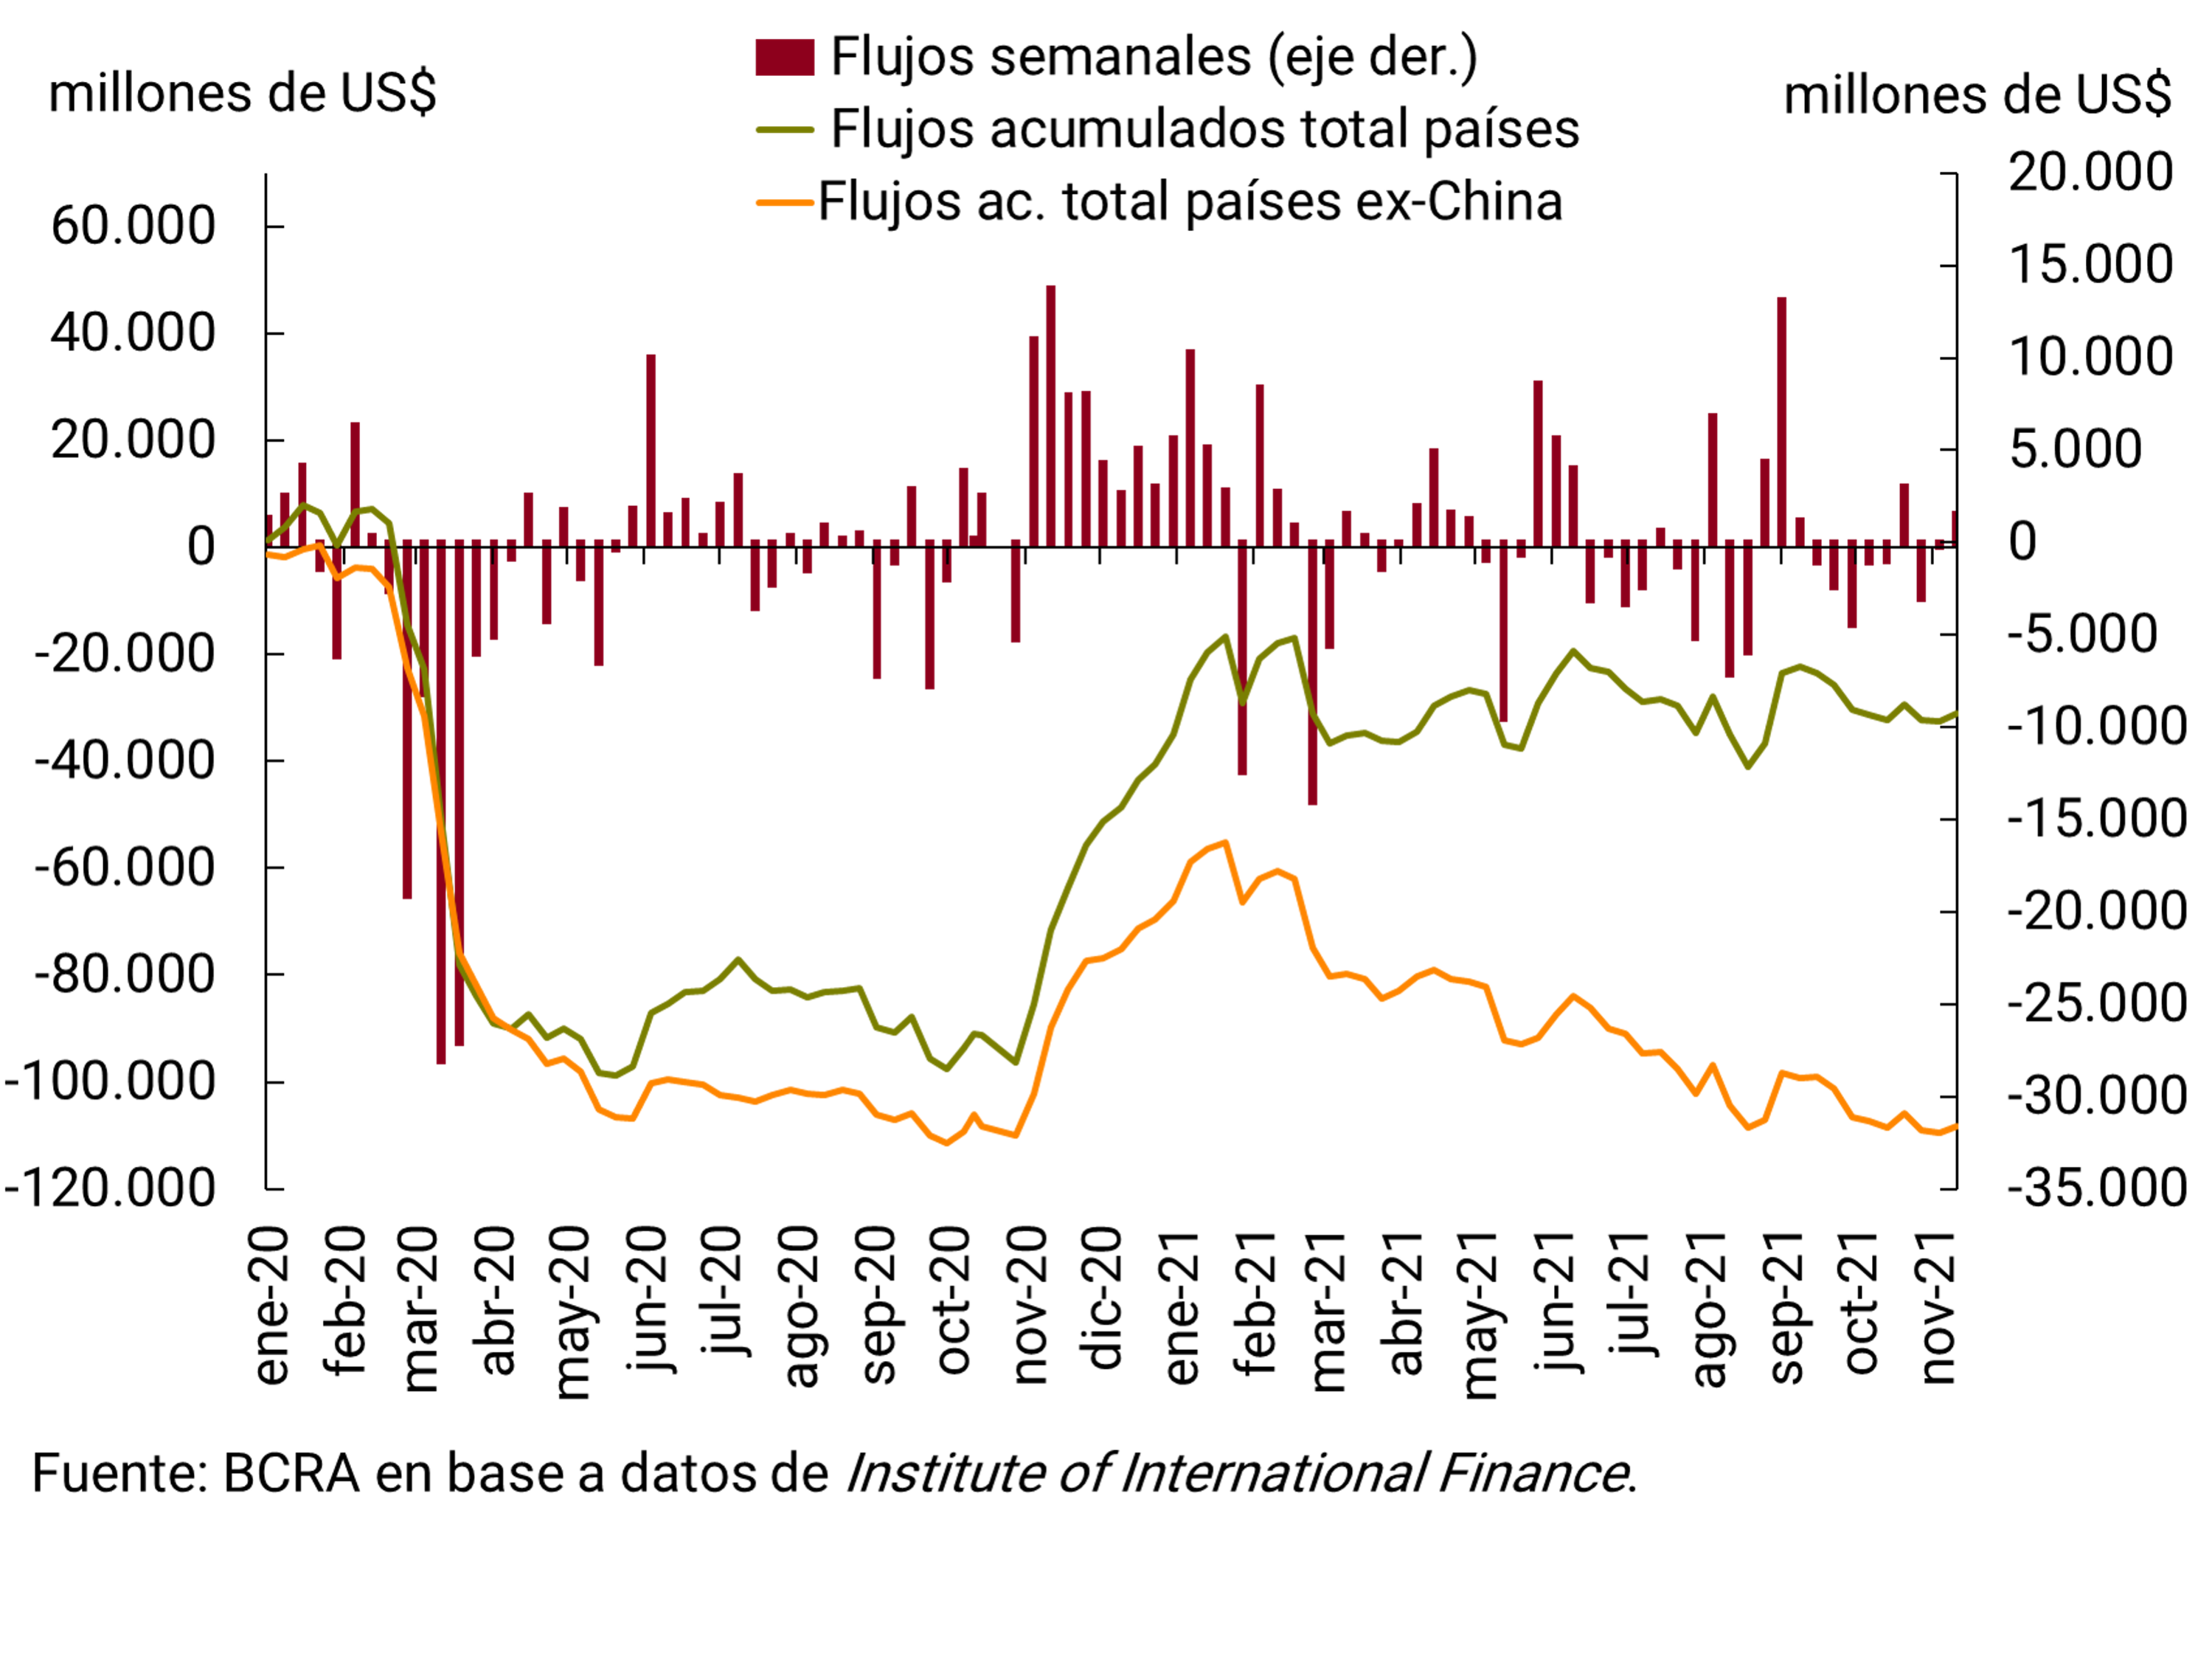
Capital flows to emerging countries have not changed much in recent months, accumulating a net inflow of US$9.9 billion since the previous IPOM and a similar number since the beginning of the year (see Figure 2.14). In any case, it should be noted that a large part of them went to China and are negative towards the rest of the countries. Since the beginning of the pandemic, emerging countries (excluding China) have accumulated capital outflows of US$31 billion, while China has registered inflows of US$77 billion. Finally, commodity prices did not show major movements (a 2% drop since the close of the previous IPOM according to the BCRA’s IPMP), with the exception of the price of oil, which rose by 25% in the same period.
2.5. In summary
The global economy is recovering, but in a disparate way between advanced and developing countries, and with rising inflation. On the one hand, this reduces the monetary and fiscal policy space available to the latter countries to continue to boost the recovery. On the other hand, the monetary policy reaction of advanced countries could negatively “spill over” to the rest of the world through less favorable financial conditions: higher interest rates, global appreciation of the dollar and its eventual impact on capital flows and commodity prices. Financial markets carry additional risks: a collapse in crypto-asset prices, which could have unknown ramifications at this time; a possible contagion of the real estate crisis in China to other assets. The balance of risks of the global economy can be summarized as follows: positive expected growth, but with downside risks; expected inflation stable or falling, but with upside risks.
3. Economic Activity and Employment
Economic activity resumed the path of recovery in the third quarter of the year, after temporarily receding as a result of the impact of the second wave of COVID-19, in line with what was anticipated in the previous IPOM. The data available from the EMAE for August showed that the sectoral performance is still heterogeneous, in which activities that managed to operate and remain at relatively high levels coexist with others that recently began to gain greater momentum. According to the evolution of various leading indicators, economic activity would continue to improve in the remainder of the year, driven mainly by the performance of services.
As anticipated in the previous IPOM, the measures implemented by the National Government aimed at delaying the entry of new variants of the virus in a context of greater availability of vaccines made it possible to accelerate the vaccination process and thus significantly improve the local health context. The lower probability of a new outbreak of COVID-19 made it possible to advance on a plan for greater opening of activities, in a progressive and sustained manner, accelerating the economic recovery process.
The National Government established new policies during the third quarter aimed at sustainable and inclusive economic growth based on technological innovation and the recovery of employment and income, while implementing measures to support sectors still postponed by the COVID-19 crisis. For its part, the BCRA continued to contribute to the process of economic normalization through lines of credit for productive purposes aimed at promoting a balanced and sustained recovery and the continuity of measures to promote private consumption, such as the “Ahora 12” Program.
The BCRA expects activity to continue to recover in the remainder of the year, driven by the flexibilities of both activities and capacity, with greater vaccination coverage with complete schemes of the population and by the policies to support the activity of strategic sectors implemented by the National Government and the BCRA. All in all, GDP would grow by about 9% in 2021, also translating into improvements in employment. Although less likely, the risk associated with the circulation of the Delta variant of the virus in the country persists, as well as other strains that could eventually compromise the favorable epidemiological evolution.
3.1. Activity recovered within the framework of a great advance in the vaccination process that allowed the health situation to be controlled
The accelerated progress of the vaccination process since June made it possible to significantly improve the epidemiological situation and implement a process of progressive and sustained reopenings, simultaneously with the gradual expansion – and in some cases elimination – of the capacities in various activities (See Section 2 / Vaccination as a key determinant of the evolution of economic activity). In this context of progress towards a new normality, the National Government established various policies aimed at strategic sectors for the increase of exports and the recovery of employment and income, sustaining policies focused on the sectors in which the speed of recovery has been slower. For its part, the BCRA continued to contribute to the process of economic normalization through new lines of credit aimed at promoting a balanced and sustained recovery and the continuity of policies to promote private consumption (See Chapter 7. Monetary Policy).
The Monthly Estimator of Economic Activity (EMAE) adjusted for seasonal factors (s.e.) recovered quickly after the impact of the second wave of infections in April-May. Thus, after registering a fall of 1.4% s.e. in the second quarter – reflecting the impact of the second wave of infections – the Product would register an improvement of close to 3% quarterly s.e. in the third, higher than initially forecast by market analysts3.
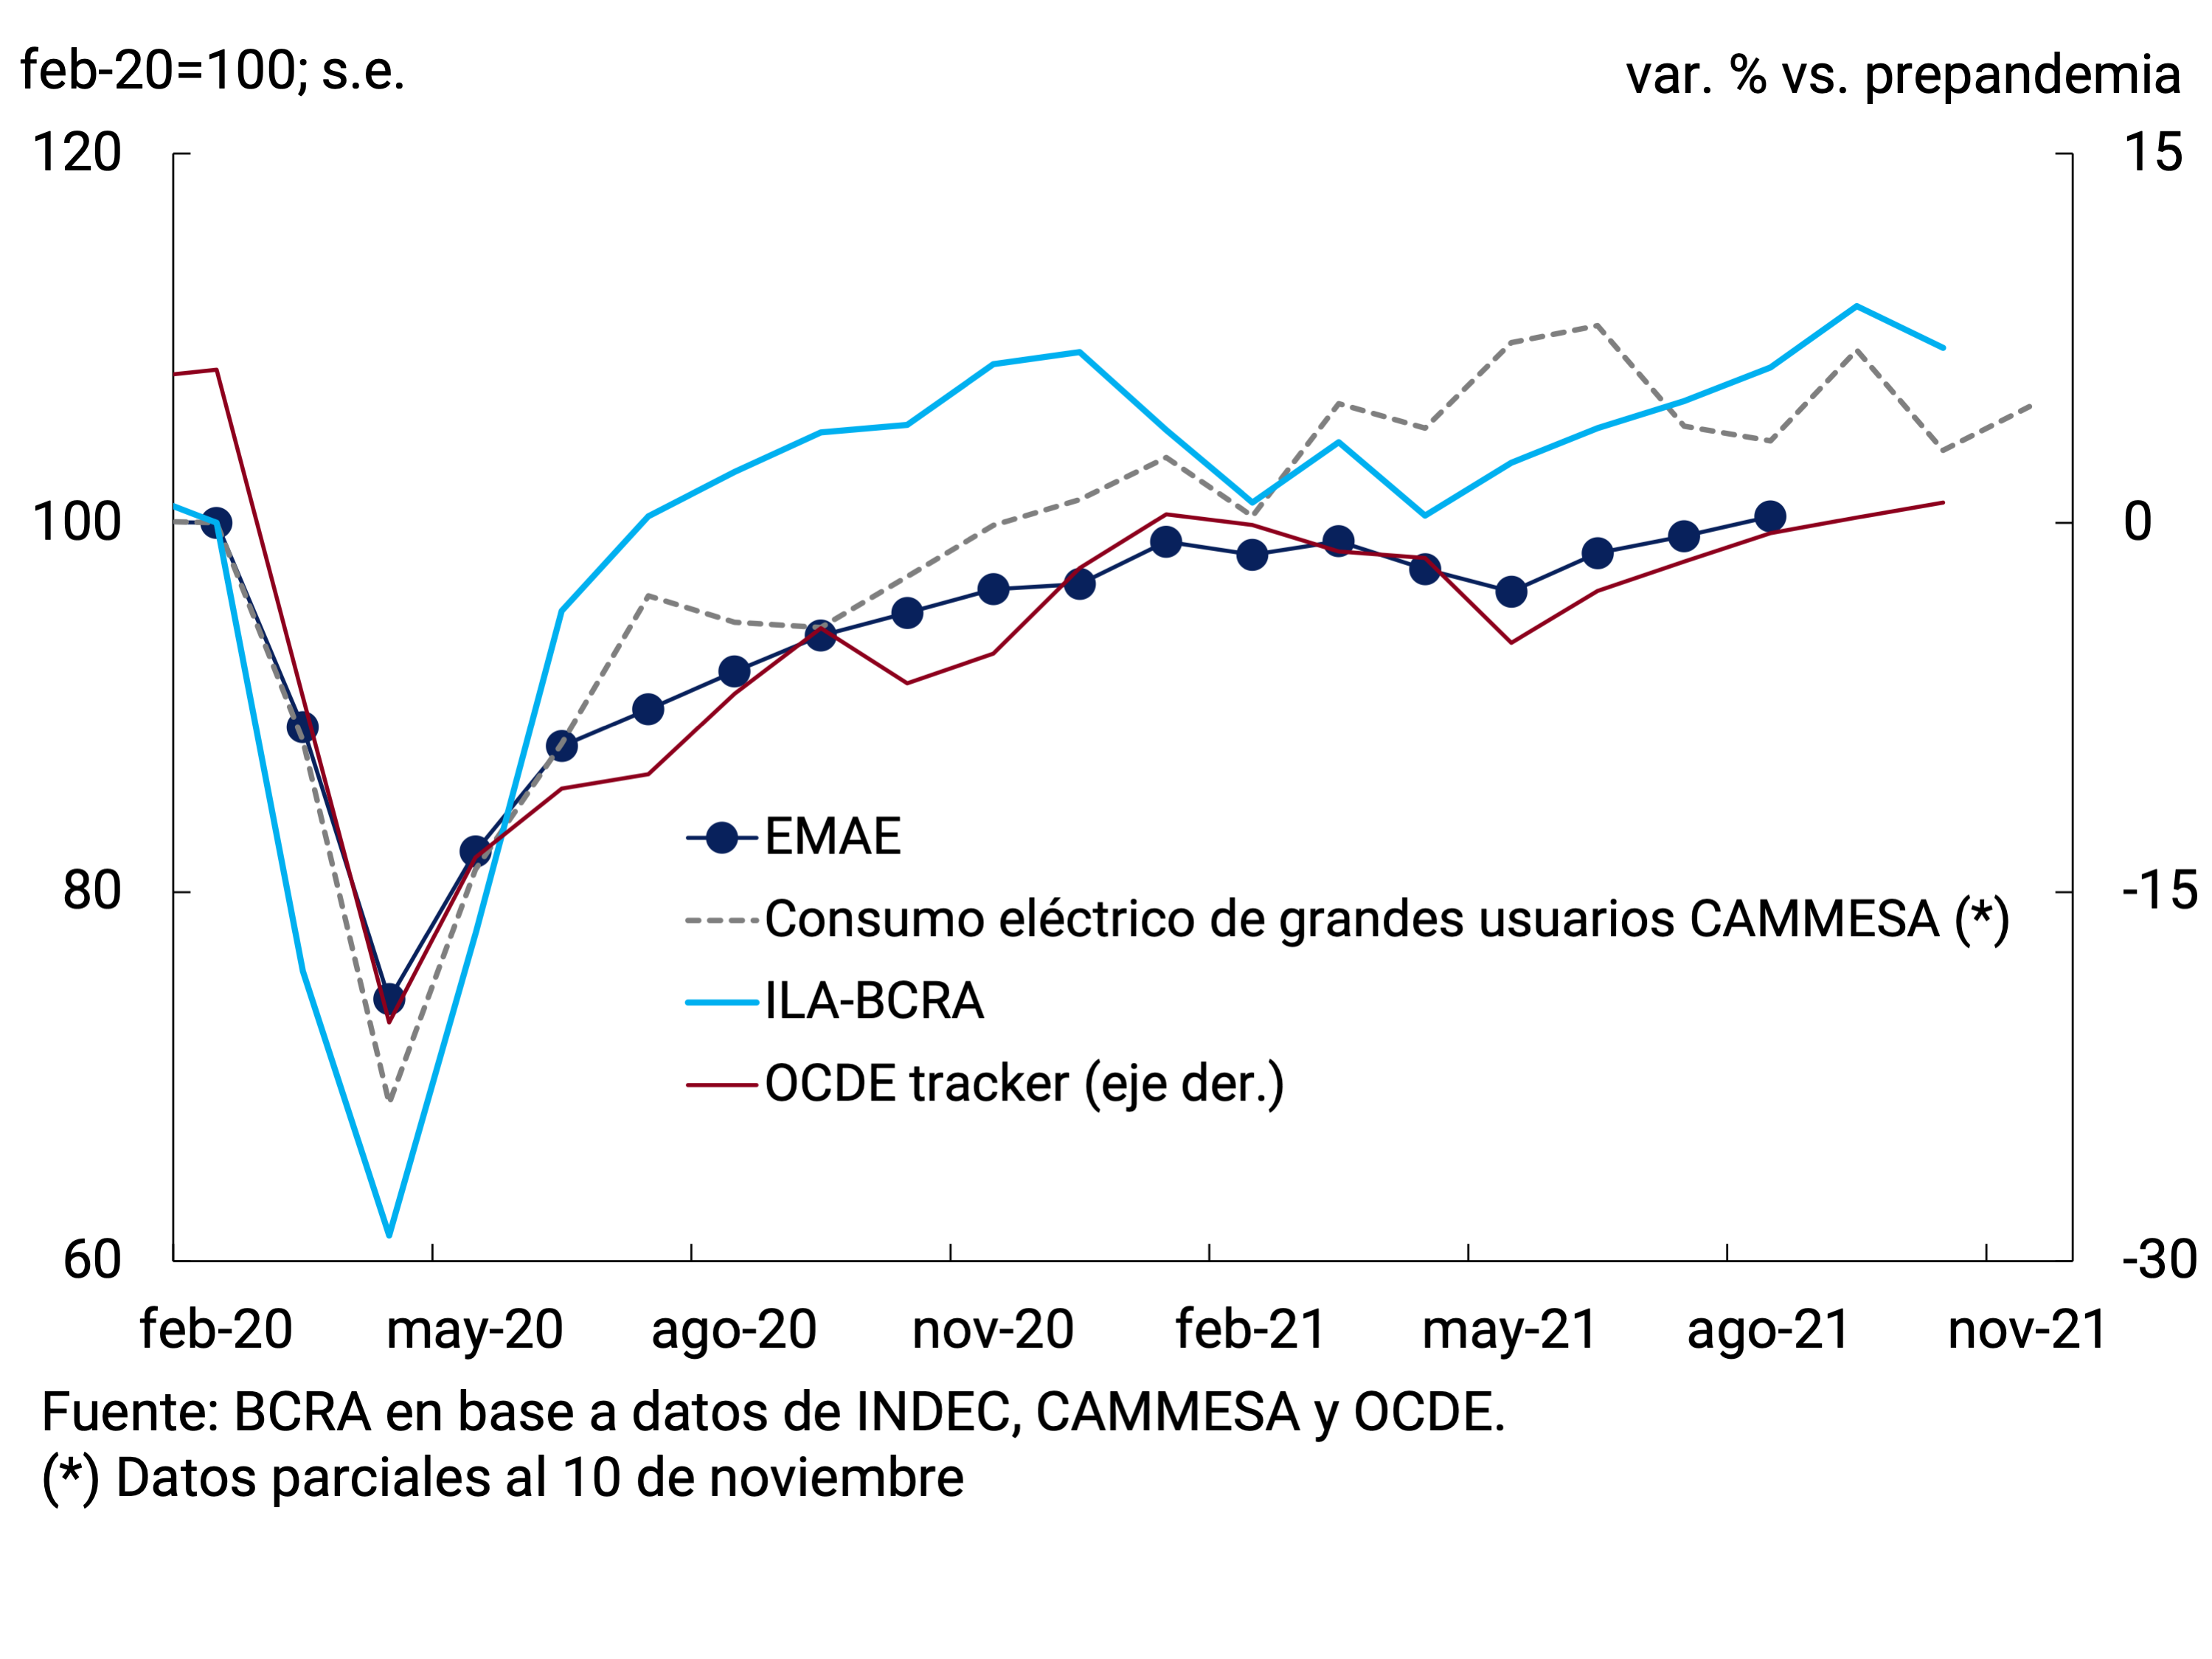
The high-frequency data available for the fourth quarter anticipate the continuation of the recovery in economic activity, with an accelerated progress in the vaccination process and, consequently, a favorable epidemiological situation. The Leading Indicator of Economic Activity (ILA-BCRA) remained in the recovery phase4 while the OECD’s weekly indicator of activity continued to increase in October (see Figure 3.1).
Figure 3.1 | | Monthly indicators of economic activity
3.1.1. Domestic demand continued to recover and greater dynamism in private consumption stood out
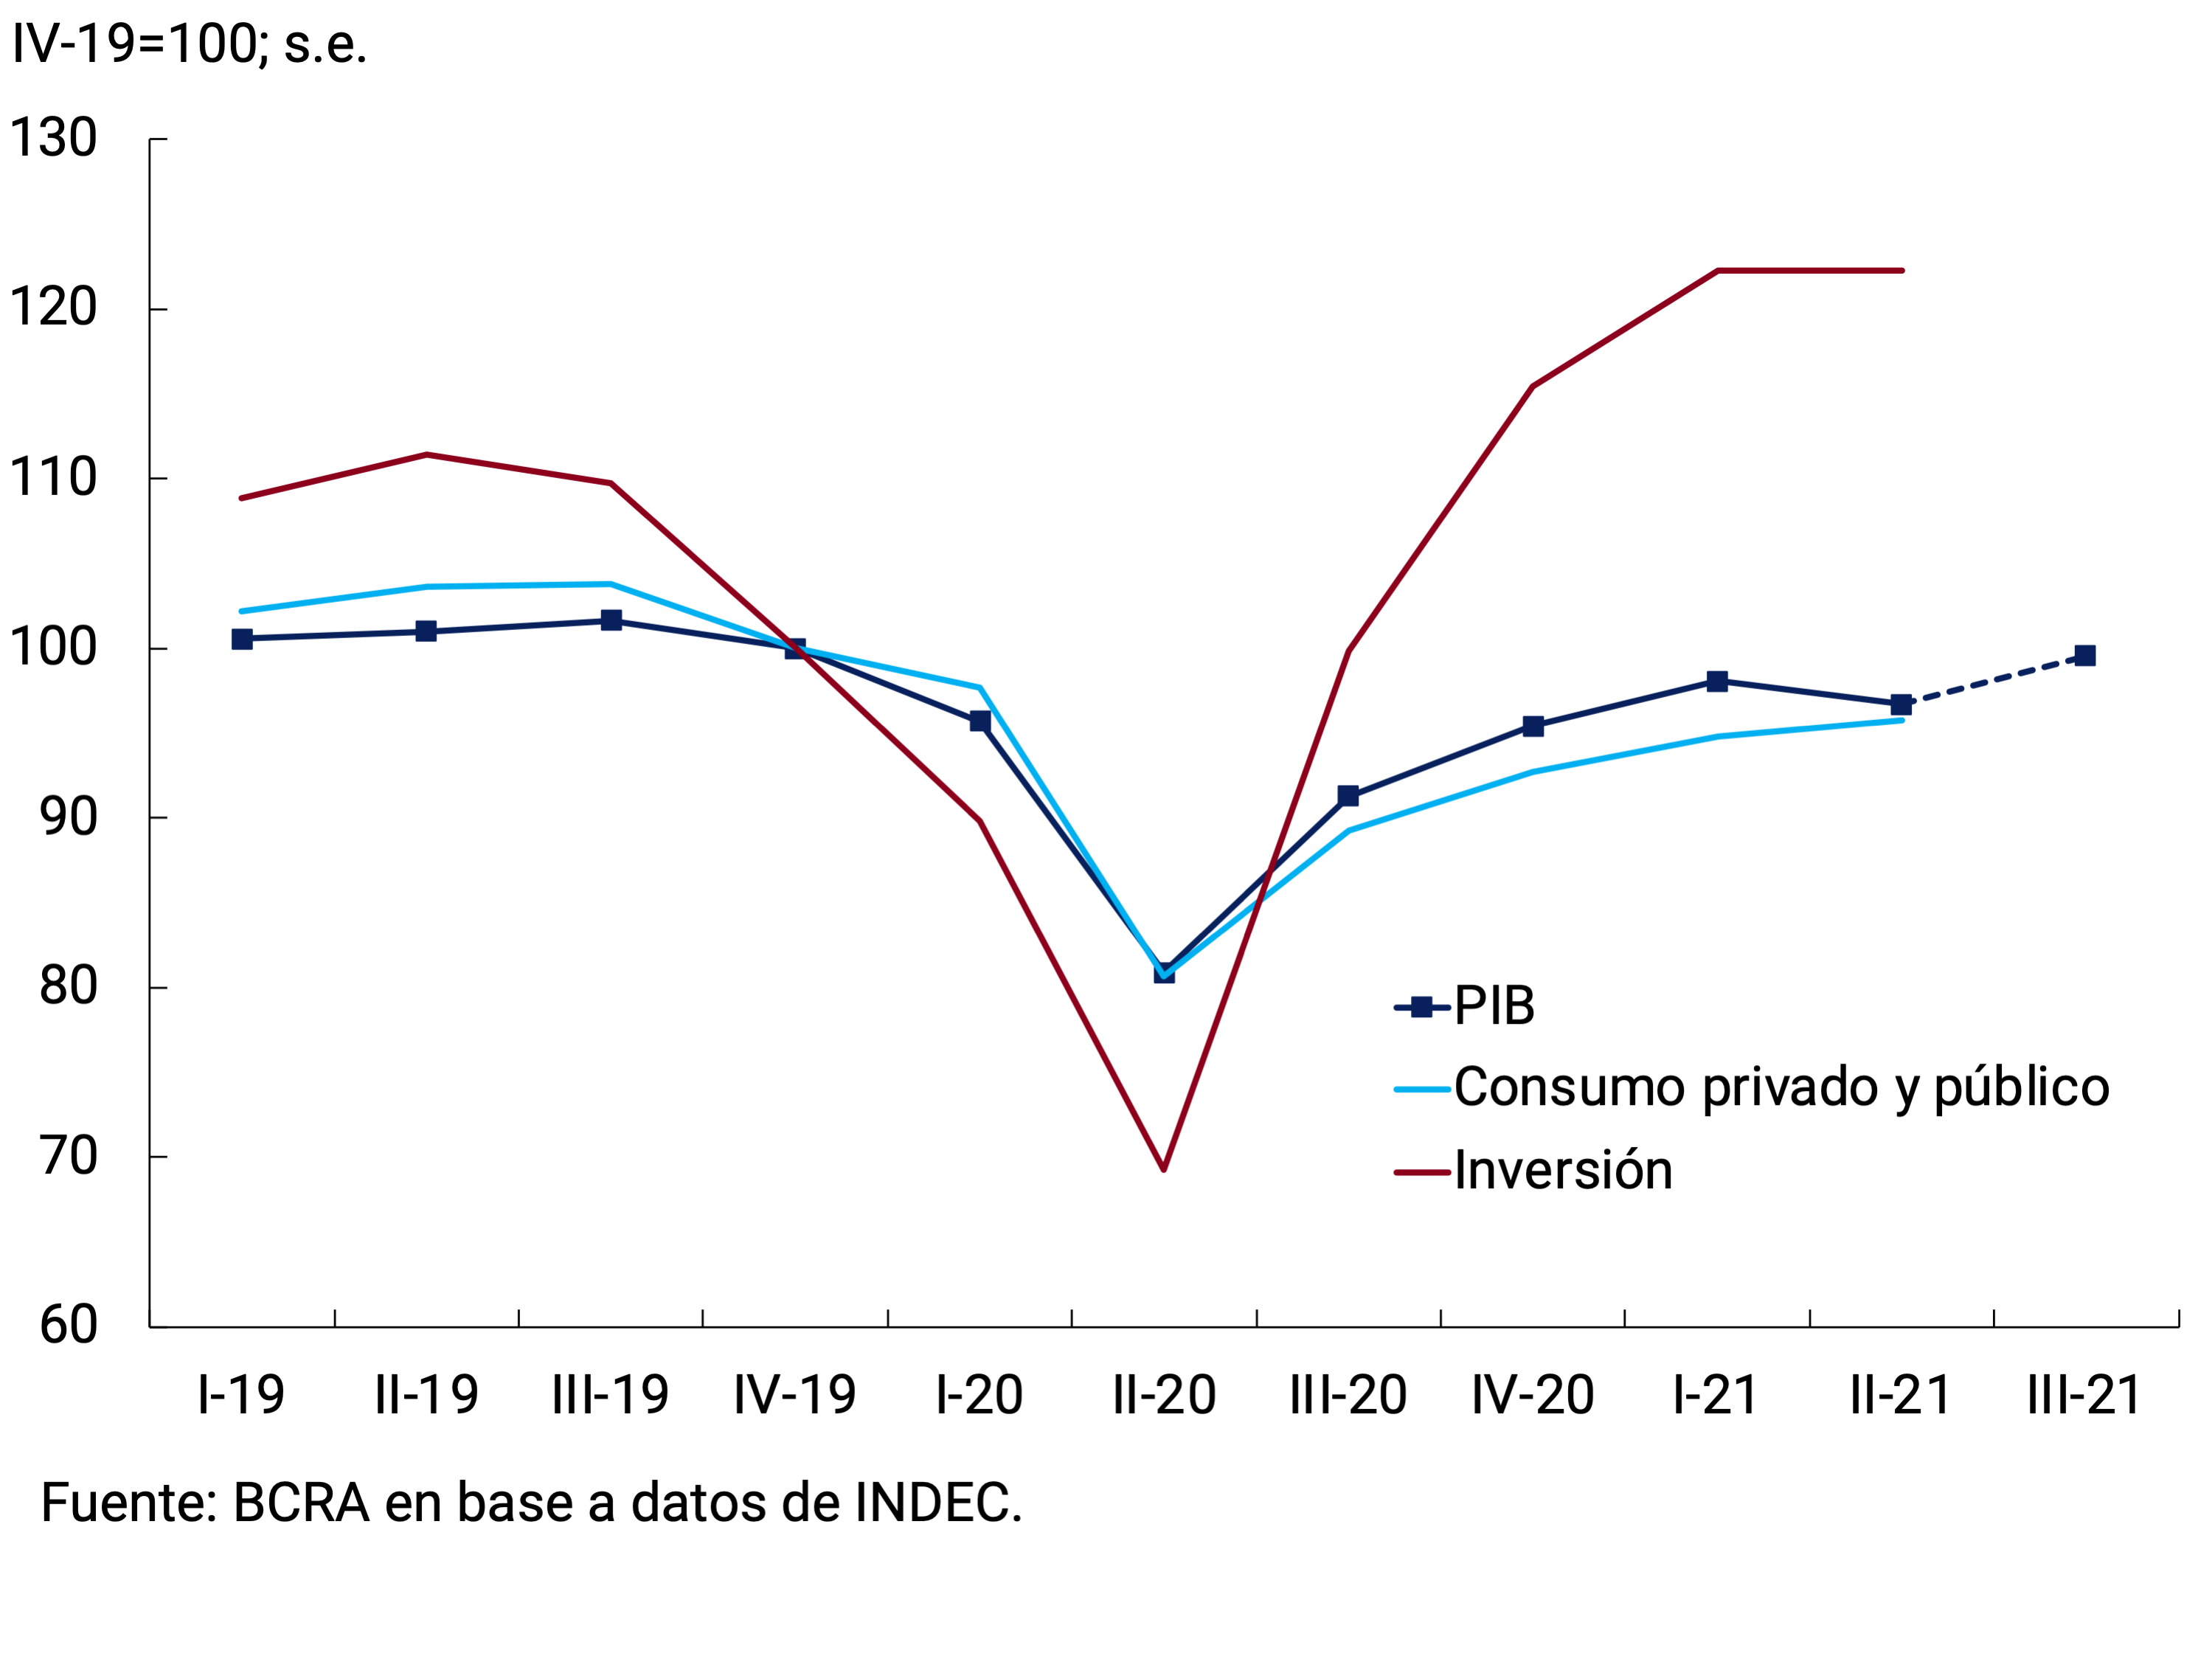
In the second quarter of 2021, GDP contracted 1.4% quarter-on-quarter (+17.9% y.o.y.) and was 3.3% below its level in the last quarter of 2019, while domestic demand – total domestic expenditure on consumption and investment – recovered 0.8% quarter-on-quarter s.e., reaching its pre-pandemic level. Private consumption recovered 1.1% qoq s.e. (21.9% y.o.y.) and public consumption increased 0.5% s.e. (8.2% y.o.y.) and investment5 remained stable in relation to the previous quarter (76.6% y.o.y.). Exports of goods and services increased 5.7% qoq s.e. (6.3% y.o.y.) and imports, 5.4% qoq s.e. (36.6% y.o.y.)6. Available data for the third quarter7 anticipate increases in both private consumption and investment (see Figure 3.2).
Figure 3.2 | GDP and main components of demand
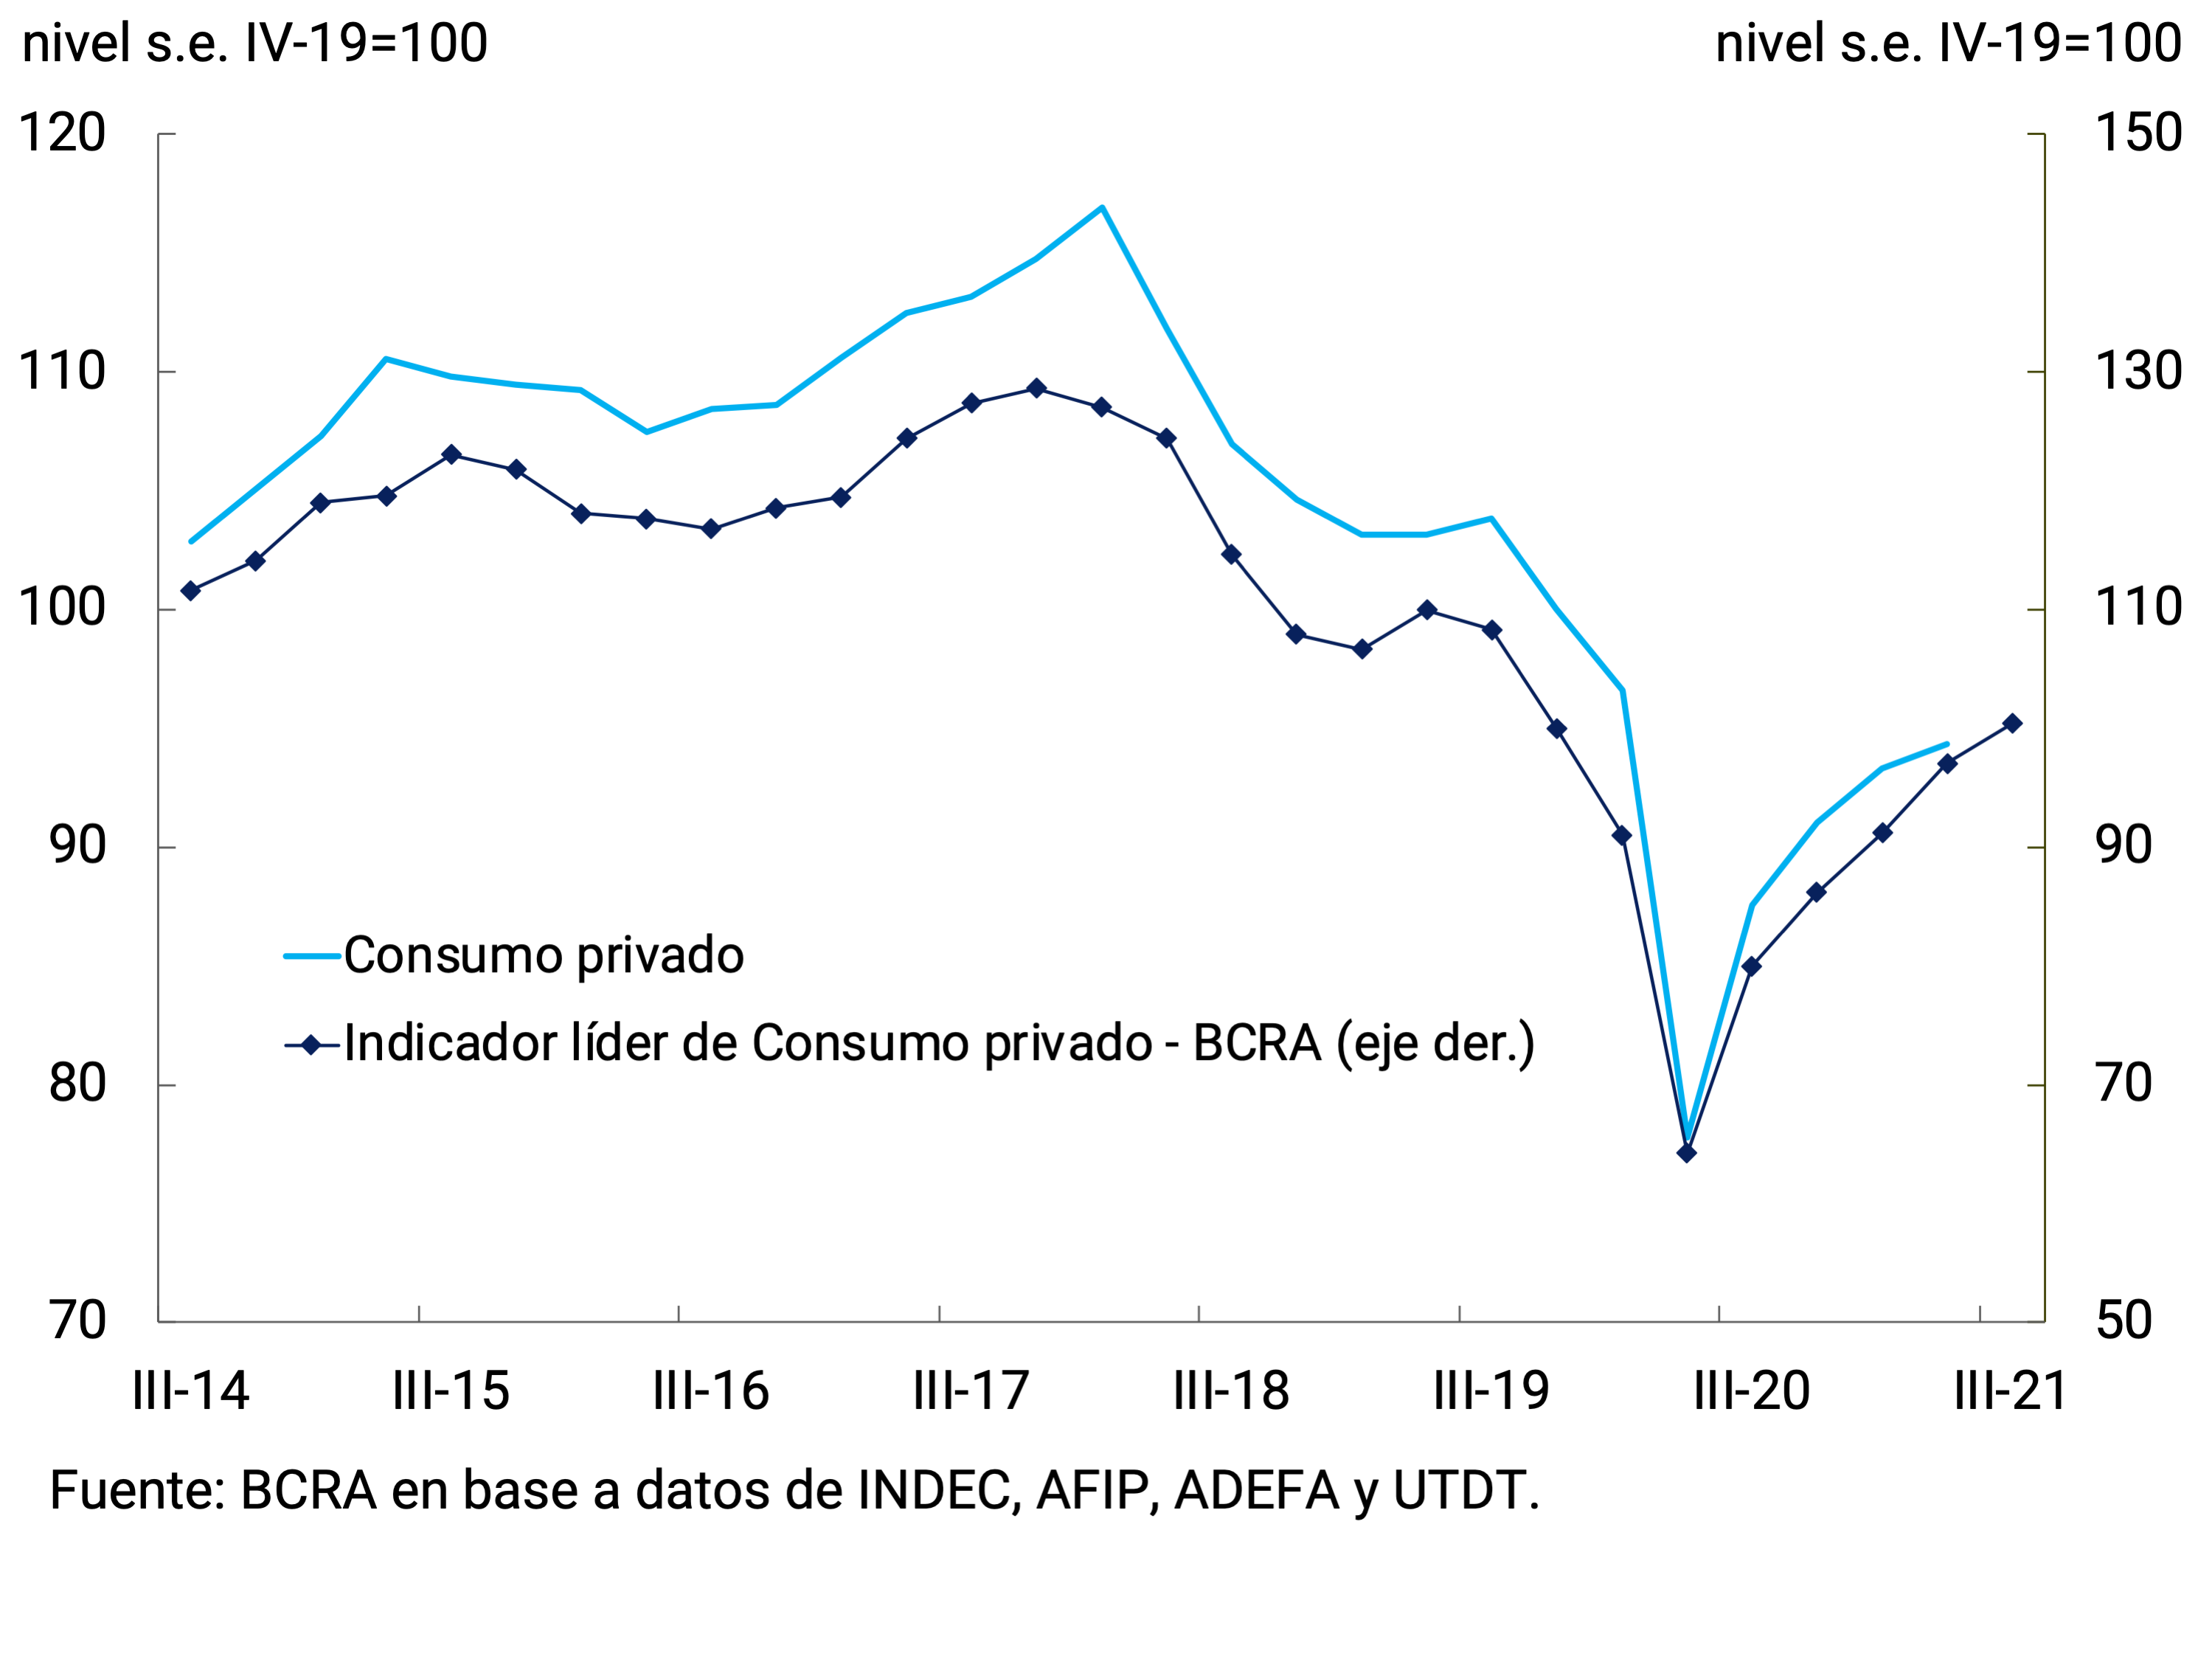
As for Private Consumption, the BCRA Leading Indicator8 shows an increase in the third quarter, recovering the level of the last quarter of 2019 (see Chart 3.3). The gradual recomposition of the level of private consumption is associated with the evolution of the mass of household income, which includes improvements in both employment levels and real wages, and was favored by the income policies of the National Government. In this context, the gradual normalization of social mobility was mainly reflected in an increase in the consumption of services.
Figure 3.3 | Private consumption
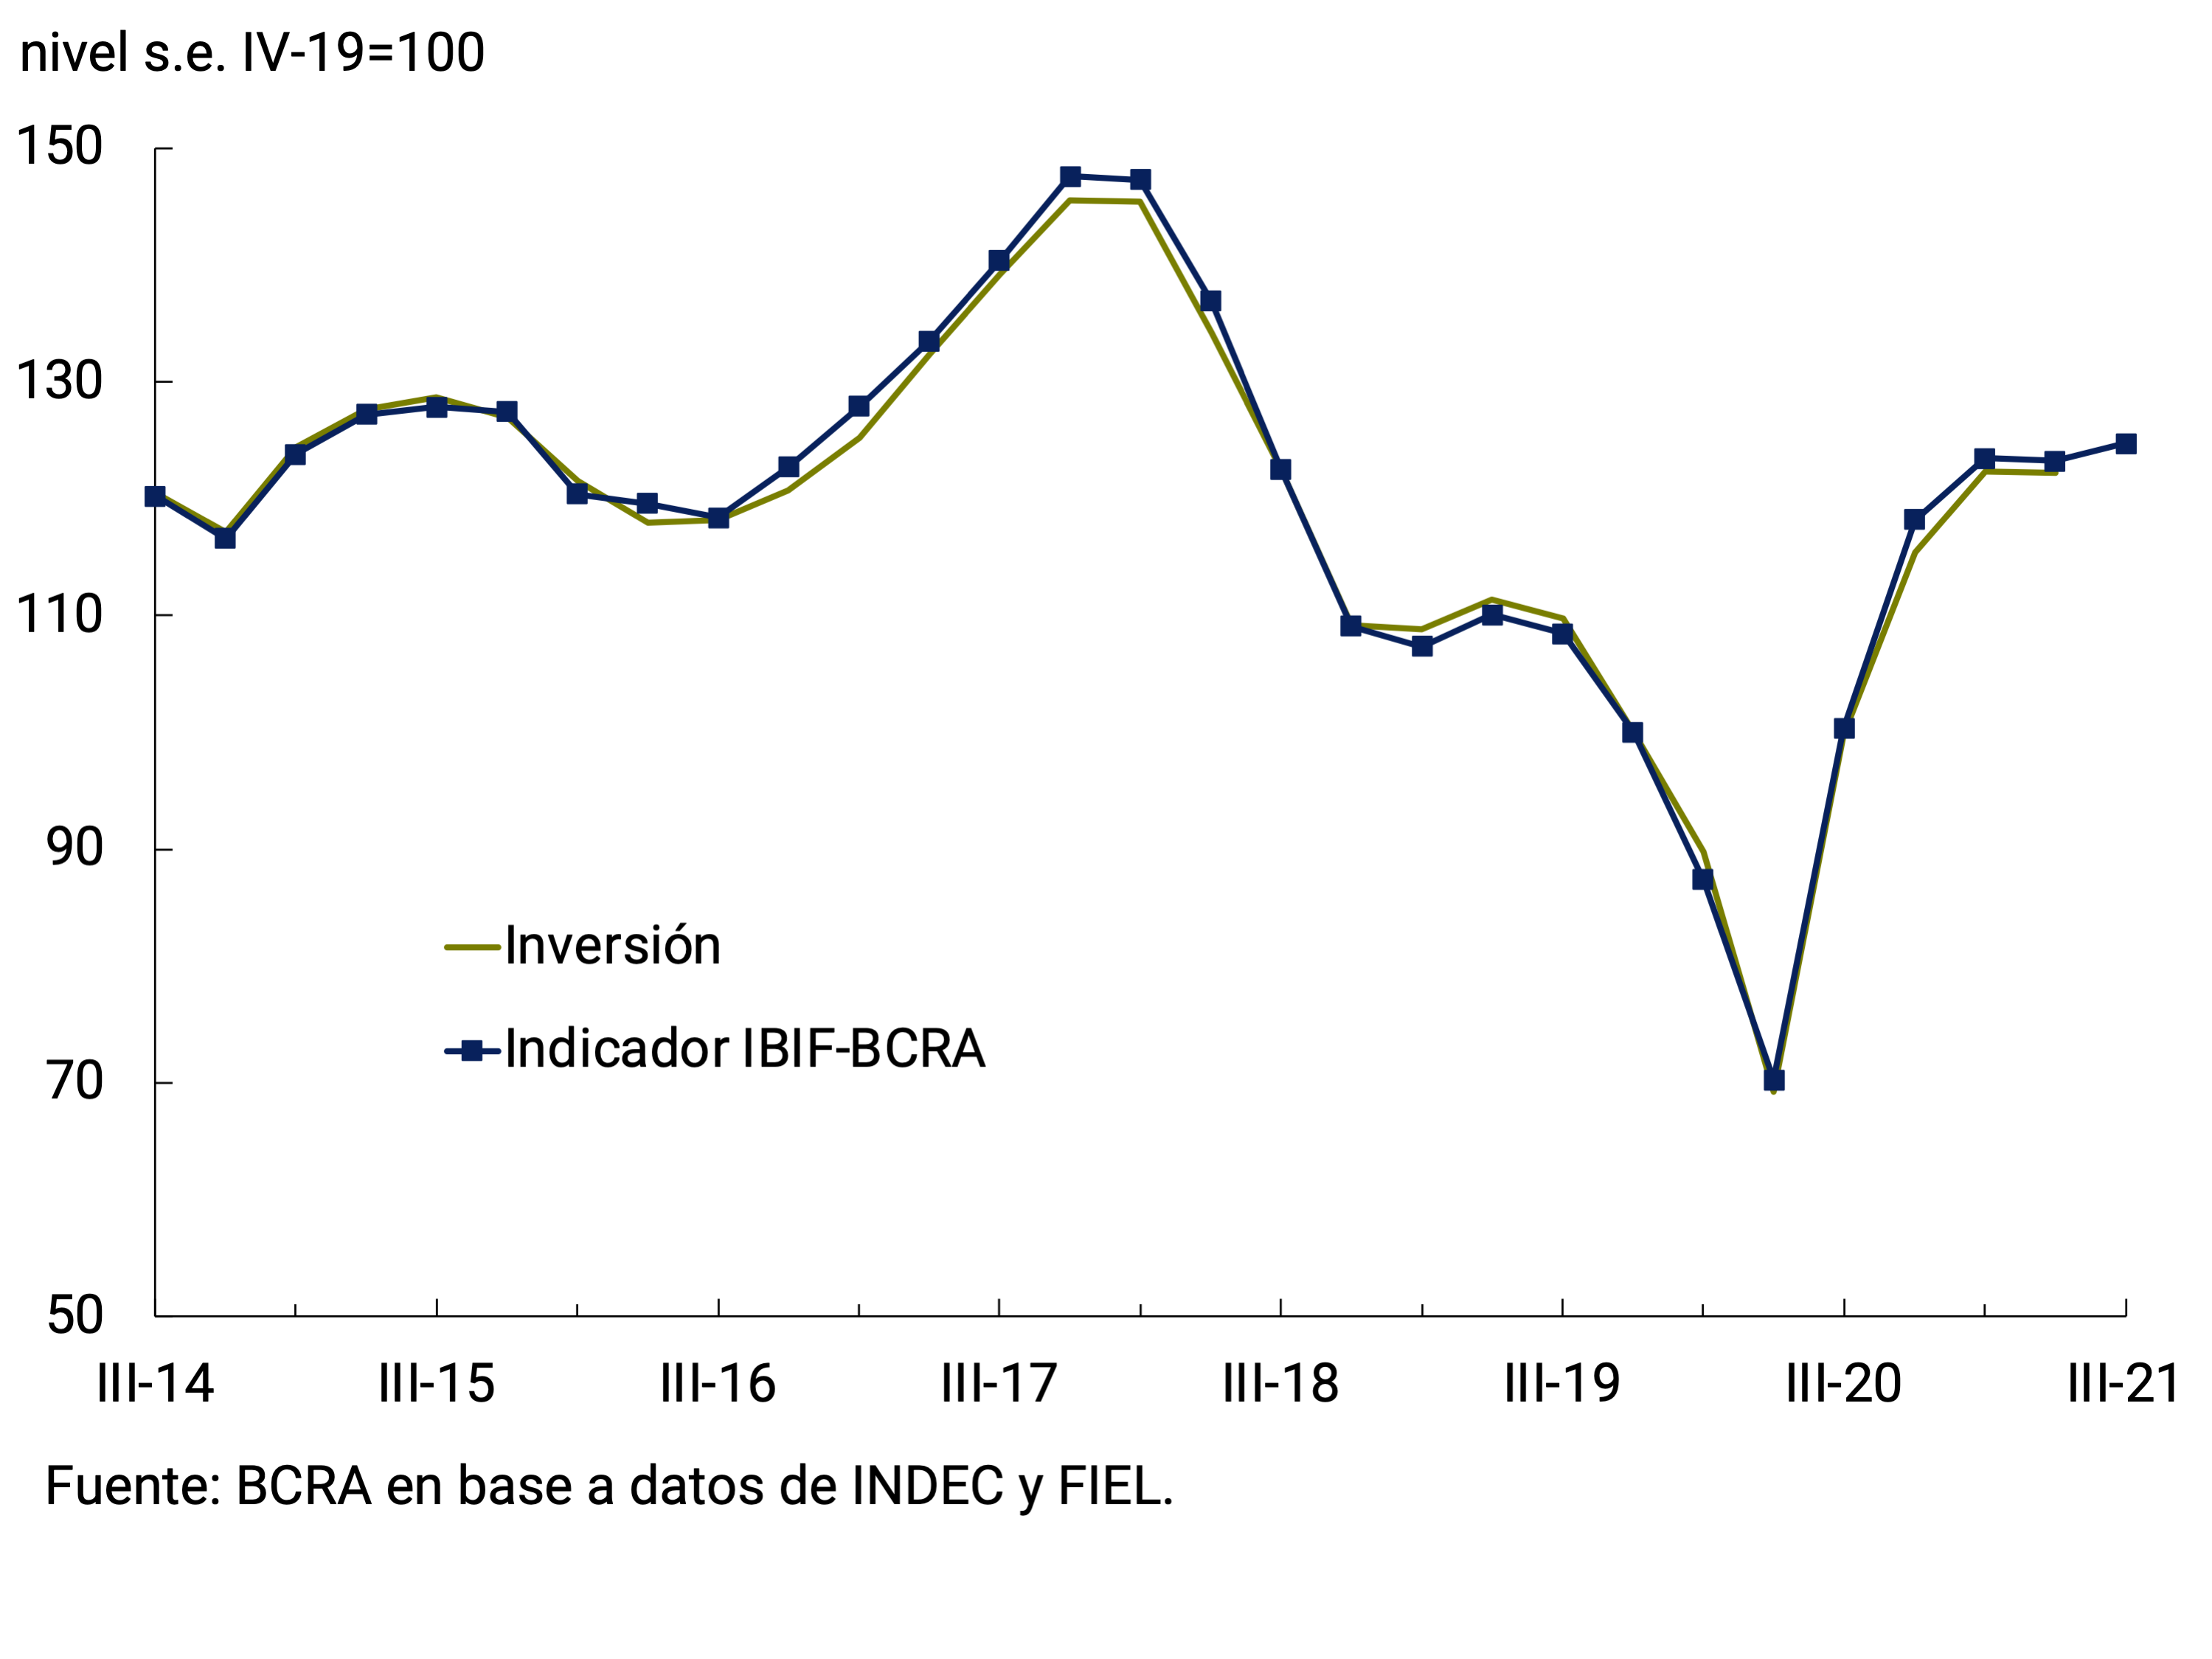
For its part, the IBIF-BCRA indicator continued to increase and showed a quarterly improvement of 1.3% s.e. in the third quarter of 2021 (see Chart 3.4). This increase was due to increases in investment in durable equipment of national origin and construction, partially offset by a fall in imported equipment9. With respect to the external sector and according to the information referring to the Commercial Exchange of Goods of INDEC, in the third quarter the contribution of net exports of goods and services to the quarterly variation of the Product would have been positive. Exported quantities of goods registered a strong quarterly increase (7.6% s.e.), while imported volumes of goods remained at levels very similar to those of the previous quarter in seasonally adjusted terms (see Chapter 4. External Sector).
Figure 3.4 | Gross domestic fixed investment
3.1.2. The services that suffered the most from the impact of the pandemic in 2020 are those that are contributing the most to the growth of economic activity at the margin
During the third quarter of 2021, in which activity managed to recompose the level observed at the beginning of 2020, services would have explained almost two-thirds of the seasonally adjusted quarterly variation of Output. As can be seen from EMAE10, the sectors with the greatest contribution to the quarterly variation of the general level were: Other social and community services and Hotels and Restaurants. These two service categories had been the ones that suffered the greatest impact of the pandemic, having registered cumulative falls of 65.6% s.e. and 81.7% s.e. between March and April 2020, respectively.
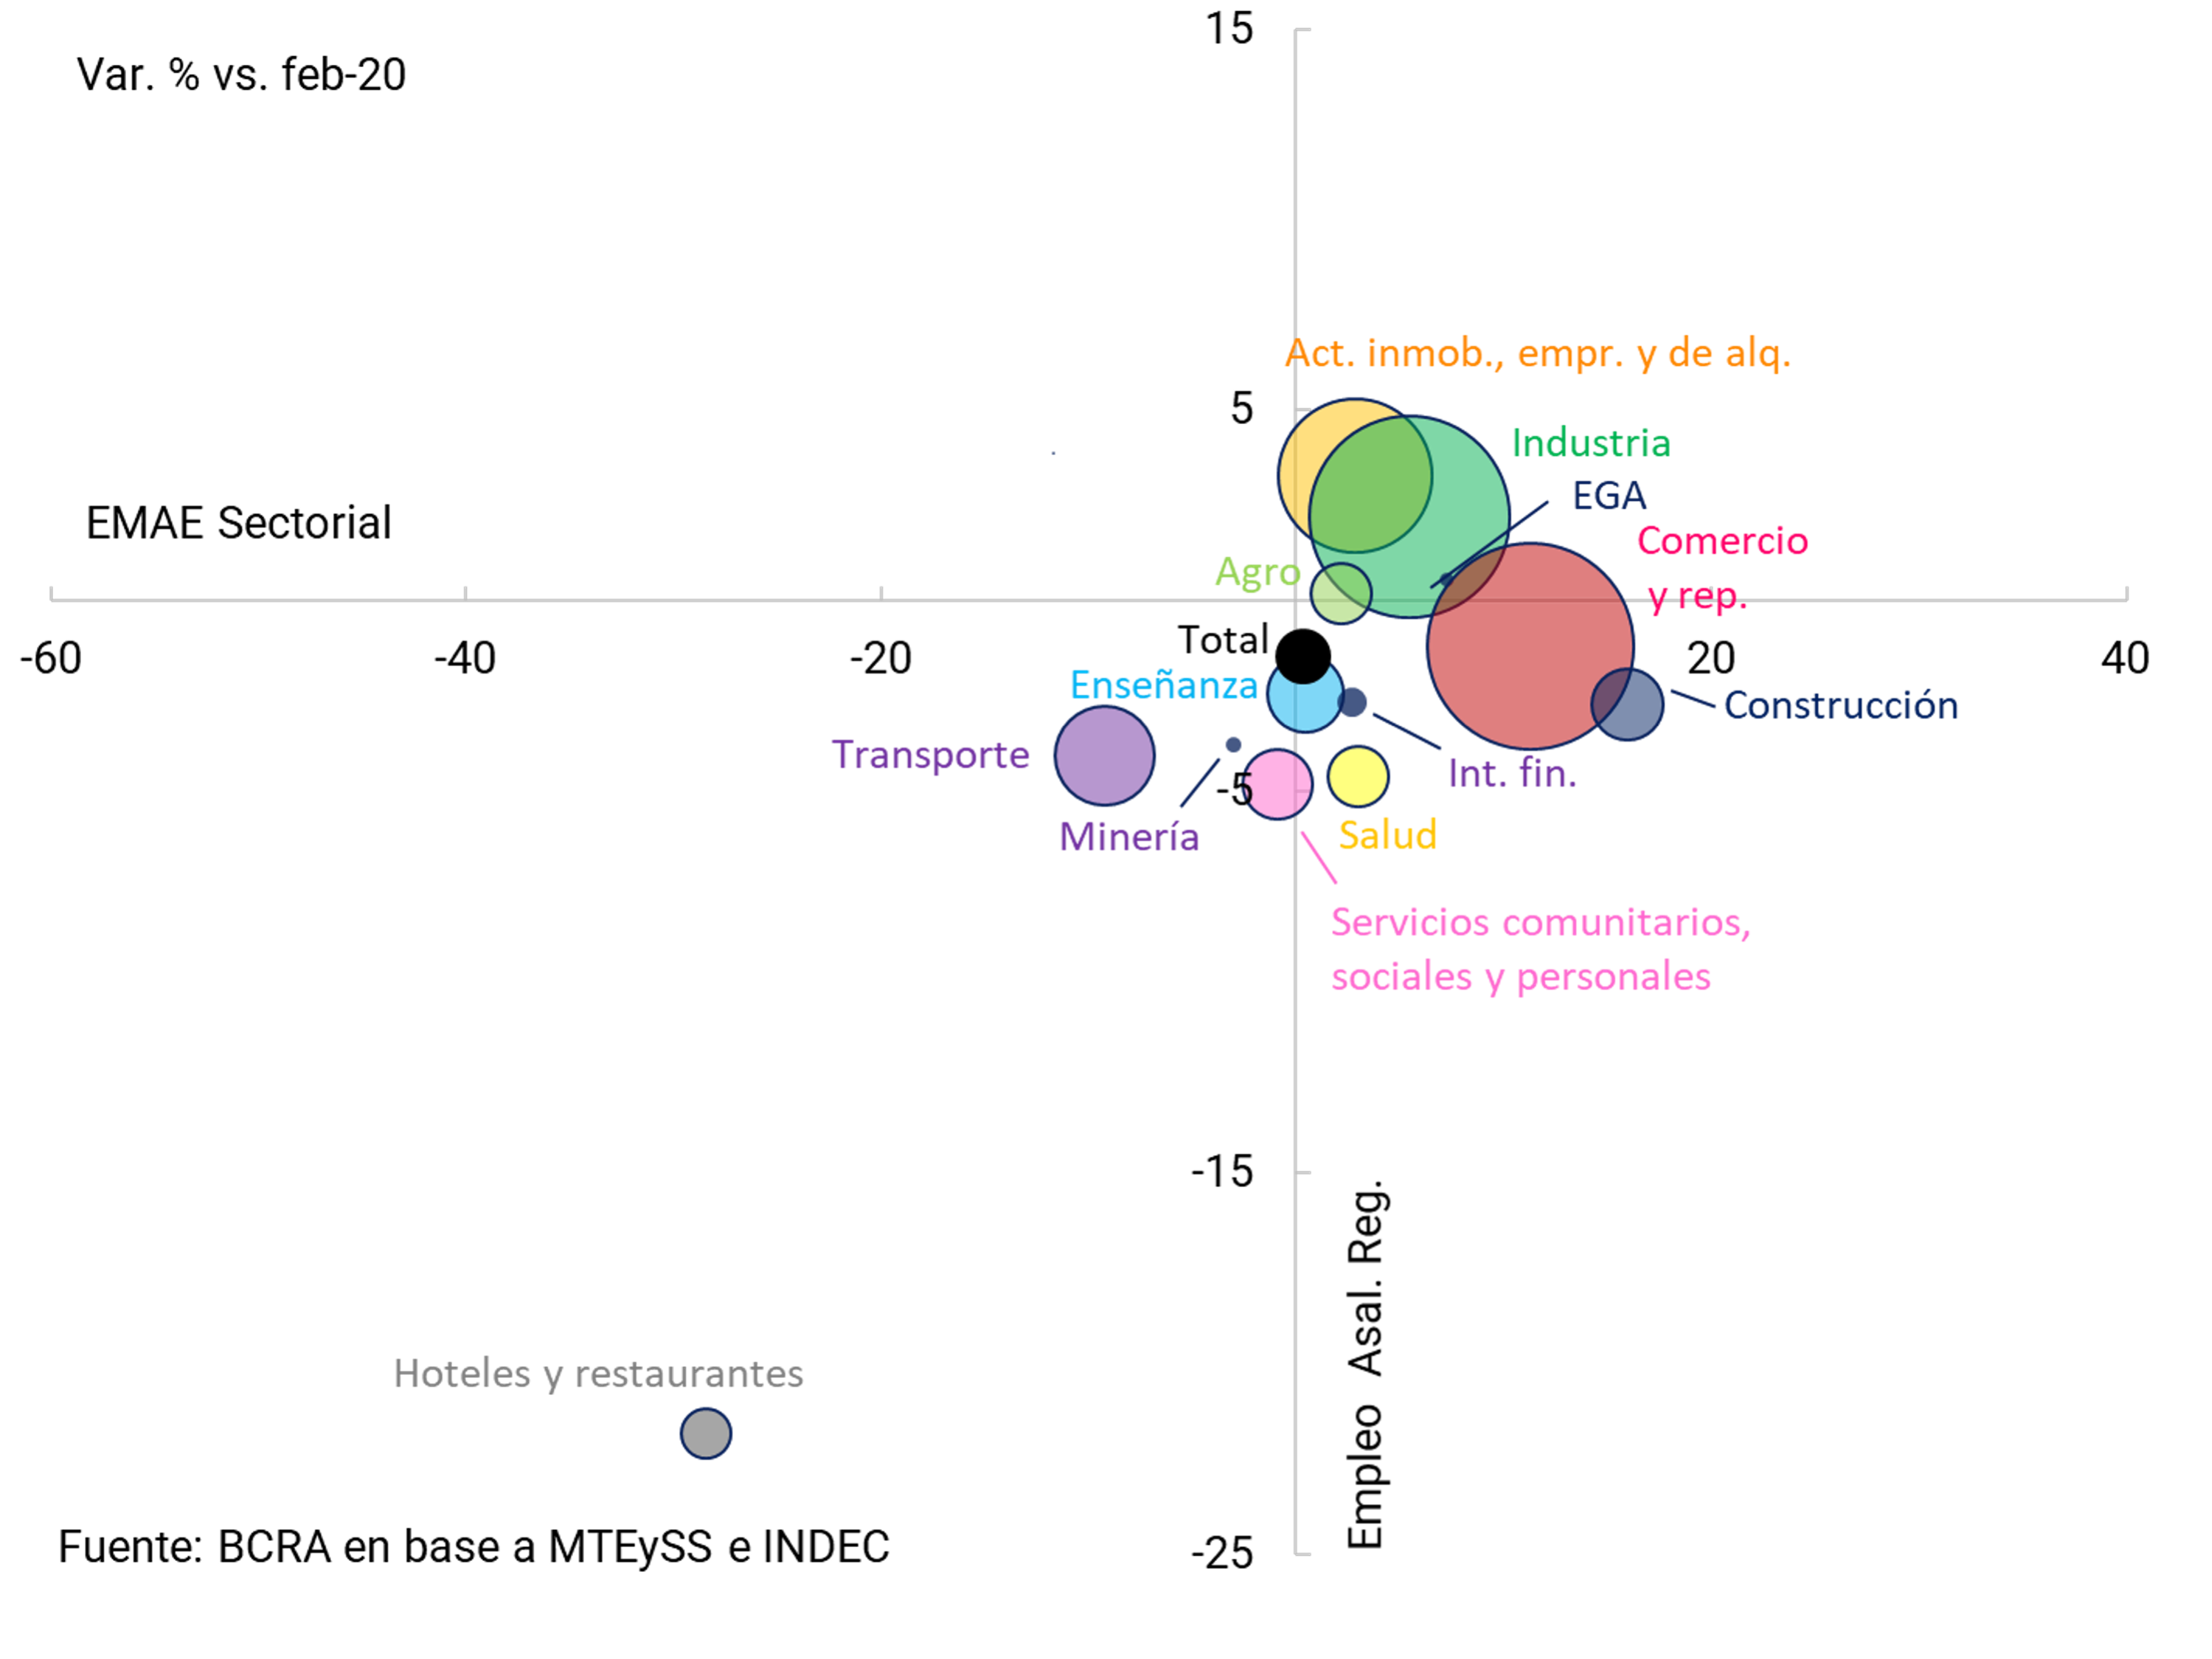
By way of synthesis, the following graph shows the seasonally adjusted levels of activity of the different productive sectors at the worst moment of the COVID-19 crisis (April 2020) and the latest available data (August 2021), always in relation to the level at which each sector operated at the time prior to the outbreak of the pandemic (February 2020), when a value of 100 was assigned. in order to facilitate comparisons.
In the upper left quadrant are the blocks that have reached or exceeded their pre-pandemic level, led by construction and commerce. These sectors were hit hard by the pandemic in 2020, but recovered quickly and are more than 10% higher than the level observed in February 2020. In the lower left quadrant are the branches with the worst relative performance, with the Hotels and Restaurants segment showing the weakest recovery and still far from its pre-pandemic levels (-28.5% s.e.). The “Other social and community services” sector, which includes, among others, the activity of cinemas, theaters, hairdressers, cultural and sports activities, managed to recover more quickly and operate practically at pre-pandemic levels (-0.9% s.e.).
Other sectors that until August 2021 were unable to recompose the level of activity they had at the time prior to the start of the COVID-19 crisis are Fishing (-11.7% s.e.), Transport and communications (-9.2% s.e.) and Mining (-3% s.e.). Financial intermediation was the only sector of activity that continued to increase during the pandemic, unlike in previous recessions, this time driven by an active credit policy of the BCRA and the National Government (see Figure 3.5).
The health situation allowed the implementation of new flexibilizations starting in the third quarter, with gradual reductions in capacity —up to zero in some cases—, enabling group travel, opening of land, air and foreign tourism borders without quota, expansion of capacity for recreational activities and social events and the return to face-to-face in the Public Administration. These measures began to be reflected in the most recent activity indicators. The reactivation of activities that were severely restricted by the health situation is expected to intensify and drive the growth of activity in the last quarter and throughout the summer period, favoured by measures to boost tourism11.
Figure 3.5 | Sectoral economic activity. Heterogeneous recovery

3.1.3. The labor market would show a gradual and sustained recovery after the slower pace of growth in the second quarter
During the first quarter of 2021, the labour market extended the recovery seen in the previous two quarters. The Employment and Economically Active Population (EAP) rates were slightly below the levels in force in the first quarter of 2020 (-0.6 p.p. and -0.8 p.p. respectively). The open unemployment rate stood at 10.2% and showed a reduction of 0.2 p.p. compared to that of the first quarter of 2020 (see Figure 3.6).
Figure 3.6 | Main labour market rates
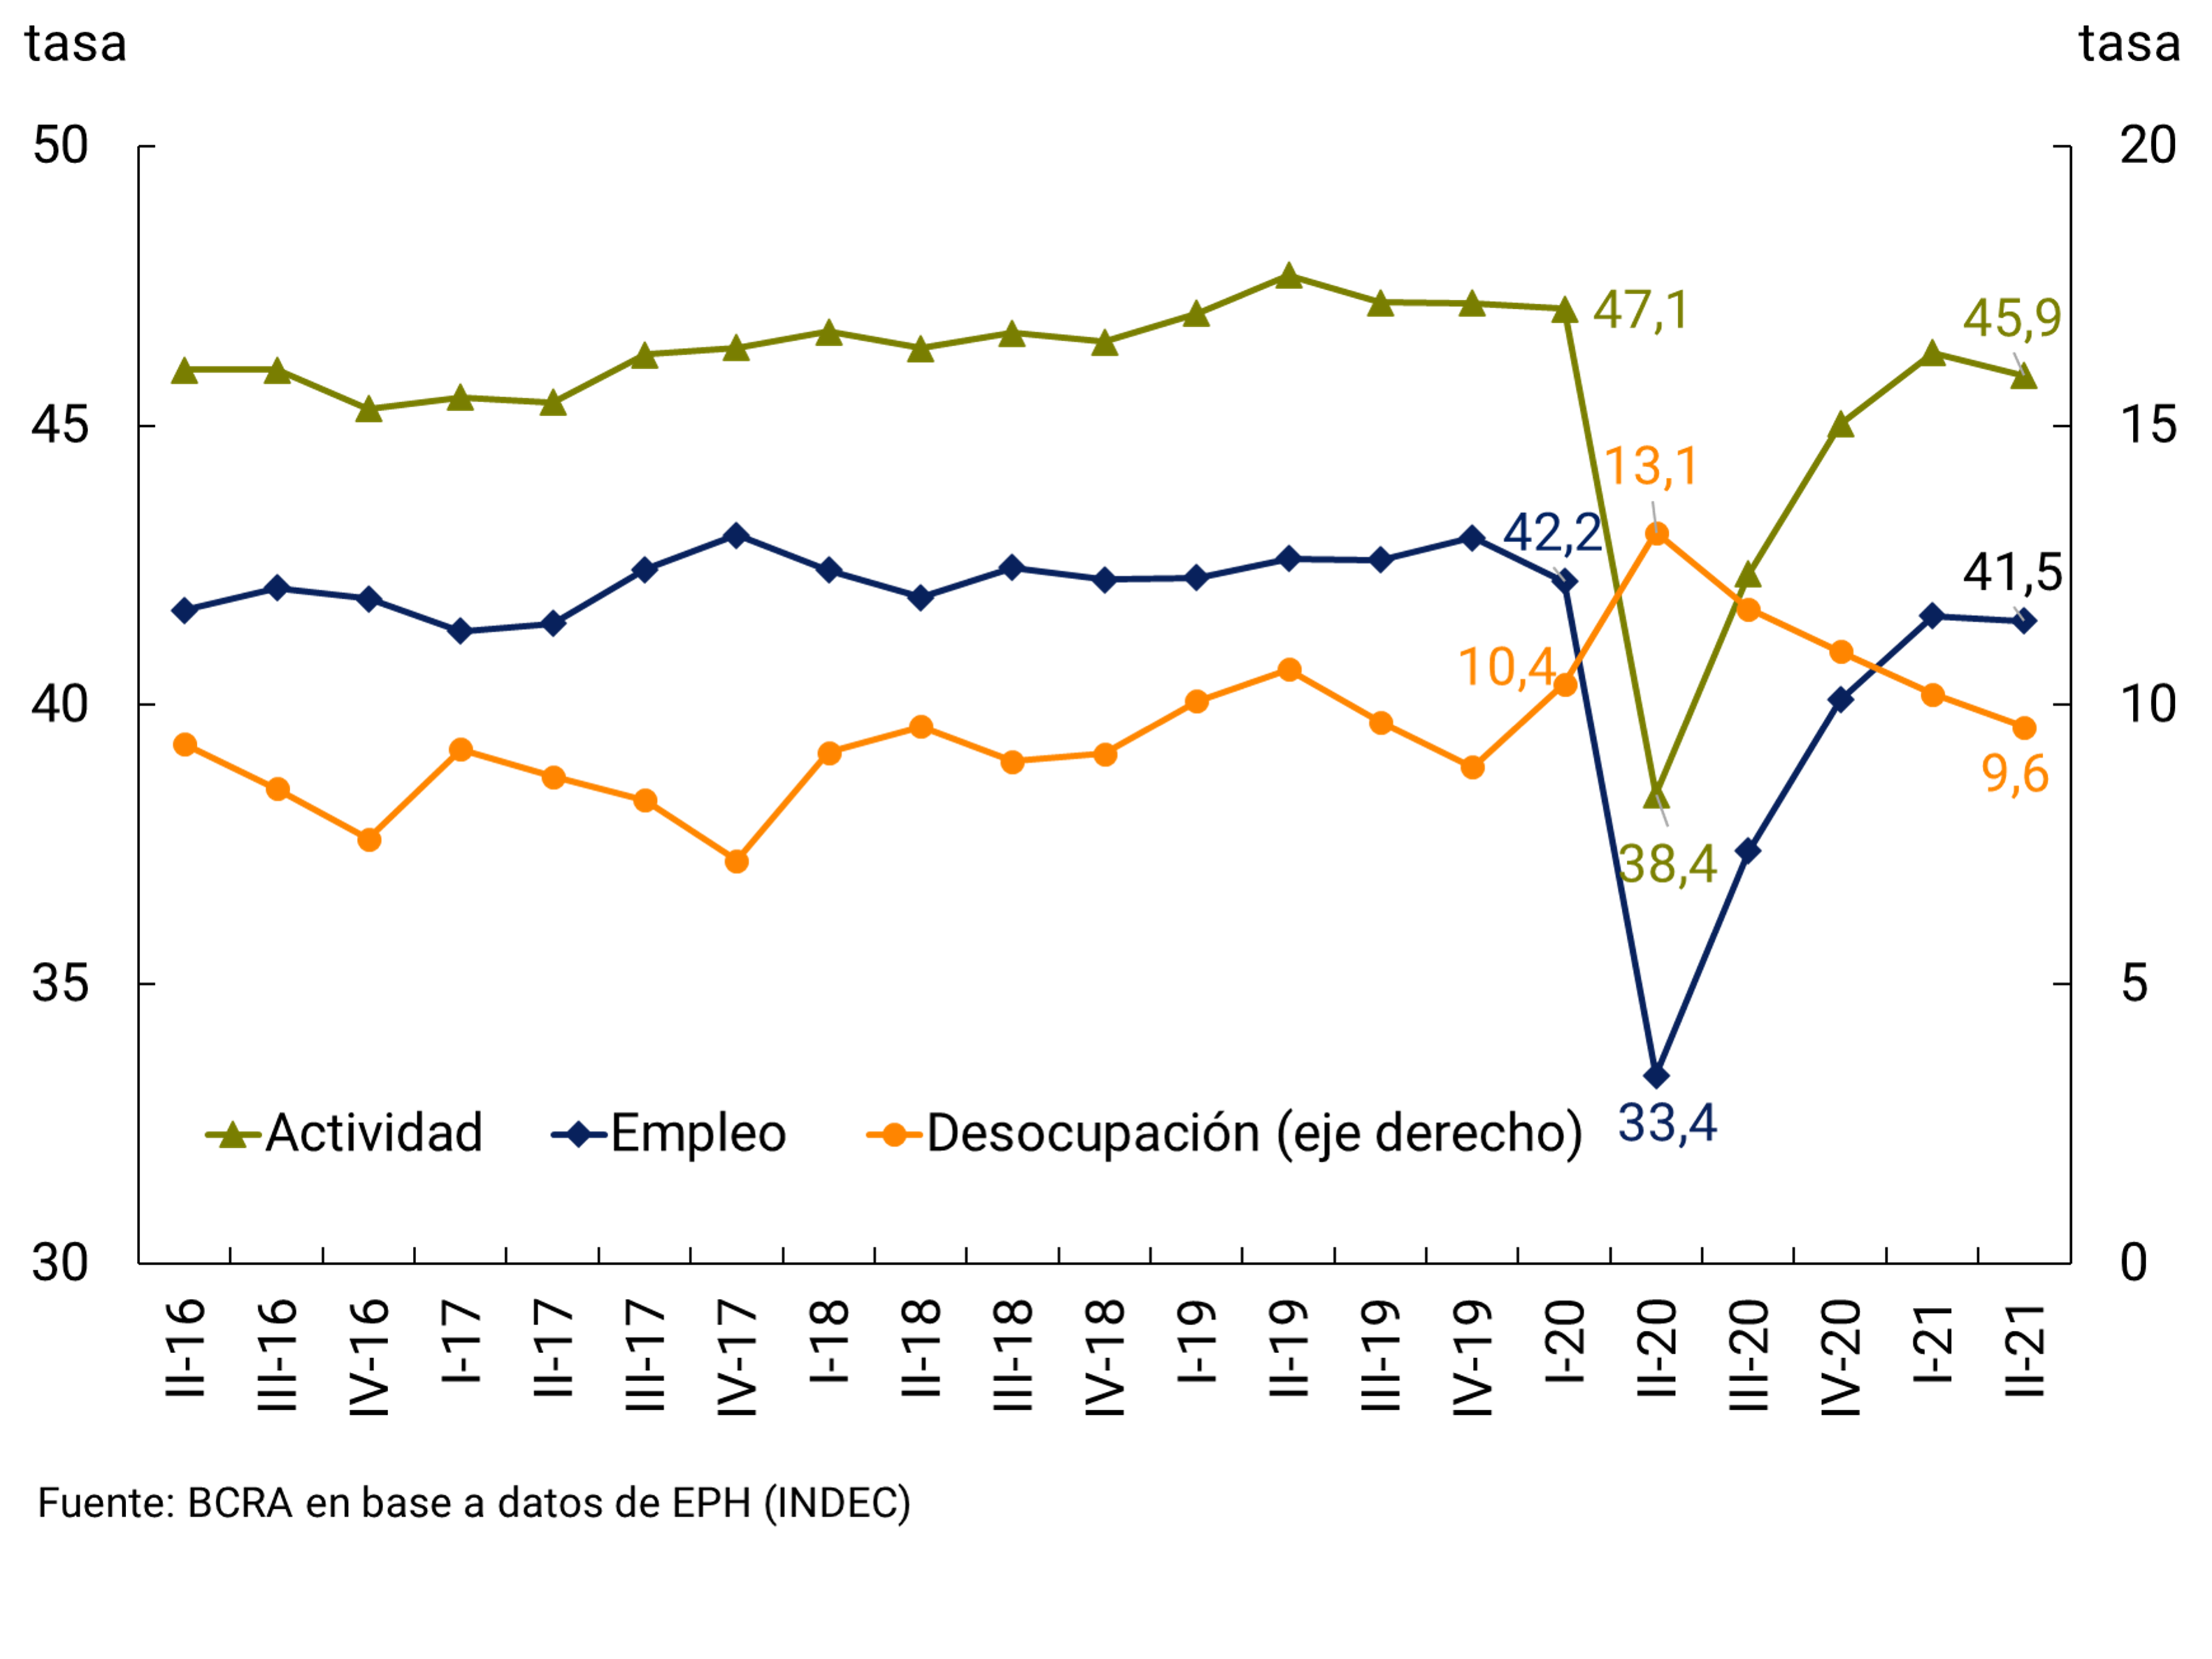
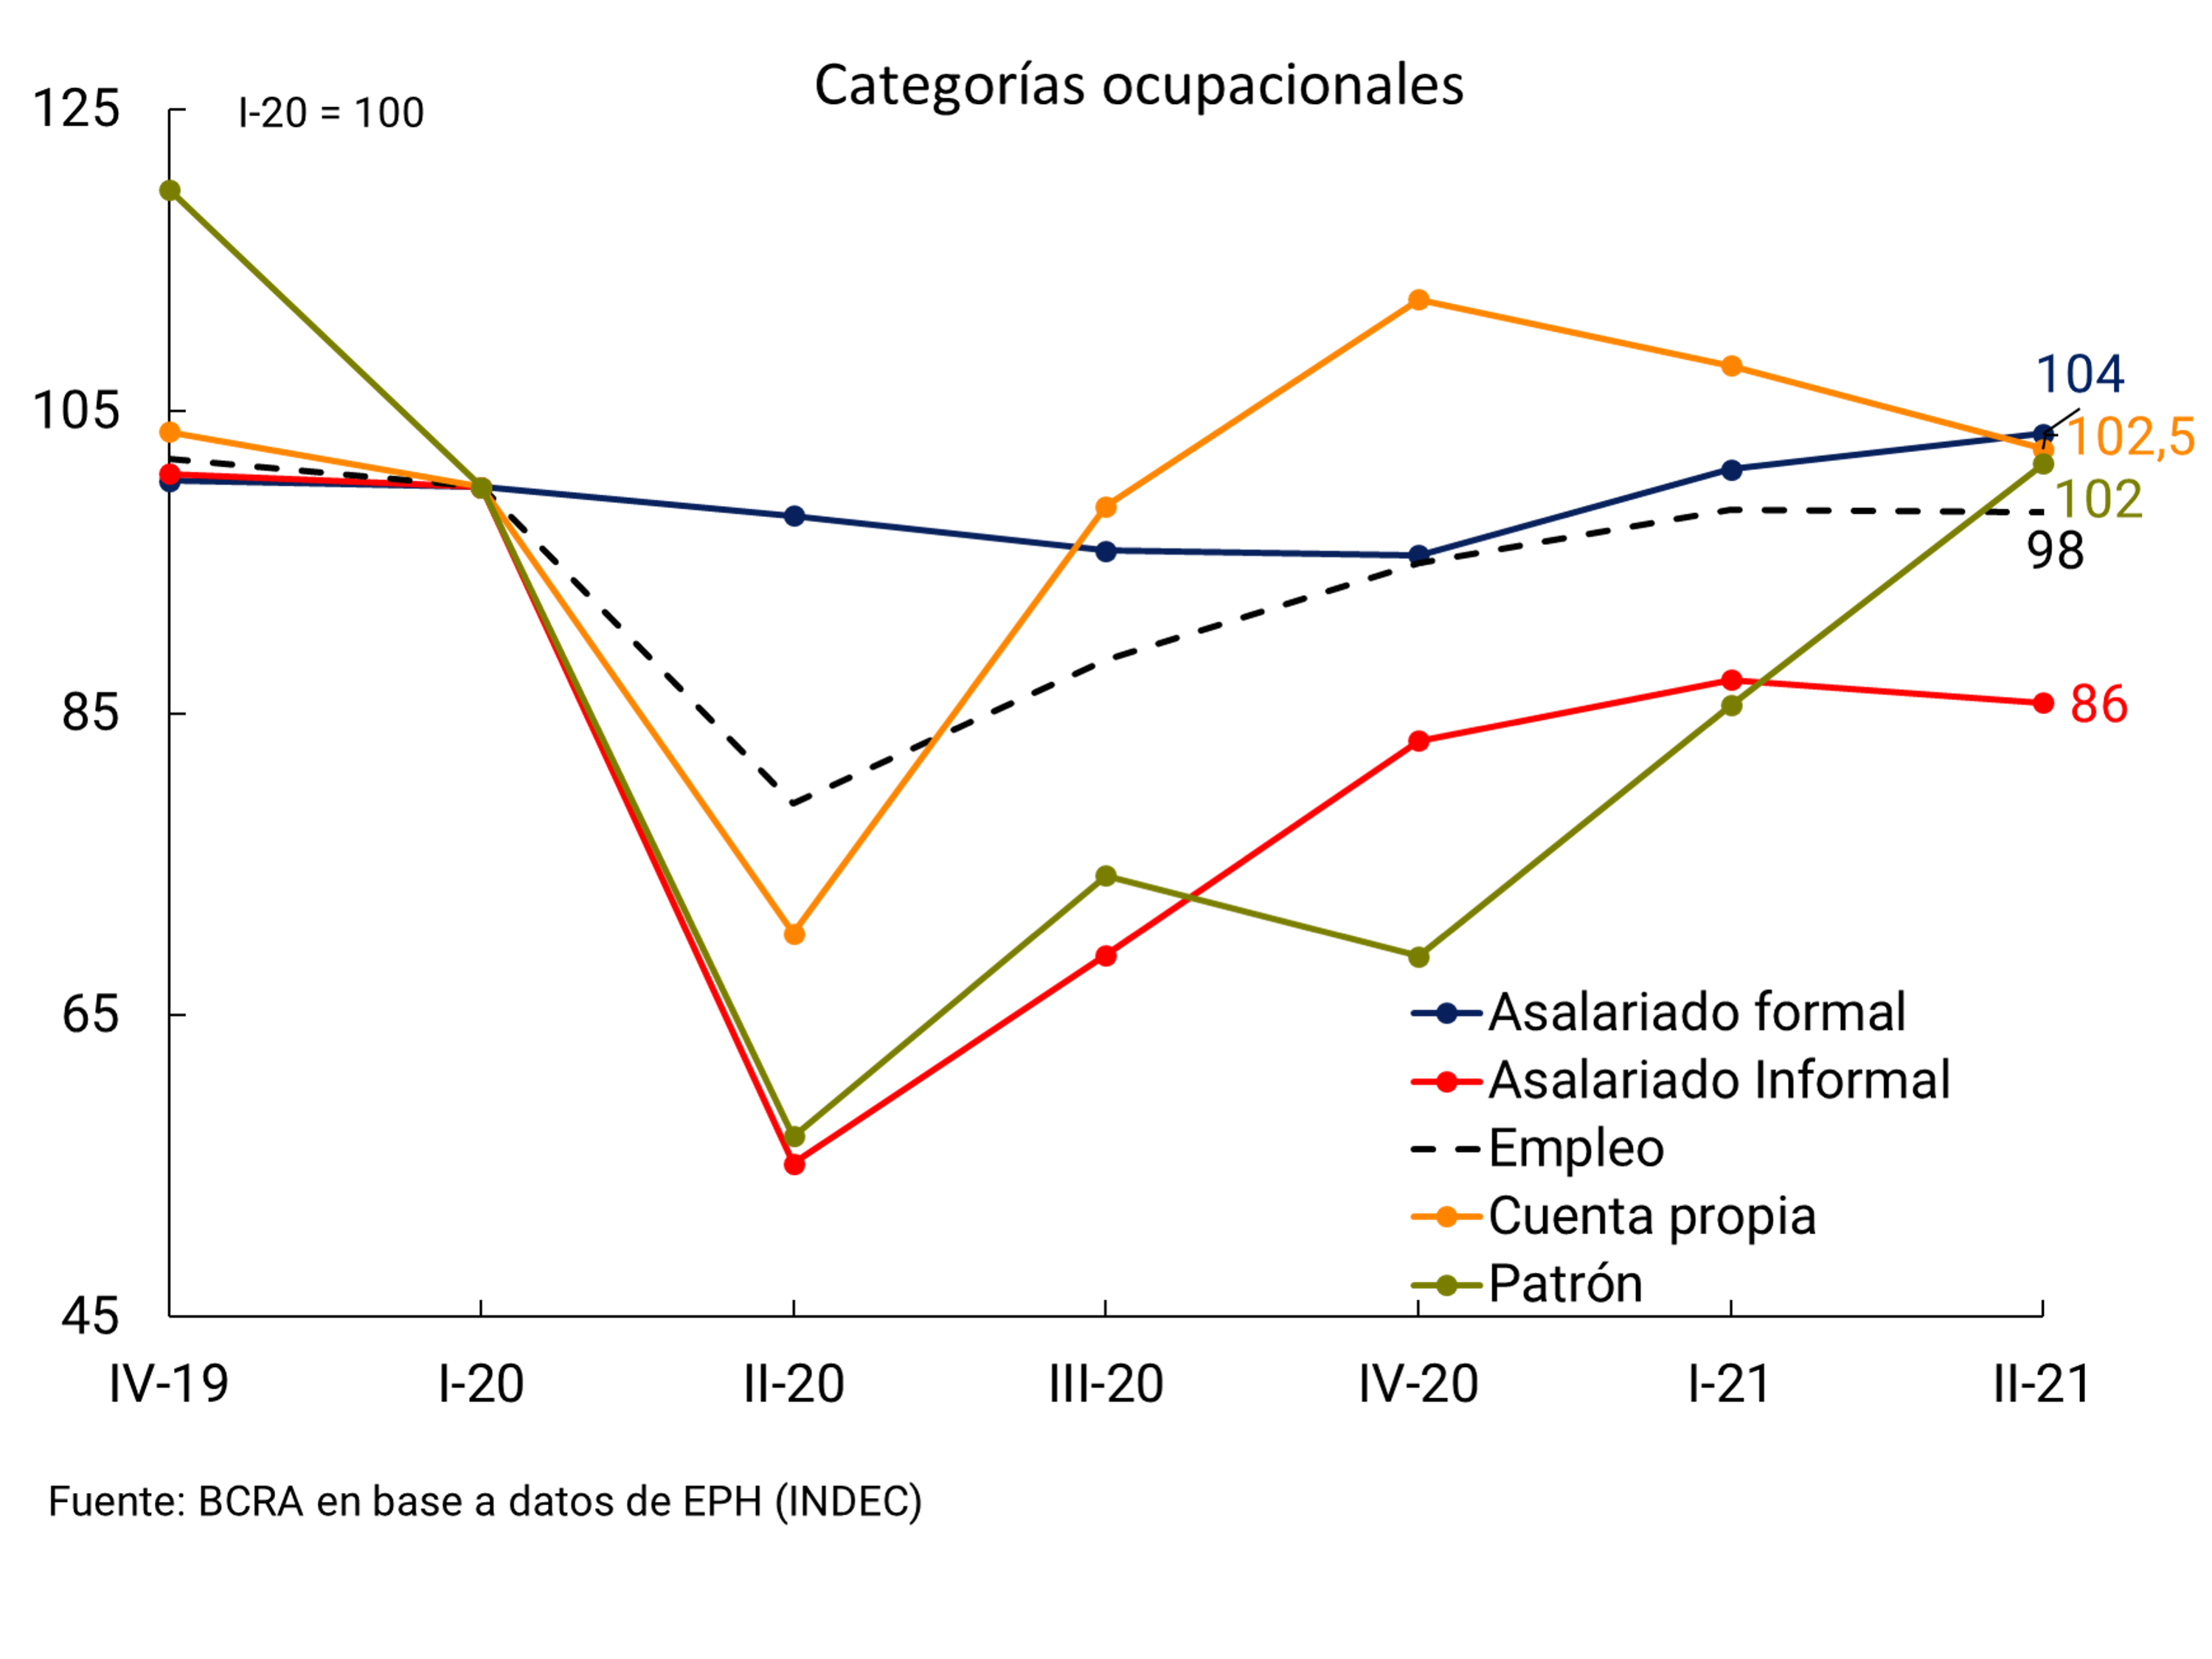
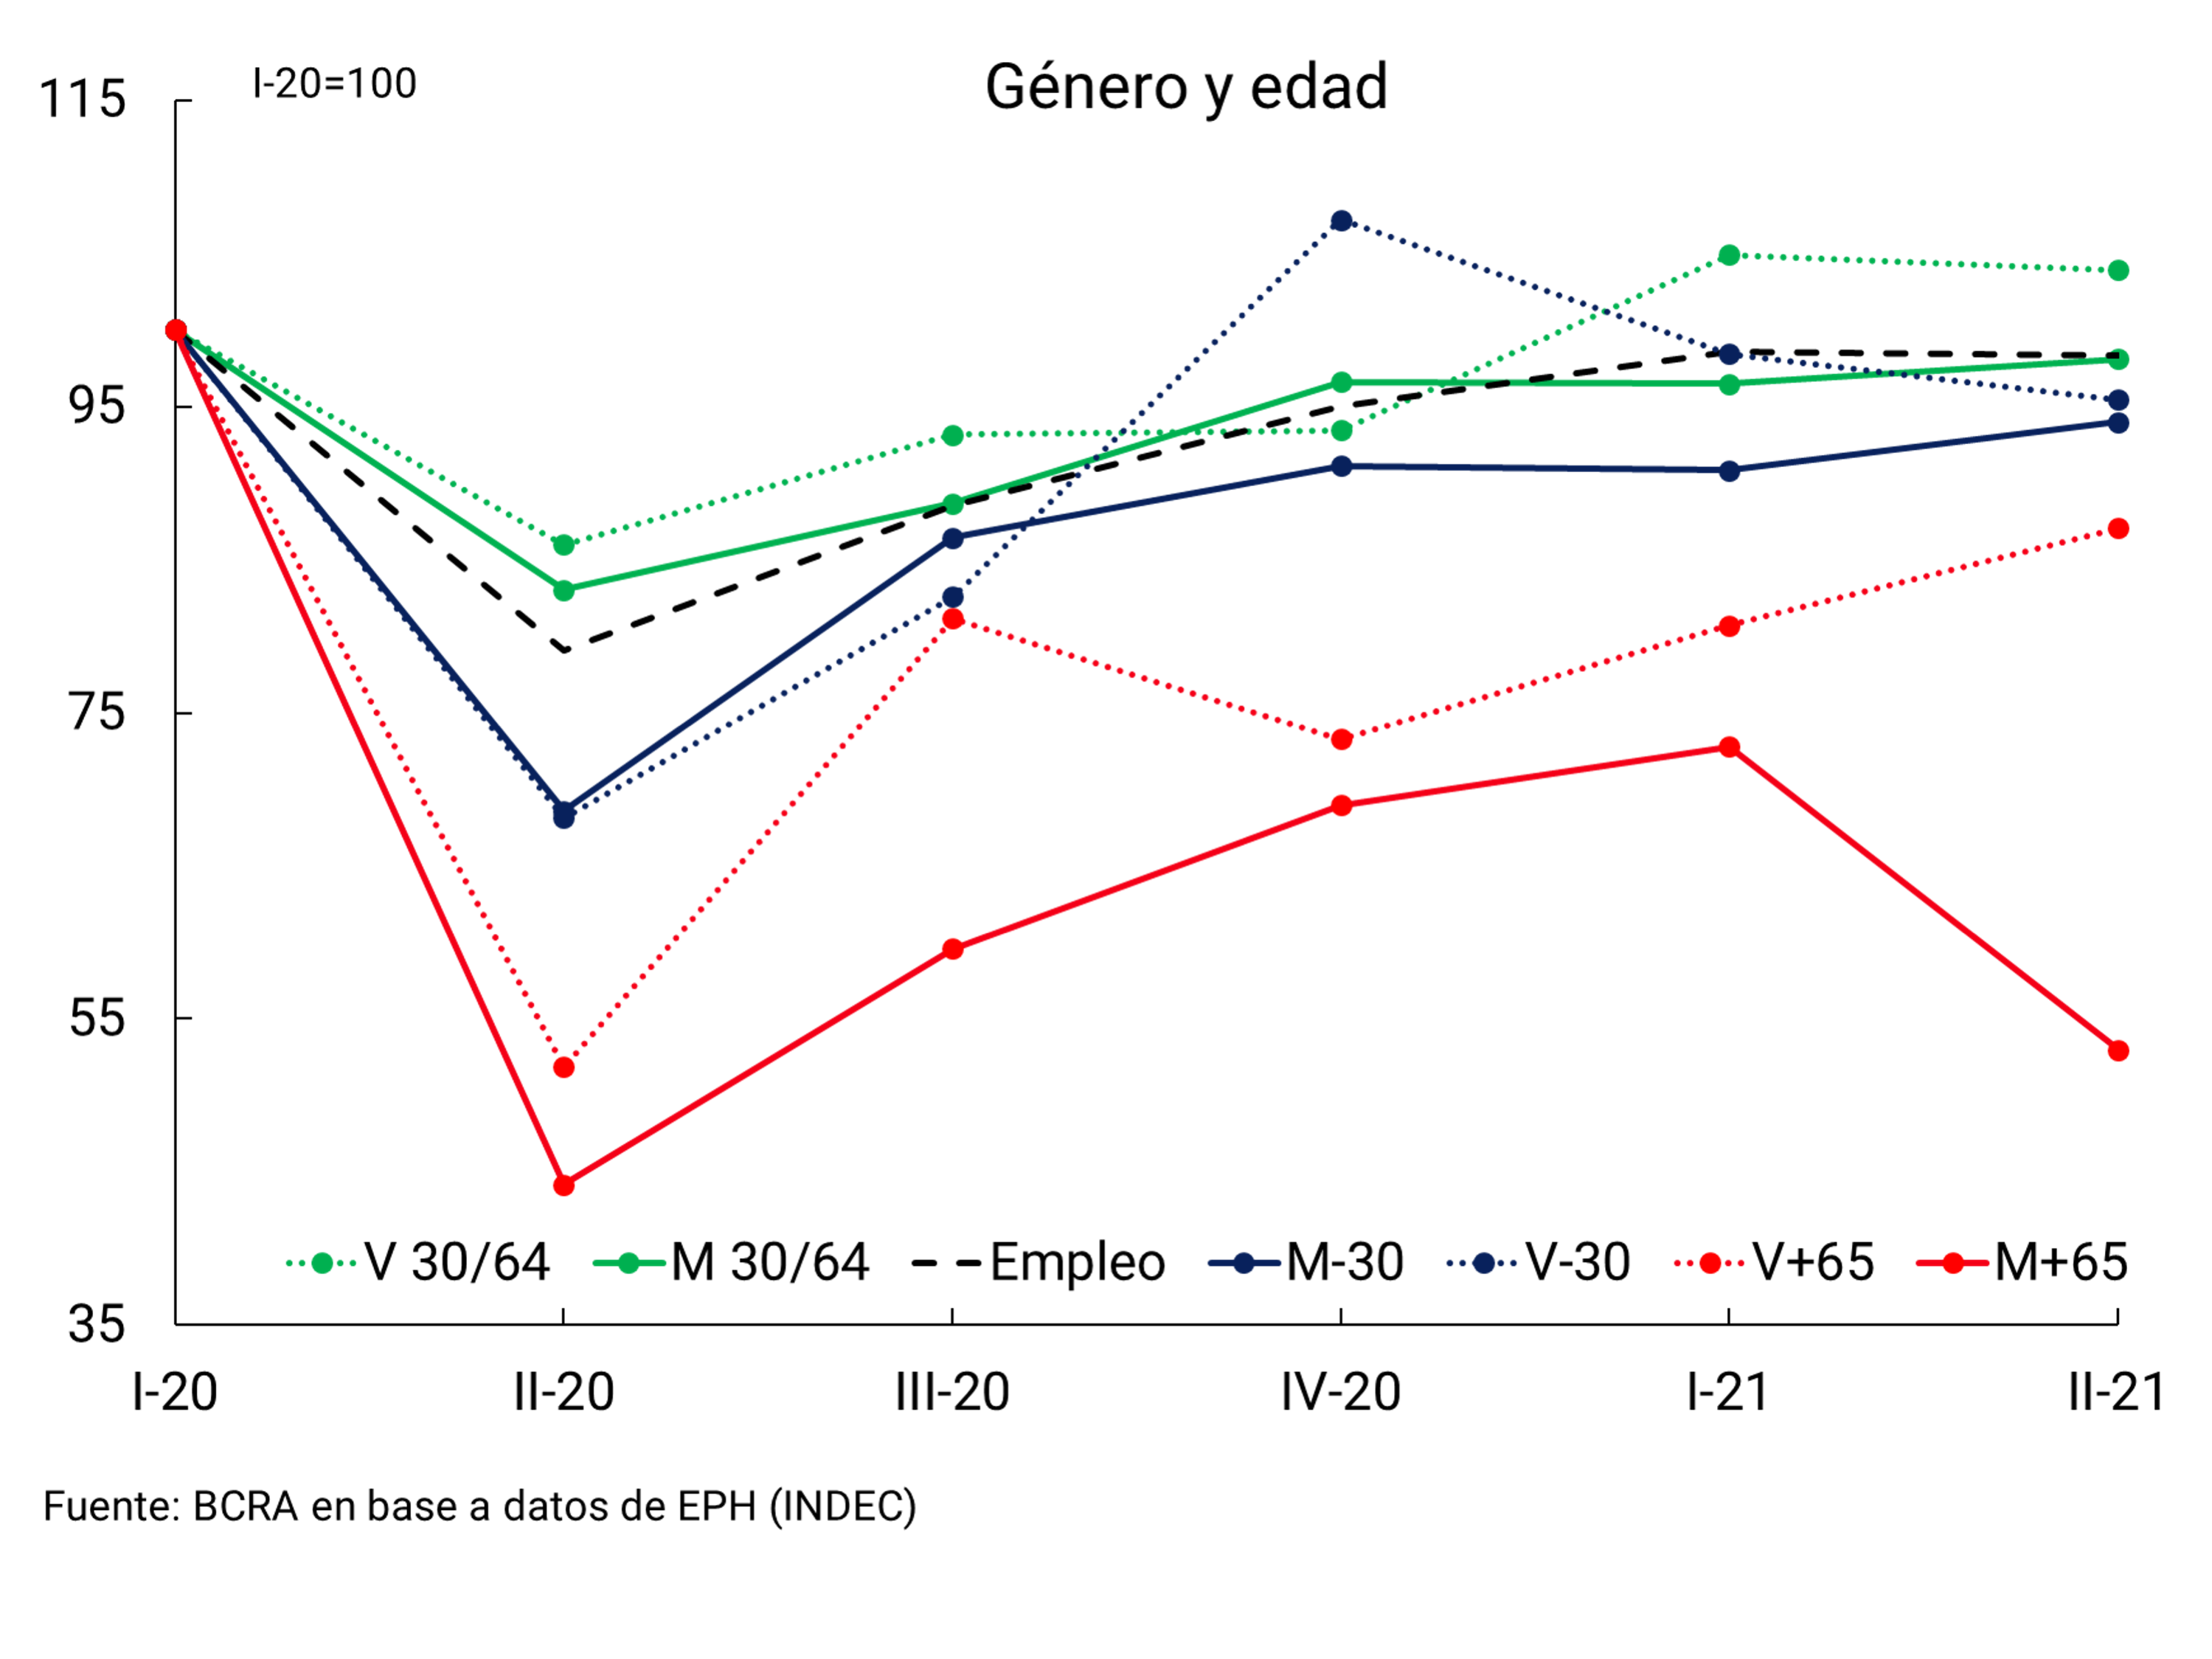
According to data from the Permanent Household Survey (EPH), in II-21, the labor market stopped the pace of recovery verified in the previous three quarters. This phenomenon is associated with the temporary decrease in the level of activity as a result of the restrictions implemented during the second wave of infections. The employment and economically active population (EAP) rates were slightly below the levels in force in the first quarter (45.9% and 41.5%, respectively), while the open unemployment rate stood at 9.6%, showing a reduction compared to the first quarter (10.2%; see Figure 3.6)12. Regarding the evolution of the different occupational categories, it can be observed that during II-21 self-employment fell again (although it is still above the pre-pandemic levels of I-20) and that employers have maintained sustained growth since IV-20. This dynamic could be due to a continuity of the substitution effect between the two categories (self-employed who incorporate employees into their tasks and become employers). On the other hand, the growth of informal wage earners stagnated still far from pre-pandemic levels. Likewise, the most outstanding data was the growth for the second consecutive period of salaried workers with a retirement discount that, with a significant increase, exceeded the I-20 level13. Finally, the most affected age range continued to be those over 65 years of age, and women in general were the ones who lagged behind in terms of employment recovery (see Figure 3.7).
Figure 3.7 | Employment rates by category, sex and age
Occupational categories
Gender and age
With data as of August for registered employment, the pace of expansion during the third quarter would maintain the dynamics evidenced since April. According to the Ministry of Labor, Employment and Social Security (MTEySS), total registered employment maintained the positive trend that began at the beginning of the year, accumulating a rise of 0.6% between June and August. Thus, this indicator showed an improvement of 0.4% s.e. compared to February 2020, the level prior to the outbreak of the pandemic (see Figure 3.8).
Figure 3.8 | Total registered employment

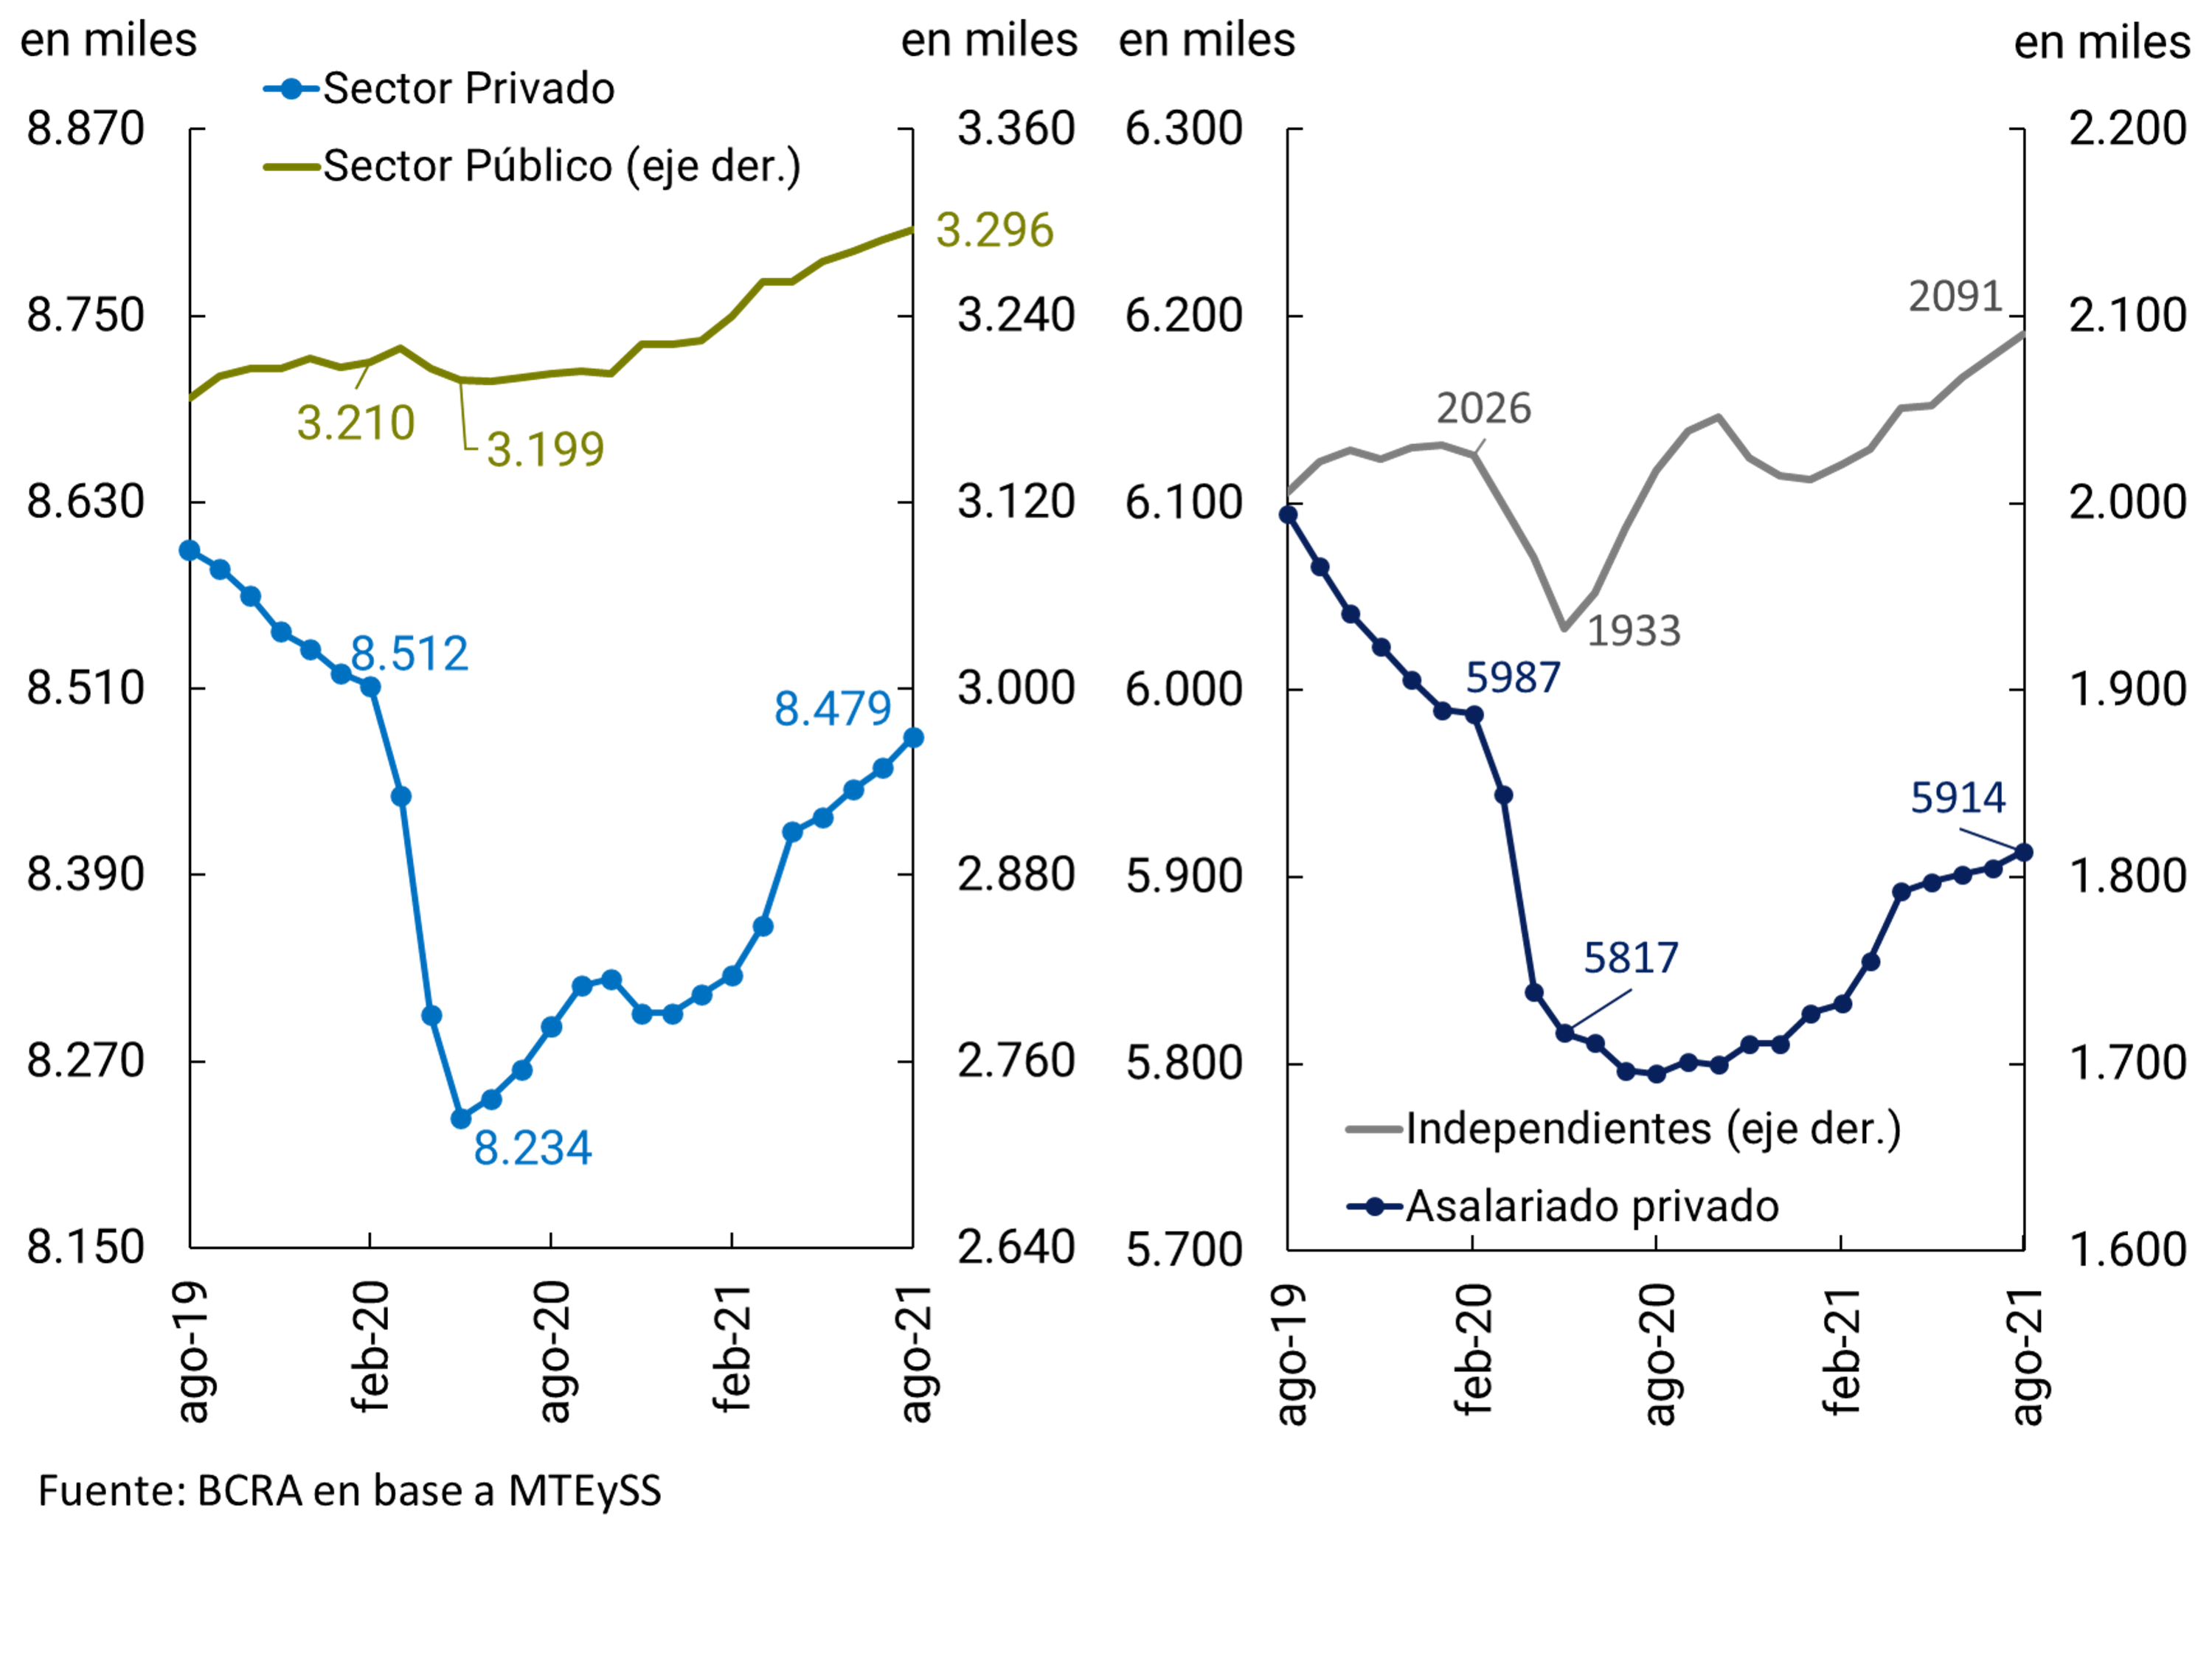
This recovery in total registered employment is related to a positive dynamic of both self-employment and registered public sector wage earners. In particular, since June, the sustained increase in registered self-employment (single-tax and self-employed people) was 1.9% s.e. (38.2 thousand people) while that of public wage earners was 0.6% s.e. (21.1 thousand people), maintaining the trend observed since October 2020. For its part, the private salaried sector maintained the pace of growth, accumulating 0.3% s.e. (16.4 thousand people) for the same period without yet reaching pre-pandemic levels (-1.2% s.e. vs. Feb-20; see Figure 3.9).
Figure 3.9 | Public, private, private salaried and self-employed employment
The behavior of private salaried employment between June and August allows us to distinguish at the sectoral level a greater dynamism in branches such as Construction (3.7% s.e.), Fishing (1.5% s.e.) and Mining (1.4% s.e.). On the other hand, the most affected sectors in terms of employment are Social and Health Services (-0.5% s.e.) and Transport (-0.4% s.e.). Compared to pre-pandemic levels, there are some sectors lagging behind, both in terms of activity and employment (taking both data as of Aug-21), such as Hotels and restaurants, Community, social and personal services and Transport, which retained a significant margin for recovery, supported by the favourable conditions generated by the easing of restrictions in the context of a significant improvement in the health situation and the measures to stimulate tourism (see Figure 3.10).
Figure 3.10 | Private registered salaried employment and activity by sector up to August 2021
Seasonally adjusted data
The Labor Indicators Survey (EIL) as of September 2021 showed a positive trend in net hiring expectations, in addition to the sustained drop in suspensions and the stability of the dismissal rate. Net expectations for hiring personnel over three months remained in positive territory between July and September, with values that grew from 2.7 p.p. to 5.1 p.p. Suspensions fell to 12.5 per thousand workers, a figure close to pre-pandemic levels. For its part, despite the validity of decree 413/2021, the rate of dismissals remained stable since June.
3.2. Perspectives
After the advances in the vaccination scheme of the population that allowed the epidemiological situation to be controlled, it is expected that all productive sectors will strengthen the process of “normalization” of their levels of activity. During the third quarter, the National Government announced a series of additional measures aimed at favoring those sectors that are lagging behind and families that were left behind in the recovery process, which included credit stimulus policies. Technological innovation, the creation of formal employment, the increase in productive investment and the export capacity of some sectors considered strategic were favored14.
The scenario of “normalized” activity is beginning to be glimpsed progressively, expressed in a favorable evolution of employment and real wages. However, the health risk has not yet disappeared and is associated with an eventual and uncertain impact of the circulation of the Delta variant in the country or of new strains that could emerge globally.
Meanwhile, the prospects for global growth account for an international context that still drives domestic dynamics. The external risks are mainly linked to the recent rise in the international price of oil which, in addition to increasing production costs, in a context of rising inflation expectations in advanced countries, could anticipate the reduction of monetary stimuli in those countries. This situation would generate incentives for capital outflows from emerging countries, slowing down the global recovery, including that of our main trading partners. Also threatening global growth are global problems associated with the resurgence of the Delta variant in some core countries, bottlenecks in supply chains – such as microchips – and a slowdown in activity in China (see Chapter 2. International Context and Section 1 / The rise in international inflation).
The terms of trade would continue to be favorable in historical terms for our exports. Climatic and water factors in the region could generate a decrease in agricultural production, although this effect could be partially offset by eventual increases in the international prices of these products.
Regarding the magnitude of Argentina’s economic recovery, the seasonally adjusted data from the EMAE for August left a high statistical drag of 2.7 p.p. of growth for the third quarter and 8.4 p.p. for 2021. The high-frequency indicators available as of November point to the continuity of the recovery, mainly explained by the performance of services, so the average variation in GDP in 2021 is expected to be close to 9%, leaving a growth floor of 2.5 p.p. for next year. This figure would exceed the growth forecasts of the REM (8.3%), the IMF (7.5%) and also those released on the occasion of the presentation of the 2022 National Budget Bill last September (8%).
4. External Sector
As a result of a high trade balance of goods, the Argentine economy would have sustained the current account surplus during the third quarter of 2021. Exports of goods at current prices were around the all-time high of 2011, driven at the margin by a sharp rise in export volumes. On the other hand, the imported values of goods grew for the fifth consecutive quarter, reflecting the increase in international prices of manufactured goods.
In the foreign exchange market, the evolution of exports and imports of goods, added to the evolution of commercial debt for exports and imports of goods, resulted in a net result for goods of US$2,402 million in the third quarter, decreasing by about US$3,700 million compared to the previous quarter. This prompted the BCRA to sell US$396 million in the foreign exchange market, which, together with the net income of financial debt of the public sector and the BCRA for about US$900 million, brought the level of international reserves to US$42,911 million at the end of the quarter.
From an annual perspective, the year is expected to close with a current account surplus, supported by the goods trade surplus. The main risk factors for the external sector of the Argentine economy going forward are a possible resurgence of the COVID-19 pandemic due to the expansion of new strains, or that the change in the monetary policy bias of most of the world’s central banks leads to a slowdown in the global economy. in addition to the potential impact that a deterioration in international financial conditions could have on the trajectory of commodity prices.
4.1. In the third quarter of 2021, the economy would have sustained the current account surplus
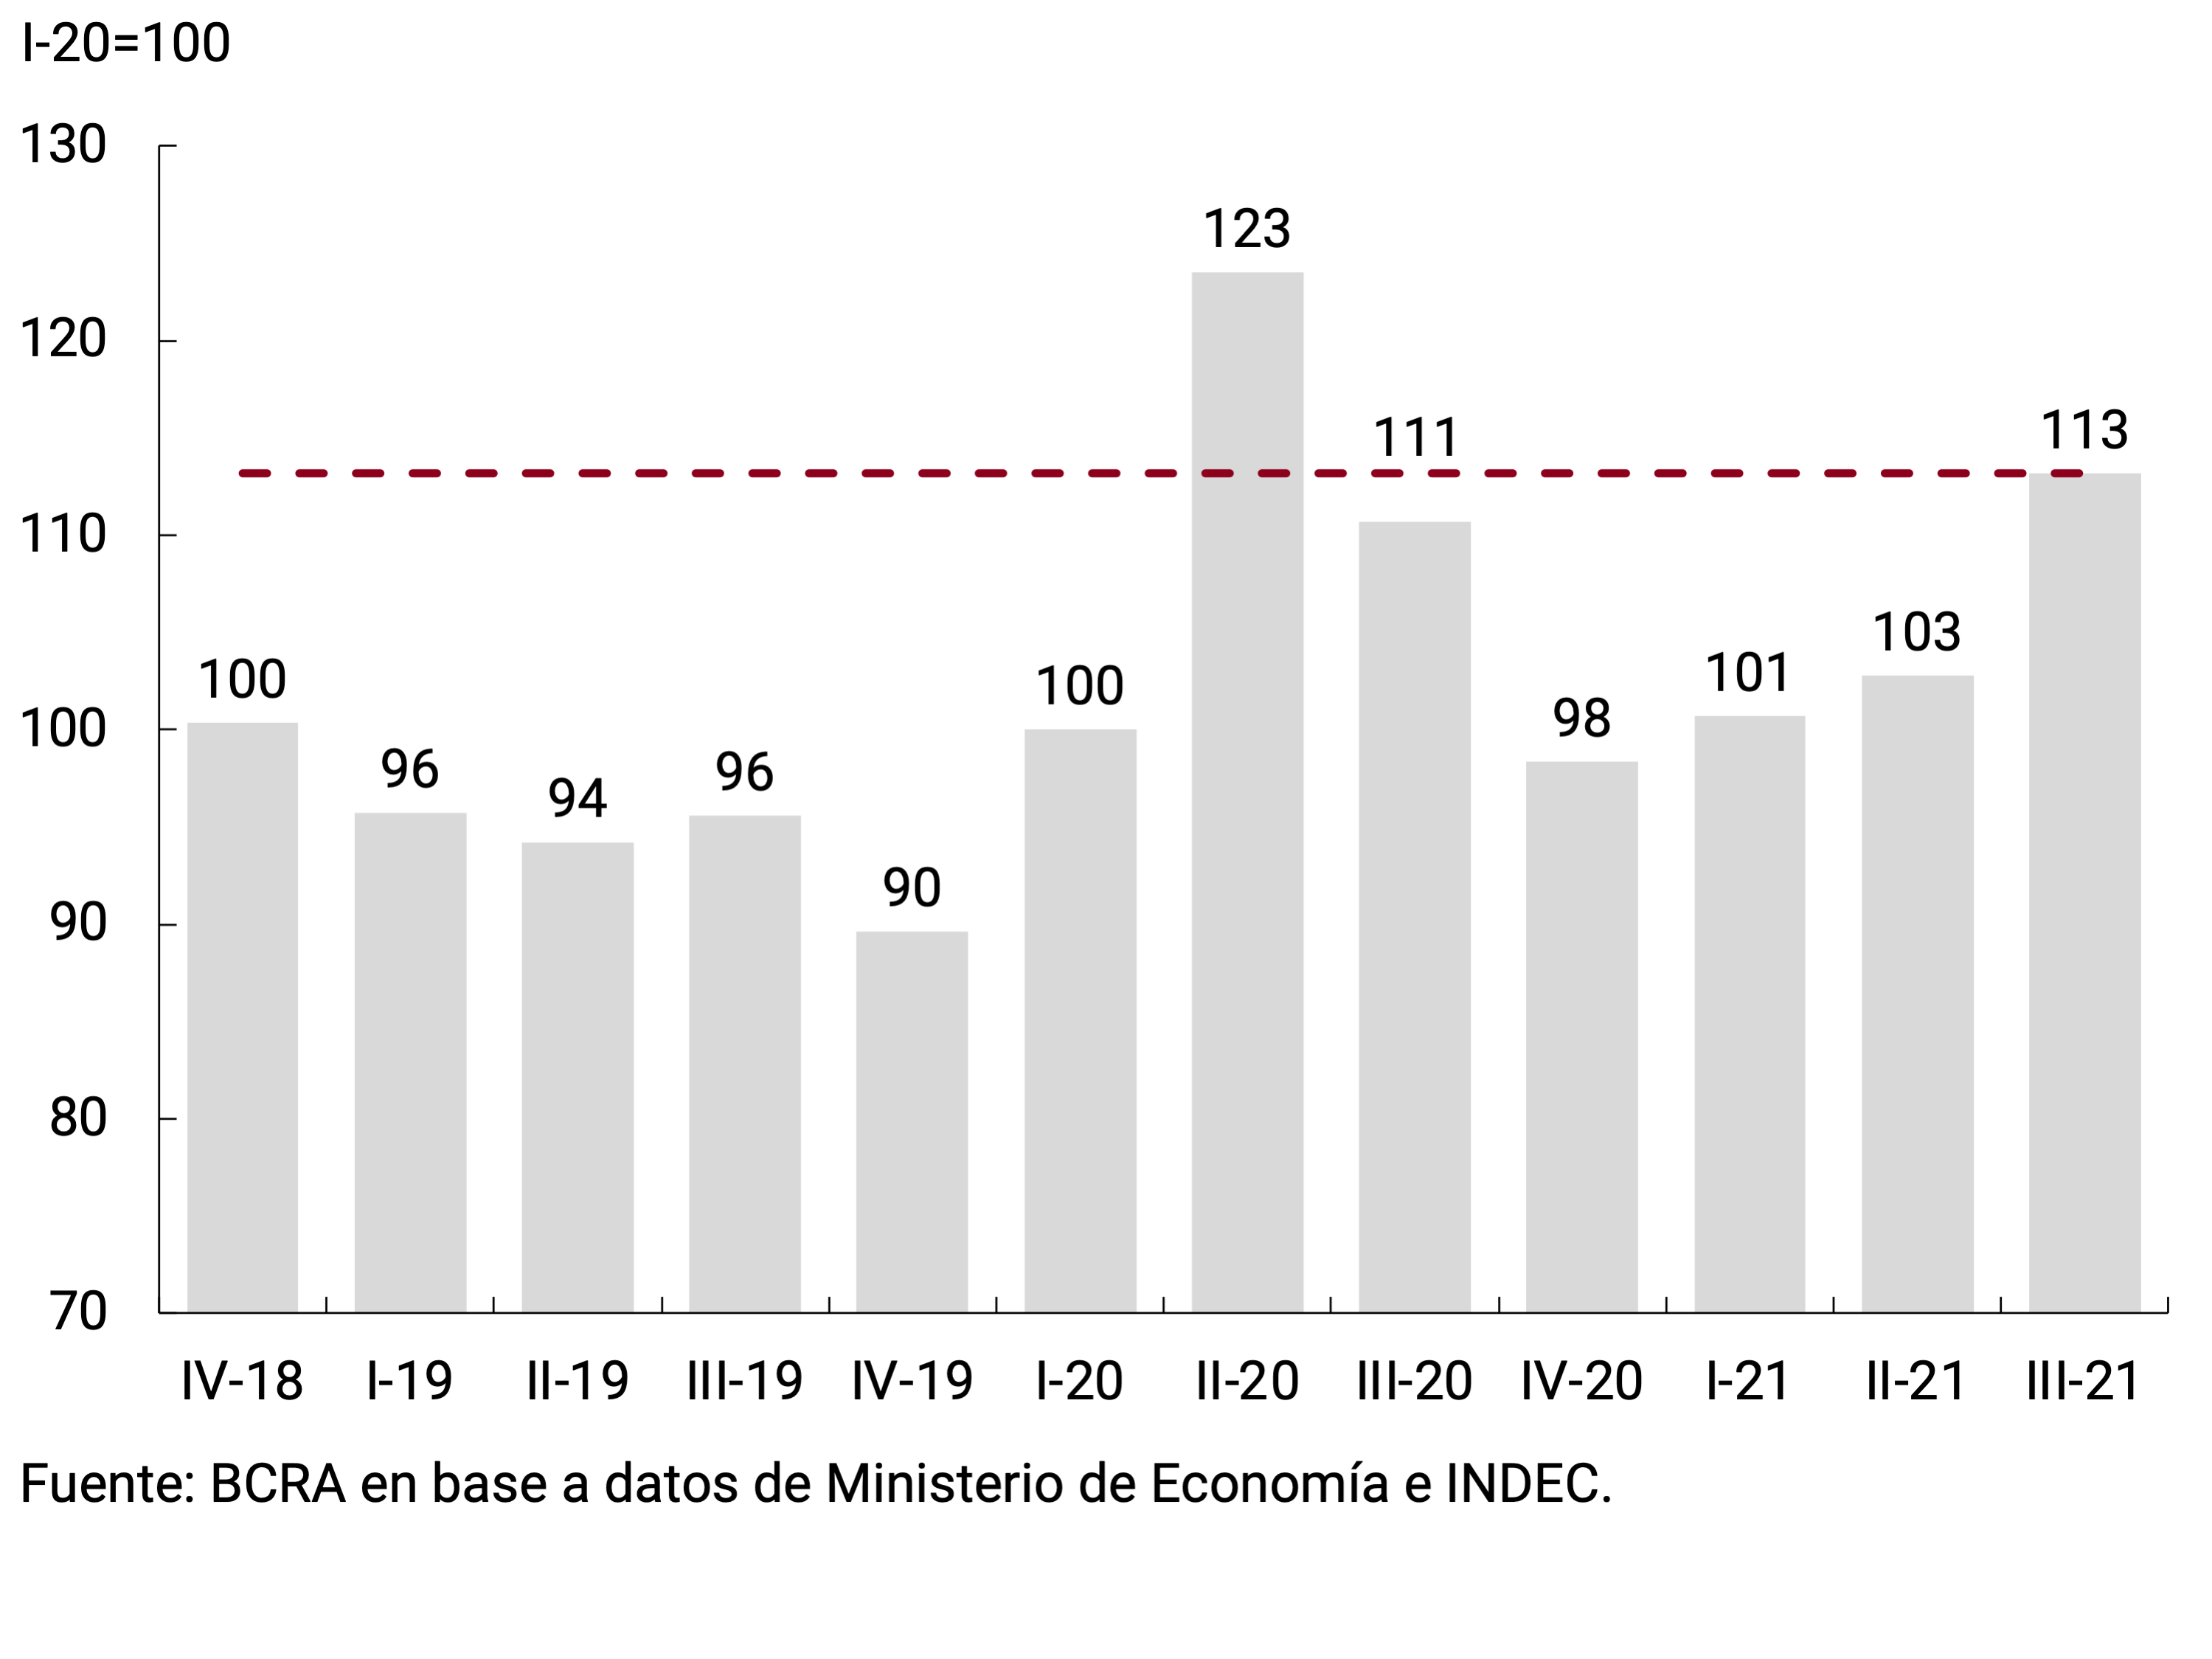
In the second quarter of 2021 (latest official data available) the Argentine economy recorded a current account surplus of US$2,763 million – equivalent to 1.4% of GDP in seasonally adjusted and annualized terms. The improvement in international prices of the main agricultural commodities exported by Argentina was the main factor behind this result.
In the third quarter of 2021, the increase in the quantities exported allowed the trade balance of goods to increase. In this context, the current account is expected to return to a positive balance of around 1.5% of GDP (see Figure 4.1).
Figure 4.1 | Seasonally adjusted current account. Annualized values

In that period, the export values of seasonally adjusted goods reached US$21,461 million (Free on Board (FOB)) at current prices, just US$2 million below the record of the third quarter of 2011 (see Section 3 / Exports of goods ten years after the record). This favorable evolution of exports of goods was mainly due to the performance of the quantities exported, which grew 11% quarter-on-quarter s.e. and exceeded pre-pandemic records for the first time. To a lesser extent, export prices also contributed positively, growing 3% compared to the previous quarter.
Three of the four main export items had increases in exported volumes in the third quarter of the year. There was only a decrease in shipments of Manufactures of Agricultural Origin (MOA; -2% qoq, s.e.), affected by lower meat sales. Fuel exports grew 64% compared to the previous quarter, driven mainly by electricity shipments to Brazil, while those of Primary Products (PP) increased 31% s.e., highlighting corn shipments that set a quarterly record reaching 14.0 million tons. On the other hand, the exported quantities of Manufactures of Industrial Origin (MOI) had a more moderate growth (7% quarterly s.e.), driven by foreign sales of land transport material.
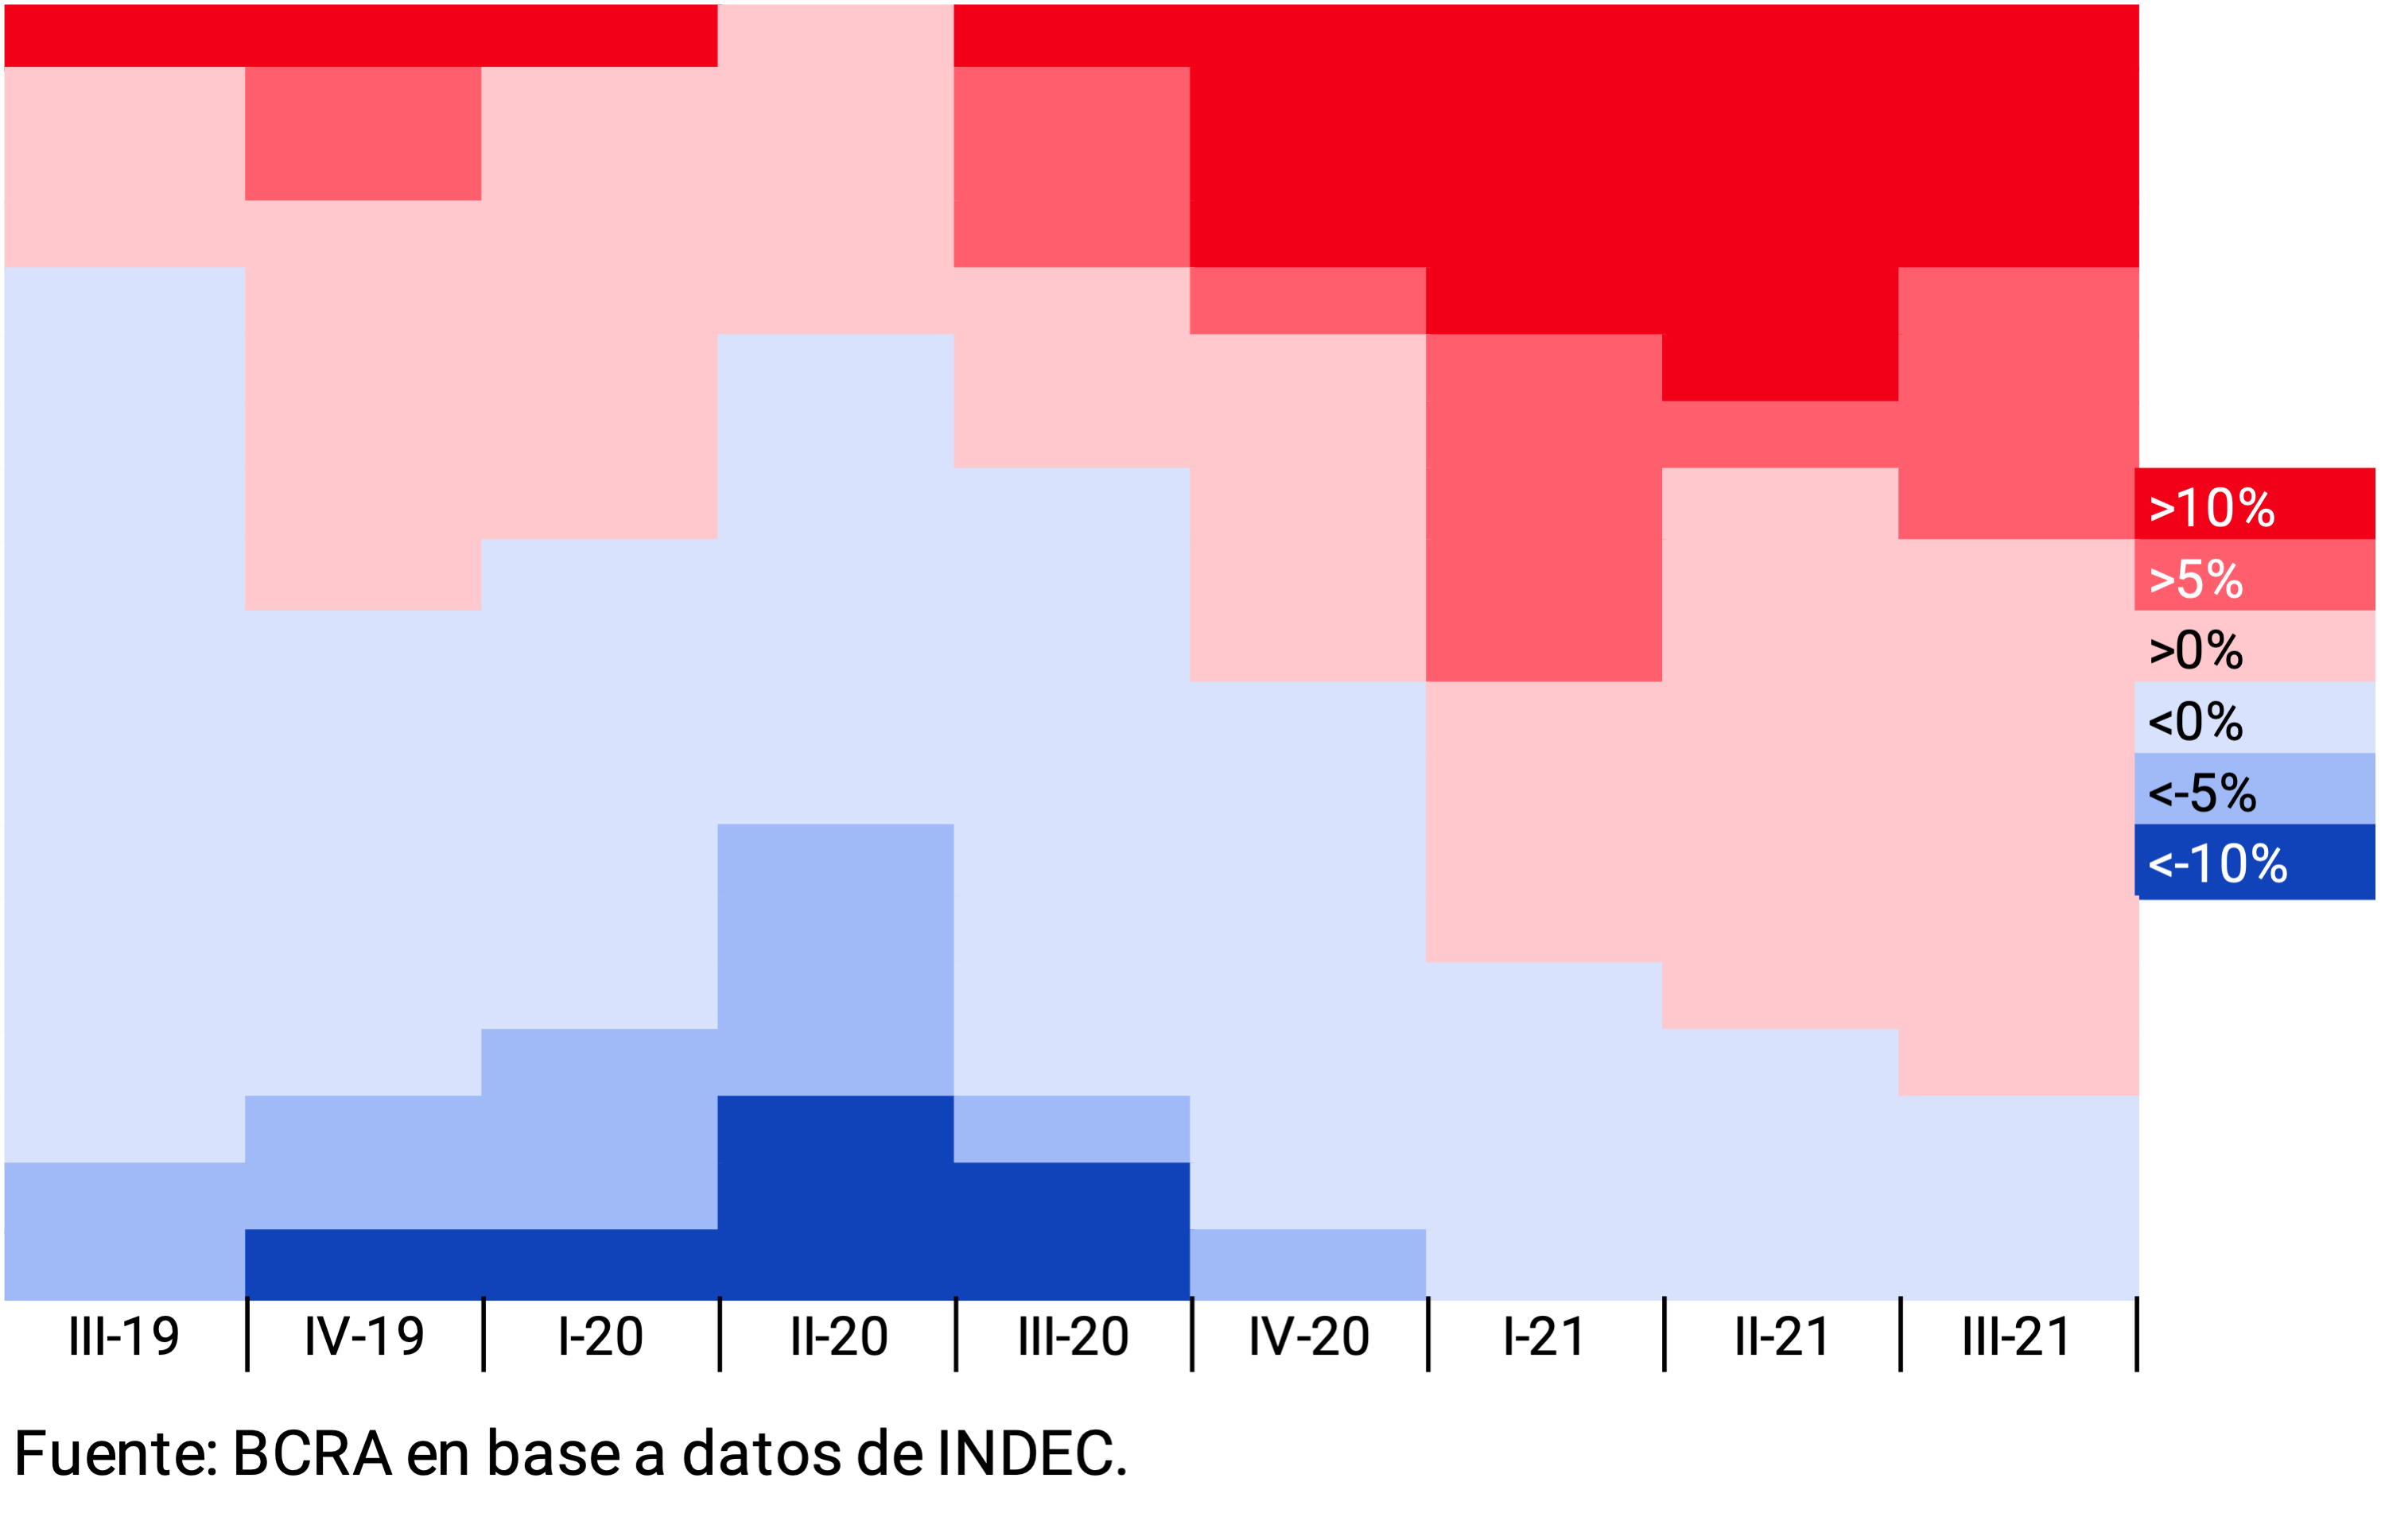
For its part, between July and September 2021, seasonally adjusted imports of goods totaled US$15,994 million (CIF), 51% above the quarterly average recorded in 2020 and 30% higher than the average for 2019. In the case of foreign purchases, it was import prices that explained this new rise (they grew 10% in the quarter), while the volumes purchased showed a slight drop (1% quarter-on-quarter s.e.) and seem to have stagnated since the beginning of the year (see Chart 4.2).
Figure 4.2 | Trade in goods. Seasonally adjusted series

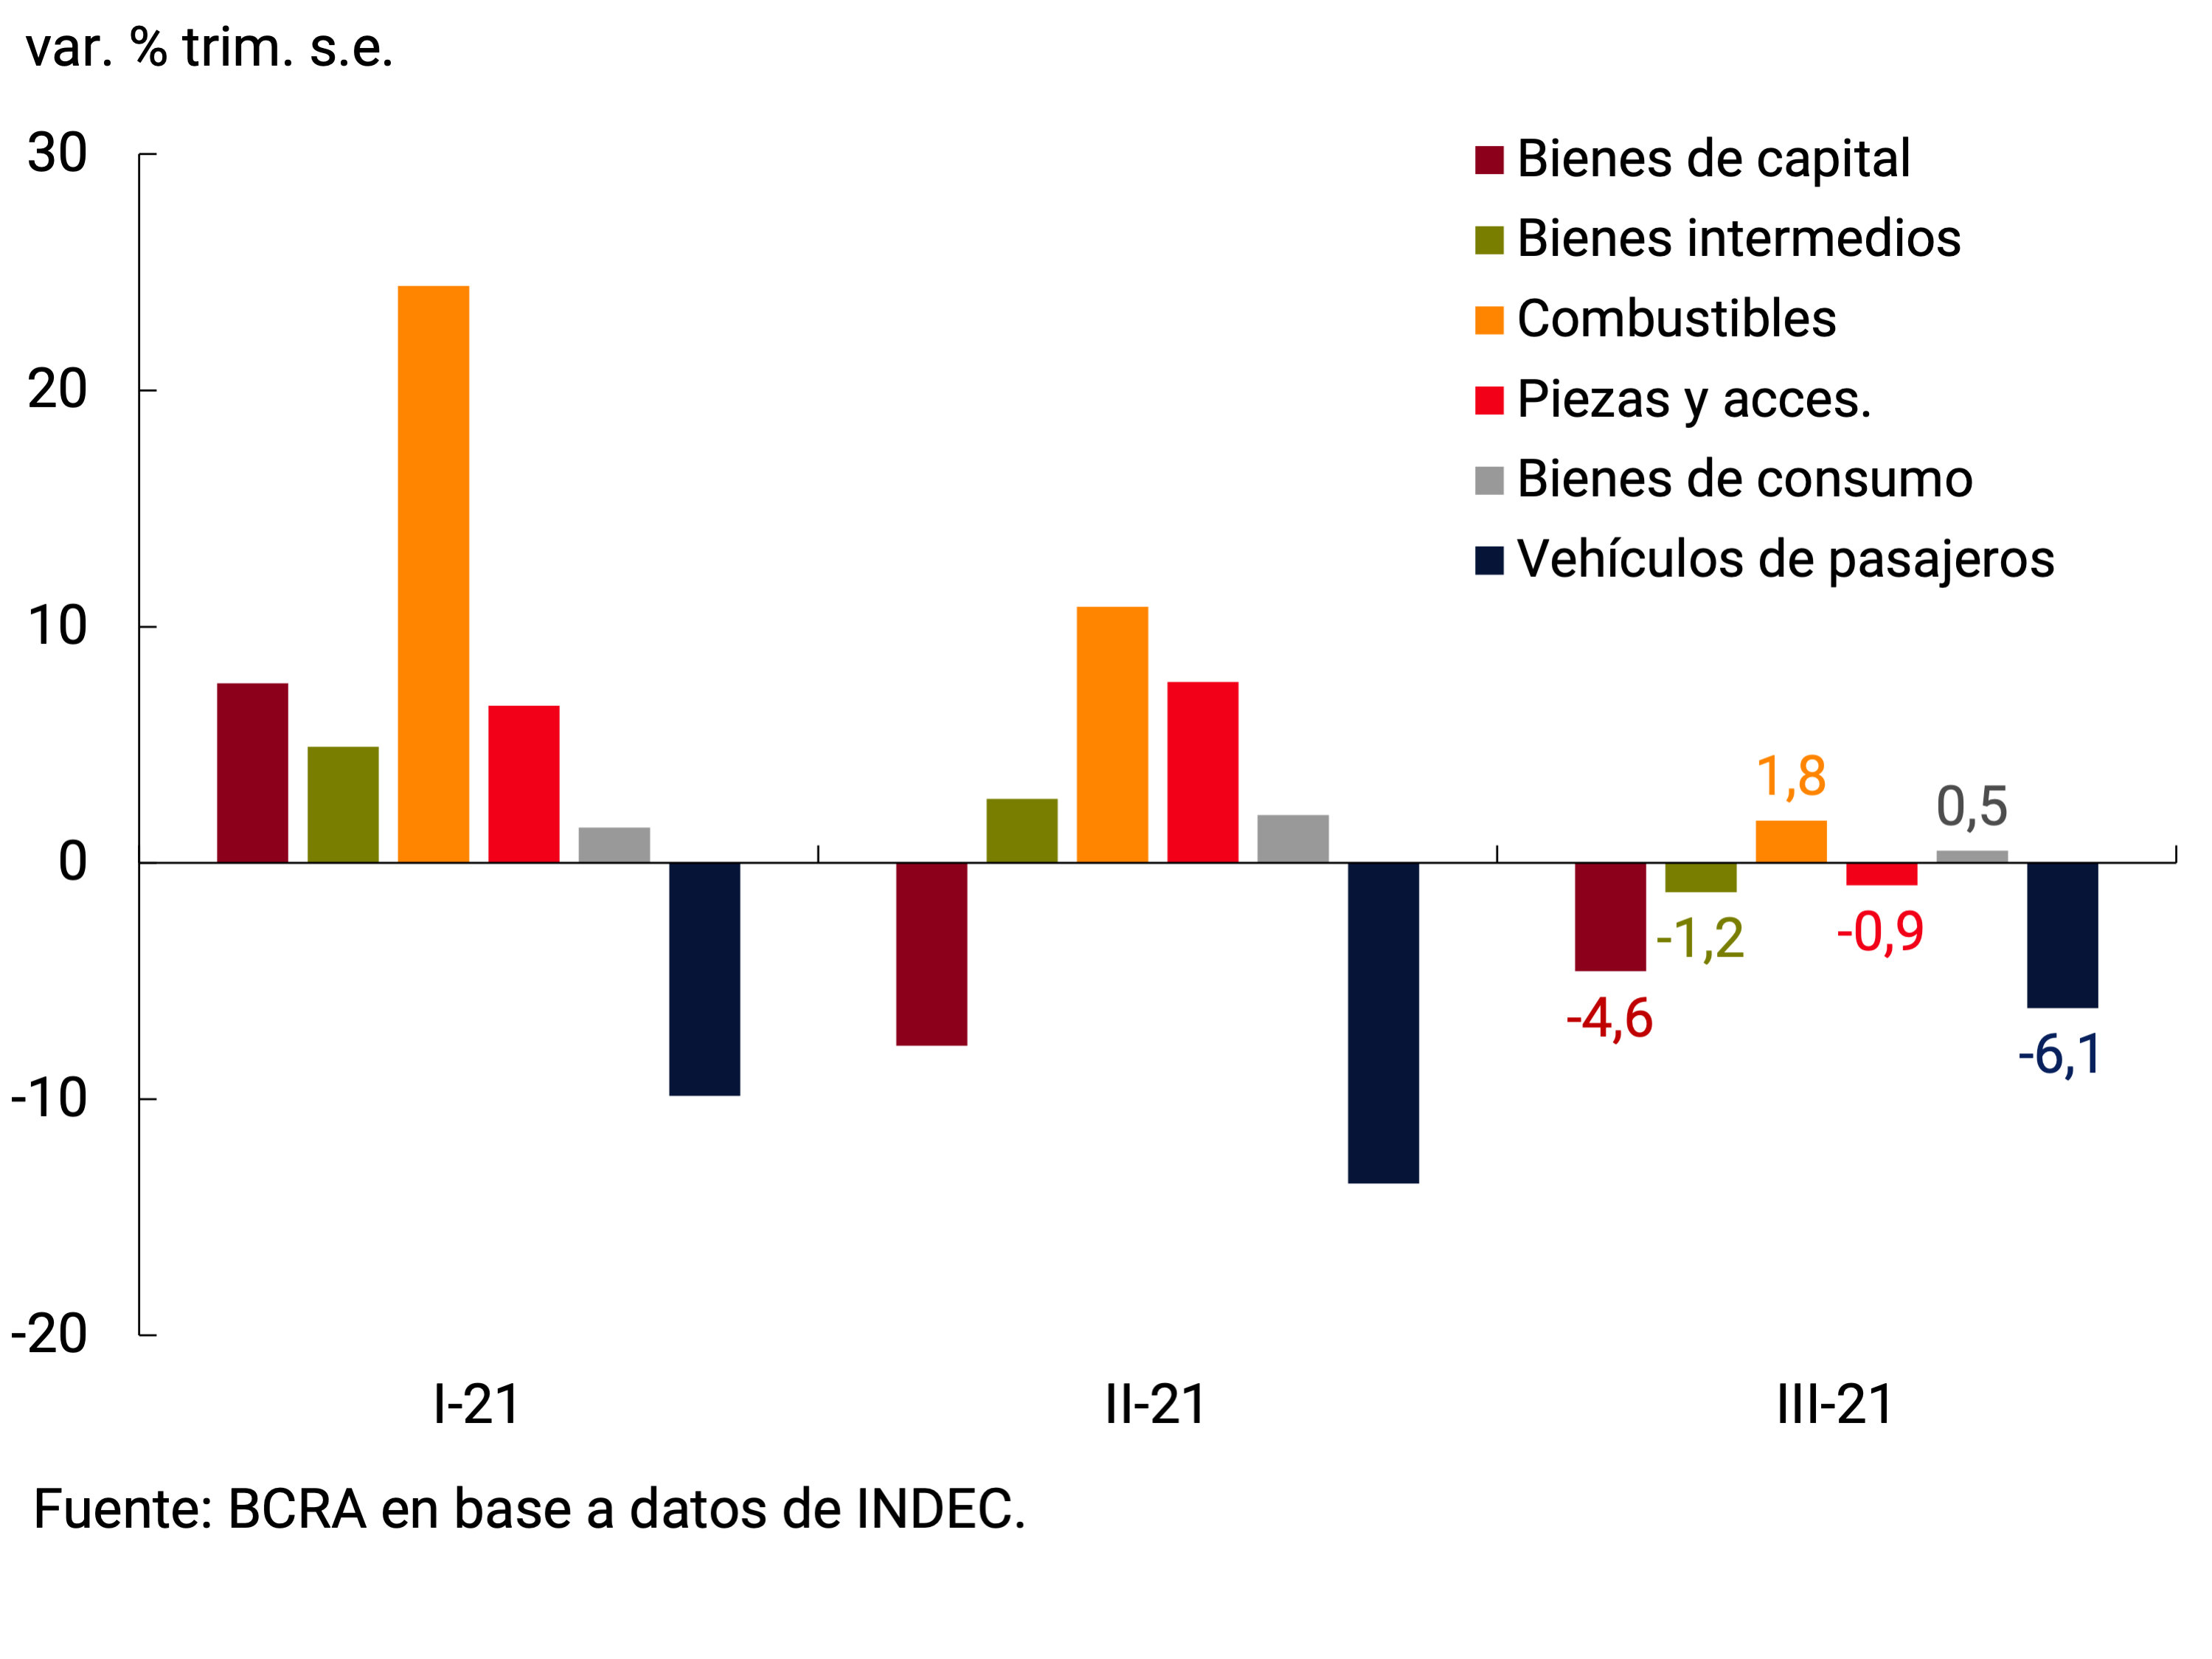
At the level of economic use, the quantities imported showed mixed behaviors. Compared to the previous quarter, there were increases in the volumes purchased of fuels (2% quarter-on-quarter) and consumer goods (1% quarter-on-quarter), while the rest showed declines, the most notable being passenger vehicles (6% quarter-on-quarter) and final capital goods (5% quarter-on-quarter; see Figure 4.3).
Figure 4.3 | Quantities imported. Seasonally adjusted series
Box. Import prices in global perspective
One of the characteristic features of the Argentine economy is its status as a net importer of manufactured goods. In the period 2016-2020, manufactures of industrial origin accounted for more than 80% of total imports of goods. Given this pattern of trade, import prices measured in dollars are expected to be closely linked to overall manufacturing prices. With a few exceptions23, this has been the case over the past 15 years (see Figure 4.4).
Figure 4.4 | Import prices and global prices of manufactures
(moving average 3 months)

In recent months, there has been a resurgence of inflationary pressures at the global level, with price variations that had not been observed in more than a decade (see Section 1 / The rise in international inflation). In this context, manufacturing was no exception. The Manufacturing Export Price Index prepared by the World Trade Organization (WTO) marked a year-on-year increase of 9% in dollars in July 2021 (latest available data). Records of the August and September producer price indices of manufactured goods from the major industrial powers suggest that the upward trend remained firm throughout the third quarter. In this context, import prices in dollars of the Argentine economy had a year-on-year increase of 19% in September.
This dynamism of import prices was very widespread. For the third consecutive quarter, 16 of the 19 grouped showed increases compared to the previous period (see Figure 4.5). In the July-September period, the increases in the prices in dollars of mineral inputs (33% quarterly), basic fuels (19%), textile fibers (17%) and processed fuels (13%) stood out for their intensity. In year-on-year terms, some of these categories became significantly more expensive: mineral inputs (+106% YoY), processed fuels (+97% YoY), plastic and rubber (+59% YoY) and chemical inputs (+41% YoY).
Figure 4.5 | Import prices
Var. % QoQ.
For their part, the prices of exports of goods grew 3% in the third quarter, which constituted a slowdown compared to the pace of the first half of the year. Thus, as a result of the faster growth in import prices, the terms of trade – the ratio between export and import prices – deteriorated by 1% in the third quarter of 2021. However, they continue to be favorable in historical terms.
4.3. In the first nine months of the year, the BCRA recorded the largest net purchases of foreign currency in the foreign exchange market since 2012
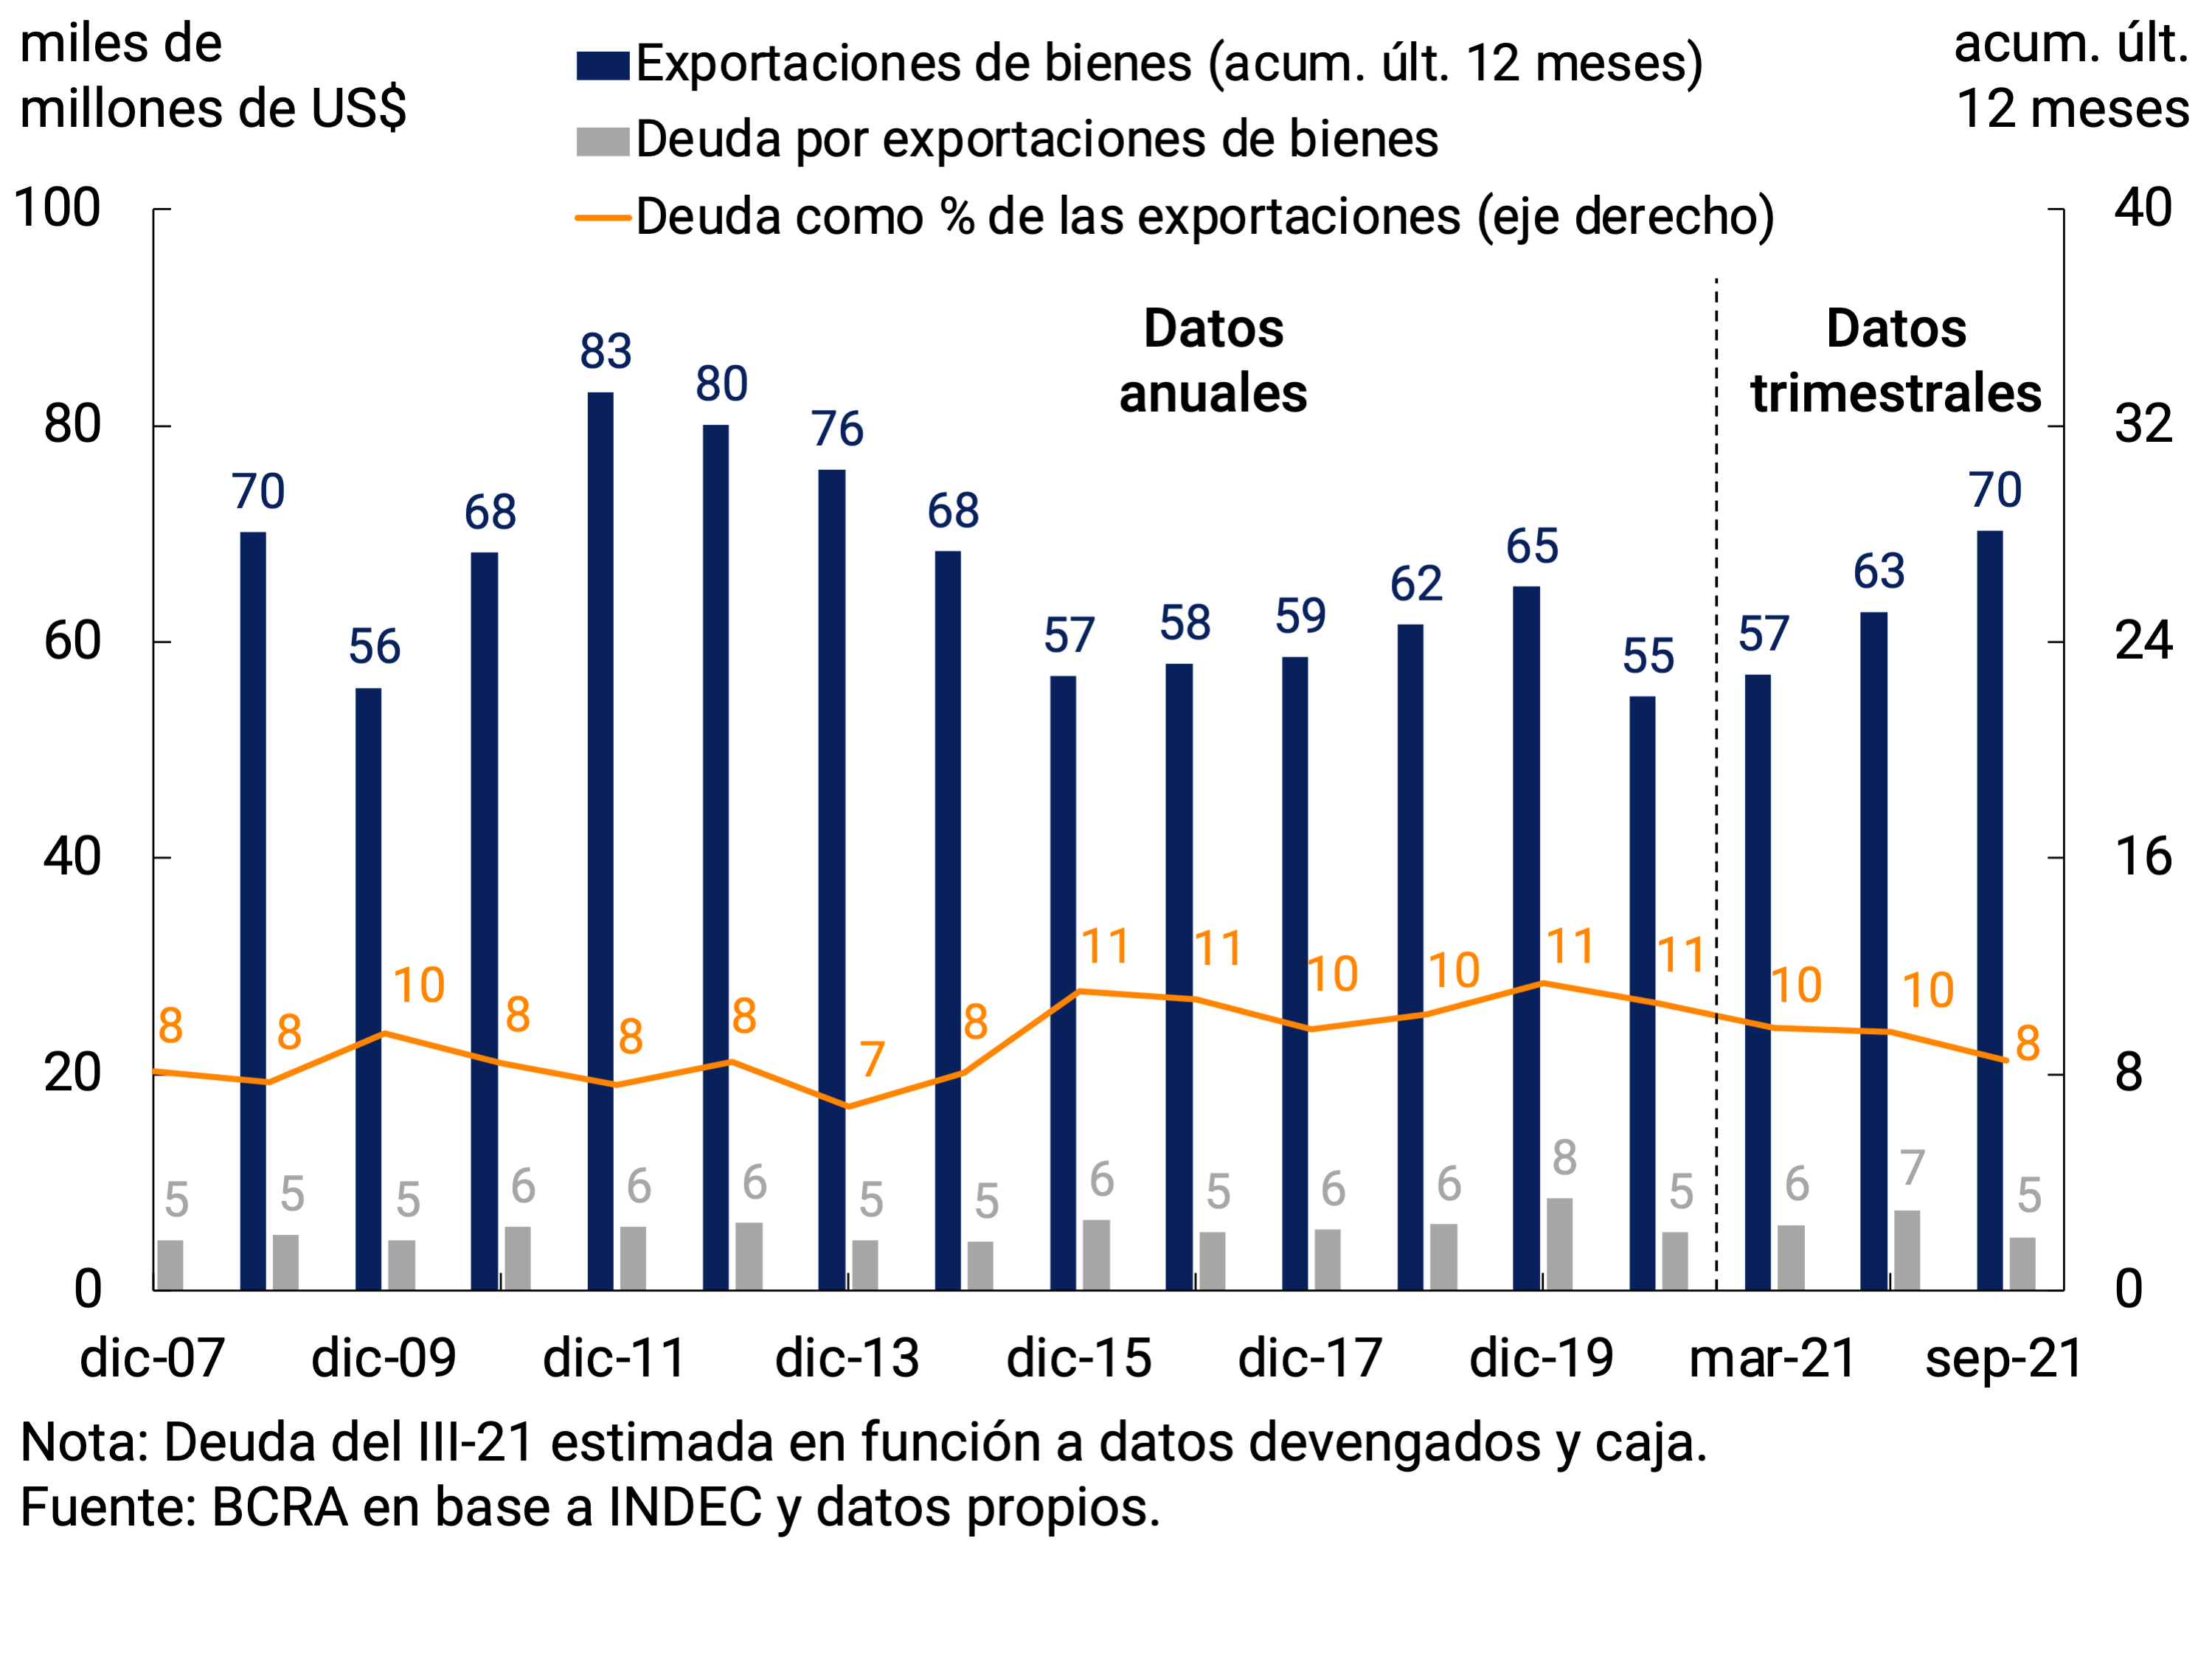
During the third quarter of 2021, exporters recorded revenues from exports of goods of about US$20,350 million. Given that exports of goods stood at about US$22,850 million, it is estimated that the external debt will be reduced by advances and pre-financing of about US$2,500 million. Thus, the ratio of this type of indebtedness to exported values is reduced to 8%, with respect to the values observed in recent years, a level that has not been verified since March 2015 (see Figure 4.6).
Figure 4.6 | Assets. Exports and external debt for exports
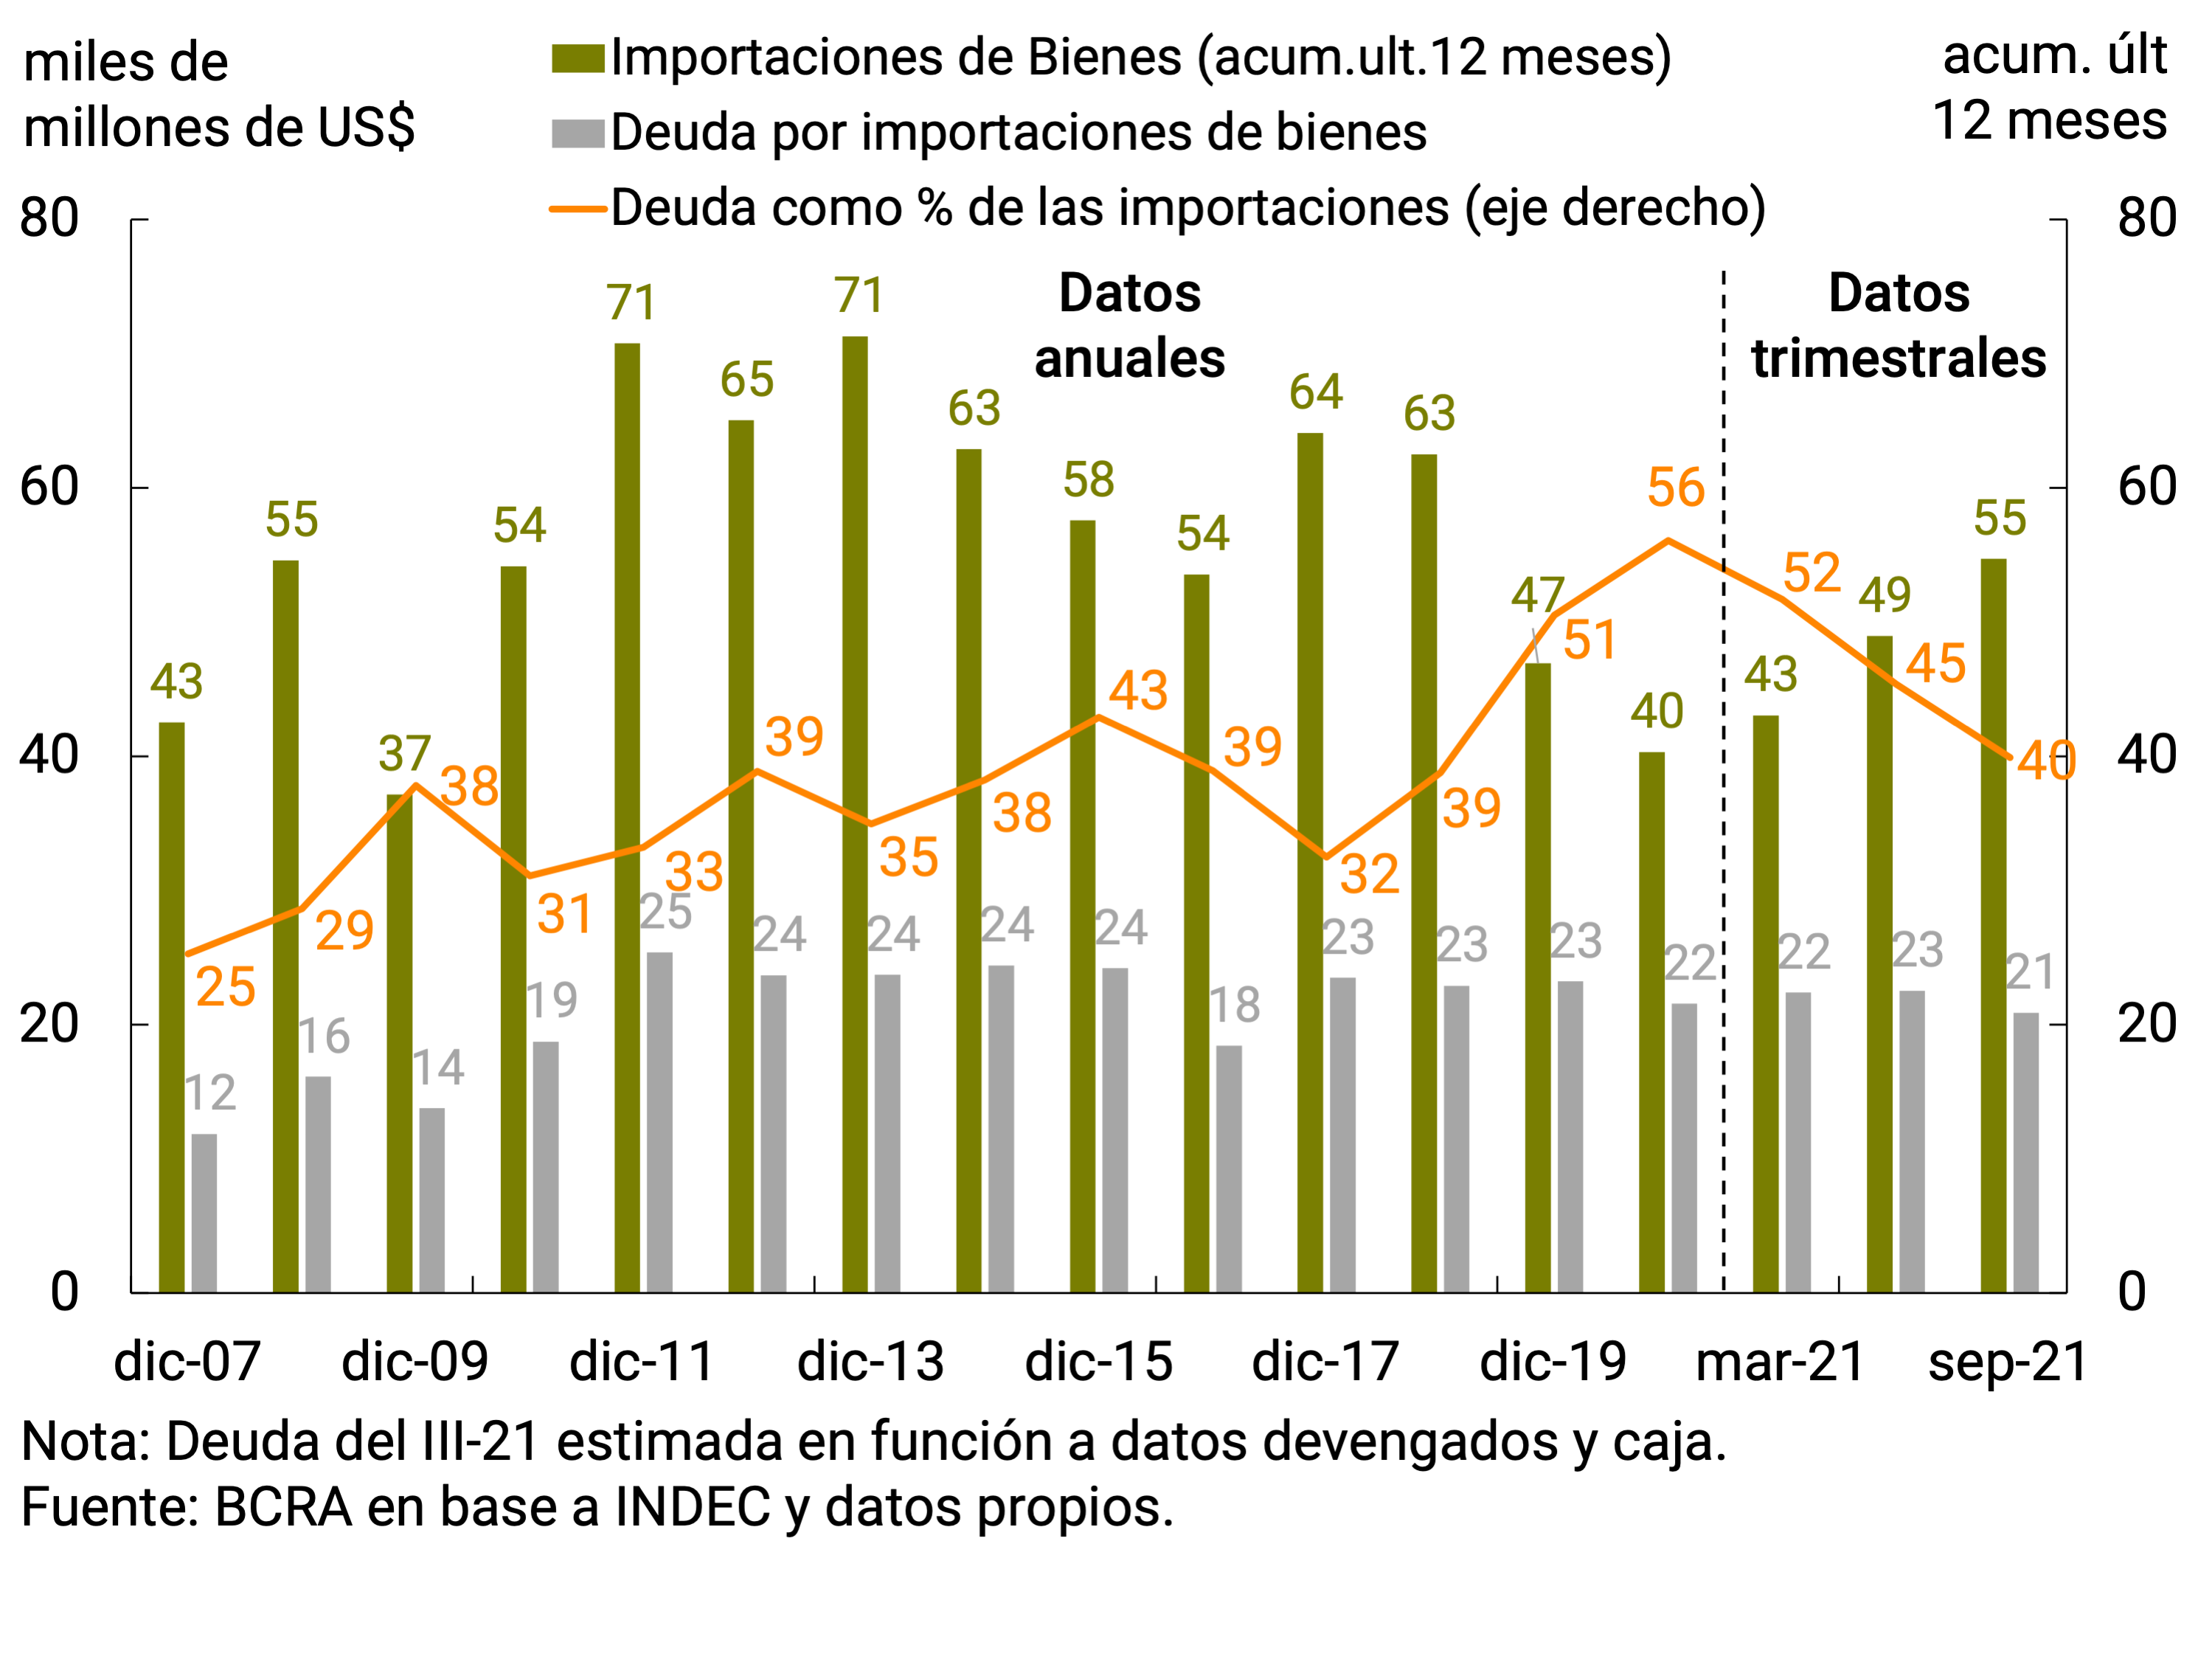
During 2020, the BCRA established a series of regulations aimed at promoting a more efficient allocation of foreign currency, which affected both the evolution of private commercial and financial debt, and which remain in force for the year 202124. In this context, during the third quarter of 2021, payments for imports of goods through the foreign exchange market for US$18,000 million were about US$1,650 million above FOB imports for the period, which would imply a fall in foreign indebtedness for this concept (or an increase in foreign assets due to early payments). In addition, due to the increase in the value of shipments to the market in recent months, the relationship between external debt and the level of imports registered a new fall, which implied 5 percentage points compared to the previous quarter and 16 p.p. compared to the end of 2020 (see Chart 4.7).
Figure 4.7 | Assets. Imports and external debt for imports
Finally, with regard to financial debt, and as part of the current regulatory framework mentioned above, in September 2020, through Communication “A” 7106, the guidelines were established under which private sector companies could initiate a process of refinancing their respective external liabilities, which would allow their maturity profile to be adapted to the guidelines required for the normal functioning of the foreign exchange market. This communication, which reached certain capital maturities between October 15, 2020 and March 31, 2021, was extended by Communication “A” 7230, covering maturities from then until the end of 2021.
In this context, the renegotiations registered during the third quarter of 2021 of some 25 companies had an impact on lower net purchases in the foreign exchange market of about US$600 million compared to the original maturities for that same period. In this way, lower net payments of more than US$1,900 million were accumulated in the year.
Finally, with regard to financial debt, and as part of the current regulatory framework mentioned above, in September 2020, through Communication “A” 7106, the guidelines were established under which private sector companies could initiate a process of refinancing their respective external liabilities, which would allow their maturity profile to be adapted to the guidelines required for the normal functioning of the foreign exchange market. This communication, which reached certain capital maturities between October 15, 2020 and March 31, 2021, was extended by Communication “A” 7230, covering maturities from then until the end of 2021.
The aforementioned recovery of exports, added to the evolution of the commercial debt for exports and imports of goods, resulted in a net result for goods in the foreign exchange market of US$12,964 million in the first 9 months of the year, about US$2,000 million lower than the result of the FOB trade balance for the same period. implying a significant improvement compared to the same period of the previous year (83%).
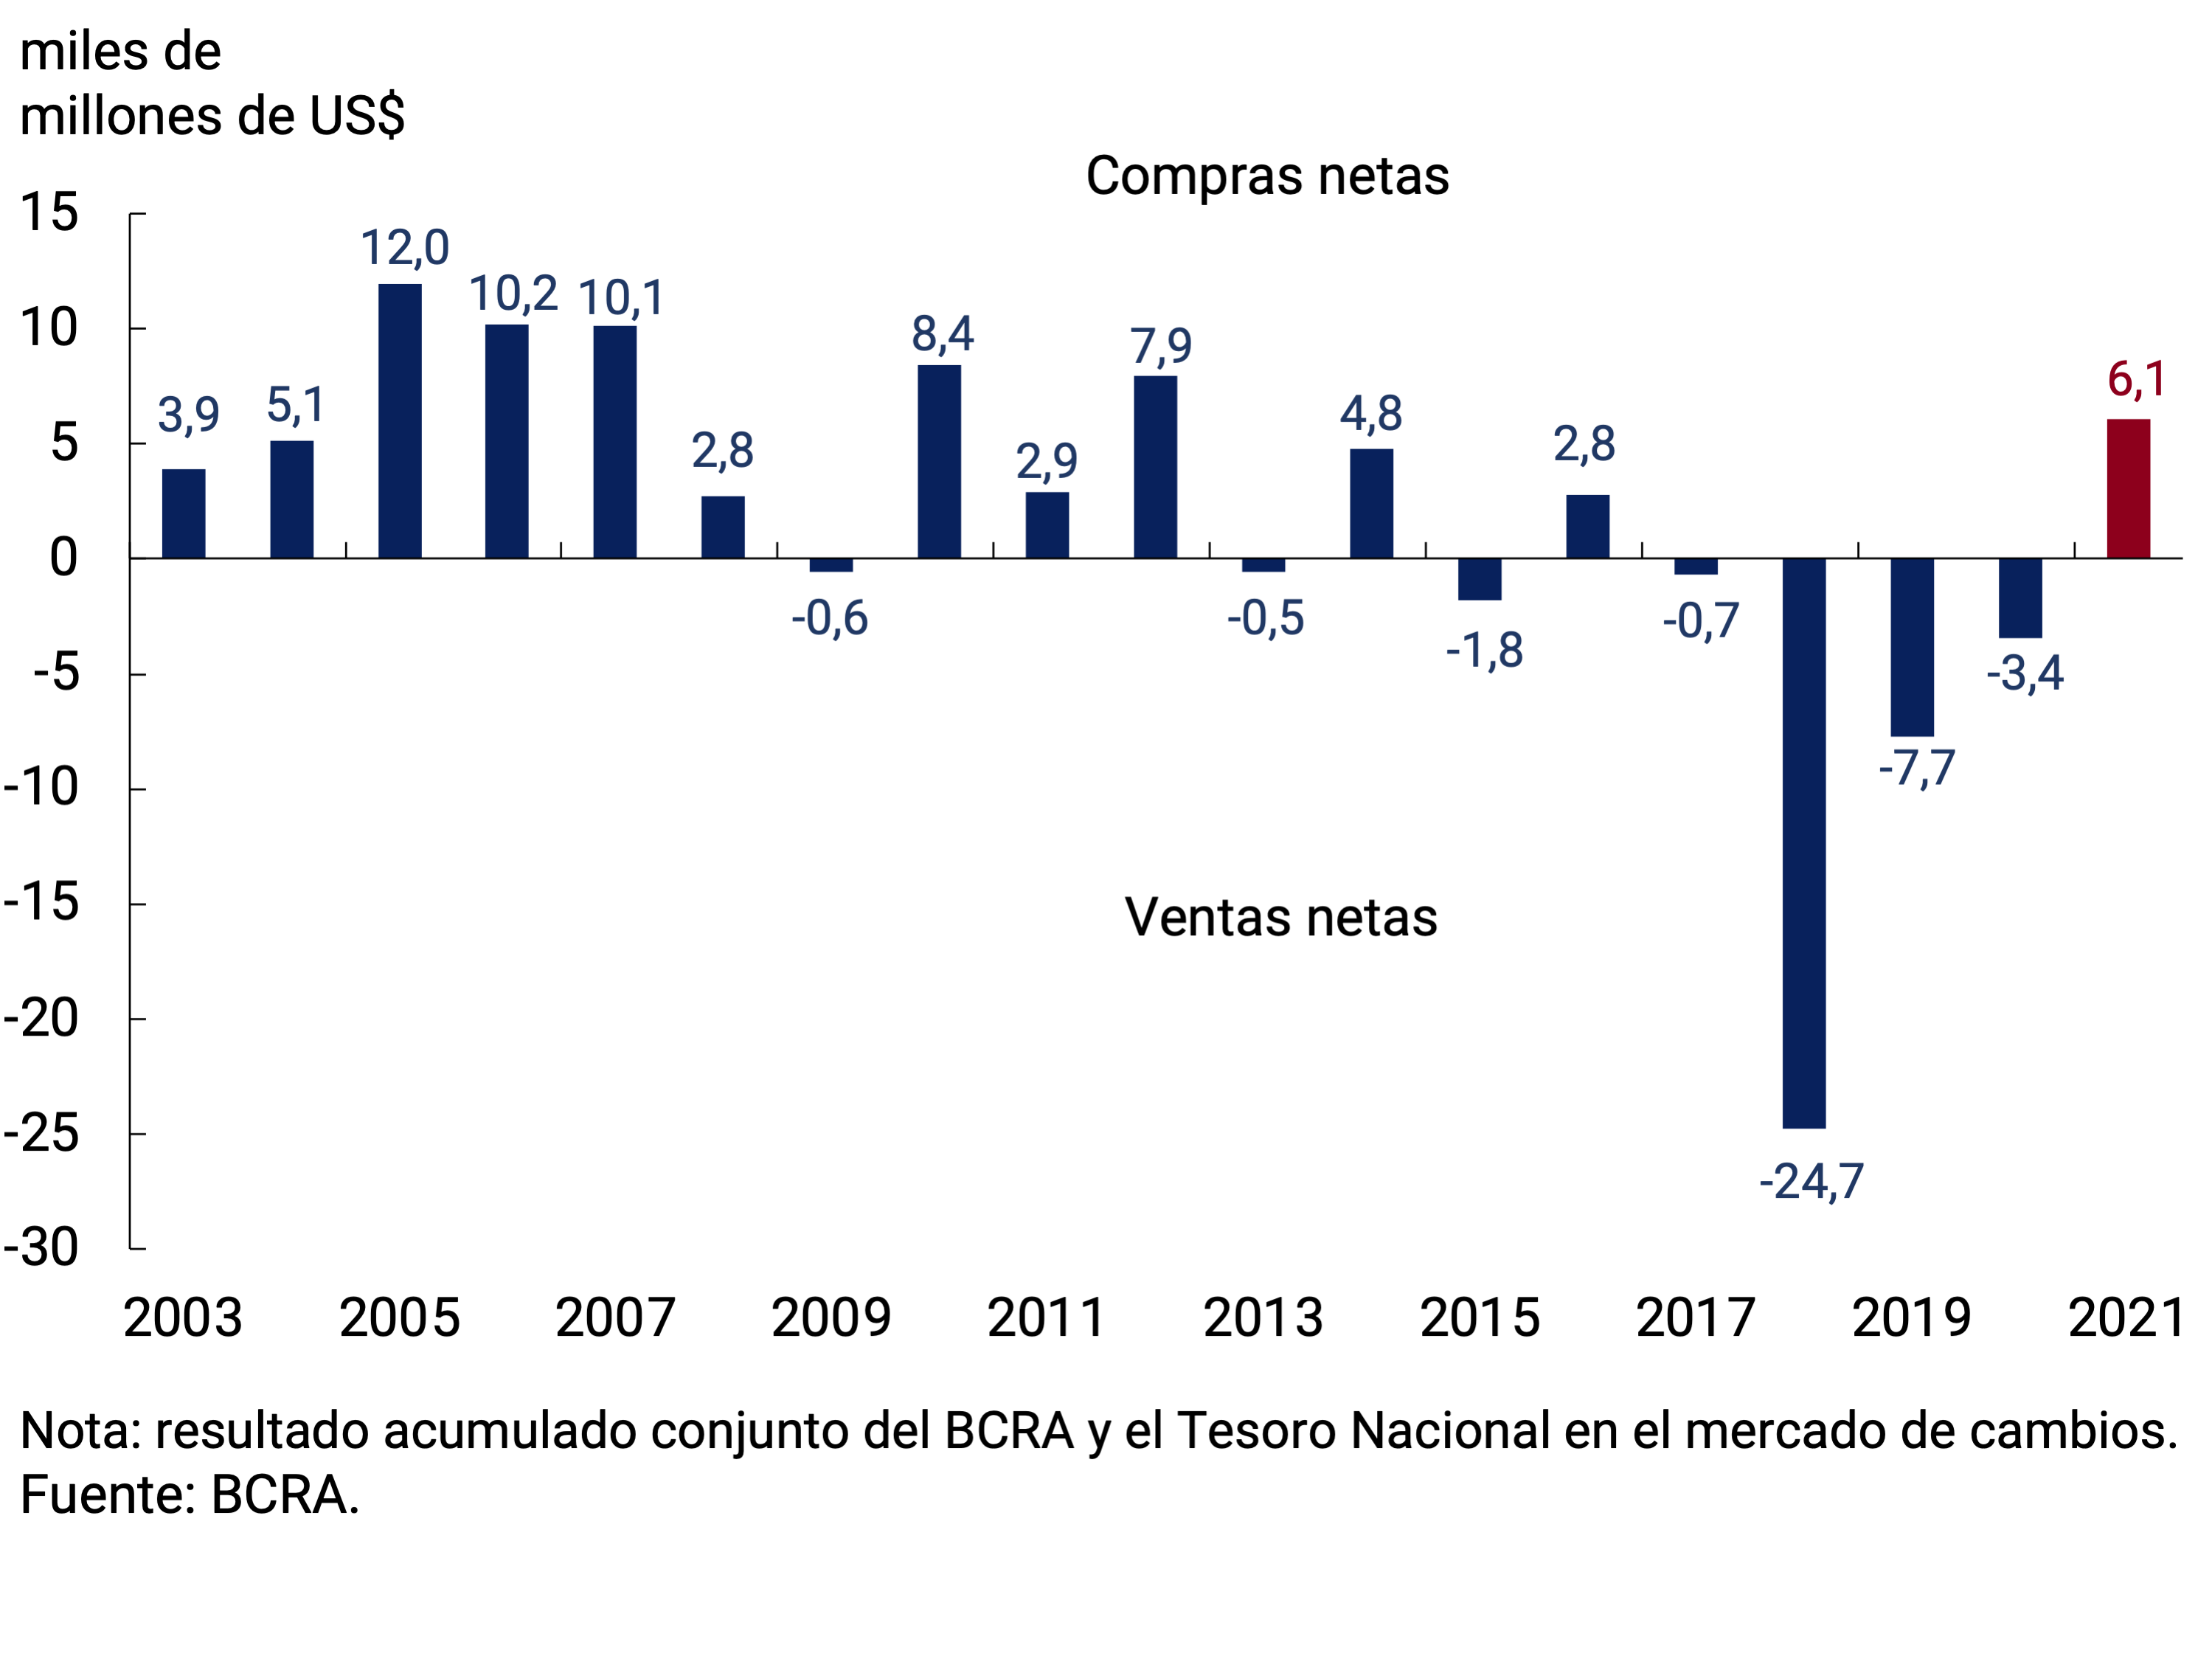
Thus, the BCRA accumulated purchases in the foreign exchange market until September by US$6,062 million, constituting a record value for the first 9 months of the year since 2012 (see Chart 4.8), while international reserves increased by US$3,523 million in the same period. This difference is mainly explained by the net cancellations of principal and interest on debt in foreign currency by the BCRA and the National Government with a direct impact on international reserves of about US$2,800 million and payments for operations carried out through the Local Currency Systems with Brazil, Uruguay and Paraguay and ALADI for about US$500 million. partly offset by the increase in the holdings of entities in foreign currency accounts at the BCRA by about US$800 million.
Figure 4.8 | Exchange Market. Cumulative profit from January to September of each year
4.4. Perspectives
For the last quarter of 2021, the economy is expected to incur a slight current account deficit, due to the seasonal decline in the goods surplus typical of the last months of the year. In any case, the year would close with a surplus, as a result of the high positive balance of goods. A resurgence of the pandemic due to the expansion of new strains of COVID-19 and/or a slowdown in the global economy as a result of the change in the bias of the monetary policy of most of the world’s central banks, added to the potential impact that a deterioration in international financial conditions could have on the trajectory of commodity prices, are the main risk factors for the external sector of the Argentine economy.
The regulatory framework in force in the Foreign Exchange Market will allow the BCRA to continue to efficiently manage foreign currency originating in commercial and financial transactions, in order to preserve monetary and exchange rate stability.
5. Public Finance
During the third quarter of 2021, national public finances continued to strengthen due to higher public revenues. National tax collection was 12.2% above the pre-pandemic value (first quarter of 2020) in seasonally adjusted real terms. This revenue dynamic made it possible to develop an expansive fiscal policy with a view to economic growth with social inclusion. The recovery in domestic demand and taxes related to foreign trade—in a context of higher international commodity prices—determined this favorable evolution. Likewise, the regulatory modifications on taxes provided for in the Social Solidarity and Productive Reactivation Law of the end of 2019 and in the National Budget Law 2021 continued to have a positive impact. On the other hand, non-tax resources (driven by the solidarity and extraordinary contribution of large fortunes) also contributed to improving the situation of the public accounts.
Social spending was sustained – within the framework of the social and economic emergency that has been in force since the end of 2019 – and an increase in capital spending was promoted in line with the provisions of the 2021 National Budget, with the aim of supporting the recovery process of economic activity. In the opposite direction, there was a more limited trajectory of extraordinary expenditures associated with the evolution of the pandemic. However, excluding extraordinary expenditures in 2020 and 2021 aimed at mitigating the effects of the pandemic and accompanying the most affected sectors, real primary expenditure expanded by 15% YoY in the third quarter of 2021.
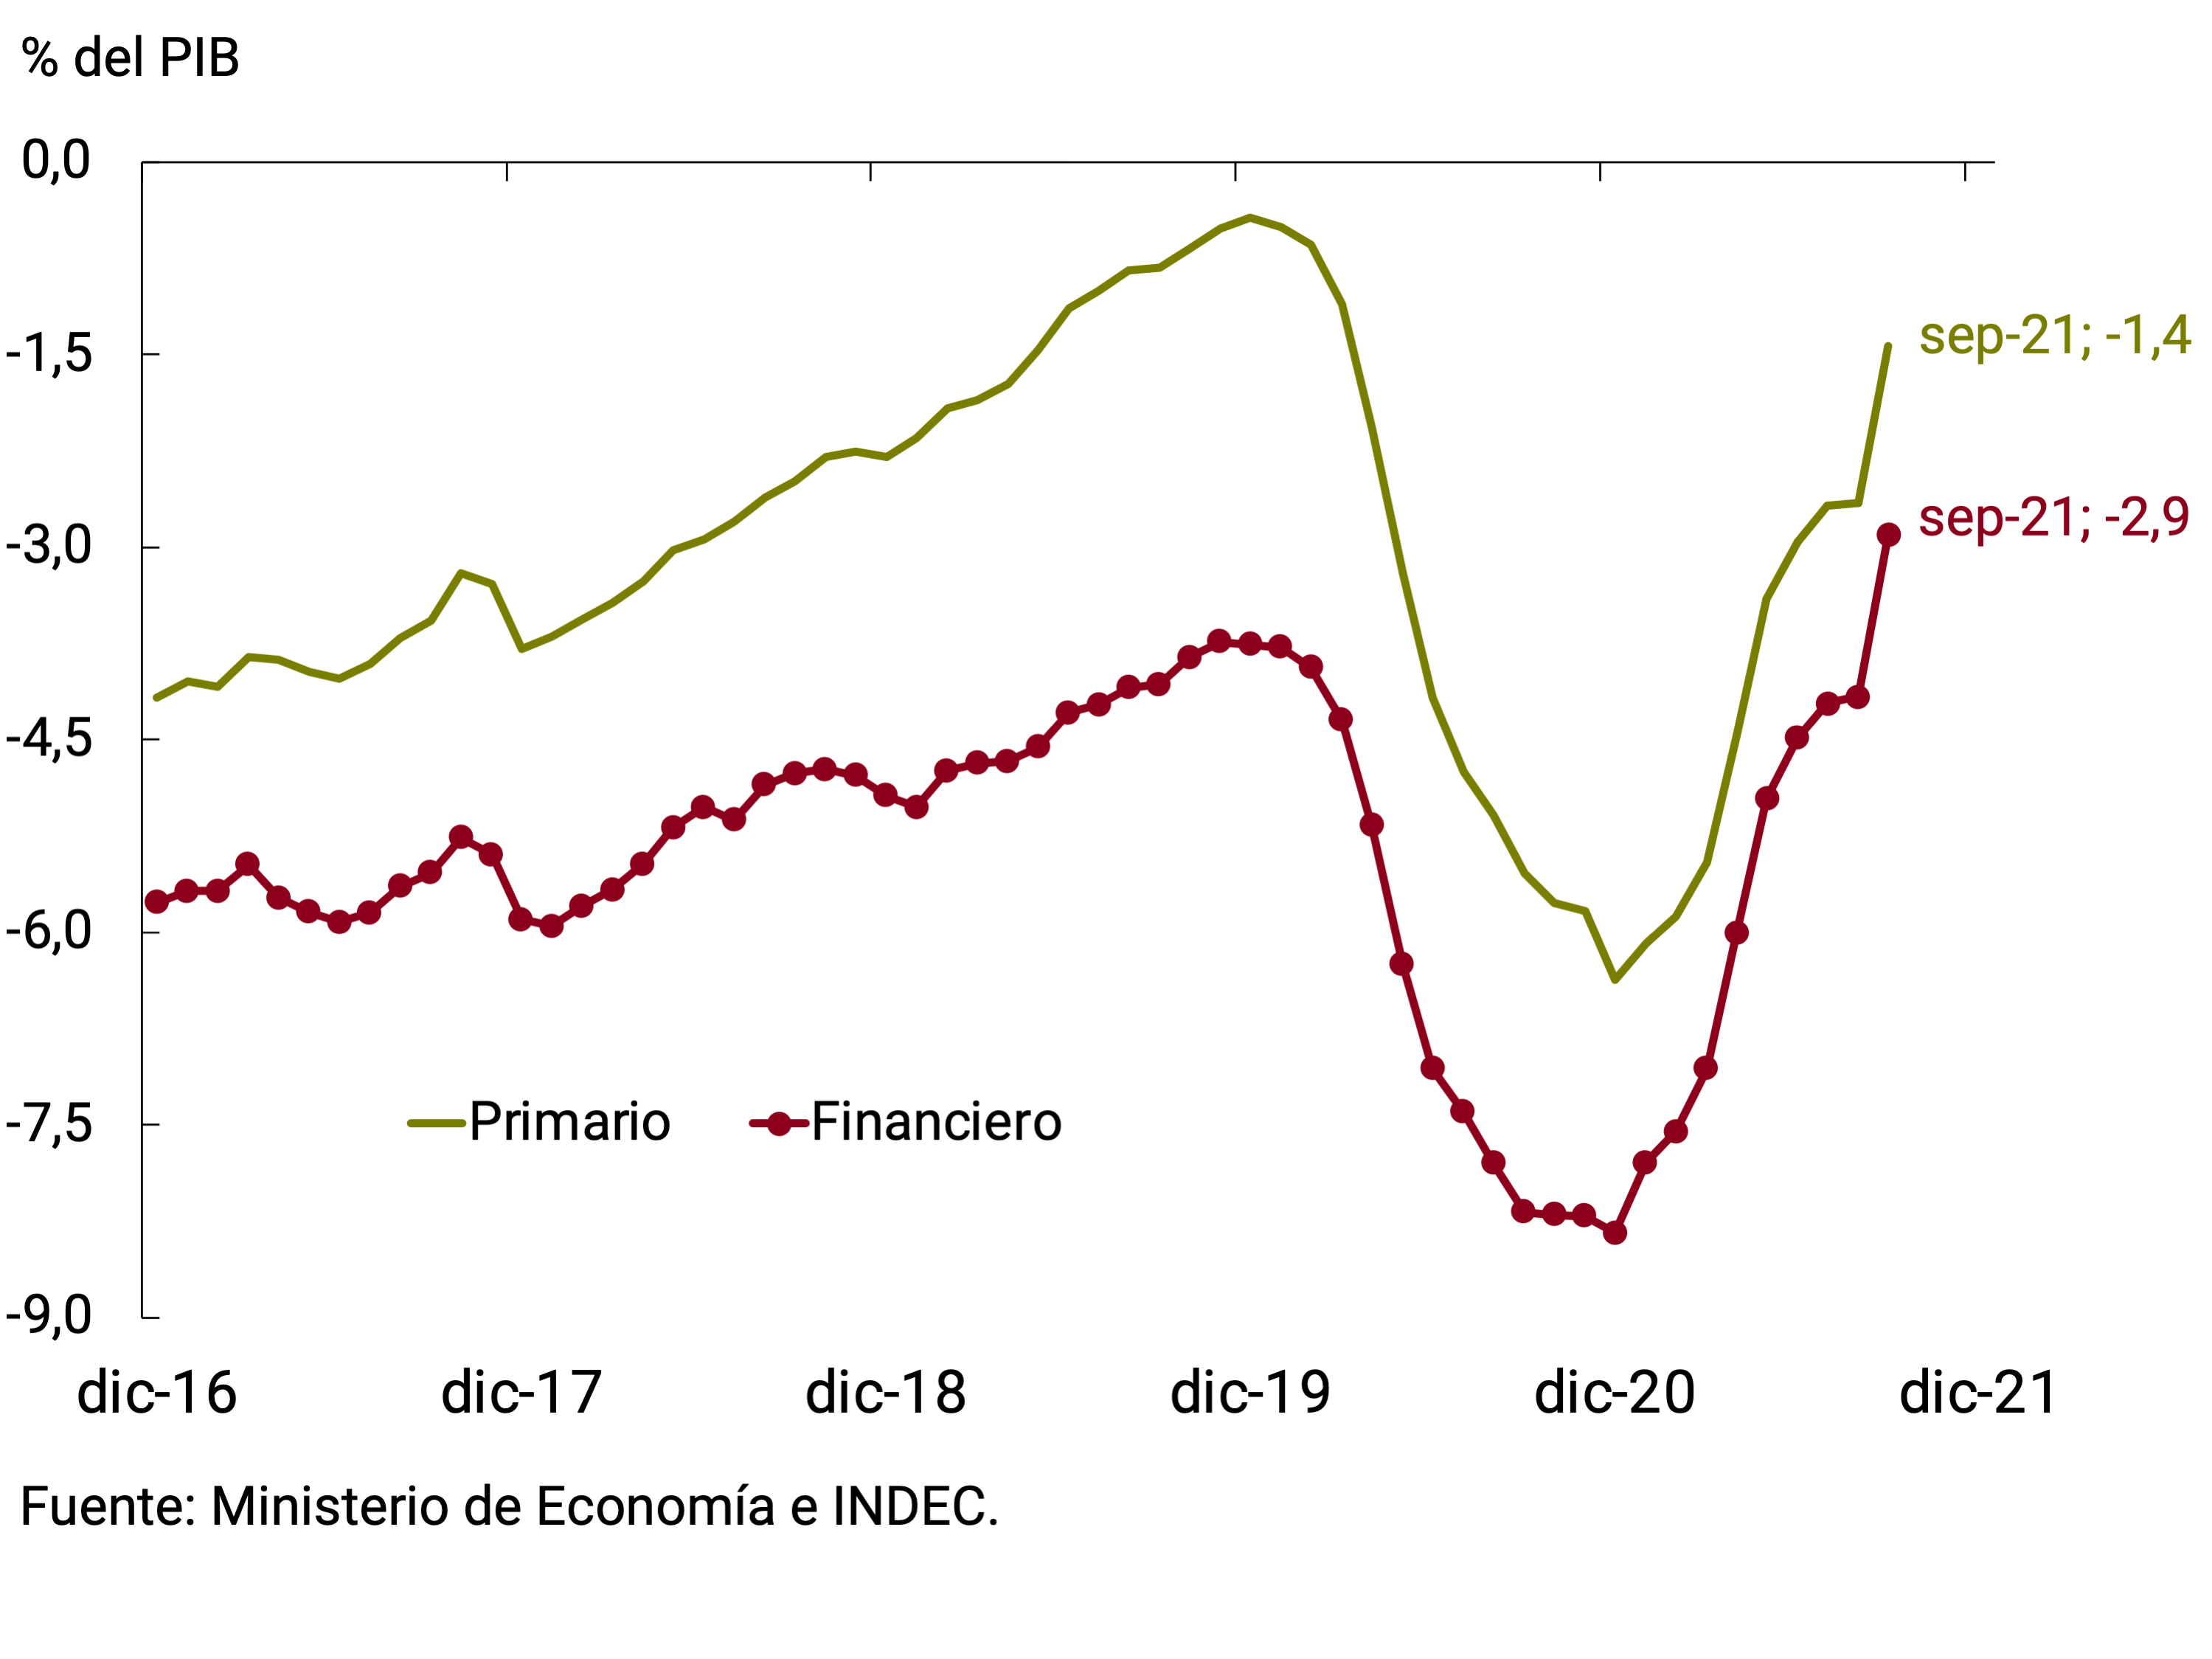
Given the trajectory of revenues and expenditures, the fiscal deficit continued to be reduced. In the last 12 months to September 2021, the primary deficit on a cash basis accumulated a balance equivalent to 1.4% of GDP, significantly lower than that observed during 2020 (-6.4% of GDP). It should be noted that this value incorporates the resources from the allocation of Special Drawing Rights (SDRs) that the International Monetary Fund (IMF) made extraordinarily for approximately 1% of GDP. In mid-September, the National Government presented the 2022 National Budget Bill that foresees a primary deficit of NFPS of 4.0% of GDP during the current year (not including the extraordinary resources for the SDR allocation that impacted resources towards the end of September) and a reduction of this to 3.3% of GDP for 2022.
So far in 2021, in line with budget forecasts and in contrast to the same period last year, lower monetary financing of the needs of the National Treasury (NT) continued to be observed, even taking into account the greater assistance observed in recent months. The National Government is negotiating an agreement with the IMF to meet the large obligations that are concentrated in 2022 and 2023 (amortizations of about US$17,900 million and US$19,000 million, respectively) derived from the stand-by loan taken by the previous administration. Among the risks faced in the fiscal scenario, an eventual resurgence of the pandemic stands out, which could require intensifying policies to assist vulnerable people and companies and negatively affect tax revenues. Likewise, challenges persist in continuing to implement a financing policy that prioritizes the development of the local debt market.
5.1. Tax revenues remained highly dynamic, contributing to the strengthening of public accounts
National tax collection increased 64% YoY in the third quarter of 2021 (see Figure 5.1). This increase is explained by the consolidation of the economic recovery and the low base of comparison due to the impact of the pandemic during the third quarter of 2020. In addition, the higher values of international trade flows that are taxed continued to contribute positively. In real terms, tax collection expanded 8% YoY between July and September. In October, the nominal increase was 58.7% YoY (+4.7% YoY in real terms).
Figure 5.1 | Contribution to the nominal growth of national tax collection by tax
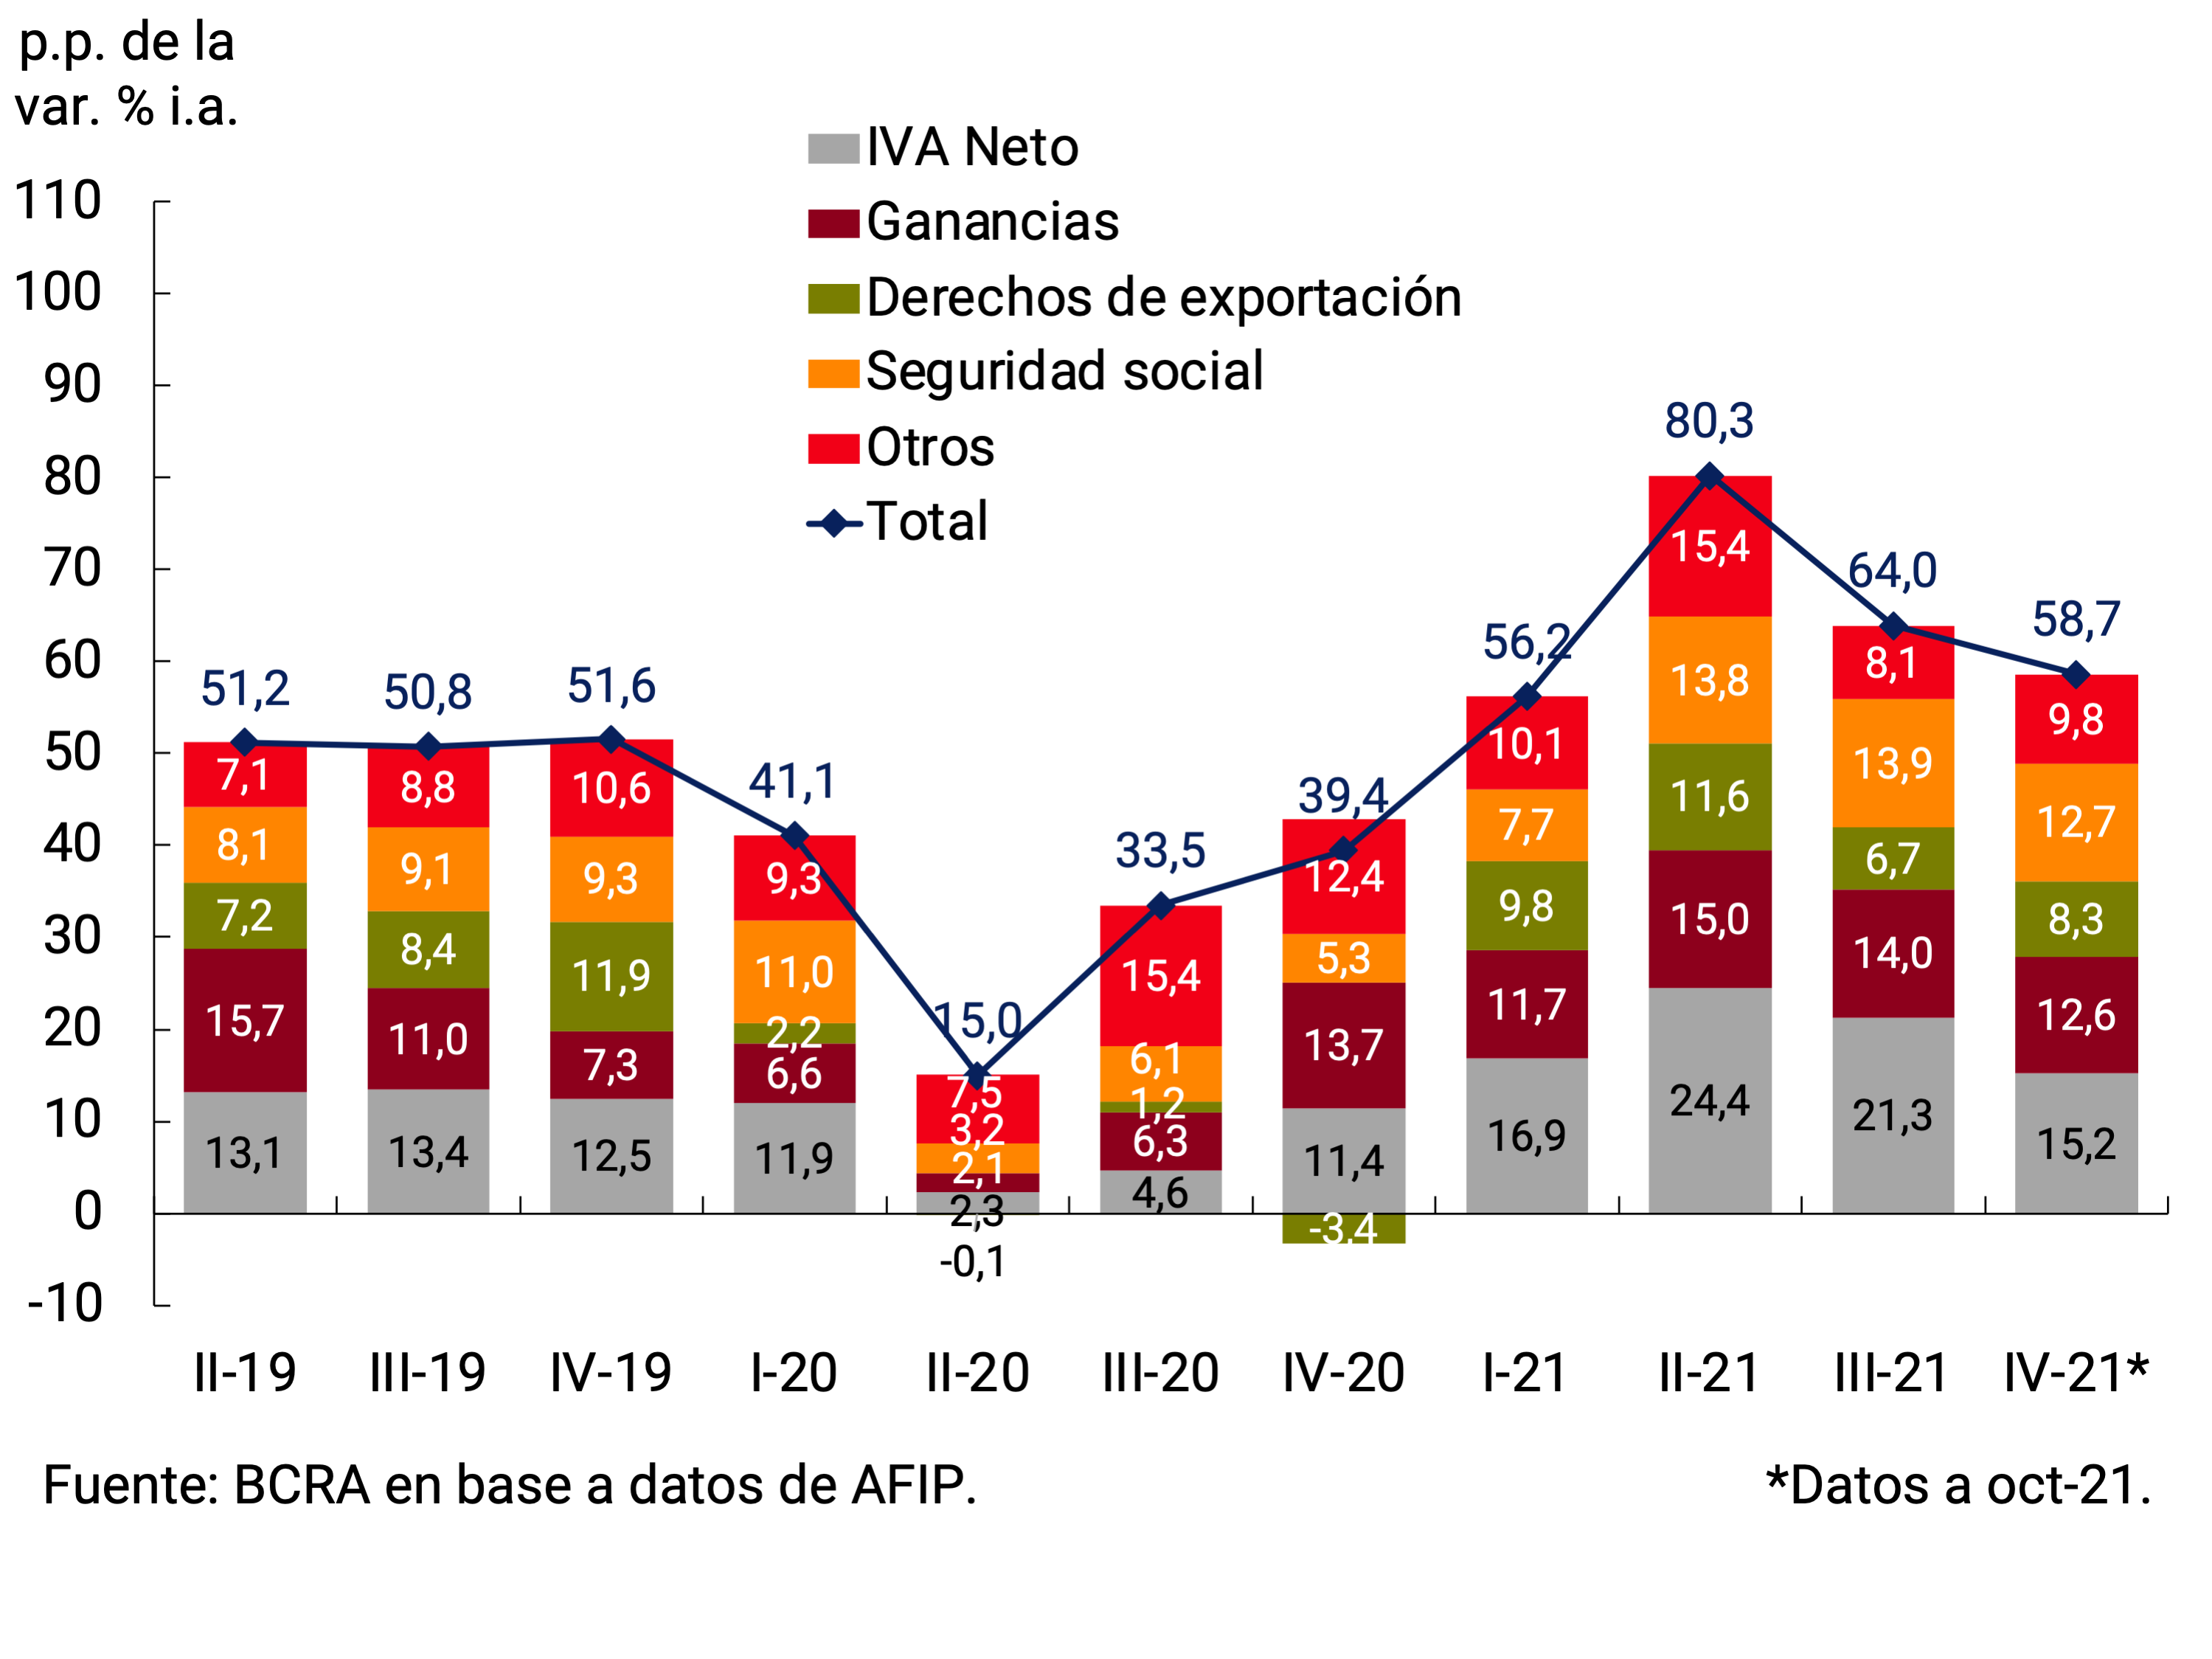
Taxes associated with foreign trade sustained a good performance. Export duties grew 135% in October and 103% in the third quarter. The rise responds both to the maintenance of the favorable international context for the prices of the main export products and to the progressive recovery of external demand. Taxes linked to foreign purchases28 also showed a strong increase during the period: 66% YoY in October and 90% YoY in the third quarter. This behavior continues to be explained basically by the increase in imported values (see Chapter 4. External Sector).
Taxes related to the domestic market (Value Added Tax (VAT), Profits, Fuels, among others) maintained the dynamism observed in the previous quarter due to the recovery of economic activity and the low base of comparison (the pandemic had still had a negative impact in the third quarter of 2020). Income Tax rose 57.7% YoY in October and 67.3% between July and September in line with what was observed in the second quarter. The regulatory change of September 2020 associated with the withholding on purchases of dollars and expenses in foreign currency through credit cards continues to have an upward effect on this tax. In addition, it is negatively impacted by the increase in personal deductions on the income of employees and by refunds for differences owed from past months to these taxpayers29. For the coming months, the modification that incorporates new rates in a staggered manner for companies, setting the maximum rate at 35% and maintaining the tax on dividends at 7%30, will have an upward impact on the collection of profits30. Net VAT remained highly dynamic, growing 79.9% YoY between July and September after having increased 88.5% YoY in the previous quarter.
Between July and September, social security resources continued to show the dynamism observed in the second quarter, basically explained by the recovery of wages and employment: they grew 63.2% YoY in the third quarter (a figure similar to that observed between April and June) and 65.0% YoY in October. This set of taxes is still negatively impacted by the measures taken by the National Government, with reductions in employer contributions in the health sector, the critical sectors contemplated in the REPRO program and in the provinces of the Norte Grande.
Figure 5.2 | National tax collection (real seasonally adjusted)
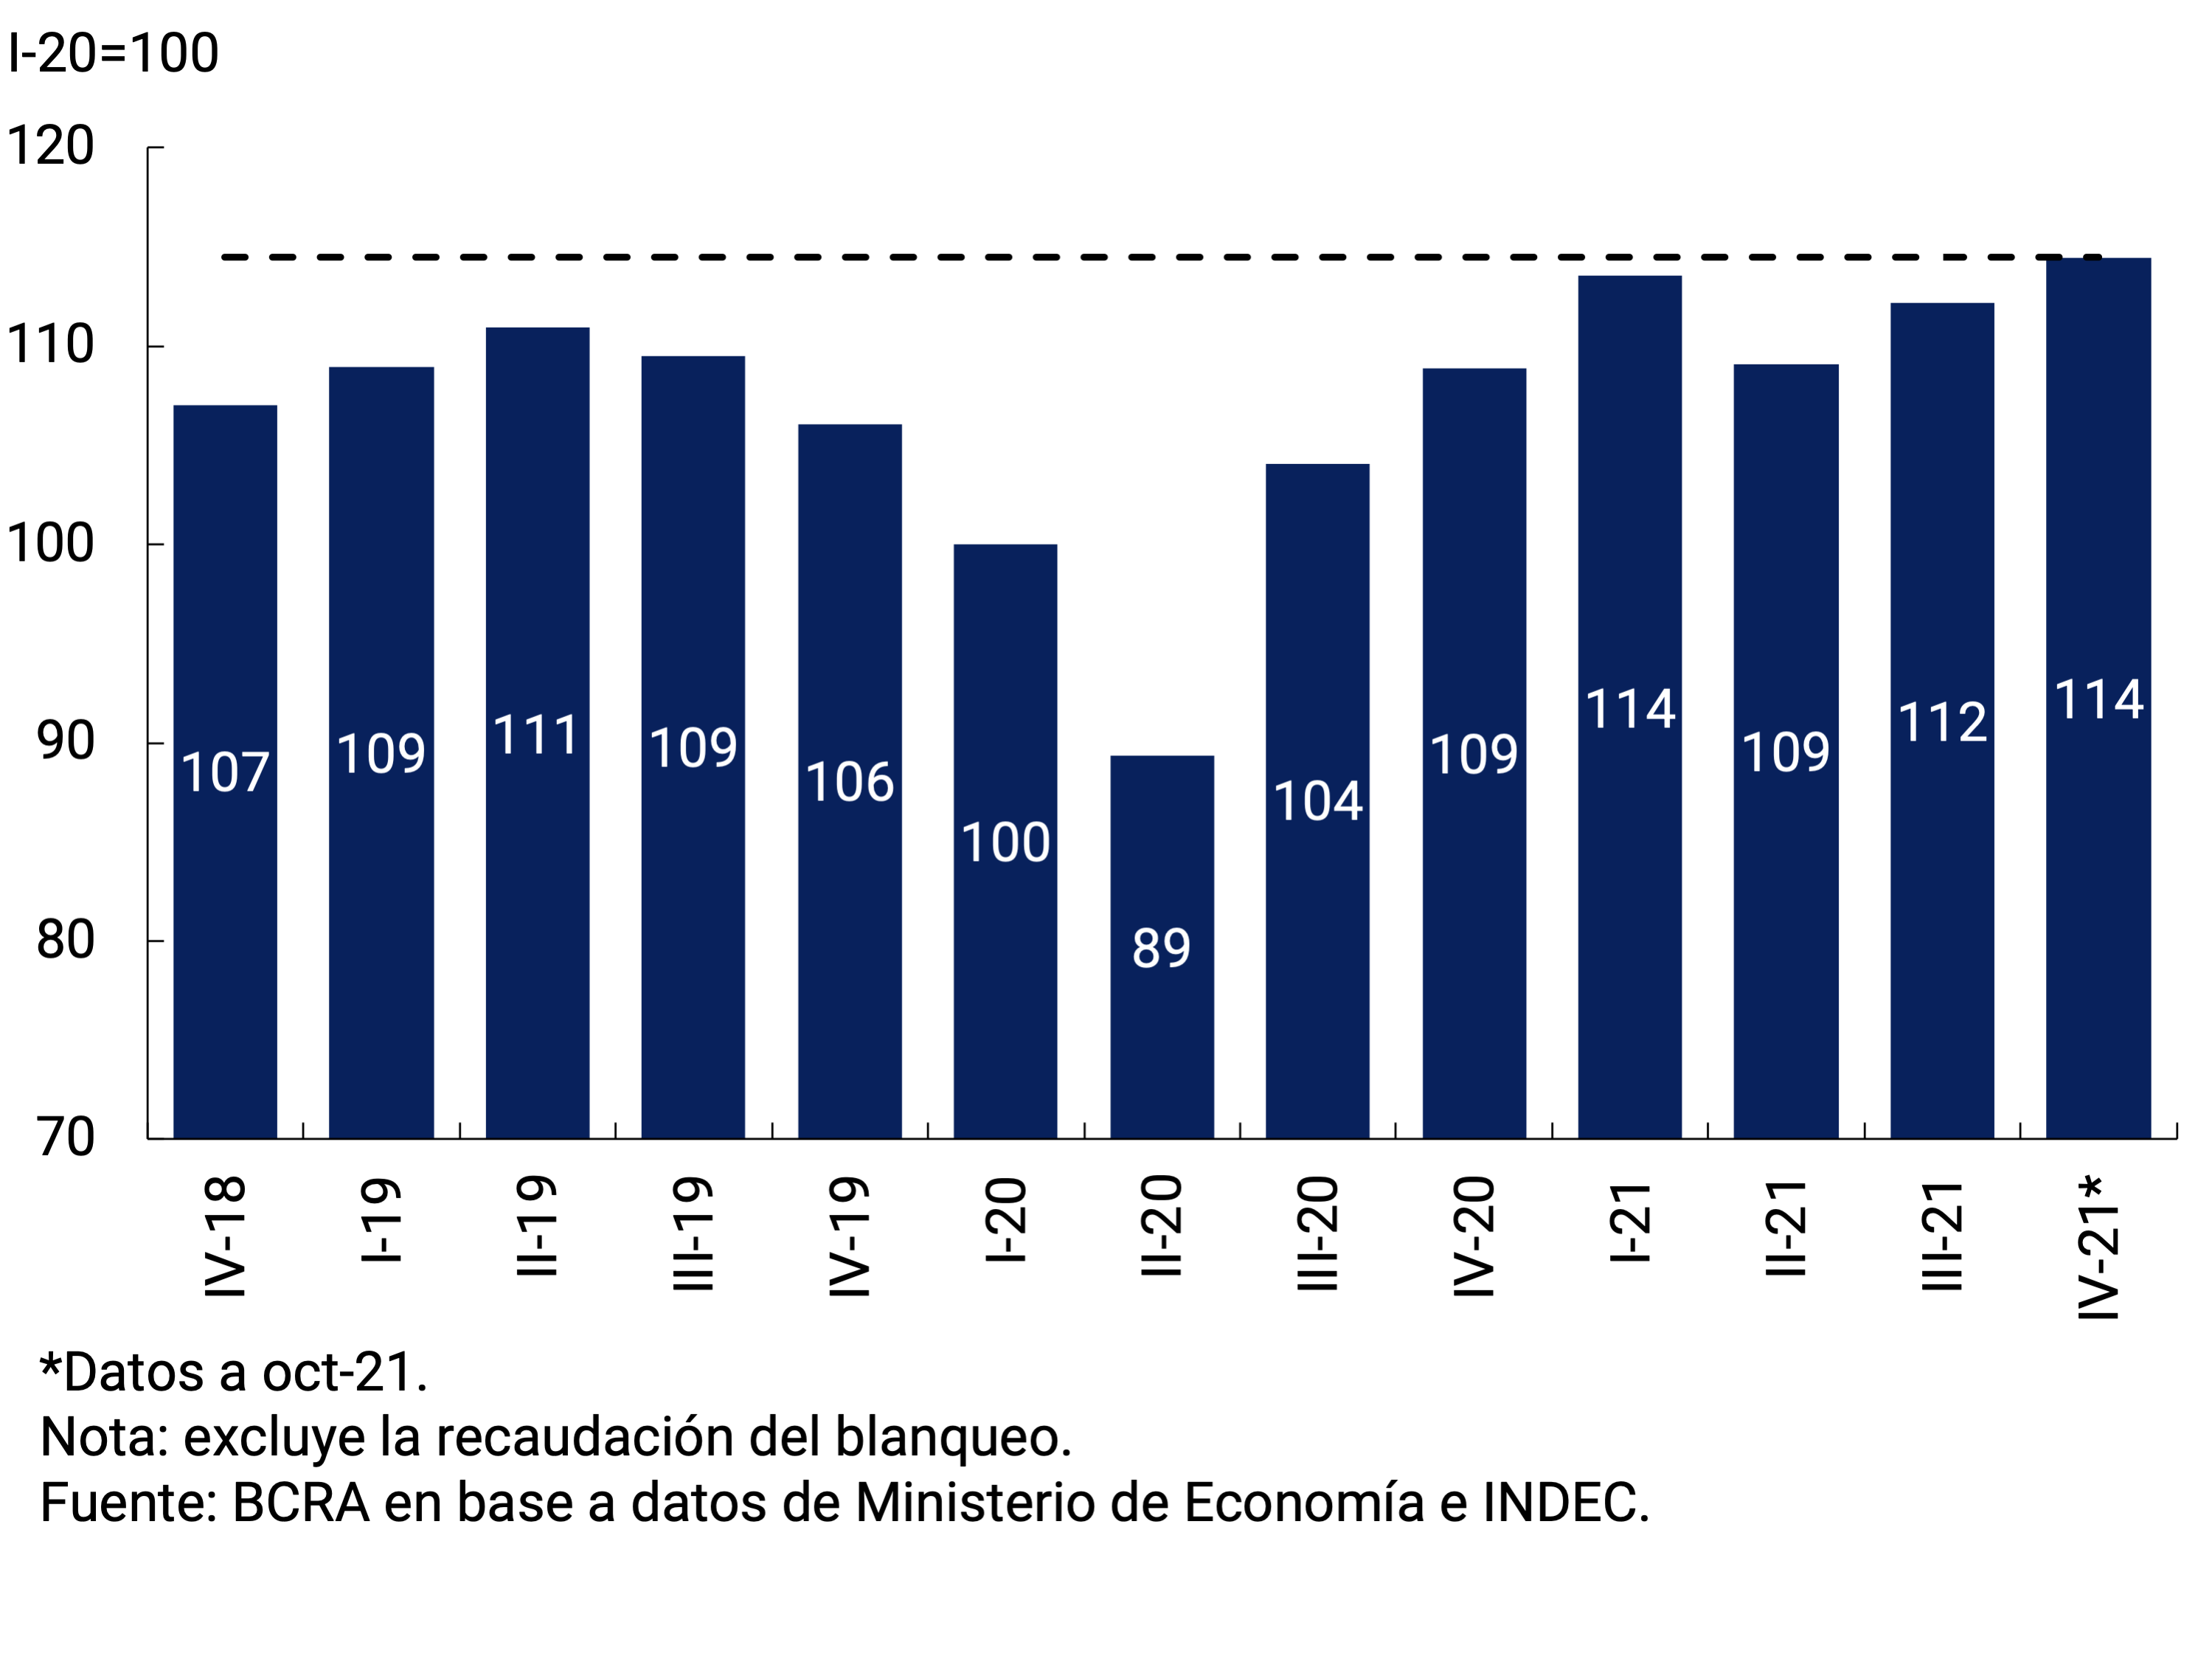
In real terms, seasonally adjusted national tax revenue grew 2.9% in the third quarter and 2.0% at the beginning of the fourth quarter (with data as of October; see Figure 5.2). The set of real national taxes, discounting seasonal effects, are 12.2% above the pre-pandemic level (first quarter 2020) in the third quarter and 14.4% in the fourth (with data as of October). This performance shows the recovery of tax revenues after the harmful effects of the COVID-19 pandemic.
The evolution of tax revenues allowed the total revenues of the National Non-Financial Public Sector (NFPS) to increase in nominal terms by 102.2% y.o.y. (33% y.o.y. in real terms) between July and September, after having increased 99.4% y.o.y. during the second quarter of the year. The year-on-year comparison of the third quarter was impacted by the calculation in current transfers of the extraordinary allocation of Special Drawing Rights (SDRs) that the IMF made in the context of the global crisis due to the COVID-19 pandemic. Net of this effect, funds would have shown a nominal increase of 69.7% in the quarter. Non-tax revenues increased by 1,209% y.o.y. in the third quarter due to the allocation of resources associated with the Solidarity and Extraordinary Contribution to Help Mitigate the Impact of the pandemic (between July and August, $61,641 million were recorded for this concept and accumulating $231,609 million in the year; Law 27605) and the allocation of SDRs (for about $427,400 million). Property rents increased 118% y.o.y. between July and September, from the collection of services of loans granted by the National Social Security Administration (ANSeS) – which was suspended during the same period last year. Meanwhile, capital resources continued to decrease in year-on-year terms in the third quarter, affected by the provisions of Law 27574 on the defense of the assets of the Sustainability Guarantee Fund (FGS), which stipulates the suspension of financing to the ANSES by the FGS to meet the disbursements of the Historical Reparation program.
Meanwhile, the tax collection of the provinces as a whole exhibited a behavior consistent with what was observed at the national level. According to the partial information available for the main districts, in the third quarter of the year the nominal advance of own tax resources would have shown an increase of more than 65% y.o.y., still impacted by the low base of comparison of the same quarter of 2020.
5.2. Seasonally adjusted NFPS primary expenditure showed a year-on-year increase in real terms in the third quarter, remaining above pre-pandemic levels
NFPS primary expenditure exhibited a nominal increase of 50.0% YoY in the third quarter and 38.4% YoY in the year to date, below the nominal increase in revenues in the nine months of 2021. In real terms, expenses decreased 1.2% YoY in the quarter and 6.3% YoY in the nine months of the year accumulated. Meanwhile, revenues31 at constant prices increased 11.8% and 25.6% y.o.y. in the third quarter and so far this year, respectively (see Figure 5.3).
Figure 5.3 | NFPS Primary Revenue and Expenditure

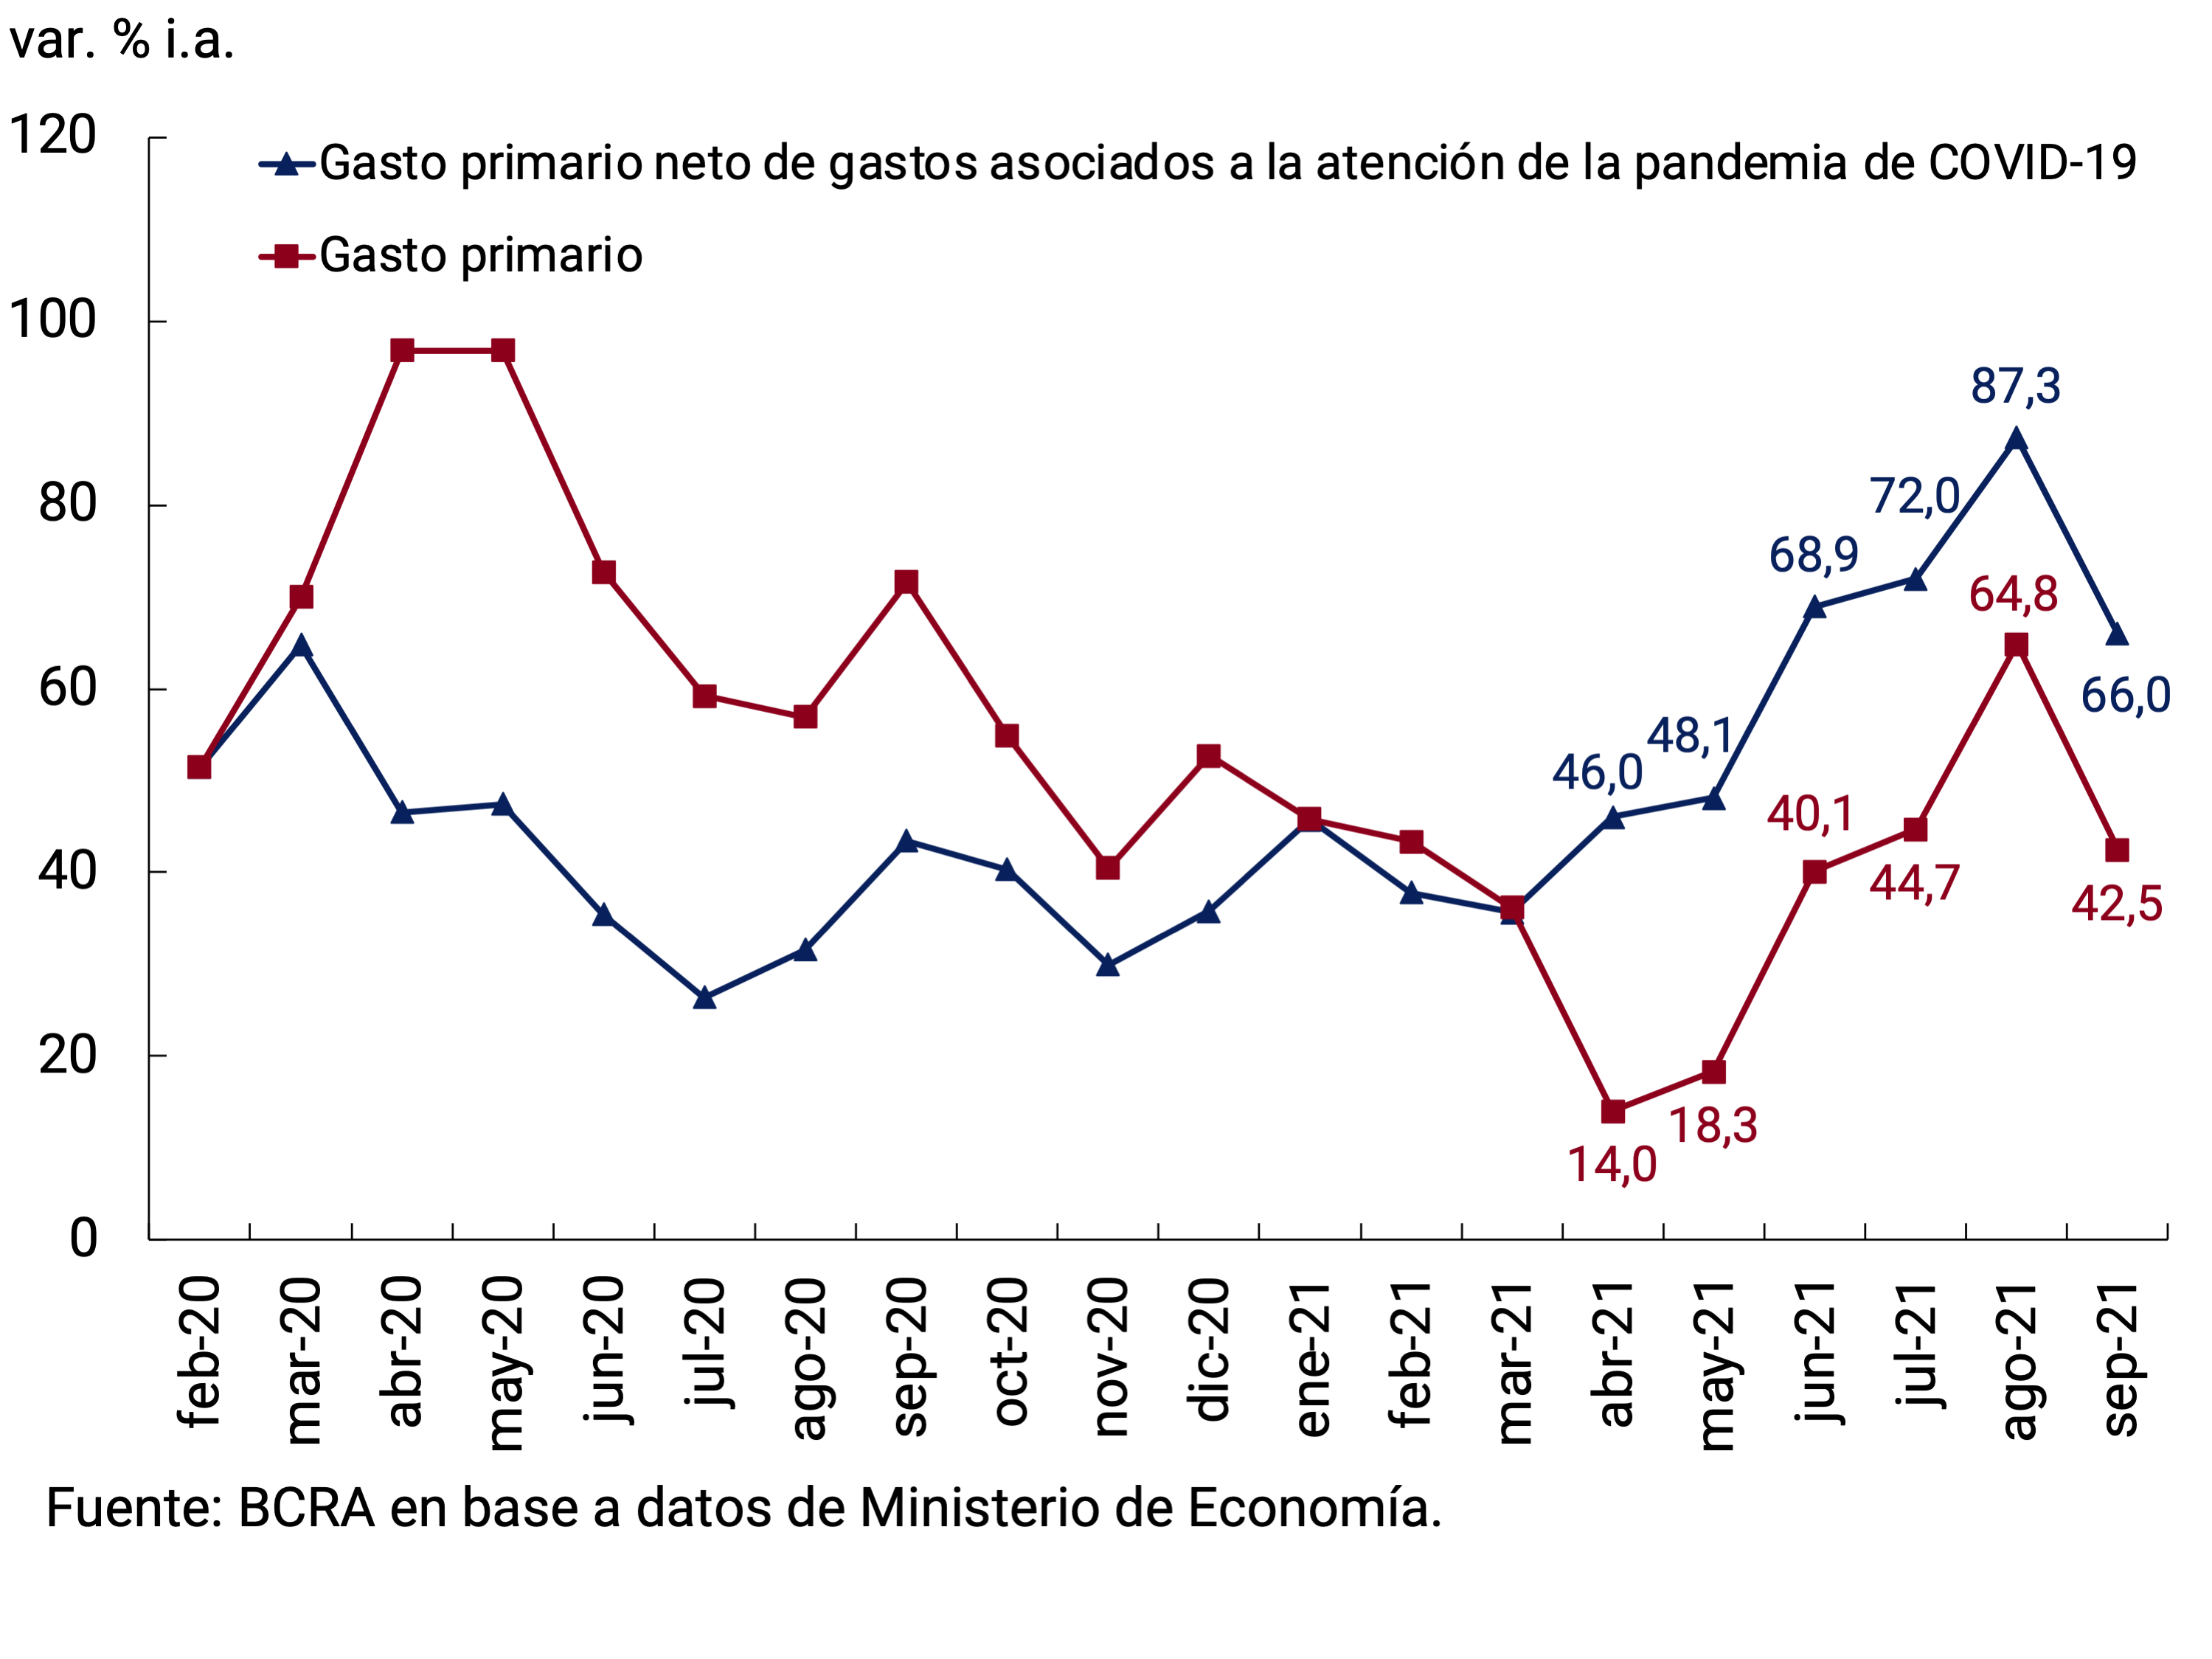
It should be taken into account that during most of the current year the public accounts were affected by a basis of comparison that includes the effects of the pandemic, whose greatest deployment was concentrated in the second and third quarters of 2020. Indeed, excluding extraordinary expenditures in 2020 and 2021 aimed at mitigating the effects of the pandemic and accompanying the most affected sectors, since April 2021 primary expenditure has expanded at a nominal rate approximately 25 p.p. higher than that of primary expenditure without deductions for COVID-19 expenditure (see Figure 5.4).
Figure 5.4 | NFPS primary expenditure and COVID-19 expenditure
In this sense, if real seasonally adjusted primary expenditure is observed, it was 13% above the pre-pandemic level (I-20) in the third quarter of 2021 and exhibited an increase of 15% year-on-year (see Figure 5.5).
Figure 5.5 | NFPS-adjusted real seasonally adjusted primary expenditure
During the third quarter of 2021, social security benefits accounted for most of the increase in primary spending: they grew 45.5% YoY (vs. +32.2% YoY in the first half of the year)32, within the framework of the provisions of the Pension Mobility Law33. Regarding social programs, the expenditures of the Food Policies program were highlighted due to the increase in the allocation of 50% and the expansion of the universe of beneficiaries up to 14 years of age, as of February 2021, and of the Empower Work program due to the increase in both the number of people and the Minimum Living and Mobile Wage since September. In turn, payments from the Employment Actions program – mainly REPRO II – registered a significant increase in order to assist the productive sectors critically affected by the pandemic. On the other hand, the growth of the Universal Child Allowances for Social Protection (AUH) and the Universal Pregnancy Allowance (AUE) (+88.0% in the quarter, +56.3% in the year) is explained by the advance of the supplement corresponding to the submission of Affidavits for schooling34. In order to sustain the purchasing power of the most vulnerable older adults, ANSES also ordered the granting in August of a $5,000 bonus to retirees and pensioners who receive up to two minimum salaries.
In a context in which the National Government promoted a policy of containing the rates of public services – electricity, gas, water and public transport – economic subsidies explained a significant portion of the year-on-year increase in spending: they grew 118.8% YoY in the third quarter and 89.5% YoY during the first nine months of the year. The increase was disseminated among the main destinations associated with energy and public passenger transport.
Items associated with salaries (including transfers to universities) grew 56.1% YoY in the third quarter and 44% YoY between January and September, while other current expenditures grew by 163.5% YoY and 111.6% YoY, respectively. It should be noted that in this last item the purchases of goods and services are recorded (including the expenditures associated with the purchase of vaccines and the expenses associated with the organization of the national electoral act) and the deficit of public companies, among others. On the other hand, current transfers to the provinces moderated significantly (28.8% y.o.y. in the third quarter) compared to 2020, when the National Government had extraordinarily assisted the districts in the face of the abrupt decrease in collection. This performance was verified despite the fact that since the beginning of 2021, the transfers associated with the creation of the Fund for the Fiscal Strengthening of the Province of Buenos Aires began to be budgeted35.
Capital expenditure continued to show dynamism, in line with the definition of priorities set out in the 2021 National Budget to boost the recovery of economic activity. In fact, Real Direct Investment (IRD) grew 193% YoY during the third quarter, while transfers for capital expenditures increased 37% YoY in the36th quarter. In the first nine months of the year, capital expenditure increased 113.6% YoY.
Thus, the primary deficit of NFPS accumulated in the last 12 months to September represented approximately 1.4% of GDP (see Figure 5.6). Net of the $427.4 billion from the extraordinary allocation of Special Drawing Rights that the IMF made in the context of the global crisis caused by the COVID-19 pandemic, the primary deficit accumulated in the last 12 months to September represented approximately 2.5% of GDP, below the annual forecast contained in the 2022 National Budget Bill —see Box. 2022 National Budget Bill (PPN-22)—. For its part, the financial deficit of the NFPS accumulated in the same period stood at 2.9% of GDP (3.9% net of SDRs).
Figure 5.6 | NFPS result (cumulative 12 months)
Box. National Budget Bill 2022 (PPN-22)
On September 15, the National Government presented the 2022 National Budget Bill.
With a revenue forecast similar to that estimated for 2021 as a proportion of GDP, the PPN-22 projects an increase in tax collection that compensates for the reduction in non-tax revenues (which in 2021 include the resources that were collected only once associated with the Extraordinary Solidarity Contribution).
On the expenditure side, the official document forecasts stable primary expenditure in real terms, although implying a reduction of 0.7 p.p. of GDP in 2022. The reduction is concentrated in current transfers, consumption expenditures and other current expenditures. For its part, the PPN-22 foresees a significant dynamism of the capital expenditure item to reach 2.6% of GDP in 2022 after estimating an execution of an amount equivalent to 2.3% of GDP in 2021.
Given the stable trajectory of resources and the decline in primary expenditures, the project foresees a reduction in the NFPS primary deficit from 4% of GDP in 2021 to 3.3% of GDP in 2022.
Table 5.1 | Draft National Budget Law 2022
National Non-Financial Public Sector

The financial result would fall from -5.4% of GDP to -4.9% of GDP in 2022. The budget document does not contemplate the transfer of profits from the BCRA for 2022. Regarding the financing of the BCRA to the National Treasury (TN), an amount of $1.08 billion associated with net financial assistance from Transitory Advances is foreseen and provides for the full refinancing of the debt maturities in the BCRA’s portfolio.
5.3. In contrast to the previous year, so far in 2021 the National Government has met its needs with less monetary financing despite the increased recent assistance
During the third quarter of 2021, the TN achieved a refinancing of 108% of principal and interest services (around 106% refinancing in October), which implied a net financing of approximately $57,300 million (to which was added about $29,700 million in October)37, accumulating a net financing in the year of about $443,300 million (around the 117% refinancing rate). Issuances of public debt instruments during the quarter were mainly with fixed-rate securities and adjustable by CER, and to a lesser extent with securities adjusted to the evolution of the dollar and at a variable rate.
The extension of the maturities of the instruments issued remained relatively stable during the quarter, while there was an increase in the cost of financing in pesos. For its part, during the month of June and July 2021, voluntary debt conversion operations were carried out, which made it possible to significantly decompress the profile of short-term maturities. With the aim of developing the local peso debt market, the participation of the 2021 Aspiring Market Makers continued to be strengthened, and the menu of investments available to Mutual Funds (FCI) was expanded from the auctions of Treasury Liquidity Bills (LELITES), while the Central Bank continued to operate in the public securities futures market.
So far in 2021, in contrast to the same period last year, lower monetary financing of the needs of the NT continued to be observed, even despite the greater assistance observed in recent months. In line with budget forecasts, so far this year $787,700 million have been transferred as a transfer of profits from the BCRA to the TN. Likewise, until mid-November, there was a net granting of net Transitory Advances from the BCRA to the TN for $147,600 million. It is worth highlighting the decision of the National Treasury to cancel Transitory Advances with the $422,174 million received as a counterpart to the sale of SDRs assigned by the International Monetary Fund (IMF) to the Central Bank of the Argentine Republic38. In addition, the National Executive Branch ordered the placement to the BCRA of SDR bills for an amount equivalent to US$4,334 million to the BCRA, the proceeds of which may only be applied to the payment of obligations to the IMF39.
6. Pricing
Average monthly retail inflation in the third quarter was 3%, reducing in relation to the previous quarter, in a period with limited variations in the nominal exchange rate and a policy of containment of public service rates by the National Government. However, after the gradual deceleration of inflation that was evident from April to August, the records for September and October amounted to 3.5% and accumulated 52.1% in 12 months. Core inflation, that is, that which discounts the effects of seasonal and regulated prices, remained close to 3.2% since July, manifesting an inertia that still remains at high levels.
In recent months, transitory factors qualitatively anticipated in previous versions of the IPOM have had a greater impact than expected. Within core inflation, the prices of services increased at a faster rate than those of goods, after their relative price deteriorated steadily since the first quarter of 2019. In line with what was anticipated in the previous IPOM, this performance was due to the recovery of the demand for private services in the face of the reopening of activities within the framework of the improvement in the epidemiological situation and, to a lesser extent, to the updates of the wage parity agreements. In the same vein, international prices had an impact – based on the higher costs of global manufacturing and lately on energy prices – supply restrictions on some products, the observed recomposition of marketing margins in certain sectors and higher inflation expectations in a context of greater financial volatility.
Wholesale prices reversed their slowdown trend in August, although monthly variations during the third quarter remained on average at lower levels than those of the previous quarter, especially in manufactured goods. The Domestic Wholesale Price Index (IPIM) and the materials that make up the Construction Cost Index (CCI) increased at a slower rate than that of retail goods, although higher than that evidenced by the exchange rate, partly influenced by international prices.
Going forward, the BCRA will direct its efforts to promote a macroeconomic environment with lower inflation levels than those currently observed, without damaging the economic recovery underway. The maximum price setting program, for a representative set of mass consumption products launched in mid-October by the National Government, would contribute in the same sense during the last months of the year. In the remainder of 2021, monthly inflation rates are expected to oscillate around the average recorded in the third quarter while, due to the base effect of comparison, year-on-year rates would begin to decline only towards the end of the year.
6.1. Inflation fell in the third quarter and increased since September
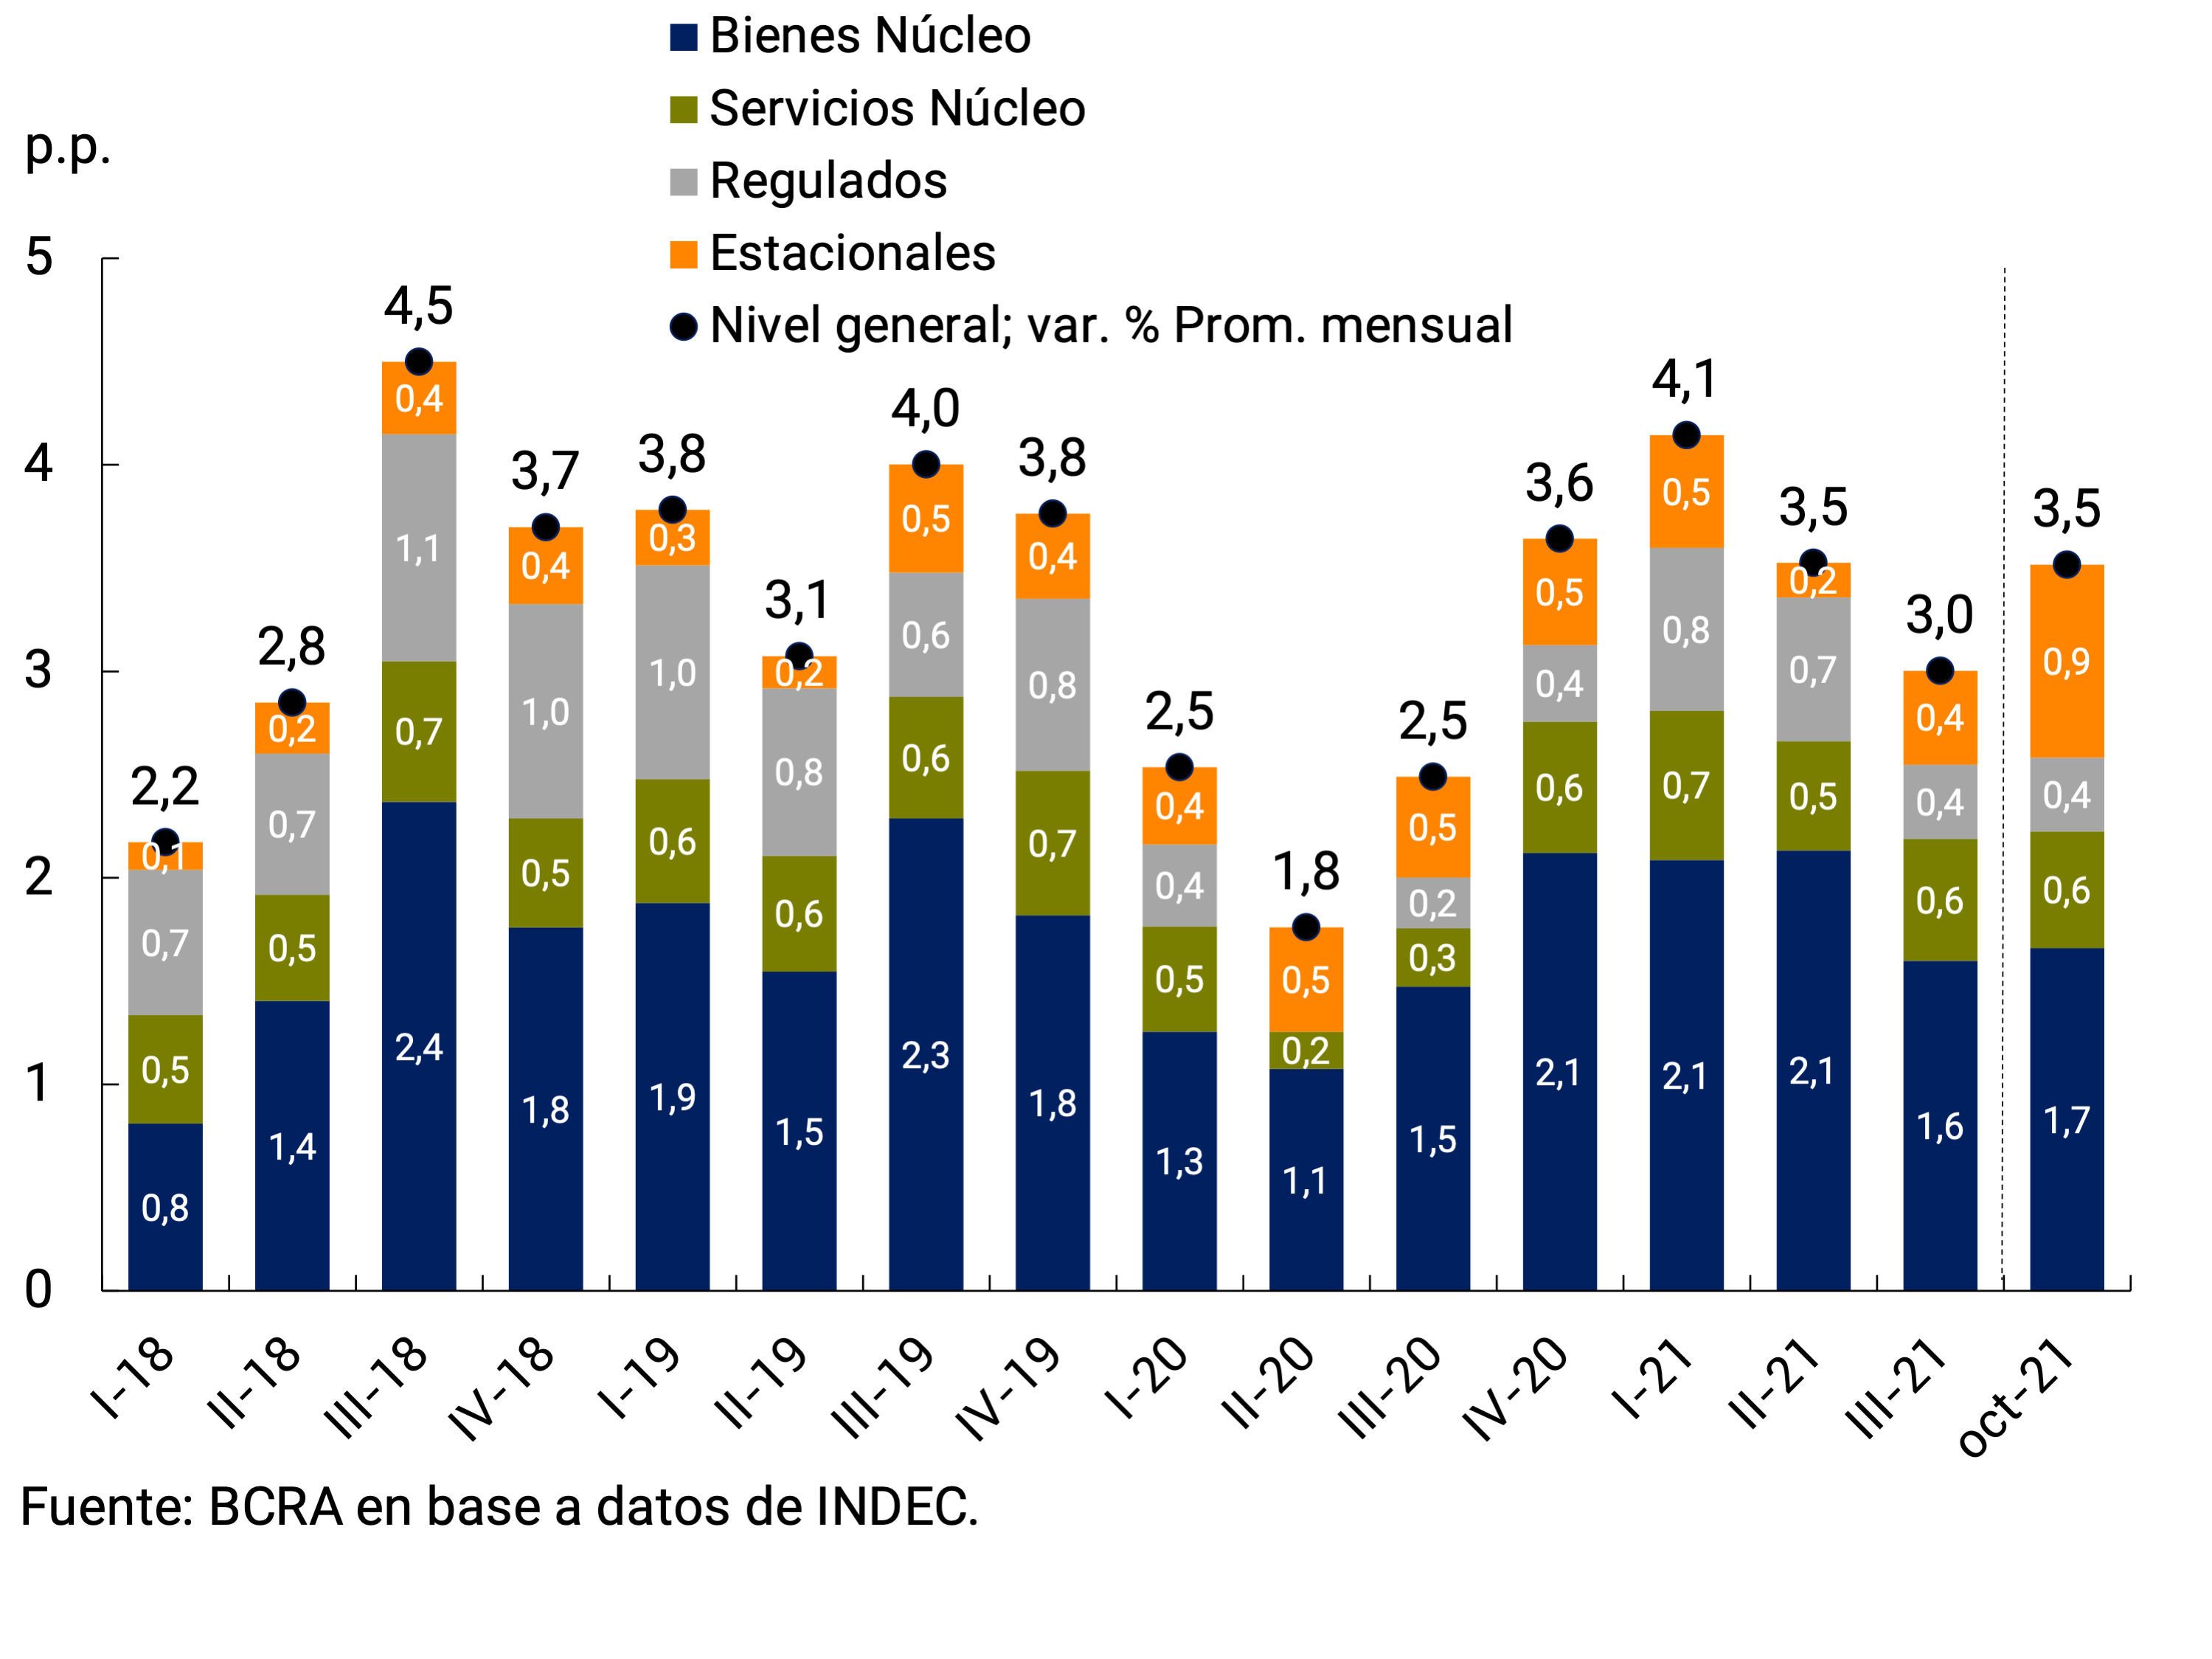
During the third quarter of 2021, retail prices registered an average monthly increase of 3.0%, slowing down 0.5 p.p. compared to the previous period (see Figure 6.1). Quarterly inflation was the lowest since the third quarter of 2020, being one of the lowest records in the last three years. After the trend of gradual reduction in inflation that was evident from April to August, the records for September and October rose and stood at 3.5%.
Figure 6.1 | CPI. Monthly and quarterly evolution of the General Level

The slower rate of increase in the Consumer Price Index (CPI) in the third quarter was mainly explained by the slowdown in the Core category (3.2% monthly average, -0.7 p.p. compared to II-21) and, to a lesser extent, by the Regulated category (1.8%, -1.7 p.p.), favored by the containment of public service rates. The Seasonal category (3.9%, +2.5 p.p.) accelerated, as is usually the case in the same period each year, mainly due to the higher rate of increase in the prices of tourism-related services and also of fruit and vegetables (see Graph 6.2, see Section 5/ Seasonal prices and their influence on the volatility of monthly inflation).
Figure 6.2 | CPI. Contributions of Seasonal, Regulated and Core Goods and Services in the Quarter
The reduction in inflation in the third quarter was a consequence of the slowdown in goods (3.0% monthly average, -0.9 p.p. compared to II-21), in a context of limited variations in the exchange rate. At the divisional level, Food and non-alcoholic beverages (2.6% monthly average, -0.9 p.p. compared to II-21) was the one with the greatest contribution to the reduction in the rate of increase in goods. The slowdown in Clothing and footwear also had a lesser impact (3.5% monthly average, -0.3 p.p. compared to II-21). On the other hand, the Alcoholic Beverages and Tobacco division (3.7%, +0.1 p.p. compared to II-21) accelerated slightly.
The slowdown in Food and beverages was seen in both packaged and fresh products, although the recovery in the relative prices of processed products continued after the update of the price agreement programmes. The more limited rate of increase in fresh foods was explained by the evolution of meats and their derivatives, which offset the higher records of vegetables and fruits. In fact, retail beef prices sharply cut their rate of expansion for the third consecutive quarter, averaging a monthly variation of 1% in the quarter (-3.3 p.p. compared to II-21), contributing significantly to the reduction of core inflation. In September and early October, the prices of packaged foods accelerated and, in this context, the National Government launched the maximum price program on a set of 1,432 products of mass consumption41.
On the other hand, the prices of services (3.0% monthly average, +0.4 p.p. compared to II-21) accelerated during the third quarter and grew at a slightly faster rate than that of goods. This performance, in line with what was anticipated in the previous IPOM, was mainly due to the recovery of demand for private services, which are mainly part of the Core category of the CPI, driven by the reopening of activities in the face of the improvement in the epidemiological situation. To a lesser extent, the updates of the wage parity agreements that took place in the third quarter would also have helped to explain the higher rate of increase in services. The divisions that contributed the most to the acceleration were Restaurants and hotels (3.9% monthly average, +0.3 p.p. compared to II-21) and Recreation and culture (3.5%, +1.2 p.p.; see Figure 6.3).
Figure 6.3 | CPI Core disaggregated. Average monthly change by quarter and contributions by selected components

The prices of tourist services that make up the Seasonal category – accommodation, transportation, packages and excursions – generally increase their rate of increase in the third quarter of each year due to the winter recess. In 2021, the acceleration would have been greater due to the recovery in demand driven by the reduction of restrictions and by the stimulus plan for the sector launched by the National Government (Previaje).
On the other hand, regulated services slowed down in the third quarter as a result of the deepening of the policy of containing the rates of public services – electricity, gas, water and transport – by the National Government. The reduction in the gas rate in some locations of the country as a result of the extension of the Cold Zone Regime as of August had a special impact on the quarter.
Regarding the rest of the regulated services, the authorized increases in the fees of prepaid medicine42 and private schools continued to stand out. On the other hand, the price of telephony and internet slowed the rate of increase during the third quarter.
6.2. The reduction in wholesale inflation during the third quarter was more pronounced than in retail goods
In the third quarter, wholesale prices captured by the Domestic Wholesale Price Index (IPIM) continued to grow at an average monthly rate lower than that of retail goods and verified a more pronounced deceleration (2.5%, -1.2 p.p. compared to II-21). After the downward trend in monthly registrations that occurred between February and July, the variations of the IPIM rose slightly. Since mid-2020, wholesale prices, as well as retail prices, have continued to grow at a faster rate than the nominal exchange rate, a dynamic that would be partially explained by the impact of international commodity prices (see Figure 6.4).
Figure 6.4 | IPIM, nominal exchange rate and international commodity prices (IPMP)
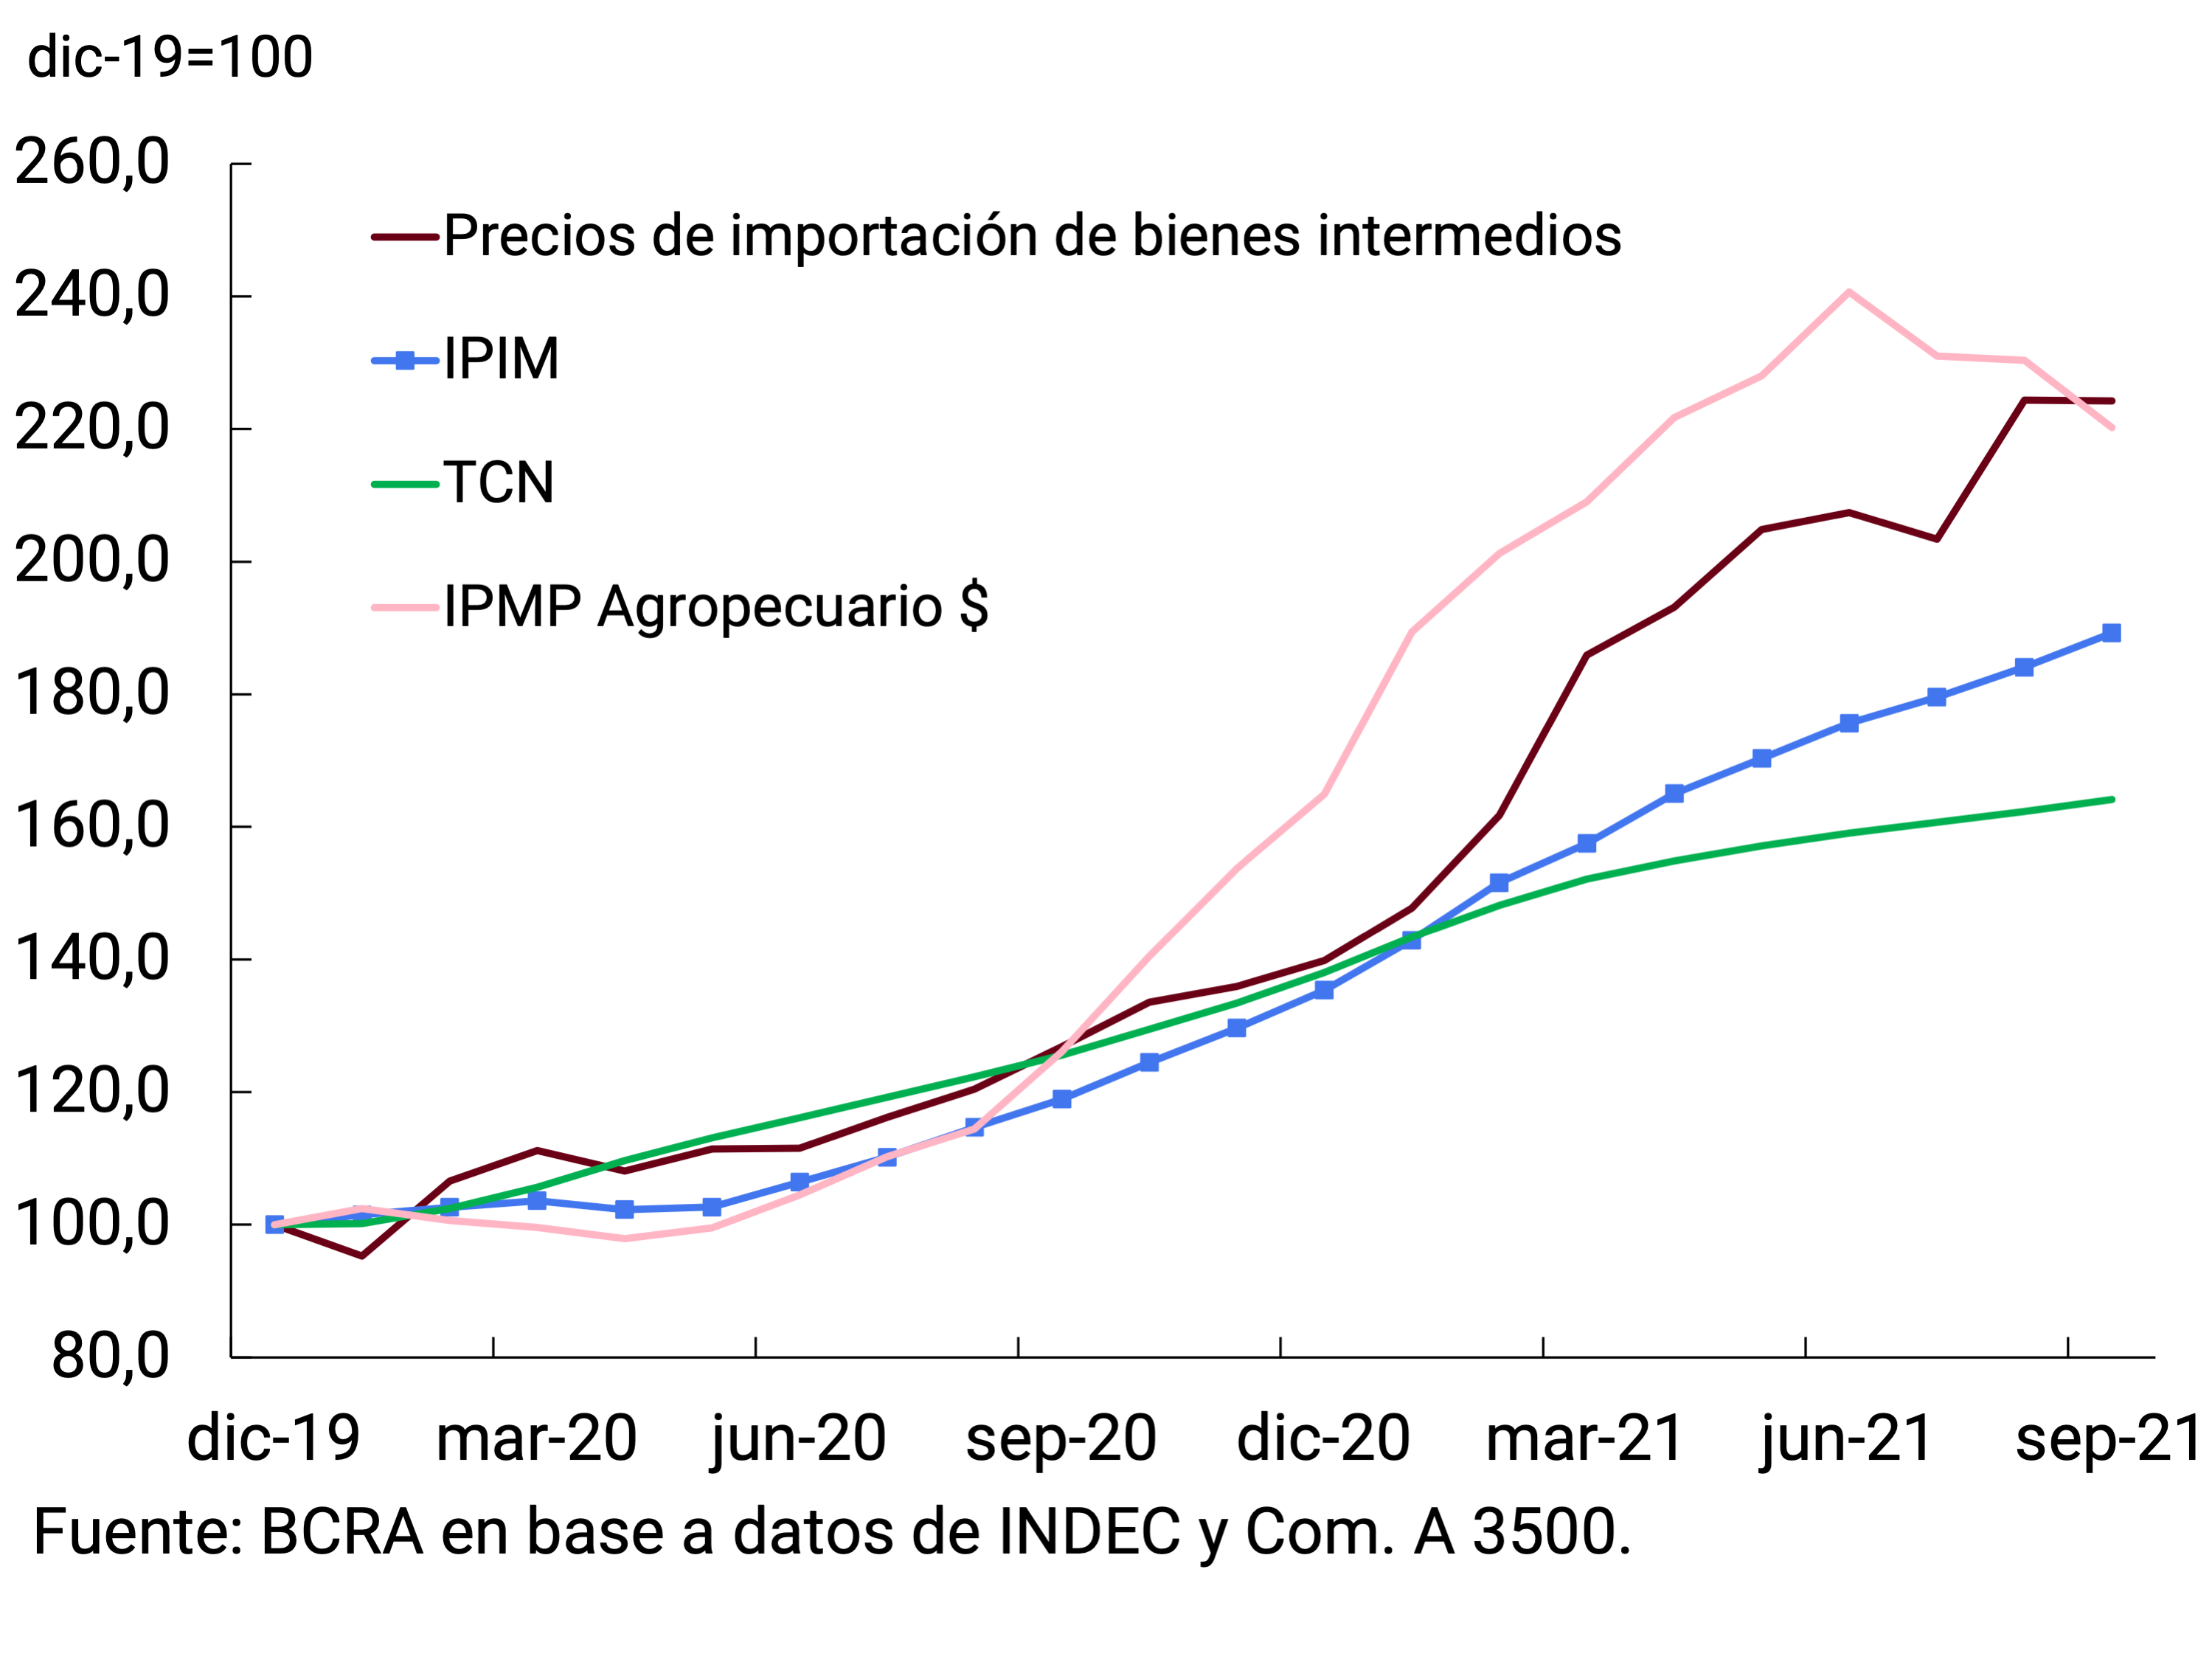
Within the IPIM, Manufactured Products (2.7%, -1.7 p.p. compared to II-21) were the ones that contributed the most to the slowdown in the quarter, mainly reflecting the lower rate of increase in Refined Petroleum Products (0.9% monthly average, -6.5 p.p.) and, to a lesser extent, Chemical Substances and Products (2.4% monthly average, -2.2 p.p.). Heterogeneous behaviors were recorded in the rest of the components of the group (see Figure 6.5). Imported products also moderated their rate of increase compared to the previous quarter (2.1% monthly average, -0.4 p.p.), while Primary Products saw a slightly higher increase (2.1% monthly average, +0.1 p.p.).
Figure 6.5 | Evolution and contributions of the IPIM and the nominal exchange rate

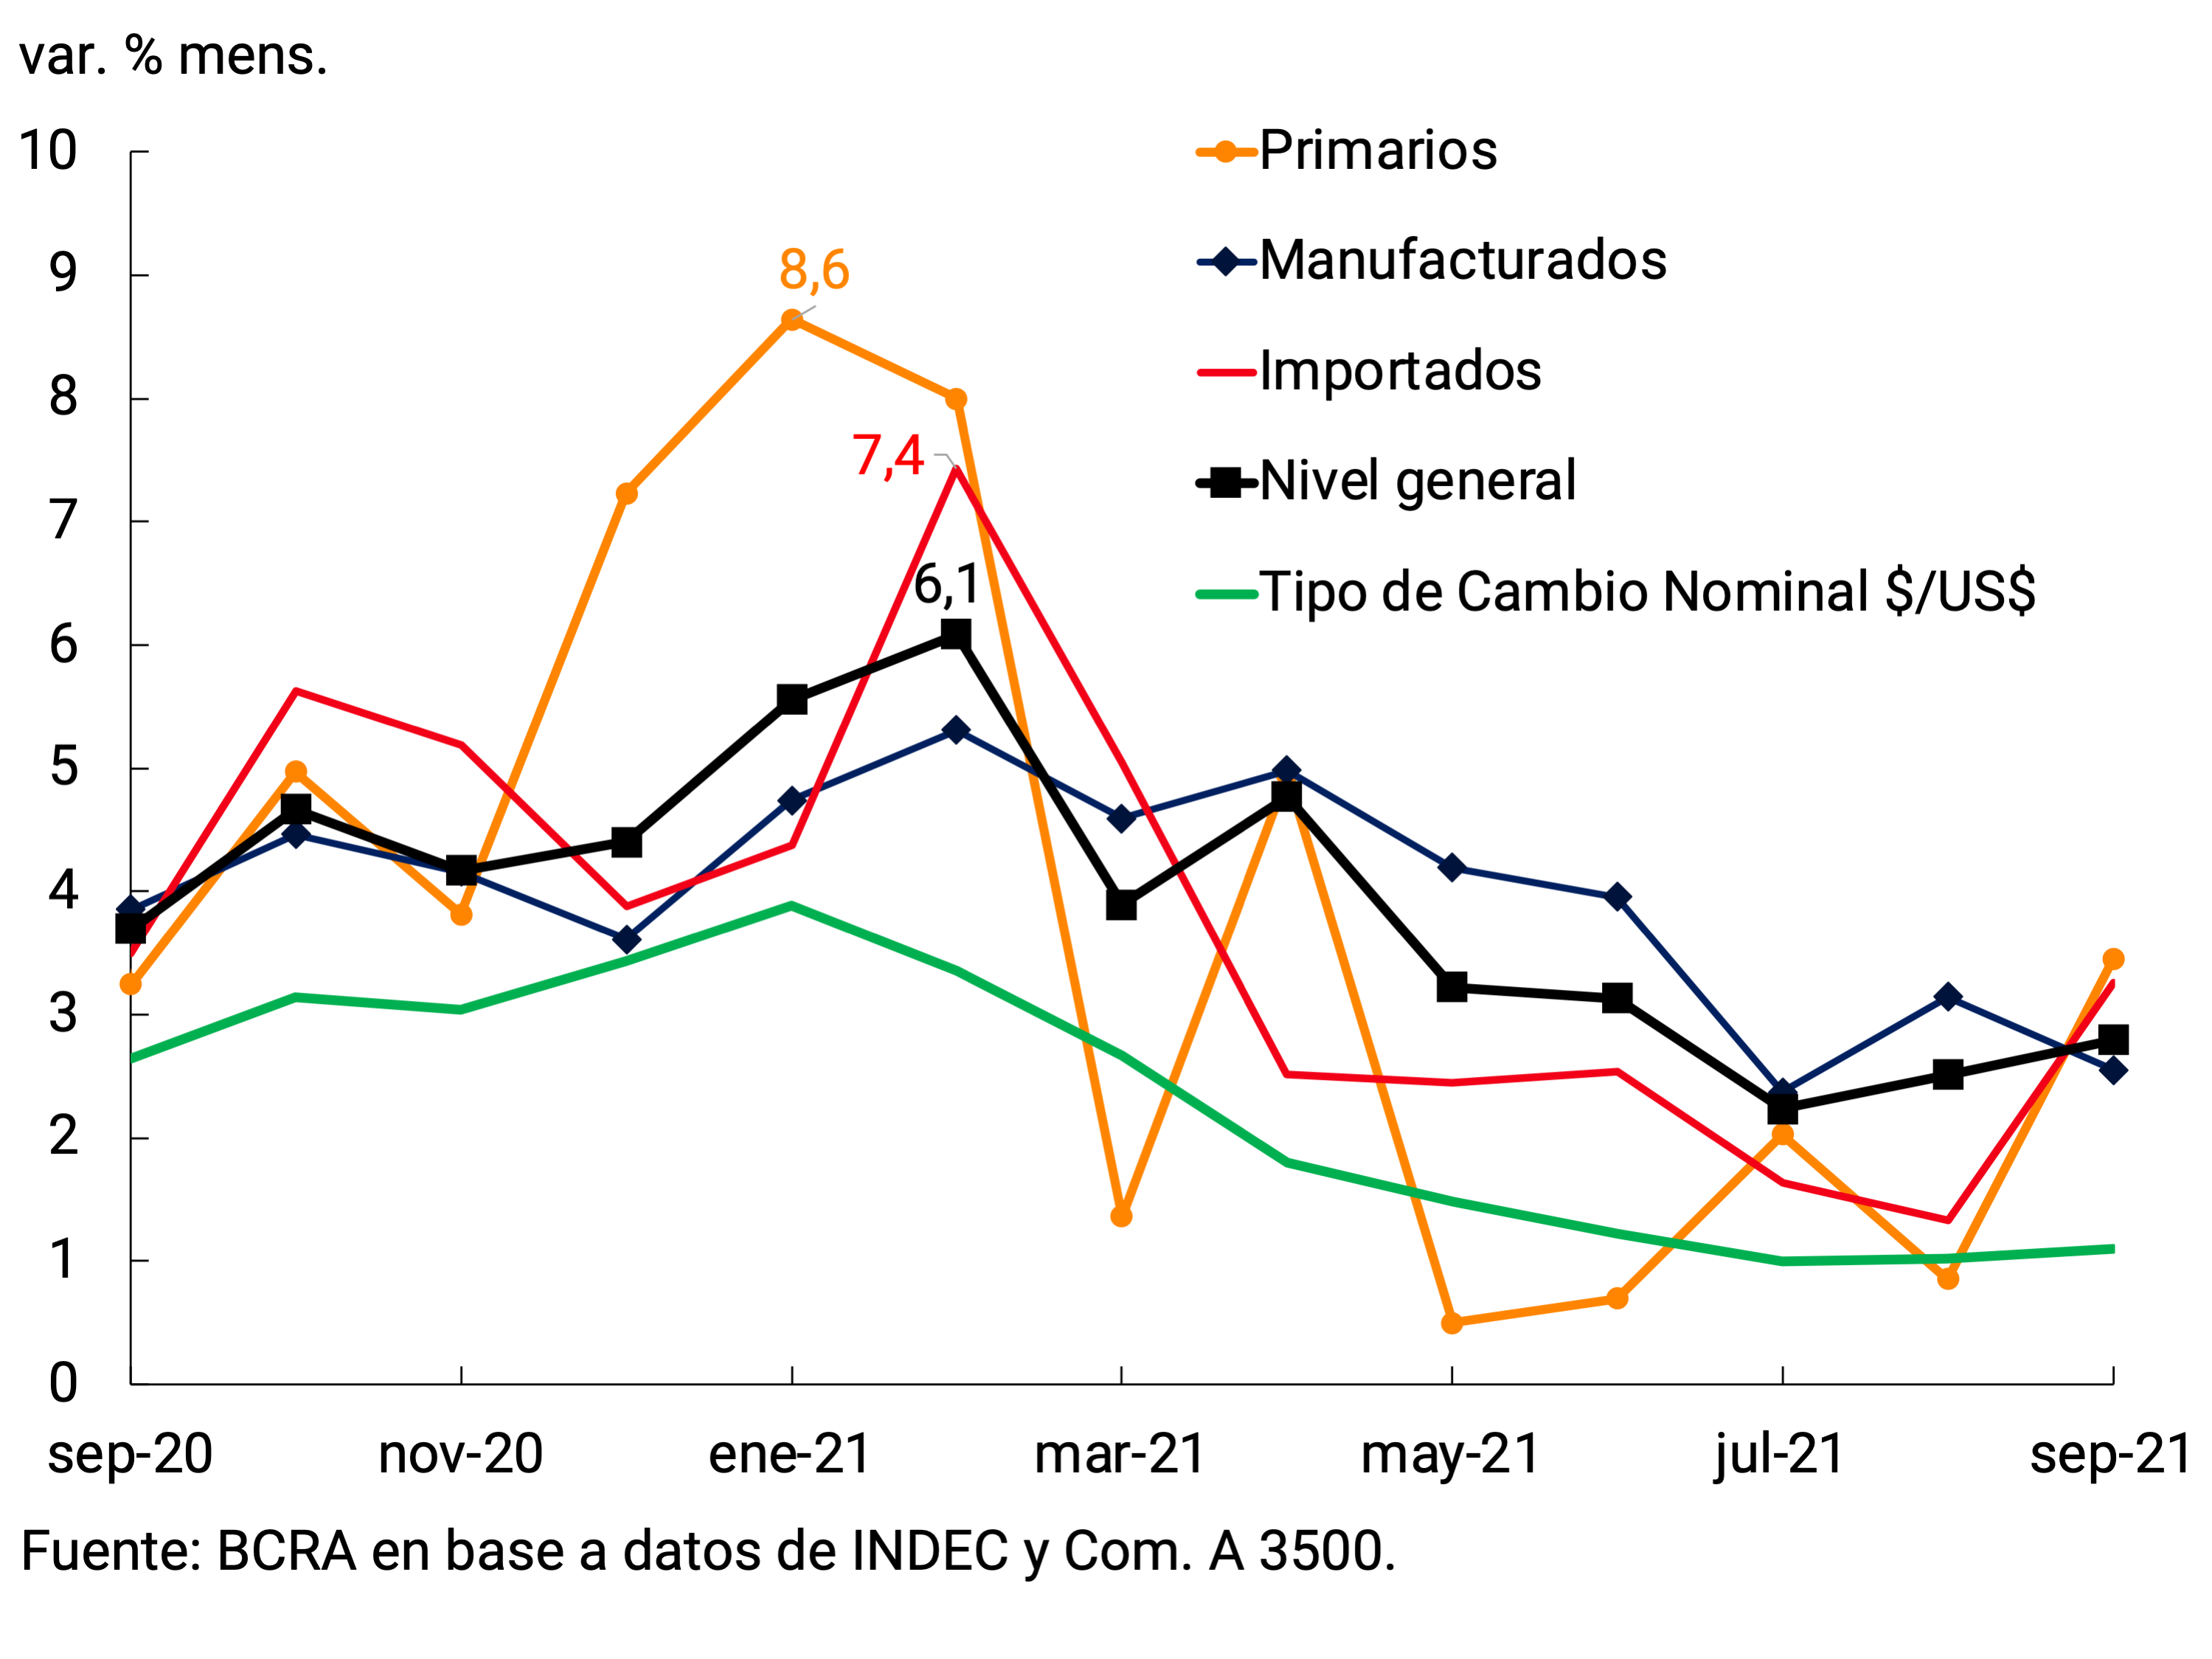
Construction costs also slowed down during the third quarter, although they maintained an average rate of increase higher than that of wholesale prices (3.4% monthly average, -0.5 p.p. compared to II-21). The deceleration was mainly explained by the evolution of Materials (2.9%, -1.0 p.p.), whose variations continued the downward trend they have registered since the end of 2020. The Labor chapter maintained a similar rate of increase to that of the previous quarter (3.8% monthly average), reflecting the impact of the sector’s parity brackets in July and September (see Figure 6.6).
Figure 6.6 | Construction costs
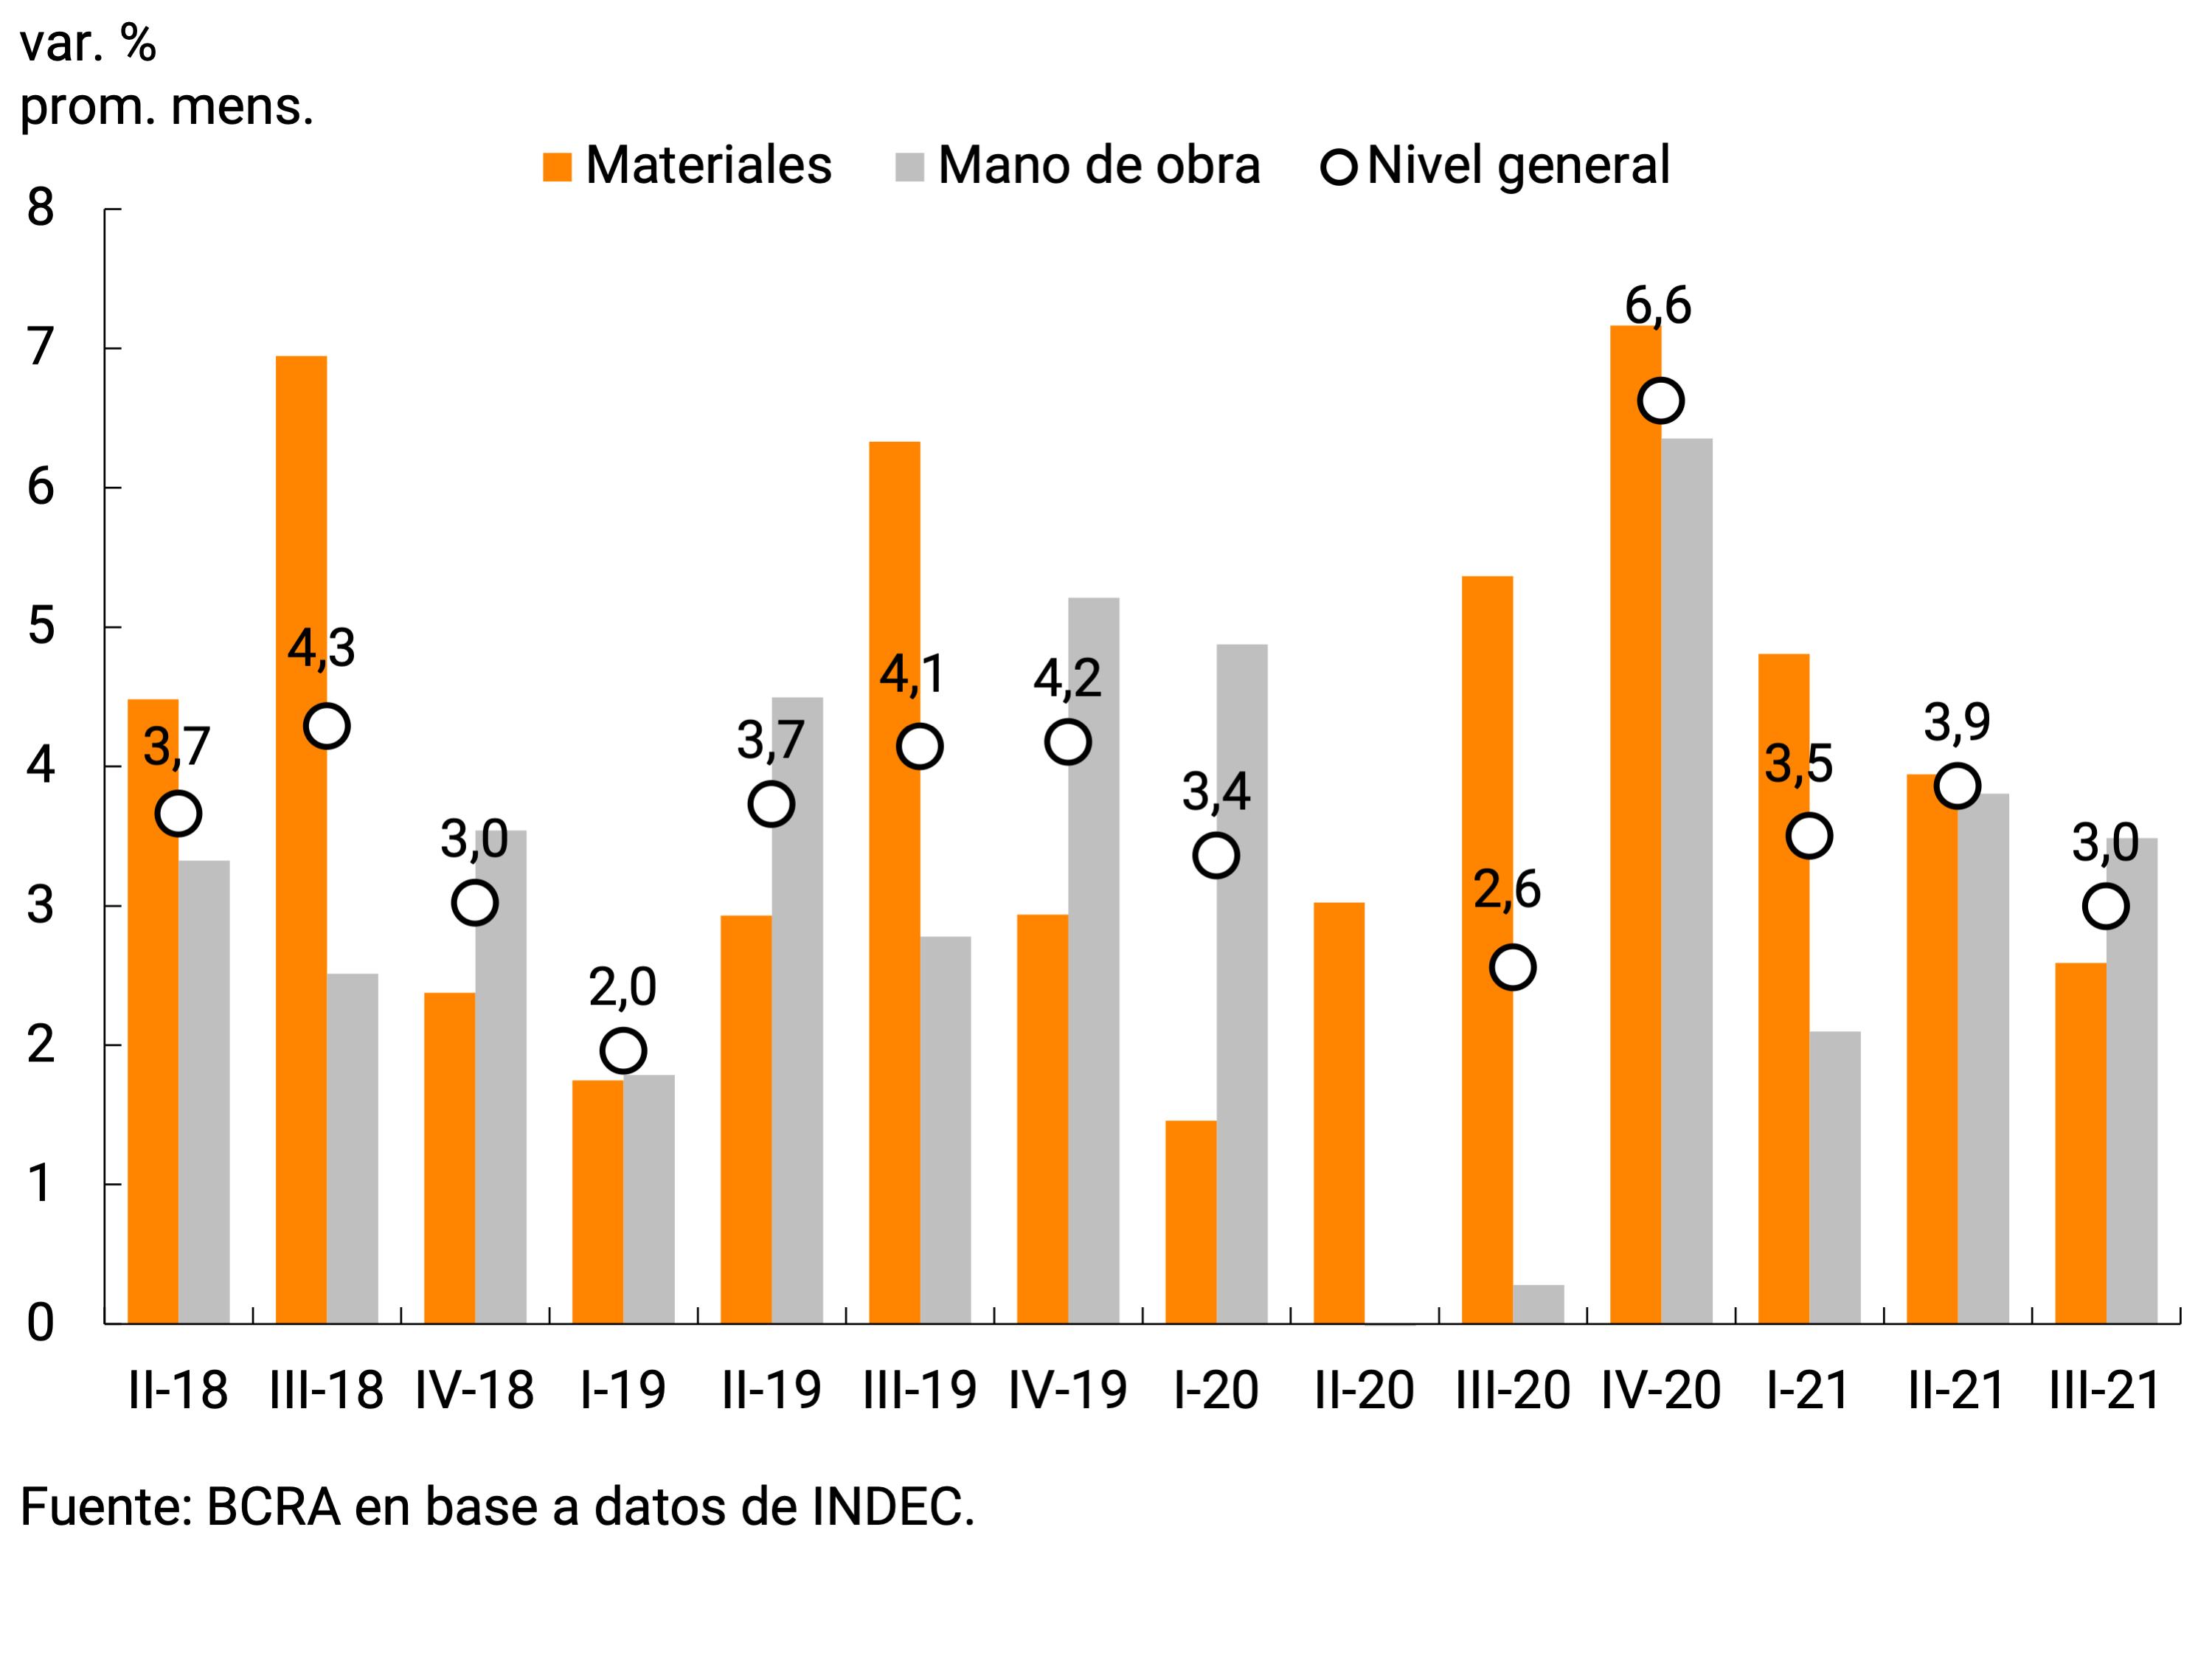
6.3. Year-on-year inflation increased and heterogeneity between the main categories decreased
As in the previous quarter, the year-on-year inflation rate continued to increase despite the monthly slowdown in prices (51.9% in III-21 and 52.1% in October). This trajectory is explained by the low base of comparison of the same period in 2020 when, in the context of the greatest impact of the pandemic on the economy, the monthly records were on average relatively limited.
In the third quarter of 2021, the heterogeneity between the year-on-year rates of change of the main categories was reduced. The prices included in the Core and Regulated accelerated and sustained the difference between their year-on-year inflation rates. Seasonal goods and services, which had exhibited higher rates during 2020, continued to decelerate and converged to variations similar to those of the General Level. For its part, the year-on-year change of wholesalers also remained above that of retailers, although it continued to narrow the gap (see Figure 6.7).
Figure 6.7 | Retail (CPI) and wholesale (IPIM) prices
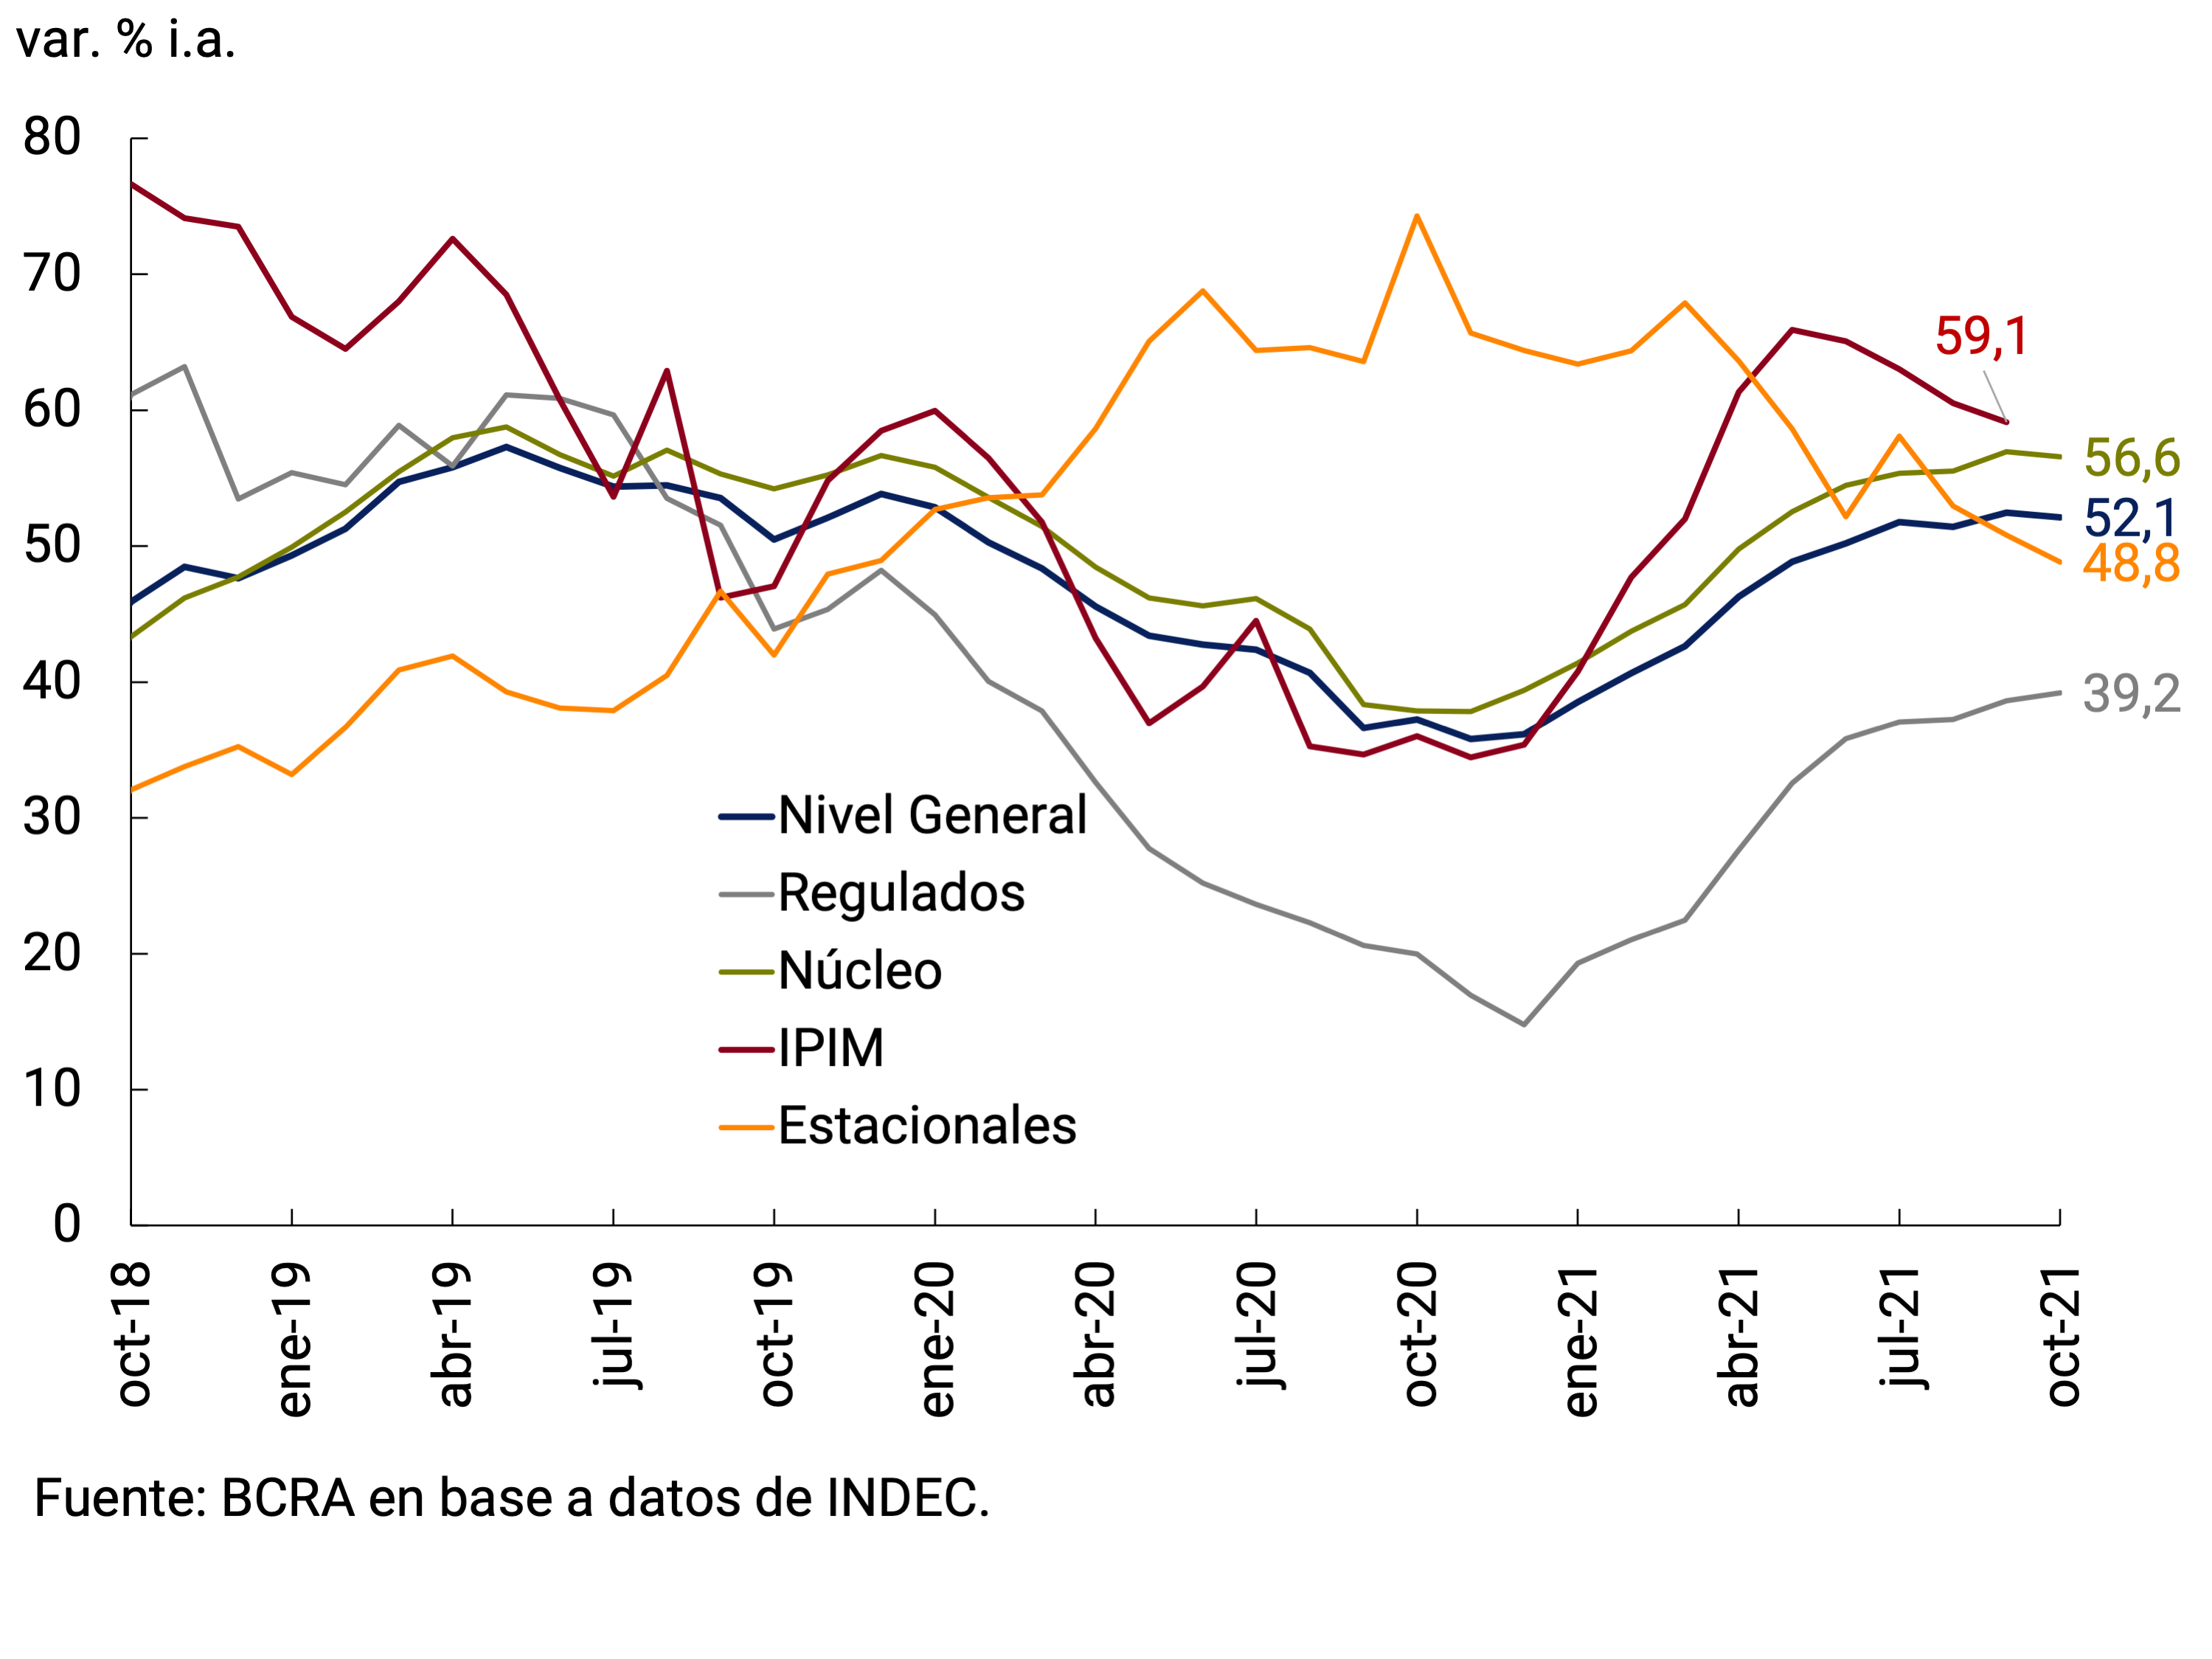
Using information from the CPI of the City of Buenos Aires with a higher level of openness, it can be seen that the dispersion of the year-on-year rates of change continued to reduce in most of the groupings of goods and services, although with different behaviors among them (see Figure 6.8).
Figure 6.8 | Heterogeneous dynamics within the CPI BA
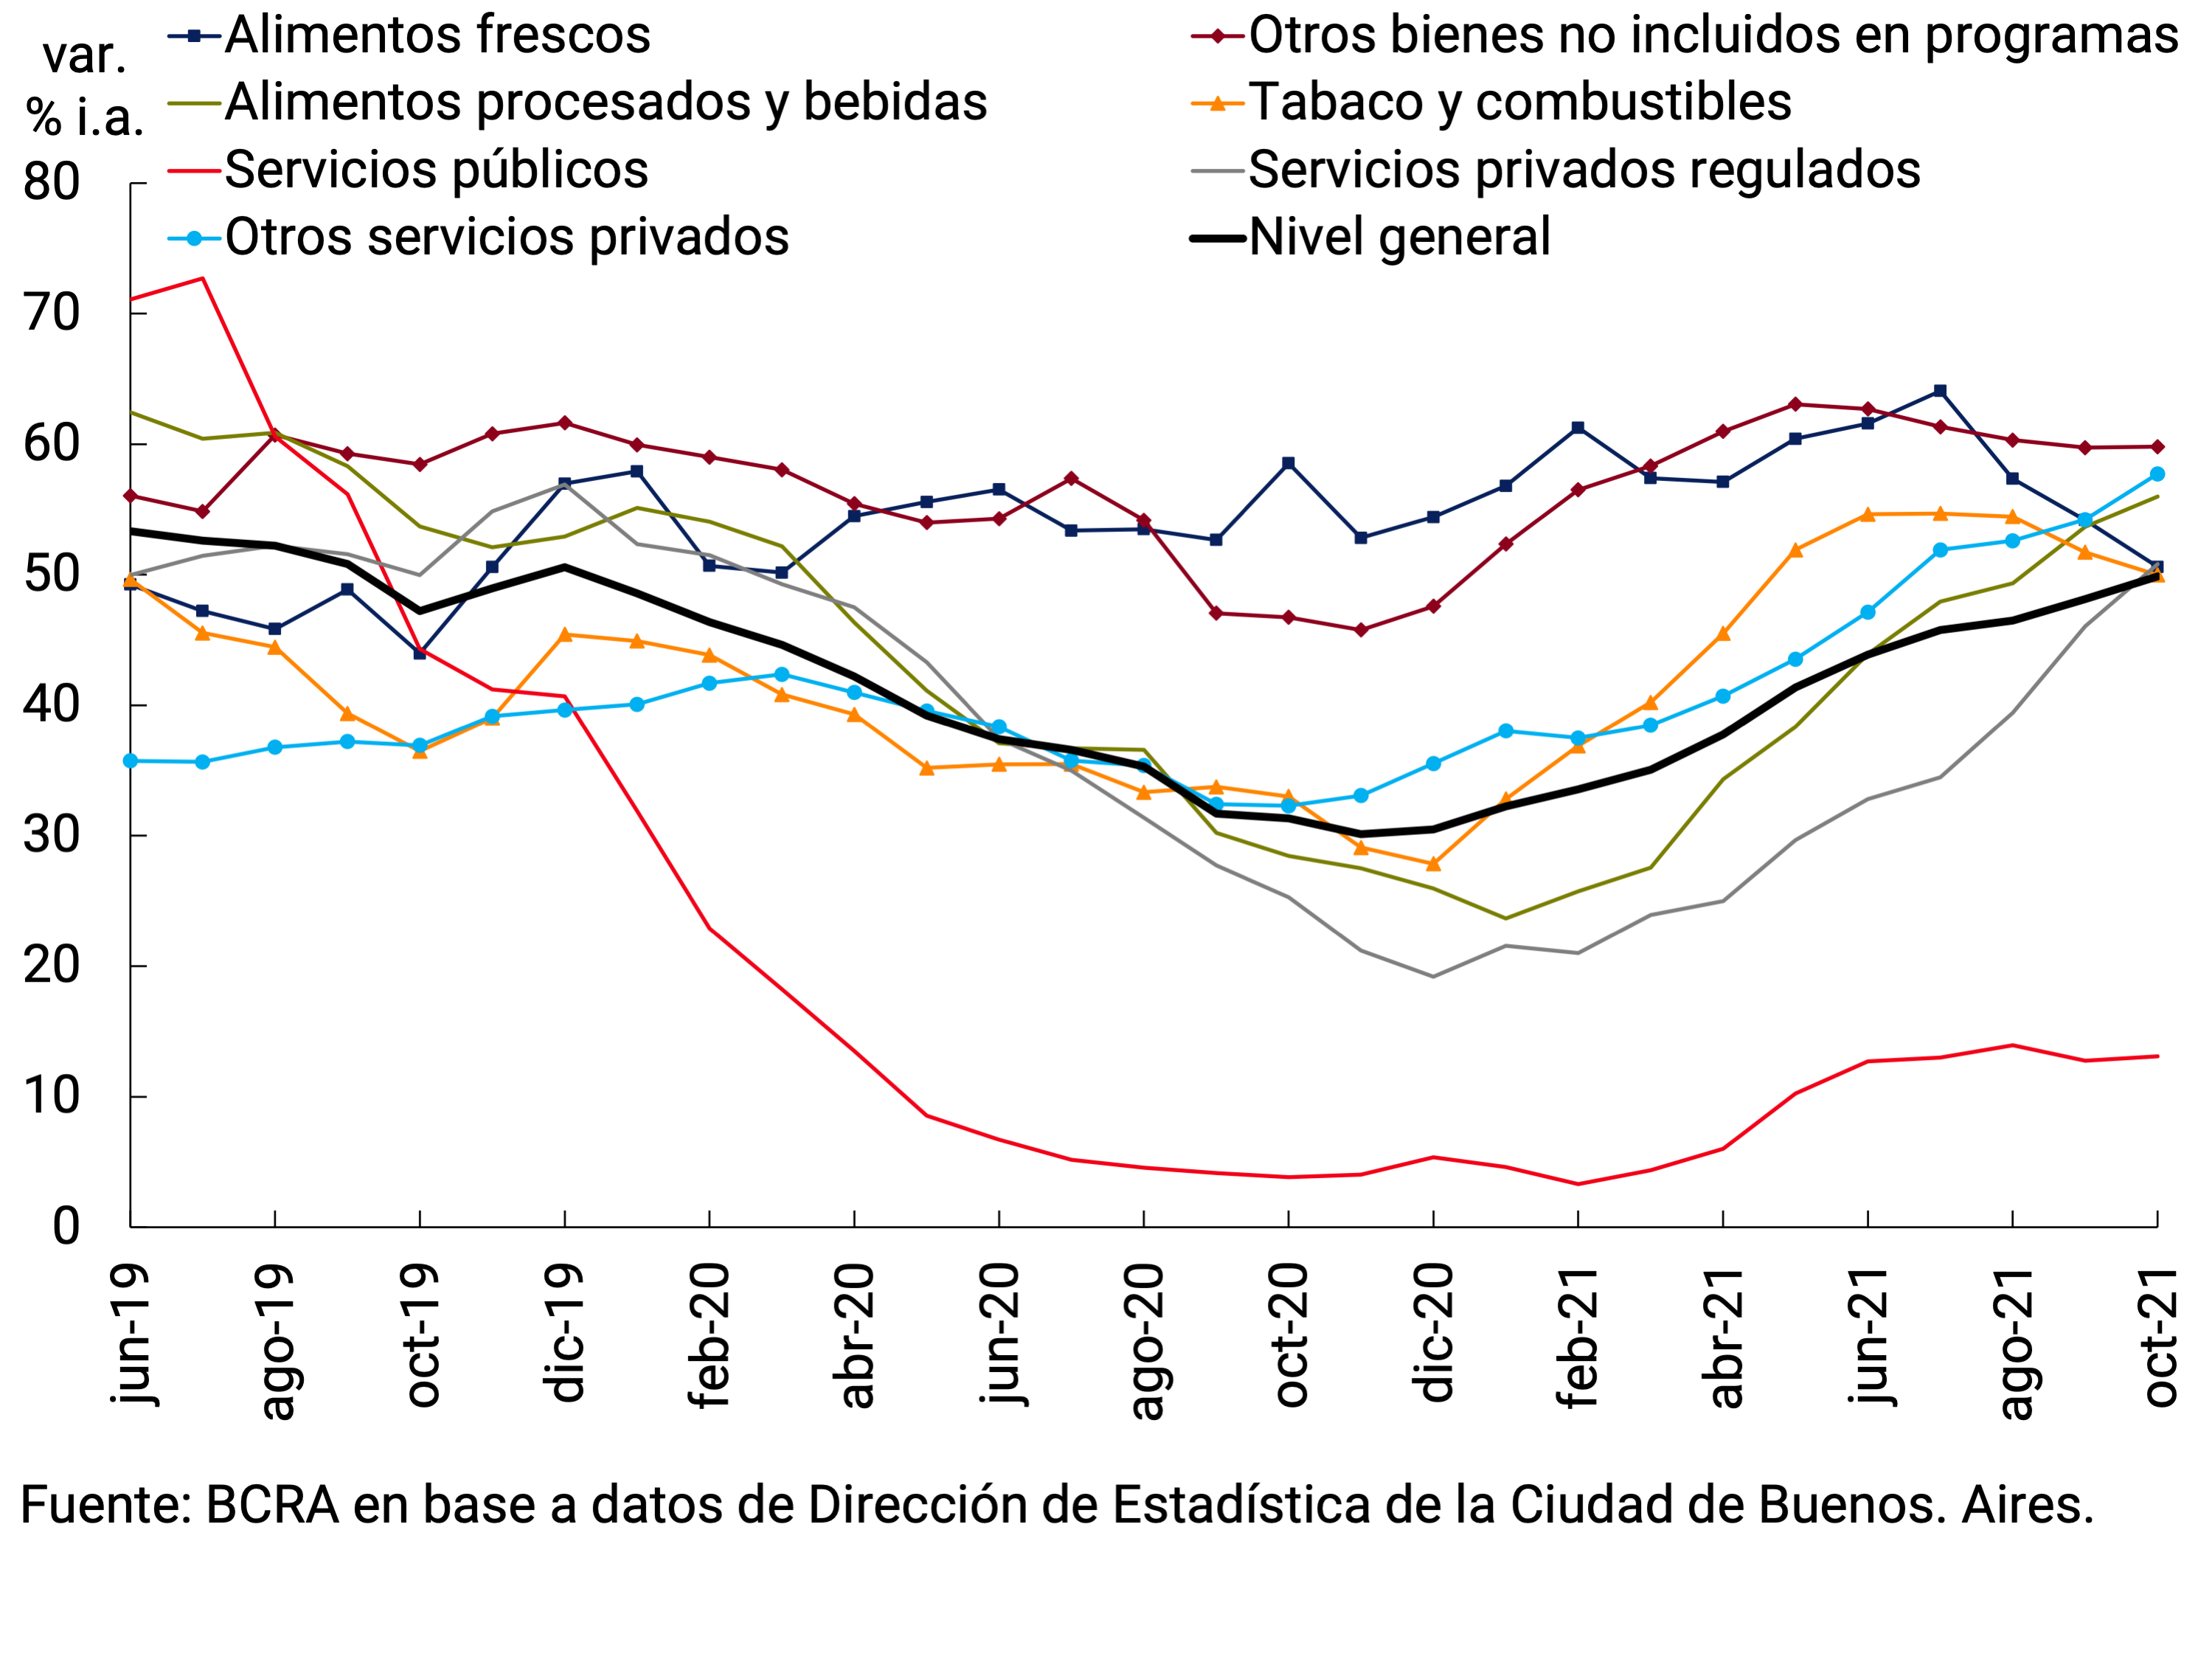
A set of goods that has been verifying a year-on-year growth rate higher than that of the General Level, exhibited a slowdown during the third quarter. Among them, fresh foods stand out, which was influenced by moderation in the rate of increase in meats. Regulated goods also slowed down during this period in which only increases in tobacco values were authorized, while those of fuels remained stable, after updates in gasoline prices in the first part of the year. On the other hand, the moderation was lower in the prices of goods that were not included in reference price programs and continued with a high growth rate, highlighting the evolution of automobile values.
A second set of goods and services increased its year-on-year rate of expansion. Processed foods and alcoholic beverages, which were affected by reference price programs during the previous year and the beginning of this year, accelerated and began to gain relative weight. Regulated private services accelerated sharply, driven by updates in private college fees and prepaid medicine. For its part, the acceleration in unregulated private services occurred within the framework of the reopening of activities and synthesized the increases in restaurants and hotels, recreation and culture and services related to tourism, which continued to gain weight within the index.
Finally, public services slowed down in year-on-year terms and continued to contain the increase in the general price level, deepening the deterioration of their relative prices.
6.3. Perspectives
After high monthly inflation records were observed in September and October, inflation is expected to resume a path of gradual deceleration as the transitory factors that pressured the general price level subside. For its part, the temporary fixing of maximum prices for sale to the final consumer of prices recently established by the National Government, aimed at returning the prices of a set of products to their values of early October and keeping them unchanged until January 7, will also contribute to moderating inflation in the last months of the year.
Inflationary dynamics will continue to be influenced, among other factors, by the updates of wage parity and the gradual recovery of demand from the progress of the vaccination process, which would continue to drive a recomposition of the relative prices of services based on the recovery of commercial margins in some sectors.
The BCRA will direct its efforts to promote a macroeconomic environment with lower levels of inflation than those currently observed, without damaging the economic recovery underway (see Chapter 7. Monetary Policy). By base effect of comparison, the year-on-year rates would begin to fall only towards the end of the year. Looking ahead to 2022, an upcoming agreement with the International Monetary Fund (IMF) will help improve the expectations of those actors who condition their vision of the sustainability of the external sector on the outcome of such negotiations, helping to contain exchange rate pressures and inflation expectations.
7. Monetary Policy
The BCRA continued to calibrate its monetary policy to the evolution of the macroeconomic environment. Throughout the third quarter, a systematic drop in the rate of COVID infections was observed, reaching minimum levels at the end of the period. This improvement in the epidemiological situation was possible thanks to the significant progress made in the vaccination campaign. The lower economic impact of the resurgence of cases of the second wave and the subsequent rapid recovery made it possible to achieve continuity in the process of reopening and revitalizing the economy. However, heterogeneities persisted between productive sectors and social strata. In a more dynamic macroeconomic environment, inflation in October registered a value above the average for the third quarter. On top of inflationary inertia, transitory factors already anticipated in previous editions of the IPOM were added, with greater intensity than expected.
The National Government and the BCRA maintained focused assistance measures, prioritizing a balanced recovery of household activity and consumption. The public sector significantly reduced the fiscal deficit compared to the previous year, although it still continues to implement a broad social protection policy. In the year-on-year comparison, a lower share of monetary financing was observed within the financing of the National Treasury. Thus, so far this year, primary expansion linked to the public sector was at levels similar to those of previous years, excluding the first year of the pandemic. The BCRA’s purchase of foreign currency in the foreign exchange market was another important factor in the expansion of the monetary base so far this year, framed within the structural objective of accumulating International Reserves.
Payment methods remained unchanged in the third quarter, and in terms of Product remained below the average figure between 2010 and 2019. In particular, the behavior of the circulating currency held by the public is highlighted, which is close to its lowest in the last 20 years. The lower dynamism of payment methods in the quarter was mainly associated with a higher demand for interest-bearing instruments. On the credit side, corporate liquidity needs led to an increase in demand for short-term financing, which boosted the growth of commercial loans. Added to this were purchases through the Ahora 12 program and the relaunch of the zero-rate credit line for single-tax people, which boosted credit card financing.
With a short-term perspective, the consolidation of the normalization process of the domestic debt market will allow the year to end with a level of financial assistance to the National Treasury significantly lower than the previous year. An agreement with the IMF is expected to be reached in the coming months. This will help to improve the expectations of those actors who condition their vision of the sustainability of the external sector on the outcome of such negotiations, helping to contain exchange rate pressures and inflation expectations. The BCRA will continue to calibrate the liquidity of the economy, sterilizing eventual monetary surpluses. With a medium-term vision, the BCRA will continue to carry out a monetary policy that, in addition to preserving monetary and financial stability, will lay the foundations for a path of economic development with social equity.
7.1. The BCRA continued to calibrate its policies according to the macroeconomic environment
The improvement in the epidemiological situation at the country level and the important progress made in the vaccination campaign against COVID-19 allowed a gradual reopening of the economy. In this context, in the third quarter of the year there continued to be a gradual recovery in economic activity, although it continued to be heterogeneous at the sectoral level.
The improvement in the health situation allowed the government to keep its assistance initiatives focused on the most backward sectors (particularly those linked to tourism, gastronomy and culture) and on the most vulnerable population. Likewise, to alleviate the financial situation of single-tax people, a new edition of zero-rate loans was launched.
On the other hand, in a context of recovery in economic activity and expectations of gradual moderation in the inflation rate, the BCRA maintained its main monetary policy guidelines. The results of all these policies were reflected in the evolution during the third quarter of the monetary aggregates, credit and the foreign exchange market. In the following sections, an analysis of the evolution of these variables is carried out.
7.1.1. Monetary aggregates in terms of output remained below their average of the past decade
The recovery in economic activity led to a continuation in the process of improving private sector income throughout the year. Likewise, the dynamism experienced by the economy during the year had a positive impact on the public accounts (see Chapter 5. Public Finance). On the other hand, the improvement in the epidemiological situation allowed assistance measures to continue to be focused, which resulted in a lower expansion of expenditure than in 2020.
The consolidation of the process of normalization of the peso debt market allowed the National Treasury to channel a significant proportion of its financing needs through it. Likewise, in recent months the National Government took a series of additional measures with the aim of deepening financing through the capital market. The National Securities Commission (CNV) authorized Mutual Funds (FCI), excluding Money Market (MM), to invest up to 15% of their assets in national public debt securities acquired in primary placement, with a maturity of less than or equal to 30 days, with the option of partial or total prepayment and non-transferable44. This new instrument launched by the National Treasury and called LELITE seeks to offer a combination of term and yield according to the profile of these agents. On the other hand, the “market makers” program was launched, which seeks to get banks and brokers to participate in the primary auctions of the National Treasury and to provide liquidity to the secondary market of public securities. All in all, so far this year the National Treasury achieved a positive net financing of $443,257 million, of which $86,975 million correspond to the accumulated amount between July and October.
So far this year, the growth of the monetary base was mainly explained by the primary expansion of operations with the National Treasury and by the purchase of foreign currency by the BCRA. With regard to the public sector, in the third quarter there was an increase in the positive contribution of this factor. However, with a more limited fiscal deficit and financed in a smaller proportion with monetary resources, so far this year the growth of the monetary base linked to the public sector was at levels similar to those of previous years, excluding 2020 (see Figure 7.1). Although the purchase of foreign currency was also configured as an expansion factor in the third quarter, its dynamics were not homogeneous between the months, being in September a factor of contraction. The expansion of liquidity, both throughout the year and in the third quarter, was mainly sterilized through monetary regulation instruments (Passive Passes and LELIQ).
Figure 7.1 | Public Sector Primary Issuance*
|Acum. October of each year

However, in the third quarter of the year, the growth of the monetary base was 8.6% ($232,084 million), maintaining in October an expansion rate similar to the average monthly rate of the previous three months. However, in year-on-year terms and at constant prices, it continued to contract, reaching a variation of -17.1% in October. Thus, the monetary base was at similar levels to those of mid-2003. In terms of GDP, it stood at 6.1%, 3.9 p.p. below the maximum recorded in 2020 and around its lowest value since 2003 (see Figure 7.2).
Figure 7.2 |
Historical evolution of the monetary base
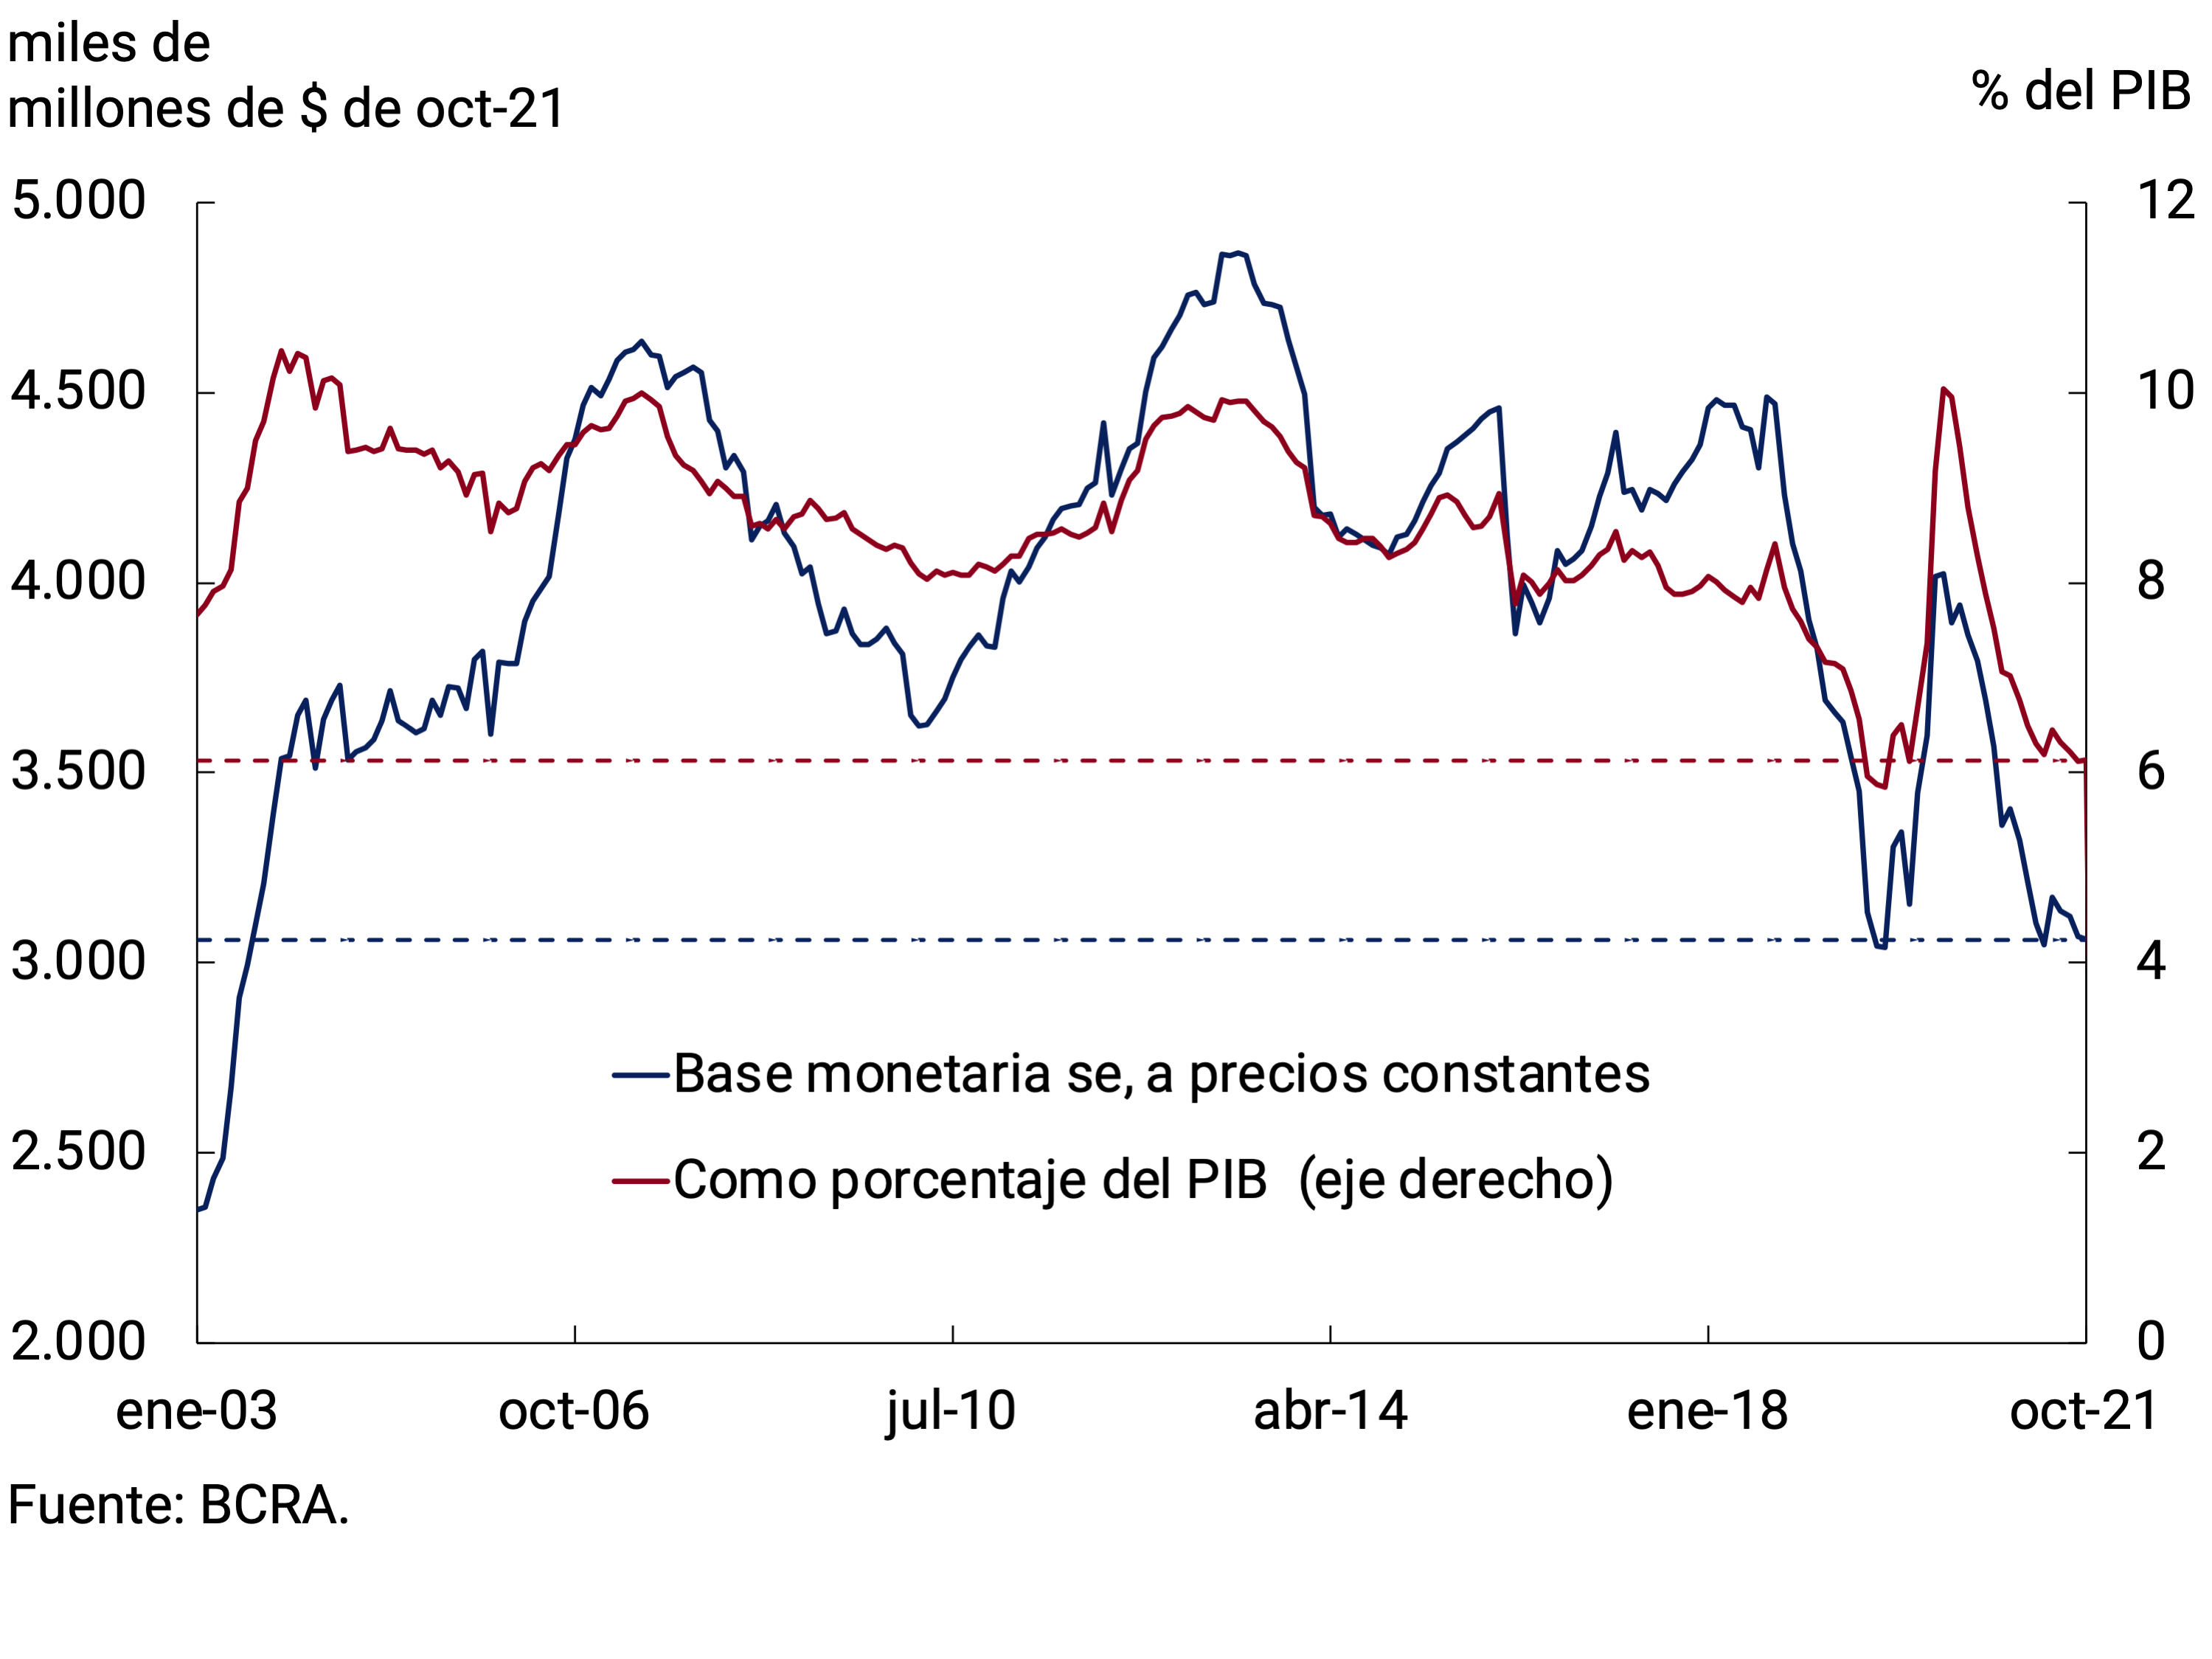
Transactional means of payment, at constant prices and adjusted for seasonality, remained unchanged in the third quarter of the year, with growth observed in October. In fact, during the third quarter, private transactional M2 registered an average monthly expansion rate at constant prices of 0.7% s.e. and 1.6% s.e. in October. In particular, the dynamics of October were linked, on the one hand, to the entry of salary adjustment tranches of several unions and, on the other, to a transitory increase in the demand for transactional money due to the greater tourist movement by virtue of the long weekend of that month. At the level of its components, the evolution over the period was relatively homogeneous. In terms of GDP, transactional M2 has been around 10% since the middle of the year, just over 4 p.p. below the peak reached during the first year of the pandemic and -1.6 p.p. compared to its average between 2010 and 2019. In particular, the working capital held by the public stood at 4% in terms of Output, one of the lowest records in the last 15 years (see Figure 7.3). Although the boom in electronic means of payment caused this component to lose relative participation in the demand for means of payment, it would be expected that it will gradually converge to higher levels associated with higher levels of economic activity.
Figure 7.3 | Means of payment in terms of GDP
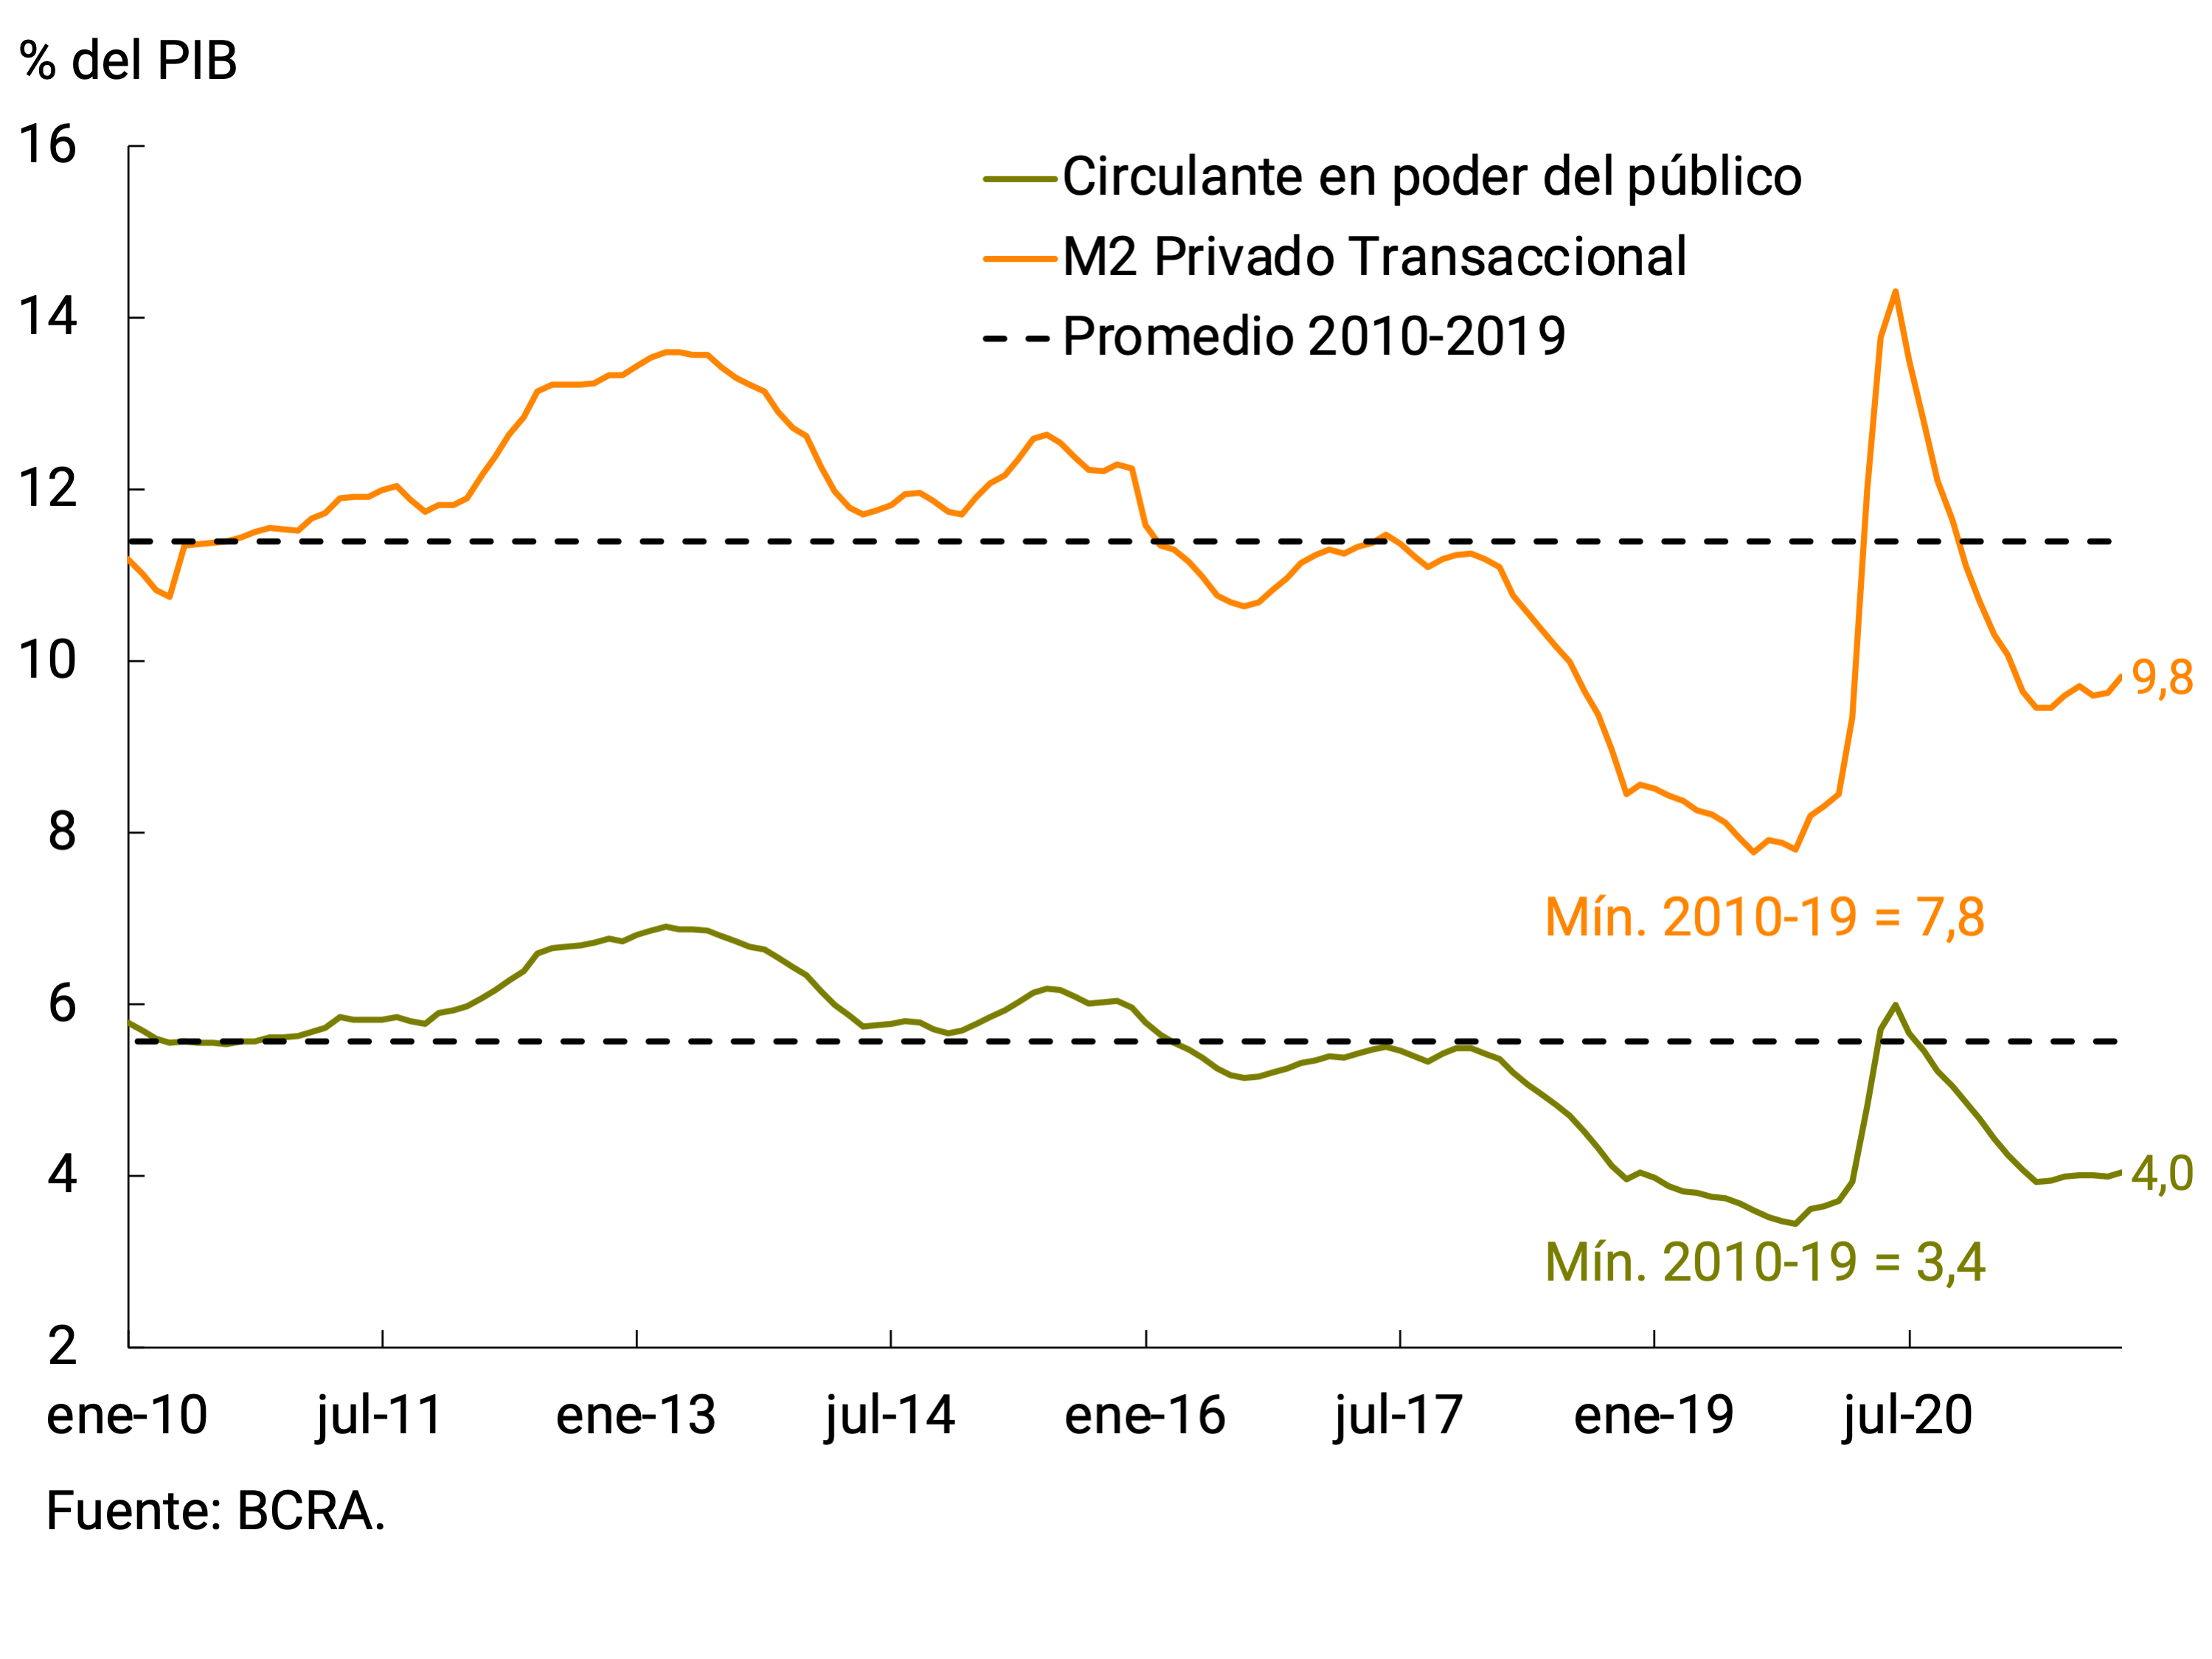
7.1.2. Demand for local currency savings instruments increased in the quarter
The low dynamism of payment methods during the third quarter was partly explained by an increase in the demand for interest-bearing instruments. In fact, in the third quarter, fixed-term deposits in pesos of the private sector maintained a positive expansion rate at constant prices of 0.6% s.e. This dynamic was reversed in October, as was the case with means of payment, a period in which fixed-term placements fell at constant prices (1.2% s.e.).
The wholesale segment (more than $20 million) was the one that set the pace of expansion of total fixed-term deposits throughout the year, a trend that was also observed both in the third quarter and in October (see Figure 7.4). Within this layer of amount, the main actors are: Money Market Mutual Funds (FCI MM; see Section 6 / The Mutual Fund Industry and its participation in the money market) and companies. The behaviour of both types of depositors was not homogeneous throughout the quarter. The growth in the assets of the FCI MM between July and September resulted in an increase in traditional fixed-term placements in the first two months. However, as of September, these agents changed the composition of their portfolio in favor of more liquid assets. As a result of the latter, an increase was observed in the holding of interest-bearing demand deposits and investments with an early cancellation option. The relevant interest rate for this segment (TM20 of private banks) stood at 33.9% n.a. (39.7% y.a.) in mid-November, in line with the minimum guaranteed rate for this type of deposits.
Figure 7.4 | Monthly variation in time deposits by amount stratum.
At constant prices
Placements of between $1 million and $20 million at constant prices moderated their growth throughout the third quarter. Then in October they presented a slight contraction in real terms. Meanwhile, retail deposits (less than $1 million) contracted practically throughout the period under analysis. It should be noted that in the retail segment the minimum rate for individuals stood at 37% (43.98% e.a.), practically unchanged from the previous period. The low dynamism of retail deposits and the expansion of those between $1 and $20 million can be explained in part because among the former the most dynamic segment was that of $750,000 to $1 million, so considering the capitalization of interest, part of these deposits over time tend to cross stratum.
In a context of moderation in the inflation rate compared to the beginning of the year and prioritizing the recovery of economic activity, the BCRA once again kept the benchmark interest rates unchanged. In this context, the interest rate differential between deposits in UVA and in pesos turned in favor of the latter, which explained a lower demand for assets adjustable by CER in favor of those denominated in non-indexed pesos. This led first to a moderation in growth and then, towards the end of the quarter, to a fall in UVA time deposits. With the contraction verified as of August, these instruments broke with a period of uninterrupted rise since the beginning of the year (see Figure 7.5).
Figure 7.5 | UVA Time Deposits by Deposit
Type At Constant Prices
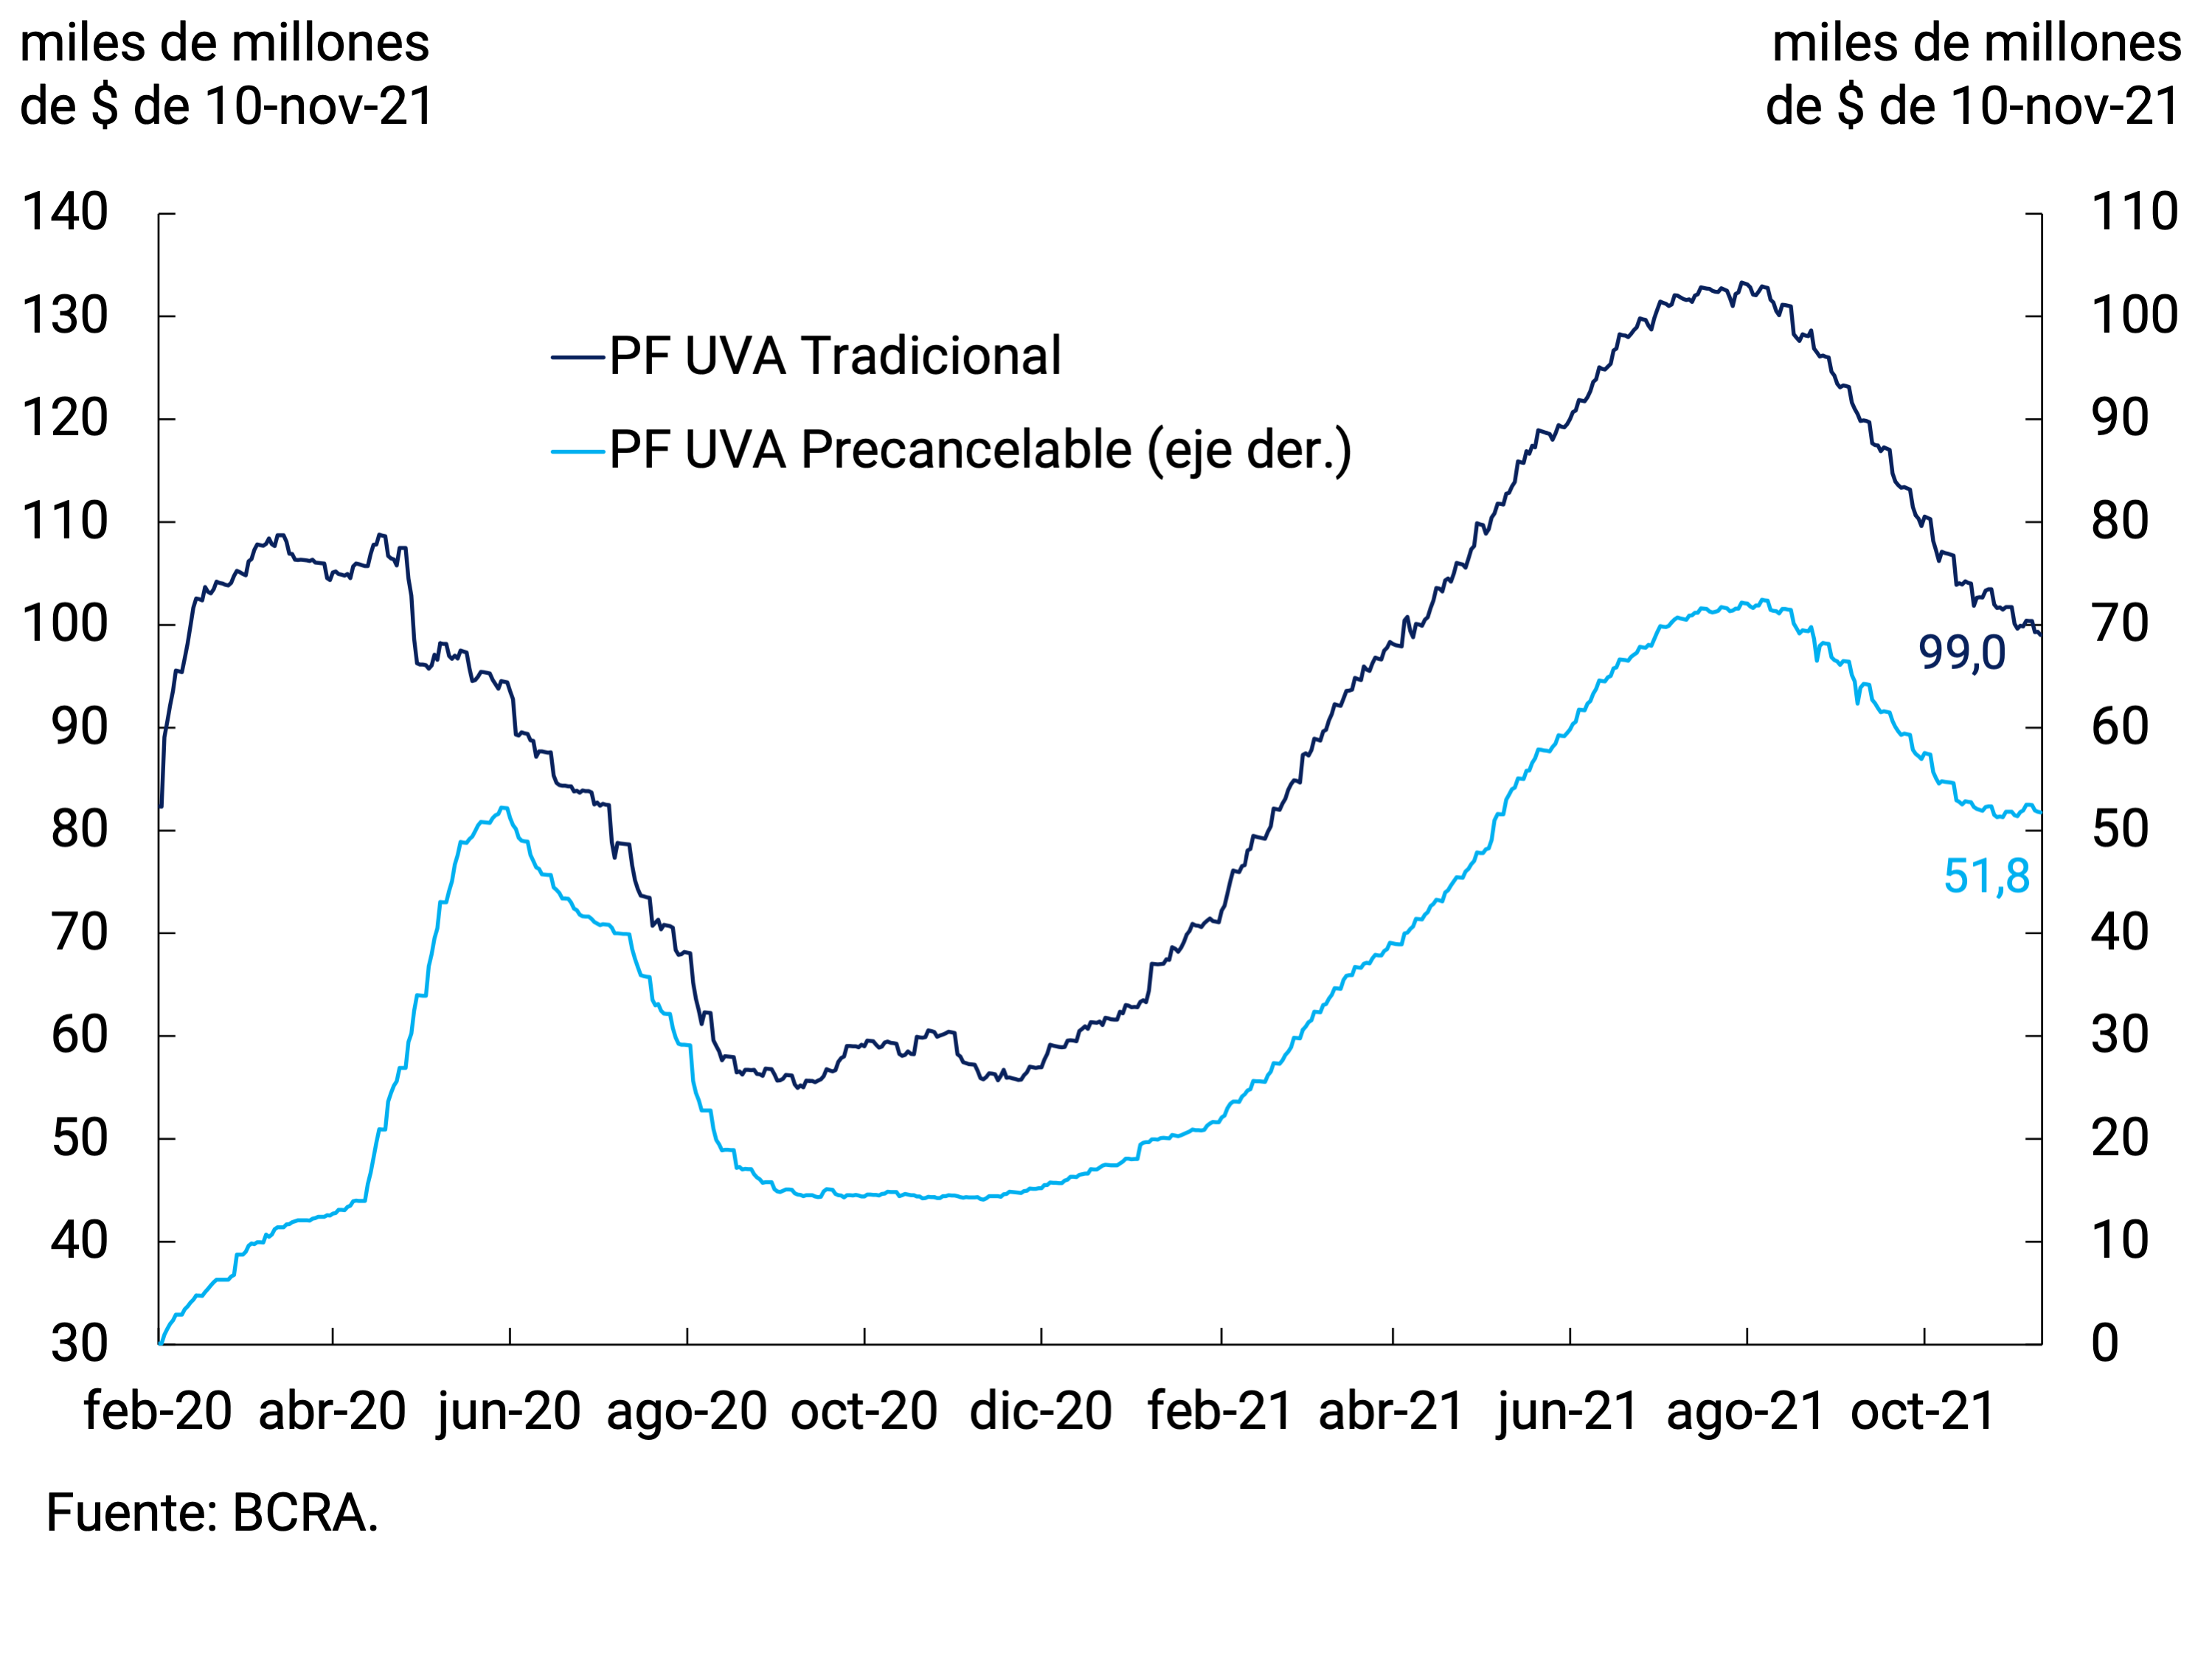
All in all, the broad monetary aggregate private M3 registered an average monthly increase of 0.9% s.e. at constant prices in the quarter, growth that accelerated in October to 1.7% s.e. In terms of GDP, it stood at 18.2%, 6.0 p.p. below the maximum record reached in June 2020 and in line with its average record between 2010 and 2019.
Credit policy continued to focus on the lagging sectors
The return to normality in most of the activities affected by the pandemic allowed the BCRA to continue with its credit policy focused on the most lagging sectors, with a special emphasis on productive development. The Productive Investment Financing Line (LFIP) continued to be the main vehicle for channeling productive credit to MSMEs under favorable financial conditions.
Since its implementation, and with data as of October 31, the LFIP has accumulated disbursements for a total of $1,187,780 million, maintaining a monthly expansion rate of around 14% nominal between July and October. Approximately 84% of the funds disbursed were used to finance working capital, while the remaining 16% was used to finance investment projects. Recently, the BCRA decided to extend the validity of the LFIP until the end of March 2022, extending it to some specific sectors (see Box. Financing Line for Productive Investment of MSMEs: new quota and compliance with the 2021 quota).
Box. Financing Line for Productive Investment of MSMEs: new quota and compliance with the 2021 quota
The Central Bank decided to extend the validity of the Financing Line for Productive Investment (LFIP) and established a new quota that will run from October 2021 to March 2022 (Quota 2021/2022)45. This will continue to be 7.5% of the deposits in pesos of the non-financial private sector in pesos, 46 for Group A entities and 25% of said quota for public sector financial agents that do not belong to Group A.
This new section of the LFIP incorporates some modifications with respect to the previous ones, which give it a greater scope. On the one hand, special treatment is provided for the gastronomy, hotel, cultural and leisure services sectors. These sectors, which were the most affected during the pandemic, can access the working capital line with an interest rate of 35% n.a. and a grace period of 6 months to start repaying the loan. Likewise, and in order to encourage this type of financing, for the purposes of meeting the quota, they will be computed at 120% of their value.
In addition, eligible financing included those granted to small companies with agricultural activity as long as the funds are intended to increase the productive capacity of beef and/or bovine milk. Thus, small agricultural producers will be able to access the line of financing for investment and working capital projects47.
Regarding the degree of compliance with the quota that ended on September 30 (Quota 2021), at the level of the entire financial system, it is verified that on average financial institutions excessively complied with the minimum limit established in the LFIP. In fact, the balance of financing included in the LFIP (monthly average for September) stood at 8.8% of the deposits in pesos of the non-financial private sector in March48 (see Figure 7.6).
Figure 7.6 |
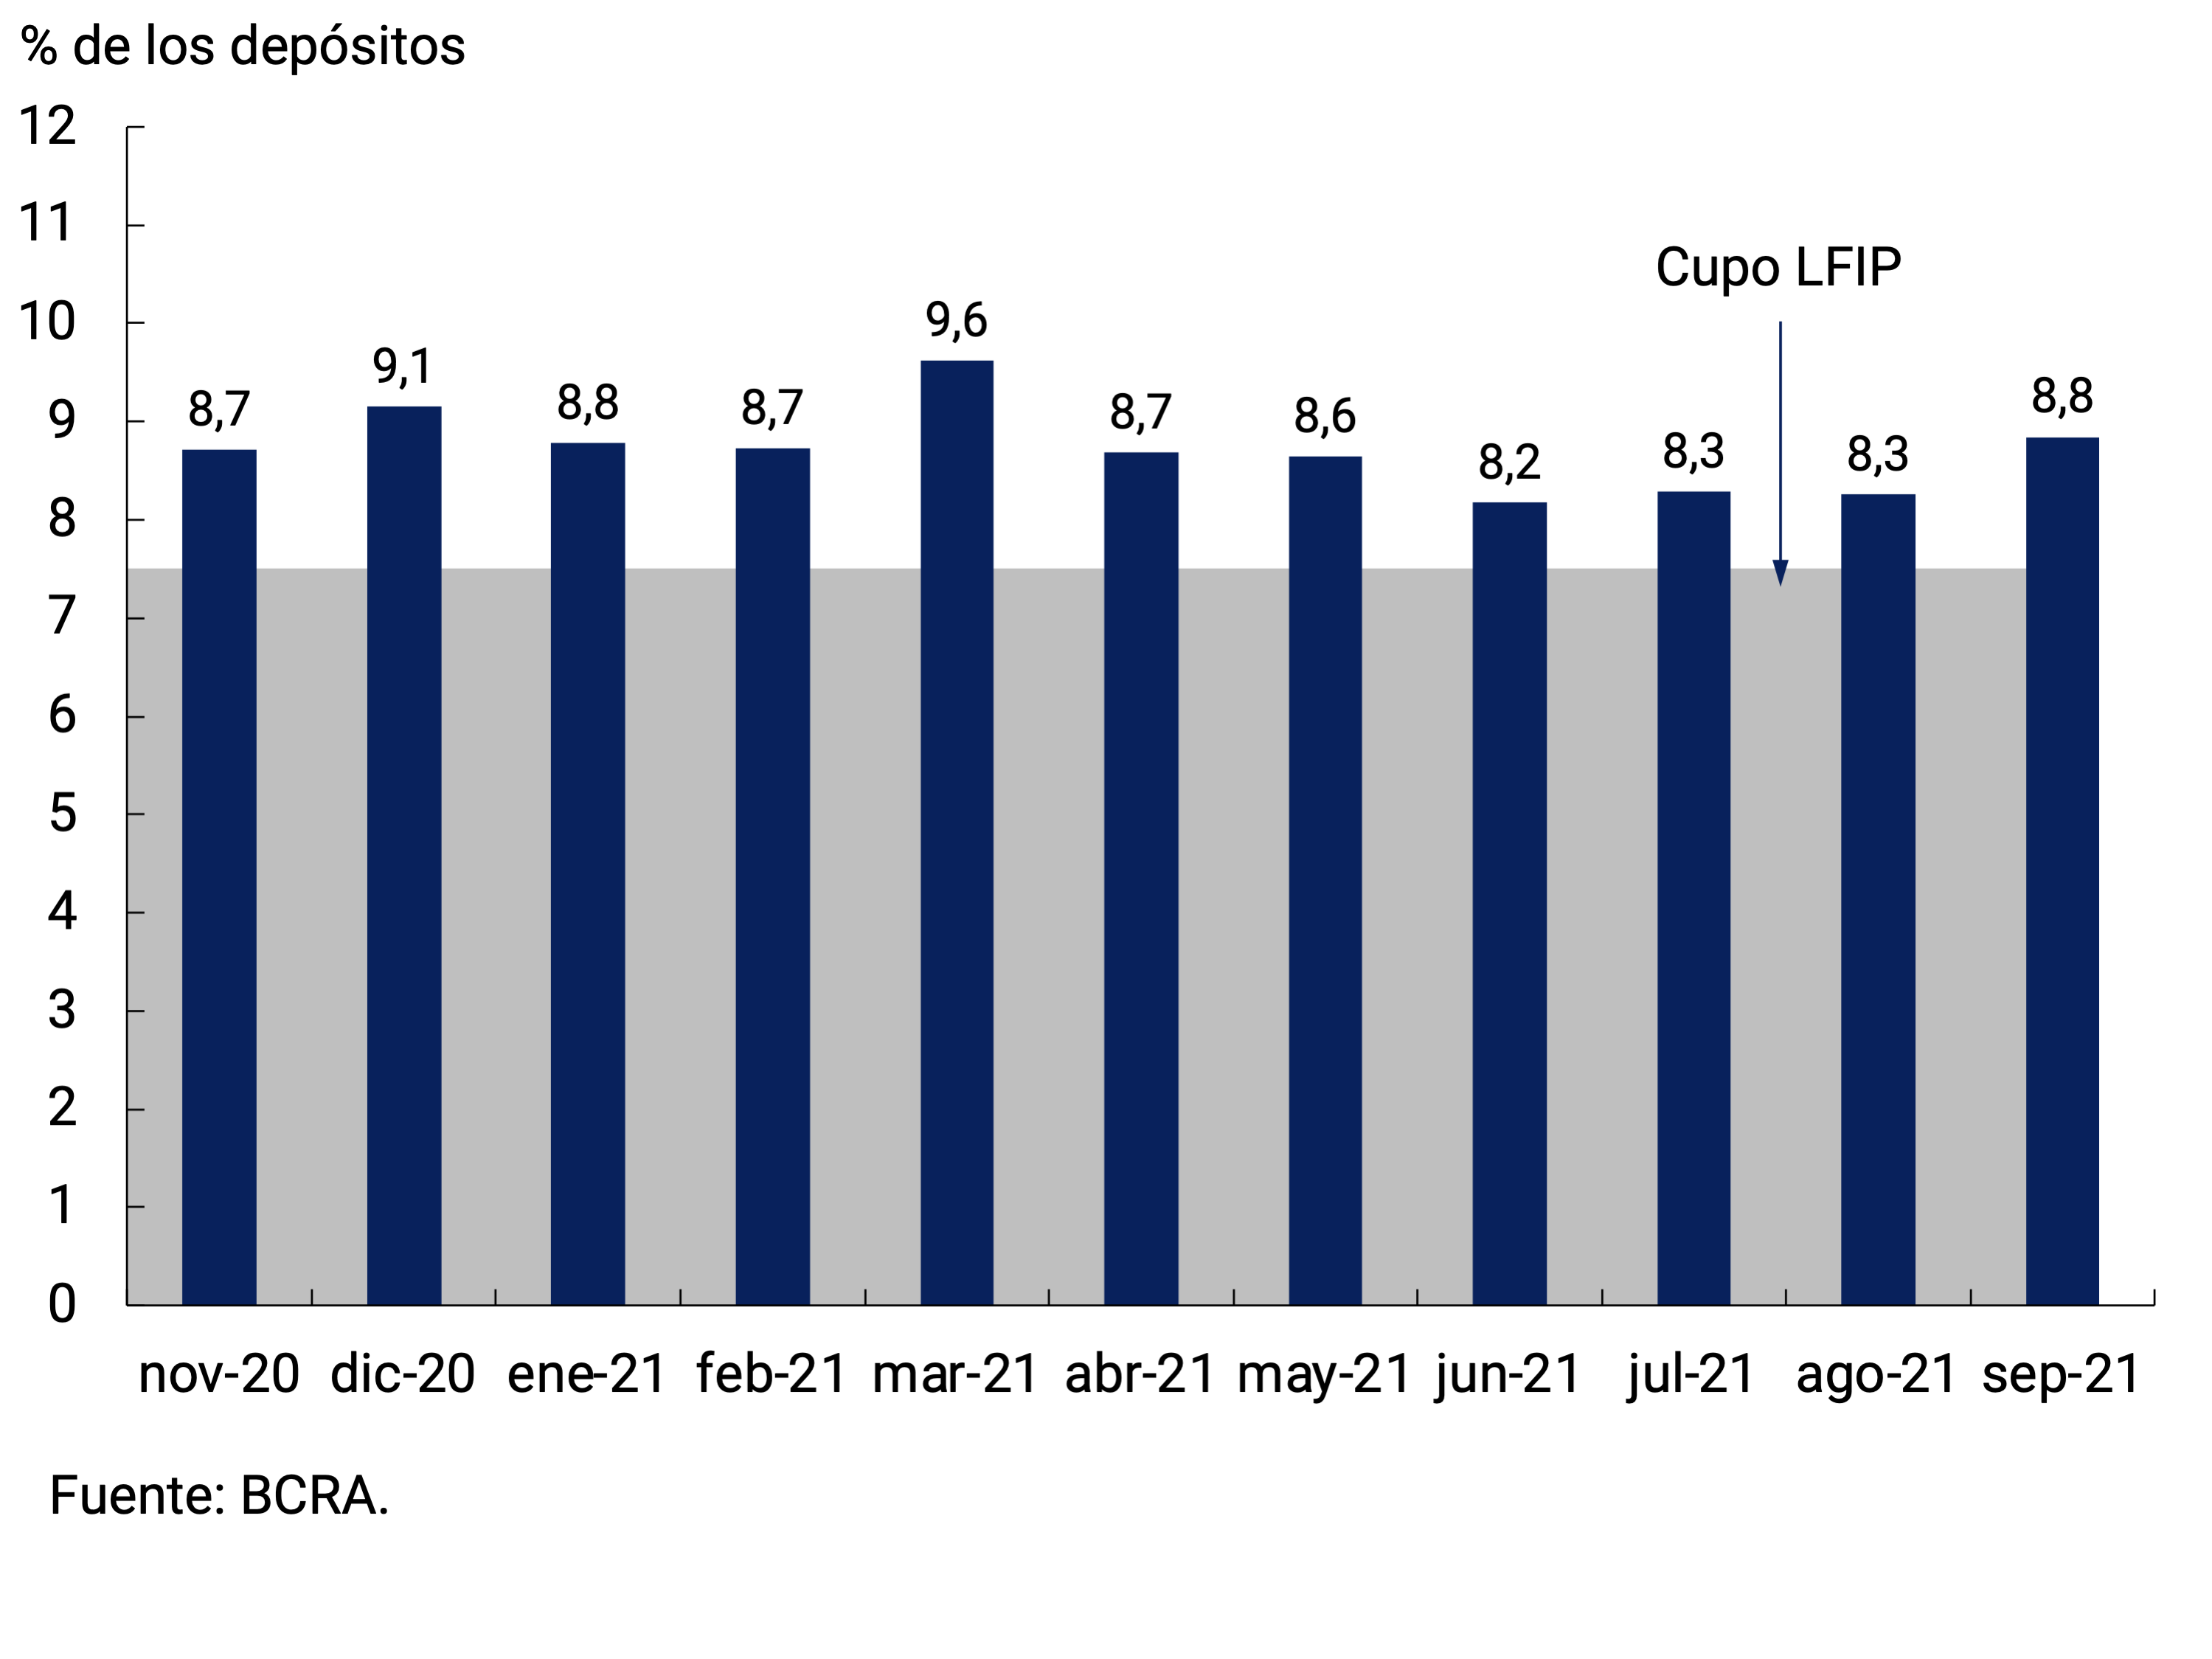
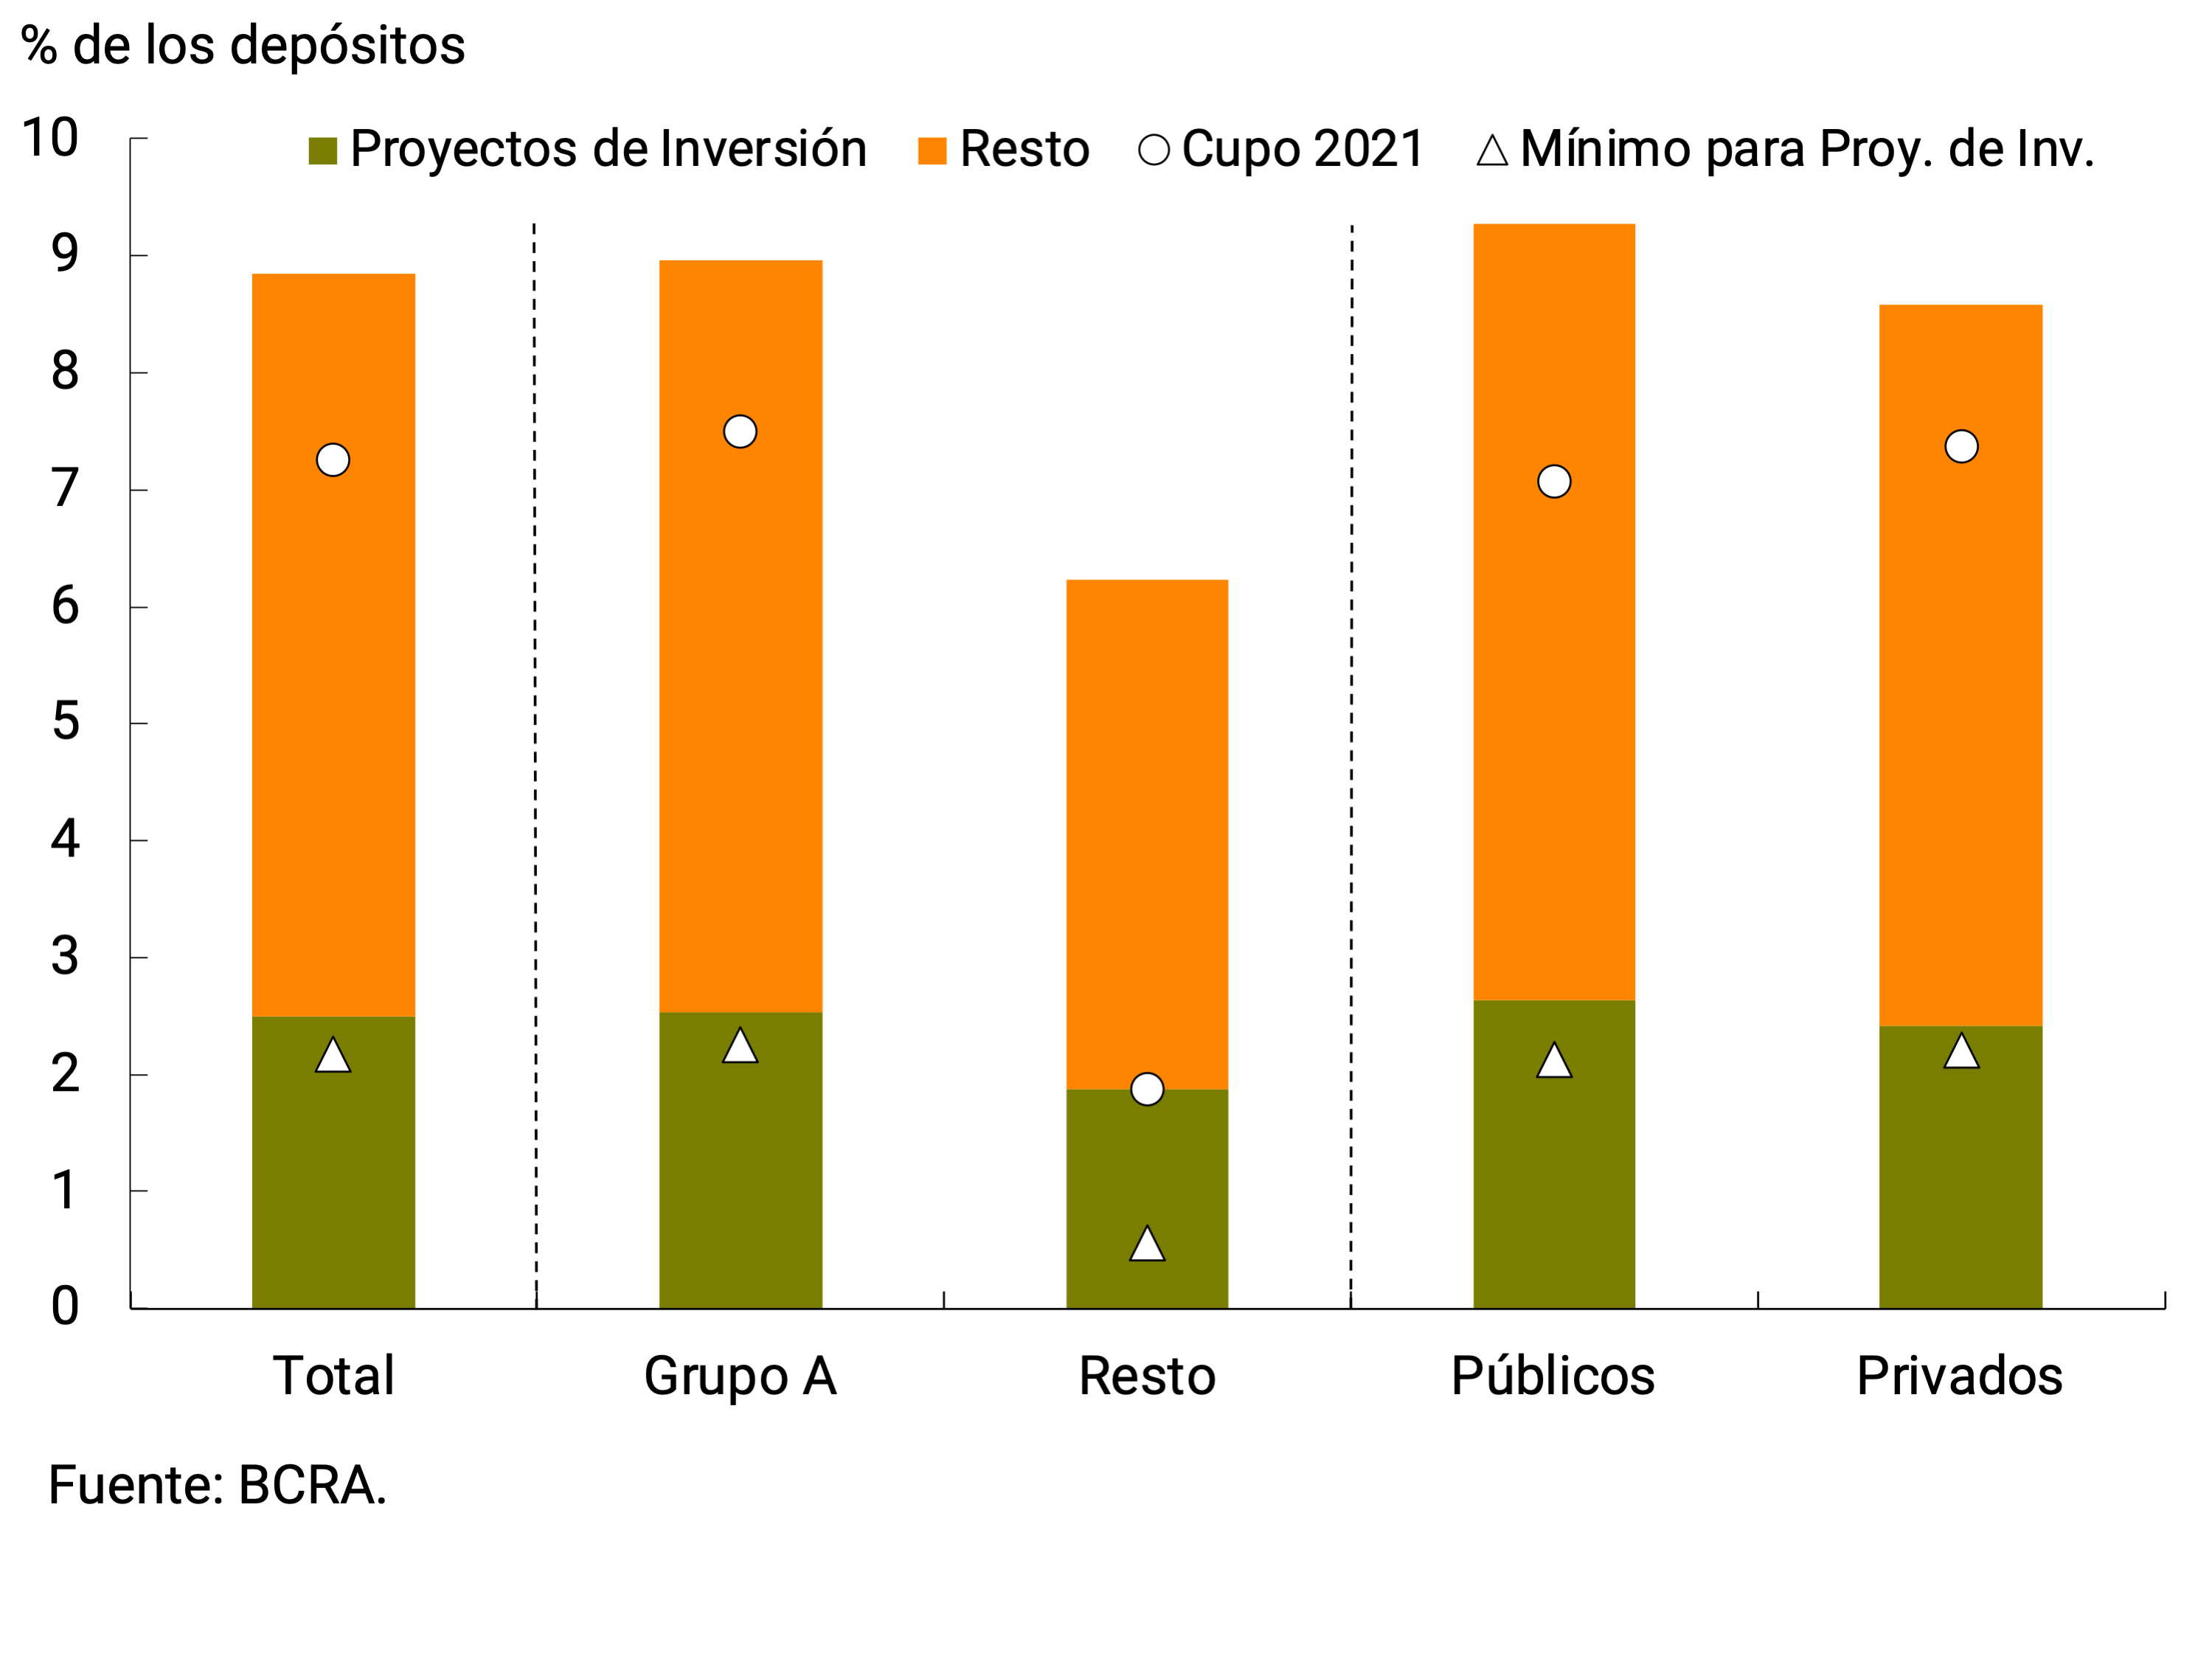
Lines with essentially commercial destinations registered a variation at constant monthly average prices of 0.8% s.e. in the third quarter and a growth of 2.5% s.e. in October. The most dynamic line was that of discounted documents, which was largely explained by the financing granted to MSMEs through the LFIP. However, single-signature documents, which have a longer average term, grew again towards the end of the quarter, breaking with a period of 6 consecutive months of negative real variations. Thus, the balance of credit to relatively smaller companies showed a sustained increase in real terms since the beginning of August, after some stability in July. Thus, the average monthly increase in the quarter was 2.4% and accelerated to 3.2% in real terms in October (see Figure 7.7).
Figure 7.7 | Estimated balance of commercial loans to the private sector by type of debtor.
At constant prices

Financing to large companies exhibited a slight downward trend since August, which was reversed in October due to the greater liquidity needs of these agents. This increased demand for liquidity was channeled through current account advances. It should be noted that financing to this type of company closed the quarter with some stability at constant prices and an average monthly growth of 2.2% s.e. in October.
Among consumer-related loans, credit card financing presented an average monthly drop in the third quarter of 1.8% s.e. at constant prices. However, this trend changed at the end of September. Thus, in October they grew 0.9% s.e. in real terms. This reversal in the dynamic was mainly explained by the relaunch of zero-rate loans for single-tax individuals. It should be remembered that this line contemplates the granting of loans without interest cost for the policyholder for a maximum amount of $150,000 (depending on the category of monotax), a balance that is credited in a single disbursement on the person’s credit card. The loans have a grace period of 6 months and are repaid in 12 consecutive monthly installments. At the time of publication, the accumulated disbursed amounts amounted to $28,800 million, which were granted through some 250,000 credits (see Figure 7.8). The line also contemplates the granting of cards for those who do not have one, a mechanism by which some 75,600 new plastics have already been issued. For their part, personal loans were gaining momentum between July and October. This was reflected in a growth in the average daily bestowal over the period. Thus, after three consecutive years of declines in real terms, these financings presented a reversal in the ninth month of the year. In fact, the average monthly growth in September was 0.8% s.e. at constant prices, a figure that was repeated in October.
Figure 7.8 | Zero-Rate Loans 2021

Finally, with regard to loans with real collateral, collateral loans continue to exhibit great dynamism, accumulating 16 consecutive months of positive variations at constant prices. However, loans in pesos to the private sector in real and seasonally adjusted terms registered little significant variations in the third quarter of the year, showing greater dynamism in October (1.6%).
7.1.4. Exchange rate policy continued to be adapted to meet the needs of the situation
With regard to exchange rate policy, the BCRA continued with its strategy of promoting an efficient allocation of foreign currency through regulation and foreign exchange intervention and adapting the volatility of the nominal exchange rate to the anti-inflationary strategy.
To meet these objectives, a series of complementary measures have been taken to those already adopted in previous quarters. In mid-August, it was established that transactions for the purchase and sale of securities carried out with settlement in foreign currency may not be carried out by payment in banknotes in that currency, or by deposits in custody accounts or in third-party accounts49.
On the other hand, it was established that companies that obtain new financing from abroad may apply it to the payment of commercial debts, being able to access the foreign exchange market without prior approval from the BCRA for debt payments of up to US$5,000,000 for imports of goods and services. The new debt will have to be for an amount not less than the payment to be made and with an average life of at least 2 years. Thus, the private sector has a mechanism that will allow it to regularize its external commercial liabilities through the use of new funds from financial indebtedness with the outsideworld 50.
In turn, local financial institutions were allowed to access the foreign exchange market to meet their obligations to non-residents for financial guarantees granted as of October, as long as they meet certain conditions51. In that same communication, the deadline for the settlement of foreign currency generated in the export of barley and sorghum, mainly destined for China, was extended from 15 to 30 days, thus taking into account the particular conditions of marketing to that country, whose sales have a special phytosanitary protocol.
Considering that since June there had been payments for a value greater than the clearance of goods to the market, the mechanism by which advance payments are made for some imports, which during October should have been made from the release of the goods, was modified. The measure only applies in cases where imports are being made for a higher value than that which has been entered, so it affects approximately 13% of them. Specifically, in order to access the foreign exchange market without prior approval from the BCRA for the making of payments for certain imports of goods or the cancellation of principal of debts originated in the importation of goods, it must be recorded that the total amount of payments associated with imports of goods made through the foreign exchange market as of January 1, 2020, including the payment for which the course is being requested, does not exceed by more than the equivalent of US$250,000 (previously US$1,000,000)52. Effective November 1, 2021, inputs imported to be used in the manufacture of goods in the countrycan be paid at the port of origin, up to the amount equivalent to the average value of the total imports that were made in the last twelve months.
On the other hand, the Board of Directors of the BCRA generated a mechanism that allows tourists visiting Argentina to open a bimonetary savings account or obtain a prepaid card. With these tools, they will be able to make purchases in pesos in stores in the country, withdraw cash in national currency, and carry out financial operations for currency exchange54. In order to open this account, they must have a bank account in their country of origin, which will be the only one enabled to transfer foreign currency to the local account. In this way, tourists are made easier to earn foreign currency and manage electronic payment systems.
Finally, the BCRA provided that financial institutions must maintain between November 5 and 30 a net global position in foreign currency that does not exceed the minimum between the cash position of November 4 and the monthly average of daily balances recorded in October 2021, without considering the securities issued by residents that have been imputed there55.
With regard to the nominal exchange rate, the BCRA maintained a relatively limited rate of depreciation, with the aim of contributing to the slowdown in the inflation rate. Despite the lower dynamism of the nominal exchange rate, the ITCRM remains at competitive levels and around the average of the last 24 years.
Finally, the balance of International Reserves stood at US$42,608 million as of November 12, accumulating an increase of US$170 million since the end of June. This dynamic was influenced by the allocation of Special Drawing Rights (SDRs) by the IMF and the payment made to the organization in mid-September. It should be noted that the net purchase of foreign currency from the private sector accumulated between June and October was practically neutral. The BCRA began the quarter with a buying position in the foreign exchange market, although the greater volatility of the market led to an increasing intervention by the BCRA that caused it to present a net selling position at the end of September and in the first days of November. In October, on the other hand, the BCRA was the net buyer of foreign currency in the market (see Figure 7.9).
Figure 7.9 | Net purchases of foreign currency by the BCRA
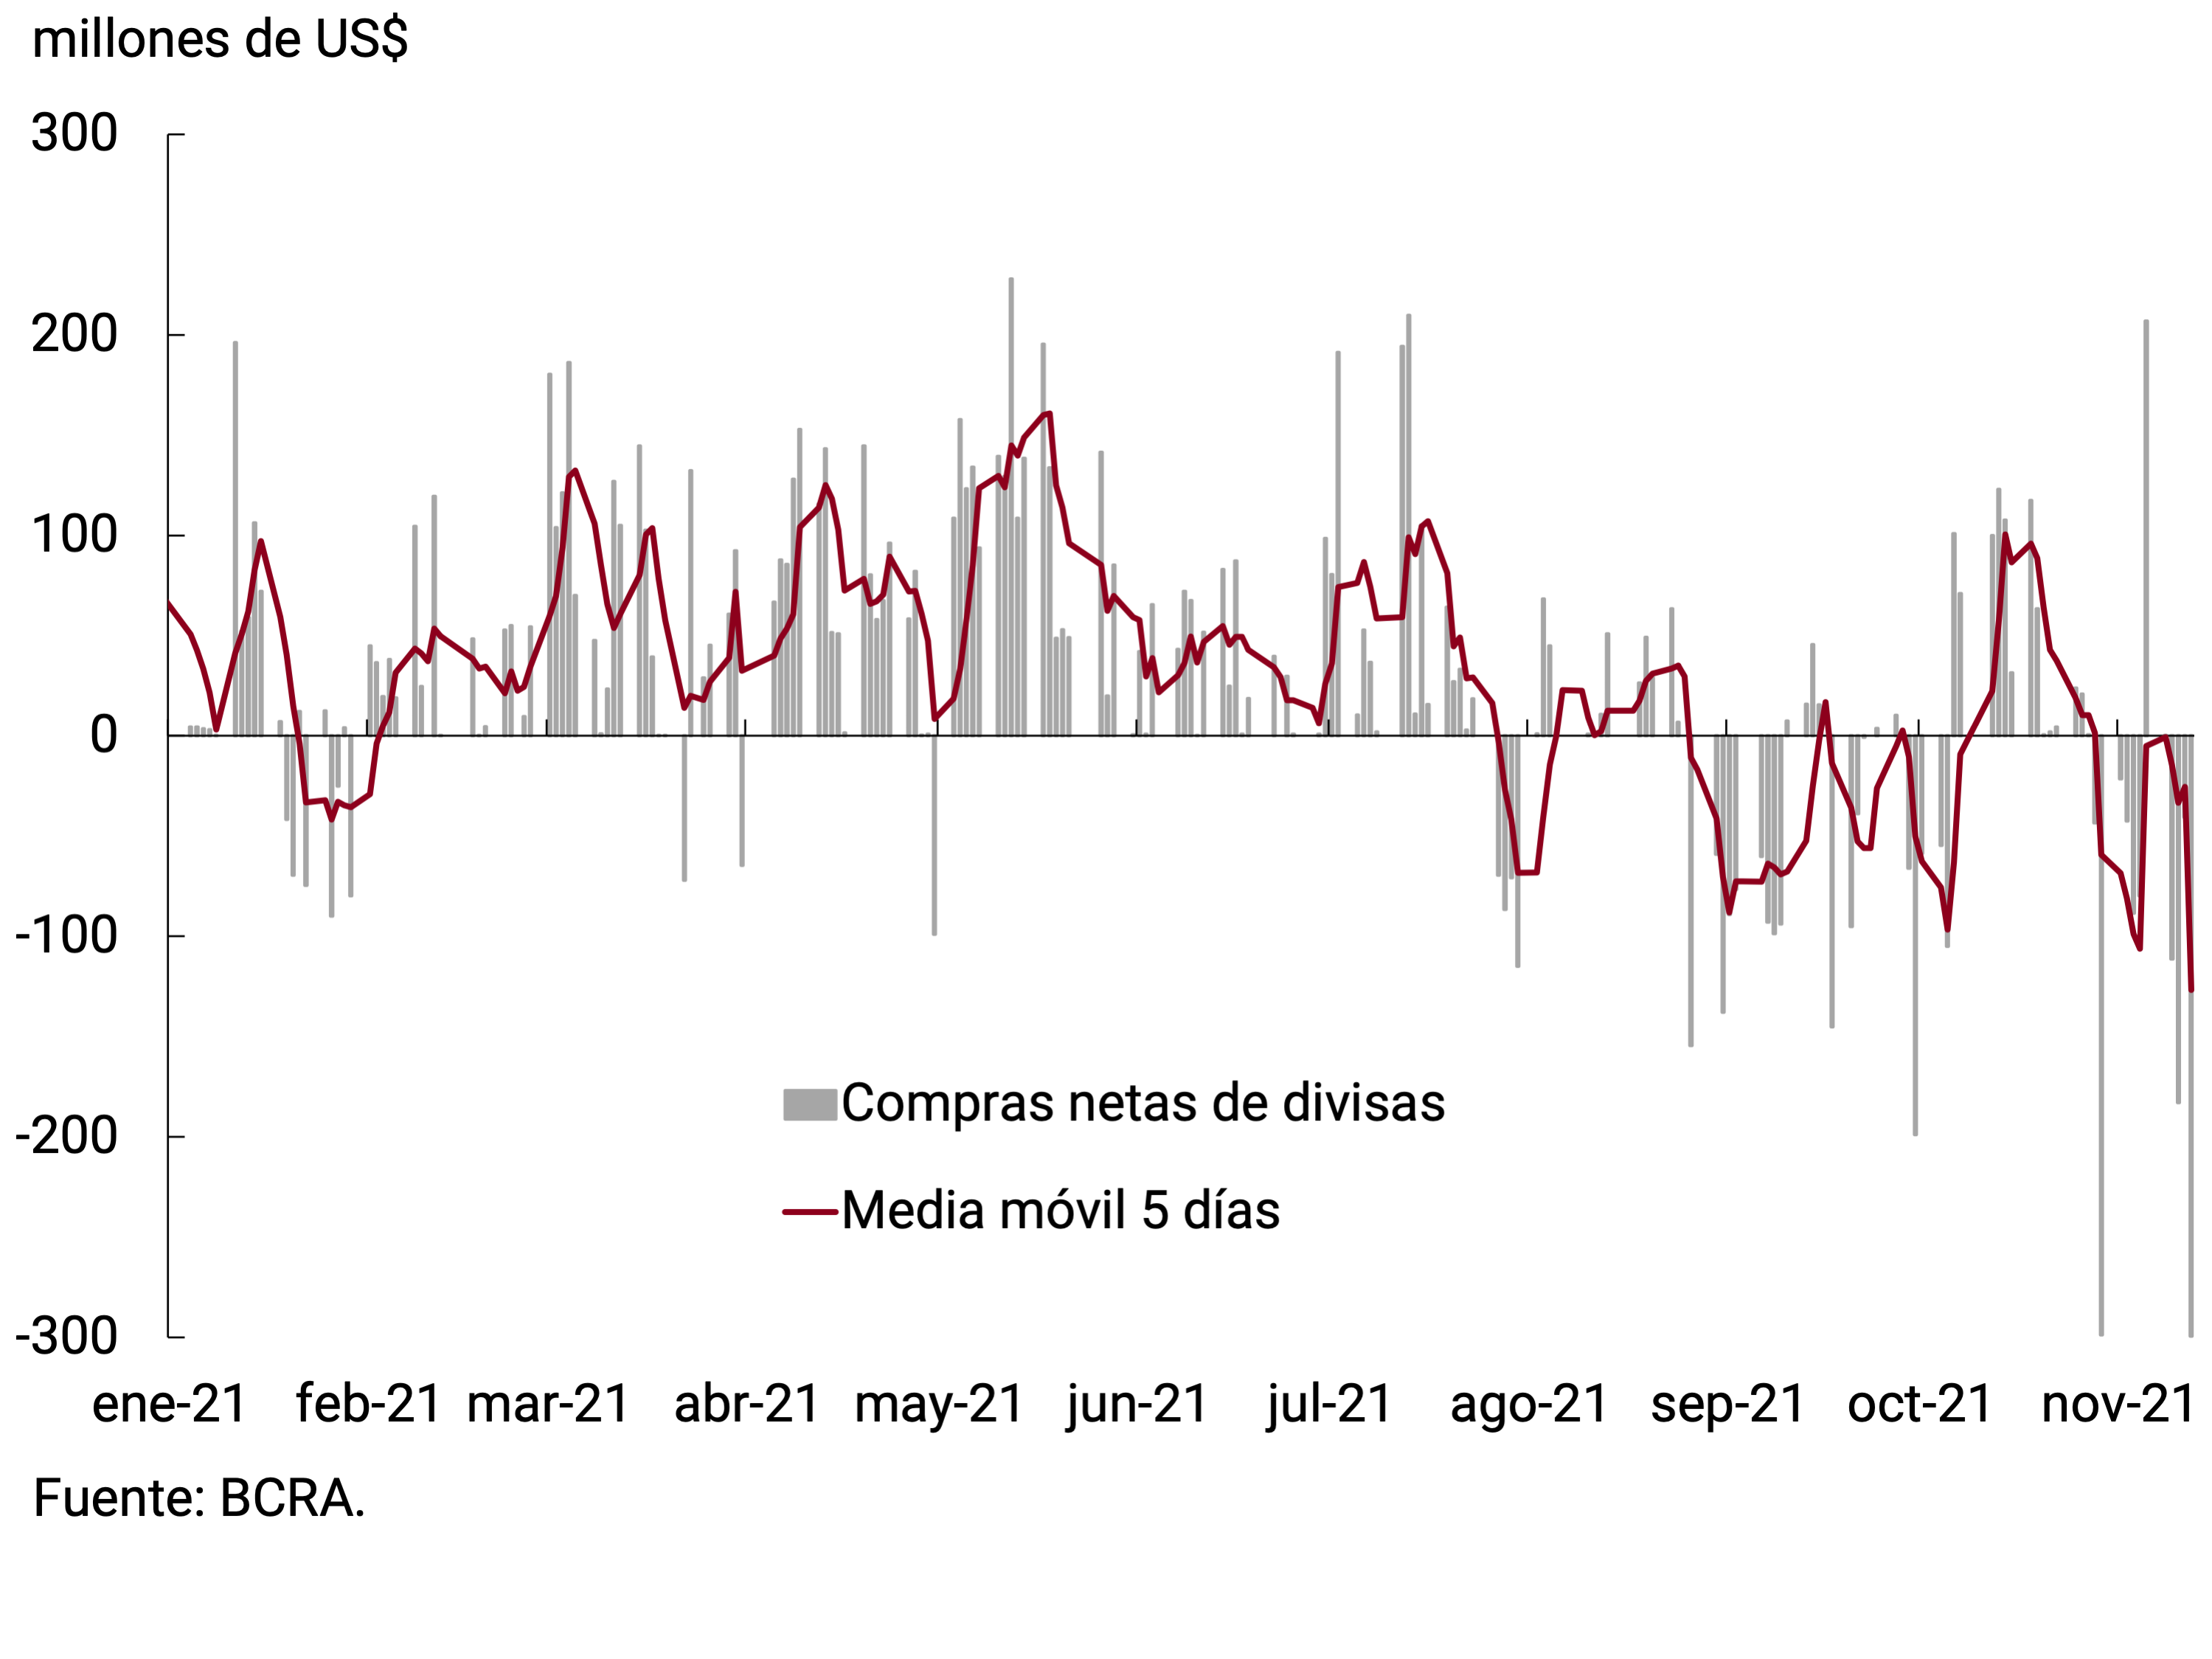
7.2. Monetary policy outlook
The improvement in epidemiological indicators, the progress with the vaccination plan and the strengthening of the health system allowed the return to normality of most economic activities. In this context, the economy continued to show signs of reactivation, a trend that would continue in the coming months. Likewise, it is expected that as the transitory factors that pressured the general price level subside, inflation will resume a path of gradual deceleration.
After the successful restructuring of the debt in foreign currency, the National Government continues to move forward with the necessary actions to reestablish the sustainability of the public debt. In particular, it continues with negotiations with the International Monetary Fund (IMF), in order to set a more reasonable maturity schedule in accordance with the economy’s ability to pay, unlike the current one, the product of a stand-by agreement that did not meet its objectives, and that is excessively concentrated in the short term. It should be noted that within the framework of the understanding reached with the Paris Club, the National Government committed to reach a new agreement with the IMF as soon as possible and no later than March 2022. This will help to improve the expectations of those actors who condition their vision of the sustainability of the external sector on the outcome of such negotiations, helping to contain exchange rate pressures and inflation expectations.
The progress made in the reconstruction of the domestic debt market will allow the year to end with a level of financial assistance to the National Treasury significantly lower than the previous year. However, the BCRA will continue to calibrate the liquidity of the economy and sterilize eventual monetary surpluses. On the other hand, the monetary authority will continue with the policy of managing the exchange rate, encouraging the exchange rate dynamics to contribute to slowing down the inflation rate.
With a medium-term view, the sustained growth in economic activity would lead to a greater demand for real monetary balances, which would be around the average value verified during the previous decade (2010-2019). In this new stage, it is expected that both the extraordinary financing needs of the National Treasury and the consequent sterilization effort will subside. This would favor the demand for the monetary base to be provided by the interest associated with the BCRA’s interest-bearing liabilities and, potentially, by a dismantling of the balance thereof. This process, together with economic growth, would contribute to reducing the relative weight of the BCRA’s Bills and Passes on its balance sheet and also with respect to the size of the economy, a trend that would be underpinned by a growing credit dynamic.
Section 1 / The rise in international inflation
The progress in the vaccination process against COVID-19 at the global level made possible a progressive lifting of health restrictions and a marked increase in the mobility of people, gradually returning to the values that were recorded prior to the pandemic (see Chapter 2. International Context Section 2.3). This led to the recovery of economic activity, although it also brought with it higher inflation: in many cases, to levels not seen in decades, a dynamic that was verified in both developed and emerging countries (see Graph 1). This is due to supply mismatches, the base effect of comparison, the increase in the price of raw materials, mainly energy; all this in the context of monetary support measures taken since March last year. In the case of emerging economies, the impact of higher commodity prices was enhanced by exchange rate depreciation.
Graph 1 | Global inflation, 2018-2021
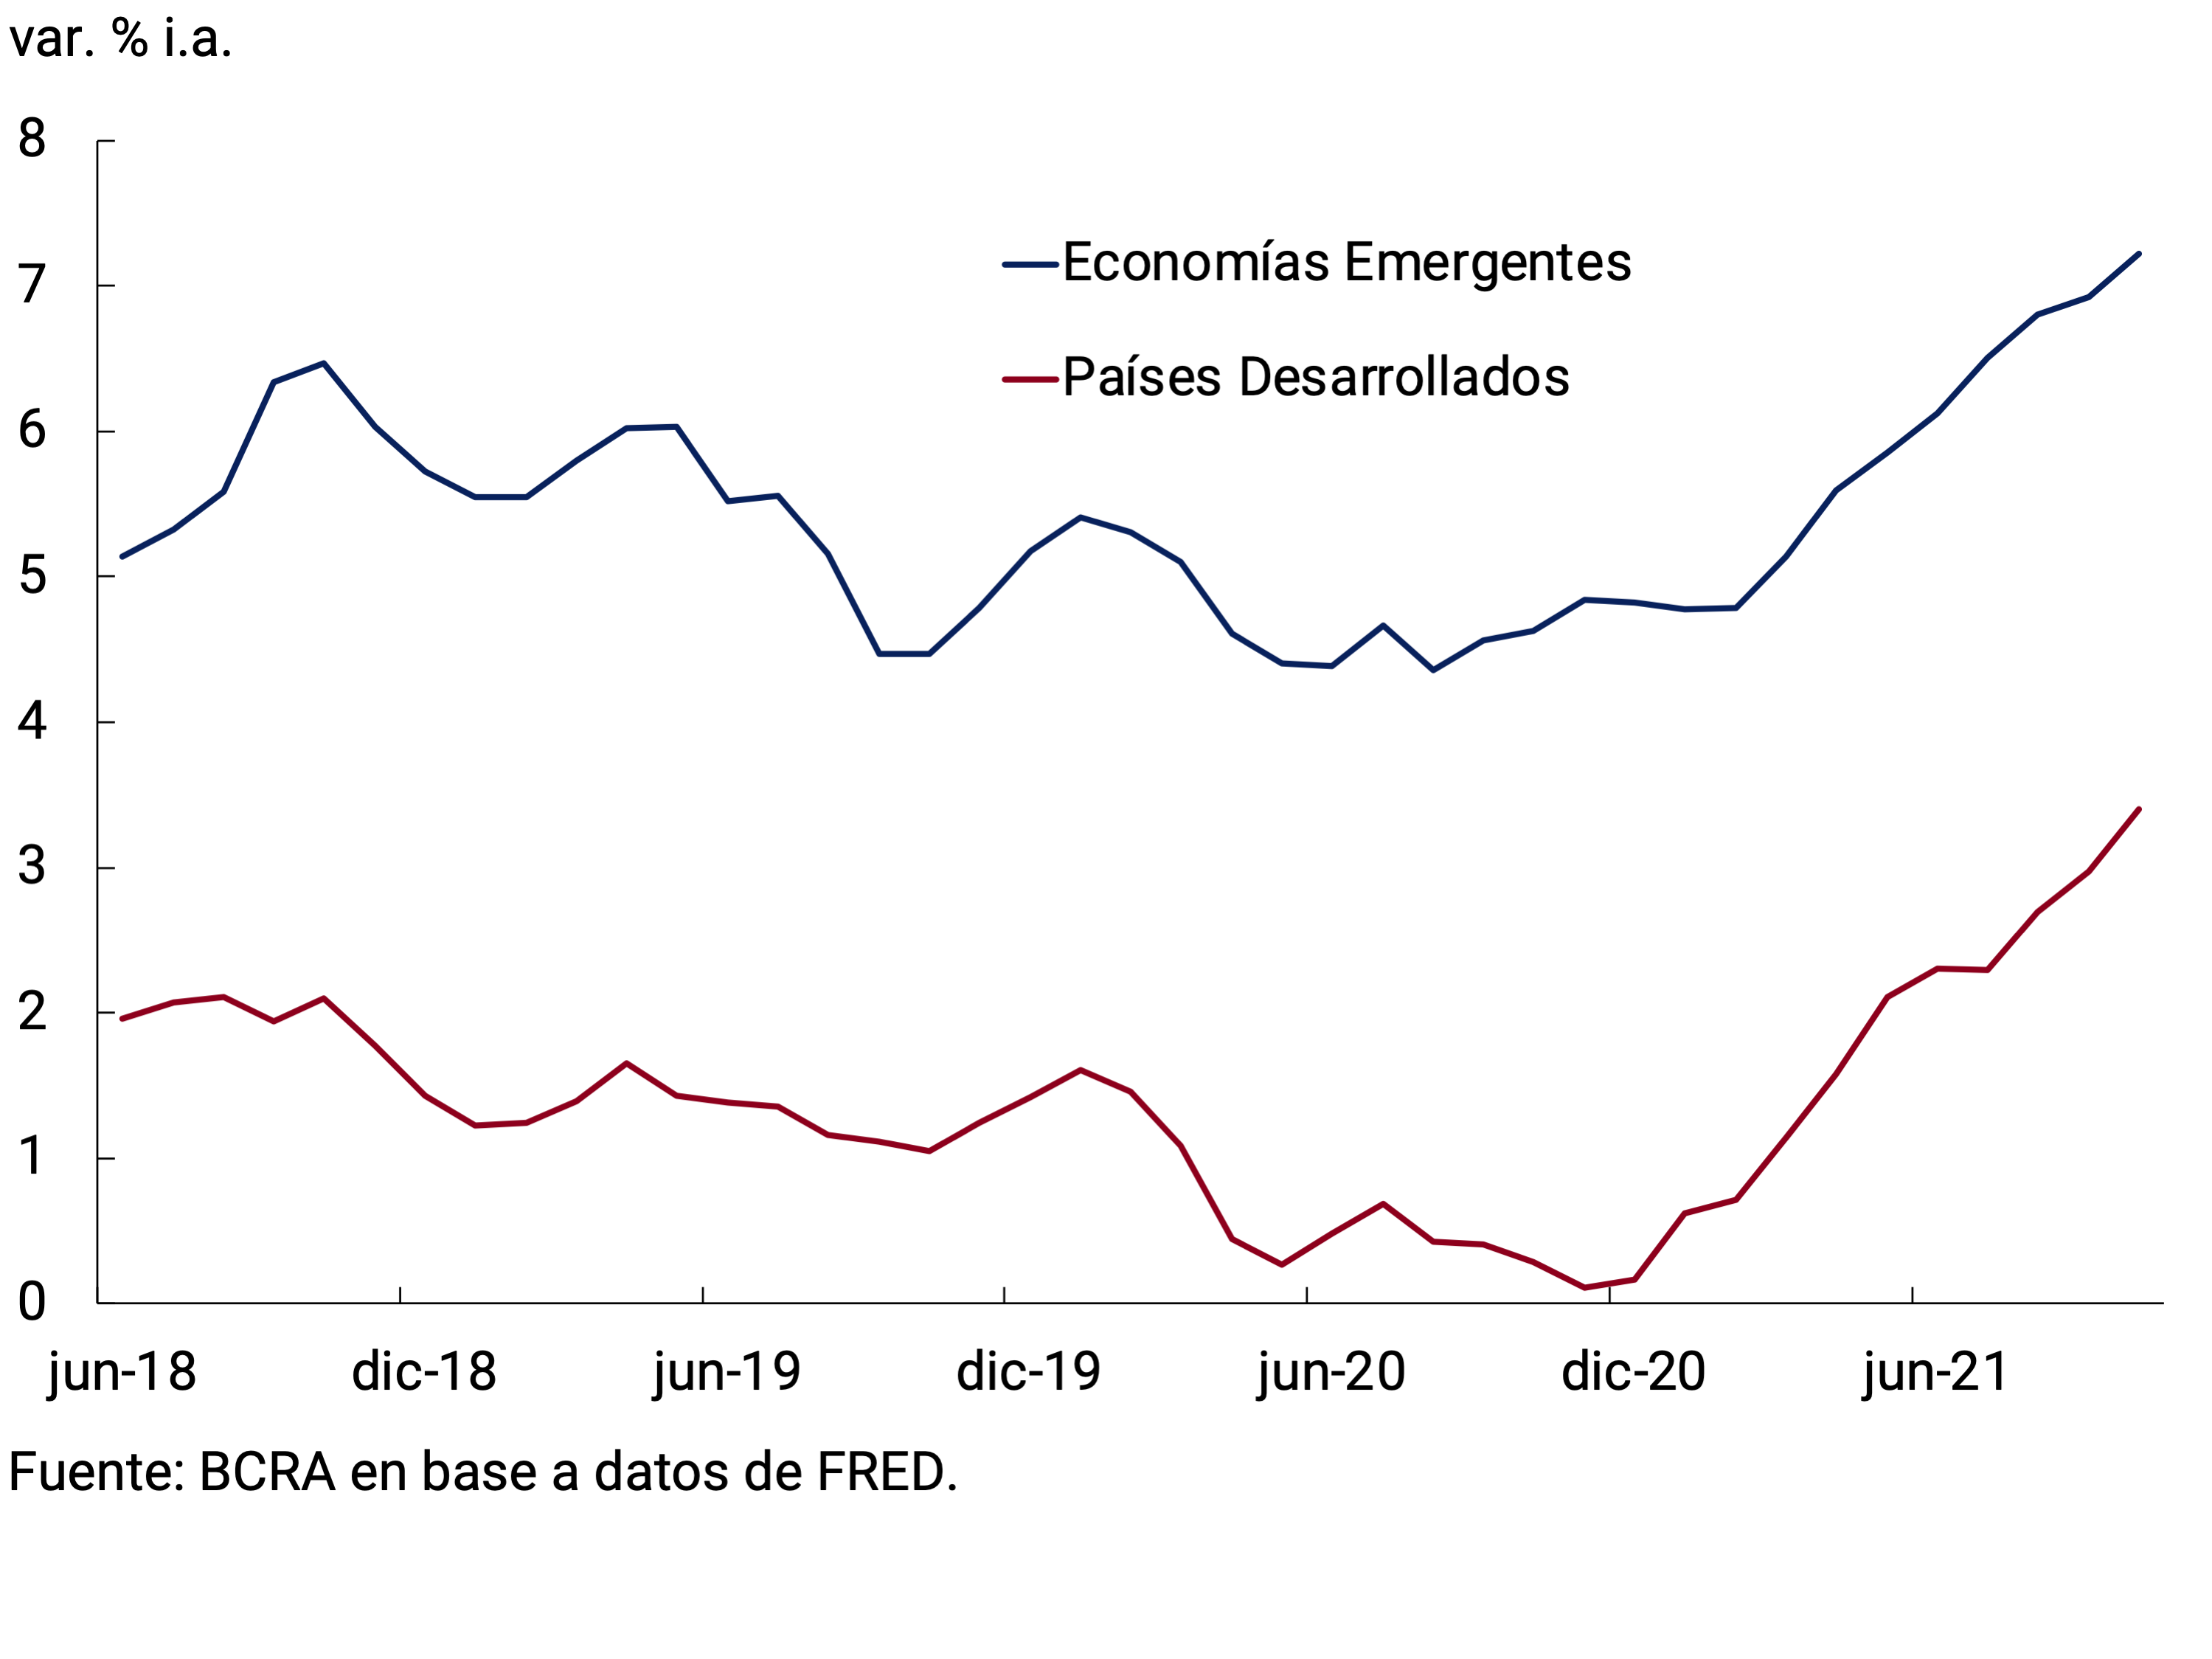
Food and energy prices account for much of the higher inflation. In the case of developed countries, taking the US as an example, higher energy prices translate into both higher transport costs and housing costs, items that explain 2.9 p.p. and 1.9 p.p. of the year-on-year increase recorded in October 2021, respectively. In the case of transport, the contribution of higher car prices is also important, and in the case of housing, the dynamics of rents. Food, on the other hand, contributes 0.6 p.p. to the 5.4 p.p. growth of the general index. In the case of emerging markets, these factors are compounded by the exchange rate depreciations of 2020 and the higher prices of other commodities: where, as an example in Brazil, October inflation of 10.7% y.o.y. transport accounts for 4 p.p., food and beverages 2.7 p.p. and housing 2.2 p.p. (see Graph 2).
Graph 2 | Inflation in the U.S. and Brazil, 2019-2021
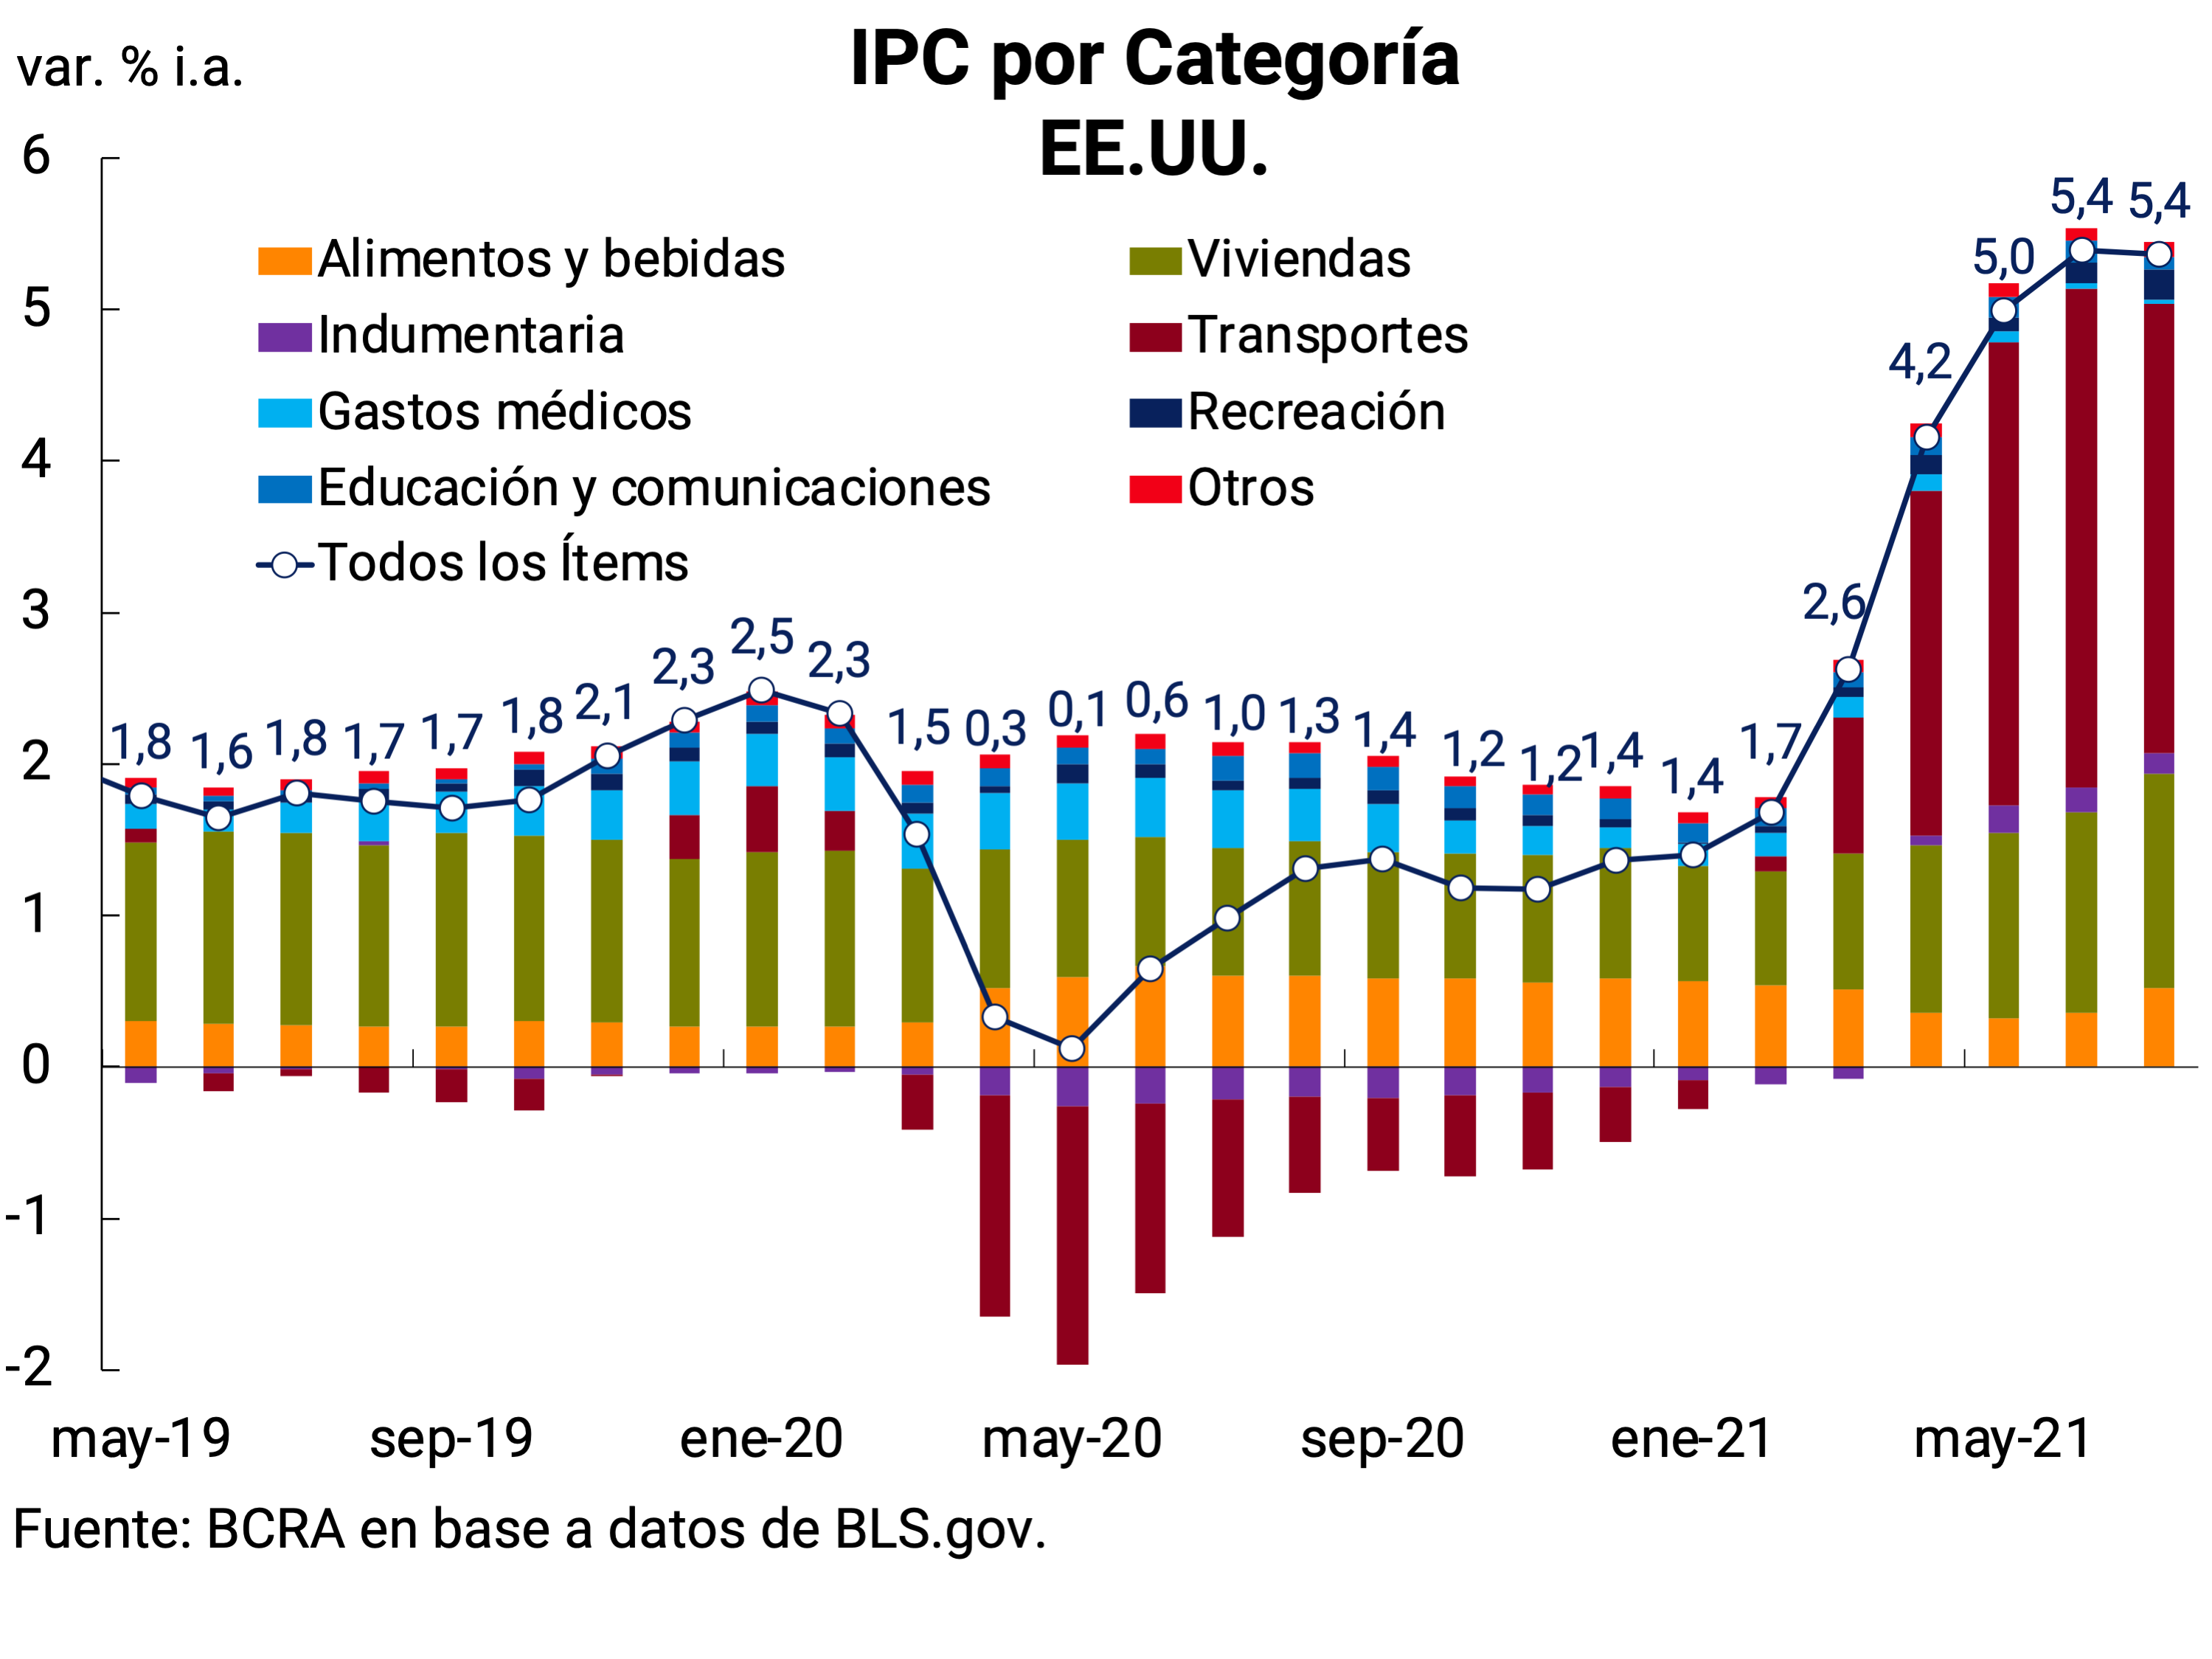

The pandemic and the health measures implemented implied a profound change in behavior, in the way production is worked and organized, and in consumption habits (see Anayi et al. (2021). Some of these changes appear to have been transient and rapidly reversing, while others will be more far-reaching. To correctly identify inflationary pressures, it is useful to distinguish demand shocks from supply shocks and how transitory or permanent they are expected to be.
Permanent or transitory factors behind the recent global inflation rise
The COVID-19 pandemic episode differs dramatically from a typical shock in that it encompasses diverse and complex interrelated supply and demand channels and economic policy responses (see Bobeica et al. (2021). Initially, it manifested itself as supply shocks, related to social distancing measures and business closures and, simultaneously, a series of demand shocks, due to increased uncertainty and infection risks. But this distinction between supply and demand effects became less clear as consumers adapted and changes in supply triggered demand effects, and changes in demand likely triggered supply-side frictions in some goods. And this was compounded by unprecedented policy responses (see Figure 1).
Diagram 1 | The impact of COVID-19 on inflation

As health restrictions were lifted, economic activity recovered, but inflationary pressures appeared in some sectors, caused by the different speeds at which supply and demand shocks were reversed. Demand shocks were naturally faster to reverse, which was enhanced by the fact that many agents accumulated consumption postponed during the quarantine, particularly in advanced countries where there were increases in savings rates to historic record levels, in a context in which government support measures sustained household incomes. While the replenishment of inputs, the rehiring of workers and the logistics necessary for the transport of inputs and products made the reversal of supply shocks slower and more complicated. These problems were exacerbated in the case of those activities carried out through complex global chains. As a result, bottlenecks were generated in many sectors that drove prices upwards.
A notorious example is the significant increase in the price of used cars in the U.S. With the pandemic, the demand for laptops and other consumer electronics that use microprocessors increased. With the return to normality, there was a significant increase in the demand for cars, which had been depressed during the pandemic, and given the limited supply of these inputs, this generated a bottleneck. Thus, there was a sharp reduction in inventories and long delays in the deliveries of new units, and a rise in prices, which was especially accentuated in the used car market. Used vehicles registered a price increase of 24.4% YoY in September 2021 (and reached a peak of 45% in June), while new units accumulated an increase of 8.7% YoY.
In the case of housing costs, it would seem to be a somewhat more persistent phenomenon, particularly in the US, where the median price of homes sold rose 20% YoY in July, although this is not directly transferred to the CPI since the latter includes the cost of rents and the cost of housing that is imputed to those who are owners. During the quarantine, rental prices were depressed, as many of the families who had to stay at home without being able to work were able to negotiate lower rents, a situation that was reinforced by the eviction moratorium that the U.S. government ordered during 2020. Once the term of this moratorium expired, and tenants had to renegotiate contracts, prices skyrocketed. There is also reason to believe that upward pressures on these prices may prove more durable. On the one hand, the owners of rental properties transfer the higher prices of their properties to the rental prices that they charge gradually and with a certain delay, and on the other hand, rental contracts are generally renegotiated once a year, while price surveys for the preparation of price indexes are carried out. generally, every six months. However, according to the evolution of house prices, the incidence of rents in the CPI and the lags with which they adjust, the IMF estimates, at the global level, that this will add 1.5 p.p. to inflation in a period of two years (see IMF (2021).
In the case of the price of energy, different factors come together. Some are more permanent, such as a gradual transition to a more intensive use of renewable energies, which motivates less investment in the exploration and exploitation of oil, gas and coal. Other factors are more specific, such as the appearance of certain logistical difficulties in the transport of fuels or in the international trade of some inputs. And also the need to improve the financial position of some OPEC members, who preferred not to increase production and take advantage of some time of higher prices, after a long previous period of low prices. However, the increase in the price of these more polluting forms of energy, while challenging the conduct of monetary policy, is conducive to accelerating the transition process towards the more widespread adoption of more environmentally benign alternative sources of energy.
Finally, there do not seem to be tensions on the labor market side, and inflation expectations have risen mostly over short horizons. Indeed, while wage growth has been high in some sectors, and wages for people with lower incomes or lower levels of education have improved more than average, overall nominal wage inflation across the economy remains subdued. Some measures, based on household surveys and market-implied measures, point to inflationary pressures over the short-term horizon, but market-implied medium-term inflation expectations have risen slightly (see Figures 2.11 and 2.13 in Chapter 2. International Context).
The different attitude of Central Banks in the face of the recent rise in inflation
The current situation presents an enormous challenge for policymakers. Changing the stance of monetary policy to address inflationary pressures caused by transitory shocks, if expectations remain anchored and there are no second-round effects, could be inappropriate and risk hindering the economic recovery. On the other hand, not taking action in time if shocks are more permanent can cause expectations to become unanchored and activate second-round effects that make inflationary dynamics much more costly to reverse.
In recent years, some Central Banks (CBs) of developed countries, such as the Fed and the ECB, had reformulated their monetary policy schemes, providing them with more symmetry (allowing inflation to be both above and below the target level), or greater flexibility (allowing to compensate for periods of inflation below the desired value, with others where it would be tolerated to be above, so that in a longer-term average it fluctuates around the value sought). This implies a change in attitude compared to the past, where CBs were more likely to take preventive action policies, given signs that conditions could be brewing for inflation to rise above the desired value. This, together with a diagnosis that the shocks were rather transitory, the bottlenecks were in specific sectors, and inflation expectations remained anchored, tipped the balance in favor of not yet tightening the stances of its monetary policies. But given the dynamics that prices continued to show and the growing concern that this generates, this continues to be a source of discussion, both inside and outside these monetary authorities.
On the other hand, in emerging countries, as the risks of inflation expectations becoming unanchored are higher, and the pass-through of increases in commodity prices to the general price level is larger, many CBs tightened their monetary policies. And unlike in previous cycles of commodity price increases, where the exchange rates of emerging economies that export them tended to appreciate (which helped to counteract inflationary pressures), this time many emerging economies experienced depreciations in their exchange rates, which added additional inflationary pressures.
For emerging countries, a tightening of the monetary policy stance in developed countries will imply a tightening of international financial conditions, capital outflows and pressures on their exchange rates, which they will have to be prepared to deal with. Although on other recent occasions emerging countries have not shown serious difficulties in this type of situation, the measures adopted during the pandemic find them somewhat more vulnerable, since they had to finance extraordinary fiscal policies, which raised their debt levels.
References
Anayi, L., Bloom, N., Bunn, P., Mizen, P., Thwaites, G. & Young, C. (2021) Covid-19 and structural change. VoxEU.org – CEPR’s policy portal.
Bobeica, E., Hartwig, B. & Nickel, C. (2021) The euro area Phillips curve: Damaged but not dead. VoxEU.org – CEPR’s policy portal.
Phillips, M (2021) Used Car Prices Catch Wall Street’s Eye as a Predictor of Inflation. The New York Times
The Economist (2021a) Another upward force on American inflation: the housing boom. Oct 16th 2021Edition.
The Economist (2021b) The age of fossil-fuel abundance is dead. Oct 9th 2021Edition.
IMF (2021) World Economic Outlook – Recovery During a Pandemic. Oct 2021.
Section 2 / Vaccination as a key determinant of the evolution of economic activity
Vaccines have so far proven to be effective in mitigating the effects of the pandemic on the severity of the disease and deaths from COVID-19 in the world. Greater access to and application of the different vaccines have been the main determinants of the recent favourable evolution of both local and global economic activity (see Chapter 2. International Context).
In our country, the vaccination process began at the end of 2020 with the “Strategic Plan for vaccination against COVID-19 in the Argentine Republic”. In an initial context of limited global supply, logistical problems associated with distribution, and massive international demand for vaccines, the National Ministry of Health decided to prioritize the groups most exposed to contagion and at greater risk of severe disease15. In the face of a global production of vaccines that was becoming more dynamic, as new agreements were reached and the local production of someof them 16 was launched, the local supply of vaccines increased strongly (see Table 1).
Table 1 | Reception of COVID-19 vaccines in Argentina

In the first half of 2021, the partial vaccination of the prioritized groups grew exponentially, reaching about 90% of the population over 60 years of age in mid-June, while by September the same proportion was reached with complete schemes. Once the population most exposed to the virus and at risk was covered, vaccination was extended to people in lower age ranges, including children between 3 and 11 years of age since October. As of the date of publication of this report, 78.8% of the population has started their vaccination schedule and 60.5% have the complete schedule, while for the highest risk groups and the highest age ranges, coverage is practically total (see Graph 1).
Graph 1 | Population vaccinated with 1st. and 2nd. Dose by age range (%)

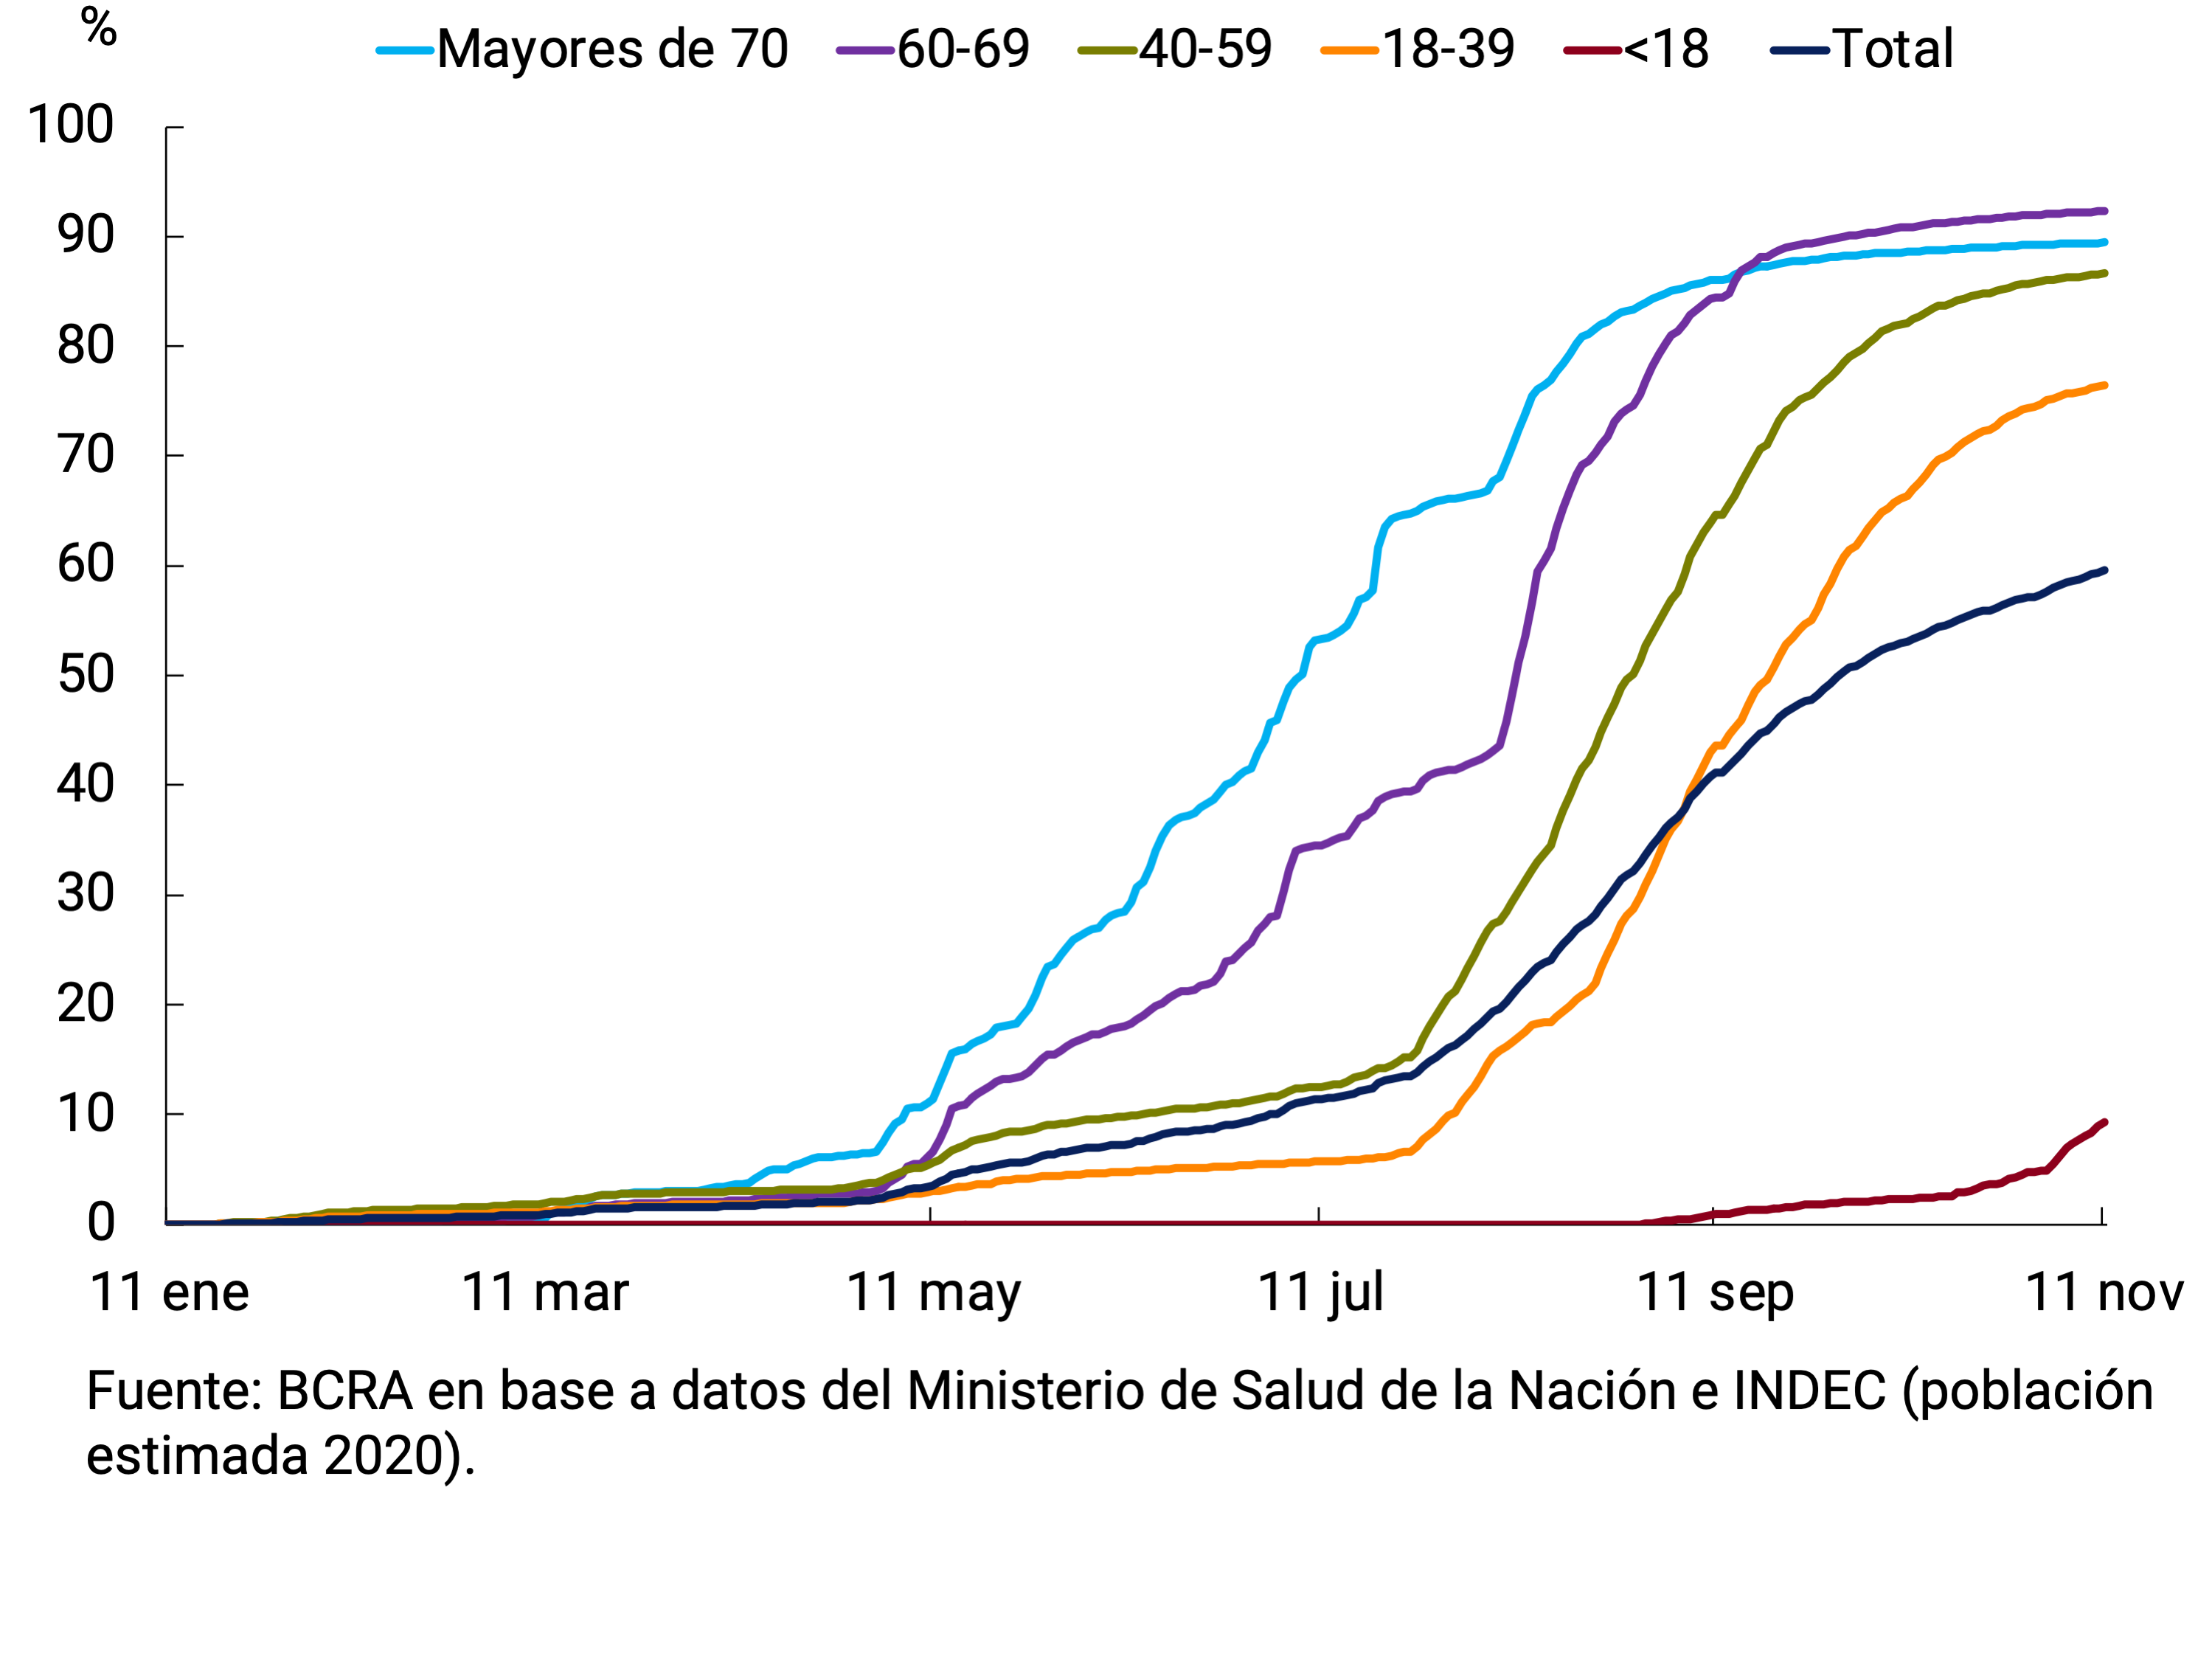
With the progress of vaccination, within the framework of a wide acceptance by the population, the health situation improved significantly. The economic effects of the second wave of infections in the country in April and May 2021 were relatively limited and could be overcome quickly. Since the beginning of June, new cases and deaths from COVID-19 have fallen steadily and in November were close to the lowest levels since the beginning of the pandemic in the country. The level of positivity also dropped significantly, managing to pierce the 10% threshold in August and remaining below the level recommended by the World Health Organization (WHO)17. The number of occupied intensive care beds in November was at levels similar to those of July 2020, with a 92% drop compared to the peak of June 2021, in a context of strengthening the health system18 (see Graph 2).
Graph 2 | New cases and deaths from COVID-19 per 100 thousand inhabitants. (7-day ultimate moving average). ICU occupancy and percentage of positivity
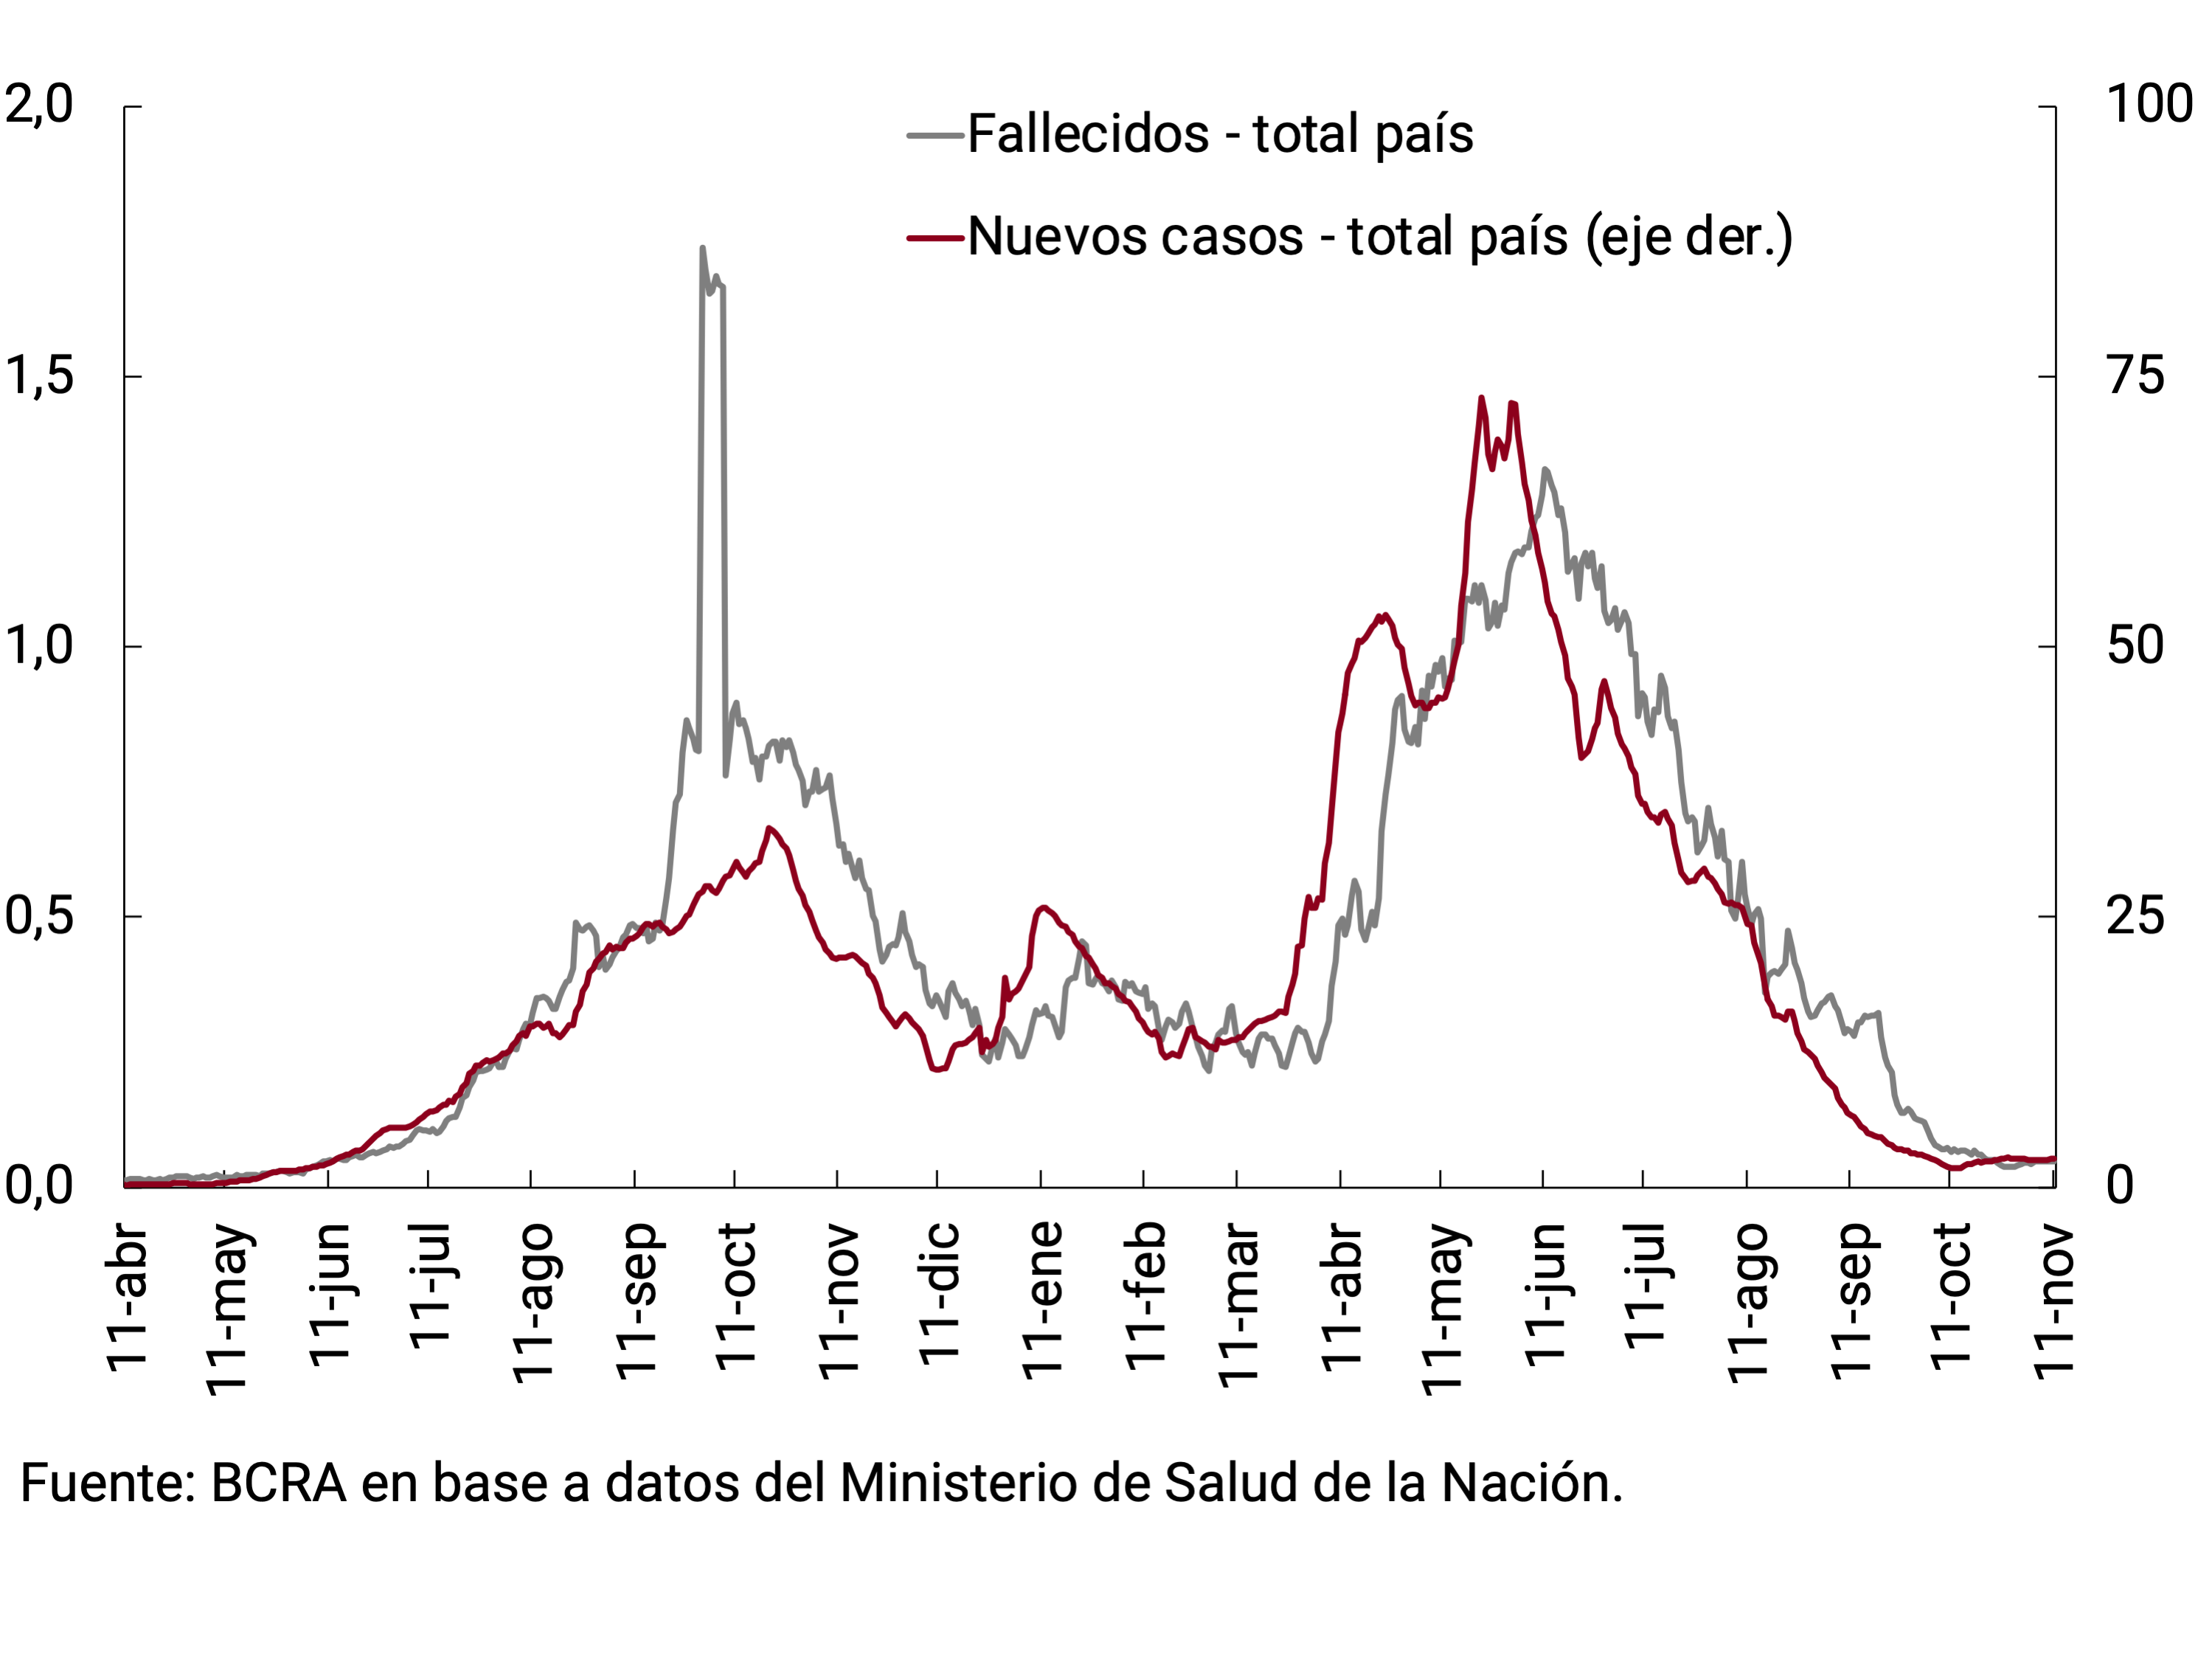

In the third quarter, the acceleration of the vaccination process in lower age ranges, together with the combination of vaccines implemented by the Ministry of Health19 , made it possible to significantly reduce the probability of a new event of magnitude associated with COVID-19 and to continue advancing with the authorization of activities and expansion of capacities20. Social mobility indicators showed a rapid rise since June 2021, reaching maximum levels in November in November. According to Google data, all mobility concepts were above pre-pandemic levels21. In the case of mobility associated with residential areas, it progressively decreased within the framework of the return to face-to-face learning, until returning in November practically to pre-pandemic levels (-0.5% below the level of Feb-20). All this was reflected in economic activity, which managed to recompose the pre-pandemic level earlier than expected at the beginning of the year (see Chapter 3. Economic Activity and Employment).
Graph 3 | Social mobility in Argentina (7-day last moving average)

More recently, the improvements achieved in epidemiological indicators have allowed Argentina to enter Europe’s “white list” for the entry of its citizens and residents, placing the country as a safe destination in terms of health. This generates very good prospects for inbound international tourism in the coming months, which are added to the favorable conditions for domestic tourism.
In any case, the risk associated with the circulation of the Delta variant in the country persists, which will require strict and careful monitoring, as well as that of new variants of the virus that could emerge globally and partially compromise the control of the local health situation. In this regard, and in accordance with international recommendations, it is planned to continue expanding vaccine coverage and strengthening the population’s immunity. Recently, the Ministry of Health of the Nation announced that, simultaneously with the progress of the partial vaccination process in the population over 3 years of age, it will continue to apply both second doses and additional and booster doses for the groups at greatest risk22.
Section 3 / Exports of goods ten years after the record
The record for exports of goods at current prices for a third quarter was reached in 2011: US$ 23,522 million. Between July and September 2021, for the first time in 10 years, foreign sales approached that value, totaling US$ 22,904 million. Export prices explain a significant part of this improvement (they grew 30% in year-on-year terms)25, but the contribution of the quantities exported cannot be ignored. In fact, given that export prices returned to the level they had 10 years ago, the volumes exported necessarily had to do the same to observe the value exported during the third quarter (see Graph 1).
Graph 1 | Exports of goods
Third quarter of each year

Although the levels are similar, some differences in the composition of both export baskets (III-21 vs III-11) can be highlighted. The top five product categories (out of 48 possible) remain the same: residues from the food industry, cereals, oilseeds, land transport material, and fats and oils. However, while in the third quarter of 2011 these 5 grouped together accounted for 51% of total foreign sales, in the third quarter of 2021 their share extended to 59%. Even among the main categories, movements in opposite directions were recorded: while foreign sales of cereals more than doubled, exports of land transport equipment were 37% lower than those of 10 years ago, being, in absolute terms, the category that showed the greatest decline of the 48 existing ones. Finally, the change in the composition of the exportable supply of the soybean complex is also noteworthy, in which soybean derivatives (Manufactures of Agricultural Origin) gained weight at the expense of beans (Primary Products; see Graph 2).
Graph 2 | Exports of goods
US$ billions
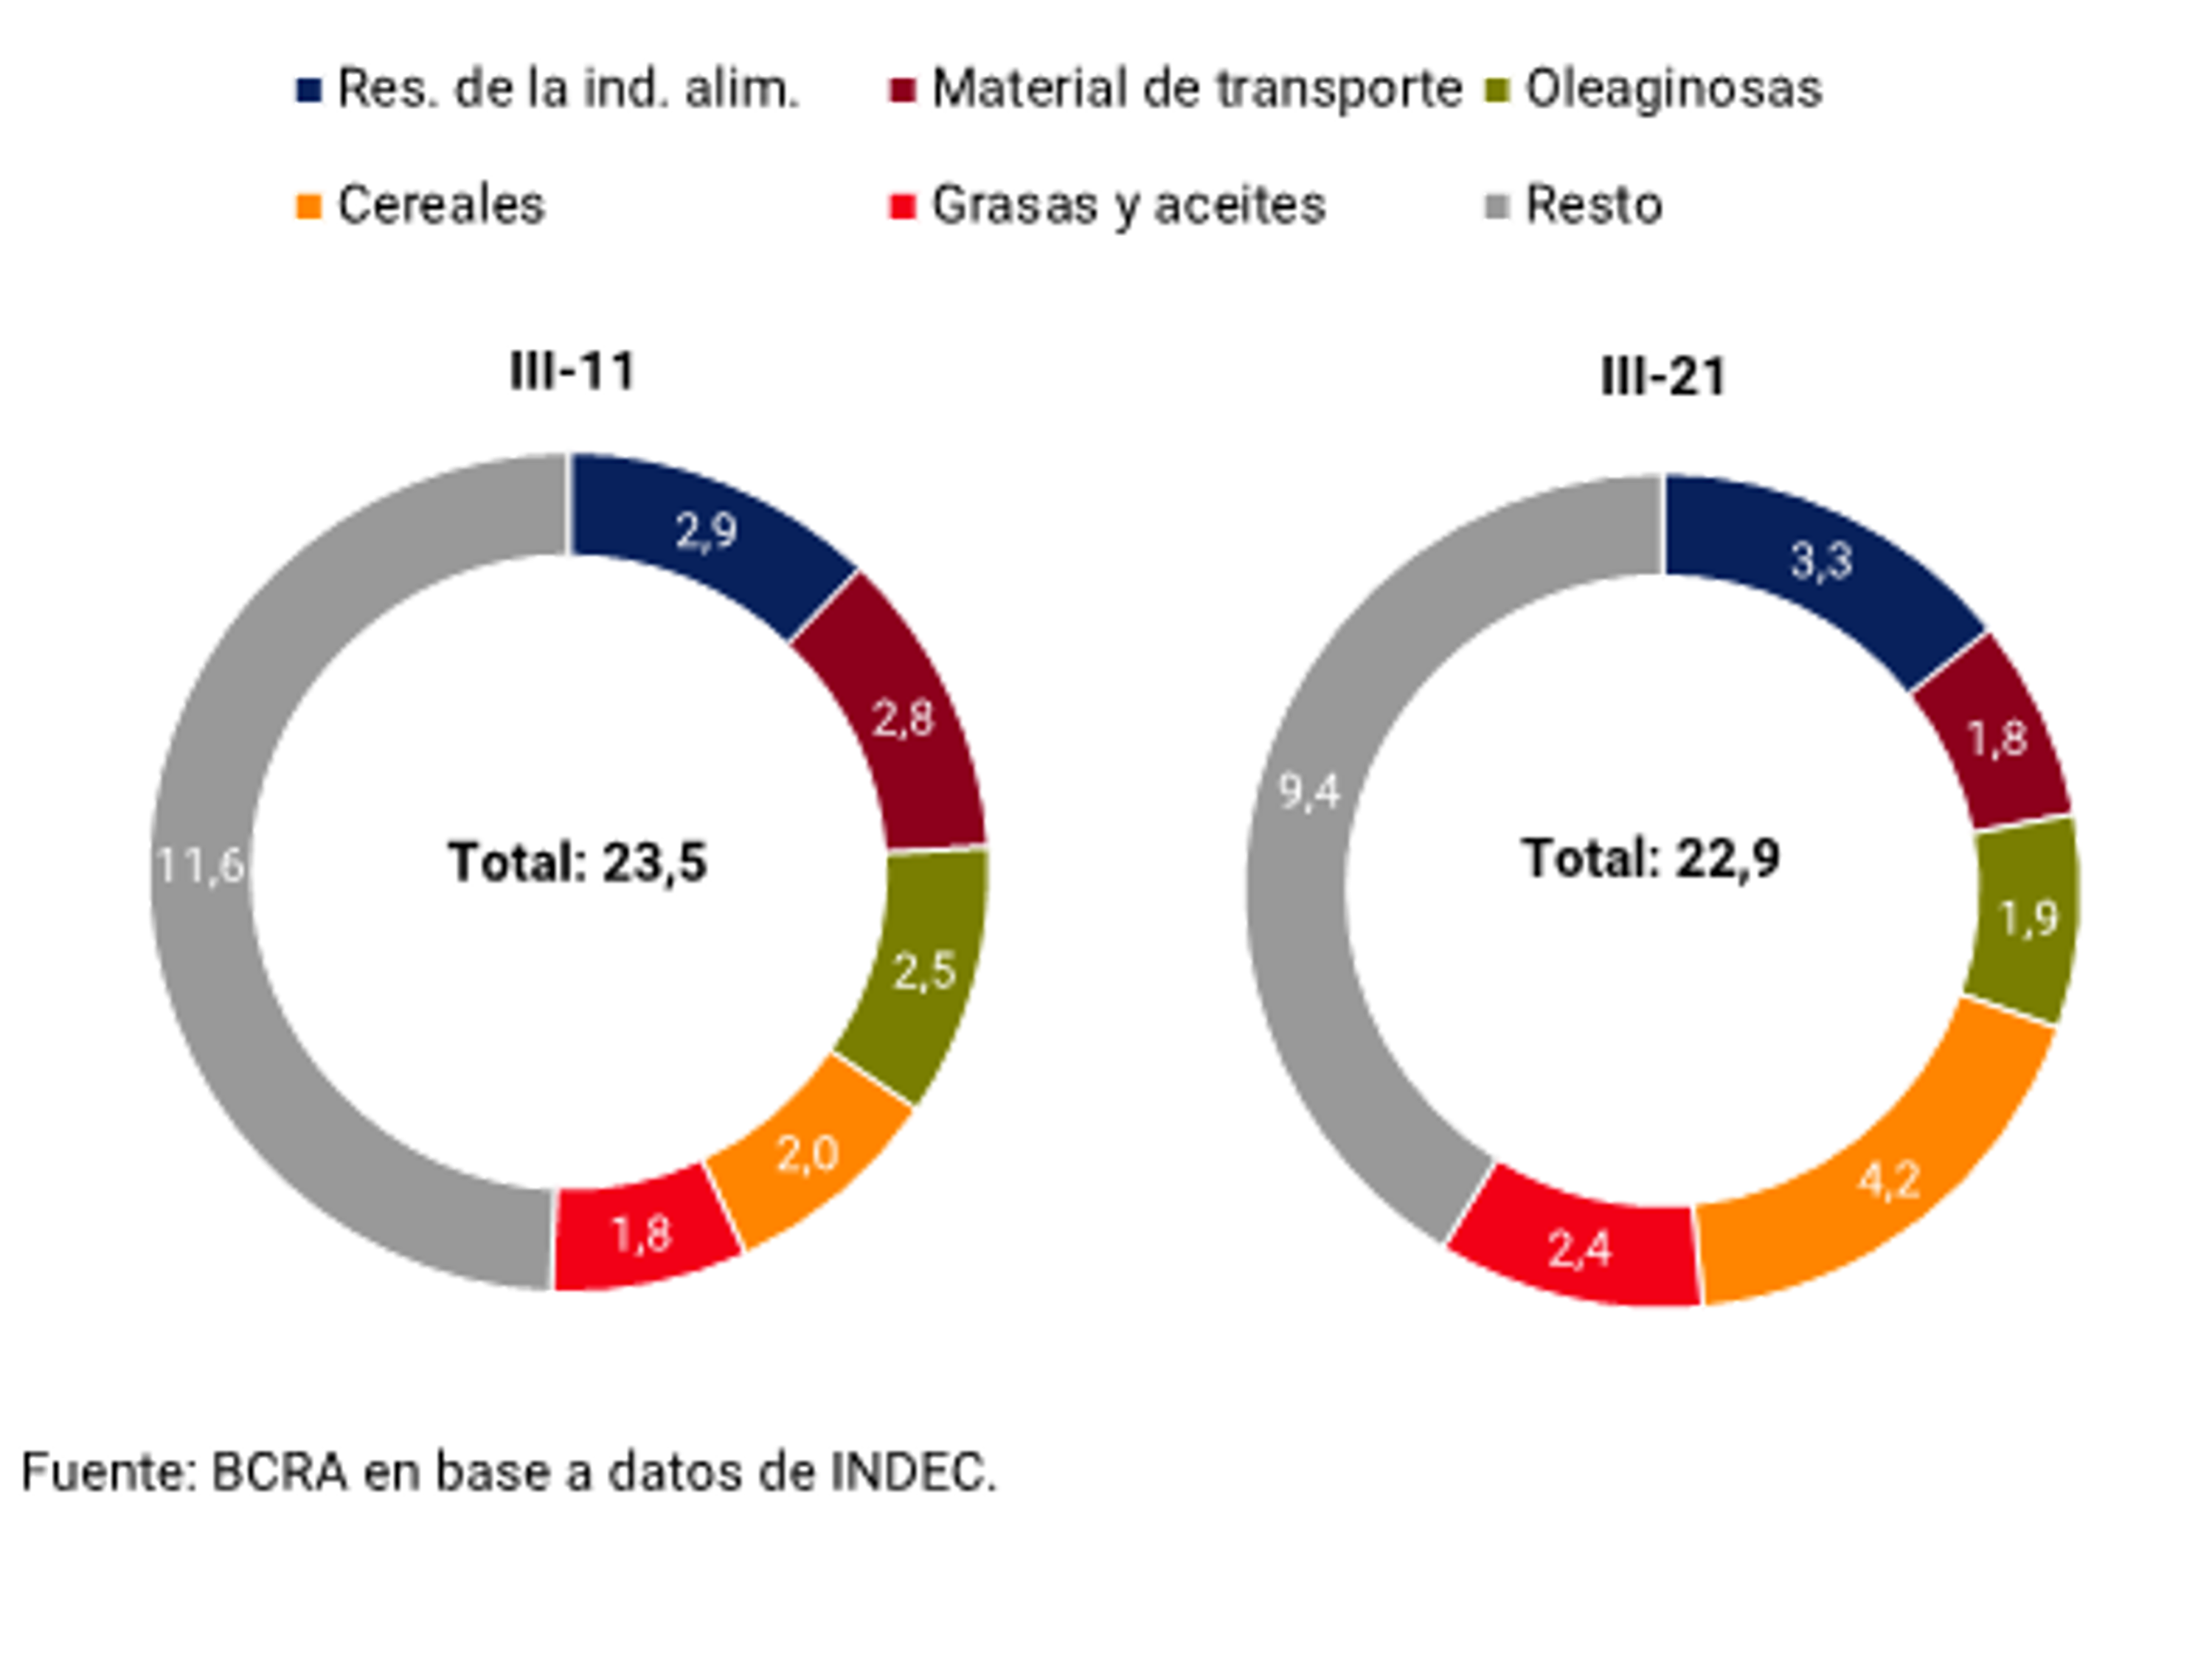
Other categories that gained notorious participation in Argentina’s export basket were: electric energy (+1.9 p.p.) and meat and its preparations (+1.8 p.p.); while among the categories that lost ground, fuels (-1.4 p.p.), metalliferous minerals (-1.3 p.p.) and base metals (-1.3 p.p.) also stood out.
Graph 3 | Exports of goods
Selected categories
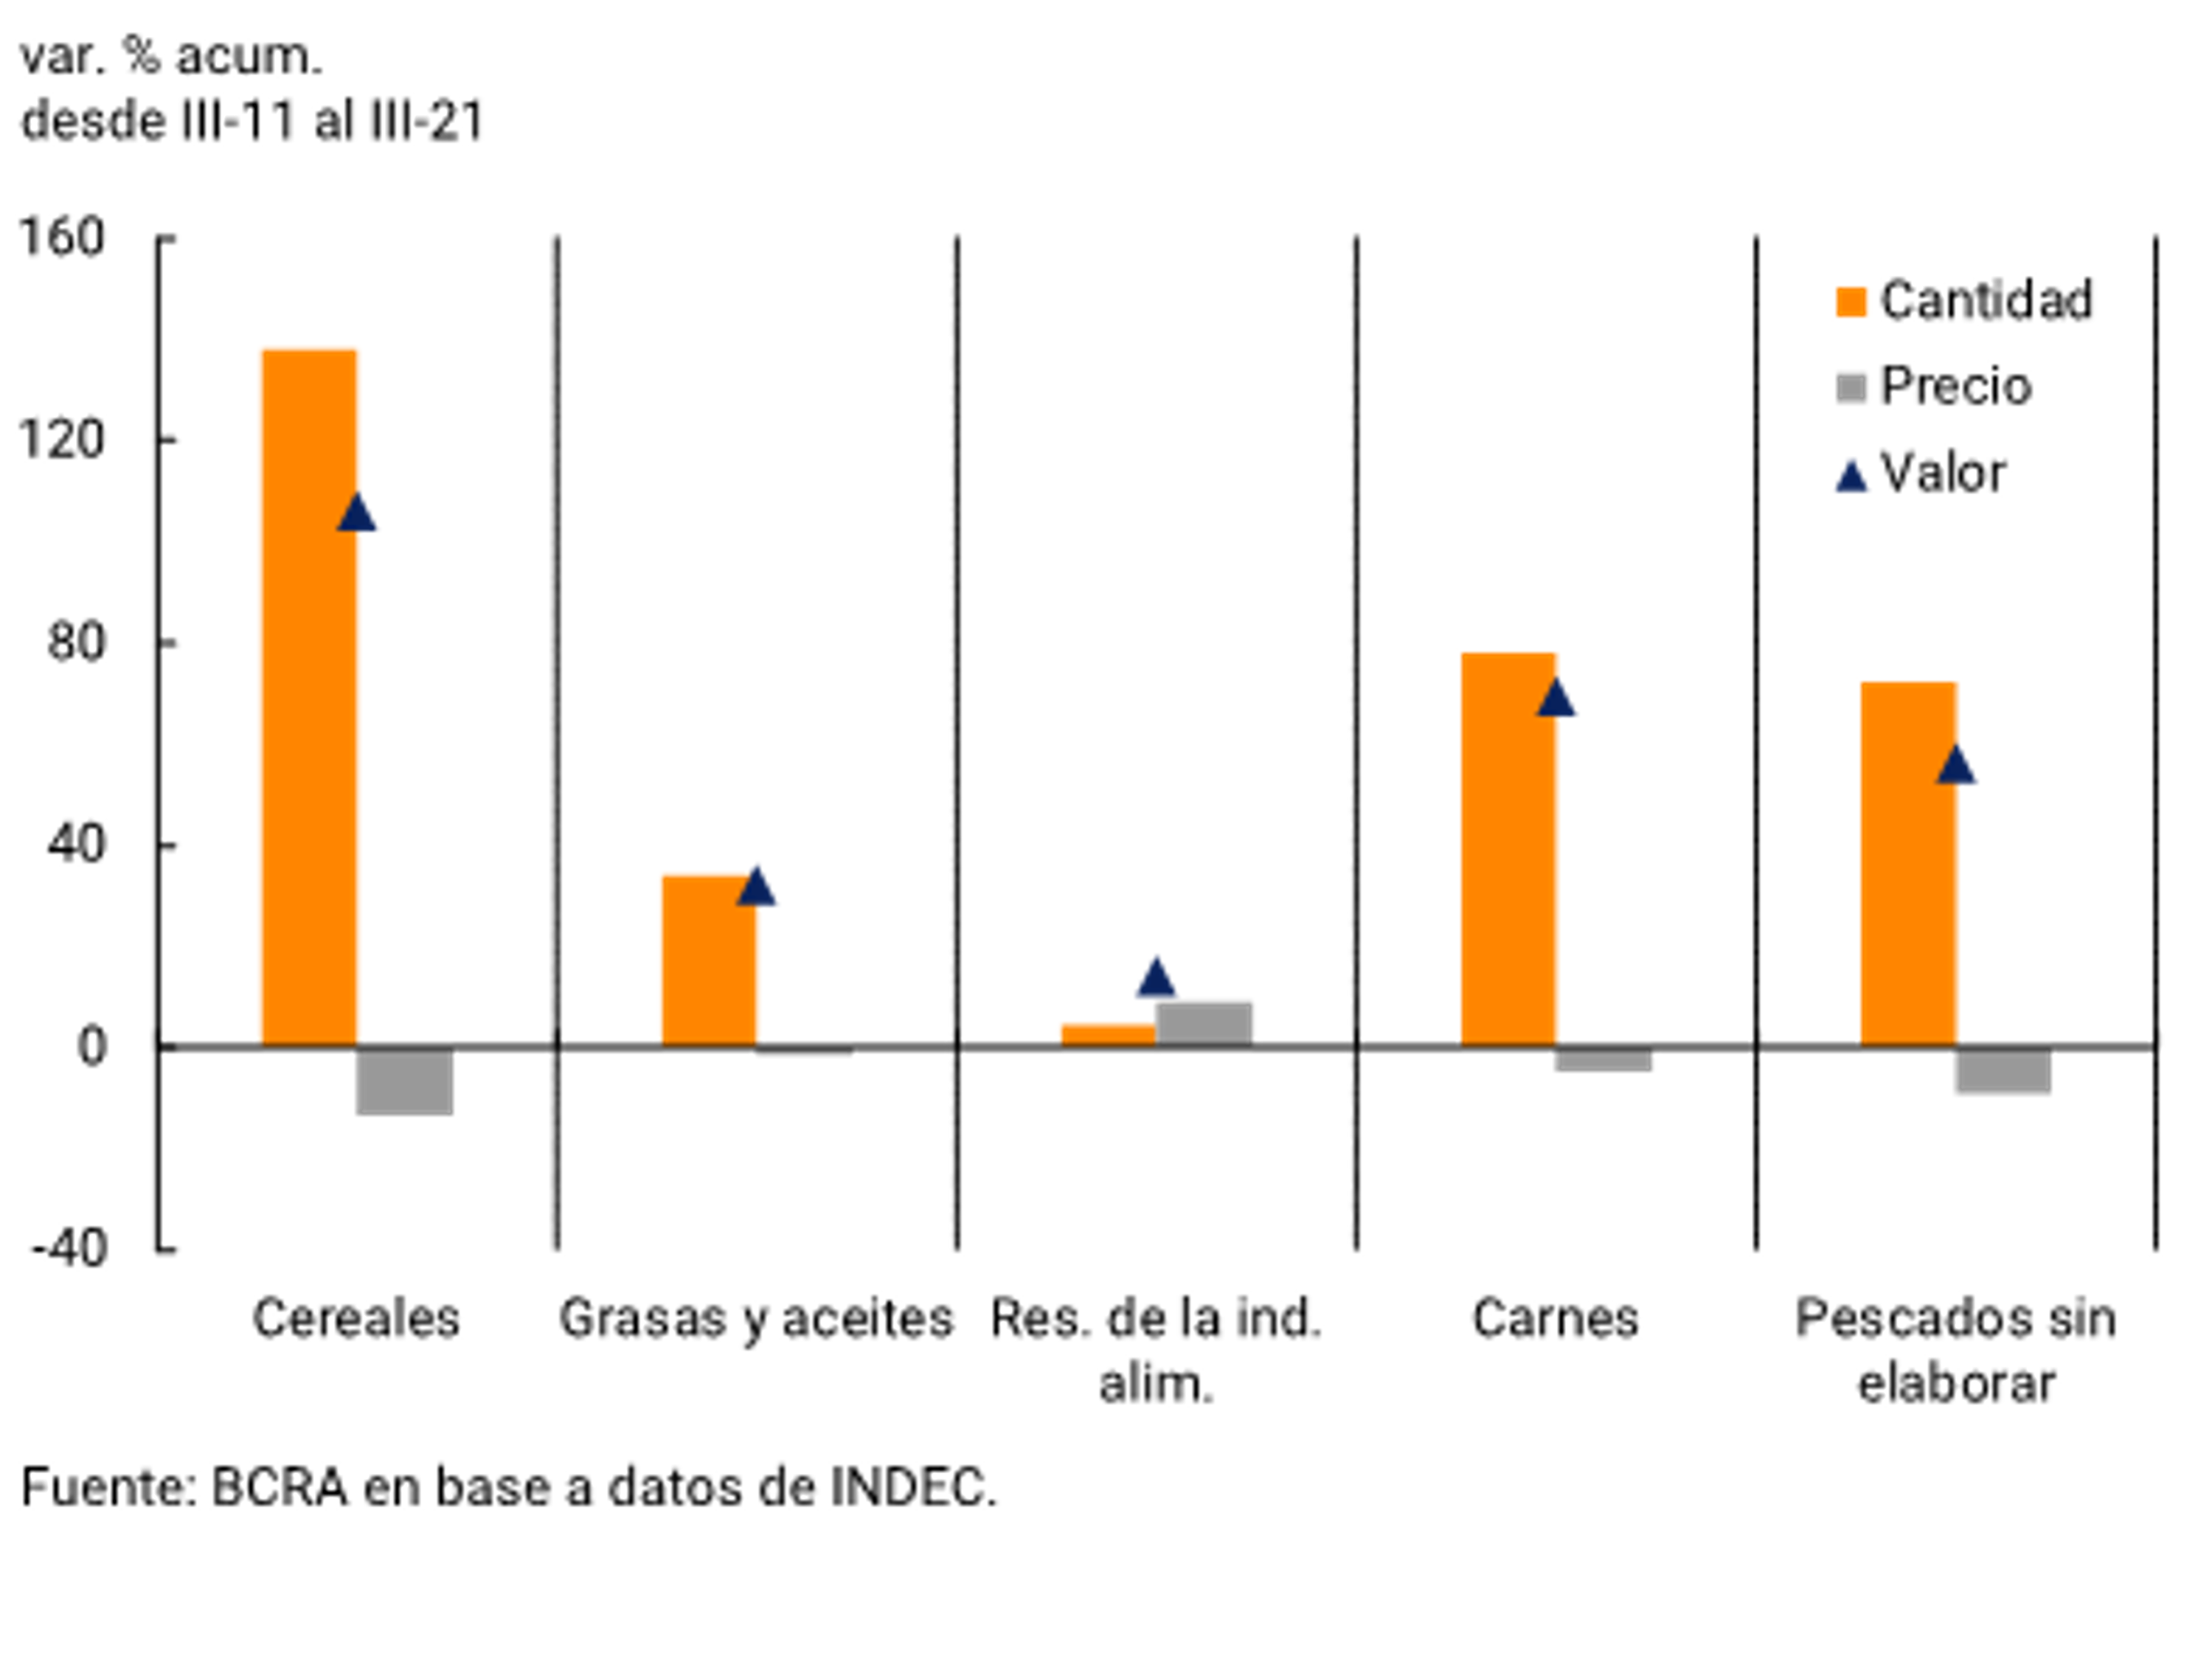
Taking the five categories that gainedthe most, 26 and the five that lost the most share in the export basket, it can be seen that, in general, it was fundamentally the variations in the volumes exported that were behind the changes in the values exported (see Graphs 3 and 4).
Figure 4 | Exports of goods
Selected categories

The cumulative variations in the volumes exported in the last ten years reflect different sectoral realities. In this period, the combined production of maize, wheat and barley (the main export cereals) grew 93% and the beef sector was boosted by penetration into the Chinese market. In contrast, exports of metalliferous minerals were reduced to a minimum due to the cessation of operations of Minera Bajo la Alumbrera in 2018 (the main copper producer) and the patenting of vehicles in Brazil (the main destination for Argentina’s automotive exports) fell by practically half, which is reflected in the decrease in exports of transport material from our country.
While global trade is going through a period of instability, as reflected in disruptions in some specific value chains (see Chapter 2. International Context), expectations ahead continue to point to a scenario of opportunities for the Argentine economy. For the next five years, the volume of world trade in goods is expected to grow at an average annual rate of 4.3%27, slightly above the growth rate of global output for the same period (3.2%). In this context, if Argentine firms manage to maintain their current share of world trade, Argentina would experience a sustained growth trajectory in exports, an objective that would contribute to the external sustainability of the economy, and would give the Central Bank room to review the current exchange regulations with a view to their progressive relaxation.
Section 4 / Restructuring of provincial public debts
The government that took over the leadership of the country as of December 10, 2019 implemented a series of social, productive, regulatory and fiscal consolidation measures aimed at facing the most immediate manifestations of the crisis in which Argentina was immersed. Following efforts to stabilize the macroeconomy, policy priorities were redefined with the aim of laying the groundwork for a process of sustainable economic development. After the restructuring of the national public debt denominated in foreign currency under foreign and domestic legislation that was perfected during 2020, actions were taken to adapt the commitments of the provincial public sector with its real possibilities of meeting them. Recently, the Province of Buenos Aires joined the majority of the sub-national districts that managed to restructure their liabilities with a broad acceptance of the latest offer made to creditors, practically bringing to an end the challenge of recreating the conditions that allow the provinces and their public debts to be fiscally sustainable.
The extremely demanding maturity profile of the sub-national public debt that Argentina faced at the end of 2019 had been gestated from a cycle of over-indebtedness experienced by provincial governments – as well as the Nation. After starting from a historically low level of indebtedness at the end of 2015, the previous administration promoted that sub-national financing needs be covered with a significant issuance of provincial bonds and taking out loans with international organizations, mostly denominated in foreign currency and under external legislation. This meant that the consolidated provincial debt went from 4.5% of GDP in 2015 to 7.3% of GDP at the end of 2019 (see Graph 1). Provincial debt in bonds in terms of output increased 143% in that short period.
Graph 1 | Consolidated provincial public debt

Between 2016 and 2018, a total of US$13,140 million dollars were placed in foreign currency bonds. Among the most relevant issuances are those of the Province of Buenos Aires for a total of US$5,818 million, those of the Province of Córdoba for US$1,985 million and the Autonomous City of Buenos Aires for US$890 million (see Table 1).
Table 1 | Issuance of provincial public debt in foreign
currency (Bonds; 2016-2018)

After the strong process of external indebtedness of the provinces, the previous administration saw access to voluntary foreign debt markets completely restricted, and unilaterally deferred the payment of national public debt services. The demanding maturity profile of provincial bonds in foreign currency became even more challenging in the context of the macroeconomic crisis that Argentina had been experiencing since the second quarter of 2018, considering the growing effort to address liabilities in foreign currencies in the face of the significant increase in the real exchange rate and the lower tax revenues associated with an economy in recession (see Chart 2).
Graph 2 | Profile of maturities of provincial public debt in foreign currency as of December 31, 2019

The skyrocketing growth of interest payments as a proportion of total expenditure damaged the fiscal position of the districts. Expenditure on property income (basically interest) of the consolidated provincial public administration went from representing 1.5% of total expenditure in 2015 to 4.7% in 2019. In this context, as in 2020, several provincial jurisdictions undertook a process of restructuring their debt securities issued under foreign legislation and denominated in foreign currencies. In addition to the complex situation arising from the recklessness of the financing policy, the harmful and unforeseen effects of the COVID-19 pandemic were added.
Between the end of 2020 and the beginning of November 2021, a total of 11 of the 12 provinces managed to restructure their maturities of international securities involving an aggregate amount of US$12,300 million, highlighting the relevance of the agreements reached by the Province of Buenos Aires (US$7,150 million, 58% of the provincial total restructured so far). Córdoba (US$1,685 million, with 14%), Neuquén (US$694 million), Chubut (US$623 million), Mendoza (US$530 million) and Entre Ríos (US$500 million). Meanwhile, Tierra del Fuego is still in a negotiation process.
The debt swap of the Province of Buenos Aires, the most significant due to its magnitude, implied financial relief of around US$4,600 million for the jurisdiction until 2027. Likewise, the debt repayment term was tripled while a reduction in the cost of debt inbonds 40 was achieved.
The savings in debt services derived from the processes of renegotiation of external liabilities are very significant, involving almost US$2,400 million in 2021 and US$1,500 million in 2022, contributing to improving the current account result of the balance of payments and reducing the demand for foreign currency (see Table 2).
Table 2 | Restructuring of provincial international securities

The restructuring of provincial securities was thus added to the exchange of the national public debt and the processes of refinancing the debts of private sector companies – financial liabilities abroad and/or local debt securities denominated in foreign currency. In this way, the profile of the external commitments of the different agents of the Argentine economy was adapted to the real aggregate capacities to honor them, contributing to laying solid foundations that allow a process of sustainable economic development.
Section 5 / Seasonal prices and their influence on the volatility of monthly inflation
The goods and services that make up the basket of the Consumer Price Index (CPI) of Argentina, are classified by INDEC into three categories: Core, Regulated and Seasonal43. The category with the highest weighting is the Core (approximate weight of 67.9% in the CPI basket at the national level in December 2016), followed by Regulated (20.8%) and finally Seasonal (11.3%). The latter is the most volatile, since it includes goods and services whose prices are affected by transitory and/or seasonal factors that significantly modify their supply and/or demand. Thus, despite being the ones with the lowest participation in the CPI basket, seasonal prices contribute greatly to increasing the variability of monthly inflation rates. Therefore, it is relevant to analyze the typical behavior of the items that make up this category, and thus facilitate the analysis of the trend of inflation in the short term.
A recent example of the effect of the volatility of the Seasonal category on the general price level was verified in July 2021, a month in which its sharp increase explained that, despite the significant slowdown in the Core and Regulated categories, inflation only fell by 0.2 percentage points (from 3.2% in June to 3.0% in July). During the third quarter of 2021, the impact of seasonal volatility became more evident, contributing to the monthly variation of the general price level falling from 3% in July to 2.5% in August and then rebounding to 3.5% in September, despite the fact that core inflation remained relatively stable. In that period, the increase in seasonal prices went from 4.9% in July to only 0.6% in August and then registered a very significant increase to 6.4% in September. In October, another strong increase in the Seasonal category (8.1%) explained why the general price level maintained its rate of expansion compared to September (3.5%), despite the significant slowdown in the Regulated category.
Graph 1 | Recent developments in monthly inflation by category
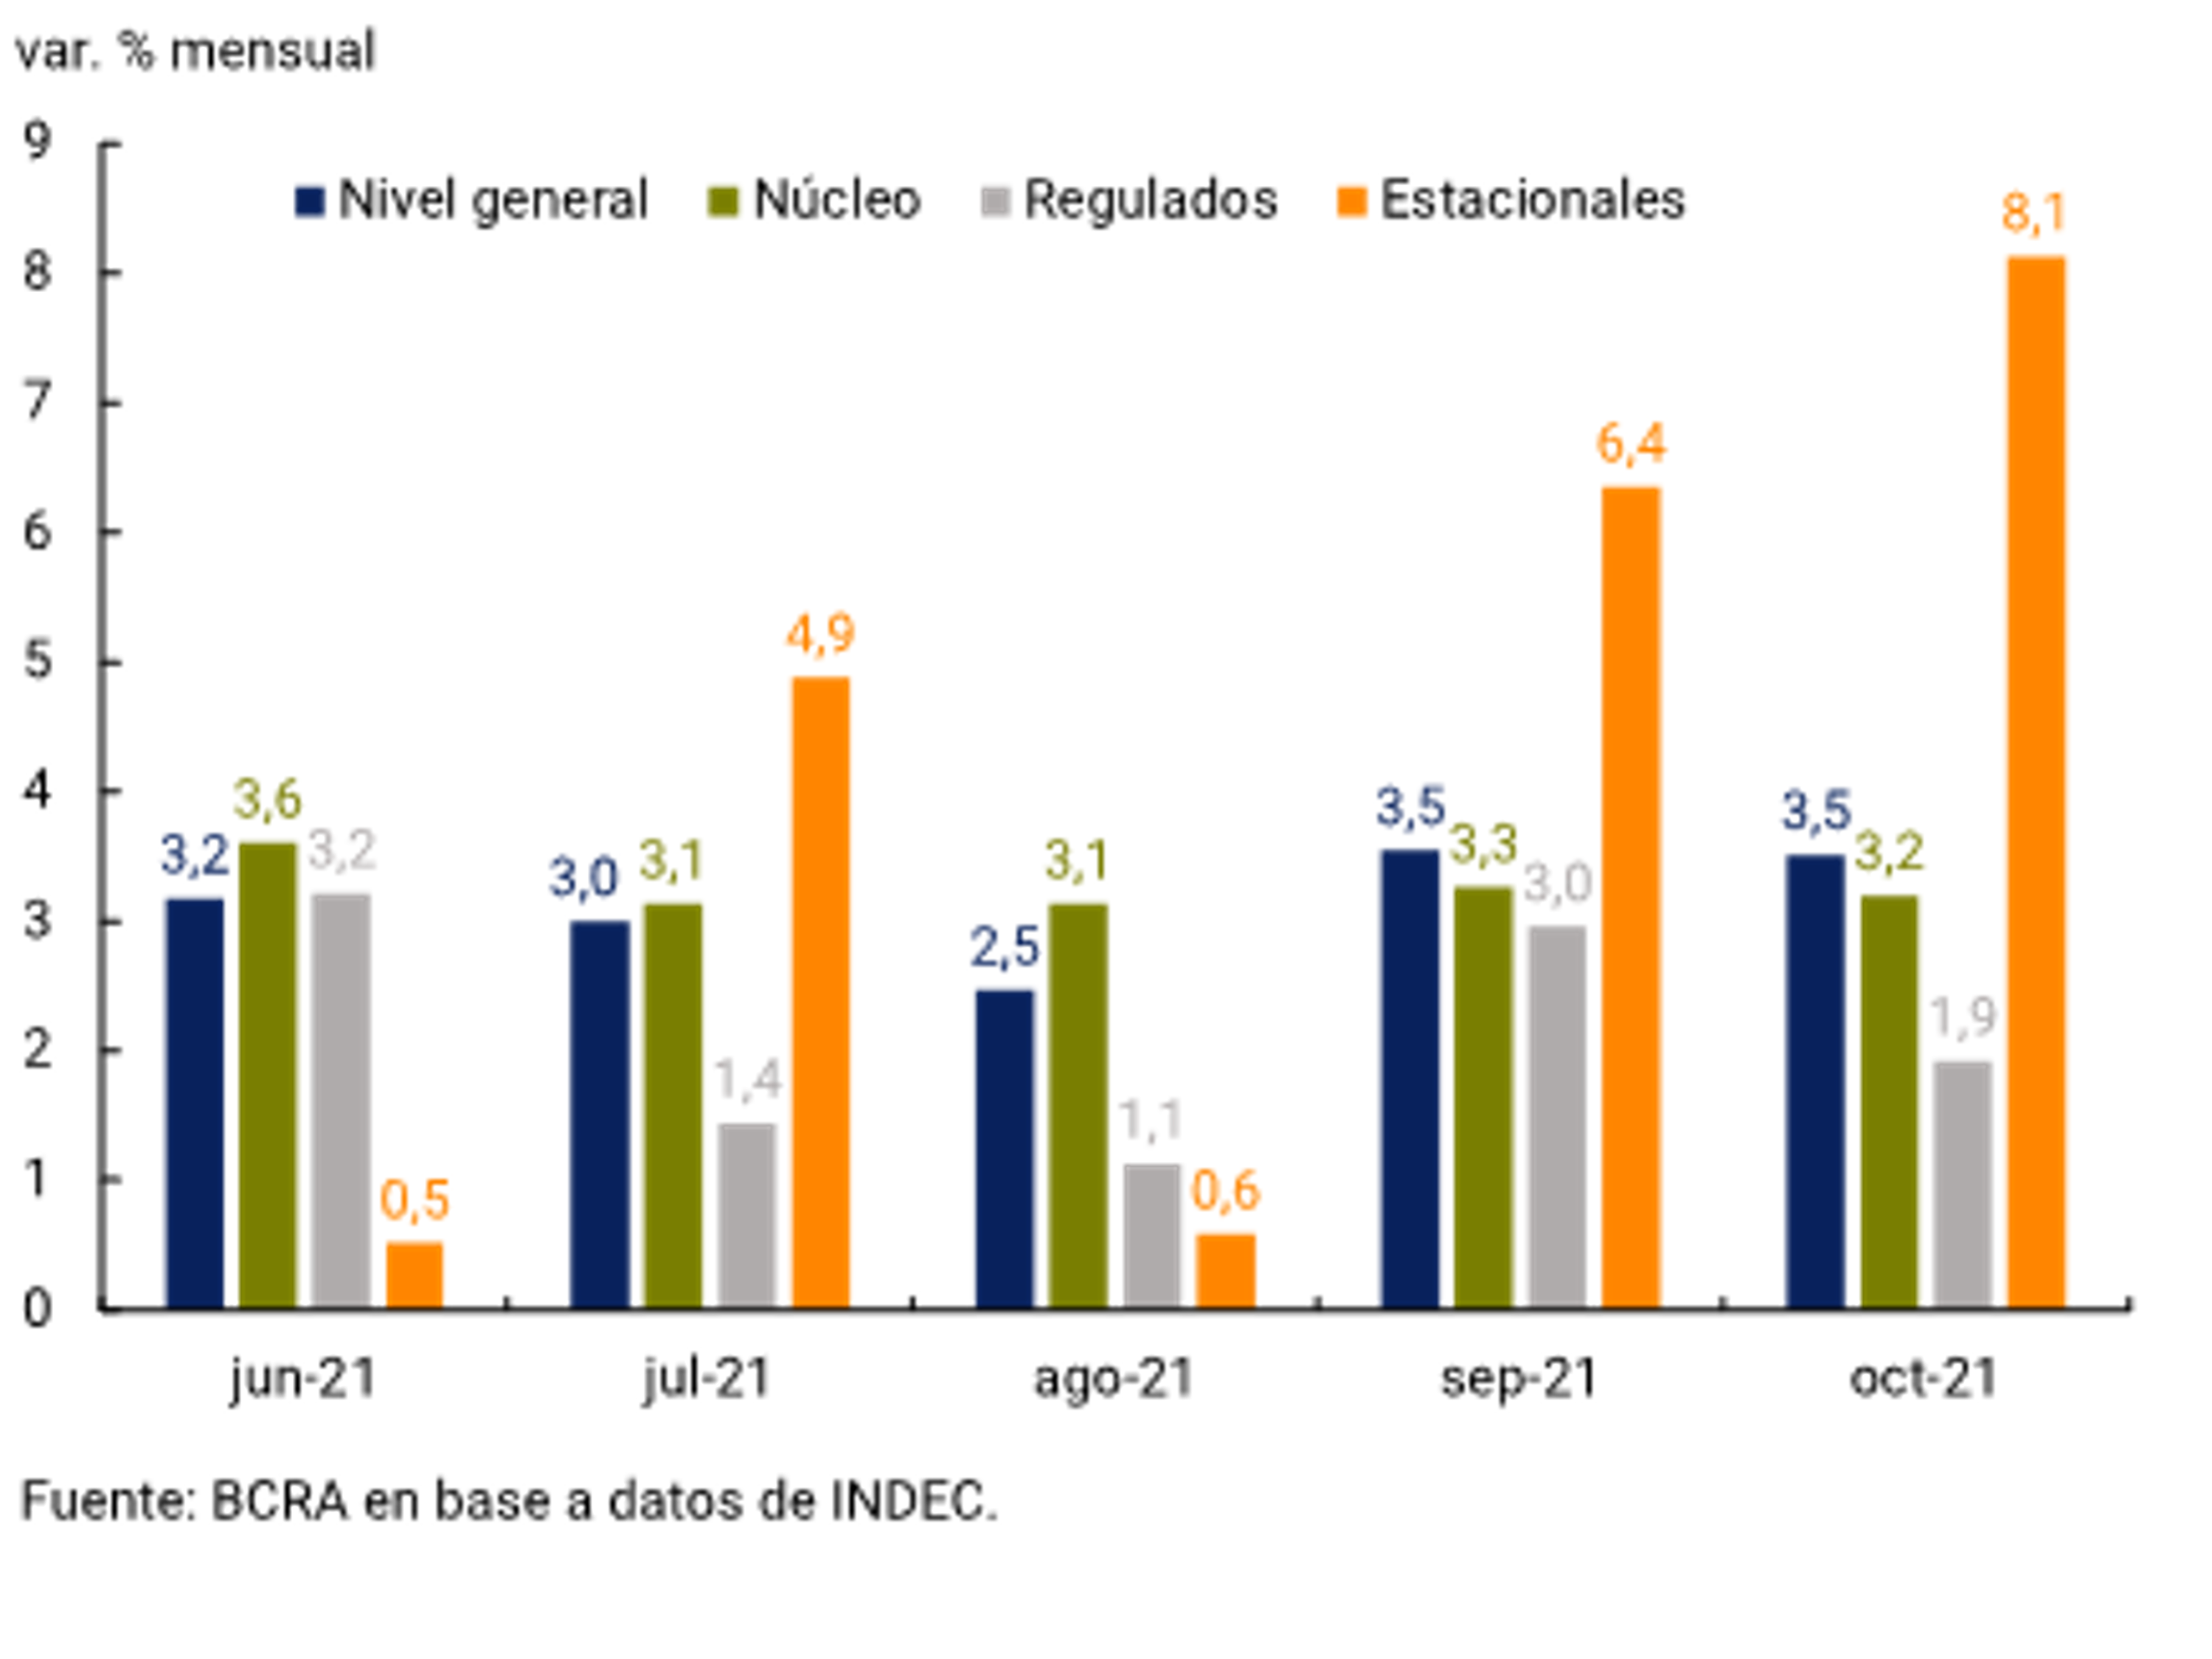
The goods and services considered seasonal are: fruits, vegetables, outerwear and tourist services – such as excursions, accommodation and tourist transport (land and air). The category is constructed by weighting each of these goods and services by their weights in the consumption basket according to the National Household Expenditure Survey (ENGHo) 2004/2005 updated by the evolution of their relative prices up to the base period of the CPI. The evolution of these prices usually exhibits a pattern throughout the year that allows us to anticipate, to a certain extent, which will be the months in which their variations can be expected to be higher or more limited.
Graph 2 | Evolution of the components of the Seasonal category
With regard to fruits and vegetables, it is climatic factors that tend to affect their supply, abruptly altering their prices, although there is also a certain seasonality in demand, especially in the case of fruits. The irregularity of these factors does not allow us to identify a stable seasonal pattern in the evolution of vegetable prices, with the exception of the falls that have occurred in all Decembers since 2017, although with a wide range of variation. Regarding fruits, it could be said that from September to February they usually exhibit the highest increases, while between March and August they usually present very limited or even negative variations.
Outerwear prices register stronger increases during the months in which the so-called “change of season” occurs (Mar-Apr/Sep-Oct) in response to the increase in demand that is usually generated in those periods of the year. Finally, the prices of tourist services also fluctuate along with demand, therefore, they tend to rise at a higher rate in the “high season” months both in winter and summer, and then rise in a limited way or even present negative variations in the rest of the months, such as in February. March and/or August.
The evolution of the Seasonal category throughout each year is therefore the result of the monthly variations of its components, which occur both due to seasonal factors and also due to possible changes in relative prices associated with more structural issues of supply and/or demand. The combination of the volatilities of the various prices that make up the category results in more stable variations at the aggregate level, although with a less evident seasonal pattern, on which some regularities can still be distinguished.
First, it is observed that the year 2020 presented a very different seasonality from the rest of the periods analyzed, especially in clothing and tourism, which may be a consequence of both changes in consumption patterns and also of transitory alterations in the modalities of price surveys, within the framework of mobility restrictions during the first months of the COVID-19 pandemic. A second regularity that stands out is that the ratio between the monthly variations of the Seasonal and Core categories is, on average (excluding 2020), less than one during the first semesters and greater than one unit in the second. It is observed that in the months of September, October and November the Seasonal category usually presents significantly higher increases than those of the Core category while in February, May, August and especially in December they tend to increase at a much lower rate
Graph 3 | Ratio between the monthly variations of Seasonal and Core

The year 2021 has so far presented a seasonality pattern similar to the 2017-2019 average, differentiating itself from 2020. As explained above, the volatility of the Seasonal category contributed greatly to the recent monthly inflation showing significant fluctuations. For the rest of the year, according to the typical pattern, seasonal ones should rise at a higher rate than in the Core category in November and significantly lower in December. Next year should begin with an acceleration of seasonal prices in January, which would increase at a similar rate to that of the Core category, and then there would be a significantly lower increase in February.
Section 6 / The Mutual Fund Industry and Its Share of the Money Market
Mutual Funds (FCIs) are a collective investment vehicle. They are made up of contributions from groups of investors with similar objectives in terms of profitability and risk. The sum of these contributions makes up an undivided patrimony, which is professionally managed. One of the advantages of managing large portfolios is that economies of scale are achieved in asset operations, by reducing transaction costs. As for the regulatory framework, the activity of the FCIs is governed by Law 24,083, sanctioned in 1992. It establishes that the regulation and supervision of FCIs is the responsibility of the National Securities Commission (CNV).
There are different types of investors, with heterogeneous needs and characteristics. On the one hand, small and medium-sized savers are highly risk-averse and tend to be poorly informed. It should be noted that this type of investor can acquire securities, which have high minimum investment amounts, accessing, through quotas, a market that they could not access individually. On the other hand, there are institutional investors, such as insurance companies and ANSES56 and other qualified investors. They have a degree of technical sophistication or equity resources that allow them to make an adequate assessment of the risks involved and have a greater appetite for risk.
Thus, according to the investment objective or the demand profile of investors, FCIs can be classified into different types:
• Money Market (MM): they invest mainly in deposits in banks authorized by the BCRA, so they have less volatility. This type of fund is attractive for people who want to have liquidity in the short term (or even immediately) and plays an important role in managing the liquidity of companies.
• Fixed Income: its asset portfolio is mainly made up of public or private debt securities. These types of funds are designed so that they can be adjusted to different investment horizons. Due to their characteristics, price fluctuations are greater than those of Money Market Funds, but in return they are expected to have a higher return in the medium and long term.
• Mixed Income: these funds combine fixed income and variable income instruments. The latter correspond mainly to shares of companies listed on the stock exchange. Due to the nature of the instruments in which it invests, they have a higher associated risk, although they are expected to generate higher returns in the long term than alternative financial investments.
The development of financial markets, the greater financial education of savers and the possibilities offered by the simplification of digital operations have had an impact in recent years, favoring the growth of the FCI industry. In fact, the equity of the FCIs in pesos presented an average monthly balance of approximately $2,858 billion in October, more than doubling the value at constant prices that it presented in December 2019. In terms of GDP, equity in pesos stood at 5.7% of GDP, reaching a maximum in historical terms.
This dynamic was mainly explained by the behavior of the MM FCIs, which have been showing great dynamism since mid-2018. Thus, in October of this year they reached a ratio to GDP of 3.1%, compared to an average level between 2004 and 2018 of 0.6% of GDP (see Graphs 1 and 2).
Graph 1 | Equity of the FCIs in Pesos as a percentage of GDP and average monthly balance at constant
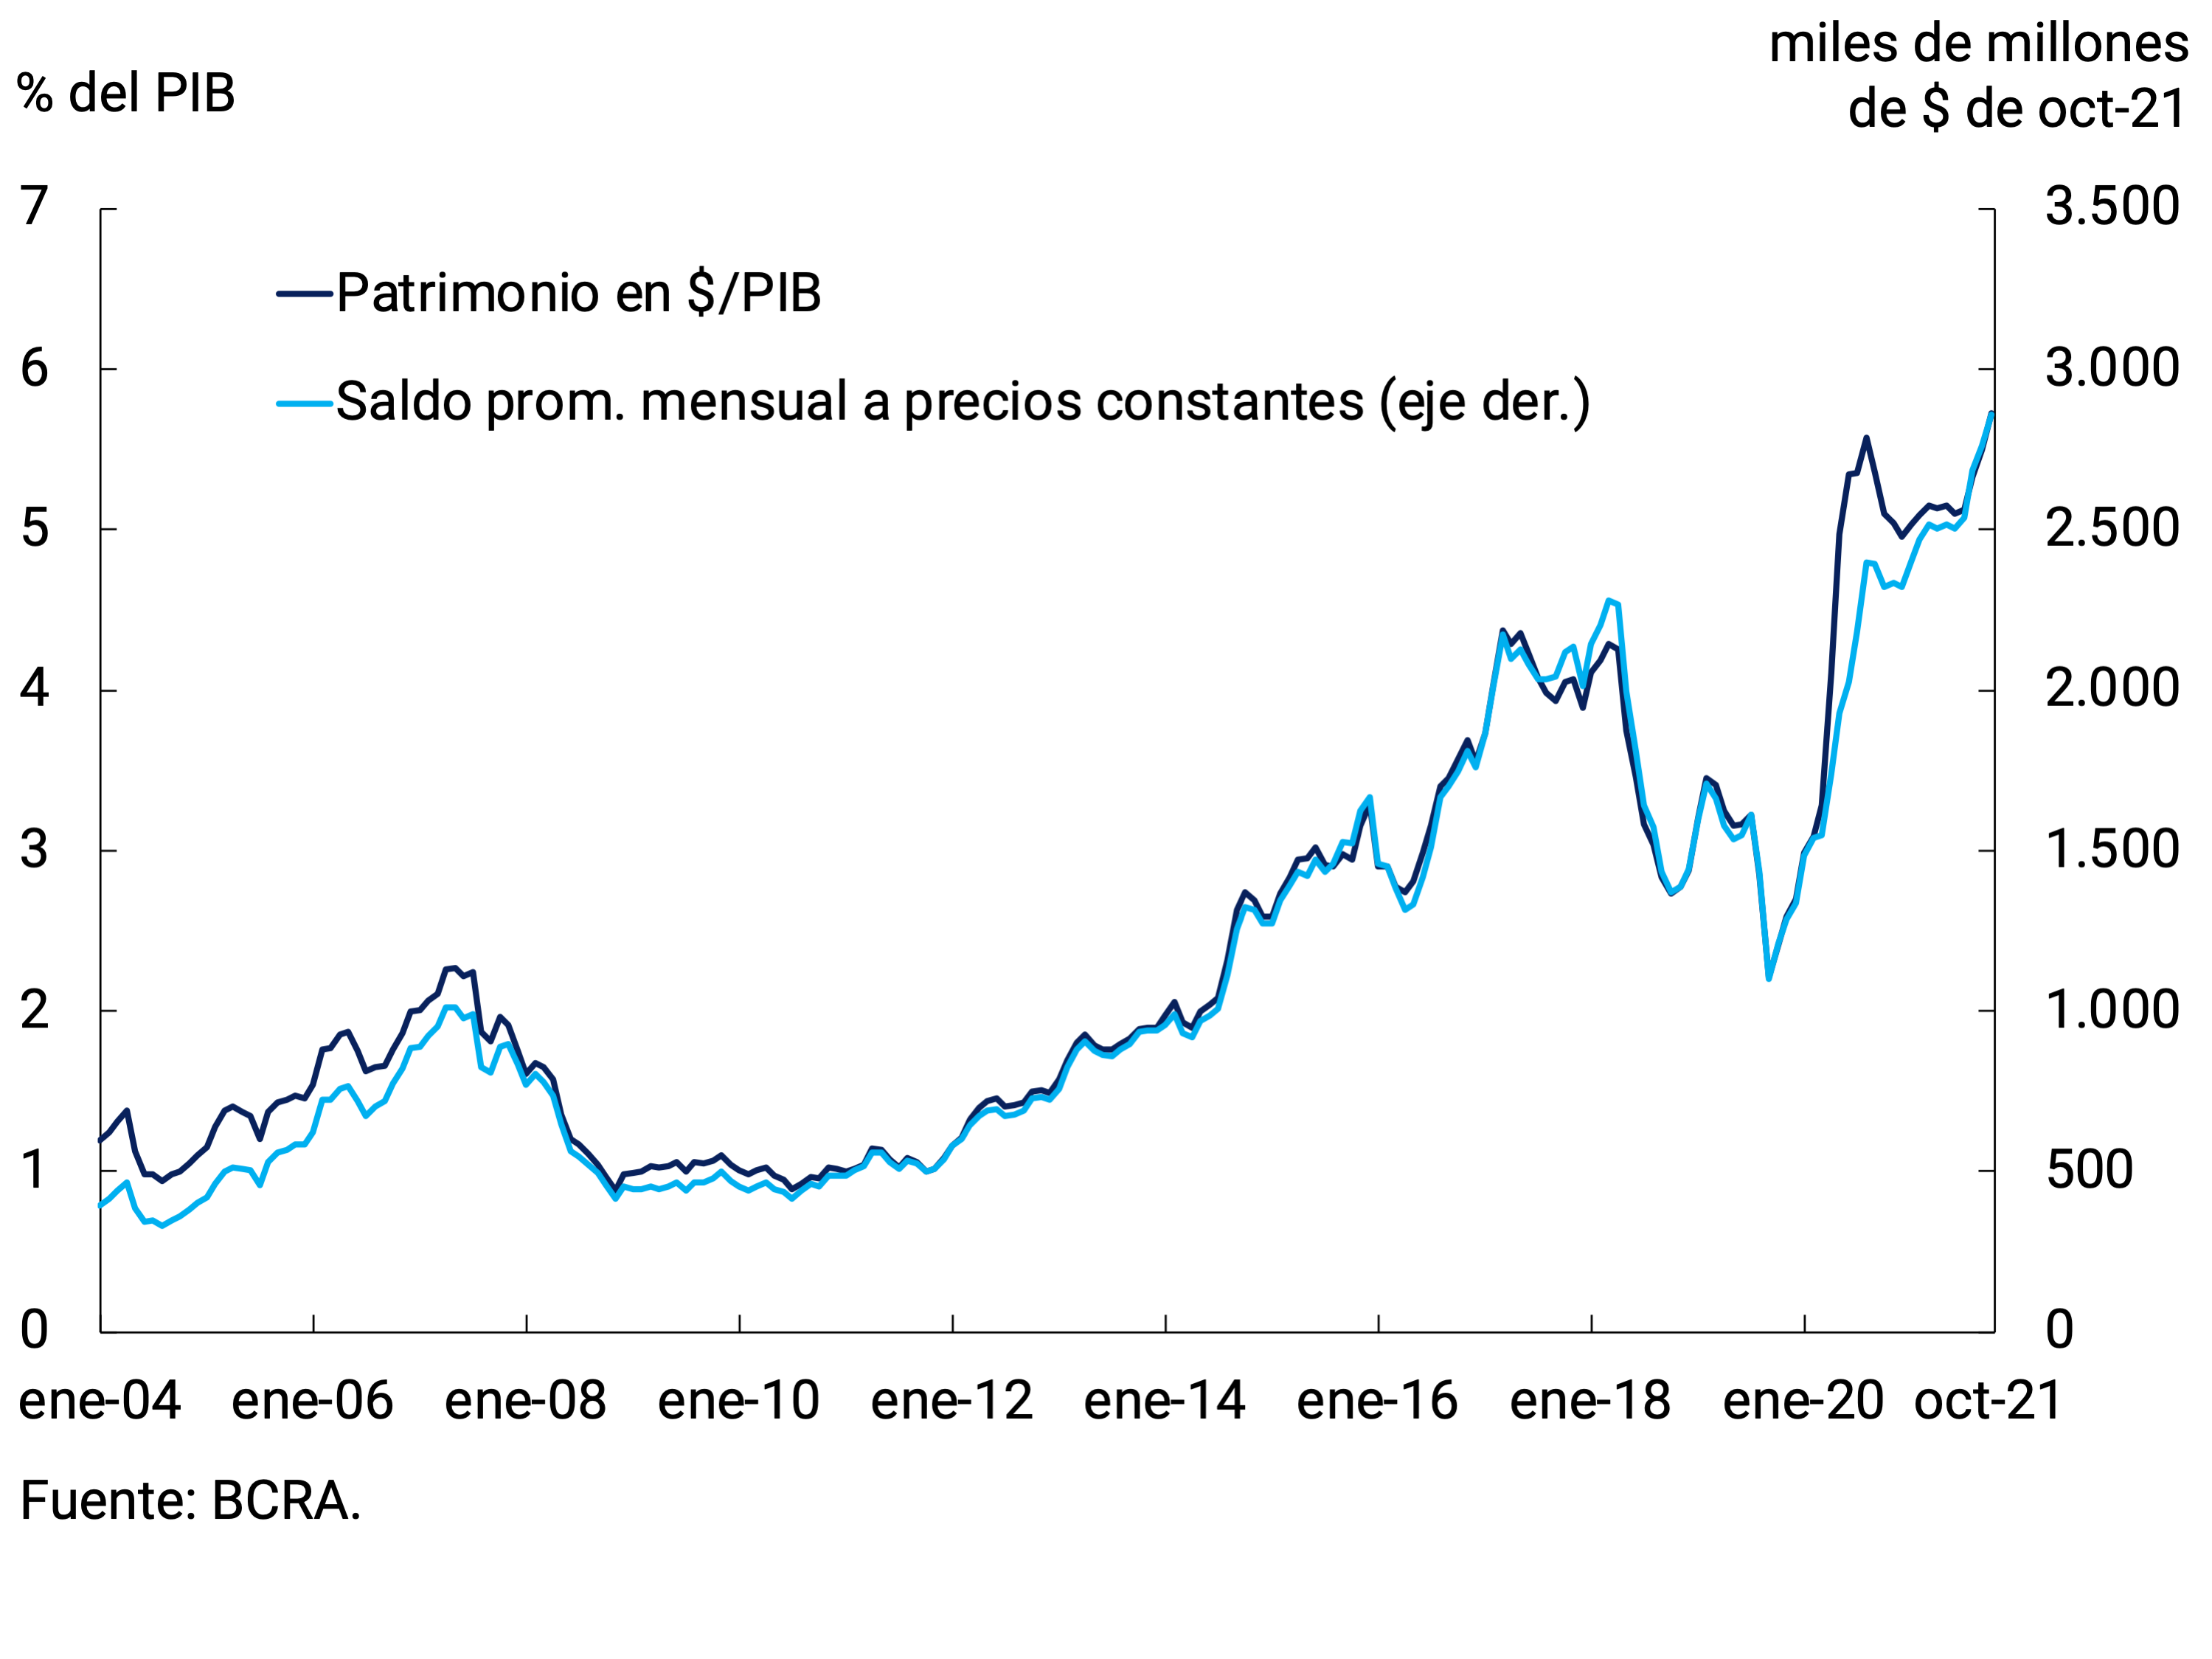
Graph 2 | Assets of CRFs as a percentage of GDP of the main types of funds

The dynamism that the FCI MMs have been exhibiting in recent years was also reflected in the increase in the relative share of their placements in the total deposits in pesos of the non-financial private sector. Indeed, certificates of deposits held by FCI MM went from representing less than 5% at the beginning of 2018 to about a fifth of total private sector bank deposits, making it an important player in the money market (see Chart 3).
Graph 3 | FCI deposits in pesos in relation to private sector deposits in pesos
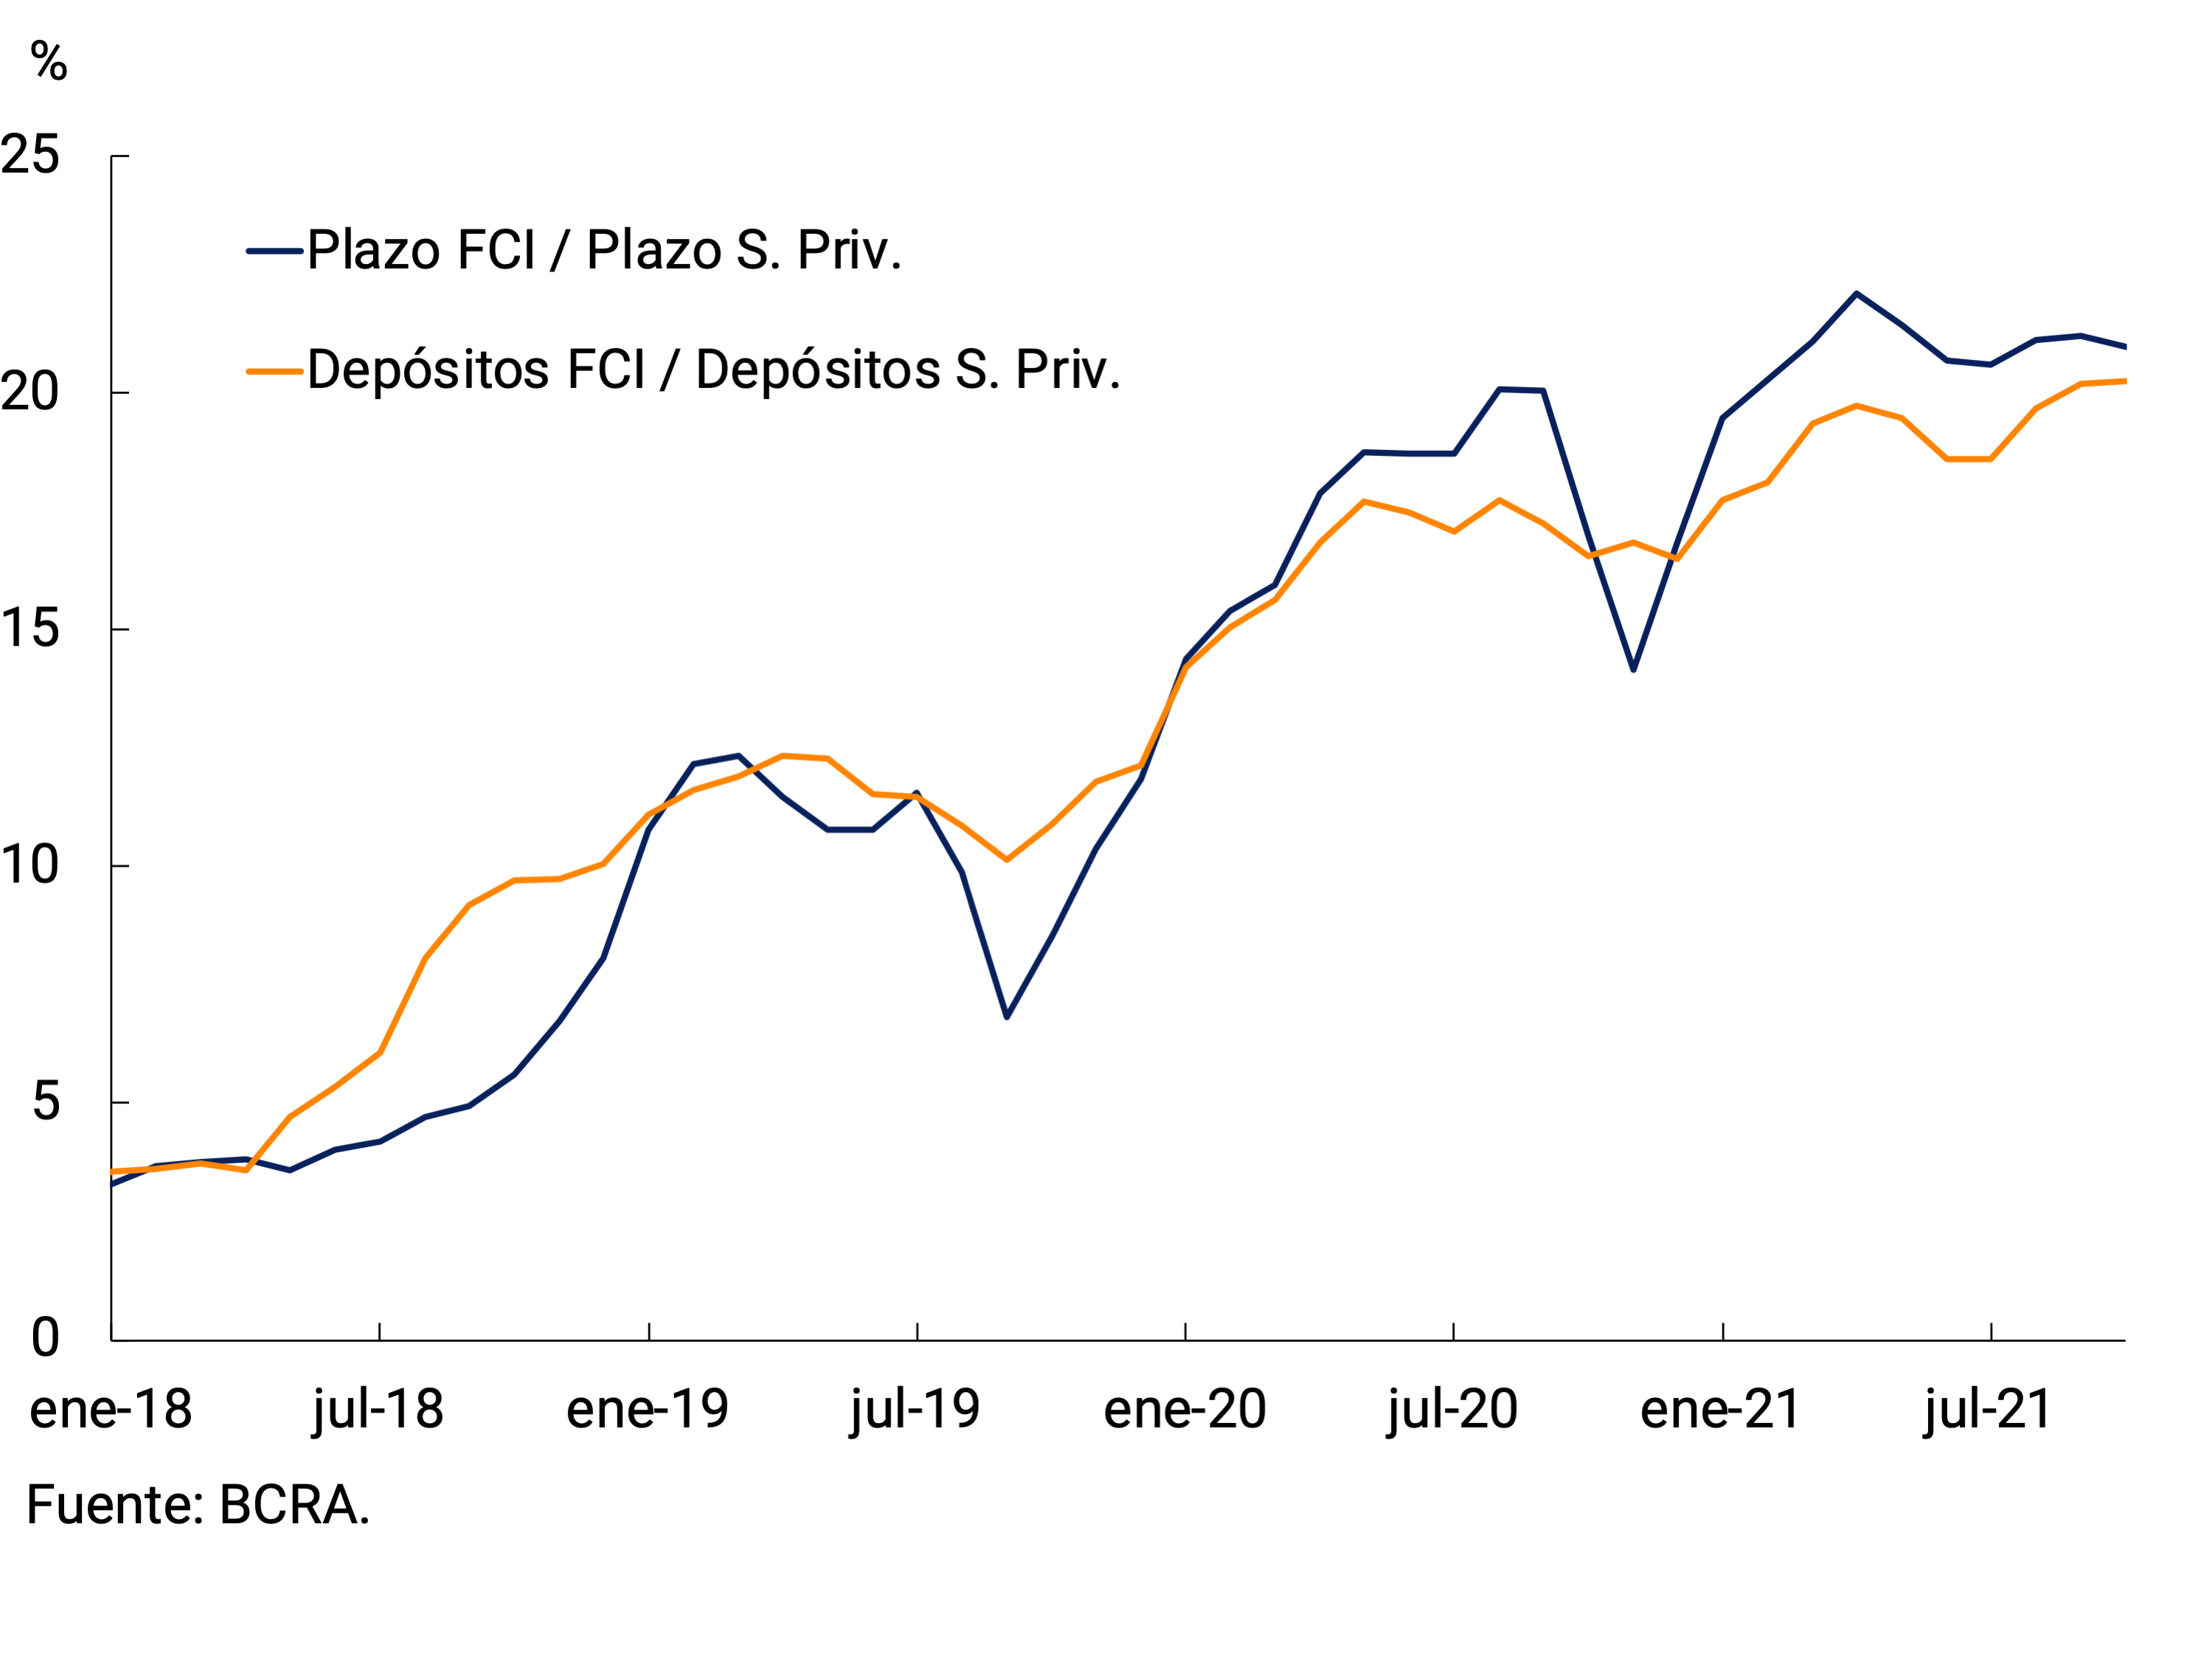
In the fixed income segment, the equity of the FCIs stood at 1.8% of Output. These values are relatively high, only surpassed by those recorded between the second half of 2016 and the first half of 2018, a period of strong foreign capital inflows and high demand for Central Bank Bills (LEBACs).
It should be noted that in mid-October a new financing instrument was created, the National Treasury Liquidity Bills (LELITES), aimed exclusively at FCIs authorized by the CNV. These bills are non-negotiable and non-transferable short-term instruments. However, they include an option for early pre-cancellation of up to 40% of the balance of nominal values57. This new instrument expands the variety of assets in which fixed-income FCIs can invest.
Breaking down assets in pesos by type of fund, FCI MM concentrate practically half of the total. In order of importance, it is followed by fixed-income FCIs, with 34% of assets; while mixed-income FCIs represent 7% of the total. The rest corresponds mainly to FCIs that were created to finance projects directly and favor key sectors for development. Such is the case of the “Open Mutual Funds for the Financing of Infrastructure and the Real Economy” and the “Open Investment Mutual Funds for SMEs”58 (see Figures 4 and 5).
Figure 4 | Equity of the FCIs in Pesos by type of fund. Data as of 29/10/2021
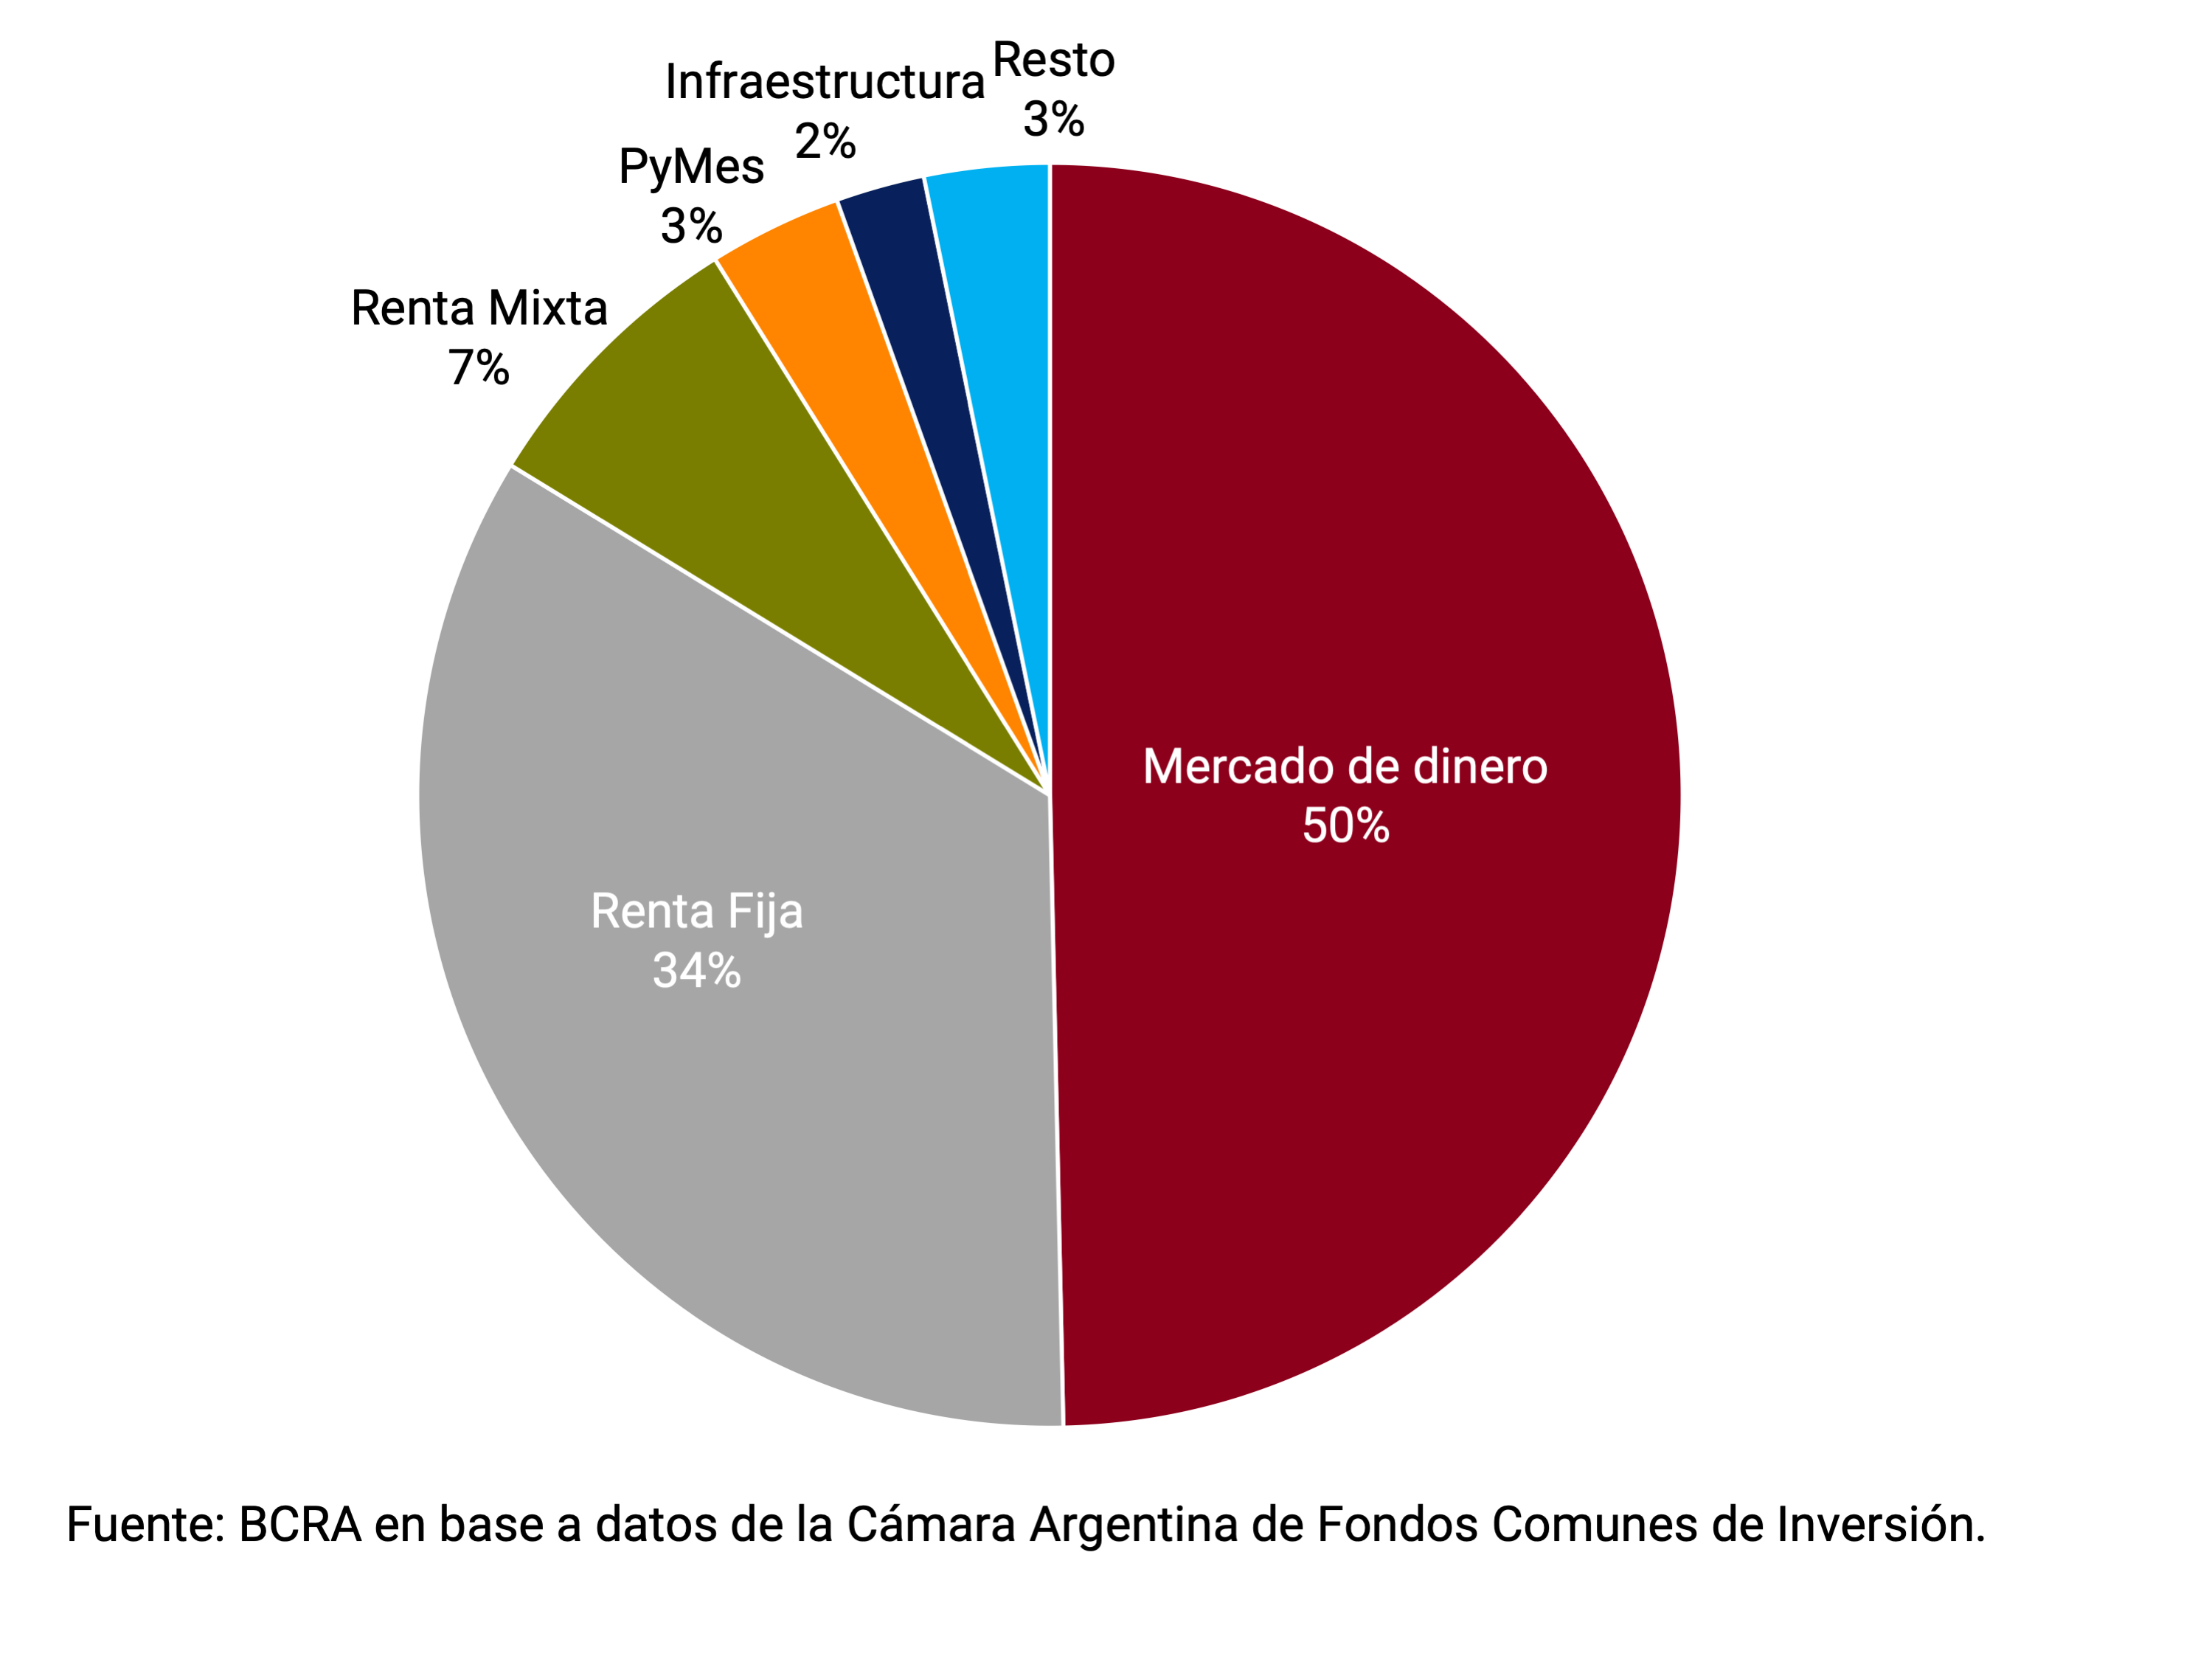
Graph 5 | FCI Portfolio Composition by Fund Type. Data as of 29/10/2021

With regard to infrastructure FCIs, it is worth noting that the CNV introduced some regulatory modifications as of August, assigning a greater scope to this type of funds59. The main reformulation is the expansion of the menu of eligible assets. In this way, infrastructure FCIs can invest in projects and sectors in which they have not participated until now, such as the provision of public services, real estate development, construction, transport or logistics. Likewise, limits (expressed in percentages of portfolios) were defined for investments that do not fit within the eligible assets. It is worth noting that the portfolio of infrastructure FCIs is basically made up of fixed-income assets.
In the same vein, the BCRA authorized financial institutions to acquire shares of Open Investment Mutual Funds subject to the “Special Regime for the Constitution of Open Investment Mutual Funds for the Financing of Infrastructure and the Real Economy”. The participation in each of these funds may be up to 15% of the total issue and up to 2% of the Computable Patrimonial Liability (RPC)60.
In short, the size of the FCI industry has grown significantly in recent years, reaching maximum values in relation to the economy. In terms of portfolio composition, the funds were mainly oriented towards short-term investments, reflecting a high preference for liquidity. The growth of the FCI industry is closely related to the level of development of financial and capital markets. In this sense, it is expected that the industry will continue to show great dynamism from the emergence of new financial instruments, whose diversity and quantity contribute to the structuring of portfolios with a greater variety in terms of their composition, capable of meeting the different demands in terms of risk, degrees of liquidity and time horizon.
Section 7 / Financial de-dollarization. Reflections based on the Argentine experience
The way in which the private sector allocates its savings is a central determinant of financial intermediation in domestic currency, as well as for the financial stability and economic development of the country. In this sense, Argentine history shows an almost uninterrupted process of formation of foreign assets, constituting a limitation for financial intermediation.
The literature has developed general frameworks that rationalize this process of financial dollarization as an internal phenomenon, arising from equilibrium in the credit market, in which creditors and debtors optimize the currency composition of their contracts (see Armas et al. (2006), various chapters). In the process of selecting the optimal currency composition, there are three basic motivations: i. The maximization of the return corrected for volatility (in the presence of risk aversion); ii. The minimization of the cost of credit, which favors the currency that minimizes the probability of default (in the case of multiple creditors and imperfect information) and iii. The maximization of the value of the redemption option or a deposit guarantee, which promotes moral hazard-driven balances in which the preferred currency is the one that maximizes the insurer’s expected costs.
In particular, with respect to the first motivation, the literature uses a portfolio approach to explain financial dollarization based on the CAPM model, where risk-averse agents choose the currency composition that optimizes the risk-return profile of their portfolio, measured in units of the local consumption basket. Based on this approach, an extensive literature has been developed that explores the empirical support of the minimum variance portfolio (MVP) argument as one of the underlying arguments behind financial dollarization61. In equilibrium, dollarization is explained by the second moments (i.e., volatility) of inflation and the depreciation of the real exchange rate, rather than the first moment (i.e., expected inflation and nominal depreciation).
Under specific conditions, the mean-variance analysis applied to the portfolio dollarization problem yields corollaries that can guide policy recommendations aimed at promoting financial de-dollarization. For a given variance of inflation, an increase in the change in the depreciation rate could reduce dollarization by increasing the risk of dollar assets. Thus, it is suggested that inflation-targeting regimes, combined with a free-floating exchange rate scheme, should contribute to the reduction of financial dollarization, by increasing exchange rate volatility relative to price volatility – for an exhaustive discussion of this point see Armas et. al (2006)—.
In this section, we will focus exclusively on the dollarization of savings assets. Specifically, we analyze the history of high macroeconomic and financial volatility that our economy has experienced for more than half a century, and in light of this history, we explore the existence of additional elements to those proposed by the “mean and variance” approaches, which determine the demand for stores of value of households and firms. This could be useful to rethink, in certain contexts, some of the recommendations to promote financial de-dollarization processes postulated by the literature based on portfolio approaches.
Analysis of exchange rate correction episodes
As a starting point, Graph 1 shows the monthly evolution of the 1-month real return of the fixed term in pesos and of an external asset62 for the last 80 years (between January 1939 and December 2020).
The first element that stands out from Graph 1 is the high volatility of the series. Second, volatility presents clusters, associated with the frequent episodes of exchange rate correction evidenced during the period. We refer to “exchange rate corrections” because some of the episodes correspond to exchange rate jumps that implied modifications in the monetary-exchange regime, but that are not necessarily evidence of a critical event that put an end to a particular regime.
Graph 1 | Evolution of monthly real returns
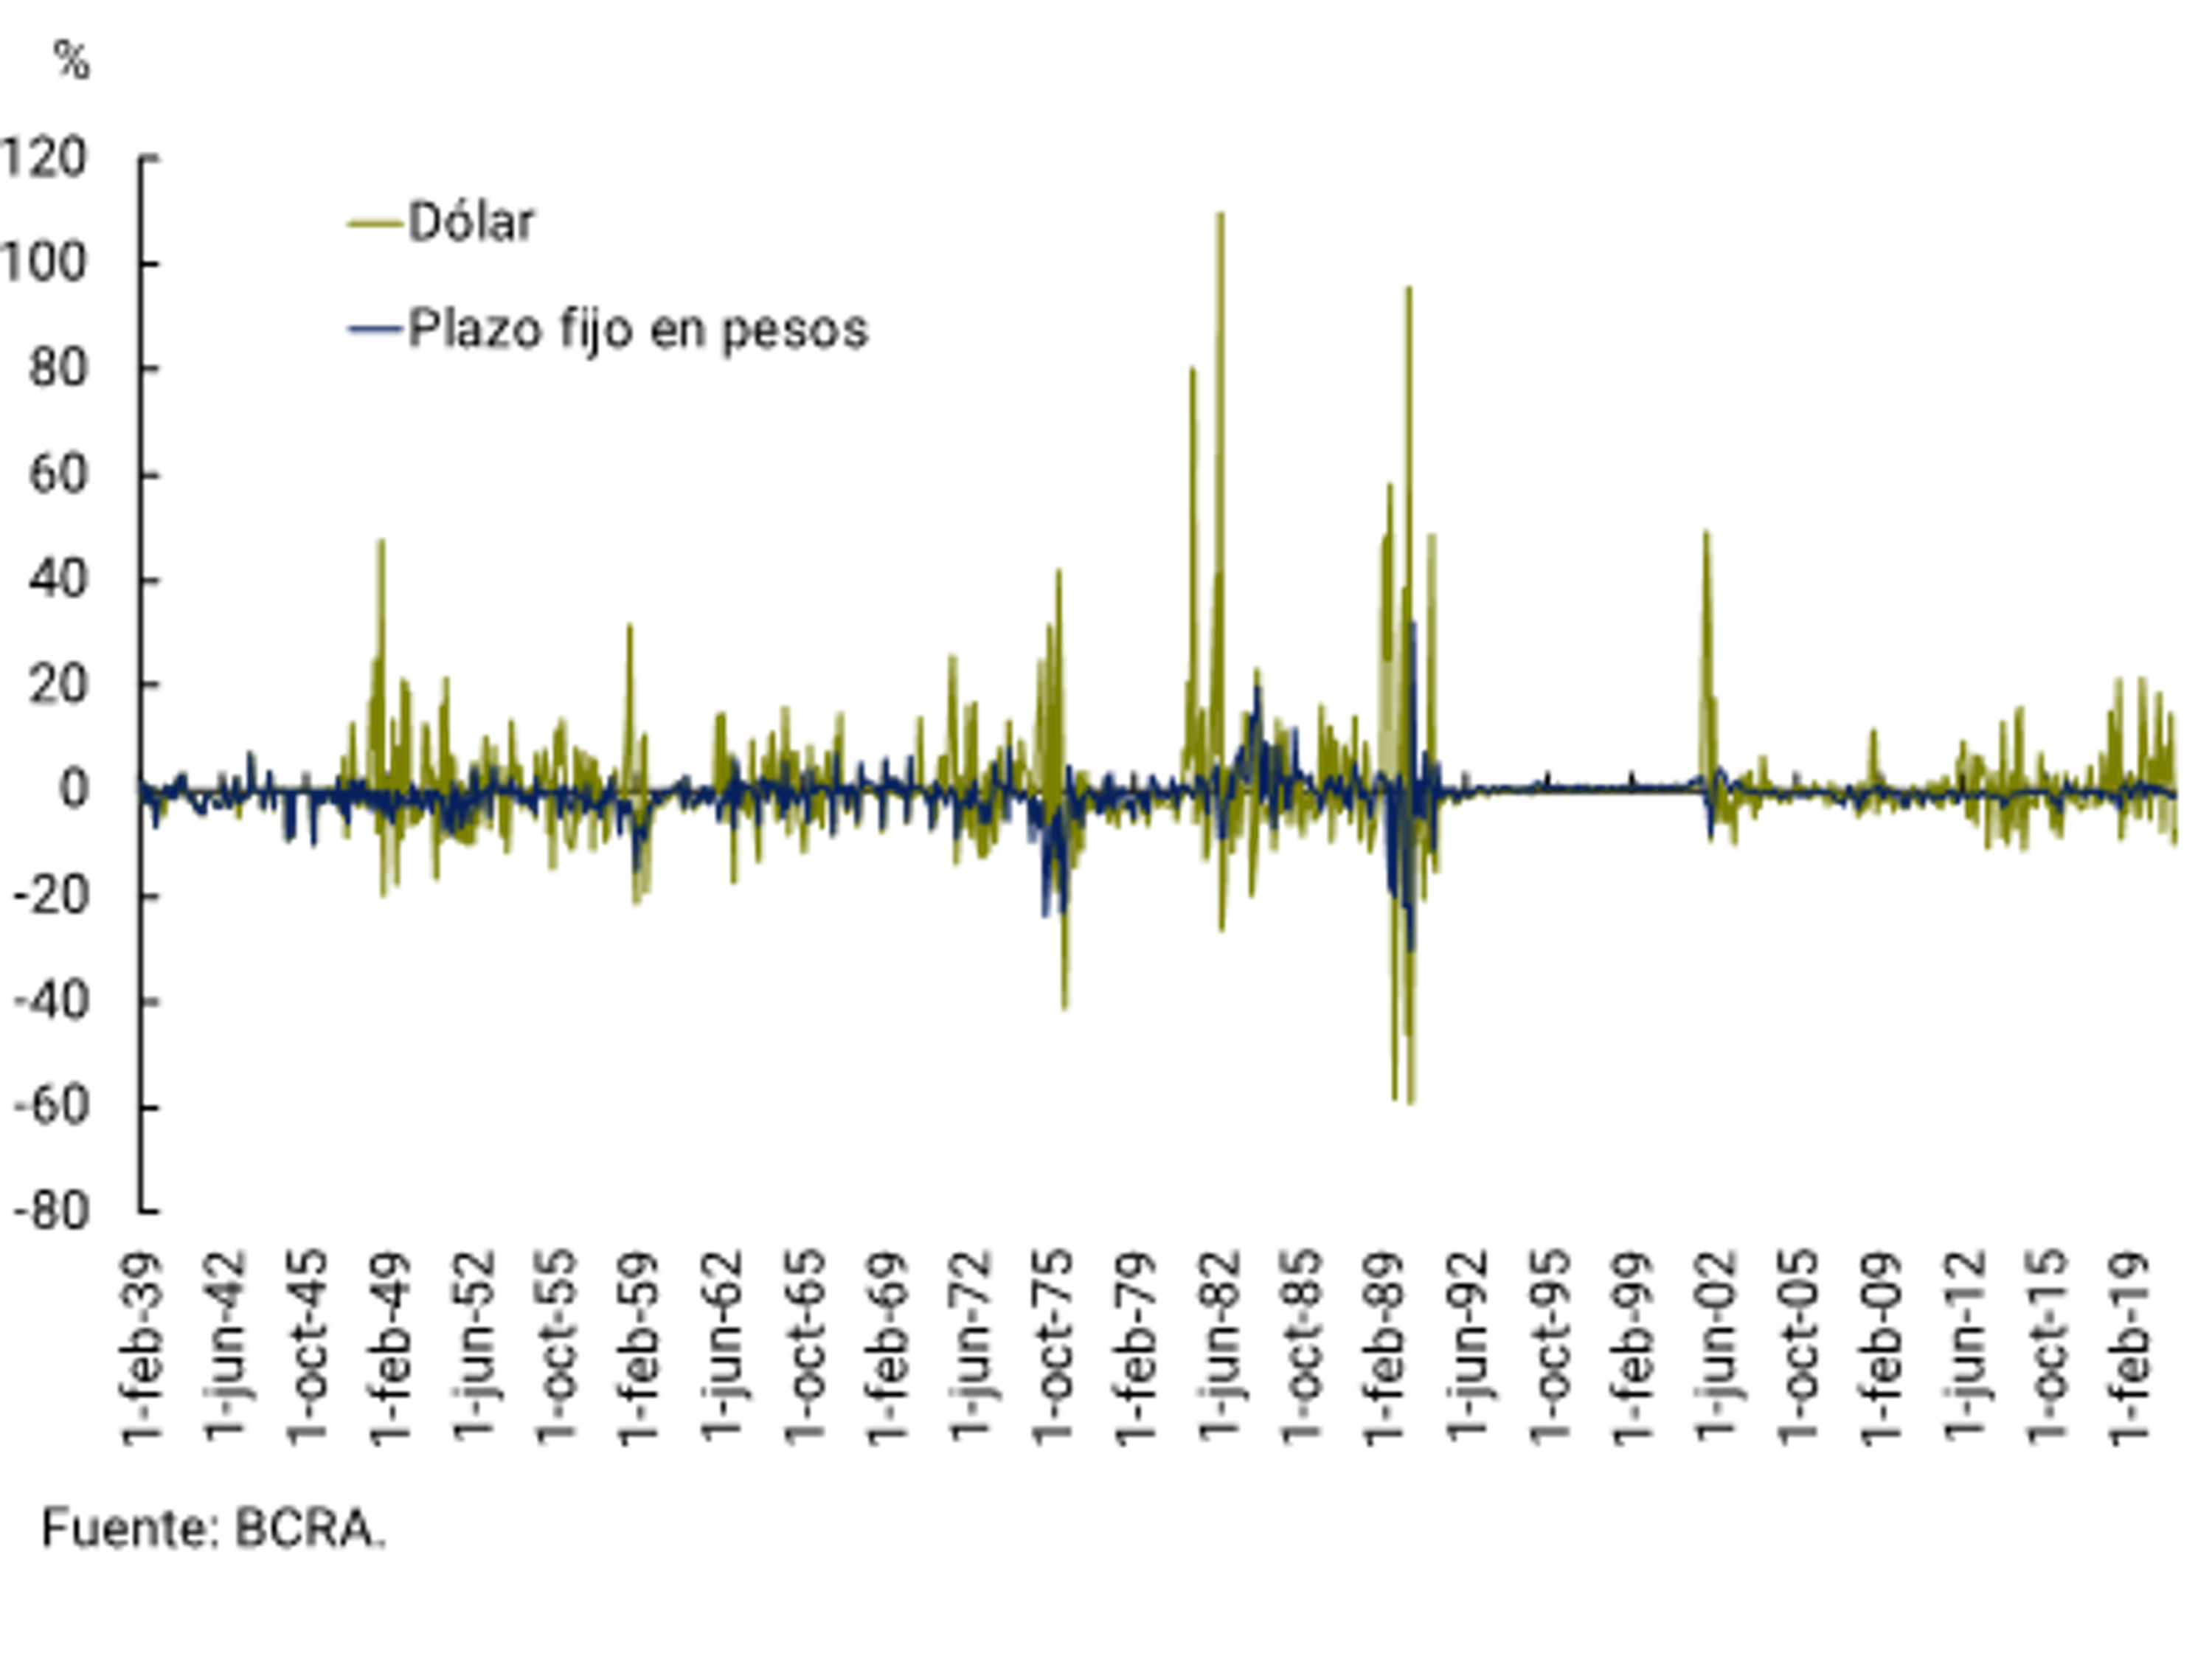
With respect to the structure of clusters, it is important to mention that, during the period of analysis, there were at least 15 episodes of exchange rate correction of magnitude63. Of these episodes, we will concentrate on seven specific cases, which share two fundamental characteristics among themselves. The first, and for which they were selected, is the fact that the evolution of real returns prior to the exchange rate disruption event justified the demand for assets denominated in local currency as part of the private sector’s optimal holdings of stores of value. The second characteristic is that such regimes were followed by exchange rate corrections.
The first experience considered is the crisis of 1949. The second, the devaluation carried out by the administration of President Frondizi in December 1958. The third is the exchange rate jump associated with the high uncertainty during Frondizi’s dismissal. The fourth is the crisis of the “exchange rate” in April 1981. The fifth, the exchange rate uncertainty once the effects of the Austral Plan implemented in June 1985 had weakened. The sixth is the Convertibility crisis in December 2001 and the seventh, the episodes of exchange rate jumps that followed April 2018.
In order to identify common patterns, Table 1 presents the first four central moments of the distribution of real monthly returns of fixed-term loans in pesos and of the holding of dollar-denominated assets (same series as Graph 1), separating the stages before and after the exchange rate correction episode.
Table 1 | Central moments of the distribution of real returns to 1 month of the fixed term in pesos and the dollar
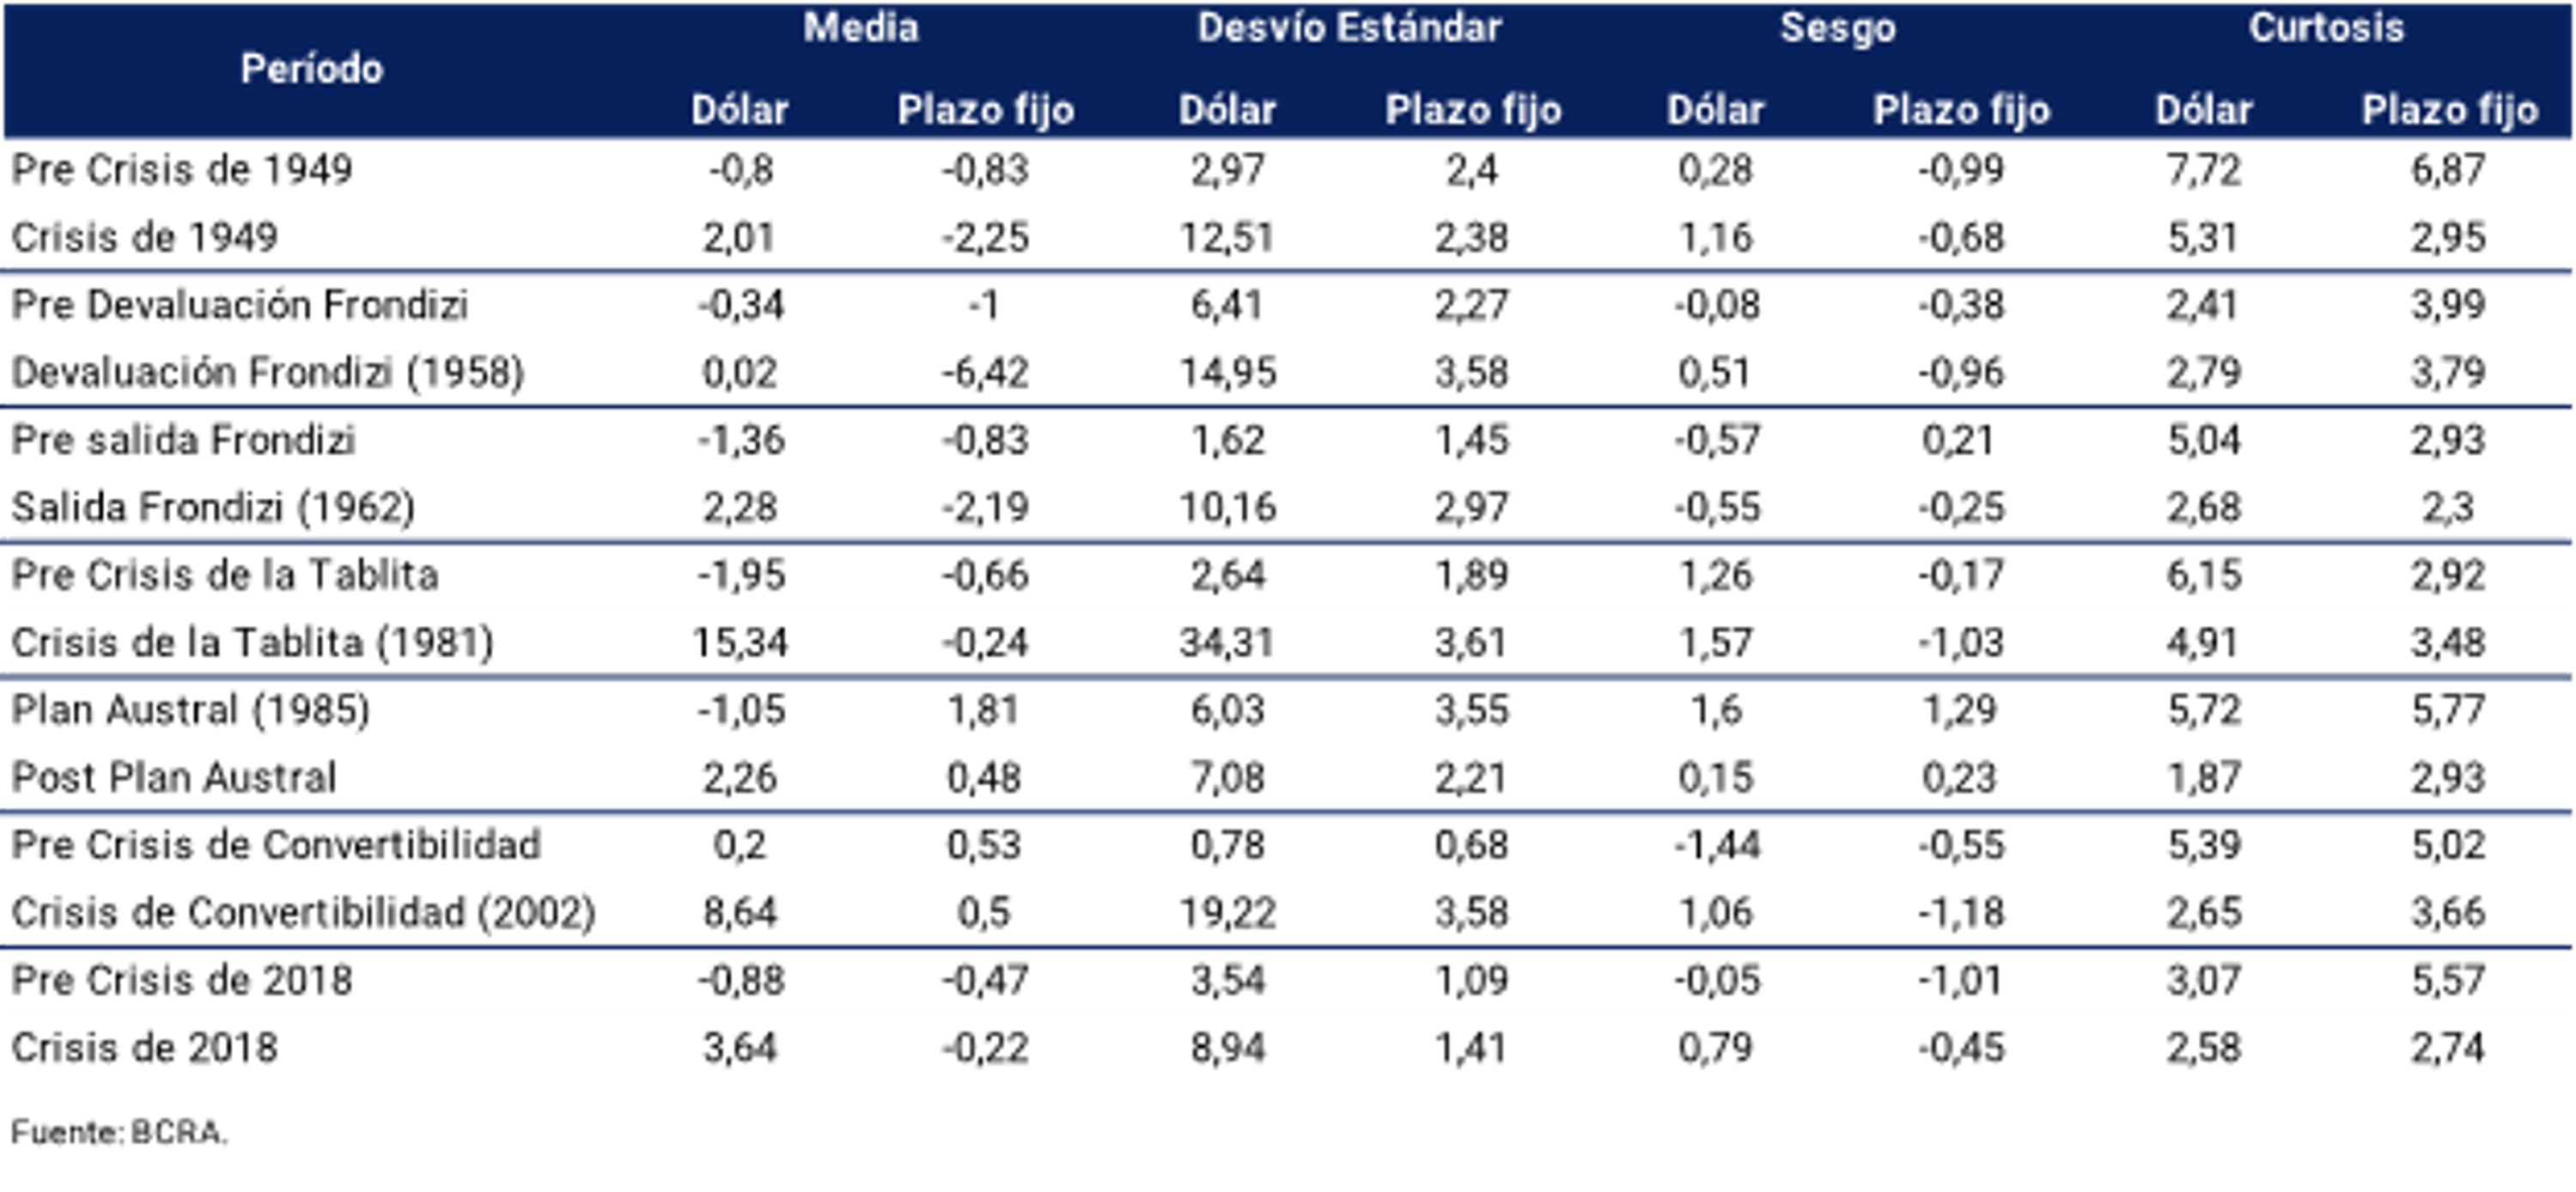
As can be seen, the average real return in dollars was always positive in the stages corresponding to the exchange rate episode, with significant differences in level in relation to the period prior to the exchange rate correction, as well as with respect to the real return of the fixed term in pesos. In turn, the performance of the foreign currency was also more volatile during the exchange rate episodes compared to previous periods and the return of the fixed term. The distributions in the exchange rate correction environment show a positive bias. Finally, kurtosis alternates values greater and less than 3, the reference value of the Normal distribution, so that a clear pattern in the weight of the tails (i.e., the frequency of observations at the ends) is not distinguished.
Discussion from the evidence
The high frequency of exchange rate corrections associated with changes in the operation of specific regimes could condition the process of forming expectations of families and firms when deciding in which instrument to preserve the purchasing power of their wealth. This has potentially varied consequences.
First, the main features of real return distributions under normal conditions and changing monetary and exchange rate regimes can be institutionalized. In this case, past experiences would condition expectations when thinking about the future dynamics of the variables of interest. This may imply that, even in periods of relative normality in the operation of a specific regime, agents assign a non-zero probability to a scenario of abandonment of the same, within their investment horizon, and decide, in response, to keep a substantial portion of their stores of value dollarized. This element may be one of the factors behind the high persistence of the financial dollarization process.
Second, the memory of past experiences can lead agents to face problems of “signal extraction” (difficulties in extracting relevant information from the context) when making inferences about the distributions that, they hope, govern the behavior of the economic variables relevant to their decision to choose the currency of denomination of their stores of value.
The last point makes us reflect on the potential results, under certain contexts, of some of the policy measures postulated in the literature to promote de-dollarization processes, and which result from the use of mean-variance approaches. One of them is to reduce the volatility of inflation and increase the volatility of the exchange rate of change. Although under particular environments this recommendation could have the desired effects, in the presence of subjective distributions that show bias, as well as signal extraction problems, agents could react in the opposite direction to that predicted by these approaches. For example, an increase in exchange rate variability by the monetary authority could be perceived by agents as a change in environmental conditions that increases their subjective probability of regime change. As a consequence, there could be results contrary to those expected, which tended to promote rebalancing in the portfolio of agents in favor of holdings of assets in dollars. From this perspective, the perception of sustainability of the monetary-exchange regime by families and firms constitutes a central element for the potential success of policies that seek to promote de-dollarization processes.
Based on our history, the value that agents assign to this subjective probability exceeds the exchange rate regime that is circumstantially adopted. The response of individuals in terms of their demands for assets to changes in their environment has been delineated over many decades of macroeconomic and financial instability. Stabilizing perceptions of regime change entails dismantling institutionalized adaptive responses throughout our history. That is why the reduction of financial dollarization is a long-term challenge not only for this Central Bank, in relation to the adoption of specific monetary-exchange regimes, but also for the development strategy adopted by the National State.
Bibliography
Alain Ize and Eduardo Levy Yeyati (2003). “Financial dollarization.” Journal of International Economics, 59(2) p.323-347.
Armas, Adrian, Ize, Alain, and Eduardo Levy Yeyati (2006). “Financial dollarization: The policy agenda.” Central Reserve Bank of Peru. Barajas, A. and R. A. Morales (2003). “Dollarization of Liabilities: Beyond the Usual Suspects”. IMF Working Paper 03/11 (Washington, D.C.: International Monetary Fund).
De Nicoló, G., P. Honohan, and A. Ize (2003). “Dollarization of Bank Deposits: Good or Bad?”. IMF Working Paper No. 03/146. Published as “Dollarization of Bank Deposits: Causes and Consequences.” Journal of Banking and Finance, vol. 29, no. 7, pp. 1697-727.
Goldstein, M. and P. Turner (2004). “Measuring Currency Mismatch: Beyond Original Sin”, in Controlling Currency Mismatches in Emerging Economies, Institute for International Economics.
Martínez, L. and A. Werner (2001). “The Exchange Rate Regime and the Currency Composition of Corporate Debt: The Mexican Experience”. Presented at the NBER Inter-American Seminar on Economics (July).
Ivana Rajkovic and Branko Urosevic, (2014). “Dollarization of deposits in short and long run: evidence from CESE countries,” Working papers 28, National Bank of Serbia.
References
1 The Purchasing Manager Index is constructed through surveys of purchasing managers and executives of companies in the manufacturing and service sectors. The questions asked are related to, for example, production, new orders, employment, stocks, delivery times, among others, and must be answered in relation to the situation with respect to the previous month (in terms of whether they increased, decreased or remained the same). For each variable, the index is the sum of the percentage of responses that indicated “increases” and half of the percentage of responses “no change.” The indices range from 0 to 100, with a level above 50 indicating growth compared to the previous month, and below 50 indicating contraction. Source: IHS Markit.
2 The OECD Weekly Tracker of Economic Activity provides a high-frequency, real-time indicator of GDP growth using Google Trends data (searches related to consumption, labour markets, home purchases, retail sales, industrial activity and economic uncertainty) for 46 OECD and G20 countries. The indicator represents the percentage change in weekly GDP levels from the growth trend estimated before the pandemic (in the OECD Economic Outlook of November 2019).
3 The median REM for the month of August 2021 (before the release of the EMAE data for July), indicated a quarterly improvement in GDP of 1.3% s.e. in the third quarter and a recovery of only 0.6% quarterly s.e. in the fourth.
4 The purpose of this indicator is to anticipate the EMAE pivot points. On Sep-20, the ILA-BCRA met the 3 criteria (duration, diffusion and depth) that indicated the beginning of a recovery phase. The increase was disseminated among its components, exceeding the required threshold of 52.5% on average of the last 4 months and the variation accumulated by the ILA in 6 months (depth of the increase) far exceeded the minimum required of 2.3%. From Dec-20 onwards, the ILA showed oscillations, but it did not meet all the necessary criteria to indicate a turning point in economic activity. For more methodological details of the ILA, see Section 3 / Leading Index of Economic Activity of the BCRA, published in the IPOM of January 2017.
5 Gross fixed capital formation, is composed of Construction and Durable Production Equipment (which includes Machinery and Transportation Equipment and Equipment, domestic and imported).
6 It should be noted that the interference of a shock of magnitude such as the pandemic in II-20 strongly altered the analysis of the seasonally adjusted series, by making it difficult to correctly isolate the purely seasonal effects. Both INDEC and the BCRA incorporated international criteria in the deseasonalization process, which basically consist of the inclusion of outliers in the filtering models of the time series. In some cases, these atypical observations were not punctual and concentrated in a period of time, but persist, affecting seasonality factors even today. It is for this reason that seasonally adjusted variations are very volatile and unstable, so they must be interpreted with caution.
7 The seasonally adjusted data from the EMAE for August left a statistical carryover of 2.7 p.p. for the third quarter.
8 The Leading Indicator of Private Consumption is its own index, which includes traditional and non-traditional indicators of the consumption of goods and services, including quantities sold in supermarkets, credit card consumption (deflated by CPI), units sold of automobiles, imported volumes of consumer goods, VAT collection in real terms and the Consumer Confidence Index. The data from III-21 are partial. For more details, see Section 1 / Private consumption, a variable difficult to follow in real time, published in the IPOM of July 2017.
9 With partial data as of Aug-21, construction activity grew 0.9% quarter-on-quarter s.e. The national production of capital goods increased 6.1% quarter-on-quarter s.e., according to FIEL, while the quantities imported of capital goods and industrial transport equipment fell 2.8% quarter-on-quarter s.e.
10 Available in August.
11 The recomposition of the pre-pandemic levels of all the services included in “Basic services” and “Services with the highest risk of contagion” would mean an additional contribution of 3.9 percentage points to the seasonally adjusted GDP of II-21.
12 The passage of the unemployed to inactivity (fall in the EAP) could be indicative of an underestimation of open unemployment.
13 It should be noted that the growth of formal wage earners in EPH differs ostensibly in terms of the magnitude of the growth in registered employment when compared to the registration data published by MTEySS.
14 In coordination with the National Government, the BCRA provided new lines of assistance to benefit regional productive sectors affected by the pandemic, including gastronomy, hotels, cultural and leisure services. It also incorporated new lines of productive financing for small businesses in the agricultural sector and promoted a new round of loans to low-income single-payers at a zero rate. For its part, the National Government extended the REPRO II Program (Resol. 643/21 of the Ministry of Labor, Employment and Social Security) and the Emergency Assistance Program for Self-Employed Workers in critical sectors. Likewise, it launched the “Registered” Program, implemented the PAMI Pre-Travel Program to promote tourism (Provision 20/2021). In addition, it promoted the conversion of social programs such as “Empower Work” and “Labor Insertion” into private salaried registered employment (DECTO 711/21) and ordered the increase of the minimum, vital and mobile wage (Resol. 11/2021), Minimum Retirement, Universal Child Allowance (AUH) and Pregnancy Allowance (AUE). To favor the export capacity of strategic sectors, the National Government announced the presentation of the Law for the Promotion of Sustainable Mobility, which will include incentives to stimulate the use of vehicles powered by non-conventional sources. It also announced the Export Plan for Development aimed at strategic sectors such as Hydrocarbons, Electromobility, Mining, Agribusiness, Wines, Automotive, Biotechnology, Knowledge Economy, Forestry Industry, Fisheries and Agriculture, Pharmacy and Medical Cannabis, provided for the reduction of export duties on fishing and the elimination of them for SMEs, and from January 2022 for knowledge-based services.
15 The exposure risk group included health personnel, armed forces, security personnel, prison service personnel, teaching and non-teaching personnel, and other strategic populations. For its part, the risk group for severe disease included adults over 70 years of age, elderly residents of long-term care homes, adults between 60 and 69 years of age and adults between 18 and 59 years of age belonging to at-risk groups.
16 At the end of May 2021, the first batches of AstraZeneca vaccines were received, whose active ingredient is produced in Argentina and packaged in Mexico, while the first locally produced doses of the Sputnik V vaccine were received at the end of August 2021.
17 The World Health Organization timely recommended a positivity percentage of less than 10% as an indicator of testing capacity and control of virus transmission.
18 The Ministry of Health of the Nation reported that since the beginning of the pandemic, intensive care beds for adults have been increased by 47%, 12 modular hospitals have been built, professionals in the health area have been incorporated, and the national production of critical supplies has been strengthened, among other measures.
19 Since August 2021, the Ministry of Health has implemented the vaccine interchangeability strategy with identical or even more favorable results than homologous vaccination schedules.
20 Through DECNU 678/2021, the National Government enabled group trips by graduate students, retirees, nightclubs and mass events with capacity and vaccination and the total presence of the Public Administration. In addition, it enabled the progressive opening of borders from October 2021 through safe corridors and the entry of tourists from abroad since November 2021. For its part, the Autonomous City of Buenos Aires eliminated the capacity in shops, shopping malls, public transport, gastronomy and professional activities. By Resol. 389/2021 the Ministry of Transport established that urban and suburban and metropolitan and regional rail public transport services must guarantee the maximum frequency of their services, establishing the authorization of public transport for all agglomerations, departments or parties that are not in a situation of epidemiological and sanitary alarm.
21 This statistic has been available since February 2020, a month that is usually affected by the summer period, so the levels could be overestimated.
22 In the coming months, additional doses will continue to be applied to immunocompromised people and people over 50 years of age who have received the Sinopharm vaccine in order to improve the effectiveness of the vaccines. Recently, the Ministry of Health of the Nation announced the application of a booster dose against COVID-19 in health personnel and people over 70 years of age in order to prolong the immunity of the vaccinated population.
23 It should be noted that the import price index is a Paasche type index, which means that its measurement is sensitive to changes in the basket of imported goods. The moments of decoupling between this index and global manufacturing prices respond, among other reasons, to variations in the share of manufactured fuels in foreign purchases.
24 Following the same line, as of October 2021, new adjustments to foreign regulations and changes with an effect on import payments came into force.
25 See Section 4 / Recent performance of agricultural exports of the IPOM August 2021.
26 Electric energy, fourth in the ranking of categories that increased its weight in Argentina’s export basket, is excluded from this analysis due to the lack of price and quantity series.
27 As reflected in the IMF’s estimates in its latest World Economic Outlook report (WEO Oct-21)
28 VAT-DGA, DGA Profits, Import Duties and Statistical Tax.
29 Law 27617 increased the non-taxable minimum and the special deduction for retirees and employees in a relationship of dependency, relieving the low and middle income brackets that were reached by the tax, while implementing a schedule for the refund of what was withheld until the time of entry into force of the rule. link
30 Law 27630 made modifications to the corporate income tax rates. Link
31 The net income of the impact on them of the extraordinary allocation of Special Drawing Rights (SDRs) that the IMF made in the context of the global crisis due to the COVID-19 pandemic and were incorporated into the Budget as resources for current transfers for a total of $427,400 million are compared.
32 In September, social security benefits increased by 48.6% YoY.
33 The third quarterly increase granted through Mobility Law 27609 for retirements, pensions and allowances was 12.39% in September 2021, accumulating 36.2% so far this year.
34 It should be noted that these reinforcements are in addition to the extension of the AUH, the AUE and the Family Allowances through various measures, including the elimination of the maximum limit of children per family; the reduction to 2 years of the requirement of legal residence in the country for foreign family groups; the reinstatement to the Universal Allowance of children and adolescents suspended for not having presented the school or health booklet, the elimination of the minimum income for the collection of family allowances; the determination to maintain the payment of allowances to those single-payers with delays in the payment of fees and the extension to 9 months of the collection of the Universal Pregnancy Allowance, among others.
35 Decree 735/2020.
36 Part of the increase in capital expenditures is due to a low comparison base due to the negative impact of COVID-19 and, at the same time, to a low level of execution associated with the start of management in 2020.
37 It is worth mentioning the regulatory modification of the BCRA (Communication “A” 7290) that allowed banks to choose to integrate the fraction of reserve requirements that, until May, was remunerated through LELIQ with instruments issued by the TN in pesos, whose residual term is greater than 180 days (excluding tied to the evolution of the dollar).
39 Decree 622/2021.
40 For more information, see the following link.
41 Resolution 1050/2021 – Secretariat of Domestic Trade
42 Resolution 2125/2021.
43 INDEC (2017) considers Regulated goods and services whose prices are subject to regulation or have a high tax component; Seasonal are those that present seasonal behavior and calls the rest of the CPI groups Core. “National Consumer Price Indices, Background and General Characteristics”, Directorate of Consumer Price Indices Buenos Aires, INDEC, May 18, 2017.
44 General Resolution 908/2021 of the CNV.
45See Communication “A” 7369.
46 On this occasion, calculated on the average of private sector deposits for the month of September.
47 See Communication “A” 7373
48 Latest available information on the Minimum Cash Regime, corresponding to the month of October 2021, containing the financing for September 2021.
49 Communication “A” 7340.
50 Communication “A” 7348.
51 Communication “A” 7374.
52 Communication “A” 7375.
53 Communication “A” 7385.
54 Communication “A” 7384.
55 Communication “A” 7395.
56 ANSES administers the Sustainability Guarantee Fund (FGS).
58 See General Resolution 803/19 of the National Securities Commission.
59 See General Resolution 897/21 of the National Securities Commission.
60 Communication “A” 7341.
61 See, for example, Barajas and Morales, (2003), De Nicoló, Honohan and Ize (2003), Ize and Levy Yeyati (2003) Martínez and Werner, (2001), Goldstein and Turner (2004), Rajkovic and Urosevic (2014).
62 Because the variation in the exchange rate constitutes the main component of the return on foreign assets, we will speak indistinctly of foreign assets or banknote dollars. For the sample periods in which exchange restrictions or formal schemes of multiple exchange rates were in force, the free quotation of the US currency is used.
63 In terms of our series, we refer to the variations in the free exchange rate associated with the exchange rate episodes of 1949, 1959, 1962, 1972, 1975, 1981, 1986, 1989, 1990, 2001, 2015, 2018 and 2019. In the period 2002-2020, minor corrections have been observed in 2008 and 2014. This implies an average of one event every approximately five and a half years. These exchange rate correction events implied jumps in the price of the U.S. currency, which may either be the consequence of the abandonment of a specific regime, such as the convertibility crisis, be part of a stabilization program, such as the devaluation of 1959 or the one associated with the Austral Plan of 1985. as well as that resulting from an environment of high economic and/or political uncertainty, such as the exchange rate episodes of 1962. In terms of our analysis, regardless of the reasons behind the jump in the price, it implies an incentive for agents to use the dollar as a store of value.
Share on


