Executive summary
• In 2024, there was an increase in both the joint holding of accounts in financial institutions (EEFF) and payment service providers (PSPs), as well as in the holding of accounts in foreign currency | 69% of the adult population has accounts in both types of providers, while the proportion of people with accounts in foreign currency grew from 44% to 51%, in a context of incentives for means of payment in foreign currency.
• People with activity on their accounts reached a significant number of account holders | In the fourth quarter of 2024, 28.8 million account holders registered movements, which is equivalent to 77.5% of the total number of account holders. Of these, 18 million operated in both a financial institution (FI) and a payment service provider (PSP), suggesting that users combine both alternatives and take advantage of interoperability between accounts.
• Electronic payments continued to advance to the detriment of the use of cash | In 2024, the adult population made an average of more than 28 electronic payments per month, 45% more than in the same period of 2023. The contrasting behaviors between cash withdrawals and electronic payments suggest that the latter are playing a relevant role in the decrease in the use of cash. This trend was evident in areas such as supermarkets, household appliances and e-commerce.
• Mutual Funds (DCFs) and foreign currency deposits were the most dynamic savings and investment products among individuals | Payment accounts with a balance in DCF grew from 13.8 million in December 2023 to 22.4 million in December 2024, and it is estimated that at the end of the year at least 53.7% of people with payment accounts had balances in DCF. On the other hand, balances in foreign currency in bank accounts, driven by the Asset Regularization Regime, also stood out, reaching a 31.2% share in the total balance of savings and investment products.
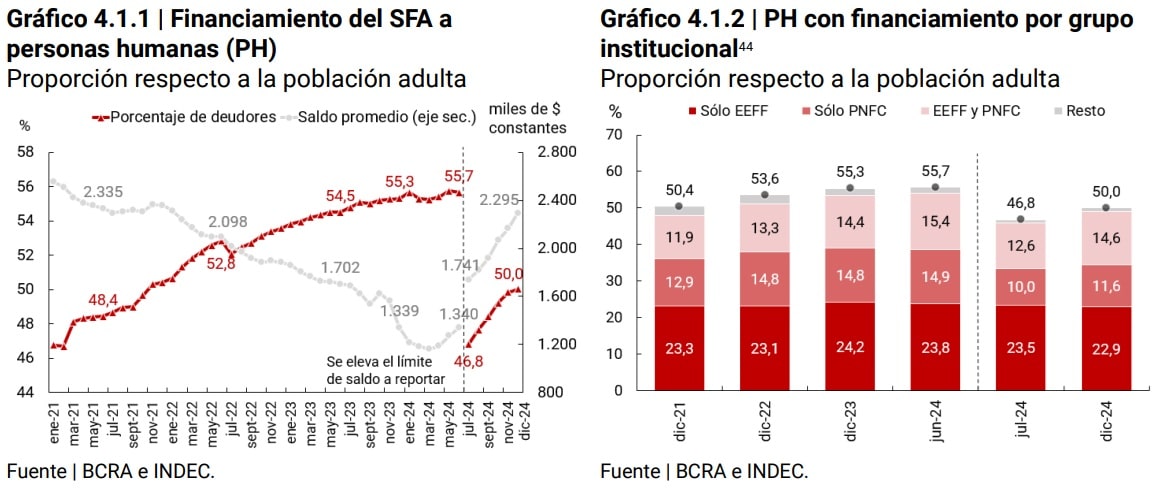
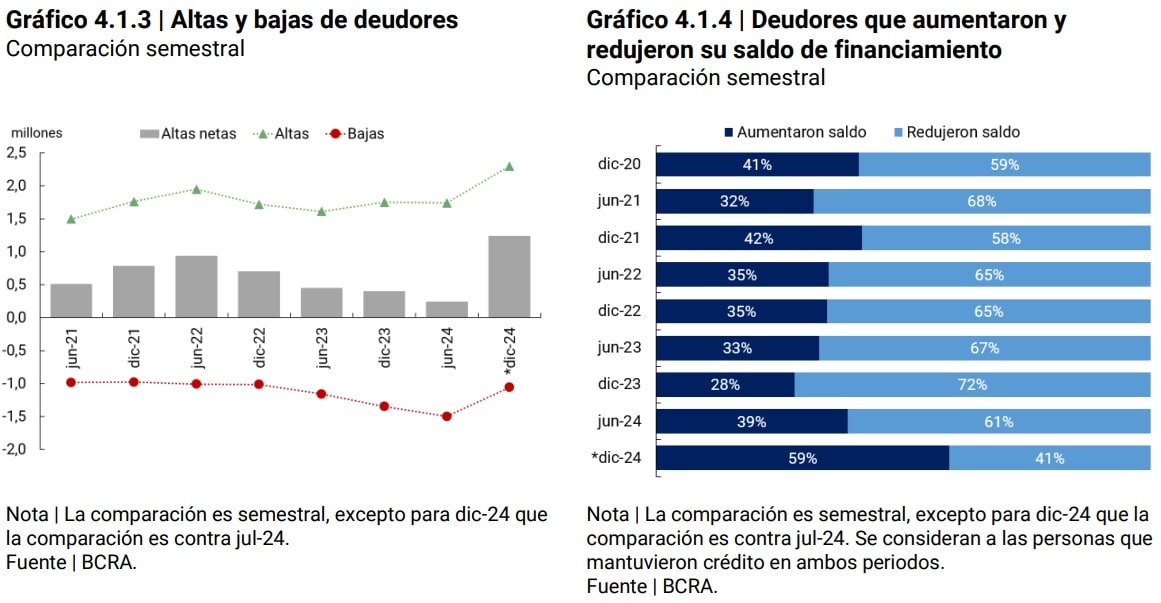
• Credit to individuals combined a broadening of its debtor base with a higher level of utilization by existing debtors | On the one hand, the incorporation of new debtors was intensified and, on the other hand, the use of credit among those who already had financing was deepened. Between July and December, 1.3 million new (net) debtors were added, a figure higher than that recorded in previous periods, and the indicator of people with financing reached 50% of the adult population. In that same period, more than half of the people with credit increased their balance in real terms, also by a greater magnitude than previously observed.
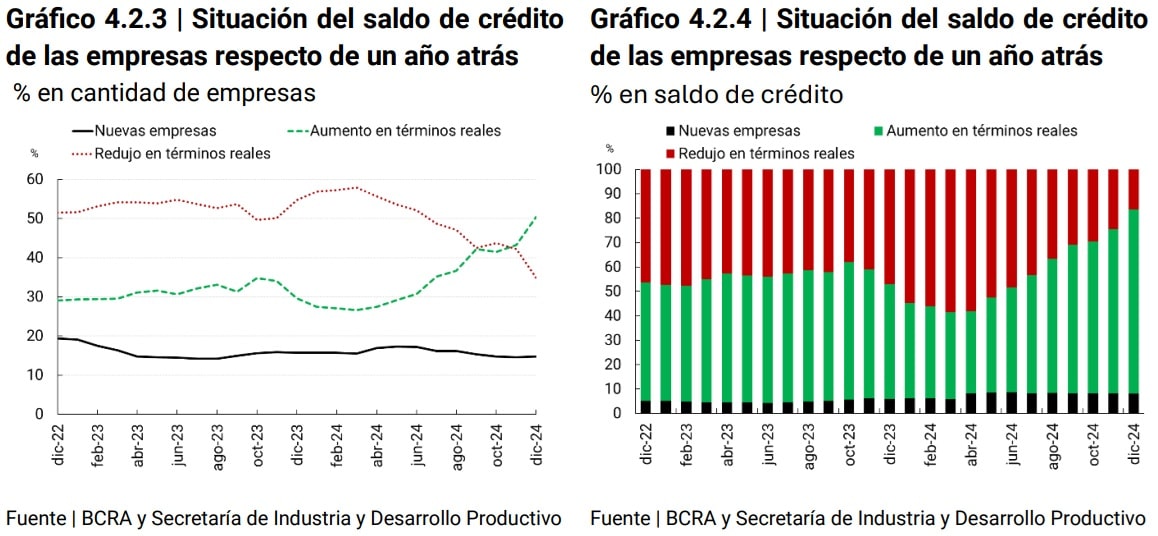
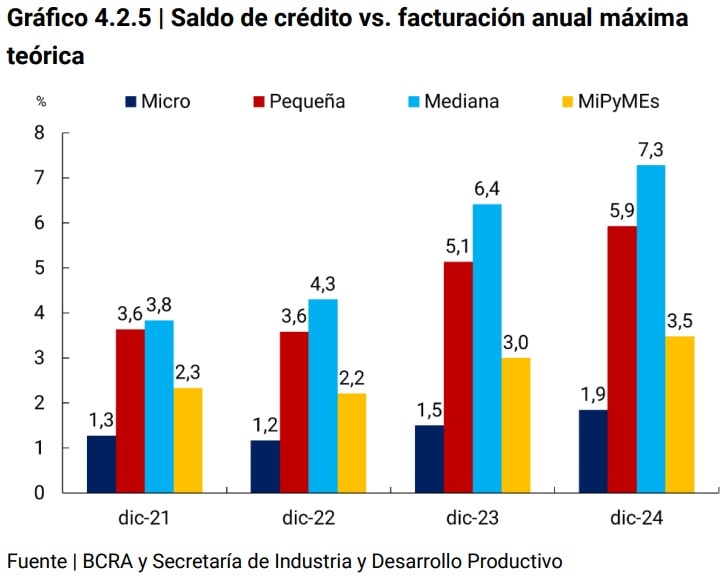
• Credit to MSMEs did not show significant changes in the proportion of companies with financing compared to December 2023, although a higher use of credit was observed | The proportion of companies that expanded their credit balance increased, reversing the downward trend of the last two years, while the entry of new MSMEs into the credit market remained stable. Despite these advances, in relation to indicative annual turnover variables, the depth of credit remains low.
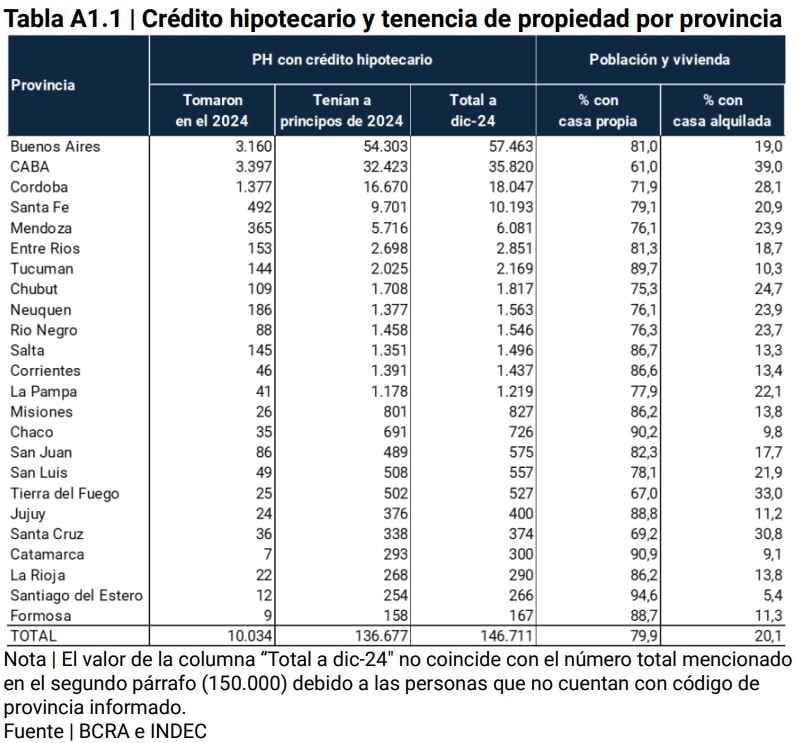
• During 2024, some 10 thousand individuals took out mortgage loans for housing, a figure that almost triples the number of people incorporated in 2023 | The granting of new mortgage loans was mainly concentrated among people with dependent jobs, residents of jurisdictions with a high proportion of the population in a renting situation and belonging to the age range with the highest activity rate in terms of the labor market (30 to 64 years old).
Indicator Table | Financial inclusion in Argentina
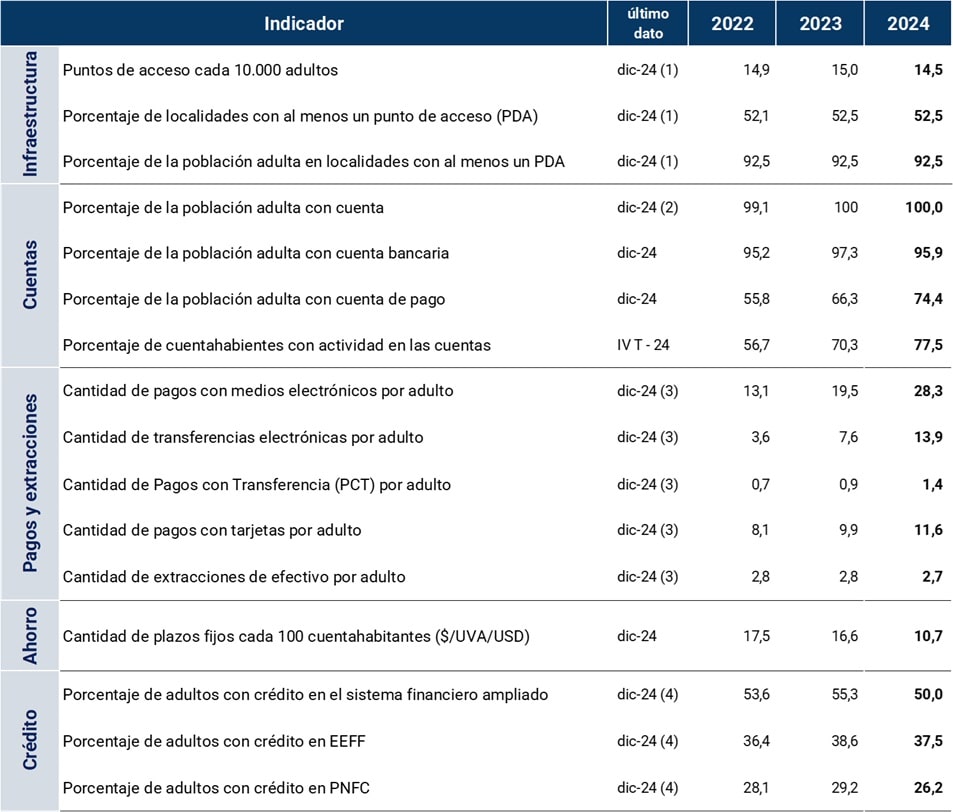
Notes | As of the date of publication of this edition, the final results of the 2022 National Census of Population, Households and Housing (CNPHV) have been released, which were published in different stages during the years 2023 and 2024. Population data based on the 2022 CNPHV were used for the national and provincial level indicators, while for departmental and locality-level indicators, population data based on the 2010 CNPHV continued to be used.
(1) This includes access points for financial institutions (branches, mobile branches, ATMs, self-service terminals and complementary financial services agencies) and ATMs operated by non-financial institutions.
(2) The percentage of the adult population with at least one account yields a value of 101% for the year 2024.
(3) Monthly average for each period. In 2024, it refers to the monthly average of the year.
(4) As of July 2024, financial institutions and other reporters began to inform the BCRA’s Debtors Center of people with a debt balance of $25 thousand, instead of $1 thousand as was the case until June 2024 (Communication A 8001). Consequently, a fall is observed in the column corresponding to the year 2024.
Introduction
Argentina showed improvements in terms of financial inclusion in 2024. Among these advances were greater access to accounts, savings instruments, the intensification of the use of electronic means of payment and financing. Some of these changes are due to structural transformations, such as the use of electronic means of payment and the Mutual Funds (CDF), while others, such as the increase in financing, are due to short-term reasons associated with the reversal of the economic cycle and the reduction of interest rates and inflation.
The greater access to accounts was reflected in two aspects: (i) on the one hand, the predominance of the joint holding of accounts in pesos, financial institutions (EEFF) and payment service providers (PSPs) was consolidated, reaching 69% of the adult population in December 2024, (ii) on the other hand, the increase in the population with accounts in foreign currency, which went from 44% to 51% of the adult population between December 2023 and 2024, in a framework of promotion of means of payment in foreign currency. This advancement in account access continued to lay the foundation for greater utilization of financial services.
In terms of use, more individuals registered some type of movement of funds for payments or money transfers in the last quarter of 2024 compared to the same period in 2023 (77.5% vs. 70.3%). Likewise, a continuous growth of electronic payments was observed to the detriment of the use of cash.
The widespread access to accounts added to greater electronic payment activity through virtual wallets, both EEFF and PSP, led to an increase in the use of savings and investment products, such as Mutual Funds (CDFs) in pesos and foreign currency. The CDFs in pesos were one of the two instruments that boosted people’s savings flows during 2024. This occurred under a scenario in which the real interest rates of the DCFs were close to zero, similar to that of the 30-day fixed terms.
The nominal yield of the main savings and investment products continued to decline as a result of the fall in the monetary policy rate from 40% in June 2024 to 32% in December, although the further slowdown in the price level produced improvements in real interest rates on all savings and investment instruments. On the other hand, balances in foreign currency in bank accounts, largely explained by the implementation of the Asset Regularization Regime, was another instrument that drove savings, reaching a share (31.2%) that exceeded those of other savings and investment products.
In terms of access to financing, the incorporation of new debtors intensified and, on the other hand, the use of credit among those who already had financing was deepened. As of December 2024, 50% of the adult population had a credit in the expanded financial system (SFA) and a net inclusion of more than 1.3 million debtors was recorded since July. In that same period, more than half of the people with credit increased their balance in real terms, also by a magnitude greater than that previously observed. Another phenomenon that was observed is the intensity in which the average balance of financing of individuals expanded, at a rate of 6% per month between July and December 2024. This performance would be associated with the reduction of nominal interest rates, inflation and the recovery of real wages.
On the other hand, although from relatively low values, the growth of pledge and mortgage loans stands out. These instruments, aimed at financing long-term consumption, have a differential impact with respect to lines of greater scope such as credit cards and personal loans, by covering other needs in people’s lives, such as housing.
However, the greater participation of people in account holding, savings and investment products and credit products has not yet had a significant impact on the depth of these financial services. As of December 2024, the balance of individuals (PH) in savings and investment products and credit in relation to GDP showed values close to 8.6% and 5.4%, respectively, when economies with similar levels of PH participation in products reach significantly higher values1. On the electronic payments side, despite continued growth, there is still room to catch up with other economies. Countries with similar or somewhat lower levels of account holding reached levels of electronic payments that were double local values2.
The dynamics of financial inclusion in Argentina occurred in a context of recovery in economic activity and private consumption during the second half of 20243. The employed population began to grow from the second quarter of 2024 and closed the year with a year-on-year increase4.
Real wages showed a contraction at the end of 2023, with a greater drop in public and unregistered wages. The wage recovery began during the second quarter of 2024, showing greater dynamism in private wages (both registered and unregistered)5.
On the other hand, lending and lending rates remained relatively lower than those reached in the recent past. The reduction in interest rates during 2024 was accompanied by a lengthening of financing terms. While in January 2024 the average term of personal loans was 720 days, as of July it was around 1,070 days. Associated with this same phenomenon, a widening of interest rate spreads among consumer loans was observed, with a more pronounced fall in the interest rate on personal loans compared to the credit card rate. Thus, the interest rate on personal loans below the interest rate on credit cards would have been indicating the reduction in expected short-term interest rates.
For its part, a series of measures were provided with effects on access to and use of financial services. On the side of electronic payments, the BCRA continued to promote its use through the adaptation of the regulations for public transport payments with QR code via account debit. In addition, a set of regulations aimed at promoting currency competition was provided, such as the development of the elements required for the acceptance of payments in foreign currency with debit cards in stores, the incorporation of debit card payments in foreign currency into the interoperable QR system and a new variant of recurring DEBIN (Immediate Debit) called “programmed DEBIN”. which allows account holders to pay for purchases of goods or services in fixed installments in pesos or in foreign currency with a single authorization. In terms of savings, the products available related to the savings and investment of adolescent accounts were expanded. With regard to access to credit, the National Government decided to extend the Programme for the Promotion of Consumption and Production of Goods and Services “SIMPLE QUOTA” and established the constitution of divisible mortgages on real estate subject to real estate projects in order to promote mortgage credit.
1. Financial infrastructure
Financial infrastructure coverage indicators registered slight variations in the second half of 2024. In December 2024, 52.5% of localities and 92.5% of adults had coverage of at least one Financial Services Access Point (PDA)6, maintaining the coverage ratios of June 2024. The density of ADP was 14.5 ADP per 10,000 adults, mainly explained by ATMs and complementary financial services agencies (ACSFs)7.
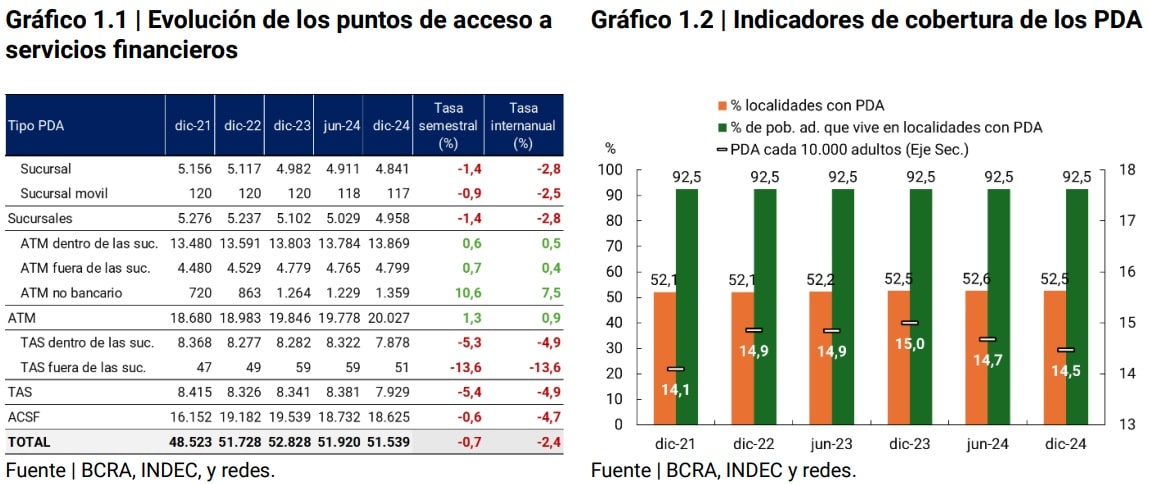
Despite the six-month decrease of 0.7% (-381 units) in the total number of FLW, which stood at 51,539, territorial coverage was not affected, since the reduction occurred in localities that already had other points. As mentioned in other reports, the slow decline in the number of PDAs is due, among other factors, to: (i) the migration of operations from physical points to electronic channels of financial institutions (EEFF) and (ii) to the physical infrastructure that is already installed and allows the performance of basic financial operations, such as businesses that allow cash withdrawals and the payment of services and taxes.
However, other reasons provide arguments for maintaining the territorial coverage of the physical points. Its existence is key to expanding the depth of the financial system (both in terms of deposit-taking and granting of credit), carrying out administrative procedures and handling cash, which is still relevant as a means of payment. In this sense, the semester showed the incorporation of new automated teller machines (ATMs), possibly as part of a technological renovation process. These devices not only improve cash management, but also allow other types of operations such as deposits in accounts, adding resources to the financial system.
So, an initial question that arises is whether the geographical location of the PDAs is related to the geographical distribution of account holders, considering that account ownership is almost universal among the adult population. A subsequent question is whether the number of points, in a given geographical space, is sufficient to satisfy the demand of the account holders who inhabit that space.
As a first approximation to measure the effective scope of the physical infrastructure, we measure whether account holders have access points of the EEFF where they are customers within the locality in which they live8. This means that the physical infrastructure must be in a radius close to people to be effective in solving problems and considering that it would also have a positive impact on financial intermediation9.
In December 2024, almost 70% of people with an account lived in towns where there were access points of one of the EEFF where they had their accounts, a result that reflects the importance of territorial proximity to financial services. Even when segmenting access points according to their primary function—such as cash withdrawal or selling products—the values are still high. As a first approximation, these values suggest that the distribution of access points reaches or is close to a significant portion of account holders.
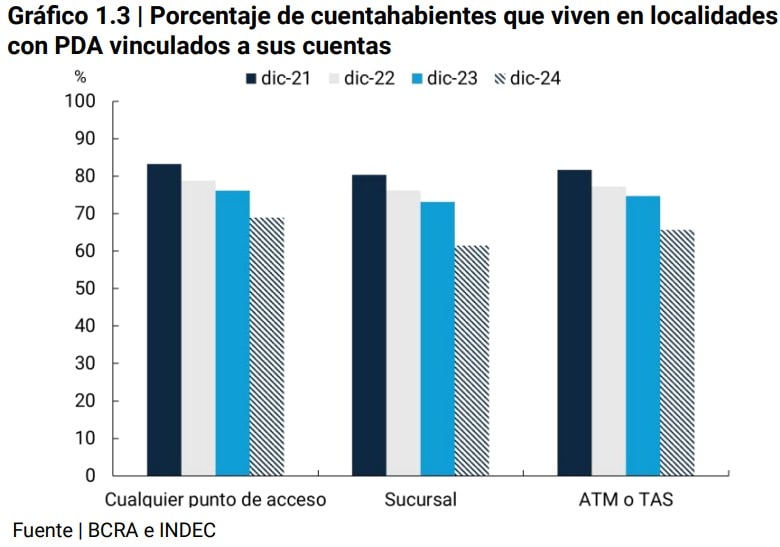
However, when comparing these levels with those recorded four years ago, a drop is observed. The population opened accounts in new EEFF without them having access points in their locality. Among the factors that explain this result are the changes in the supply of financial services, where some EEFF (new or existing) have been prioritizing digital channels for customer acquisition, with incentives such as account remuneration, promotions on purchases of goods and services, access to capital market products, among others. It should also be noted that the opening of accounts in new LFS did not imply the closure of accounts in the FFSs with PDAs in the locality where the people reside, but rather the multiple holding of accounts tended to deepen.
Likewise, this phenomenon occurred in localities with different levels of adult population. In particular, localities with lower population density registered significant decreases. In these areas, where the supply of financial services is usually more limited, a significant number of people were EEFF customers who do not have a physical presence in their town of residence. In these cases, the possibility of operating 100% digitally becomes more relevant, since people incurred a cost of time and money if the new FI requires that the management of services be carried out in person.
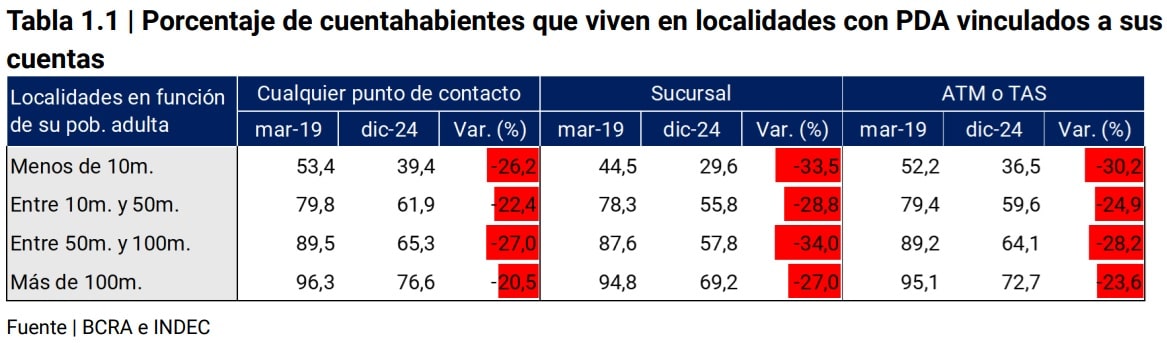
In conclusion, the holding of multiple accounts, facilitated by remote opening, the absence of opening and maintenance costs, and interoperability between accounts, is weakening the territorial relationship between the EEFF and their account holders, although it is still at high values. This phenomenon, together with the expansion of digital channels and alternative physical points that allow basic financial services to operate, raises the question of whether the current physical infrastructure is sufficient or whether, on the contrary, other factors such as the growth of financial intermediation will require a greater number and territorial coverage of service points.
2. Account Access and Use
The number of individuals (PH) with accounts stood at 37.2 million as of December 2024, with a net increase of 800 thousand in relation to the same month of the previous year. Two trends were highlighted: (i) the deepening of the joint holding of bank and payment accounts and (ii) the increase in the population with accounts in foreign currency. The number of individuals with bank and payment accounts increased by 3.3 million during 2024, while the number of those with accounts in pesos and foreign currency increased by 2.8 million 10.
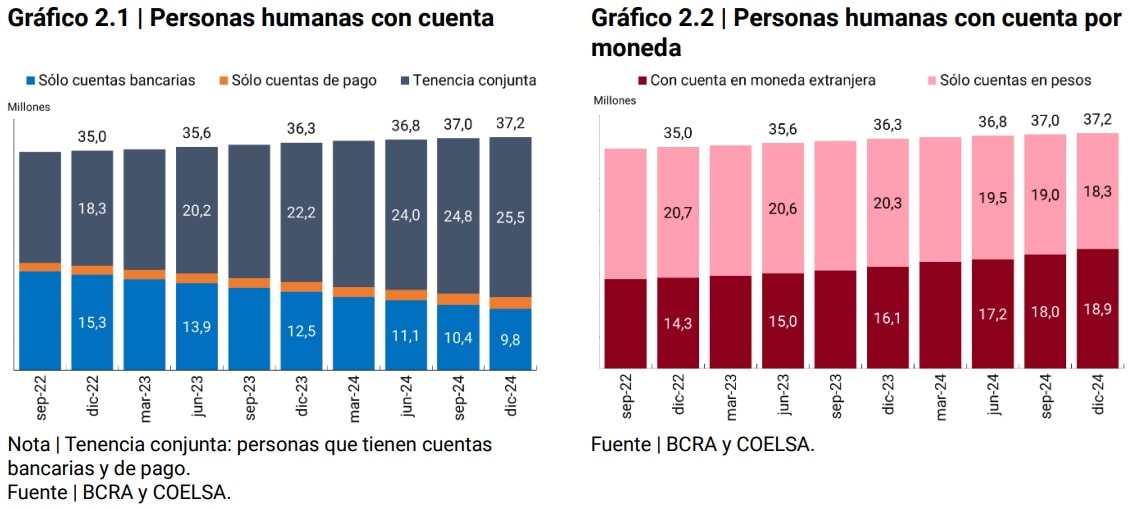
In a context where the use of foreign currency for all types of transactions began to be promoted, the number of people with foreign currency accounts reached 18.9 million in December 2024, more than half (51%) of the adult population. Accounts in foreign currency that initially fulfilled the function of a store of value also have the functionality of a means of payment. In this sense, different regulations are promoting electronic payments in foreign currency, such as the enabling of payments with debit cards11, QR12 and recurring DEBIN13 in US dollars.
On the other hand, payment accounts have helped to facilitate payment operations and, at the same time, contain the loss of purchasing power of the balances deposited in them through the subscription of Mutual Funds (DCFs).
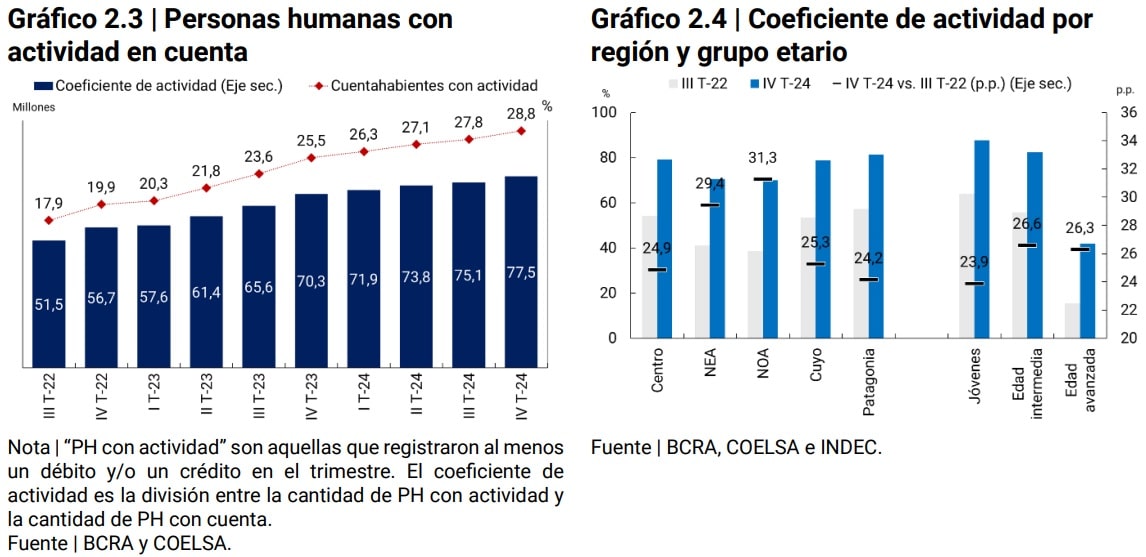
The number of individuals with activity on their accounts continued to increase. In the fourth quarter of 2024, 28.8 million account holders registered movements, which represents 77.5% of the total number of account holders. This trend of greater use of accounts was also evident among those who have both types of accounts: 76% of these holders (18 million people) carried out operations in at least one financial institution and in at least one PSP. This suggests that users take advantage of each option, benefiting from interoperability between accounts.
Along the same lines, 4.5 million people were registered who were active in the fourth quarter of 2024, but who did not present activity in the same quarter of the previous year, while there were 24.2 million people with movements in both periods. This shows that transactional operations through electronic channels are of recurrent use by the population.
On the age group side, the activity rate of the elderly differs significantly from the activity rates of young and middle-aged people. Although the elderly have increased their activity rate, they still registered a low level. This could be explained by the lower use of the internet and mobile devices, as well as the greater use of debit cards as a means of payment14. The low use of technology would have a negative influence on the possession of payment accounts, since their opening and use of accounts requires the internet and the use of cell phones15.
On the regional side, activity rates also registered differences, although less relevant than in the case of age groups. While Patagonia, Centro and Cuyo reached values close to 80%, the NOA and NEA regions were around 70%, but exhibited the highest progress between September 2022 and December 2024. At the territorial level, the technological factor does not have the same incidence as in the age group, since urban agglomerations did not report significant differences in internet connectivity16 and the use of computers and cell phones17. Outside the urban environment, internet connection difficulties could have a negative influence on account activity levels.
Box 1 / Adolescent minors
As of 2016, the BCRA allowed the opening of accounts for minors with the authorization of parents or guardians (0 to 17 years old)18. In 2019, the opening of accounts for adolescent minors (13 to 17 years old) was enabled, which does not require the authorization of parents and guardians19. Then, in 2023 and 2024, the BCRA and the CNV issued regulations to expand the services available for accounts of adolescent minors: (i) the opening of savings accounts in foreign currency20 and of principal sub-accounts that allow operations with fixed and variable income instruments to be carried out, and guarantees21, (ii) the subscription and redemption of Mutual Funds (CDFs) was enabled, and (iii) the maximum ceiling for the accreditation of funds was raised from 1 to 3 salaries22.
As of December 2024, adolescent minors with an account represented 67.6% of the total number of adolescent minors. This value was mainly explained by the exclusive holding of payment accounts (38.3%). If those who operate through digital banks are included, the percentage rises to 45%. This indicates that almost half of these holders opt for a fully digital environment, reducing the relevance of face-to-face operations.
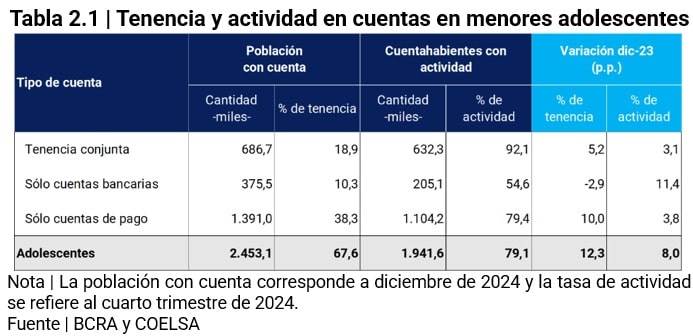
On the other hand, the activity rate of adolescents was close to 80% in the fourth quarter of 2024. Digital natives, having been in contact with the internet, computers and mobile devices from an early age, developed capacities and skills to learn and adopt new technologies in a more natural way23. This familiarity with the digital environment is a key factor in the preference of future customers of the financial system to operate remotely, without the need to go to branches or other points of access to financial services.
3. Electronic means of payment and savings and investment modalities
3.1. Electronic means of payment24
During the second half of 2024, the BCRA continued to promote new electronic payment mechanisms, as well as the improvement of existing ones in order to improve competition and security. Some of the measures adopted by the monetary authority include the adaptation of the regulations for public transport payments with QR codes through account debits, the shortening of the crediting period for payments with prepaid cards, and the readjustment of the functionality of the recurring DEBIN (Immediate Debit) to improve its usability and user protection25.
In a context where account ownership is complete, electronic payments, in quantity and amount, continued to grow in 2024. This path has a positive effect in terms of financial inclusion, given that electronic payments are the gateway to other financial services. Not only in terms of generating a digital footprint for potential access to credit, but its use is conducive to savings and investment.
The familiarity with making electronic payments through virtual wallets – bank and payment accounts – favors an approach to short-term savings and investment instruments such as the Mutual Funds (CDFs) offered by EEFF and PSP. Many of these accounts allow the balance to be kept constantly invested in an FCD, from which payments can be made directly. In other cases, when the DCF is set up separately from the main account, it is also possible to make payments directly from the fund (see Savings and Investment Arrangements).
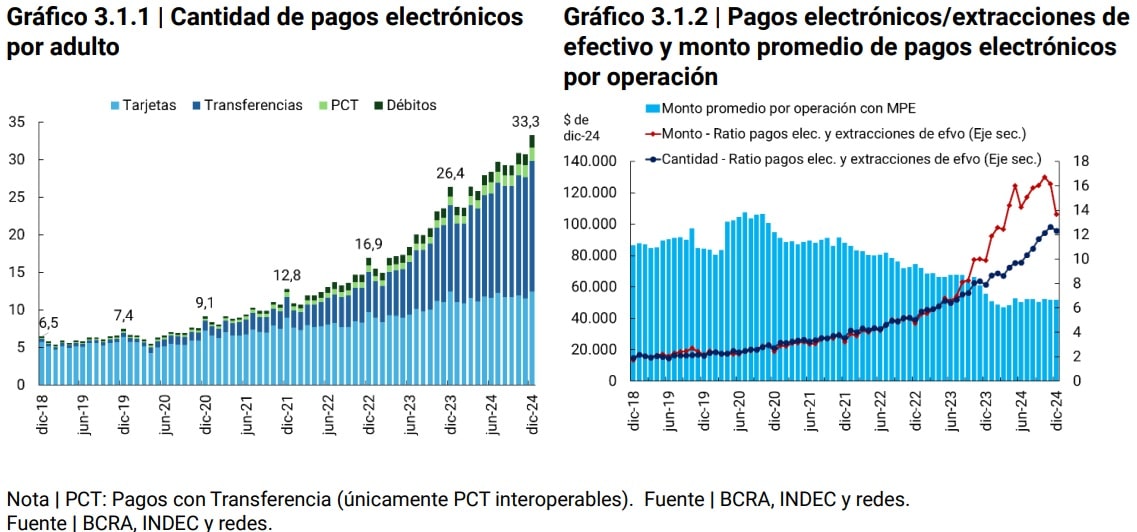
Electronic payments continued to increase in 2024, in an economic context where a contraction in private consumption was observed during the first half of 2024 and a recovery in the second half (see Introduction). Each adult person made, on average, more than 28 electronic payments26per month, 45% more than during 202327. This increase, driven by immediate payments (transfers and Transfer Payments -PCT-), is part of the upward trend of people registering electronic payment activity in their accounts, which reflects a greater adoption of electronic payments (See Access and use of accounts).
As in other years, the amount of payments in constant terms28 per adult expanded at a slower rate (12.7% YoY) than the number of payments. Transfers drove this growth while items such as debit cards and PCT registered contractions. Under the current scheme, of instant crediting, easy access for the user and receiver through wallets and without commissions for sending and receiving payment, transfers manage to capture a retail payment modality that contributes quantity and amount to electronic means of payment (MPE).
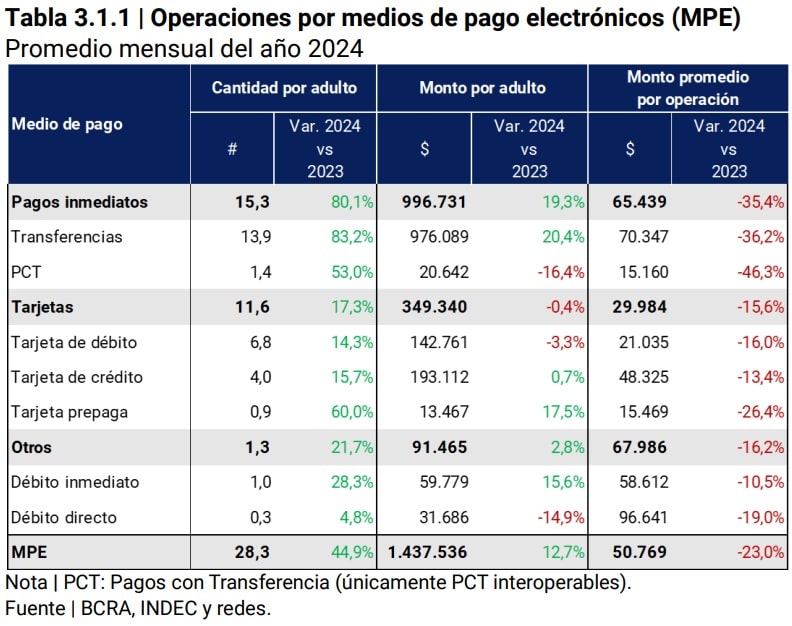
Because the number of electronic payments grew more than the amount transacted, the average amount for each electronic payment continued to decline in 2024 compared to the average of a year earlier, although as of May some stabilization in monthly values is observed. The fall in the average amount of operations with MPE, as mentioned in other editions of the IIF, implies a substitution of cash by electronic means in regular and low-amount payments.
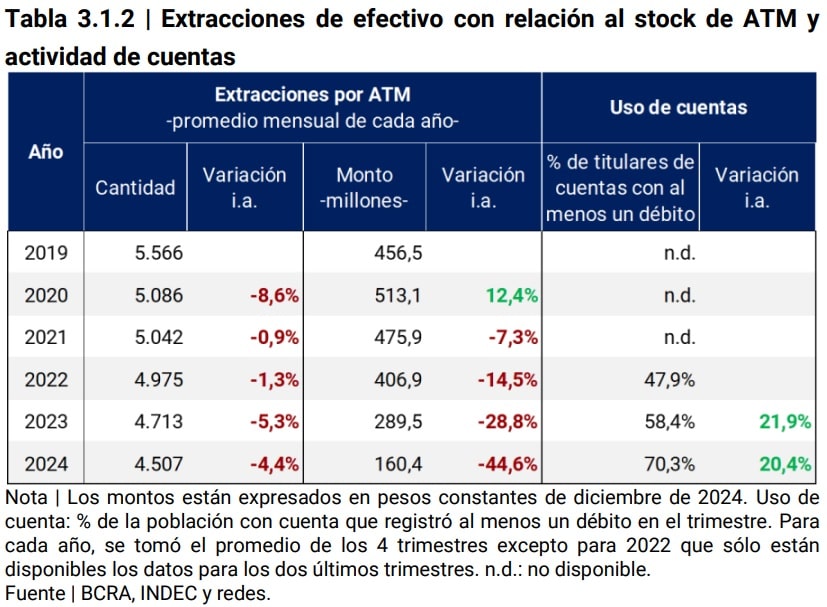
The substitution of cash by electronic means can be inferred from the evolution of electronic payments and cash withdrawals29. In 2024, 10 electronic payments were made for each cash withdrawal, while in 2023 7 were made and in 2019 only 2. The growth of this ratio — more and more electronic payments for each cash withdrawal — has accelerated in recent years, especially in terms of amounts.
The advance of electronic payments over cash withdrawals shows a lower need for cash by the population to make retail payments, and, therefore, fewer withdrawals compared to the ATM infrastructure – which in recent years has remained relatively stable with a slight growth (See Financial Infrastructure section). In 2024, there were, on average, 200 fewer monthly withdrawals per device than in 2023, and about a thousand fewer than in 2019. The drop was even more marked in terms of amounts. This decrease in cash withdrawals corresponds to the increase in the population that uses their accounts to make debits30.
The decrease in the share of cash and the increase in electronic payments in the sales of supermarkets and household appliances also mark the advance of digitalization. Although information is only available on payment methods in terms of amount and not quantity, the drop in the percentage of cash over total sales in supermarkets is notable, from 29% in 2022 to 18% in 2024. In contrast, the amounts paid with credit cards advanced 7 p.p. In the household appliances category, a similar trend is also observed, although due to their characteristics (goods that generally involve relatively large disbursements of funds where financing is usually more common), the variations are more attenuated. The weight of cash fell 5 p.p. in the last year and only 12% of total sales are paid with this means.
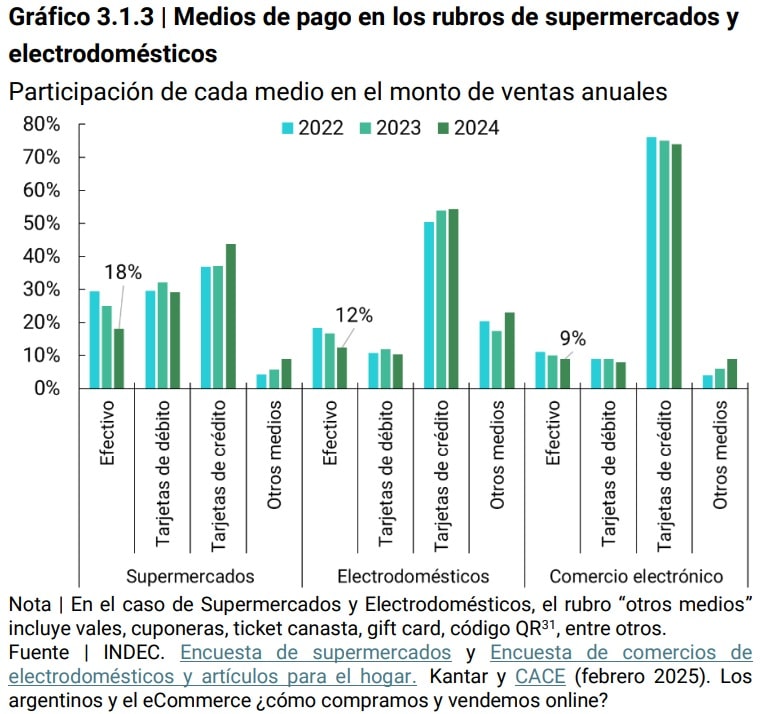
In the e-commerce sector, the use of cash also fell, although at a slower pace, due to the specific characteristics of this type of commerce. Although it lost some share, the credit card continued to lead this market and accounted for 75% of total sales, probably due to the relevance of installment financing for buyers (8 out of 10 stated that the possibility of financing in installments influences their purchases)32. In the case of these three commercial items, payment by electronic means, such as credit cards and/or through some electronic wallets, may be associated with applicable discounts on the purchase amount. This factor also contributes to the decrease in the use of cash.
Box 2 | Electronic payments in foreign currency
Within the framework of the set of regulations aimed at promoting currency competition, the BCRA provided that: (i) companies that intermediate between the merchant and customers to process payments (acquirers and sub-acquirers) develop the elements required for the acceptance of payments in U.S. dollars (USD) with debit cards in merchants that so wish, (ii) the incorporation of debit card payments in pesos and U.S. dollars into the interoperable QR system, and (iii) a new variant of recurring DEBIN (Immediate Debit) called “programmed DEBIN”, which allows account holders to pay for purchases of goods or services in fixed installments in pesos or dollars with a single authorization33. These measures came into force at the end of February (i and iii) and April (ii) 2025 and, consequently, the evolution of these payments in US dollars will be observed in the next Financial Inclusion Report.
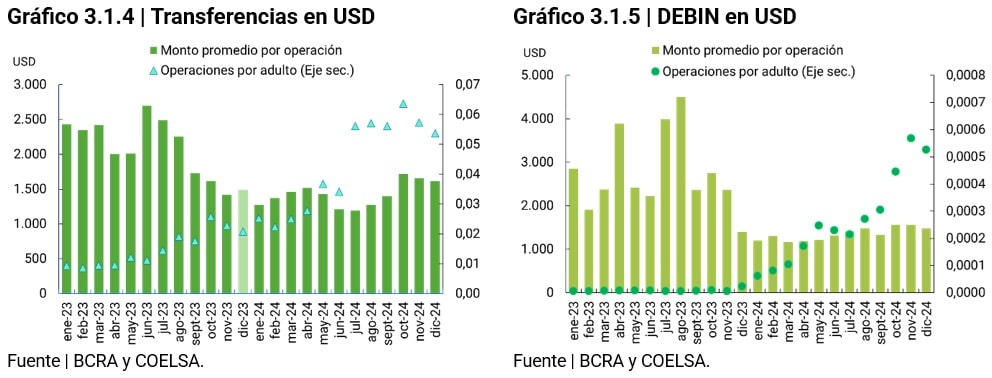
Regarding the adequacy of foreign currency (ME) operations, at the end of 2023 the possibility of making more than one transfer per month in EM to another account denominated in EM34 was established, without the need to justify the reason for the transfer. Although a growth in these operations was observed in 2024, they represented a very low number compared to transfers in pesos, since they are in an incipient stage. It should be noted that people with foreign currency accounts accounted for 51% of account holders in December 2024, a figure that grew 7 p.p. compared to December 2023 (44%).
Considering transfers and DEBINs, the adult population carried out twice as many operations in 2024 as in 2023. The increase observed from the second half of the year may be associated with the implementation of the Asset Regularization Regime and new products in foreign currency such as Mutual Funds and payments in installments of goods and services. The amounts exhibited a similar behavior to the amounts, and doubled in 2024.
In 2024, the average amount of each dollar transfer was approximately USD 1,400, 31% less than in 2023. Taking into account the marked difference in the average amounts, the use of transfers in dollars would respond to purposes other than those made in local currency (equivalent to $1.6 million and $120 thousand, respectively). Likewise, the average amount per DEBIN was around USD 1,300, an amount close to that of transfers in dollars. Similarly, the average amount of DEBINs transacted in local currency ($57 thousand) would show a demand for use originated by reasons different from their counterpart in dollars (equivalent to $ 1.5 million).
3.2. Savings and investment modalities35
In December 2024, the balance of savings and investment products for individuals (PH) in the financial system and capital market was $59.5 trillion. This balance registered a half-yearly growth of 21.7% and a year-on-year growth of 5.5%. Mutual Funds (DCFs) in pesos and deposits in foreign currency, both demand and time, accounted for a large part of the variations observed in the first half of the year. It should be noted that the increase in balances in foreign currency was influenced by the Asset Regularization Regime.
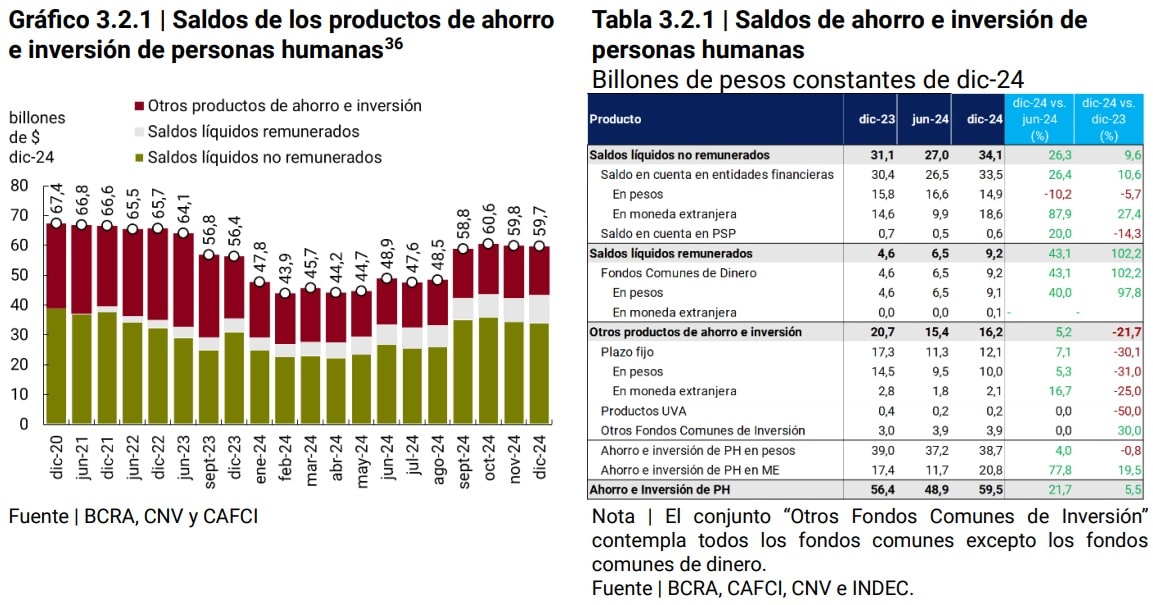
In a historical perspective, the evolution of savings and investment balances in pesos were influenced by the dynamics of inflation and the behavior of interest rates. On the one hand, inflation increased the opportunity cost of holding liquid account balances without remuneration, causing a contraction in demand for these. On the other hand, the increase in inflation led to a greater use of DCFs in order to reduce the loss of purchasing power of balances in pesos.
The greater facilities that PHs have to use DCFs for transactional purposes37 (payments and money transfers) made this product more relevant than other savings and investment options, increasing its share from 13.3% to 15.6% in the total balance between June and December 2024. With this benefit, payment account holders and accounts in financial institutions (EEFFs) often reallocate their liquid balances to FCDs within the same PSPs or EEFFs.
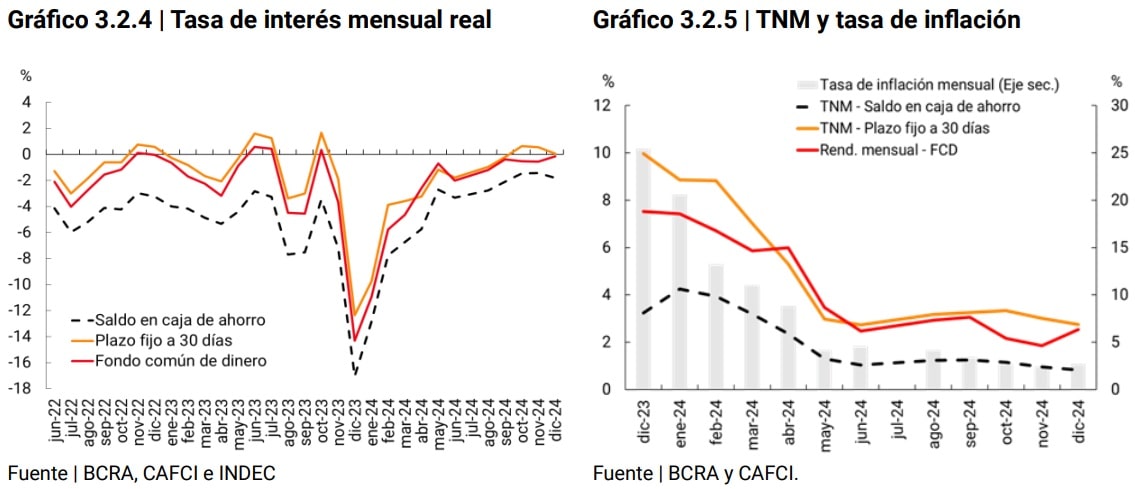
This occurred in a scenario where real interest rates on CDFs were close to zero, with a tendency to move out of negative territory. These rates are higher than that of maintaining liquid balances in account and similar to that of 30-day fixed terms, without losing liquidity and giving up little profitability. The nominal yield of the main savings and investment products continued to decline as a result of the fall in the monetary policy rate, which went from 40% in June 2024 to 32% in December of the same year.
However, the greater slowdown in the price level produced improvements in real interest rates in all savings and investment instruments. These increases in real yields caused fixed-term loans in pesos to present positive real interest rates during the fourth quarter of 2024, the first records above zero since October 2023. The fixed-term in pesos continues to be the product with the highest average balance per holder, with 4.4 million pesos as of December 2024, although the number of holders is reduced quarter by quarter.
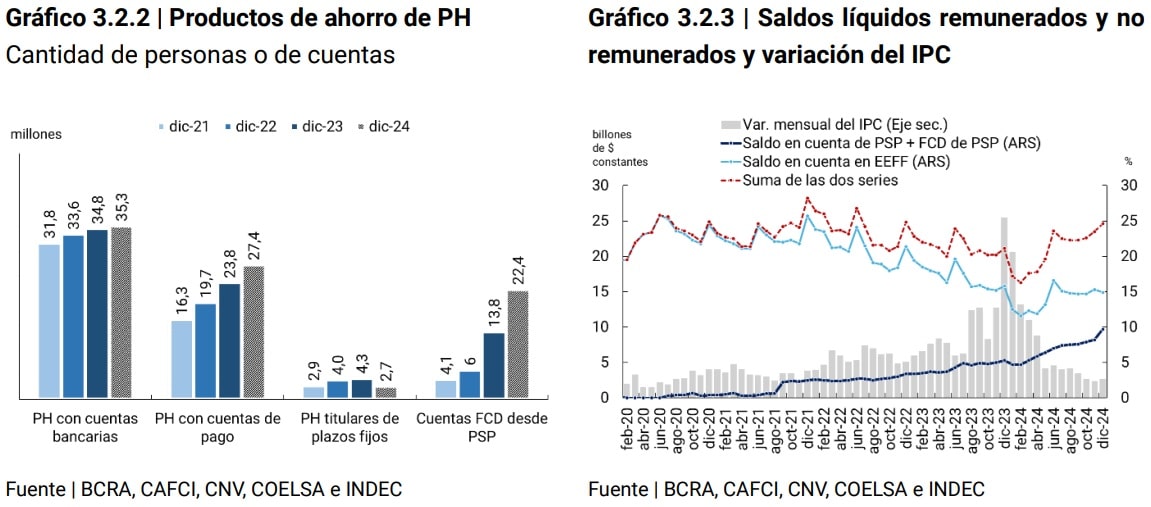
The low rate differential between FCDs and fixed-term loans in pesos, coupled with the facilities offered by the EEFF and PSPs to carry out transactions with FCDs and for subscription and immediate redemption of funds, had a positive impact in terms of financial inclusion. This translated into a greater participation of individuals in the product, well above the participation in fixed terms. As a reference, the number of PSP accounts with a balance in CDFs went from 13.8 million in December 2023 to 22.4 million in December 2024 and it is estimated that at the end of 2024 at least 53.7% of PHs holding payment accounts had balances in DCF, with a year-on-year increase of 10.4 p.p.
The regulatory measures and advances adopted to promote currency competition have boosted the supply of savings and investment products in foreign currency. In 2024, DCFs stood out for diversifying their investment offering in US dollars. At the end of 2023, there were only 3 funds with this possibility, but at the end of 2024 the figure rose to 35, of which 15 came from instruments created38 by EEFF and 20 from instruments created by capital market agents.
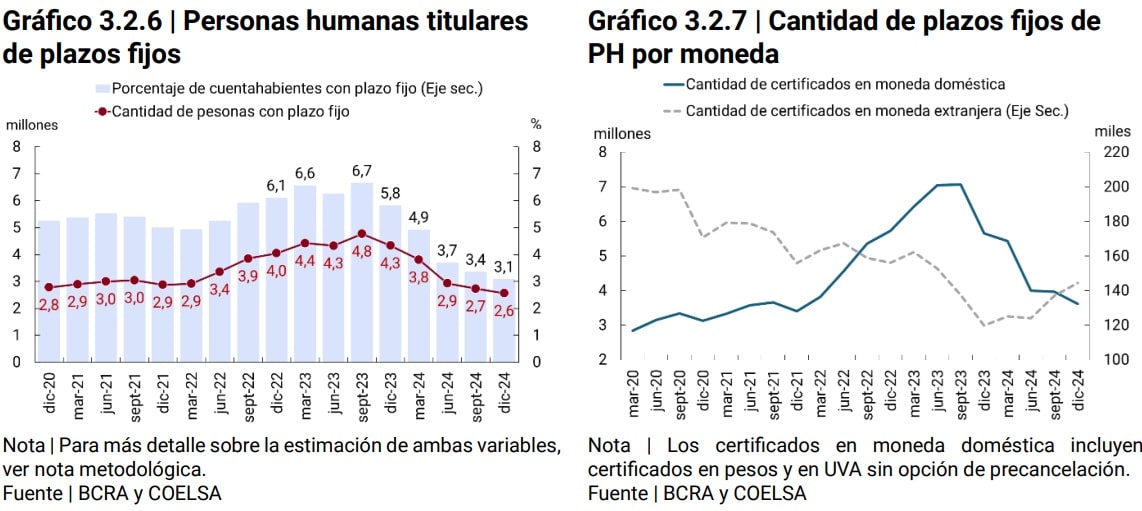
However, fixed-term loans continued to show signs of weakness in terms of financial inclusion. On the one hand, the number of PH holders of fixed terms went from 4.3 to 2.6 million within the year. Thus, the percentage of account holders with a fixed term39 was 3.1%, with a year-on-year drop of 2.8 p.p. On the other hand, fixed-term balances showed a slight recovery compared to the first half of the year, with a half-yearly increase of 7.1%. This increase was driven in part by fixed terms in foreign currency, which showed a growth of 16.7% in the last 6 months of 2024. The number of fixed terms in foreign currency of PH stood at 145 thousand, with a year-on-year growth of 20.7%.
The percentage of account holders with a fixed term shows the low use of fixed terms as a savings instrument for PHs, in contrast to what was mentioned in the previous paragraphs on DCFs. As of December 2024, the balances in CDF were equivalent to 3 quarters of the fixed-term balances. As of November 2024, the balances in FCIs (sum of the DCFs and other FCIs) exceeded the balances in fixed terms, reaching a percentage difference of 9% as of December 202440. A secondary effect of the constitution of CDFs by PHs is the increase in the demand for fixed terms by the financial service providers that manage these funds. In other words, although individuals reduced their direct use of fixed terms, these instruments continue to be indirectly demanded through the constitution of CDFs.
4. Credit 41
4.1 Credit to individuals
As of December 2024, 18.4 million individuals registered financing in the expanded financial system (SFA)42, which implied the net incorporation of 1.3 million debtors since July 2024. This variation is the result of the registration of 2.3 million new debtors and the withdrawal of 1 million. Coverage of the adult population reached 50% of the adult population in December 2024. The analyses in this section are carried out with respect to July 2024, since in June there was a change in the methodology for reporting debtors43.
The net incorporation of new debtors intensified in the second half of the year, both due to a reduction in gross write-offs and an increase in gross registrations. In addition, between July and December 2024, more than half of the people who had financing increased their credit balance in real terms45. It is also worth noting the growth rate of the average balance of financing per debtor, which, between the months of May to June and from August to December, grew at a rate of 6% per month in constant values.
This situation was very different from previous years where a significant portion of debtors reduced their financing in real terms. On the other hand, the net increase in debtors was driven by those who have exclusive debt with Non-Financial Credit Providers (PNFCs) and by those with simultaneous financing in PNFCs and financial institutions (EEFF)46, while the number of debtors with exclusive financing in EEFF decreased.
In other words, in the second half of the year, the credit market combined two dynamics, in principle, positive for financial inclusion. On the one hand, the incorporation of new debtors was intensified and, on the other hand, the use of credit products by people who already had financing was deepened. The latter phenomenon could be motivated by the inflationary slowdown and the recovery of real wages.
In terms of balance, the different groups of debtors presented markedly dissimilar levels of credit. On the one hand, those who increased their balance between July and December 2024 belonged, for the most part, to the segments with the highest financing balances. On the other hand, among new debtors, a significant proportion was concentrated in the lower balance brackets. This reinforces what was mentioned in previous reports regarding the incorporation of new debtors is carried out mainly due to reduced debt balances.
On the other hand, between July and December 2024, all lines of financing registered increases in the percentage of debtors in terms of the adult population. Although from relatively low values, pledge and mortgage loans stand out, which finance long-term consumption and have a differential impact with respect to lines of greater scope such as credit cards and personal loans, by covering other needs in people’s lives, such as housing.
In the long-term credit segment, mortgage loans interrupted a prolonged trend of reduction in the number of holders with debt, incorporating 10,000 people during 2024, although levels remain very low (see Section). In the case of pledge loans, also starting from relatively low values, there was a 13% growth in the proportion of debtors over the adult population between July and December 2024, and 7.8% in year-on-year terms. This increase occurred in a context in which the automobile registration index accumulated a 4.9% drop between January and December 2024; however, since August, the year-on-year variation of the index was positive, reversing the downward trend observed since December 202347.
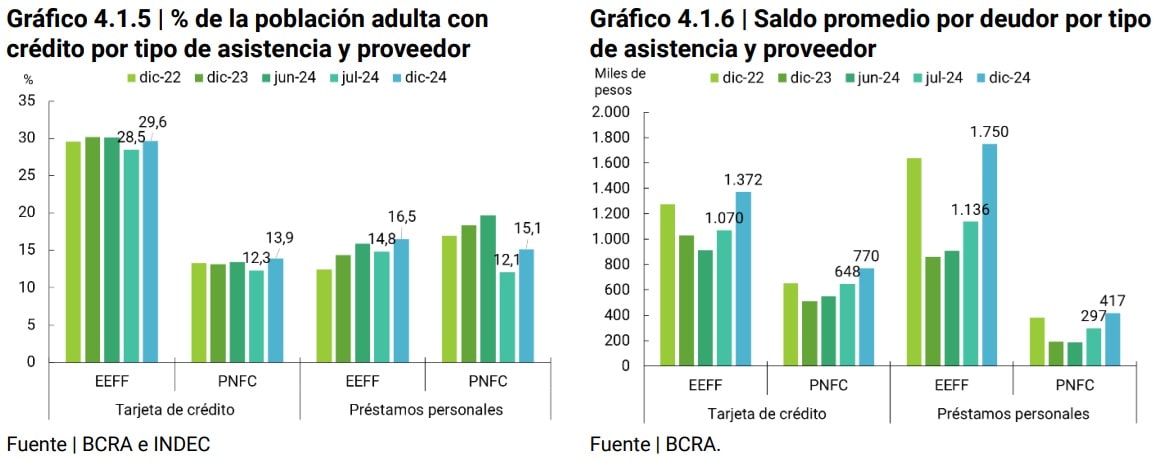
In the consumer credit segment, credit cards, with 13.9 million people, continued to be the credit instrument with the highest penetration in the population (37.4% of the adult population), while personal loans, with 9.6 million people, ranked second. It should be noted that, in June 2024, NFPPs were the main providers of personal loans, with almost 4 p.p. above the LFFS, while as of December 2024, the NFPPs were only 1.4 p.p. behind the FFS.
Although there is no data available on the financing management channel (remote or face-to-face), it is observed that 100% digital providers have a greater presence in PNFC debtors than in EEFF debtors. Digitalization makes it possible to overcome certain barriers to access to credit and cover use cases that other financing products do not reach. In addition, the digital footprint generated by other services, such as electronic payments, often offered by companies linked to these providers, helps to compensate for the lack of credit history of certain population groups, such as informal workers. These advantages would be more exploited by the PNFC48.
In terms of amount, the average balance per debtor of personal loans and credit cards by type of provider registered increases between 19% and 54% in real terms between July and December 2024. As mentioned above, this marks a change in trend in people’s short-term financing, generally intended for consumption, with an increase in balances in real terms. Despite the increases, the average balance per debtor of the PNFCs of the personal loan lines continued to represent a quarter of the balances channeled through the EEFFs.
This would mark the difference in the debtor’s profile and/or in the destination of use of one type of loan or another depending on the type of provider. A previous analysis found that the PNFC client portfolio was composed of a higher proportion of relatively younger people who do not have a job in a dependent relationship compared to the segmentation of clients in the LFCPs49. Likewise, the type of provider also affects the level of indebtedness of people depending on the source of resources in each case. In the case of credit cards, the gap in the average balance per debtor between the two providers also remained unchanged (the balance from the PNFCs represented around 60% of the balance provided by the EEFF) and would show a similar situation to personal loans, but to a lesser extent.
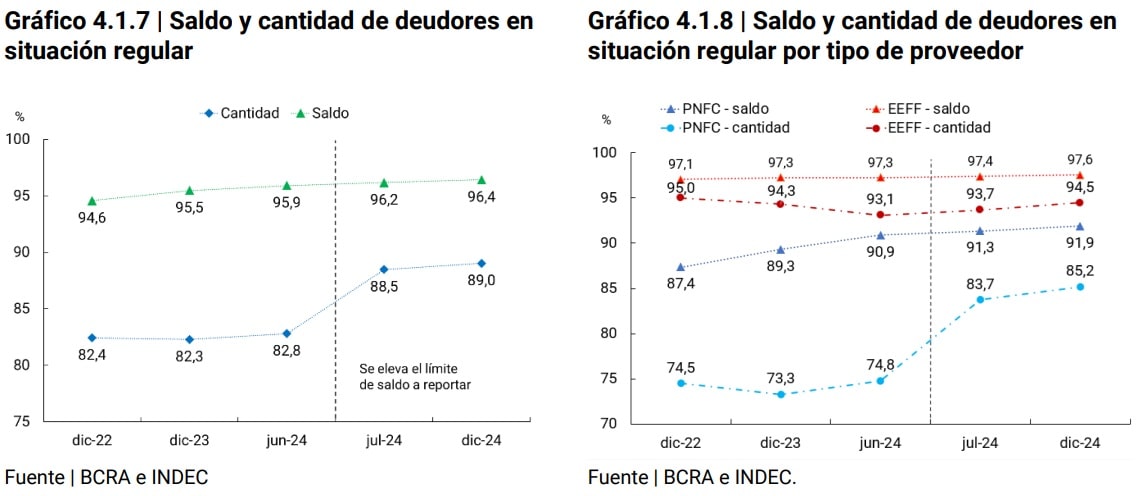
On the other hand, in the second part of the year, there was an improvement in the payment behavior of debtors. This improvement occurred in a context of an increase in the number of people with financing and an increase in their average balance. In this way, the net incorporation of 1.3 million debtors occurred in a framework of improvement in people’s repayment behavior. 89% of individuals with financing recorded adequate compliance with their financial commitments in December 2024, 0.5 p.p. more than in July 2024. The improvement in the repayment behavior of debtors was verified in both those with financing in EEFF and in PNFC. In the latter, the increase in the base of debtors in a regular situation was even greater (1.8 p.p.) than in the EEFF (0.9 p.p.). This shortened the historical gap between debtors who adequately meet their commitments in PNFC (85.2%) and EEFF (94.5%), which was strongly reduced by the change in the information base between June and December 2024.
4.2. Credit to MSMEs50 productive units
In December 2024, the indicators on the proportion of MSMEs with credit remained at values close to December 2023. According to statistics from the Ministry of Industry and Productive Development, the number of this type of companies reached 1.9 million in December 202451. Of this total, 71.6% of companies had credit in December 2024, while, in a disaggregated manner, the values amounted to 91.2% for medium-sized companies, 85.2% for small companies and 71.1% for microenterprises52. In this period, funding levels grew substantially, registering in December 2024 the highest balance in the last 4 years, both at the aggregate level and by size53 .
The share of credit to MSMEs within credit to the non-financial private sector (NFPS) was approximately 44% in 2024, below the average of previous years. NFPS lending performed better than MSME lending – it fell less in the first half of the year and grew more in the second half – something that had not happened since 2021. In this context, regulations were modified that promoted credit to MSMEs through subsidized rates. These regulations aimed to bring financing to MSMEs closer to conditions more aligned with the market54 .
Between December 2023 and 2024, some 203 thousand MSME companies joined the credit market, contributing about $2.3 trillion constant pesos. Likewise, 60% of MSMEs with financing in December 2024 increased their credit balance in real terms compared to December 2023, contributing $6.8 trillion.
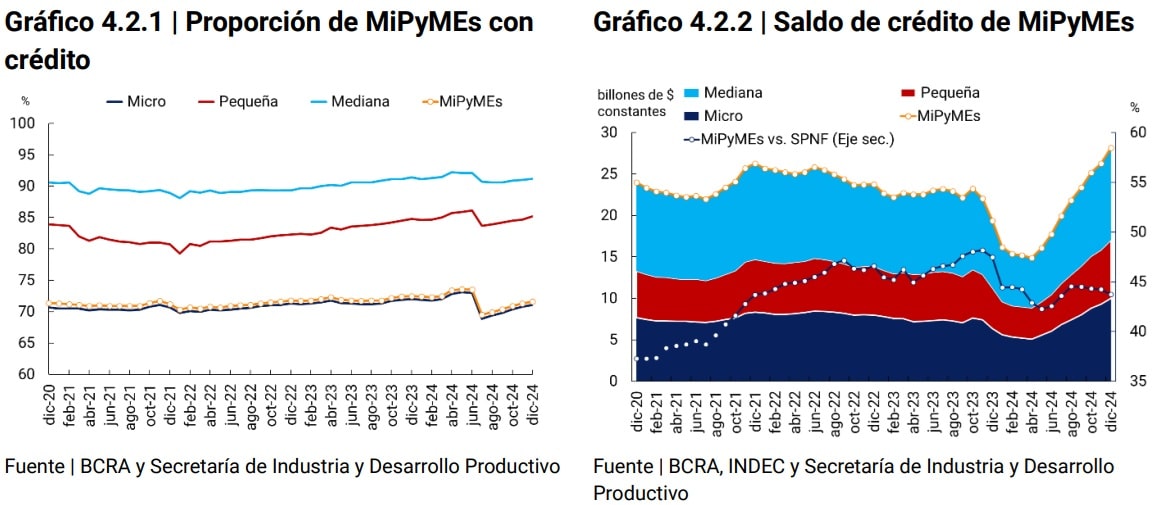
As of April 2024, an increase was observed in the proportion of companies that increased their financing balance, reversing the trend of the previous two years. This change suggests that, in the face of a new macroeconomic context, MSME companies chose to make more active use of credit, which contributes to their financial inclusion. On the other hand, the entry of new MSMEs into the credit market remained stable in line with the levels of the last two years.
Despite these advances, the depth of credit remains limited. While funding ratios to theoretical maximum annual turnover55 increased across all firm sizes, levels remain low, especially in microenterprises. The lower use of credit by microenterprises could be influenced by their shorter life span, the instability of their income, and the structure of their organization (mostly individuals). These conditions would lead microenterprises to rely more on alternative sources, such as equity capital or financing through the capital market.
Section 1 / A characterisation of new holders of mortgage loans for housing
The housing mortgage loan market was reactivated in 2024 after an extended period of stagnation. In that year, some 10 thousand individuals took out mortgage loans, a figure that almost triples the number of people incorporated in 2023. Different economic issues led to the recovery of this market, which led financial institutions (EEFF) to renew their offer of UVA mortgage loans during the second half of1956 in a context where the population’s interest had skyrocketed in April 2024 as measured by internet searches for the term “mortgage loans”.
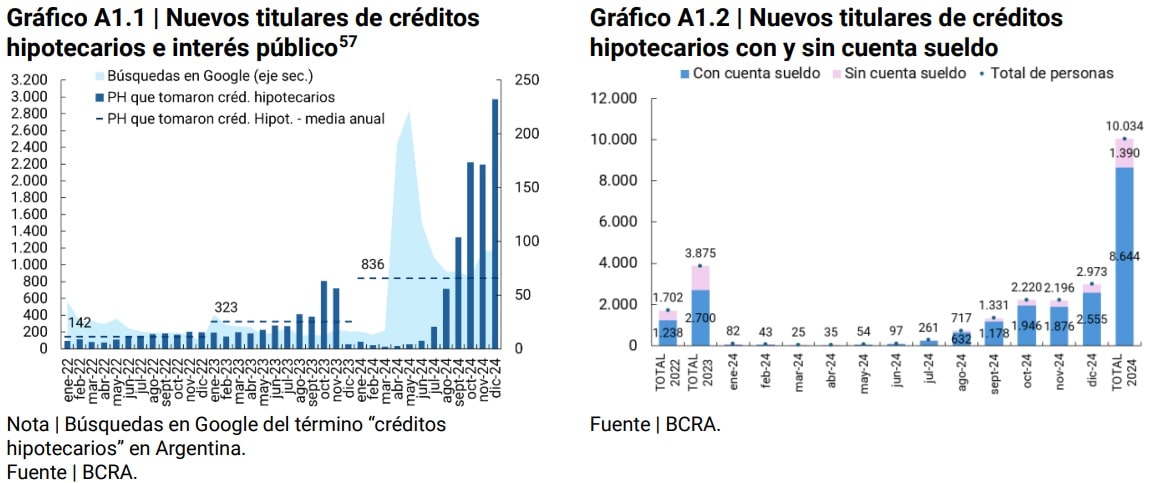
However, as of December 2024, the total number of individuals with mortgage credit reached only 150 thousand individuals, which represents 0.4% of the adult population. On the one hand, the countries of the upper-middle-income group, to which Argentina belongs, registered between 3% and 20% of their population with access to mortgage credit58. On the other hand, in the historical comparison, the value of December 2024 is the lowest figure in recent years59.
Different factors can affect people’s demand for mortgage loans. The replacement of one’s own home for reasons of expansion or housing improvement, investment in real estate (demand for second or third homes) and the search for one’s own home in the case of people who are renting. In the latter case, the proportion of people living in rented housing is around 20% of the population, although extreme cases such as CABA, Santa Cruz and Tierra del Fuego are recorded with values above 30%60. Although the decision to rent may be a desired situation, there are elements of a psychological and/or cultural nature, such as aspirations, or of an economic nature61, such as avoiding fluctuations in future rental prices, which lead people to want to own their home.
In other words, given these housing conditions and the mortgage credit market, this product has a high growth potential, although it requires certain conditions of macroeconomic stability. As an introduction to this incipient phenomenon, this section will study the characteristics of the group of people who joined this long-term credit product in 2024.
Employment status. The granting of new mortgage loans was mainly aimed at people who had a job in a dependent relationship62 (85 out of every 100 new holders). Month by month, the participation of these debtors increased in the total number of new holders, as the granting of mortgage loans accelerated (from 69% in June to 86% in December 2024). This phenomenon is also replicated at the provincial level where the participation of salary account holders is very high.
It should be noted that many EEFF grant benefits, such as lower interest rates, to those who transfer the credit of their salary to a salary account in the same FI that grants the loan. These incentives are not usually available to freelancers. In this first stage, the EFFs would be prioritizing the allocation of mortgage loans to people with low risk profiles (stability in income level).
Geography. New mortgage borrowers were distributed roughly in line with the distribution of the adult population. The Autonomous City of Buenos Aires (CABA) was the jurisdiction that led the dynamism of the mortgage loan segment in terms of the adult population, surpassing by almost three times Córdoba, which was ranked second, and Neuquén, in third place, by 4 times.
Various factors can influence the differences observed between jurisdictions, such as the level of disposable income of individuals, the housing conditions of the population (such as the property tenure regime), the employment characteristics of the inhabitants (such as the degree of formality), and the physical financial infrastructure, which in turn conditions the available credit supply in each territory. Although the advance of digitalization manages to reduce the barrier associated with distance, this type of loan still requires a certain degree of face-to-face presence.
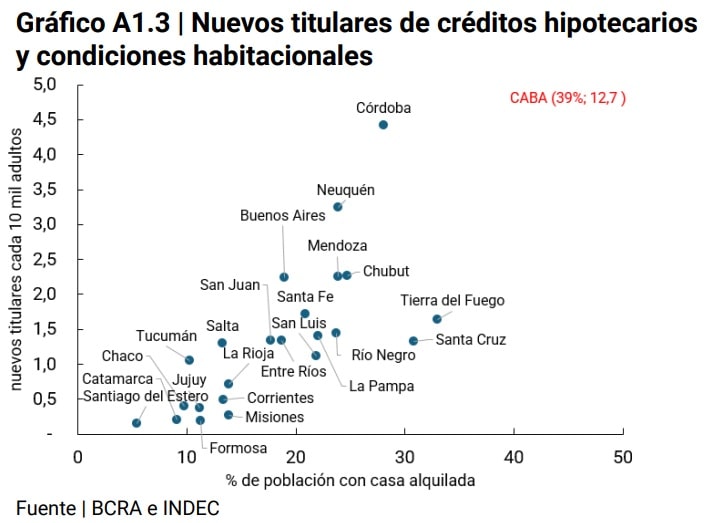
The percentage of the population living in rented housing shows some association with new mortgage loan holders by province and could explain, at least in part, the differential behaviour between the different jurisdictions. While in CABA 35% of the population resided in a rented home in 2022, in Catamarca only 8% of the population did so, a province with one of the lowest numbers of new debtors per 10 thousand adults.
That is, people who were renting, with access to a mortgage loan as a vehicle to buy a home, seek to replace the rent amount with the loan installment. The jurisdictions with the highest percentages of participation of the population with rented houses have average salaries above the national average and with high levels of salary account tenure (except Córdoba).
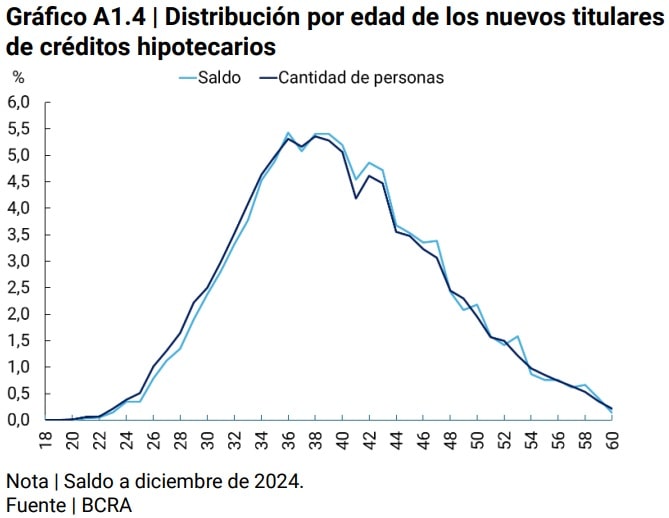
Age group. New mortgage borrowers were concentrated between the ages of 30 and 49. This age group covered 80.2% of the holders and 80.8% of the balance as of December 2024. This is related to at least two factors:
(i) the requirements of the EEFF on the age conditions regarding the term of the credit: the EEFF requires that the mortgage loan be paid before a certain age (e.g. 75 or 85 years).
(ii) the age structure of the labor market: the employment rate63 of people up to 29 years of age stood at 9.9%, an age group that included only 7.5% of new mortgage loan holders. While, in the 30 to 64 age range, the employment rate was 33.1% and represented 91.7% of new mortgage loan holders and 92.7% of the total balance.
Methodological note
Population data
This report presents indicators that are disaggregated by different demographic and geographical variables. As of the date of publication of this edition, the final results of the 2022 National Census of Population, Households and Housing (CNPHV) have been released, which were published in different stages during the years 2023 and 2024. Population data based on the 2022 CNPHV were used for the national and provincial level indicators, while for departmental and locality-level indicators, population data based on the 2010 CNPHV continued to be used.
In this regard, given that the National Institute of Statistics and Census of the Argentine Republic (INDEC) does not publish a series that simultaneously contains all the disaggregations used throughout this report (gender, age group, and geographical location at the provincial, departmental, and locality levels), it was necessary to take different series according to the definition of each indicator:
– For the indicators at the national and provincial levels, the series entitled “Population by sex and five-year age groups for the country and provinces as a whole. Years 2010-2040”;
– For the departmental indicators, the series “Estimated population on 1 July of each calendar year by sex, by department” was used;
– finally, given that INDEC does not publish a projection of the evolution over time of the number of inhabitants of each locality, it was necessary to construct the series for the indicators at that level, for which the results of the CNPHV of 2010 were used.
Finally, for the purposes of this report, an “adult” is considered to be a person 15 years of age or older, following the standard used by the World Bank for its financial inclusion indicators.
Regionalization
For the purpose of developing regional indicators, the regionalization criterion proposed by the Ministry of Economy and Public Finance (now the Ministry of Economy) was used, which establishes five regions:
– NOA (Northwest Argentina): Salta, Jujuy, Tucumán, Catamarca and Santiago del Estero.
– NEA (Northeast Argentina): Formosa, Chaco, Misiones and Corrientes.
– Nuevo Cuyo: Mendoza, San Juan, San Luis and La Rioja.
– Patagonia: La Pampa, Neuquén, Río Negro, Chubut, Santa Cruz and Tierra del Fuego.
– Centro and Buenos Aires: Córdoba, Santa Fe, Entre Ríos, Buenos Aires and the Autonomous City of Buenos Aires.
In the text of this IIF, Nuevo Cuyo is mentioned as Cuyo and Center and Buenos Aires as Center.
Physical access points’ reach metrics to their account holders
To construct this indicator, it was analyzed whether, in each locality, the inhabitants have access points (PDAs) of the financial institutions in which they have accounts, located within the same locality. The metric only includes individuals with accounts in financial institutions and is constructed from the person-financial institution pair. In other words, each person is accounted for once for each entity in which they have an account.
The person-financial institution pairs were classified into two groups: those with access to a PDA of that financial institution in their locality and those without access to PDAs belonging to the entities where they have an account. The same person with accounts in more than one entity can be part of both groups.
As an example: 10 people live in the “L1” locality and there are access points for two financial institutions (EF1 and EF2). All the inhabitants have accounts in EF1, EF2 and in a third entity (EF3), which does not have a PDA in L1. The total number of person-financial institution pairs is 30 (10 people × 3 entities). Since only EF1 and EF2 have PDAs in the L1 locality, the reach metric is 66.7% (20 out of 30 pairs).
Finally, it should be noted that the relationship between the locality and the account holders is established from the tax domicile declared in the AFIP register.
Payment accounts at payment service providers
Among the Payment Service Providers (PSPs) that operate in COELSA, there are providers that are registered in the BCRA’s Registry of Payment Service Providers (PSP) and other providers that are not registered64. For the purposes of this report, only payment accounts for vendors that are registered as PSPs that offer payment accounts are counted.
Account activity
The “Activity” series comes from COELSA and identifies whether account holders registered debits or credits in their bank and/or payment accounts within a quarter in each supplier where they have an account. The activity indicator presented in the report counts each person only once. If a person makes transactions from different accounts, either from the same entity or from different entities, it is posted only once.
The series makes it possible to distinguish whether the movement of funds is the result of a debit and/or credit and includes debits and credits made through immediate transfers, payments with online transfers, transactions with checks, direct debits, DEBIN and batch (deferred) transfers, to the extent that they are settled and cleared by COELSA.
Given that the “Activity” series considers the subset of operations in which COELSA is involved, the activity indicators are underestimated. In particular, the indicator does not capture those account holders who operate with a debit card and do not carry out any of the operations settled and cleared by COELSA. Another aspect of the indicator is that debit transactions are, in general, initiated by the PH account holder itself, while credit transactions are originated by a third party (PH or PJ). This distinction has different considerations in terms of financial inclusion, given that in the first case it is an active operation of the PH.
Balances of savings and investment products of individuals (PH)
The savings and investment balances of PHs are classified as follows:
1. Non-interest-bearing liquid balances: include: (i) balances in current accounts and savings accounts denominated in local and foreign currency; and (ii) balances in payment accounts.
2. Interest-bearing liquid balances: include the value of the net worth (PN) of the Mutual Funds (DCFs) subscribed by PH (estimate) denominated in local and foreign currency.
3. Other savings and investment products: include: (i) value of the NP of other Mutual Funds (Other FCIs) subscribed by PH (estimate), which include fixed income funds (bonds), variable income (shares), mixed income, structured, among others65, (ii) balances in fixed terms in pesos and in foreign currency and (iii) product balances in UVA.
To estimate the PN of the DCFs subscribed by PH, the sum of (i) the DCFs exclusive to PH was calculated and, (ii) for those DCFs that may be made up of both PH and PJ in EEFF, the PH was estimated on the basis of weights. The weights were obtained through the calculation of the share of the PH FCIs in the Total FCIs (PH+PJ). Exclusivity was consulted through a survey of the websites and management regulations of the DCFs. On the other hand, to estimate the NP of the other CRFs, the difference between the NP value of the FCIs subscribed by PH (using information published by CAFCI and CNV) and the PN value of the DCF subscribed by PH was calculated.
Individuals with fixed terms and percentage of account holders with fixed terms
The Information Regime for Supervision compiles, on a quarterly basis, the number of holders of fixed terms at the level of financial institution (FI), which include individuals (PH) and companies. To estimate the PH holders of fixed terms for each FI, the number of fixed-term holders was multiplied by the quotient between the number of PH fixed-term certificates with respect to the total certificates, both in pesos and in foreign currency, for each FI66. Then, the estimated amounts for each FI were added and the estimate for the total financial system was obtained, which may contain duplications to the extent that the PHs have fixed terms in more than one FI.
Proportion of payment account holders with balance in Mutual Funds (DCF)
Section “A” of the Information Regime for Payment Service Providers Offering Payment Accounts compiles, on a quarterly basis, the number of payment accounts that have a balance in Mutual Funds (CDF) for each payment service provider (PSP). This series was used to estimate the number of CDF holders for each PSP, since these DCFs only include PH and each account has a single DCFassociated with it 67. Also, it is assumed that each person has only one payment account in each PSP. Then, the quantities corresponding to each PSP are added, whose total may contain duplications to the extent that the PHs have CDFs in more than one PSP. The denominator of this quotient is the number of people who have payment accounts in the PSPs that offer CDFs, which arises from adding the number of account holders in each PSP. In this way, the denominator can have duplications like the numerator.
Real Interest Rate68
For the calculation of the real monthly interest rate, the following formula was applied:
r= [(1+i) / (1+p )] -1
Where: i is the nominal monthly interest rate; p is the inflation rate obtained through the monthly variation of the CPI and r is the real monthly interest rate.
Glossary of abbreviations and acronyms
ACSF Complementary Financial Services Agency
AFIP Federal Administration of Public Revenues
ANDE Uruguay’s National Development Agency
ARG Argentina
ATM ATM
BaaS Banking-as-a-Service
BCRA Central Bank of the Argentine Republic
BCB Central Bank of Brazil
BIS Bank for International Settlements
BP Payment Button
ByMA Argentine Stock Exchanges and Markets
CABA Autonomous City of Buenos Aires
YOU FALL Argentine Chamber of Extrabank Tax and Services Collection Companies
CAFCI Argentine Chamber of Mutual Funds
CBU Uniform Bank Code
CENDEU Central Bank of Debtors of the Financial System
CGAP Consultative Group to Assist the Poor
CNBV National Banking and Securities Commission of Mexico
CNE National Economic Census
CNPHV National Census of Population, Households and Housing
NVC National Securities Commission
COELSA Electronic Clearing House
CPD Deferred payment check
CVU Uniform virtual key
DEBIN Immediate debit
Der Law
EEFF Financial Institutions
EF Financial Institution
ENACOM National Communications Entity
EPH Permanent Household Survey
ETCNB Non-Bank Credit Card Issuers
E Companies and organizations
FAS Financial Access Survey
CDF Direct Pool Fund
FCD-PH Pool of Money of Human Persons
FCEM Electronic Credit Invoices for MSMEs
FCI Mutual Fund
FF Financial Trust
FGP Public guarantee funds
IMF International Monetary Fund
FOGAR Argentine Guarantee Fund
GPFI Global Partnership for Financial Inclusion
HB Home banking or internet banking
year-on-year i.a
IIF Financial Inclusion Report
INEGI National Institute of Statistics and Geography of Mexico
CPI Consumer Price Index
IPD Digital public infrastructure
LAC Latin America and the Caribbean
LFIP Financing Line for Productive Investment
M Miles
MAV Mercado Argentino de Valores S.A
MB Mobile Banking
Billion Millions
MINCIT Ministry of Commerce, Industry and Tourism of Colombia
MSMEs Micro, Small and Medium Enterprises.
MPE Electronic Payment Methods
MPOS Mobile Device at Point of Sale
MTESS Ministry of Labour, Employment and Social Security
NEA Northeast Argentina
NOA Northwest Argentina
OECD Organization for Economic Co-operation and Development
ON Negotiable Obligation
OPNFC Other Non-Financial Credit Providers
PCT Transfer payments
PDA Access Points
FAQ Fixed Term
PH Human Person
PI Immediate Payments
GDP Gross Domestic Product
PJ Legal Entity
PN Net Worth
POS Point of Sale Device
p.p Percentage points
PSP Payment Service Providers
QR Quick Response code
Shadow Fiend Financial system
CIDER Brazil’s IBGE Automatic Recovery System
YES Chilean Internal Revenue Service
SIPA Argentine Integrated Pension System
NFPS Non-financial private sector
SGR Mutual Guarantee Companies
SUC Branch
TAS Self-service terminal
TVI Year-on-year rate of change
UNESCO United Nations Educational, Scientific and Cultural Organization
UVA Purchasing Value Units
References
1 In Brazil, with 41% of debtors compared to the adult population, domestic credit to the private sector represented 72% of GDP. In Sweden and Spain, with access to financing of 49% and 52%, respectively, the credit-to-GDP ratio stood at 128% and 78%, in each case. Source: Global Findex (2021) and World Bank (2023).
2 Close to 53 operations per month per inhabitant in Brazil (2024), the United States (2023) and Sweden (2023), while in Argentina 23 electronic payments were made per inhabitant per month in 2024.
3 INDEC, Macroeconomic Aggregates, Seasonally Adjusted Quarterly Series of Global Supply and Demand. Years 2004-2024.
4 INDEC. Labor market. Socioeconomic Rates and Indicators (EPH), Fourth Quarter of 2024.
5 INDEC. Wage index.
6 Financial service access points include branches, mobile branches, automated teller machines (ATMs), self-service kiosks (TAS) and complementary financial services agencies (ACSFs) and ATMs operated by non-financial institutions.
7 The series of PDAs is provisional. A financial institution is reviewing the information uploaded to the Information Regime of Service Units (RIUS), which could impact the historical values of both ACSF and PDA.
8 To construct this indicator, it was analyzed whether, in each locality, the inhabitants have access points (PDAs) of the financial institutions in which they have accounts, located within the same locality. The metric only includes individuals with accounts in financial institutions and is constructed from the person-financial institution pair. In other words, each person is accounted for once for each entity in which they have an account. The person-financial institution pairs were classified into two groups: those with access to a PDA in their locality and those without. The same person with accounts in two entities can be part of both groups.
9 In this specific year, the possibility for a customer of one financial institution to use the ATM of another institution is not contemplated. In the case of the type of ATM PDA, account holders can carry out transactions using ATMs of other entities.
10 The percentage of the adult population with an account shows a value of 101% in December 2024. For more explanation, see Methodological Note.
11 Communication A 8180. Point 3.
12 Communication A 8180. Point 1.
13 Communication A 8180. Point 2.
14 The indicator does not capture those account holders who operate with a debit card and do not carry out any of the transactions settled and cleared by COELSA as transfers to or from payment accounts. For more detail, see Methodological Note.
15 In the fourth quarter of 2023, the use of the internet and cell phones for people between 18 and 29 years of age reached 96.7% and 98% respectively, for people between 30 and 64 years of age these values were 93.2% and 97.5%. On the other hand, for people over 64 years of age, the use of the internet and cell phones was 69.9% and 81%. See Report on Access and Use of Information and Communication Technologies. EPH, fourth quarter of 2023. INDEC.
16 Internet Access Report, INDEC.
17 Report on Access and Use of Information and Communication Technologies. EPH, fourth quarter of 2023. INDEC.
20 Communication A 8181, point 2 incorporated the opening of savings banks in foreign currency (dollar, euro, yuan, renminbi and others) in accounts intended for adolescent minors.
21 General Resolution 1023/2024, CNV.
22 Communication A 8181. Point 3.
23 UNESCO, Institute for Information Technologies in Education. Digital Natives: How do they learn? How to teach them?
24 The figures presented in this section are subject to revision and possible corrections that could affect some analyses.
25 Communication A 8006, Communication A 8162, Communication A 8180.
26Electronic payments are composed of: (1) Instant payments: (i) Transfers: includes interbank transfers and to and/or to a payment account and does not include transfers between payment accounts of the same payment service provider (PSP) or within the same financial institution; (ii) PCT: includes payments with interoperable transfers and does not include payments with transfer between the same PSP; (2) Cards: debit, credit and prepaid; and (3) Immediate Debits and Direct Debits.
27 For reference, Brazil recorded, on average, 65 monthly electronic payments per adult during the second quarter of 2024 (Central Bank of Brazil (BCB). With data available as of 2023, economies such as the United States and Sweden presented about 53 electronic payments per inhabitant and others such as Mexico from India, around 9. By that year (2023), Argentina had registered 24. electronic payments per inhabitant (BIS data portal).
28 The amounts in this section are expressed at constant December 2024 prices (CPI December 2024 = 100).
29 Cash withdrawals are usually to approximate the use of cash in payments. IMF “Measurement and Use of Cash by Half the World’s Population”, 2023.
30 Other factors, such as people’s real income level, can have an impact on this dynamic.
31 The QR code enables payment through various electronic instruments such as debit card, debit card and credit card. The amount of credit card and debit card may be underestimated.
32 CACE. Annual summary 2024.
35 The amounts in this section are expressed at constant December 2024 prices (CPI December-24 = 100). The savings and investment balances of the PHs include products in local and foreign currency. Balances in foreign currency are expressed in pesos and valued at the BCRA reference exchange rate (Com. A 3500) on the last business day of each month.
36 (i) Non-interest-bearing liquid balances: includes balances in accounts (bank and payment); (ii) Interest-bearing liquid balances: include Cash Pools (DCFs); (iii) Other savings and investment products: these include fixed terms, UVA products and other Mutual Funds.
37 There is a growing number of EEFF and PSPs that allow payments to be made immediately, using directly balances invested in DCFs.
38 It refers to the fact that the EEFF designed the instrument and, through the management regulations, established the terms and conditions. The same criterion applies to capital market agents.
39 The number of PH holders of fixed terms is an estimate and the calculation does not yield single holders, since holders may have fixed terms in more than one FI. For more detail, see Methodological Note.
40 Monthly Monetary Report. February 2025.
41 Throughout this document, the metrics consolidate unique debtors within the group of suppliers that they take as a reference. Duplication caused by multiple funding lines within the same provider and by funding across different providers in the same analysis group is eliminated. On the other hand, the amounts in this section are expressed at constant prices of December 2024 (CPI December-24 = 100).
42 Extended financial system (SFA) includes the financing of EEFF and/or PNFC. The latter lend with their own capital and must meet minimum requirements such as registration, sending of information and user protection.
43 As of July 2024, financial institutions and other reporters began to report to the BCRA’s Debtors Center people with a debt balance of $25 thousand, instead of $1 thousand as was the case until June 2024. Given this change in the information base, a large part of the analyses in this section are carried out with respect to July 2024 in order to compare the actual movements in the credit market (Communication A 8001).
44 EEFF only: financing only in EEFF (and not in PNFC, although they can register debt in financial trusts -FF-). PNFC only: financing only in PNFC (and not in EEFF, although they can register debt in FF). EEFF and PNFC: simultaneous financing in EEFF and PNFC (although they can register debt in FF). Remainder: debt only in FF. With the available data, it is not possible to determine whether the debt included in the FF originated in EEFF or PNFC. For this reason, the information of the debtors who only registered debt in FF as “Remainder” is presented and the debtors who registered debt in FF and EEFF to “EEFF Only”, those who registered debt in FF and PNFC to “PNFC Only” and those who registered debt in FF, EEFF and PNFC to “EEFF and PNFC” are added.
45 The amounts in this section are expressed at constant December 2024 prices (CPI December 2024 = 100).
46 These groups concentrate debtors with a relatively low average balance per person, unlike those who have exclusive financing in EEFF. In the case of PNFCs, the proportion of debtors to the adult population fell from 14.9% in June to 10% in July 2024 and, in the case of adults with simultaneous debt in PNFC and EEFF, the ratio fell from 15.4% to 12.6%. However, in the case of exclusive financing in EEFF, the ratio fell slightly from 23.8% to 23.5%.
47 Index of patents. INDEC. IV quarter of 2024.
48 As of December 2024, 47.7% of PNFC debtors had financing from digital providers, while 95.8% did so from non-digital providers. In the case of the EEFF, 9.9% of debtors have financing from digital suppliers, compared to 69.2% who did so through non-digital suppliers. Digital providers are considered to be those that operate 100% digitally, while non-digital providers combine face-to-face and digital channels, in different proportions.
49 Financial inclusion report. First half of 2023.
50 “MSMEs” are those individuals or legal entities that have an MSME certificate.
51 It is estimated that around 30% of them were MSMEs employers, that is, they had at least 1 employee. (Statistics on SMEs, Entrepreneurs and the Knowledge Economy).
52 See Footnote 43.
53 Except for the medium size where the maximum of the last 4 years is $11.6 trillion constant pesos.
54Since April 2024, the BCRA implemented a new credit incentive scheme for MSMEs, called the Minimum MSME Quota (Com. A 7983), which replaced the Financing Line for Productive Investment. The main difference is that the new scheme is voluntary, while the previous one was mandatory. In addition, as of 01.01.25, the deduction of the minimum cash reserve for customers not reported in the CENDEU, including MSMEs (Com. A 8159), was eliminated.
55 The theoretical maximum turnover for each size and sector of MSMEs is calculated based on the billing ceilings established for the issuance of the MSME Certificate at any given time.
56 Comparative list of UVA Mortgage Loans for Housing.
57 The calculation of new debtors identifies those who did not have a balance in mortgage loans in December of the previous year and do have it the following year (for example, a new debtor in June 2023, necessarily do not have a mortgage credit in December 2022).
58 The Global Findex Database 2021: Financial Inclusion, Digital Payments, and Resilience in the Age of COVID-19, asks: Has an outstanding housing loan (% age 15+), data from 2017.
59 As a reference, in December 2016, 0.6% of the adult population had mortgage financing, while in March 2019 that value stood at 0.7%.
60 National Census of Population, Households and Housing 2022, INDEC.
61 See Sinai Todd and N. Souleles (2003). Owner-Occupied Housing as a Hedge Against Rent Risk NBER Working Paper No. 9462, January.
62 Approximate by the possession of a salary account. Source: BCRA.
63 Data as of the third quarter of 2024. Source: INDEC.
64 TO Payment Service Providers.
65 See Glossary, CAFCI.
66 Information Regime for Supervision. Codes 999705, 999706, 889901 and 889902 – Number of forward transactions.
67 Information Regime payment service providers that offer payment accounts. Code 30000.
Share on


