Executive summary
Total access points increased by 5.8% during 2019 | The financial system registered 30,726 access points (PDAs) as of December 2019. A predominance of electronic devices is observed, contributing 82% among ATMs and self-service terminals. Complementary financial services agencies (ACSFs) accounted for 0.2% of the total number of PDAs with 54 units distributed in the interior of the country.
There is a marked disparity in the distribution of FLW between provinces and between the departments that compose them | As of December 2019, 41.9% of the localities had at least one FLW and concentrated 91.3% of the adult population. Considering the adult population by locality, there is a decrease in the coverage index as the number of inhabitants decreases: only 22% of localities with less than 2,000 adult inhabitants had at least one PDA.
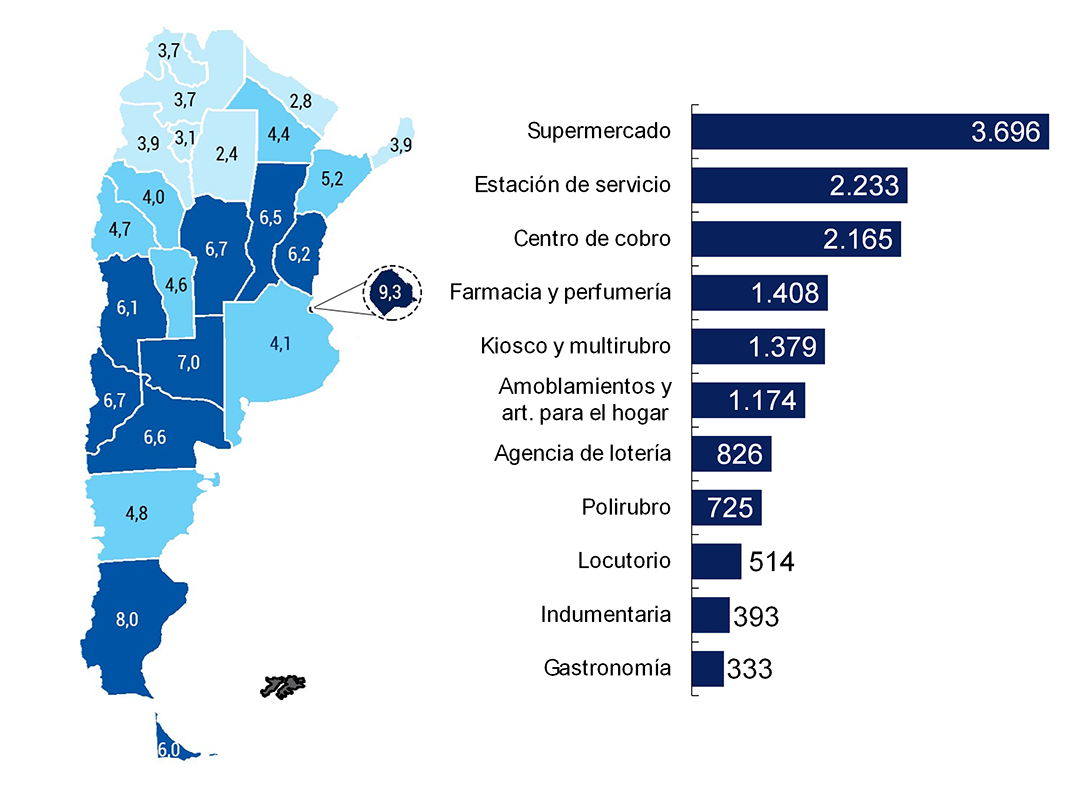
Extra-bank withdrawal points equated to ATMs | These points demonstrate a provincial distribution similar to that of the PDAs, with 65% concentrated between CABA, Buenos Aires, Córdoba and Santa Fe. The main items identified are supermarkets (21% of the total), service stations (13%) and pharmacy and perfumery stores (8%), while bill collection and service centers comprise 13% of the points.
Over the last decade, there has been an average year-on-year growth of about 8% in the number of deposit accounts in pesos per 10,000 adults | On average, 1.4 deposit accounts in pesos were registered per adult as of December 2019; 64% of them are associated with the receipt of some kind of periodic accreditation – salaries, retirements, pensions and social programs. On the other hand, 66% of deposit accounts registered a very low average monthly balance (less than $3,000), which would indicate the low use of deposit accounts for both transactional and passive savings purposes.
The number of fixed-term deposits in pesos per 100 deposit accounts in pesos has remained constant for a decade | This metric stood at 6 fixed terms in pesos for every 100 deposit accounts in pesos as of December 2019, a value around which it oscillated during the last ten years. This number reflects that only a small proportion of peso deposit account holders use fixed-term deposits as a savings instrument.
Electronic means of payment continued their growth path | Debit, credit and prepaid card purchases and electronic transfers registered increases relative to the population in recent years, despite the absence of growth in economic activity. In 2019, for every 100 cash withdrawals per adult, almost twice as many transactions were carried out by electronic means of payment.
The geographical distribution of fixed-term balances per adult has been extremely heterogeneous over the last decade | CABA, the district with the highest figures over time, exceeded each of the provinces of the NOA and NEA by at least 3 times as of December 2019. Likewise, while CABA presented a 13% drop in real terms over the last decade, Formosa (NEA) and Catamarca (NOA) registered a growth of 89% and 67%, respectively.
Half of the adult population had at least one funding as of September 2019 | Discrimination against this value indicates that 37% of adults had at least one financing granted by financial institutions. Considering an expanded financial system (SFA), which includes non-bank credit and/or purchase card issuers (ETCNBs) and other non-financial credit providers (NPPOCs), that figure rises to 49%. This access to credit is not homogeneous between men and women, with a gender gap to the detriment of women for the percentage of adults who access financing (5.8 p.p. in the SFA).
There is a disparity in the population with financing by region of the country | The NEA (40%), NOA (44%) and Cuyo (45%) regions were, in general, below the national average, while Patagonia (52%) and the Central region (51%) were above the national average.
The number of individuals with debt in an irregular situation increased | 74% of the SFA’s debtors were in a regular situation as of September 2019, i.e. they were able to adequately meet all their financial commitments. The reduction of 4 p.p. in the indicator during the previous 24 months is noteworthy. The disaggregation of this indicator according to the gender of the debtors denotes a difference in the repayment behavior of men and women, with women registering a higher percentage of debtors in a regular situation than men (75.7% vs. 72.4%).
Access to credit for MSMEs has steadily improved over the last decade | To a greater or lesser extent depending on the sector, size and region, the proportion of MSMEs with financing increased year after year. In the case of microenterprises, which represent 84% of all companies, the proportion increased from 38% to 53% from December 2007 to December 2018 in the case of those incorporated as legal entities and from 61% to 81% in the case of individuals who carry out a business activity.
Indicator Table | Financial inclusion in Argentina
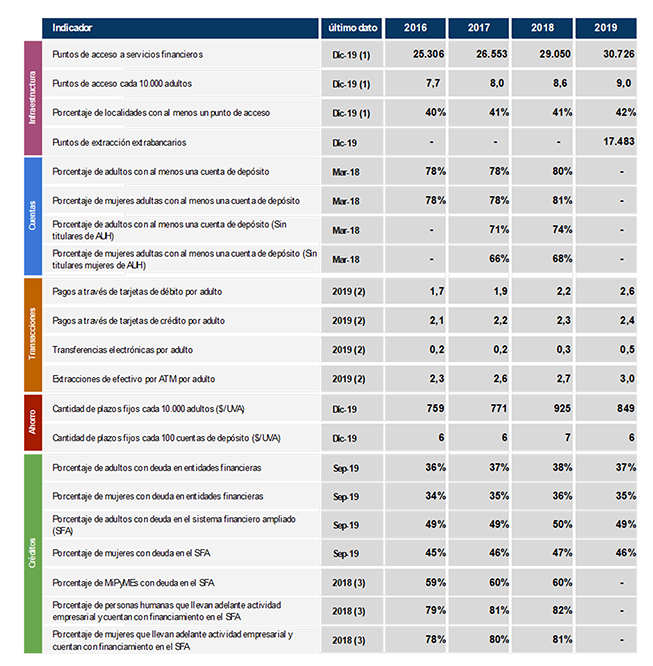
Notes:
(1) This includes access points for financial institutions (branches, mobile branches, ATMs, self-service terminals and complementary financial services agencies) and ATMs operated by non-financial institutions.
(2) Monthly average for each year.
(3) Data corresponding to companies incorporated as legal entities with financing during any month of 2018.
Local context
The integration of all households and businesses into financial services is a necessary step towards achieving a more equitable financial system. For this reason, the BCRA is implementing an active agenda for financial inclusion, understood as a key aspect to achieve social inclusion, prioritizing access to and use of financial services for the most vulnerable sectors.
Access to a bank account is presented as the first of a series of steps to consider the financial inclusion of an individual or company. Having a bank account allows access to financial services such as fund transfers, service payments, savings instruments and access to electronic channels such as internet banking and mobile banking.
For those who do not have a bank account, in January 2020 the Universal Free Account (CGU) that had been discontinued in 2016 was restored. This bank account is opened with the sole presentation of the DNI, it has no opening or maintenance cost, and all banks must offer it and open it at the request of unbanked people.
Another key aspect of financial inclusion lies in the use of savings products by individuals and companies. Saving allows the population, in general, to face unforeseen expenses or emergencies, plan the purchase of goods and services in the future and make investments to generate more wealth.
The low proportion of people who save in the financial system is observed in different segments of the population and is reflected in the intensity of use of instruments such as fixed-term loans. Since 2010, the number of fixed terms per 100 deposit accounts – both in pesos – has not changed greatly, going from 5 fixed terms in 2010 to 6 in December 20191.
To encourage savings in domestic currency, in January of this year a fixed-term alternative in UVA2 was promoted, guaranteeing a yield above the evolution of the consumer price index of at least 1%. Its minimum incorporation period is 90 days, but you can opt for early cancellation from 30 days after hiring. A significant proportion of the balance of fixed terms in the non-financial private sector is denominated in pesos and UVA (81% as of December 20193) and does not have the option of early cancellation.
In terms of credit, the financial system has pending challenges in the access of individuals and micro, small and medium-sized enterprises (MSMEs), which present asymmetries at the geographical level and company size. Four out of 10 adults4 own at least one credit product in financial institutions. This number rises to 5 out of 10, if non-financial credit providers who report their debtors to the BCRAare included 5. This indicator is mainly explained by the possession of credit cards (38% of the adult population), with access to medium and long-term instruments being extremely low (1.3% for pledge loans and 0.7% for mortgages)6.
At the gender level, access to credit products presents a gap to the detriment of women of 5.8 percentage points (p.p.) of difference in the percentage of adults with a product for each gender, while at the geographical level, the provinces located above the national average in terms of access to financing (49%) are located within the Central and Patagonian regions. while the NOA, NEA and Cuyo are several percentage points below.
Likewise, the adverse macroeconomic conditions in which the economy operated, and in particular the persistence of high interest rates in a context of contraction in activity, were reflected in the proportion of individuals and companies with financing in an irregular situation. In this sense, of the total number of individuals with access to credit, the proportion of those in an irregular situation increased by 4 p.p. between September 2017 and the same month in 2019. For its part, in the last two years, the proportion of companies with debt in an irregular situation grew by around 3 p.p. for all company sizes.
In this context, the BCRA relaxed the regulatory conditions to encourage credit to families through the AHORA 127 Program, which makes it possible to purchase goods in fixed installments without interest through bank credit cards, and modified limits on the annual nominal interest rate for financing through credit cards8 banking and non-banking. Both measures seek to boost the recovery of consumer credit and protect the most vulnerable sectors.
In addition, to avoid abusive practices and promote greater financial inclusion, the prohibition of using interbank direct debit for loan collection was prohibited, which was designed as a voluntary and reversible payment tool9. From this measure, the interbank debit linked to new loans can be processed through the so-called “spot DEBIN”, a mechanism that requires the express authorization of the receiving customer prior to making each debit.
The financing of productive and business activity, in which companies registered as individuals (PH companies) and others as legal entities (PJ companies) participate, raises the need to generate more equitable access with respect to the size of the production unit. In the case of PJ companies, half of the microenterprises have taken financing during 2018, while large companies did so almost in their entirety. This situation is more balanced in the case of PH companies, although the weight of financing in the financial system is substantially lower than that registered by PJ companies (10% vs. 90%). In line with the aforementioned measures for individuals, the BCRA readjusted the regulatory conditions to encourage financing to MSMEs at a fixed interest rate of less than 35% per year10.
In terms of protection for users of financial services, new regulations were established for payment service providers (PSPs): (1) the funds of customers credited to payment accounts must be in demand accounts, in pesos, in financial institutions in the country and, at all times, immediately available upon request and (2) customers may apply the balances of payment accounts in common funds of money and the PSP must report the balances invested separately from the rest of the funds.
Although this type of payment accounts could contribute to the financial inclusion of the population, when combined with investment instruments and little information about the associated risks, it can lead to unexpected results for the user in the face of falls in the profitability of mutual funds.
Responses to Financial Inclusion Challenges in the Context of the Health
EmergencyIn the context of the health emergency affecting the world’s population, the BCRA has issued a set of regulations aimed at mitigating the impact of the economic crisis as a result of the Coronavirus COVID-19 pandemic. These measures aim to ensure that the financial system can provide more support to both companies and families and that the payment chain does not suffer. The most relevant measures from the perspective of financial inclusion are mentioned, which are explained in greater detail in the Regulatory Annex.
In line with the mandatory quarantine ordered by the National Executive Branch, branches remained closed to the public, and financial institutions must continue to provide services to users remotely11. By way of exception, branches were opened for the payment of social security and pensions and social assistance benefits, plans or programs12. Subsequently, the branches opened to the general public, with limitations on operations and through a shift system to avoid the agglomeration of people in the branches.
In the case of companies, the measures promoted the offer of financing lines to MSMEs at low cost (maximum annual interest rate of 24%) applied to working capital. Subsequently, the incentives for these lines were increased when the funds are intended for the payment of salaries to employees13. The National State, through the Argentine Guarantee Fund (FoGar), made available a fund to guarantee MSME working capital loans, for up to 100% in the cases of micro and small enterprises and monotributistas of all categories; and 25% in the cases of medium-sized companies section 1 and 214.
In the case of individuals, incentives were increased for financial institutions to allocate financing to the AHORA 12 Program in order to meet the consumption of families and the suspension of charges and commissions for operations carried out through all ATMs15 was established. In relation to credit card maturities, it was determined that: (1) the unpaid balances of credits granted by financial institutions, whose installments are due between 01.04 and 30.06, do not accrue punitive interest, and (2) their cancellation is made once the mandatory quarantine is over, without any surcharge and with a financing rate not exceeding 49%16. Subsequently, a reduction to 43% of the maximum annual nominal rate for compensatory interest that financial institutions can receive for balances financed in credit cards was ordered. Likewise, they must automatically refinance the unpaid balances of credit cards with a one-year term with a 3-month grace period and 9 monthly installments, equal and consecutive to said rate.
For both individuals and companies, the parameters with which bank debtors are classified were temporarily made more flexible. The current classification system takes into account, among other variables, the number of days of arrears of each debtor. Until September 2020, a period of 60 days will be added to the classification of each debtor for each category, allowing the difficulties caused by the crisis in various branches of economic activity to be contemplated17.
1. Physical infrastructure
Physical infrastructure plays a fundamental role in the access of people and companies to the financial system, providing face-to-face and electronic service channels for carrying out operations. These points perform different functions, such as making payments, withdrawals or transfers, channeling savings through different investment instruments or applying for a loan, among others.
In a large territory such as Argentina, the geographical coverage of financial services poses an additional challenge. It is not only relevant to analyze infrastructure indicators in relation to population, but also to observe what happens at the level of different administrative or territorial units. In this sense, access points can be analyzed within the perimeter of a province or department or according to an area that does not obey a political division but, on the contrary, that verifies certain particular socioeconomic characteristics. Following international guidelines, Financial Services Access Points (PDAs) are defined as any physical entity where a person can carry out their deposit or withdrawal operations with a financial institution.
In our country, PDAs are made up of bank branches (including mobile branches),18 ATMs, self-service terminals (TAS) and complementary financial services agencies (ACSFs, known in the literature as banking correspondents).
As of December 2019, the financial system registered 30,726 PDAs nationwide, showing a growth of 5.8% compared to the same month in 2018. As for the distribution among the different types of PDAs, 57.3% corresponded to ATMs, 24.9% to TAS, 17.3% to branches and 0.4% to mobile branches. The ACSFs, whose figure was incorporated into the local regulation in November 2018, did not present a significant contribution, having reached only 54 units (0.2% of the total). The sustained growth of FLW, which outpaces population growth, shows an improvement in the availability of FLW by the financial system.
The distribution shows a predominance of electronic devices over PDAs that imply greater physical and human infrastructure requirements for their operation, a trend that is observed globally. In general, electronic devices are located inside branches (74% for ATMs and 99% for TAS), while the remaining part are installed in other locations, such as supermarkets, service stations or shopping centers. It should be noted that the latter allow for greater decentralization of the ADPs, helping to increase geographical coverage and improving the population’s access to financial services.
The evolution of FLW shows an upward trend, with an average year-on-year growth of 6.7% in the last three years. At the individual level, ATMs are the type of PDA that shows the greatest increase (8.6% year-on-year average -p.i.), followed by TAS (7.2% p.i.) and, finally, branches, with very little significant growth (0.5% p.i.). In other countries in the region (and globally as well), the low growth of branches is associated with several factors, such as the significant growth in the number of banking correspondents and the remote or electronic provision of financial services.
Figure 1.1 | Number of FLDs by type and annual growth
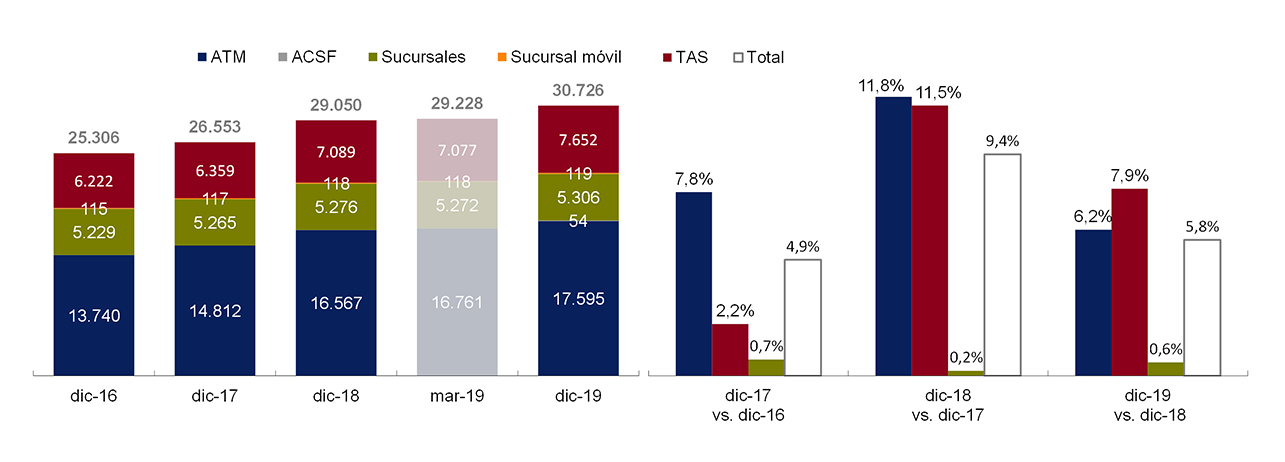
Source | BCRA and networks.
As mentioned above, the absolute amount of ACSF is still low and, although regulation allows financial institutions to delegate to them all the activities they carry out with their customers, only a third allow transactional operations such as cash withdrawals and the collection of taxes and services, thus reducing the potential impact in terms of financial inclusion. A positive aspect is that all the ACSFs are located outside CABA and Buenos Aires, feeding more PDAs to the interior of the country.
At the provincial level, 48% of the ADPs were concentrated in CABA and Buenos Aires, which shows marked differences in their geographical distribution. Among other factors, these disparities are associated with the distribution of the population, since districts with a greater number of adults would tend to have a greater amount of FLW. Thus, for the purposes of making a more accurate comparison between jurisdictions, it is necessary to take into account the number of inhabitants of each one.
As of December 2019, Argentina had 9 PDAs per 10,000 adults, with CABA being the jurisdiction with the best performance (22.3), while Tierra del Fuego, despite being the province with the lowest absolute number of PDAs, was in second place (14.7). Additionally, it is observed that all the provinces that make up Patagonia19 exhibited values above the national average, while the provinces of the NEA and the NOA presented a behavior below the average for this indicator. Compared to the previous report (data as of March 2019), improvements are evident in all provinces, with Neuquén and La Rioja presenting a greater increase in FLW per 10,000 adults, with increases of 1.3 and 1 FLW per 10,000 adults, respectively.
Figure 1.2 | Distribution by province of FLW and ADP per 10,000 adults
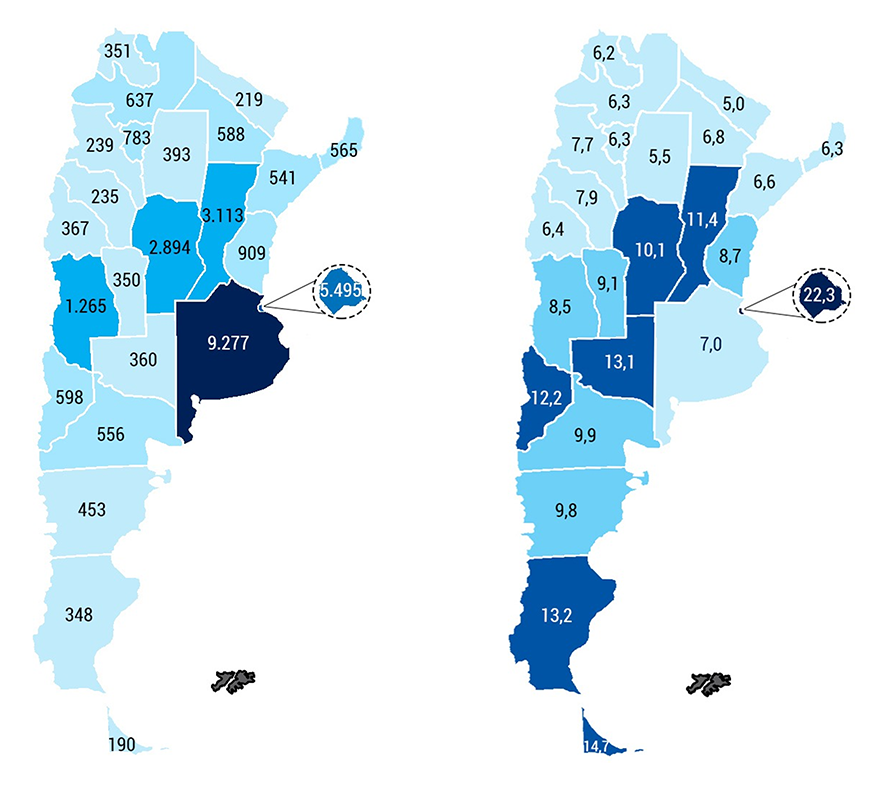
Note | Data as of December 2019.
Source | BCRA, networks and INDEC.
Just as there is a marked disparity in the distribution of FLW between provinces, the same phenomenon is recorded within each one, with clear differences between the levels of FLW in the departments that compose them. As an example, the province of Buenos Aires agglomerates districts such as San Isidro or Vicente López with 19.2 and 18.3 PDA per 10,000 adults, respectively, which more than double the national indicator, and others such as Florencio Varela or José C. Paz with 3 and 2.3 PDA per 10,000 adults, respectively, with a third or less of the national value. These disparities between departments or parties are observed in all Argentine provinces.
In relation to FLW coverage, 41.9% of Argentine localities had at least one FLW as of December 2019, showing a small improvement in recent years, from 39.6% in December 2016. However, while the percentage of localities covered may seem low, it is appropriate to consider the population of each locality in order to determine the percentage of the population that has access to a PDA in the locality in which it resides. In this sense, as of December 2019, it is observed that 91.3% of the adult population lived in a locality that had at least one FLW, while the remaining population lived in rural areas (5.8% of the total adult population) or in localities without ADP (2.9%).
Along the same lines, considering the number of adults living in each locality, it is possible to segment the localities to perform a more precise analysis of PDA coverage. Thus, as of December 2019, all adults living in towns with more than 50 thousand adult inhabitants had at least one PDA in their locality. As the number of inhabitants is reduced, a decrease in the coverage index is observed. This is accentuated for localities with less than 2 thousand adult inhabitants, given that only 22% had at least one PDA, leading to only 43% of adults living in localities of this population size having at least one PDA in their locality.
The same analysis can be done to identify those localities that have at least one bank branch, which is the type of PDA that offers bank customers the most complete range of services. This analysis is particularly useful to determine the quality of coverage, since there are localities whose only PDA is an ATM in which to carry out certain operations (apply for a loan, for example) residents must move to another locality that has a branch.
Figure 1.3 | Coverage of localities by at least one PDA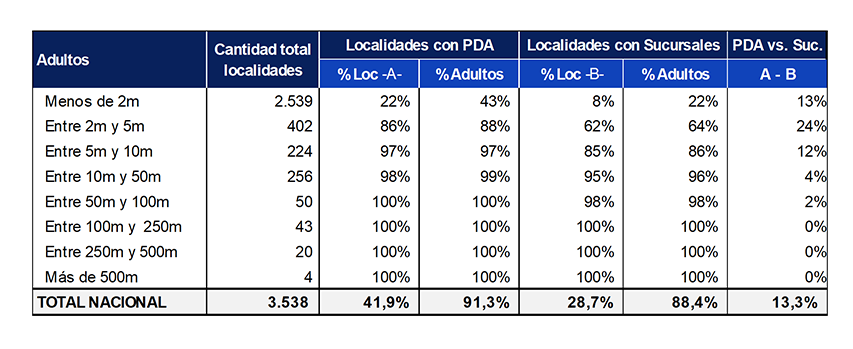
Note | m = thousand. The national population also considers the dispersed rural population.
Source | BCRA, networks and INDEC.
Branch coverage is relatively lower, considering that 28.7% of the country’s localities had at least one bank branch in December 2019 compared to 41.9% if we consider all types of PDAs. The difference between the two indicators indicates that 13.3% of the localities are covered by a type of PDA other than bank branches. They obtain their coverage mainly through ATMs installed outside bank branches and, to a lesser extent, mobile branches.
In addition to bank access points, there are other types of points in our country where the population can exclusively make cash withdrawals. These extra-bank withdrawal points include businesses such as supermarkets, pharmacies, service stations, among others, and extra-bank collection networks that offer the cash withdrawal service. Through the use of debit cards, customers can get cash that is debited from their bank account.
A survey carried out by the BCRA indicates that as of December 2019, a total of 17,483 non-bank withdrawal points were registered nationwide, with a notable growth in this type of points in recent years. The provincial distribution of non-bank withdrawal points is similar to that of the PDAs, with 44% concentrated between CABA and Buenos Aires and 65% considering Córdoba and Santa Fe.
The main items identified are supermarkets (21% of the total points), service stations (13%) and pharmacy and perfumery stores (8%). On the other hand, the collection centres for invoices and services comprise 13% of the extra-bank withdrawal points20. Although the non-bank withdrawal points do not offer the variety of financial services associated with the PDAs of the financial system, these extra-bank points are equivalent to the total number of operational ATMs, thus improving the population’s access to cash and contributing to financial inclusion.
Figure 1.4 | Number of non-bank withdrawal points per 10,000 adults and by main items
Note | Data as of December 2019. The breakdown by item shows the main items identified, but does not cover all the points.
Source | BCRA survey based on data from Mastercard, Cabal, Visa, Rapipago, Pagofácil, Plus Pagos, Pago24 and Bica Ágil.
2. Deposit accounts and payment and savings methods
Bank accounts provide a secure way to store money and manage expenses and income, making it easy to pay for utilities, send and receive funds, build savings, and access credit. In Argentina, 80% of the adult population had at least one bank account as of March 2018, without any gender gap. The figure drops to 74% if the number of holders who receive the Universal Child Allowance (AUH), one of the main social assistance programs in our country, is subtracted. In this case, there is a gap of 11.5 p.p. to the detriment of women, given the high proportion of women in the AUH benefit (97%).
One of the most common uses of an account is to make payments. Electronic means of payment facilitate transactions for the population and, at the same time, contribute to reducing the use of cash. In each of the metrics of electronic means of payment in Argentina – purchases with debit, credit and prepaid cards and electronic transfers – there were increases relative to the population during the last time, despite the fact that economic activity has stagnated or fallen in the last five years. Thus, in 2019, for every 100 cash withdrawals per adult, almost twice as many transactions were carried out by electronic means of payment.
Accounts provide a way to generate savings for the future, although not the only way. Savings are the part of income that is not used for consumption and is intended to face unforeseen expenses or emergencies, buy goods and services in the future, and make investments to generate more wealth. According to the Survey for the Measurement of Financial Capabilities carried out in Argentina in 2017, approximately 1 in 3 people had saved money in the previous year, being more common in men (32%) than in women (26%). In the case of active savings, the use of fixed-term deposits (hereinafter, fixed-term) as a savings instrument was low in proportion to the number of deposit accounts in our country (6 fixed-term deposits per 100 deposit accounts, both in local currency), a ratio that remained practically constant over the last decade. which indicates that only a small number of deposit account holders would use this savings instrument.
2.1. Deposit
accounts In order to promote access to financial services by the population, the BCRA makes different types of bank accounts available. A bank account is a contract between the customer and the bank where the holder deposits an amount of money and the bank undertakes to safeguard it, in order to be able to use the money deposited for different purposes and at any time. In general, bank accounts are set up as checking accounts or deposit accounts, such as savings banks or salary accounts.
Current accounts are characterized by the possibility of withdrawing funds when you do not have enough balance. To do this, the holder must agree with the financial institution on a line of credit called an overdraft. On the other hand, deposit accounts in pesos have no opening or maintenance cost and the holder is granted a debit card free of charge. These accounts do not allow you to use more money than the one deposited and do not involve the provision of credit cards, although this product can be contracted additionally. All operations carried out with these accounts both remotely – through home banking, mobile banking or another channel – and those carried out at the branches of the financial institution that opened the account, whether by ATM, self-service terminal (TAS) or counter, have no cost for the account holder.
Deposit accounts in pesos are intended only for individuals and are made up of savings banks, salary accounts, social security accounts (hereinafter, pension accounts) and the recently relaunched Universal Free Account (CGU). There are also other types of deposit accounts, used for specific purposes, such as savings banks for the payment of social assistance plans or programs, among others.
Figure 2.1 | Basic Deposit Account Operations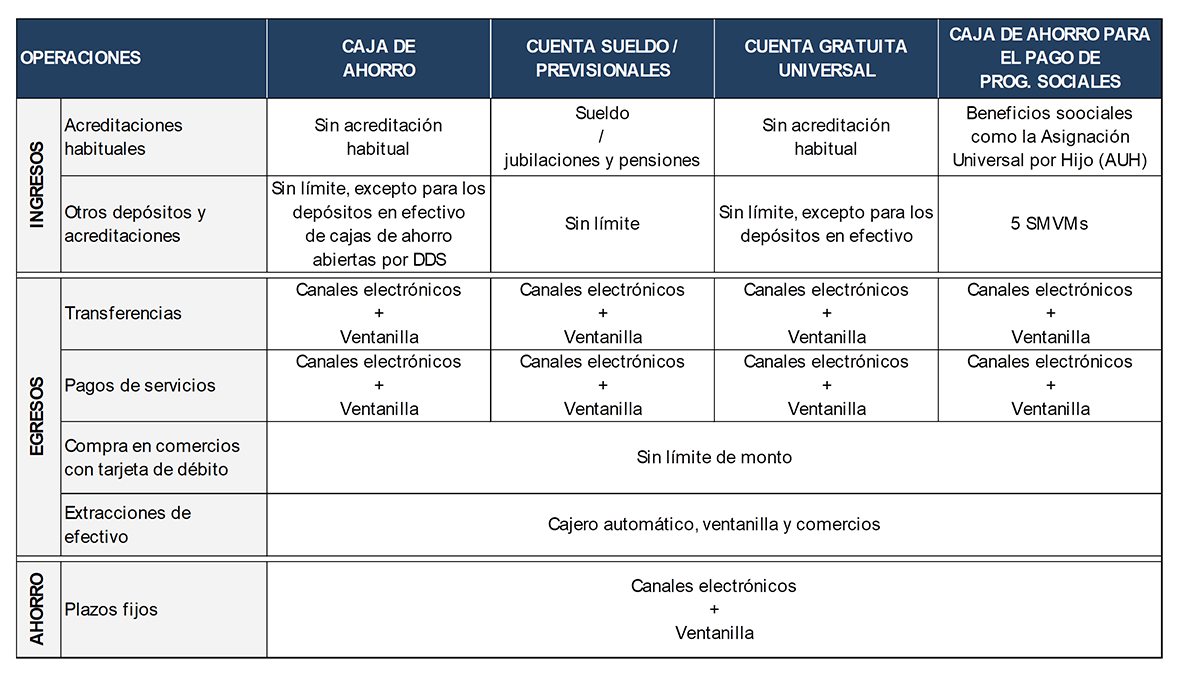
Note | “DDS” stands for Simplified Due Diligence. For more details about the accounts, inquire about the following explanatory contents: CGU, salary account, pension accounts.
Source | BCRA.
The CGU21 was relaunched in order to advance in the full banking penetration of the population, especially the most vulnerable sectors. This account is available to all those who do not have another bank account in the financial system and its opening only requires the presentation of the DNI. This account admits all types of accreditations, including those originated in the sale of goods and services through the “Food Card” within the framework of the “Argentina Plan against Hunger”.
Deposit accounts share the largest number of basic transactions, with some differences in the minimum documentation required for opening, monthly balance limits and in the fee scheme for transactions carried out at ATMs and self-service terminals. Both in the CGU and in savings banks, when they are opened through the Simplified Due Diligence process, the balance of the account must be less than 25 Minimum Living and Mobile Wages (SMVM) and monthly cash transactions must not exceed 4 SMVM. In the same vein, savings banks for the payment of social programs have a monthly limit of 5 SMVM for accreditations other than social benefits.
On the other hand, operations carried out at ATMs and TAS through ATMs and TAS through salary, social security and social program payment accounts have no cost for the account holder, regardless of which financial institution the device belongs to or its location (inside or outside a bank branch). In the case of the CGU, up to eight operations are contemplated at no cost at ATMs of other financial institutions, but those carried out on devices of the financial institution itself located outside the branches -for example, in a supermarket-, may have a cost. On the other hand, in savings banks, transactions arranged on devices of other financial institutions and of the entity itself located outside the branches may have a cost for the account holder.
To measure the penetration of the different types of deposit accounts in the population, the percentage of adults who have at least one deposit account is analyzed. The opening of accounts for beneficiaries of social assistance programs and retirements or pensions has a favorable impact on this indicator, as well as the opening of salary accounts. To determine the impact of each account on the global indicator, the number of beneficiaries for each of the types of accounts was estimated based on the available information22. It should be clarified that for this exercise it was assumed that there is no overlap in account holding between these three categories and that people belonging to these groups do not have any bank account other than those mentioned.
The number of people with savings banks for the payment of social programs was estimated based on the sole holders of the Universal Child Allowance (AUH) social program. The AUH is one of the most important social assistance programs in the country, with more than 2 million unique holders23. Although it is the type of account with the lowest participation in the global indicator, its impact on it is significant, increasing its overall value. By not taking this group of accounts into account in the calculation, the percentage of adults with at least one account is reduced to 73.8%.
A little more than half of this value is explained by the set of salary and pension accounts, while the remaining part is related to holders of different types of savings banks, such as self-employed workers and beneficiaries of social programs other than the AUH – for example, unemployment insurance.
Figure 2.2 | Percentage of the adult population with at least one bank account in pesos
Discriminated by account type
Discriminated against by gender (March 2018)
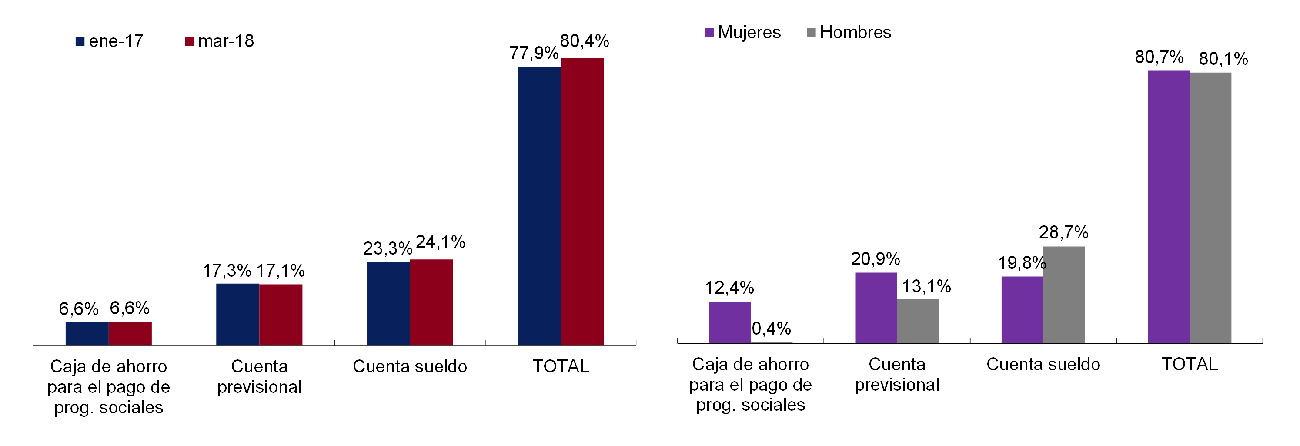
Note | TOTAL column: percentage of the total adult population and of each gender corresponds to unique CUITs with at least one bank account.
Source | BCRA, COELSA, ANSES and INDEC.
Thus, the indicator of holding at least one net deposit account for pension accounts and for the payment of social programs shows a final figure of 54% as of January 2017, approaching the value obtained by the Global Findex survey24, with only 48% of the sample answering affirmatively about the holding of bank accounts by the adult population. In the previous IIF, it was mentioned that this could reflect the ignorance of many people regarding the possession of accounts in the financial system, given that another survey found that 39% of the population responded that same year that they did not own any financial product. The 54% obtained here, as an approximation, could indicate that this lack of knowledge about account ownership could come to a greater extent from the segments that receive retirements and/or pensions and the payment of social programs; although this is not corroborated from the available data.
If the gender breakdown of account holders is carried out as of March 2018, it is observed that there is no gap at the global level, a fact probably explained in large part by the participation of women in the AUH (97% is headed by women)25. If we subtract savings banks for the payment of social programs from the calculation, the gender gap in the possession of deposit accounts amounts to 11.5 p.p. to the detriment of women.
In turn, the number of pension accounts amounted to 3.6 million for women and 2.1 million for men26. Thus, if we also subtract the pension accounts, the result would indicate that 8.2 million women had an account (47.4% of the adult female population) compared to 10.8 million men (66.7% of the adult male population), resulting in a gap of 19.4 p.p.
At the same time, the holding of salary accounts shows a gap of 9 p.p. to the detriment of women, in line with their lower participation in the formal labor market. As noted in the section on credit to individuals, women have a lower rate of activity in the labor market (49% vs. 70% of men) and a lower employment rate of 44% vs. 64% of men27.
A complementary indicator, used as a proxy variable in countries that do not have individualized data on deposit account holding, is the number of deposit accounts per 10,000 adults. As of December 2019, 16,866 deposit accounts were registered per 10,000 adults, which is equivalent to 1.6 deposit accounts per adult, registering an average year-on-year growth of 9.6% over the last decade. If we consider deposit accounts in local currency, which represent 82% of the total, there are approximately 1.4 deposit accounts per adult.
Figure 2.3 | Deposit accounts per 10,000 adults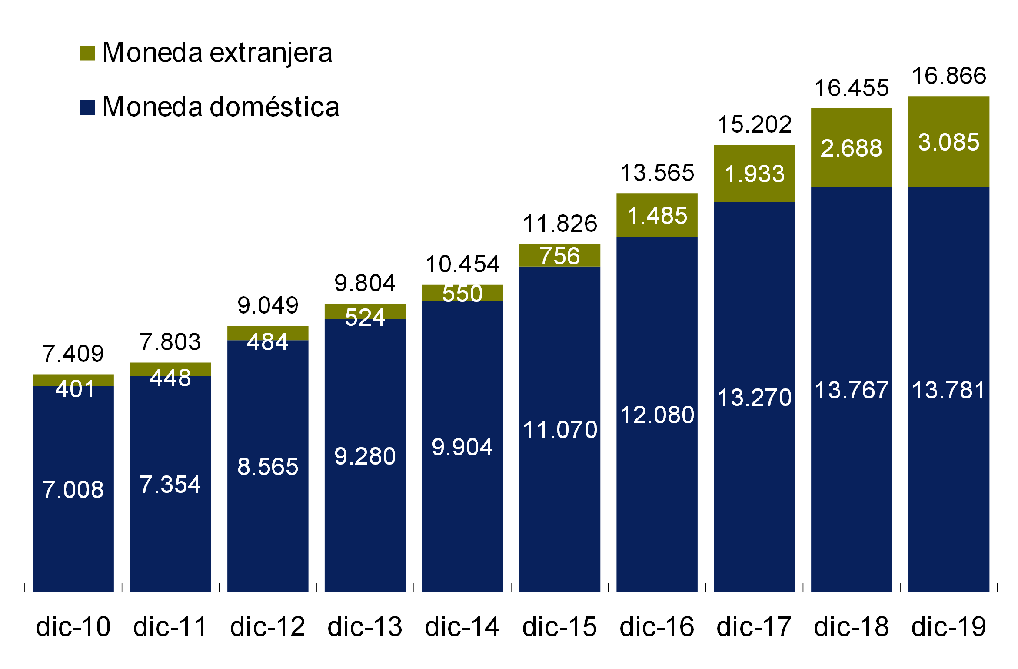
Source | BCRA and INDEC.
The information provided by financial institutions allows for grouping deposit accounts in local currency according to their balance level (monthly average)28. Based on this information, the distribution of the number of accounts according to different levels of balances is obtained, as well as the average balance in each of these groups.
The first range of information groups accounts with an average monthly balance of up to $2,999. This range brought together more than 30 million deposit accounts (out of a total of 46.8 million) for a total amount of almost $15 billion as of December 2019. This is equivalent to saying that 66% of deposit accounts in pesos were concentrated in the lower range, which, on average, registered a balance of $480. A similar distribution was verified for the months of December 2017 and 2018, with a slightly higher proportion in the first range, probably due to the effect of the nominal values of the balance brackets.
Leaving balances deposited in a deposit account could be considered passive savings. Only 1 in 3 people reported leaving balances in deposit accounts or checking accounts as a form of savings29, which would be in line with the information analyzed here.
Figure 2.4 | Relative Share of Deposit Accounts by Balance Tranche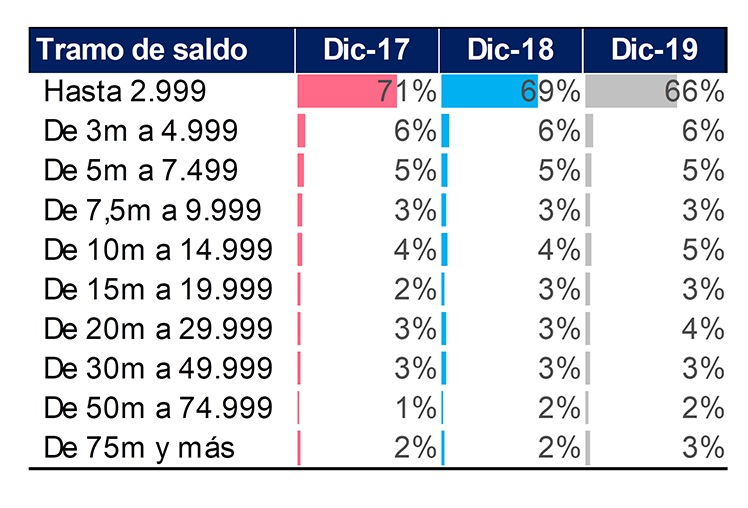
Note | m = thousand. Local currency deposit accounts are considered, and the balance of each account corresponds to the average monthly balance.
Source | BCRA.
Deposit accounts that are assigned the receipt of some kind of income – salaries, retirements and pensions and social assistance – accounted for 64% of the total deposit accounts in local currency as of December 2019, with pension accounts registering the highest participation (28%). This behavior has remained constant over the last 6 years. The fact that the rest of the savings banks have a 35% share of the total could be indicating that a large part of the population has a savings account in addition to the one they receive their income. This would be related to the aforementioned metric that in Argentina there are 1.4 deposit accounts in pesos per adult.
2.2. Transactions by electronic means of payment and cash
withdrawals In line with the objectives set by the BCRA, electronic means of payment facilitate transactions for the population and, at the same time, contribute to reducing the use of cash. They make it possible to overcome geographical barriers, making it easier to send and receive money, simplify transactions of goods and services and contribute to a better management of available resources.
In this framework, the operations carried out by individuals through credit, debit, prepaid and electronic transfersare analyzed 30. In particular, debit, credit and prepaid card purchases, transfers of funds originating in bank accounts through electronic channels and cash withdrawals at ATMs made using cards or other alternative systems are considered in the analysis. Both the number of operations and the amounts involved are measured in relation to the adult population.
In each of the metrics of electronic means of payment, there were increases relative to the population, both in the number of operations and in the amount operated31 in real terms, despite the fact that economic activity has stagnated or contracted during the last five years. The existence of a regulatory framework aimed at the expansion of these means of payment may partially explain their continued growth. The obligation for merchants to accept payments with debit cards and the progressive reduction of interchange fees for debit and credit card transactions32, added to regulatory innovations such as payments through quick response codes (QR codes33) – including payment through different types of cards by this means – are factors that, from the sellers’ side, they help explain the growth of electronic means of payment.
On the other hand, the extension of the electronic transfer system through different modalities, types of accounts (bank and provided by Payment Service Providers -PSP), as well as the simplification adopted to identify the recipient (Alias-CBU34), among others, have contributed to a greater offer and greater adhesion by the population.
2.2.i. Debit, credit and prepaid card payments. Electronic payments, which facilitate transactions and help reduce the use of cash, can be executed from different technological environments such as cards, computers and cell phones. In 2019, electronic card payments grew 12% in average number of transactions per adult and thus consolidate several years of growth.
In Argentina, the debit card was the most used electronic means by the population to make payments during 2019, slightly surpassing the credit card by 7%. In previous years, the latter had been the instrument most chosen by the population to make payments, considering that it has the possibility of providing financing.
Both means of payment have maintained their growth path in 2019, although in the case of debit cards there was evidence of an acceleration. Taking into account the moving average of the number of monthly transactions per adult, it can be seen that in recent months debit card payments raised their usual growth range from 8% to 12% per year. From lower levels, the use of the prepaid card grew steadily and, like the debit card, experienced an acceleration in recent months. As mentioned in the previous IIF, prepaid cards, powered by PSPs, support the same operations as debit cards. In addition, these cards are linked to a payment account that, through the Uniform Virtual Key (CVU) launched by the BCRA, allows the interoperability of PSPs and bank accounts to be streamlined.
In order to strengthen the protection of financial services users, new regulations for PSPs were established in 2020. The funds of customers credited to payment accounts must be in demand accounts, in pesos, in financial institutions in the country and, at all times, immediately available upon request35. It was also established that it was mandatory for PSPs to register in the “Register of Payment Service Providers Offering Payment Accounts” and to report the corresponding information36 to the BCRA.
Figure 2.5 | Electronic Payment Per Adult Transactions
Amounts
Amounts

Note | Quantity and average monthly amount of the period (Base Price Index January 2019).
Source | BCRA and INDEC.
As for the amounts traded relative to the adult population, all electronic means of payment verified – in real terms – positive variations throughout the period, except for credit cards, which registered a slight drop. The latter could be explained by the adverse macroeconomic conditions in which the economy operated, in particular, the persistence of high interest rates in a context of contraction in economic activity. As observed in relation to the amounts, the amount of prepaid cards registered the highest relative increase from the lowest levels (monthly average per adult $21, $31 and $60 for 2017, 2018 and 2019, respectively).
2.2.ii. Transfers of funds originating from bank accounts through electronic channels. Electronic transfers have been consolidating their growth in recent years, growing the number of operations at rates close to 47% in the last two years and almost doubling the average monthly amount operated from 2016 to 2019. In addition, this amount exceeded the amount operated with credit cards by 40% and by 2.5 times the amount of debit cards in 2019. In recent years, various regulations have been issued to improve the user experience, a pseudonym (Alias-CBU) was created to facilitate the identification of accounts and limits were temporarily increased at the request of customers37, among others.
Both in terms of amounts and amounts transferred, the channel most used by adults in recent years has been HB, followed by ATM and in third place by MB. HB transfers, with significant growth in the period, doubled the amounts made by ATM and exceeded those of MB by 5 times in 2019.
As for the amounts, they were 6 and 11 times higher than those channeled by ATM and MB, respectively. From relatively lower values, MB led the growth of these channels during this period, both in quantities (increase of 500%) and volumes (increase of more than 300%). This would be in line with a trend in favor of the adoption of cell phones for carrying out financial operations, since they offer a practical and agile alternative to operate through an account.
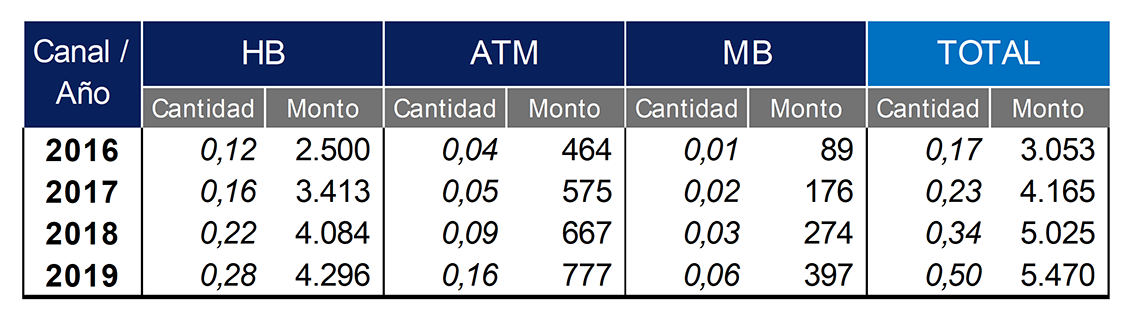
Notes | Quantity and average monthly amount of the period (Base Price Index January 2019). Only operations of human persons are contemplated.
Source | BCRA and INDEC.
2.2.iii. ATM cash withdrawals per adult. From 2016 to 2019, ATM cash withdrawals increased by 29%, while average amounts withdrawn decreased by 22% in constant values. This could be due to the evolution of the financial infrastructure and the aforementioned increase in the use of electronic means of payment. The greater the availability of physical points, both PDAs and alternative cash withdrawal points, the possibility of carrying out these operations at any time is facilitated, without the need to withdraw large sums of money at each opportunity.
On the other hand, by encouraging the greater use of electronic means of payment, the adoption of these instruments is quickly incorporated into the new payment habits of the population. In this way, it is verified that in 2019, for every 100 withdrawals per adult, almost twice as many transactions were carried out by electronic means of payment (191), which are broken down into 89 with debit card, 82 with credit card, 17 transfers and 3 with prepaid cards.
Figure 2.7 ATM cash withdrawals per adult Amount Quantity
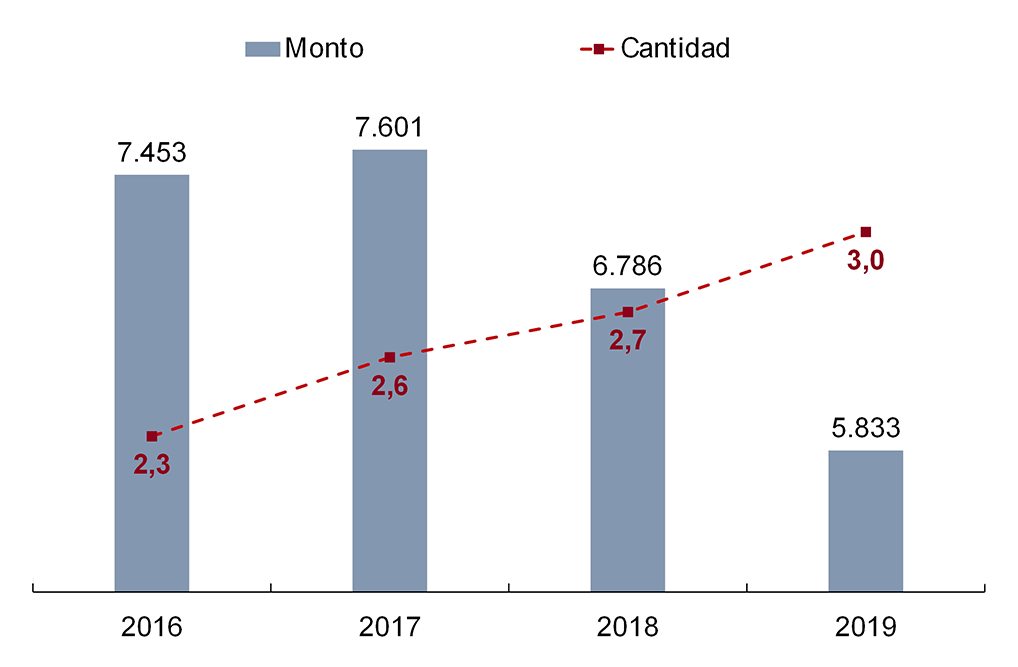
Note | Amount and average monthly amount for the period (base January 2019)
Source | BCRA and INDEC.
2.3. Savings modalities
The modalities of passive and active savings are channeled by the population through different instruments of the financial system. In the case of active savings, which involves the choice of a specific savings product, fixed terms are one of the main tools for channelling household savings and obtaining remuneration.
Fixed terms are placements in which the depositor delivers a sum of money to the financial institution for a certain period, in exchange for a future remuneration agreed between the parties. They can be made in pesos, UVA (Purchasing Value Units) or foreign currency (mainly dollars or euros), have a fixed or variable remuneration and be carried out in person or remotely (electronic channels). Its minimum term is 30 calendar days and some of them can be canceled before its expiration date (pre-cancellation option). They also have the possibility of being constituted without having a bank account, although they are usually made through them.
Fixed terms in pesos and in foreign currency have similar characteristics except for the currency of collection and settlement. On the other hand, fixed terms in UVA have the UVA as the unit of account, which is updated by the Reference Stabilization Coefficient (CER), which follows the evolution of the Consumer Price Index. This instrument constitutes an alternative for savings in pesos that is adjustable to the evolution of prices, maintaining the purchasing power of the capital saved.
Figure 2.8 | Main characteristics of fixed terms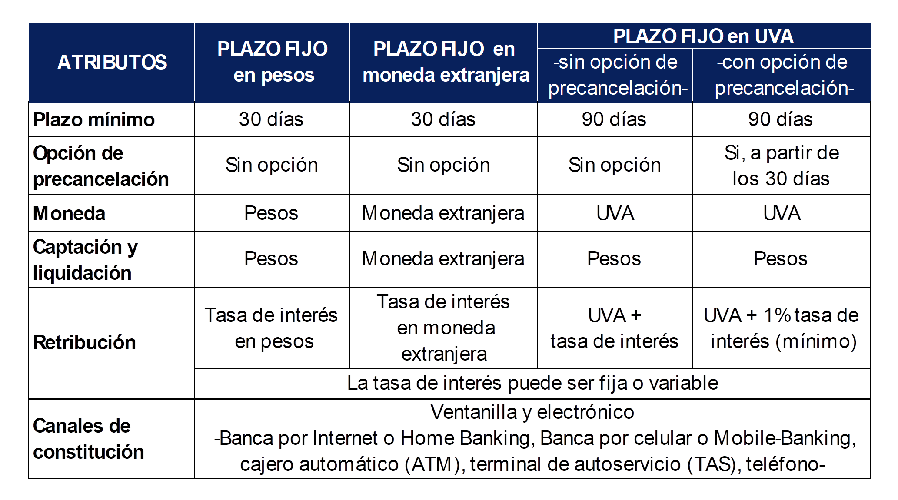
Source | BCRA.
Fixed Terms in UVA require a minimum term of 90 calendar days, but offer an alternative that includes the possibility of early cancellation from 30 days of its constitution38. The interest rate of the early exit will be fixed at the time of contracting the fixed term for those who opt for the term of 90 days, plus 1% nominal per annum, guaranteeing a positive real interest rate.
One of the basic indicators for measuring the use of this savings instrument is the number of fixed terms made by individuals39 in relation to the country’s adult population. As of December 2019, the number of fixed-term loans per 10,000 adults was 909, falling 10% compared to a year ago. A stylized reading of this value indicates that, on average, 1 in 10 adults had a fixed term as of December 2019. Between December 2010 and 2019, the number of fixed-term loans in pesos per 10,000 adults more than doubled, registering an average year-on-year increase of 10%.
During the period analyzed, the share of fixed-term deposits in local currency registered a slight but sustained increase, standing at 93% as of December 2019. Various regulatory changes have made it easier to set up fixed terms in domestic currency – through electronic channels without the need to be a customer of the financial institution – and respond to the specific needs of users – to maintain purchasing power. Also, the conditions that governed the foreign exchange market may have influenced the selection of the population’s savings products.
Figure 2.9 | Number of fixed terms per 10,000 adults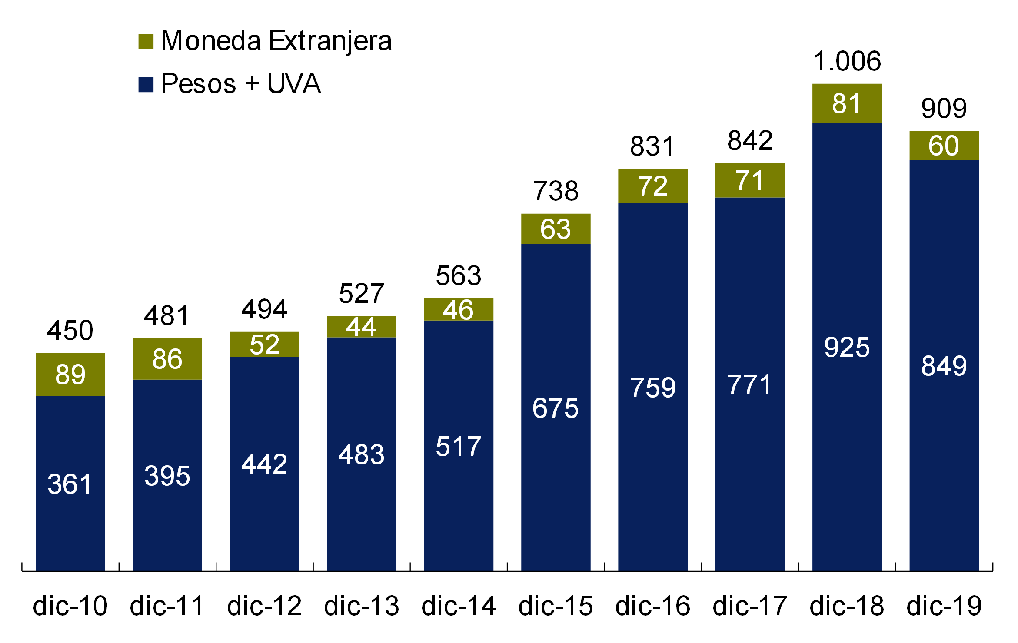
Source | BCRA and INDEC.
Another indicator that allows us to measure the intensity of use of fixed terms is the relationship between the number of fixed terms and the number of deposit accounts. Over the last decade, the number of fixed terms per 100 deposit accounts in foreign currency has been substantially reduced as a result of the massive opening of deposit accounts in that currency. In contrast, the metric in local currency maintained an average value of 6 fixed terms per 100 deposit accounts.
Figure 2.10 | Number of fixed terms per 100 deposit accounts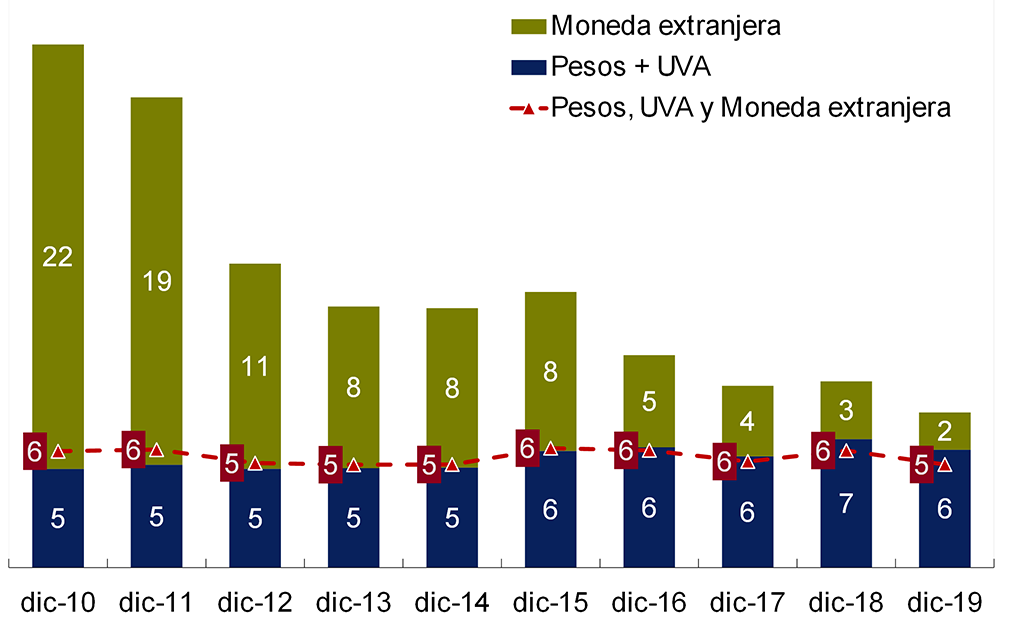
Source | BCRA.
The performance of this indicator indicates that only a small proportion of deposit account holders would use this savings instrument, which is in line with the low number of fixed-term deposits in relation to the adult population and with the results of the survey mentioned at the beginning of the section. The average balance per adult in real terms grew by only 4% between December 2010 and December 2019. Taking into account the SMVM as of December 2019, the average balance per adult on that date represented 1.6 times the SMVM. The geographical distribution of the real balance of fixed terms per adult was not homogeneous between the different provinces. It is observed as a trend that the Central and Patagonia regions presented the highest values of fixed terms per adult, while the NOA and NEA regions exhibited the lowest values.
As of December 2019, CABA led the ranking, surpassing Tierra del Fuego, which was in second place, by 1.7 times, and Misiones, located in last place, by 8 times. However, CABA presented a significant drop in real terms in the balance of fixed terms (13%) compared to December 2010. On the other hand, it is highlighted that Formosa and Catamarca were the provinces with the highest growth between December 2010 and December 2019, with 89% and 67% respectively. This implies a reduction in the differences in fixed-term balances per adult at the provincial level.
Figure 2.11 | Real balance of the fixed terms of human pesos. Provincial distribution by adult. 
Note | It contemplates fixed terms in pesos, UVA and foreign currency. Price index (base January 2019).
Source | BCRA and INDEC.
One of the elements to encourage the use of savings products such as fixed-term savings is to facilitate their constitution as much as possible. Electronic channels such as HB and MB have many advantages in relation to the face-to-face modality. Based on the information on the balances of the fixed terms constituted by the non-financial private sector, it can be stated that the electronic channel has been the most chosen by individuals and companies over the last 10 years, ranging between 92% and 97% of the total balance.
Box / Regional comparison of the regulatory framework for basic accounts
Basic accounts seek to promote financial inclusion while protecting the integrity of the financial system40. Especially for people in vulnerable situations, it is important to have a policy for admitting new customers to the financial system that is not too restrictive and thus avoid financial exclusion41. Likewise, without access to the formal financial system, these people turn to cash and unregulated channels, which limits transparency and increases the risk of crime and money laundering, undermining financial integrity42.
Basic or simplified accounts refer to accounts that, based on specific regulatory provisions, require the request for reduced information and documentation requirements (know-your-customer policy). A large part of the vulnerable population is not in a position to present the documentation that is normally required to open standard bank accounts, such as proof of address and/or sources of income.
Generally, the regulations for basic accounts contemplate their opening through non-traditional channels, such as banking correspondents, or remote ones, through electronic means such as computers and cell phones, in order to facilitate the incorporation into the financial system of historically excluded people. These channels contribute to reducing transaction costs associated with the provision of formal financial services in remote populations, especially in rural areas, and in those localities where the provision of services through traditional infrastructures, such as branches and ATMs, is not sustainable.
In line with the lower requirements and simpler opening processes, transactional and balance limits are usually established for this type of account, in order to reduce their potential use for the management of resources of illicit origin and/or financing of terrorism.
Several countries in the region have regulatory frameworks that define simplified openness fundraising products, focused on improving financial inclusion conditions for the underserved population. This is the case in countries such as Mexico, Colombia, Peru and Paraguay, where this type of account has a specific name that allows them to be identified and differentiated from the rest of the deposit accounts, having been implemented in 2012, 2009, 2011 and 2013, respectively.
Except for Mexico, the rest of the countries mentioned only contemplate the opening of these accounts for individuals. Another common factor is the possibility of opening through correspondents and by electronic means and the imposition of transactional limits. In contrast, regulatory frameworks differ in the policy of charging fees and in terms of restrictions on account holding at the system level.
Figure R1 | Regional comparison of the regulatory framework for basic accounts43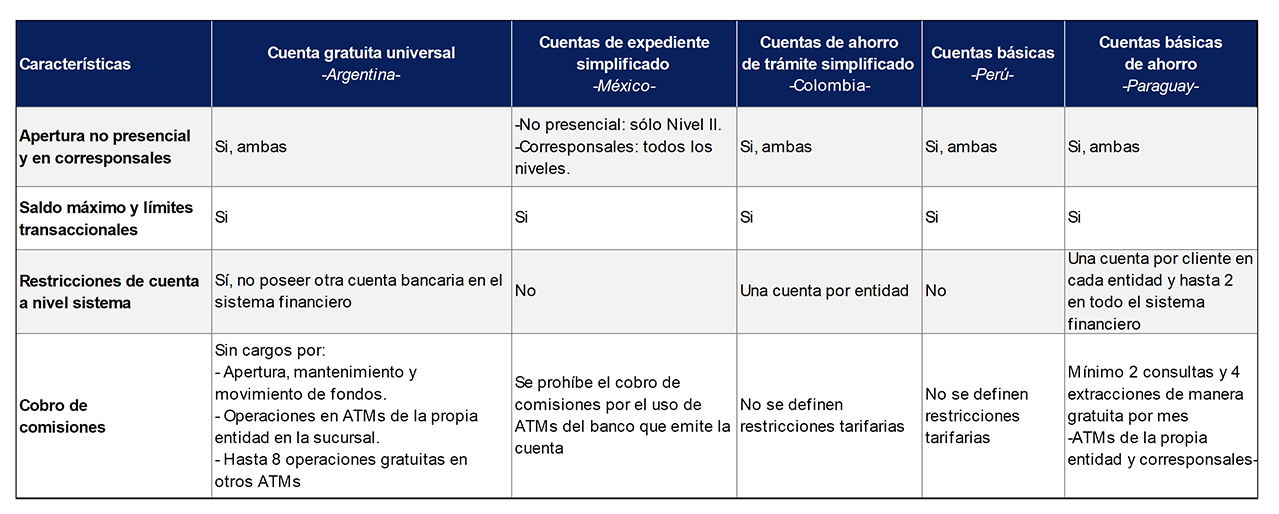
In the case of Argentina, in January 2020 the Universal Free Account (CGU), which had been discontinued in 2016, was restored. This bank account is aimed at unbanked people and is opened with the sole presentation of the DNI, having no opening and maintenance cost. All banks are obliged to offer and open it at the request of individuals. Starting in June of this year, banks will have to offer the remote opening of GUCs, reducing geographical barriers to access to financial services.
In this regard, it should be noted that although the proportion of the population living in localities without bank branches is relatively low (11.6%), in most cases these access points are located in urban centers, which implies that a large part of the population must travel considerable distances to access them. Likewise, the number of branches per locality is very scarce to serve the population that lives in them, considering that 34% of the localities have less than one branch for every 10,000 adults.
Basic accounts are a key instrument in terms of financial inclusion, since they are the vehicle for vulnerable segments of the population to access the benefits of participating in the financial system. In this sense, it is highlighted that the possession of a bank account allows people to carry out cashless transactions, such as purchases in stores and payments for services electronically, send money -transfers- and channel savings, among others.
3. Credit
3.1. Credit to individuals
The analysis of access to credit is one of the key axes of the diagnosis of financial inclusion in a country, since it makes it possible to determine the degree of use by individuals and companies of the financing provided by the financial system. In Argentina, there are different institutions that grant credit to individuals and companies.
The main difference between those who provide credit lies in the origin of the funds used for it. Institutions that take funds from the public and then lend them to third parties, which is known as financial intermediation, are called financial institutions and are regulated by the BCRA in accordance with the provisions of the Financial Institutions Law. As of September 2019, 37% of Argentine adults had at least one financing granted by these entities.
On the other hand, those that lend with funds or own capital are not under this regulatory framework. Within this group, there are non-financial companies that issue credit and/or purchase cards (ETCNB) and other non-financial credit providers (OPNFC)44. As of September 2019, the ETCNBs provided financing to 16% of adults in our country, while the OPNFCs reached 9%. These two groups of institutions make up the group of Non-Financial Credit Providers (NFCPs), while the Extended Financial System (SFA) is defined as the group that includes financial institutions and NFPs.
In this context, all financial institutions and PNFCs registered in the respective registries report to the BCRA on the financing they grant to their customers. This credit information system is called the Central Bank of Debtors of the Financial System (CENDEU), whose data are available for individual consultation with CUIT, CUIL or CDI for the general public on the BCRA website.
3.1.i. Adults with at least one financing per set of providers and per province. According to data reported to CENDEU, as of September 2019, 37% of adults in our country had at least one financing granted by financial institutions. On the other hand, this indicator amounted to 49% in the SFA.
The temporal evolution of the indicator, both for financial institutions and for the SFA, shows a relatively stable performance, registering a small increase in 2018 and, with the information available, a contraction during 2019. The percentages observed remained almost unchanged in recent years, showing certain limits in the inclusion of new people in credit products.
Figure 3.1| Percentage of adults with ale minus one financing.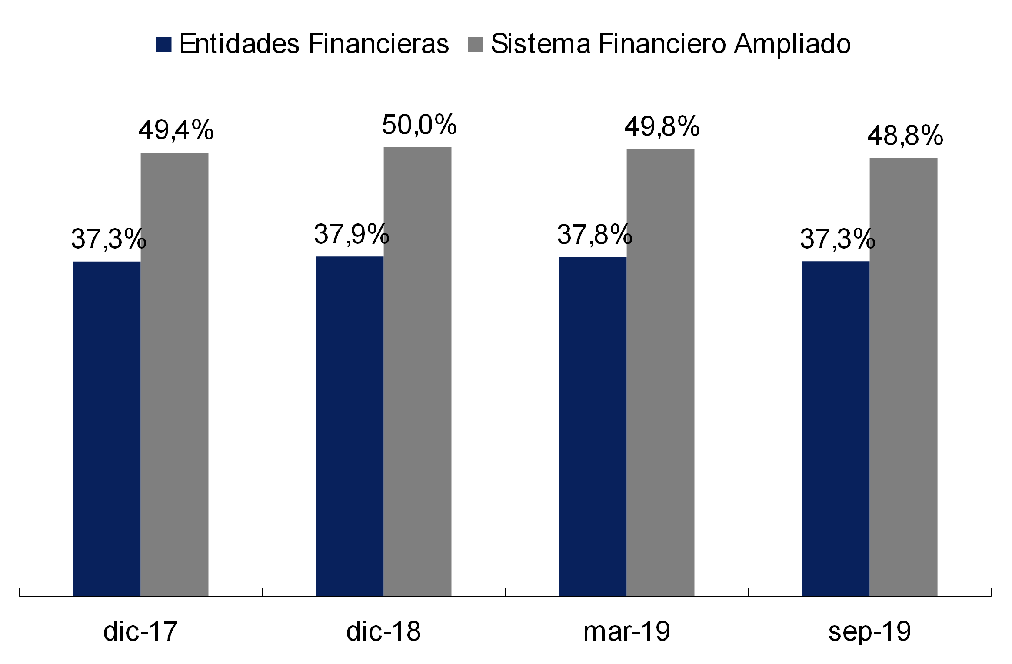
Source | BCRA and INDEC.
The distribution by province45, both for the financing of financial institutions and for that of the SFA, shows that CABA was the province with the highest proportion of debtors over its adult population, while Corrientes was at the opposite extreme. In all provinces, there is a considerable contribution of the PNFC to the percentage of debtors, with La Rioja being the province with the highest participation of this group (17.3% of the adult population), followed by Catamarca (16.7%), while La Pampa registered the lowest magnitude (6.6%).
In regional terms, as with the indicators of PDA and credit of individuals with business activity, a better performance is recorded for the Central and Patagonia regions, with a 51% and 52% percentage of debtors in the SFA, respectively, while the NEA, the NOA and Cuyo verified a lower proportion of adults with financing (40%, 44% and 45% respectively).
For the purpose of analyzing explanatory factors of access to financing, the relationship between participation in the formal labor market and access to financing is considered, taking as an indicator the possession of a salary account46. Nationally, 25% of adults had such an account as of September 2019. Within this group, 79% of people had at least one financing granted by the SFA.
There is a considerable improvement in the indicator of access to financing for people with a salary account, taking into account that there is a difference of 30 percentage points (p.p.) between the total percentage of adults who access financing and the percentage of adults with a salary account who access it. Again, there are great disparities at the provincial level, with Corrientes being the province with the least access to financing for its population with a salary account (56%) and Santa Cruz the one with the greatest access (84%).
Figure 3.2 | Debtors by province and accreditation of remuneration in bank account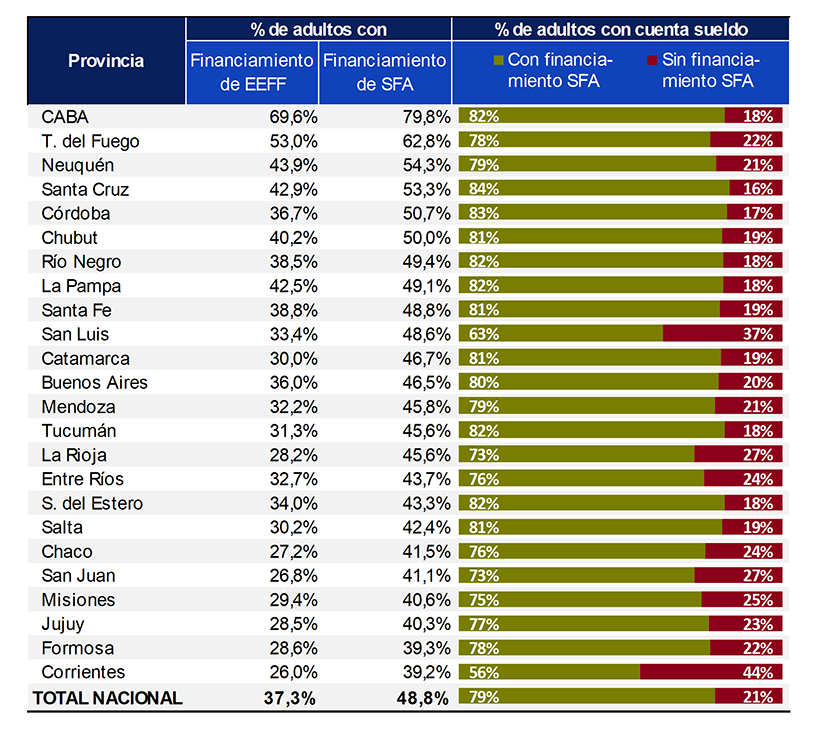
Note | EEFF: Financial Institutions. Data as of September 2019.
Source | BCRA and INDEC.
3.1.ii. Adults with at least one funding per provider type, funding type, and age group. Financial institutions can be classified into different main institutional groups: private banks (50 entities), public banks (13) and financial companies (15). On the other hand, if we consider the PNFCs that report to CENDEU, we find the ETCNB and the OPNFC47. Based on this classification, 30% of the adult population had at least one financing with a private bank as of September 2019. Public banks, on the other hand, accounted for 11% of adults, while ETCNBs and OPNFCs accounted for 16% and 9%, respectively48.
Both at the national level and in each of the regions, private banks are the institutional group that financed a higher percentage of the population, followed by the ETCNBs – with the exception of the NEA region where the OPNFCs take on greater relevance than the latter.
Although at the national level, public banks demonstrate a greater reach than OPNFCs, this performance is not homogeneous throughout the territory, with marked differences between regions. It is observed that in the Central and Patagonia regions, public banks grant financing to a higher percentage of adults than the OPNFCs, while in Cuyo, the NEA and the NOA this behavior is reversed.
An aggregate comparison of financial institutions on the one hand, and OPNFCs plus ETCNBs on the other, shows that while in the Central region the former had a higher relative share (ranging from a minimum of 32% to a maximum of 42%), the participation of the latter was relatively low (between 14% and 22%). On the other hand, OPNFCs and ETCNBs are more relevant in the NEA, NOA and Cuyo regions, where banks decrease their relative participation. In Patagonia, the percentage of adults with financing is high in relative terms relative to the other regions for all institutional groups, highlighting that it is the region where public banks have the greatest reach.
Figure 3.3 | Percentage of adults at least one funding per institutional group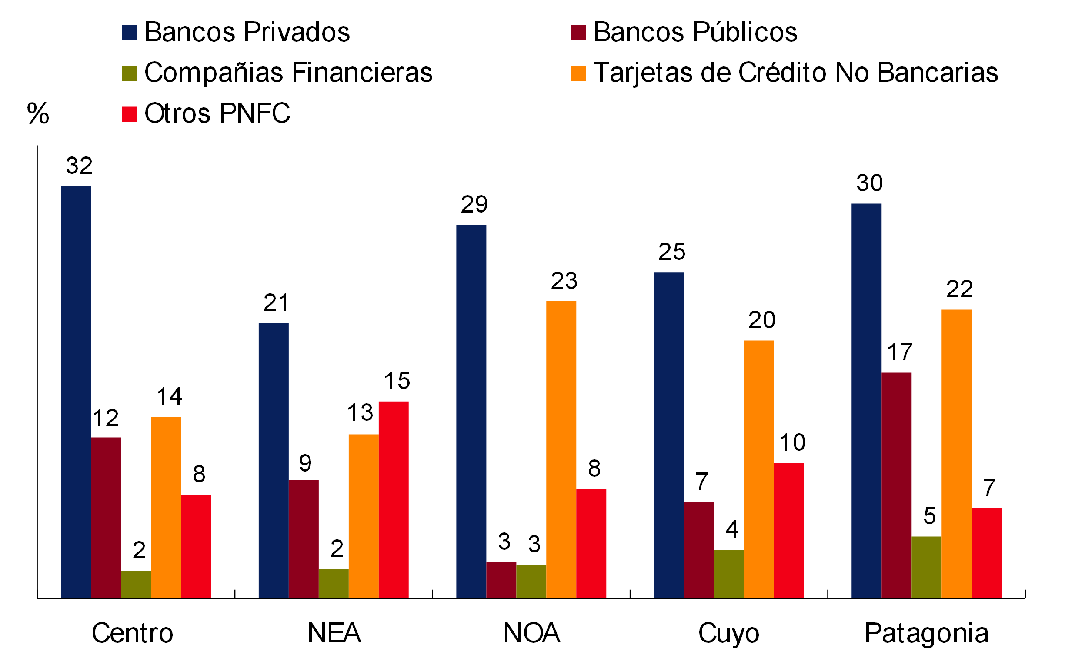
Note | Data as of September 2019.
Source | BCRA and INDEC.
On the side of the type of financing, as of September 2019, 38% of the adult population had at least one credit card financing (both bank and non-bank). For that period, financial institutions and ETCNBs reported that there were a total of 28 million credit cards in Argentina that registered activity49. Taking into account this amount in relation to the adult population that registered credit card assistance, it appears that each debtor had an average of 2 credit cards.
In second place are personal loans, which were accessed by 25% of the adult population. For both types of financing, a slight reduction in the percentage of adults is observed between December 2018 and September 2019. On the other hand, longer-term loans that require collateral reached a much smaller percentage of the adult population. Only 1.3% of adults had a title loan, while for mortgages the percentage was only 0.7%.
With regard to the age of the debtors, in all age ranges, the most used type of assistance was the credit card. From the age of 65, the percentage of the population that accesses personal loans increases considerably. This phenomenon could be associated with the existence of lines of credit offered by financial institutions to retirees and pensioners who receive retirement benefits or pensions in bank accounts.
Figure 3.4 | Percentage of adults with at least one SFA funding by type of assistance and age group
Note | Data as of September 2019. Source | BCRA and INDEC.
Mortgage loans were more prevalent in the population between 35 and 54 years of age, which could be related to a higher and more stable income level in these age groups, as well as a greater preponderance of the constitution of independent households and the acquisition of their own home. On the other hand, title loans registered a relatively longer scope until the age of 64.
3.1.iii. Financing situation of debtors. Financial institutions and PNFCs classify debtors according to the ability to pay their debt. The regulations provide for the existence of levels of grouping (“situations”) of debtors in decreasing order of quality, with Situation 1 being the one in which the debtors are able to adequately meet all their financial commitments (even though they may be late in payment) and Situations 5 and 6 those in which the debt is considered uncollectible50.
Debtors classified in Situation 1 and 2 are grouped in the regular situation, i.e. they can meet all their financial commitments, and all other debtors are considered under the category of irregular situation. As of September 2019, 74% of SFA debtors were in a regular situation. The temporal evolution of this indicator shows a reduction in the percentage of debtors who adequately meet their obligations, having fallen 4 p.p. and 2 p.p. compared to the same month in 2017 and 2018, respectively.
Figure 3.5 | Percentage of SFA debtors in a regular situation by gender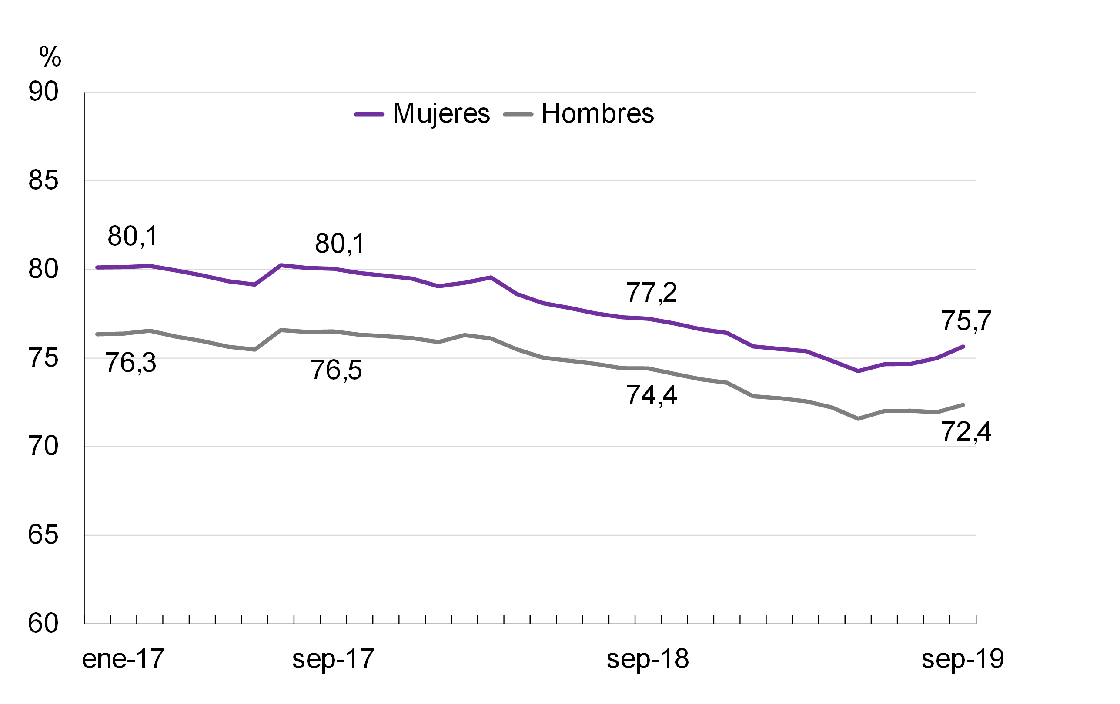
Note | Debtors whose financing has been assigned to financial trusts are included.
Source | BCRA and INDEC.
The disaggregation of this indicator according to the gender of the debtors denotes a difference in repayment behavior between men and women: while of all women with at least one financing in the SFA, 75.7% adequately fulfilled their obligations, in the case of men, this percentage was reduced to 72.4%. A similar difference is maintained over time, indicating that women as a group tend to have better debt payment behavior than men. The deterioration in the repayment situation shows a different performance between both genders, with a greater drop for women than for men, which were 4.4 p.p. and 4.1 p.p. in the last 24 months, respectively.
In terms of age, the percentage of debtors in a regular situation is lower in young people than in older ones, evidencing a positive relationship between the age of debtors and repayment behavior. As of September 2019, 69% of debtors between 20 and 40 years of age were in a regular situation, while for debtors between 40 and 65 years of age that percentage rose to 74% and for those over 65 years of age to 82%. Likewise, it can be seen that the largest number of debtors who do not adequately comply with the repayment of their financial obligations is between 30 and 45 years old.
Geographically, the provinces of Patagonia had a higher proportion of debtors in a regular situation than the rest of the provinces, while the provinces of Cuyo had the lowest values. CABA and La Pampa were the jurisdictions in our country with the highest percentage of debtors in a regular situation, while La Rioja and San Luis were the ones with the lowest percentage.
Figure 3.6 | Percentage of SFA debtors in a regular situation by province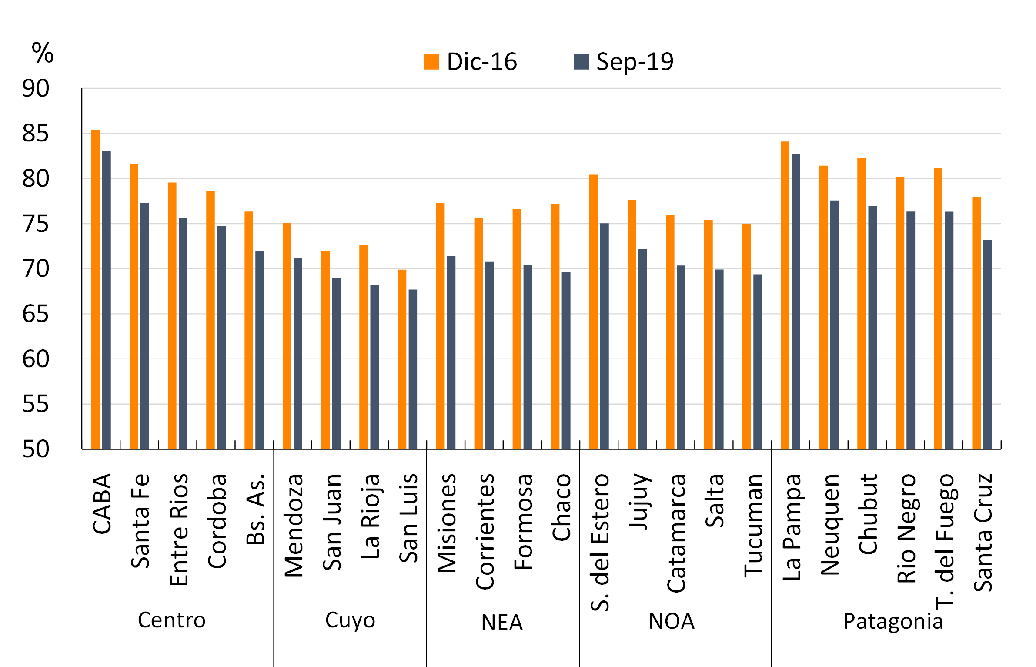
Note | Debtors whose financing has been assigned to financial trusts are included.
Source | BCRA and INDEC.
The evolution of the indicator over the last few years shows that all Argentine provinces have suffered a reduction in the proportion of debtors that regularly meet their commitments, this decrease being greater for the provinces that make up the NEA and the NOA. In particular, Chaco and Formosa show steep falls of 7.5 and 6.2 p.p. respectively which, compared to the falls in CABA and La Pampa (2.4 and 1.4 p.p. respectively), show that the deterioration in the indicator has had a very heterogeneous impact throughout the territory.
3.1.iv. Gender gaps by institutional group, type of financing and age group. As of September 2019, 46.0% of women and 51.8% of men had at least one financing in the SFA. These two values show the existence of a gender gap in access to financing that reached 5.8 p.p. Disaggregating the indicator, it is verified that the gap is mainly explained by the financing granted by financial institutions, with the gap for this subset reaching a value of 3.7 p.p. Within the subset of NFCPs, the gap is considerably smaller, with a difference of 0.4 p.p. for ETCNBs and 0.5 p.p. for NFPOs.
Figure 3.7 | Percentage of adults with at least one financing by gender and group of credit providers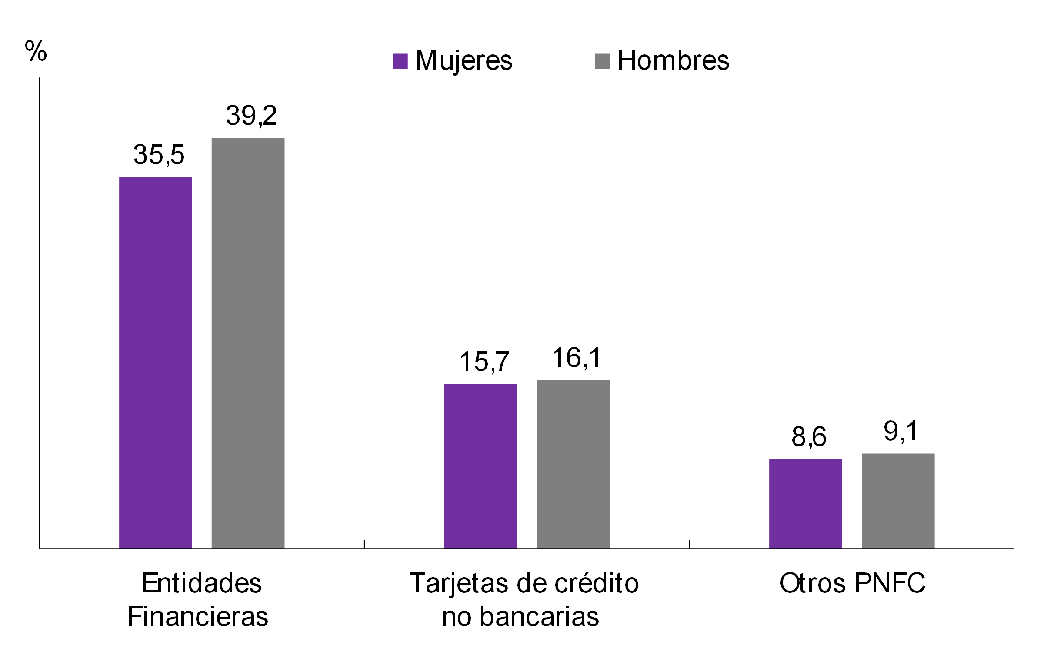
Note | Data as of September 2019.
Source | BCRA and INDEC.
The evolution of the percentage of debtors by gender shows that, during 2018, the percentage of women who had at least one financing in the SFA increased by 0.8 p.p., while in the case of men the increase was 0.4 p.p. During 2019, however, there was a decrease in the percentage of adults who accessed financing, being 1 p.p. for women and 1.2 p.p. for men. These changes show a slight reduction in the gender gap in access to credit, a trend that has also been observed in previous years.
In all types of funding, the percentage of men was higher than that of women in the SFA. Although the difference between the percentage of men and women was greater in the case of credit cards and personal loans (4.1 p.p. and 3.1 p.p. respectively), for the types of loans that require greater collateral and a longer repayment period (pledge and mortgage loans) the difference between men and women was greater in relative terms (bearing in mind that there were almost twice as many men as women who had access to these types of financing). However, since title and mortgage loans cover considerably smaller percentages of the population, the impact of the disparity is relatively more limited. It should be clarified at this point that CENDEU registers loans in the name of a single debtor, so that, when a loan is taken out by more than one person (for example, a married couple who receive a mortgage loan), the financing is registered in CENDEU only in the name of one of them.
The gender gap is not only observed in the number of men and women who access credit, but also in the financing balances of each gender. In all types of financing, except for mortgage loans, there is a difference in balances to the detriment of women. In credit cards, the most widely used financing instrument, the difference between the average balance of men and women reached 30% in favor of men. For every $1,000 of financing balance that men had, women registered $769.
On the other hand, in terms of age of debtors, it can be seen that as of September 2019 the highest average debt balances for both genders were between 35 and 49 years old. From the age of 20, for all age ranges, there are higher balances for men than for women. One of the factors that could explain the gender gap observed in access to credit is participation in the labor market. According to INDEC51 data, women had an activity rate52 of 49.2% and an employment rate53 of 43.9% in the third quarter of 2019, while for men these values amounted to 70.2% and 64% respectively.
Figure 3.8 | Average balance by type of care, gender and age group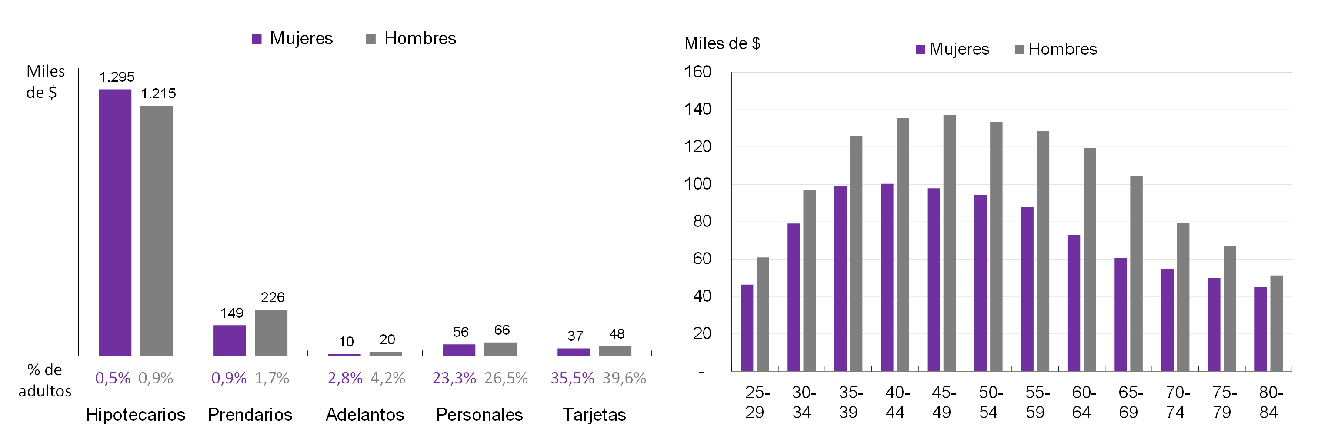
Data as of September 2019. Debtors and SFA balances.
Source | BCRA and INDEC.
Taking the possession of a salary account as an indicator of registered work, as of September 2019, 21% of women had at least one salary account, while for men the percentage rose to 28%. Within this group, 78% of women had at least one financing in the SFA, while for men this value rose to 80%. Thus, it is observed that considering the universe of adults who participate in the formal labor market, the gender gap in access to credit, although reduced, is still present. This would indicate that there are other factors, in addition to participation in the formal labor market, that affect access to credit for men and women.
3.2. Credit to productive
units In the first IIF, the financial inclusion of the country’s companies in terms of their use of financing was analyzed. On that occasion, a static study was carried out, characterizing the situation at a moment in time. In this report, based on historical series, the temporal dimension of the metrics already presented is incorporated, considering the evolution of around 600,000 productive units between 2007 and 2018.
The temporal analyses include both the financing of companies incorporated as legal entities (PJ companies) and those individuals that carry out a productive and/or commercial activity without being incorporated as companies or legal entities (PH companies). It should be noted that the analyses of PH companies may be influenced by the fact that it is not possible to distinguish precisely financing for productive purposes from lines of credit for consumption. For this reason, in some passages of the section, PH companies are excluded from the analyses, as well as analyses excluding large and medium-sized companies section 2 in order to focus the study on MSMEs54, which are of greater interest for financial inclusion.
Figure 3.9 | Evolution of the percentage of companies that took out a loan with the SFA discriminated by company size and type of person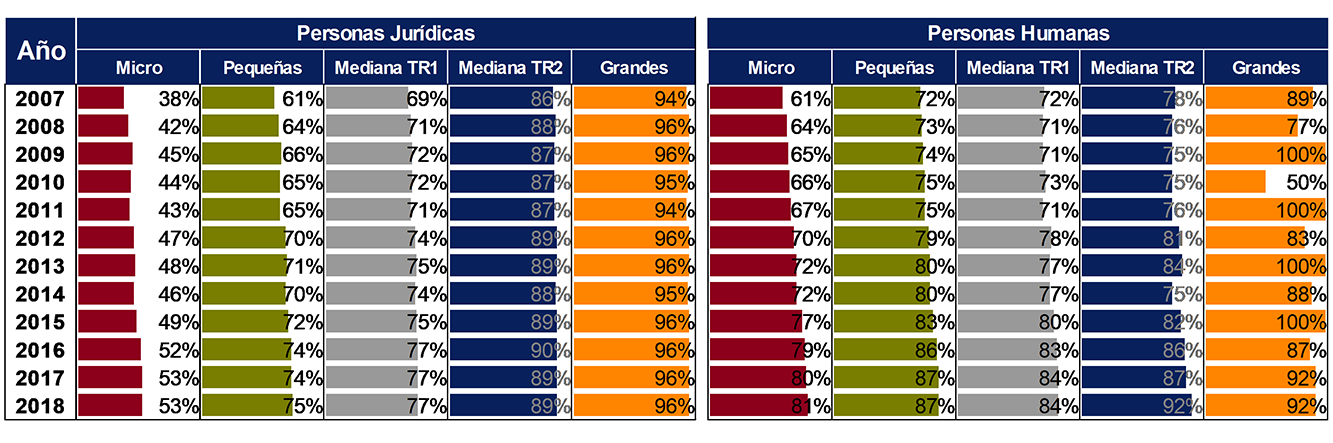
Note | Companies with financing for any month of the year considered.
Source | BCRA and Ministry of Productive Development.
The first credit indicator presented in the previous IIF consisted of the percentage of companies that took out some financing with the expanded financial system (SFA)55. It emphasized the disparities observed at the level of company size; in the case of PJ companies, only 53% of microenterprises took financing during 2018, while for large companies this proportion was 96%. Analyzing the historical evolution, it is found that these gaps tended to narrow, especially until 2016.
Analyzing the evolution of this same indicator by sector of activity for PJ companies, and focusing on smaller units, it is observed that the general trend of increase in the proportion of companies with financing is verified at all levels and sectors, with very slight differences in magnitude. Considering the performance of this indicator in absolute terms, it appears that the gaps between sectors were reduced, given that the sectors with less access to financing increased by a greater amount.
In particular, the evolution of the services sector stands out, which expanded the percentage of coverage between 2007 and 2018 from 24% to 41% for microenterprises and from 47% to 64% for small companies. However, in relative terms of the number of excluded companies, the agricultural, industry and mining sectors, which were already starting from higher values, were the ones that registered the best performance between 2007 and 2018. In the agricultural sector, the indicator of microenterprises with financing increased by 16 p.p., and that of small enterprises by 15 p.p., representing 31% and 46%, respectively, of the number of unfinanced enterprises in 2007.
Figure 3.10 | Evolution of the percentage of PJ companies that took out a loan with the SFA discriminated by company size and economic sector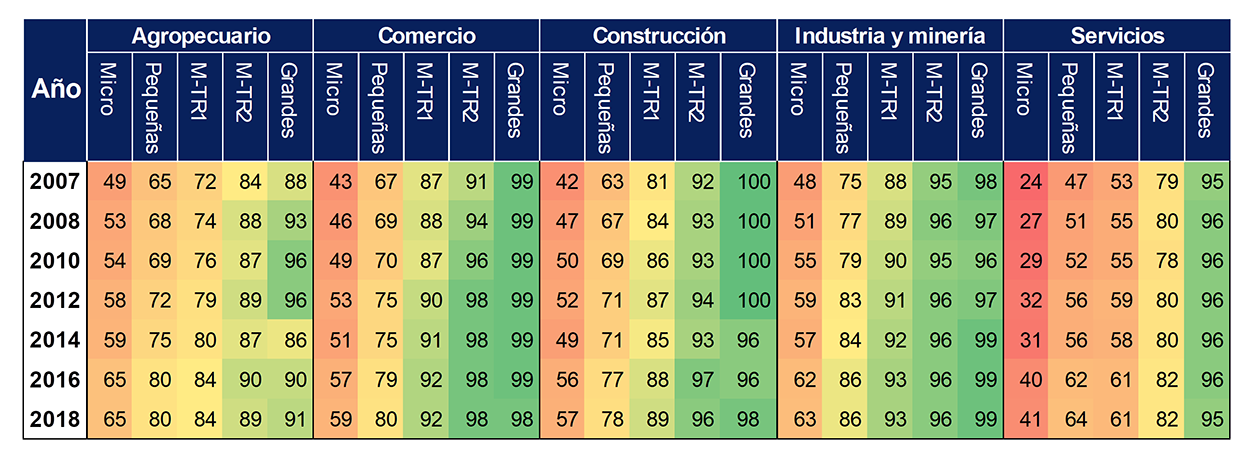
Note | Companies with financing for any month of the year considered. M-TR1 and M-TR2 means medium tranche 1 and tranche 2, respectively.
Source | BCRA and Ministry of Productive Development.
In the industry and mining sector, the behavior was similar, registering a 15 p.p. increase for microenterprises and 11 p.p. for small companies, values that represented 29% and 44% of companies without financing in 2007. For its part, the services sector, which showed the highest absolute increase (17 p.p. for microenterprises and small enterprises), was the one with the worst final performance in relative terms, given the low initial level, incorporating 22% and 32% of microenterprises and small enterprises, respectively, without financing in 200756.
At the regional level, there are very slight differences in the percentages of companies with financing. Considering MSMEs, the largest increases in absolute terms occurred in the NOA and NEA for PH MSMEs, with growth of 25 p.p. and 24 p.p. between 2007 and 2018, respectively, thus reducing the gap with the regions that had a higher percentage with financing, such as Centro and Patagonia. In the case of PJ MSMEs, the increase in the indicator was more moderate and the gaps between regions tended to widen, with a greater incorporation of companies in Centro and Cuyo, although regional differentials remained at insignificant values (4 p.p. difference between the region with the highest and lowest percentage).
Figure 3.11 | Evolution of the percentage of MSMEs that took out a loan with the SFA discriminated by type of person and geographical region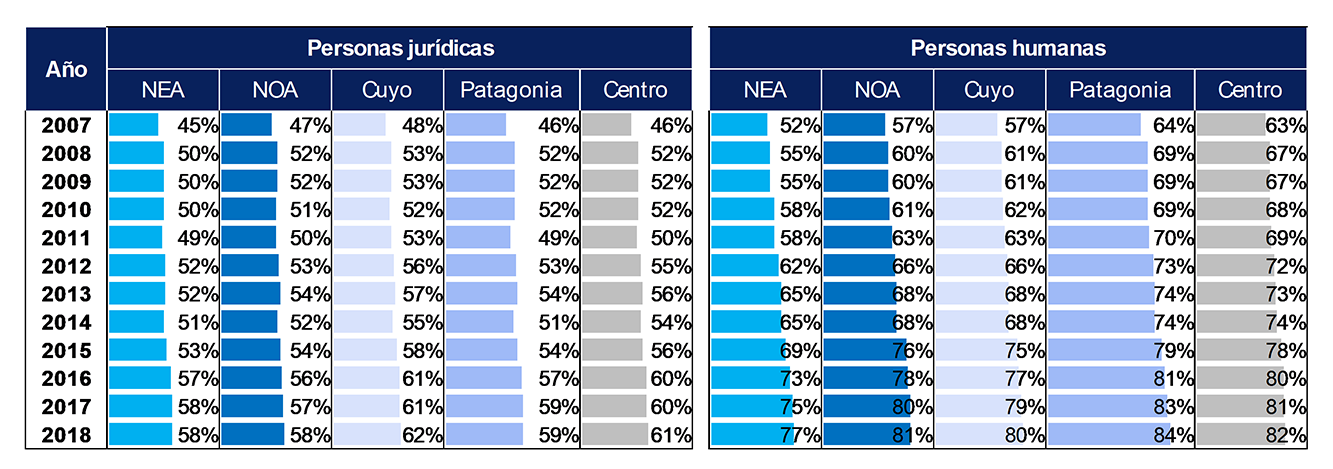
Note | Companies with financing for any month of the year considered. Source | BCRA and Ministry of Productive Development.
Within the universe of companies that took financing in the period analyzed, not all used the same type of financing. PJ MSMEs resorted to a greater extent to secured loans, such as mortgages and pledges, which may express a stricter collateral requirement on the part of financing providers towards this type of companies compared to larger ones.
On the other hand, PJ MSMEs also used document discounting to a greater extent, while medium-sized companies tranche 2 and large companies resorted relatively more to advances. Although both types of financing are usually short-term and oriented to working capital, it can again be deduced that PJ MSMEs require some additional support to obtain financing (a document to be discounted, such as a check).
On the other hand, in terms of evolution, the marked growth of export pre-financing from 2016 onwards stands out, becoming the main type of financing for larger companies. This was in line with the increase in foreign currency deposits in financial institutions57, which allowed for an increase in credit to exporting companies. Although it was the largest companies that were able to take advantage of this context to a greater extent, the reach it had for PJ MSMEs was also significant, reaching 12% of financing in 2018.
Figure 3.12 |Distribution of the debt balance of PJ companies by type of assistance and company size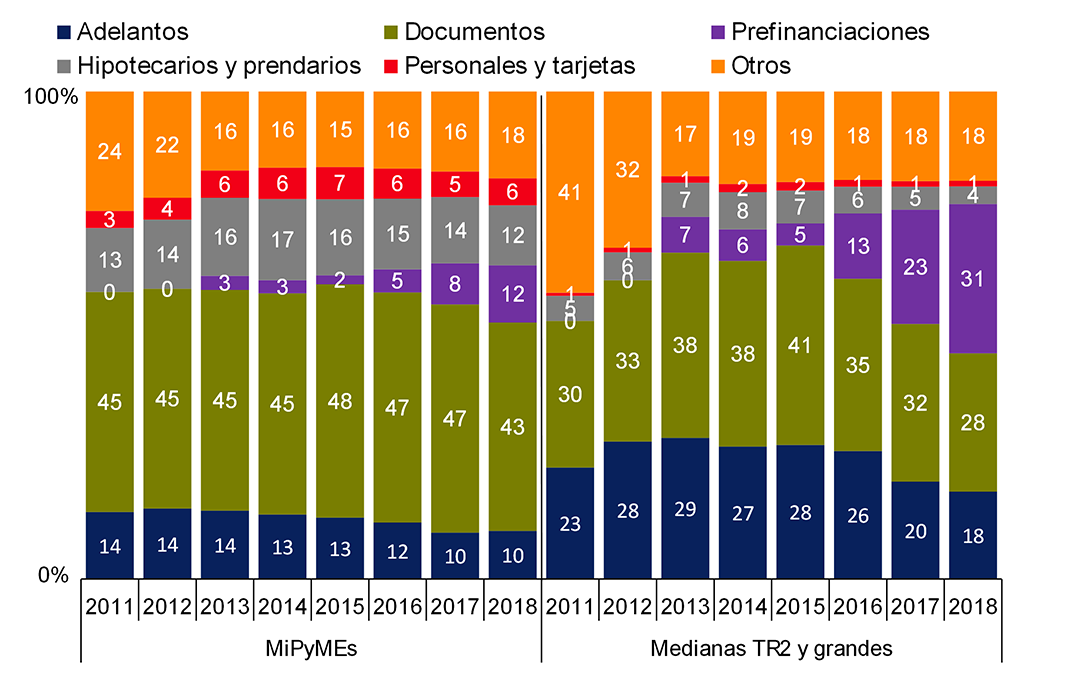
Note | It is calculated based on the sum of the monthly balances in real terms.
Source | BCRA and Ministry of Productive Development.
Another dimension from which the financial inclusion of companies can be measured, in addition to considering how many have access to financing, is to evaluate the extent to which they can afford to repay these loans. In this case, the indicator used consists of the percentage of companies – including both PH and PJ – that had some financing in an irregular situation58 (in relation to the total number of companies with financing). This indicator showed a markedly differentiated evolution for different sizes of companies.
On the one hand, microenterprises had the lowest proportion of companies with irregular financing in 2007 (2.5%), while larger companies (medium-sized tranche 2 and large) showed the highest proportion, surpassing the former by 4 p.p. It was verified until 2013 that the larger the size, the greater the proportion of companies with non-payment problems, a relationship that from the following year is reversed.
From 2016 onwards, there has been a pronounced worsening of the indicator for microenterprises, which in 2019reached a maximum of 6.9% of the total with debt balances in an irregular situation. Although as of 2018 the increase in this indicator is pronounced for all sizes of companies, the gap widens to the detriment of the smallest ones, and it is verified that the profile of financing in irregular condition was reversed compared to the beginning of the period.
Figure 3.13 | Percentage of companies with financing in an irregular situation discriminated by company size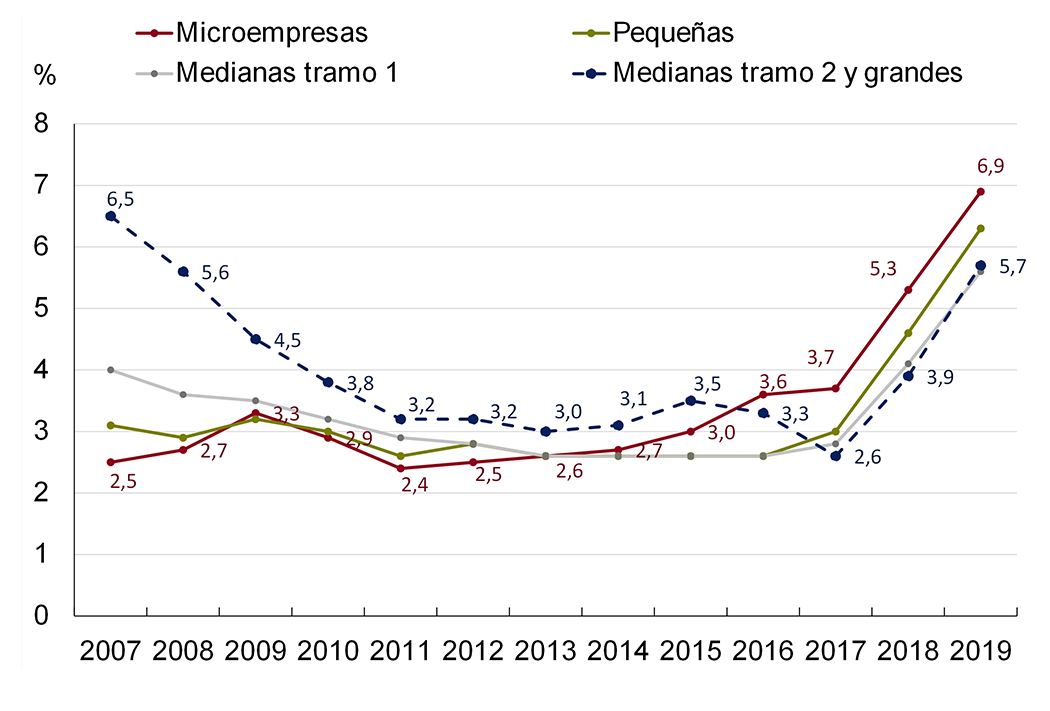
Note | It is calculated as the average of the monthly indicator. It includes all companies (PJ and PH) in an irregular situation with a financial institution or PNFC in each month.
Source | BCRA and Ministry of Productive Development.
The foregoing analyses allow us to complement with a dynamic vision the static panorama presented in the first IIF regarding the state of financial inclusion of MSMEs in the country. On the one hand, it should be noted that in trend terms, there was a generalized improvement (to a greater or lesser extent depending on the sector, size or region) in credit coverage indicators, although a slight slowdown also began to be seen in the last 2 years analyzed.
This process, added to the increase in the proportion of MSMEs with financing in an irregular situation, shows that the situation presented significant challenges for the financial inclusion of smaller companies. On the one hand, to continue with the process of incorporating more MSMEs into the possibility of obtaining financing, as well as to ensure that the conditions of this do not make it too onerous a burden. Although the macroeconomic context plays a key role in the conditions in which these processes are developed, and an improvement in this aspect is essential for the deepening of financial inclusion, regulatory actions that reduce the barriers to access to financing for this group of companies are also relevant.
3.3. Credit to individuals who carry out business
activity Continuing with the study of the financing of productive units (or companies), the analysis of the subset composed of individuals who carry out a productive and/or commercial activity without being incorporated as companies or legal entities (PH companies) is deepened60. Access to financing for this subset allows the development of business activity and facilitates the potential transformation into a larger productive unit.
Given that the productive unit in question is directly in charge of a natural person, it is possible to study, in addition to the size of the productive unit and its link with financing, characteristics such as the geographical location, gender and age group of the owner. As mentioned above, it should be noted that the analyses presented below may be influenced by the fact that it is not possible to distinguish precisely financing for productive purposes from lines of credit for consumption.
In 2017, this subset of PH companies was composed of more than 326,000 productive units, which represented 59% of the total base of companies taken as a reference61. Of this amount, 94% corresponded to the size of microenterprises62, contrasting with the proportion of PJ companies of this size, which stood at 68%63.
In line with the relative smaller size of PH companies, the balance of their debt represented only 10% of the average balance of companies registered in the Central Bank of Debtors of the Financial System (CENDEU) during 2018, including both financing granted by financial institutions and by non-financial credit providers (PNFC). In relation to access to credit, 82% of PH companies had financing during 2018 (reference period for debt), with the average debt balance of approximately $400,000. For PJ companies, the percentage of access to credit amounts to 61% while the average debt balance was 20 times higher than that recorded by PH companies.
If the gender of the owners of PH companies is considered, it emerges that 68% corresponded to men (220,454) while the remaining 32% corresponded to women (105,693)64. Although there is a significant difference in the number of PH companies in favor of men, the differences in access to financing are minimal, considering that the proportion of companies that registered financing in some month of 2018 amounts to 82% for male owners and 81% in the case of women owners. Both the smaller disparities and the high levels of access to finance remain in all sizes of companies. As mentioned above, this could be due to the fact of not being able to distinguish the destination of productive financing and consumption; for example, credit card consumption.
However, there is a substantial gap in terms of debt stock, as PH companies with male owners more than double the debt balance of those with women owners. Although PH companies with male owners are on average larger, this does not explain these differences, since considering only microenterprises, it is verified that the balance of debt of PH companies owned by men is more than double that of female owners. In any case, additional adjustments could be made (such as sector of activity, turnover, among others) to investigate whether there are other factors that explain the difference besides gender.
Figure 3.14 | PH company financing, according to size and gender of the holder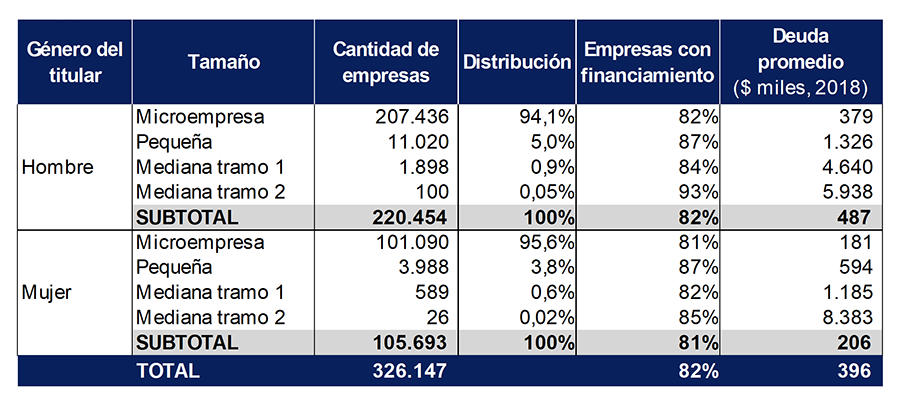
Note | Companies with financing for some month in 2018. For the calculation of the “average debt”, the average debt balance during the year 2018 is considered.
Source | BCRA and Ministry of Productive Development.
Geographically, if the regional distribution of this type of companies and their debt balances is considered, regardless of the gender of the holder, there is a marked concentration in the Central region of both the number of PH companies and their financing balance. Likewise, this agglomeration is more than proportional to its adult population, a situation that is also repeated in the Patagonian region.
Figure 3.15 | PH business financing, by geographic region and gender of the holder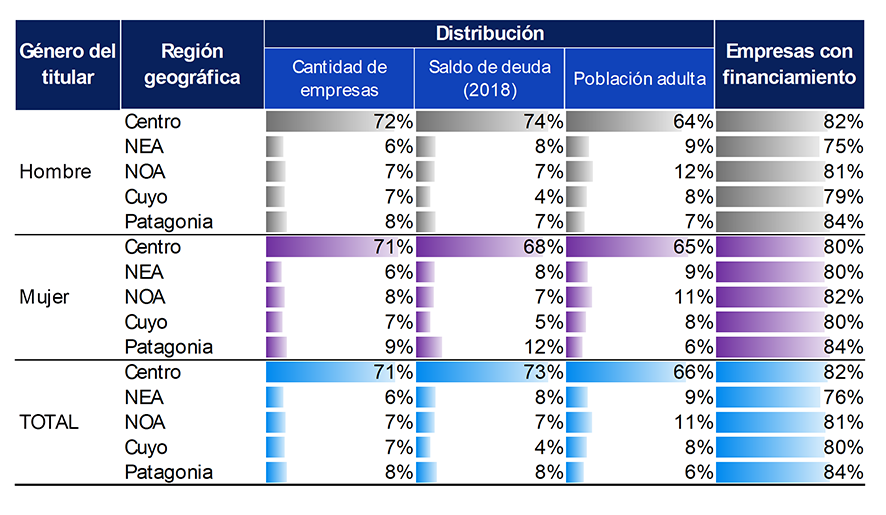
Note | For the calculation of “Debt balance”, the average monthly debt balance of 2018 is considered.
Source | BCRA and Ministry of Productive Development.
Despite these disparities, it is observed that the percentage of male-owned PH companies with financing in 2018 exceeded 75% for all geographical regions, while for female-owned companies the floor was 80%, indicating that there would not be a significant geographical bias at the level of access, which is the case in terms of the intensity of business activity and its financing.
Based on the age composition of PH business owners, there is a greater concentration in the age range of 40 to 69 years, that is, in a stage of maturity of adult life. This age group, although it represented only 39% of the total adult population of the country, comprised 69% of PH companies, which in turn accounted for 74% of the total financing of PH companies registered in CENDEU for the year 2018.
Figure 3.16 | Distribution by age group of the number of PH companies, debt balance and adult population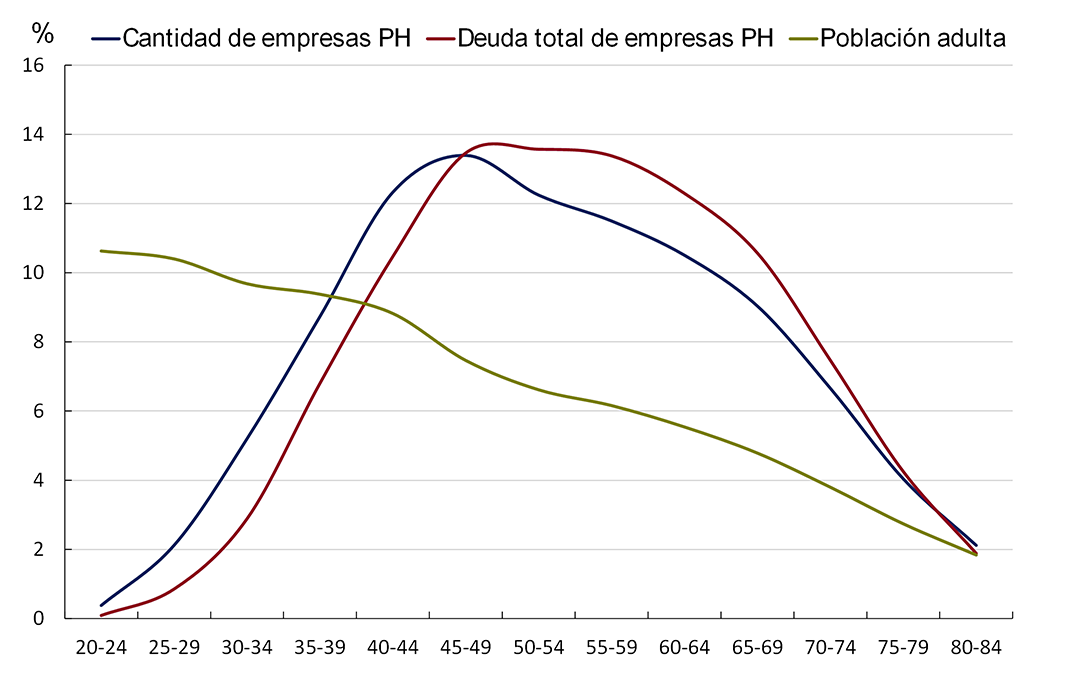
Note | For the calculation of “Total debt of PH companies”, the average monthly debt balance of 2018 is considered.
Source | BCRA, Ministry of Productive Development and INDEC.
Young people up to 34 years of age are the age group that has the least weight in the ownership of PH companies in relation to their participation in the adult population. On the other hand, PH companies with older holders largely concentrated financing in 2018 since they show a participation in debt balances more than proportional to their weight in terms of the number of PH companies.
This allocation of financing could be associated with the fact that these economic activities are in a mature stage of their development cycle, which would also explain why the young group between 20 and 39 years of age, which concentrates 40% of the adult population, has only contributed 16% of the number of productive units and concentrated 11% of the financing balance. raising the question of whether access to financing would limit the creation of PH companies in younger age groups.
In a first analysis, these metrics pose certain challenges in the geographical and age expansion of financing to this subset of productive units and in the levels of financing in the microenterprise size where the largest number of units are concentrated. This format of business activity could occupy a relevant space in the development and growth of the country’s economic activity.
Section 1 / The microcredit market in Argentina
The size of bank credit in Argentina is small compared to other countries in Latin America and the Caribbean due to a multiplicity of factors65. In this context, access to financing by the most vulnerable sectors of the population takes on a central aspect in the promotion of economic and social development66. Microcredit contributes to the fulfillment of this objective by providing financing to low-income small entrepreneurs, usually excluded from the financial system (hereinafter, microentrepreneurs67), allowing them to sustain (and eventually increase) their productive and/or commercial activities, which are the basis of their economic sustenance (self-employment) and a tool to combat poverty68.
The activity of generating, managing and granting microcredits has its own characteristics that differ from those followed for traditional credits. The most traditional model of microcredits is characterized by the granting of small amounts, with repayment terms in accordance with the productive activity carried out and by the lower demand for usual requirements such as guarantees or guarantees. In addition, microcredits are mainly provided by microcredit institutions, whose work format differs considerably from that carried out by financial institutions, since both credit evaluation and financing monitoring are generally based on visits and meetings in the field between credit counselors and microentrepreneurs. In many cases, these entities provide technical assistance to the microentrepreneur to improve the management of the finances of the enterprise.
In this section, the available statistics on this sector are reviewed, focusing on four aspects:
- 1. Financing provided by financial institutions to microcredit institutions (IMCs).
- 2. Participation of financial institutions in the share capital of IMCs.
- 3. Granting of financing by the IMCs themselves.
- 4. Direct provision of microcredits by financial institutions.
In Argentina, the Ministry of Social Development, together with RADIM (Argentine Network of Microcredit Institutions) and FONCAP (Social Capital Trust Fund), is conducting a survey of microcredit institutions with the aim of disseminating their activity and their main performance indicators, as well as providing up-to-date information for the preparation of statistics and reports on the sector.. Based on the last mapping -as of September 2019-, 51 BMIs were registered in the country70, of which 70% were concentrated in CABA, Buenos Aires and Santa Fe71.
The analysis of the scope and dimension of microcredits is a central point in terms of financial inclusion, given that their target population is commonly excluded from the financial system. By combining the information available in the survey with data from the Central Bank of Debtors of the Financial System (CENDEU), it is possible to analyze characteristics of the microcredit market such as the geographical size and gender of the debtors.
The BCRA’s regulatory framework allows financial institutions to grant financing to microcredit institutions through a mechanism specifically designed for this sector72. However, according to the data available in CENDEU, financial institutions did not register financing to IMCs through this concept during 2019. However, this does not imply that microcredit institutions do not have access to financing, but that they do so in accordance with the general mechanisms provided for in the regulations.
In this regard, it is observed that almost a third (16 of the 51) of the institutions reported in the survey took financing in the financial system during the last year, with the total debt balance being $30 million as of September 2019. This amount was reduced, in real terms73, 57% and 76% in relation to the balance of December 2017 and 2018, respectively. Likewise, considering the balance of the portfolio that these institutions have granted to their customers as of September 2019, the financing obtained from the financial system represented 1%. Thus, it is observed that the use of the financial system as a source of funding was extremely low, increasing the relevance of other sources such as financing from foreign government entities, own funds or donations.
In relation to the characteristics of the financing, 90% corresponded to short-term credit mainly associated with working capital, which was potentially intended for the granting of microcredits. Another relevant aspect is the concentration of credit in a few institutions, given that only 3 institutions accounted for 90% of the balance. Likewise, the institutions based in Buenos Aires and CABA had a share of 83% of the total balance of financing.
On the other hand, the regulatory framework also includes within the complementary activities allowed to financial institutions, participation in institutions that have as their object the financing of microentrepreneurs. In this sense, it is noted that two of the BMIs surveyed in the mapping belong to financial institutions.
With regard to the characterization of the demand for microcredits, it should be noted that some of the IMCs report their debtors to CENDEU74. As of September 2019, the financing granted to microentrepreneurs by the reporting IMCs totaled $3,000 million and reached 56,113 debtors. If we compare these values with the client portfolio of the 51 institutions reported in the aforementioned survey, the balance represented 88% of the total portfolio and the number of debtors 69% of the total debtors reported in the mapping.
Figure A.1.1 | Microcredits. Number of debtors and debt balance
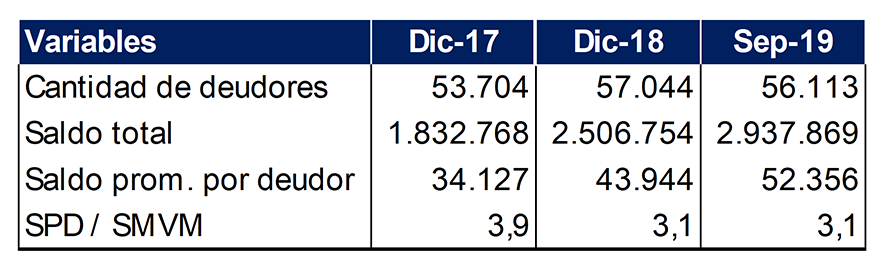
Note | Total balance in thousands of pesos.
Source | BCRA.
Analyzing these values in relation to the financial system as a whole, it can be inferred that microcredits are a little widespread instrument, since they represented 0.2% of the total balance and 0.3% of the universe of individuals who are debtors in the financial system (0.7% if only debtors for personal loans are considered). Likewise, the average balance per debtor was $52,000, which is equivalent to 3.1 Minimum Living and Mobile Wages (SMVM) for the same period.
Disaggregating by gender, there is a sustained growth in the debt balance and the number of debtors of both genders, but as of December 2018 there was a gradual decrease in both indicators. However, in all the months analyzed, a greater number of female debtors (54%) than men (46%) were observed, a behavior that differs from the rest of the credit products of the financial system, in which the participation of women is lower. However, the balances were higher for men, in line with what was observed for the rest of the different types of credit.
Figure A.1.2 | Microcredits. Number of debtors and debt balance by gender 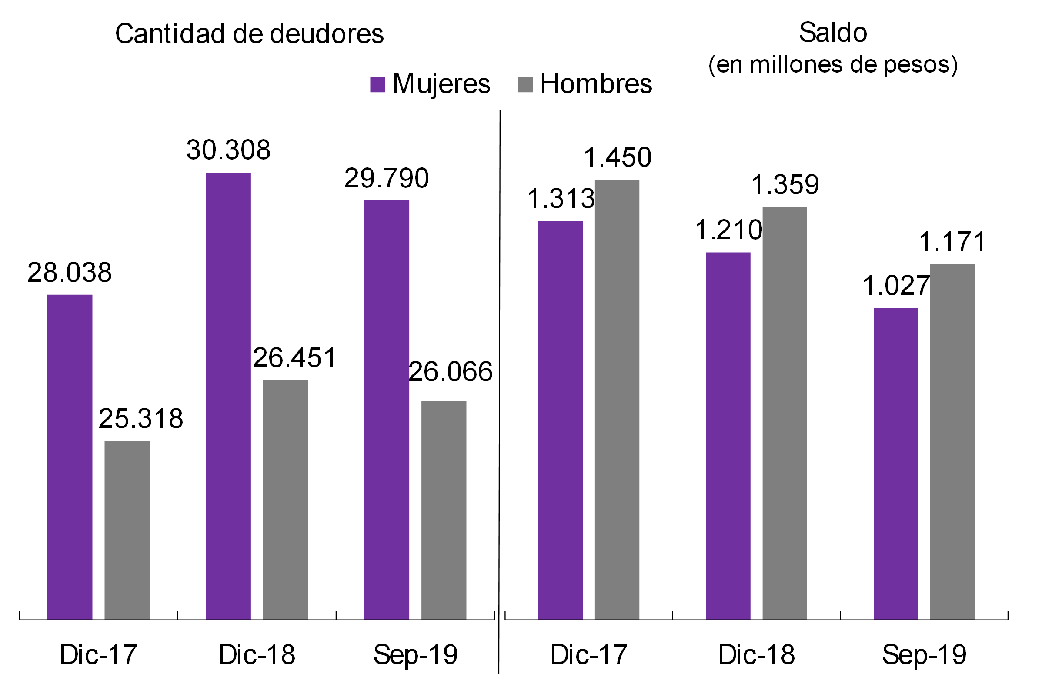
Note | The sum of the values by gender does not match the total in Figure A.1.1 because some registries do not have gender assigned. Source | BCRA.
Geographically, the largest number of debtors was registered in the province of Buenos Aires, followed by CABA and Salta. In this sense, it is observed that there is no spatial overlap of BMIs by geographical location, since each microcredit institution is limited in the granting of a specific area. The highest concentration of debtors in Buenos Aires and CABA is in line with what is indicated in the credit chapter of this IIF, since the largest proportion of debtors was in the Central region (which includes CABA).
Financial institutions can also provide loans to microentrepreneurs directly, reducing compliance with traditional requirements and providing treatment according to their characteristics75. During the last year, this regulatory facility was used by only two financial institutions, reaching a total of 450 debtors with a debt balance of $16.4 million as of September 2019.
As a financing instrument, most of the balance and quantity of microcredits are concentrated in a few institutions and therefore in a few provinces. Its link with the financial system is explained more by the participation of financial institutions in the capital stock of IMCs than by its use as a source of financing. In terms of financial inclusion, microcredit is presented as a complementary credit instrument to the traditional financial system, but which, in a first analysis, presents similar challenges, such as incorporating more credit subjects, improving geographical coverage and reducing the gender gap in the allocation of resources.
Section 2 / Fintech and financial inclusion: an analysis of the profile of its debtors
From the development of technological applications to the world of financial services, a variety of new products and associated companies have emerged in recent years, which are usually encompassed under the concept of fintech. One of these innovative financial services consists of the granting of loans in a non-face-to-face manner, either through cell phones or computers (online). Its distinguishing feature is the use of technology to dispense with the physical presence of the applicant.
Generally, the holographic signature of the contract is replaced by an electronic signature, biometrics are used for remote identity validation and alternative credit scoring mechanisms are used to evaluate the customer. For the purpose of collecting and disbursing collections, the banking infrastructure and extra-bank collection networksare used 76. In Argentina, this business scheme showed a relevant development in recent years, identifying a total of 46 active online loan firms as of December 2019.
In order to more accurately evaluate the impact that the emergence of this modality has had and its link with the financial inclusion of the population, a detailed analysis of the credit portfolio of a group of fintech companies that offer all their loans remotely is presented. To this end, the databases of the Central of Debtors of the Financial System (CENDEU) were consulted, to which some of these companies report their debtors monthly because they are registered as other Non-Financial Credit Providers (PNFC). It should be noted that not all companies that carry out this type of activity are registered77.
Taking August 201978 as a reference period, a total of 141,725 people had balances owed to one of these companies, for a total amount of $2,809 million, which implies an average debt of $19,820. Of this universe of debtors, almost 23% corresponded to individuals who did not register the collection of salaries through a salary account in the previous 12 months79. In other words, the debtors of the fintech companies analyzed correspond mostly –more than three-quarters – to formal employees, who, by collecting their salary through a bank account, already had a first link with the financial system. This subset of debtors accounts for 82% of the debt balance, with an average per debtor of almost $21,000, an amount that is 33% higher than the average debt of debtors without a salary account ($15,783).
With regard to the payment situation of these loans, the percentage of irregular debt80 amounted to 37% of the balance, a level much higher than that of the financial system (5.4%)81, mainly explained by the irregularity of the portfolio of debtors with a salary account (40%). The lowest level was presented by the group that did not register the collection of salaries from which, in the absence of additional information regarding its economic activity, it is difficult to draw conclusions. It is worth mentioning that they could be both informal workers and micro-entrepreneurs or self-employed professionals, presenting a high disparity in income levels.
Figure A.2.1 | Amount and balance for salary account holdings
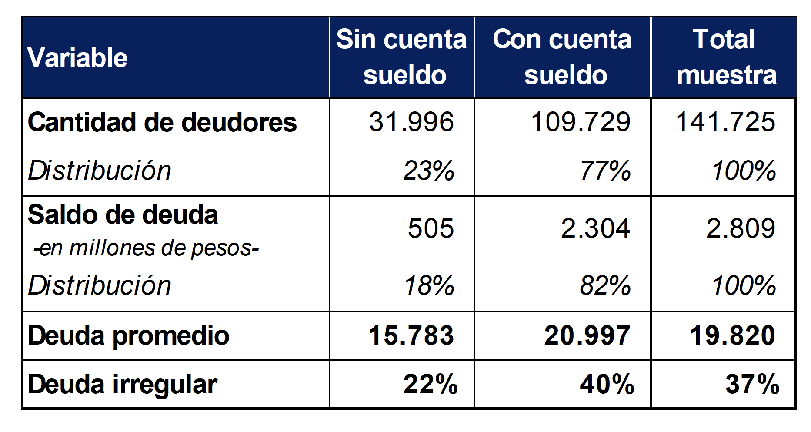
Source | BCRA.
To deepen the analysis of the behavior of fintech debtors, we investigated their credit situation with the rest of the extended financial system (SFA)82. On the one hand, only 7.5% of them did not have debit balances with the SFA. Of the remaining debtors who did have some other debt, 71% accumulated an average balance of more than $50,000, while 31% averaged a balance of $200,000. As a comparative reference, the average balance owed by a debtor of financial institutions was around $100,000 on the same date (August 2019), while only 10% of debtors exceeded $200,000.
Expanding the sample of debtors to all those who have at some point had a debit balance with any of the fintech companies analyzed from their registration as PNFCs (hereinafter, historical debtors), it was observed that the irregularity of the debt with other suppliers and financial institutions reporting to CENDEU, remained high throughout the period analyzed83. In addition, the number of debtors with at least one line in an irregular situation showed an upward trend since 2017, with an acceleration from June 2018, increasing from 50% to 64% between that month and August 2019.
In terms of the demographic characteristics84 of the historical debtors, the geographical diversity of the debtors stands out in the first place, considering the 24 provinces of the national territory. The main districts in which the assisted people were located are the province of Buenos Aires (44%), CABA (10%), Córdoba (9%) and Santa Fe (7%), in line with the distribution of the adult population85, which shows that the electronic channel gave fintech companies a wide geographical reach without the need to have their own physical infrastructure in the different points where their debtors were located.
Figure A.2.2 | Age distribution of fintech debtors vs. SFA 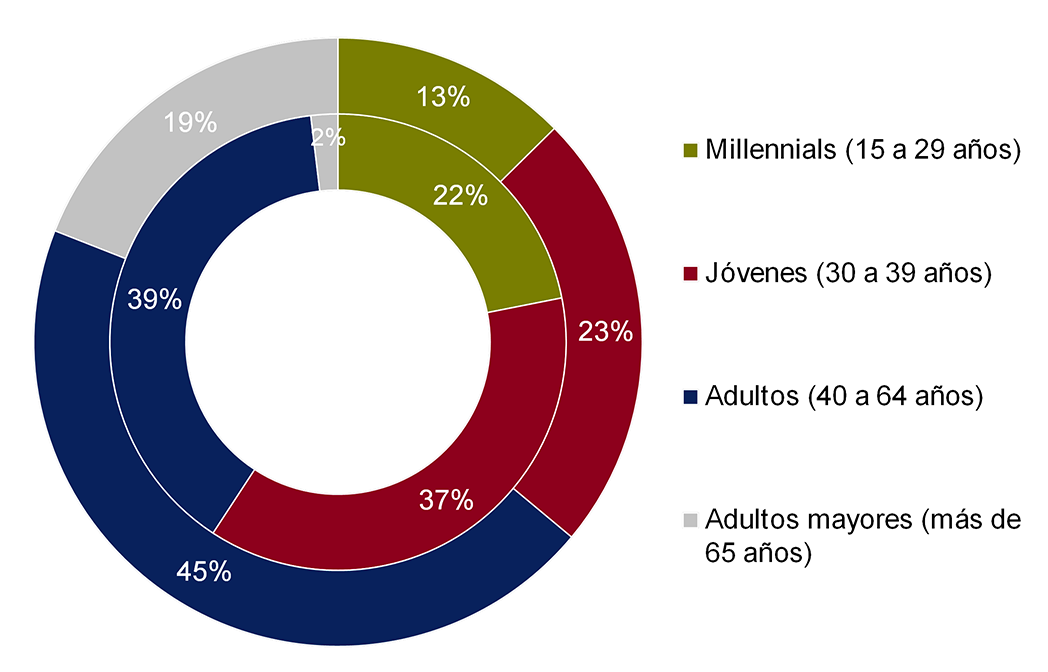
Outer ring: total debtors / inner ring: debtors of fintechs.
Source | BCRA.
As for the age distribution, a trend was observed in favor of younger people. Older adults86 barely accounted for 2% of debtors, while at the opposite extreme, millennials87 represented 22% of the total and young adults88 37%, these proportions being notably higher than those that arose considering the total number of loans registered in CENDEU.
Based on the analysis of this sample of fintech debtors, it can be stated that a small proportion were on the margins of the financial system – 23% did not have a salary account and 7.5% did not have financing from financial institutions or other credit providers – indicating a limited expansion of access to financing to traditionally excluded sectors and, with this, a low impact on the financial inclusion of the population.
This configuration raises questions about the reasons why this group of debtors – in many cases with a salary and credit account in financial institutions – has chosen fintech companies to access – in many cases, again – financing. Various hypotheses can be raised, linked to its more flexible requirements, more dynamic and agile operations through new technologies and/or the impossibility of taking credit again from the traditional financial system, among others.
Methodological note
Population
dataThis IIF presents indicators that are disaggregated by different demographic and geographical variables. For the elaboration of these indicators, population data were used based on the population projection made by the National Institute of Statistics and Censuses of the Argentine Republic (INDEC). Considering that this agency does not publish a series that simultaneously contains all the disaggregations used throughout this IIF (gender, age group and geographical location at the provincial, departmental and locality levels), it was necessary to take different series according to the definition of each indicator.
For the indicators at the national and provincial levels, the series called “Population by sex and five-year age groups for the country and provinces as a whole” was used. Years 2010-2040″, while for the indicators at the departmental level, the series “Estimated population on July 1 of each calendar year by sex, by department” was taken as a basis. Finally, since INDEC does not publish a projection of the evolution over time of the number of inhabitants of each locality, it was necessary to construct the series for the indicators at that level, for which the results of the 2010 National Census were taken as a basis.
For the purposes of this IIF, an “adult” is considered to be a person 15 years of age or older, following the standard used by the World Bank for its financial inclusion indicators.
Regionalization
For the purpose of developing regional indicators, the regionalization criterion proposed by the Ministry of Economy and Public Finance (now the Ministry of Economy) was used, which establishes five regions, namely:
NOA (Northwest Argentina): Salta, Jujuy, Tucumán, Catamarca and Santiago del Estero.
- • NEA (Northeast Argentina): Formosa, Chaco, Misiones and Corrientes.
- • Nuevo Cuyo: Mendoza, San Juan, San Luis and La Rioja.
- • Patagonia: La Pampa, Neuquén, Río Negro, Chubut, Santa Cruz and Tierra del Fuego.
- • Centro and Buenos Aires: Córdoba, Santa Fe, Entre Ríos, Buenos Aires and the Autonomous City of Buenos Aires.
In the text of this IIF, Nuevo Cuyo is mentioned as Cuyo and Center and Buenos Aires as Center.
Extra-bank
withdrawal pointsIn order to carry out the analysis of businesses that allow cash withdrawals, a survey was carried out consulting the different companies that offer the service. Once the data was received and consolidated, the address reported for each extraction point was used to identify those businesses that operate through more than one brand simultaneously with the aim of eliminating duplications and obtaining a list of unique businesses.
With regard to the classification according to the main items, it is mentioned that the extraction points corresponding to the non-bank collection companies for which a specific activity could be identified (for example, a warehouse) were assigned to that activity, while the rest were classified as “collection centers”. This classification into items may present differences in relation to the previous survey carried out in March 2019.
Credit to productive
unitsThe base of companies used in this study, provided by the Ministry of Productive Development, is composed of the productive units of the non-financial private sector that registered at least one employee in each of the years considered. The database has information up to 2017. For the analyses of 2018 and 2019, the 2017 company base was used, so all those that have been created subsequently are excluded, and others that could have disappeared are still considered. For this reason, the indicators for these years should be considered provisional.
The size classification was made based on the legal limits by sector established by the Ministry of Productive Development, although considering only the size of the number of employees of the companies and dispensing with the billing criterion because they do not have the necessary information at the firm level. Finally, the sectoral classification is based on the main activity that each company registers with the AFIP, from which the province in which they register tax domicile is also obtained.
Regarding the size and composition of the base, it can be noted that there are no major transformations in the period under analysis. The total number of companies was approximately 567,000 at the beginning (2007), reaching 600,000 three years later and then stabilizing around that value, with a maximum of 612,000 in 2013. The composition according to type of person changed slightly in favour of the PJs, which increased their participation year by year since 2008, from 36.5% to 40.7% in 2017. According to size, the distribution was practically unchanged in the period, with approximately 84% of microenterprises, 11.5% of small companies, 3.8% of medium-sized companies section 1, 0.5% of medium-sized companies of section 2 and 0.2% of large companies.
References
1 Considers all deposit accounts in pesos and fixed terms in both pesos and UVA.
2 TO Time deposits and investments. Point 2.8.
3 Prepared by the author based on the Monthly Accounting Information Regime – Balance Sheet.
4 An adult is defined as a person 15 years of age or older.
5 Non-bank credit and/or purchase card issuers and other non-financial credit providers.
6 Source: BCRA. Information as of September 2019.
7 Communication A6857
8 Communication A6911?y? A6912
9 Communication A6909
10Communication A6901
11 Communication A6942
12Communication A6949
13 Communication A6937 and A6946
14 Decree 326/2020
15 Communication A6945
16 Communication A6949
17 Communication A6938
18 As of 2017, the BCRA allowed the installation of ATMs operated by non-financial entities. In this way, the PDAs also include this type of ATM. As of December 2019, they totaled 300 nationwide.
19 See Methodological Note for the regionalization criterion used.
20 See Methodological Note for additional information regarding classification into items.
21 T.O. “Savings, Salary and Special Deposits”, Section 3, Point 11, “Universal Free Account”.
22 It is clarified that there is no information available on sole account holders for the payment of social programs or retirement and/or pensions.
23 Source: ANSES. H.2.1 – Country Total. Holders of the AUH. Child and Child with Disability
24 It is important to mention that, while the BCRA’s statistics come from supply-side data, the Global Findex figures are based on self-reported data – personal interviews with a sample of individuals.
25 Source: ANSES – H.2.2 – Country Total. AUH holders, by sex and age group. The value of June 2018 was taken since the value corresponding to March 2018 is not available.
26 Source: P.2.4 – Country Total. Sole holders with at least one retirement or contributory pension per age group and sex. The value of June 2018 was taken since the value corresponding to March 2018 is not available.
27 Labor market data correspond to the third quarter of 2019 (Source: INDEC).
28 It is calculated as the monthly average of the daily balances of each deposit account, that is, the money that is deposited in each account each of the days of the month.
29 According to the results obtained by the Survey for the Measurement of Financial Capabilities.
30 Refers to interbank transfers.
31 Except for credit card amounts.
32 Communication A6212
33 Communication A6425
34 Communication A6425
35 Communication A6859
36 Communication A6885
37 Communication A6235
38 T.O. Time Deposits and Investments, Section 2.8. Deposits with early cancellation option in Purchasing Value Units upgradable by “CER”, Law 25,827 (“UVA”) and news about the launch of the Pre-cancelable Fixed Term.
39 The nomenclature “number of fixed terms” refers to the number of fixed-term certificates in force on the last working day of each quarter.
40 It refers to avoiding transactions that involve risks of money laundering and terrorist financing.
41 “Sound management of risks related to money laundering and financing of terrorism” Basel Committee on Banking Supervision. June 2017.
42 “FATF Guidance on AML/CFT measures and financial inclusion, with a supplement on customer due diligence”. November 2017.
43 Sources | Argentina: Ordered text of “Savings, salary and special account deposits” (as of 02/19/2020).
Mexico: Circular 03/2012 of Banxico of 2012 amending Circular 2019/95 of 1995 Credit Institutions Law (LIC) article 115 General provisions referred to in art. 115 of the LIC.
Colombia: External Circular 053 of 2009 External Circular 013 of 2013 Chapter IV of Title II of the Basic Legal Circular.
Peru: SBS Resolution No. 2108 of 2011. SBS Resolution No. 2891-2018.
Paraguay: Resolution 25, Minute 51 of July 18, 2013 of the Central Bank of Paraguay.
44 All non-bank credit and/or purchase card issuers must be registered in the “Register of non-financial credit and/or purchase card issuers”, while other non-financial credit providers must be registered in the “Register of other non-financial credit providers” if they are linked to financial institutions and/or if they are subject to credit from financial institutions. if they exceed 20 million pesos in financing granted. TO Credit Assistance to Non-Financial Credit Providers.
45 The geographical distribution of debtors is made according to the domicile declared to the AFIP. Consequently, it could be the case of debtors who migrate from jurisdiction to obtain financing (for example, residents of the province of Buenos Aires who take a loan in CABA).
46 It should be noted that a person may have a registered job and not have a salary account, for example, by receiving his salary in cash.
47 As of early April 2020, 122 ETCNBs and 272 OPNFCs were registered.
48 The analysis by type of provider must be interpreted considering the number of entities or institutions in each group, as well as the geographical scope of each institution and the profile of customers. These variables affect the result of the indicator.
49 As of September 2019, financial institutions and ETCNBs reported 39.5 million credit cards, of which 71% registered at least one settlement during the previous 7 months (Source: BCRA).
50 In accordance with the Debtor Classification Order, financial institutions and PNFCs classify each of their debtors in one of the 6 situations provided for, taking into account all the financing they have granted them. In this way, each debtor will have a classification for each entity that has provided financing.
51 EPH, INDEC
52 Calculated as a percentage between the economically active population and the total reference population.
53 Calculated as a percentage between the employed population and the total reference population.
54 In this document, MSMEs are considered to be micro, small enterprises and medium-sized enterprises section 1 (medium-sized enterprises section 2 are excluded).
55 This section and the following section do not include financing assigned to financial trusts.
56 For the calculation of relative performance, the rate of change in the percentage of companies without financing (or excluded) between the final moment (2018) and the initial moment (2007) is measured. For example, in the case of PJ microenterprises in the agricultural sector, the percentage of companies without financing at the beginning was 51%, a value that fell to 35% at the end of the period analyzed. In other words, this percentage was reduced by 16 p.p., which in relative terms implies a 31% decrease (35 – 51= -16; -16/51= -31%).
57 Private sector dollar deposits in financial institutions were approximately USD 9,300 million as of December 2015, USD 21,500 million a year later, and USD 28,500 million as of December 2018 (Daily Monetary Report).
58 Debt in situation 3 or higher is considered irregular, according to the ordered text of the Classification of Debtors.
59 The year 2019 is included in this case due to the relevance of presenting more updated information for this indicator, noting that the values constitute a provisional estimate since they were obtained from a database of companies with information as of 2017. Based on historical dynamics, it can be estimated that the set of companies used corresponds to at least 90% of the one in force in 2019. On the other hand, it is noted that the observed evolution (increase in the percentage of companies with irregular financing) occurs in a generalized way for all sizes of companies, and that for larger companies the base presents greater stability, which reinforces the robustness of the results presented.
60 This means that they register employees with the AFIP directly under their person. This type of venture can range from an independent professional who hires an assistant or secretary, to a larger company such as an agricultural production or a manufacturing industry.
61 All companies in the non-financial private sector with at least one registered employee during some month of 2017 are considered.
62 Microenterprises, according to the legal classification, may have a maximum of 5 to 15 employees, depending on the sector (on average, up to 9 employees). See Resolution 220/2019
63 The universe of PH companies active in 2017 is considered, and financing data for 2018 are shown.
64 Large PH companies are excluded from the analysis.
65 Section 3 / The challenge of boosting credit, IPOM February 2020, BCRA.
66 Microfinance and the challenge of financial inclusion for development, Economic Essays No. 67, Dec-2012, BCRA.
67 Point 1.1.3.4. TO Credit Management
68 Idem, footnote 2.
69 Mapping, September 2019.
70 Annex 1, Mapping. For the purposes of this section, CONAMI’s social inclusion microcredit programs are not considered.
71 The provinces were assigned according to the fiscal domicile of the institution or the information collected from its website.
72 In each period the main debtors may vary. In addition, they do not necessarily coincide with those presented by each of the entities in Graph A.5.1.
73TO Credit Management. Point 1.1.3.4.b.
74 At this point, it should be noted that IMCs are not required to report their debtors to the BCRA, except for those that have registered as “Other non-financial credit providers”. Four IMCs currently report their debtors to CENDEU.
75 Communication A 5998: This type of financing has a limit of 50 SMVM, which amounts to $844,000 at December 2019 values.
76 For more details on the legal aspects of fintech credit, see the following article: link.
77 See footnote 44 for PNFC registration guidelines.
78 This month is considered for reasons of availability of information.
79 The data submitted by the financial institutions to the BCRA are taken with the list of employees who receive salaries with credit in salary accounts.
80 Loans that are 90 days or more in arrears are considered to be in an irregular situation. /p>
81 Data corresponding to the irregularity of the household consumption portfolio as of August 2019 (Source)
82 For the purposes of this analysis, the “expanded” financial system (including non-bank card issuers and other non-financial credit providers included in the CENDEU) is considered.
83 January 2015 to August 2019.
84 The data recorded in the register of the Federal Administration of Public Revenues (year of birth, gender and province of tax domicile) are used.
85 According to INDEC data, the adult population (15 years of age or older) is distributed in a very similar way: the Province of Buenos Aires 39%, Córdoba and Santa Fe 8% each and the City of Buenos Aires 7%.
86 Older adults are considered to be people over 65 years of age.
87 People under 30 years of age are considered millennials .
88 Young adults are considered to be people between 30 and 39 years of age.
Share on


