Executive summary
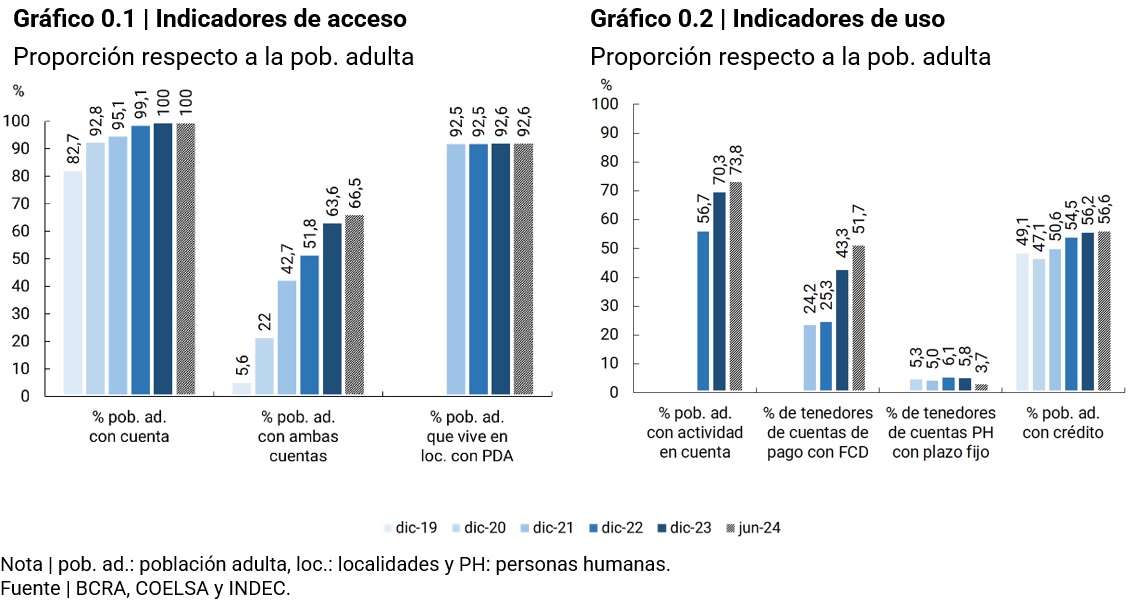
Both account access and usage continued to include more individuals | In June 2024, individuals with accounts reached 36.8 million, registering a net increase of 1.2 million compared to June 2023. The group with joint bank and payment account holders accounted for 66.4% of the adult population, with an increase of 4.5 p.p. compared to last December. Likewise, in the second quarter of 2024, 73.8% of individuals with accounts registered at least one transaction for the crediting or debiting of funds, with a year-on-year increase of 12.4 percentage points.
Electronic payments continued to advance to the detriment of the use of cash | In the first half of 2024, the adult population made an average of more than 40 electronic payments per month, 73% more than in the same period of 2023. The contrasting behaviors between cash withdrawals and electronic payments suggest that the latter, particularly immediate ones (transfers and Payments with Transfers), are playing a relevant role in the decrease in the use of cash.
Mutual Funds (DCFs) continued to expand their reach among savings and investment products for individuals | The number of payment accounts with DCF balances increased from 13.8 million in December 2023 to 18.6 million in June 2024, representing approximately 51.7% of payment account holders.
Credit to individuals continued with the inclusion of new individuals | With a net increase of 200 thousand people (1%) compared to December 2023, access to financing through financial institutions (EEFF) and non-financial credit providers (PNFC) reached 56.6% of the adult population in June 2024. More than half (53%) of people who entered the credit market (1.7 million) obtained financing through PNFCs, where average balances per debtor are historically lower than in the EEFFs.
Average Funding Balance per Debtor Began to Expand in the Second Quarter of 2024 | After several months of contraction, the average balance of financing ($1.2 million) began to grow as of March, although it is still below the values reached in previous years.
Financing to MSMEs through the capital market has grown strongly in recent years | This financing reached 1.6% of the Gross Domestic Product in the second quarter of 2024, although it represented a low proportion in relation to what was granted by financial institutions to this group of companies. The growth of electronic promissory notes in foreign currency was highlighted, an instrument that allowed the extension of average financing terms. Likewise, mutual guarantee societies, the main issuers of guarantees for MSMEs, have increased the number of guaranteed companies in recent years.
Instant payments in Argentina drove the retail payments market and expanded the use of electronic payments | Instant payments, characterized by the immediate transfer of funds between consumers and sellers and lower fees for merchants, have expanded globally in a context of widespread growth in electronic payments.
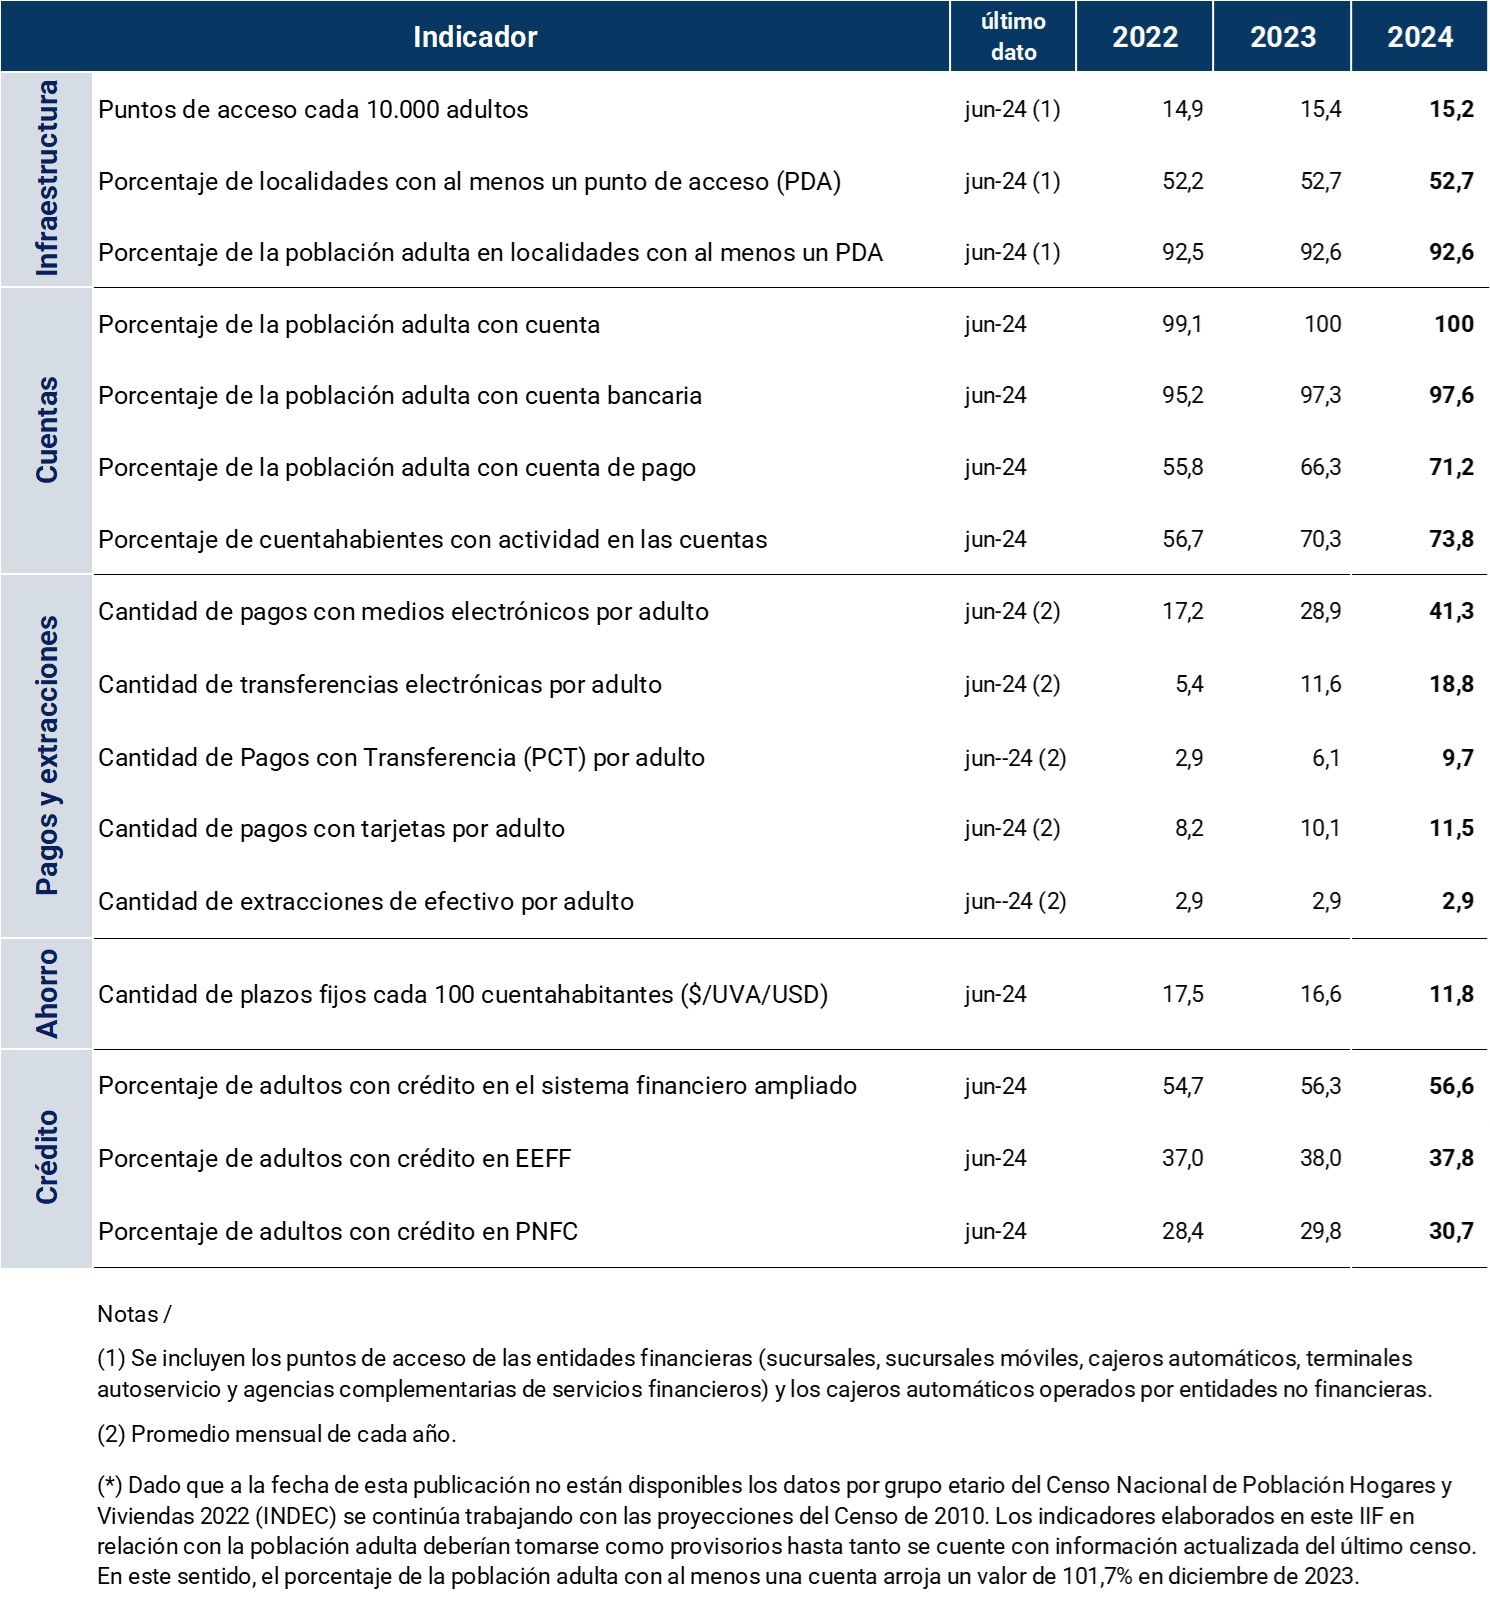
Indicator Table | Financial inclusion in Argentina
Introduction
Financial inclusion in Argentina showed progress in some of its main components during the first half of 2024, although certain challenges remain. People who only had bank accounts continued with the trend of adding payment accounts, which would have a positive impact on the use of electronic means of payment and access to investment products. Likewise, the indicators of use of electronic means of payment and the number of people with financing continued to show progress.
The role of non-banking institutions, both in the transactional field and in savings and credit, was relevant in the access and use of financial products and services. In the case of credit, the financing granted is for average values lower than those registered in the traditional financial system and at higher interest rates.
This happens in a context where the functioning of the financial system1 operates on a layer of free and interoperable basic financial services that, simultaneously, have positive externalities for the system as a whole. On the one hand, the greater use of electronic means of payment reduces the costs associated with cash management, provides greater security in the transactions of individuals and companies and generates a history that allows their users access to new financial services. On the other hand, by expanding the use of their accounts2 to new savings and credit products, users contribute resources to the financial system for their subsequent intermediation.
In the first half of the year, different measures by the national government and the BCRA had an impact on access to and use of financial services. To improve access to financial services, the conditions for opening accounts in foreign currency were facilitated and some regulatory elements were adjusted in order to achieve a better functioning of services linked to accounts in pesos and in foreign currency. In addition, the requirements for the opening of complementary financial services agencies were simplified and the operations allowed at these access points were expanded.
With regard to the use of financial services, the adoption of electronic means of payment continued to be promoted through tax incentives, the creation of new electronic payment alternatives and the promotion of competition. Some of these measures include the interoperability of QR codes for credit card payments, the elimination of withholding taxes on electronic payments, the elimination of tariff caps for debit card and credit card collections, and the expansion to other means of electronic payments for the collection of public transport fares and tips. Also, the minimum limits on interest rates for fixed terms and the minimum financing quotas for MSMEs were eliminated. In addition, new incentives were implemented for consumer and productive credit, such as Simple Quota and Minimum MSME Quota.
This happened in a context where the annual nominal monetary policy rate went from 100% in December 2023 to 40% in June 2024. This had its downward correlation in the passive and active rates of the financial system, such as the interest rate on 30-day deposits and the interest rate on personal loans, which fell 72 and 78 p.p. in the first half of the year, respectively. Likewise, the price level measured by the Consumer Price Index (CPI) continued to grow, although at a slower pace.
Reducing inflation is an indispensable condition for achieving financial inclusion and improving people’s financial well-being. Inflation disproportionately affects the poorest households, which have fewer financial tools to protect themselves from rising prices. These households represent a larger share of the population than in advanced economies.
For their part, the indicators of economic activity, employment and income showed contractions during the first quarter of 2024 and stability or growth in the second. Wages in the economy fell in the first months of the year, but with marked heterogeneity between sectors. Wages in the registered private sector grew by 8% while those in the unregistered and public sectors fell by 6% and 4%, respectively3. In April 2024, activity found a floor and in May it grew 0.6% compared to the previous month, remaining unchanged on June4 . Registered employment added 25,000 positions in May and June5; and total wages grew in real terms from their bottom in March and have recovered 6.9% since then.
Finally, the financial inclusion of the population presents opportunities for improvement. On the one hand, the density of financial infrastructure in localities with access points could increase judging by the results achieved by other Latin American countries. On the other hand, there are small towns that still do not have coverage of access points to financial services. On the side of savings products, although it was observed that the use of investment instruments (for example, Mutual Funds) was widespread among the population, this seems to be associated with a behavior of sustaining the purchasing power of transactional money and not with long-term savings goals. Thus, challenges remain in terms of the use of longer-term savings instruments, such as fixed-term loans. In terms of credit, penetration in the population continued to grow, reaching high levels in terms of the adult population. However, the total credit balance remains low relative to the size of the economy, with short-term financing predominating. This poses the challenge of extending terms, expanding the range of products and contributing to greater competition in terms of interest rates.
1. Financial infrastructure
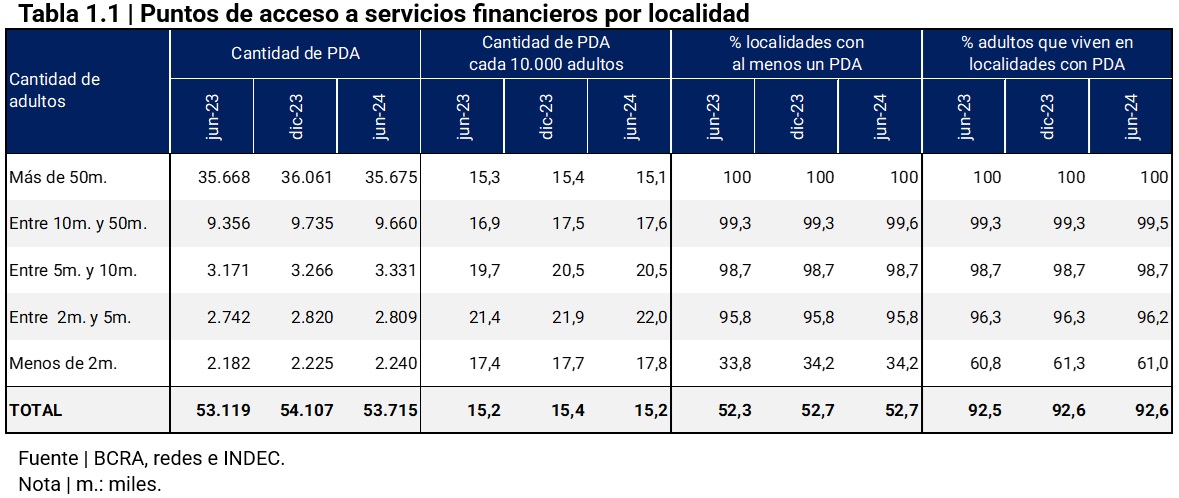
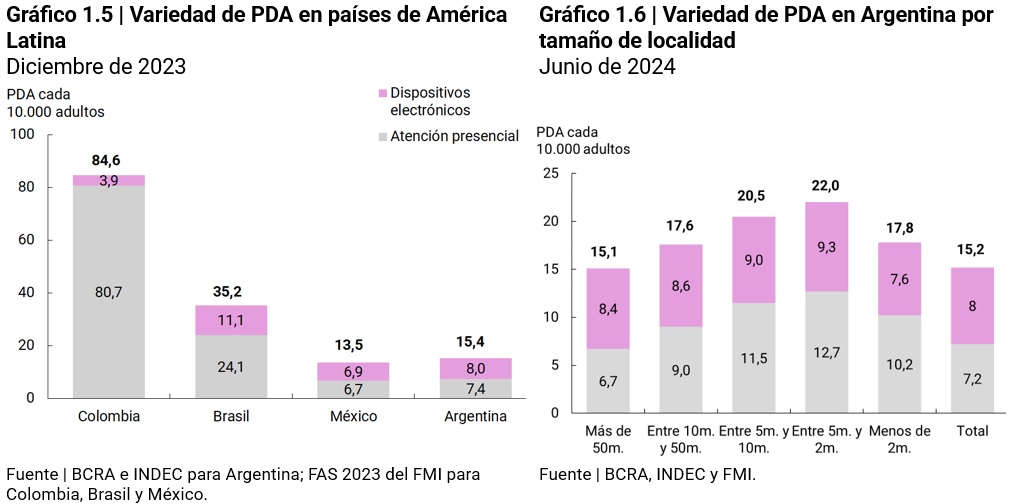
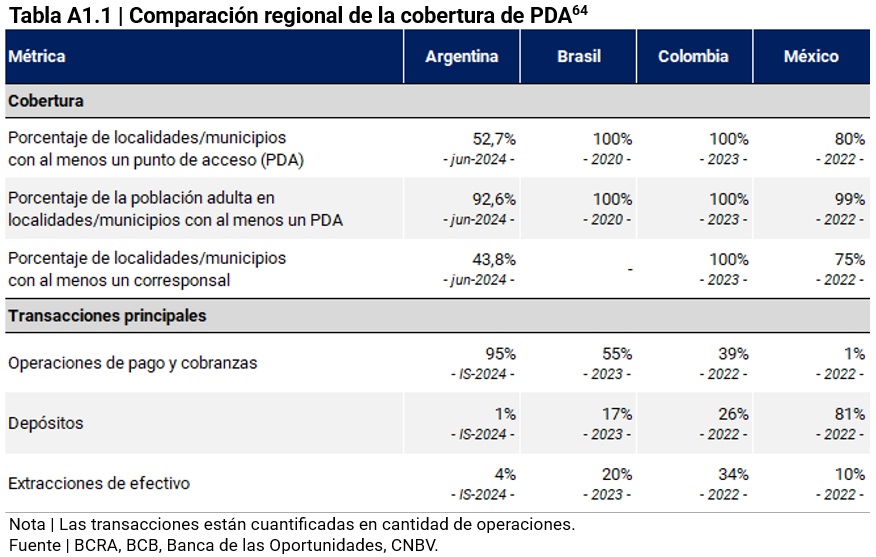
Financial infrastructure coverage indicators registered small changes in the first half of 2024. In June 2024, 52.7% of localities and 92.6% of adults had coverage of at least one financial service access point (PDA)6, maintaining the coverage ratios of December 2023. The density of ADP was 15.2 ADP units per 10,000 adults, lower than that of countries such as Mexico, Brazil and Colombia7.
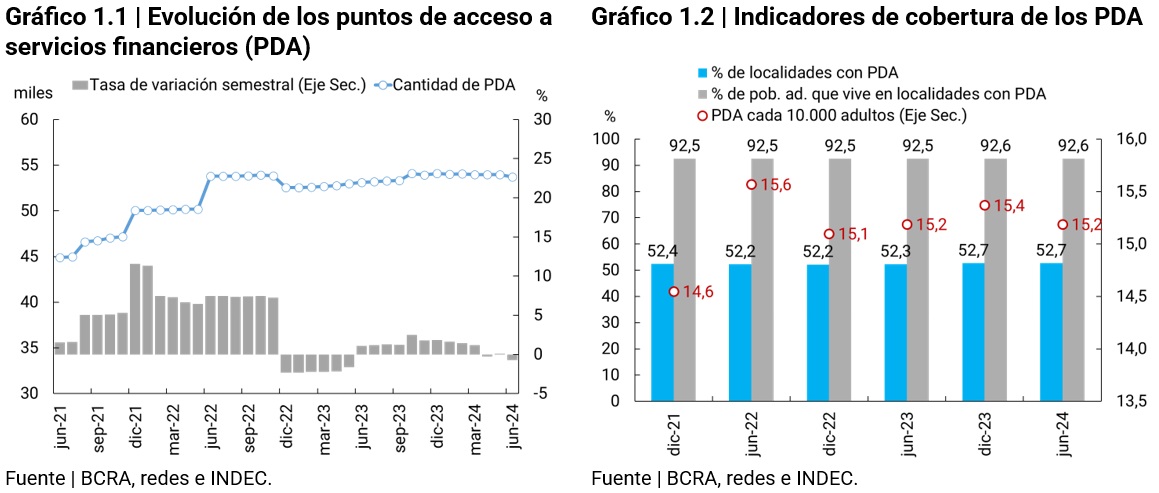
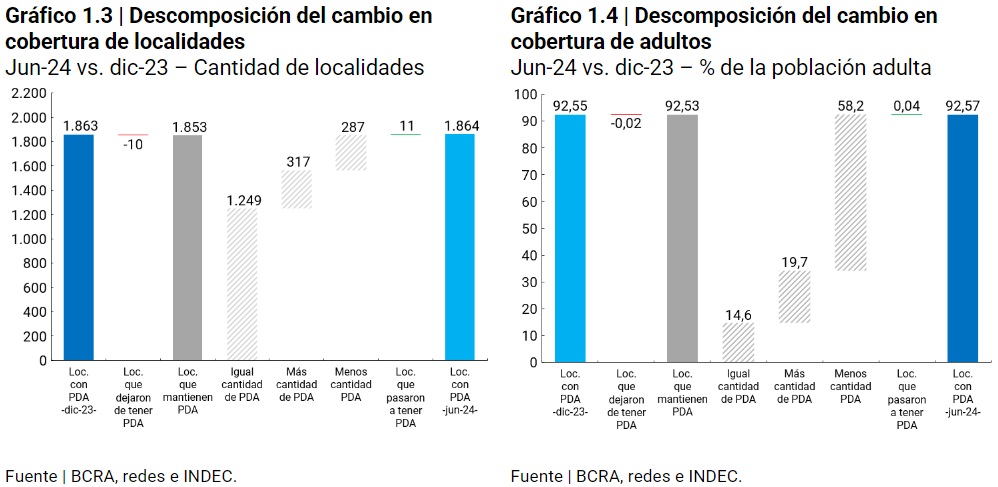
Despite the half-yearly decrease of 0.7% (-392 units) in the total number of FLWs, which reached 53,715 units8 , coverage was not affected, as the reduction occurred in localities that had other ADPs. In the first half of 2024, the set of localities with PDA coverage added one locality. Behind this increase in net terms, 11 localities gained coverage and 10 lost, representing 0.04% and 0.02% of the country’s adult population, respectively. The localities without PDA coverage reached 1,674 units and concentrated 2.6 million adults.
There are different elements that drive the slowdown in the pace of expansion of physical infrastructure: (i) the almost full coverage of people with bank accounts and the advance of the digitalization of financial services: digital channels (home banking, mobile banking, virtual wallets, etc.) make it easier for the population to start operating or expand the number of financial institutions (EEFF) and payment service providers (PSPs) with which they operate and they see grow its customer base without realizing the need to expand the physical infrastructure, both its own and that of third parties; and (ii) the shallow depth of the Argentine financial system. As an example, a financial system with long-term assistance would imply the existence of a larger network of PDAs in order to serve and advise customers on the existing alternatives to finance themselves.
However, the physical infrastructure still plays an important role in the administrative procedures and the sale of new products and consultations with the EEFF – since these still have a strong face-to-face content – and in the provision of cash – of widespread use. In this context, the physical infrastructure presents a pending challenge in the localities that have PDA coverage. Table 1.1 shows that the coverage problem is mostly concentrated in localities with fewer than 2,000 adults. On the other hand, considering the difference in the density of FLW compared to other countries in the region, the physical infrastructure could present a problem of quantity and variety in the localities already covered, which would generate a deficit in benefits.
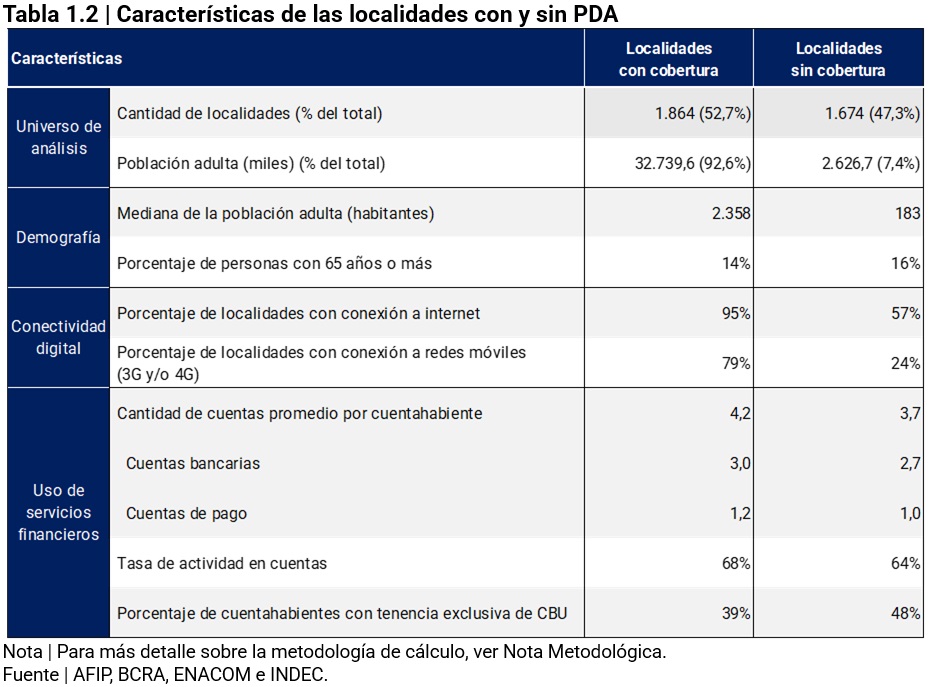
Characterization of localities not covered by PDA. To better understand the coverage problem, Table 1.2 compares the set of localities without PDA coverage as opposed to those that do. Based on the available information, the comparison presents certain characteristics of the population and the infrastructure installed that may influence the demand for financial services.
Among the most relevant differences, it emerges that: (i) localities without FLW coverage have, on average, an older population than the population of the covered localities; (ii) regarding access to and use of accounts, the average number of accounts per account holder is, on average, 0.5 units lower in localities without PDAs compared to those with PDAs (3.7 vs. 4.2), while the activity rate of these accounts is lower (64% vs. 68%) and there is a gap of 9 p.p. in the exclusive possession of a bank account between both types of localities (48% vs. 39%); (iii) regarding their connectivity levels, only 57% of localities without PDAs have some type of internet connection compared to 95% of localities with PDAs, while the gap is even larger in the range of mobile networks (24% vs. 79%).
These factors suggest that the inhabitants of these localities present more elements towards the demand for face-to-face financial services and less towards the adoption of digital financial services. Taking into account the experience of other countries in the region, the coverage of this type of localities was carried out through banking correspondents (or ACSF). On the one hand, the nature of ACSFs makes it possible to take advantage of pre-existing infrastructure (e.g. local businesses) and not incur installation costs. On the other hand, the human attention they provide can bring the inhabitants of these localities closer to the products of the financial system.
Number and variety of access points. The next challenge is the quantity and variety of PDAs in the localities that already have them. In developing countries such as Argentina, where lower levels of education expose lower digital skills of the population, the presence of physical points is still relevant to promote financial inclusion. As mentioned above, the high use of cash and the commercial and administrative management of financial products requires face-to-face service points.
The number of PDAs per 10,000 adults is lower in Argentina in relation to countries such as Brazil, Colombia and Mexico. These countries, which in addition to sharing the upper-middle-income group9 , share similar levels of labor informality 10. In terms of variety, face-to-face service points and electronic devices, Argentina has a greater presence of face-to-face service points than Mexico, but less than Colombia and Brazil, explained by the greater presence of correspondents in these two countries.
In conclusion, the largest localities in Argentina seem to face a deficiency in the number of face-to-face service points compared to other smaller localities and selected countries. Despite the fact that these urban areas concentrate people who usually have the skills to carry out electronic transactions, certain administrative and commercial procedures still require face-to-face contact.
2. Account Access and Use
The number of individuals (PH) holding accounts stood at 36.8 million as of June 2024. This variable registered a net increase of 1.2 million in relation to the same month of the previous year, which meant a year-on-year increase of 3.3%. As mentioned in previous Financial Inclusion Reports, the continuous increase in individuals with bank and payment accounts (year-on-year increase of 3.9 million) to the detriment of the group of people with only bank accounts (year-on-year fall of 1.4 million) was highlighted. Adults with bank and payment accounts accounted for 66.4% of the adult population in June 202411 .
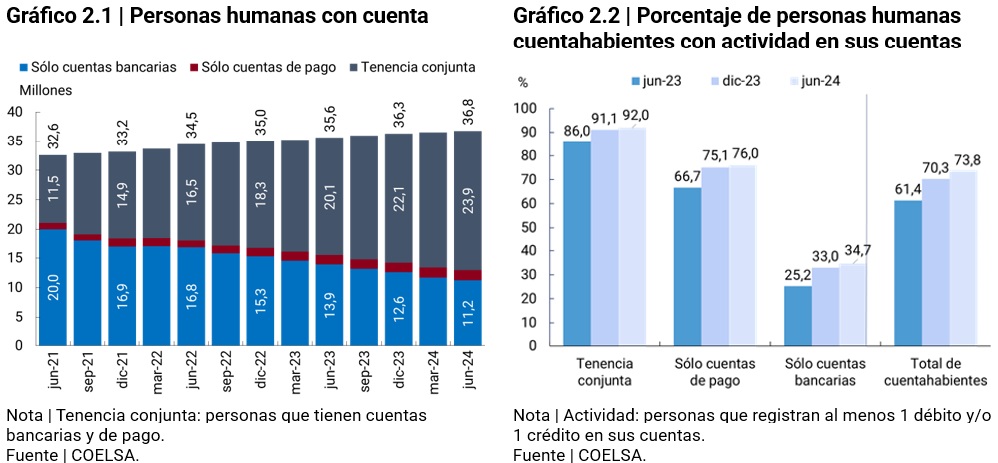
Likewise, the number of people with activity on their accounts continued to increase. In the second quarter of 2024, the number of PHs that registered at least one credit or debit operation12 was 27.1 million, that is, 73.8% of the PH account holders as of June 2024, with an increase of 12.4 p.p. 13 . This meant a net increase of 5.3 million people compared to the same quarter of the previous year, that is, a year-on-year increase of 24.2%.
The growth in joint tenure was reflected in more individuals choosing to add payment accounts to their bank accounts. In the first half of 2024, the net opening of14 payment accounts amounted to 14 million, of which 11 million corresponded to people with joint tenure. People who had only bank accounts by the end of 2023 opened 1.9 million payment accounts, which is in line with the transfer of these people to the joint tenancy group.
The interoperability between payment and bank accounts facilitates the use of these in a combined way, allowing users to choose the services and products that best suit their needs and, in this way, improve their degree of financial inclusion. This trend can be seen in the indicators for the use of transfers, Payments with Transfers (PCT) and Mutual Funds (DCF) (See section 3). In addition, only 25% of people with both types of accounts logged activity with a single account provider, suggesting that most users take advantage of interoperability between accounts.
However, there is still a group of human persons (PH) who only have bank accounts. This could be due to demographic and socioeconomic factors, such as age or lack of familiarity with technology, or that the opening of the account does not come from an active decision of the person but from another institution (for example, ANSES in the case of retirements).
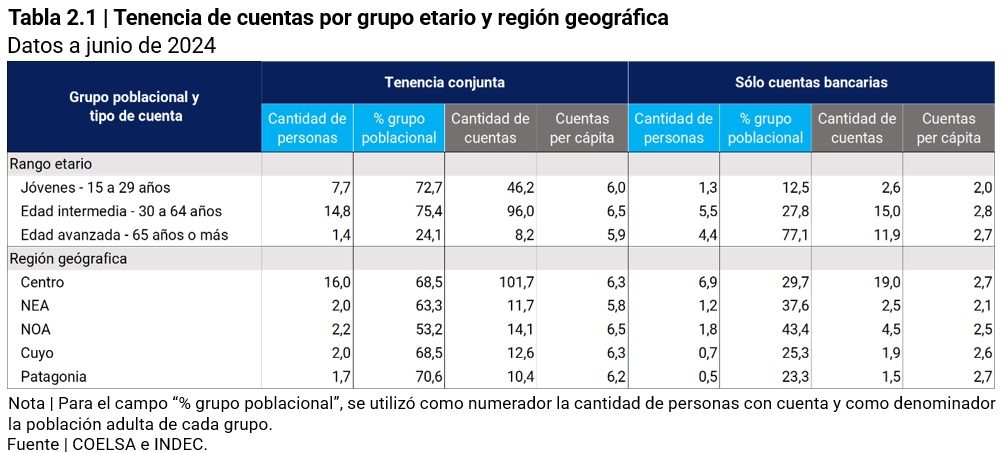
In this sense, as of June 2024, about 40% of people with only bank accounts belonged to the age group of 65 years or older. Within this age range, the exclusive possession of bank accounts was predominant, since 77.1% of people had only bank accounts, a figure that doubled that of middle-aged people (27.8%) and far exceeded that of young people (12.5%).
Lower use of the internet and mobile devices15, as well as limited familiarity with technology among older people, could explain differences in account ownership and the number of accounts per capita, given that opening and using payment accounts requires access to the internet and cell phones. In the case of the regions, the technological factor does not have the same incidence as in the age group, since the urban agglomerations of the five regions did not report significant differences in internet connectivity16 and the use of computers and cell phones17. Outside the urban environment, internet connection difficulties could have a negative impact on levels of joint account ownership.
Box 1 | Foreign currency accounts
As of December 2023, the National Government and the BCRA introduced changes in the regulatory framework that could boost transactions in foreign currency, such as the equalization of the requirements for the opening of savings banks in foreign currency18 19 and the Asset Regularization Regime 20. These regulations encourage the transactional use of foreign currency accounts through different electronic means of payment21.
As of June 2024, half of the adult population had bank accounts in foreign currency. This group reached 17.2 million human persons. In the first half of 2024, around 1.6 million people began to have accounts in foreign currency, in contrast to the same period of the previous year, when just over 1 million new people were added. This behavior shows some interest in holding accounts in foreign currency. On the other hand, the possession of a salary account usually includes a package of products, including accounts in dollars. As of June 2024, 40% of people with a foreign currency account had a salary account.
When segmenting people according to their age, it is observed that middle-aged people stood out for their interest in foreign currency accounts. 54.2% of people in this age group had accounts in both currencies as of the second quarter of 2024, in contrast to the elderly (40%) and young people (35.7%). These differences could be related to the stage of the work cycle, which influences people’s ability to save. People in the most productive phase (middle age) have greater possibilities of saving, which tend to decline when the person is out of the labor force or at the beginning of their professional career.
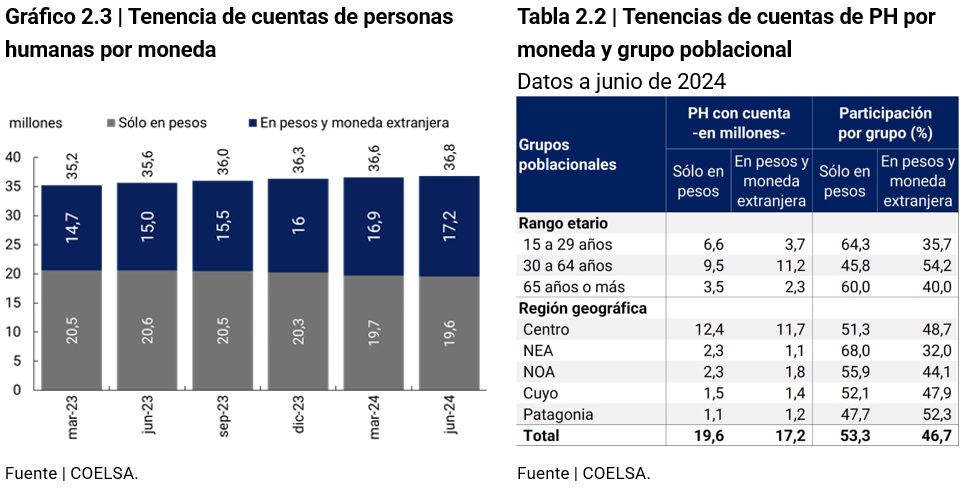
Likewise, the geographical disaggregation showed that Patagonia differed from the rest of the national territory by predominating the proportion of holders with foreign currency accounts (52.3%), while, at the other extreme, the NEA and NOA regions were located, with 32% and 44.1%, respectively. Differences in income levels between regions can influence people’s ability to save, thereby reducing the incentive to have foreign-currency accounts.
Historically, PH’s foreign-currency savings banks recorded higher average balances than the equivalent with pesos. Indeed, as of June 2024, the average balance of savings banks in foreign currency was 5.7 times higher than the average balance of savings banks in pesos. This indicator would reflect the different uses given to this type of account, transactional in accounts in pesos and for savings reasons in accounts in foreign currency. However, the stratum from 0 to 2,999 USD concentrated 97% of savings banks in foreign currency, with a share of 17.4% in the balances. This set of accounts had an average balance of 82,150 pesos, suggesting that foreign currency accounts could be used for everyday transactional purposes22.
3. Electronic means of payment and savings and investment modalities
3.1. Electronic means of payment23
The advancement of technology and regulation generated a transformation of the retail electronic payment industry in Argentina, providing the tools for consumers and businesses to manage their payments and collections in a more efficient way. Even in a context of falling economic activity, the number of electronic payments continued to grow significantly, where those with immediate accreditation and lower costs gained share. Likewise, the steady decline in the average amount per transaction shows that more and more people are using these means for their low-value everyday transactions.
In this context, new measures adopted by the BCRA and the National Government continue to enhance its use and improve the experience of consumers and businesses. Some of these measures include the interoperability of QR codes for credit card payments, the new modality of immediate pull transfers for funding between own accounts and the elimination of withholdings (value added and income taxes) on payments through electronic means of payment (MPE) for amounts up to 10,000 UVA24 .
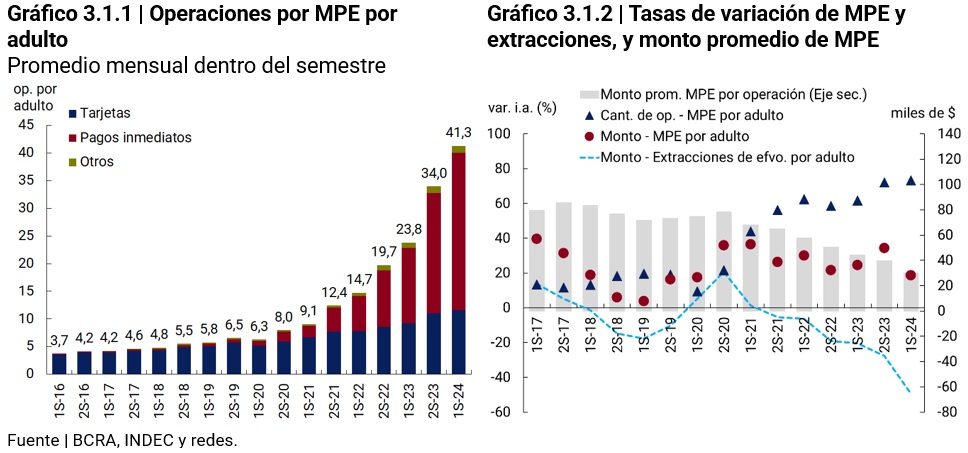
In the first half of 2024, each adult person made, on average, more than 40 electronic payments25 per month, 73% more than in the same period of 202326. This increase was in line with the higher number of people who registered activity on their account (see section Accessing and using accounts), which means that new people are using electronic payments. The contrasting trends between the series of cash withdrawals and the use of electronic means of payment (EPM) suggest that electronic payments, particularly immediate payments (Transfers and Payments with Transfers), are playing a relevant role in the decrease in the use of cash. In this way, the BCRA regulation created the conditions for users and businesses to modify their preferences, increasing the number of people who use MPE as well as the intensity of their use.
As usual, the amounts in constant terms27 per adult expanded at a more moderate rate (19% y.o.y.) than the amounts (73 y.o.y.) if the first half of 2024 is compared to that of 2023. This responds to the contractions of cards and other MPE items, mainly due to the falls in the amounts channeled through credit cards and direct debits, while immediate payments drove the increase in amounts per adult.
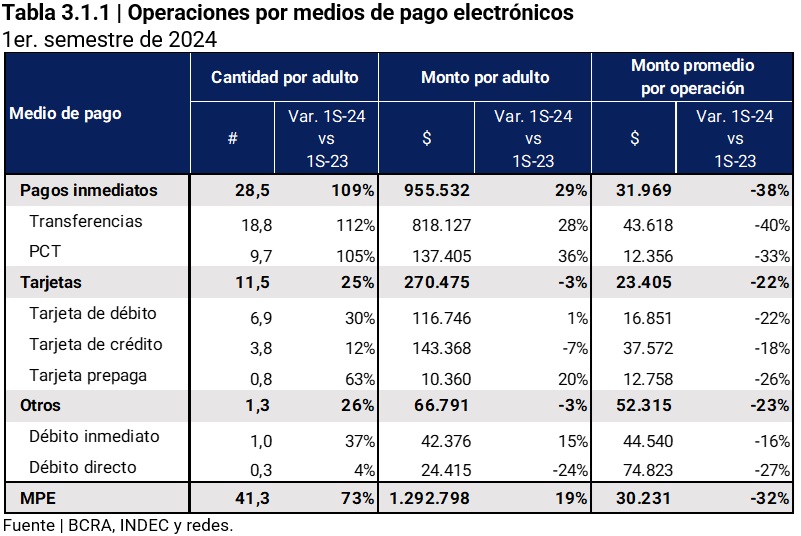
Due to the fact that MPE transactions grew more in quantity than in amount, the average amount for each electronic payment continued to decline in the first half of 2024 (-32% y.o.y.). This, as mentioned in previous editions, suggests an advance in digitization in daily and low-value operations that were mostly carried out in cash.
This trend, more electronic payments and lower average amounts, is consistent with the contraction observed in the amounts of money withdrawn at ATMs and other terminals (such as supermarket outlets), an indicator that is usually used to approximate the use of cash in payments. In recent semesters, both the amount withdrawn per adult and the average amount per withdrawal showed negative (and increasing) year-on-year rates of change. This would reflect the population’s lower need and use of cash to make retail payments, although other factors such as the impact of the activity on people’s real income may have an impact. The reduction in the share of cash in supermarket and household appliance sales are clear examples of this dynamic30 .
Immediate payments.
(i) Wire Transfers31. Once again, transfers were the most used instrument within the electronic payment ecosystem during the first half of 2024, accounting for almost half of electronic payments (46%), while a year earlier they represented 37%. This growth meant that for each debit card transaction, almost 3 transfers were made, and almost 5 for each credit card transaction. On the other hand, in the first half of 2023, these ratios were 1.7 and 2.6, respectively.
Several factors contribute to the wide adoption of transfers: (i) there are use cases that involve movements of funds, although they do not necessarily involve a payment, such as transfers between different accounts of the same holder, in an increasingly interoperable market, for the management of liquidity in an FCD and the acquisition of foreign currency (through the mechanism of buying and selling bonds); (ii) use cases that do involve a payment: the continuous development of digital wallets and banking apps promoted the familiarization of consumers and merchants/service providers in the handling of transfers, which also have the benefit of immediate accreditation and at no cost to the latter.
(ii) Payments by Transfer (PCT). In the first half of 2024, PCTs were the second most used instruments by the population (23% of total operations with MPE), increasing their participation by 3 p.p. in the period. Unlike transfers, the amounts per adult operated through PCT represented 10% of the total transacted by MPE. This is reflected in the average amount per transaction, the lowest figure in the digital payment ecosystem, which would indicate that its use is linked to operations of relatively small amounts since this instrument is used to pay in stores.
Cards. Although they lost relative weight compared to immediate payments, debit card payments grew during the first half of 2024, with a year-on-year rate of 30%. In this way, they were ranked as the third most traded instrument in number of operations. The amounts per adult showed a meager year-on-year growth of 1%, which caused a 22% drop in the average amount per operation. Despite this, the debit card remains one of the most widespread instruments, with a low average amount per transaction, suggesting frequent use for lower-value transactions.
Credit card payments showed an expansive behavior in terms of the number of transactions per adult during the first half of 2024 (12% YoY) and contractionary in the amounts per adult (-7% YoY). The historical series of amounts channeled via credit cards shows an association with the performance of the economic activity of the commercial sector. Therefore, the fall in the amounts per adult operated during this period is to be expected.
However, the use of credit cards had differentiated behaviors: (i) in the case of supermarket sales, the share of amounts paid by credit card increased (42% vs 37% in the first half of 2023), with growth in most of the months of the first half of the year, and (ii) in the case of e-commerce, Credit card use continued the downward trend (70% in the first half of 2024 from 75% in the same period a year earlier), although it still channels the largest amounts.
Box 2 | Electronic collections: alternatives, commissions and adoption
The growth of electronic payments is usually analyzed from the perspective of consumers, who, by not facing costs or paying low fixed costs to make electronic payments, are indifferent to their choice32. For sellers, on the other hand, electronic payments may involve different fees and crediting times.
With the information available, the objective was to analyze the commissions and credit deadlines of electronic collections, as well as to size the group of potential users of these products on the supply side. For this last point, both human persons (PH) and legal entities (PJ) whose main activity is trade or the provision of services were considered.
Payment conditions. Retail electronic payment instruments include cards (debit, credit and prepaid), transfers and Payments with Transfers (PCT, immediate transfers used to pay for goods and/or services with the participation of an acceptor)33 34. Except in the case of credit cards, which allow the holder to defer payment, in all other instruments the amount paid for the good or service is automatically debited from an account, using different technologies available to the consumer to make said payment, such as a card with a magnetic stripe or a chip or through a mobile phone application.
Likewise, these instruments are used in different channels, which include POS and mPOS devices, QR (printed or dynamic on POS device), payment links, among others. So, the combination of payment methods, accreditation term and channel determines certain commissions. The values of these commissions or tariffs to merchants are established by the acquirers and payment aggregators, except for PCTs whose maximum cost was set by the BCRA (0.8%). These fees reward different participants in the operation, such as the financial institution or PSP from which the funds were debited, the acquirer or aggregator, and the administrator of the payment scheme (for example, card brands when the payment is made through this instrument issued by a bank).
Public data on commissions and accreditation deadlines applied to businesses and service providers tend to be limited, as not all actors provide such information in a complete manner. Based on a survey of the websites, it was found that the information is more extensive for operators that come from the category of Payment Service Providers35.
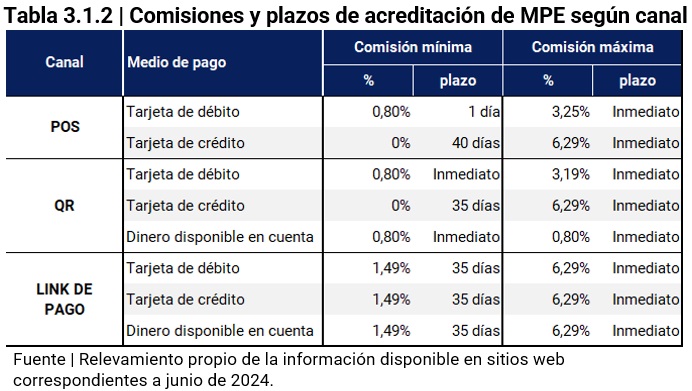
Some conclusions that can be drawn are the following:
(i) Fees for payments with money available in account (DDC) were the cheapest in terms of fee and crediting period. In this case, the crediting of funds for trading is immediate and the commissions are 0.8% with QR (there is a case with a commission of 0.6% that uses user passwords instead of QR). These payments make up the so-called PCT. Debit card payments through QR are also added to those with the lowest commission and in terms of crediting time.
(ii) Credit card fees tend to be the highest, possibly reflecting part of the risk involved for the system to advance funds to merchants before charging consumers
(iii) Commissions tend to be higher in e-commerce (through payment links or payment button on the website), than in face-to-face commerce (point-of-sale terminals), when payment is made by debit cards or with an account balance.
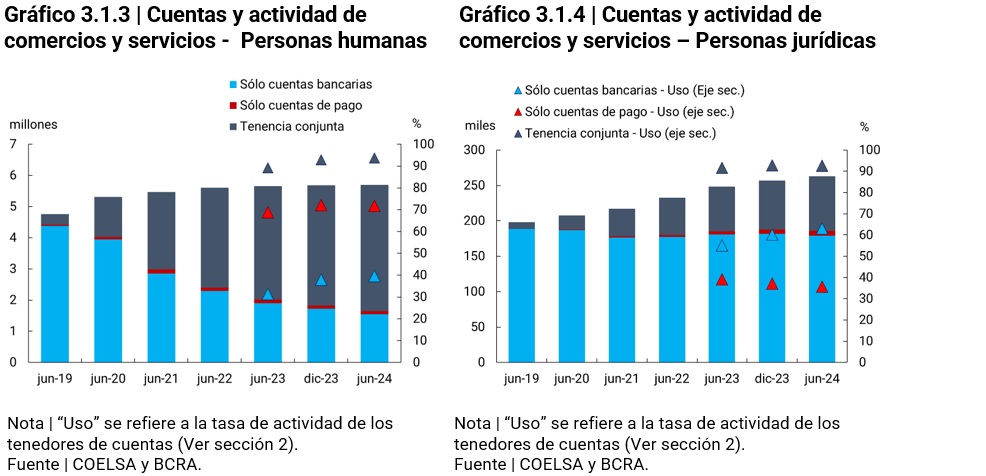
Adoption. In the last five years, the number of legal entities in the areas of commerce and services that have an account in financial institutions or PSPCPs has grown. The number of individuals active in these areas also expanded in the period, with the adoption of both types of accounts being more pronounced in this case.
3.2. Savings and investment modalities36
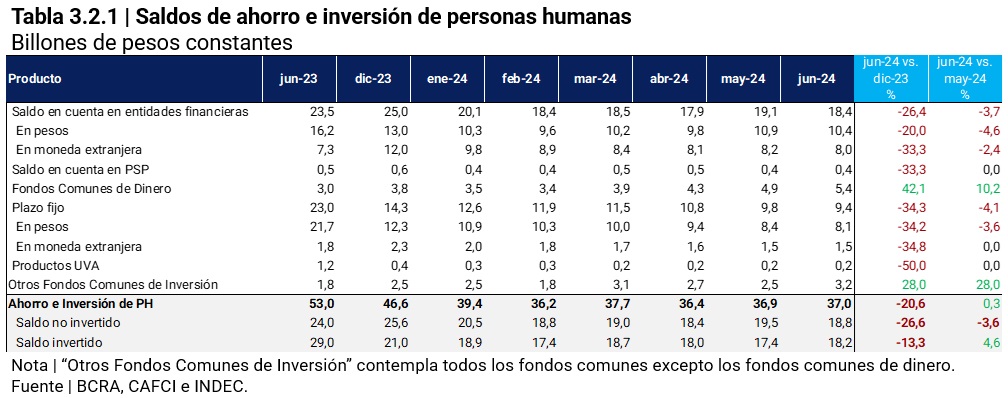
In June 2024, the balance of savings and investment products for individuals (PH) in the financial system and capital market37 was worth $37 trillion38. This balance suffered a year-on-year reduction of 30.2%, while in relation to December 2023 the fall was 20.6%. However, this variable showed improvements in the last months of the first half of 2024, registering a monthly growth of 1% in May and 0.3% in June.
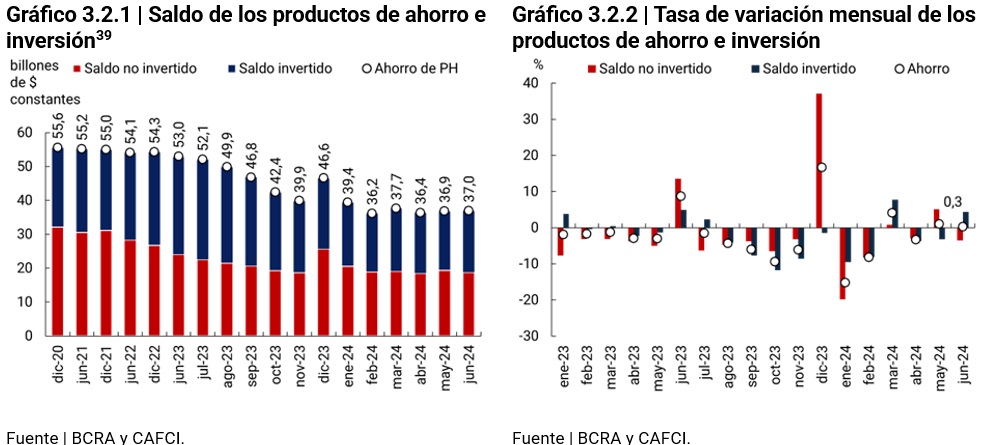
The better performance of mutual funds drove progress in the last months of the semester. The reduction in liquid balances in pesos could be redirected towards mutual funds (DCFs), while the decrease in fixed terms could be related to the choice of products with a higher risk-return ratio (such as mutual funds other than DCFs) or to the purchase of foreign currency through the capital market (MEP dollar). In this sense, both financial institutions and capital market agents facilitated both operations through their electronic platforms. These movements took place in a context of slight growth in the working capital held by the public, which varied 1% in real terms and without seasonality in the first half of 202441 .
This happened in a context where the monetary policy rate went from 80% in March to 40% in June 2024. The nominal yield of the main savings and investment products continued to decline at a faster pace than in previous months, while the price level continued to grow, albeit at a slower pace. With these changes, real interest rates went from significantly negative levels at the beginning of the semester to values close to zero towards the end, although still in negative territory. The improvement in real interest rates was due exclusively to the decline in the inflation rate.
In April and May, the real interest rate on DCFs exceeded the real interest rate on fixed-term loans, a situation that had not happened in the previous 24 months. This change could be related to a greater share of forward transactions in the asset portfolios of DCFs42, composed mainly of fixed terms (and to a lesser extent, stock market guarantees). On the other hand, in April 2024, bank reserve requirements of 10% were introduced on these instruments, which were raised to 15% in the following month43, which reduced the yield of the DCFs.
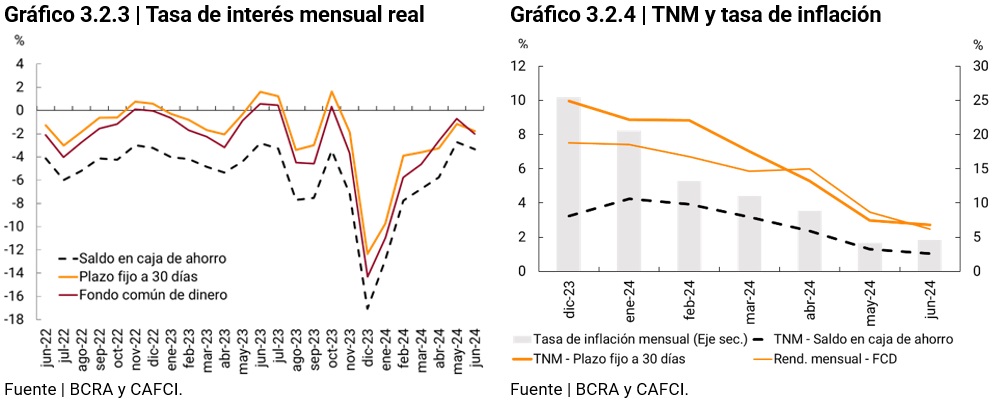
Even with negative real interest rates, this product offers a higher yield than maintaining liquid balances in account and similar to that of a 30-day fixed term, without losing liquidity. The increase in the balance of DCFs could be driven by savers migrating their funds from account balances and fixed terms to DCFs. This product has gained relevance compared to other savings and investment options, increasing its share from 18% to 30% in the total balances invested between December 2023 and June 2024.
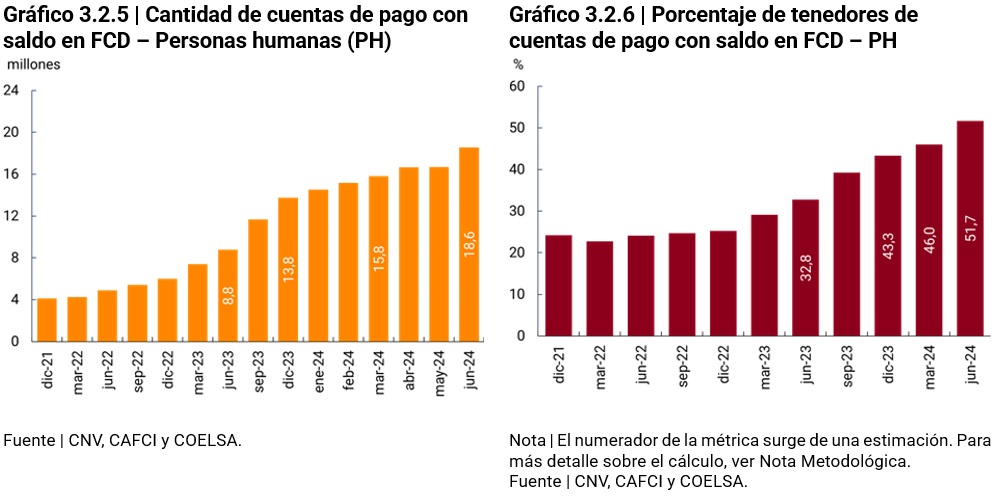
Payment service providers (PSPs) have played a key role in the adoption of this product. This growth had a positive impact in terms of financial inclusion. The number of PSP accounts with a balance in DCFs increased from 8.8 million in June 2023 to 18.6 million in June 202444. Although data on the use of payment accounts at the PH level is not available, it is estimated that as of June 2024, at least 51.7% of the PHs holding payment accounts45 had a balance in DCF, with a year-on-year increase of 8.4 p.p. This behavior suggests an increasingly intensive use of this product.
For their part, in the first half of 2024, fixed terms continue to show signs of weakness in terms of financial inclusion. In June 2024, PH’s fixed-term balances registered a monthly reduction of 4.1% and a semi-annual reduction of 34.3%. Both fixed terms in domestic currency and in foreign currency registered monthly and semi-annual falls.
In turn, as of June 2024, the number of fixed terms in PH in national currency was 4 million, registering a quarterly drop of 26.1% and a semi-annual drop of 29.2% and the number of fixed terms in foreign currency of PH stood at 124 thousand, with a quarterly reduction of 0.7%, and a six-month increase of 3.7%. For its part, the number of PH holders of fixed terms went from 4.3 million to 2.9 million within the same semester. Thus, the percentage of account holders with a fixed term was 3.7% in June 2024, with a quarterly drop of 1.55% and a semi-annual drop of 36.2%.
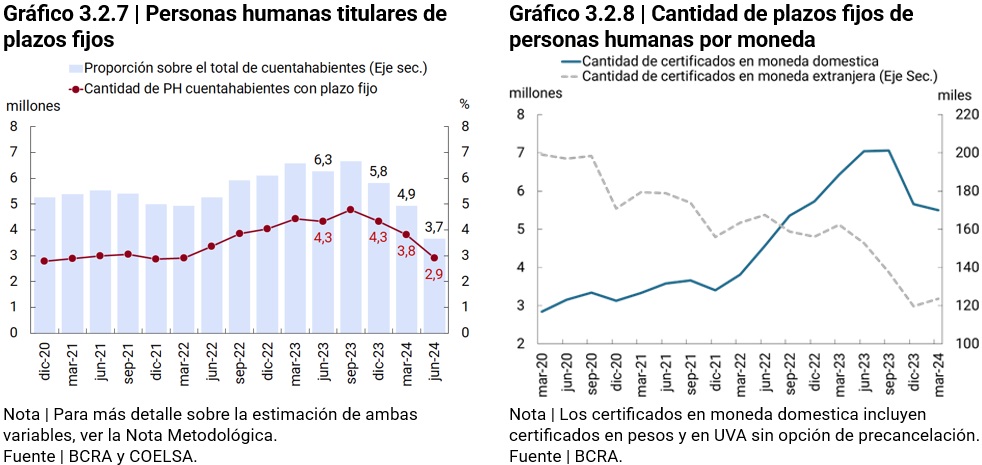
The values of this indicator show the low use of fixed-term loans as a savings instrument, especially compared to the use of bank accounts for transactions47 (34.7% in June 2024) and the money pools mentioned in the previous paragraphs. Despite their lower use, the balance in fixed terms is still higher than the balance in CDF, although the difference between the two was reduced.
4. Credit to individuals48
As of June 2024, 20.3 million individuals registered financing from the expanded financial system (SFA)49 , which represented a net increase of 200 thousand debtors (1%) since December 2023. This net increase arises from the incorporation of 1.7 million people and the reduction of 1.5 million. Thus, the coverage of the adult population reached 56.6%, compared to 56.3% in December 2023.
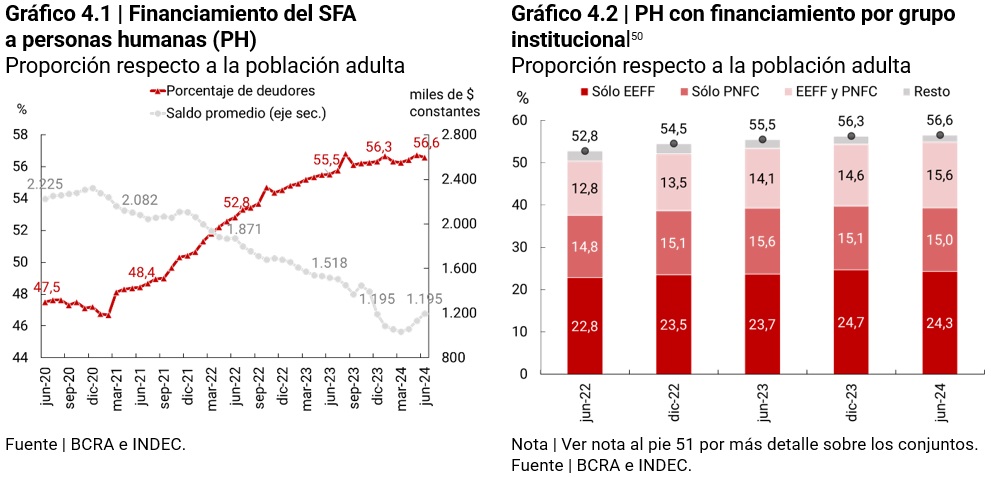
The average balance owed per person deepened its contraction in the first months of the year and then reversed its behavior, beginning to show increases starting in April. Different factors are associated with this behavior51 (i) the contraction in the income of salaried persons during the first three months of the year followed by a recomposition as of April52 ; and (ii) the reduction in nominal interest rates and inflation tended to generate favorable conditions in the consumer credit market.
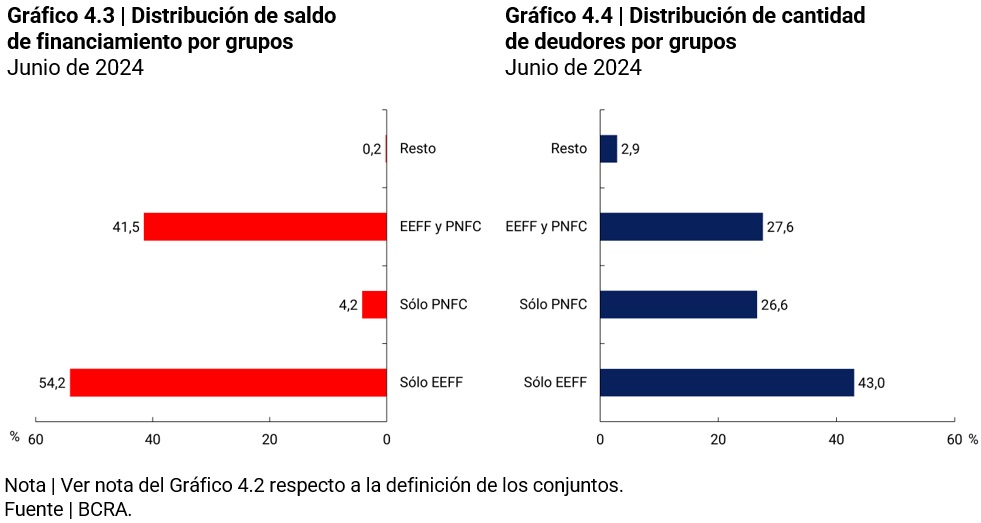
Among the highlighted characteristics, it was observed that people who entered the credit market (1.7 million) more than half of the new borrowers (53%) obtained financing only through non-financial credit providers (NFCPs), where the average balances per debtor are historically lower than in financial institutions (EEFF). The rest was mainly distributed among those who took credit exclusively in EEFF (39%) and 7% who did so simultaneously in both types of providers (EEFF and PNFC). In this process, the most significant contribution of new debtors was made by a PNFC that totaled almost 750 thousand people, 38% of the total gross registrations53 . In particular, the increase is explained by PNFC’s Fintech group, companies that provide consumer financing through mobile applications or websites.
Although the greatest dynamism in recent years came from the PNFCs, whose exclusive debtors accounted for 27% of the total SFA, the financing balance concentrated less than 5% of the total as of June 2024. For their part, the EEFF led both in the number of debtors and in the balance of financing. These reached 8.7 million exclusive debtors (13.7 million, if those with debt in PNFC are counted), while PNFCs covered 5.4 million (10.9 million, if those with debt in EEFF are counted). Likewise, the group of people with simultaneous EEFF and PNFC financing continued its upward trend, reaching 5.6 million.
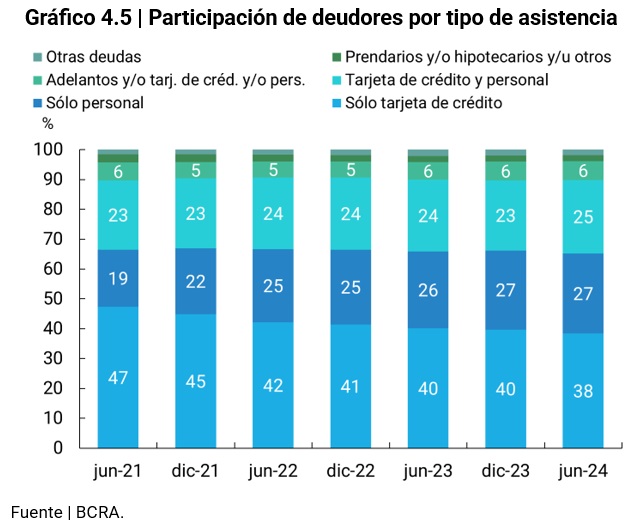
Type of assistance. With a more relevant role of the PNFCs, the importance of lines of credit aimed at financing consumption involving relatively low and short-term amounts, through credit cards and/or personal loans, has intensified. As of June 2024, 90% of individuals with credit had some credit of this type, a situation that has remained unchanged since at least June 202154 despite the increase in the number of debtors in terms of population (from 48.4% to 56.4% between those dates, 8.1 p.p.).
In this period, there was a change in the choice between these two credit instruments. The share of exclusive credit card debtors registered a drop of 8 p.p., from 47.3% to 38.4%, which was practically offset by the increase of almost 8 p.p. of exclusive holders of personal loans. This situation is related to new use cases for personal loans, such as consumer financing through e-commerce granted by the platforms themselves or other providers, either in one payment or in installments.
This phenomenon is part of the global trend of “Buy Now, Pay Later”55 or consumption quoting, which allows consumers to pay in installments without the need for a credit card, a means traditionally used for this purpose. This system would be less demanding in terms of the requirements to access credit, which would also imply a higher risk of repayment compared to the management of traditional credits.
This dynamic generates a positive effect in terms of financial inclusion, since people who did not have financing in the formal financial system were able to access credit through a provider that must comply with regulatory requirements, such as those related to the protection of financial users. In addition, its inclusion implies that its credit history is reported, generating a footprint in the formal financial system, in order to potentially resort to financing from other regulated providers with better credit conditions.
Even with the growth of personal loans, credit cards remained the most widespread type of assistance among people (reaching 39.4% of the adult population or 14.1 million people), continuing with an upward trend although moderate. The average balance per debtor attenuated the pace of a continuous reduction (-8% in June compared to December 2023), showing an increase compared to March 2024 (+12%).
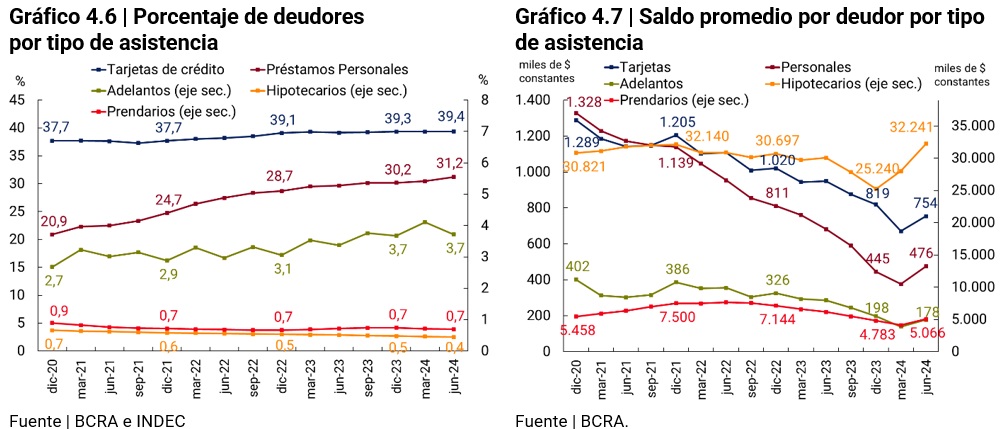
Personal loans were the line of greatest growth through the incorporation of more than 430 thousand new debtors and covered 31.2% of the country’s adults or more than 11.2 million people in June. This type of assistance is the second most widespread among the population. In terms of balances, the average per debtor broke a downward trend that lasted until March 2024 and in June registered an increase of 7% compared to December 2023 and 27% compared to March 2024.
On the long-term financing side, the renewed offer of UVA mortgage loans from the EEFF and the resurgence of interest by the population56 in the first half of 2024 stand out. The BCRA published a comparative instrument57 with the aim of facilitating decision-making in the contracting of financial products. The table, updated monthly, is a sample of UVA mortgage loans for the acquisition of owned, unique and permanent housing in the Autonomous City of Buenos Aires (CABA) and allows a homogeneous and transparent comparison between the different options available in the market.
In the first half of 2024, people with mortgage loans continued with a sustained reduction (-7%) and reached about 160 thousand debtors (0.4% of the adult population). In that semester, the average balance per debtor increased by 28% in real terms, and reached an amount of $ 32.2 million as of June 2024.
Regarding the increase in the balance in real terms, it is worth noting that, between December 2023 and June 2024, the value of the Purchasing Value Unit (UVA) increased by 125% compared to 79.8% of the Consumer Price Index (CPI). Although 59% of mortgage loan debtors correspond to UVA mortgage loans, these covered 98% of the total balance as of June 2024, so the evolution of the mortgage loan balance depends to a large extent on the value of the UVA.
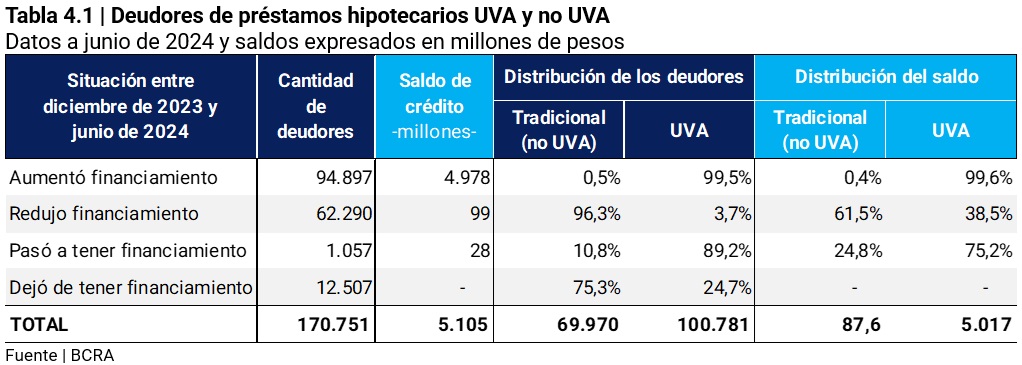
With a more detailed analysis of mortgage loan debtors, it can be seen that, during the first half of 2024, 114 people obtained traditional loans (non-UVA) and 943 obtained UVA loans, while 12,507 stopped having financing (9,419 non-UVA and 3,088 UVA). The greater number of cancellations than registrations explains the reduction in the total number of debtors mentioned in the previous paragraph.
Section 1 / What are digital correspondents?
In recent years, financial service access points (PDAs) have behaved differently depending on the income level of the countries. On the one hand, high-income countries reduced the number of their ATMs and branches. On the other hand, low- and middle-income countries recorded significant growth in banking correspondents and ATMs, while the number of branches remained relatively stable58 .
In Latin America, correspondents have played an important role in increasing the coverage and capillarity of the financial system by offering a series of financial services on behalf of financial institutions (EFSAs) to communities that were far from the points of contact with the financial system. Its quality as a physical point with human attention is key to the approach to financial services of individuals with low levels of education or low computer skills, who face barriers to the use of electronic devices and digital platforms59 .
However, the mass adoption of digital financial services would facilitate the transition from a face-to-face model to a digital model of delegation of EFSA services. Therefore, this section analyzes the status of physical correspondents in Argentina and other Latin American countries and investigates conceptual material and use cases of the financial services delegation of the EEFF in non-financial companies that have developed digital platforms and mobile applications (“digital correspondents”).
Status of physical correspondents. Brazil and Colombia had ADPs in all their localities, while 7.3% and 6% of the localities were attended exclusively by correspondents, respectively60. Mexico had PDAs in 80% of the localities, while correspondents reached 75% of them61 . The effective use of these points was mostly concentrated in payments for services (collections) and cash withdrawals, except in Mexico where the predominant use was cash deposits. These countries have extensive experience in the development of correspondents, since their regulatory frameworks were established several decades ago62 .
The regulatory framework for correspondents in Argentina was put in place at the end of 2018, allowing63 EEFF to delegate operations to complementary financial services agencies (ACSFs). These agencies can be natural or legal persons (non-financial) and the provision of financial services must be their secondary activity. Since the mid-1990s, non-bank collection companies have been providing services that resemble the services provided by ACSFs, which consist of the payment of taxes and services.
Its rapid deployment was mainly explained by two factors: (i) the care needs arising from the COVID-19 pandemic; and (ii) the pre-existence of an extensive network of non-bank collection companies. The number of ACSFs went from 54 in 2019 to 17,693 in 2021 and most of them were located in this network of businesses. Thus, by the end of 2022 they were already the main PDA, reaching a total of 20,517 units in June 2024.
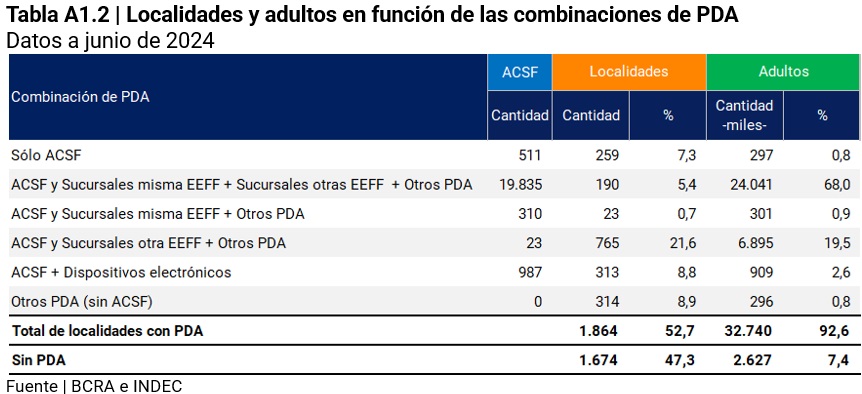
The most relevant contributions of the ACSF are the coverage of localities that previously did not have financial services and those where they are the only point of human contact. As of June 2024, ACSFs provided exclusive access to financial services to 7.3% of localities where 0.8% of the adult population resides and for an additional 8.8% of localities, where 2.6% of adults reside, they were the only point of human contact with the financial system. Likewise, the ACSF provide a variety of points in 27.7% of the localities, where 88.4% of the adult population resides.
Finally, localities without FLW accounted for 47.3% of the total, where 7.4% of adults reside, mostly populations with fewer than 2,000 adults. The remaining challenge in terms of coverage could be addressed through more flexible distribution channels, such as ACSFs. However, the expansion of the ACSF would require the incorporation of new merchant networks – since the infrastructure of extra-bank collection merchants is close to its65 ceiling – or digital innovations.
Digital innovation in correspondents. Digital correspondents could be seen as a specific case of Banking as a Service (BaaS), where the EEFF outsources the provision of some of their services to technology-based non-financial companies, in order to increase their customer base. For their part, non-financial companies incorporate these services into their applications or digital platforms, making them more attractive to their own customers.
According to CGAP66 , BaaS combines “the scalability of digital ecosystems with the financial depth of a complete banking offering,” representing a flexible, low-cost proposition to “move beyond the current ‘broad but shallow’ state of inclusion.” But he warns that progress in inclusion will depend on who the new service offer is ultimately aimed at. Digital correspondents enjoy the same advantages (flexibility and low costs) and face the same challenges to advance financial inclusion (the population that benefits from the effective provision of their services).
In Latin America, Colombia incorporated digital correspondents in 2020. The same regulation also provided for the creation of mobile correspondents, which provide services on an itinerant basis. In 2022, mobile and digital correspondents in Colombia accounted for 1.4% of the channel’s operations and 0.4% of the67 amounts. In 2024, Mexico incorporated technology-based commission agents (correspondents)68, who are more in tune with the BaaS scheme. The EEFF are authorized to “enter into commercial commission contracts with third parties who act at all times in the name and on behalf of them before customers or potential customers through the Internet pages or computer applications of said commission agents”. The permitted operations are limited to the opening of accounts and transfers from said accounts, granting of credits of up to a certain amount, payment of goods and services and consultation of balances and operations carried out with said commission agents.
Digital correspondents could be effective in improving the offering of financial products and services available:
(i) in localities that do not have any type of PDA (but do have an internet connection): 25% of the first group has mobile network coverage69 ;
(ii) in locations where the supply of PDAs is very limited; y
(iii) for people who have already been financially included through Payment Service Providers (PSPs), but as they do not have EEFF accounts, they do not have access to products such as term investments or loans from the financial system. One million adults have accounts exclusively on PSPs (See Section on Account Access and Use).
(iv) in general for people who operate with bank, non-bank electronic wallets or who use electronic commerce and who want to access a wider variety of financial services (for example, the constitution of fixed terms, credit cards, loans, among others).
These points, added to the fact that cell phones are the technology with the highest penetration in the Argentine territory (89.5% of people have one70 ), would make digital correspondents an alternative to advance the financial inclusion of these populations.
Section 2 / Credit to MSMEs. Role of the capital market and guarantee institutions
Access to finance is one of the main challenges faced by micro, small and medium-sized enterprises (MSMEs) in emerging economies71. In last semester’s financial inclusion report, two challenges were identified for MSMEs around financing. The first is an intensity challenge, which refers to whether the amount of financing is sufficient to cover the needs of the company, a problem faced by companies of all sizes. The second is an access challenge, which focuses on the possibility of effectively obtaining that financing, this being a difficulty for microenterprises.
Given this situation, this section makes a first approach to two institutional frameworks that allow improving the financing of MSMEs: (i) the capital market and its different products; (ii) third parties that act as guarantees or collateral for the loans taken by MSMEs. This first approach aims to explore the level of use of these products, their outstanding characteristics and their relationship with the financing of financial institutions (EEFF).
(i) Capital market products. The Argentine capital market offers SMEs a wide range of financing alternatives depending on the term and amount of the financing, which are traded on authorized markets72:
- Oriented to short-term financing or working capital: deferred payment checks (CPD), electronic credit invoices (FCE) and stock market promissory notes. Stock notes can be issued in both pesos and US dollars, while deferred payment checks can only be issued in pesos. These instruments can be issued digitally.
- Aimed at medium and long-term financing or expansion of productive capacity or the refinancing of liabilities: negotiable obligations (ON), financial trusts (FF) and issuance of shares (capital).
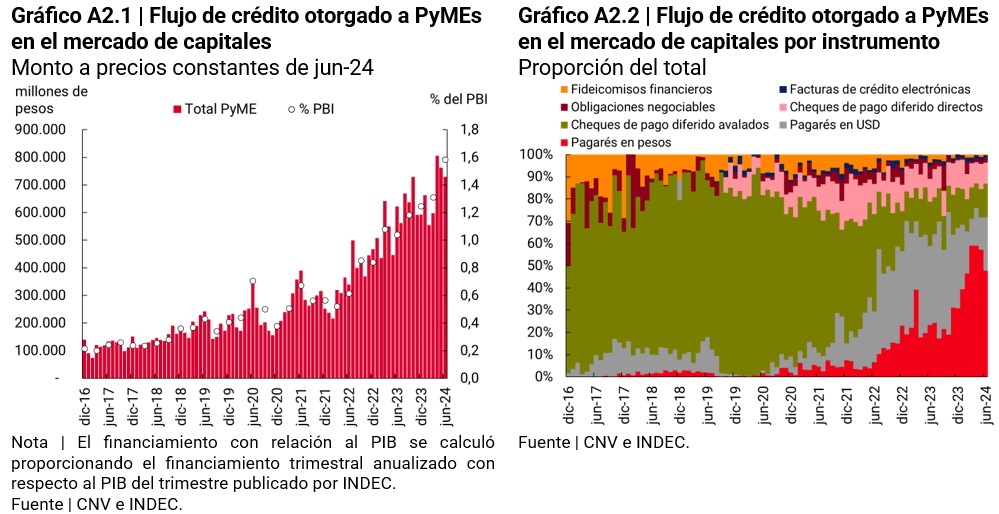
In June 2024, the flow of financing to SMEs amounted to $729,448 million and concentrated 42% of the total financing in the capital market for that month. This financing is still small in relation to the credit granted by financial institutions (EEFF) to SMEs73 (24% in June 2024) and in relation to GDP (1.6% of GDP in the second quarter of 2024).
However, in recent years, the flow of financing to SMEs through the capital market has increased significantly. Promissory notes have been gaining share to the detriment of Guaranteed DPCs, while ONs have been the most widely used product among long-term financings. Bonds benefit from a special regime known as ON Simple74 , which grants facilities to SMEs that want to issue this type of instrument.
The greater relative weight of promissory notes is partly explained by the increase in those issued in foreign currency. This instrument can be issued in pesos and in foreign currency with a term of up to 3 years. This contrasts with the DPCs that cannot be issued in foreign currency or exceed 360 days. In June 2024, promissory notes in dollars represented 34% of the volume issued, with an average term of 190 days, while promissory notes in pesos had an average term of 49 days and CPDs of 93 days.
The issuance of guaranteed securities reached approximately 21% of the amount issued during June 2024. The guaranteed segment of these markets, present in some of the debt instruments, allows MSMEs to use guarantees provided by guarantee institutions to access more competitive financing conditions.
(ii) Warranties. The existence of a guaranteed segment and a direct segment (without collateral) in some of the instruments for SMEs is directly related to the performance of guarantee institutions. It is a group made up of Mutual Guarantee Societies (SGRs), Public Guarantee Funds (FGP) and financial institutions (EEFF), which issue guarantees that allow MSMEs to access financing in the capital market and also in the expanded financial system (SFA). In June 2024, the amount of guarantees in force (live risk) was distributed among the SGRs (56%), FOGAR (national guarantee fund) (37%) and provincial guarantee funds (7%)75 .
Guarantees (collateral) fulfill the role of limiting the credit risk perceived by creditors and, consequently, achieving better conditions (rates and terms) for debtors, providing a solution to the problems of adverse selection and moral hazard existing in credit markets. MSMEs, which are usually more susceptible than large companies to these imperfections, do not have sufficient assets to use as collateral and are subject to greater idiosyncratic risks than their large counterparts76 , benefit directly from the operations of these entities.
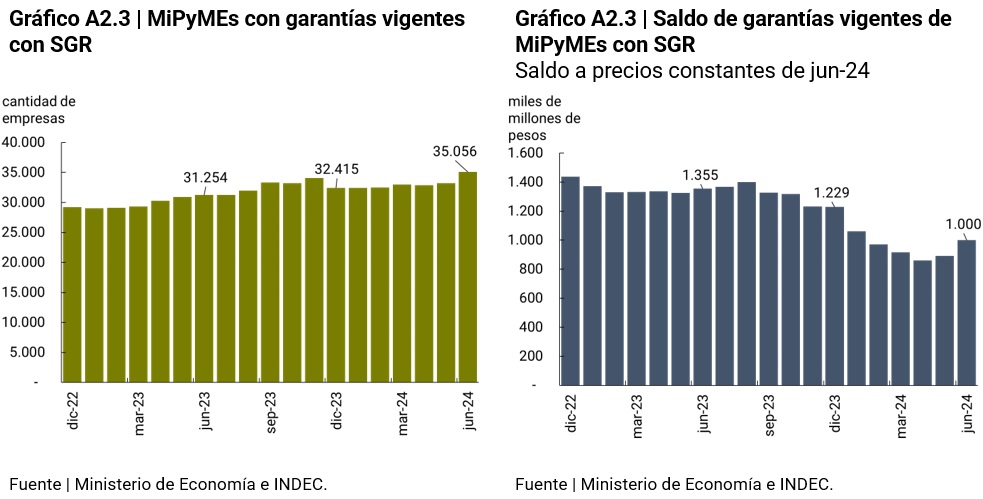
SGRs are the main issuers of guarantees for MSMEs. Its operation is based on a Risk Fund – which acts as a final guarantee in case the MSME does not pay – and on the actions of two types of partners: the Protective Partners, who contribute to the Risk Fund and the Participating Partners, which are the MSMEs that request and receive the guarantees from the entity.
In June 2024, the SGRs operating in Argentina77 granted guarantees to 4,897 MSMEs. The total number of companies with guarantees in force reached 35,056, which represents 2.1% of MSMEs with certificates, with a net balance of $1 trillion. During the first half of 2024, 44% of the guarantees were allocated to bank loans, 43% to CPD Guaranteed, 7% to guaranteed promissory notes, and 6% to other forms of financing.
Section 3 / The performance of instant payments in the world
In recent decades, the retail payments market has undergone significant changes globally, one of which was the rapid growth of instant payments. The objective of this section is to explain what is meant by instant payments, to analyze its evolution and relative importance with respect to the rest of the electronic means of payment and to briefly describe its development in three countries in the region.
Since the creation of the first instant payment system in South Korea in 2001, these schemes have proliferated globally. As of June 2023, some 100 jurisdictions already had this system, and many more planned to implement it in the short term78. Instant payments (PI) are channeled through transfers where funds are made available to the merchant or beneficiary in real-time and can be executed 24×7 with relatively low costs for the recipient. This means that funds can be immediately reused for new payments through a financial institution (EEFF) or payment service provider (PSP).
In contrast, other electronic payment instruments have delays in the availability of funds, generally being greater for credit cards than for debit cards79 . With cash, traders must deposit it into an account before reusing it electronically. In addition, their handling entails storage, transport and security costs.
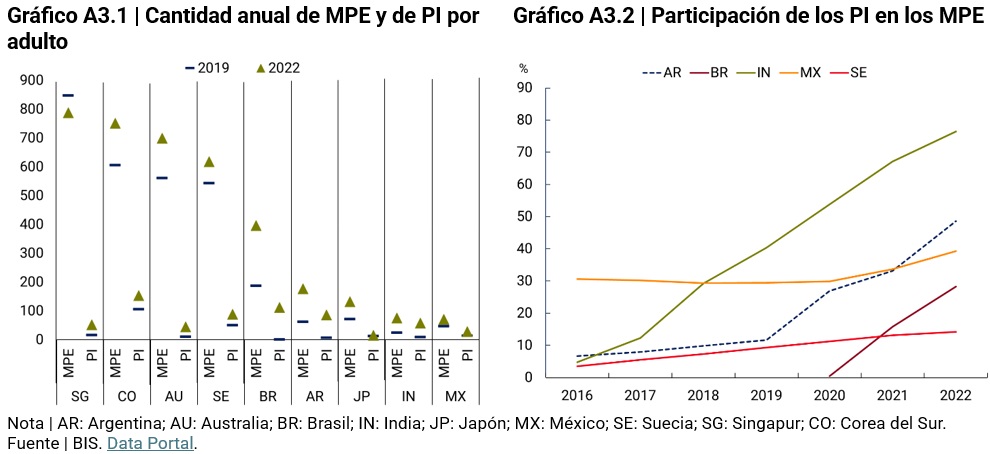
Most jurisdictions withavailable data 80 increased immediate payments in a context of general expansion of electronic means of payment, with a significant dynamism of the former. In general terms, immediate payments gained share within the MPEs in those economies where the use of traditional means of payment (cards) was not as widespread.
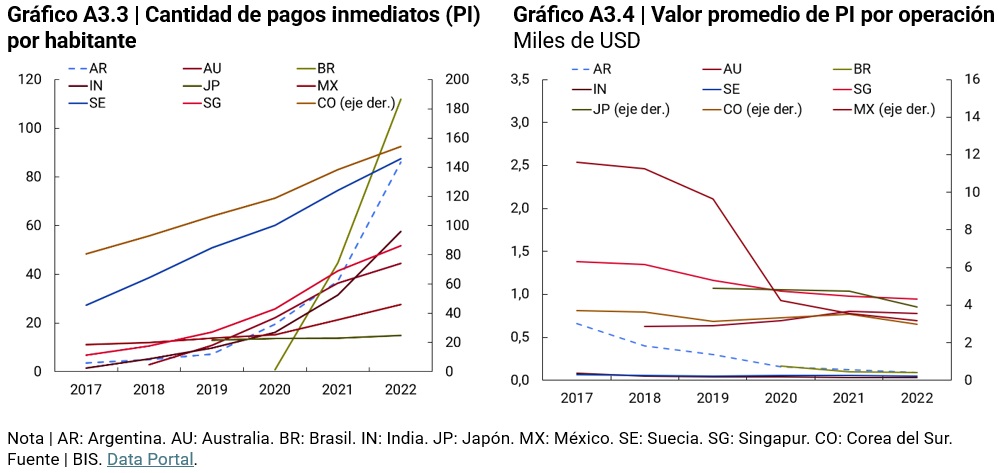
The average value of transactions shows a downward trend, although with great heterogeneity, even in countries within the same economic group. These differences may reflect different use cases across countries and over time, as well as changes in the amount limits set by the payment systems or providers involved.
The growth of IP in several countries led to an increase in their share of total electronic payments. In Argentina and India, which start from relatively lower levels of electronic payments per capita than other economies (62 and 24, respectively in 2019), as well as their average transaction values, the expansion of IP produced a rapid change in the composition of the retail payments market. On the other hand, in Brazil, which already had relatively high levels of electronic payments per capita (188 in 2019), with a widely expanded card payment scheme (credit, debit and prepaid), the increase in the share of total electronic payments was more moderate.
Development of instant payment systems in Argentina, Brazil and Mexico. By way of comparison, the main characteristics of the 3 most relevant instant payment systems in Latin America are presented.
In Argentina, in 2011, transfers with immediate credit were regulated by the BCRA and in 2016 their use was extended to payments initiated with cards, quick response (QR) codes or other methods through the so-called Mobile Payment Platform (PPM). In 202081, the “Payment with Transfers” project was formalized, which unified the configuration of PPM and regulated Payments with Transfer (PCT). The use of transfers as a means of payment was favored by: (a) the identification and traceability of transfers between bank accounts and payment accounts through the Uniform Virtual Key (CVU), which promoted interoperability, and (b) the possibility of using an alias (easy-to-remember nickname) to identify bank and payment accounts (CBU and CVU).
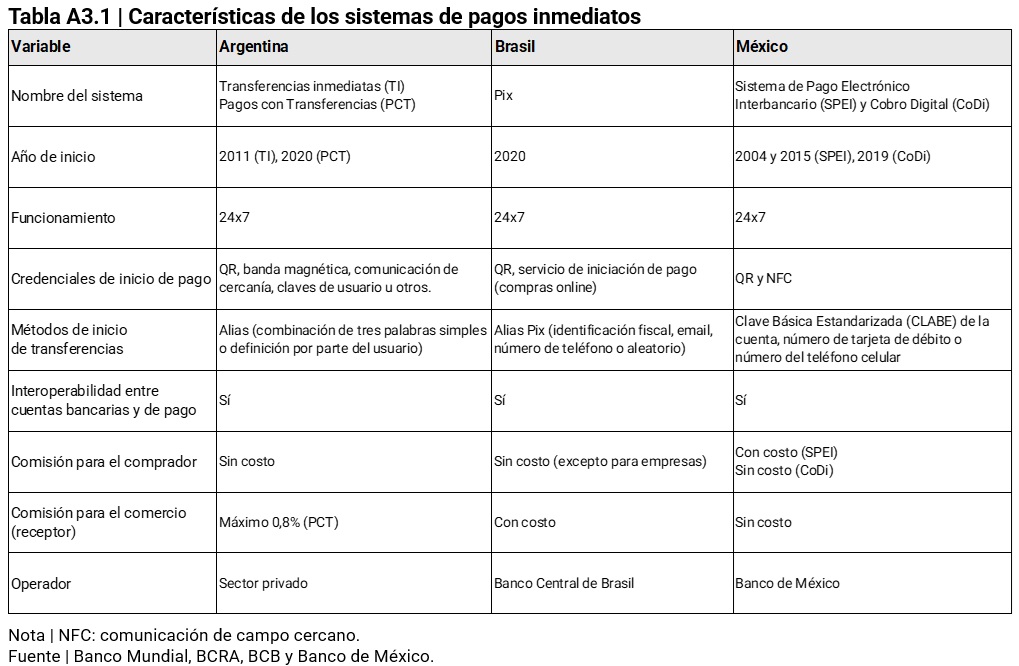
For its part, the Central Bank of Brazil put the immediate payments system (Pix) into operation at the end of 2020. Pix operates between transactional accounts (current, deposit and prepaid accounts) between individuals and legal entities through a financial institution or payment institution (system participant). Transfers or payments can be initiated with the account alias, QR code, or other methods and, as a differential feature, payments can be scheduled for a specific date.
In Mexico, the electronic transfer system (Sistema de Pago Electrónico Interbancario -SPEI-) was launched in August 2004 and expanded to a service available 24×7 in 2015. SPEI operates for retail and high-value payments and, as in Argentina and Brazil, SPEI allows the use of an alias. In 2019, the Bank of Mexico launched CoDi (Digital Collection) which is a low-value digital payments platform on the operation of SPEI. CoDi facilitates payments through QR codes, NFC and messages via the internet and was designed to simplify and homogenize the experience of requesting a payment or responding to a payment request for end users. A differentiating element between countries is the role played by the monetary authority. While in all three cases they were initiatives promoted by central banks, in the cases of BCB and Banco de México, they added the function of system operator.
In summary, instant payments have advanced significantly and offer clear benefits compared to other instruments: immediate use of funds, lower commissions and availability without time restrictions, which facilitate daily transactions.
As mentioned in previous reports, the use of MSPs contributes to improving financial inclusion since, in addition to channeling the different payment needs of the population, they can make access to new financial services, such as savings or financing products, affordable for their users82. In an enabling environment, instant payments can continue to expand and drive greater access to financial services.
Methodological note
Population data
This report presents indicators that are disaggregated by different demographic and geographical variables. As of the date of publication of this edition, the final results of the 2022 National Census of Population, Households and Housing (CNPHV) have been released, which were published in different stages during the years 2023 and 2024. Due to the need to adjust processes and update relevant statistics, the use of population data based on the 2010 CNPHV continued.
In this regard, given that the National Institute of Statistics and Census of the Argentine Republic (INDEC) does not publish a series that simultaneously contains all the disaggregations used throughout this report (gender, age group, and geographical location at the provincial, departmental, and locality levels), it was necessary to take different series according to the definition of each indicator:
– For the indicators at the national and provincial levels, the series entitled “Population by sex and five-year age groups for the country and provinces as a whole. Years 2010-2040”;
– For the departmental indicators, the series “Estimated population on 1 July of each calendar year by sex, by department” was used;
– finally, given that INDEC does not publish a projection of the evolution over time of the number of inhabitants of each locality, it was necessary to construct the series for the indicators at that level, for which the results of the CNPHV of 2010 were used.
Considering that there are differences between the results of the CNPHV 2022 and those of 2010, the indicators in this report in relation to the adult population should be taken as provisional. Finally, for the purposes of this report, an “adult” is considered to be a person 15 years of age or older, following the standard used by the World Bank for its financial inclusion indicators.
Regionalization
For the purpose of developing regional indicators, the regionalization criterion proposed by the Ministry of Economy and Public Finance (now the Ministry of Economy) was used, which establishes five regions:
– NOA (Northwest Argentina): Salta, Jujuy, Tucumán, Catamarca and Santiago del Estero.
– NEA (Northeast Argentina): Formosa, Chaco, Misiones and Corrientes.
– Nuevo Cuyo: Mendoza, San Juan, San Luis and La Rioja.
– Patagonia: La Pampa, Neuquén, Río Negro, Chubut, Santa Cruz and Tierra del Fuego.
– Centro and Buenos Aires: Córdoba, Santa Fe, Entre Ríos, Buenos Aires and the Autonomous City of Buenos Aires.
In the text of this IIF, Nuevo Cuyo is mentioned as Cuyo and Center and Buenos Aires as Center.
Payment accounts at payment service providers
Among the Payment Service Providers (PSPs) that operate in COELSA, there are providers that are registered in the BCRA’s Registry of Payment Service Providers (PSPs) and other providers that are not registered83. For the purposes of this report, only payment accounts for vendors that are registered as PSPs that offer payment accounts are counted.
Account activity
The “Activity” series comes from COELSA and indicates whether account holders registered debits or credits in their bank and/or payment accounts throughout a quarter. If a person makes transactions from different accounts, either from the same entity or from different entities, it is posted only once.
The series makes it possible to distinguish whether the movement of funds is the result of a debit and/or credit and includes debits and credits made through immediate transfers, payments with online transfers, transactions with checks, direct debits, DEBIN and batch (deferred) transfers, to the extent that they are settled and cleared by COELSA.
Given that the “Activity” series considers the subset of operations in which COELSA is involved, the activity indicators are underestimated. In particular, the indicator does not capture those account holders who operate with a debit card and do not make transfers to or from payment accounts, cash withdrawals, among others. Another aspect of the indicator is that debit transactions are, in general, initiated by the PH account holder itself, while credit transactions are originated by a third party (PH or PJ). This distinction has different considerations in terms of financial inclusion, given that in the first case it is an active operation of the PH.
Balances of savings and investment products of individuals (PH)
The savings and investment balances of PHs are classified as follows:
1. Uninvested balances: include: (i) balances in current accounts and savings accounts denominated in local and foreign currency; and (ii) balances in payment accounts.
2. Invested balances: include: (i) fixed-term balances in pesos and foreign currency; (ii) product balances in UVA; (iii) value of the net worth (PN) of the Mutual Funds (CDFs) subscribed by PH (estimate); and (iv) value of the NP of other Mutual Funds (Other FCIs) subscribed by PH (estimate). The latter include fixed income funds (bonds), equities (shares), mixed income, structured funds, among others84 .
To estimate the PN of the DCFs subscribed by PH, the sum of (i) the DCFs exclusive to PH was calculated and, (ii) for those DCFs that may be made up of both PH and PJ in EEFF, the PH was estimated on the basis of weights. The weights were obtained through the calculation of the share of the PH FCIs in the Total FCIs (PH+PJ). Exclusivity was consulted through a survey of the websites and management regulations of the DCFs. On the other hand, to estimate the NP of the other CRFs, the difference between the NP value of the FCIs subscribed by PH (using information published by CAFCI and CNV) and the PN value of the DCF subscribed by PH was calculated.
Number of PH holders of fixed terms and percentage of account holders with fixed terms.
The Information Regime for Supervision compiles, on a quarterly basis, the number of holders of fixed terms at the level of financial institution (FI), which include individuals and companies. To estimate the PH holders of fixed terms for each FI, the number of fixed-term holders was multiplied by the quotient between the number of PH fixed-term certificates with respect to the total number of certificates, both in pesos and in foreign currency, for each FI85. Then, the estimated amounts for each FI were added and the estimate for the total financial system was obtained, which may contain duplications to the extent that the PHs have fixed terms in more than one FI.
Proportion of payment account holders with balance in Mutual Funds (DCF) Section “A” of the Information Regime for Payment Service Providers Offering Payment Accounts compiles, on a quarterly basis, the number of payment accounts that have a balance in Mutual Funds (CDF) for each payment service provider (PSP). This series was used to estimate the number of CDF holders for each PSP, since these DCFs only include PH and each account has only one DCFassociated with it 86 . Also, it is assumed that each person has only one payment account in each PSP. Then, the quantities corresponding to each PSP are added, whose total may contain duplications to the extent that the PHs have CDFs in more than one PSP. The denominator of this quotient is the number of people who have payment accounts in the PSPs that offer CDFs, which arises from adding the number of account holders in each PSP. In this way, the denominator can have duplications like the numerator.
Real interest rate on fixed-term loans87
For the calculation of the real monthly interest rate, the following formula was applied:
r= [(1+i) / (1+p )] -1
Where: i is the nominal monthly interest rate; p is the inflation rate obtained through the monthly variation of the CPI and r is the real monthly interest rate.
Metrics for localities with and without Financial Services Access Points (PDAs)
To characterize the population in localities with and without PDA, a CODLOC estimate was used based on location data from the AFIP Registry. Based on the available information on address, zip code, and province, a CODLOC was assigned to each person. Records with such incorrectly reported fields were not included in the analysis, as it is not possible to estimate their place of residence (approximately 1.8 million people).
Glossary of abbreviations and acronyms
ACSF Complementary Financial Services Agency
AFIP Federal Administration of Public Revenues
ANDE Uruguay’s National Development Agency
ARG Argentina
ATM ATM
BaaS Banking-as-a-Service
BCRA Central Bank of the Argentine Republic
BCB Central Bank of Brazil
BIS Bank for International Settlements
BP Payment Button
ByMA Argentine Stock Exchanges and Markets
CABA Autonomous City of Buenos Aires
YOU FALL Argentine Chamber of Extrabank Tax and Services Collection Companies
CAFCI Argentine Chamber of Mutual Funds
CBU Uniform Bank Code
CENDEU Central Bank of Debtors of the Financial System
CGAP Consultative Group to Assist the Poor
CNBV National Banking and Securities Commission of Mexico
CNE National Economic Census
CNPHV National Census of Population, Households and Housing
NVC National Securities Commission
COELSA Electronic Clearing House
CPD Deferred payment check
CVU Uniform virtual key
DEBIN Immediate debit
Der Law
EEFF Financial Institutions
EF Financial Institution
ENACOM National Communications Entity
EPH Permanent Household Survey
ETCNB Non-Bank Credit Card Issuers
E Companies and organizations
FAS Financial Access Survey
CDF Direct Pool Fund
FCD-PH Pool of Money of Human Persons
FCEM Electronic Credit Invoices for MSMEs
FCI Mutual Fund
FF Financial Trust
FGP Public guarantee funds
IMF International Monetary Fund
GPFI Global Partnership for Financial Inclusion
HB Home banking or internet banking
year-on-year i.a
IIF Financial Inclusion Report
INEGI National Institute of Statistics and Geography of Mexico
CPI Consumer Price Index
IPD Digital public infrastructure
LAC Latin America and the Caribbean
LFIP Financing Line for Productive Investment
M Miles
MAV Mercado Argentino de Valores S.A
MB Mobile Banking
Billion Millions
MINCIT Ministry of Commerce, Industry and Tourism of Colombia
MSMEs Micro, Small and Medium Enterprises.
MPE Electronic Payment Methods
MPOS Mobile Device at Point of Sale
MTESS Ministry of Labour, Employment and Social Security
NEA Northeast Argentina
NOA Northwest Argentina
OECD Organization for Economic Co-operation and Development
ON Negotiable Obligation
OPNFC Other Non-Financial Credit Providers
PCT Transfer payments
PDA Access Points
FAQ Fixed Term
PH Human Person
PI Immediate Payments
GDP Gross Domestic Product
PJ Legal Entity
PN Net Worth
POS Point of Sale Device
p.p Percentage points
PSP Payment Service Providers
QR Quick Response code
Shadow Fiend Financial system
CIDER Brazil’s IBGE Automatic Recovery System
YES Chilean Internal Revenue Service
SIPA Argentine Integrated Pension System
NFPS Non-financial private sector
SGR Mutual Guarantee Companies
SUC Branch
TAS Self-service terminal
TVI Year-on-year rate of change
UNESCO United Nations Educational, Scientific and Cultural Organization
UVA Purchasing Value Units
References
1 Includes financial institutions, payment service providers and non-financial credit providers.
2 Both bank accounts and payment accounts.
3 Variation on a seasonally adjusted basis. Wage index. INDEC
4 Month-on-month variation of the seasonally adjusted series. EMAE. INDEC
5 Variation on a seasonally adjusted basis in the number of total jobs. The increase was concentrated in monotributistas and public employees, while registered private employment continued to contract. Situation and evolution of registered work. Ministry of Human Capital.
6 Financial services access points are made up of branches, mobile branches, ATMs, self-service terminals (TAS) and complementary financial services agencies (ACSFs) and ATMs operated by non-financial institutions
7 Financial Access Survey 2023. IMF (2024)
8 Composed of 20,517 ACSF, 19,784 ATM, 8,381 TAS, 4,915 branches and 118 mobile branches.
10 Labor informality in these countries is: 37% (Brazil), 56% (Colombia), 56% (Mexico) and 50% (Argentina). International Labour Organization (2023).
11 The percentage of the adult population with an account shows a value of 102.4% in June 2024. For more explanation, see Methodological Note.
12 This metric measures the proportion of account holders who registered at least one transaction in one of their accounts throughout the quarter.
13 Since this indicator considers the subset of operations in which COELSA is involved, the activity metrics are underestimated. In particular, the indicator does not capture those account holders who operate with a debit card and do not make transfers to or from payment accounts, among others. Another aspect of the indicator is that debit transactions are, in general, initiated by the PH account holder itself, while credit transactions are originated by a third party (PH or PJ). This distinction has different considerations in terms of financial inclusion, given that in the first case it is an active operation of the PH. For more details on the transactions settled and cleared by COELSA, see Methodological Note.
14 Net opening (or net increase) is calculated by subtracting the total accounts between two dates. This calculation does not consider gross account openings and closures on an individual basis.
15 In the fourth quarter of 2023, the use of the internet and cell phones for people between 18 and 29 years of age reached 96.7% and 98% respectively, for people between 30 and 64 years of age these values were 93.2% and 97.5%. On the other hand, for people over 64 years of age, the use of the internet and cell phones was 69.9% and 81%. See Report on Access and Use of Information and Communication Technologies. EPH, fourth quarter of 2023. INDEC.
16 Internet Access Report, INDEC.
17 Report on Access and Use of Information and Communication Technologies. EPH, fourth quarter of 2023.INDEC
18 Communication A 8027 establishes that savings banks in foreign currency will have the same requirements as savings banks in pesos in their opening and operation. Savings banks in foreign currency must not be conditioned to the acquisition of other financial products and/or services. They may be denominated in U.S. dollars, euros, yuan, renminbi, and other currencies.
19 Communication A 7933 provided for the possibility of making more than one transfer per person per month in foreign currency to another account denominated in foreign currency. These review requirements had been provided for by Communication A 7072.
20 In July 2024, Communication A 8062 regulated the Special Account for the Regularization of Assets provided for in Law 27,743, Article 26, in the context of money laundering.
21 In August 2024, Communication A 8106 Point 1 incorporated the possibility for holders of Asset Regularization Accounts to link them with a debit card and/or other electronic means of payment.
22 In this semester, certain supermarkets and neighborhood stores began to accept payments in dollars.
23 The figures presented in this section are subject to revision and possible corrections that could affect some analyses.
24 Communication A 8032, Communication A 8032, Resolution 780/24, General Resolution 5554/24, Decree 731/24, Decree 698/24.
25 Electronic payments are made up of: (1) Instant payments: (i) Transfers: includes interbank transfers, from and/or to a payment account and between payment accounts of the same payment service provider (PSP) and does not include transfers within the same financial institution; (ii) PCT: includes payments with interoperable transfers and payments with transfer between the same PSP; (2) Cards: debit, credit and prepaid; and (3) Immediate Debits and Direct Debits.
26 For reference, Brazil registered, on average, 47 monthly electronic payments per inhabitant during the first quarter of 2024 (Central Bank of Brazil (BCB)). With data available as of 2022, economies such as the United States and Sweden made about 50 electronic payments per inhabitant and others such as Mexico from India, around 6. By that year (2022), Argentina had registered 15 electronic payments per inhabitant (BIS data portal).
27 The amounts are expressed at constant prices of June 2024 (CPI June 2024 = 100).
28 IMF “Measurement and Use of Cash by Half the World’s Population”, 2023.
29 The monthly average per extraction was 28 thousand constant pesos in the first half of 2024 while, in the same period of 2021, it was 78 thousand constant pesos.
30 Cash payments in supermarkets had a share of 27% in the first half of 2023, which fell to 19% in the same period of 2024. While in the appliances category, cash reached 13% of sales from 17% between the first half of 2024 and 2023, respectively. Source: Indec. Supermarket Survey and Household Appliances and Household Goods Retail Survey
31 These operations include movements of money that do not necessarily involve a payment. Based on the available data, it is not feasible to discriminate between remittances that do not constitute payments and those that do. Immediate transfers do not include those made within the same financial institution.
32 This decision may be influenced by other factors such as promotions or the possibility of paying in installments, among others. In general, credit card payments can be considered to have a fixed cost (associated with the issuance of the statement and/or the renewal of the card). In the case of the use of transfers and debit cards, the fixed cost could be considered to be the amount of maintaining the account (if it is not free). In any case, the cost per operation decreases with use. In the case of businesses, as it is a percentage of the operation, the cost does not decrease with use.
33 The acceptor offers merchants the tools to collect with this means of payment. PCTs have different trade rules than other immediate transfers.
34 For more details, see the glossary of the Minority Payments Report.
35 The survey consisted of investigating the information available on the websites of FiServ, Payway, MercadoPago, Ualábis, NaranjaX, SiPago, Viumi, and Getnet.
36 The amounts in this section are expressed at constant prices in June 2024 (CPI jun-24 = 100). Balances in foreign currency are expressed in pesos and valued at the reference exchange rate (Com. A 3500) on the last business day of the month.
37 The savings and investment products considered in this paper are: (i) savings: balance in EEFF and PSP accounts, both in pesos and in foreign currency; fixed terms in pesos, UVA and foreign currency and other UVA products such as savings accounts; (ii) investment: money pools and other mutual funds (which are not money pools).
38 trillion is millions of millions.
39 The valuation of foreign currency deposits at a higher exchange rate explains the jump in the series in December 2023. See footnote 48 of the Financial Inclusion Report published in April 2024.
40 0ByMA published data on the status of the principals’ accounts during the first half of 2024, which allow inferring a significant income of individuals in the capital market. The total number of client accounts in Caja de Valores S.A. registered a significant increase, reaching 13.1 million accounts in June 2024. In the first half of the year, the client accounts with operations in ByMA reached a total of 1.2 million, while in the first half of 2023 that amount was 430 thousand. Market Growth. 1st semester of BYMA. As a complement, from the Shareholders’ Meeting of ByMA and Infographics, it emerges that the total number of principal accounts amounted to 7 million in December 2023, while the total number of principal accounts with operations in ByMA reached 3.6 million in that year.
41 Monthly Monetary Report – June 2024, BCRA.
42 As of June 2024, forward transactions accounted for 58.1% of the DCF portfolio, while this share stood at 22.3% at the end of 2023 (Source: Argentine Chamber of Mutual Funds (CAFCI, Statistical Reports, Money Market Funds – Evolution of the Main Holdings by Asset Class). In particular, the DCFs with the greatest impact on the weighted monthly return adjusted the composition of their assets as mentioned, increasing the share of forward operations from 10.3%, 17.1% and 45.5% in December 2023 to 60.2%, 53.7% and 69.4% in June 2024, respectively (Source: CNV)
43 Communication A 7988 and Communication A 8000.
44 The structure of this market has some particularities: as of June 2024 (i) three PSPs accounted for 96% of the number of payment accounts with FCDs and 97.6% of the balances of the FCDs subscribed from PSPs in both cases; (ii) 9% of the PSPs offered this investment alternative.
45 PSP account holders who subscribe to CDFs represent more than 90% of payment account holders.
46 The number of PHs holding fixed terms is an estimate and the calculation does not yield single holders, since holders may have fixed terms in more than one FI. See the explanation of the estimation method in the Methodological Note.
47 See Section on Access and Use of Accounts.
48 Throughout this document, the metrics consolidate unique debtors within the group of suppliers that they take as a reference. Duplication caused by multiple funding lines within the same provider and by funding across different providers in the same analysis group is eliminated.
49 Extended financial system (SFA) includes the financing of EEFF and/or PNFCs. The latter lend with their own capital and must meet minimum requirements (such as registration, sending information and user protection).
50 EEFF only: financing only in EEFF (and not in PNFC, although they can register debt in financial trusts -FF-). PNFC only: financing only in PNFC (and not in EEFF, although they can register debt in FF). EEFF and PNFC: simultaneous financing in EEFF and PNFC (although they can register debt in FF). Remainder: debt only in FF. With the available data, it is not possible to determine whether the debt included in the FF originated in EEFF or PNFC. For this reason, the information of the debtors who only registered debt in FF as “Remainder” is presented and the debtors who registered debt in FF and EEFF to “EEFF Only”, those who registered debt in FF and PNFC to “PNFC Only” and those who registered debt in FF, EEFF and PNFC to “EEFF and PNFC” are added.
51 The amounts in this section are expressed at constant prices in June 2024 (CPI June 2024 = 100).
52 Total wage index (deflated), includes wages from the registered private sector, public sector and unregistered private sector. INDEC. Wage index.
53 As of June 2024, this PNFC was the credit provider with the largest number of debtors, which represented 25% of the total number of SFA debtors.
54The comparison with June 2020 is avoided because it is a year impacted by an atypical situation such as the COVID-19 pandemic.
55 For more details on the characteristics of “Buy Now, Pay Later”, see Section 1 of the June 2024 Report on Non-Financial Credit Providers, BCRA.
56 In the months of April and May 2024, the highest number of searches for the terms “UVA mortgage loans” since January 2016 were registered in Google search engines (source: Google Trends).
57 Comparison List – UVA Loans
58 Financial Access Survey: Trends and Developments. 2023. IMF; Financial Inclusion Report. First half of 2023.
59 Guidance Note on Policy Options to Improve Last Mile Access and Quality Inclusion, through digital infrastructure, including Digital Public Infrastructure (DPI), Consumer Protection and other FIAP objectives (not yet published). GPFI, 2024.
60 Geospatial Analysis of Banking Correspondents in Colombia. Banca de las Oportunidades.
61 Annual Overview of Financial Inclusion 2023. CNBV
62 Brazil (1973), Colombia (2006) and Mexico (2008).
63 Communication A 6603.
64 The difference in coverage between Argentina and the rest of the countries is not due to the size of the municipalities. Brazil has one municipality for every 1,529km2; Colombia one every 1,034 km2; Mexico one every 803 km2; Argentina one every 776 km.
65 According to CAECEIS, there are 25,000 service points.
66 Banking as a service: How it can catalyze financial inclusion. Consultative Group to Assist the Poor (CGAP), 2022.
67 Colombia’s 2022 Financial Inclusion Report. Banca de las Oportunidades.
68 Art. 319 bis of General Provisions Applicable to Credit Institutions. CNBV.
69 3G or 4G network coverage. First quarter of 2024. ENACOM.
70 Access to and use of information and communication technologies. Fourth quarter of 2023. INDEC.
71 What are the biggest obstacles to growth of SMEs in developing countries? An empirical evidence from an enterprise survey. Wang (Borsa Istanbul, 2016).
72 Mainly, MAV, BYMA and MAE.
73 Refers to the monthly flow of credit from financial institutions to SMEs incorporated as legal entities, BCRA.
75 Report – June 2024, Argentine Chamber of Companies and Guarantee Funds.
76 MSMEs and the credit market in Argentina. Management of Economic and Financial Investigations. BCRA (2001).
77 The set of guarantee institutions is made up of: 49 SGRs (Open Data), 11 provincial FGPs (BCRA), 1 national FGP and 49 banks authorized (CNV) to extend guarantees. The SGRs, the main providers of guarantees to MSMEs, are governed by Law 24,467 of 1995 and amendments.
78 The future of Fast Payments. World Bank. October 2023.
79 In Argentina, the maximum period for financial institutions to credit the amount of a sale by a merchant with a credit card can vary between 5 and 18 business days depending on the area of economic activity and/or size of the company (TO Sistema Nacional de Pagos – Payment Services).
80 BIS. Data Portal.
81 Communication “A” 7153.
82 Financial Inclusion Report – second half of 2022
83 TO Payment Service Providers.
84 See Glossary, CAFCI.
85 Information Regime for Supervision. Codes 999705, 999706, 889901 and 889902 – Number of forward transactions.
86 Information Regime payment service providers that offer payment accounts. Code 30000.
Share on


