Executive summary
• In September, the growth of the real balance of bank credit granted to the private sector continued to consolidate, while the financing irregularity ratio remained unchanged at moderate levels. In this context, the financial system preserves high indicators of soundness.
• The balance of financing in pesos granted by the financial system to the private sector grew 6.7% in real terms in September (monthly increase of $3 trillion in homogeneous currency), reaching $48.4 trillion. The increase was widespread among the different credit assistance, accumulating an increase of 48.6% from the level at the end of April. The real balance of credit to the private sector in pesos presented a positive year-on-year variation (y.a.) of 5.8%, a situation that had not been verified since mid-2022. The balance of loans in foreign currency increased 8.5% in the month and 93.3% YoY (in currency of origin). The real balance of total credit (domestic and foreign currency) to the private sector grew 6.7% in September and accumulated an increase of 12% real YoY, reversing the negative year-on-year rates observed in the last 6 years.
• In September, the non-performing ratio of credit to the private sector remained at around 1.6% for the aggregate financial system. The indicator of irregularity of loans to companies totaled 0.7% and 2.6% for the portfolio of loans to households, with no changes in magnitude compared to August for both segments. The banks as a whole maintained a high forecast, equivalent to 174.3% of the balance of loans in an irregular situation in the month (109% when considering the balance of forecasts attributable to loans in an irregular situation).
• The real balance of deposits in pesos in the private sector increased 1% in the month, with increases in the time segment and a reduction in demand accounts. Within the framework of the Asset Regularization Regime, the balance of foreign currency deposits of the private sector grew 62.7% in the month, reaching in September a level similar to that of mid-2019 (about USD31,600 million). The real balance of total deposits (considering all sectors and currencies) grew 12.7% in the month.
• The broad liquidity ratio in national currency increased by 1.6 p.p. of deposits in the same denomination in the month, to represent 36.8%. The liquidity ratio in foreign currency stood at 83.5% of deposits in that denomination, 7.1 p.p. more than at the end of August within the framework of the aforementioned inflow of funds from the Asset Regularization Regime.
• In September, the capital integration (RPC) of the aggregate set of financial institutions represented 34.7% of risk-weighted assets (RWA), 1.8 p.p. less than last month in the context of the aforementioned credit expansion. In the period, the excess regulatory capital of the financial system totaled 336% of the minimum regulatory requirement and 58.3% of the balance of credit to the private sector (net of forecasts).
• In recent months, there has been a downward trend in the profitability indicators of the financial system. The total comprehensive results in homogeneous currency accumulated by the sector in the last 3 months to September were equivalent to 1.9% annualized (y.) of assets (ROA) and 7% y. of equity (ROE), being lower records than those verified in the previous months. In the accumulated 12 months to September, the ROA of the aggregate of entities was equivalent to 6.8% and the ROE totaled 26.9%.
• In the month, immediate transfers (TI) decreased compared to August, maintaining a significant expansion in year-on-year terms (74.6% in quantity and 32.5% in real amounts). In September, payments with transfers (PCT) via QR grew 4% in quantity and 3.6% in real amounts (159.8% YoY in amounts and 119.9% YoY in real amounts). ECHEQs continued to increase their share of total check clearing, accounting for 50.1% in quantity and 76% in amounts.
I. Financial intermediation activity
Financial intermediation between all institutions and the private sector grew again in September for the fifth consecutive month, thus closing the third quarter of the year with real increases in both the balances of loans and deposits in this sector.
Considering the most outstanding monthly movements – in homogeneous currency – of the balance in pesos of the aggregate financial system, in September the increase in the balance of deposits (from the private and public sectors) and the fall in financing to the public sector were the main sources of funds. These resources were mostly channeled to increase the real balance of credit to the private sector and bank liquidity. As for the foreign currency segment, in the period the most relevant variations were associated with increases in the balance of private sector deposits and liquid assets of all entities, mainly within the framework of the Asset Regularization Regime established by Law 27,7431.
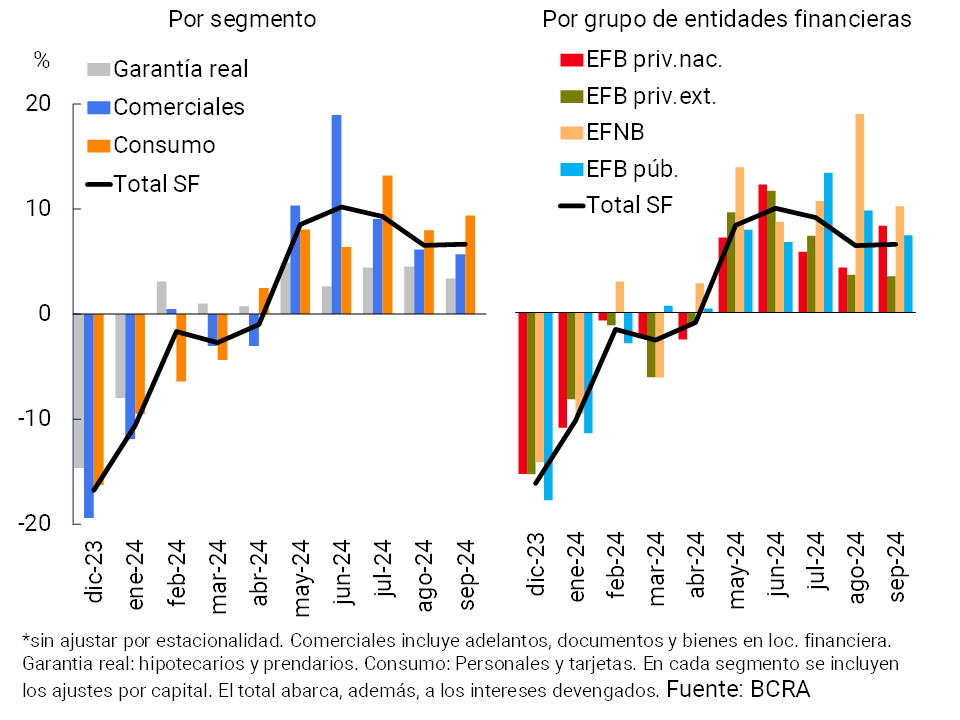
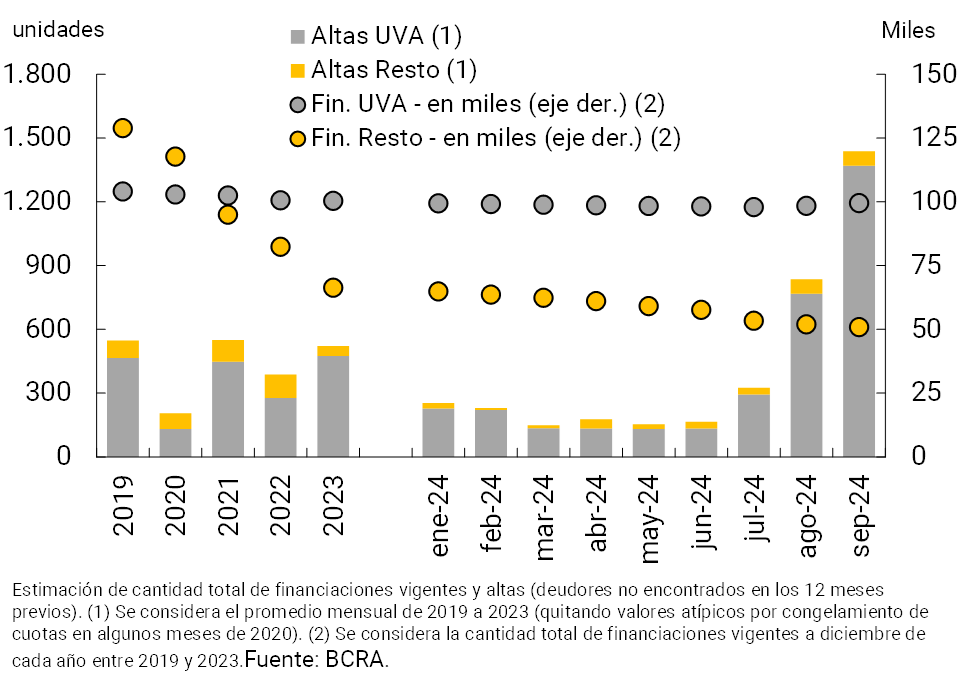
In September, the balance of loans in pesos to the private sector grew 6.7% in real terms compared to the previous month, with increases in all credit segments and groups of financial institutions (see Graph 12. In the period, consumer financing lines in pesos increased 9.4% in real terms, followed by commercial loans (5.7% in real terms) and those with real collateral (3.4% in real terms). Within the latter segment, mortgage loans continued to regain dynamism, with increases of 2.3% in real terms in the month – including principal and adjustment of UVA loans. It is estimated that in September the number of new mortgage debtors (“registrations” of individuals) in the financial system amounted to 1,438 (of which 95% were arranged through instruments denominated in UVA, see Graph 2).
Graph 1 | Balance of credit to the private sector in pesos
Monthly changes in real terms*
Graph 2 | Amount of mortgage financing (individuals) and estimate of “highs”
Financial system
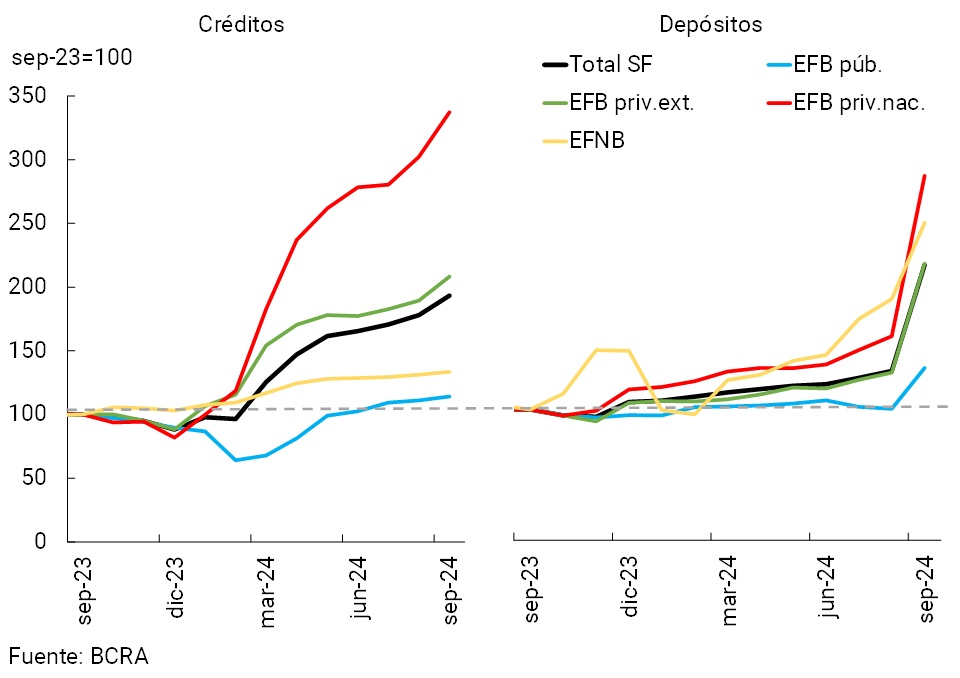
The positive performance of the real balance of credit in pesos to the private sector that has been observed since April (48.6% real in the last five months) was reflected in almost all financial institutions. In particular, the largest relative increases in the real balance of financing in pesos to the private sector were verified in the largest entities in terms of assets (see Chart 3). Based on this positive performance verified in recent months, the real balance of credit to the private sector in pesos presented a positive year-on-year variation in September (5.8% y.o.y.), after more than two years of declines.
Graph 3 | Distribution among financial institutions of the variation in the real balance of credit to the private sector in pesos
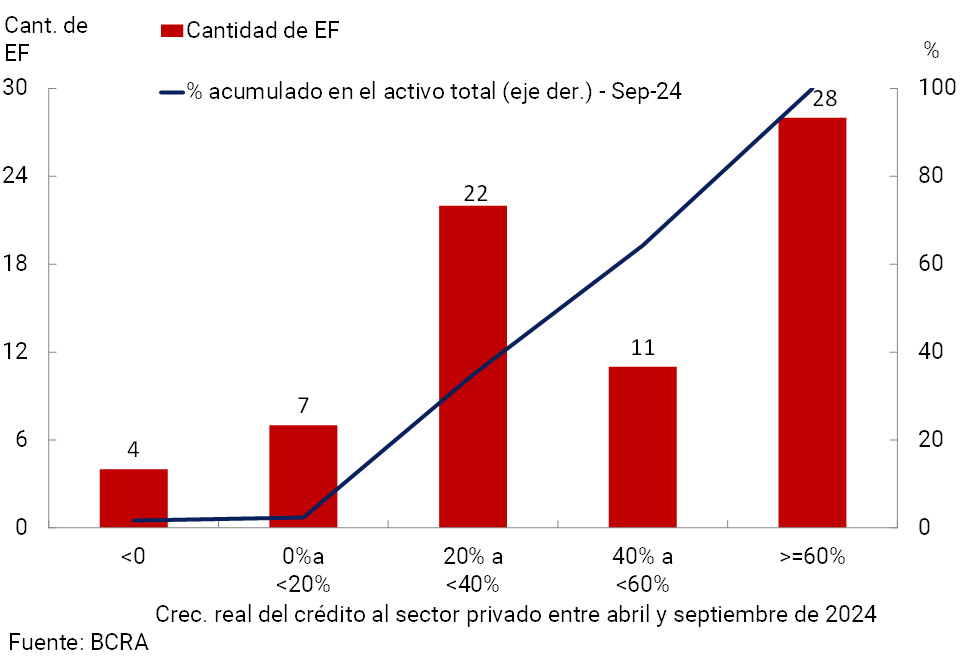
Figure 4 | Financial intermediation with the private sector in foreign
currency In source currency
In relation to the foreign currency segment, the balance of credit to the private sector increased by 8.5% in September —in the currency of origin—, with a greater relative dynamism of domestic private banks and foreign entities (see Chart 4). Almost half of the increase in the period was driven by documents and export pre-financing.
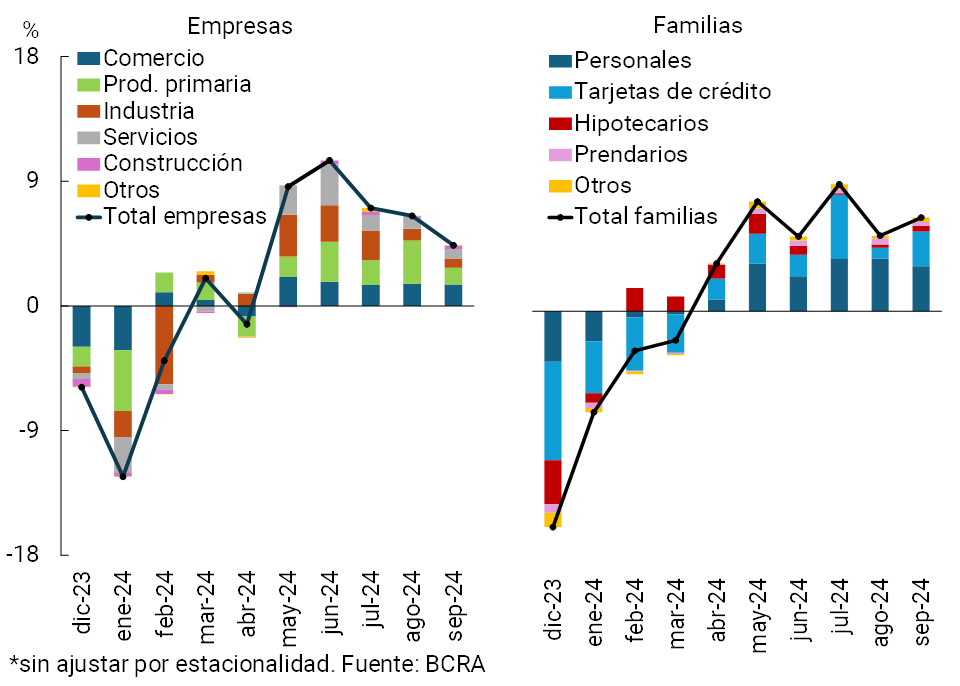
When considering all currencies, in September the real balance of credit to the private sector increased 6.7% between peak of the month. The balance of credit to firms increased by 4.4% in real terms, mainly due to loans to trade and primary production (see Chart 5).3 On the other hand, financing to families grew by about 7% in real terms in September, driven mainly by the performance of consumer lines (personal and cards). As a result of the positive dynamics observed in recent months, the real balance of total credit (domestic and foreign currency) to the private sector accumulated a growth of 12% real year-on-year, reversing the negative year-on-year rates of the last 6 years.
Graph 5 | Total credit balance to the private
sector Contribution to the monthly change in real terms*
Based on the results of the Credit Conditions Survey (CCS) for the third quarter of the year, the expansion of credit (both for companies and households) in the period responded to both supply and demand factors for financing. According to the results of the ECC, this trend would continue during the last quarter of the year.
In September, the real balance of deposits in pesos in the private sector increased 1% between the end of the month (see Chart 6). The performance in the period was explained by time deposits (3.5% real monthly), with a higher relative growth of those arranged at a fixed interest rate (5.8% real monthly) compared to those adjusted for UVA. On the other hand, demand accounts fell 2.4% in real terms compared to August4.
Graph 6 | Balance of private sector deposits in pesos
Changes in real terms*
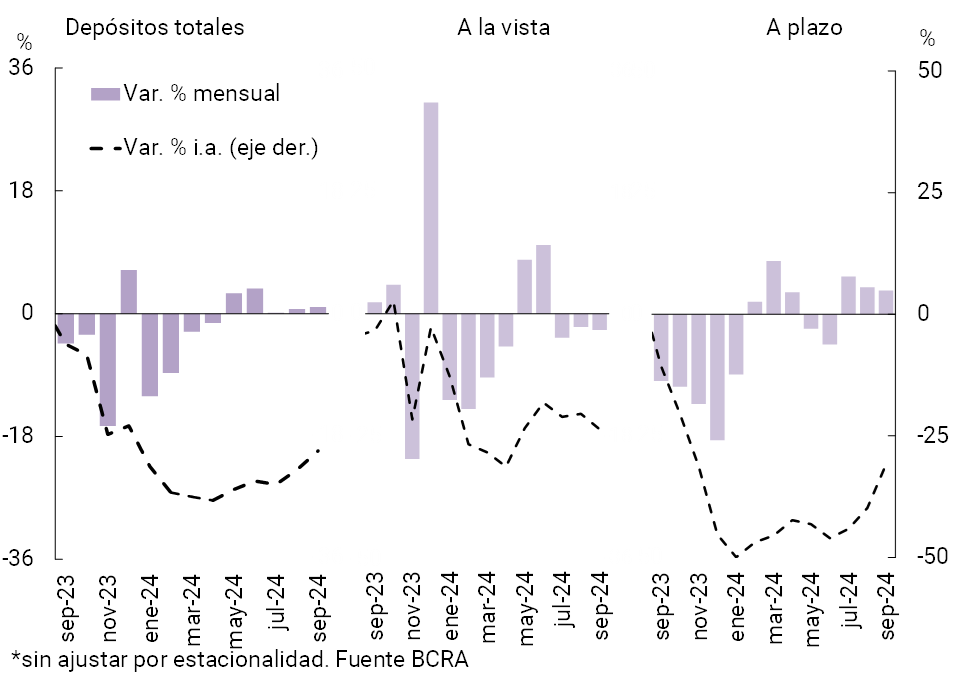
In September, the balance of deposits in foreign currency of the private sector grew 62.7% compared to August (equivalent to USD12,177 million, see Graph 4), driven by the entry of resources into the financial system within the framework of the Asset Regularization Regime. Thus, the balance of deposits in foreign currency of the private sector stood at USD31,584 million, a level similar to that observed in mid-2019. In this context, the real balance of total deposits (considering all sectors and currencies) grew 12.7% in month5.
II. Evolution and aggregate composition of the balance sheet
In September, the size of the balance sheet of the aggregate financial system grew. The total assets of the sector increased 8.7% in real terms in the month, a performance that occurred within the framework of the incorporation of resources from the Asset Regularization Regime6. In a year-on-year comparison, the total assets of the financial system accumulated a reduction of 3.2% in real terms.
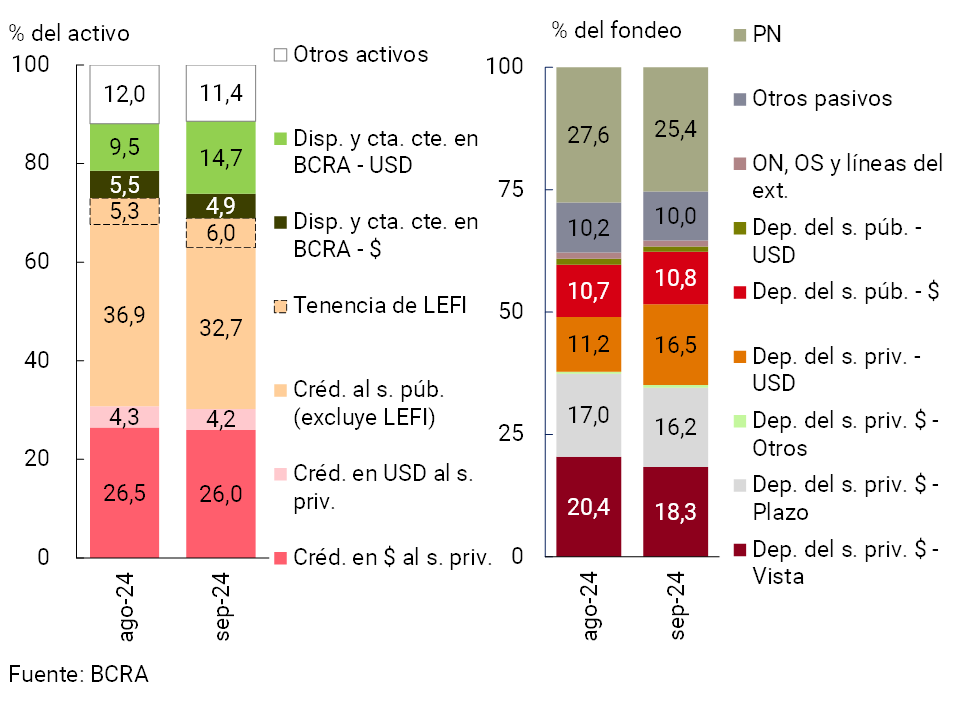
The entry into force of the Asset Regularization Regime also had effects on the composition of assets and total funding of the financial system in September. Within assets, the share of the balance of availabilities and current accounts in the BCRA in foreign currency increased monthly, with the counterpart being the increase in the weighting of private sector deposits in the same denomination in the total funding of the sector (see Section I and Graph 7). With regard to the rest of the items that make up the sector’s assets, LEFI holdings also increased their relative weight in the month, while the rest of the components reduced their weighting in the total. On the other hand, the other concepts that make up the total funding decreased their relative participation in the total in the month.
Figure 7 | Composition of assets and funding Financial
system – Participation %
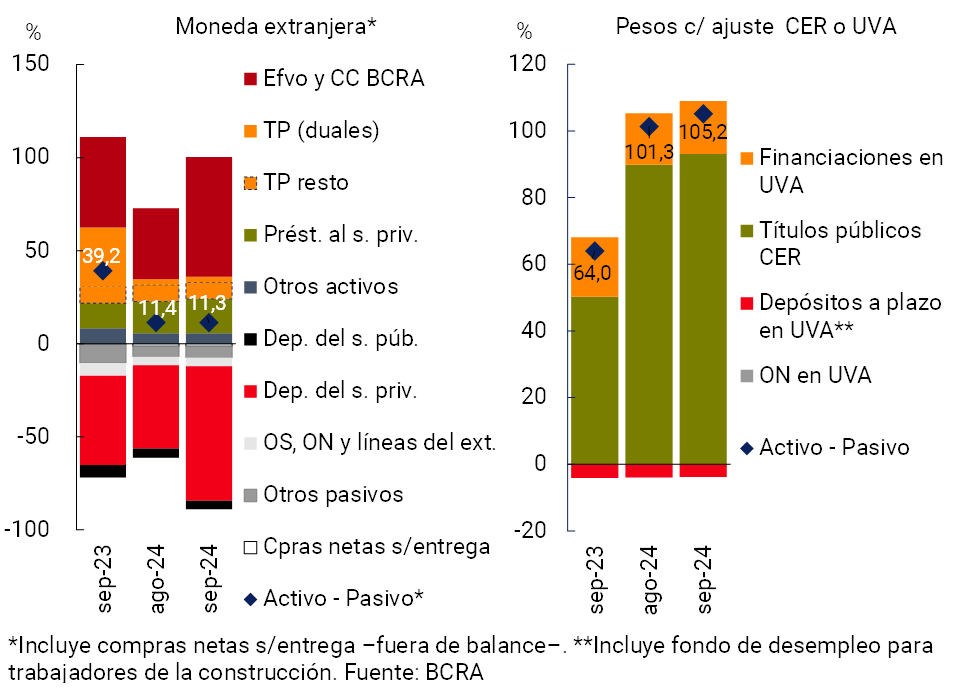
The financial system’s foreign currency assets and liabilities registered similar increases in the month, leading to the estimated spread between items in that denomination remaining without significant changes in September7. In the month, this indicator totaled 11.3% of the PRC for all financial institutions (-27.9 p.p. y.o.y., see Chart 8). On the other hand, it is estimated that the spread between the items of assets and liabilities in pesos with capital adjustment by CER (or that are agreed in UVA) stood at 105.2% of the sector’s PRC, 3.8 p.p. above the August figure (+41.1 p.p. y.o.y.).
Figure 8 | Spread between assets and liabilitiesIn % of PRC
III. Portfolio quality
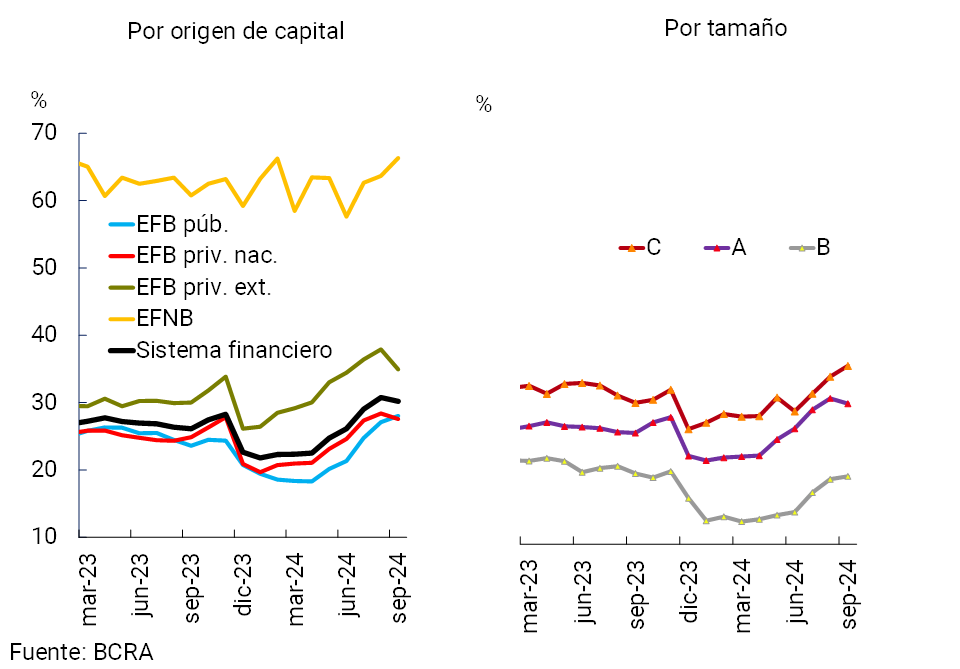
In a month in which the total assets of the financial system expanded significantly, largely as a result of the inflow of resources from the Asset Regularization Regime (see Section II), the gross exposure of all entities to the private sector fell by 0.6 p.p. of assets8 to 30.2% in September (+4.1 p.p. y.o.y.). This dynamic was largely explained by private banks and relatively larger entities ( see Figure 9). Considering the segment in pesos, the indicator totaled 26% in the period, while the weighting of credit to the private sector in foreign currency in the total assets of the sector stood at 4.2%9.
Figure 9 | Credit balance to the private sector in terms of assets
By group of financial institutions
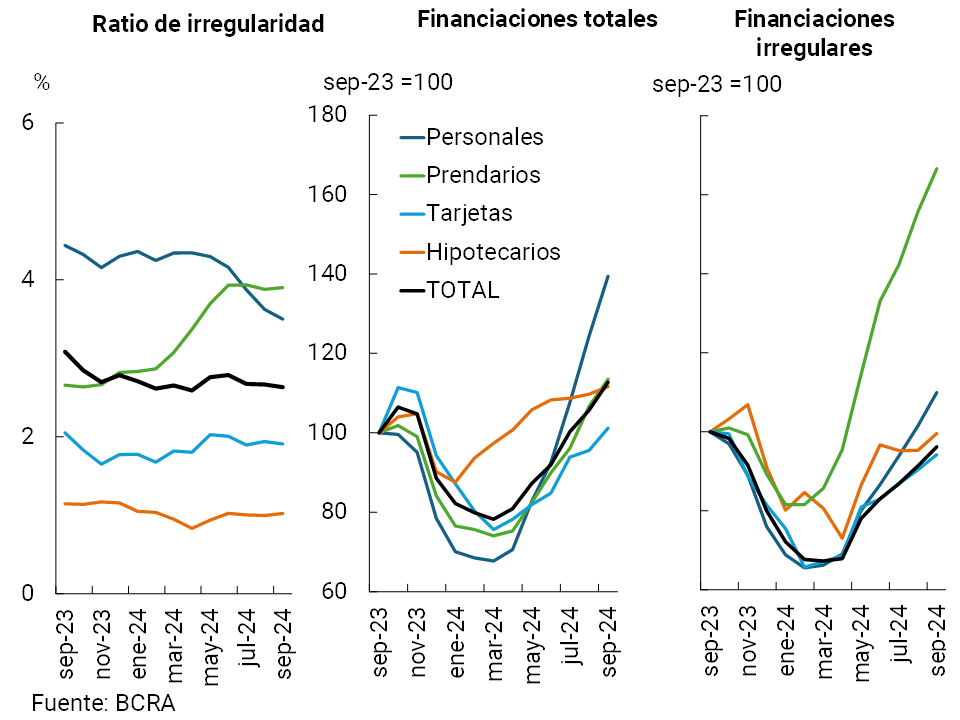
The non-performing loan ratio for loans to the private sector remained stable in September, at around 1.6% at the systemic level (a slight decrease in public EFBs and a slight increase in EFNBs). In the month, the NPL indicator for the corporate financing portfolio stood at 0.7%, with no changes in magnitude compared to August. With the exception of construction, with a relatively higher level, the rest of the sectors presented irregularity ratios more in line with total credit to companies ( see Graph 10). The irregularity ratio of credit to households did not change significantly in September either, standing at 2.6%. The monthly dynamics were generalized among the different credit assistance to families ( see Graph 11; personal loans slightly reduced their relative delinquency in the month).
Figure 10 | Irregularity of credit to companies
In real terms — Financial system
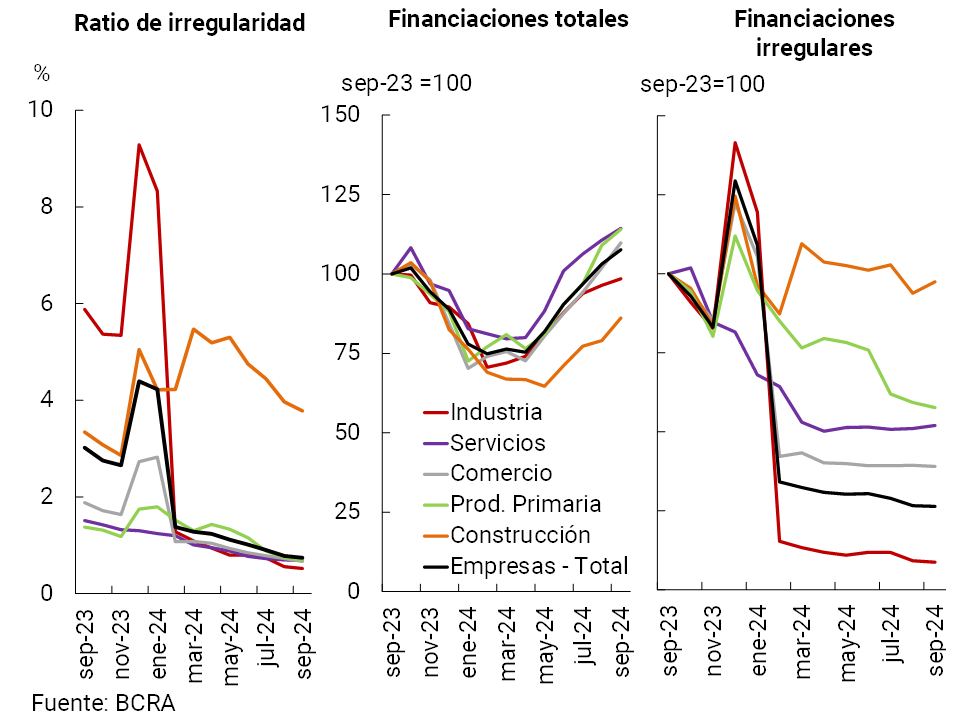
Figure 11 | Irregularity of credit to households
In real terms — Financial system
The sector maintains high forecasting. In September, the total balance of forecasts of the financial system represented 174.3% of the irregular portfolio of the private sector, 4.1 p.p. and 52.5 p.p. more than in August and in the same period of 2023, respectively. The forecasts attributed exclusively to the balance in an irregular situation10 stood at 109% of the irregular portfolio for the financial system as a whole, increasing 2.9 p.p. compared to August and 21 p.p. y.o.y.
IV. Liquidity and solvency
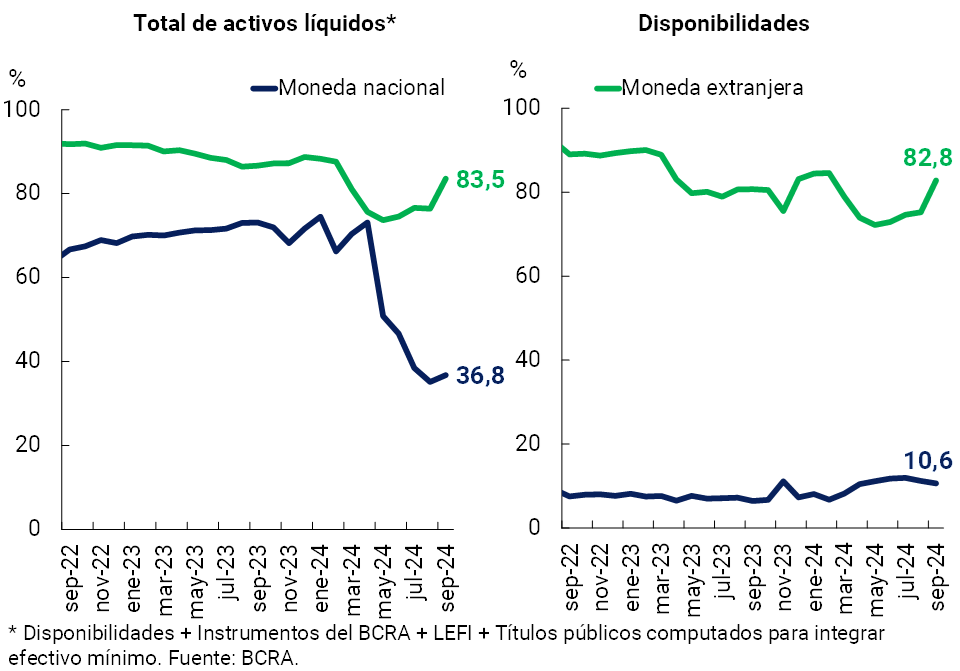
In September, the liquidity indicators of the financial system grew. The broad liquidity ratio in national currency11 increased by 1.6 p.p. of deposits in the same denomination in the month, to represent 36.8% (-36.4 p.p. y.a.) ( see Graph 12). Basically, this was the result of a greater possession of LEFI in the system aggregate (the availabilities reduced its relative weight)12. On the other hand, within the framework of the inflow of funds from the Asset Regularization Regime, the liquidity ratio for the segment in foreign currency stood at 83.5% of deposits in that denomination at the systemic level, 7.1 p.p. more than at the end of August (-3.1 p.p. y.o.y.).
Figure 12 | Liquidity
indicators Financial system – As % of deposits
In a context of credit expansion, in September the capital integration (RPC) of the aggregate group of entities represented 34.7% of risk-weighted assets (RWA), 1.8 p.p. less than last month. This dynamic occurred in a context of a monthly fall of 0.7% in real terms in the PRC together with a 4.5% real increase in RWAs (mainly due to the expansion of credit to the private sector). In the period, the excess of regulatory capital in the financial system totaled 336% of the regulatory requirement and 58.3% of the balance of credit to the private sector (net of forecasts).
At the end of the third quarter of the year, the leverage ratio13 amounted to 21.5% for the financial system as a whole, 0.6 p.p. below the previous quarter’s figure and 4.1 p.p. above a year ago ( see Chart 13). All groups of financial institutions presented a level above the regulatory minimum (set at 3%).
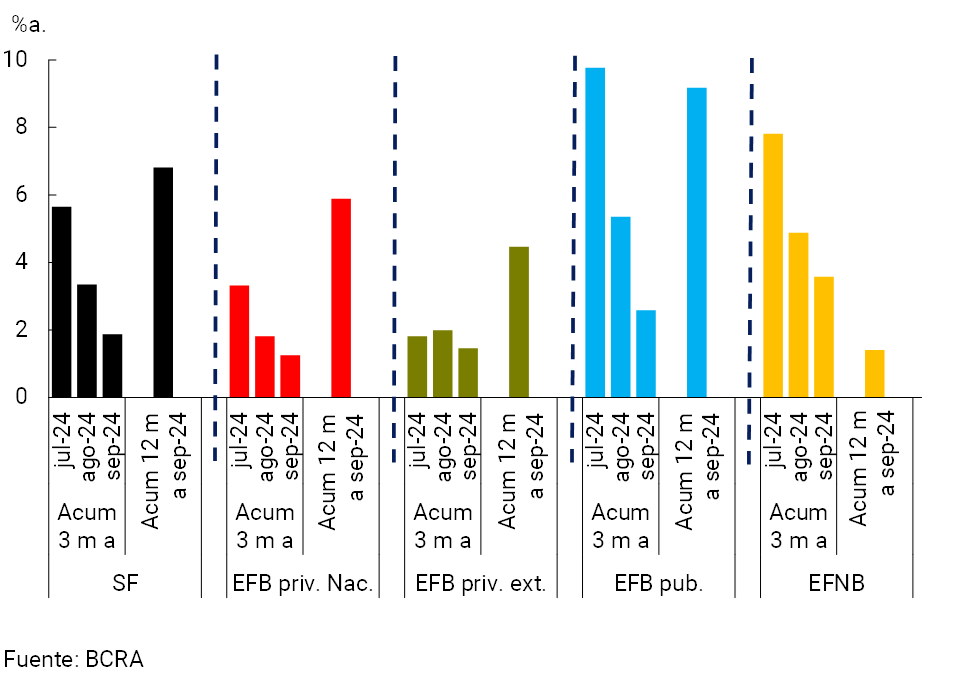
With regard to the endogenous generation of capital in the financial system, in recent months there has been a downward trend in profitability indicators in all groups of entities ( see Chart 14). The total comprehensive results in homogeneous currency accumulated by the sector in the last 3 months to September were equivalent to 1.9% annualized (y.) of assets (ROA) and 7% y. of equity (ROE), being lower records than those verified in the previous months. This performance was largely explained by the accrual of a lower real comprehensive financial margin (mainly premiums for passes, results for securities and CER adjustment; tempered by lower interest expenses and a decrease in monetary losses (fall in monthly inflation records), offset by the reduction in tax expenditures. For its part, in the accumulated 12 months to September, the ROA of the aggregate of entities was equivalent to 6.8% and the ROE totaled 26.9%.
Figure 13 | Leverage
ratio Capital 1 in terms of a broad measure of exposure
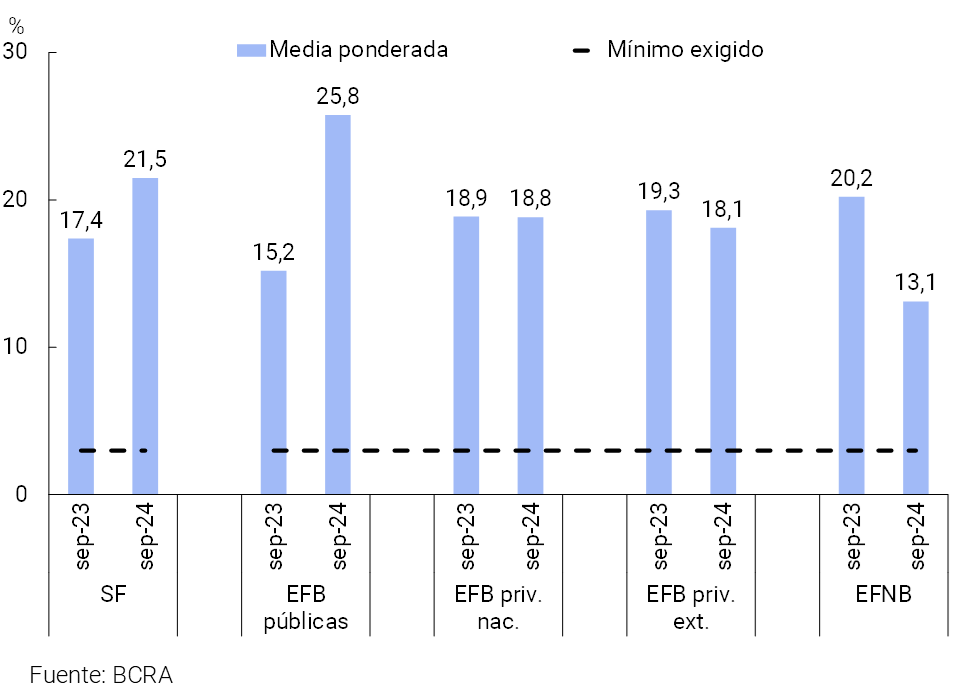
Figure 14 | Cumulative ROA (3 and 12 months)
By financial institution group
V. Payment system
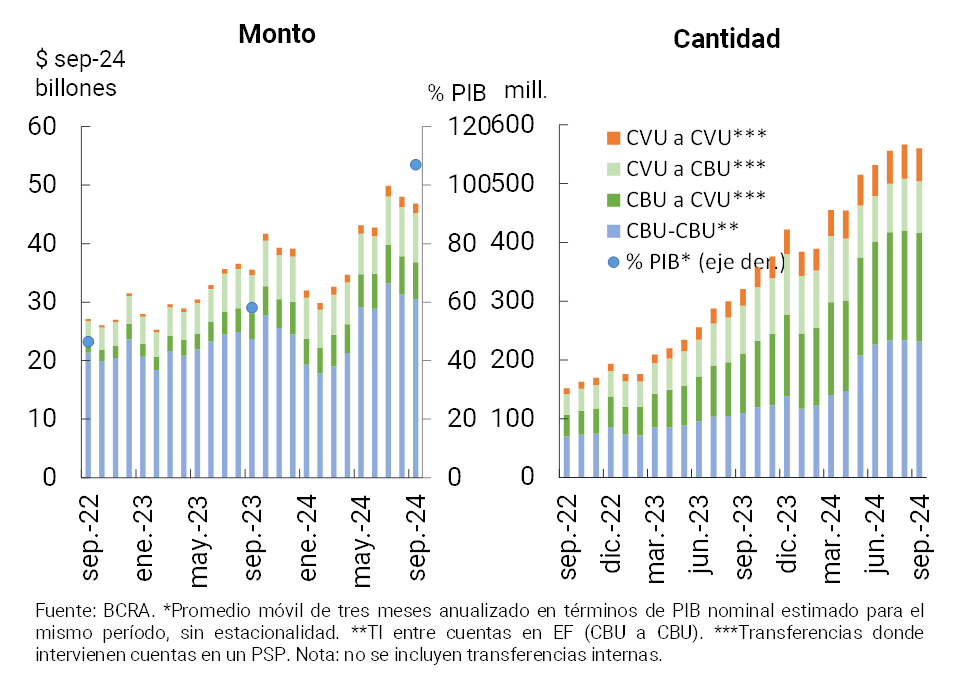
In September, immediate transfers (TI) showed a slight contraction compared to the previous month (-1.1% in the number of operations and -2.5% in real amounts)14. However, in year-on-year terms, IT continued to expand, with a growth of 74.6% in quantity and 32.5% in real amounts ( see Graph 15). Year-on-year dynamics were driven by transactions between bank accounts (from CBU to CBU) and between accounts in payment service providers (from CVU to CVU)15 16. In the last 12 months, it is estimated that IT almost doubled its weight in the economy, representing approximately 107% of GDP (+48.9 p.p. y.o.y.).
Figure 15 | Instant Transfers (TI)
In the month, Payments with Transfer (PCT) operations through QR codes grew 4% in amounts and 3.6% in real amounts. These operations accumulated an increase of 159.8% YoY in quantities and 119.9% YoY in real amounts17. Although they start from limited levels, it is estimated that PCTs with QR grew 1 p.p. of GDP in the last year to total 1.4%.
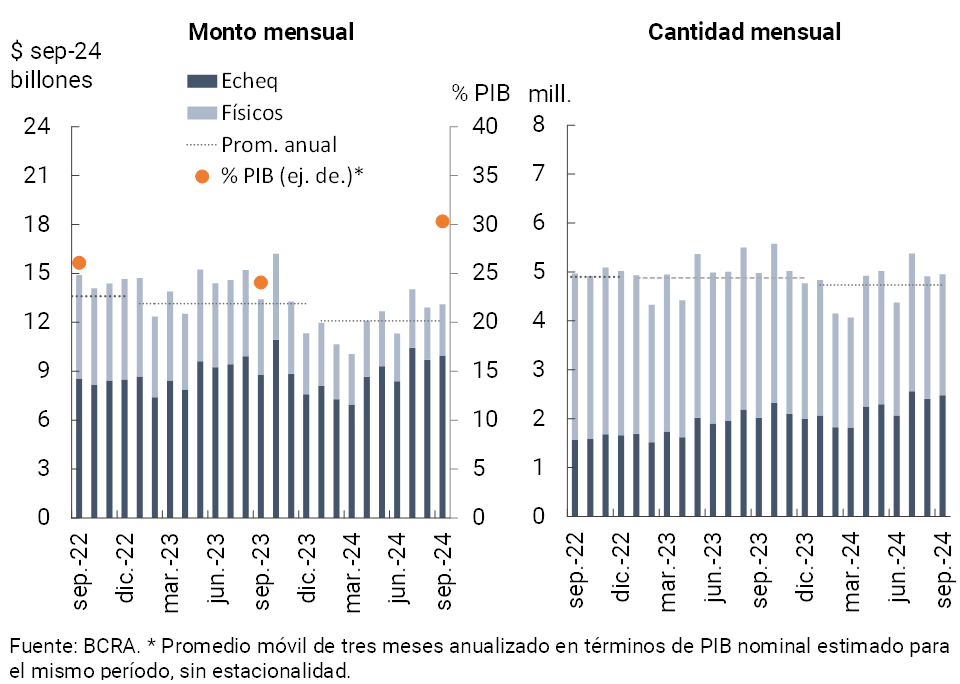
With regard to the clearing of checks, in September there was a slight monthly growth of 0.7% in quantities and 1.5% in real amounts ( see Graph 16)18. In this context, ECHEQs continued to gain share, representing 50.1% of the number of operations and 76% of the real amounts. For its part, the rejection of checks due to lack of funds in terms of the total compensated showed a slight monthly increase, standing at 0.67% in the number of operations (+0.03 p.p. compared to August and slightly higher than the average for 2024). In terms of amounts, the check rejection ratio reached 0.42% (+0.02 p.p. in the month, although lower than the 2024 average).
Figure 16 | Check clearing
References
1 It should be noted that the National Government extended until November 8 the deadline for the manifestation of adhesion to stage 1 of the Regime (initially it was dated September 30, later extended until October 31).
2 Includes principal adjustments and accrued interest.
3 Financing to companies is defined here as that granted to legal entities and commercial financing granted to natural persons. On the other hand, loans to families are considered to be those granted to individuals, unless they are for commercial purposes.
4 In a year-on-year comparison, the real balance of private sector deposits in pesos accumulated a fall of 27.9%.
5 In a year-on-year comparison, the real balance of total deposits (all currencies and sectors) fell by 10.5%.
6 For more detail see Section I.
7 Includes off-balance sheet foreign currency forward purchase and sale transactions. Liabilities include deposits that have variable remuneration depending on the evolution of the exchange rate – associated with the Export Increase Programme – and LEDIV are included in assets.
8 While the numerator (credit balance) increased 6.7% in real terms in the month, the denominator (total assets) increased 8.7% in real terms compared to August.
9 The balance of credit to the private sector net of forecasts for the system represented 29.4% of assets in the month (+0.5 p.p. monthly and +4.2 p.p. y.o.y.).
10 Based on the criteria established in the standards of minimum regulatory provisions for risk of uncollectibility, the minimum regulatory provisions for debtors in situations 1 and 2 are excluded.
11 It considers availabilities (cash and current account at the BCRA), fiscal liquidity bills (LEFI), passing operations against the BCRA, holding of BCRA instruments, and the balance of the types of public securities that the entities compute as part of the Minimum Cash.
12 When additionally considering the holding of LECAP with a residual term of less than 3 months, the broad indicator of systemic liquidity would reach 43.4% of total deposits.
13 Defined according to Basel Committee guidelines as Tier 1 Capital in terms of a broad measure of exposure.
14 In September, transfers between bank accounts (CBU to CBU) increased their share to 40.9% of the total, with an increase of 7.1 percentage points year-on-year. Transfers from CBU to CVU also grew, reaching 33.2% of the total, with an increase of 1.5 percentage points year-on-year. Transfers between CVU accounts, although representing a smaller portion, increased their share to 10.1% (+1.2 p.p. y.o.y.). On the other hand, CVU’s operations to CBU decreased their share to 15.8%, with a drop of 9.7 percentage points compared to the same period of the previous year.
15 In year-on-year terms as of September, the number of transfers between CVUs increased 98.4% (78.5% in real amounts), while those between CBUs grew 111% (29.5% in real amounts). Operations between CBU and CVU registered an increase of 82.6% year-on-year (43.3% in real amounts), while those between CVU and CBU grew more moderately, 7.9% year-on-year (29.6% in real amounts).
16 In September, the average value of immediate transfers (TI) was $81,947.
17 In August, interoperable QR transactions averaged $13,500.
18 In September, the average amount of cleared checks was $2.6 million ($1.3 million in physical format and $4 million in ECHEQs).
Share on


