I. Financial intermediation activity
In October, banks continued to deepen their role as financial intermediaries with the private sector. Considering the main variations of the items in local currency -in homogeneous currency- of the financial system’s aggregate balance sheet, the most relevant sources of funds during the month were the increase in shareholders’ equity -derived mainly from the positive results obtained (see Section IV)- and the decrease in peso-denominated liquid assets. As for the main applications of resources in local currency, the real balance of private sector deposits decreased during the period and the real balance of credit to the private sector increased. Regarding the foreign currency segment, the most significant movements in October were the increase in private sector deposits, the decrease in financing (both to the private and public sectors) and the increase in liquid assets.
The real balance of financing to the private sector in pesos increased 0.9% in October (see Chart 1; 38.7% y.o.y.). The monthly performance was boosted by secured credit lines (2.6%) and, to a lesser extent, by commercial loans (0.4%).
Graph 1: Real credit balance to the private sector in pesos*
Monthly % changes
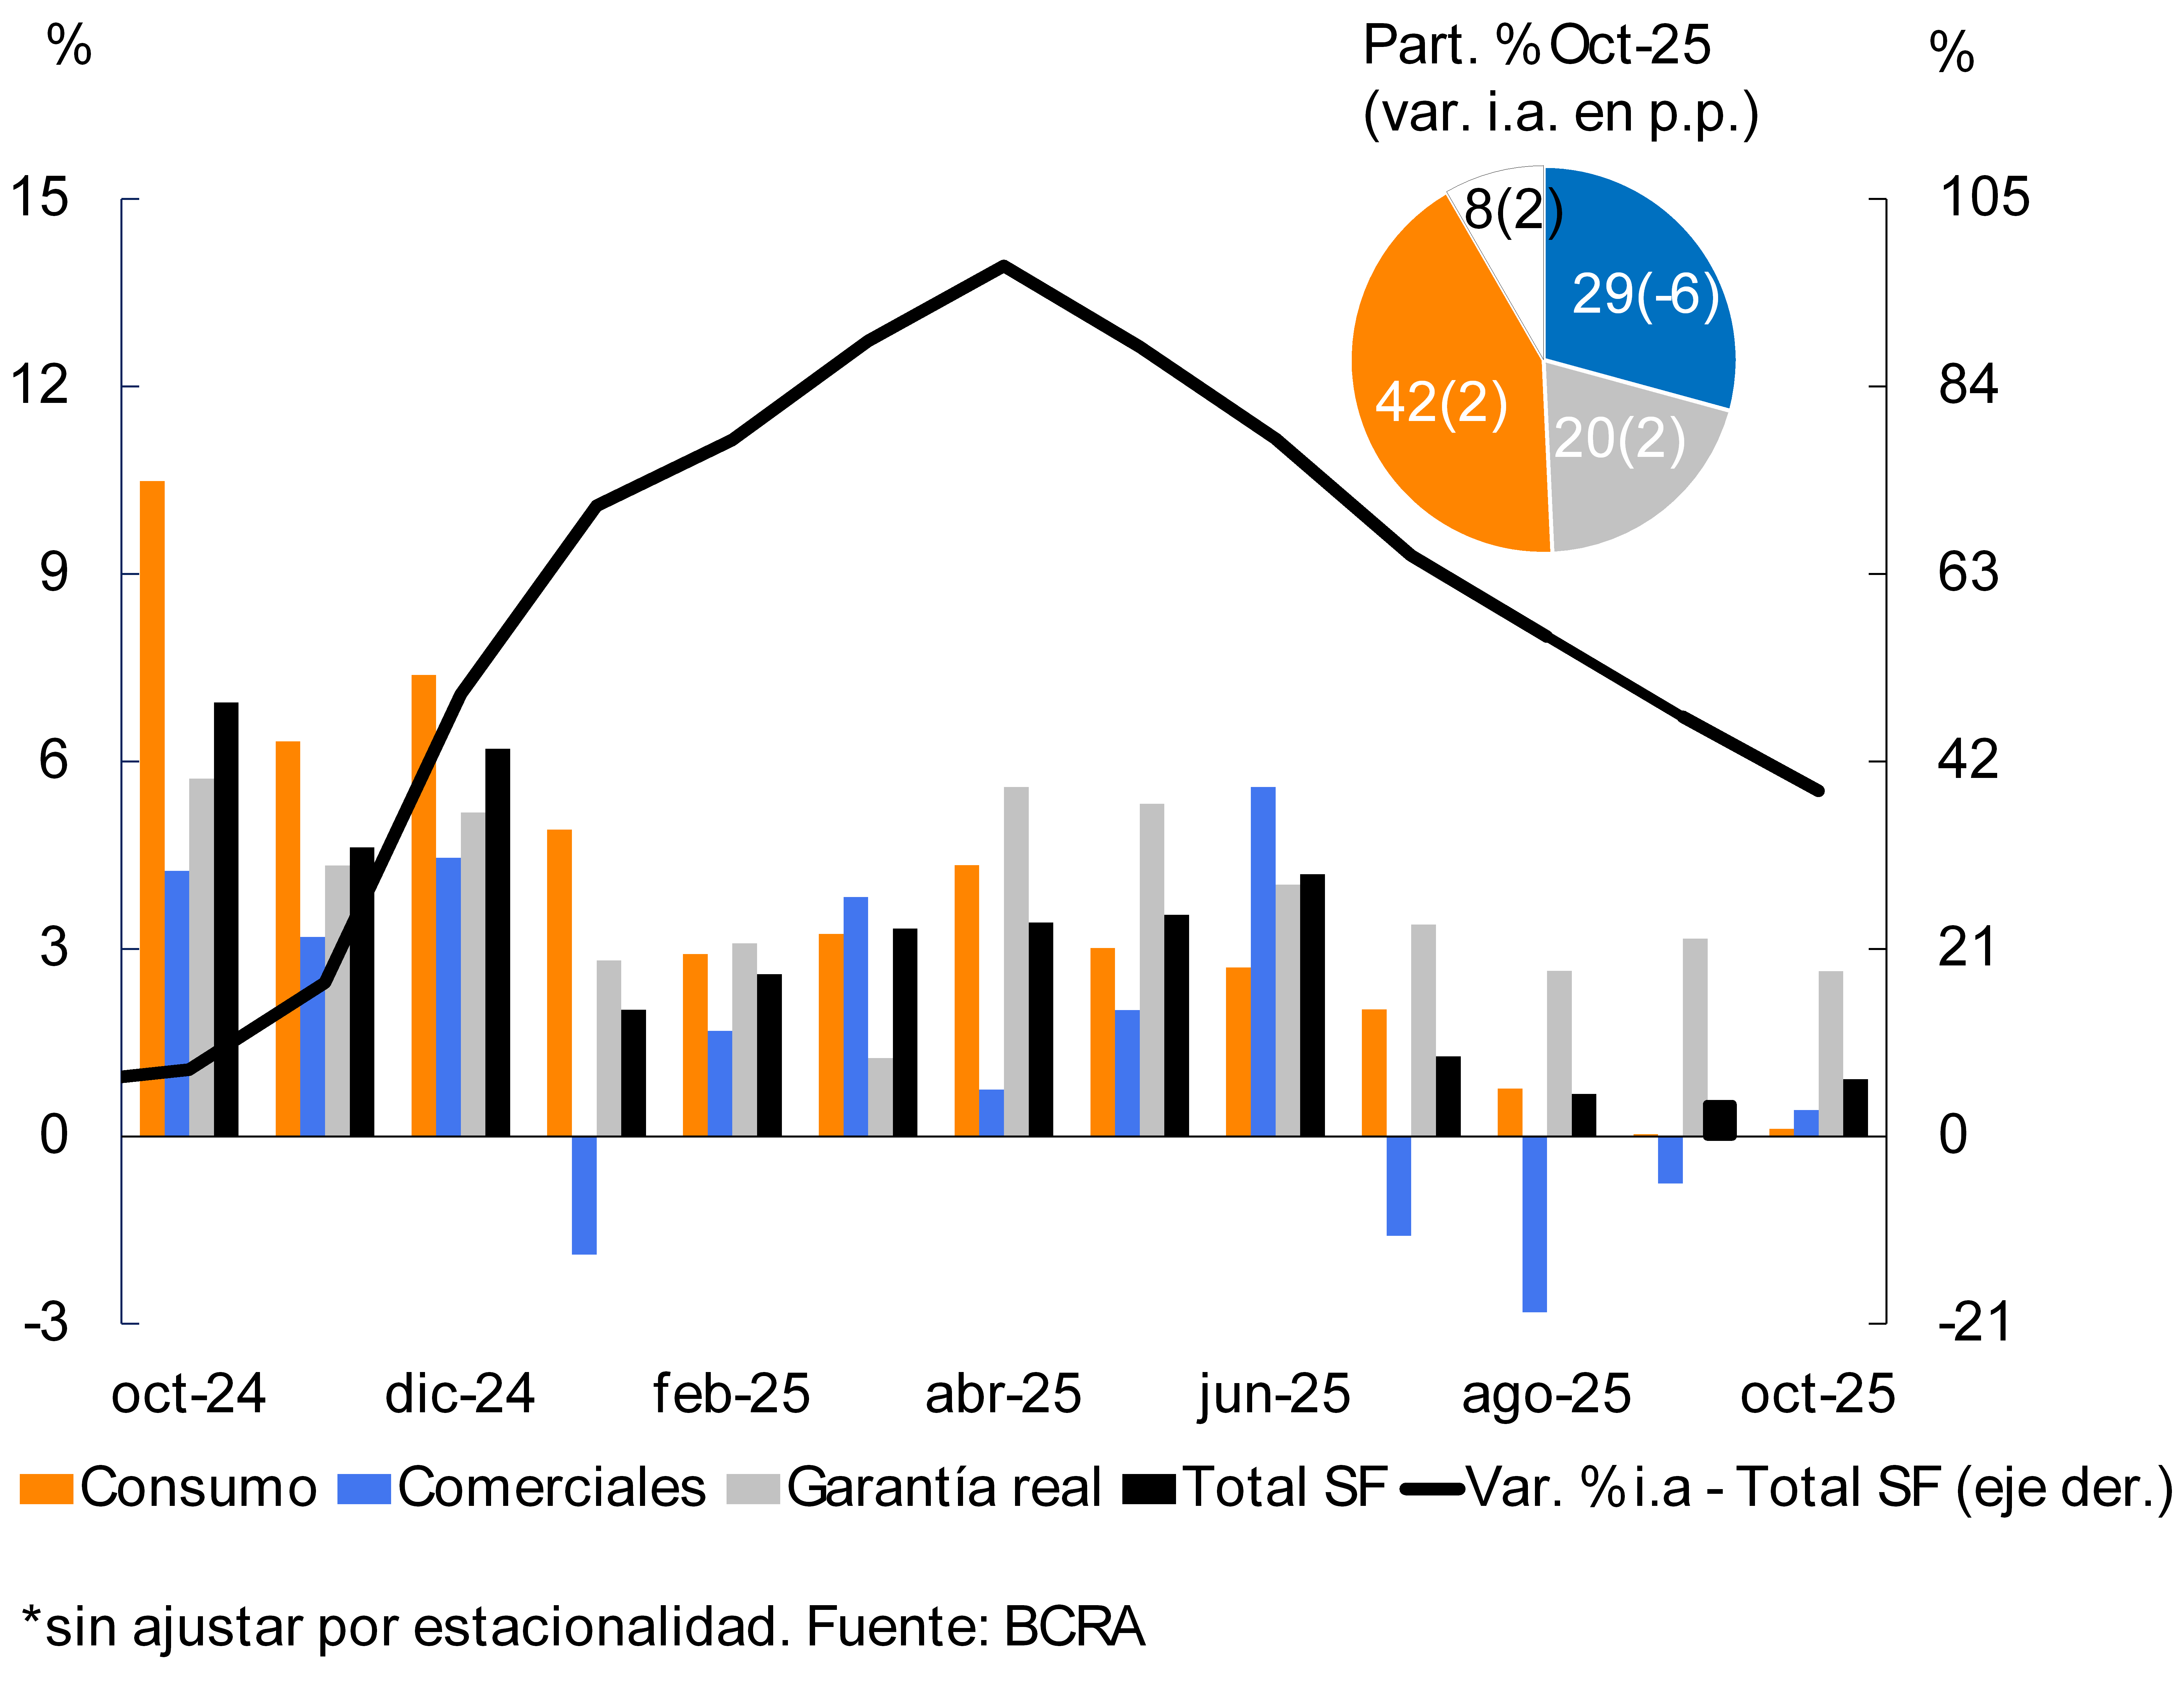
Chart 2 : Foreign currency financial intermediation to the private sector
In the foreign currency segment, the balance of credit to the private sector decreased by 3.7% in October -in original currency- (see Chart 2; 113.1% y.o.y.), mainly due to the dynamics of export pre-financing.
At a systemic level, the real balance of total credit (in local and foreign currency) to the private sector grew 0.6% month-on-month (52.8% y.o.y. real), with increases in both corporate and household loans. In particular, in the household segment, the monthly dynamism of mortgages (4% real) and, to a lesser extent, of pledges (1.7% real) stood out. The performance of credit to companies was mainly explained by industry and services (they accounted for almost 60% of the increase in the month, with real increases in financing balances of 1.5% and 1.2%, respectively).
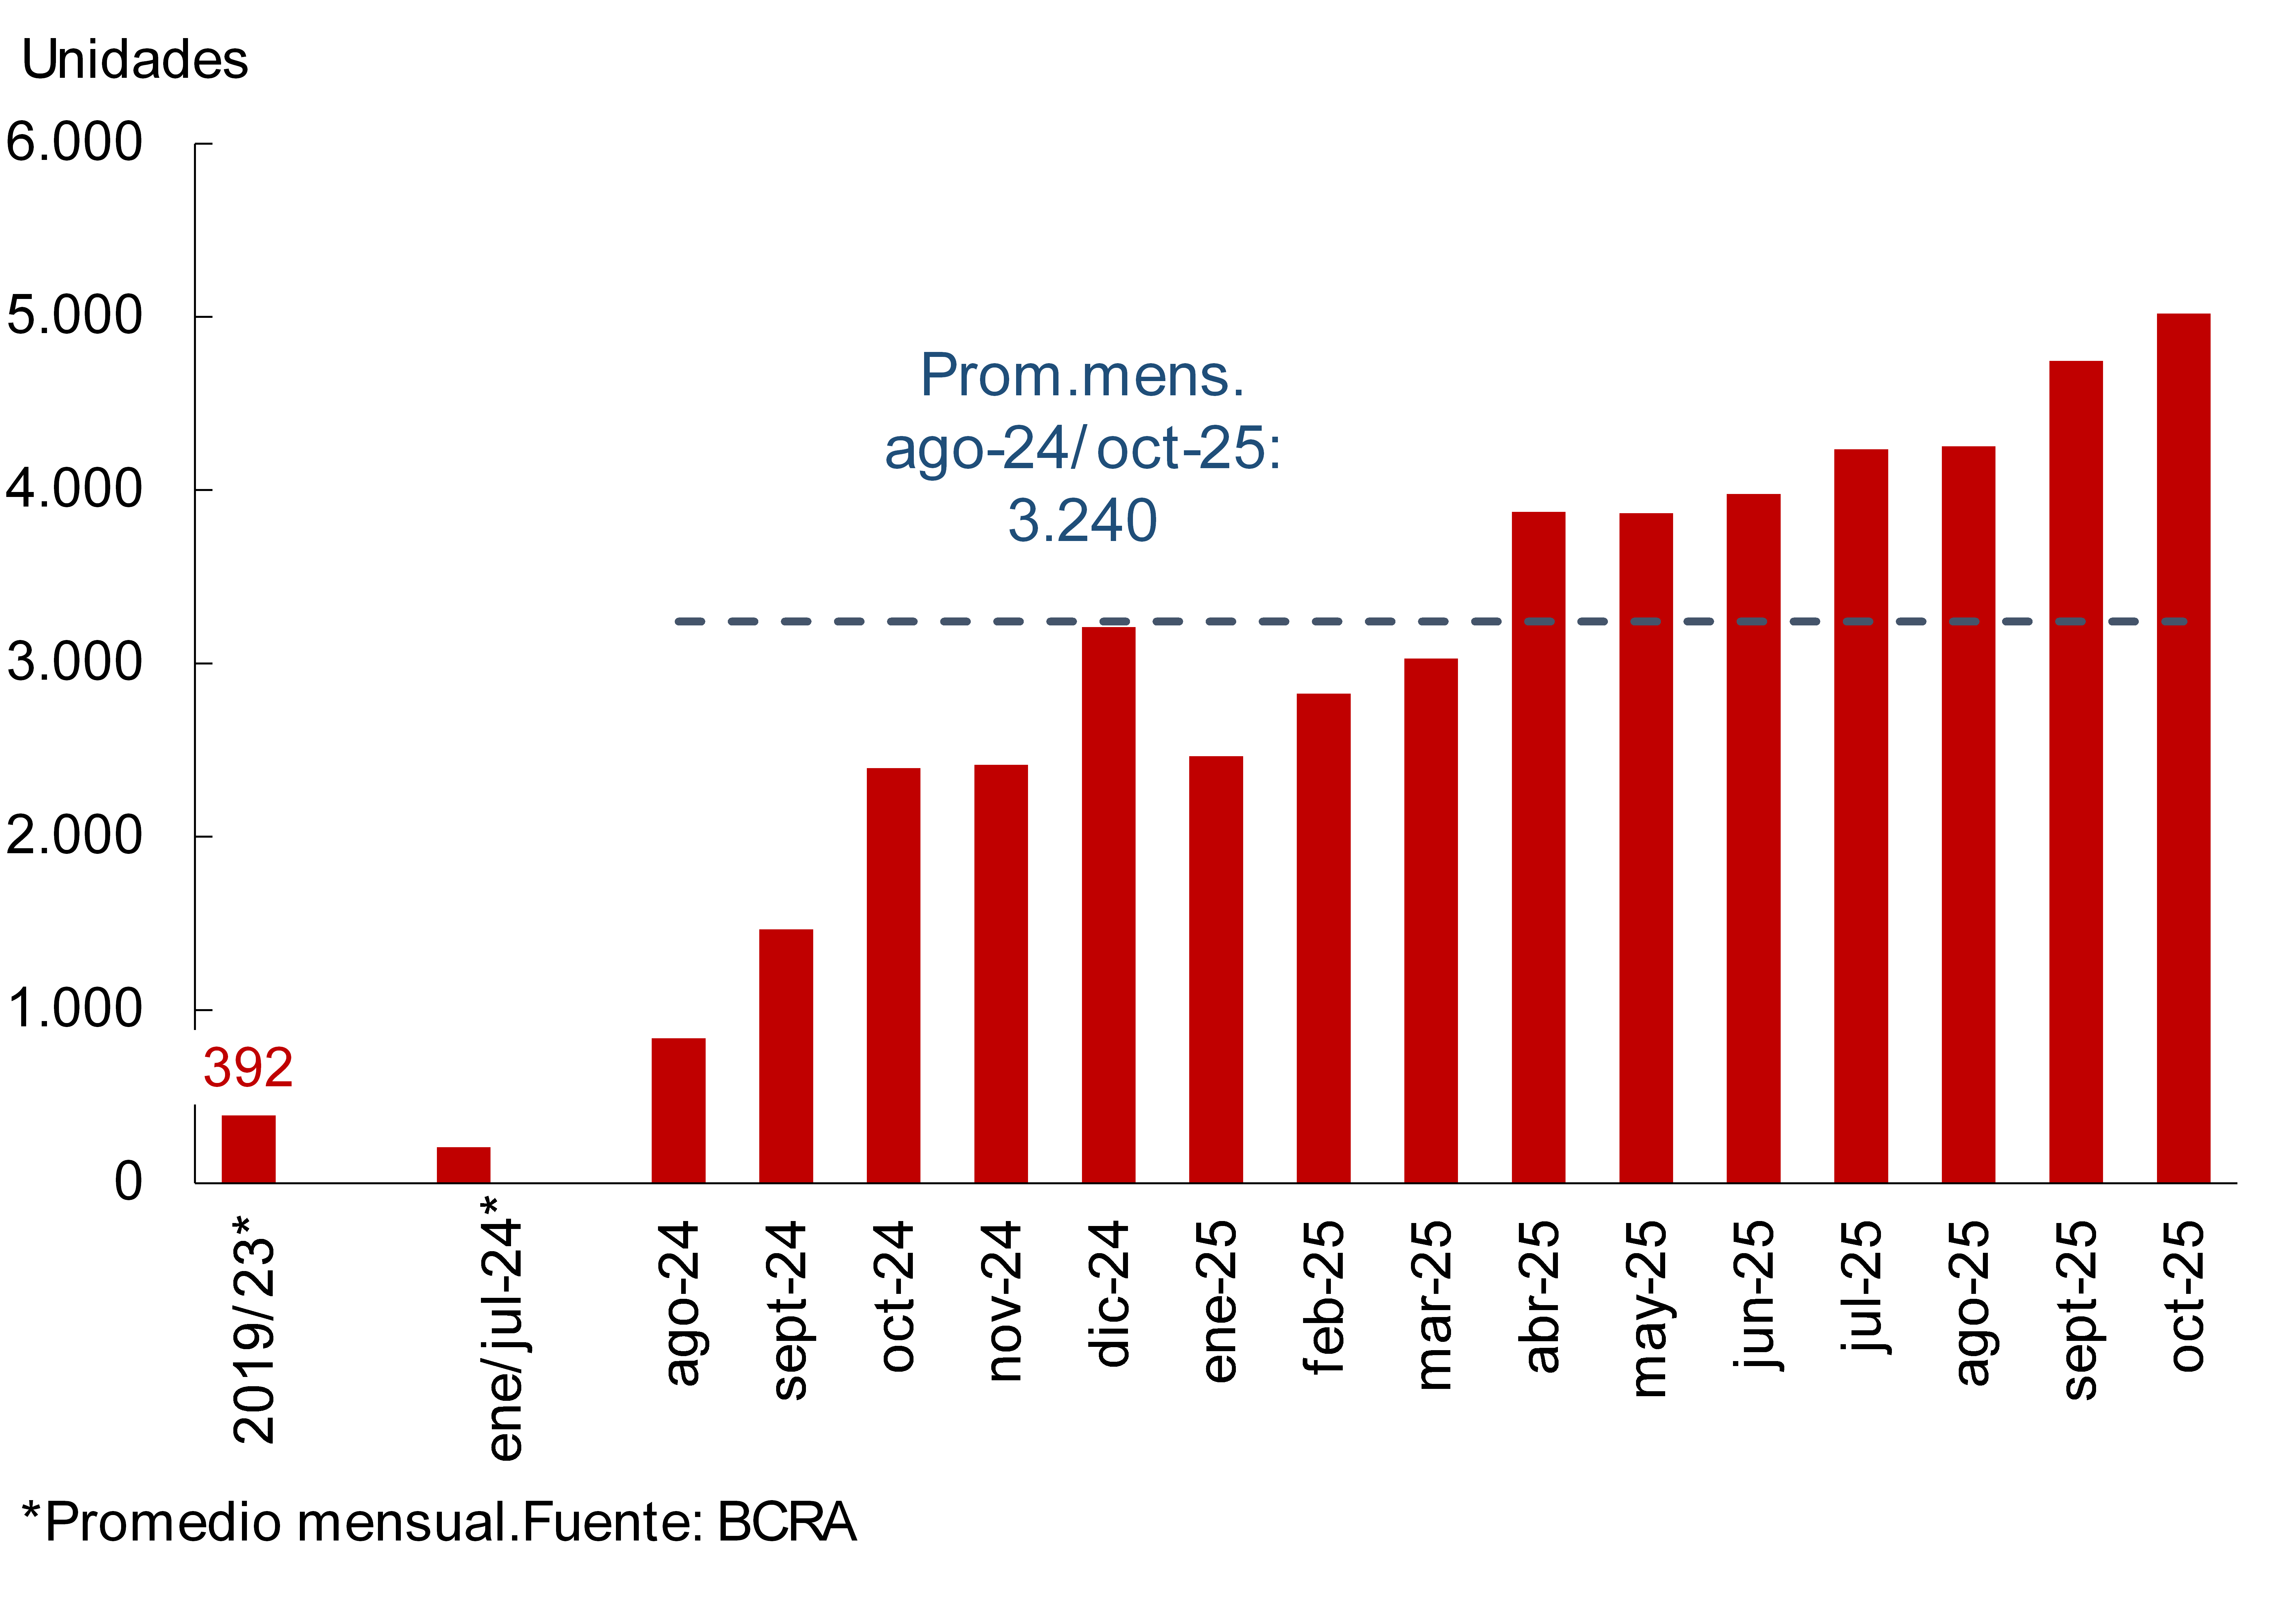
Graph 3 : Estimated mortgage registrations (human persons) –
Financial System
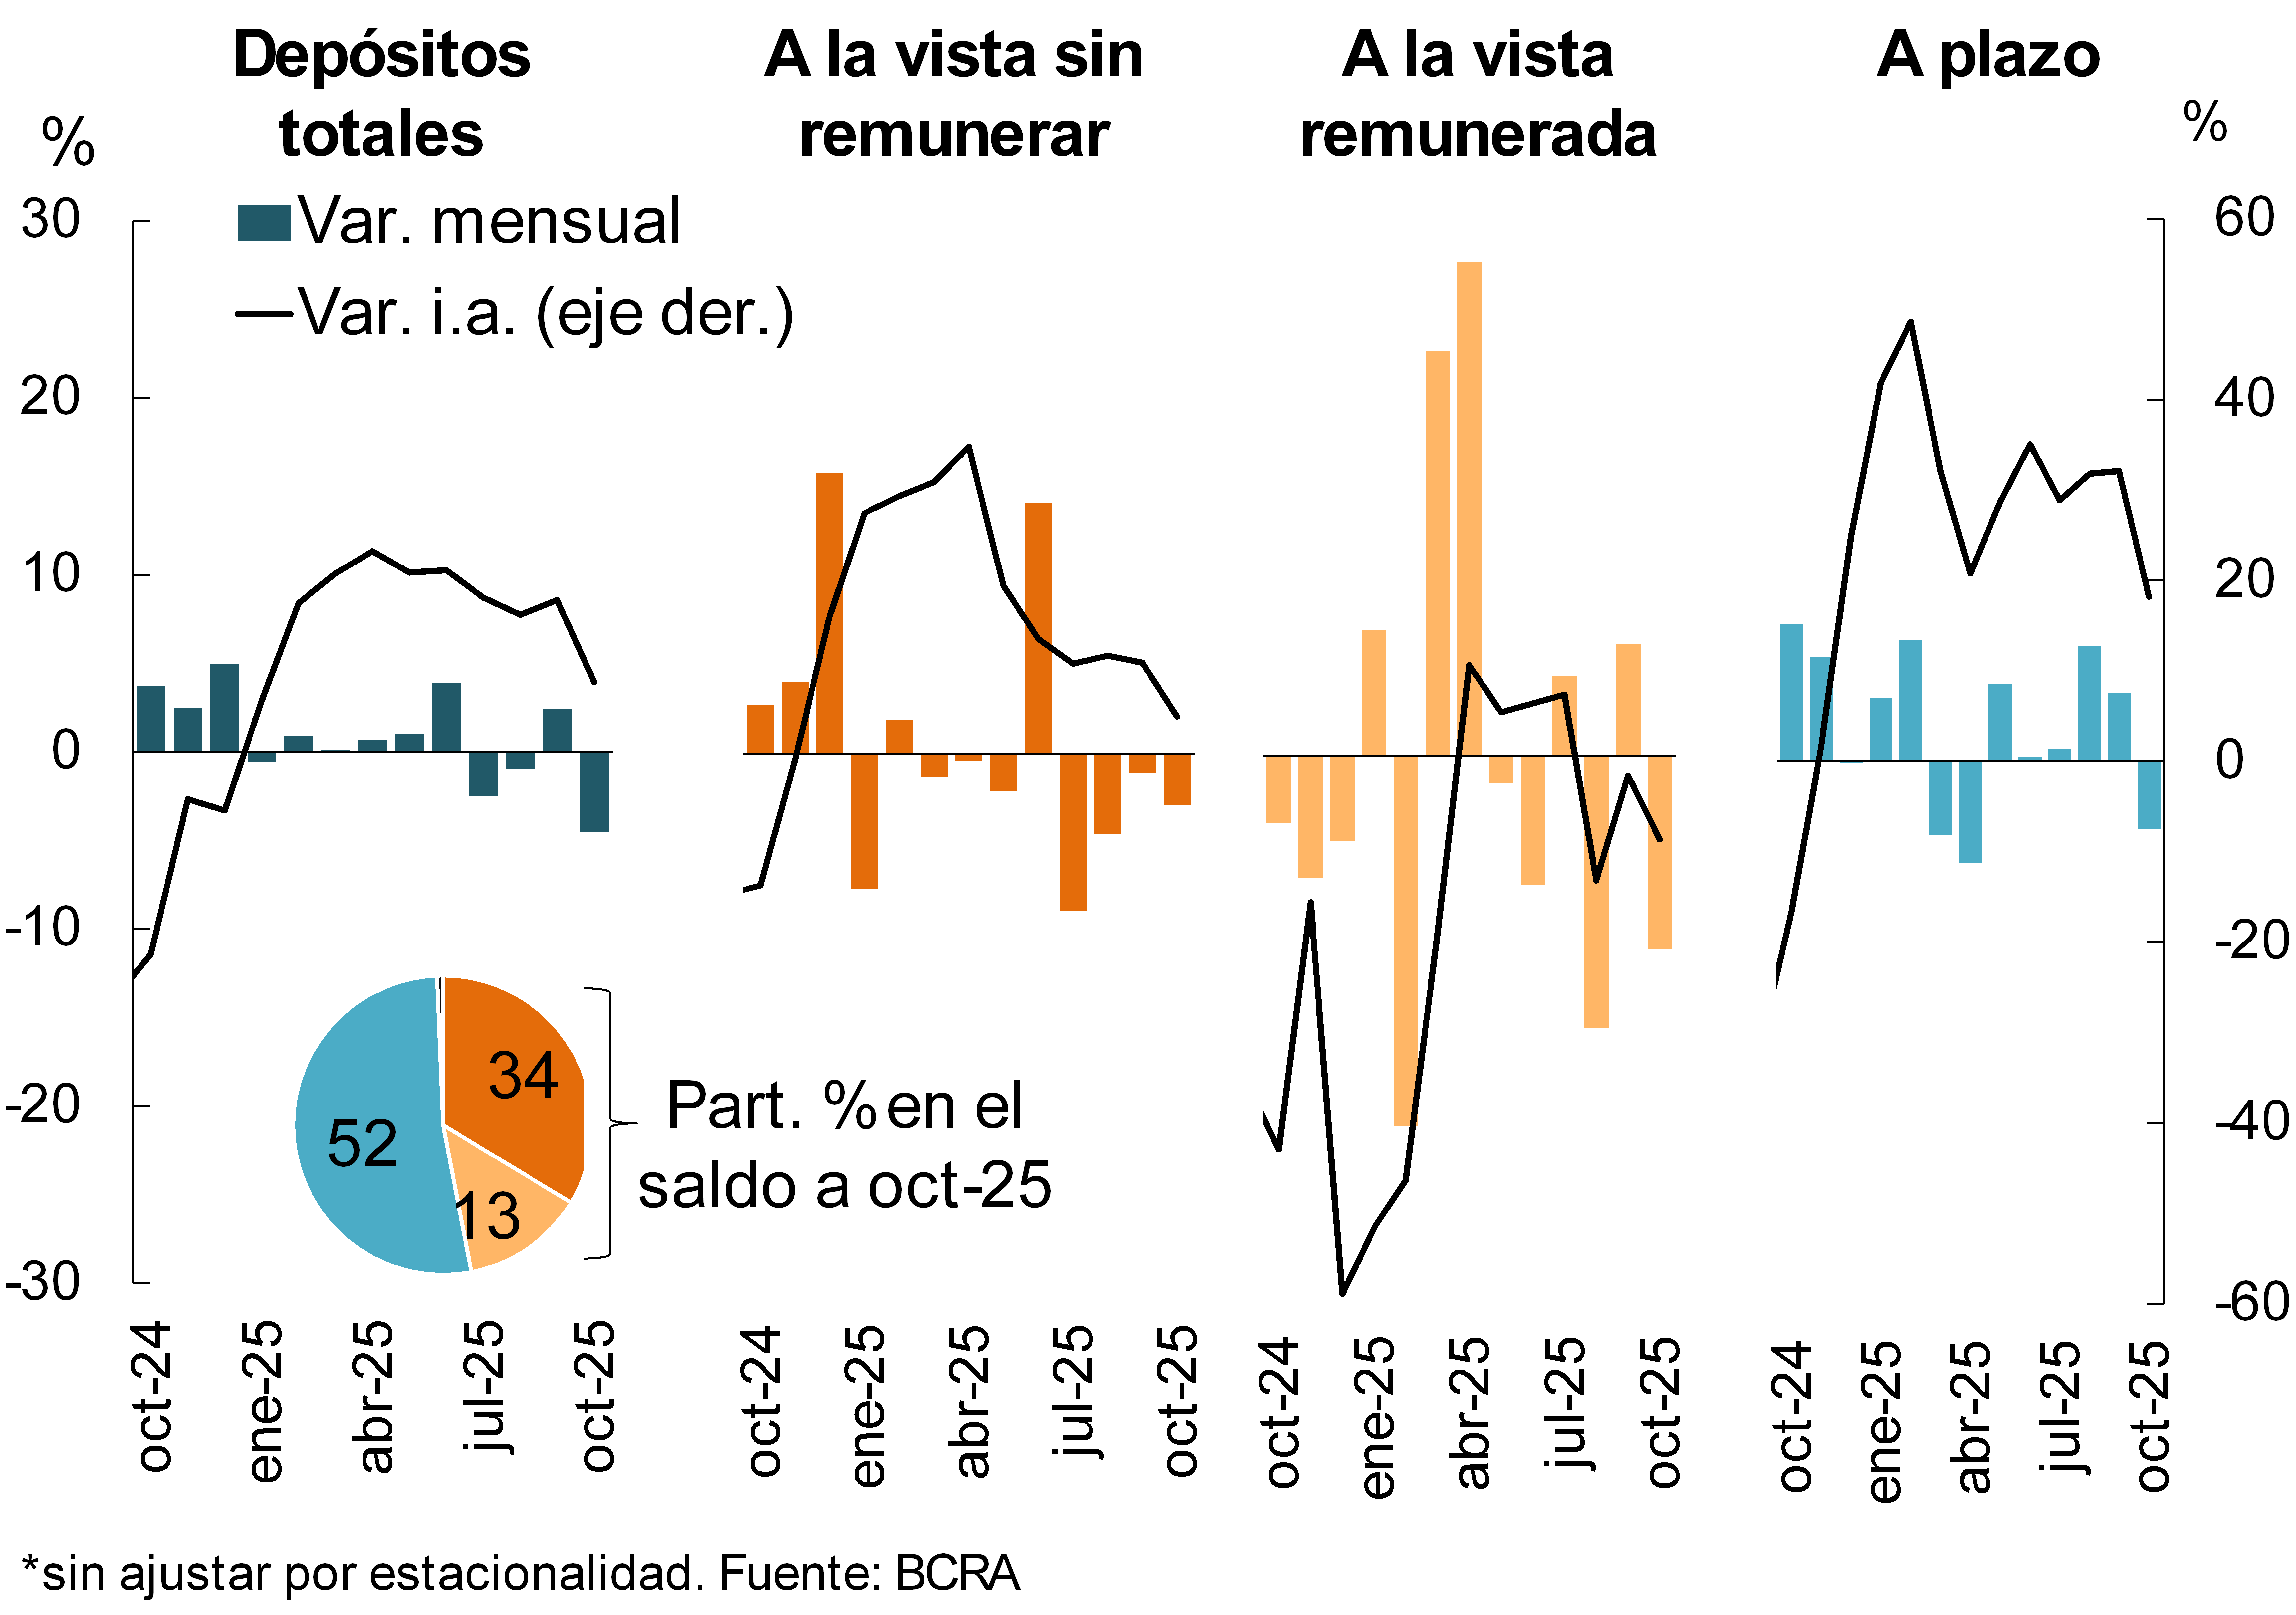
Graph 4: Real balance of private sector deposits in pesos*.
It is estimated that in October the financial system added 5,019 new mortgage loan borrowers (individuals), 5.8% above the previous month’s level (see Graph 3). Thus, it is estimated that in the last twelve months the total number of new mortgage borrowers rose to 43,900.
With respect to the funding of financial institutions as a whole, the real balance of private sector deposits in local currency decreased 4.5% in October (accumulating an increase of 7.8% y.o.y. real; see Chart 4). The monthly dynamics were reflected both in demand accounts (-5.2% real monthly, with decreases in the interest-bearing and non-interest-bearing segments) and in time deposits (-3.7% real monthly).
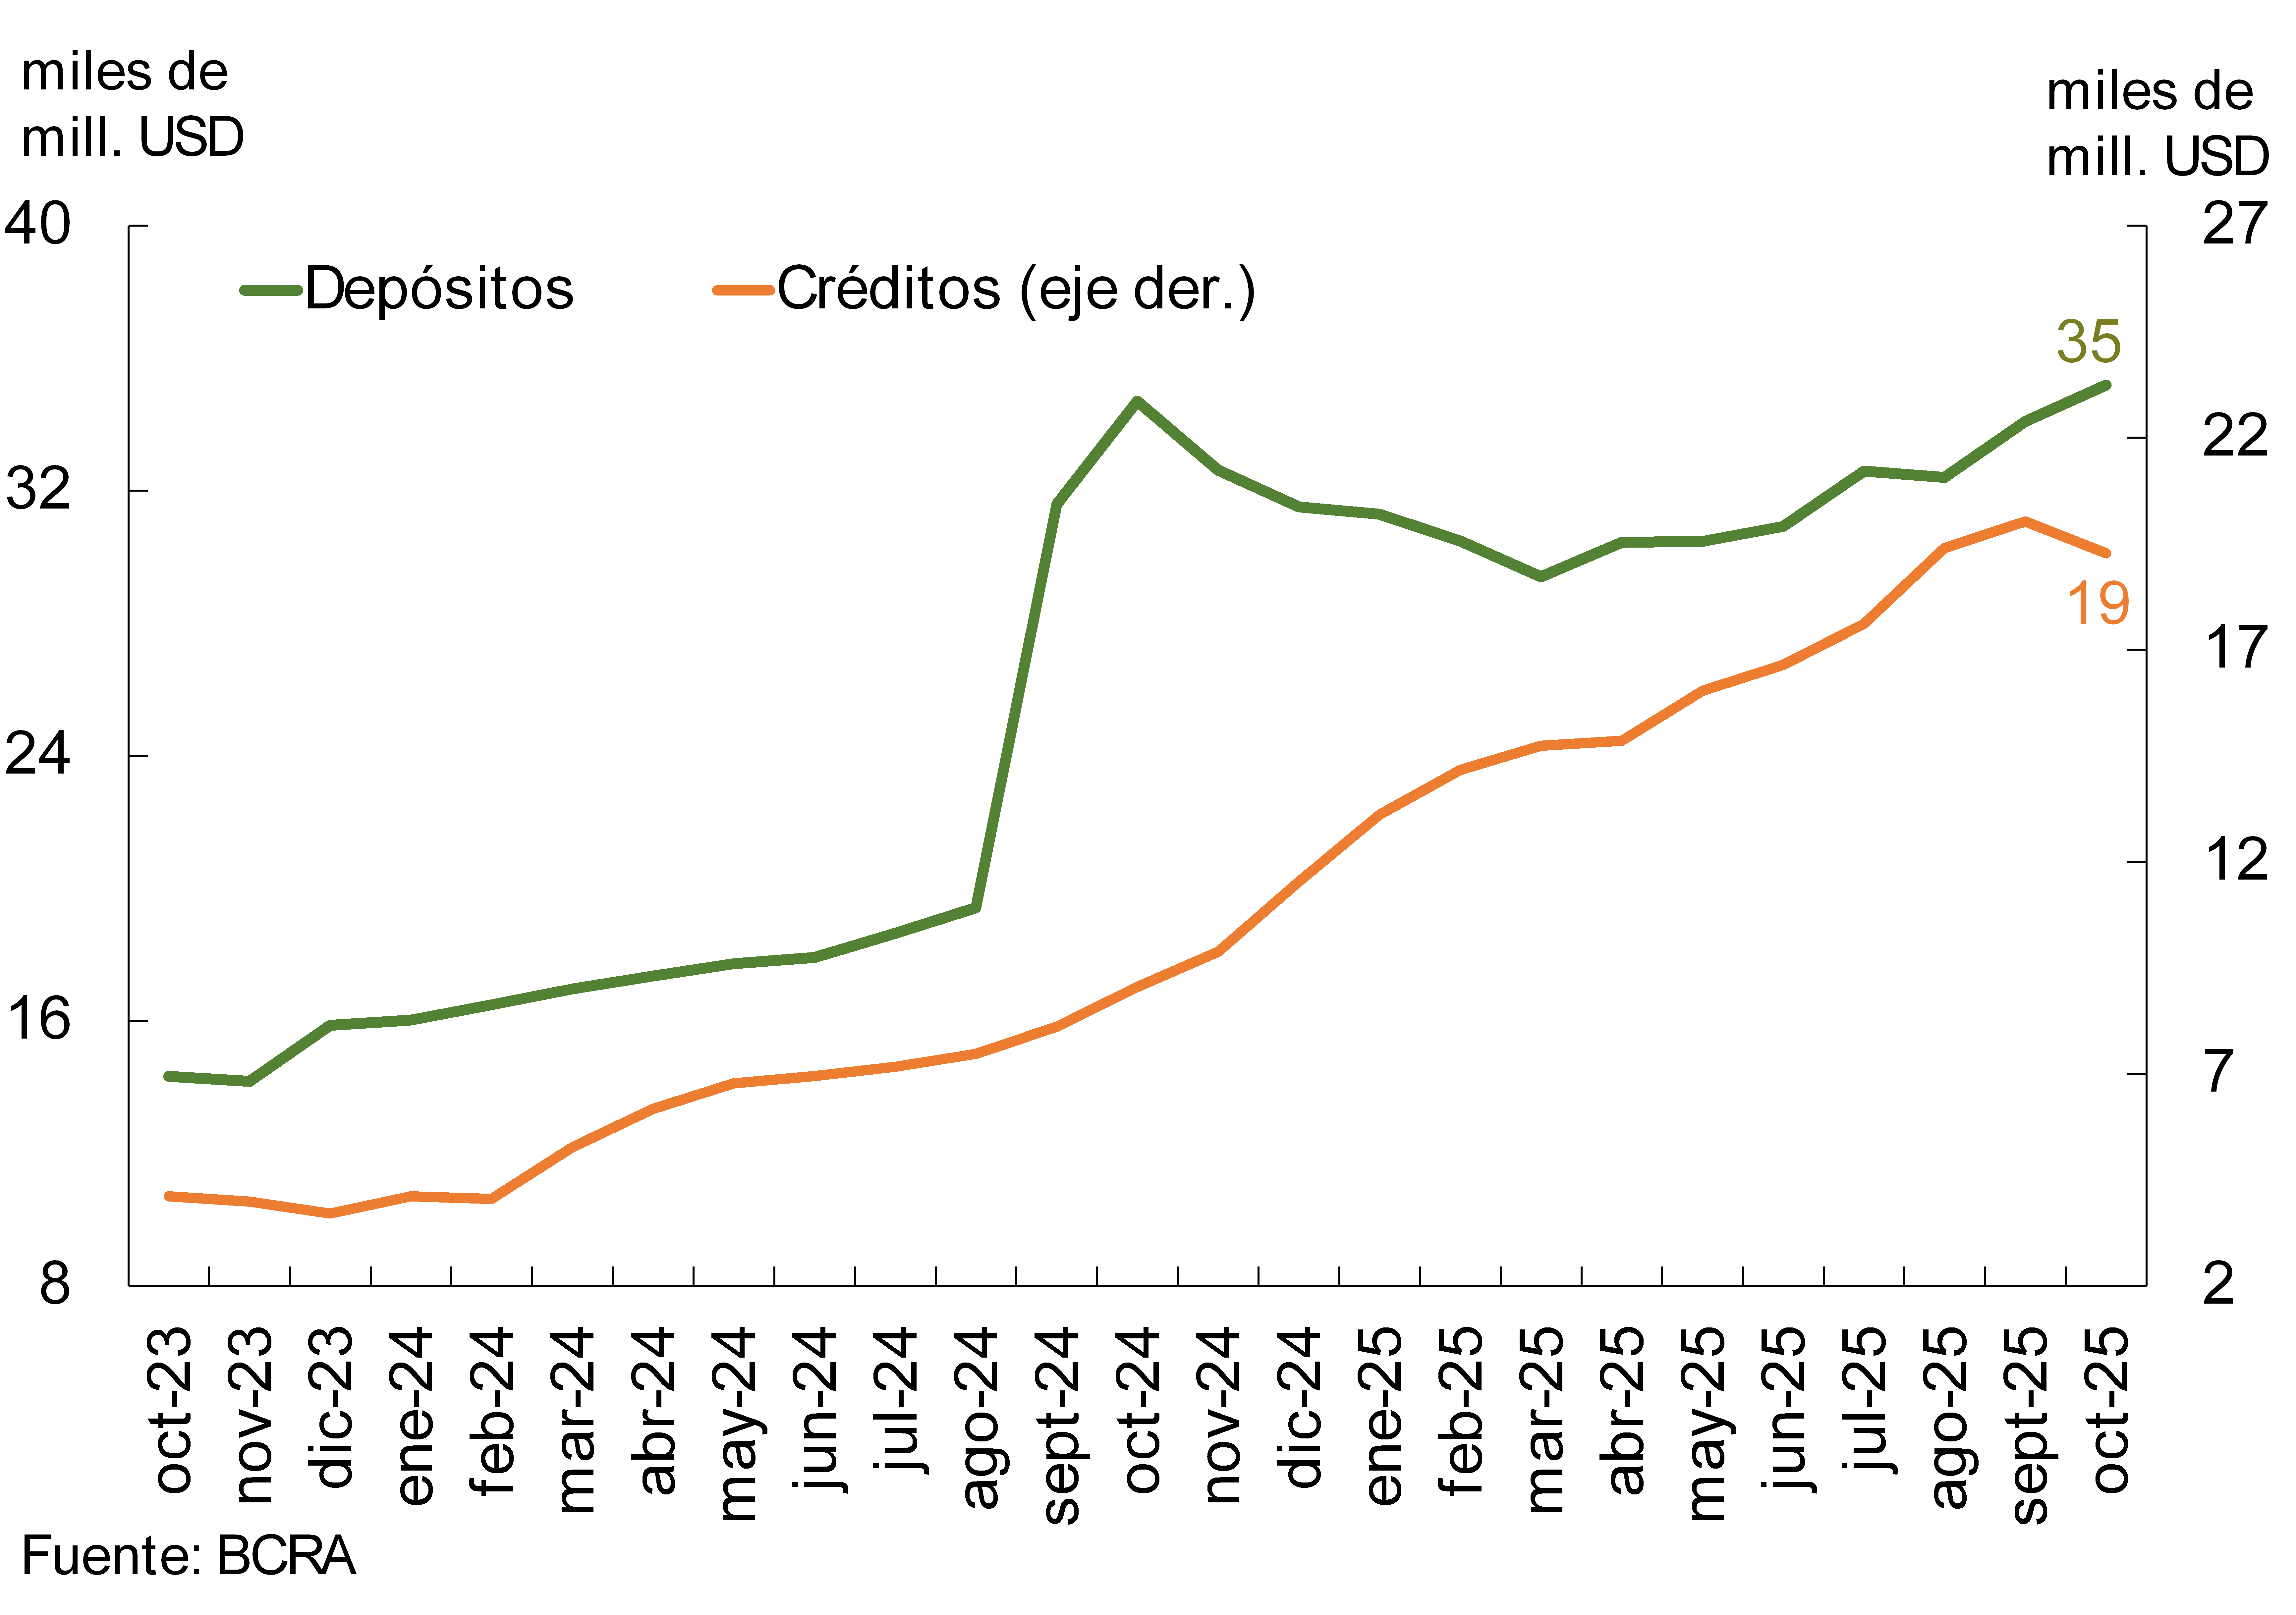
The balance of private sector deposits in foreign currency increased 3.2% in October -in local currency- (1.4% y.o.y.; see Chart 2). Considering all sectors and currencies, the real balance of deposits decreased 1.1% month-on-month (8.9% y.o.y. increase).
II. Evolution and aggregate composition of the balance sheet
In October, total assets of the financial system – measured in real terms – were at similar levels to those observed in September. In the last 12 months, the assets of the financial institutions as a whole accumulated an increase of 10.3% at constant prices, showing an expansive dynamic in all groups of institutions.
Chart 5 – Composition of assets and funding
Financial system – In % share
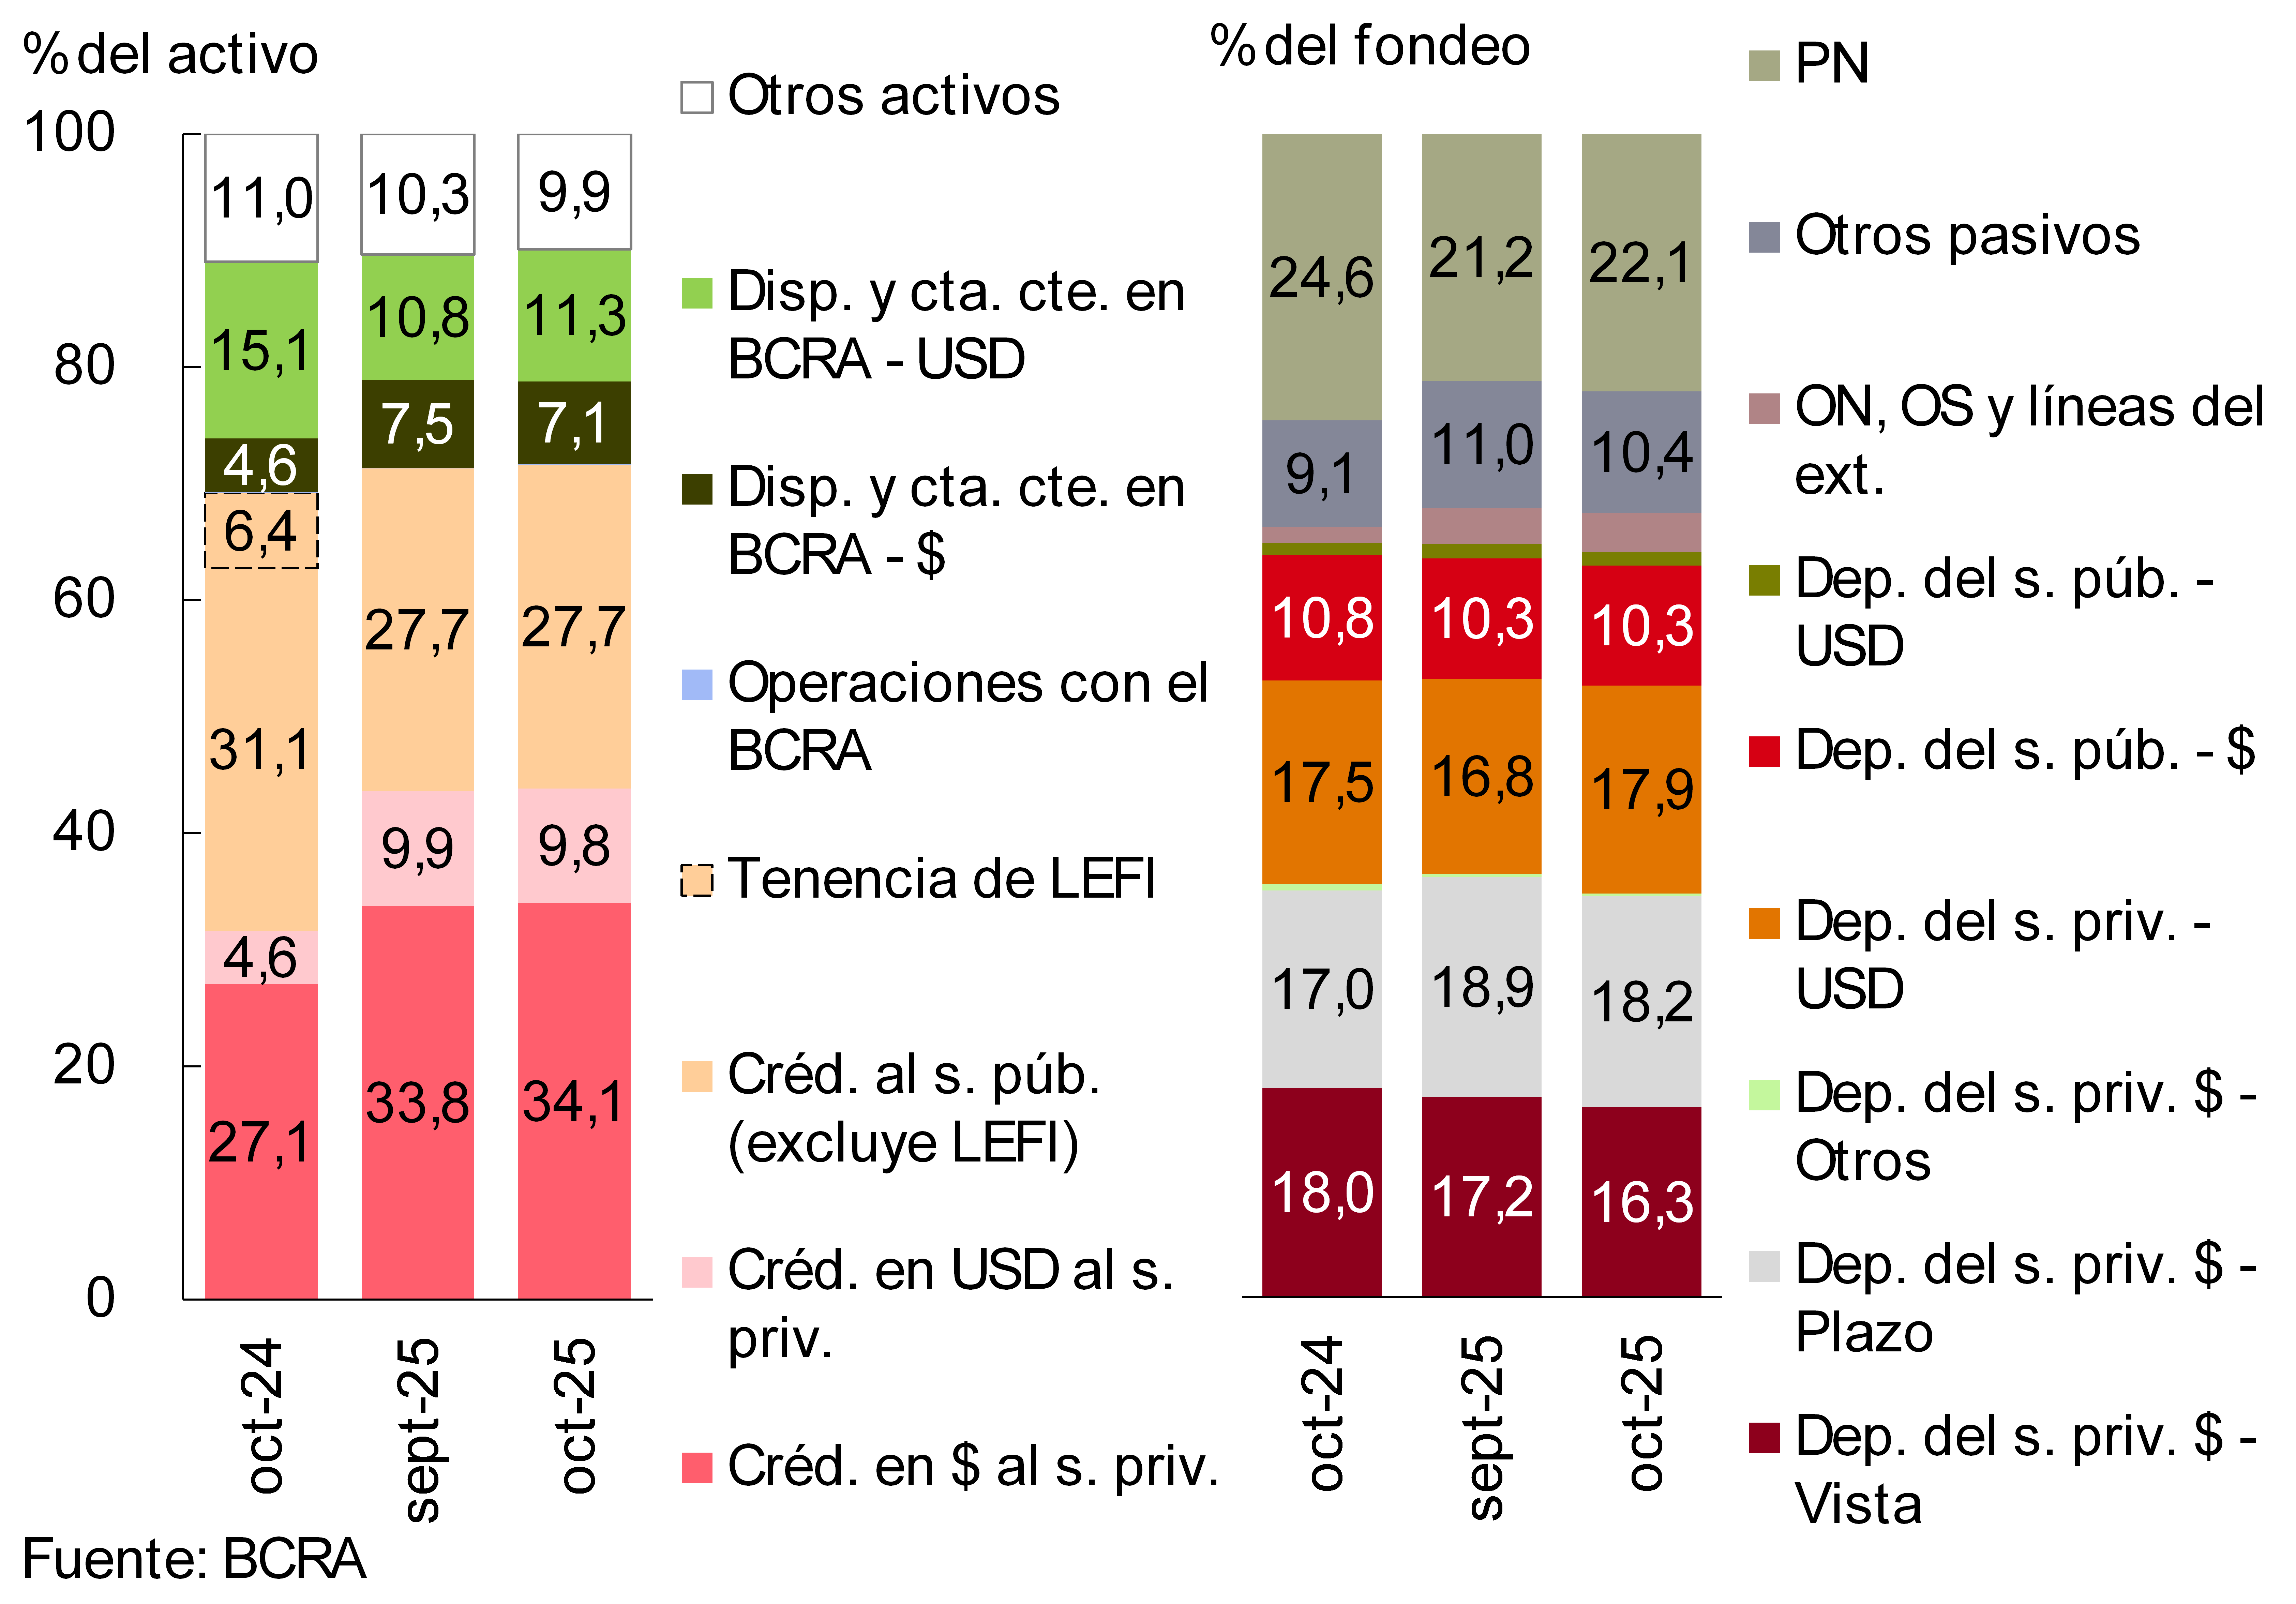
Considering the composition of the financial system’s assets, limited changes were observed in October: peso-denominated credit to the private sector and foreign currency current accounts held at the BCRA increased their weight in the total (see Chart 5), while current accounts denominated in local currency decreased their relative weight. On the aggregate funding side, between month-ends, the relevance of equity and private sector deposits in foreign currency increased (see Chart 5), while private sector deposits in domestic currency, both demand and time deposits, reduced their importance in the total.
Graph 6: Spread between assets and liabilities
As % of PRC – Financial System
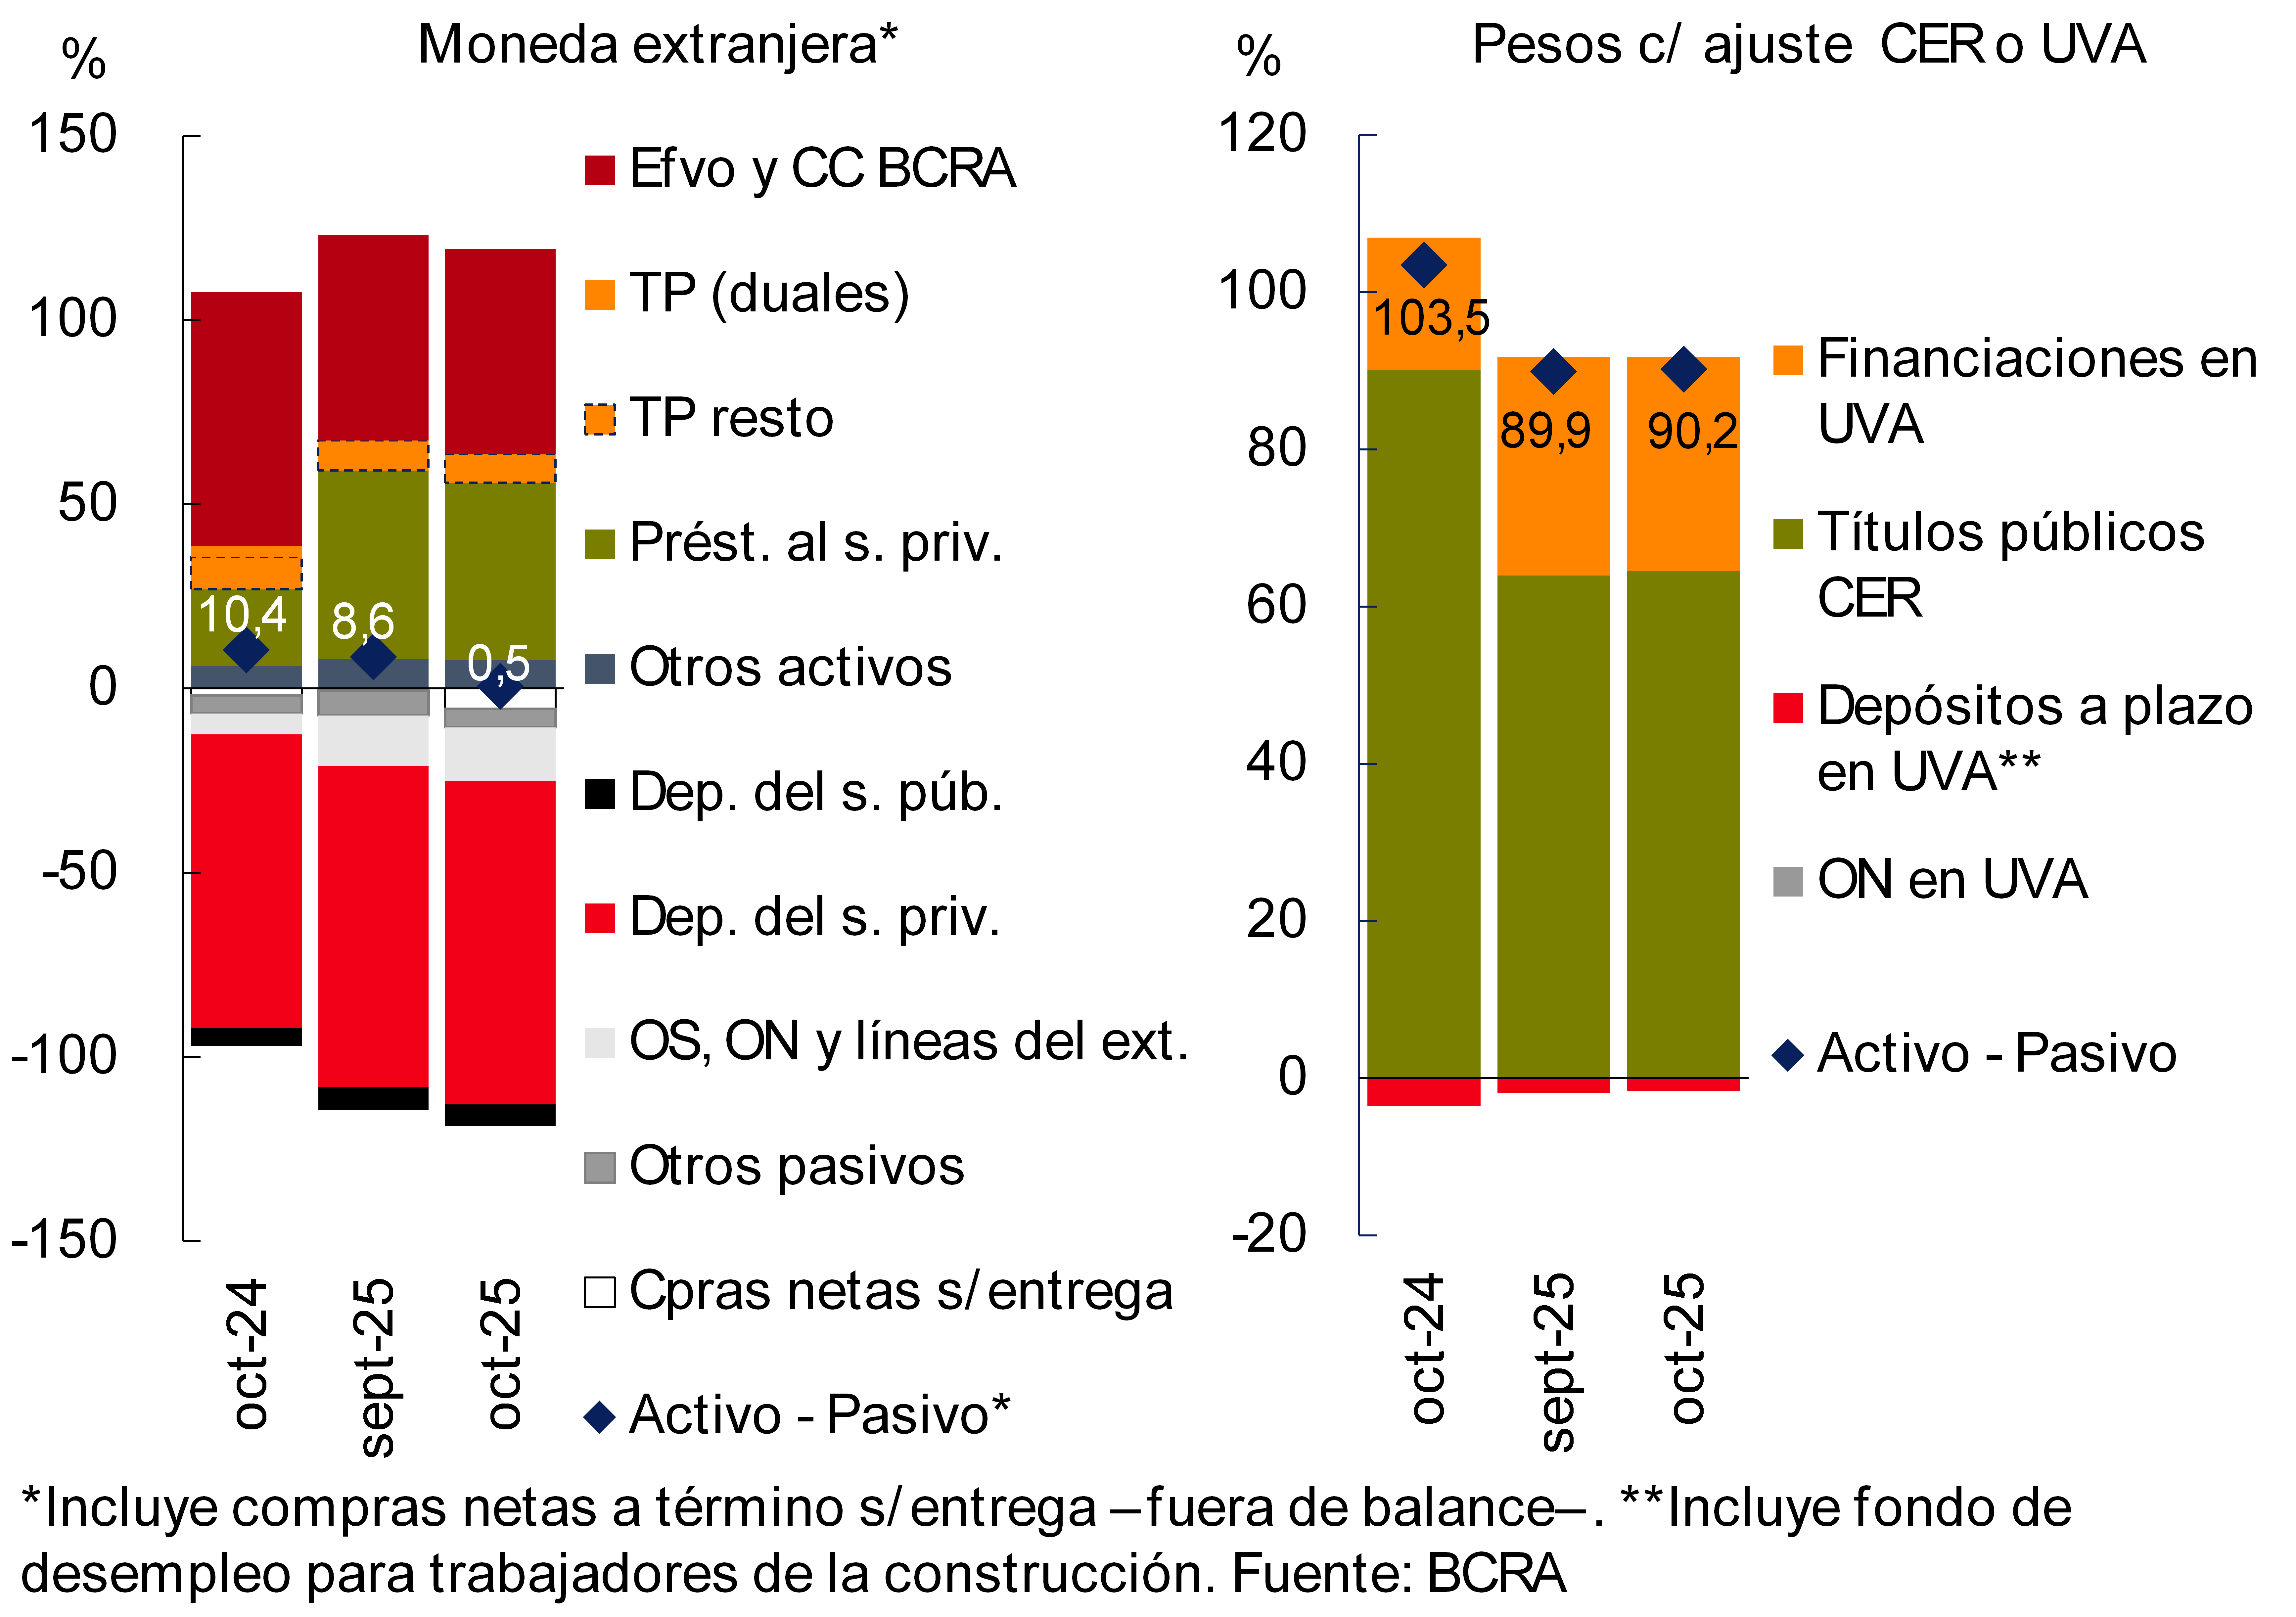
The estimated spread between assets and liabilities in foreign currency -including off-balance sheet forward purchases and sales of foreign currency without delivery of the underlying currency- decreased 8 p.p. of the regulatory capital -RPC- in October, to 0.5% (-9.9 p.p. y.o.y., see Chart 6). This decrease resulted from the increase in net sales of off-balance sheet forward foreign currency and, to a lesser extent, from the reduction of assets in this denomination (mainly associated to the monthly performance of credit to the private sector). As for the CER-adjustable or UVA-denominated items segment, the aggregate spread between assets and liabilities did not show relevant variations during the month, remaining at around 90% of the financial system’s PCE (-13.3 p.p. y.o.y., see Chart 6).
III. Portfolio quality
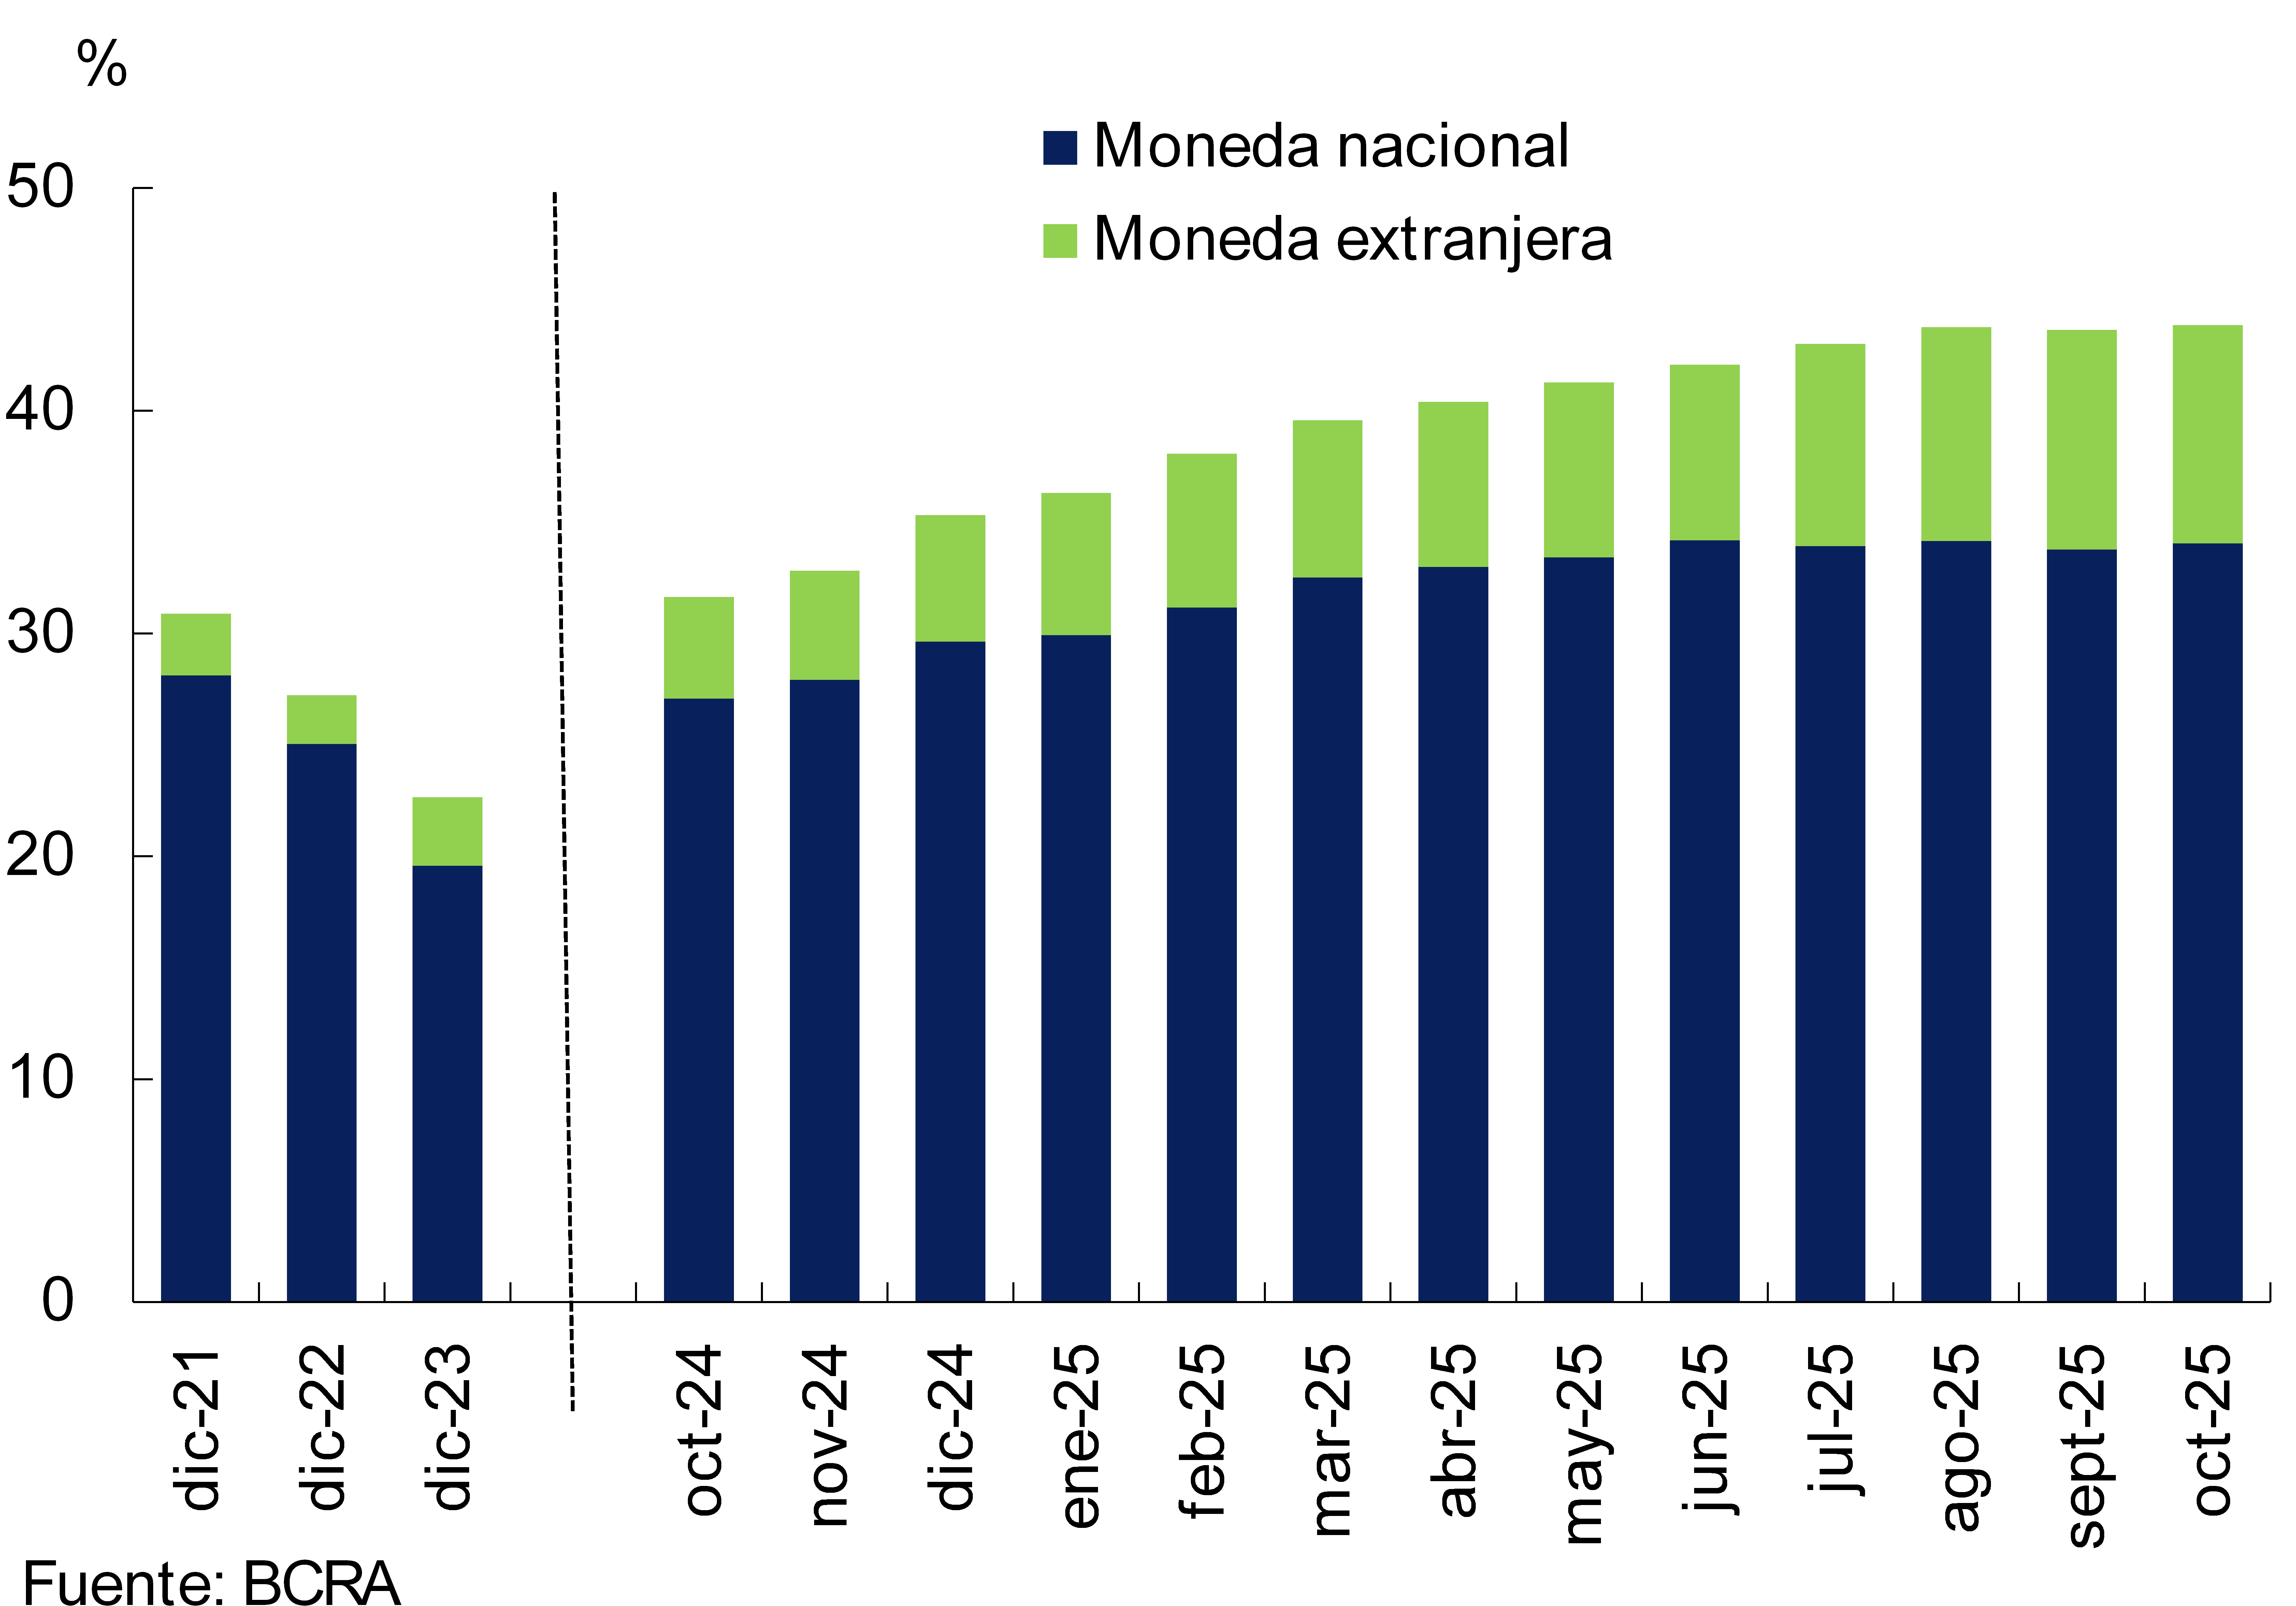
The financial system’s gross exposure -in local and foreign currency- to the private sector increased slightly during the month, reaching 43.8% of assets (see Chart 7). Considering only the domestic currency segment, this indicator stood at 34.1%, while the ratio of foreign currency loans to total assets totaled 9.8%. In the last 12 months, total credit to the private sector accumulated an increase of 12.2 percentage points of assets (7 percentage points for peso-denominated items and 5.2 percentage points for the foreign currency segment). When broken down by type of debtor, in October, loans to companies represented 24% of the financial system’s total assets, while credit to households was equivalent to 19.9% of assets.
Graph 7: Credit balance to the private sector in terms of assets
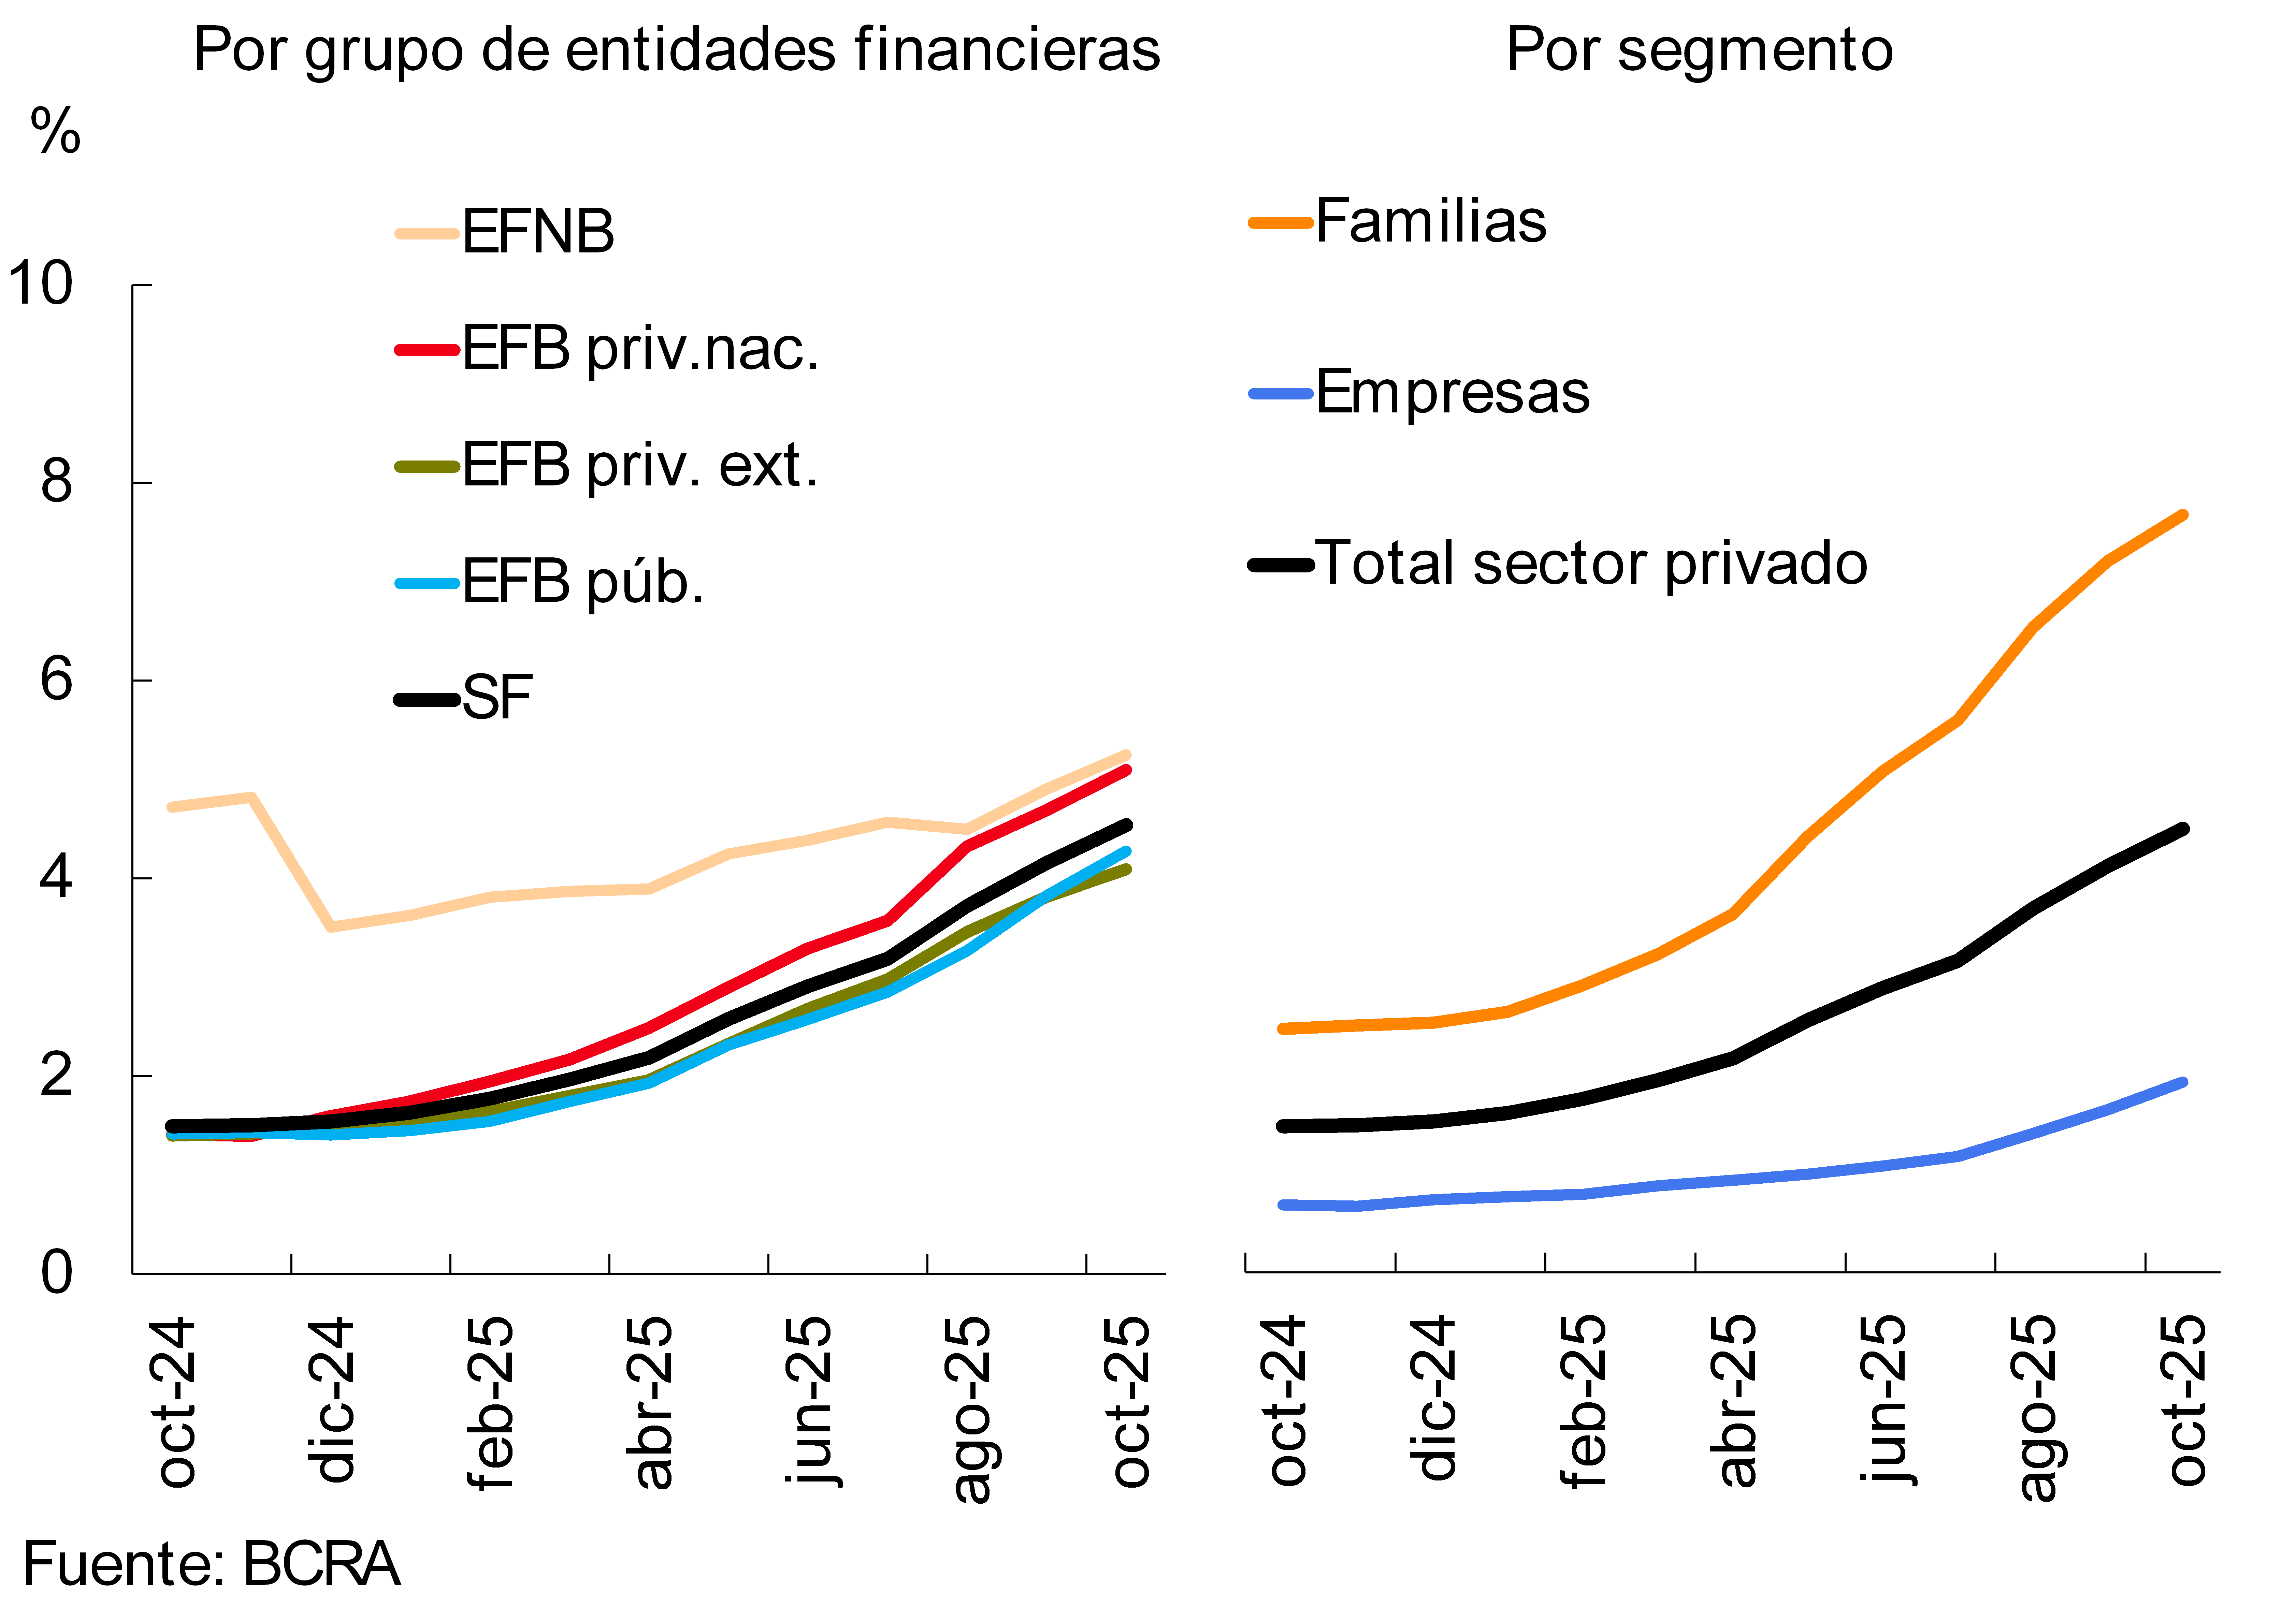
In October, the irregularity of credit to the private sector increased 0.4 p.p. of the total private sector portfolio to 4.5% at a systemic level. The monthly dynamics of the indicator was generalized among the different groups of financial institutions (see Graph 8). During the period, the delinquency ratio reached 7.8% for loans to households, while it stood at 1.9% for financing to companies.
Chart 8: Private sector credit irregularity ratio
In October, the total loan loss provisioning balance of the financial system represented 101% of the portfolio in irregular situation (-1 p.p. compared to September). In relation to the total private sector loan portfolio, total loan loss provisioning stood at 4.6% (0.3 p.p. higher than in the previous month).
IV. Liquidity and solvency
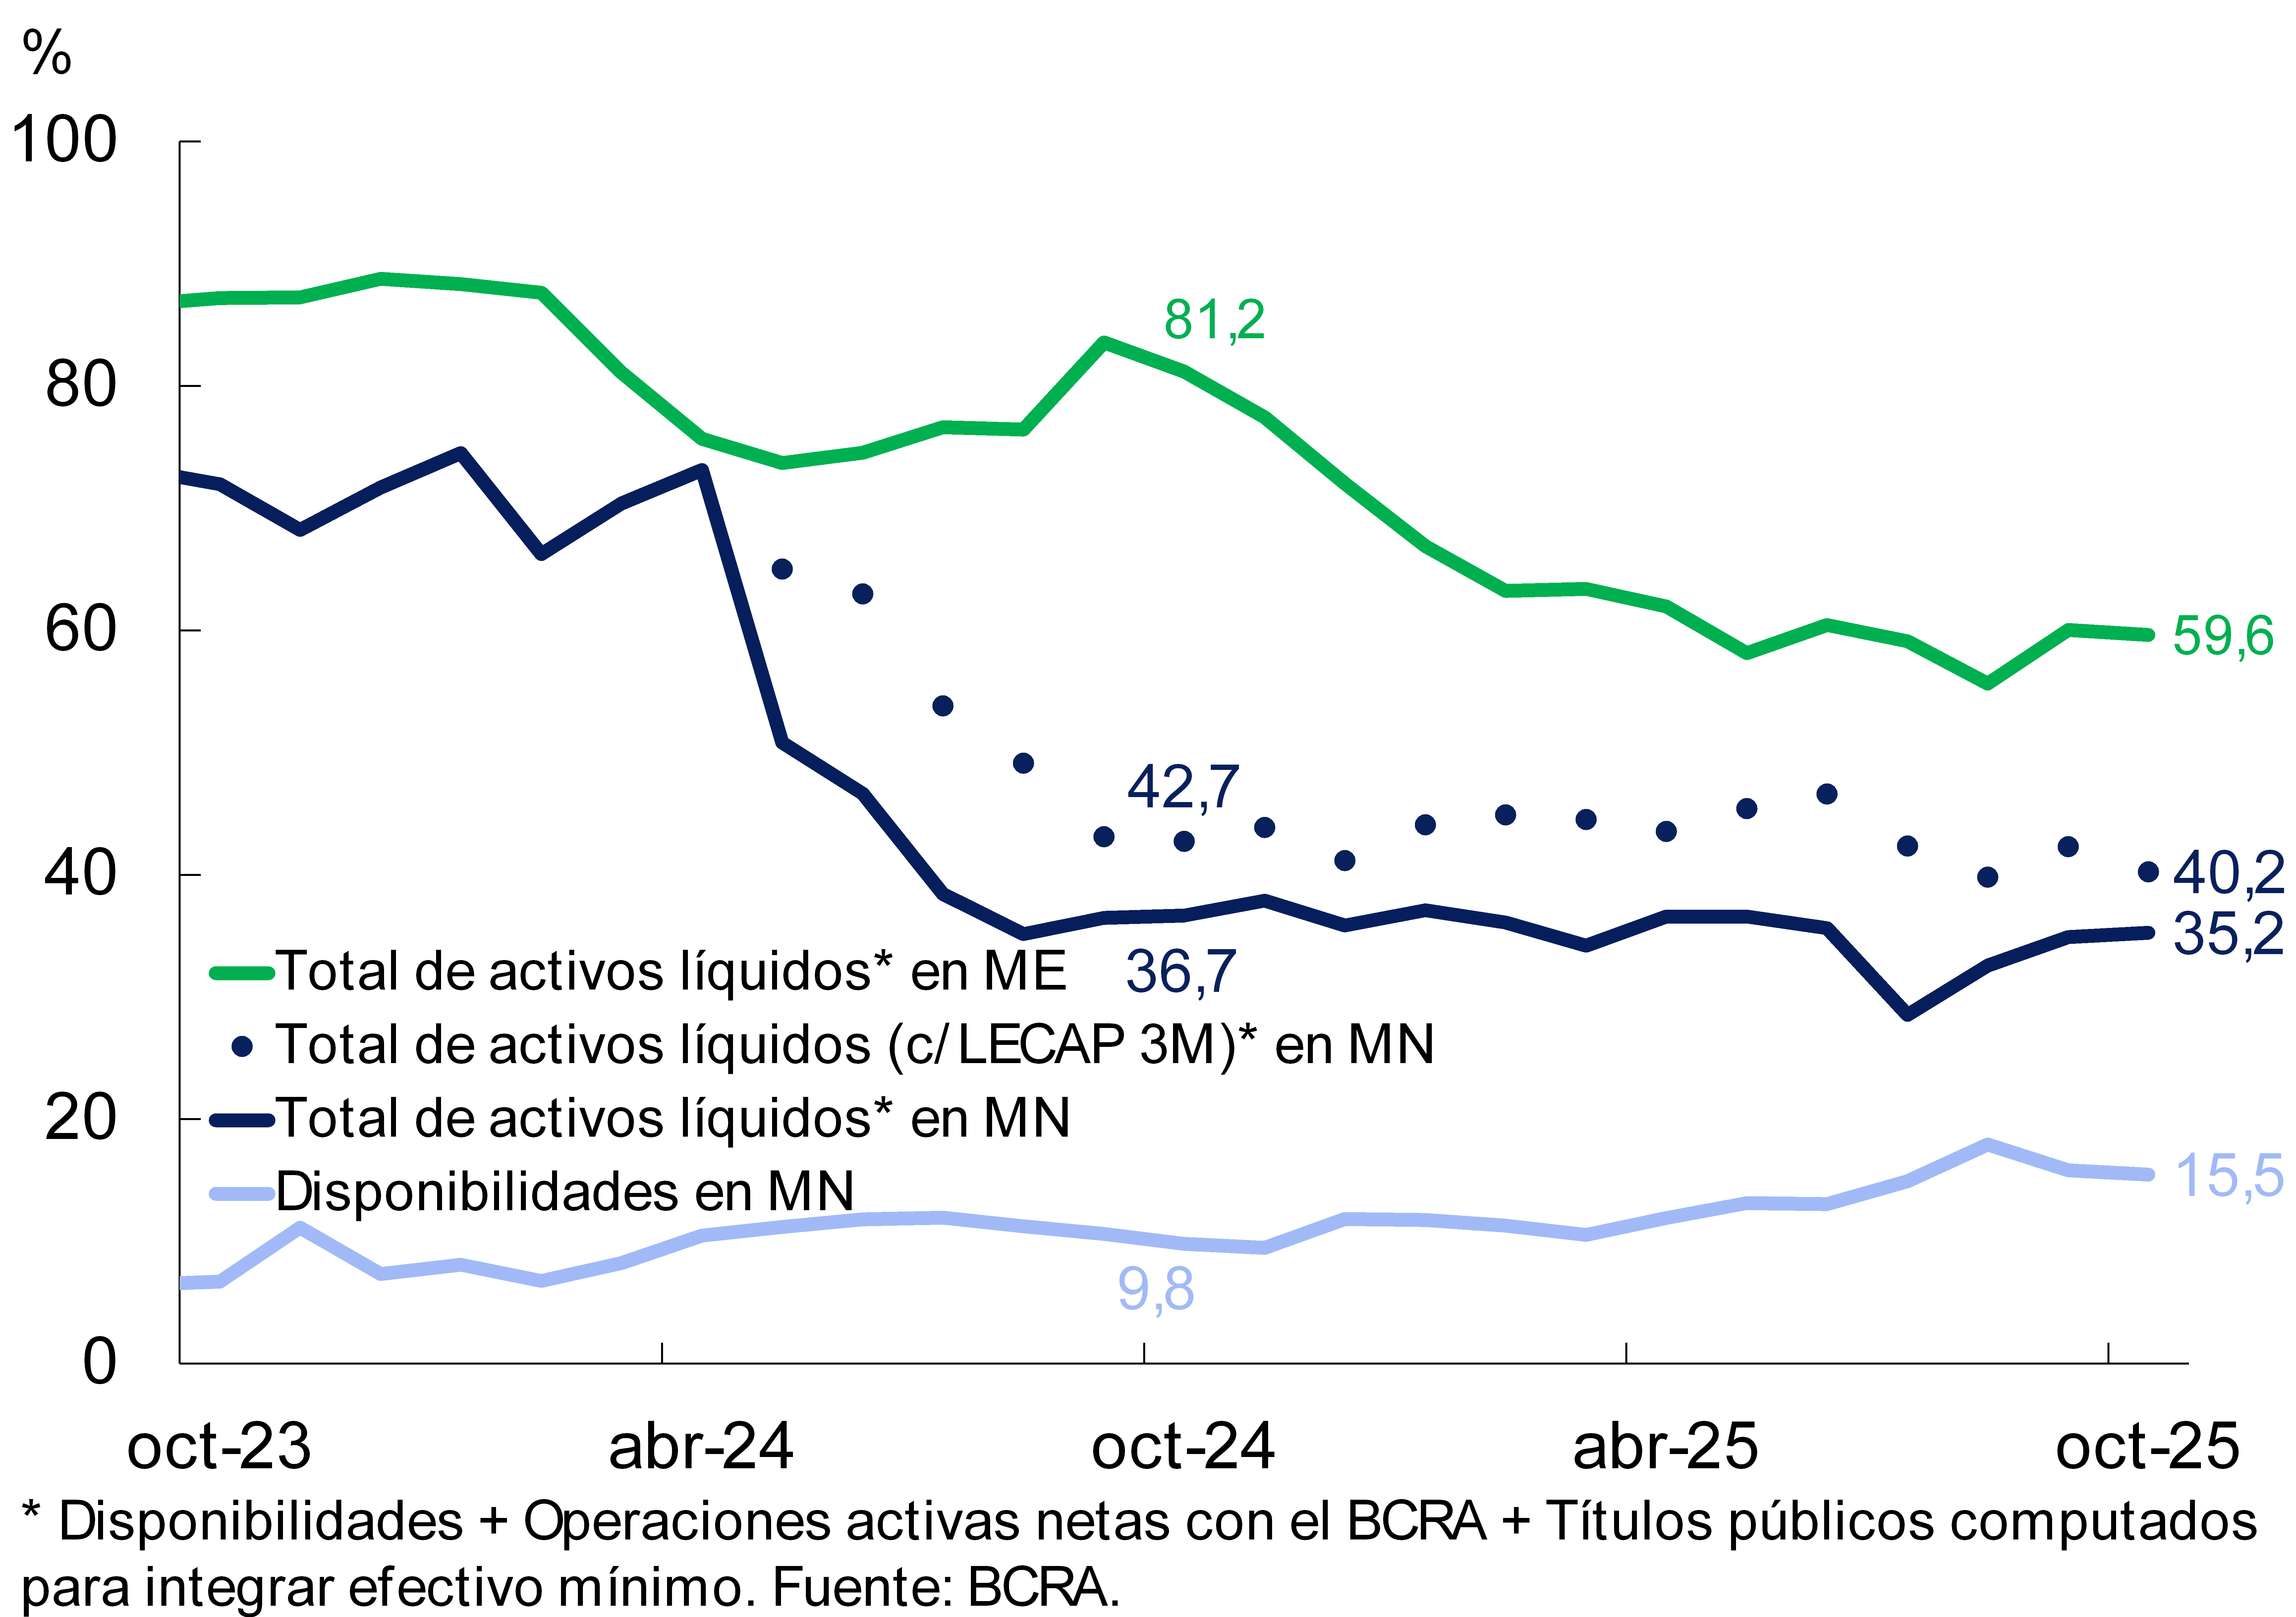
The systemic indicator of liquidity in local currency, which considers only cash and cash equivalents, decreased 0.4 p.p. of peso deposits in October, to 15.5% (+5.7 p.p. y.o.y.; see Chart 9). The broad peso liquidity ratio stood at 40.2% of peso deposits in the month, 0.4 p.p. lower than in September (-2.5 p.p. y.o.y.).1. On the other hand, liquidity in foreign currency decreased 0.4 p.p. of deposits in this segment to 59.6% (-21.6 p.p. y.o.y.).
Graph 9 : Liquidity Indicators
Financial System – As % of deposits
Graph 10 : Liquidity Coverage Ratio (LCR)
Group A Financial Institutions – In $+ME
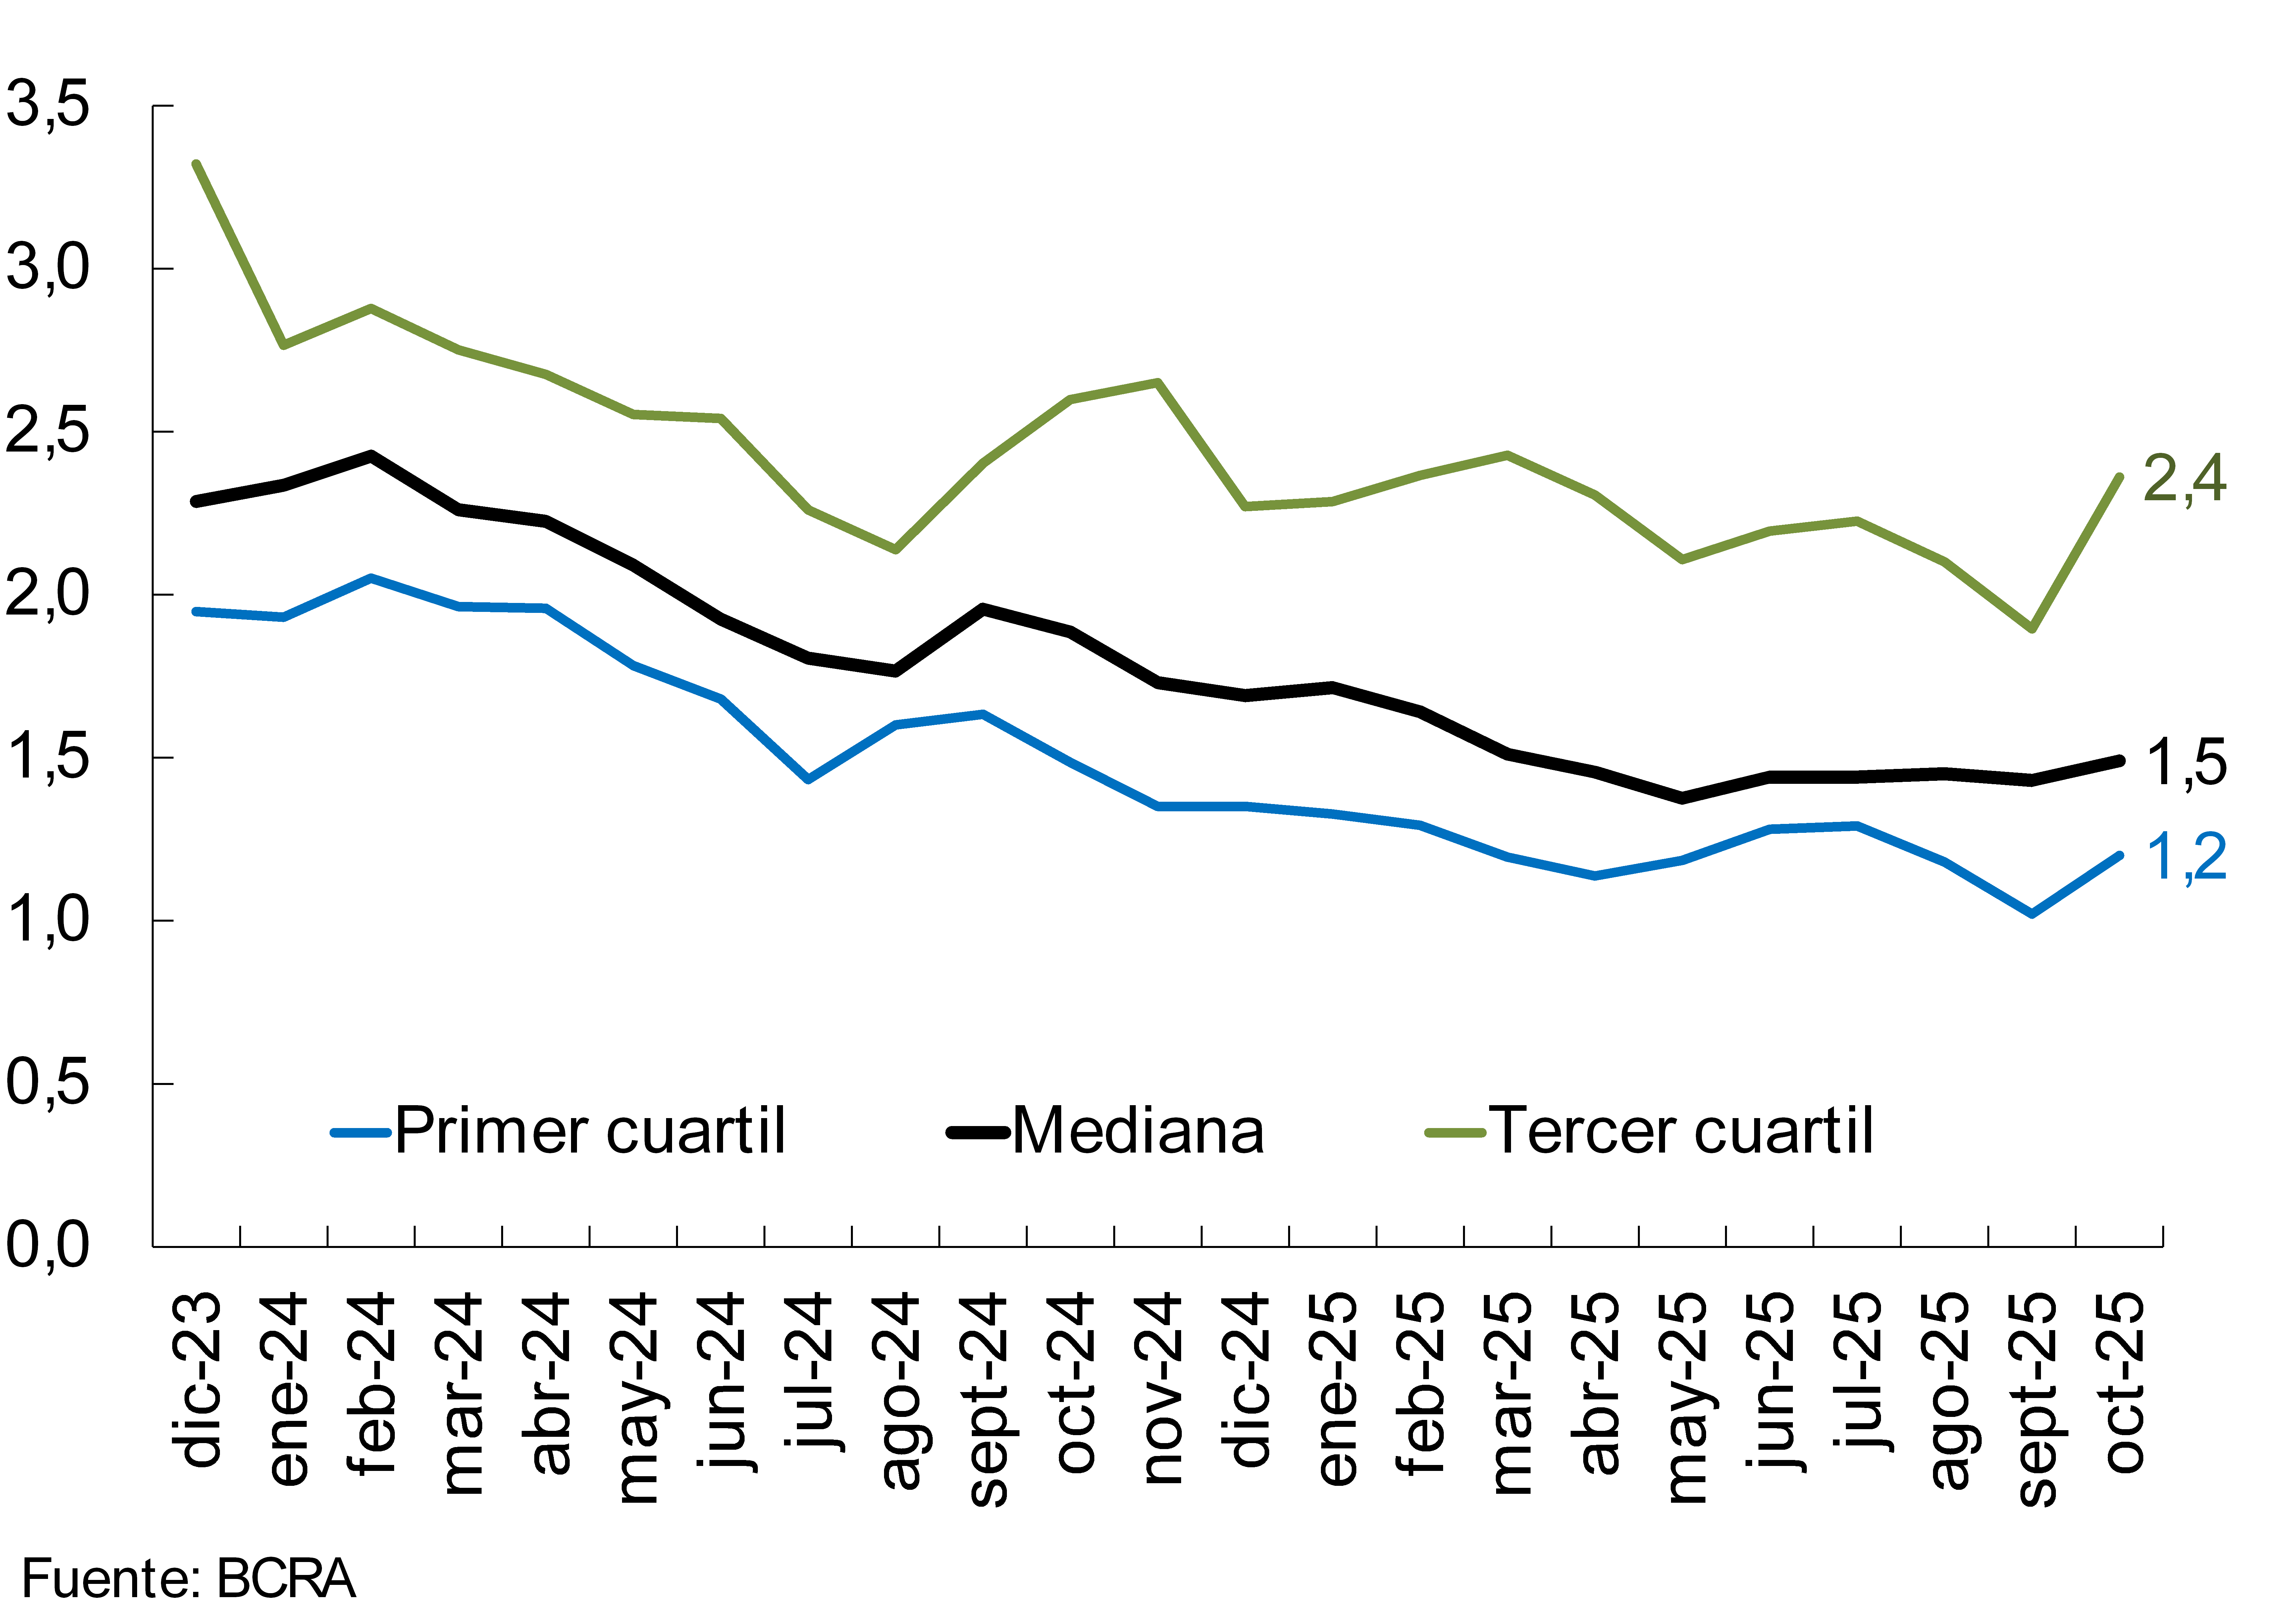
In October, the median liquidity coverage ratio (LCR, as per Basel Committee recommendations) increased slightly for the aggregate of local financial institutions required to verify it (Group A), reaching 1.5 (-0.4 y.o.y., see Graph 10).
Graph 11 : Integration of capital
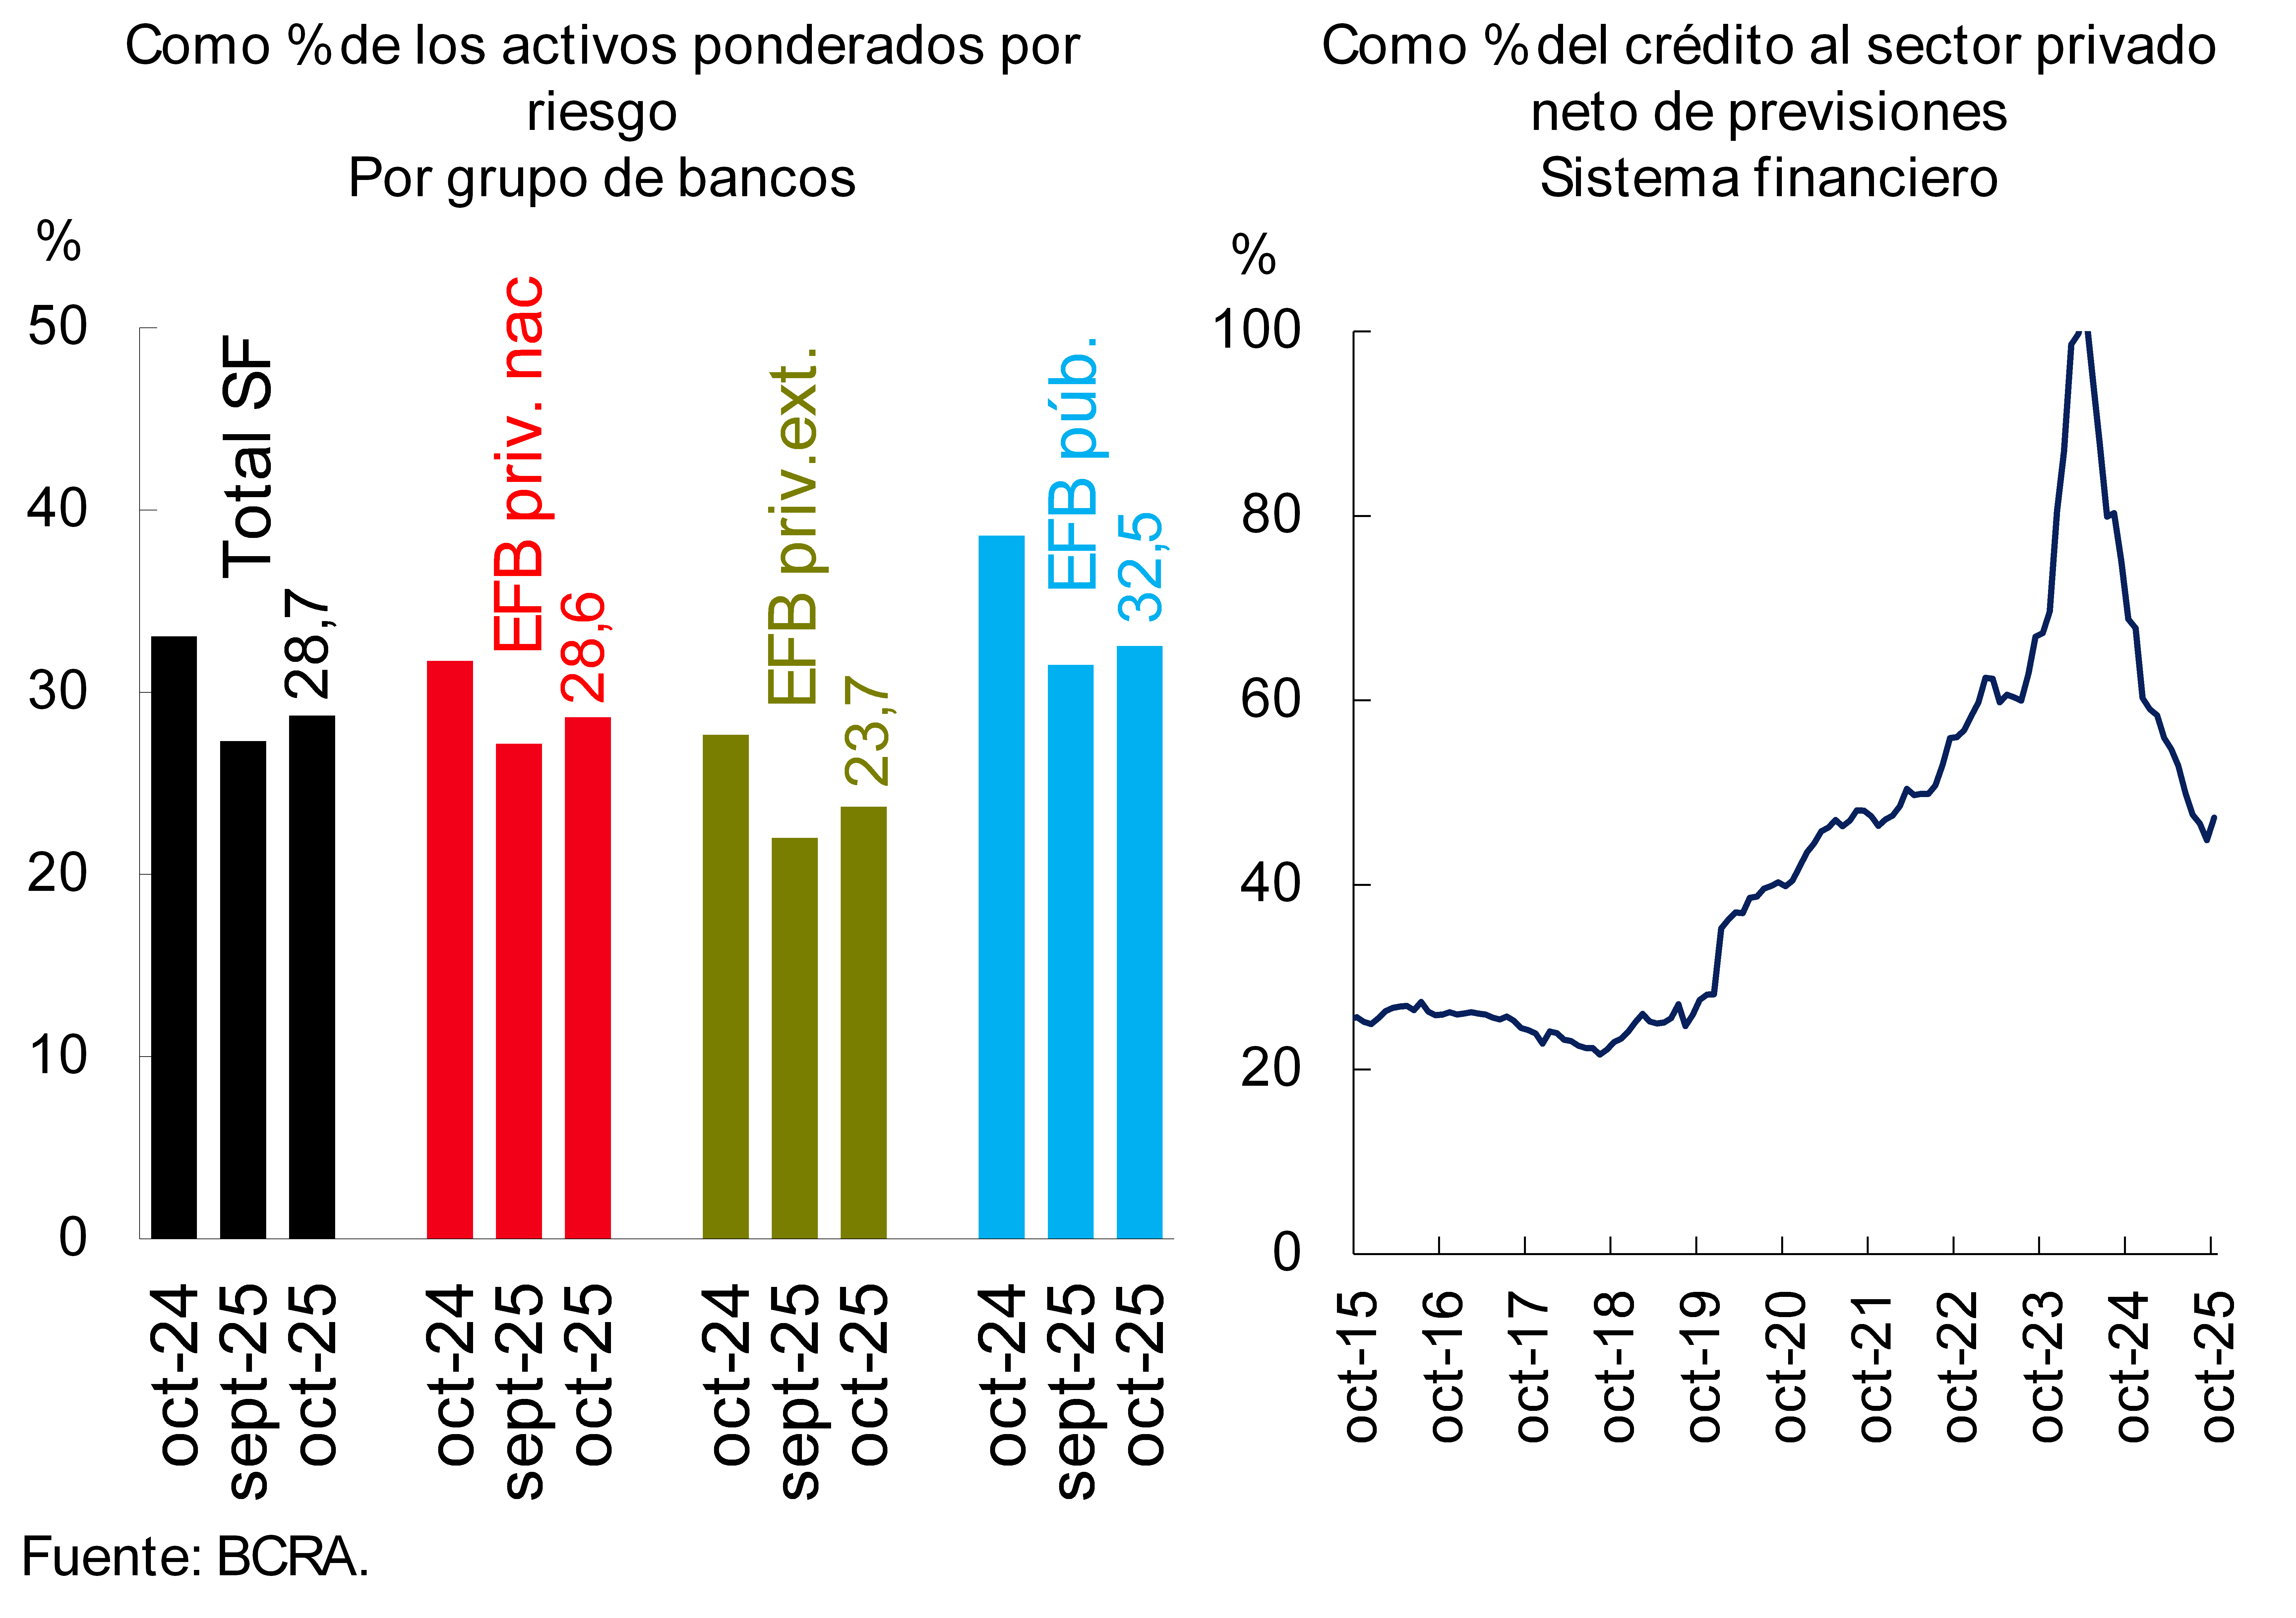
As of October, the integration of capital (RPC) in terms of risk-weighted assets (RWA) totaled 28.7%, 1.4 percentage points higher than in the previous month (see Chart 11). The monthly performance took place in a context in which the PRC increased by 5.6% in real terms with respect to September, while RWA increased by 0.4% in real terms. The monthly growth in RPC was mainly due to the positive results obtained. The excess capital (RPC net of the minimum regulatory requirement) with respect to the regulatory requirement totaled 254% in the month for the aggregate of entities (+16.8 p.p. with respect to September; exceeding the 10-year average of 183%). Regulatory capital represented 47.3% of the balance of financing to the private sector net of loan loss provisioning (+2.4 p.p. in the month; higher than the 10-year average of 43.3%).
Graph 12: Cumulative ROA over 3 and 12 months
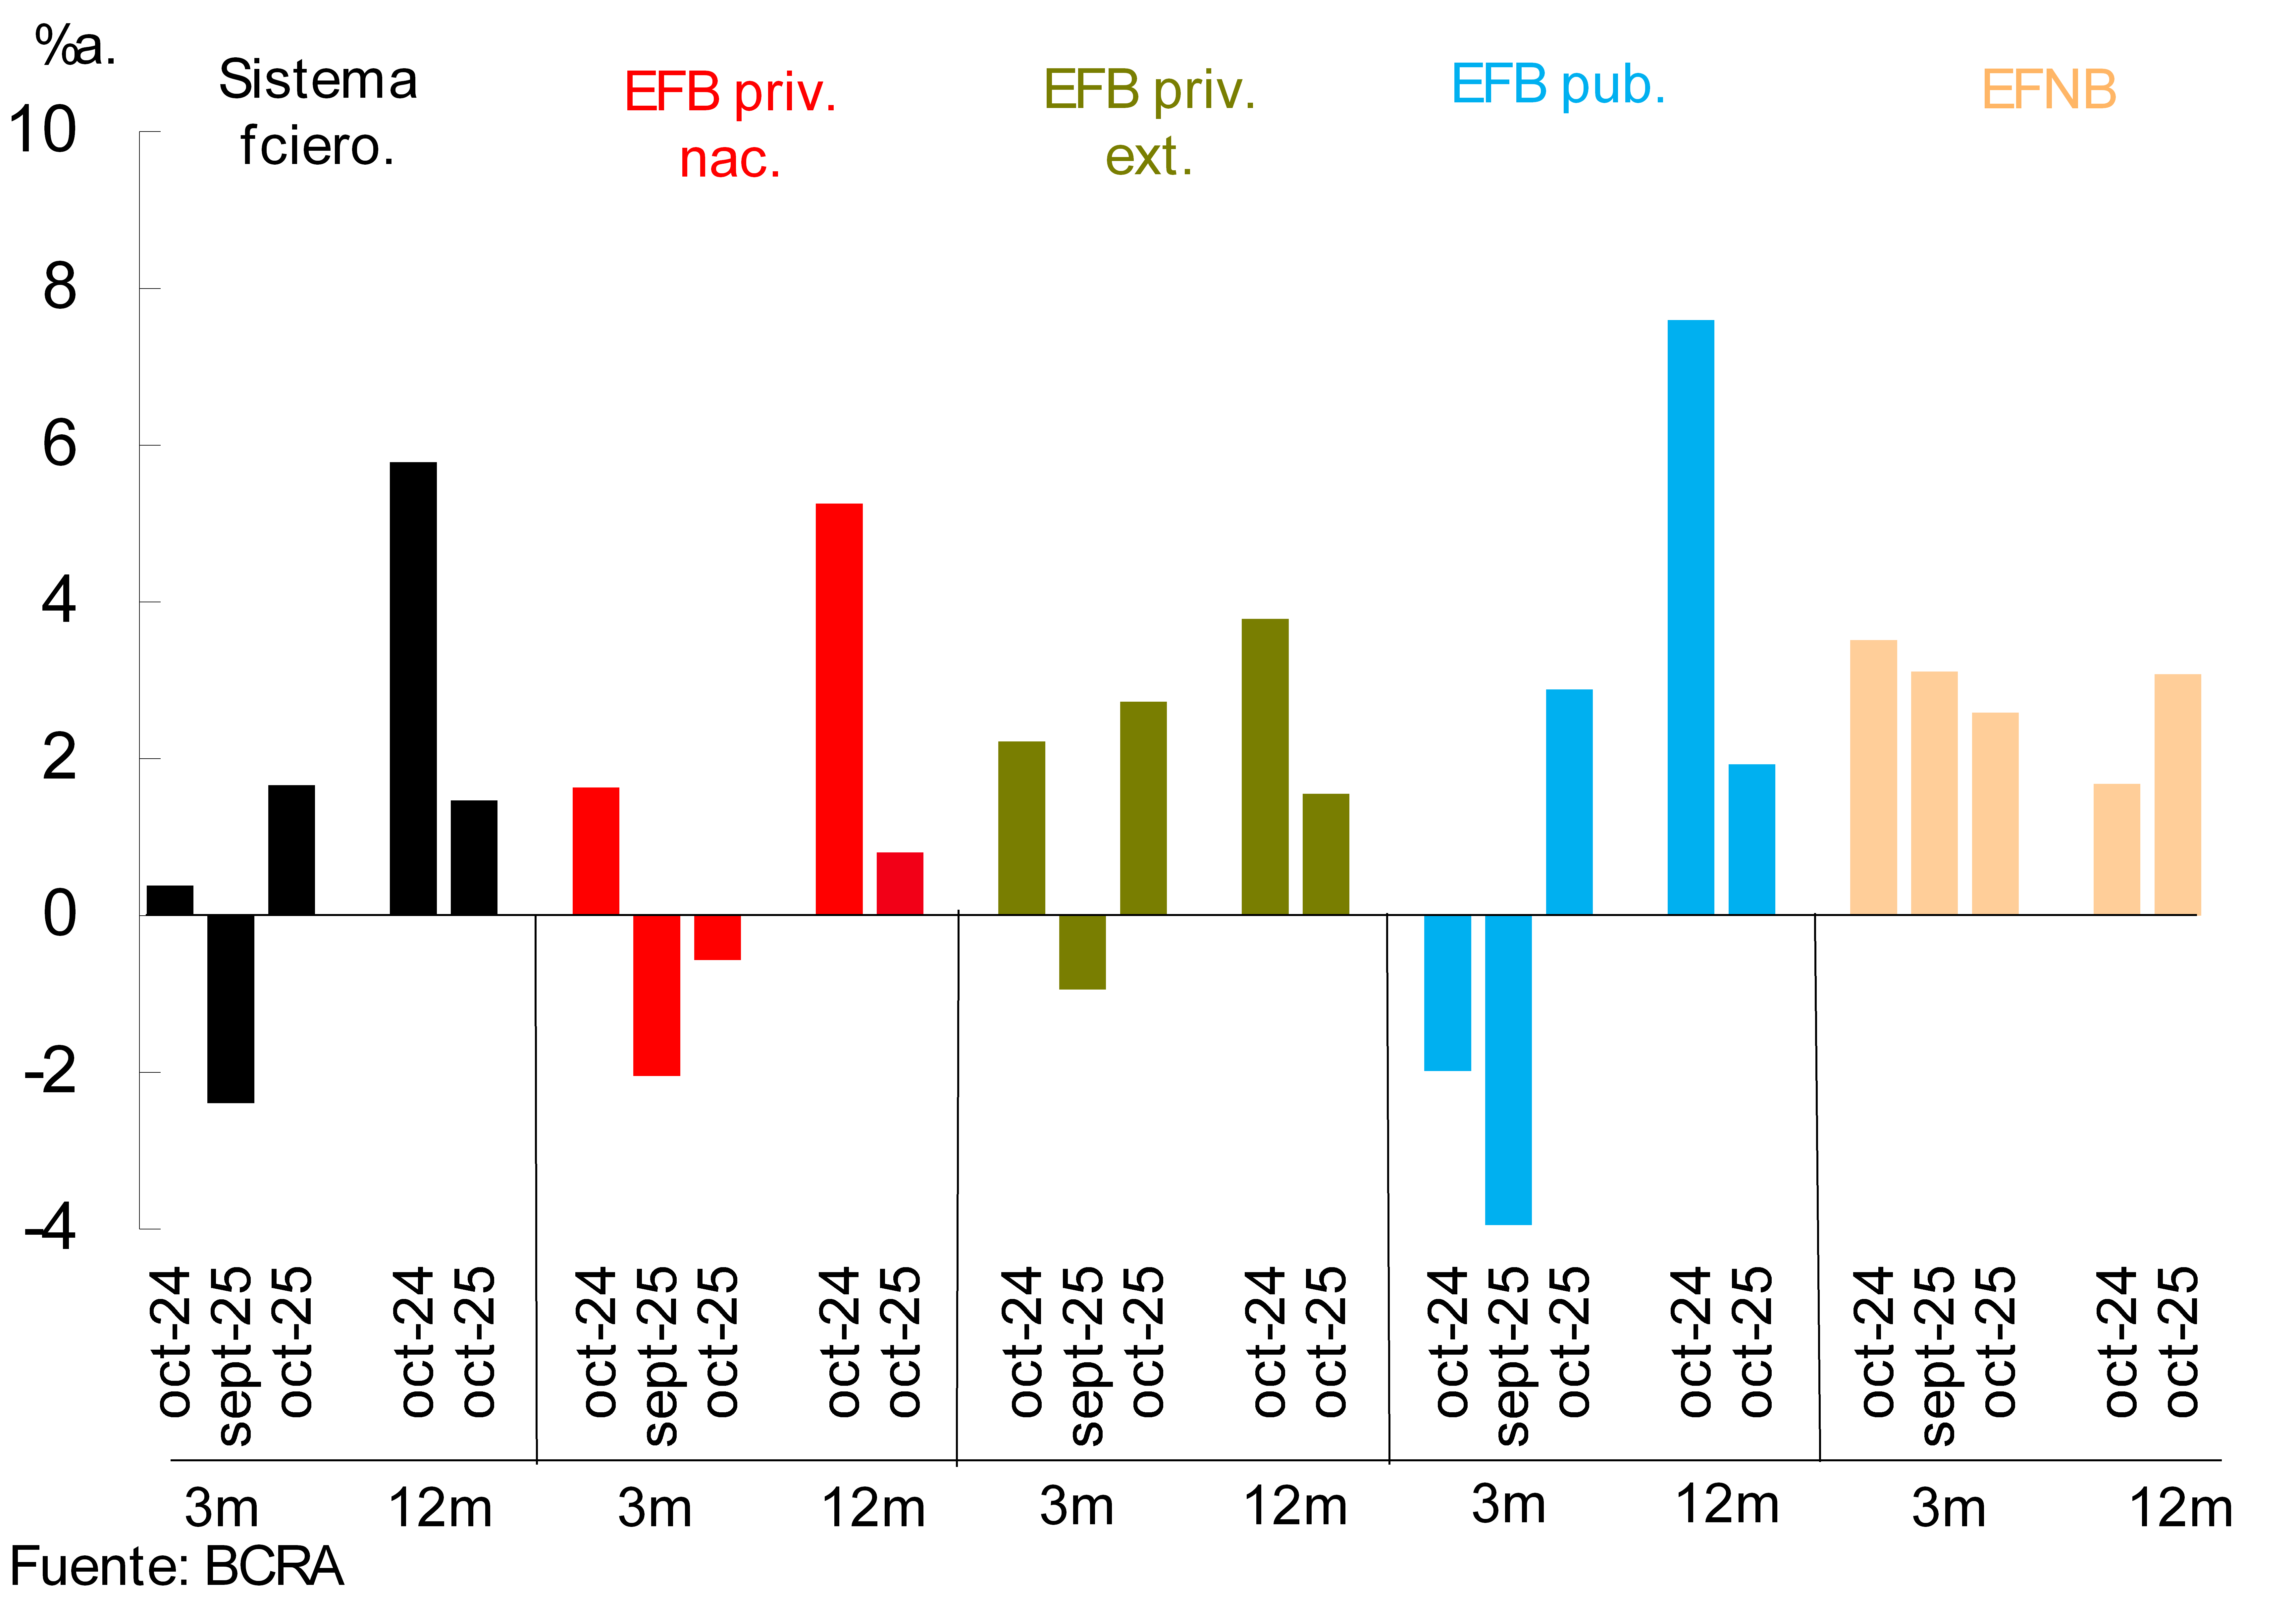
Primarily driven by securities performance2At the beginning of the fourth quarter of the year, there was a recovery in the profitability of the financial institutions as a whole. Over the last 12 months, total comprehensive income -in homogeneous currency- for the financial system was equivalent to 1.5% of assets and 6.3% of NPV, lower than the levels recorded a year earlier (see Chart 12). The year-on-year reduction was mainly explained by a lower real integral financial margin, added to higher bad debt charges. In the year-on-year comparison, there was also a reduction in the weight of administrative expenses of the financial institutions as a whole.
V. Payment system
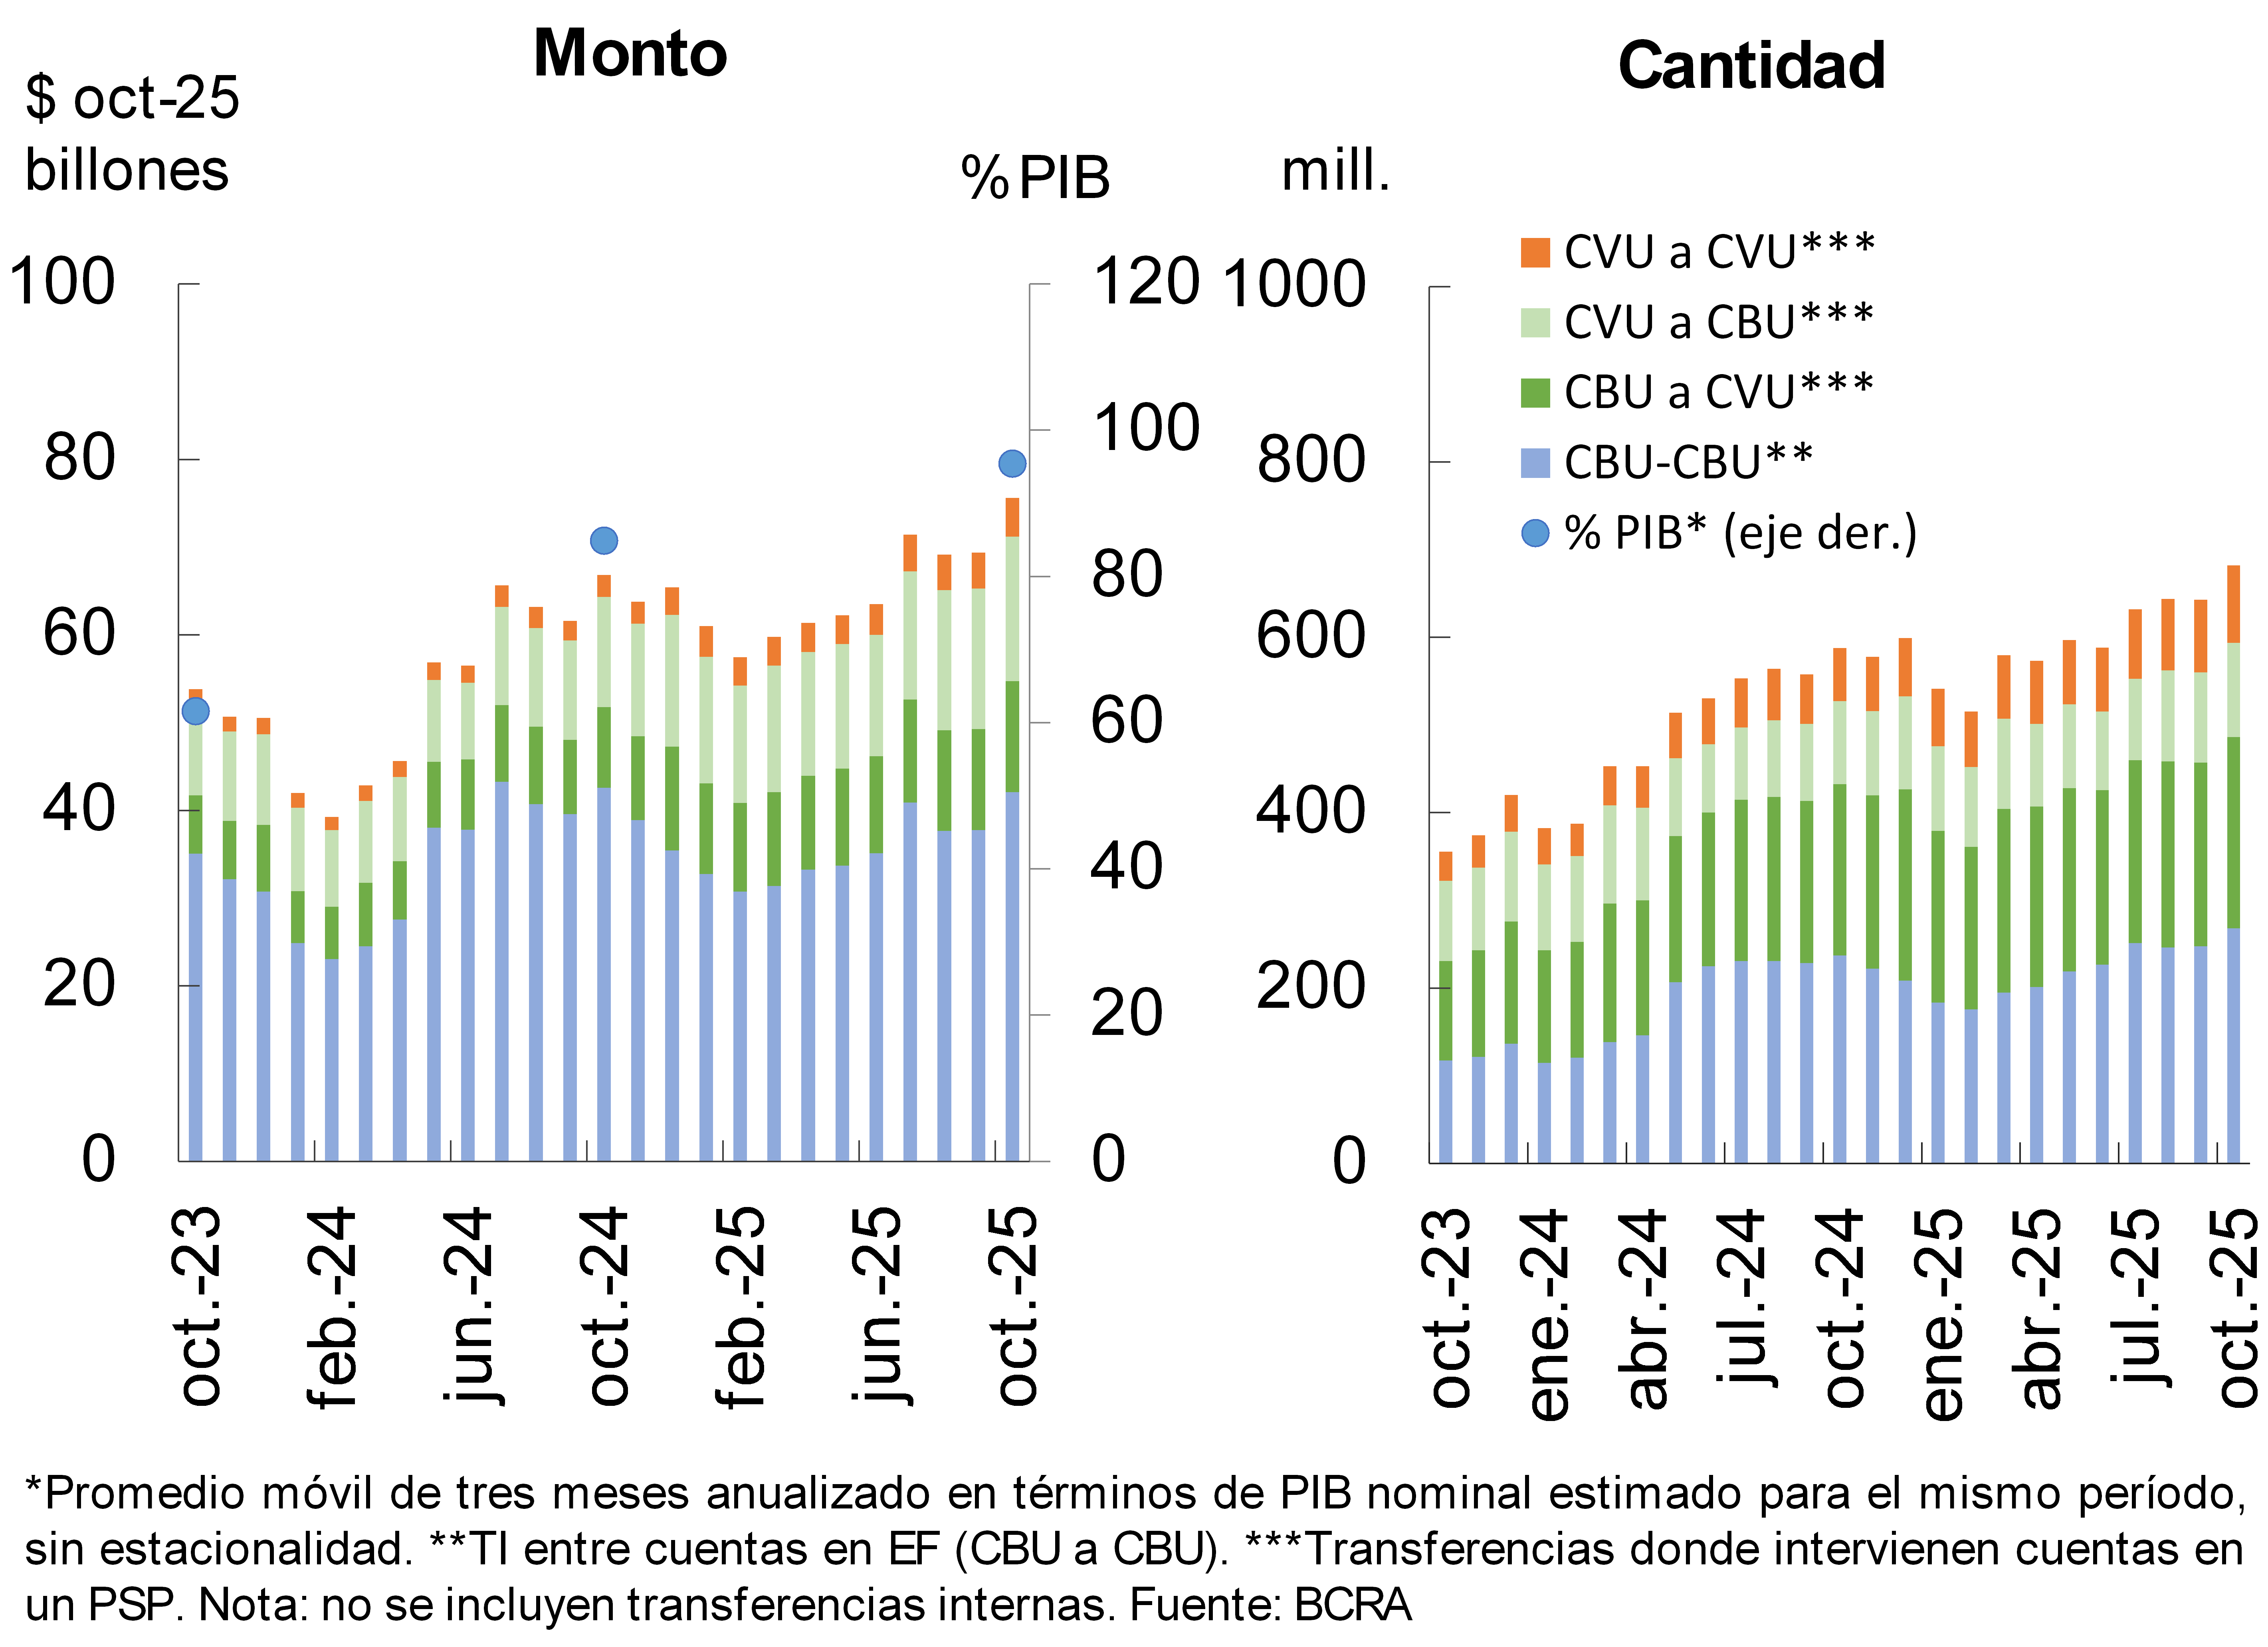
In October, immediate transfers (IT) expanded again, with increases in both quantities (6.1%) and real amounts (9%). In the year-on-year comparison, IT accumulated growth of 16% in amounts and 13.2% in real amounts (see Graph 13). IT involving CVU continued to show the highest year-on-year growth rates in real amounts: 78.1% among CVU, 37.9% in those from CBU to CVU and 30.9% in those from CVU to single banking code (CBU). On the other hand, transactions exclusively between single banking code (CBU) -excluding intra-entity- recorded a slight year-on-year decrease in amounts (-1.2%).3 The total amount of IT transactions -averaged over the last three months and annualized- represented 95.4% of GDP, 10.5 percentage points higher than a year earlier.4
Chart 13 – Immediate Transfers (IT)
Payments with Transfers (PCT) through QR code continued to grow during the month, with increases of 8.2% in amounts and 7.4% in real amounts. Compared to the same period of 2024, these transactions showed a marked advance: increases of 48.2% in amounts and 61.3% in real amounts.5 Even from limited levels within the payment system, PCTs continued to gain share. It is estimated that the amount of PCTs through QR in the last three months (annualized) represented 1.9% of GDP, an increase of 0.8 p.p. with respect to one year ago.
Graph 14 : Check clearing
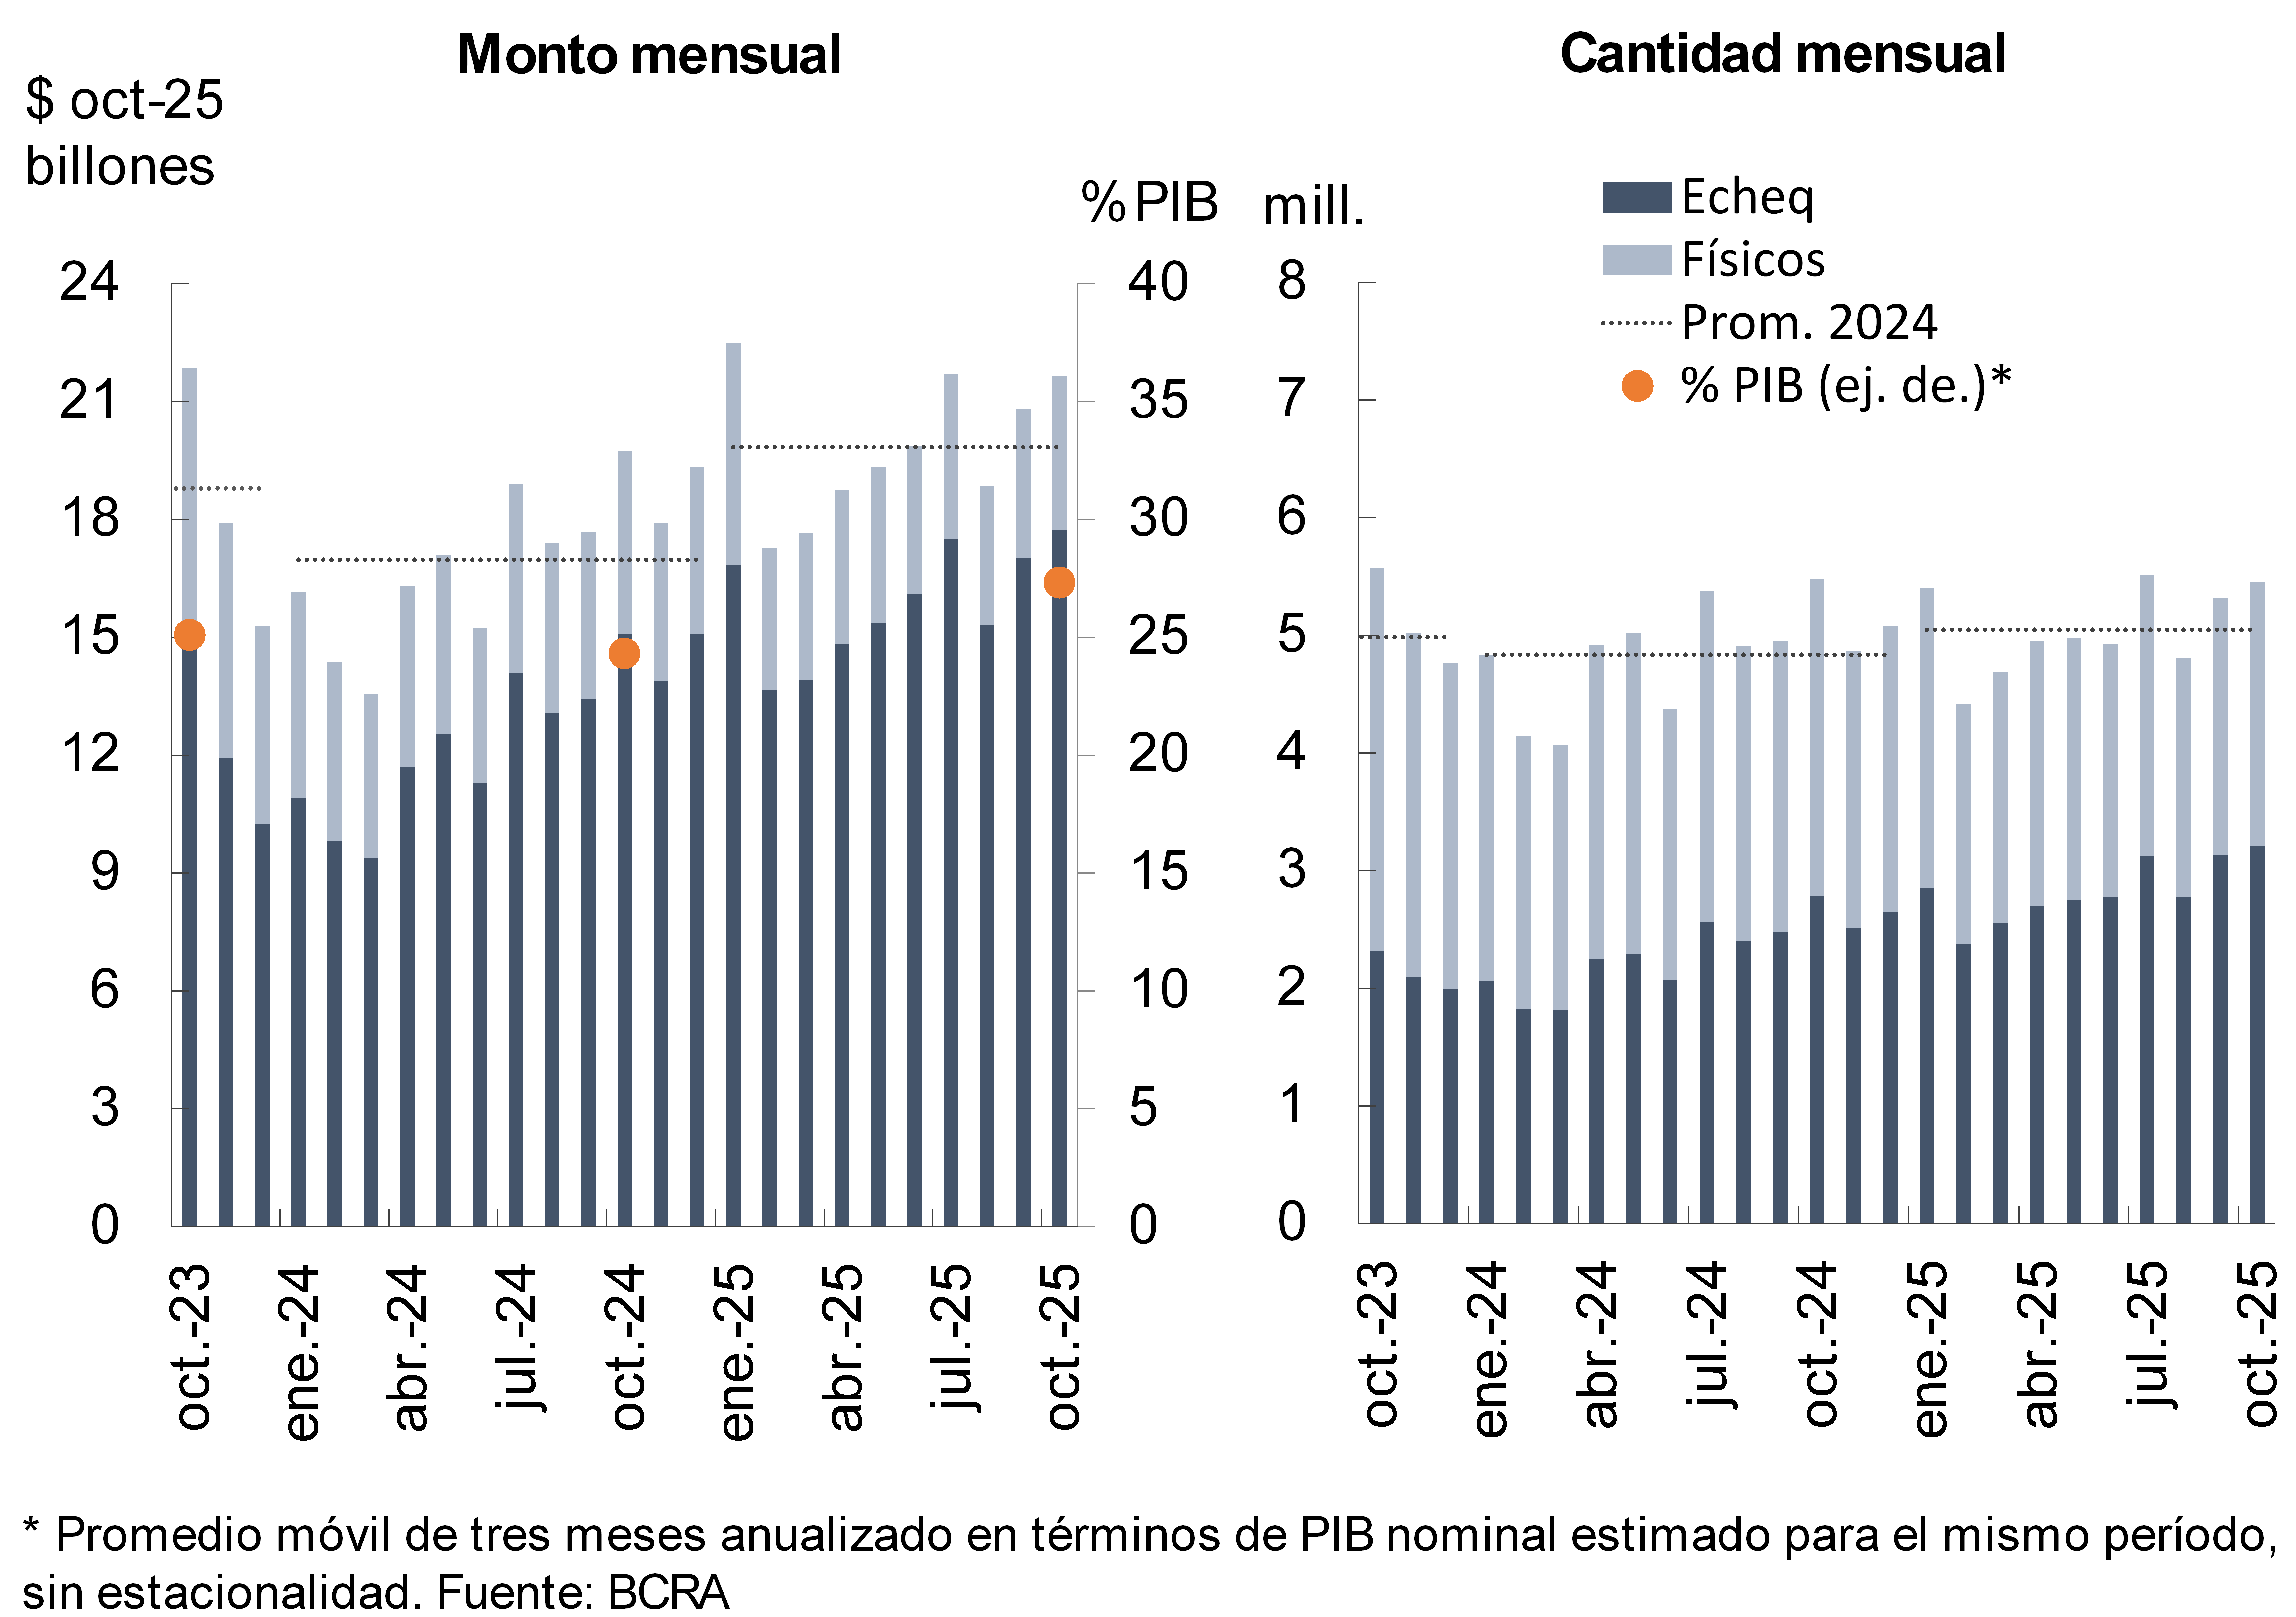
Check clearing increased 2.5% in terms of amounts and 4% in real amounts with respect to September (see Graph 14). In year-on-year terms, the total amount cleared showed mixed dynamics: real amounts grew by 9.6%, while quantities showed a slight reduction of 0.5%.6 When distinguished by type of instrument, physical checks showed decreases of 16.8% y.o.y. in amounts and 16.4% y.o.y. in real amounts. In contrast, ECHEQs expanded, growing 15.4% y.o.y. in amounts and 17.6% y.o.y. in real amounts. As a result, the electronic mode reinforced its predominance within the clearing system, accounting for 58.9% of the quantities and 81.9% of the amounts traded in the month. The total value cleared (physical and electronic format together) in the last three months (annualized) represented 27.3% of GDP, 3 percentage points higher than a year earlier.
The ratio of returned checks for insufficient funds to total cleared funds increased slightly during the month. The indicator stood at 2% for amounts and 1.47% for amounts. Both indicators were above the levels of the previous year.
References
1 Considers availabilities (cash and current account at the BCRA), net asset transactions with the BCRA, the balance of government securities species that entities compute as integration of Minimum Cash and LECAP holdings maturing in the next 3 months (until June 2025 it considered liquidity fiscal bills -LEFI-).
2 Mainly reflecting the effect of the recovery of the increase in the price of government securities following the mid-term elections.
3 In year-on-year terms as of October, the number of IT transactions between CVU increased by 45.3%, while those between single banking code (CBU) grew by 13.1%. Transactions from CBU to single banking code (CBU) and vice versa also recorded increases (11.5% y.o.y. for the former and 13.7% y.o.y. for the latter).
4 In October the average IT value was $110,800.
5 In October the average value of QR code PCTs was $19,500.
6 In October the average amount of checks cleared was $4 million (physical format: $1.74 million; ECHEQs: $5.52 million).
Share on


