I. Financial intermediation activity
The financial intermediation of all entities with the private sector increased again in November. Taking into account the most important monthly variations in the balance in pesos of the aggregate financial system – in homogeneous currency – on the side of the origins of funds, there was an increase in the balance of deposits (private and public sector). As for the most relevant applications of resources, the real balance of credit to the private sector and the most liquid assets increased in the month. In relation to the foreign currency segment, in November the balance of liquid assets and deposits of the private sector was reduced and the balance of credit to this sector increased.
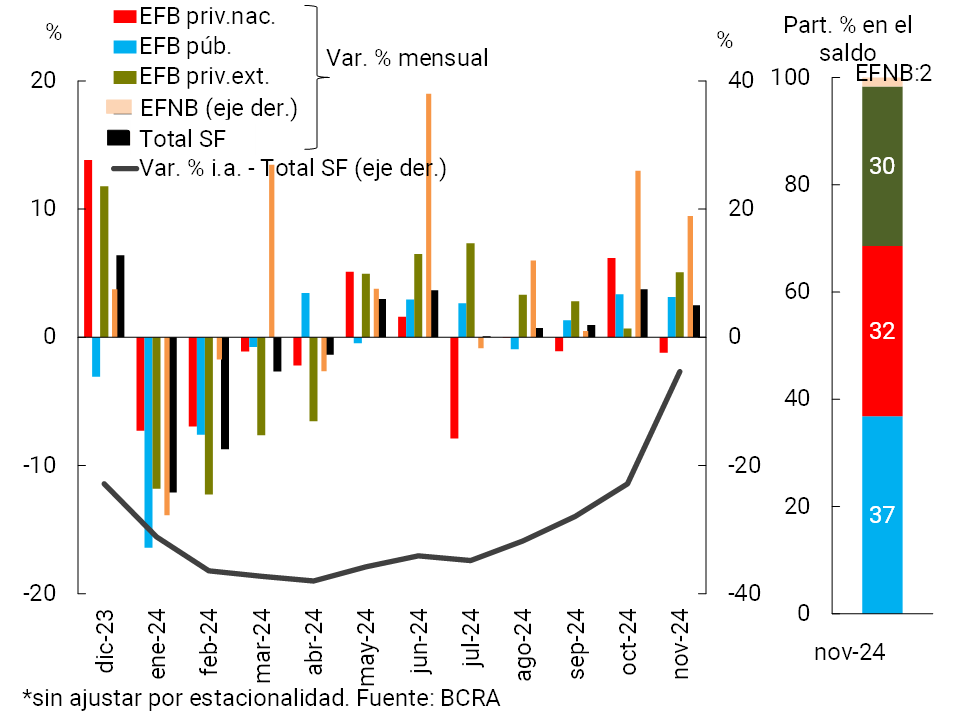
In November, the balance of credit in pesos to the private sector increased by 4.6% in real terms compared to the previous month1. This performance was widespread among groups of institutions (see Chart 1), with greater relative dynamism in EFNBs and private banks. When distinguishing by credit lines, the monthly increase was mainly driven by consumer loans (they accounted for more than half of the monthly increase, growing 6.3% in real terms in the month), followed by loans with real collateral (+4.3% in real terms) and commercial loans (+3.2% in real terms). In this scenario, the real balance of financing in pesos to the private sector accumulated an increase of 17.2% YoY, a record not observed since mid-2018, and accumulated an expansion of 66.2% in real terms since April – when credit grew again.
Graph 1 | Balance of credit to the private sector in pesos
Changes in real terms*

Graph 2 | Financial intermediation with the private sector in foreign
currency In source currency
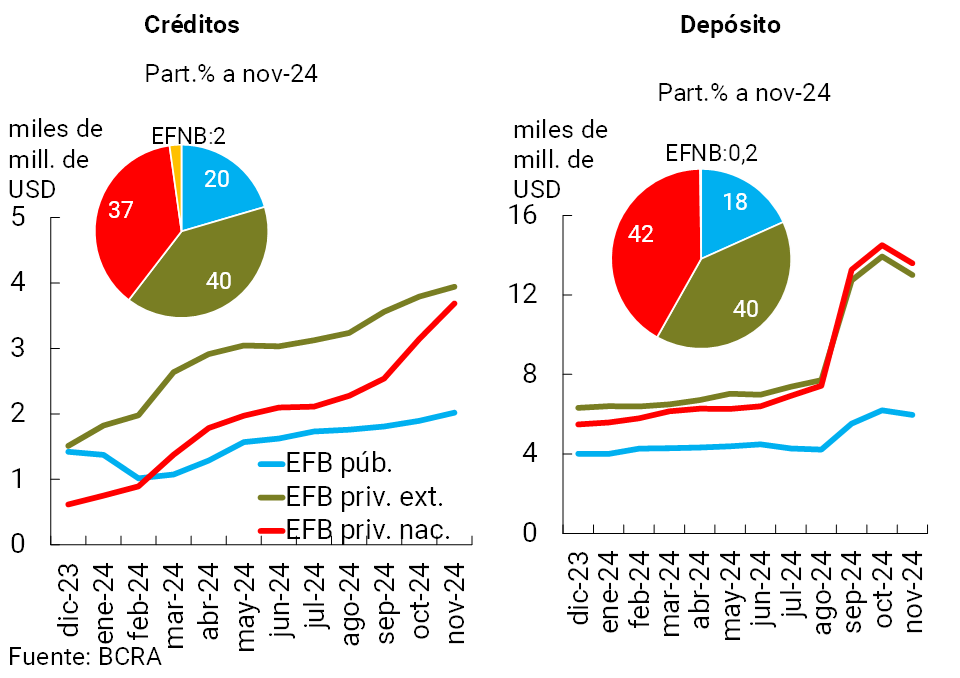
The balance of credit to the private sector in foreign currency increased 9.1% in November – in the currency of origin. The increase in the period was mainly driven by documents and pre-financing for exports (together they accounted for more than 90% of the monthly increase) and by national private entities (see Graph 2).
Considering all currencies, in November the real balance of total financing to companies and households increased by 5.2% (see Chart 3)2. On the business side, loans to trade and services saw the largest relative increases in the month. On the side of families, the dynamism of personal loans continued to stand out. In year-on-year terms, the balance of total financing to the private sector increased 27.7% y.o.y. in real terms, being one of the highest year-on-year growth rates in the last ten years (practically the same as the peak reached in May 2018).
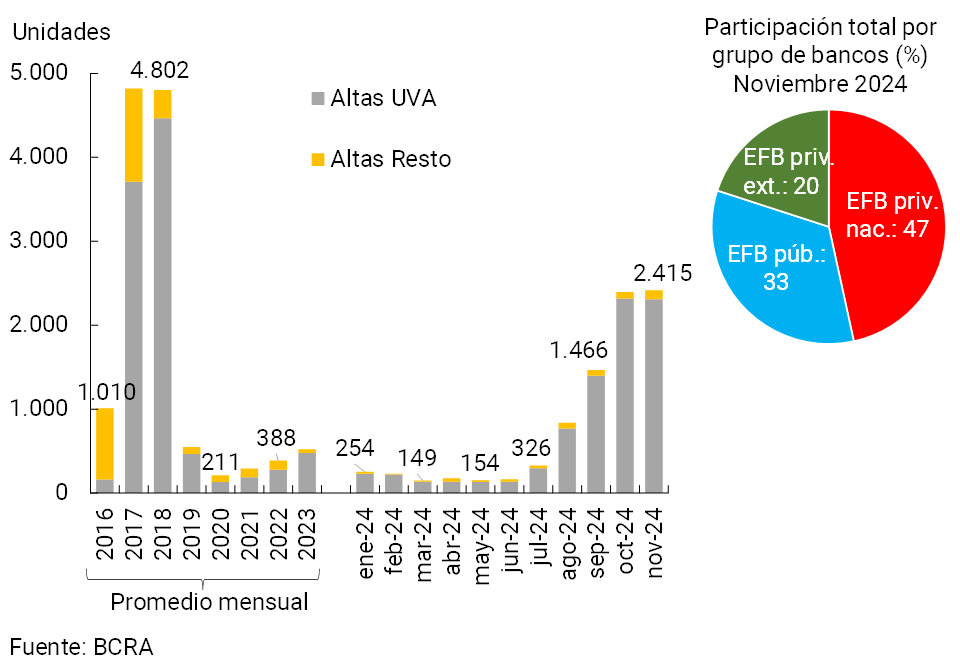
Credit lines with mortgage guarantees continued to grow in November, increasing 3.9% in real terms compared to October – including principal and adjustment of UVA loans. It is estimated that in the month some 2,400 “registrations” of mortgage debtors (individuals) were verified (see Graph 4). Almost half of the mortgage “registrations” in November were channeled by national private financial institutions.
Graph 3 | Real balance of total credit to the private sector*

Figure 4 | Estimation of mortgage “registrations” (individuals)
Financial system
In November, the real balance of private sector deposits in pesos increased by 2.5% at the systemic level, with greater relative dynamism in the EFNBs and in foreign private banks (see Chart 5). The real balance of time deposits grew 5.8% in the month, while demand accounts increased 0.7% in real terms in period3.
Graph 5 | Real balance of private sector deposits in pesos*
With respect to the foreign currency segment, the balance of private sector deposits fell by 6% in November (in currency of origin) (see Chart 2). Despite the monthly performance, the level of the balance of foreign currency deposits in the private sector continued to be one of the highest recorded in the last twenty years. In this scenario, the real balance of total deposits (including all sectors and currencies) accumulated an increase of 1.2% in the month and 14.9% year-on-year.
II. Evolution and aggregate composition of the balance sheet
In November, the size of the balance sheet of the financial system continued to grow. The total assets of the sector increased 1.5% in real terms in the month and accumulated a real increase of 10% y.o.y.
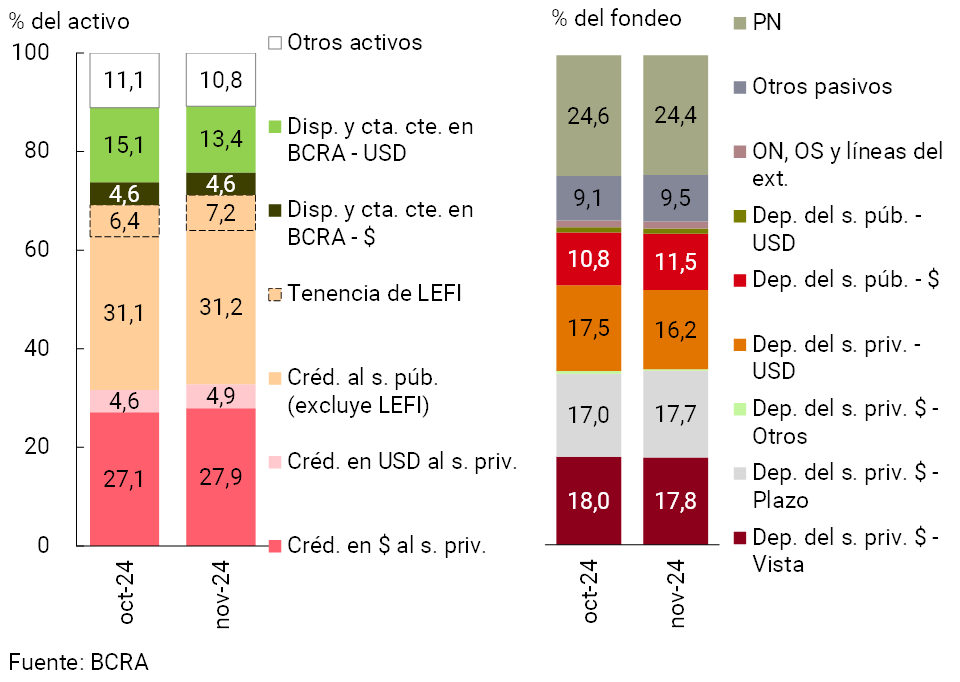
With regard to the main components of the total assets of all financial institutions, the share of credit in pesos to the private sector increased again during the month, while the weighting of the balance of availabilities and current accounts in the BCRA in foreign currency decreased (see Chart 6). In relation to the most significant items of total funding, time placements in pesos by the private sector gained relevance in the period, while deposits in foreign currency by the same sector reduced their relative importance in the total.
Graph 6 | Composition of assets and funding Financial
system – Participation %
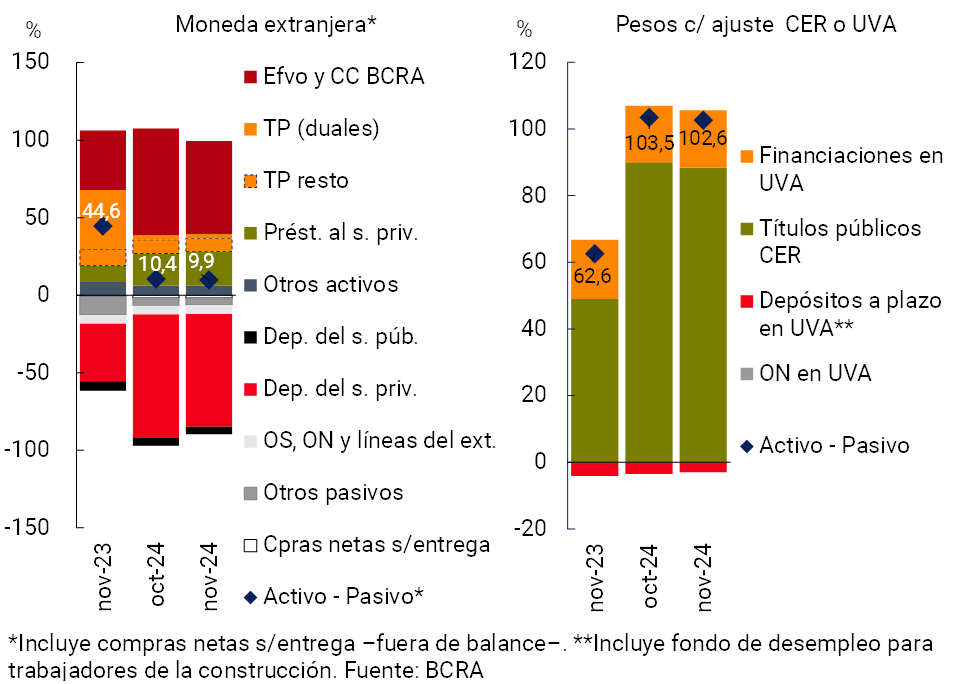
The estimated spread between the financial system’s foreign currency assets and liabilities narrowed slightly in November, standing at 9.9% of regulatory capital (RPC) for the sector as a whole (-34.7 p.p. y.o.y., see Chart 7)4. On the other hand, it is estimated that the differential between items in pesos adjustable by CER (or agreed in UVA) reached 102.6% of the sector’s PRC in the month, 0.8 p.p. below the level of October (+40 p.p. y.o.y.).
Figure 7 | Spread between assets and liabilities
In % of PRC
III. Portfolio quality
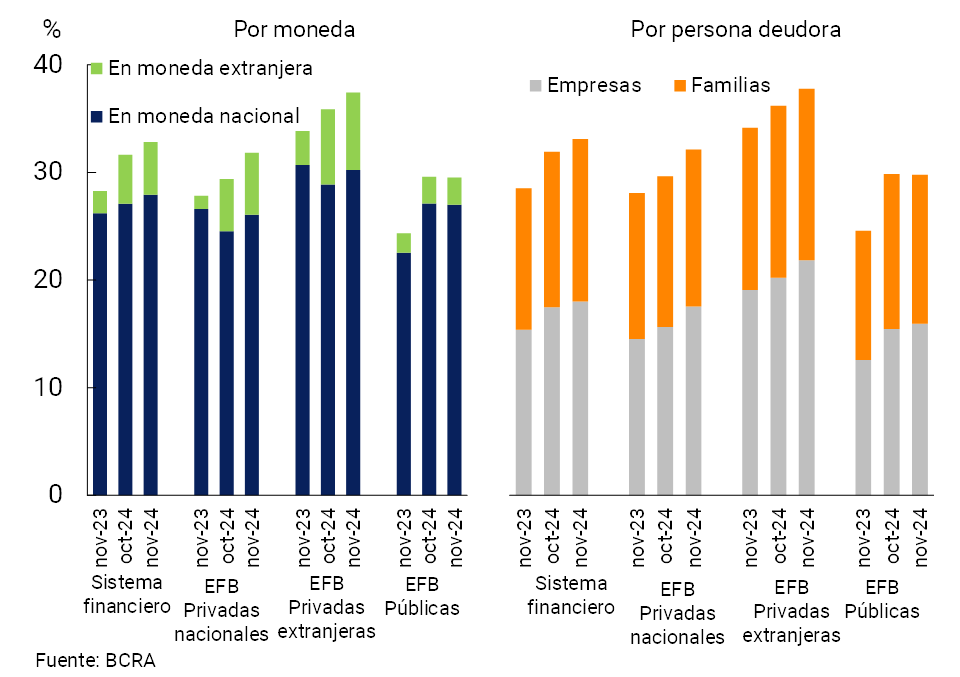
The exposure of the financial system to the private sector reached 32.8% of total assets in the month, growing 1.2 p.p. compared to October5. The monthly increase was driven by private banks and was reflected in both the domestic and foreign currency segment (see Chart 8). In perspective, the private sector exposure of the aggregate of entities has been growing since the beginning of the year (+11 p.p. from the local minimum observed in January 2024), although it is still 4.4 p.p. below the average of the last 10 years6.
Figure 8 | Credit balance to the private sector in terms of assetsBy group of financial institutions
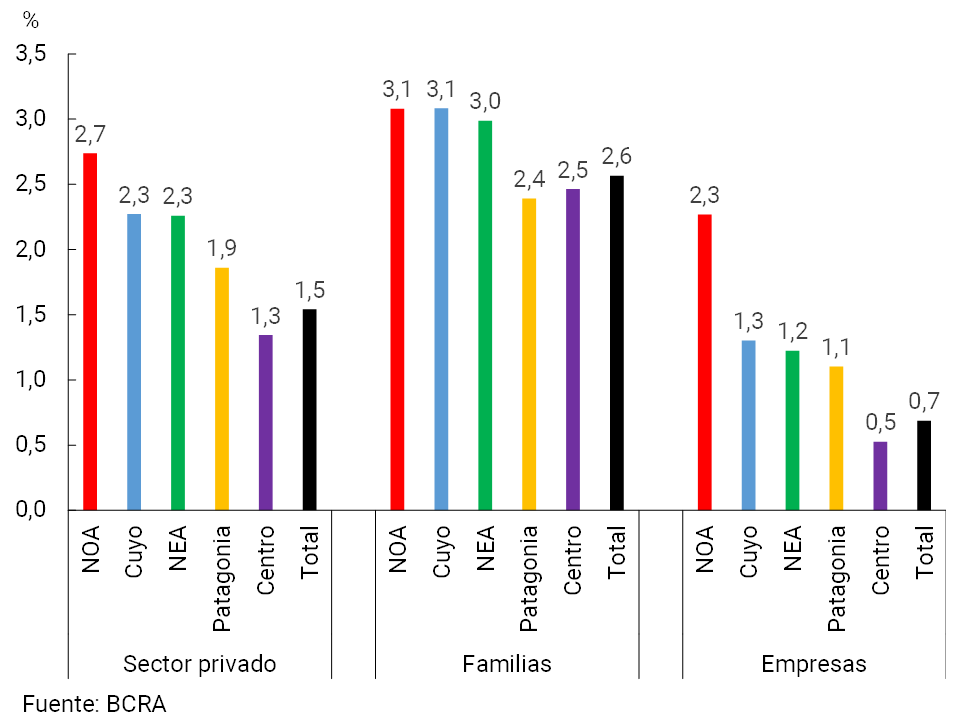
In November, the non-performing loan ratio to the private sector remained stable, at around 1.5%. The indicator of delinquency of financing to households increased slightly in the month (to 2.6%), a performance mainly explained by cards. On the other hand, the ratio of irregularity of financing to companies remained without significant changes in the month (at 0.7%). The relative levels of non-performing loans were similar in the different groups of banks, while the EFNBs maintained higher levels for this indicator (see Chart 9). The irregularity ratios of credit to households and credit to companies show some heterogeneity between the different regions of the country. The lowest record corresponds to the portfolio of debtors located in the central area of the country, followed by Patagonia; while the highest relative level is verified by those domiciled in NOA, mainly in the family segment (see Graph 10)7.
Figure 9 | Irregularity of Credit to the Private
Sector By Entity Group
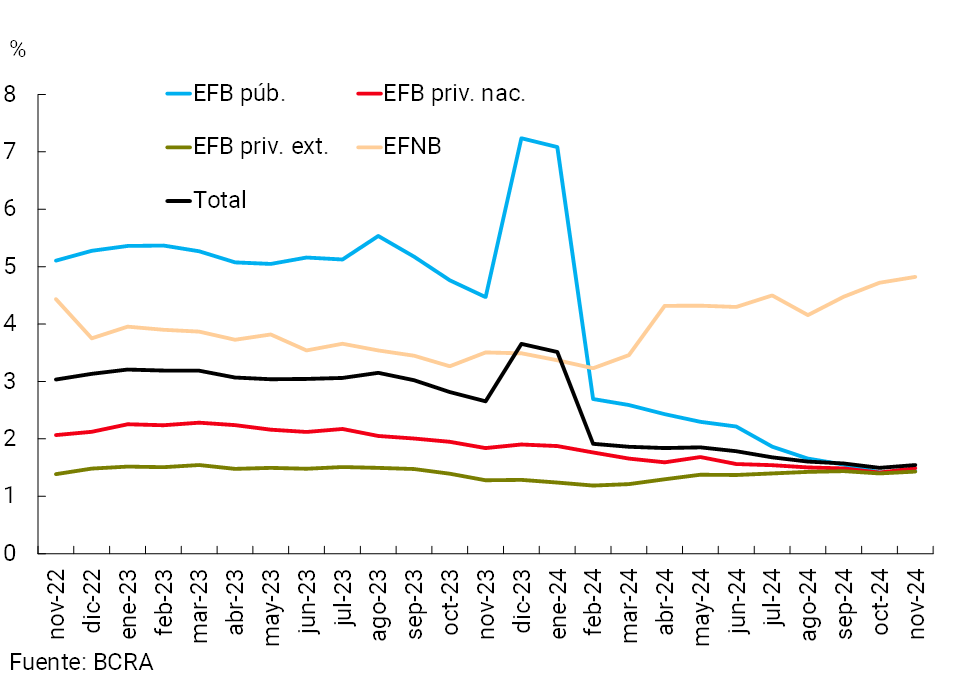
Figure 10 | Private Sector Credit IrregularityAs % of Total Private Sector Credit Balance – By Geographic Region – November 2024
In the month, the forecast for the sector represented 2.7% of the total portfolio to the private sector (unchanged in the month and -0.8 p.p. y.o.y.) and 171.8% of that in an irregular situation (-9.9 p.p. monthly and +42.3 p.p. y.o.y.). The net pension balance of that attributed to the regular portfolio (situations 1 and 2 according to minimum regulatory forecasts for uncollectibility risk) continued to exceed the entire irregular portfolio in November, totalling 104.9% of it at the systemic level (-7 p.p. monthly and +13.8 p.p. y.o.y.).
IV. Liquidity and solvency
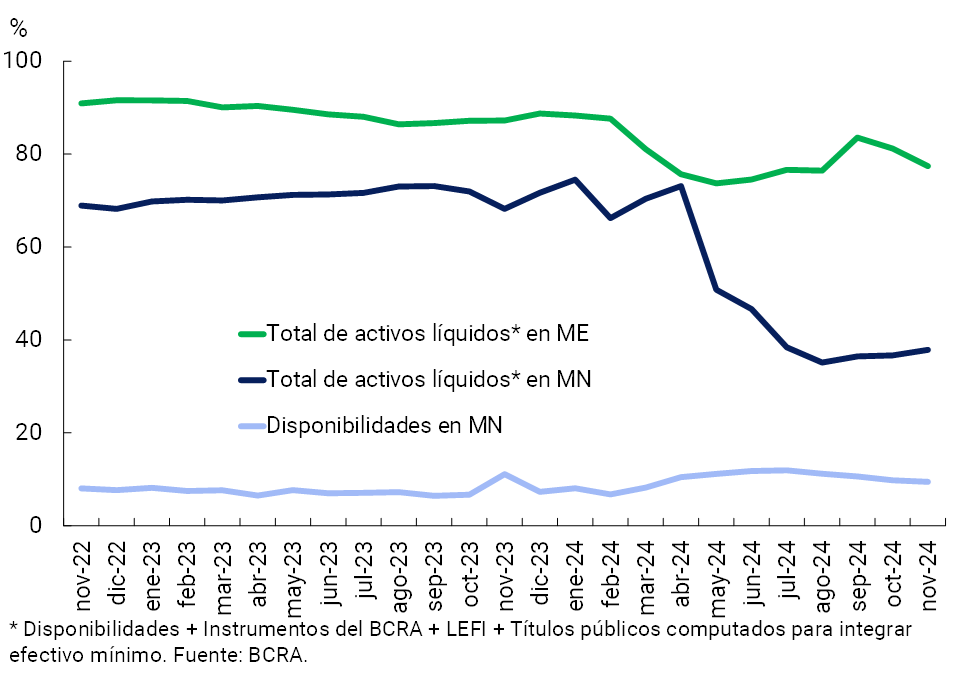
At the end of November, the broad sense liquidity in national currency of all financial institutions reached 37.9% of deposits in that denomination, increasing 1.2 p.p. compared to the previous month (see Chart 11)8 9. This increase was due to a greater holding of LEFI and public securities used to integrate minimum cash, in a context in which the liquidity indicator that exclusively considers the balance of availabilities in pesos on deposits in the same denomination fell slightly in the period (to 9.5% in November). On the other hand, from high levels, the liquidity ratio in foreign currency fell in the month (-3.8 p.p. of deposits in foreign currency, to 77.4%). In line with the expansion of credit to the private sector that has been observed, the broad liquidity indicator fell in year-on-year terms at the systemic level, both for the segment in domestic currency (-30.3 p.p. y.o.y.) and foreign currency (-9.8 p.p. y.a.)
Figure 11 | Liquidity
indicators Financial system – As % of deposits in each denomination
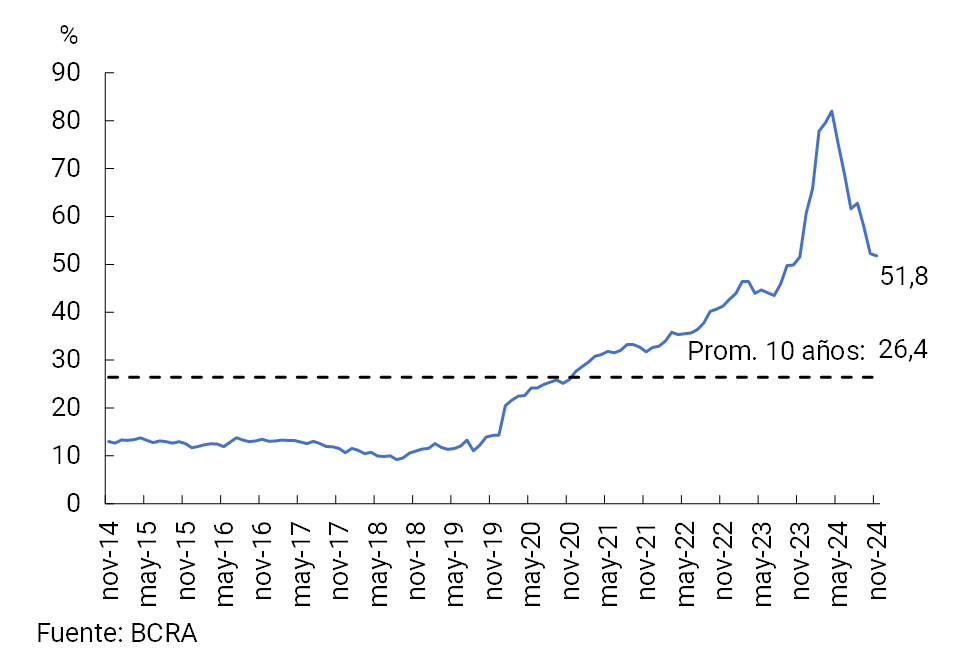
In November, the regulatory capital ratio (CPR) as a percentage of risk-weighted assets (RWA) in the financial system remained unchanged, remaining at relatively high levels (33%, see Chart 12, compared to an average of 22% over the past 10 years). This performance occurred in a context in which the PRC and RWAs of the aggregate set of entities grew by around 3% in real terms in the month. In this context, in November the excess regulatory capital (integration minus demand) of the financial system totaled 314% of the regulatory requirement and 51.8% of the balance of credit to the private sector (net of forecasts). With respect to this last indicator, in April there was a maximum (82%), from which a pattern of decline was consolidated (see Graph 13), mainly associated with the reactivation of credit (with a direct effect on the denominator and on the numerator -through a greater capital requirement derived from the growth of RWA-). In addition, since April there has also been a moderation in the PRC, in the context of the decline in profitability in the sector.
Figure 12 | Capital Integration
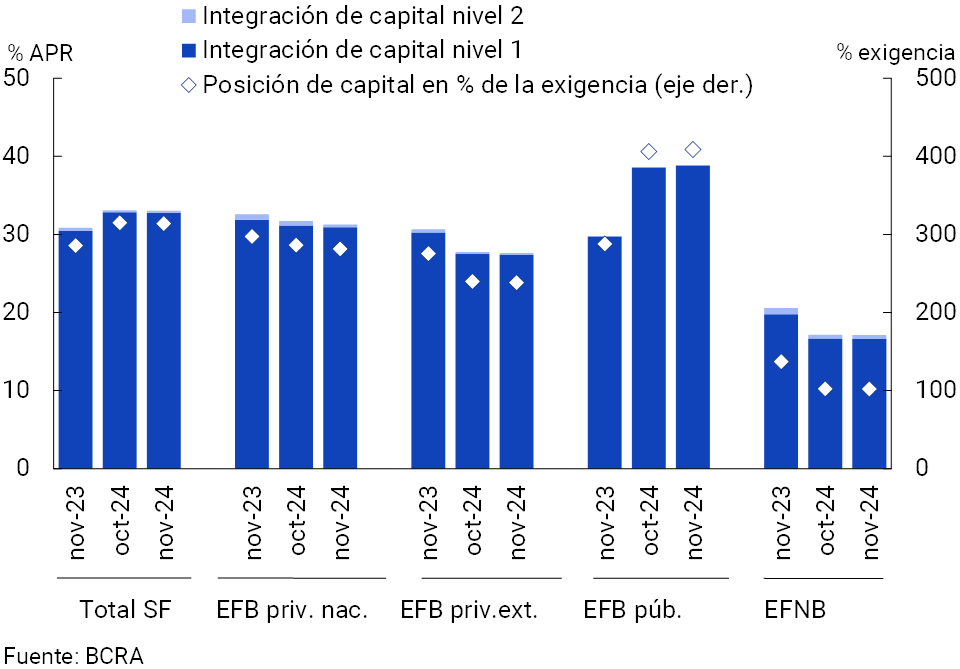
Figure 13 | Excess regulatory
capital as a % of credit to the private sector – Financial system
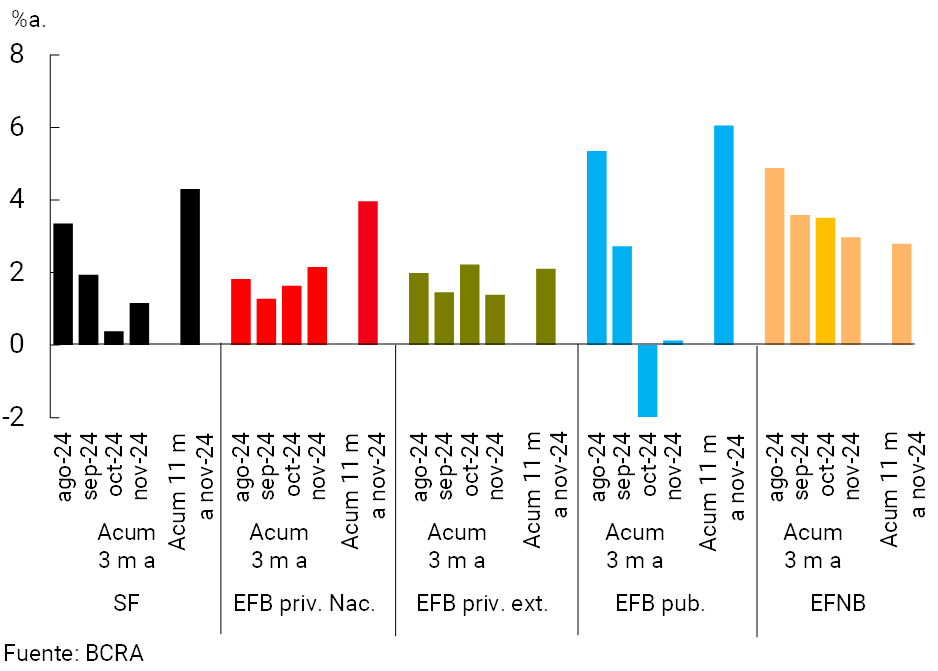
The group of entities obtained positive results in the accumulated of the last 3 months to November, in the order of 1.2% annualized (a.) of assets (ROA) and 4.7% y. of net equity (ROE). The cumulative ROA in the 3 months to November increased slightly compared to the October level (see Chart 14), mainly due to the performance of national public and private banks, in a framework of recomposition of the real comprehensive financial margin. However, the current level of the indicator (cumulative ROA in 3 months) is lower than that of the months prior to October and the cumulative ROA in 11 months of 2024. When considering the cumulative profitability in 11 months of 2024, the aggregate of entities recorded an ROA of 4.3%yr. (in line with that accrued for the same period of 2023) and an ROE of 16.6%yr. (6.3 p.p. lower than that obtained a year ago)10.
Figure 14 | Cumulative ROA (3 and 11 months)
By financial institution group – Annualized
V. Payment system
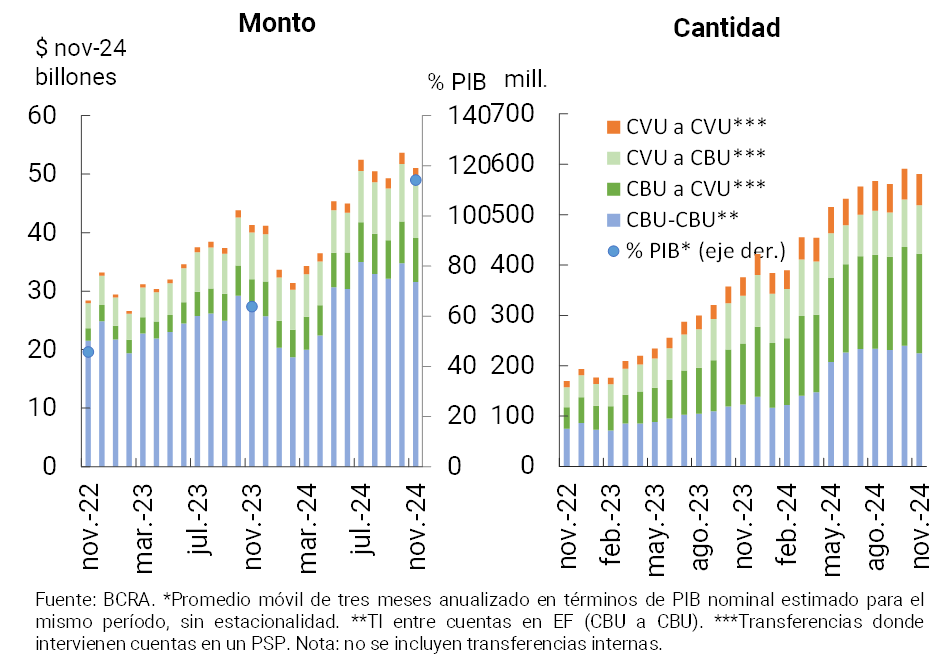
In November, immediate transfers (TI) decreased in amounts (-2.5%) and in real amounts (-6.4%). However, in the last twelve months, IT expanded significantly: 53.2% in quantity and 23.4% in real amounts (see Graph 15). The year-on-year performance was mainly driven by transactions between bank accounts (from CBU to CBU) and, to a lesser extent, by transactions between accounts in payment service providers (from CVU to CVU)11 12. In the last 12 months, IT significantly increased its weight in the economy, representing approximately 114.3% of GDP (+50.5 p.p. y.o.y.).
Figure 15 | Instant Transfers (TI)
In the month, Payment with Transfer (PCT) operations through QR codes grew 6.7% in amounts and 10.6% in real amounts. In year-on-year terms, these operations accumulated an increase of 133.4% in quantities and 109.7% in real amounts. Although they start from limited levels, it is estimated that PCTs with QR grew 1.1 p.p. of GDP in the last year to total 1.7%.
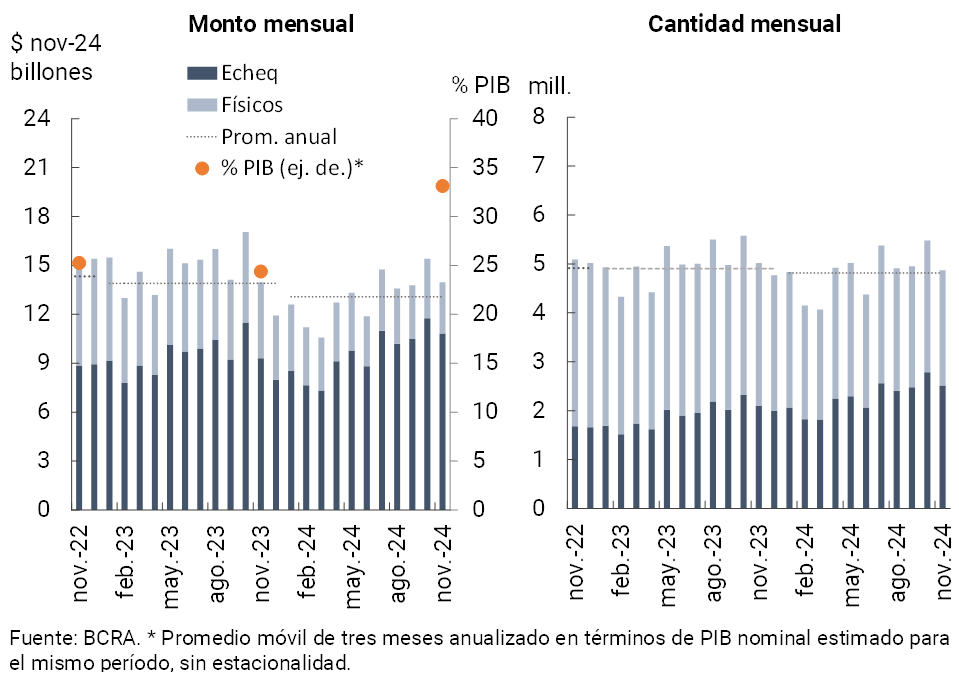
In November, the clearing of checks decreased in amounts (-11.2%) and in real amounts (-9.3%) compared to the previous month (see Chart 16)13. In this context, ECHEQs continue to consolidate themselves as the predominant modality, with a year-on-year growth of 20.2% in quantities and 16.3% in real amounts. Based on this performance, the ECHEQs already represent 51.7% of the amount and 77.5% of the total amounts compensated in November. This year-on-year advance in the use of ECHEQs led to explain the increase in the weight of the amount of check clearing in the economy, which in the last 3 months represented approximately 33.1% of GDP (+8.7 p.p. y.o.y.).
Figure 16 | Check clearing
The ratio of rejection of checks due to lack of funds (measured in terms of the total compensated) showed an increase compared to the previous month both in amounts (+0.06 p.p.) and in real amounts (+0.02 p.p.), to stand at 0.71% and 0.49%, respectively. Both records are slightly above the average observed so far in 2024 and in a comparison with the same month of the previous year (+0.08 p.p. in quantities and +0.04 p.p. in amounts).
References
1 Includes principal adjustments and accrued interest.
2 Financing to companies is defined here as that granted to legal entities and commercial financing granted to natural persons. On the other hand, loans to families are considered to be those granted to individuals, unless they are for commercial purposes.
3 The increase in time deposits was mainly explained by deposits arranged at a fixed interest rate (+8.3% in real terms in the month). Demand performance was driven mainly by the non-interest-bearing segment.
4 Includes off-balance sheet foreign currency forward purchase and sale transactions. Liabilities include deposits that have variable remuneration depending on the evolution of the exchange rate – associated with the Export Increase Programme – and LEDIV are included in assets.
5 At the systemic level, credit to the private sector grew by 5.2% in real terms and total assets increased by 1.5% in real terms.
6 Exposure to the private sector net of forecasts stood at 31.9% for the financial system as a whole (+1.2 p.p. monthly, +11.2 p.p. compared to January 2024 and +4.7 p.p. y.o.y.).
7 To assign the geographical area, the debtor’s tax domicile (according to ARCA) is used, regardless of the place where the credit originates. Downtown: CABA, Buenos Aires, Córdoba, Entre Ríos and Santa Fe. Cuyo: Mendoza, La Rioja, San Juan and San Luis. NEA: Corrientes, Chaco, Formosa and Misiones. NOA: Catamarca, Jujuy, Salta, Santiago del Estero and Tucumán. Patagonia: Chubut, Neuquén, La Pampa, Rio Negro, Santa Cruz and Tierra del Fuego.
8 It considers availabilities (cash and current account at the BCRA), fiscal liquidity bills (LEFI), pass operations against the BCRA, holding of BCRA instruments and the balance of the types of public securities that the entities compute as integration of Minimum Cash.
9 When additionally considering the holding of LECAP whose residual term is less than 3 months, the broad indicator of systemic liquidity in national currency would amount to 43.9% of deposits in pesos at the end of November (+0.8 p.p. compared to October).
10 The difference between the year-on-year variations in ROA and ROE accumulated in 11 months lies mainly in the process of reducing leverage (funding with more capital) that the sector evidenced in the period between the two measurements. In other words, the ratio between assets and net worth used for the indicators accumulated in 11 months of 20224 is 3.9 times, when a year ago it was 5.2 times.
11 In year-on-year terms as of November, the amount of IT among CVUs increased 67.4% (51.3% in real amounts), while those among CBUs grew 82.9% (20.8% in real amounts). On the other hand, operations between CBU and CVU registered an increase of 62.6% year-on-year (44.7% in real amounts), while those between CVU and CBU grew more moderately, 1.9% year-on-year (25.7% in real amounts).
12 In November, the average value of IT was $85,100 (being $84,200 for the average of 2024, at November values).
13 In November, the average amount of cleared checks was $2.9 million ($1.3 million in the physical format and $4.3 million in ECHEQs). The average monthly value for 2024 for the total compensated amounted to $2.7 million, at November prices.
Share on


