Executive summary
• The aggregate solvency ratios of the financial system remained at historically high levels in November, with slight increases in the month. The integration of regulatory capital (RPC) represented 17.5% of risk-weighted assets (RWA) (0.1 p.p. more than in October and 2 p.p. in a year-on-year comparison -y.a.-). The PRC was equivalent to approximately double the minimum capital requirement in November (201%). This ratio increased 1.5 p.p. in the month and 19 p.p. compared to November 2018.
• Liquidity in the financial system remained at high levels, with additional increases in November. The broad liquidity ratio stood at 57.3% of total deposits in the month (55.4% for items in pesos and 62.3% in the foreign currency segment), 1.7 p.p. more than in October and 3.3 p.p. more in a year-on-year comparison.
• The balance of deposits in pesos in the private sector grew 1.1% in real terms in November (+5.4% nominal), with increases in time deposits (+1.4% real, +5.7% nominal) and demand accounts (+1% real, +5.3% nominal). Private sector deposits in foreign currency continued to slow their monthly rate of decline, declining 3.4% in November – in home currency. In this context, private sector deposits accounted for 58.2% of total funding (liabilities plus equity), 0.6 p.p. more than in October and 3.5 p.p. more than in November 2018.
• In November, loans to the private sector fell: 2.1% in real terms (+2.1% nominal) in the segment in pesos, and 7.4% in foreign currency (in the currency of origin). Credit to households and companies accounted for 42.4% of the aggregate financial system’s assets in November, down 0.9 p.p. from last month and 0.1 p.p. higher y.a. In order to boost credit, at the beginning of 2020 the BCRA ordered the relaxation of reserve requirements for entities that finance MSMEs at an interest rate of no more than 40% nominal per annum, and for entities that are adhered to the “Ahora 12” program1.
• The ratio of irregularity of financing to the private sector reached 5% in the month, increasing 0.2 p.p. compared to October (+2.2 p.p. y.o.y.). The NPL ratio for loans to households remained unchanged at around 4.4% (+0.5 p.p. y.o.y.), while that of companies increased 0.4 p.p. to 5.7% (+3.5 p.p. y.o.y.). The default rate on mortgage loans to households continued at relatively low values in the month: 0.6% of the portfolio for those denominated in UVA and 0.8% for the rest.
• The net balance of provisions for those constituted on the portfolio of loans in a regular situation represented 79% of the irregular portfolio of the private sector (a ratio that reaches 99% if the total provisions for the private sector are considered). It is estimated that the irregular portfolio not covered with forecasts represented only 4% of the PRC in the month.
• In November, the financial system recorded nominal gains equivalent to 4.9% annualized (a) of assets (ROA) and 36.9% y/y of net worth (ROE). In the cumulative 12 months to November, the banks as a whole accrued in nominal terms an ROA of 5% and an ROE of 43.9%.
I. Financial intermediation activity
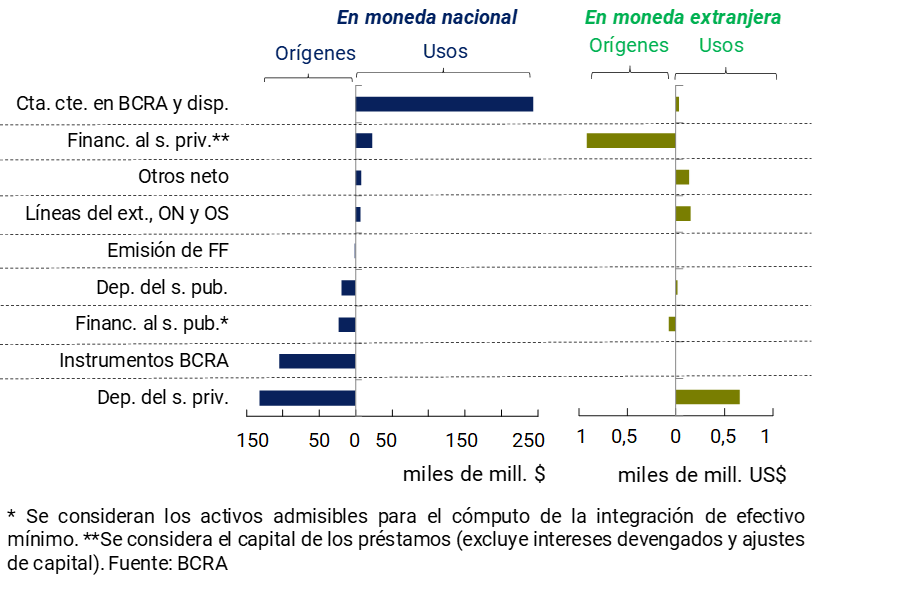
In terms of the estimated monthly flow of funds based on balance sheet items in national currency, the increase in private sector deposits and the reduction in the holding of BCRA instruments were the main sources of funds for the financial system in November (see Chart 1). These resources were almost entirely applied to increase the balance in the current accounts at the BCRA. In relation to items in foreign currency, in the month the decrease in credit and deposits from the private sector were the main sources and uses of funds by banks, respectively.
Graph 1 | Nov-19 Cash Flow Estimate
Financial System – By Currency
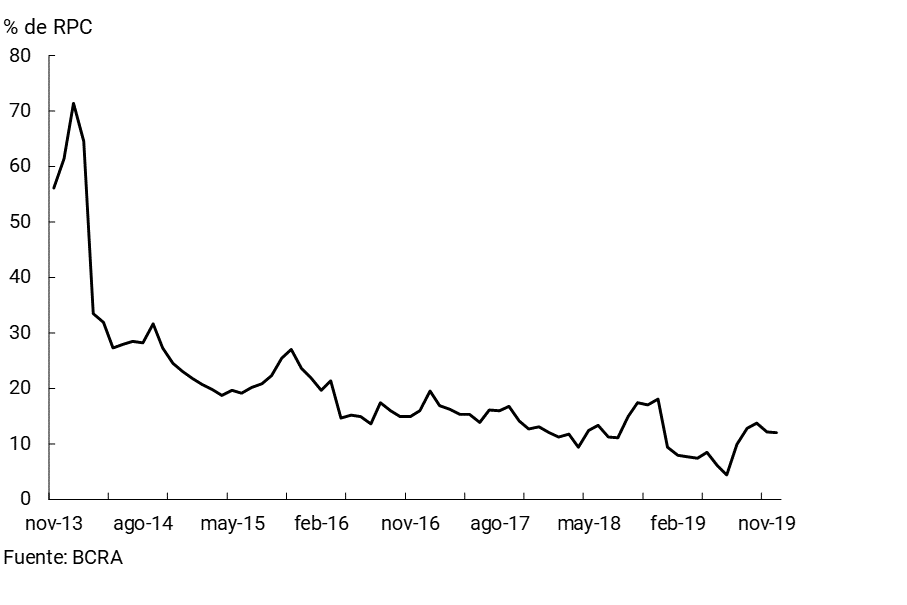
Given the aforementioned variations, the total assets of the financial system fell by 2.5% in real terms (+1.6% nominal) in November and by 22.7% in real year-on-year terms (+17.6% nominal YoY). On the other hand, foreign currency assets totaled 26.7% of the total assets of the financial system in the month – 1.4 p.p. less than in October 2019 and November 2018 – while foreign currency liabilities represented 25.2% of total funding – decreasing 1.3 p.p. and 2 p.p. compared to the previous month and the same period in 2018. respectively. The spread between assets and liabilities in foreign currency – including forward purchase and sale transactions – of the banks as a whole stood at 12% of the PRC, decreasing 6.2 p.p. compared to the November 2018 figure (see Chart 2).
Graph 2 | ME Asset – ME Liability + ME Forward Position
Financial system
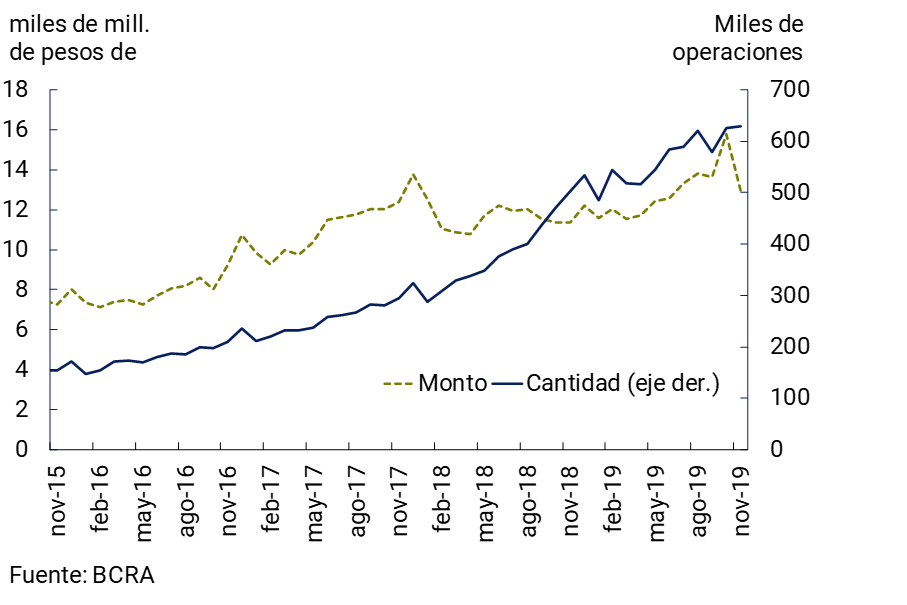
With respect to the operations of the National Payment System, in November the amount of immediate transfers fell in real terms, in a context in which the number of operations did not show significant changes compared to October (see Graph 3). Despite this performance, the value and average daily amount traded in the month through this electronic means of payment expanded 14.2% year-on-year in real terms in amounts and 23.5% in amounts, respectively.
Graph 3 | Immediate Funds Transfers
Daily average
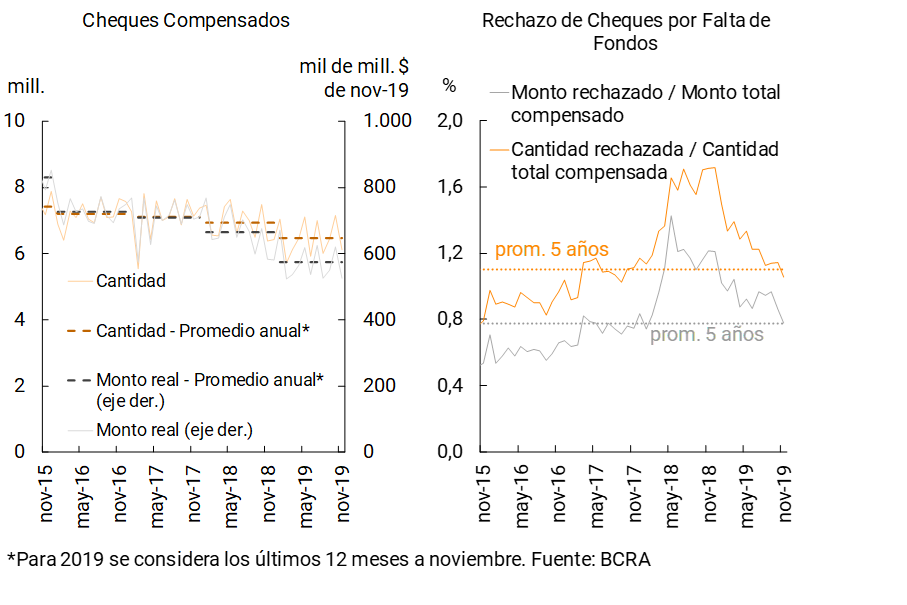
In November, check clearing was lower than October’s record and the annual average. In this context, the rejection of checks due to lack of funds in terms of the total compensated fell in the month, thus reaching values similar to the average of the last 5 years (see Graph 4). In the month, this indicator totaled 1.1% for quantities (-0.1 p.p. monthly and -0.7 p.p. y.o.y.) and 0.8% for securities (-0.1 p.p. monthly and -0.4 p.p. y.o.y.).
Figure 4 | Check clearing and rejection
II. Deposits and liquidity
In November, private sector deposits in pesos increased 1.1% in real terms (+5.4% nominal, see Chart 5), due to the performance of both time deposits (+1.4% real, +5.7% nominal) and demand accounts (+1% real, +5.3% nominal). Private sector deposits in foreign currency slowed their contraction rate compared to the previous three months, decreasing 3.4% between peak months – in currency of origin. Public sector deposits fell by 1.5% in real terms (+2.7% nominal) in November. In this context, the balance of total deposits in the financial system decreased by 1.6% in real terms in November (+2.6% nominal).
Graph 5 | Private Sector Deposit Balance – Monthly Change*
In year-on-year terms, the balance of private sector deposits in pesos fell by 10.6% in real terms (+36% YoY in nominal terms), reflecting a decrease of 17.5% YoY in term placements (+25.5% YoY nominal) and 3.2% YoY in demand balances (+47.2% YoY nominal). For their part, private sector deposits in foreign currency fell by 32.9% YoY – in the currency of origin. Total public sector deposits also fell in real terms compared to November 2018. The balance of total deposits in banks fell by 26% YoY in real terms (+12.6% YoY in nominal terms) in the period.
In November, the share of private sector deposits in the total funding (liabilities and net worth) of the financial system stood at 58.2%, 0.6 p.p. more than in October and 3.5 p.p. more than in November 2018.
The financial system continued to show high levels of liquidity in November. The broad liquidity ratio2 stood at 57.3% of total deposits in the month (55.4% for items in pesos and 62.3% in the foreign currency segment), 1.7 p.p. above the previous month’s figure (see Chart 6). In November, the composition of liquid assets in pesos changed based on the increase in the balance in current accounts at the BCRA and the reduction of the LELIQ3. This occurred within the framework of the modifications adopted in a timely manner in the matter of Minimum Cash4. In year-on-year terms, the broad liquidity ratio grew by 3.3 p.p. (+2.6 p.p. y.o.y. in the segment in local currency and +5.5 p.p. y.o. for items in foreign currency).
Graph 6 | Liquidity of the financial system
In % of deposits

III. Credit and Portfolio Quality
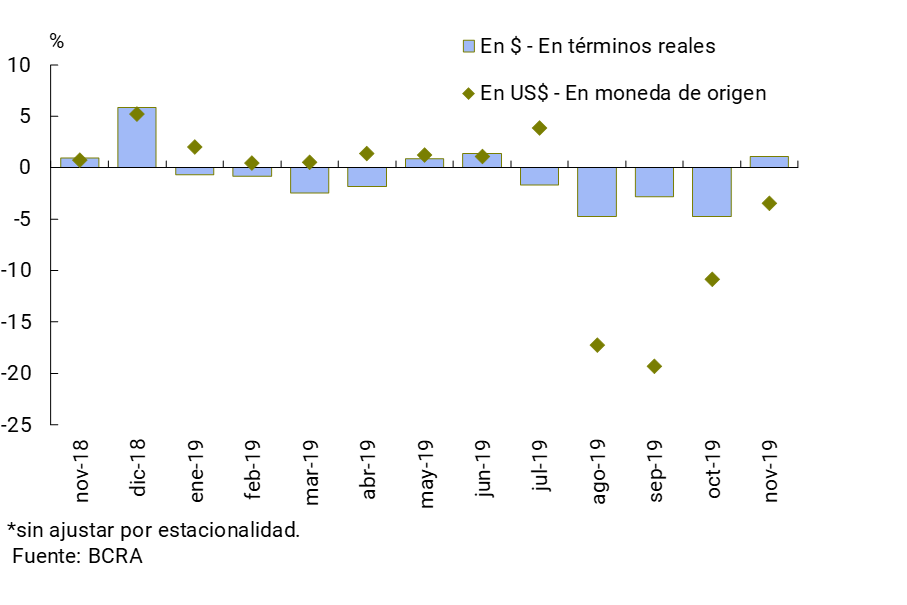
The balance of credit in pesos to the private sector fell by 2.1% in real terms in November (+2.1% nominal, see Chart 7)5. Within this segment, almost all credit lines showed declines in real terms, with the exception of credit cards. The balance of credit in foreign currency fell 7.4% compared to October – in the currency of origin – basically explained by pre-financing of exports.
Figure 7 | Private sector credit balance by currency*
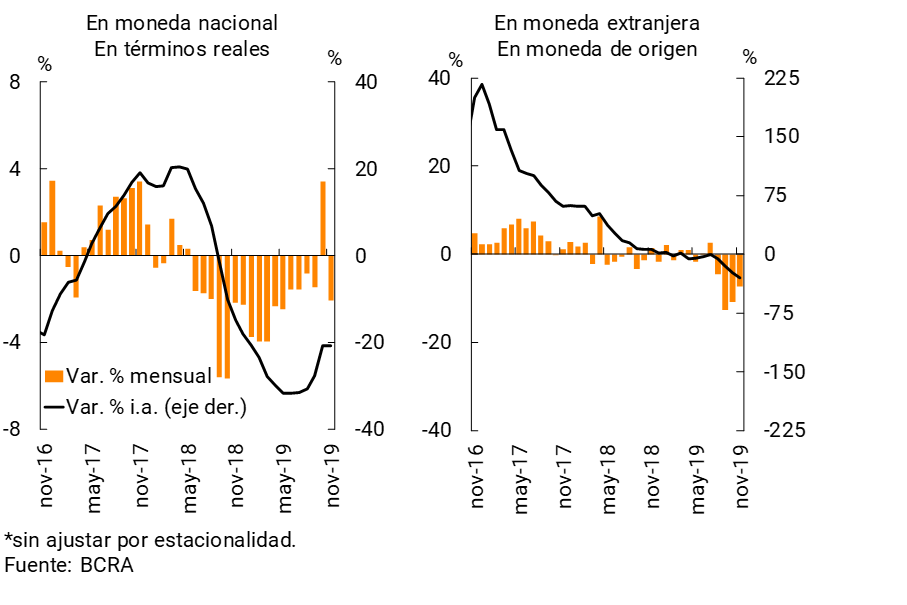
In a year-on-year comparison, credit in pesos to the private sector fell 20.7% in real terms in November, while credit in foreign currency decreased 29.9% y.o.y.
In November, the total credit balance to companies (in domestic and foreign currency) fell by 5.8% in real terms compared to October (-1.8% nominal) and by 24% in real terms compared to November 20186.
The monthly variation was mainly explained by credit to industry. On the other hand, the balance of financing to households (in domestic and foreign currency) decreased 1.8% in real terms in the month (+2.3% nominal) and 18.5% in real y.a., with a greater relative fall in pledge and personal lines.
Credit to the private sector accounted for 42.4% of the total assets of the aggregate financial system in November, down 0.9 p.p. from last month. The monthly performance was mainly explained by foreign private banks. This indicator remained slightly above (+0.1 p.p.) the value of November 2018.
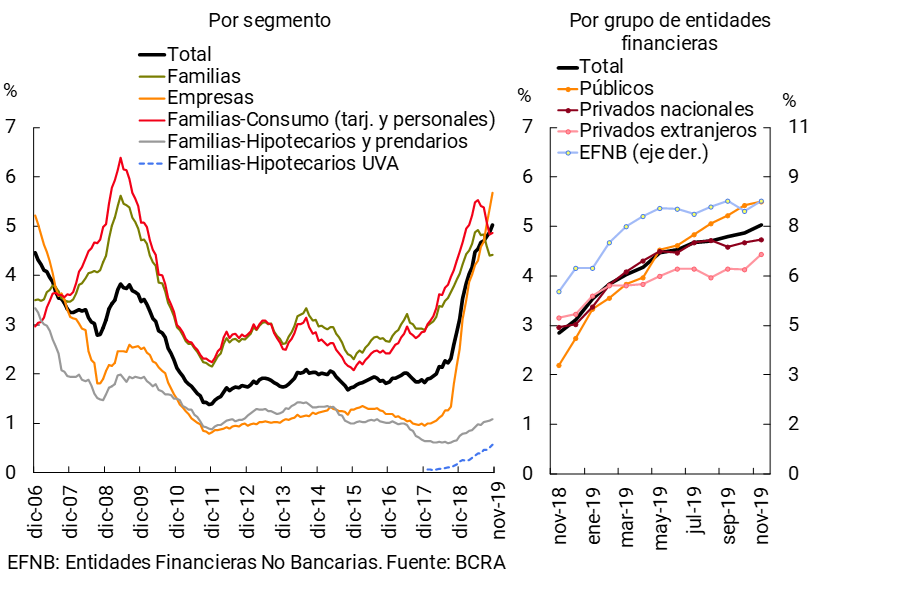
The irregularity ratio of financing to the private sector reached 5% in the month, increasing 0.2 p.p. compared to October (+2.2 p.p. y.o.y.) (see Graph 8). The NPL ratio for loans to households remained unchanged in the month (+0.5% YoY) at around 4.4%, while the non-performing loan ratio for loans to companies increased by 0.3 p.p. in the period (+3.5 p.p. YoY) to 5.7%. Non-performing loans on mortgage loans to households remained relatively low: 0.6% of the portfolio for those denominated in UVA and 0.8% for the rest7.
Figure 8 | Irregularity of credit to the private sector
Irregular financing / Total financing (%)
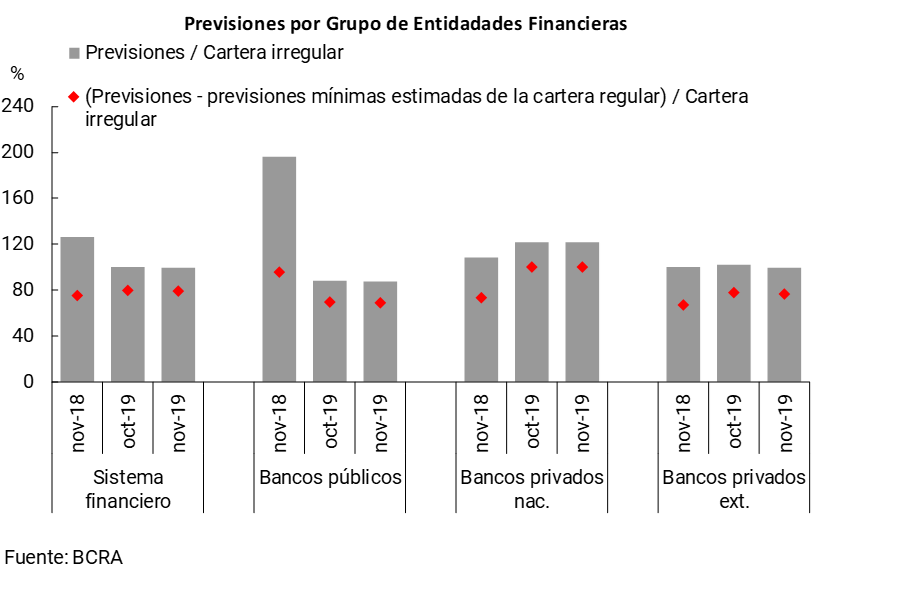
In November, the balance of the net forecasts of those constituted on the portfolio of loans to the private sector in a regular situation (according to the regulatory minimum) represented 79% of the irregular portfolio of the private sector, 0.4 p.p. less than in October (see Graph 9). Taking into account the balance of total accounting forecasts (both those originated by the regular and irregular portfolio), the forecast quotient on irregular loans to the private sector represented 99%. It is estimated that the unhedged irregular portfolio with forecasts was equivalent to 4% of the PRC in November (7.8% of excess regulatory capital), increasing 0.1 p.p. compared to October and 0.8 p.p. y.o.y.
Figure 9 | Forecasting of the Financial System
In November, financing to the public sector of the banks as a whole represented 10.1% of total assets, 0.3 p.p. less than in October and 0.8 p.p. below the figure for November 2018. For its part, the exposure of the financial system to the public sector net of the balance of deposits in this sector remained in negative territory in the month (-1.5% of total assets).
IV. Solvency
The solvency indicators of the financial system increased slightly in November. Capital integration (RPC) totaled 17.5% of risk-weighted assets (RWA) in the month, 0.1 p.p. more than in October and 2 p.p. higher in a year-on-year comparison (see Chart 10). Almost 90% of total integration continues to be accounted for by Tier 1 8capital. The financial system’s PRC was equivalent to approximately twice the minimum capital requirement in November (201%). This ratio increased 1.5 p.p. in the month and 19 p.p. compared to November 2018.
Figure 10 | Integration of regulatory capital

In November, the banks as a whole accrued nominal profits equivalent to 4.9% annualized (y.) of assets (ROA) and 36.9% y/y of net worth (ROE). Over the 12 months to date, the financial system accumulated a nominal ROA of 5% and a nominal ROE of 43.9% (see Chart 11)9.
Figure 11 | Profitability of the financial system
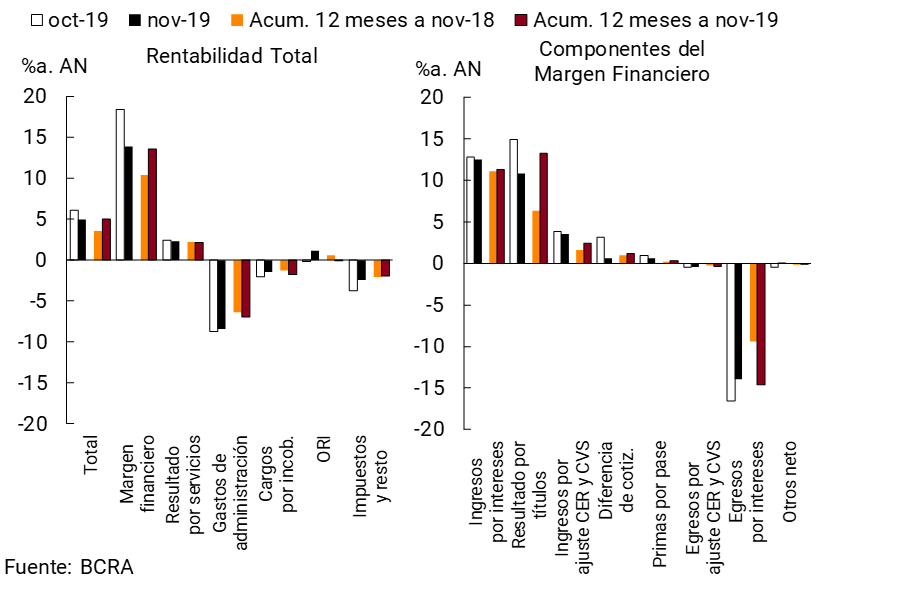
The financial margin of the banks as a whole decreased by 4.4 p.p. of assets in November, to 13.9%a. Lower results due to securities and price differences explained the monthly drop, which was partially offset by the reduction in interest expenses. In the cumulative period between December 2018 and November 2019, banks’ financial margin totalled 13.5% of assets, +3.1 p.p. y.a.
In the month, net income from services in the financial system represented 2.2% of assets, 0.2 p.p. less than in October. Considering the accumulated 12 months to November, these results reached 2.1% of assets, falling 0.1 p.p. y.a.
Administrative expenses of the banks as a whole totaled 8.5% y/y of assets in the month, 0.3 p.p. less than in October. In the accumulated 12 months to November, these expenditures represented 6.9% of assets, increasing 0.6 p.p. y.o.y. On the other hand, in November, charges for uncollectibility reached 1.4% y/y. of assets, 0.6 p.p. less than in October. In line with the evolution of the quality of the loan portfolio, in the accumulated of the last twelve months to November, bad debt charges represented 1.7% of assets, 0.4 p.p. more in a year-on-year comparison.
References
1 For more details see Communication A6857 and Communication A6858” or by clicking “HERE”
2 Availability, integration of minimum cash and BCRA instruments, in national and foreign currency.
3 Both for holdings and for pass operations with the BCRA.
4 As of November, the integration with LELIQ of reserve requirements on demand deposits was no longer admitted. See Communication A6817.
5 Includes principal adjustments and accrued interest.
6 Information extracted from the Central Debtors (national and foreign currency). Loans to residents abroad are not included. Adjustments in principal and accrued interest are considered. Business financing is defined here as that granted to legal entities and commercial financing channeled to individuals. On the other hand, loans to families are considered to be those granted to individuals, unless they are for commercial purposes.
7 As of November, out of a total of 103,609 – estimated data – mortgage financing in UVA granted to individuals in the financial system (73% generated by public banks, 16% by national private banks and 11% by foreign private banks), 781 were in an irregular situation.
8 Tier 1 capital is the capital with the greatest capacity to face unexpected losses, composed mainly of common shares and earnings.
9 The results consider the other comprehensive results (ORI) item.
Share on


