I. Recent measures2
In order to simplify the minimum cash regime and promote the extension of the term of deposits, in December the BCRA modified the structure of liquidity requirements. 3 For Group “A” entities4 and for branches or subsidiaries of foreign banks classified as systemically important (G-SIBs) not included in Group “A”, a minimum cash requirement was established for demand deposits of 30% to be integrated in pesos, 5% to be integrated into BOTES 2020 and 10% integrable into LELIQ. 5 For fixed-term deposits in such institutions of up to 29 days of residual term, these percentages were established at 17%, 5% and 13%, respectively. These requirements are reduced as the term of the deposits increases, reflecting the lower risk implied by the longer duration of the deposits. 6 For Group “B” entities, a cash requirement of 20% was established for demand deposits, 14% for deposits with a residual term of up to 29 days, 10% for deposits with a residual term of between 30 and 59 days, 5% for deposits with a residual term of between 60 and 89 days, and 0% for terms longer than 90 days. These modifications in the minimum cash regime have no impact on the total requirement or on the monetary base.
In order to continue promoting the renewal of the circulating currency with images of animals native to Argentina, in December the $100 bill with the image of the taruca, the $2 coin with the image of the drunken stick and the $10 coin with the image of the caldén were put into circulation. 7
II. Activity
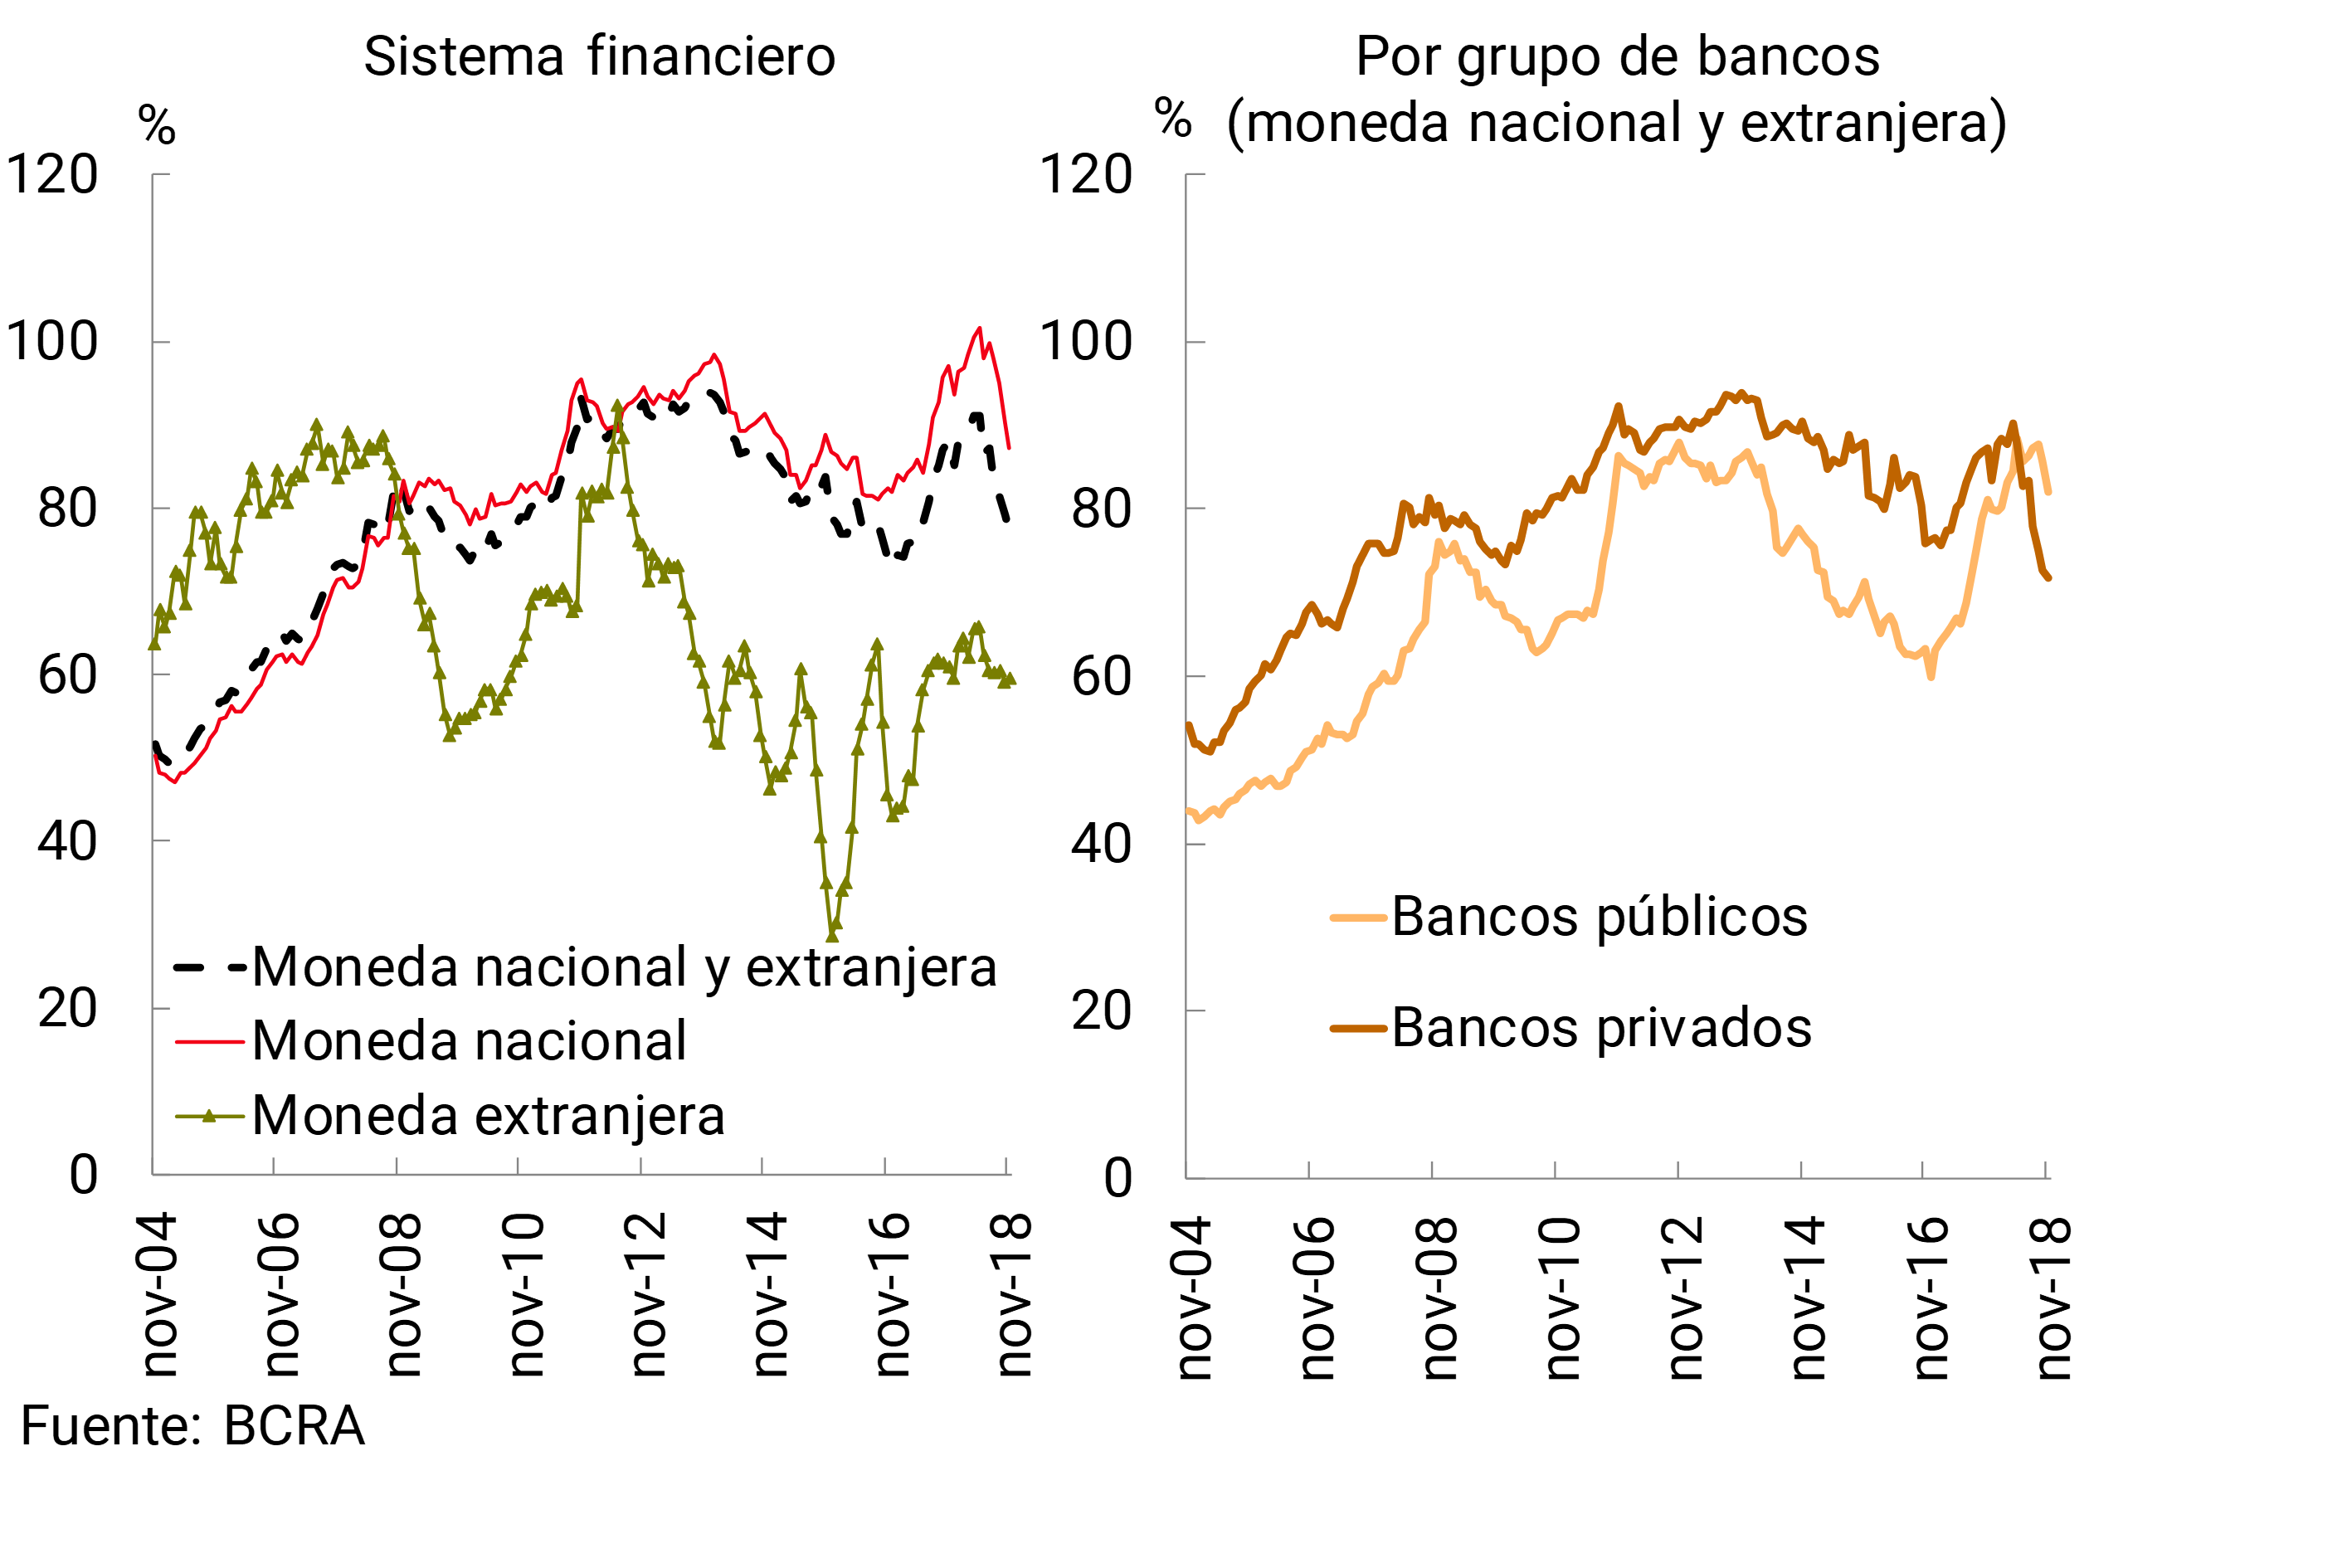
In November, the evolution of financial intermediation with the private sector continued to be moderate. As in recent months, deposits exhibited a better relative performance in relation to loans (see Chart 1). Thus, the ratio between the two variables (loans/deposits) fell for the fourth consecutive month to a total of 77% for banks as a whole. In this context, the assets of the financial system grew 2.5% in real terms.
Graph 1 | Loans in Deposit Terms – Balance Sheet Balances – Private Sector
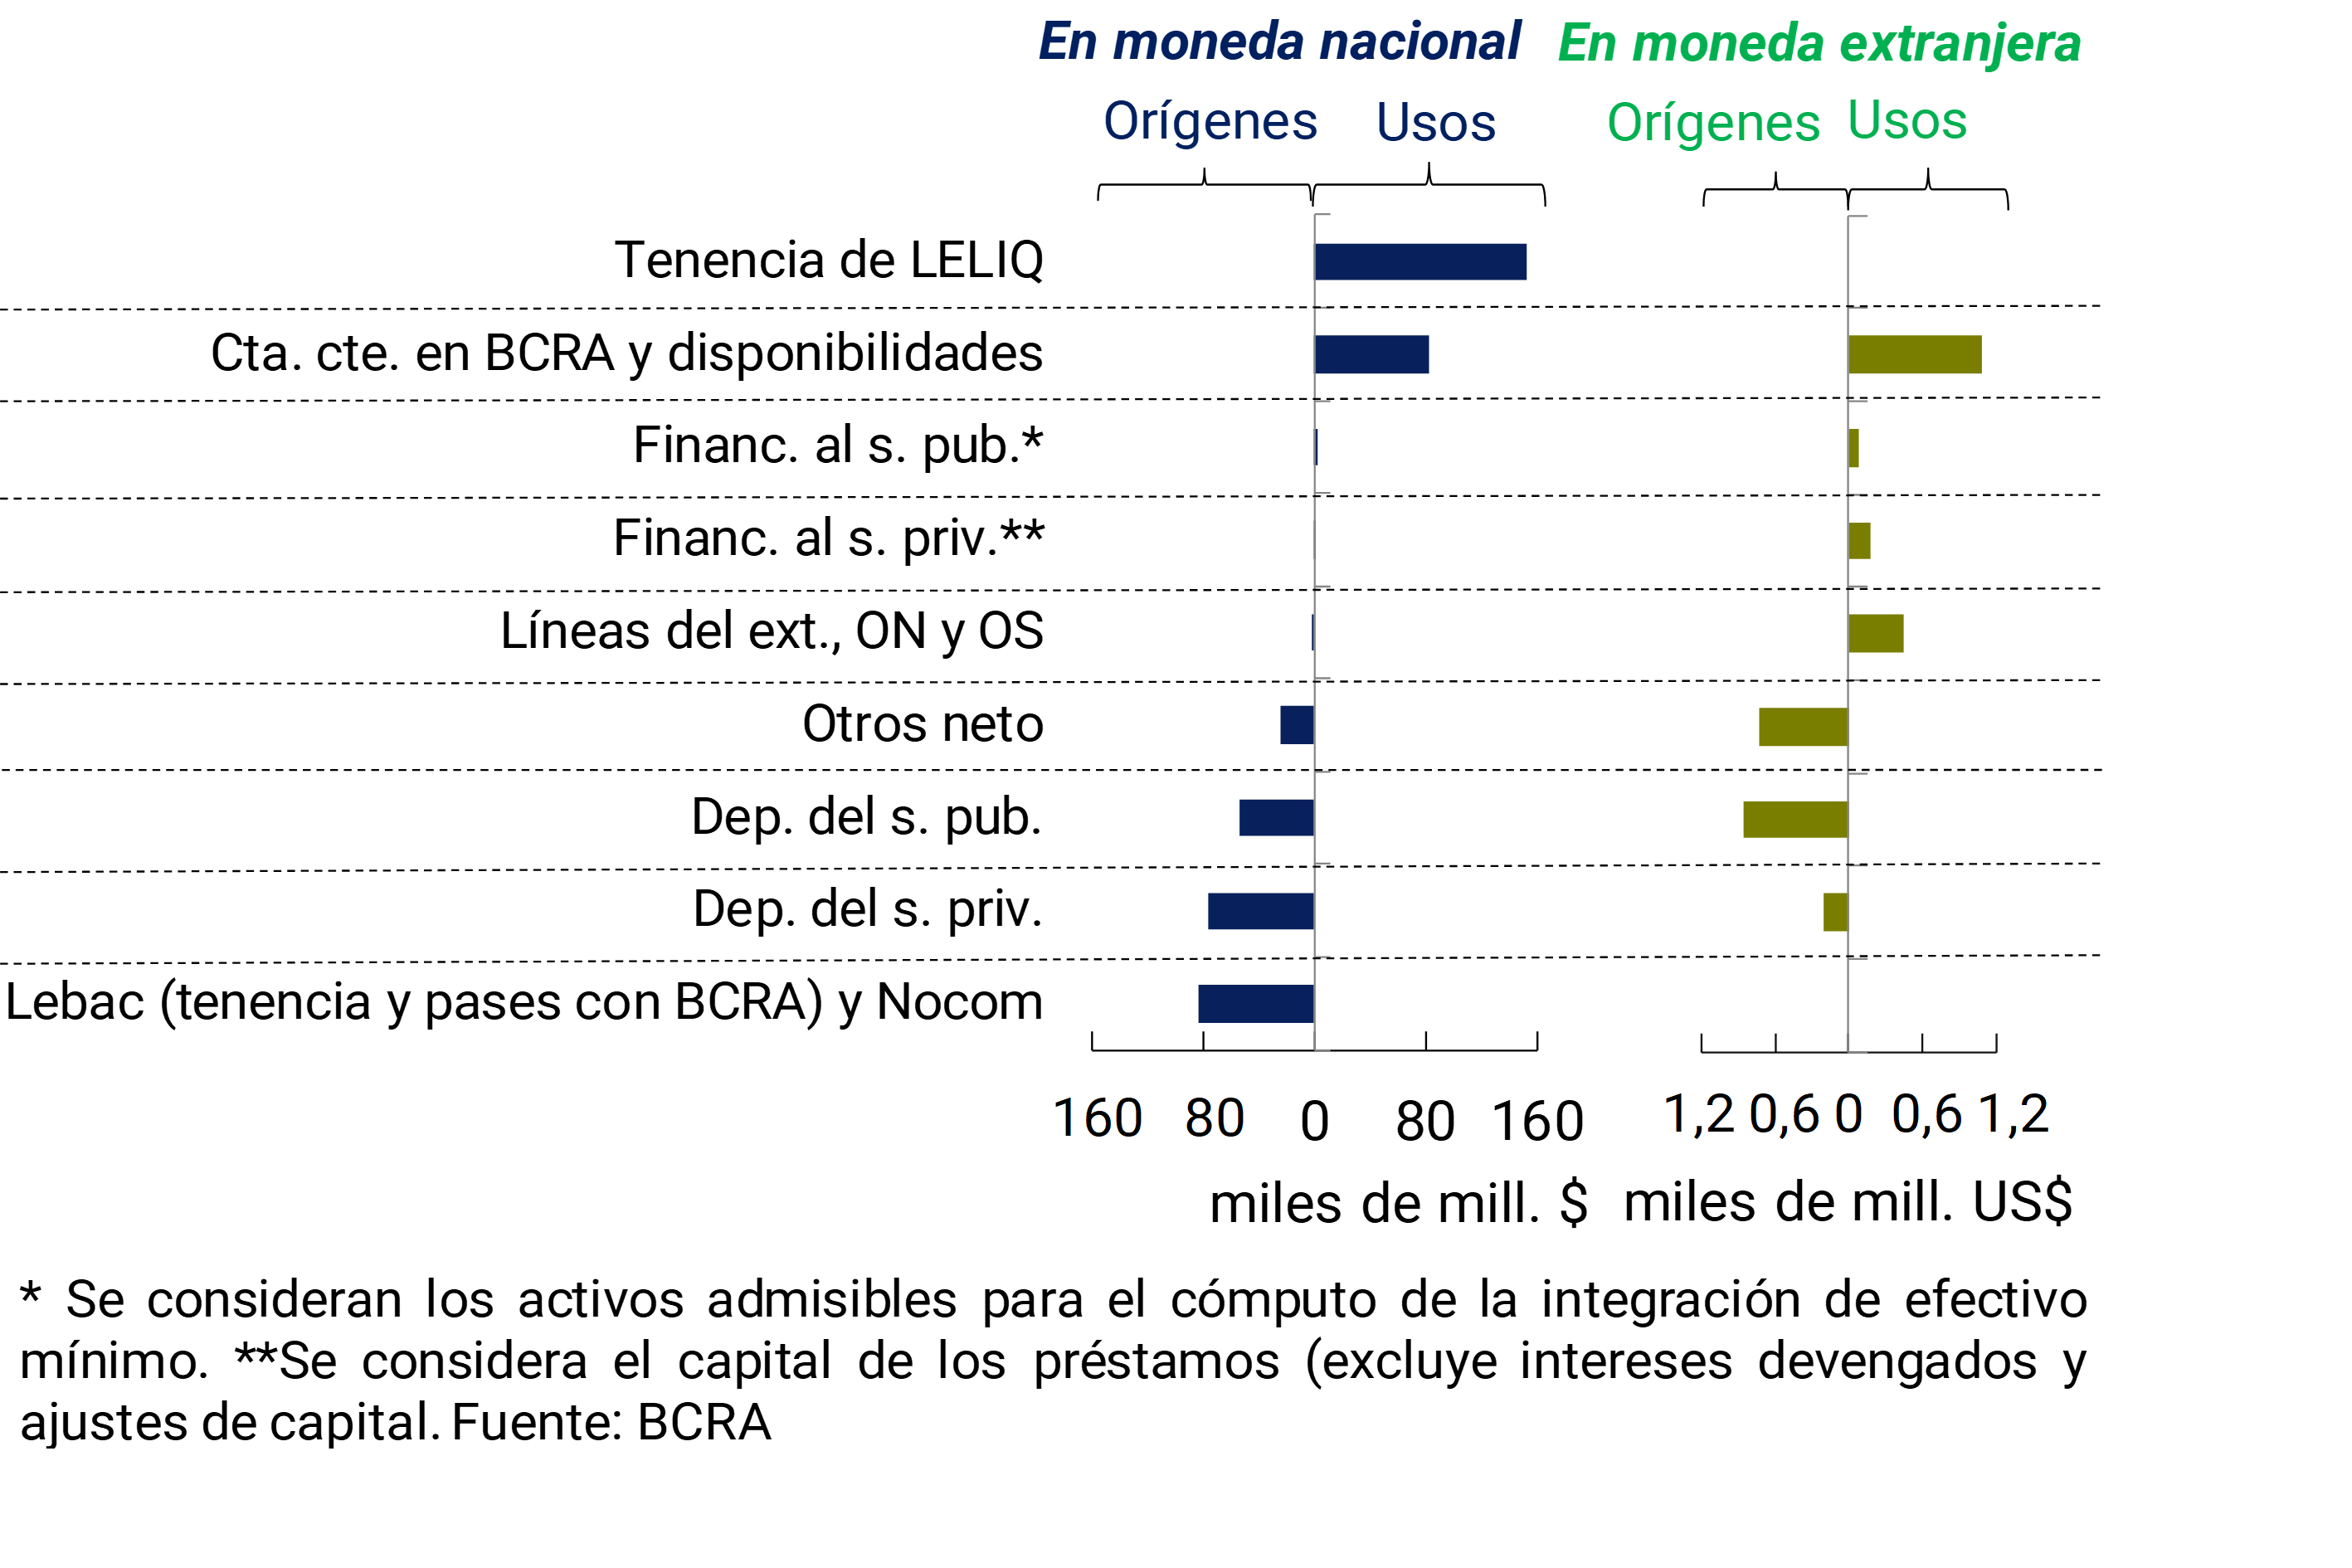
Based on the estimate of the monthly flow of funds for the items in national currency of the financial system, the reduction in LEBAC holdings ($83,400 million) and the increase in deposits from the private ($75,800 million) and public sector ($54,100 million) were the main sources of funds in November (see Graph 2). 8 These resources were mainly used to increase the balance of LELIQ ($152,900 million) and the current accounts that banks have in the BCRA ($82,700 million). On the other hand, considering the flow of funds for foreign currency items, in November the increase in public sector deposits and liquidity as the main source of resources and application of funds respectively stood out.
Graph 2 | Nov-18 Cash Flow Estimate – Financial System – By Source Currency
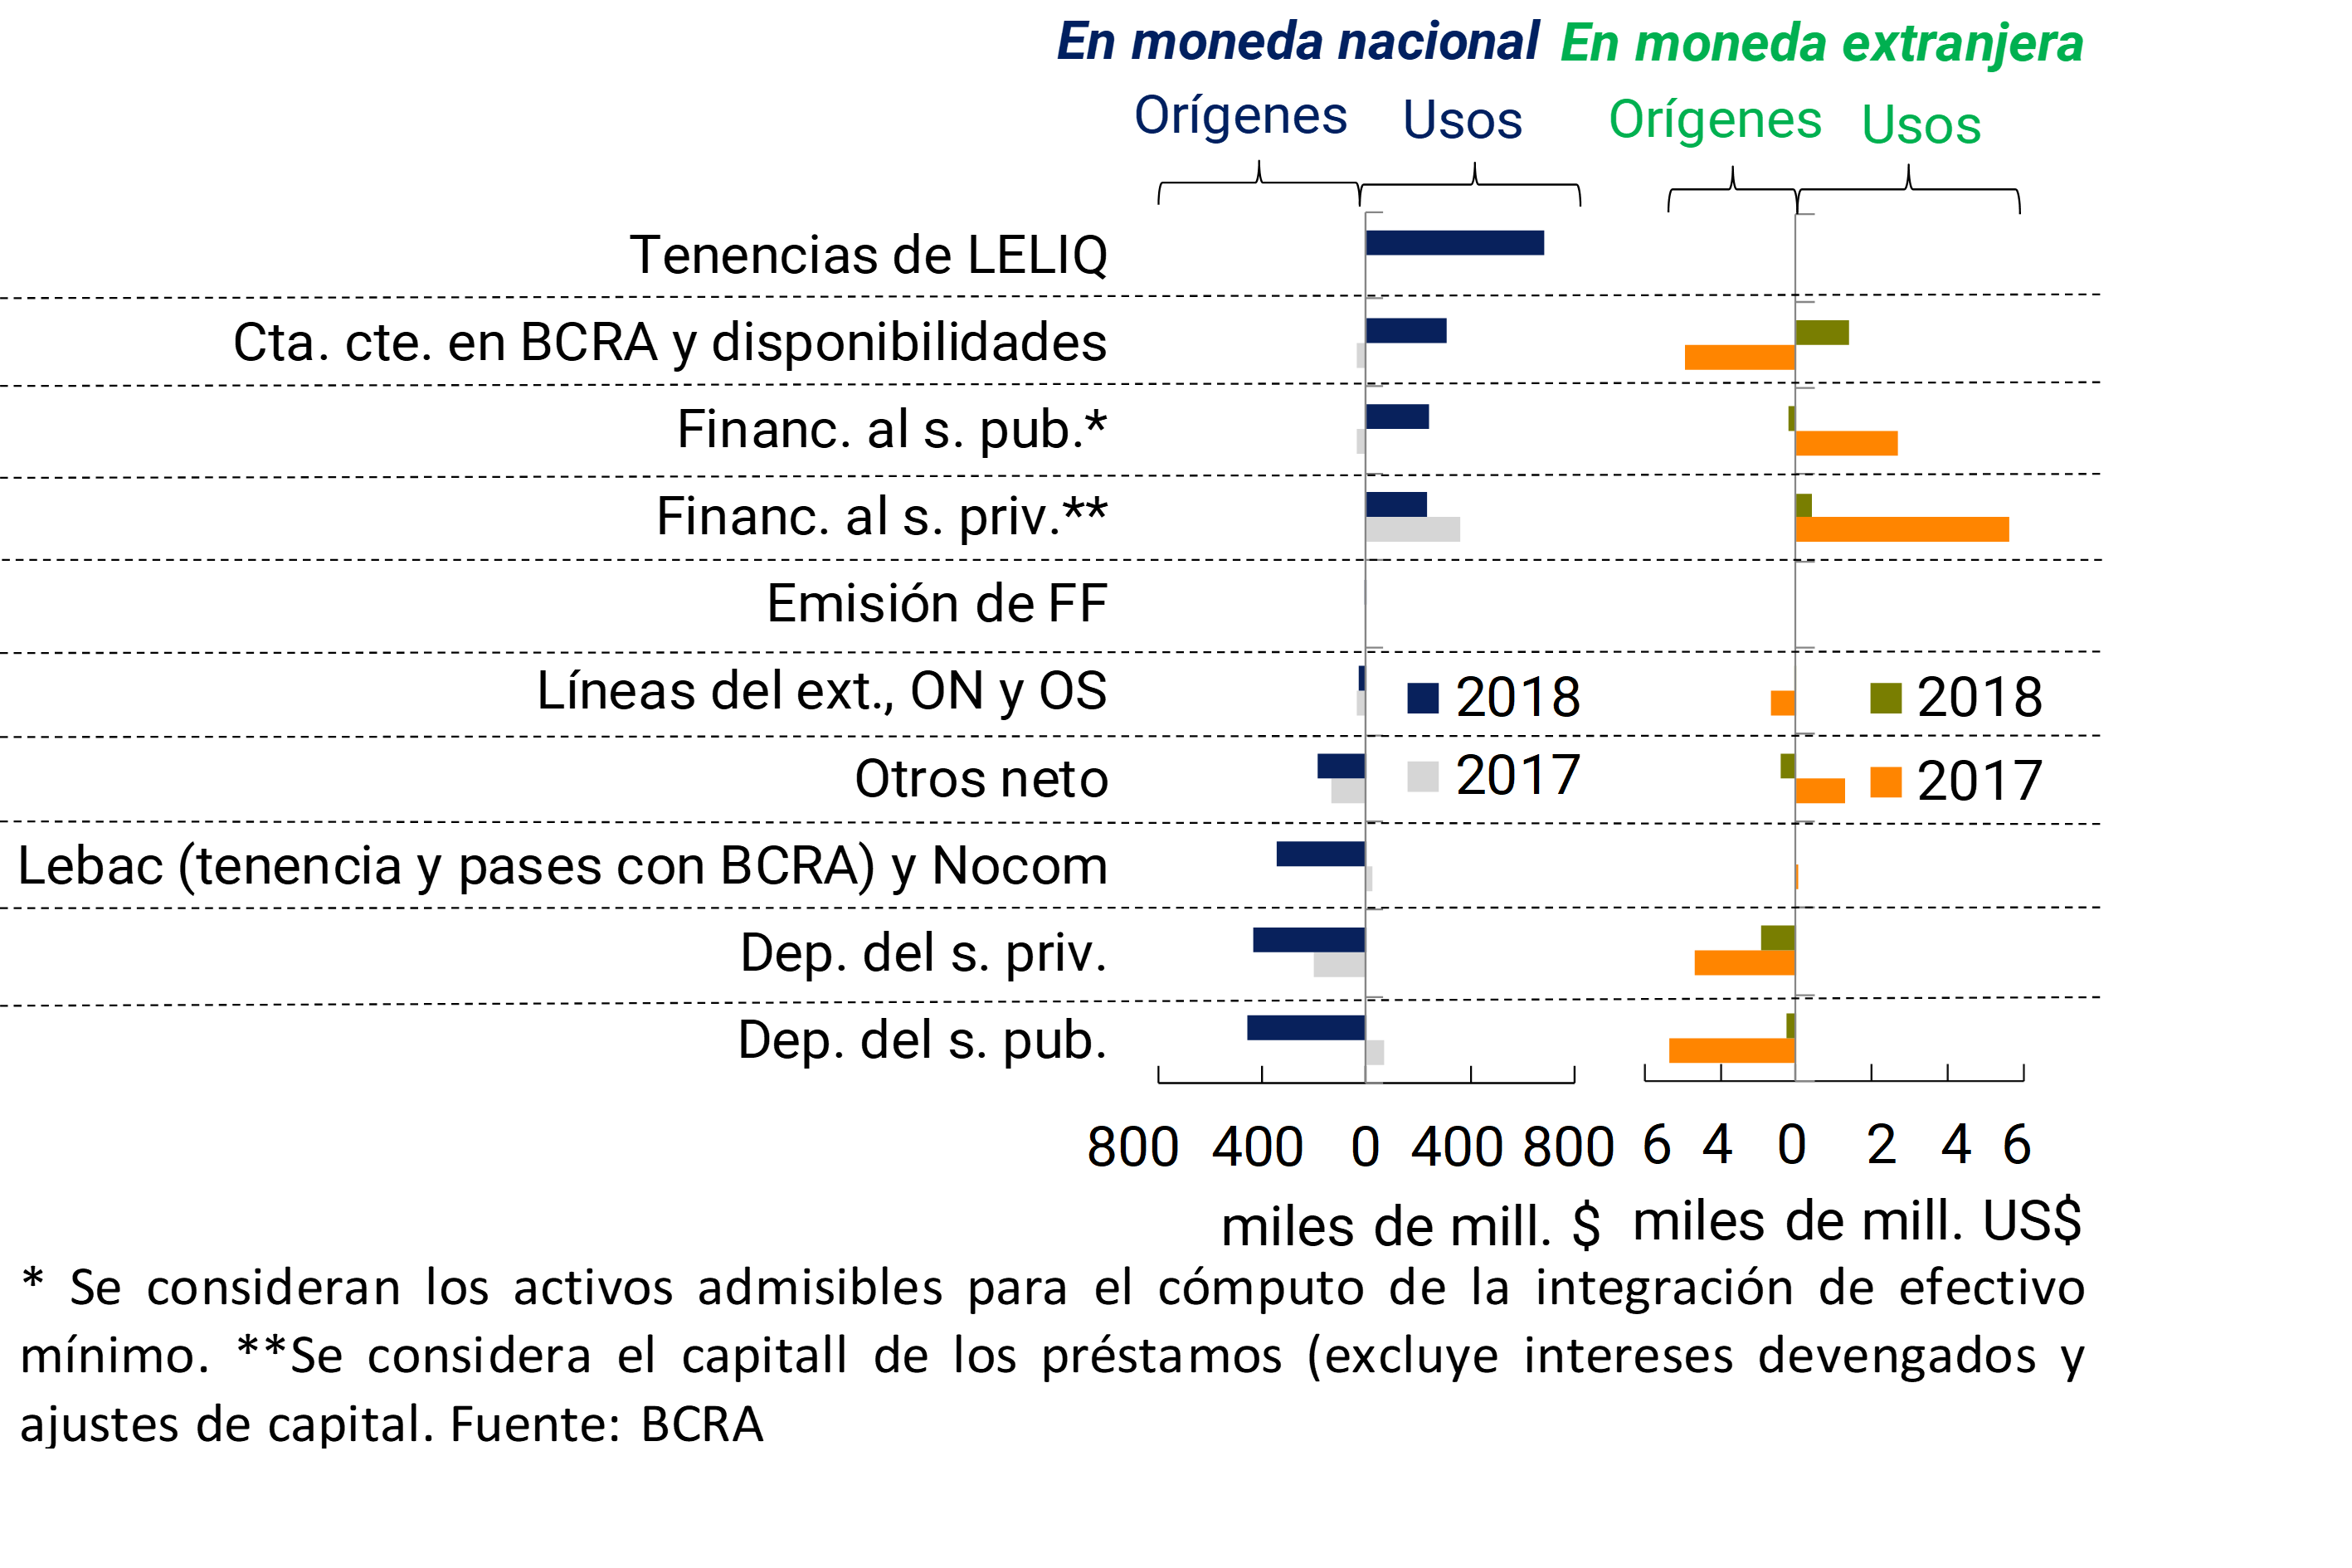
Based on the estimated flow of funds in national currency for the year so far, the increase in deposits ($456,100 million from the public sector and $434,800 million from the private sector) followed by the reduction in LEBAC holdings ($347,000 million) were the most relevant sources of funding for the financial system (see Graph 3). 9 The banks allocated these resources mainly to increase the balance of LELIQ ($681,600 million), and in second order of magnitude, to supply liquidity needs ($310,700 million) and to increase credit – both from the public and private sectors. On the other hand, considering the variations in items denominated in foreign currency, it was observed that the change in the volume of assets and liabilities was substantially lower than that recorded a year ago, highlighting the increase in private sector deposits and liquidity as the main source and application of resources, respectively.
Graph 3 | Estimated 11-Month Cumulative Cash Flow – Financial System – By Source Currency
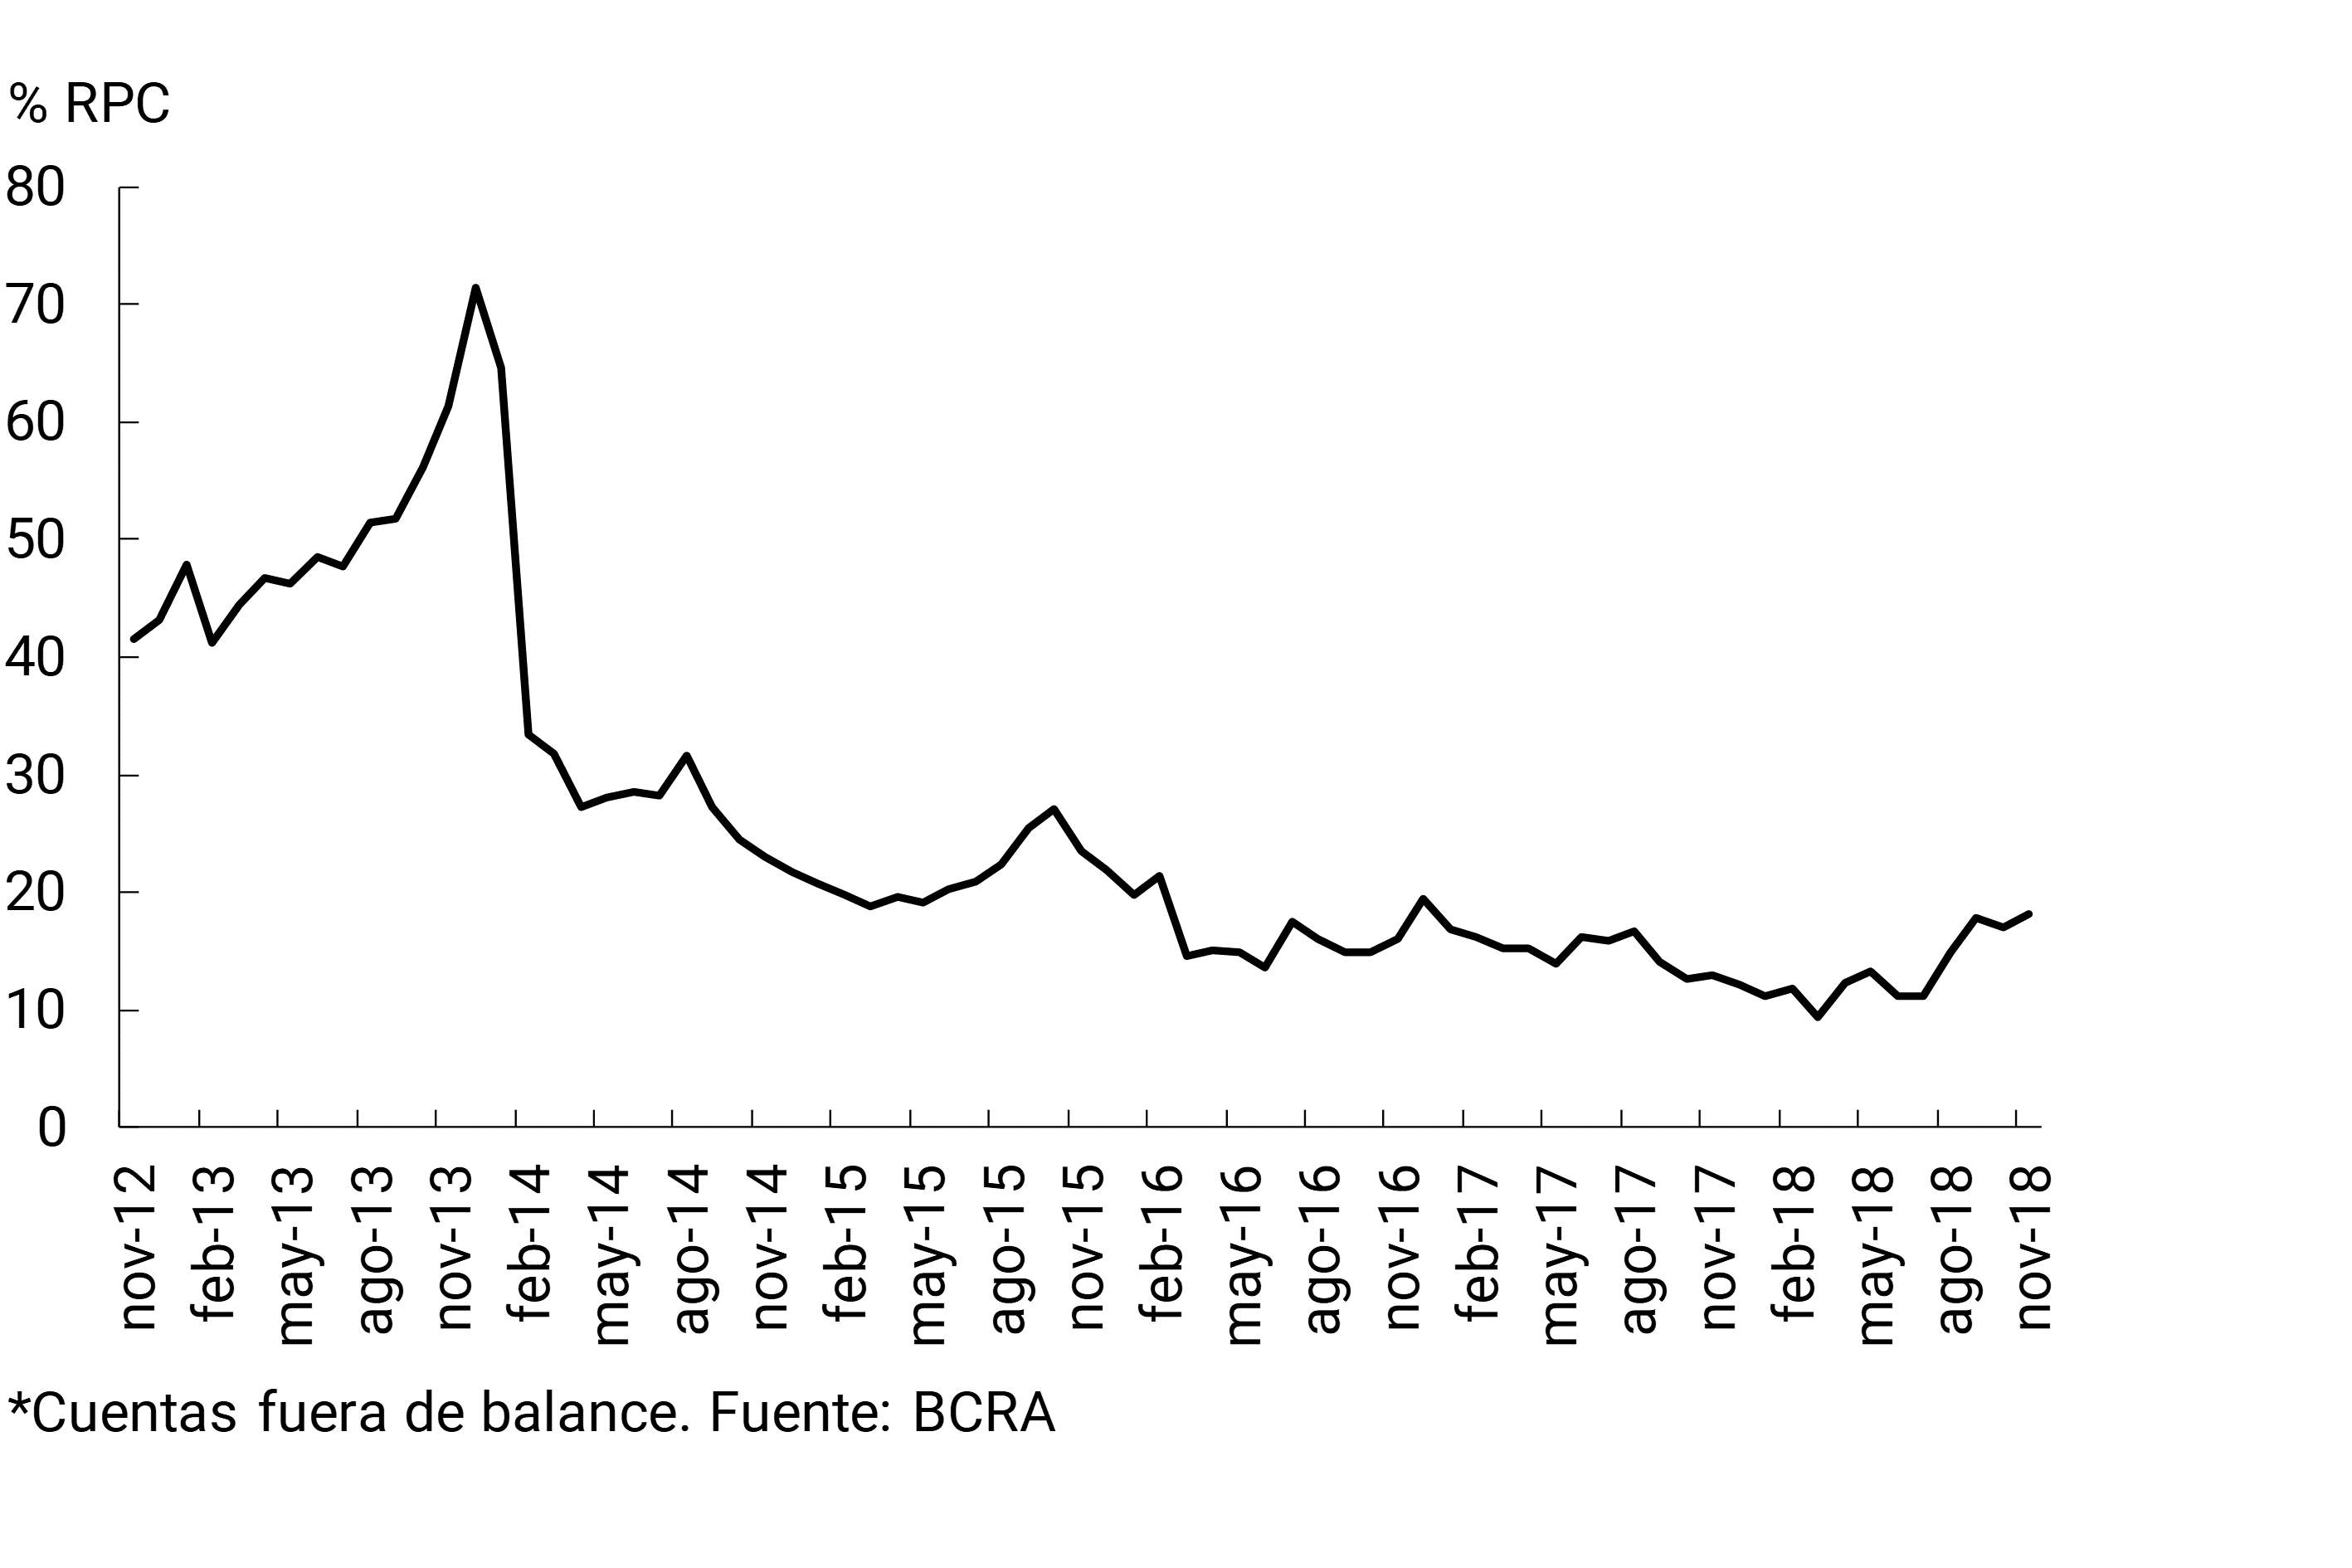
In November, the financial system presented a mismatch in foreign currency assets equivalent to 18.2% of the PRC (Computable Patrimonial Liability), slightly above last month’s figure (see Graph 4). The increase was driven by foreign banks and came from the spread between assets and liabilities on the bank balance sheet, as forward purchases of foreign currency (classified as off-balance sheet items) declined in the month. In year-on-year terms, this indicator increased to the aggregate level of 5.1 p.p. of the PRC. On the other hand, considering the items adjustable by CER, it is estimated that in November the active mismatch of banks was equivalent to just over half of the regulatory capital, growing slightly compared to the level of October. It should be remembered that public banks concentrate most of this mismatch.
Figure 4 | Foreign Currency (EM) Mismatch – EM Assets – EM Liabilities + Net Forward Purchases of EM without delivery of underlying* – As % of the financial system’s PRC
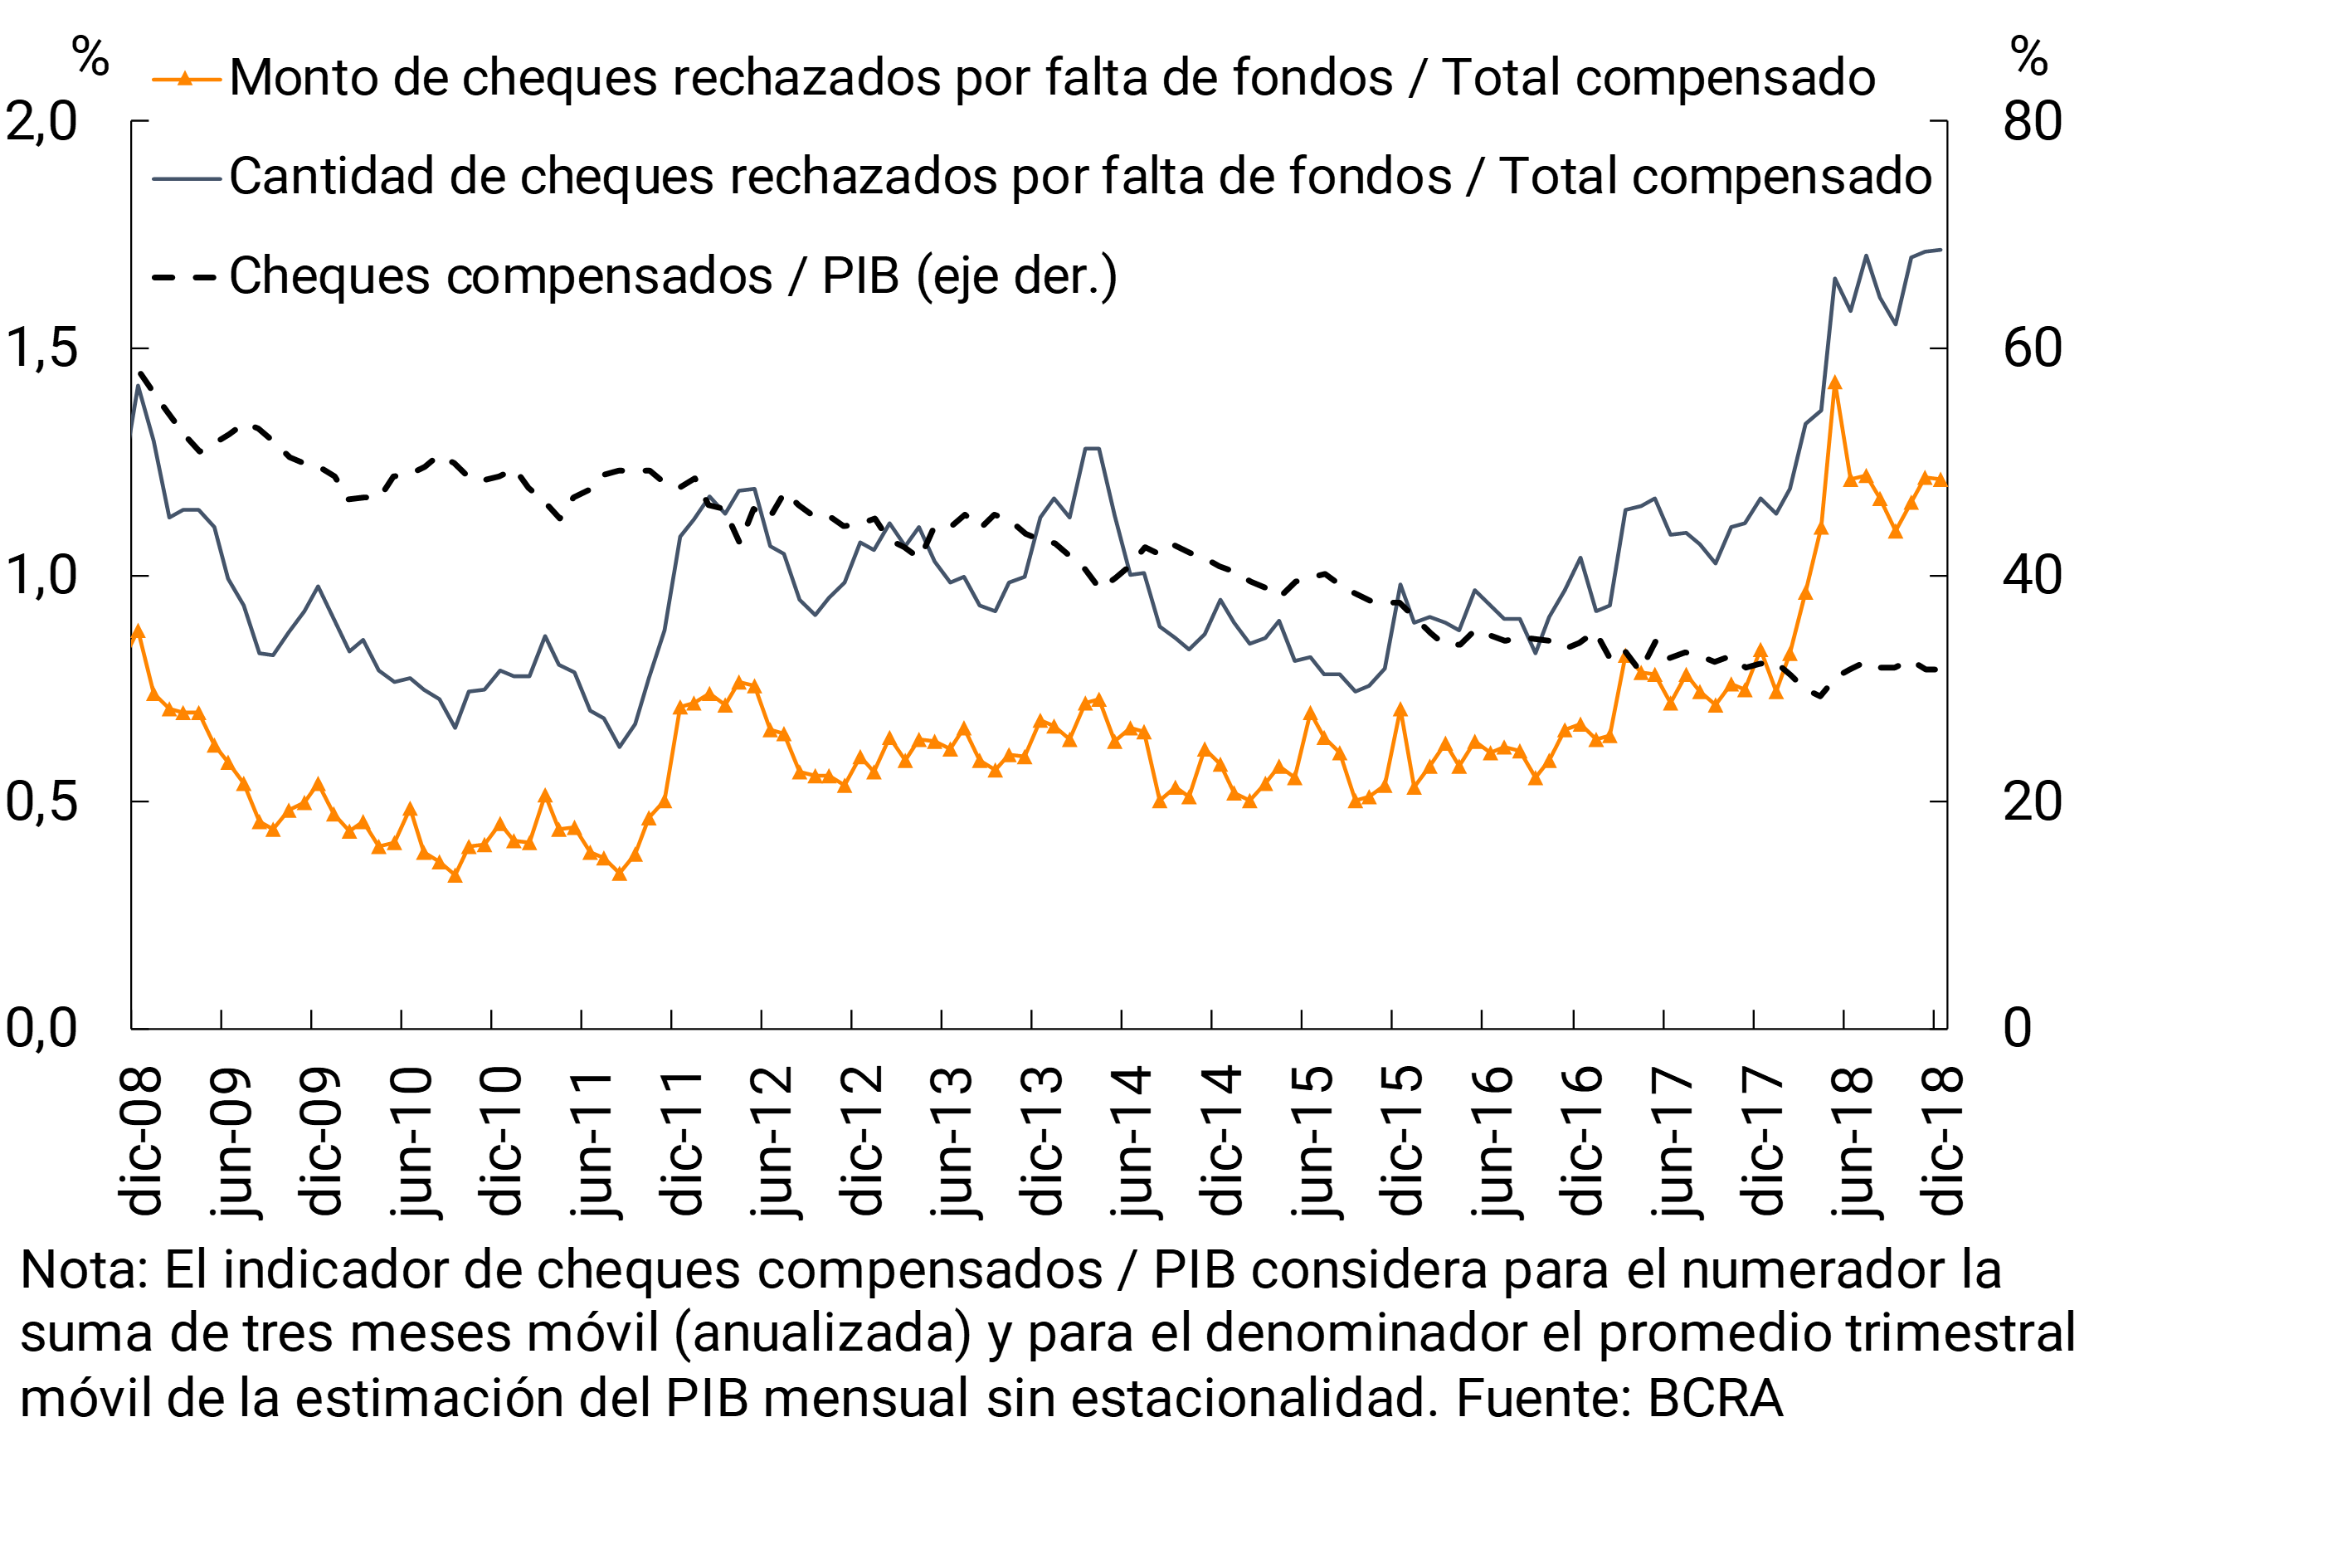
In relation to the operations carried out by the National Payment System, during December there was an increase in transfers of funds between third parties – both in quantity and values – driven by those that have instant credit of funds. Analysing the use of the different means of payment alternative to cash in 2018, it was observed that immediate transfers showed the greatest increase with respect to GDP. In the last quarter of the year, they reached a level equivalent to 19% annualized —a.—. of output (1.2 p.p. more than in the same period of 2017). On the other hand, check clearing reached a value equivalent to 32.5% of GDP for the fourth quarter of 2018 (0.3 p.p. lower in year-on-year terms). 10
In this context, during the last month of the year, rejection due to lack of funds in terms of the total compensated remained at levels similar to those of the previous month, 1.7% and 1.2%, in amounts and values, respectively (see Chart 5).
Graph 5 | Check Clearing and Rejection
III. Deposits and liquidity
Considering the sources of funding of the financial system (liabilities and equity), in November the relative importance of public sector deposits increased slightly (up to 18.5% of total funding), with private sector deposits (54.7% of the total) and net worth (10.7% of the total) decreasing.
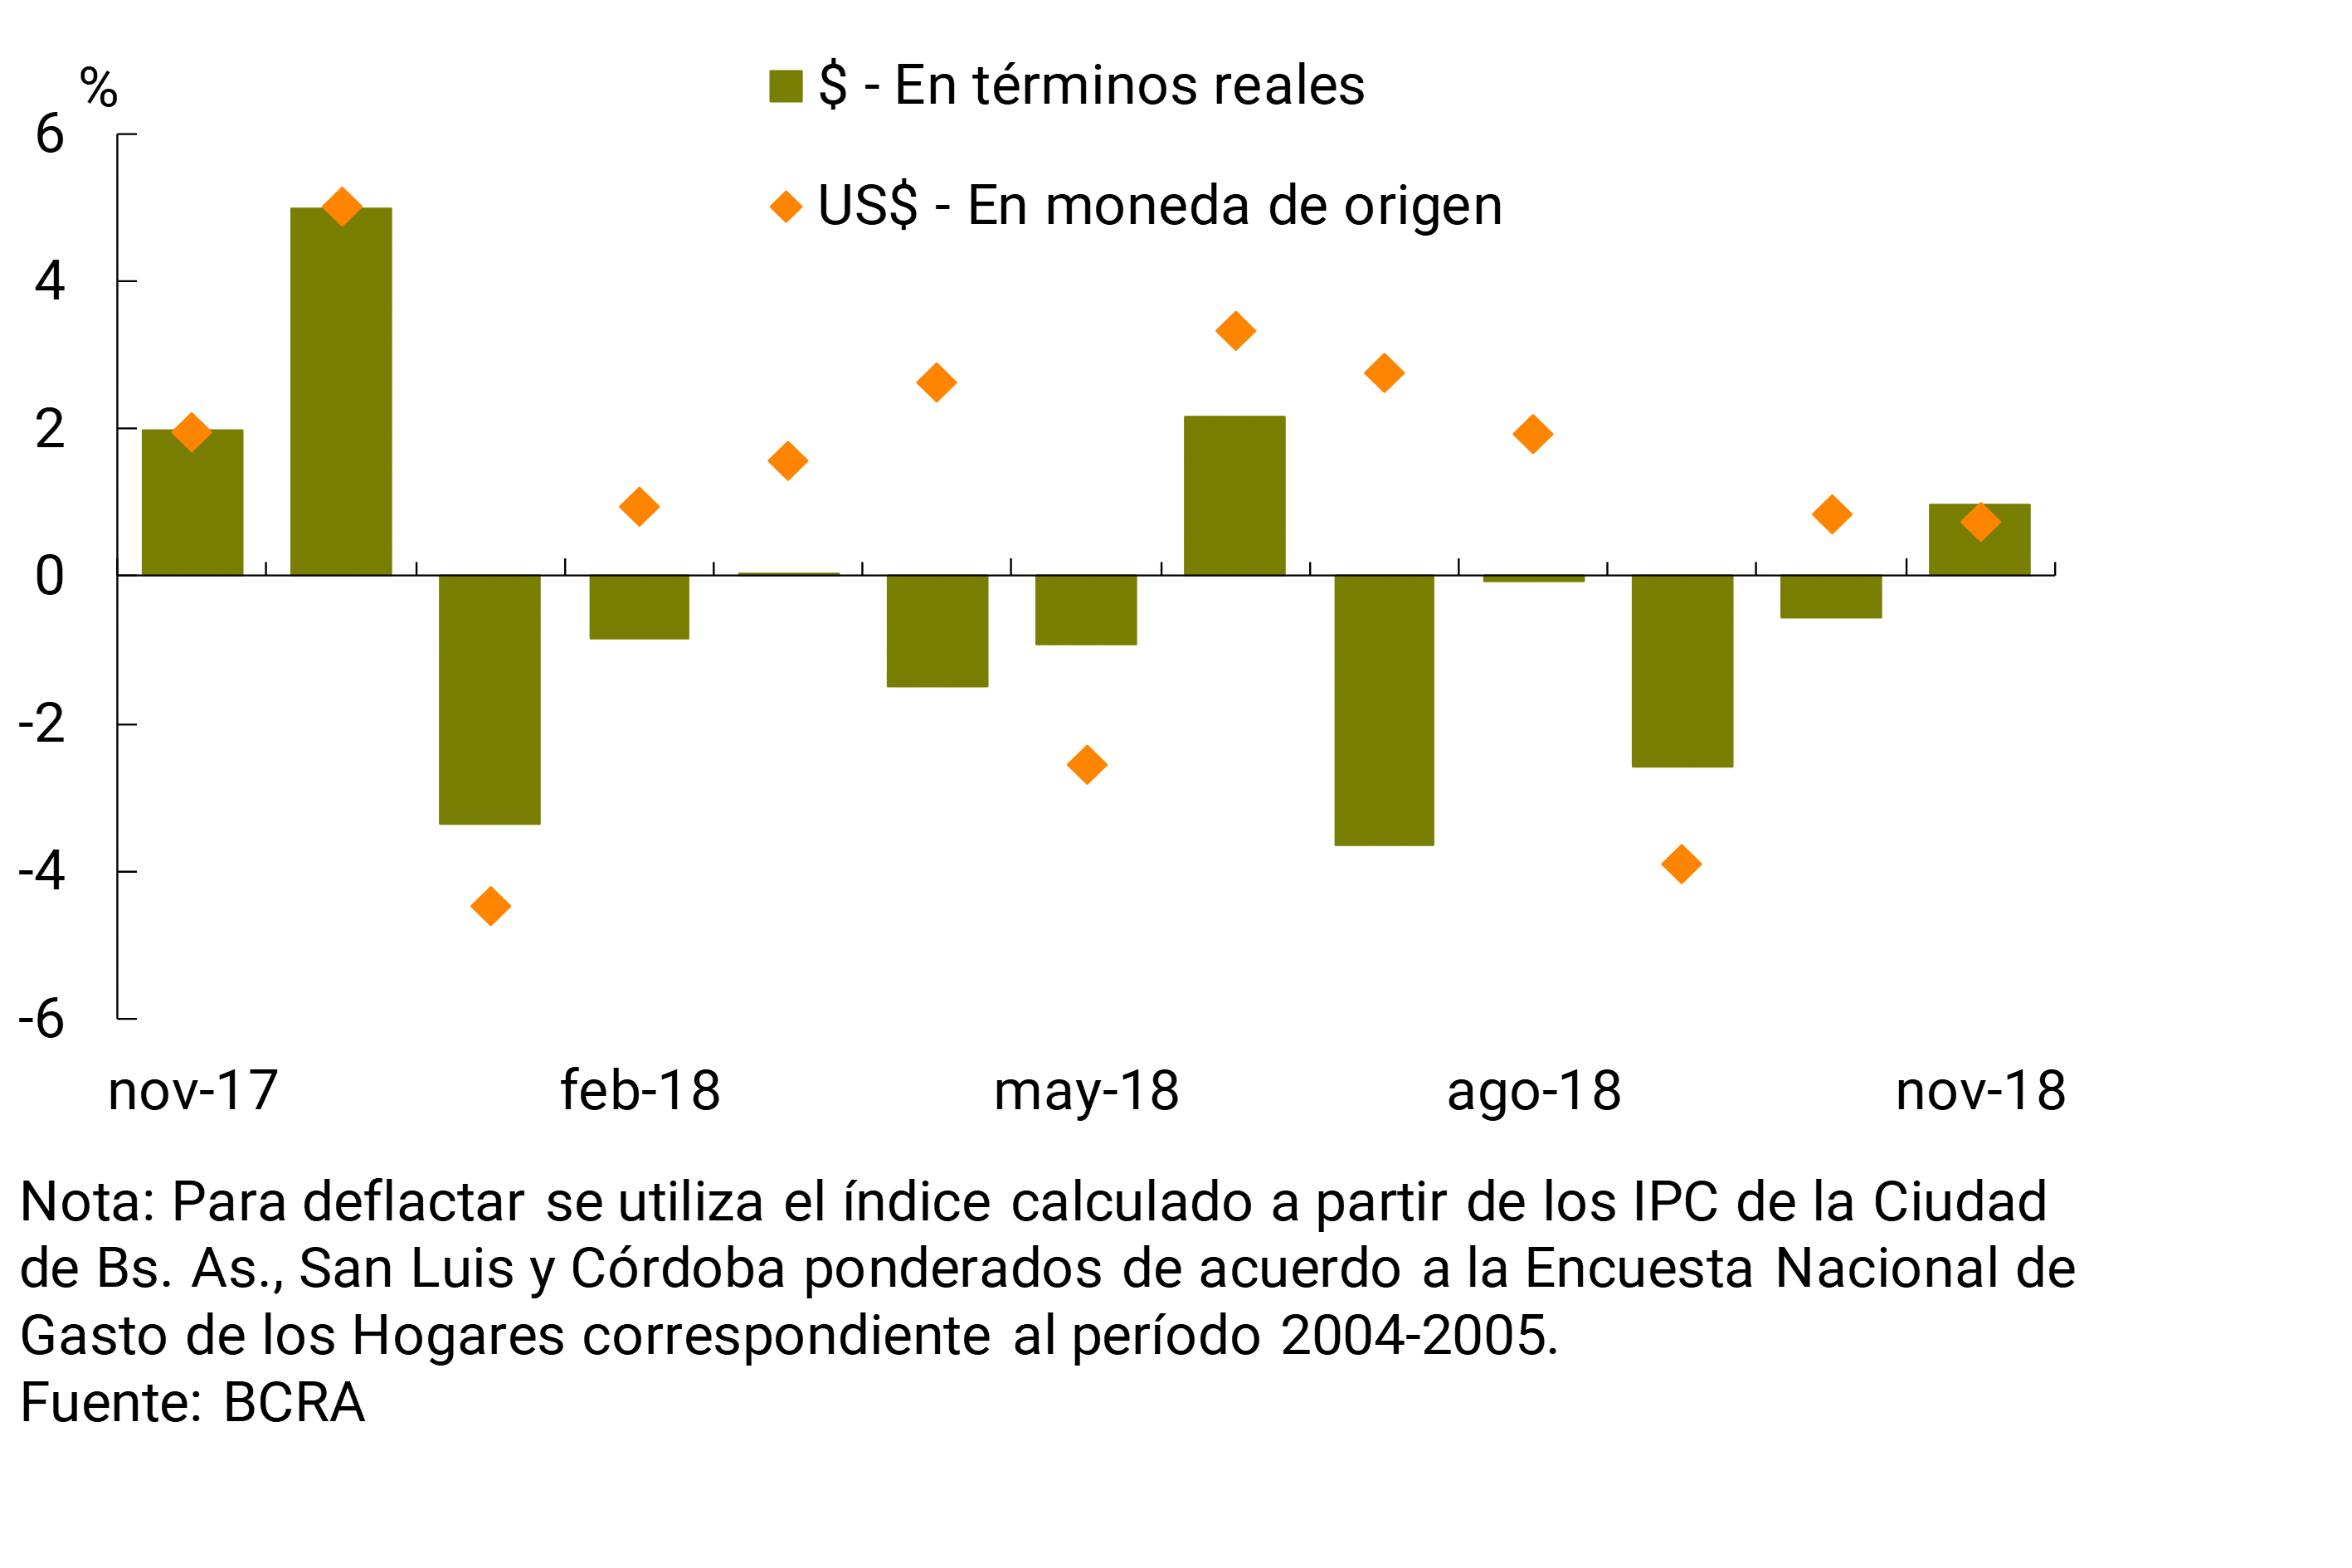
In November, total deposits in national currency increased by 2.1% in real terms, driven by public sector (+3.6% real) and private sector (+1% real) placements (see Chart 6). Within the latter segment, term loans grew 2.1% in the month, while demand accounts fell slightly – both values adjusted for inflation. The monthly performance of term balances in pesos was, to a greater extent, the result of the release of funds from the private sector linked to the LEBAC disarmament process. For their part, total deposits arranged in foreign currency increased 3.4% – in source currency – in November, driven by public sector placements. Meanwhile, private sector deposits in foreign currency increased 0.7% in the month.
Graph 6 | Monthly Evolution of Private Sector Deposits
In a year-on-year comparison, the balance of total deposits in pesos grew 10.2% adjusting for inflation, a dynamic driven by public sector placements. Meanwhile, private sector deposits in national currency fell 5.5% in real terms compared to the same month of the previous year. For their part, total deposits in foreign currency increased 2.9% – in foreign currency – in the last twelve months, driven by private sector placements, which accumulated an increase of 8.7%.
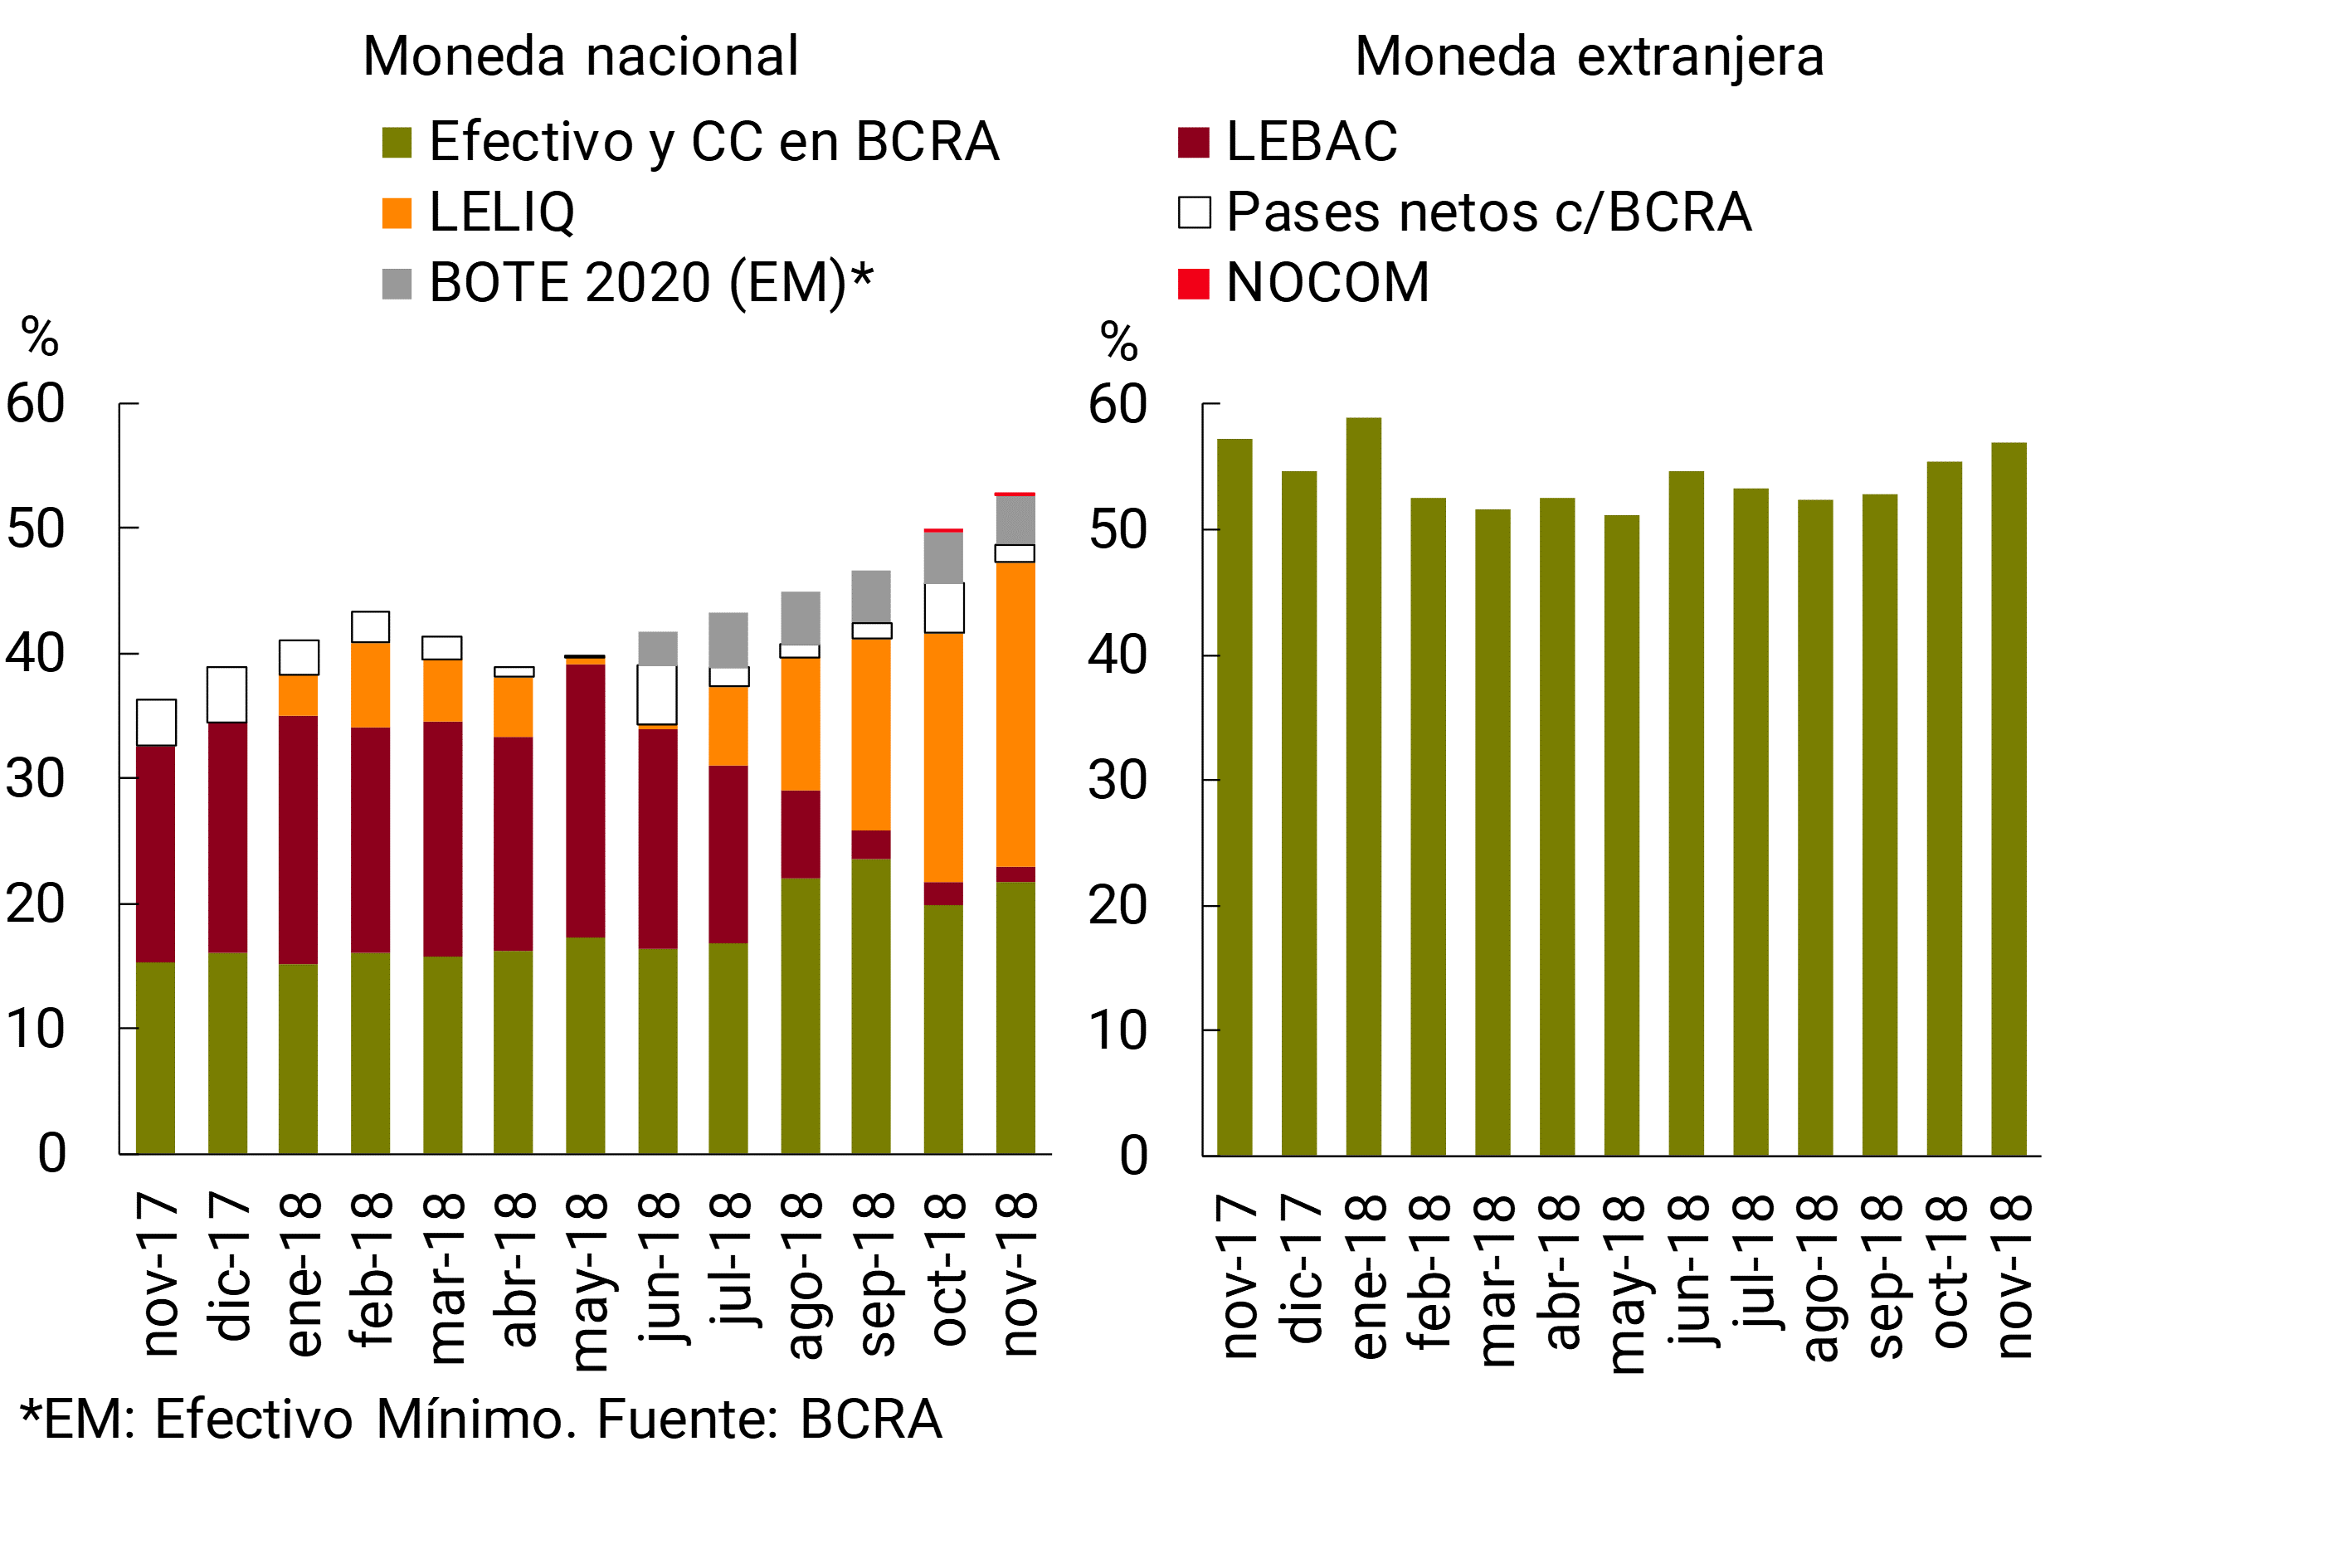
The broad liquidity indicator – integration of minimum cash, BCRA instruments and availabilities, in domestic and foreign currency – increased by 2.5 p.p. of total deposits (+2.9 p.p. considering only items in pesos) in November, to a total of 54% (52.8%). As a result of the process of dismantling the LEBAC balance, during the period there was a change in the composition of liquid assets, with a decrease in LEBAC holdings and an increase in liquidity bills – greater than what is admissible to be included by the reserve requirements regulations – and in the current accounts that financial institutions hold at the BCRA (see Graph 7). In a year-on-year comparison, ample liquidity increased 12.7 p.p. of deposits, in line with the growth differential between deposits and loans.
Figure 7 | Composition of Bank Liquidity – As % of Deposits
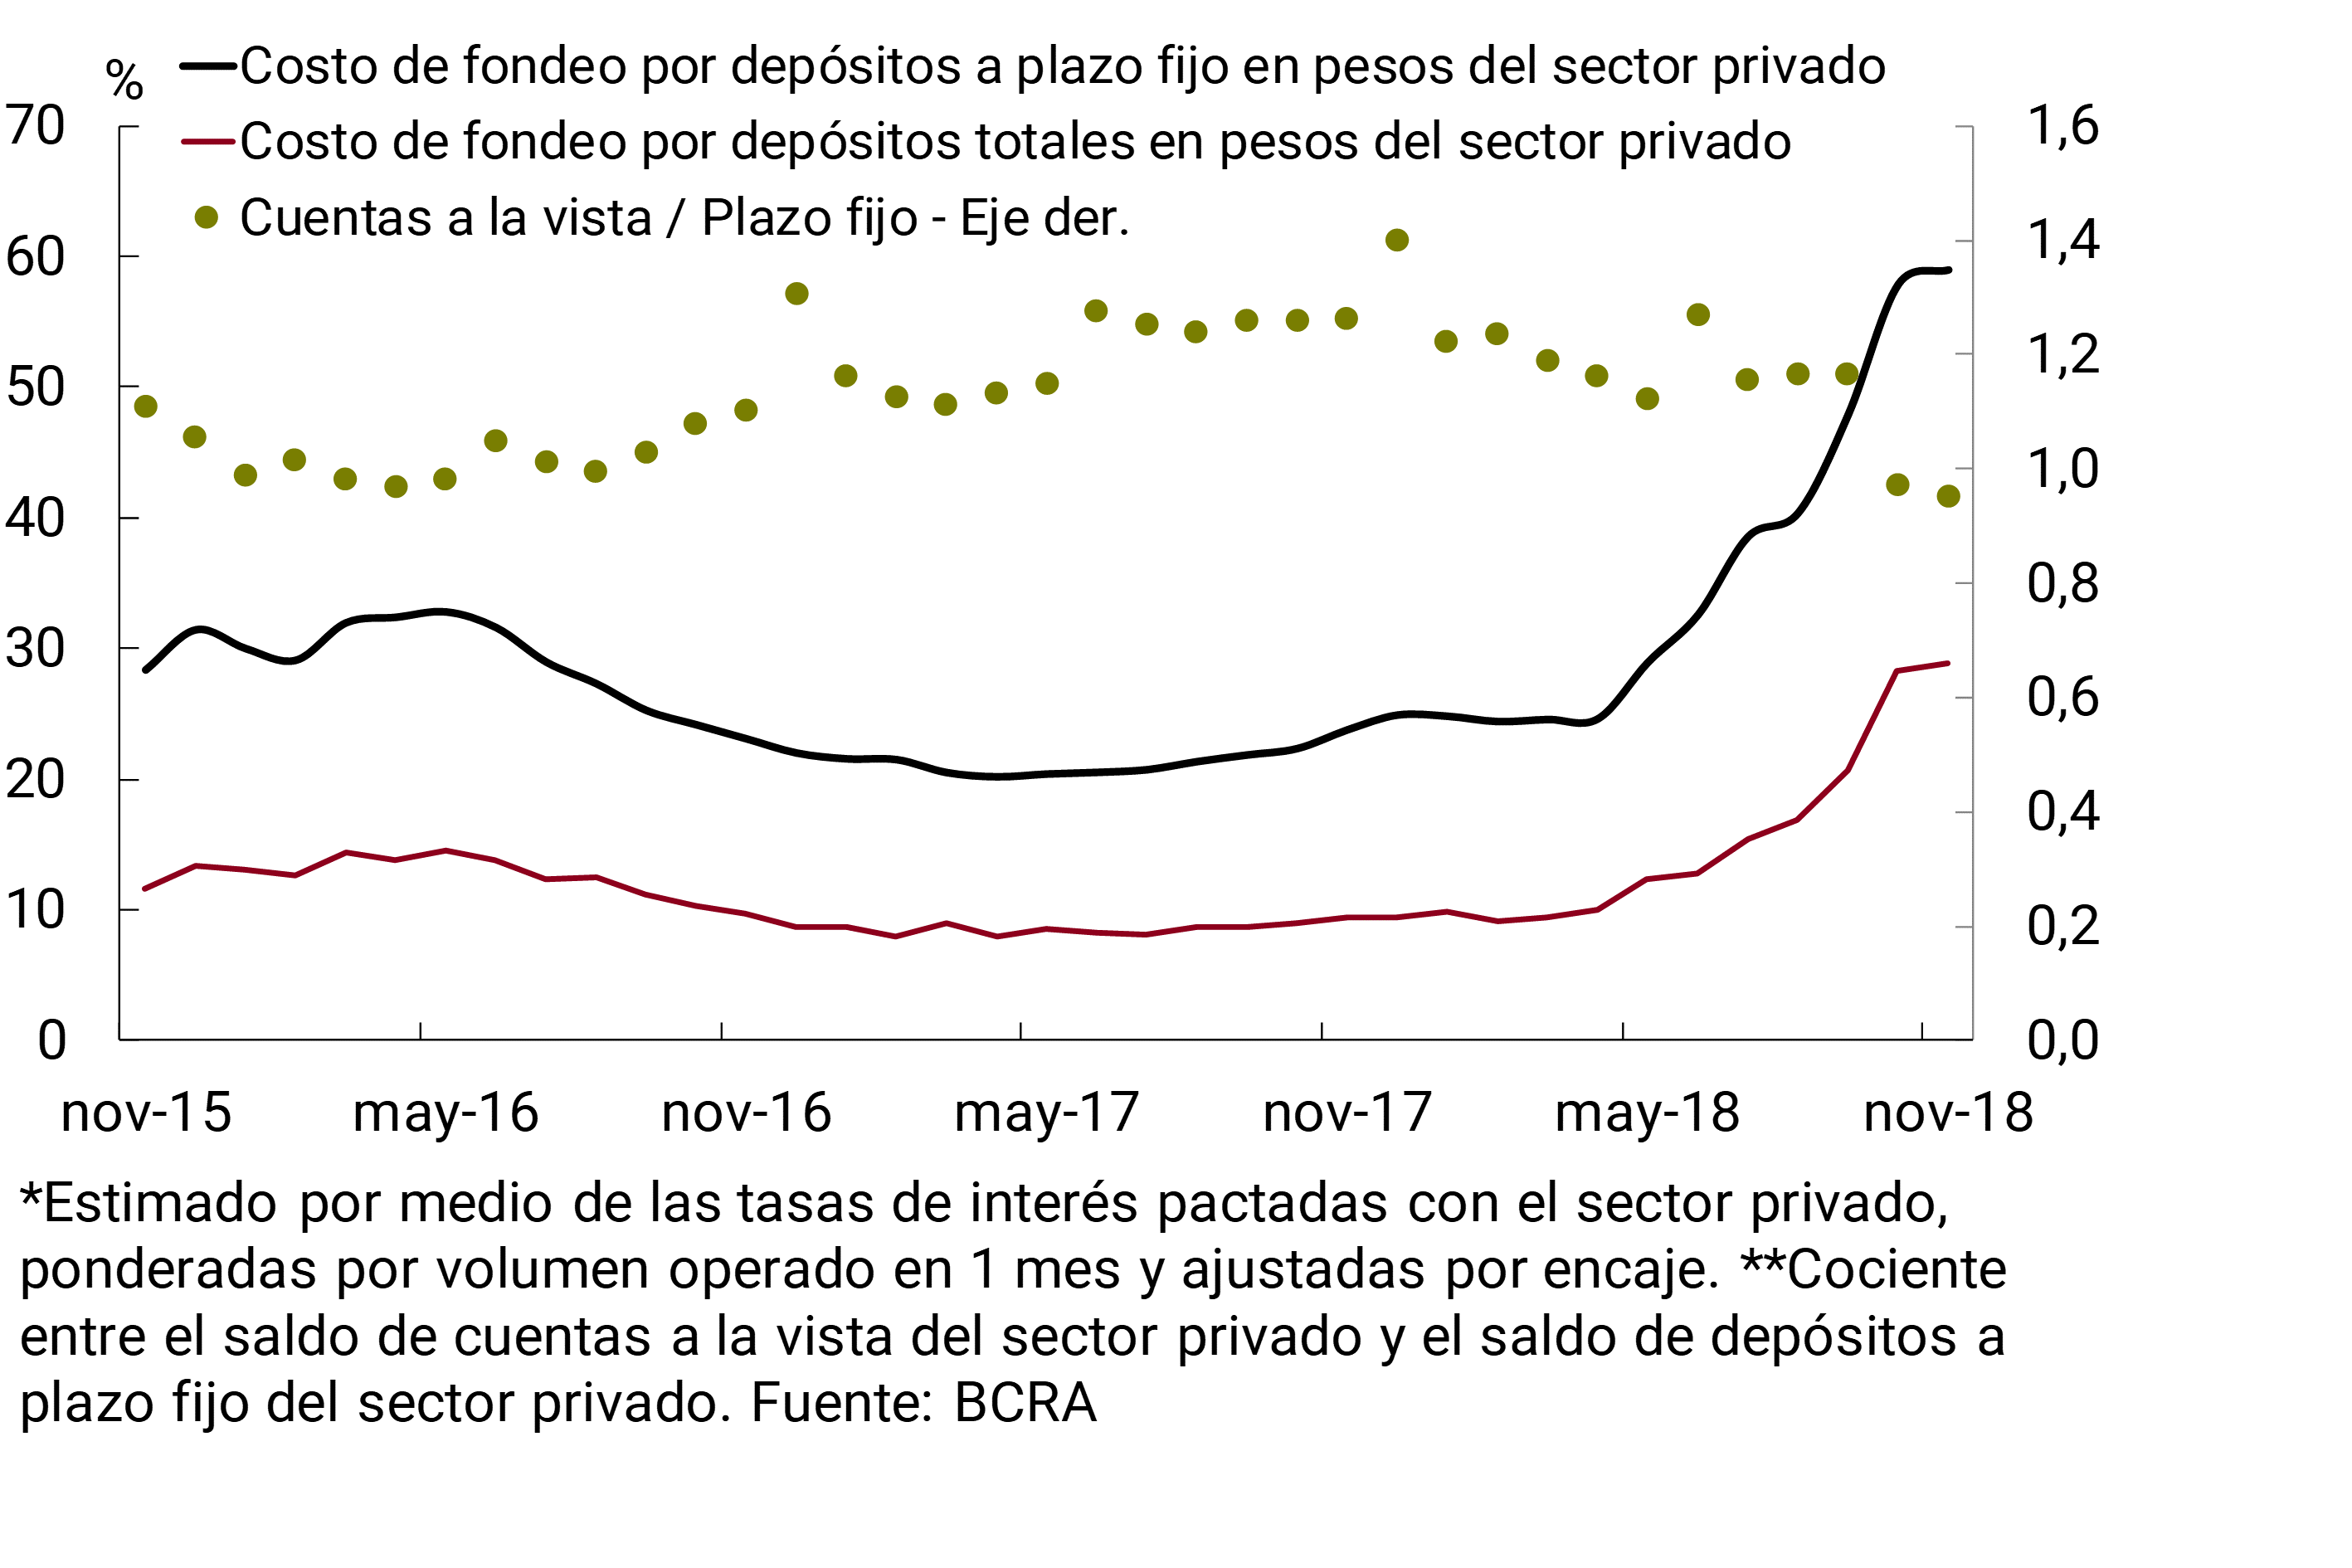
The interest rates that banks operated with the private sector for fixed-term deposits in pesos increased slightly in November (+0.9 p.p. to 47.7% nominal annual on average), tending to stabilize at the margin, after several months of upward trajectory. This performance was in line with the dynamics of the benchmark interest rate, which has continued to show a decline since mid-October. This context, coupled with a slight increase in the weighting of time deposits in the total, resulted in the estimated funding cost for private sector deposits in pesos increasing slightly in November (see Chart 8).
Figure 8 | Estimated Funding Cost for Private Sector Deposits in Pesos* and Ratio between Demand and Time Deposits**
IV. Exposures and Credit Quality
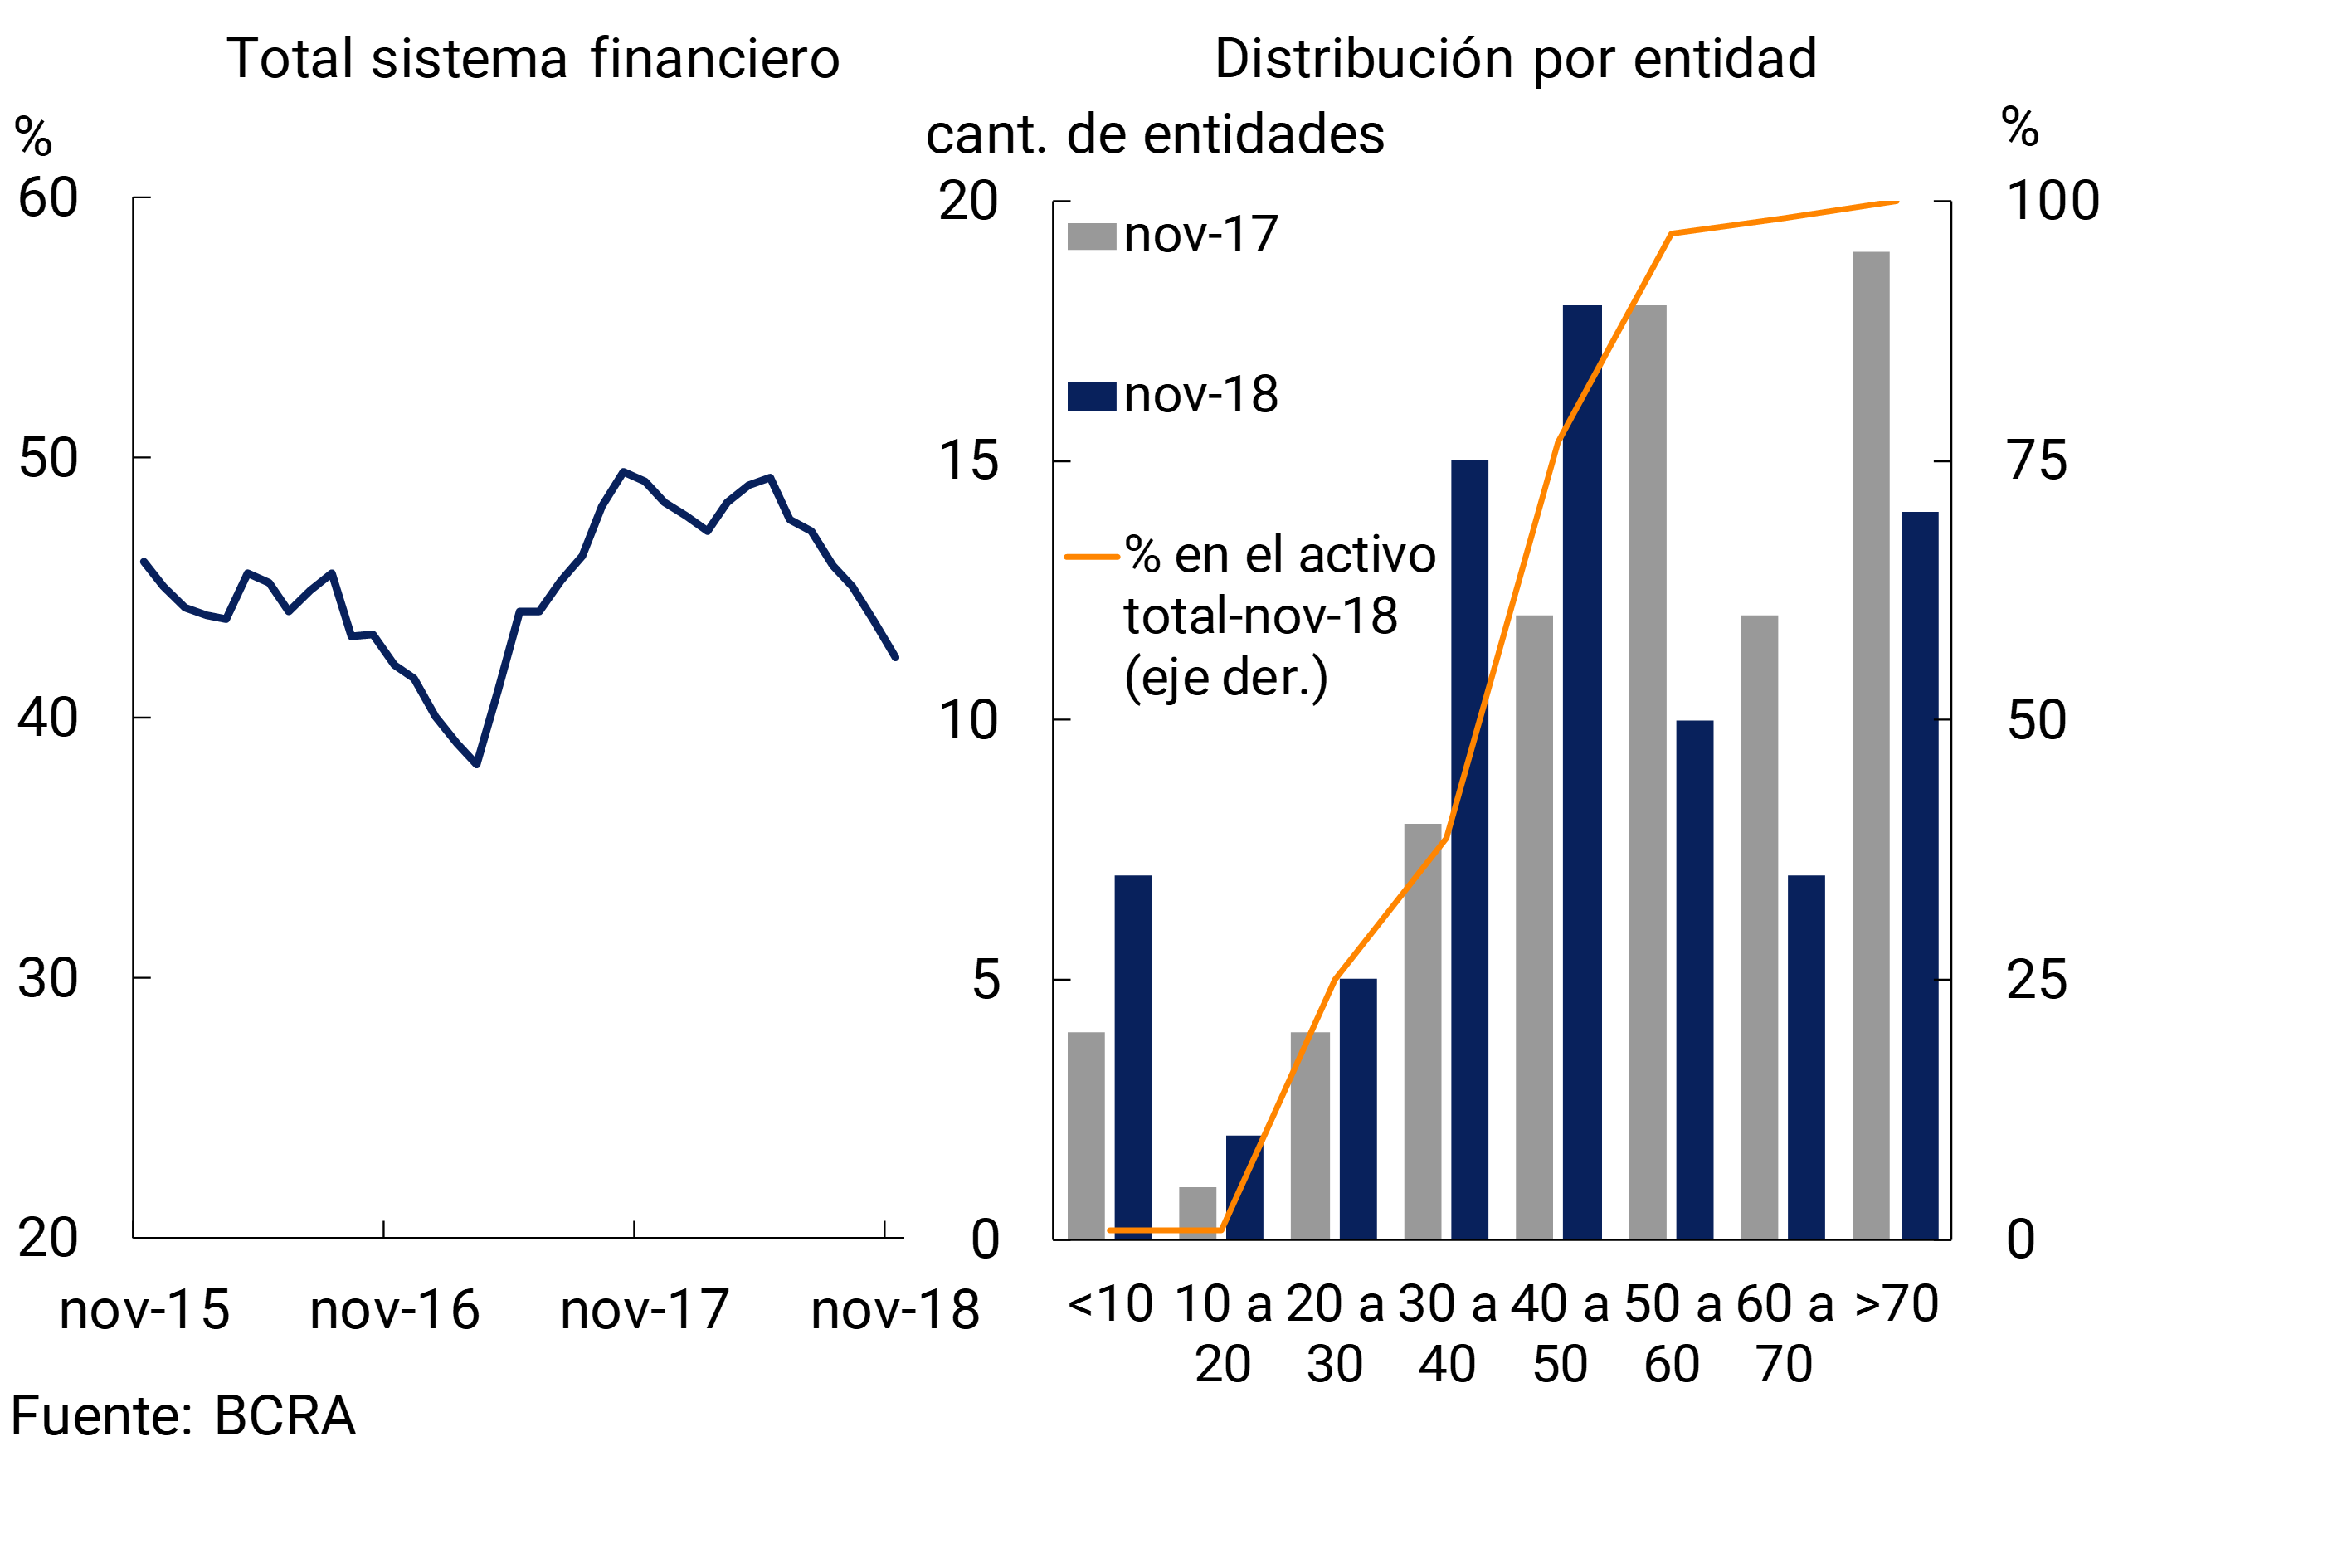
The financial system’s exposure to the non-financial private sector was at moderate levels in November. The balance of credit to the private sector in relation to total assets represented 42.3% in the month, 1.4 p.p. below the value observed in October and 6.8 p.p. less than the level of a year ago (see Chart 9). In the period, more than 60% of the banks that make up the financial system – which represent almost 77% of assets – had an exposure to the non-financial private sector of less than half of their assets, unlike a year ago when only 37% of banks registered this level.
Figure 9 | Gross Exposure to the Non-Financial Private Sector – Private Sector Financing as % of Assets
In November, the balance of financing in national currency to the private sector decreased by 2.2% when adjusted for inflation compared to the previous month (+0.9% in nominal terms) (see Chart 10). 11 The monthly fall was generalized in all credit lines and in all groups of financial institutions. Meanwhile, the balance of credit in foreign currency in the financial system grew 1.4% in the month, driven mainly by public banks and foreign private banks. Thus, the total balance (in domestic and foreign currency) of financing to the private sector expressed in pesos fell 0.8% in real terms (+2.4% nominal).
Figure 10 | Private Sector Credit Balance by Currency
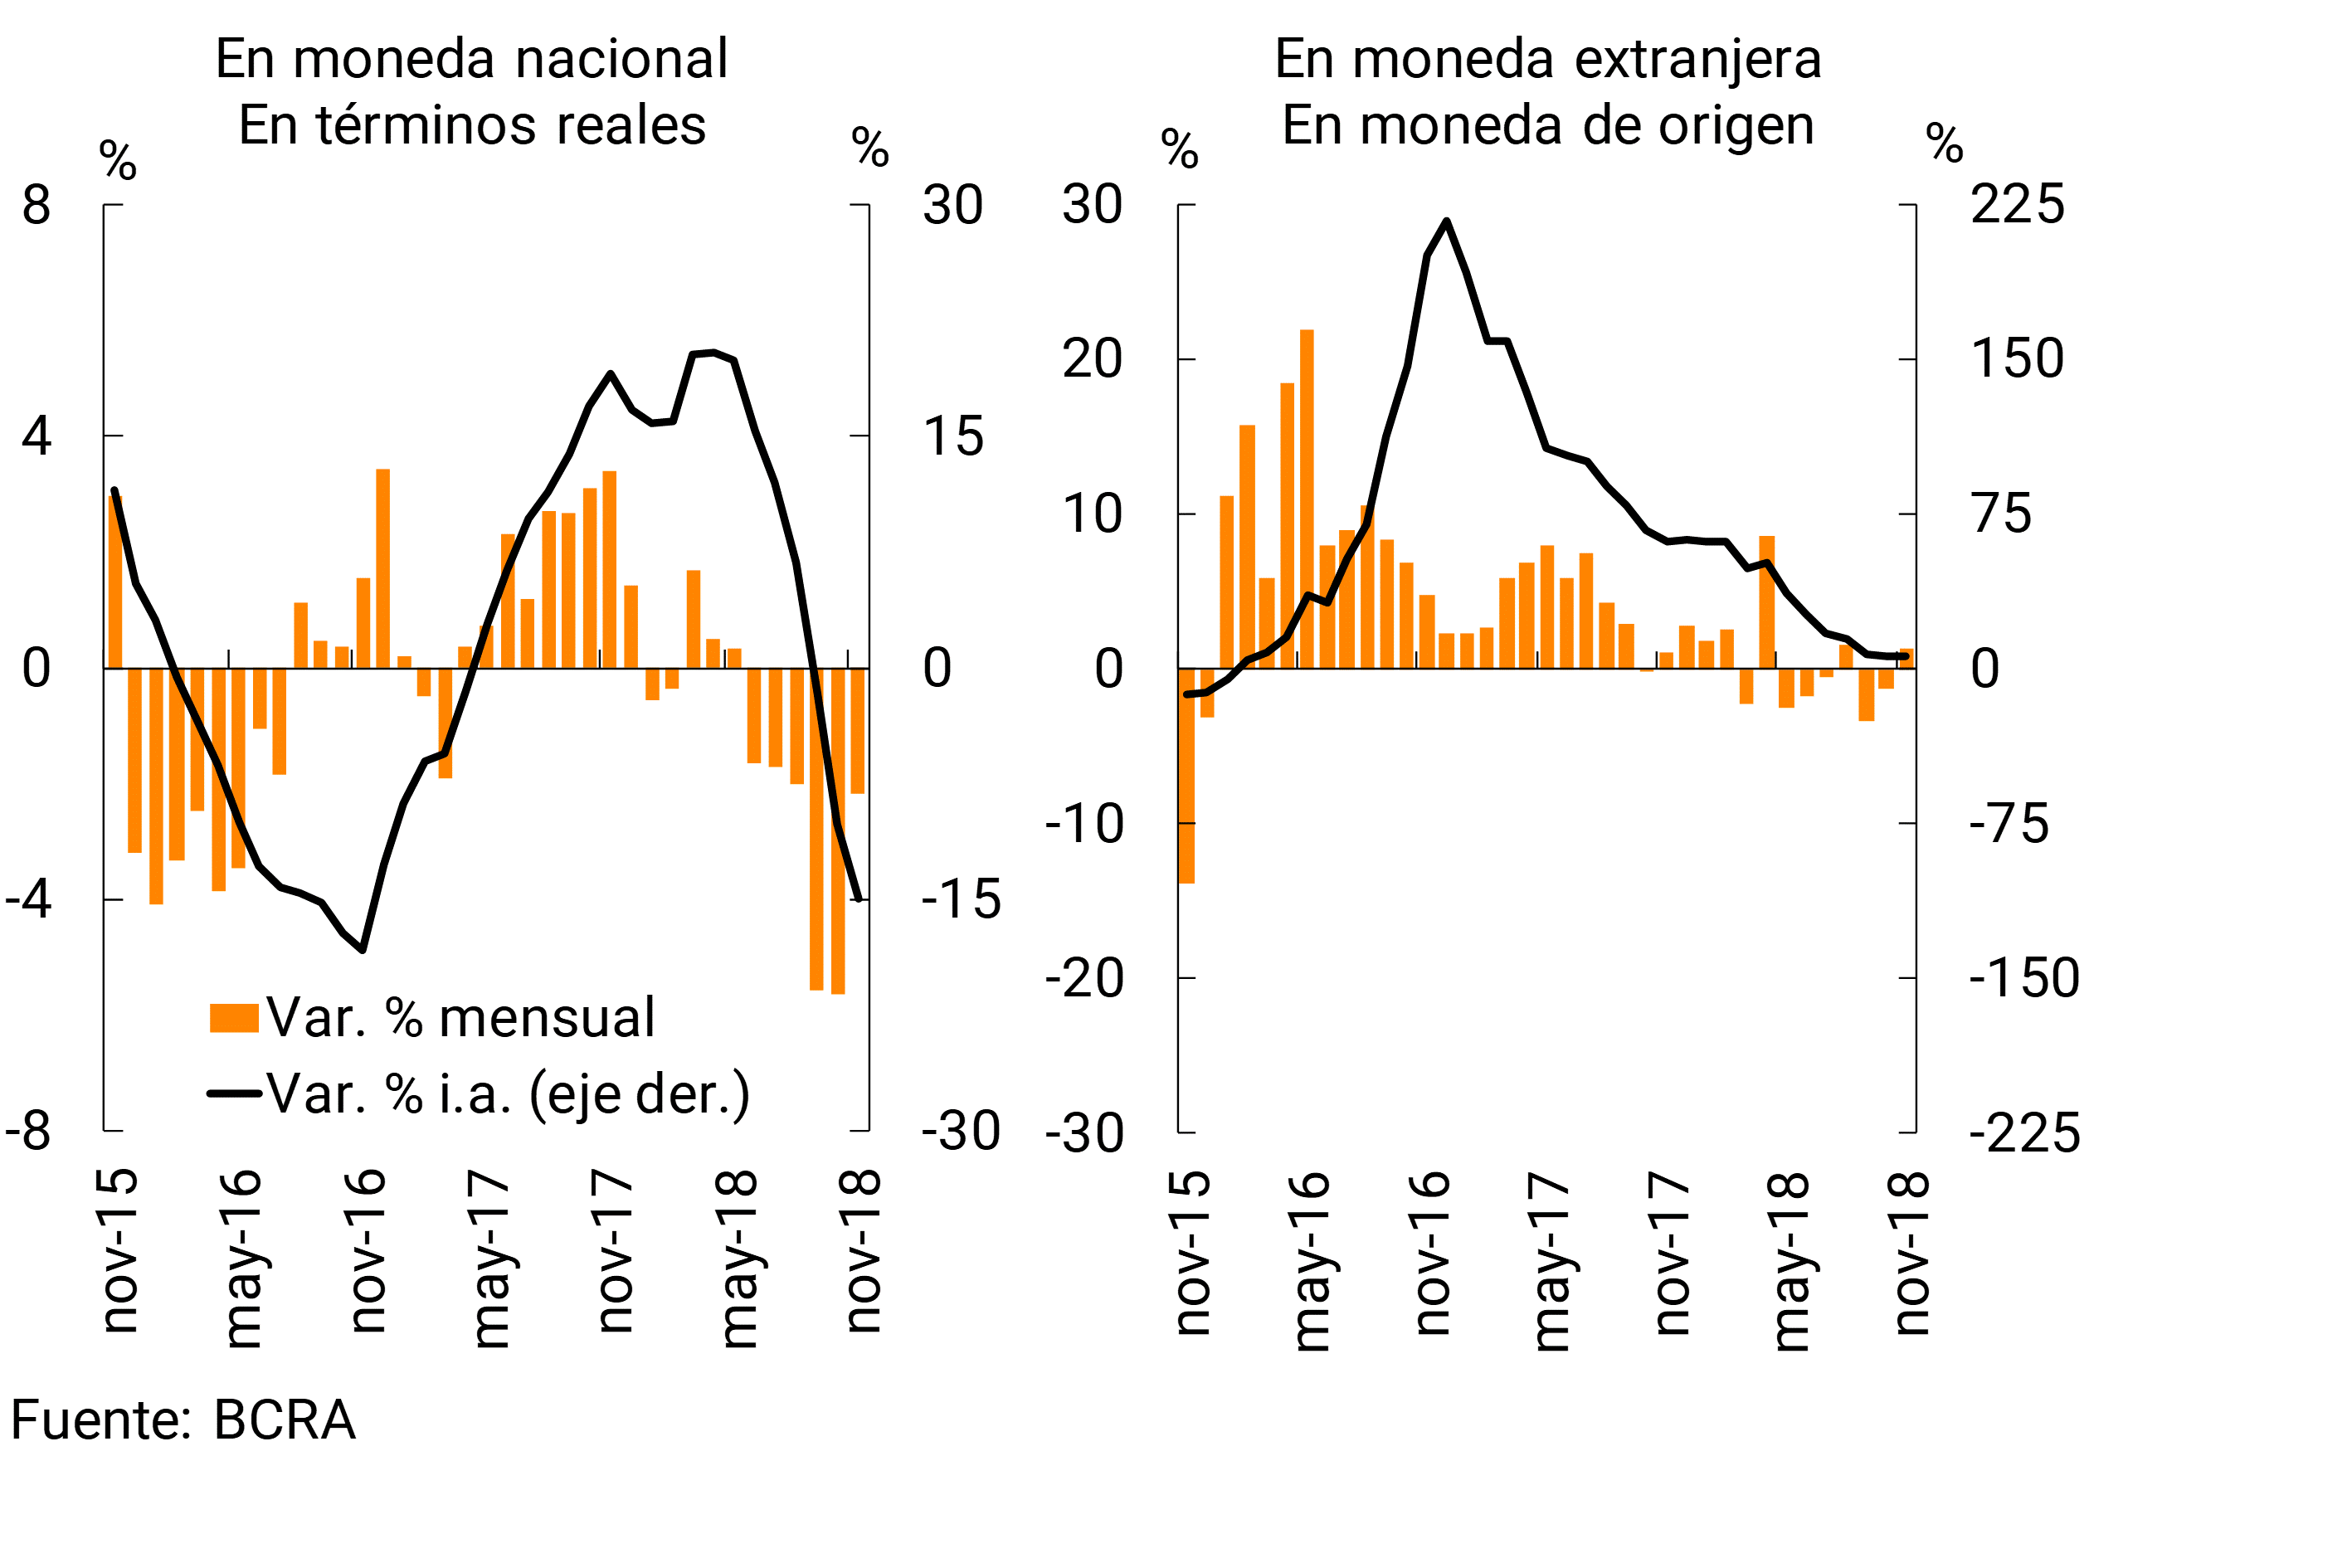
In a year-on-year comparison, the balance of financing in pesos to the private sector continued to decline in November, reaching a fall of 14.9% when adjusted for inflation (see Chart 10). 12 Loans in foreign currency increased by 6.4% YoY, remaining practically unchanged from the previous month’s figure.
In November, the total credit balance (in domestic and foreign currency) to companies decreased 0.9% in real terms compared to the previous month (+2.2% in nominal terms). 13 The monthly fall was reflected in almost all the different economic sectors, with the exception of loans to primary production, which showed a slight increase. In year-on-year terms, the total financing balance to companies when adjusted for inflation fell slightly compared to the record for the same month of the previous year (-0.2% real YoY). Credits to primary production and, to a lesser extent, to industry were the most dynamic in the period (see Graph 11).
Figure 11 | Total Credit Balance by Segment
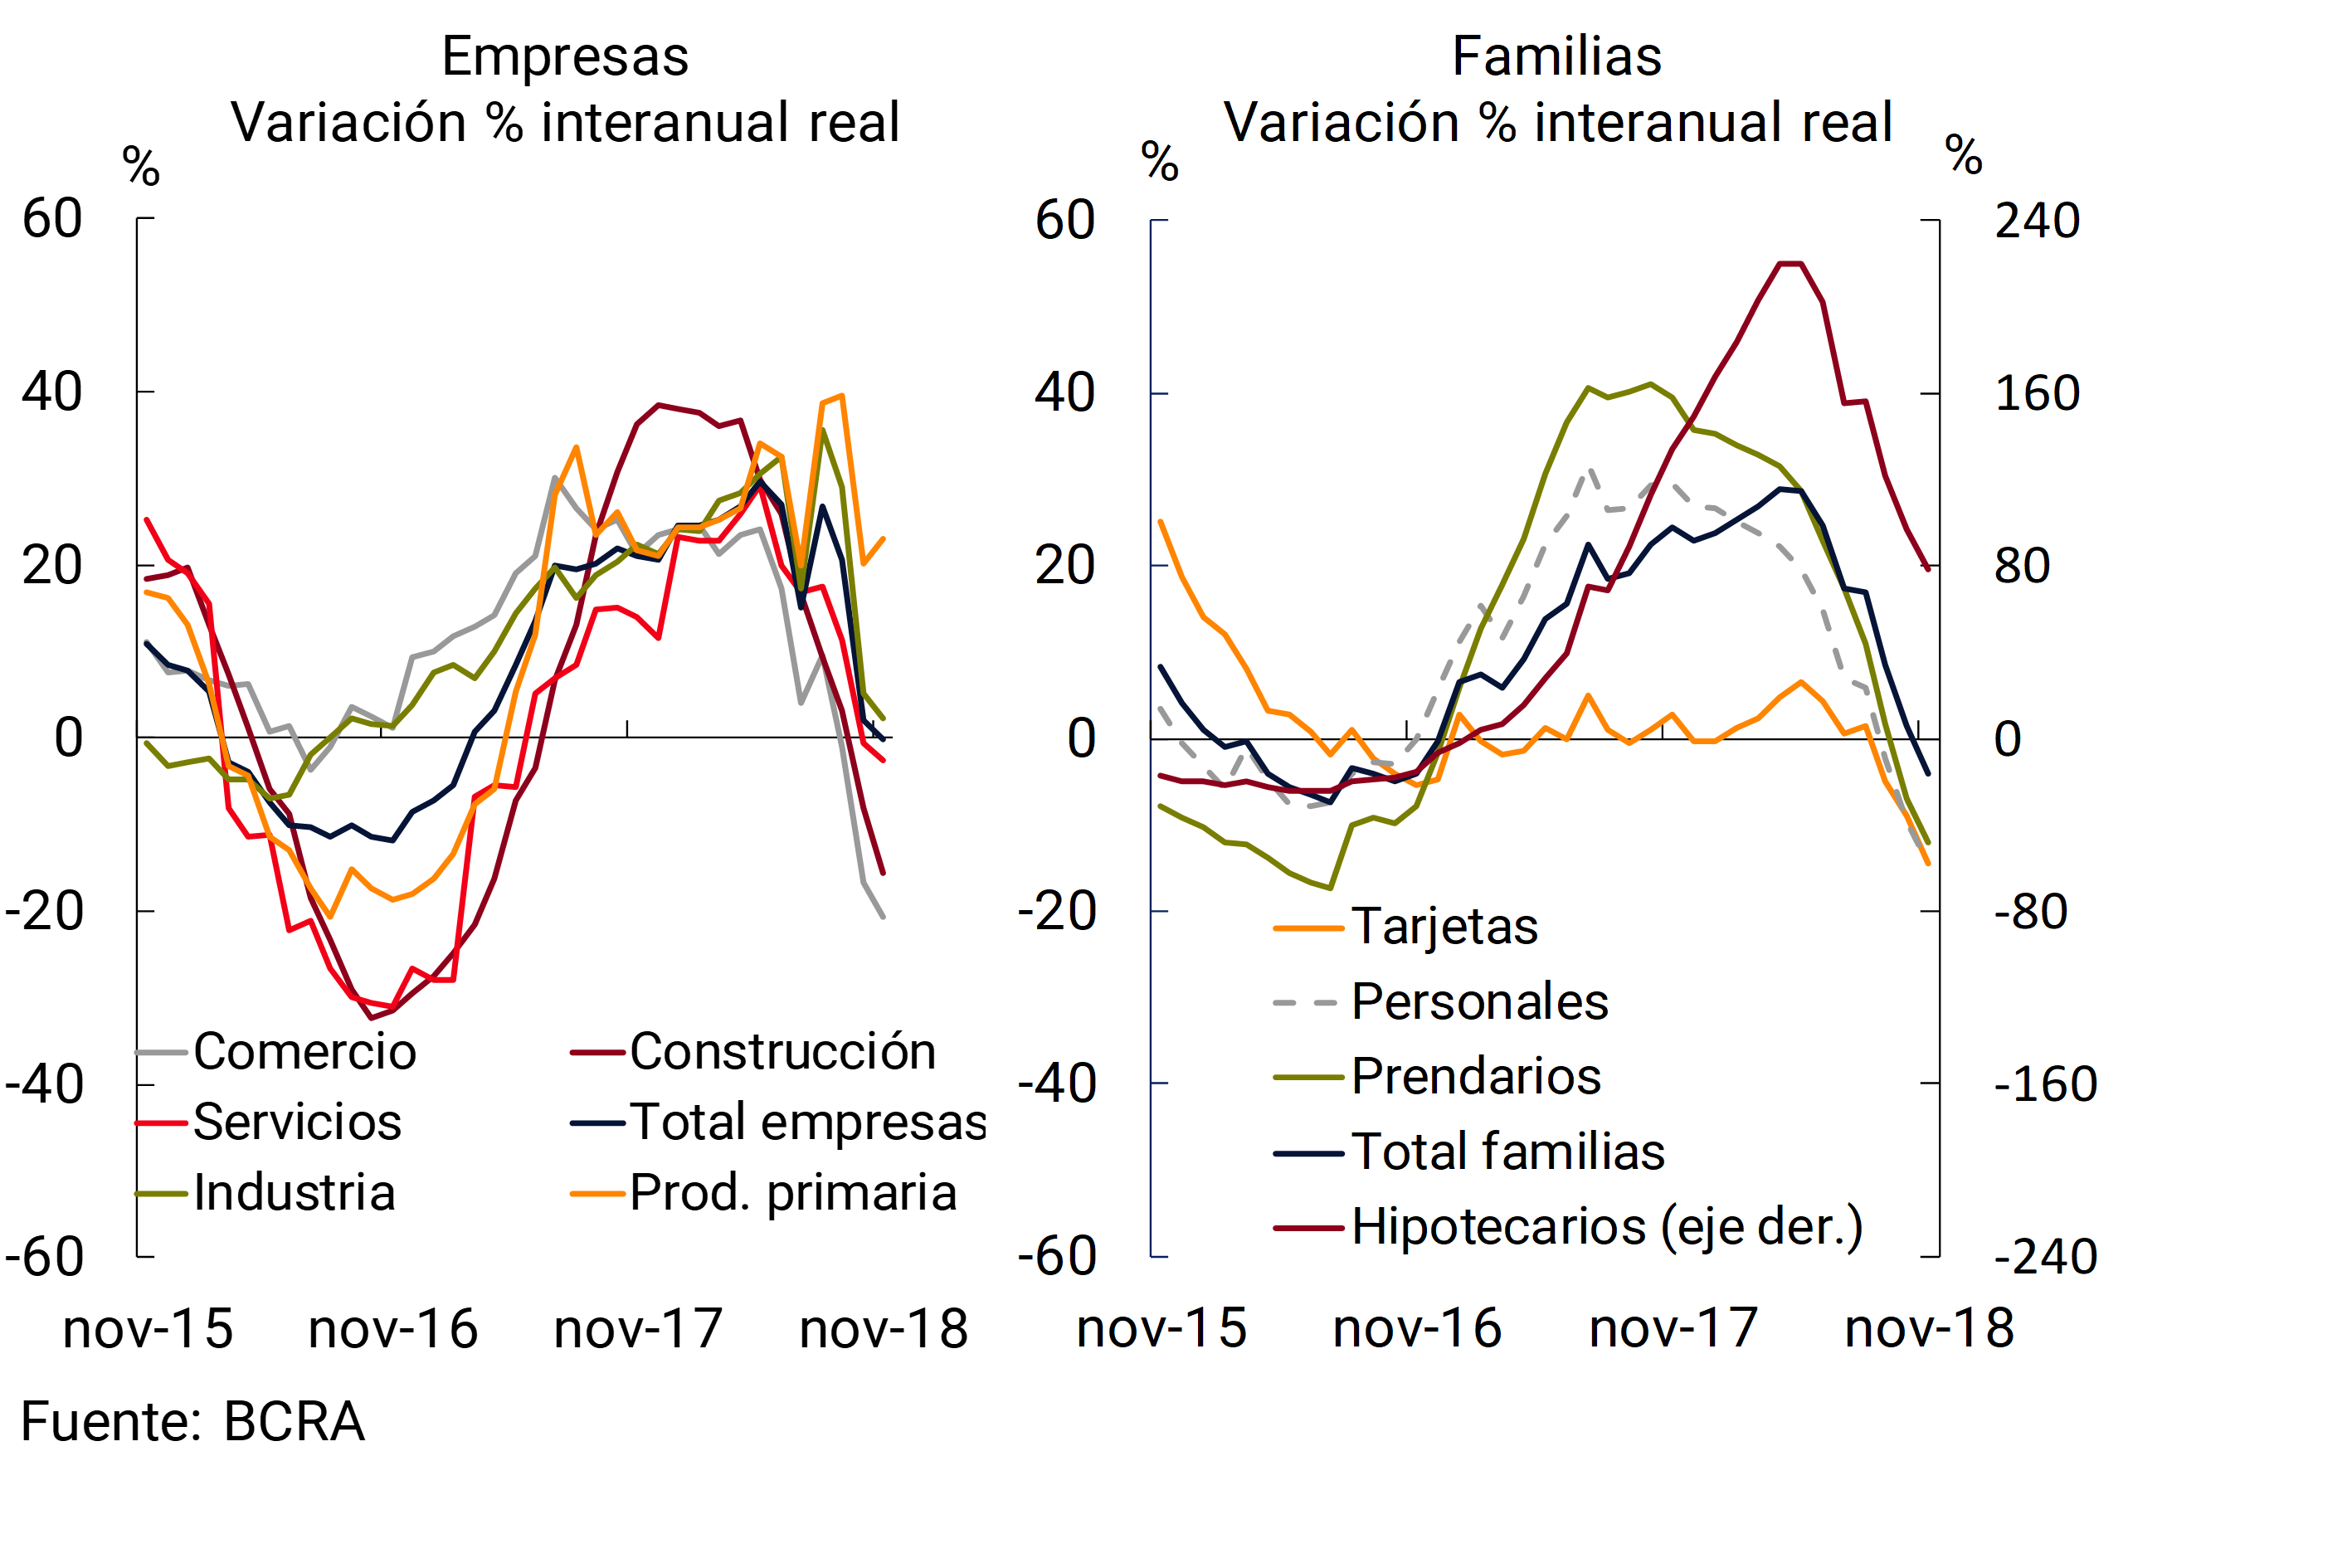
For its part, in the month the balance of bank financing to households decreased 1.5% when adjusted for inflation (+1.6% in nominal terms). 14 Almost all the lines channeled to this segment showed a fall in the month, with the exception of mortgage loans, which increased 2.2% in real terms compared to October. In a year-on-year comparison, total financing to households accumulated a decrease of 4.1% in real terms (see Chart 11), driven mainly by consumer lines (cards and personal). 15
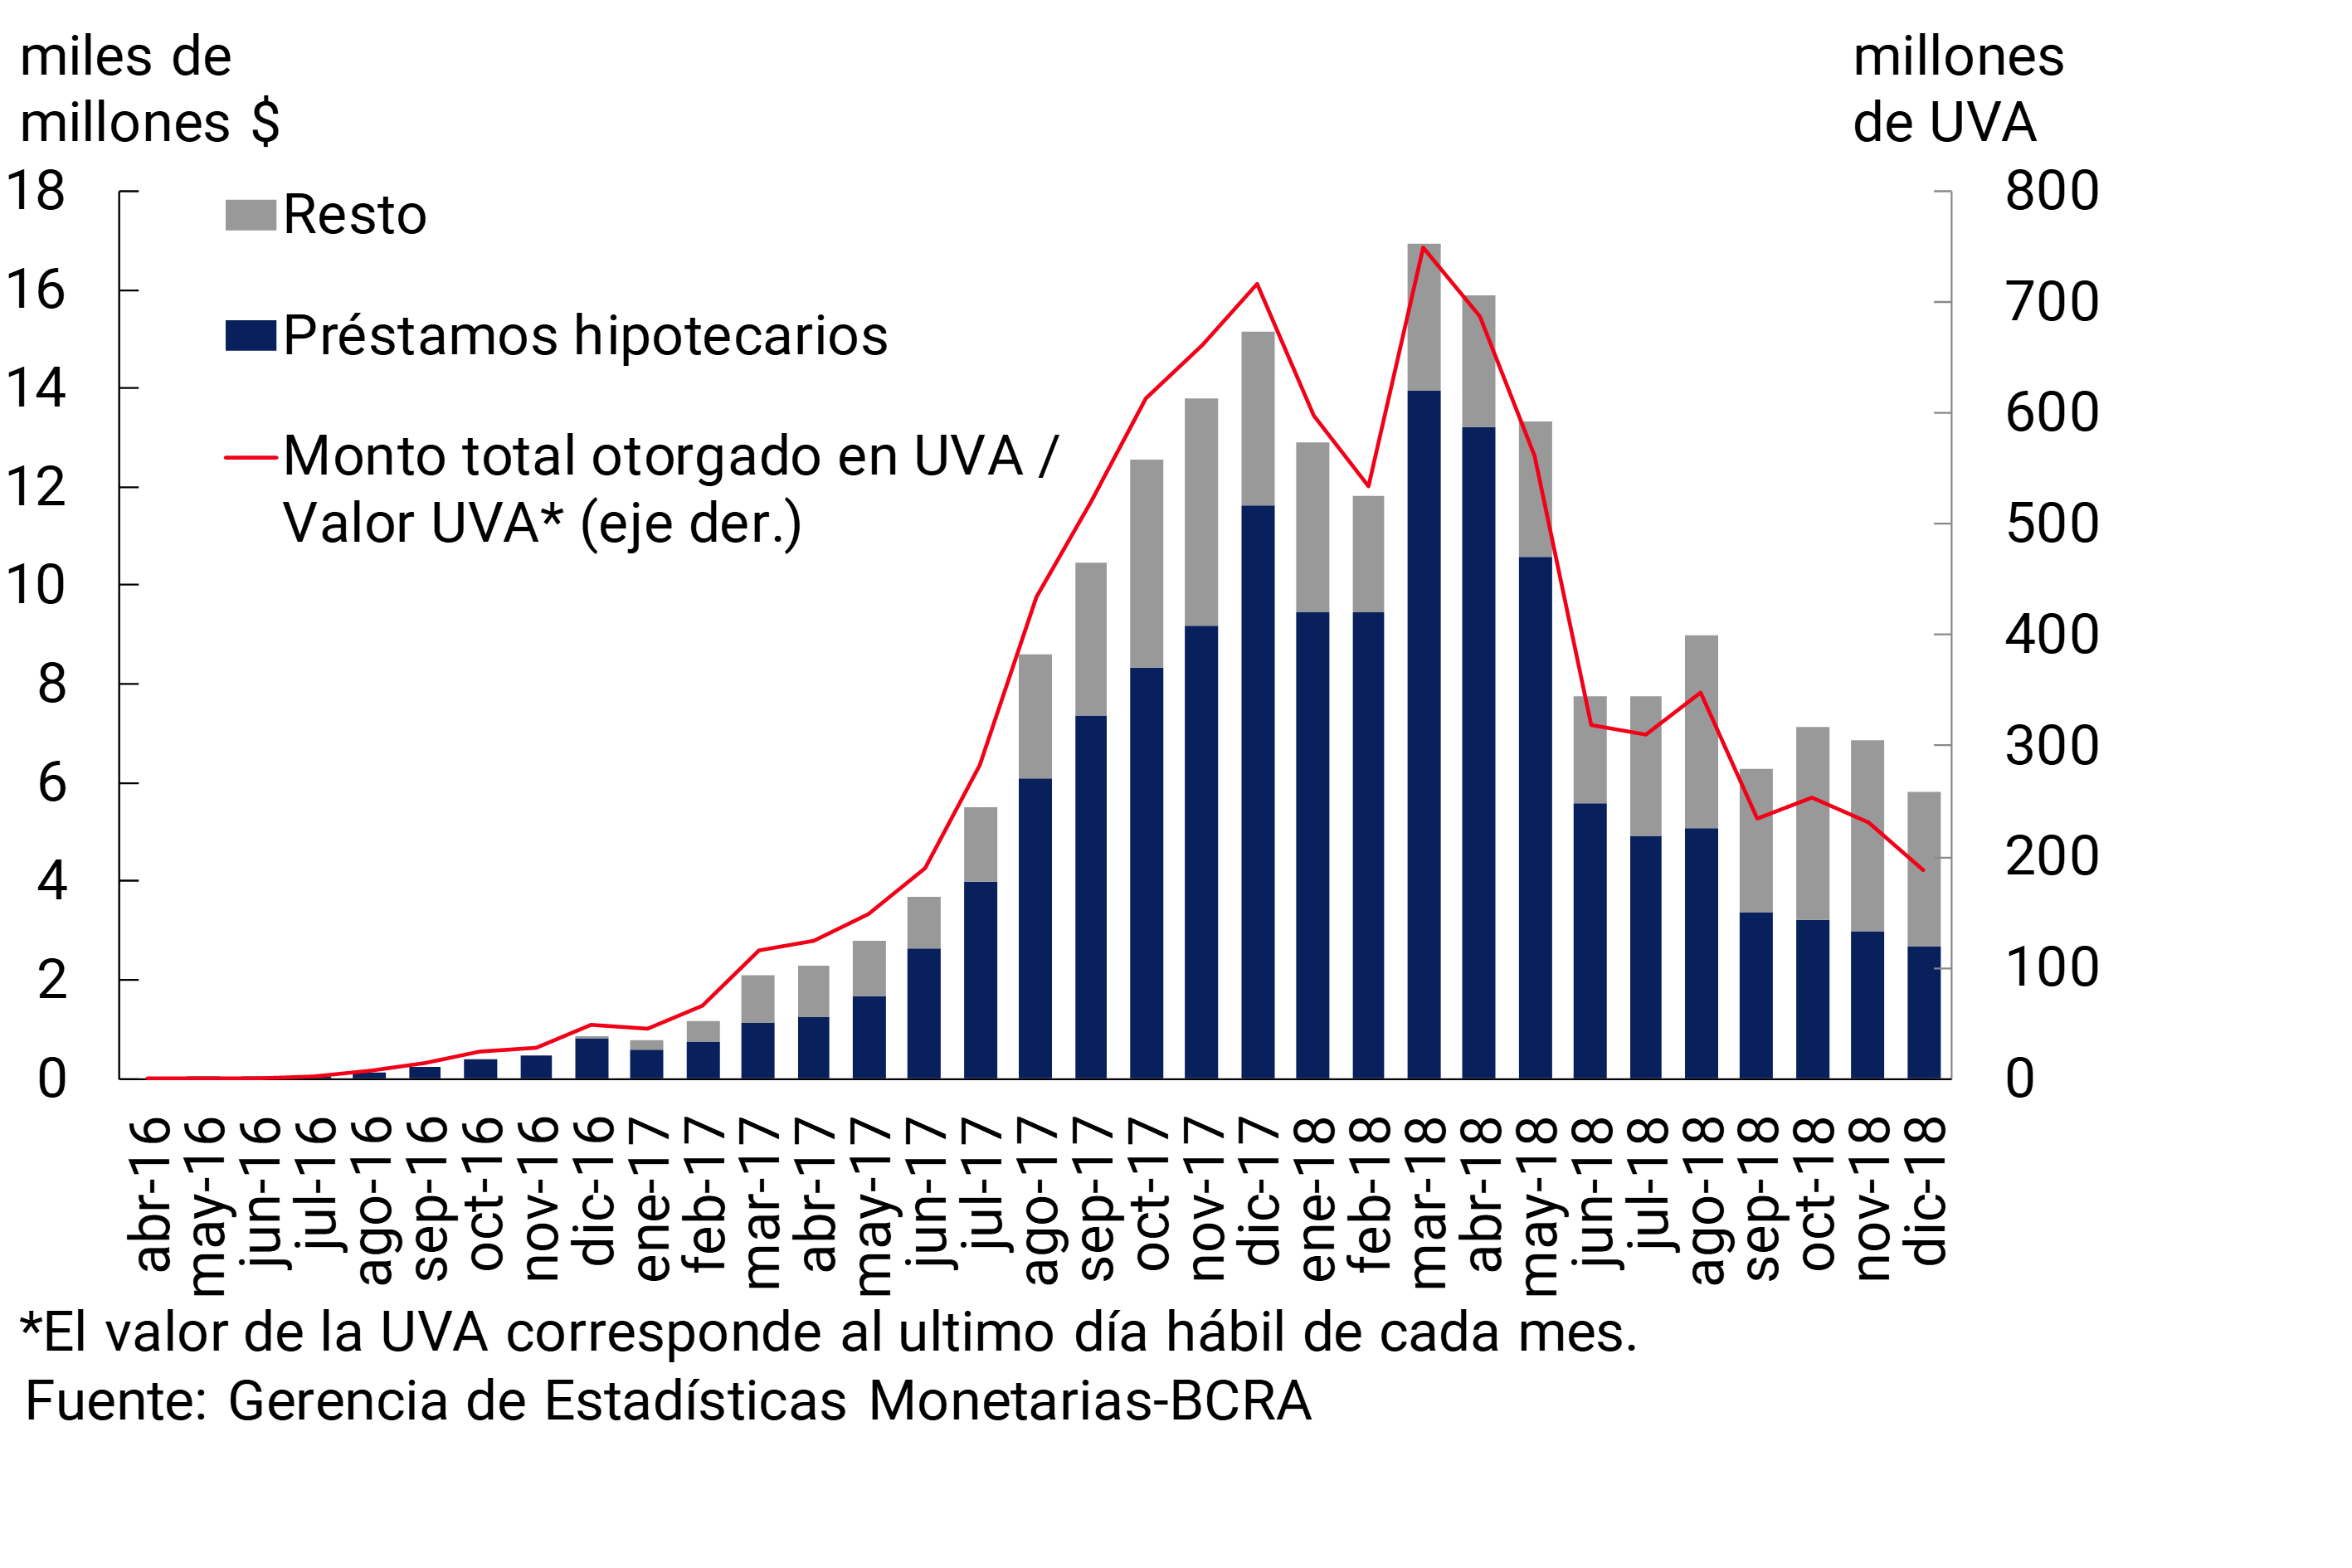
In the last month of the year, total loans granted in UVA to individuals and legal entities totaled $5,822 million (187 million UVA), 46% of which corresponded to mortgage loans (see Graph 12). 16 Considering the balance sheet of the aggregate financial system, in November UVA financing to the private sector reached $255,721 million (11.2% of the total balance of loans to the private sector). 17 Distinguishing by line, in November the balance of mortgage credit in UVA stood at $185,393, a level that represents 83% of total mortgage financing to the private sector.
Figure 12 | UVA Financing – Amounts Granted
In November, the lending rates of the aggregate of the financial system operated in pesos with the private sector remained unchanged with respect to the values observed in October, thus giving rise to a slight reduction in the spreads operated when considering the increase in the estimated funding cost of private sector deposits in pesos described in the previous section. 18 The average lending rates traded in UVA during November also remained in line with the values of the previous month, in all credit segments.
From low levels both in historical terms and internationally, the irregularity of credit to the private sector increased slightly in November (+0.25 p.p.), to represent 2.8% of the total portfolio. The increase in the month was reflected more intensely in foreign private banks, in a context in which all groups of banks showed increases in their credit default ratios (see Graph 13). The non-performing coefficient of loans to companies reached 2.2% in the month, 0.4 p.p. above the value observed in October and 1.2 p.p. compared to the level of a year ago (see Graph 14). The monthly performance was driven mostly by loans to construction and primary production. 19
Figure 13 | Irregularity of Credit to the Private Sector – Irregular financing / Total financing (%)
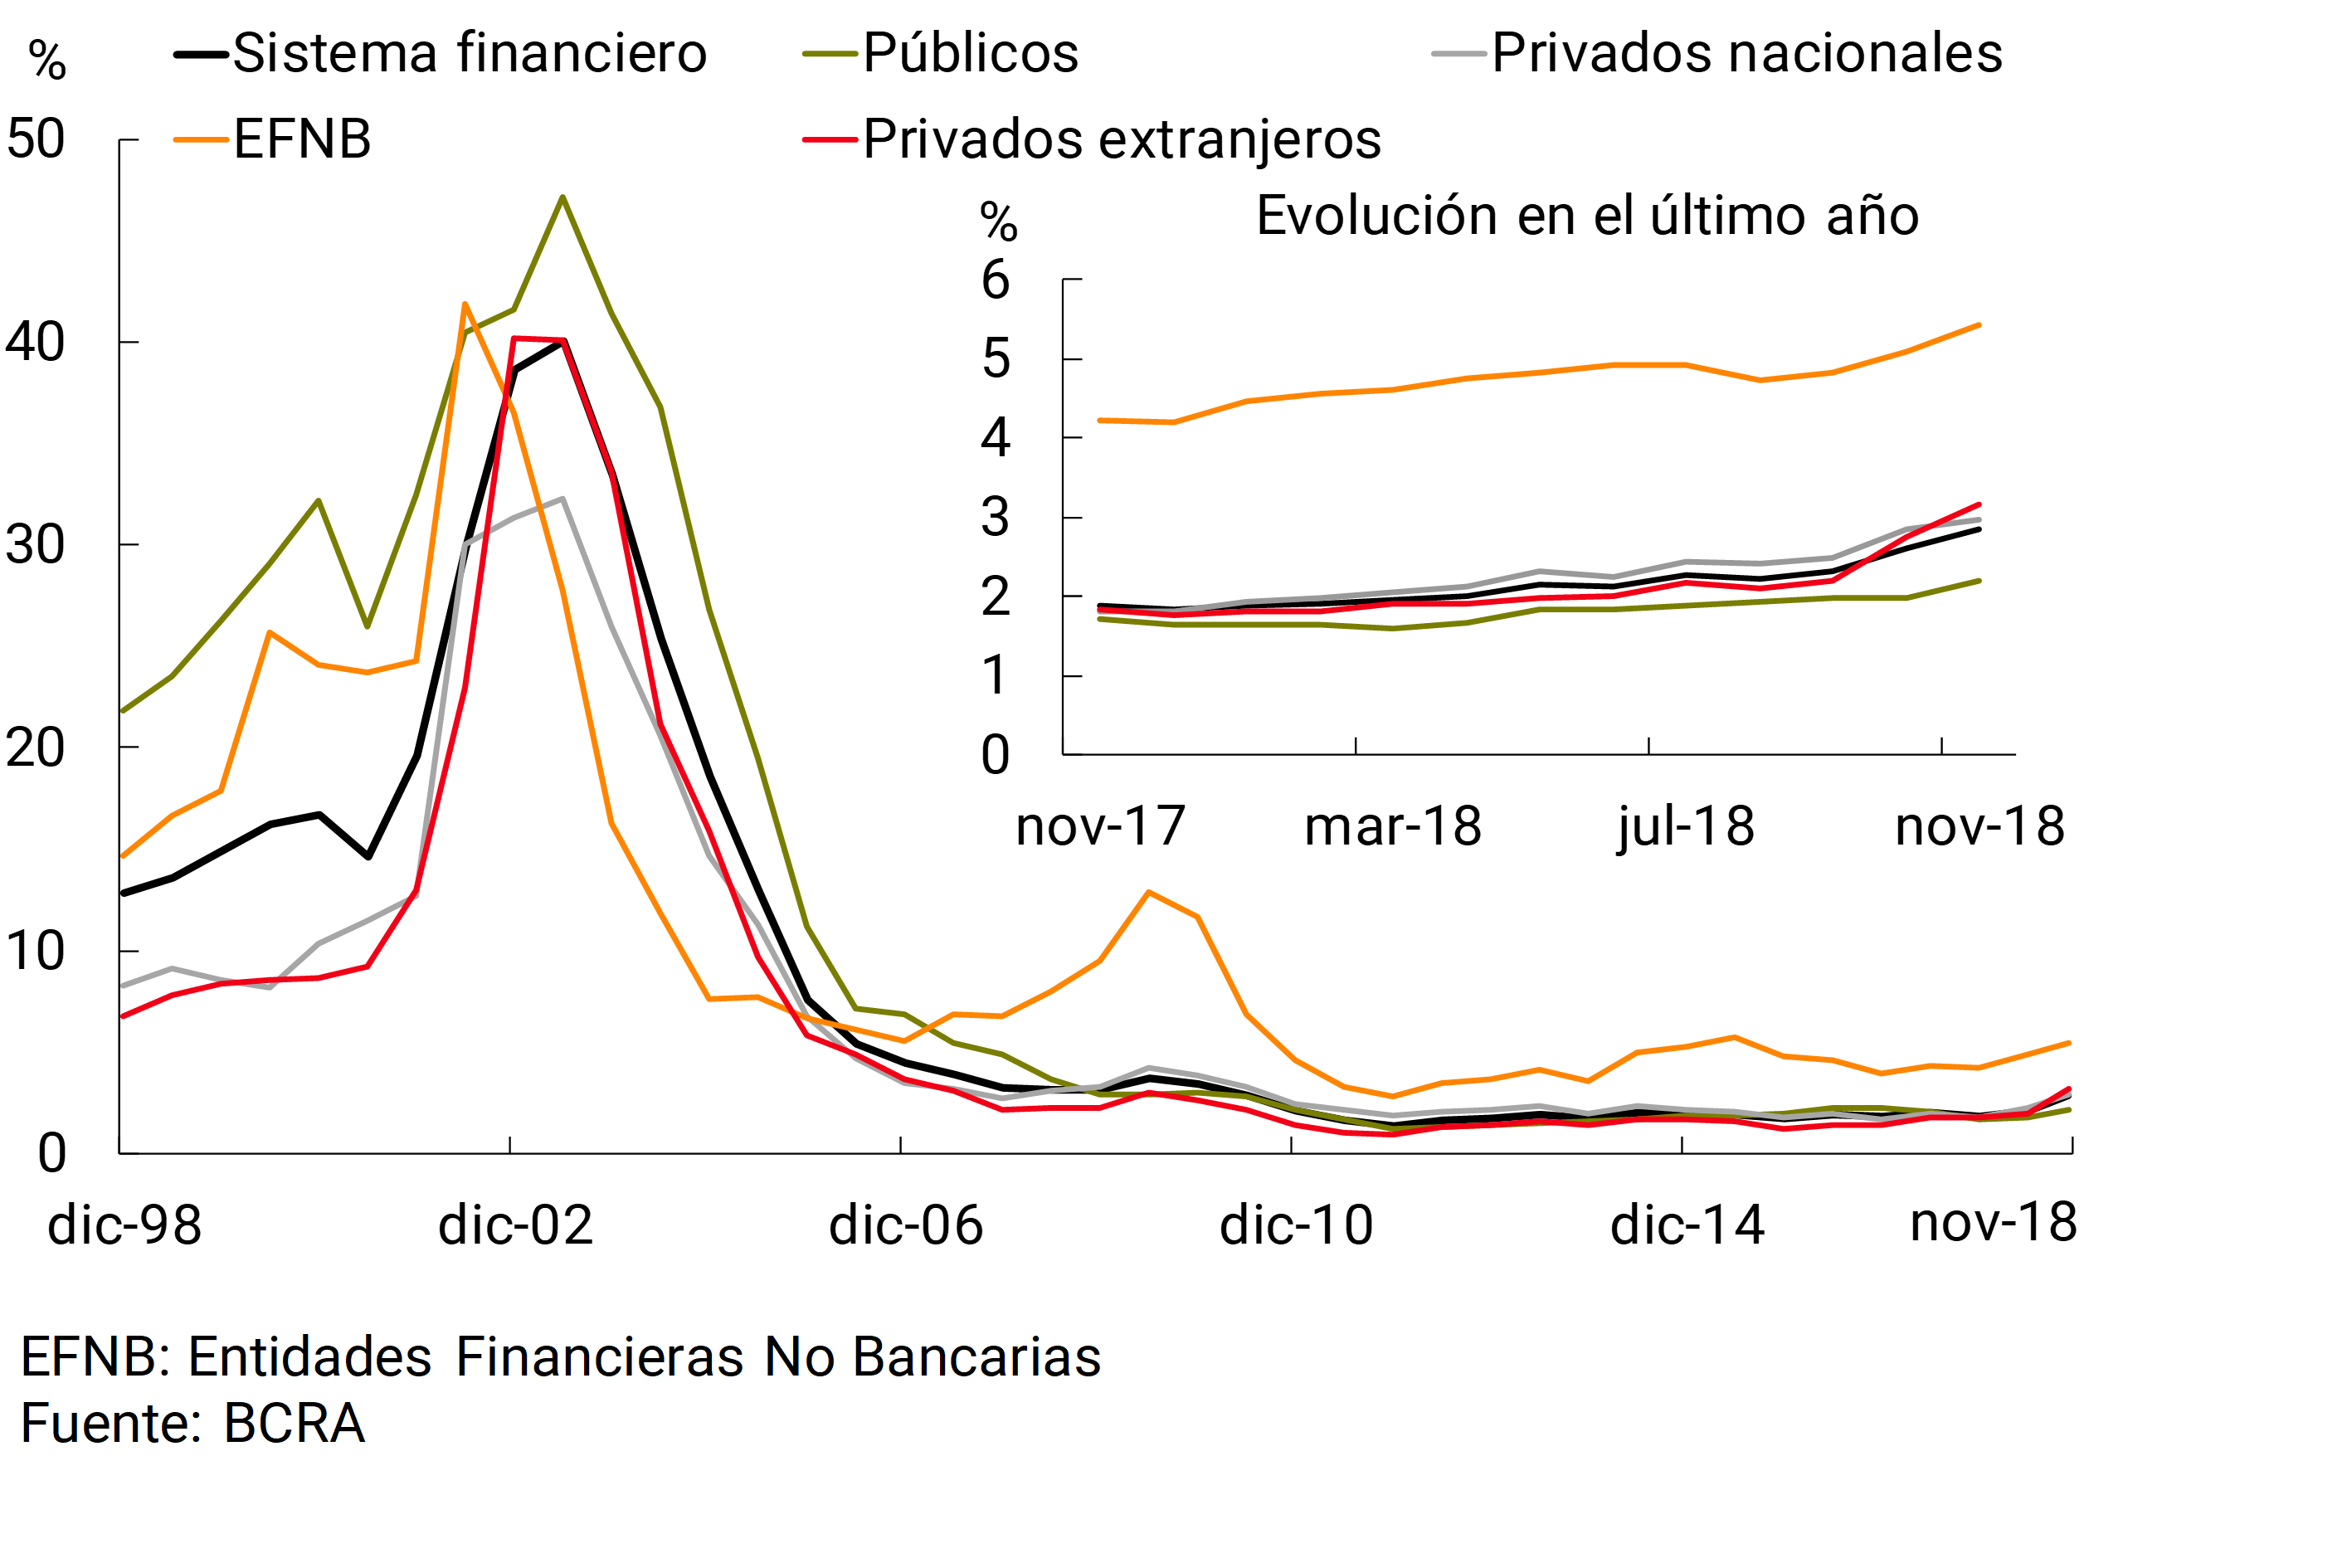
Figure 14 | Irregularity of Credit to the Private Sector – Irregular financing / Total financing (%)
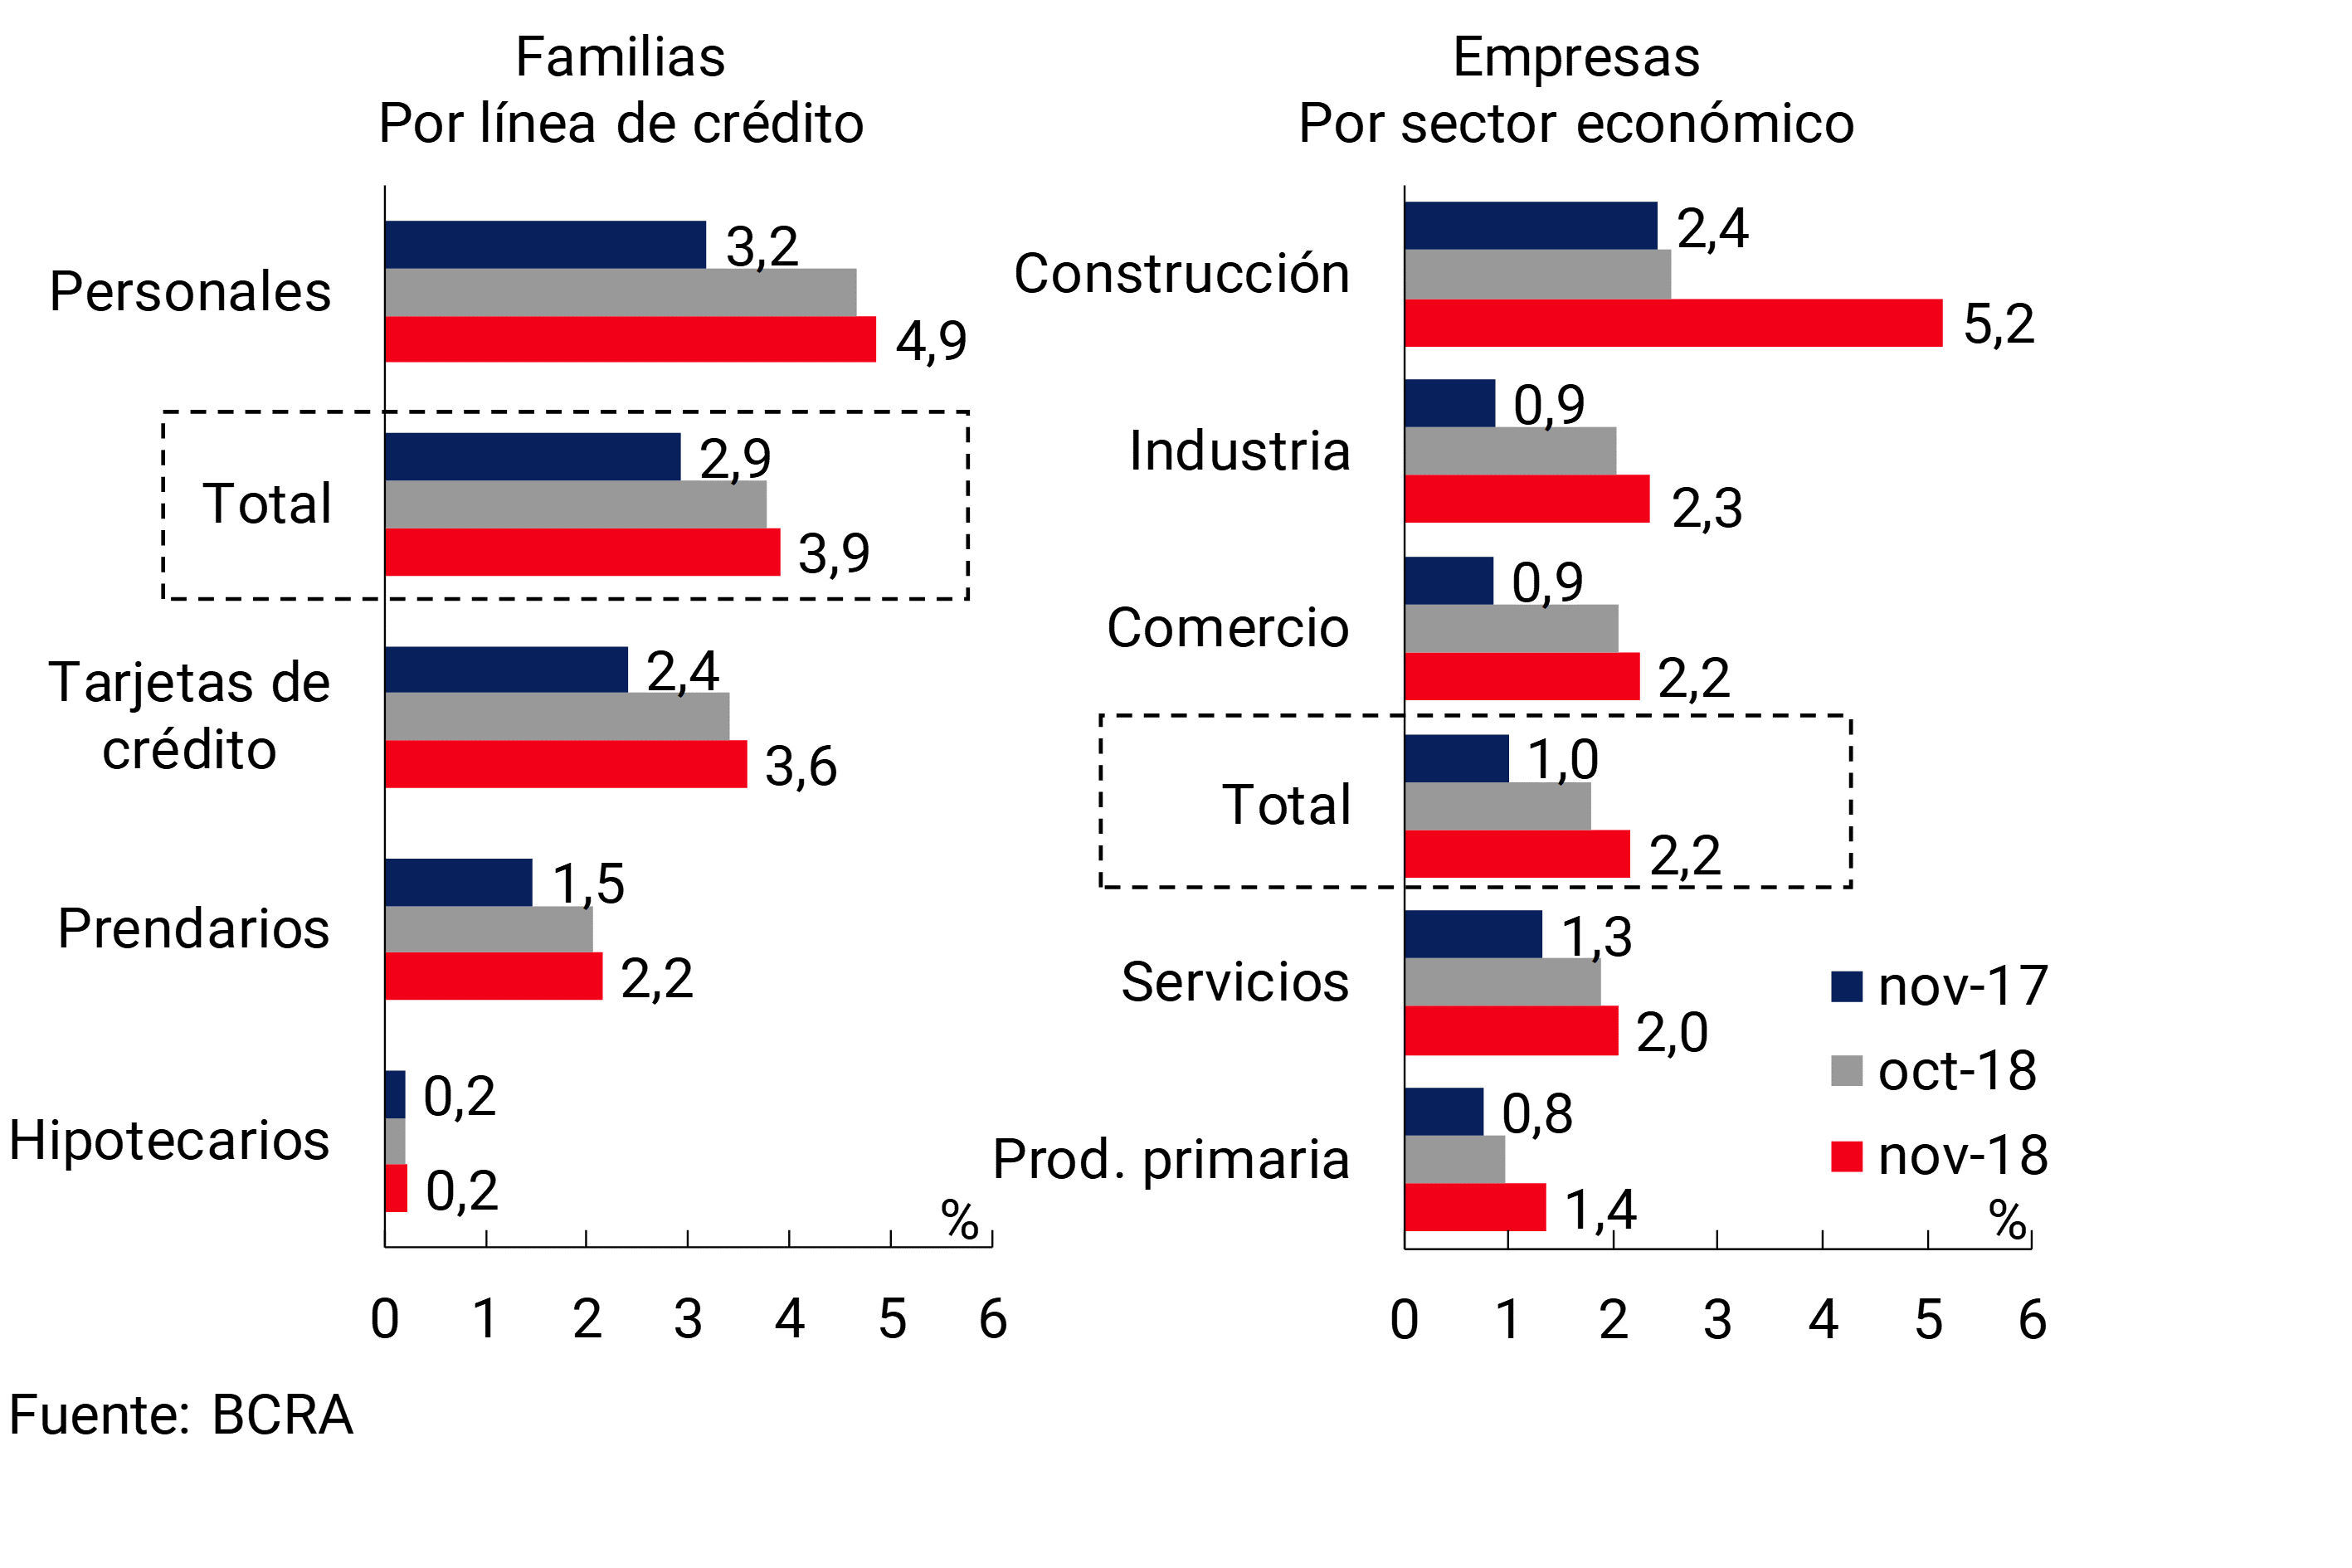
The NPL ratio for loans to households increased slightly compared to the previous month’s figure, reaching 3.9% (see Chart 14). This level was 1 p.p. above that recorded a year ago, due to the performance of personal loans and cards, and, to a lesser extent, of pledges. For its part, the NPL ratio of mortgage lines continued to be at low levels of around 0.2% (0.17% for those denominated in UVA), remaining unchanged in magnitude in the last twelve months.
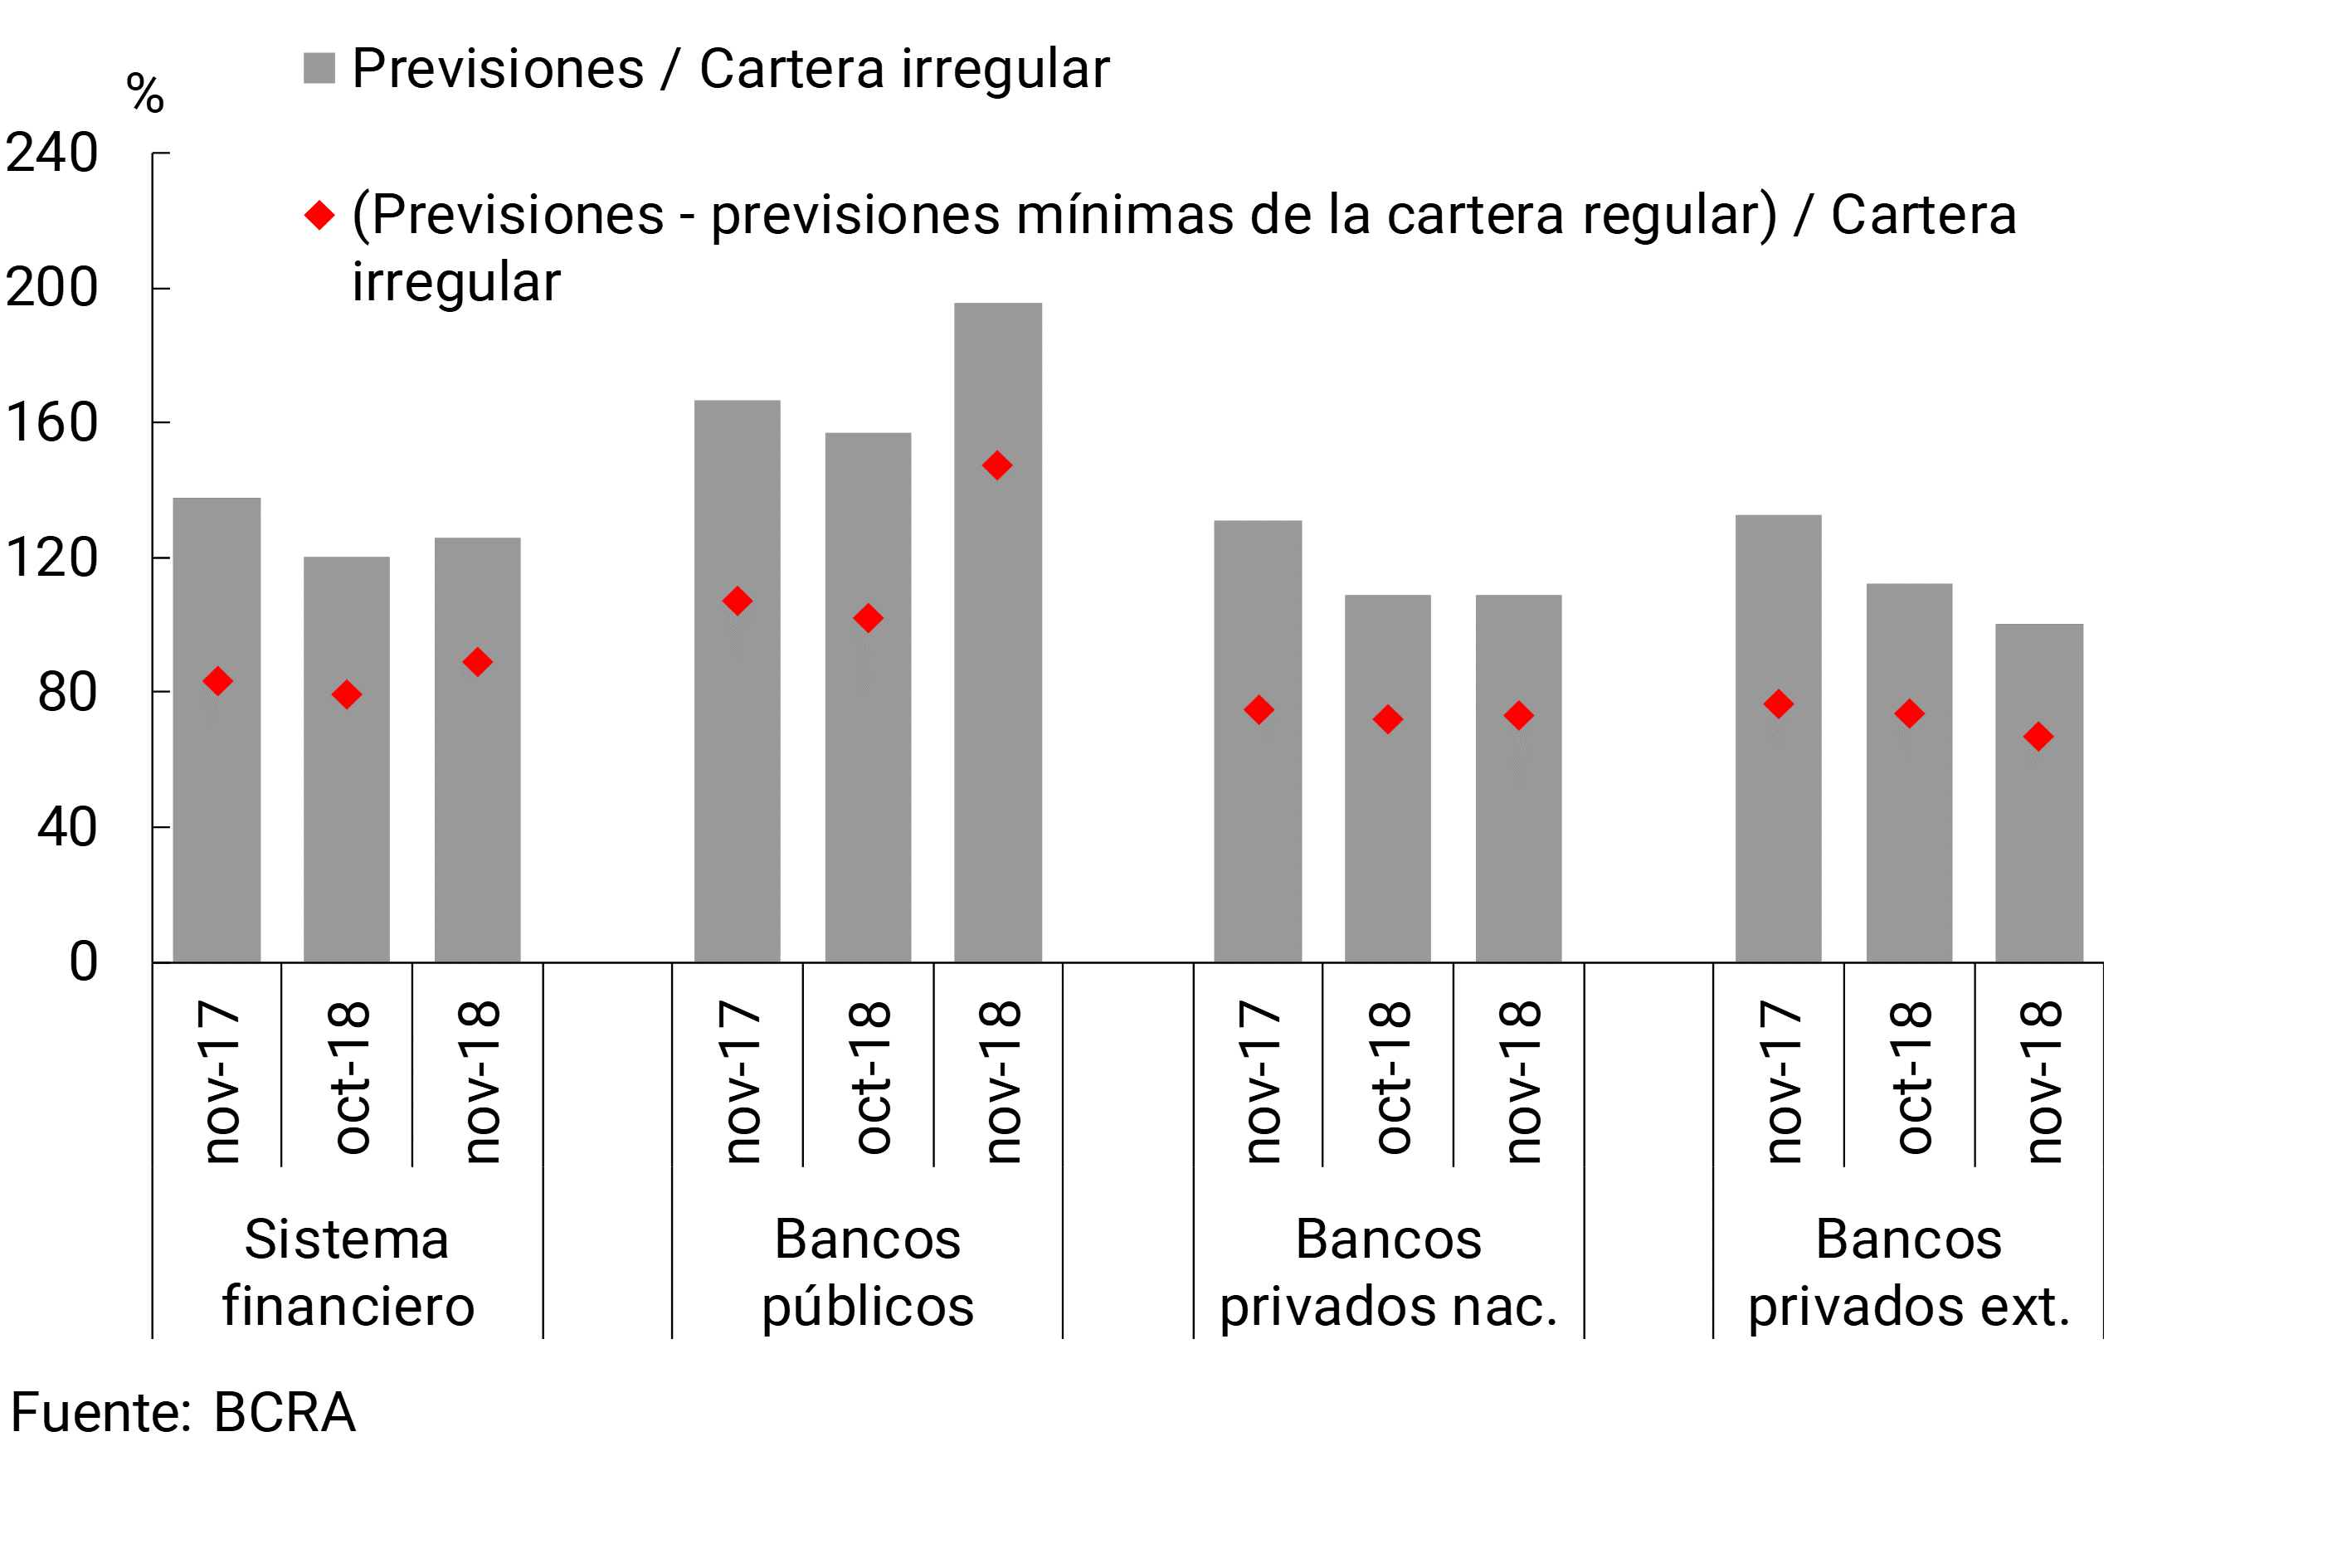
In November, the accounting forecasts of all financial institutions represented 126% of the private sector’s portfolio in an irregular situation (see Chart 15), increasing 6 p.p. with respect to the value recorded in the previous month, a variation mainly explained by an increase in the balance of forecasts (reflected to a greater extent in public banks). Excluding the minimum forecasts for the regular portfolio, the coverage ratio of the aggregate financial system would stand at 89% in the month, comfortably exceeding the level of minimum forecasts required for the portfolio in this situation (44%).
Figure 15 | Forecasting of the Financial System
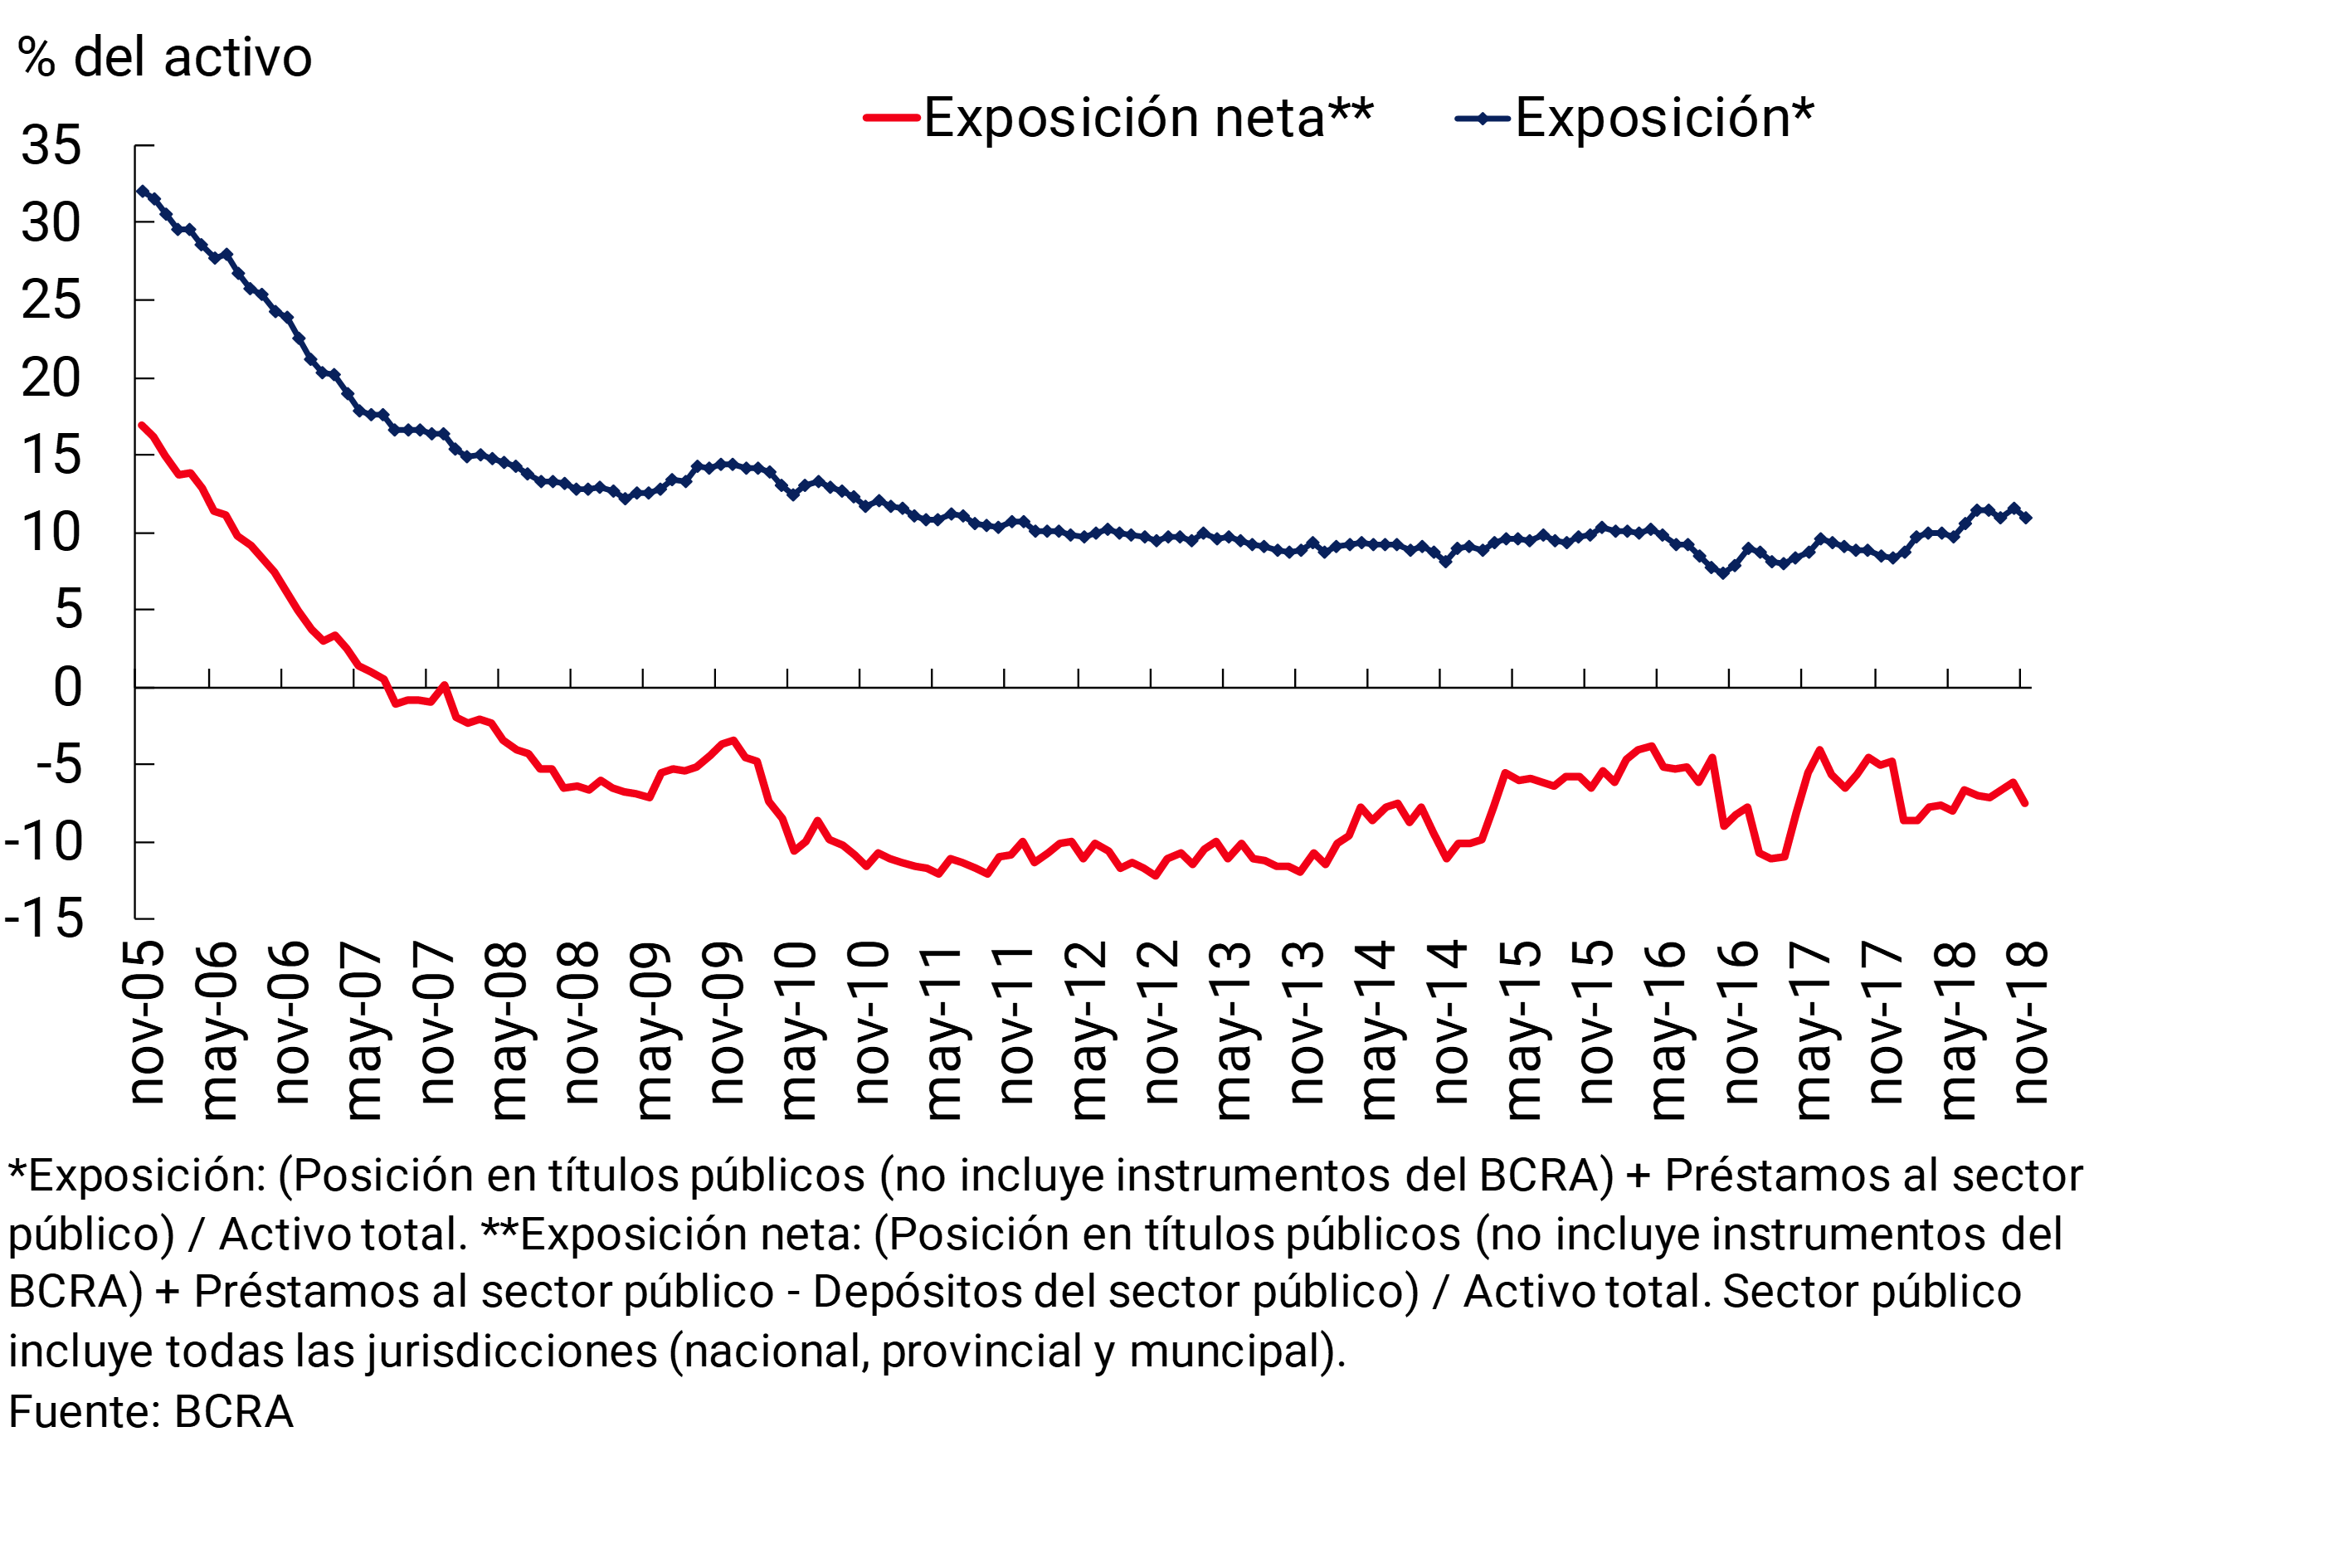
In November, the financial system’s equity exposure to the private sector remained at low values of around 1.3%, a level similar to that observed a year ago. 20 For its part, in the month the gross exposure of all financial institutions to the public sector represented 11% of total assets, 0.6 p.p. below the value of the previous month and 2.5 p.p. above the level of a year ago (see Chart 16). In addition, if the balance of public sector deposits is netted, the financial system’s exposure to this sector would stand at -7.5% of total assets in the month.
Figure 16 | Exposure of the Financial System to the Public Sector
V. Solvency
The solvency indicators of the financial system continued to exhibit high levels in the month (see Chart 17). Regulatory capital was around 15.6% of risk-weighted assets (RWA) for the group of banks, being mostly composed of the best quality (level 1 capital). 21 Capital integration grew by 0.4 p.p. of RWAs in the month, a variation driven by national public and private banks. 22 On the other hand, excess integration represented 82.4% of the regulatory requirement in the period.
Figure 17 | Capital Integration and Regulatory Capital Excess
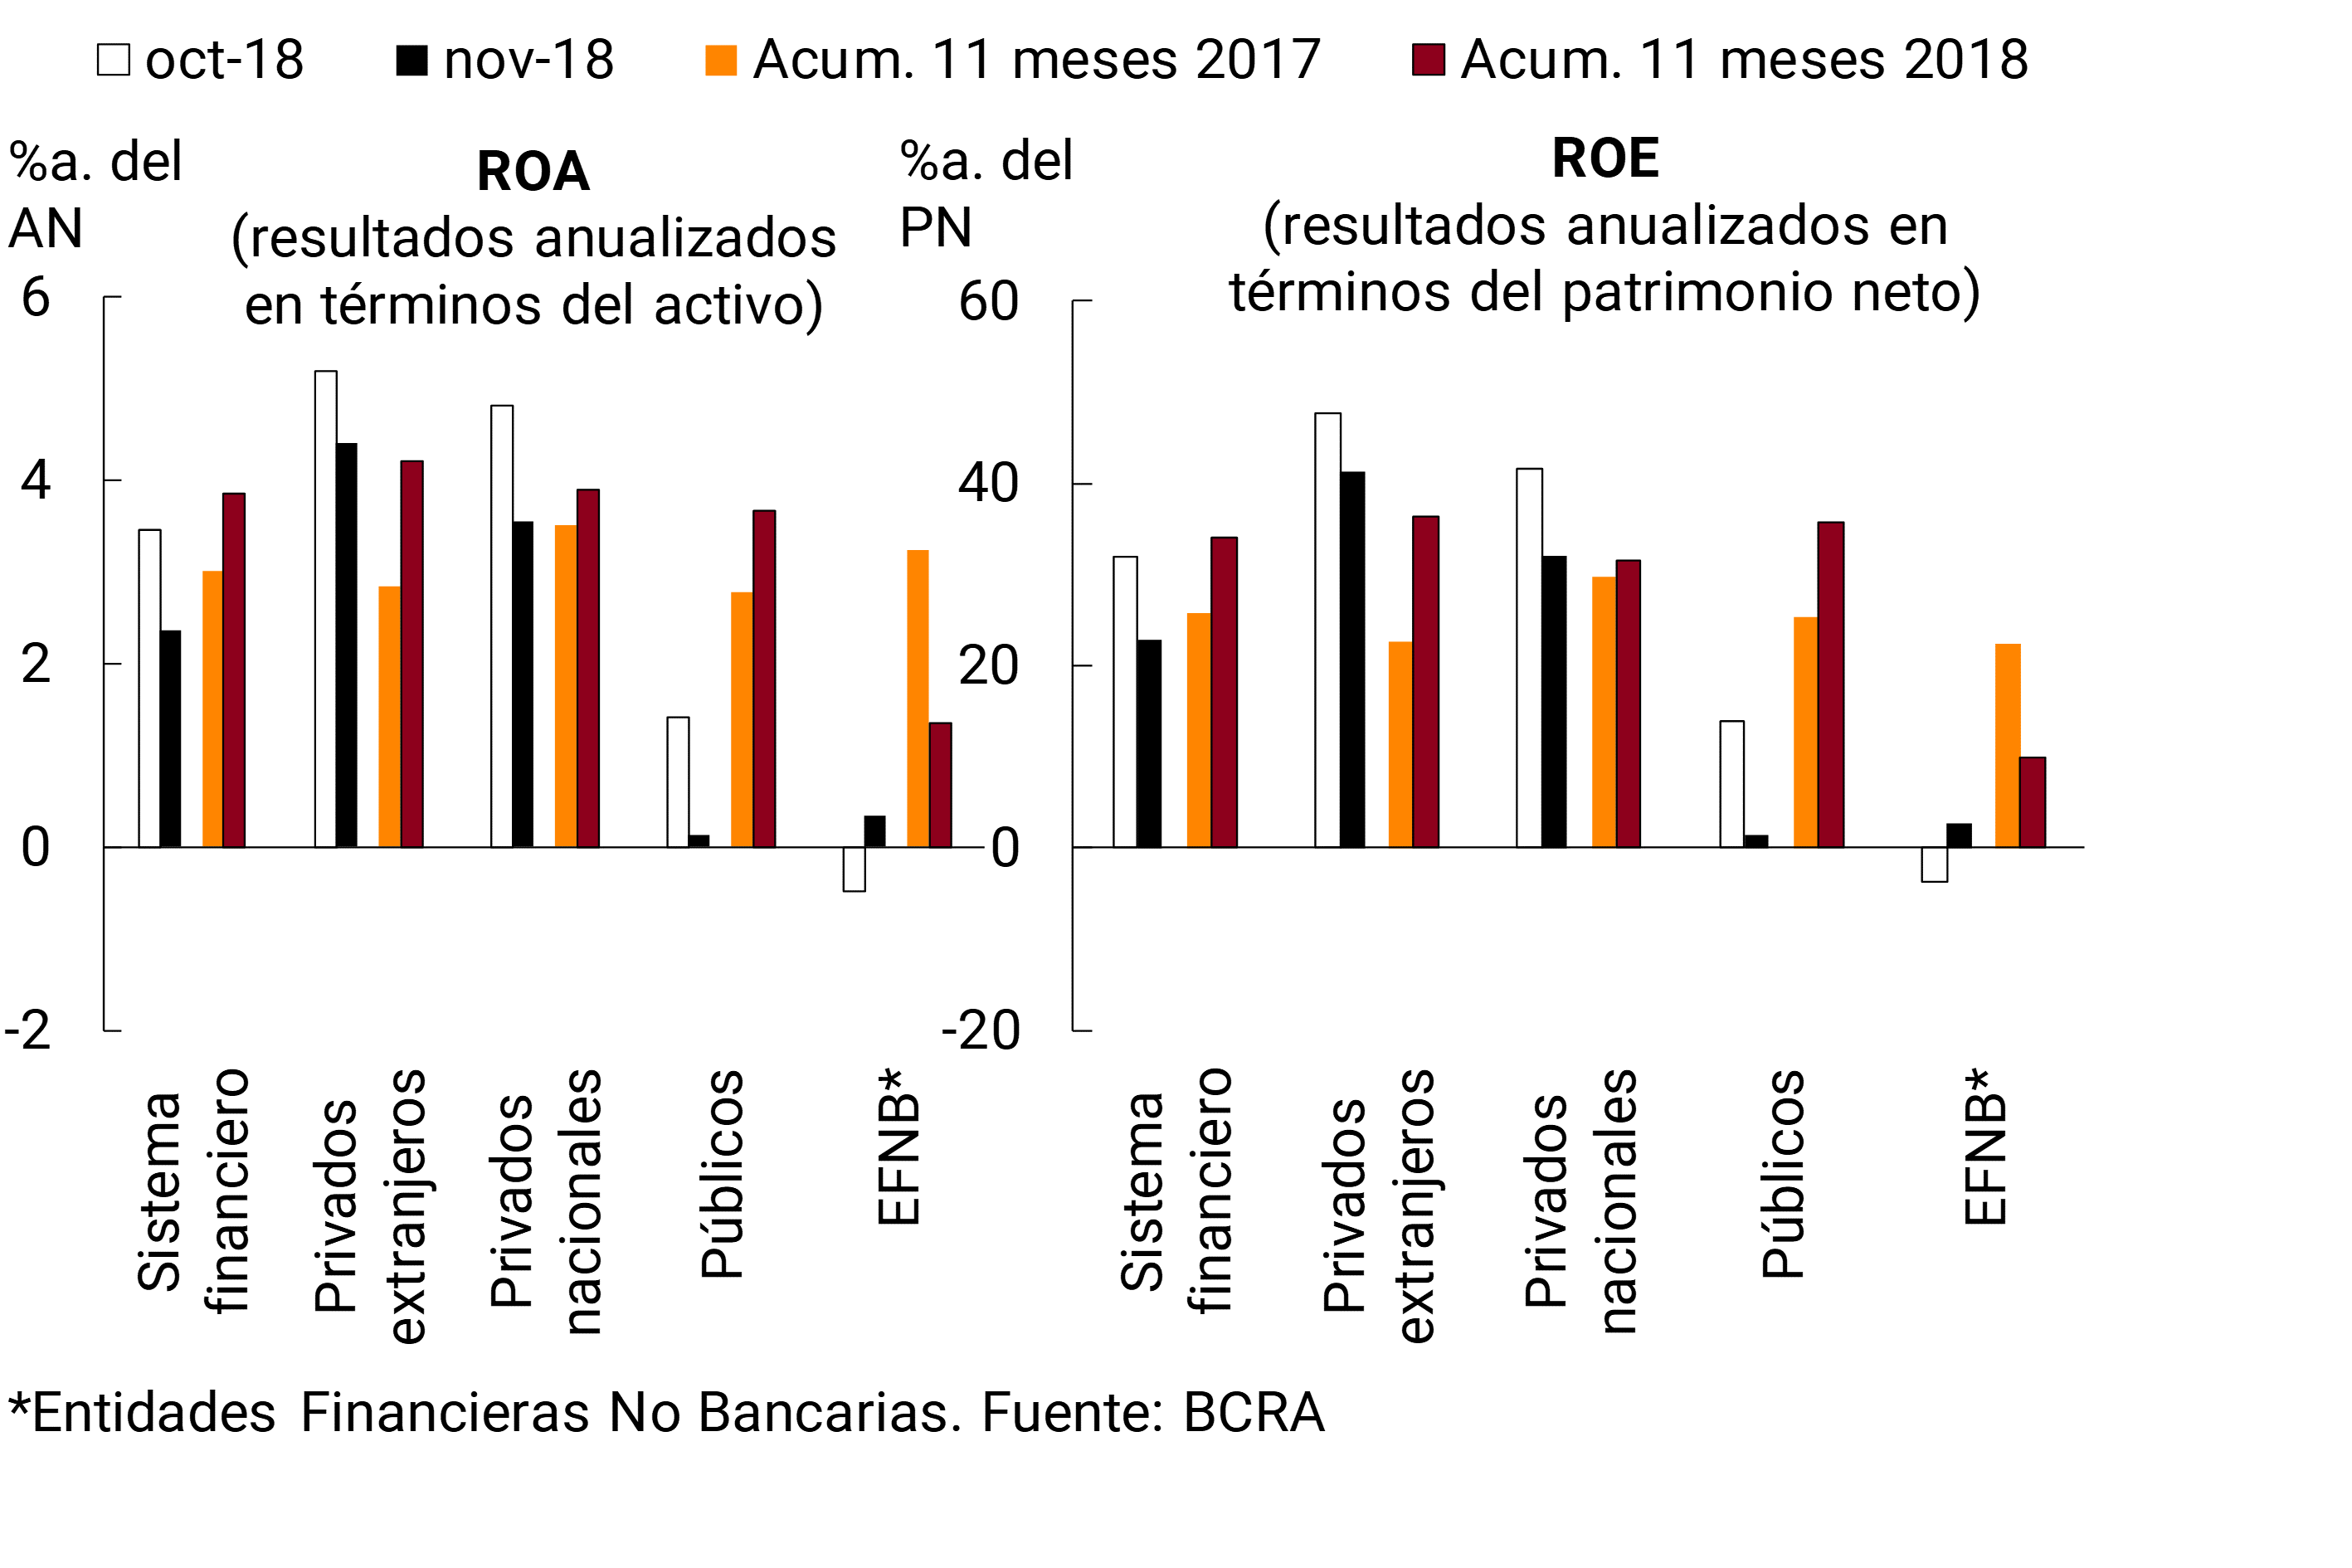
In November, banks recorded nominal accounting gains equivalent to 2.4% of assets (ROA) (1.1 p.p. lower than last month’s record), reaching 4% y.a. in private banks (1 p.p. below the previous month) (see Chart 18). Notwithstanding the monthly performance, in the year to date, the banks as a whole accrued nominal profits close to 3.8% of assets and 34.1% of equity, which were higher than those of the same period last year (0.8 p.p. with respect to assets and 8.3 p.p. in relation to capital). 23
Figure 18 | Profitability by Group of Financial Institutions
In the month, banks’ financial margin fell by 0.3 p.p. of assets to 9.9%y, basically as a result of higher interest expenses (in line with the monthly performance of time deposits) combined with lower interest income (see Chart 19). On the other hand, the increase in gains due to differences in share price and in the results linked to operations with CER partially offset the fall in the financial margin. Over the course of the year, the financial margin of the banks as a whole reached 10.5% y/a. of assets, 0.3 p.p. above the figure recorded in the same period of the previous year.
Figure 19 | Income Table – Financial System
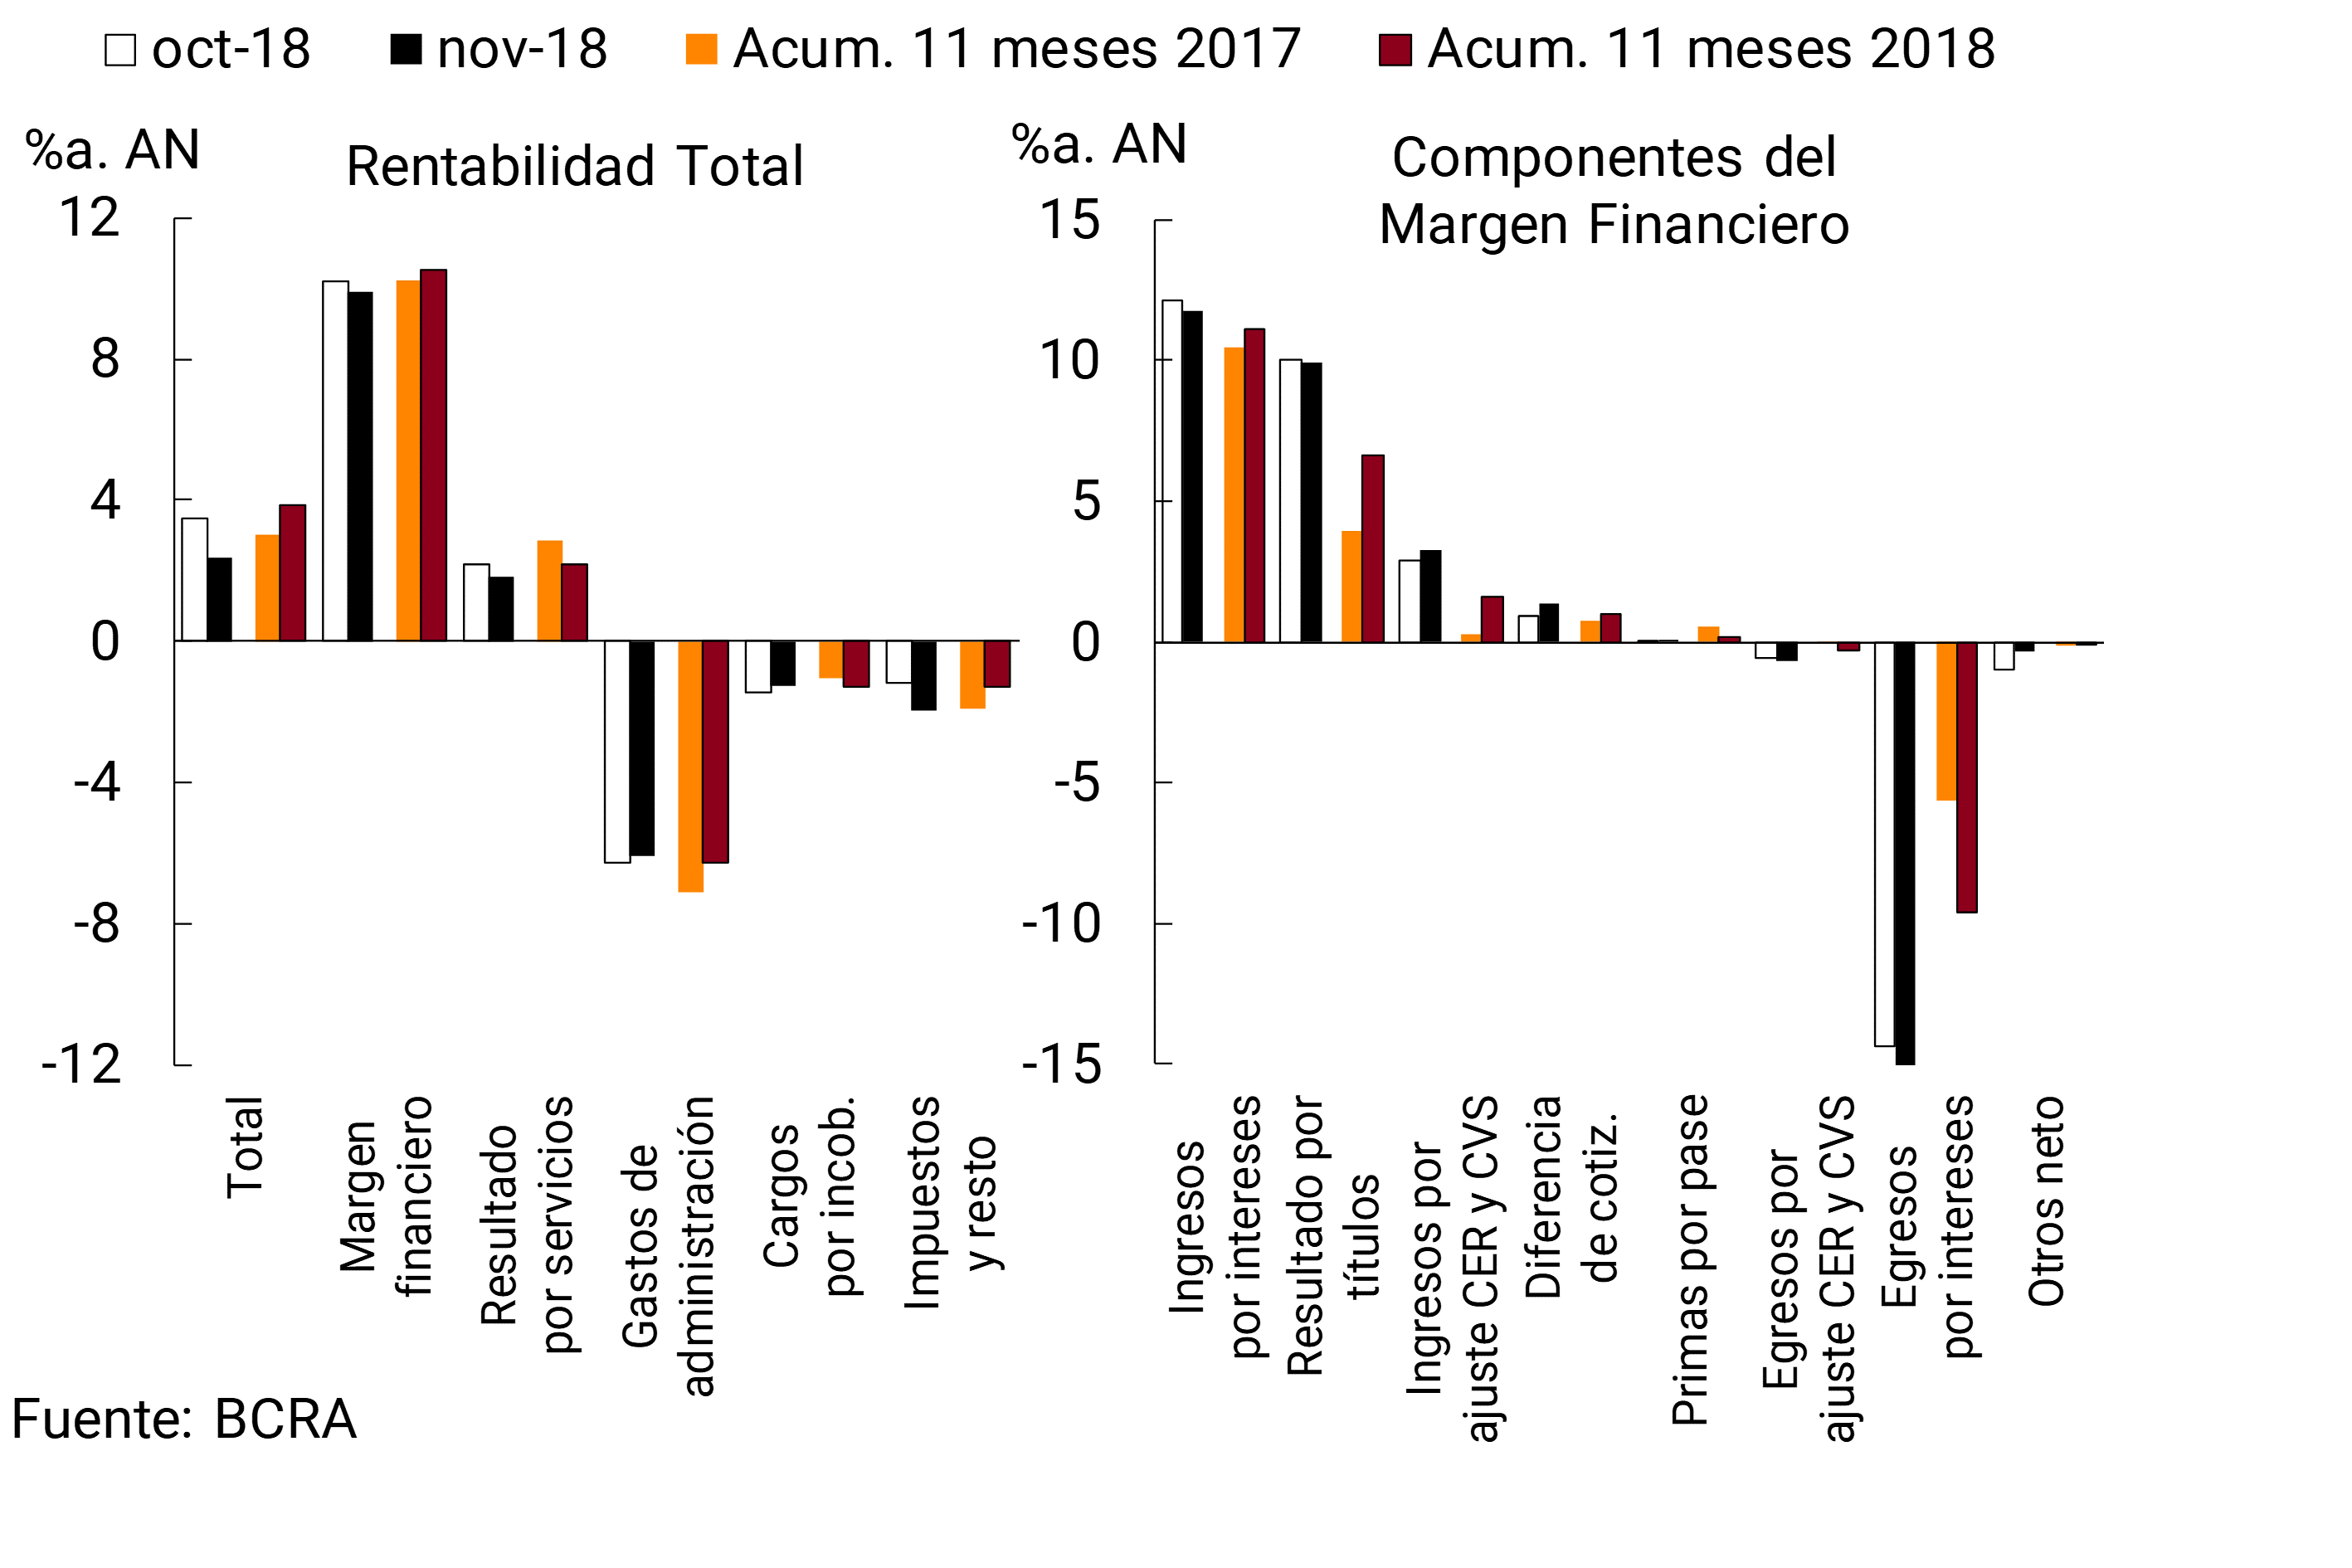
Net income from services in the financial system totaled 1.8% y/y of assets in November, thus reducing 0.4 p.p. compared to October (see Chart 19). Between January and November, the profits that banks recorded for this concept were in the order of 2.2% of assets, 0.7 p.p. lower than the level observed a year ago.
Bad debt charges declined slightly in the month to 1.3%y/y of aggregate assets (see Chart 19). In the year to date, these expenditures totaled 1.3% of assets, 0.3 p.p. more than what was observed for the first 11 months of 2017. Thus, in line with the deterioration in the quality of the loan portfolio recorded in the year, bad debt charges are on track to close 2018 at levels higher than those of recent years.
Administrative expenses of the financial system fell 0.2 p.p. of assets in November to 6.1%ya (see Chart 19). Thus, so far this year these expenditures accumulated 6.3% of assets, 0.9 p.p. less than what was observed for the first 11 months of 2017.
Regulations
Summary of the main regulations of the month, implemented by the BCRA, related to financial intermediation activity. The date of publication of the standard is taken as a reference.
Communication A6595 – 08/11/18 | Adjustments are made to the rules on “Minimum Cash”, increasing the minimum cash rate for foreign financial lines, depending on the residual term of the operations.
Communication A6599 – 22/11/18 | The rules on “Large exposures to credit risk” are disclosed, effective as of 1/1/19, and the rules on “Fractionation of credit risk” were repealed, with the exception of the provisions relating to the non-financial public sector that are incorporated into the rules on “Financing to the non-financial public sector”. It is provided that the limits are measured according to the level one capital and not the computable patrimonial liability as in the rules on “Fractionation of credit risk”. Large exposure to credit risk is defined as the sum of all the values of exposure to a counterparty that is equal to or greater than 10% of the institution’s Tier One capital.
Communication A6603 – 28/11/18 | The rules on “Expansion of financial institutions” are adapted, allowing financial institutions to delegate to complementary financial services agencies all active, passive and service operations that they carry out with their customers, subject to compliance with certain requirements. On the other hand, the administration of networks of complementary agencies is added as a complementary activity in the rules on “Complementary services to financial activity and permitted activities”.
Communication A6605 – 29/11/18 | The rules on “Guarantees” are modified, incorporating as preferred guarantee “B”: (i) the pledge or assignment as a guarantee of the bill of sale on future functional units to be built or in the construction stage, with respect to which possession cannot be exercised, as long as it is duly registered in the real estate registry of the corresponding jurisdiction; (ii) the naval mortgage or pledge, registered in the first lien on ships or naval artifacts (enabled or under construction).
References
1 Communication A6616 and Press Release of 20/12/2018.
2 Reference is made to those measures adopted since the date of publication of the previous Report on Banks.
3 Communication A6616 and Press Release of 20/12/2018.
4 For more detail, see Section 4 of the Consolidated Text on “Authorities of Financial Institutions”.
5 Group “A” is made up of those entities in which the amount of their assets is greater than or equal to 1% of the total assets of the financial system. Communication A6475 and Communication A6608.
6 For placements with a residual term of between 30 and 59 days, the requirements were established at 10% in cash, 5% in BOTES 2020 and 10% in LELIQ, while for those deposits with a residual term of 60 to 89 days they were reduced to 5%, 2% and 0%, respectively. Deposits with a residual term of more than 90 days have no minimum cash requirement.
7 Communication A6613 and Communication A6614.
8 To estimate the cash flow, differences in balance sheet balances are made.
9 Idem, previous note.
10 For a more detailed analysis, see Chapter 4 of the Financial Stability Report for the Second Half of 2018.
11 Includes principal adjustments and accrued interest.
12 Includes principal adjustments and accrued interest.
13 Information extracted from the Central Debtors (includes both national and foreign currency). Loans to residents abroad are not included. Adjustments in principal and accrued interest are considered. Business financing is defined here as that granted to legal entities and commercial financing granted to individuals. On the other hand, loans to families are considered to be those granted to individuals, unless they are for commercial purposes.
14 Idem, previous note.
15 Adjustments of principal and accrued interest are considered.
16 The value of the UVA is that corresponding to the last working day of December.
17 Includes capital and adjustment of capital for the evolution of the CER.
18 Includes transactions at a fixed and repacable interest rate.
19 The monthly increase in the irregularity ratio of construction loans was explained by the performance of a particular construction firm. If the specific case of this debtor were excluded, the total delinquency of companies would have stood at 2.1%.
20 Equity exposure to the private sector is defined as the ratio of the private sector’s irregular portfolio net of forecasts associated with the private sector’s irregular portfolio and the consolidated net worth of the aggregate financial system.
21 Tier 1 capital is the one with the highest quality and capacity to face unexpected losses. It mainly includes common shares and accumulated earnings.
22 This movement was partly linked to the process of recognition of the results obtained by financial institutions, to the extent that they have been approved by the auditors (for more details, see section 8 of the Consolidated Text on “Minimum Capital of Financial Institutions”). In addition, with the entry into force of Communication A6586 , the limit for a debtor to be considered as a retailer was extended, thus tempering the volume of RWAs in the financial system.
23 For private banks, in the year to date, ROA was 4.1% y.a. and ROE 33.9%y, 0.9 p.p. and 7.7 p.p., respectively, more than in the same period of 2017.
Glossary
%a.: annualized percentage.
% YoY: Year-on-year percentage.
Liquid assets: availabilities (integration of “minimum cash” in current accounts at the BCRA and in special guarantee accounts and other concepts, mainly cash in banks and correspondent offices) plus the net credit balance for transfer operations of financial institutions against the BCRA using LEBAC and NOBAC.
Consolidated assets and liabilities: those arising from deducting transactions between entities in the system.
Net Assets (NA): Assets and liabilities are net of accounting duplications for pass-through, forward and spot transactions to be settled.
APR: Total Risk Weighted Assets.
BCBS: Basel Committee on Banking Supervision (BCBS).
Irregular portfolio: portfolio in situation 3 to 6, in accordance with the “Classification of Debtors” regime.
Credit to the public sector: Position in public securities (without LEBAC or NOBAC) + Loans to the public sector + Compensation to be received + Debt securities and Certificates of participation in financial trusts (with underlying public securities) + Miscellaneous credits to the public sector.
Credit to the private sector: loans to the non-financial private sector including accrued interest and CER and CVS adjustment and leasing.
Contribution differences: Results from the monthly update of assets and liabilities in foreign currency. The item also includes the results originated by the purchase and sale of foreign currency, which arise as a difference between the agreed price (net of the direct expenses originated by the operation) and the book value.
Miscellaneous: miscellaneous gains (including, but not limited to, gains on permanent interests, recovered loans and unaffected provisions) minus miscellaneous losses (including, but not limited to, losses on permanent interests, loss on the sale or impairment of goods in use and amortization of business keys).
Equity exposure to counterparty risk: irregular portfolio net of provisions in terms of equity.
Administration expenses: includes remunerations, social charges, services and fees, taxes and amortizations.
IEF II-17: BCRA Financial Stability Report.
IPCBA: Consumer Price Index of the City of Buenos Aires.
CSF: Liquidity Coverage Ratio (LCR).
LEBAC and NOBAC: bills and notes issued by the BCRA.
LELIQ: BCRA liquidity bills.
LR: Leverage Ratio (LR).
Financial margin: Income minus financial expenses. It includes interest and securities earnings, CER and CVS adjustments, exchange rate differences and other financial results.
Mill.: Million or million, as appropriate.
IFRS: International Financial Reporting Standards.
ON: Negotiable Obligations.
ORI: Other comprehensive results.
OS: Subordinated Obligations.
Other financial results: rental income from financial leases, contribution to the deposit guarantee fund, interest on availabilities, charges for loan depreciation, premiums for the sale of foreign currency and other unidentified items.
PN: Net Worth.
p.p.: percentage points.
SME: Small and Medium Enterprises.
Consolidated profit: Results from permanent holdings in local financial institutions are eliminated. Available since January 2008.
Income from securities: includes results from public securities, temporary shares, negotiable obligations, subordinated obligations, options and other credits for financial intermediation. In the case of public securities, it includes the results accrued in terms of income, differences in share price, exponential increase based on the internal rate of return (IRR) and sales, in addition to the charge for forecasts for the risk of impairment.
Interest income: interest charged minus interest paid for financial intermediation, following the accrual criterion (balance sheet information) and not what is received. It includes interest on loans and deposits of government securities and premiums for passes.
Result for services: commissions charged minus commissions paid. It includes fees related to obligations, credits, securities, guarantees granted, the rental of safe deposit boxes and foreign and exchange operations, excluding in the latter case the results from the purchase and sale of foreign currency, the latter being accounted for in the “Differences in quotation” account. Expenses include commissions paid, contributions to the ISSB, other contributions for income from services and charges accrued from the gross income tax.
ROA: Final result as a percentage of net assets. In the case of referring to accumulated results, the average of the NA for the reference months is considered in the denominator.
SWEE: Final result as a percentage of equity. In the case of referring to accumulated results, the average net worth for the reference months is considered in the denominator.
RPC: Computable Patrimonial Liability. For more details, see Ordered Text “Minimum Capitals of Financial Institutions”.
TNA: Annual nominal rate.
US$: US dollars.
UVA: Unit of Purchasing Value.
ICU: Housing Units.
Share on


