Summary
The financial intermediation of the banks as a whole with the private sector continued to expand throughout May. Credit to the private sector in pesos increased 3.5% in real terms between the end of the month, accumulating a year-on-year expansion of 88.3% in real terms. The foreign currency segment also presented an outstanding performance: an increase of 7.9% in the month and 137% y.o.y. -variations in currency of origin-.
In May, the real balance of deposits in national currency of the private sector grew 1.1%, an increase explained by time deposits, which increased 4.2% in real terms in the period. In year-on-year terms, deposits of companies and households in pesos grew 20.2% in real terms. Private sector deposits arranged in foreign currency did not show any changes in magnitude in the month measured in currency of origin, accumulating a year-on-year increase of 71.9%.
During the month, the share of credit to the private sector in the total assets of all entities increased again, while the exposure of the financial system to the public sector continued to decline. This dynamic widened the gap between the two components to 9.1 p.p. of total assets (41.3% corresponding to the private sector compared to 32.2% to the public sector).
In the month, the irregularity ratio of credit to the private sector amounted to 2.6%, 0.4 p.p. more than in April. In May, the NPL ratio of credit for households totaled 4.5%, while the indicator for financing to companies stood at 1%. The current level of the irregularity ratio of credit to the private sector continued to be below the average of the last 20 years (3.1%). In this context, the level of forecasting with which the sector operates continued to be high and exceeds the portfolio in an irregular situation by 29%.
In May, the liquidity ratio in national currency for the financial system, which includes only availabilities, increased 1.2 p.p. of deposits in pesos, to 13.1% (+1.9 p.p. y.o.y.). The broad indicator of liquidity in pesos – which additionally includes holdings of LEFI, public securities used to meet minimum cash requirements and LECAPs maturing within the next 3 months – amounted to 45.4% of deposits in pesos at the systemic level in May, increasing 1.8 p.p. compared to the April level (-19.7 p.p. y.o.y.). The liquidity ratio for the foreign currency segment fell by 3.8 p.p. of deposits in this segment in the month, reaching a level of 58.2% (-15.5 p.p. y.o.y.).
In the context of credit expansion, aggregate solvency indicators continued to be adjusted in May, remaining at relatively high levels. Capital integration (CPR) for the financial system decreased 0.4 p.p. of risk-weighted assets (RWA) in the month, to 29.4%. The capital position ratio (RPC net of the minimum regulatory requirement -MNE-) stood at 263% of the MNE in May (-4.7 p.p. monthly). The aggregate capital position represented 38.2% of the net private sector financing balance in the period, remaining above the average of the last 10 years (27.8%).
The financial system accrued gains equivalent to 1.4% annualized assets (ROA) in the accumulated of the first 5 months of 2025, with a reduction in this profitability indicator in a year-on-year comparison. Considering the cumulative figure for the 12 months to May, the financial institutions as a whole recorded an ROA of 1.7% (ROE of 6.9%), 5.5 p.p. lower than a year ago (-24.9 p.p. y.o.y. in ROE).
I. Financial intermediation activity
The financial intermediation of all entities with the private sector continued to expand throughout May. When considering the monthly variations – measured in homogeneous currency – of the aggregate bank balance in national currency, the main applications of resources were the increase in credit to the private sector and in availabilities, while monthly funding came mainly from the increase in deposits. For its part, for the segment denominated in foreign currency between the end of the month, the increase in financing to the private sector stood out again, being funded basically with a reduction in liquidity.
In May, financing to the private sector in national currency grew 3.5% in real terms, presenting a positive performance in all groups of financial institutions. Real collateralized loans grew relatively more in May (5.3% in real terms, see Chart 1), followed by consumer loans (2.9% in real terms) and commercial lines (2% in real terms). In year-on-year terms, the real balance of financing to the private sector in national currency expanded 88.3%.
Graph 1 | Real balance of credit to the private sector in pesos*
Monthly changes
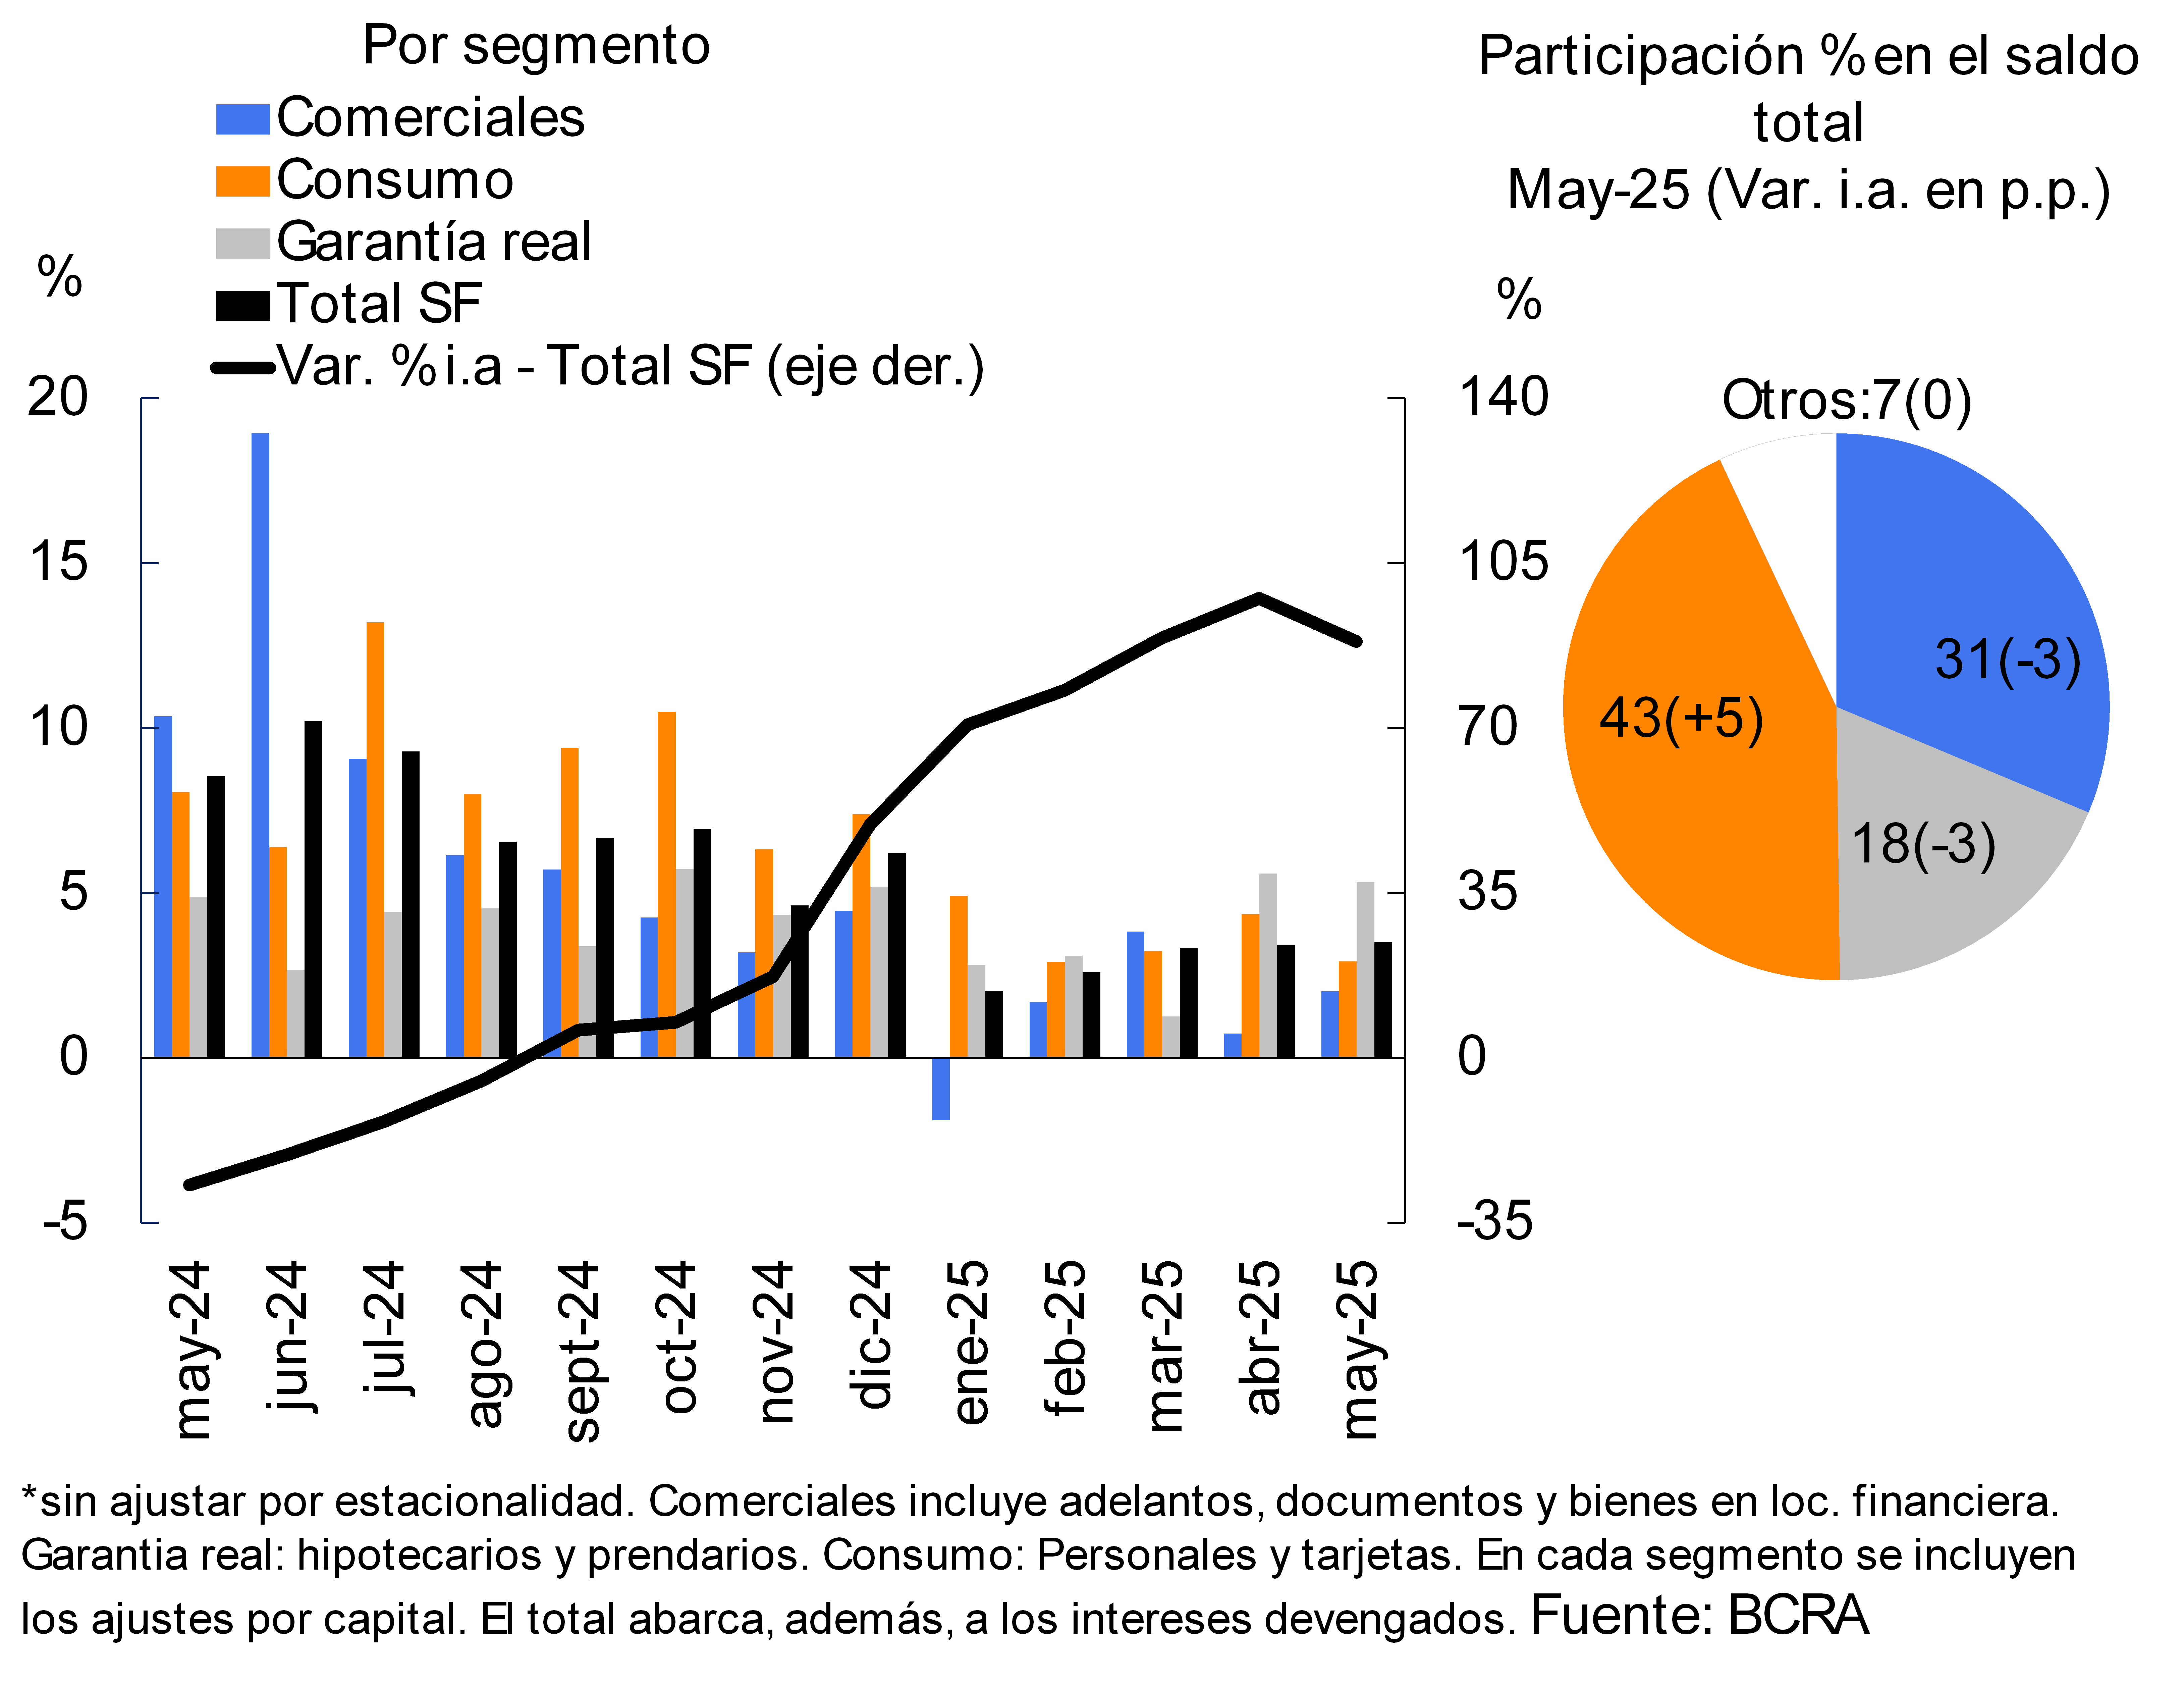
Chart 2 : Foreign currency financial intermediation to the private sector
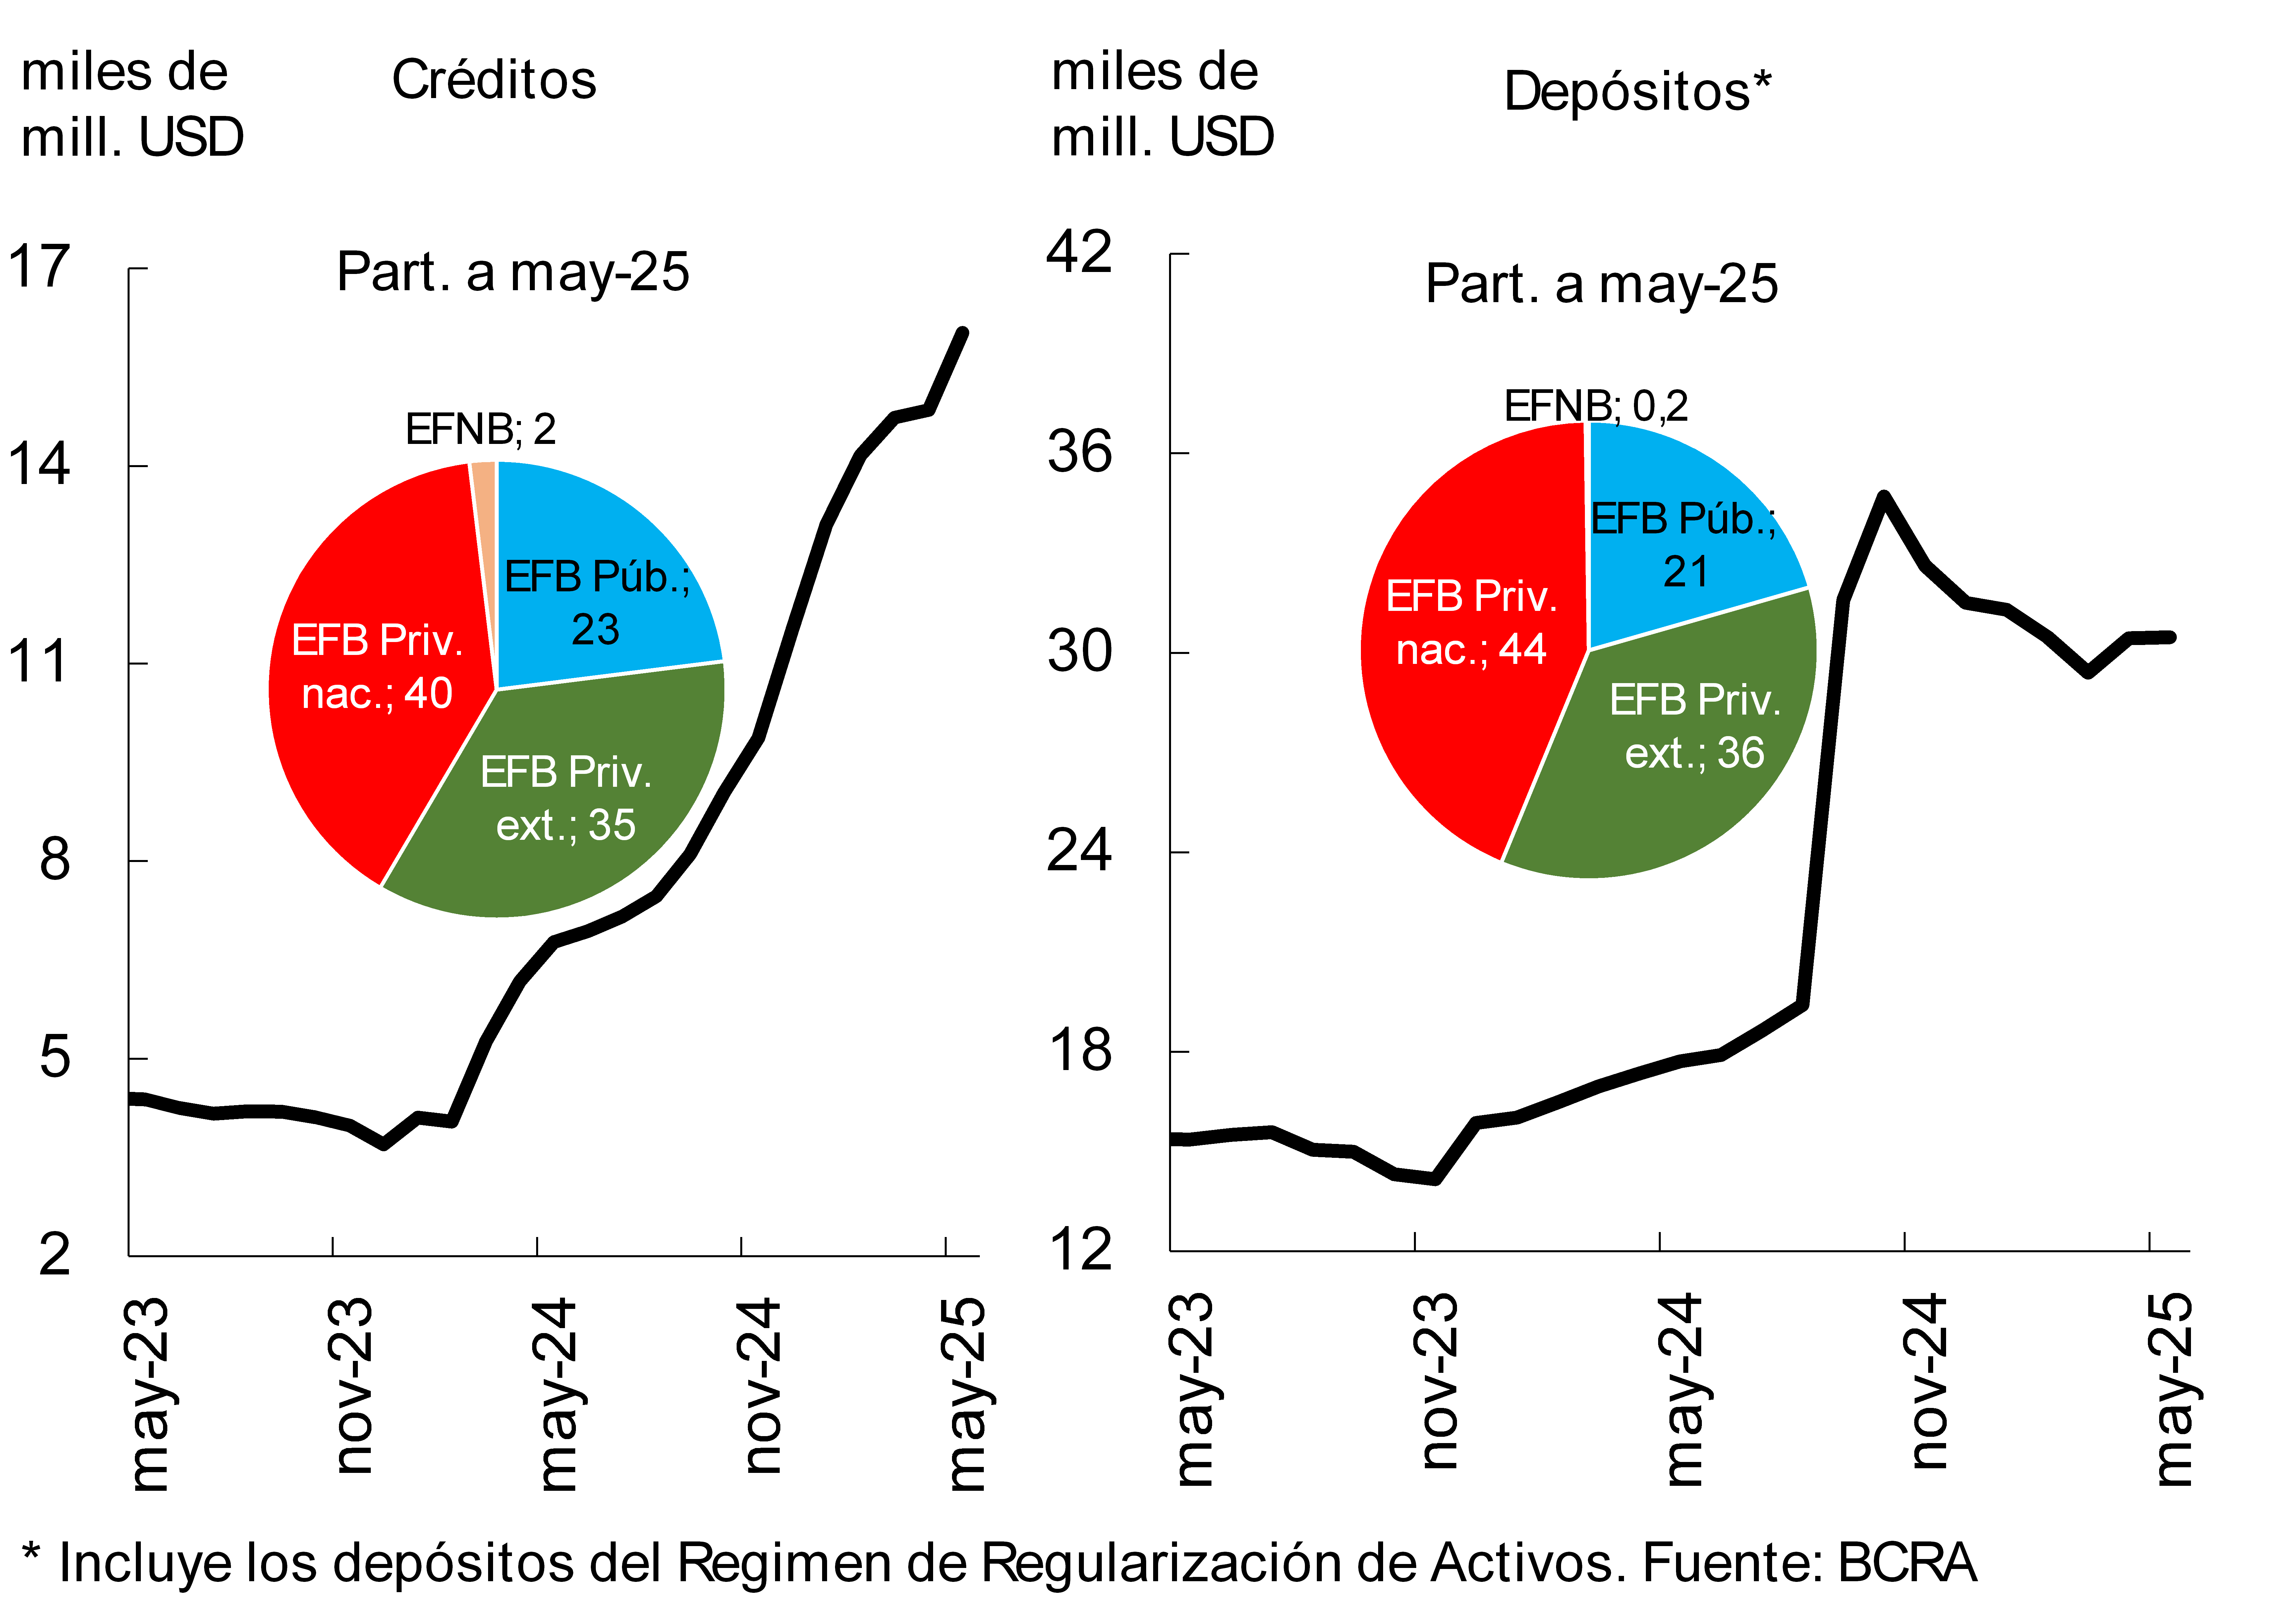
Credit to the private sector in foreign currency grew 7.9% in the month -in currency of origin-, driven mainly by private banks (9.4% in the period and a weighting of 75% in the balance, see Graph 2).
The real balance of total credit to the private sector (domestic and foreign currency) provided by the financial system increased by 4.4% compared to April. Credit to households1 increased by 4.1% in real terms in May (95% real YoY), driven mainly by collateral loans (6.5% in real terms) and mortgage loans (5.5% in real terms). In the month, financing to companies grew 4.4% in real terms (88.6% real YoY), with greater dynamism in credit to the services and trade sectors (6% real and 5.5% real, respectively).
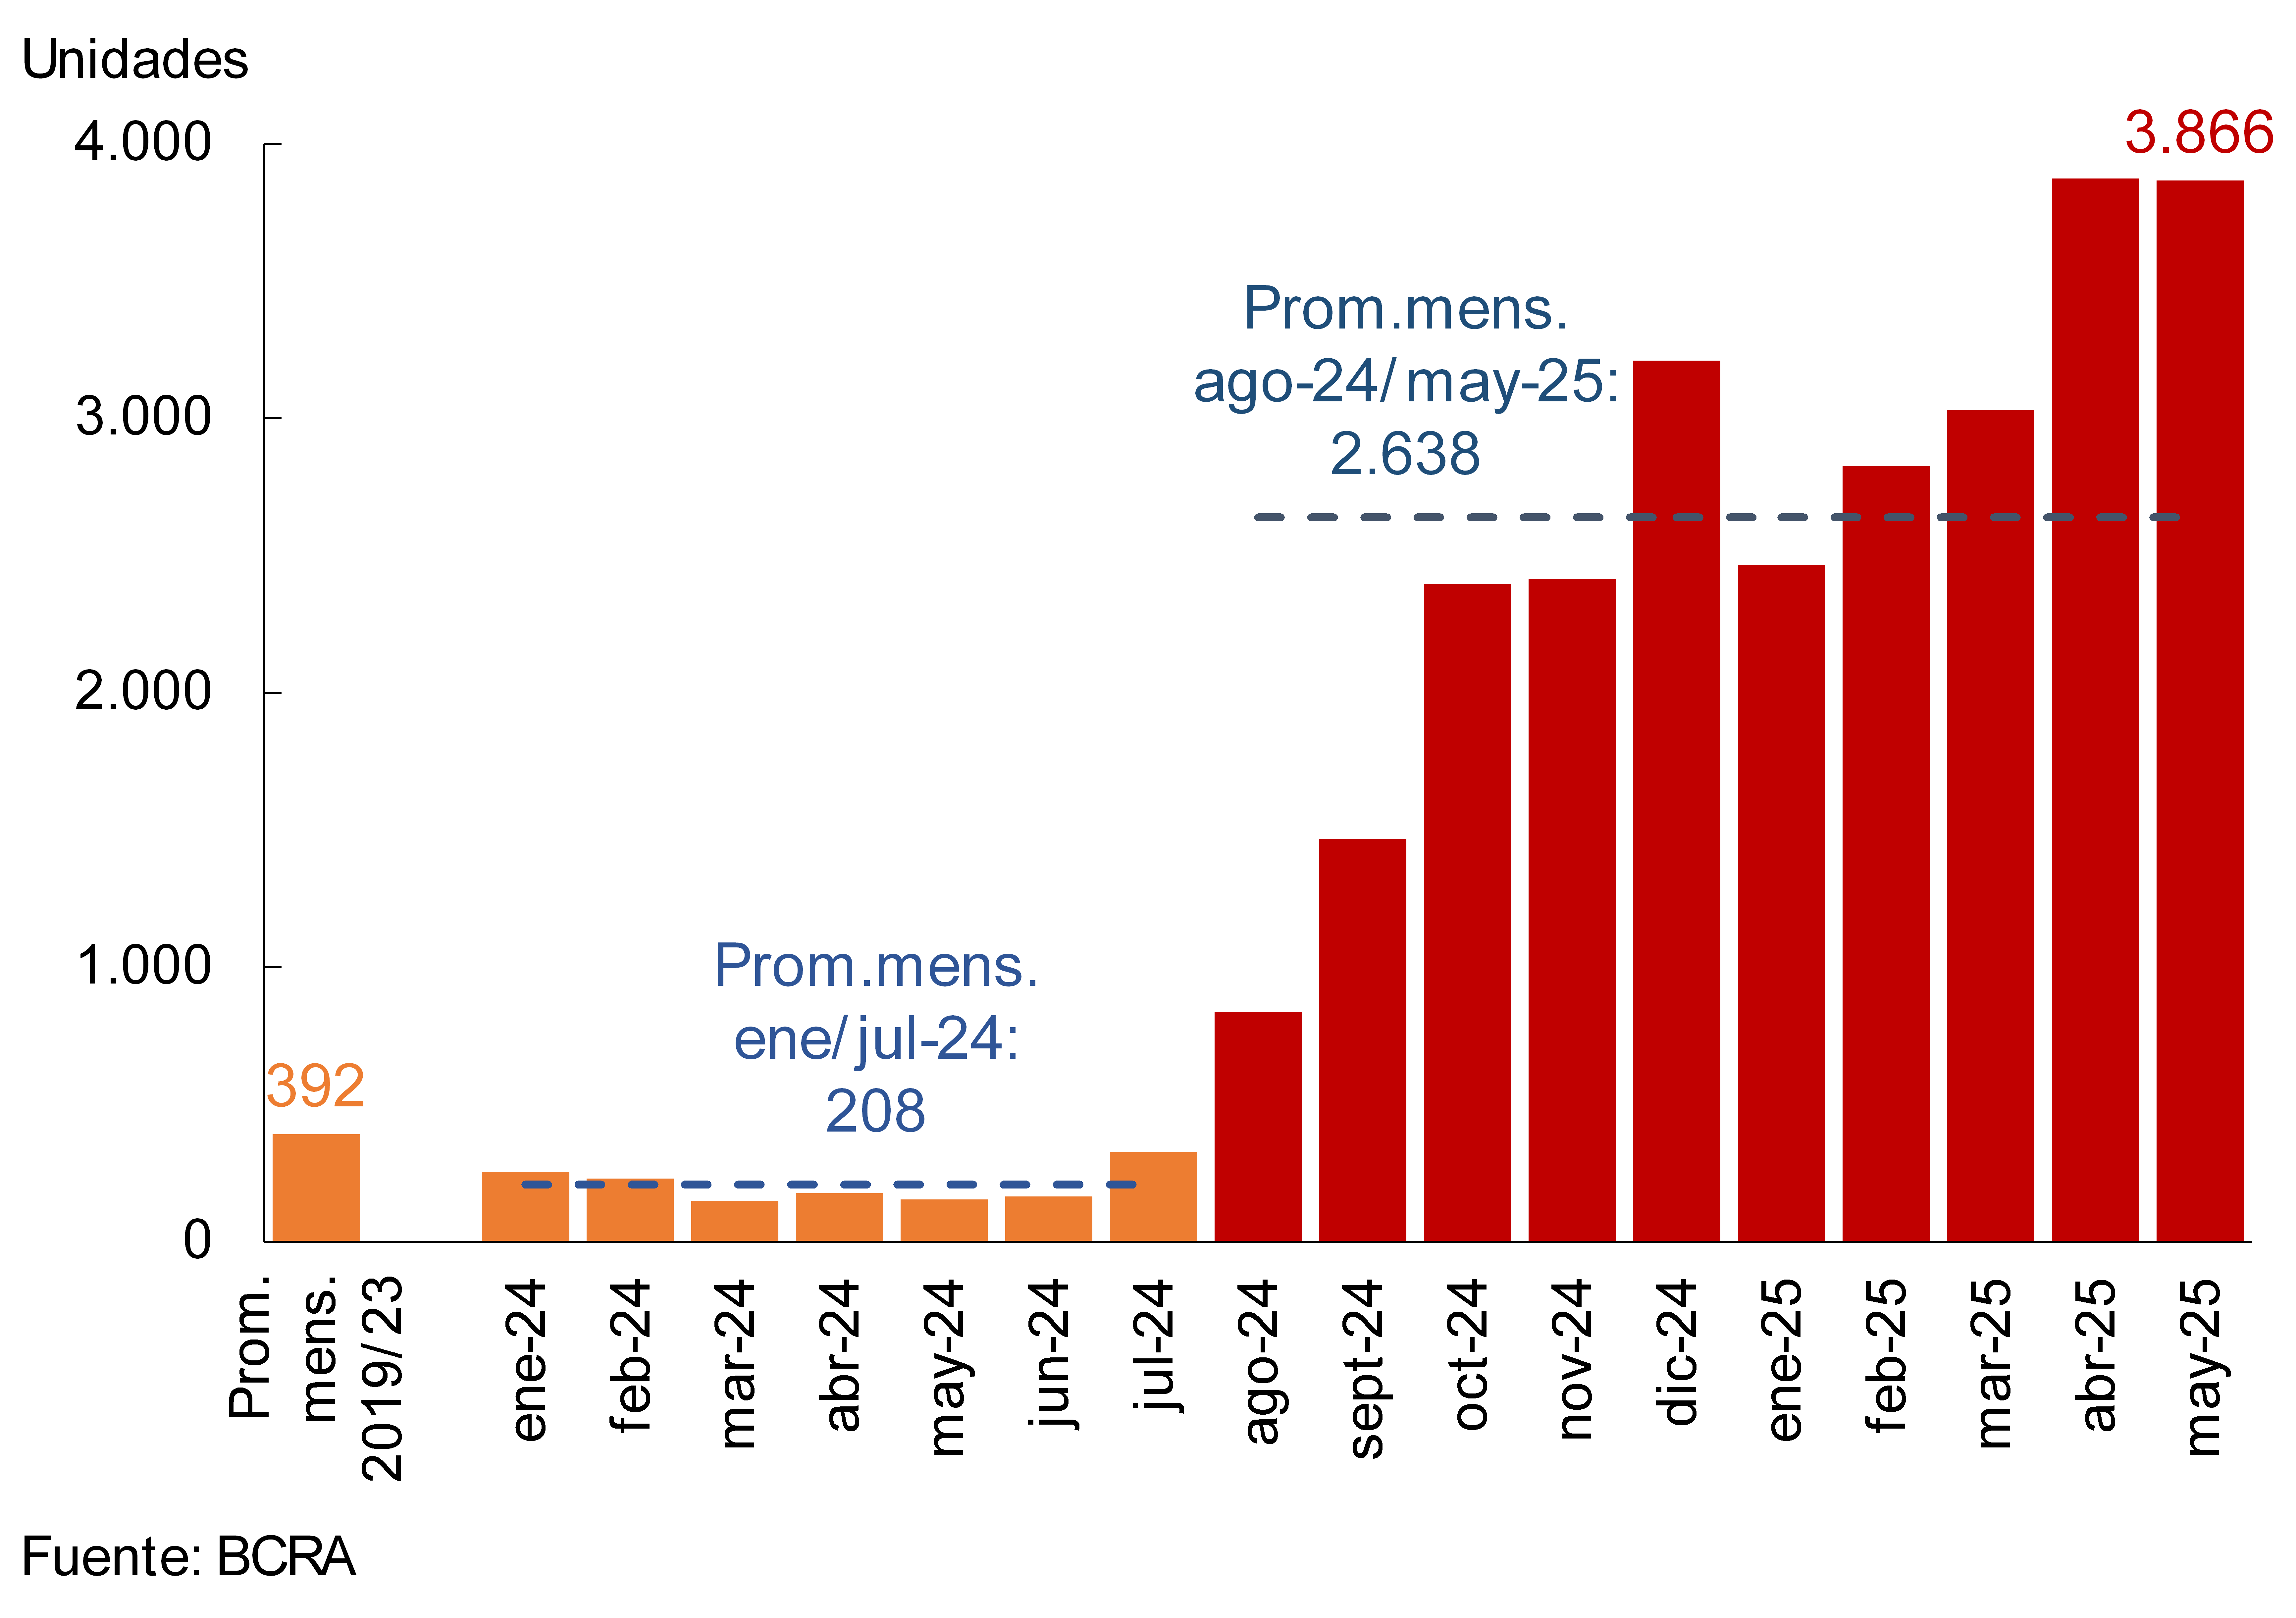
It is estimated that in May, 3,900 new mortgage loan debtors entered the financial system (registrations of individuals, see Graph 3), totaling 26,400 since August 2024 (at which time this credit assistance regained dynamism). The monthly number of new mortgage debtors incorporated in recent months far exceeded the levels recorded in recent years (2019-2023, for example, with estimated monthly registrations of 390 families on average), remaining below what was observed in 2017-2018 (average monthly registrations of 4,800).
Graph 3 | Estimation of mortgage registrations (individuals)
Financial system
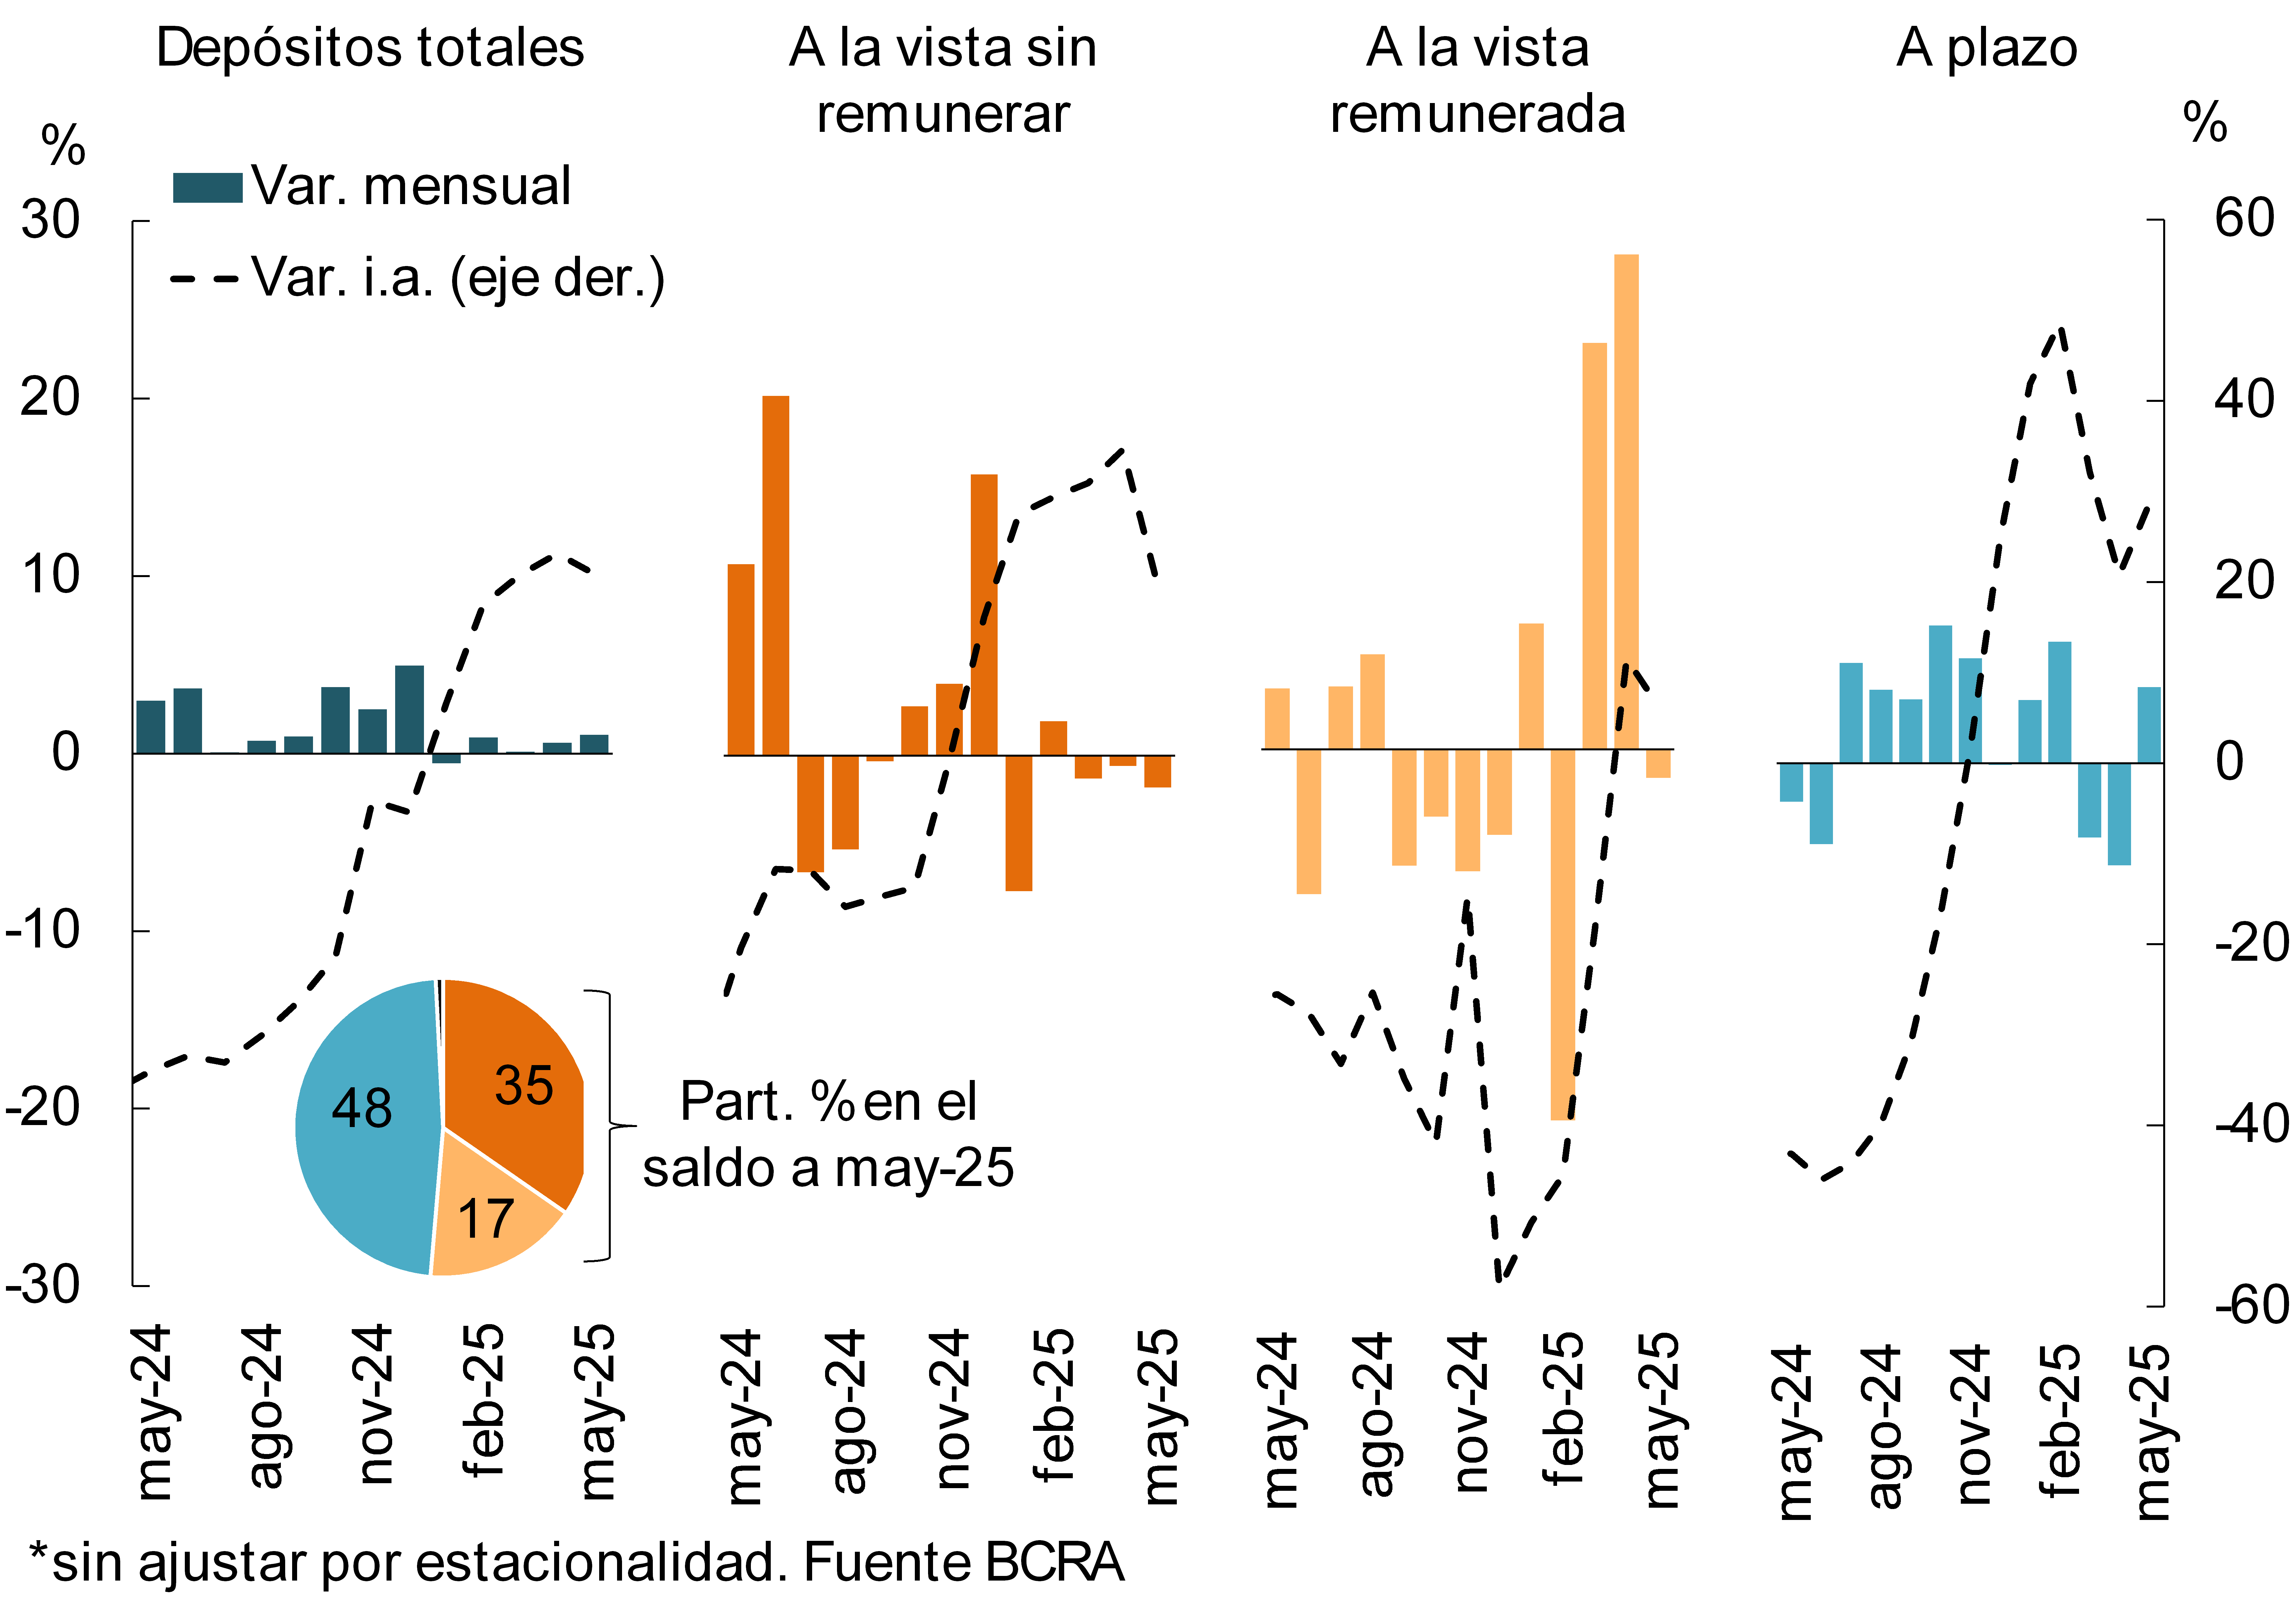
As for the funding of the entities, in May the balance of private sector deposits in pesos expanded 1.1% in real terms. Time deposits increased in the month (4.2% in real terms)2, while demand accounts (whether interest-bearing or not) reduced their real balance compared to April (-1.6% and -1.8% respectively, see Chart 4). In year-on-year terms, the real balance of deposits of companies and households in pesos grew 20.2%, with increases in all deposit segments: 28.6% for time deposits, 19.1% for unremunerated demand accounts and 4.8% for interest-bearing demand deposits (see Graph 4).
Graph 4: Real balance of private sector deposits in pesos*.
For its part, the balance of private sector deposits arranged in foreign currency did not show significant changes in the month (0.1% -in currency of origin-), accumulating a year-on-year increase of 71.9% (see Graph 2). In this context, the real balance of deposits in all sectors and currencies increased 2.5% in the month and 22.9% compared to May 2024.
II. Evolution and aggregate composition of the balance sheet
The total assets of the financial system grew 1.9% in real terms in April, driven mainly by the performance of public entities and, to a lesser extent, by foreign private banks. The real year-on-year growth of the aggregate balance sheet reached 12%, with a greater relative contribution from private banks.
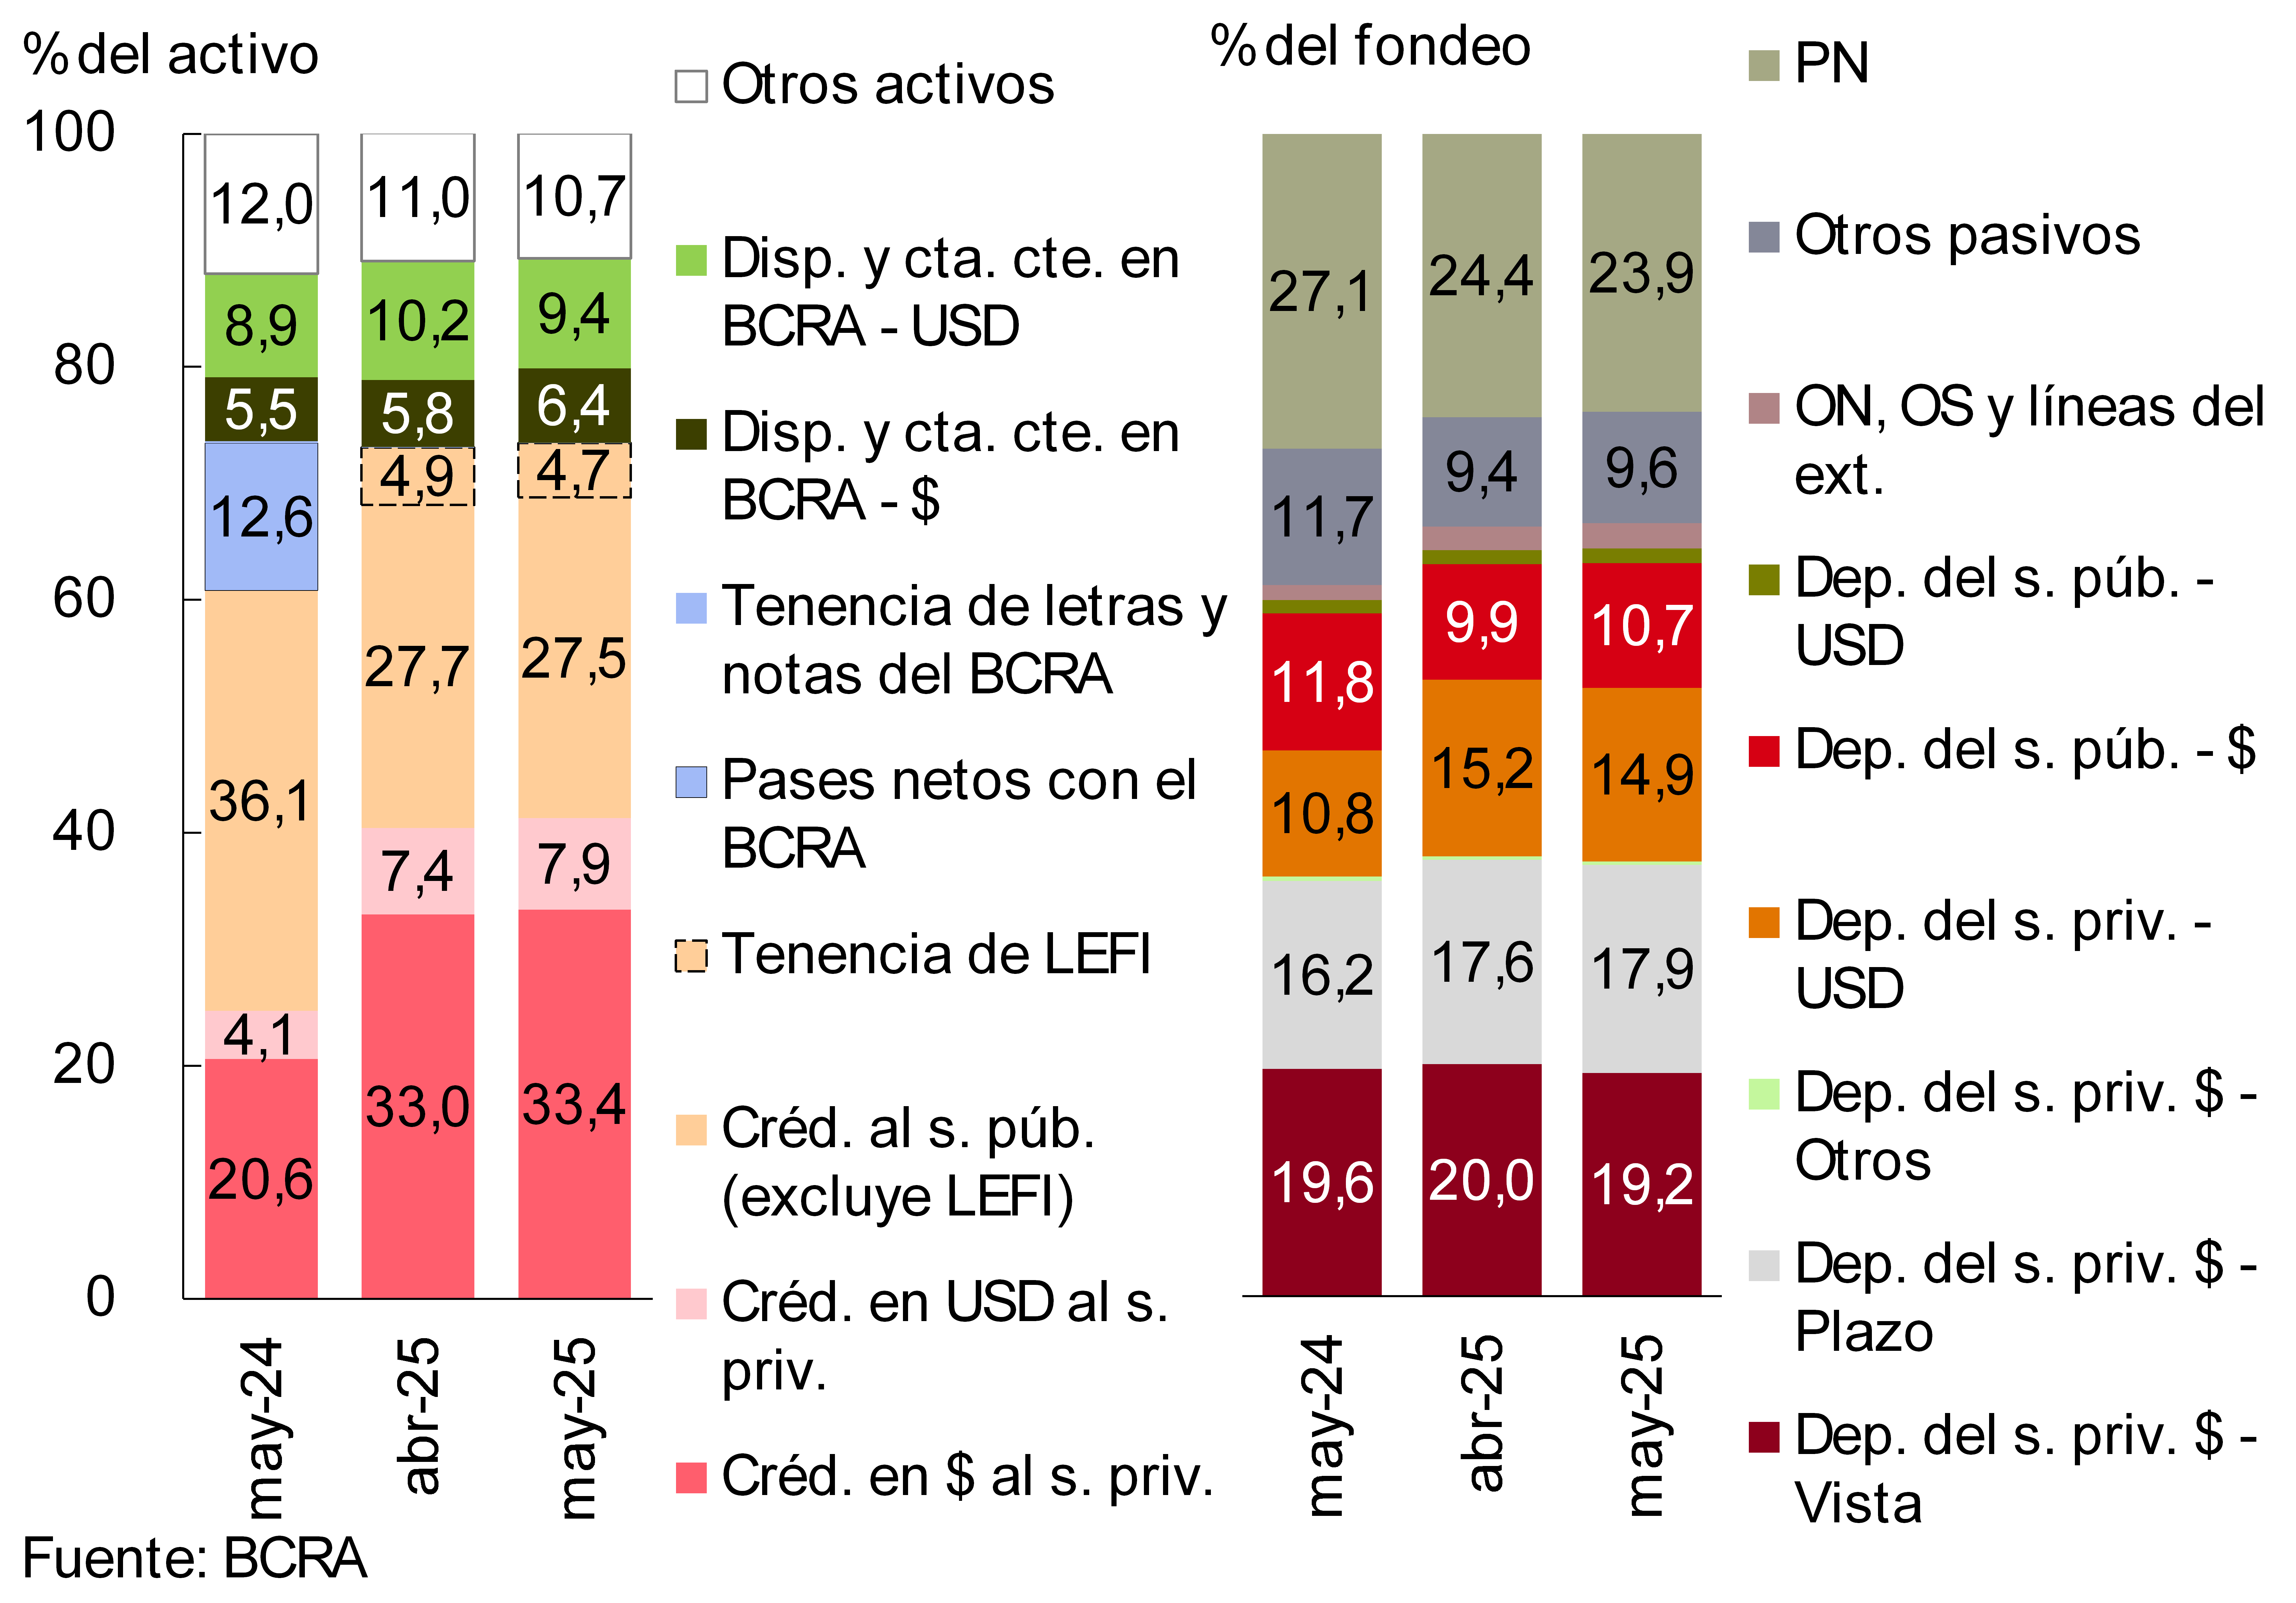
During the month, the share of credit to the private sector in the total assets of all entities increased again, while the exposure of the financial system to the public sector continued to decline. This dynamic widened the gap between the two components to 9.1 p.p. of the asset (see Chart 5). In addition, there was a decrease in the relative share of current accounts in foreign currency that entities maintain at the BCRA and an increase in current accounts in pesos at the BCRA. In relation to the funding structure, between the end of the month the relative weight of private sector term placements and public sector deposits in pesos increased, while the share of private sector demand deposits in national currency and net worth decreased.
Chart 5 – Composition of assets and funding
Financial system – In % share
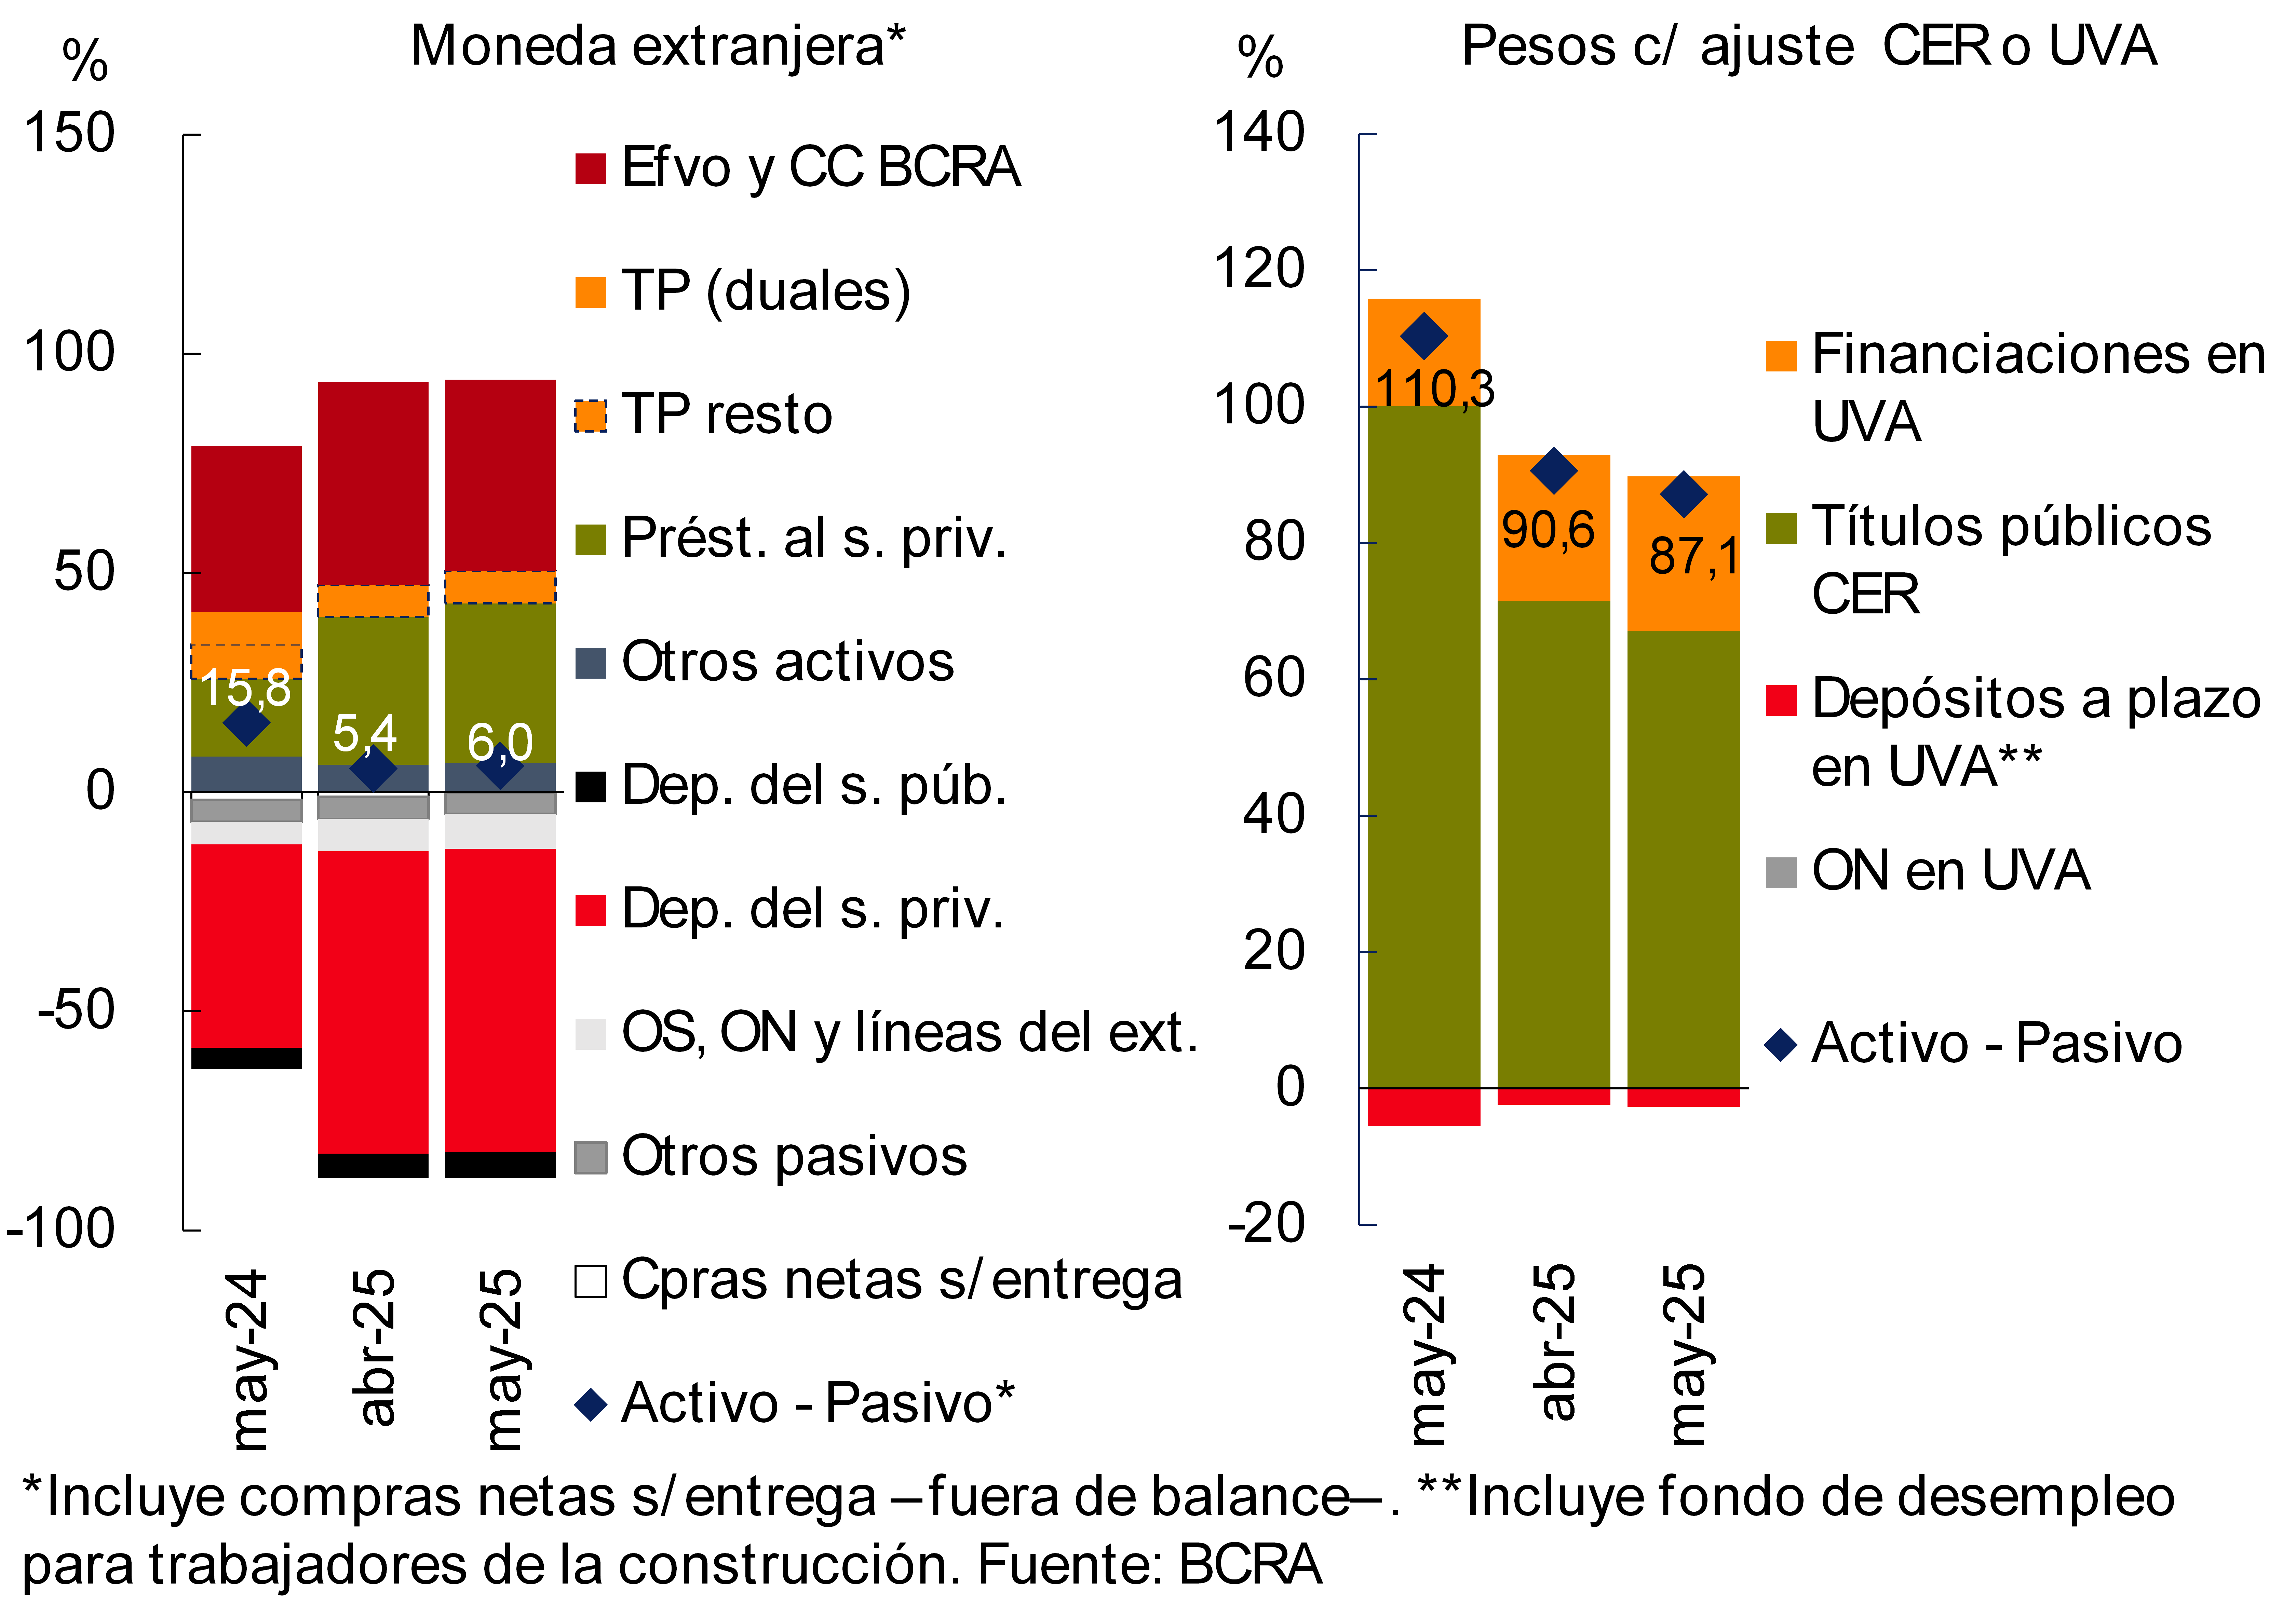
The estimated difference between assets and liabilities in foreign currency – including off-balance sheet purchase and sale transactions – represented 6% of the regulatory capital of the financial system in the period (+0.6 p.p. in relation to April and -9.8 p.p. y.o.y.; see Figure 6). On the other hand, the positive mismatch between assets and liabilities adjustable by CER or agreed in UVA stood at 87.1% of regulatory capital, registering a fall of 3.5 p.p. compared to the previous month and 23.2 p.p. in year-on-year terms (see Chart 6).
Graph 6 | Spread between assets and liabilities
In % of PRC
III. Portfolio quality
The financial system’s exposure to the private sector continued to grow in the month (see Chart 7). In May, the balance of credit to households and companies totalled 41.3% of the total assets of all entities, 0.9 p.p. more than in April. This monthly dynamic came from both the segment in national currency (+0.4 p.p., to 33.4%) and foreign currency (+0.4 p.p., up 7.9%). In year-on-year terms, exposure to the private sector increased by 16.5 p.p. (+12.8 p.p. for items in pesos and +3.7 p.p. for items in foreign currency). 3
Figure 7 | Credit balance to the private sector in terms of assets
By group of financial institutions
The non-performing ratio of credit to the private sector amounted to 2.6% in the period, 0.4 p.p. more than in April. In May, the irregularity coefficient of credit for households totaled 4.5% (4.9% for consumption-related lines), increasing between peak times of the month. Financing to companies presented an irregularity ratio of 1% in the month, with slight increases in almost all economic sectors (industry remained stable). Despite the recent increase, the current level of the irregularity ratio of the entire private sector portfolio continued to be below the average of the last 20 years (3.1%, see Chart 8). 4
Chart 8: Private sector credit irregularity ratio
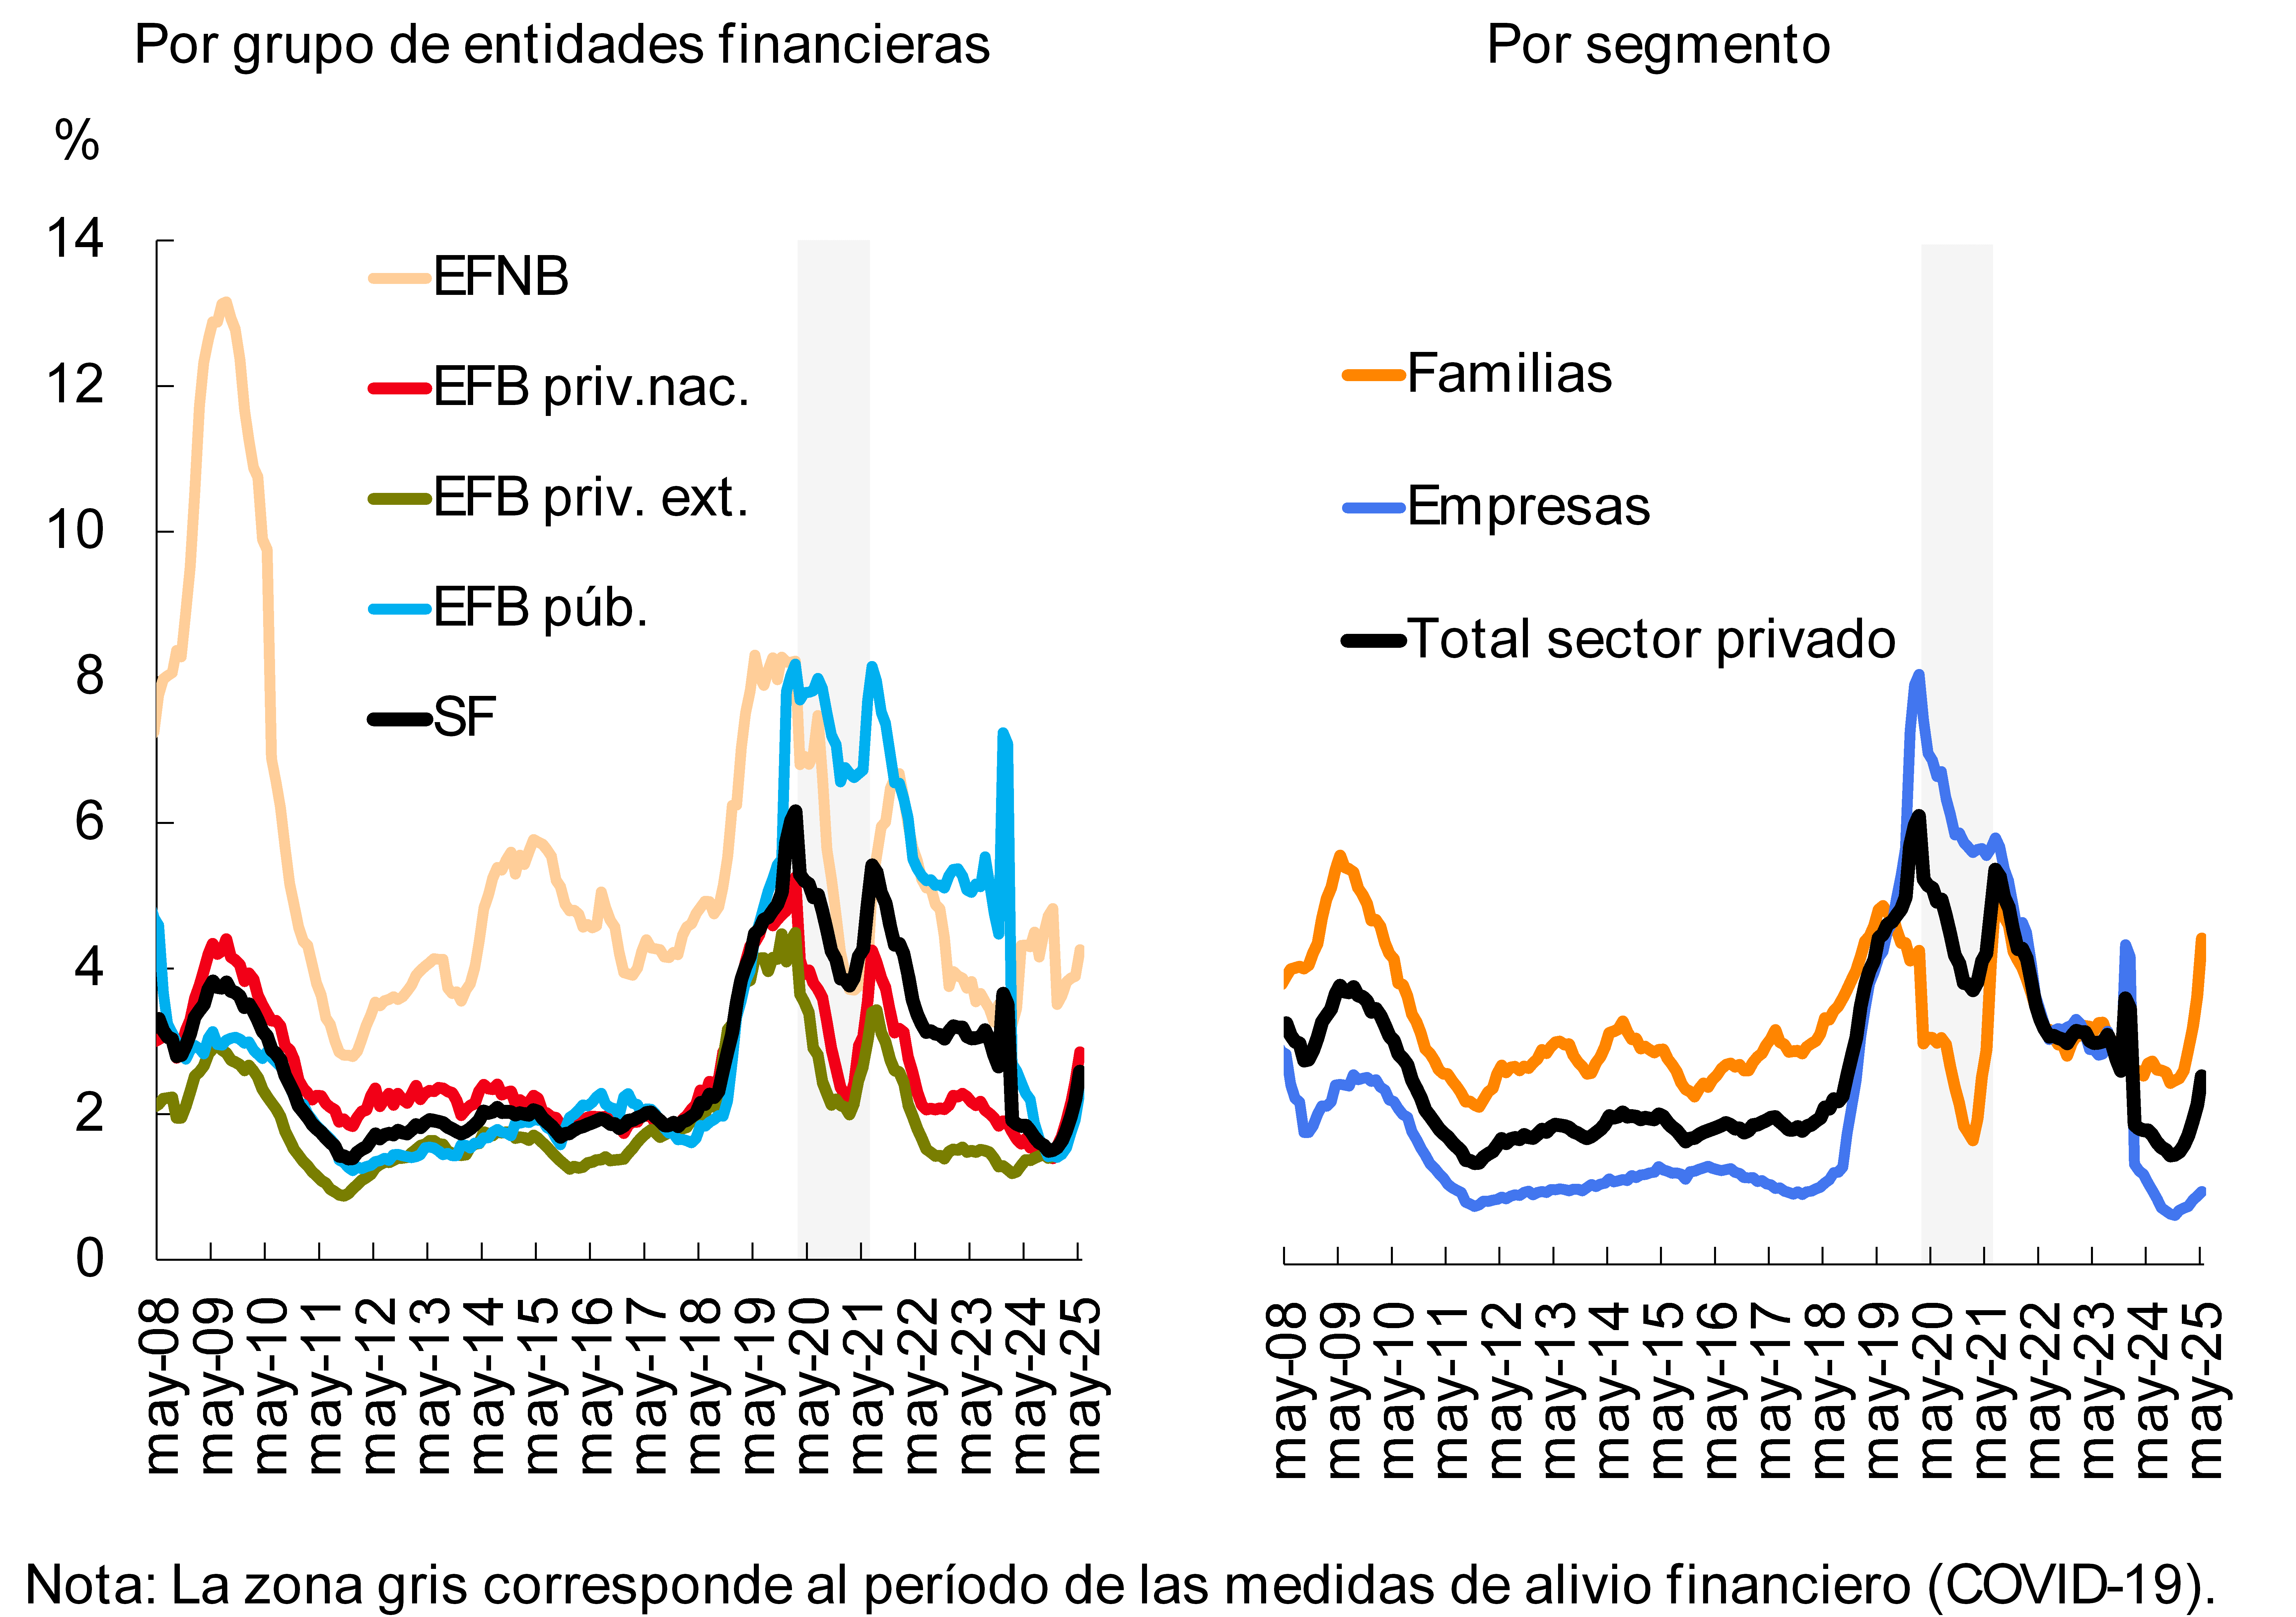
Monthly bad debt charges (accrued and annualized) of the financial system in relation to the total credit balance to the private sector increased 0.7 p.p. in the month to 5.5%. In this context, the accounting forecast continued to outperform credit in an irregular situation (129% at the end of May; monthly fall of 12 p.p.).
IV. Liquidity and solvency
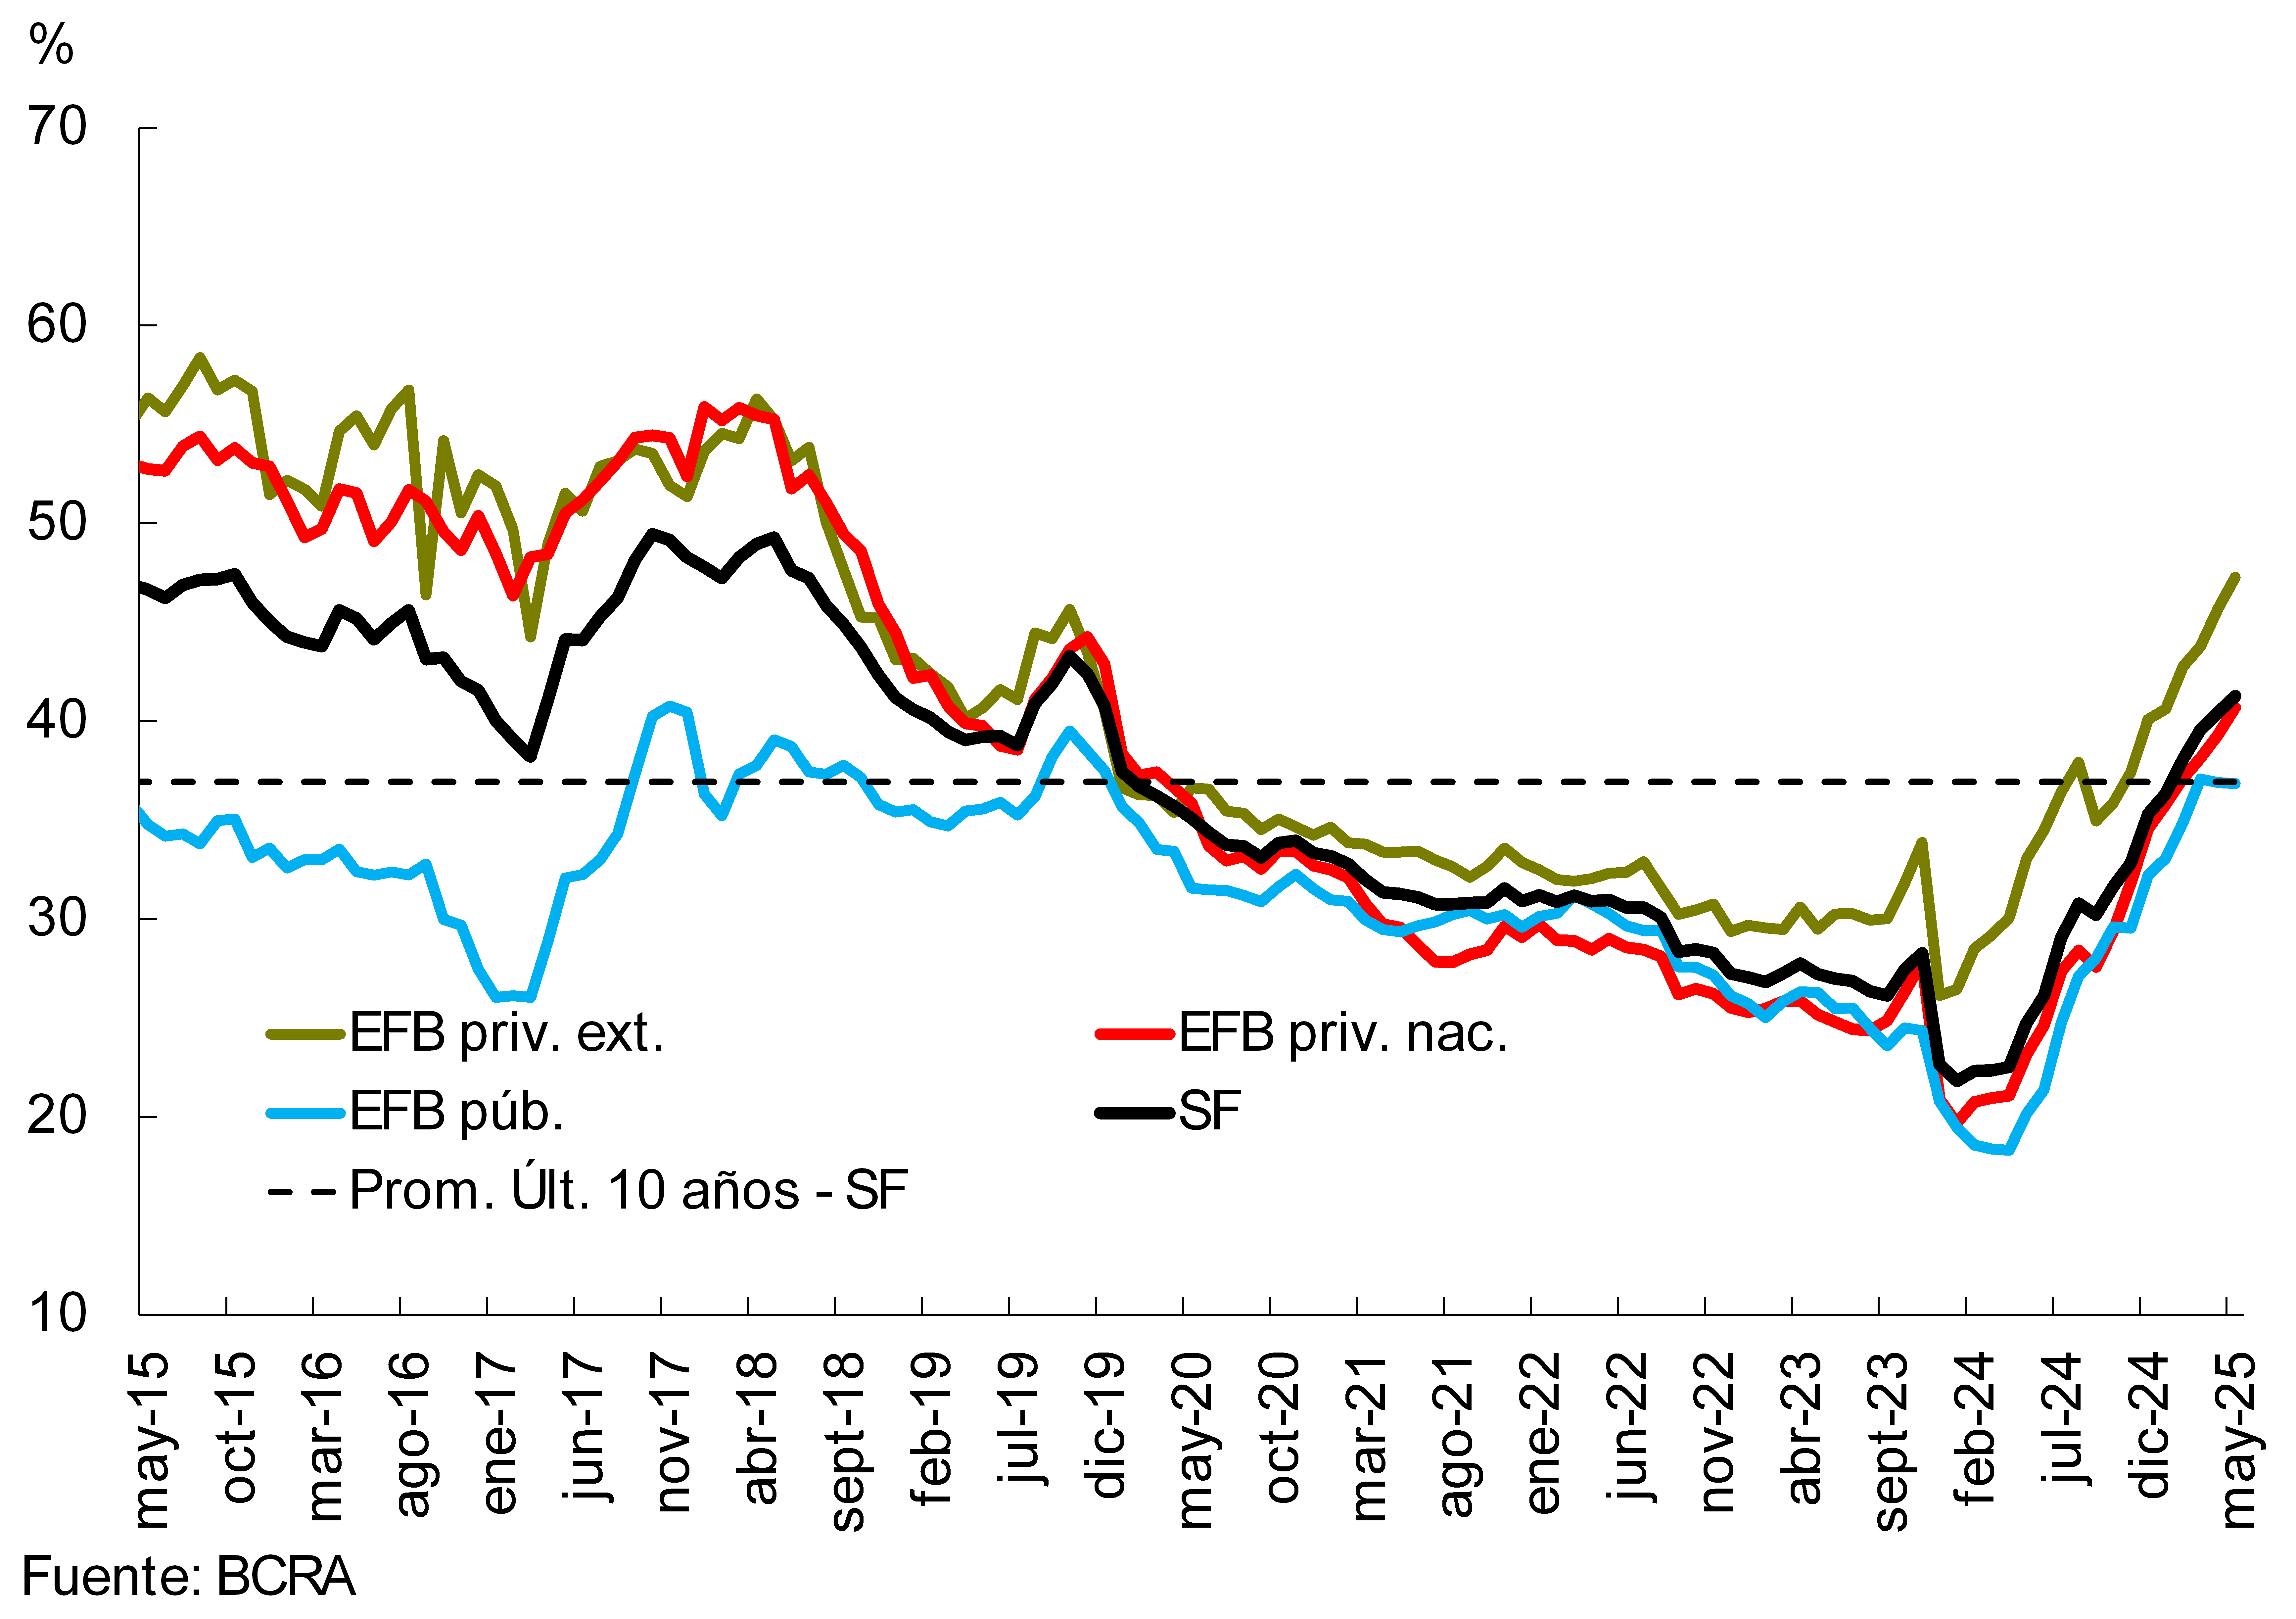
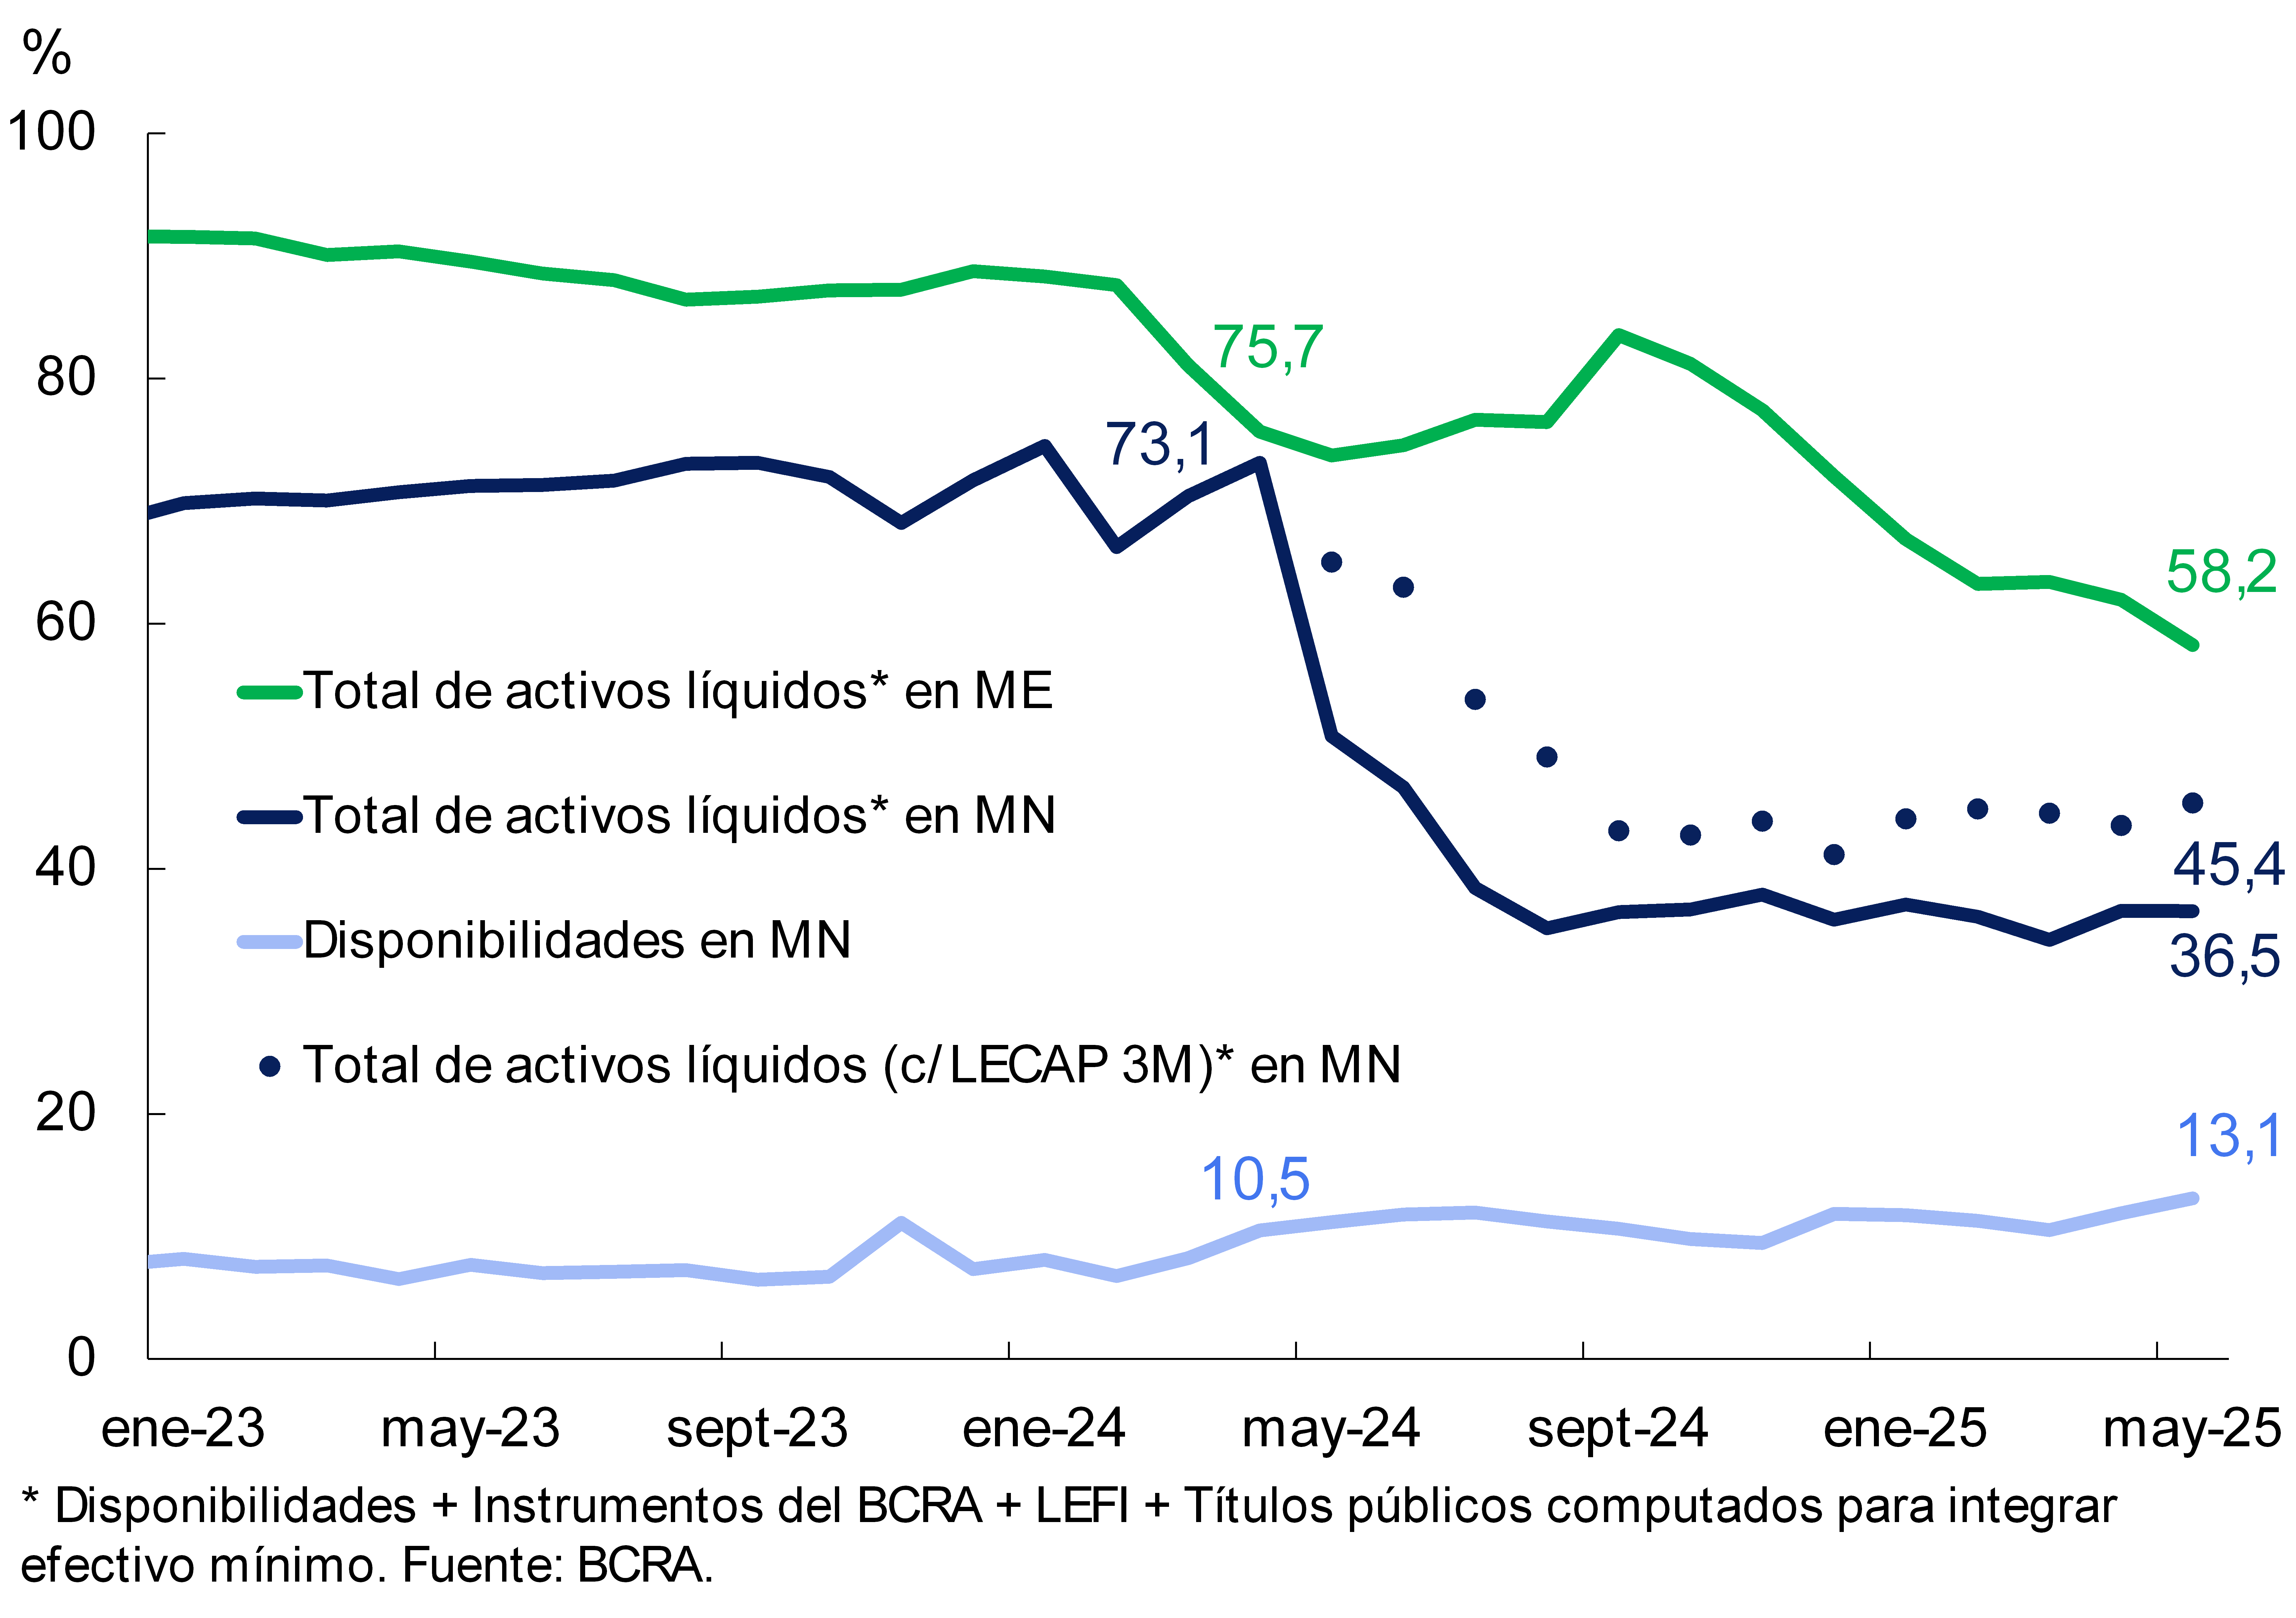
The systemic indicator of liquidity in national currency, which considers only availabilities, increased 1.2 p.p. of deposits in pesos to 13.1% (+1.9 p.p. y.a., see Chart 9). The broad liquidity ratio5 in pesos did not change in magnitude in May, remaining at 36.5% of deposits in national currency. When additionally considering LECAP holdings maturing within the next 3 months, the broad liquidity ratio in national currency amounted to 45.4% of deposits in pesos at the systemic level in May, increasing 1.8 p.p. compared to the level of April (-19.7 p.p. y.o.y.). Meanwhile, the liquidity ratio for the foreign currency segment fell by 3.8 p.p. of deposits in this segment in the month, to 58.2% (-15.5 p.p. y.o.y.).
Figure 9 | Liquidity
indicators Financial system – As % of deposits in each denomination
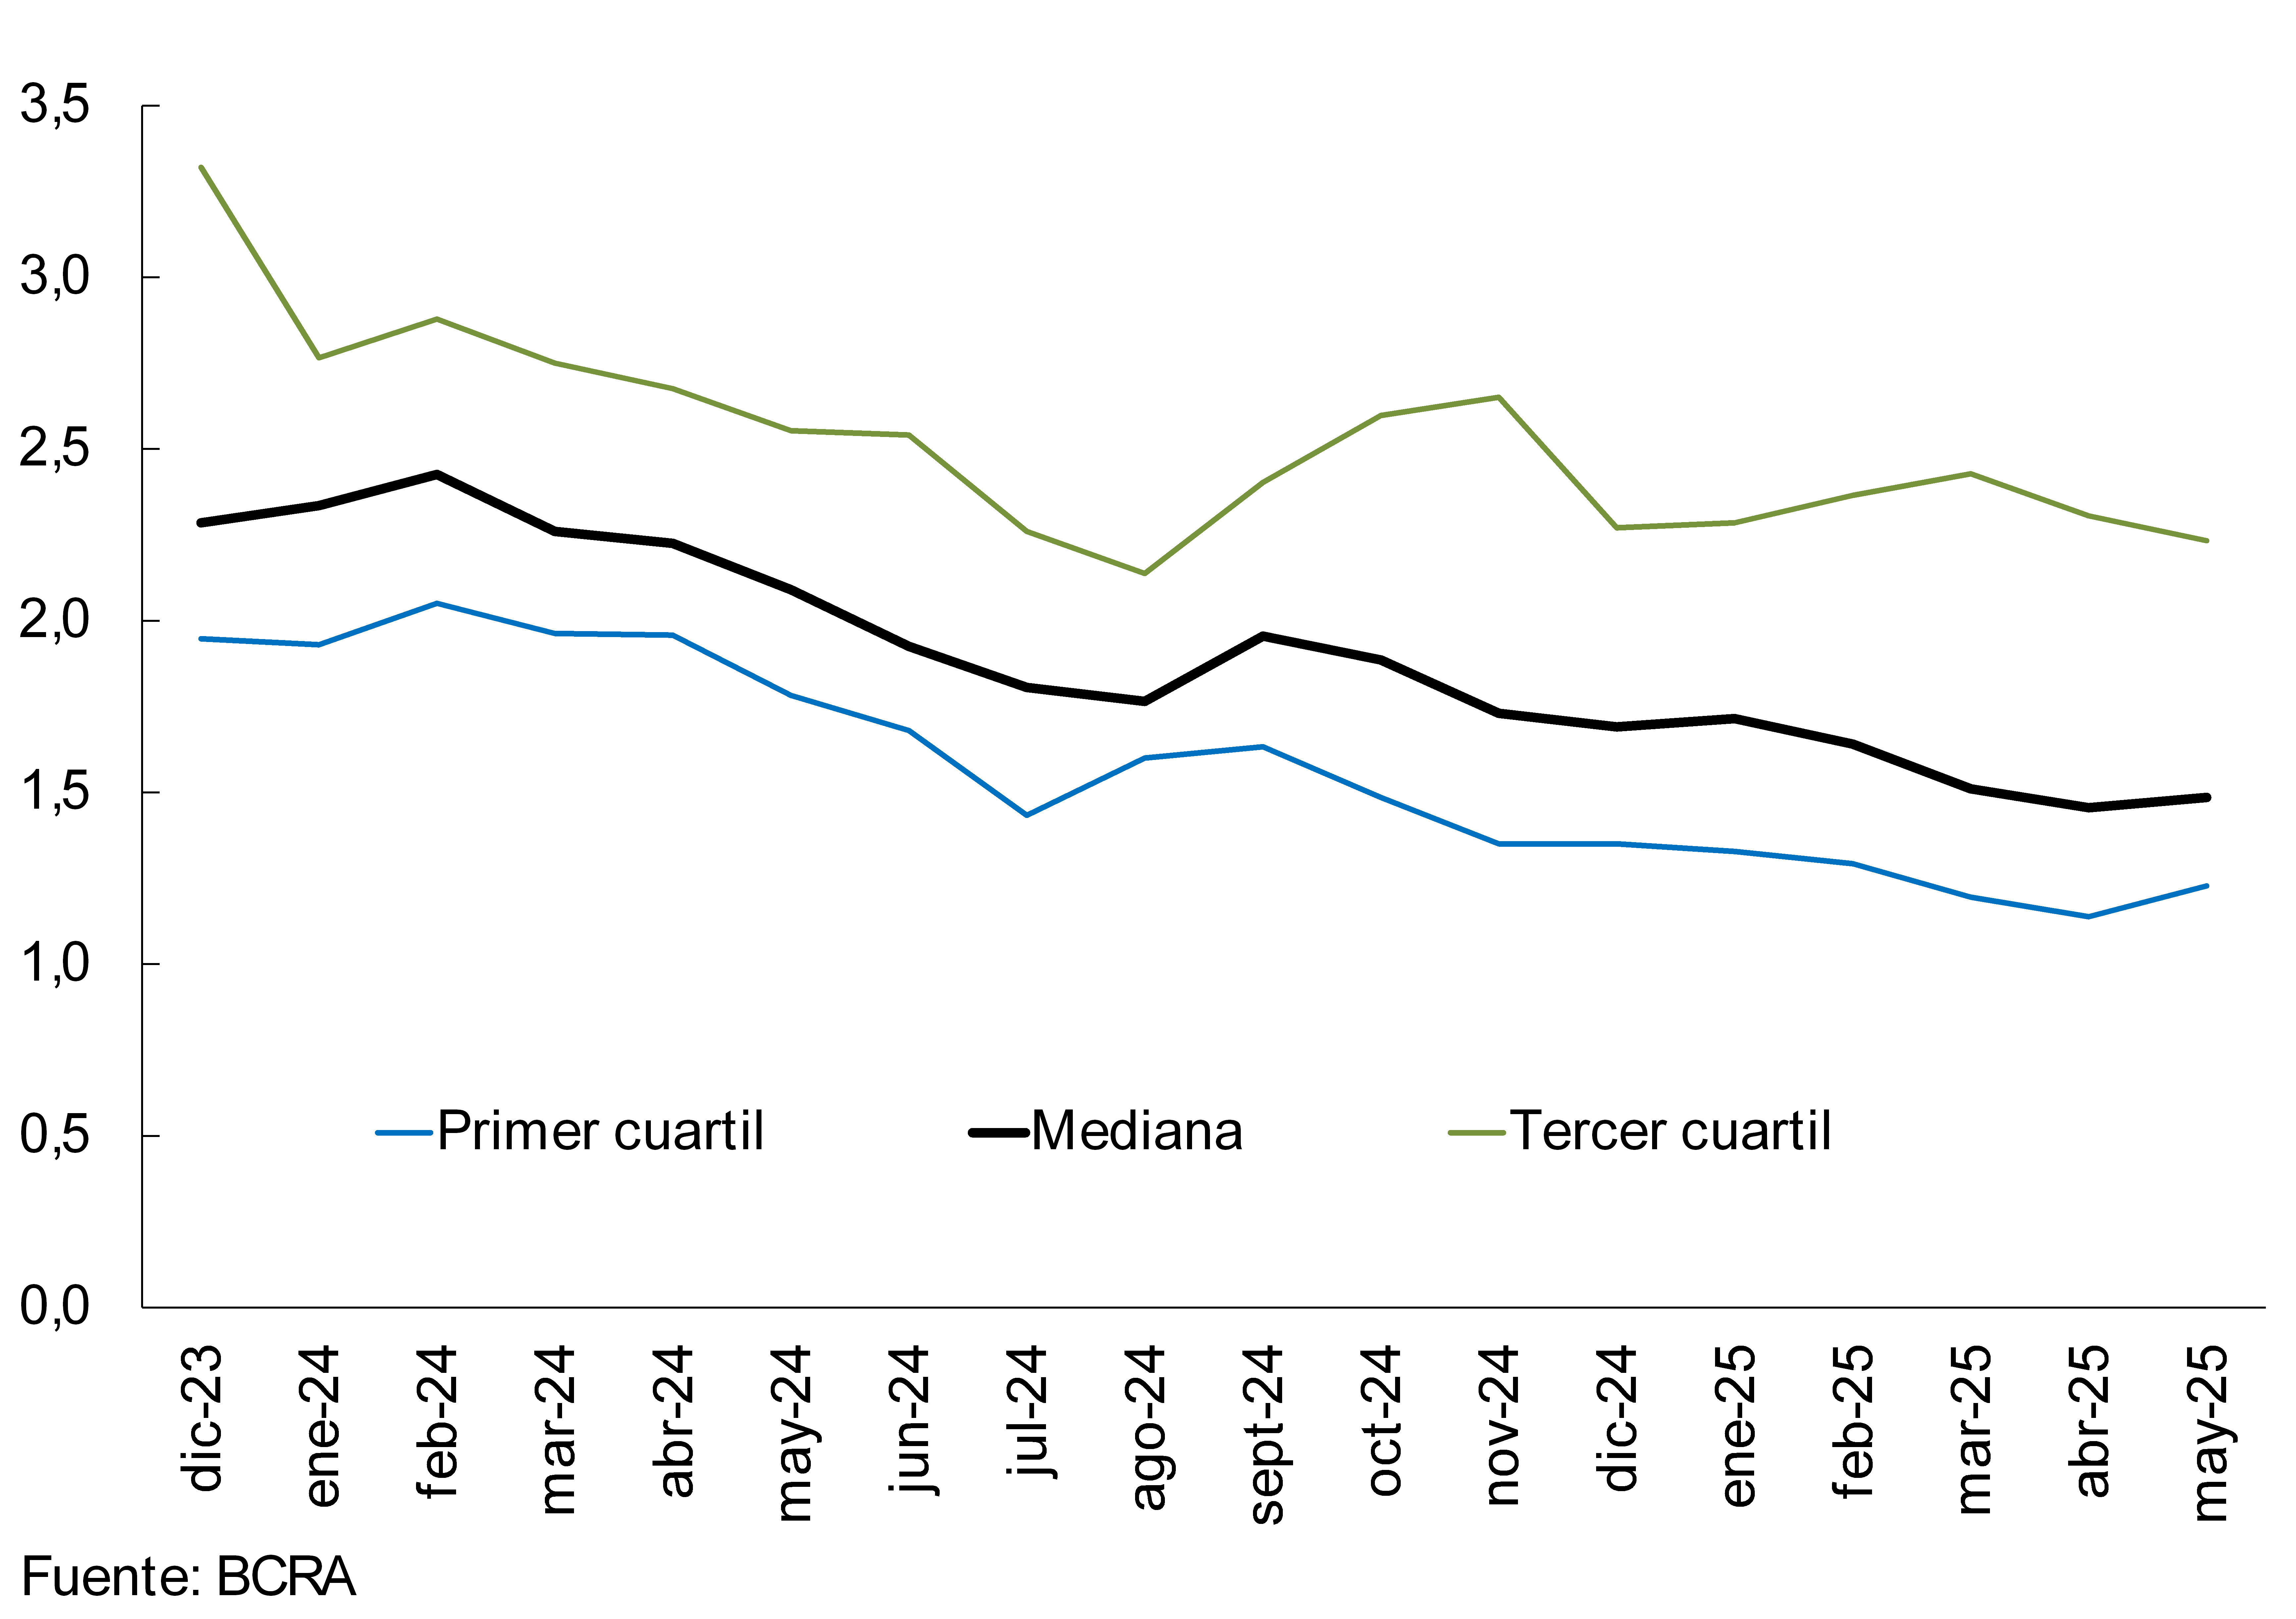
Regarding the liquidity coverage ratio (LCR, which is derived from the Basel Committee standards), in May all local financial institutions required to verify it (Group A) registered levels above 1 (regulatory minimum) (see Chart 10). In line with what was recorded in other liquidity indicators, in a year-on-year comparison there was a generalized decrease in this ratio (domestic and foreign currency), reaching a median of 1.5 for the group of entities A in May (-0.6 y.o.y.).
Figure 10 | Liquidity coverage ratio (LCR)
Group A financial institutions – In $+ME
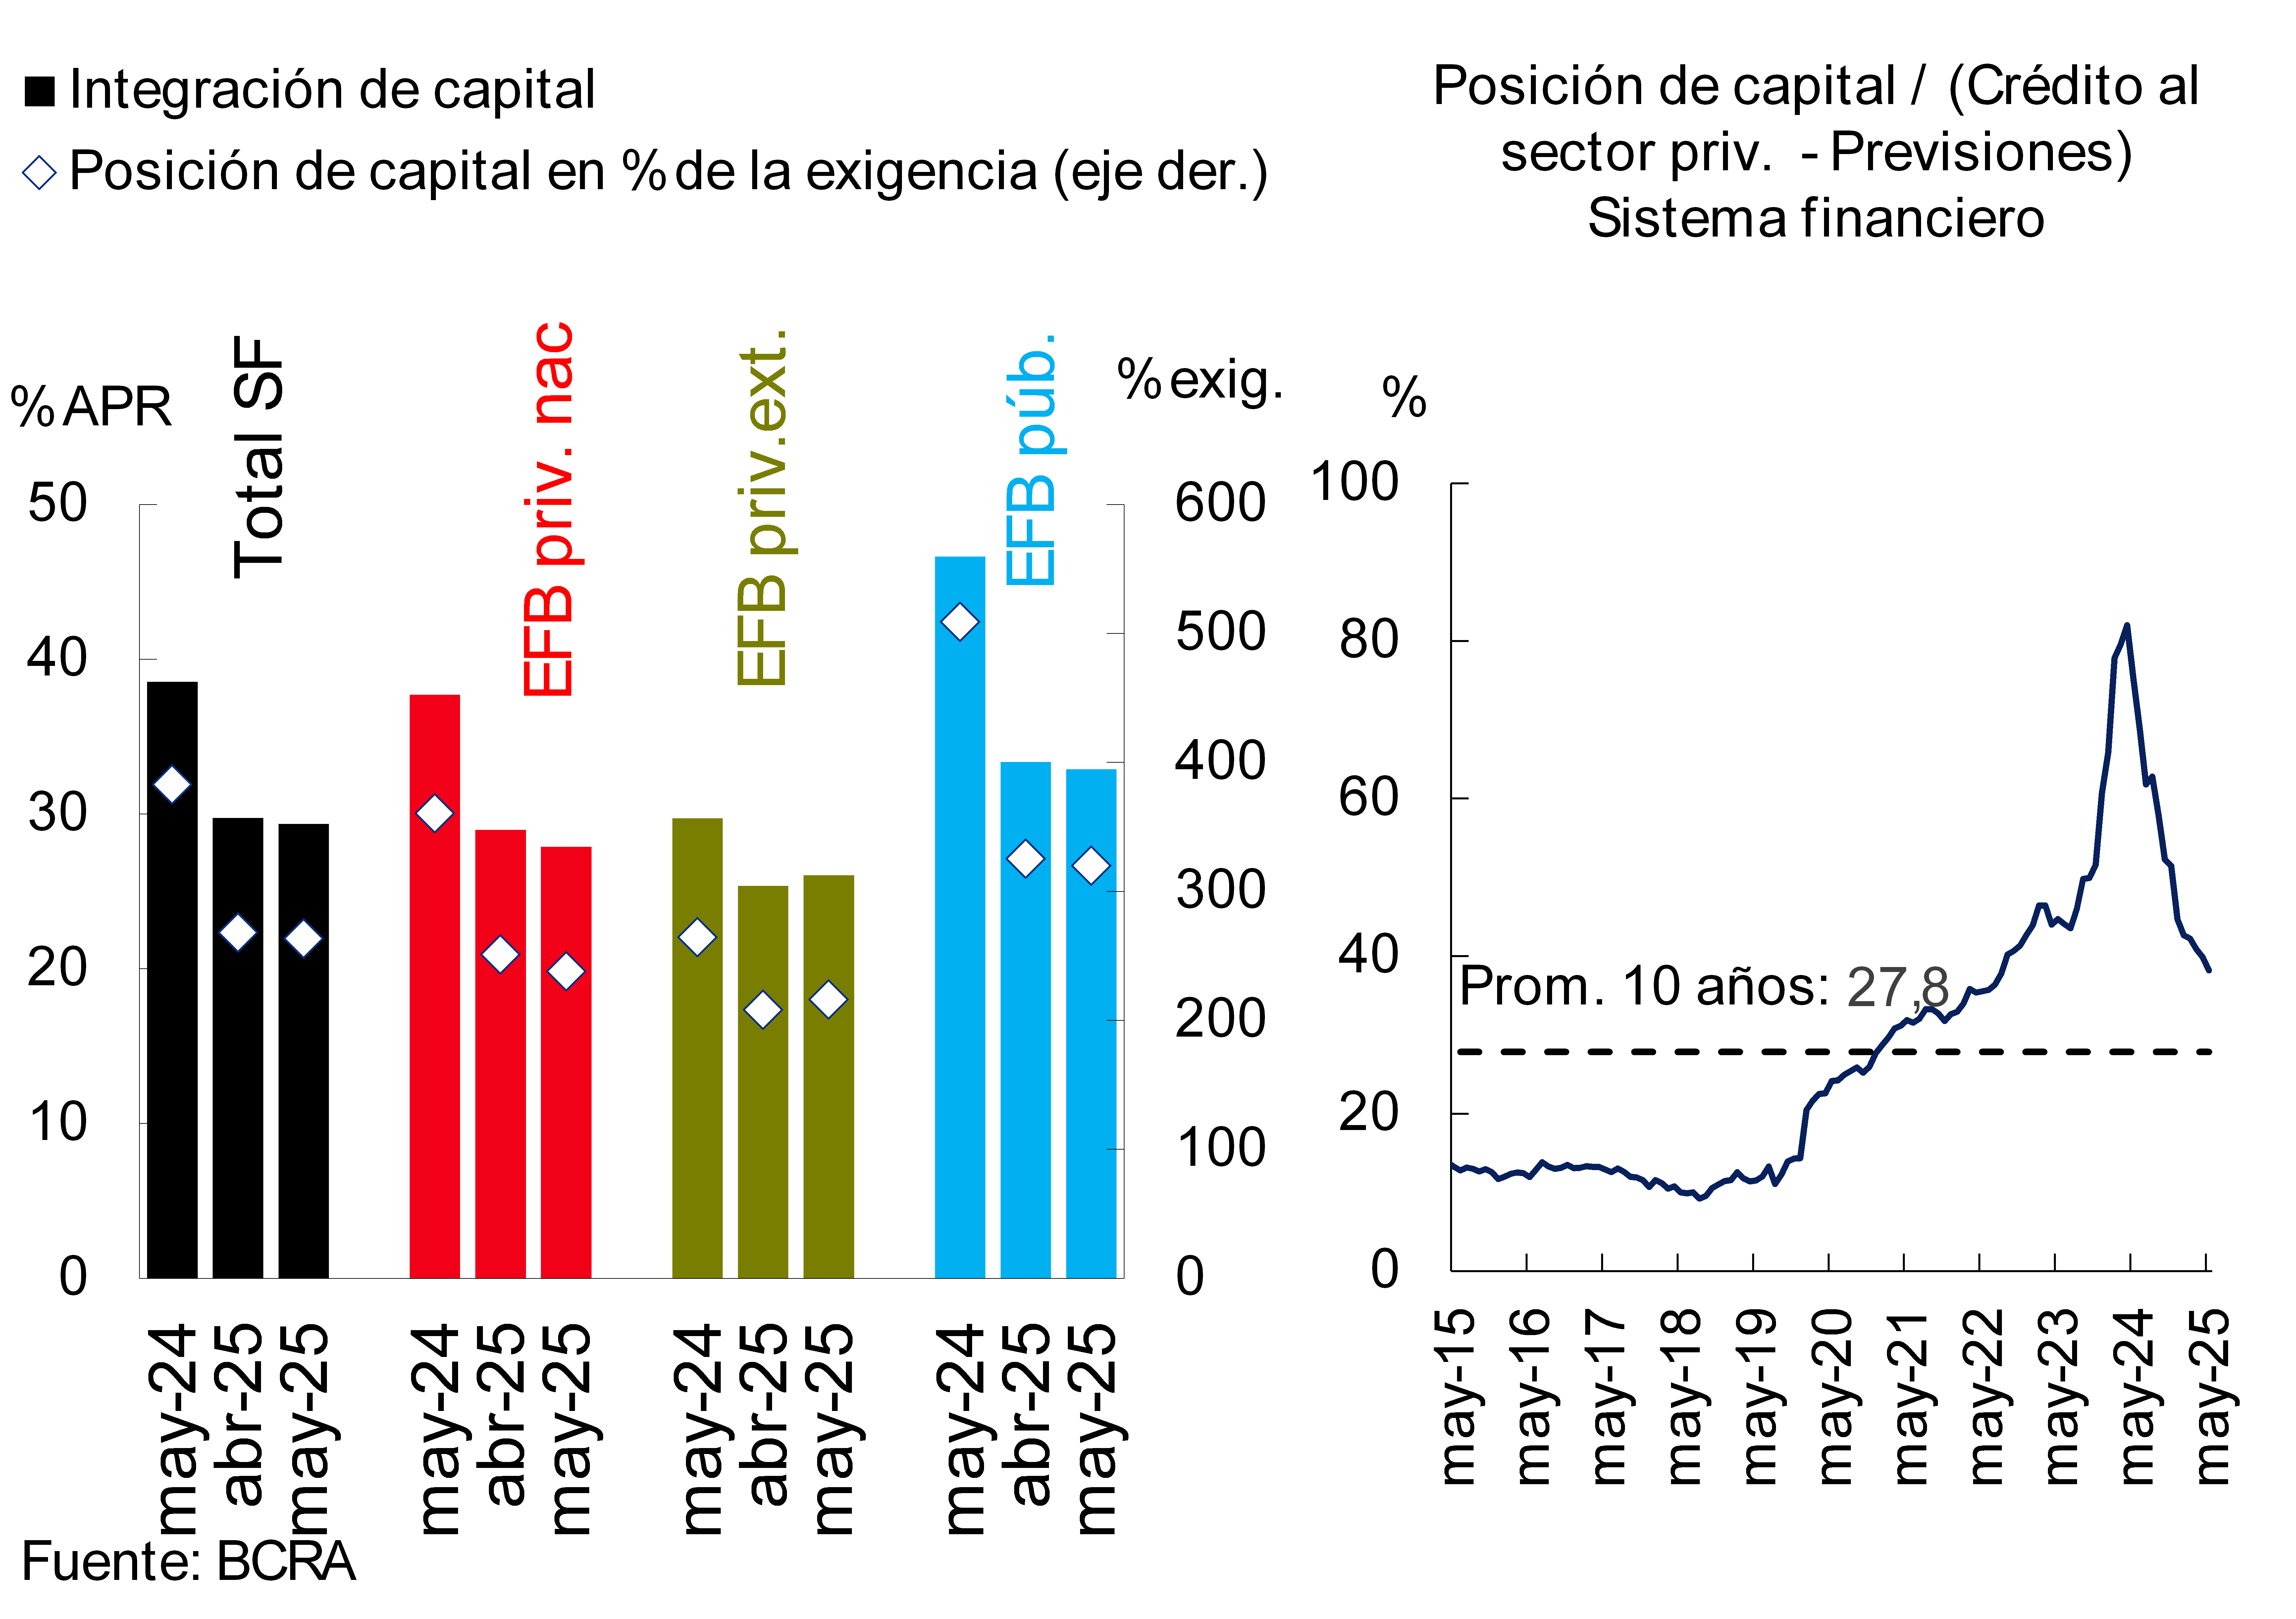
In the month, the capital integration ratio for the financial system fell by 0.4 p.p. of risk-weighted assets (RWA), to 29.4% (see Chart 11). This monthly decrease was explained by the national and public private banks. For its part, the capital position ratio (net integration of the minimum regulatory requirement) fell to 263% of the regulatory requirement in the month (-4.7 p.p. monthly and -120 p.p. y.o.y.). In the context of the credit expansion, this capital position represented 38.2% of the balance of financing to the private sector net of forecasts6 in May, remaining above the average of the last 10 years.
Figure 11 | Solvency
indicators By financial institution group
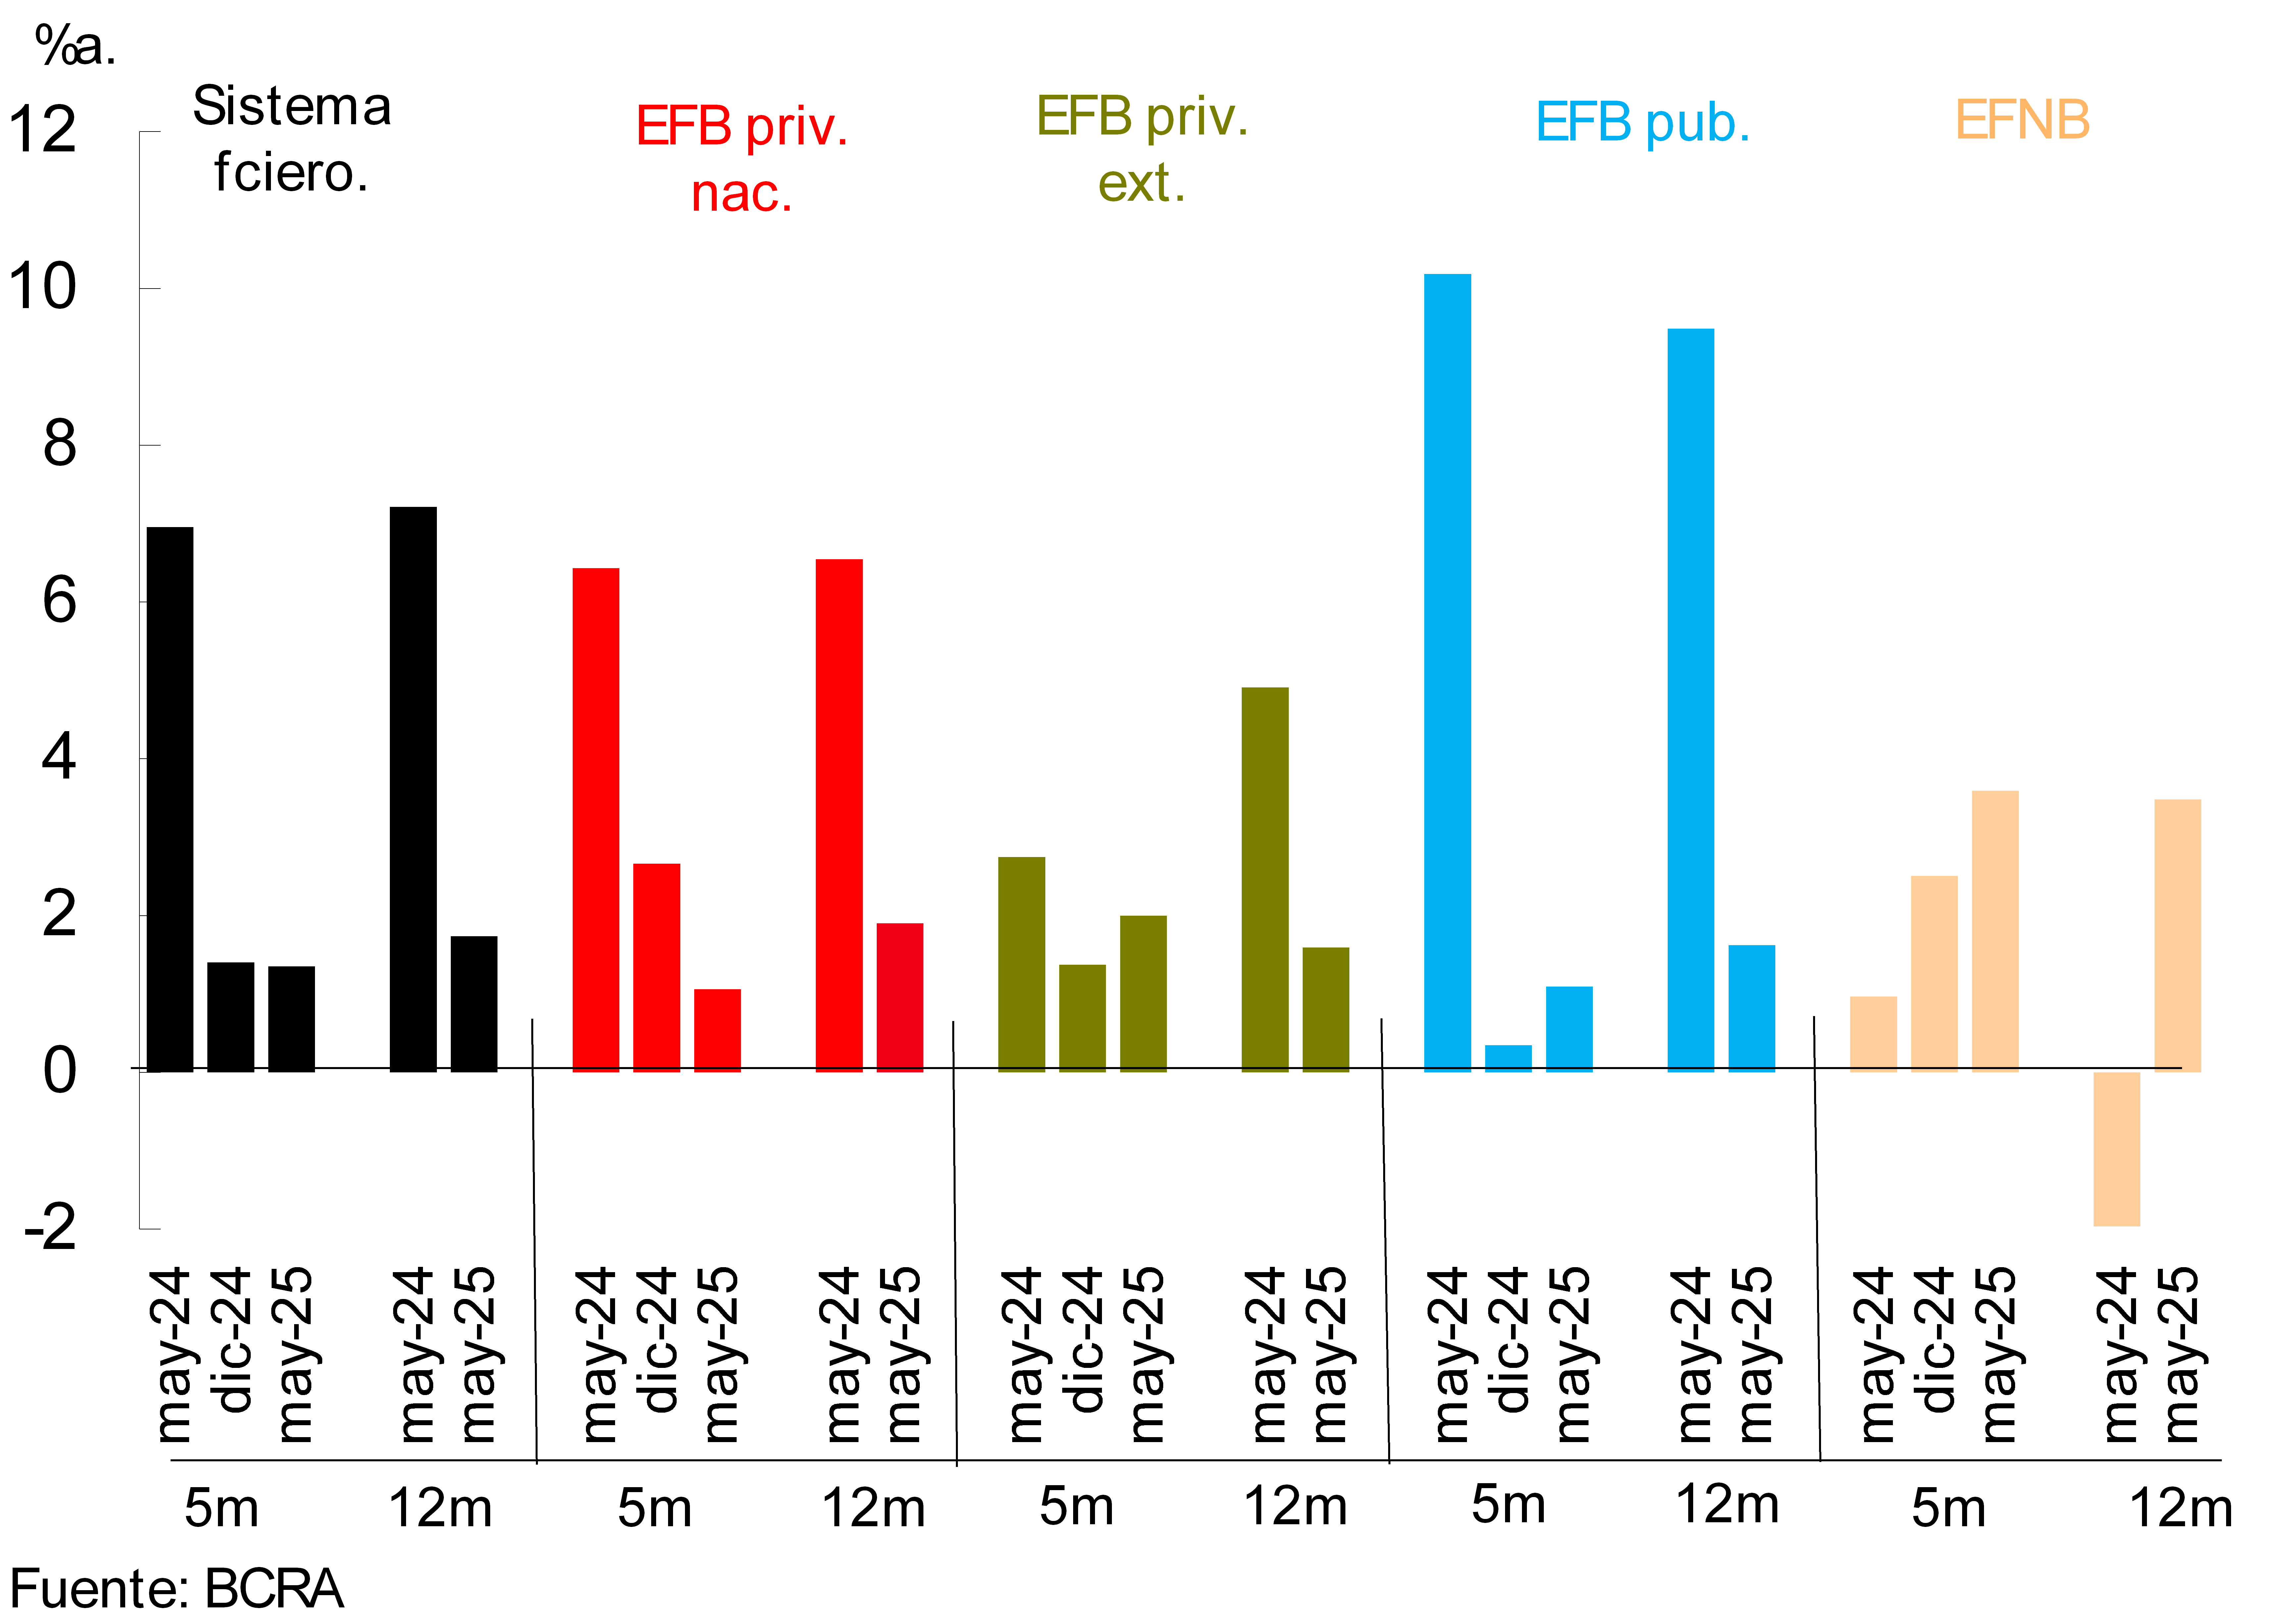
In the first 5 months of 2025, the financial system recorded gains equivalent to 1.4% annualized -a.- of assets (ROA). This level of the indicator was similar to that verified in the last 5 months of the previous year, although lower in a year-on-year comparison (see Graph 12). Compared to the same period of the previous year, the comprehensive financial margin was reduced and uncollectibility charges increased; effects that were offset by the decrease in administrative expenses and monetary results. Considering the cumulative 12 months to May, the financial system accrued an ROA of 1.7% (ROE of 6.9%), 5.5 p.p. lower than a year ago (-24.9 p.p. y.o.y. in ROE).
Figure 12 | 5 and 12 months
cumulative ROA By financial institution group
V. Payment system
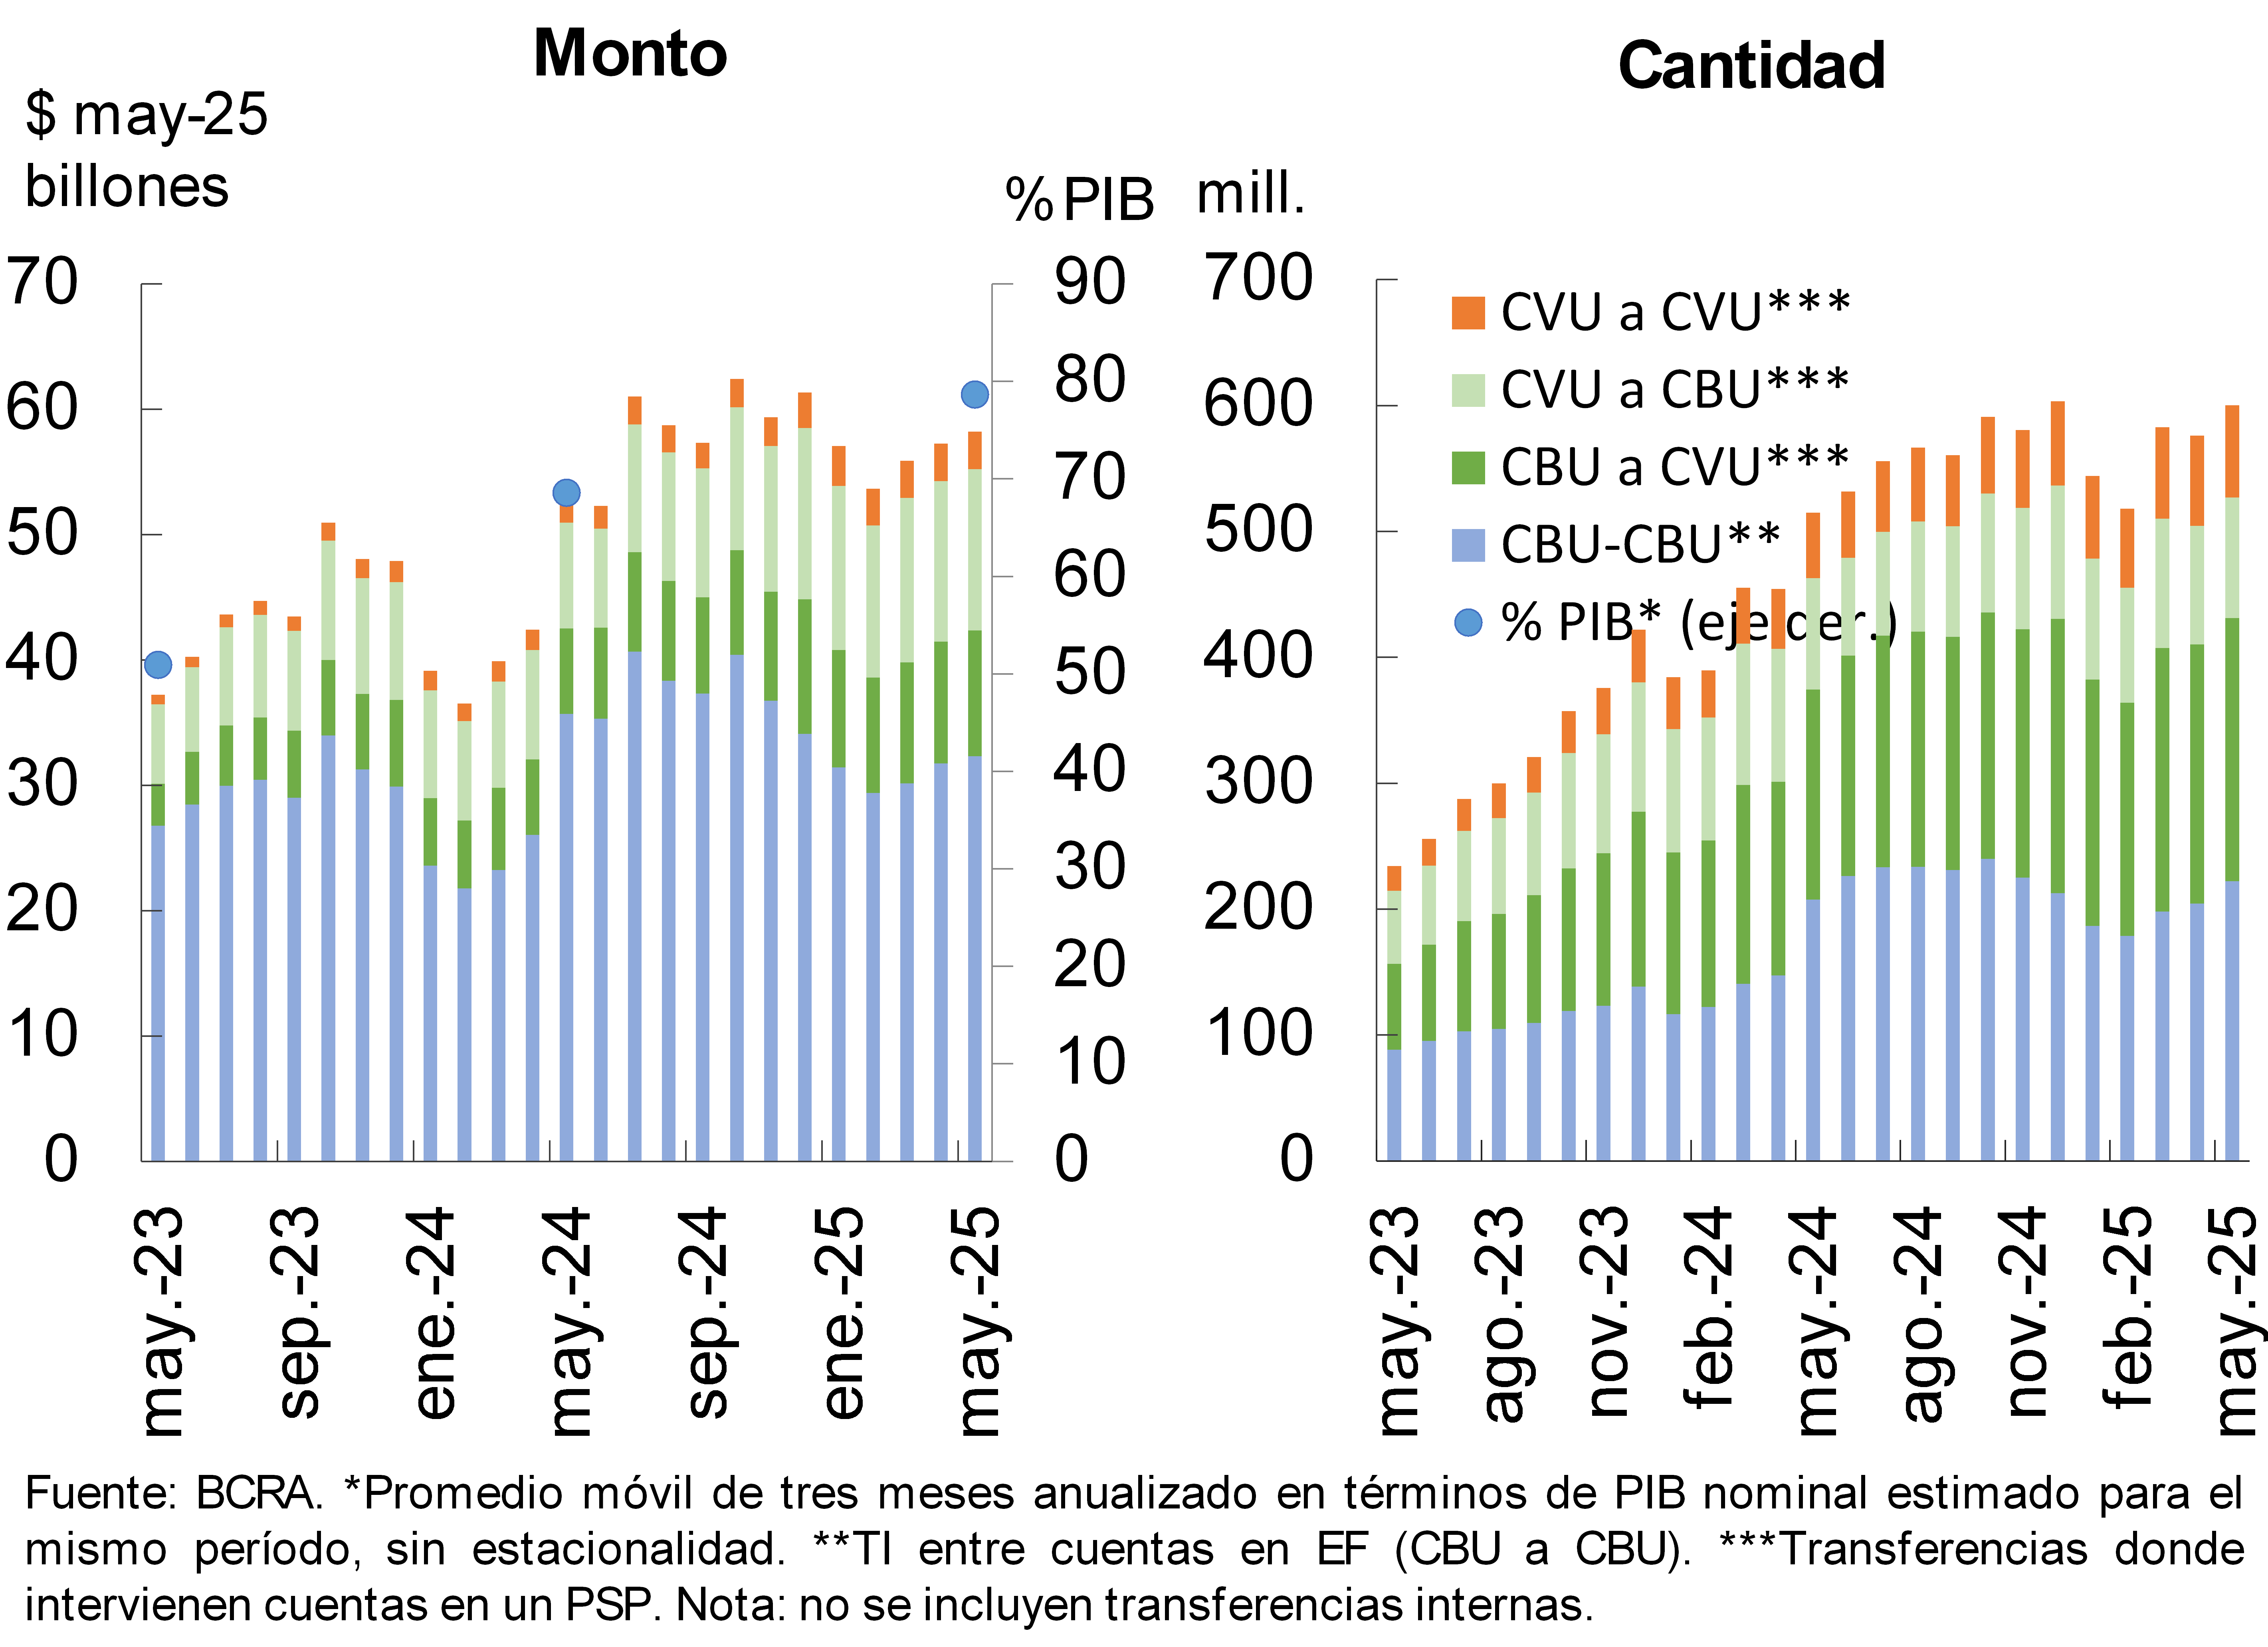
In May, immediate transfers (TI) grew 1.5% in real amounts and 4.2% in amounts. In year-on-year terms, IT accumulated an increase of 9.5% in real amounts and 16.2% in quantities (see Graph 13). In particular, among the IT modalities, the year-on-year increase in real amounts of transfers between CVU (66.4%), CVU to CBU (52.1%) and CBU to CVU (47.3%) stood out; while IT among CBUs was reduced (-11.4%). 7 8. IT consolidated its role in the economy, reaching a level equivalent to 78.7% of GDP, which represents an increase of 10.1 p.p. y.o.y.
Chart 13 – Immediate Transfers (IT)
In May, payments with interoperable transfers (PCTI) by QR code expanded 2.6% in amounts and 10.7% in real amounts compared to April. Year-on-year, the PCTI exhibited increases of 46.8% in quantities and 71.8% in real amounts9. These operations came to represent 1.5% of GDP, 0.6 p.p. above the level of a year ago.
In May, the clearing of checks increased by 0.6% in amounts and 3.2% in real amounts (see Chart 14)10. In the year-on-year comparison, the total compensated showed a slight decrease of 0.8% in quantities, although it grew 13.2% in real amounts. ECHEQs continued to consolidate as the predominant modality: they increased 2% monthly and 19.8% y.o.y. in quantities, and 3.5% monthly and 22.5% y.o.y. in real amounts. With this, the ECHEQs managed to represent 55.2% of the total compensated in amounts and 79.4% of the amounts. The total cleared in checks stood at a level equivalent to 23.9% of GDP, 1.8 p.p. above that recorded a year ago.
Graph 14 : Check clearing
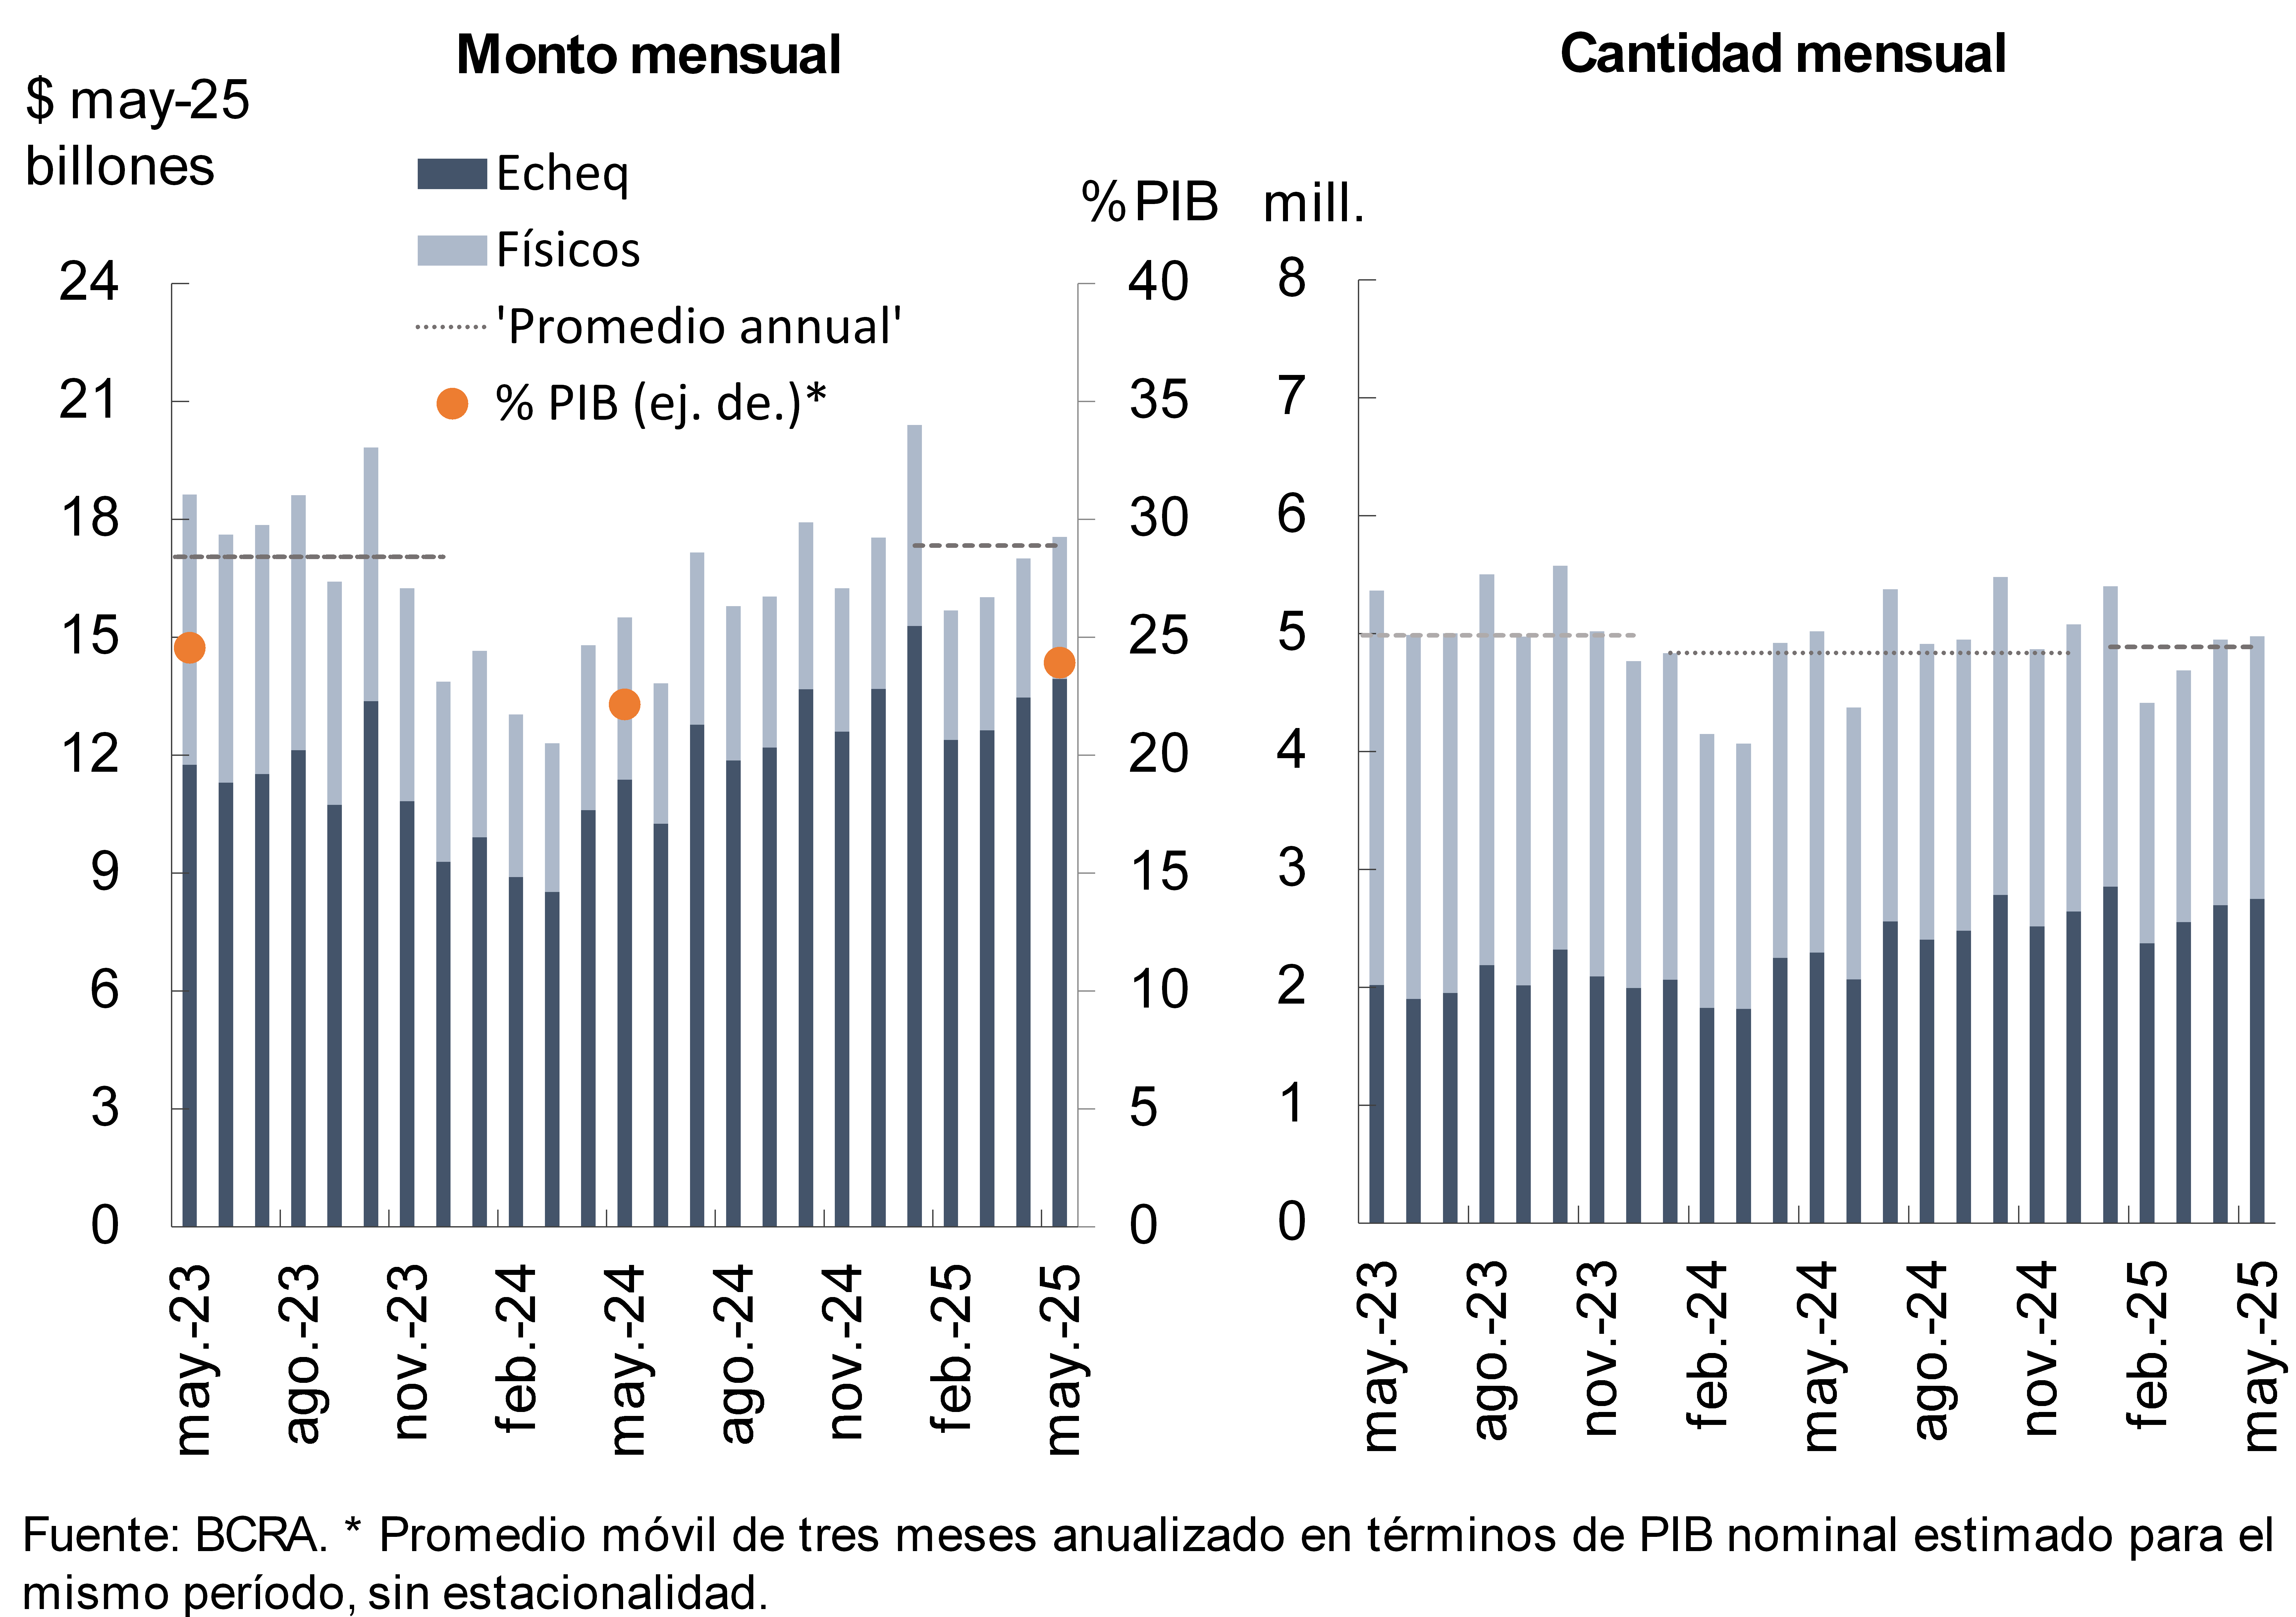
In May, the ratio of rejected checks due to lack of funds over the total cleared stood at 1.39% in amounts and 1.24% in real amounts, increasing 0.1 p.p. and 0.4 p.p. compared to April, respectively. In the year-on-year comparison, the increases in these ratios were 0.83 p.p. (amounts) and 0.76 p.p. (amounts).
References
1 Financing to companies includes those granted to legal entities and commercial financing granted to individuals. On the other hand, loans to families are considered to be those granted to individuals, unless they are for commercial purposes.
2 The balance of time deposits includes time deposits and term investments.
3 When considering the ratio between credit to the private sector net of forecasts and assets, the ratio would be around 40.3% at the systemic level.
4 Excludes the period from March 2020 to June 2021 (validity of financial relief measures in the context of the COVID-19 pandemic).
5 It considers availabilities (cash and current account at the BCRA), fiscal liquidity bills (LEFI), and the balance of the types of public securities that the entities compute as part of the Minimum Cash (until mid-2024 it incorporated BCRA instruments).
6 Within the set of information used to monitor the degree of resilience of the financial system to its exposure to credit risk, this indicator provides a first approximation (hypothetically, extremely) of how much the deterioration in the quality of the private sector loan portfolio (without recovery) should be to exhaust the excess capital of the financial system as a whole.
7 In year-on-year terms through May, the amount of IT among CVUs increased 41.2%, while those among CBUs grew by just 6%. On the other hand, CBU to CVU operations registered an increase of 25.2% YoY, while CVU to CBU operations showed an increase of 8.3% YoY.
8 In May, the average value of IT was $94,620.
9 In May, the average value of PCTs through QR codes was $18,088.
10 In May, the average amount of cleared checks was $3.5 million (physical format: $1.6 million; ECHEQs: $5 million).
Share on


