I. Financial intermediation activity
Financial intermediation activity with the private sector presented a positive performance in May, with increases in the real balances of loans and deposits in both pesos and foreign currency.
Considering the movements – in homogeneous currency – of the main items of the balance sheet in pesos of the financial institutions as a whole, on the side of the origins of funds in May, the balance of deposits in the public and private sectors increased and the passes with the BCRA were reduced1. On the other hand, the increase in the real balance of financing (public and private) was the main application of resources. In relation to the foreign currency segment, the balance of private sector deposits grew in the month and, to a lesser extent, liquidity was reduced; while the balance of credit to the private and public sectors in the same denomination increased.
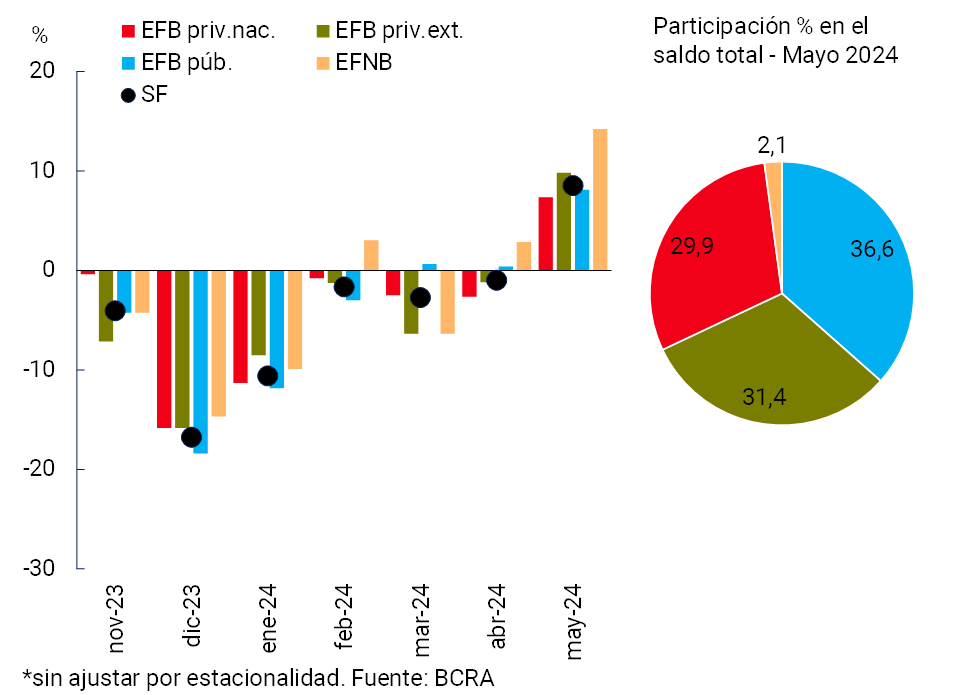
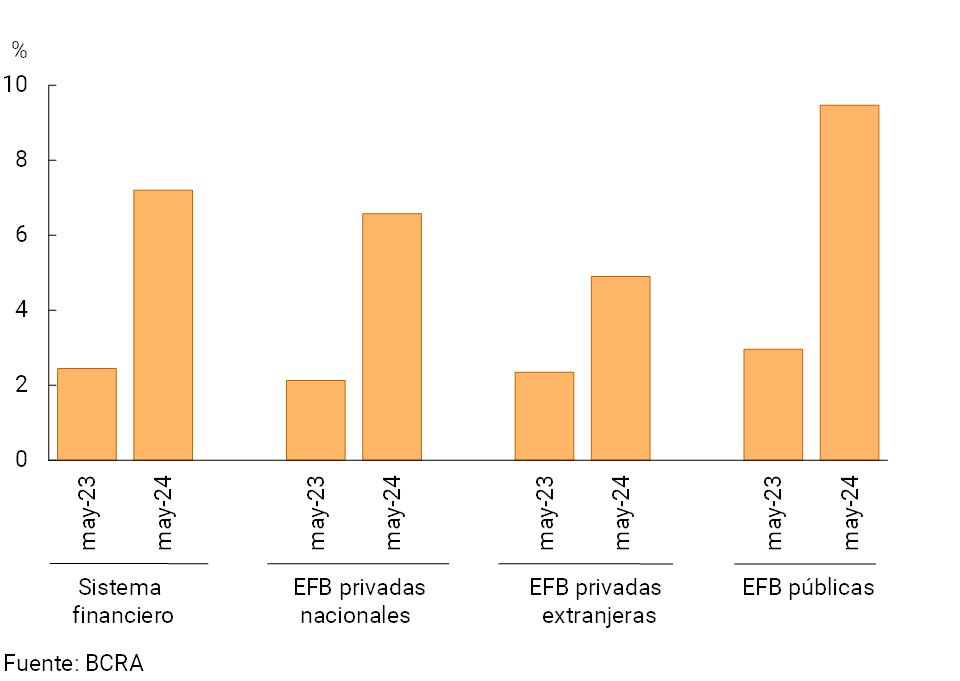
In May, the real balance of financing to the private sector in pesos increased by 8.5% (+13.1% nominal)2, with generalized increases among groups of financial institutions (see Graph 1). All credit assistance grew in the month, with greater relative dynamism in commercial loans (10.4% in real terms) and in consumer lines (8.1% in real terms)3.
Graph 1 | Balance of credit to the private sector in pesos
Monthly changes in real terms*
Graph 2 | Financial intermediation in foreign currency with the private
sector Financial system
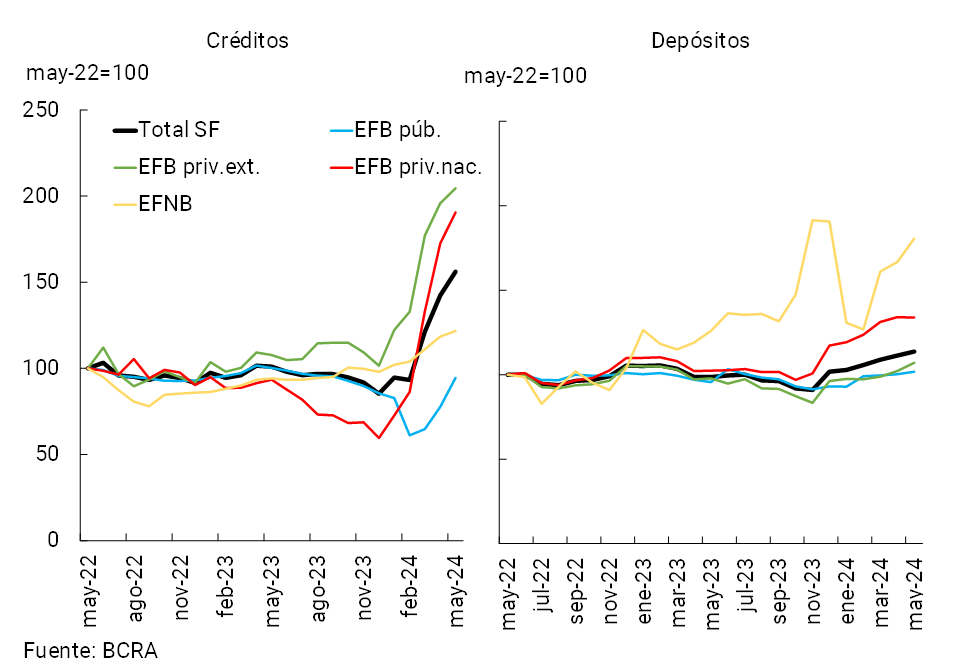
As for the foreign currency segment, the balance of financing to the private sector increased 9.8% in May (see Chart 2), driven by public and domestic private financial institutions4. Monthly performance was mainly boosted by trade lines (documents and export pre-financing accounted for almost 90% of the increase in the period)5. In this scenario, the total financing balance (in domestic and foreign currency) to the private sector grew 8.4% in real terms (+12.9% nominal) compared to the previous month (-20% in real terms in a year-on-year comparison).
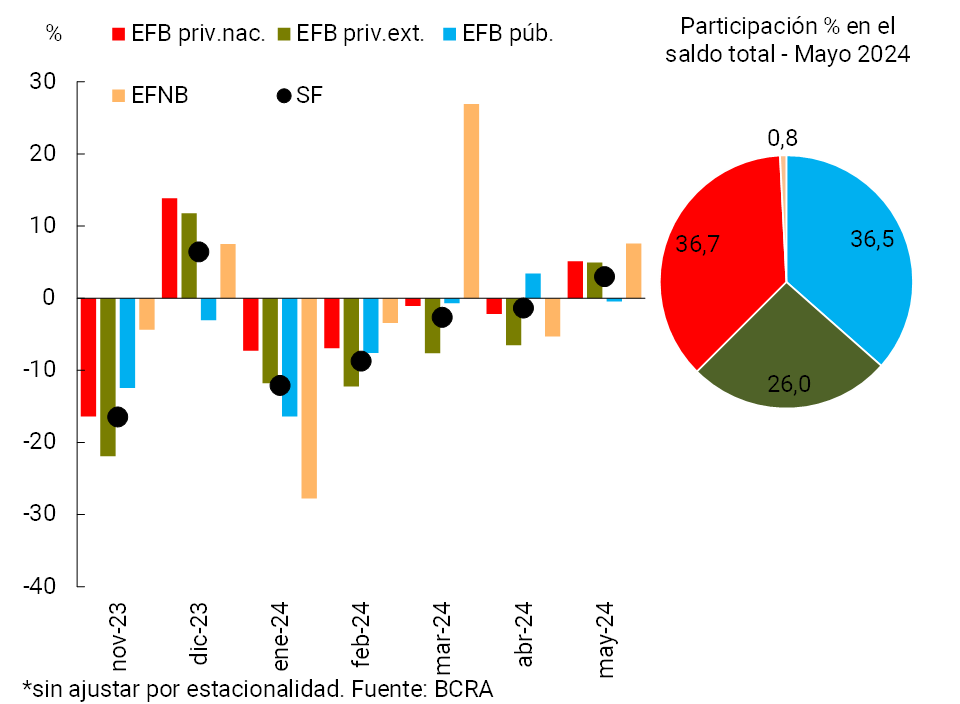
With regard to the funding of all financial institutions, in May the balance of deposits in pesos in the private sector increased by 3% in real terms (+7.3% nominal), with increases in most groups of financial institutions (see Graph 3). In the month, demand accounts grew 8% in real terms (+12.5% nominal), mainly due to the interest-bearing segment. For its part, in the period the real balance of time deposits in pesos fell by 2.1% (+2% nominal) at the aggregate level6.
Graph 3 | Balance of private sector deposits in pesos
Monthly changes in real terms*
Private sector foreign currency deposits increased 2.2% in the month, accumulating a year-on-year increase of 15.3%. The monthly performance was mainly driven by foreign private banks (see Chart 2)7. When including all currencies and sectors, the real balance of total deposits decreased by 23.7% YoY.
II. Evolution and aggregate composition of the balance sheet
In May, the total assets of the financial system fell by 1.4% in real terms compared to last month. In a year-on-year comparison, the total assets of the sector accumulated a decrease of 12% at constant prices, a generalized performance among the different groups of financial institutions.
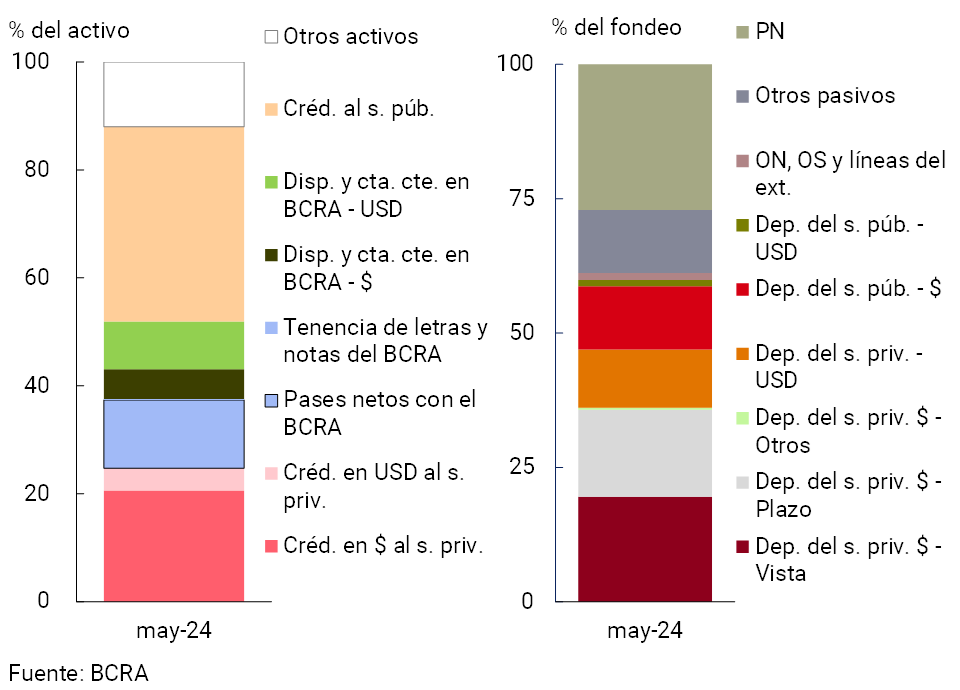
In accordance with the redefinition of the regulatory framework that promotes the management of short-term liquidity through Treasury securities to replace the BCRA’s remunerated liabilities, in May the weight of net passes with the BCRA in the total assets of financial institutions decreased (to 12.6%) and the relative importance of financing to the non-financial public sector increased (to 36.1%, see Figure 4). On the other hand, the weighting of credit in pesos to the private sector also increased, and the availabilities and current accounts in the BCRA in the same denomination8. With regard to the composition of total funding, the share of net worth in the total fell during the month (to 27.1%), while private sector demand accounts in pesos and public sector deposits in national currency increased in relative importance (to 19.6% and 11.8% respectively)9.
Figure 4 | Composition of assets and funding Financial
system – Participation %
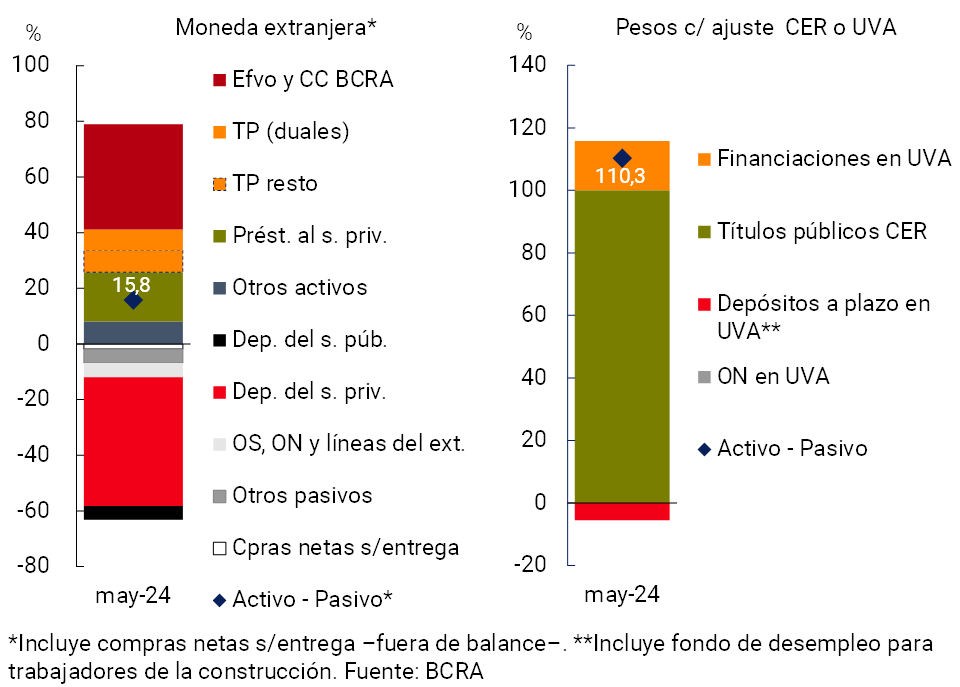
In a context in which the balance of loans, government securities and deposits in foreign currency grew in the month, the estimated spread between assets and liabilities in this denomination10 increased in May by 2 p.p. of regulatory capital, to 15.8% (-16.8 p.p. y.o.y., see Chart 5). On the other hand, the estimated differential between the balance sheet items in pesos with capital adjustment by CER (or that are agreed in UVA) increased by 5.4 p.p. of the PRC at the aggregate level in the month, to a total of 110.3% (+46 p.p. y.o.y.).
Graph 5 | Spread between assets and liabilities
In % of PRC
III. Portfolio quality
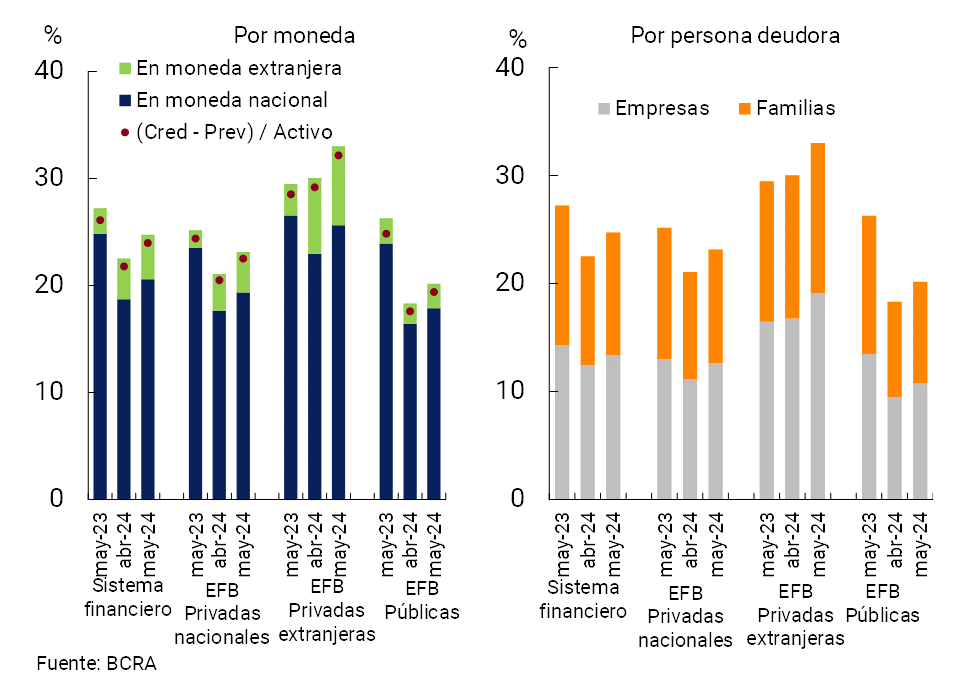
In May, the gross exposure of all financial institutions to the private sector (in domestic and foreign currency) increased by 2.2 p.p. of assets, to 24.7% (-2.5 p.p. y.a.; see Figure 6). The monthly performance reflected the effect of the increase in the real balance of credit to the private sector, and to a lesser extent, the real decrease in the total assets of the sector (see Section I and Section II). The increase in this indicator was reflected in both the segment for households and companies, and was widespread in all groups of banking financial institutions. Considering only the segment in pesos, the gross exposure of the financial system to the private sector totaled 20.6% (+1.9 p.p. monthly and -4.3 p.p. y.o.y.), while it reached 4.1% (+0.3 p.p. monthly and +1.8 p.p. y.o.y.) for items in foreign currency. If accounting forecasts are deducted, the total credit balance to the private sector represented 24% of assets in the period (+2.2 p.p. compared to April and -2.1 p.p. y.o.y.).
Graph 6 | Credit balance to the private sector in terms of assets
In May, the irregularity ratio of credit to the private sector stood at 1.9%, remaining unchanged in magnitude compared to last month (-1.2 p.p. y.o.y.; see Figure 7). The irregularity of loans to companies fell by 0.1 p.p. in the period, to a total of 1.1% (-1.8 p.p. y.o.y.), with slight falls in all economic sectors. For its part, the NPL ratio for loans to households increased by 0.2 p.p., to 2.8% of this portfolio (-0.4 p.p. y.o.y.), a dynamic driven mainly by collateral loans and financing through credit cards.
Figure 7 | Irregularity ratio of credit to the private
sector Financial system
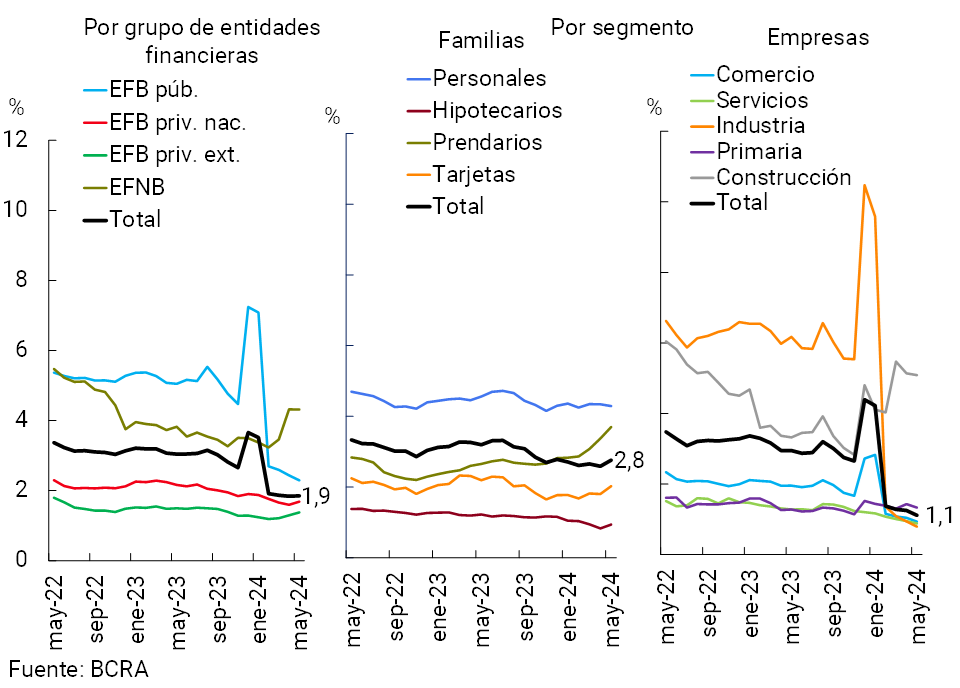
Figure 8 | Irregularity ratio of UVA loans to households – Sistema Financiero
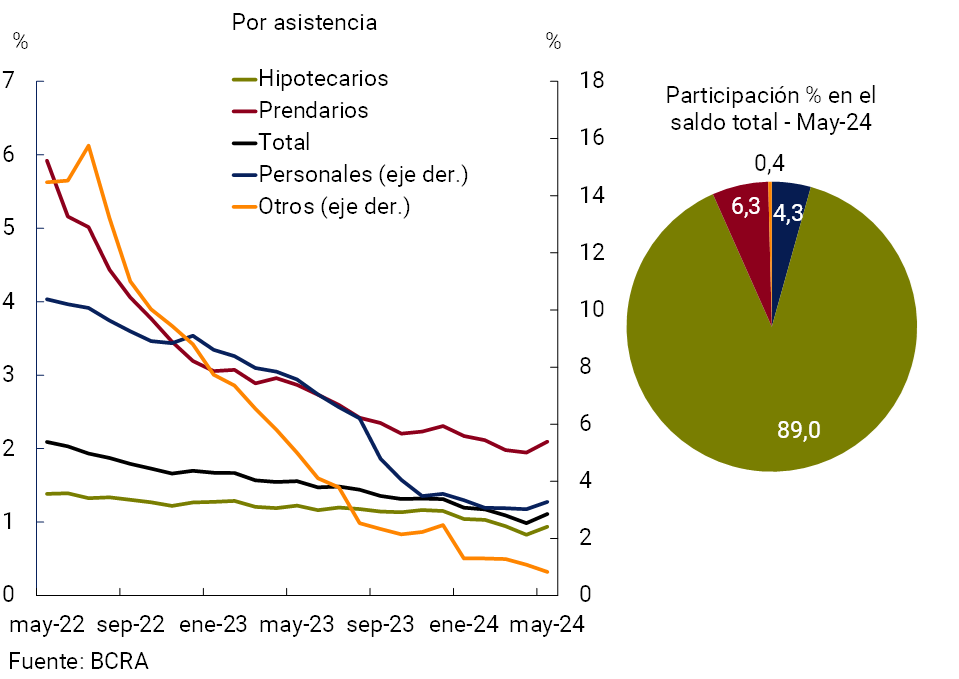
Within the household credit segment, the irregularity of UVA-denominated financing continued at very limited levels in the month (1.1%, +0.1 p.p. compared to April and -0.4 p.p. y.o.y.). In particular, mortgage-backed loans, which as of May accounted for almost 90% of the total balance of UVA financing, exhibited a NPL ratio of 0.9%, below the level corresponding to the total portfolio held with households (see Chart 8).
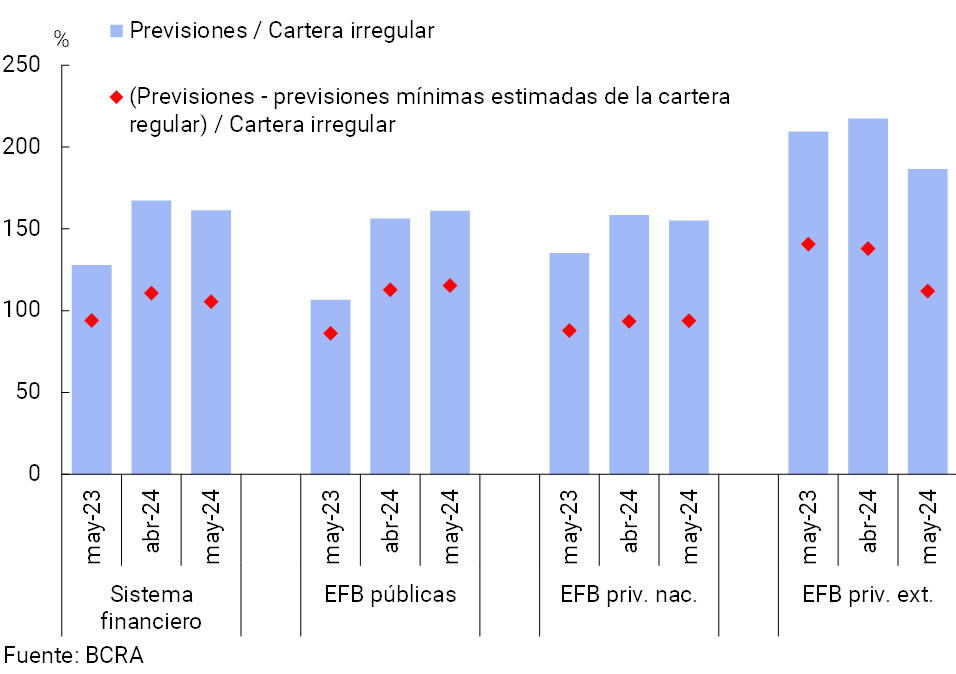
The sector continued to maintain comfortable levels of forecasting. The accounting forecasts represented 161.4% of the portfolio in an irregular situation at the aggregate level, reducing 6 p.p. in May, but exceeding the level of the same month last year by 33.5 p.p. (see Graph 9). In the period, the balance of forecasts attributable to the portfolio in an irregular situation continued to cover more than the total balance of said portfolio at the aggregate level, standing at 105.5% (-5.2 p.p. monthly and +11.5 p.p. y.o.y.)Question 11.
Figure 9 | Forecast balance (private sector)
By group of financial institutions
IV. Liquidity and solvency
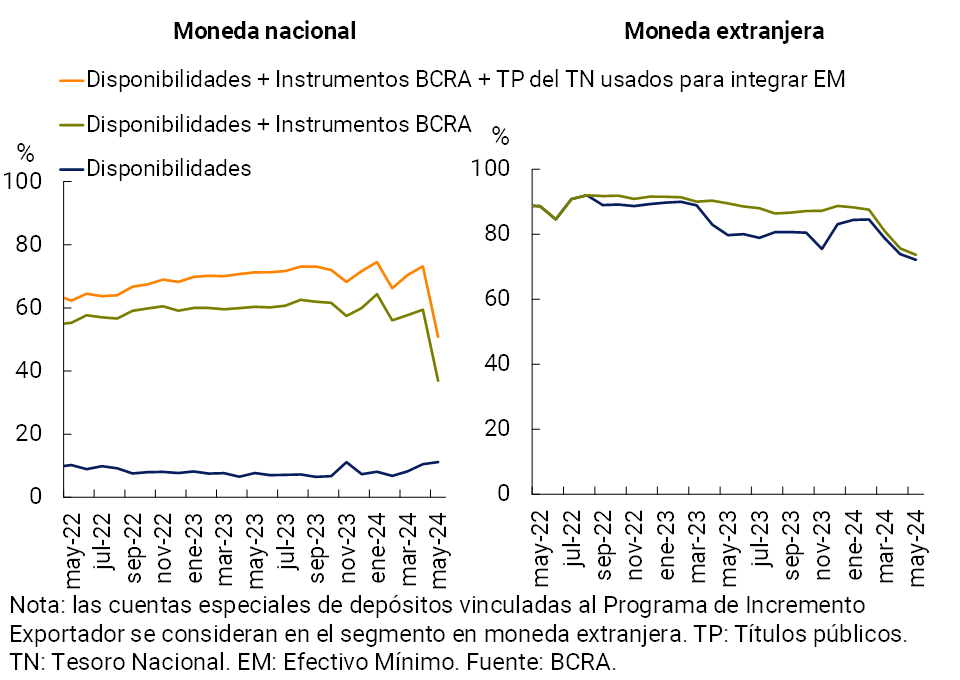
In May, the liquidity indicator that includes availabilities (cash and current account in BCRA) in terms of deposits totaled 23.4% (11.2% for items in national currency and 72.2% for the segment in foreign currency; see Graph 10), 0.2 p.p. below April and 4.1 p.p. higher in a year-on-year comparison. For its part, the broad liquidity ratio12 totaled 55.4%, 18.3 p.p. and 18.8 p.p. less than last month and May 2023, respectively. Regarding the composition of ample liquidity in pesos, in the month there was a dismantling of part of the position of passes of theentities 13, while the balance of National Treasury securities computed to integrate Minimum Cash and that of the accounts that the entities have in the BCRA increased slightly.
Figure 10 | Liquidity
indicators Financial system – As % of deposits
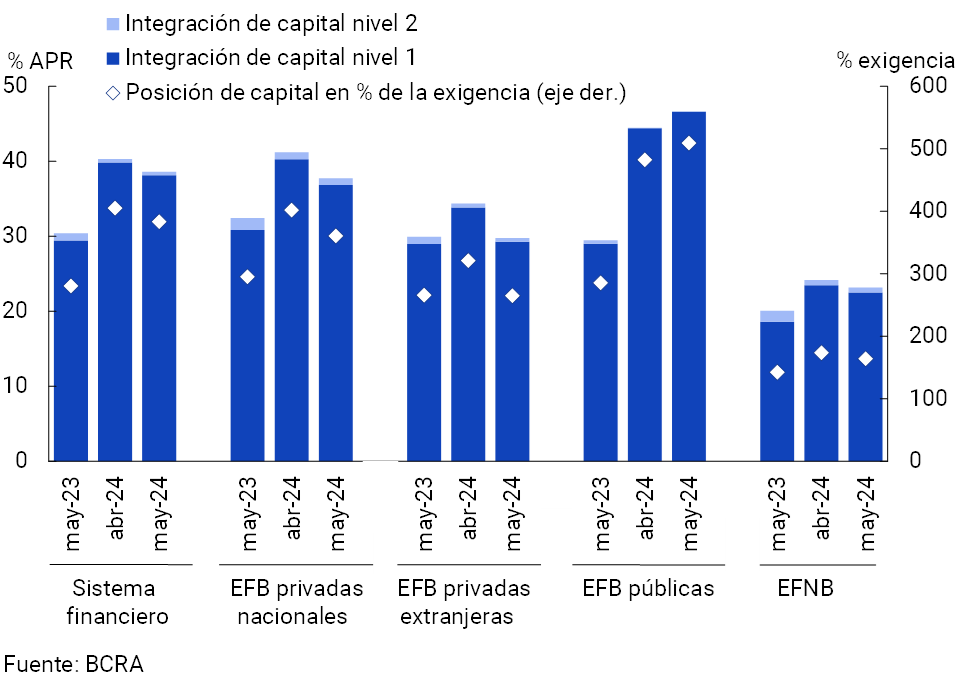
The regulatory capital integration (CPR) ratio stood at 38.6% of risk-weighted assets (RWA) for all entities (-1.7 p.p. m/m and +8.2 p.p. y.o.y., see Chart 11). The monthly decline in this ratio occurred in the context of a 0.9% real decline in the PRC (partly reflecting the effect of the authorized dividend distribution scheme)14, combined with a 3.5% real increase in RWAs (in line with the performance of credit to the private sector). In April, excess regulatory capital (RPC minus minimum regulatory requirement) represented at the systemic level 383% of the regulatory requirement and 75.2% of the balance of credit to the private sector net of provisions, well above the average of the last 10 years (24.1%).
Figure 11 | Capital Integration (RPC)
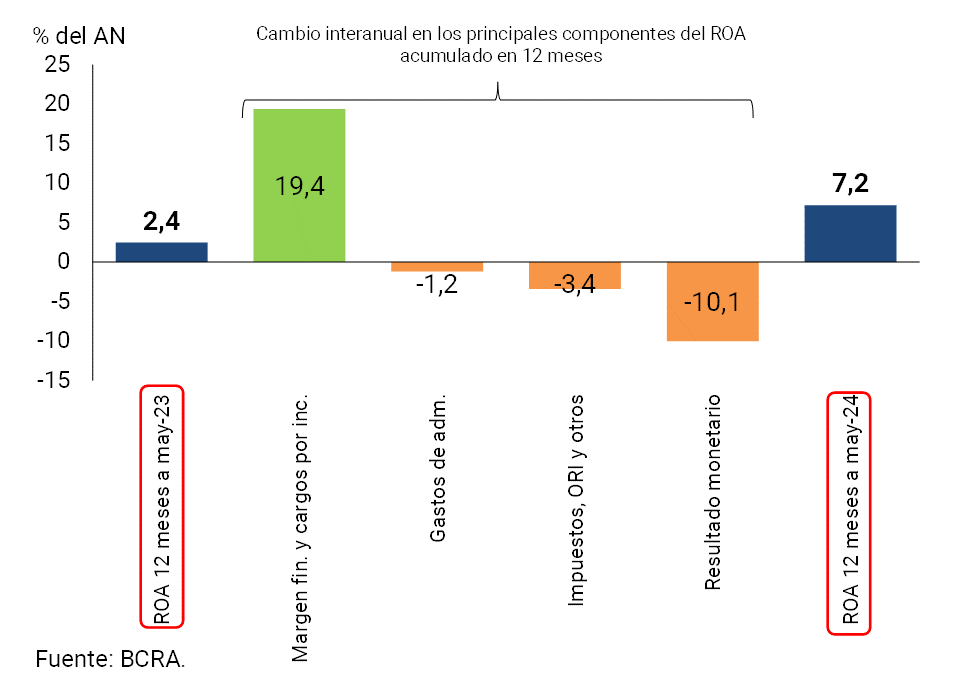
The total comprehensive profit in homogeneous currency of the financial system for the accumulated of the last 12 months to May was equivalent to 7.2% of assets (ROA) and 31.7% of equity (ROE), values higher when compared to those obtained a year ago (see Chart 12). The year-on-year increase is mainly explained by the increase in the financial margin, an effect partially offset by an increase in losses due to exposure to currency items and tax expenses, among other items.
Figure 12 | Comprehensive total profit in homogeneous currency of the financial system
The year-on-year increase in the profitability of the aggregate financial system in the last 12 months was mainly driven by the group of public banks (see Chart 13). Private banks also had a higher positive ROA than that recorded a year ago, while the profitability of non-bank financial institutions, although also improved compared to the previous year, continue to show losses.
Figure 13 | ROA by group of entities
Cumulative 12 months
V. Payment system
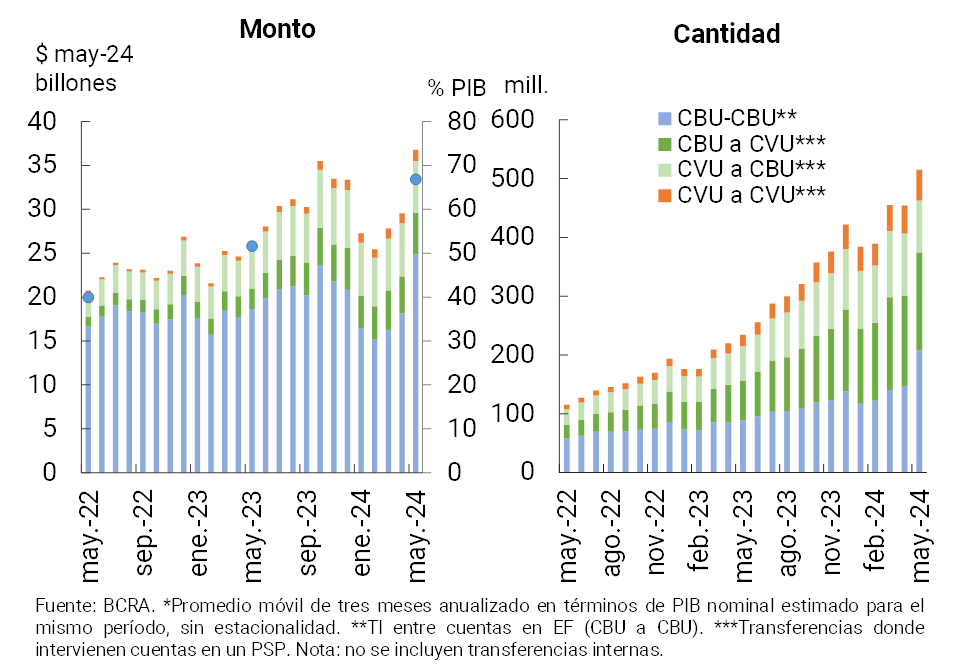
In May, immediate transfers (TI) grew significantly in relation to the previous month (24.7% in real terms in terms of amounts and 13.4% in terms of amounts, see Chart 14)15. Compared to the same period in 2023, the amount of IT more than doubled (+119.9%) and increased 43.6% when considering the actual amounts, a dynamism mainly explained by transactions involving the interaction between accounts in financial institutions (FIs) and payment service providers (PSPs), as well as the segment exclusively of accounts in PSPs16 17. In the last year, these operations gained weight in the economy as a whole: it is estimated that the aggregate amount of IT in the last three months (annualized) represented approximately 66.9% of GDP, 15.2 percentage points more than compared to the same month of the previous year.
Figure 14 | Instant Transfers (TI)
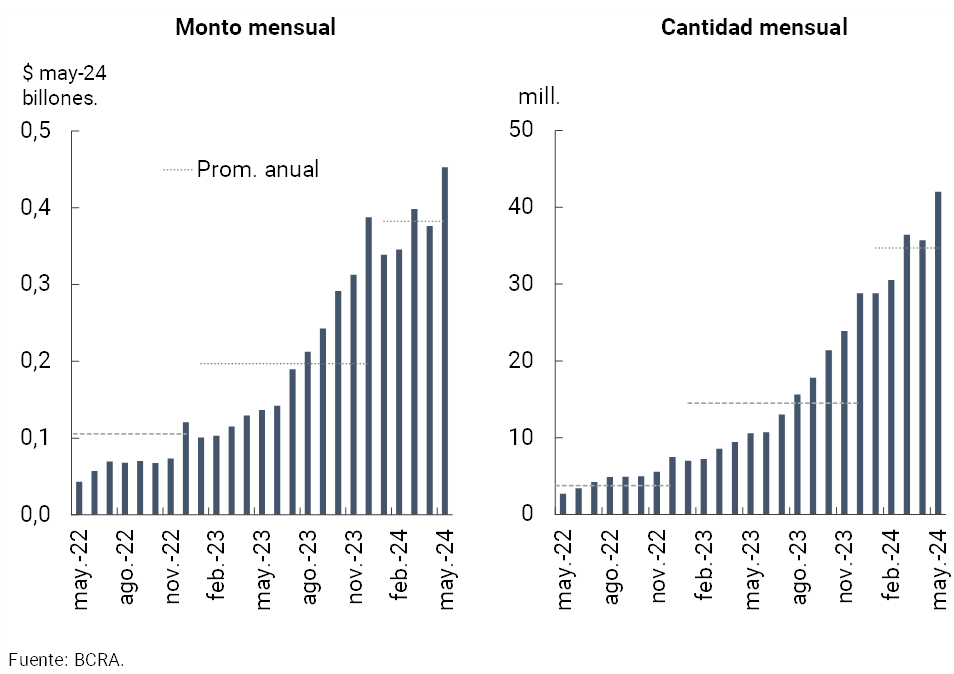
As observed in IT, Payments with Transfer (PCT) by QR code presented an outstanding performance in May, both in amounts (17.7% monthly and 297.3% y.o.y.) and in real amounts (20.4% monthly and 231.4% y.o.y., see Graph 15)18. In this context, at the end of the month the BCRA established interoperability in all registered digital wallets – whether bank or payment service providers – that allow payments by credit card and/or prepaid cards through QR codes, thus representing a substantial improvement in regular payment operations for both businesses and users. This advance implies a decisive step towards total interoperability in payment methods. The process, initiated and promoted by the BCRA, had as a milestone the entry into force of the interoperability of QR codes for credit card payments, which, after successive postponements, finally occurred on April 30, 202419.
Figure 15 | Payments with transfer (PCT) through interoperable QR codes
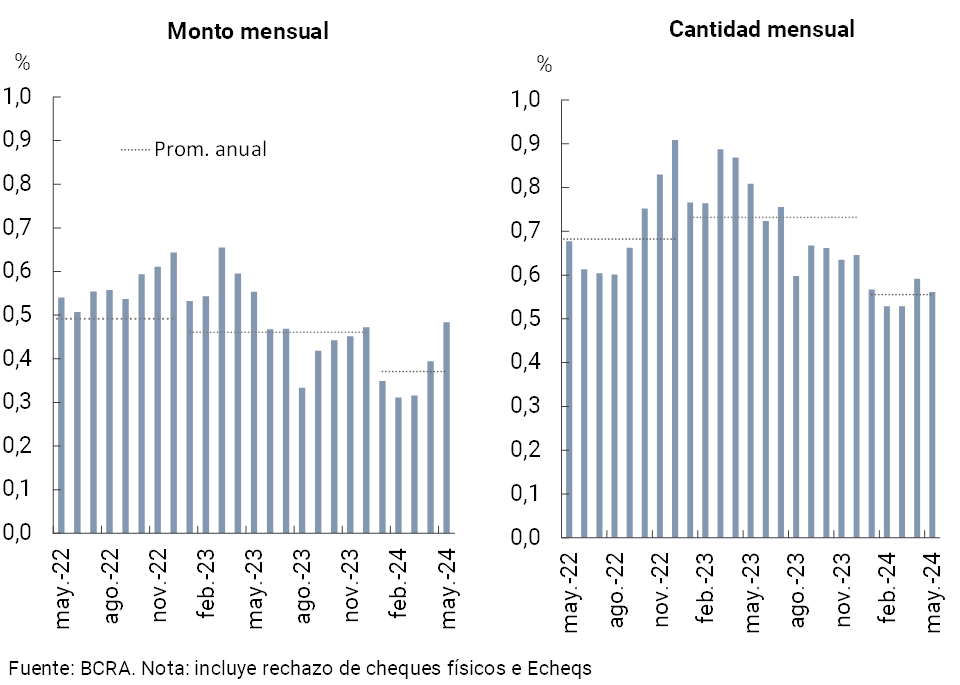
In May, more checks were cleared than in April, an increase driven by the Echeqs (+2% in amounts and +7.3% in real amounts)20. Gradually, a greater use of the digital format has been observed over the physical one, an example of this is that electronic clearing accounted for about 46% and 74% of the total operations in the month in terms of amounts and amounts, respectively. On the other hand, the rejection of checks due to lack of funds in relation to the total compensated presented a disparate behavior: increase in amounts (above the annual average) and slight reduction in amounts (in line with the average level for the year so far; see Graph 16).
Figure 16 | Bounce rate for non-funded checks – In terms of total compensated
References
1 Within the framework of the BCRA’s balance sheet clean-up strategy, in May the management of short-term liquidity was promoted through the dismantling of the BCRA’s interest-bearing liability position (whose interest rate was reduced by up to 40%) for Treasury securities (mainly LECAP). For more details, see Press Release of 16/05/2024 and the Monthly Monetary Report for May 2024.
2 Includes principal adjustments and accrued interest.
3 In a year-on-year comparison, the balance of credit in pesos to the private sector fell 27.1%.
4 In currency of origin.
5 In year-on-year terms, the balance of credit in foreign currency to the private sector accumulated a 54.7% increase.
6 In a year-on-year comparison, the balance of private sector deposits in pesos accumulated a 35.8% real fall.
7 In currency of origin.
8 The increase in the balance of availabilities and current accounts at the BCRA in the month was partly associated with changes in the minimum cash regulations, more specifically the increase in the reserve requirement ratio on balances in demand accounts of Money Market Mutual Funds and in passive stock market guarantees of financial institutions with a residual term of up to 29 days (see Communication A 8000).
9 The National Treasury deposited in the BCRA most of the surplus liquidity resulting from the migration of financial institutions from passive passes to public securities.
10 Includes off-balance sheet foreign currency purchase and sale transactions. Liabilities include deposits that have variable remuneration depending on the evolution of the exchange rate – associated with the Export Increase Programme – and LEDIV are included in assets.
11 Corresponds to the balance of total forecasts net of the minimum regulatory forecasts for debtors in situations 1 and 2, following the criteria of the minimum regulatory forecasts for risk of uncollectibility.
12 The liquidity ratio in the broad sense considers availabilities (cash and current account at the BCRA), pass operations against the BCRA, holding of BCRA instruments, and the balance of the types of public securities that the entities compute as the integration of Minimum Cash.
13 With counterpart in public securities. For more details, see footnote 1 and section 2 of this Report.
14 See Communication A 7184 and A 7997.
15 Of the total TIs carried out in the month, the following corresponded: 32.5% of CBU to CVU (13.2% of the total amount), 17.2% of CVU to CBU (16.4% of the total amount), 10.1% between CVU (not including those made between accounts of the same PSP, 3.5% of the total amount) and 40.2% for those that originate and reach CBU accounts (-excluding those made between accounts of the same financial institution-, 66.9% in amount).
16Compared to the same period in 2023, the number of transfers from CBU to CBU grew 135.1% (+35.5% in real amounts), +145.4% from CBU to CVU (104.1% in real amounts), +52.3% from CVU to CBU (33.1% in real amounts) and +163.1% between CVU (141.7% in real amounts).
17 In May, the value of IT averaged $69,956.98 ($116,408.15 for IT between CBU, $24,176.31 for IT between CVU, $28,465.34 from CBU to CVU, and $66,590.05 between CVU and CBU).
18 In May, interoperable QR transactions averaged about $10,516.
19 For more details, see press release of May 30, 2024 and Communication A 8032. In addition, this Communication specifies issues of an administrative and technical nature and those related to possible fraud.
20 In the month, the average amount of cleared checks was $2,152,852 ($1,055,423 in the physical format and $3,454,251 in ECHEQs).
Share on


