I. Financial intermediation activity
Considering the estimated flow of funds for the financial system,1 in May the nominal increase in private sector deposits was the most relevant source of funds (see Chart 1). On the other hand, the most outstanding resource applications of the month were the increase in the balance of LELIQ, followed, to a lesser extent, by the decrease in obligations payable – taxes and dividends.
Graph 1 | May-19 Cash Flow Estimate

Given these changes in the aggregate balance sheet of the group of banks, total assets fell 3% in real terms in May. In a year-on-year comparison (y.a.), assets fell 3.3% in real terms, a dynamic mostly explained by public banks.
The foreign currency assets of the financial system accounted for 31.4% of total assets in May, growing 1.1 p.p. compared to last month2. This increase was mainly reflected in the balance of the current accounts that banks have at the BCRA. Meanwhile, liabilities in this denomination totaled 30.8% of total funding in the month, 0.7 p.p. higher than last month, mainly due to the performance of demand deposits from the private sector. On the other hand, net forward purchases of foreign currency – classified as off-balance sheet items – went from a position bought in April to a position slightly sold in May (mainly by foreign private banks). Given these movements, the spread between assets and liabilities in foreign currency – including net forward purchases of foreign currency – reached the lowest level in recent years, equivalent to 6% of regulatory capital (2.3 and 7.3 p.p. less than in the previous month and May last year, respectively).
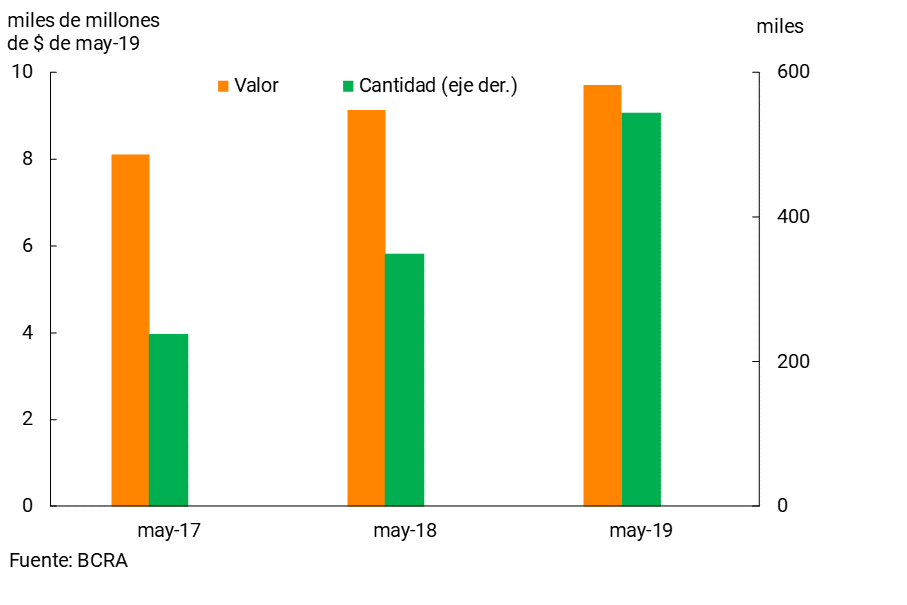
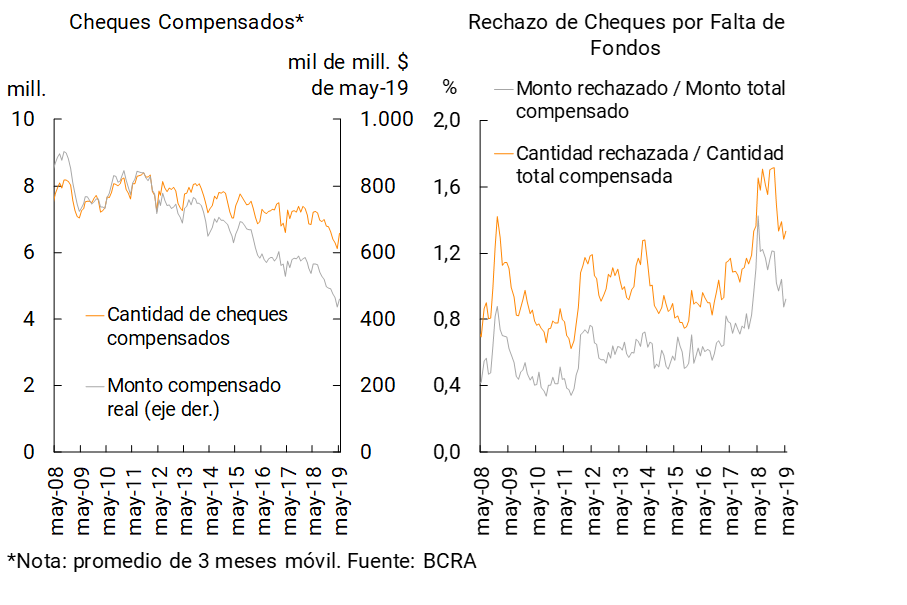
Considering the operations of the National Payment System, in the month the daily average of immediate transfers of funds increased compared to April and compared to the same period in 2018 (+56.1% YoY for the number of operations and +6.2% YoY in real terms, see Graph 2). In relation to checks issued, during May the compensation increased slightly (both in amounts and in real values), although a downward trend continues to be evidenced. On the other hand, the value and number of checks rejected due to lack of funds in terms of the total compensated did not show significant changes with respect to April, remaining below the peaks of May 2018 (see Chart 3).
Graph 2 | Immediate Funds Transfers
Daily average
Graph 3 | Check Clearing and Rejection
II. Deposits and liquidity
The balance of deposits in pesos in the private sector increased by 0.9% in real terms in May (+4% nominal, see Chart 4), with an increase in demand accounts (+1.5% real or +4.6% nominal) and in time deposits (0.9% real or +4% nominal)3. Private sector deposits arranged in foreign currency grew 1.3% in May (in source currency). For their part, public sector deposits fell in real terms in May. In this context, the balance of total deposits in the financial system remained without significant changes in real terms compared to April (+3.2% nominal).
Figure 4 | Private Sector Deposits
Monthly Change in Balance Sheet Balances*
In a year-on-year comparison, private sector deposits in local currency decreased by 3.1% in real terms, with an increase in time deposits (+6.3% y.o.y. in real terms) and a reduction in demand deposit balances (-11.1% y.o.y. in real terms). Private sector deposits in foreign currency expanded 17.5% in the last 12 months (in currency of origin). The balance of total deposits decreased slightly in real terms in the same period.
In May, the weighting of private sector deposits in the total funding – liabilities plus net worth – of the financial system stood at 60.6%, 1.7 p.p. above the April figure and 6.3 p.p. more than in May 2018. In the last year, placements in foreign currency and time deposits in pesos increased their participation in private sector deposits, to the detriment of demand accounts in pesos.
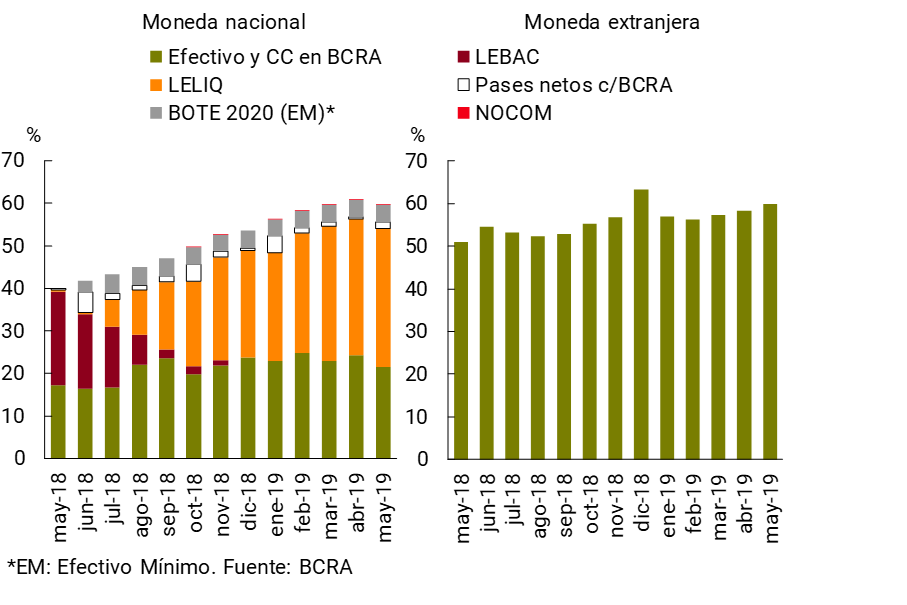
From high levels, liquidity in the financial system declined slightly in May. Broad liquidity indicator4 stood at 59.8% of total deposits (59.7% for items in pesos), 0.2 p.p. below the level recorded in April (-1.1 p.p. for the segment in national currency, see Chart 5). The monthly reduction in the liquidity ratio was due to the fact that the increase in the balance of deposits was relatively greater than the increase in liquid assets (mainly LELEQ). In year-on-year terms, the broad liquidity ratio grew by 17 p.p. of deposits (+19.8 p.p. for the peso indicator). Liquid assets in foreign currency totaled 59.8% of deposits in the same denomination in the period (+1.5 p.p. and +8.8 p.p. compared to last month and May 2018, respectively).
Graph 5 | Liquidity of the Financial System
III. Credit and Portfolio Quality
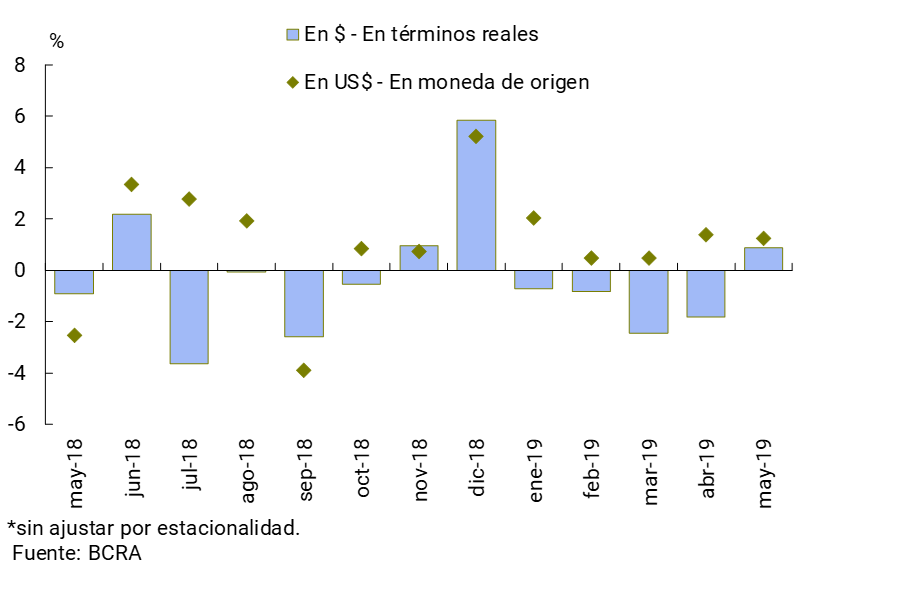
The balance of credit in pesos to the private sector decreased 2.5% in real terms in May (+0.5% nominal), mainly due to the performance of commercial lines and pledges5. Financing in foreign currency fell by 1.7% in the month (in the currency of origin, see Chart 6).
Graph 6 | Private Sector Credit Balance by Currency*
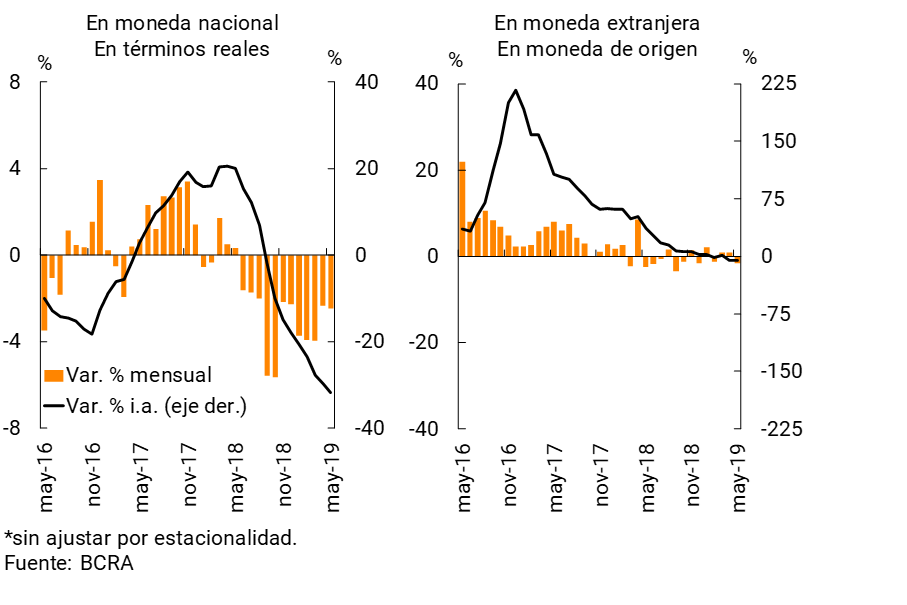
In a year-on-year comparison, in May the balance of loans in national currency to the private sector accumulated a 31.7% real fall, while financing in foreign currency fell 5% y.o.y. in source currency.
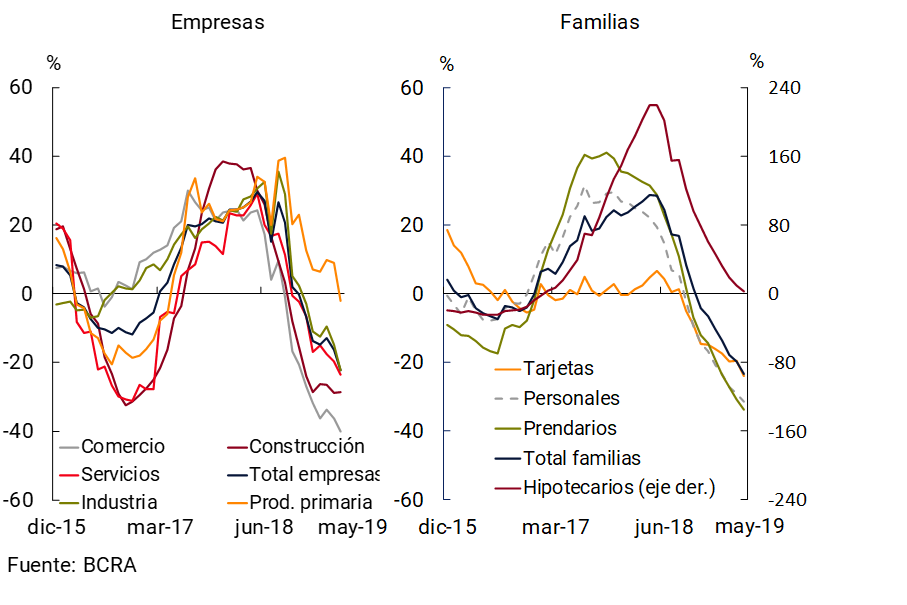
Total credit to companies (in domestic and foreign currency) decreased by 3.1% in real terms compared to April (-0.2% in nominal terms)6. The monthly behavior was reflected in all economic sectors and groups of financial institutions. In year-on-year terms, loans to companies accumulated a fall of 22.2% y.o.y. in real terms, being relatively higher in loans to commerce and construction (see Graph 7). Meanwhile, loans to households (in domestic and foreign currency) fell 1.6% in real terms in the month (+1.4% in nominal terms). In a year-on-year comparison, loans to households accumulated a decrease of 23.2% y.o.y. in real terms. Pledge and personal lines showed the largest relative year-on-year declines within this segment.
Figure 7 | Total Credit Balance by Segment
Year-on-year changes in real terms
In May, bank financing to the private sector in terms of total assets stood at 39.2%, slightly increasing compared to the value of the previous month (+0.2 p.p.). Compared to May 2018, this ratio accumulated a fall of 10.1 p.p.
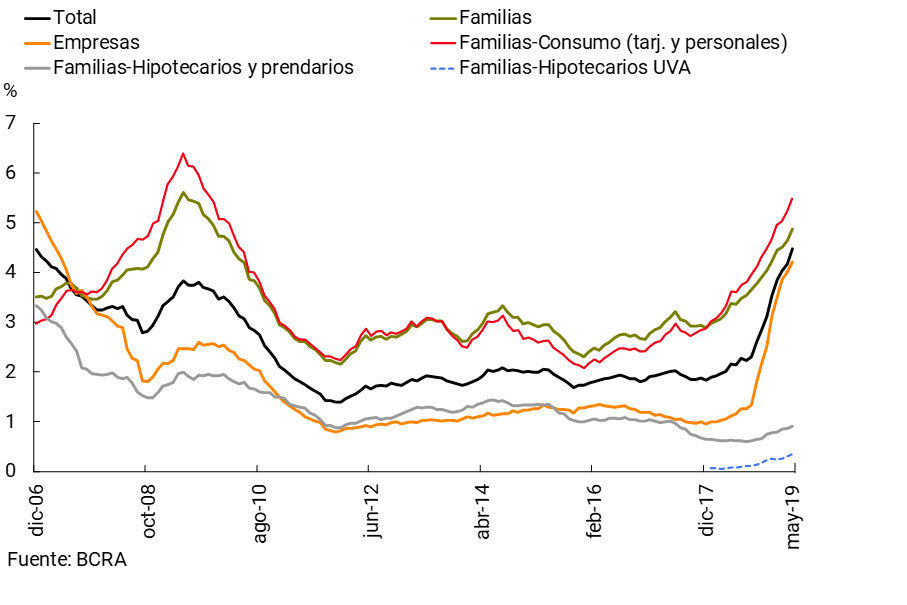
Irregular lending to the private sector accounted for 4.5% of the total portfolio in the month (+0.3 p.p. compared to April and +2.3 p.p. y.o.y., see Chart 8). The NPL ratio for loans to companies stood at 4.2% in the month (+3.1 p.p. YoY), while that of loans to households stood at 4.9% in May (+1.5 p.p. YoY). The irregularity coefficient of UVA mortgage loans to households remained unchanged in the period in the order of 0.3%, while that of the remaining mortgage lines increased slightly to 0.7%. 7
Figure 8 | Irregularity of Credit to the Private Sector
Irregular financing / Total financing (%)
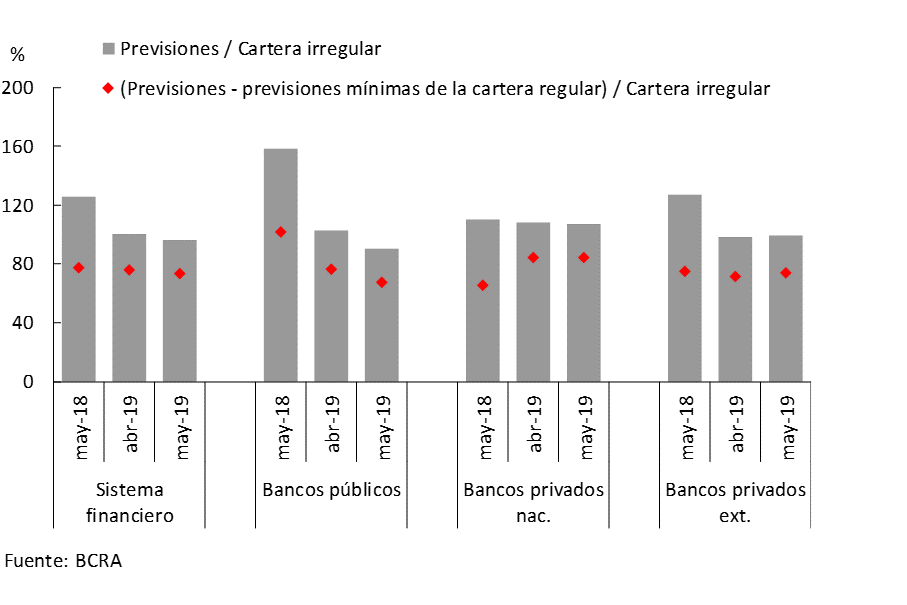
The estimated balance of forecasts attributable to the portfolio in an irregular situation represented 73% of this portfolio, slightly reduced compared to the April record, mainly due to the performance of public banks (see Chart 9). On the other hand, the balance of total accounting forecasts (considering both those awarded to the regular and irregular portfolios) represented 96% of the loans in an irregular situation to the private sector.
Figure 9 | Forecasting of the Financial System
IV. Solvency
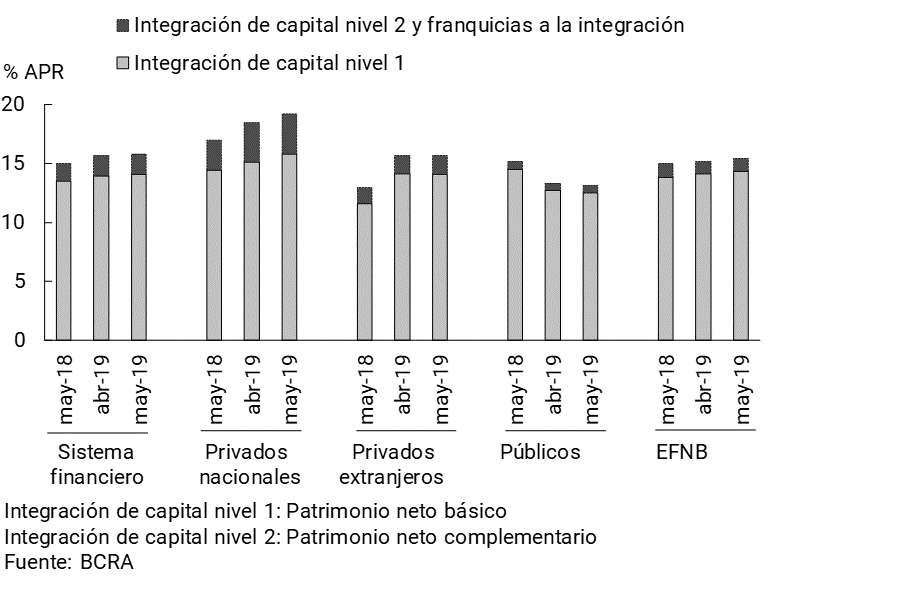
Aggregate solvency indicators remained at elevated levels in May. Capital integration in the financial system totaled 15.8% of risk-weighted assets (RWA) in the period, with no significant changes compared to April and +0.9 p.p. y.o.y. (see Chart 10). Among the concepts that make up the Computable Patrimonial Liability (CPR), Level 1 capital continued to account for almost 90% of the total. In the month, capital integration represented 183% of the regulatory requirement, 8.8 p.p. more than in May 2018.
Figure 10 | Integration of Regulatory Capital
In May, the financial system recorded nominal gains equivalent to 4.3% of assets (ROA) and 40.7% of net worth (ROE), slightly higher than those of the previous month. In the last 12 months, the nominal profitability of the banks as a whole stood at around 4.5% of assets and 41.6% of equity.
The financial margin reached 13.6% y/y of assets in May, 0.6 p.p. above the April figure (see Chart 11). Higher gains on securities and interest on loans were partially offset by the increase in interest outflows and the fall in earnings due to differences in quotation differences. In the accumulated 12 months to May, the financial margin represented 11.5% of assets, 1.2 p.p. more in a year-on-year comparison.
Figure 11 | Profitability of the Financial System
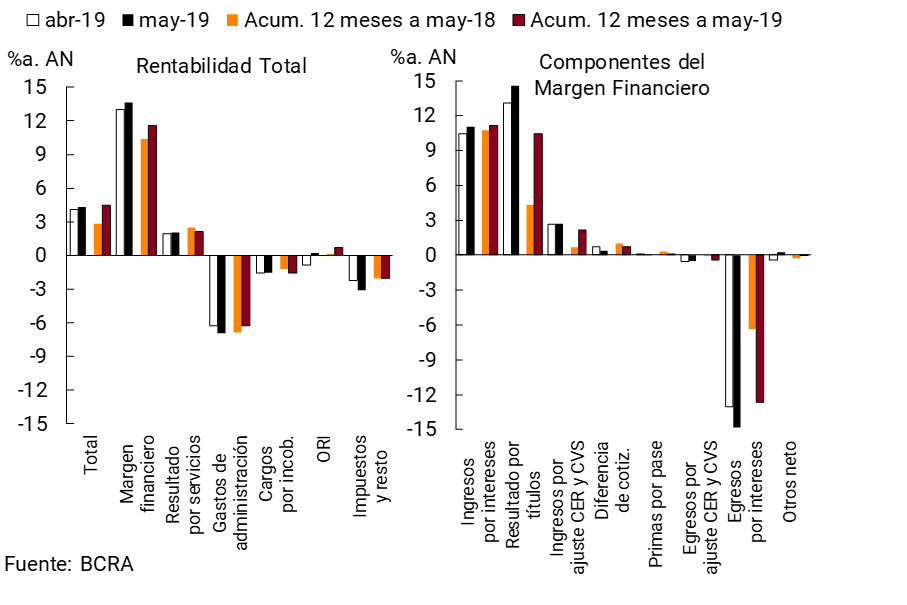
As in the last 4 months, net income from services accrued in May totaled 2% y. of assets for the banks as a whole. In the cumulative 12 months to May, these results represented 2.1% of assets, 0.4 p.p. less than in the same period of the previous year.
Administrative expenses of the financial system grew 0.7 p.p. of assets in the month to reach 6.9%a. In the last 12 months, these expenditures represented 6.2% of assets, 0.6 p.p. less than in the same period as of May 2018. On the other hand, charges for uncollectibility fell slightly in the month to 1.5% y/y of assets. Thus, in line with the evolution of the quality of the loan portfolio, in the cumulative period between June 2018 and May 2019 these charges totaled 1.6% of assets, a 0.4 p.p. year-on-year increase.
References
1 Based on differences in balance sheet balance.
2 In May, the nominal peso-dollar exchange rate increased 2% between the peak of the month.
3 It should be noted that, in order to provide more options for users to channel their savings and promote competition in the financial system, as of May the BCRA enabled the possibility for financial institutions to capture fixed terms from customers without a prior contractual relationship. These operations are implemented through Immediate Debits (DEBIN) and their evolution allows us to appreciate the impact of this measure. The number of operations carried out with DEBIN went from 592 in April to 37,927 in May, while the amounts involved grew from $6.6 million accumulated during April to more than $6,950 million in May.
4 Availability, integration of minimum cash and BCRA instruments, in national and foreign currency.
5 Includes principal adjustments and accrued interest.
6 Information extracted from the Central Debtors (national and foreign currency). Loans to residents abroad are not included. Adjustments in principal and accrued interest are considered. Business financing is defined here as that granted to legal entities and commercial financing granted to individuals. On the other hand, loans to families are considered to be those granted to individuals, unless they are for commercial purposes.
7 As of May 2019, out of a total of 101,635 mortgage financing in UVA granted to individuals in the financial system, only 479 were in an irregular situation.
Share on


